Dell OptiPlex Micro Plus 7010 incelemesi: Mini PC paketinde masaüstü Core i7-13700

OptiPlex Micro, ticari ve profesyonel amaçlar için tasarlanmış bir mini PC'dir, ancak kompakt form faktörü, özellikle standart tam boyutlu OptiPlex modelleriyle karşılaştırıldığında WFH ortamları için uygulamalara sahiptir. Bu özel model masaüstü işlemcisiyle dikkat çekerken, diğer mini PC'lerin çoğu bunun yerine mobil H veya HX serisi CPU'lara güveniyor.
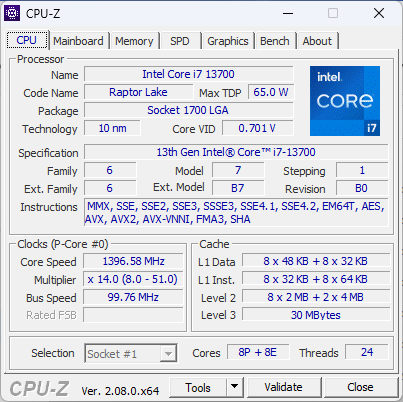
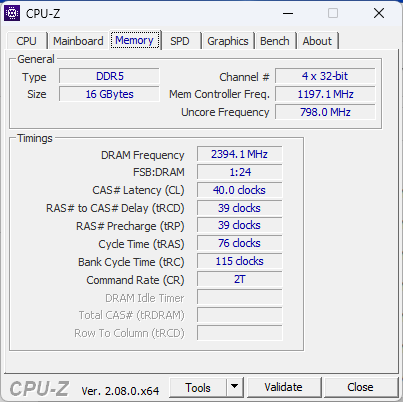
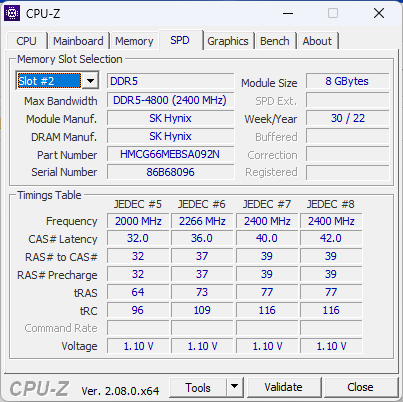
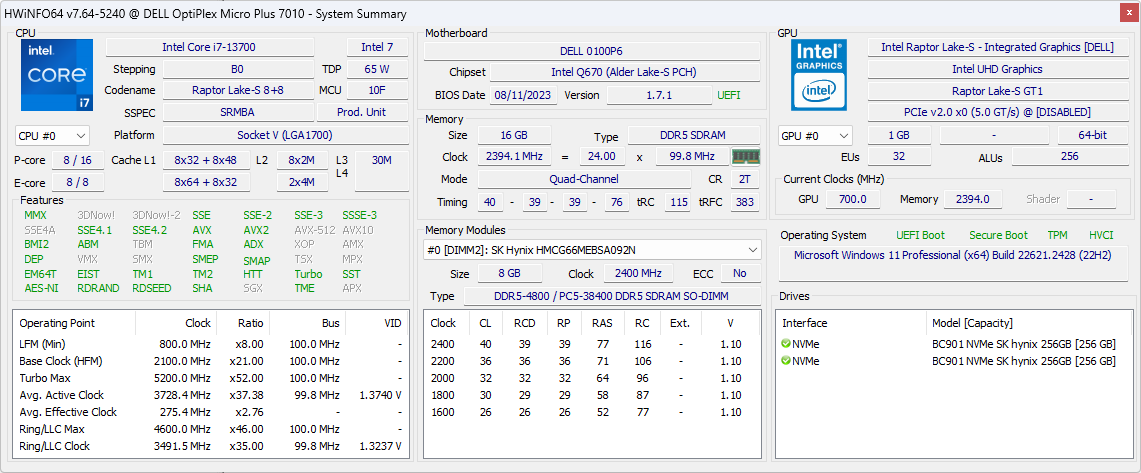
Özel test ünitemiz 13. nesil Core i7-13700 CPU, 16 GB DDR5-4800 RAM ve RAID 0'da 512 GB SSD ile yapılandırılmıştır. Alt uç konfigürasyonlar 900 doların altında Core i3-13100T ile başlayıp Core i9-13900 vPro'ya kadar çıkmaktadır. Plus olmayan SKU'lar daha da yavaş Pentium Gold G7400T ile gönderilebilir. Şu anda hiçbir yapılandırma ayrı grafikler veya herhangi bir AMD alternatifi sunmuyor.
OptiPlex Micro, aşağıdaki gibi diğer yarı profesyonel mini PC'lere karşı rekabet ederApple Mac Mini M2, Beelink GTR7veya Intel NUC serisi.
Daha fazla Dell yorumu:
Karşılaştırmalı olarak olası rakipler
Derecelendirme | Tarih | Modeli | Ağırlık | Yükseklik | Boyut | Çözünürlük | Fiyat |
|---|---|---|---|---|---|---|---|
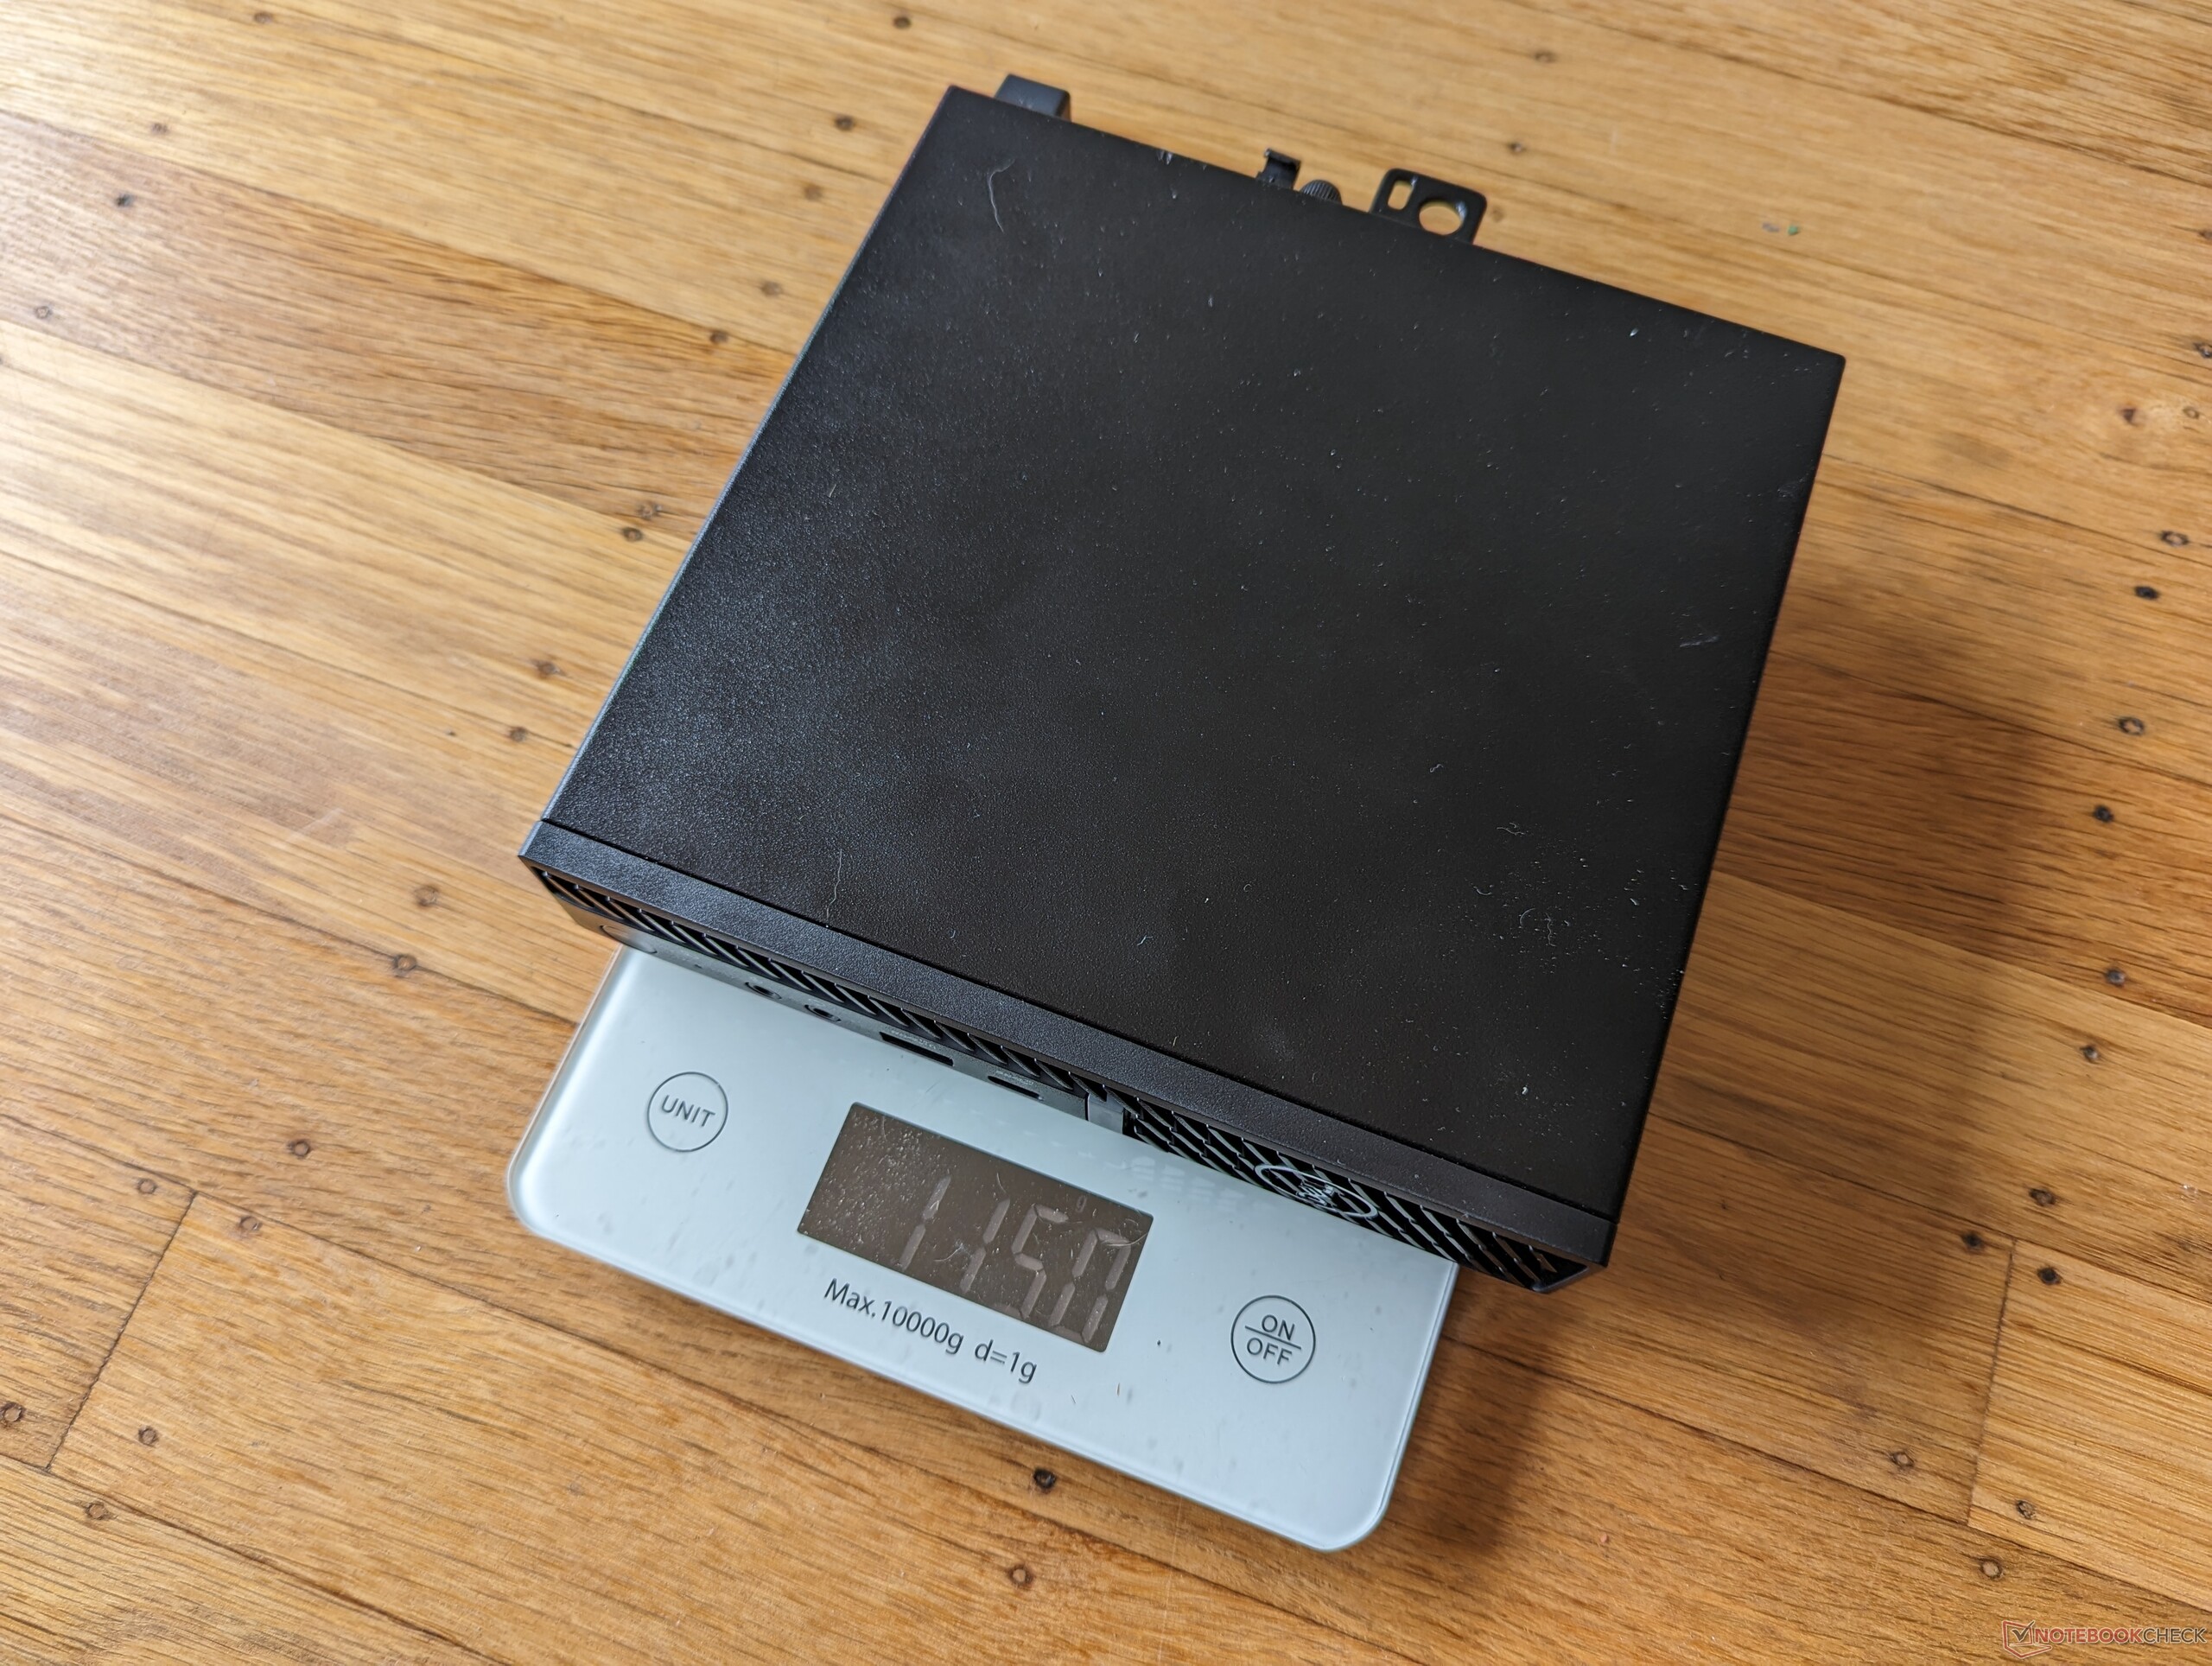
| 80.2 % v7 (old) | 10/2023 | Dell OptiPlex Micro i7-13700, UHD Graphics 770 | 1.2 kg | 36 mm | x | ||
| 87.3 % v7 (old) | Apple Mac Mini M2 M2, M2 10-Core GPU | 1.2 kg | 36 mm | x | |||
| 81 % v7 (old) | Lenovo IdeaCentre Mini 01IRH8 i7-13700H, Iris Xe G7 96EUs | 1.8 kg | 39 mm | x | |||
| 82.8 % v7 (old) | 10/2023 | GMK NucBox K3 Pro i7-12650H, UHD Graphics 64EUs | 396 g | 43.2 mm | x | ||
| 86.3 % v7 (old) | Beelink GTR7 7840HS R7 7840HS, Radeon 780M | 890 g | 48.8 mm | x | |||
| 86.6 % v7 (old) | Beelink SER7 R7 7840HS, Radeon 780M | 640 g | 49 mm | x |
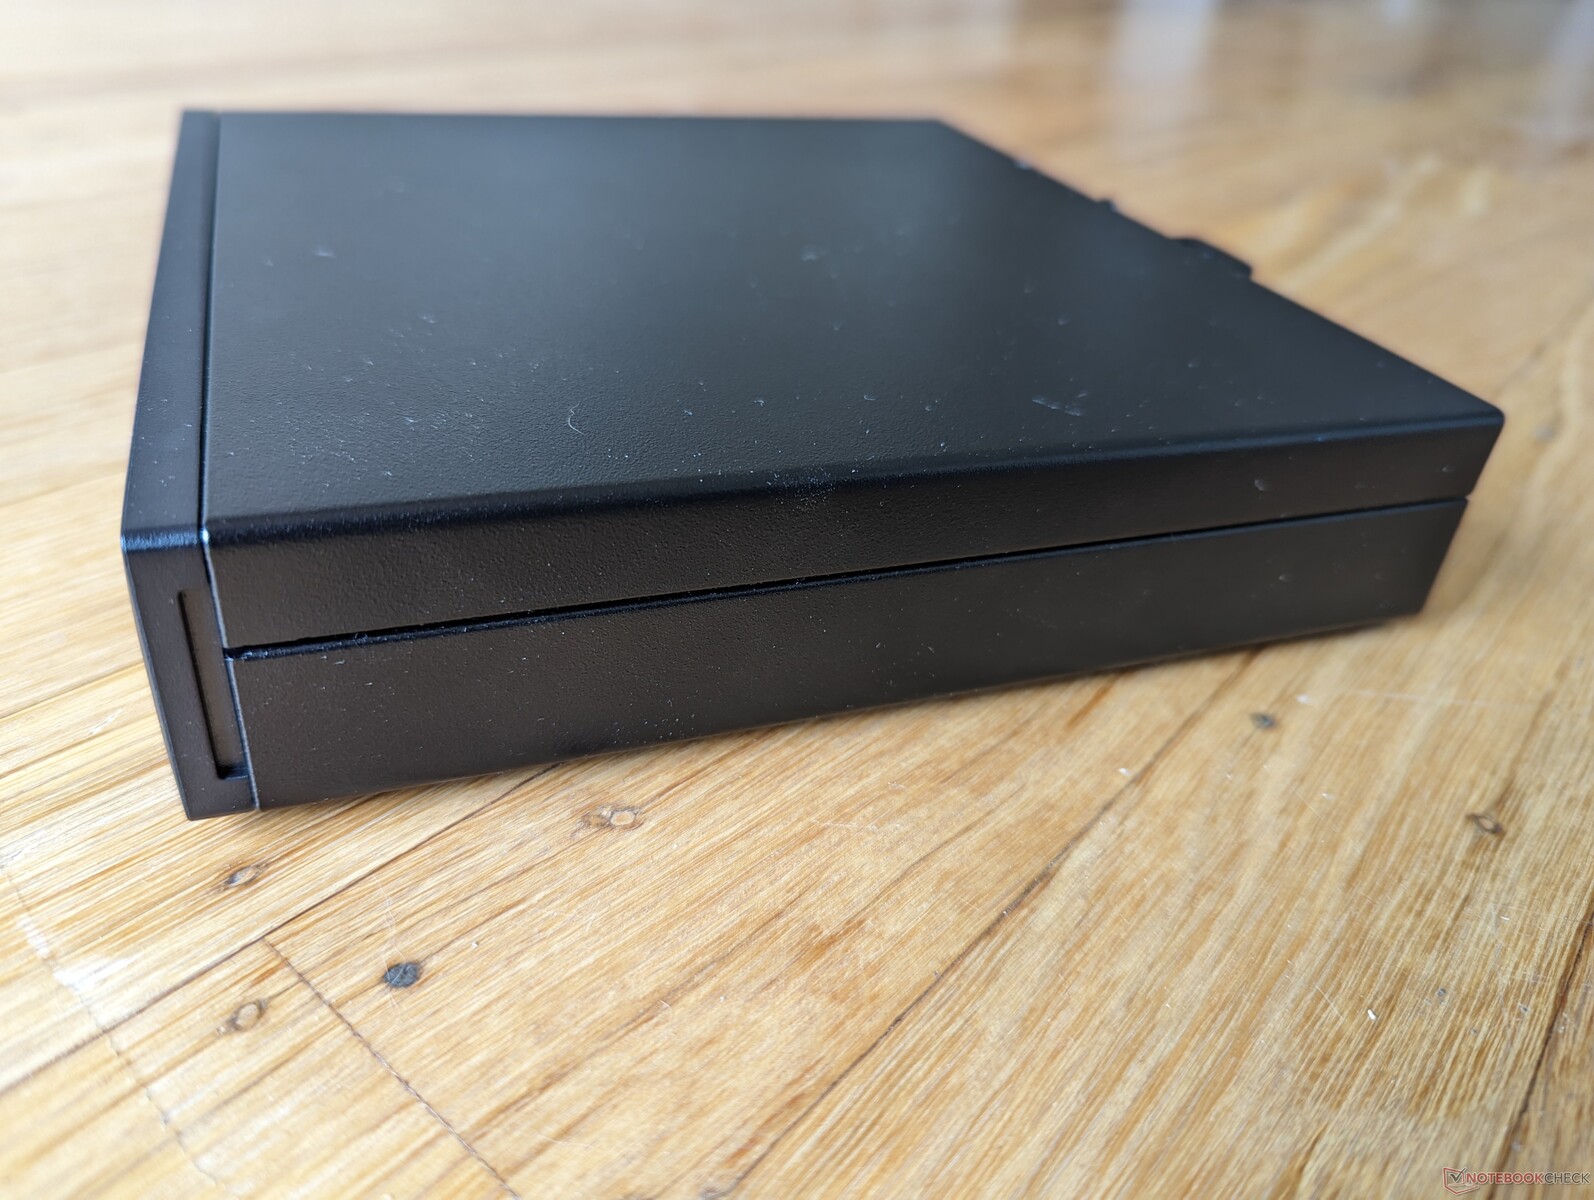
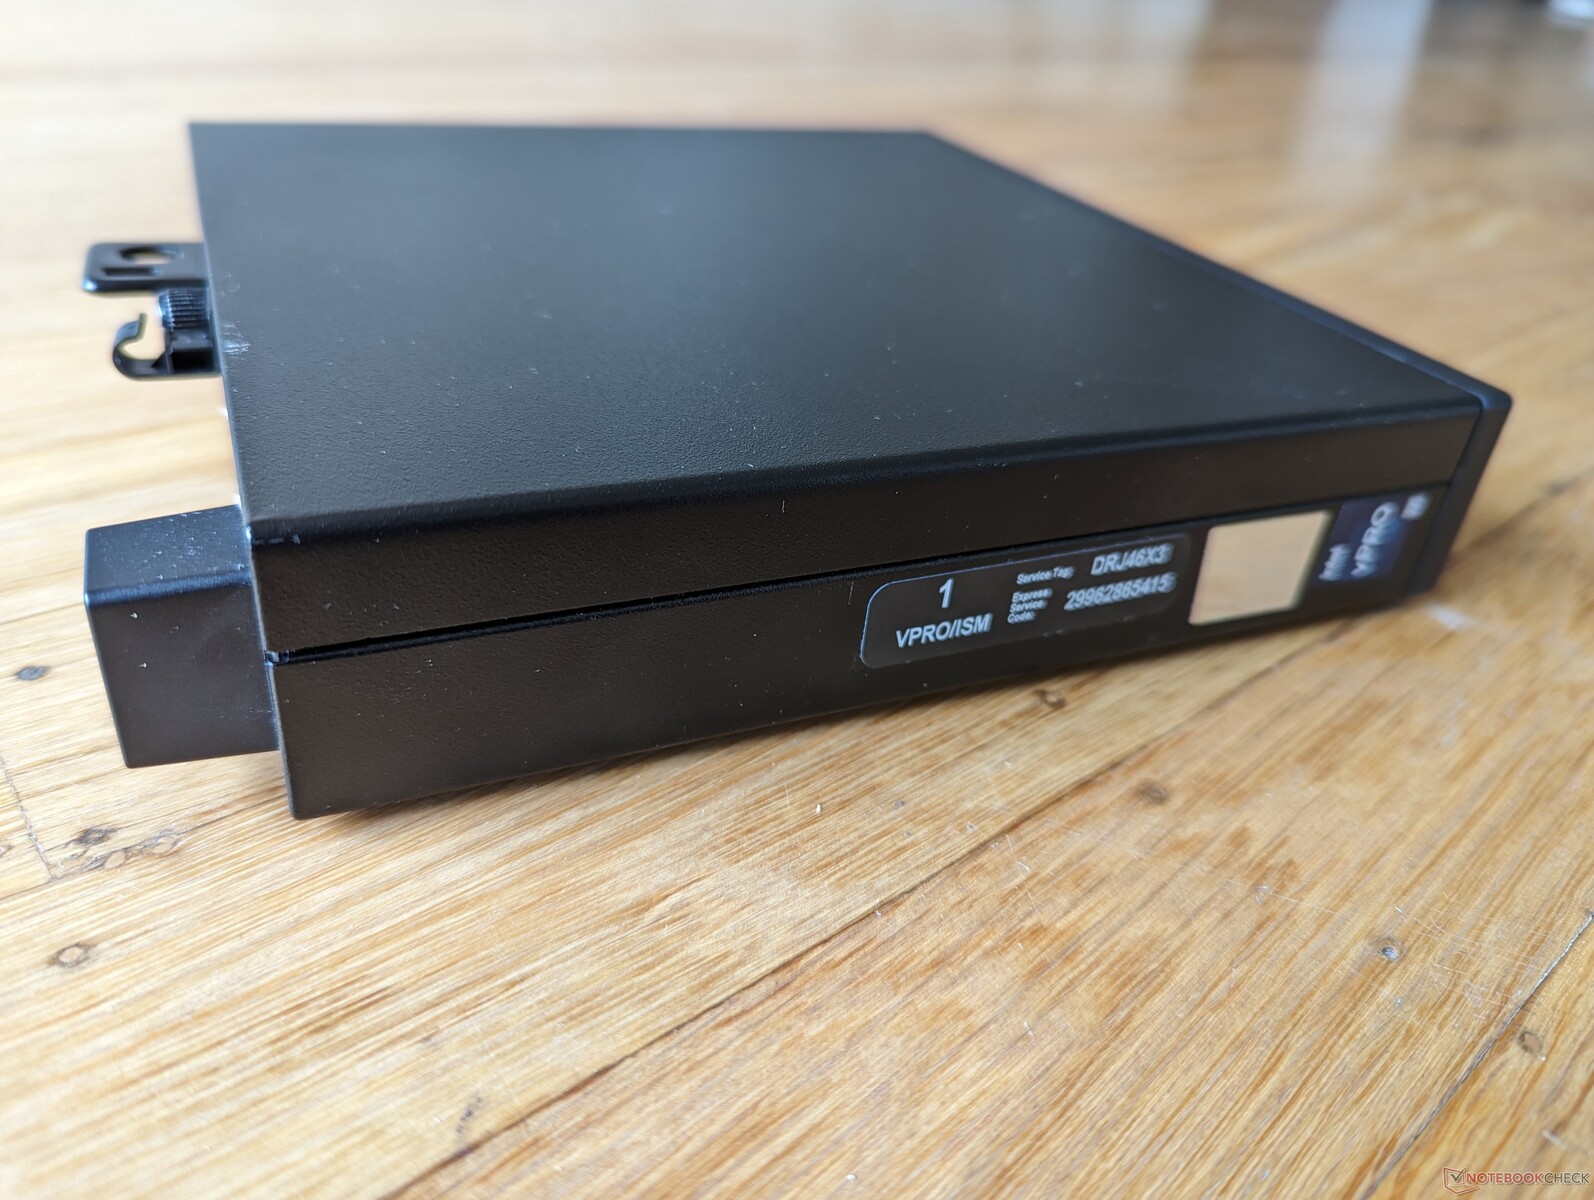
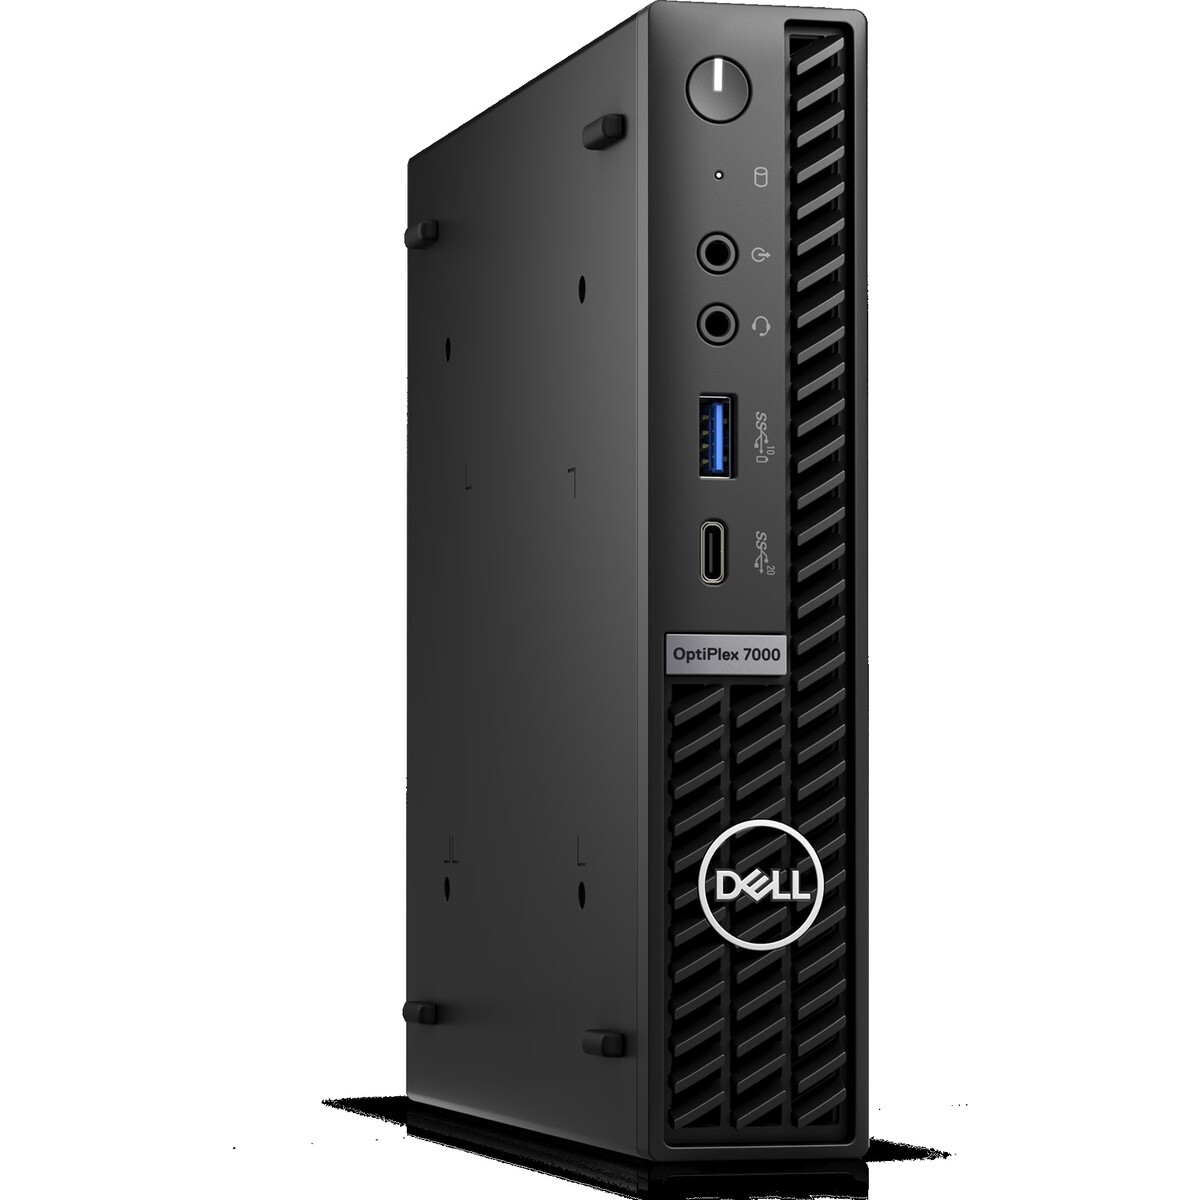
Kasa - Mini Kule Görünümü
OptiPlex Micro, Intel NUC 13 Pro'nun iki katı büyüklüğünde ve ağırlığındadır ancak yine de NUC 13 Pro'dan daha küçüktür Mac Mini ve özellikle OptiPlex SFF. Tamamen metal şasi ve ayırt edici ön ızgara tasarımı, OptiPlex'i diğerlerinden ayırıyor.
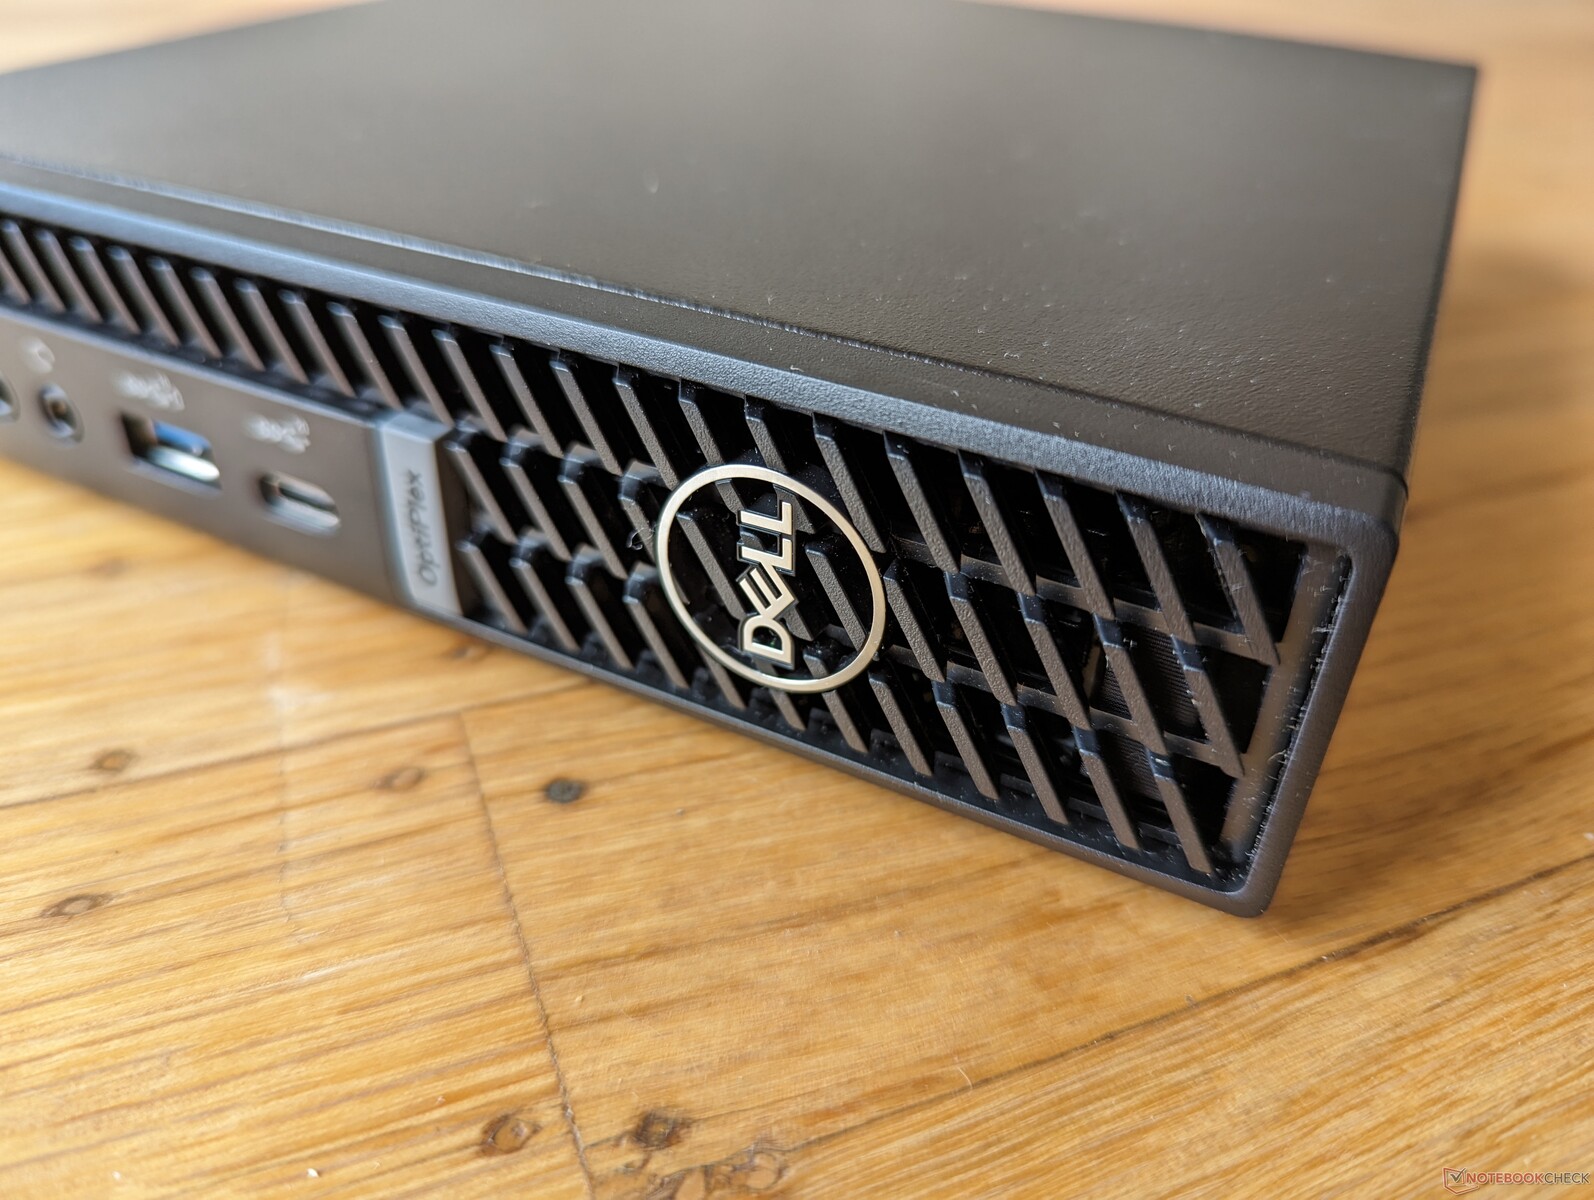
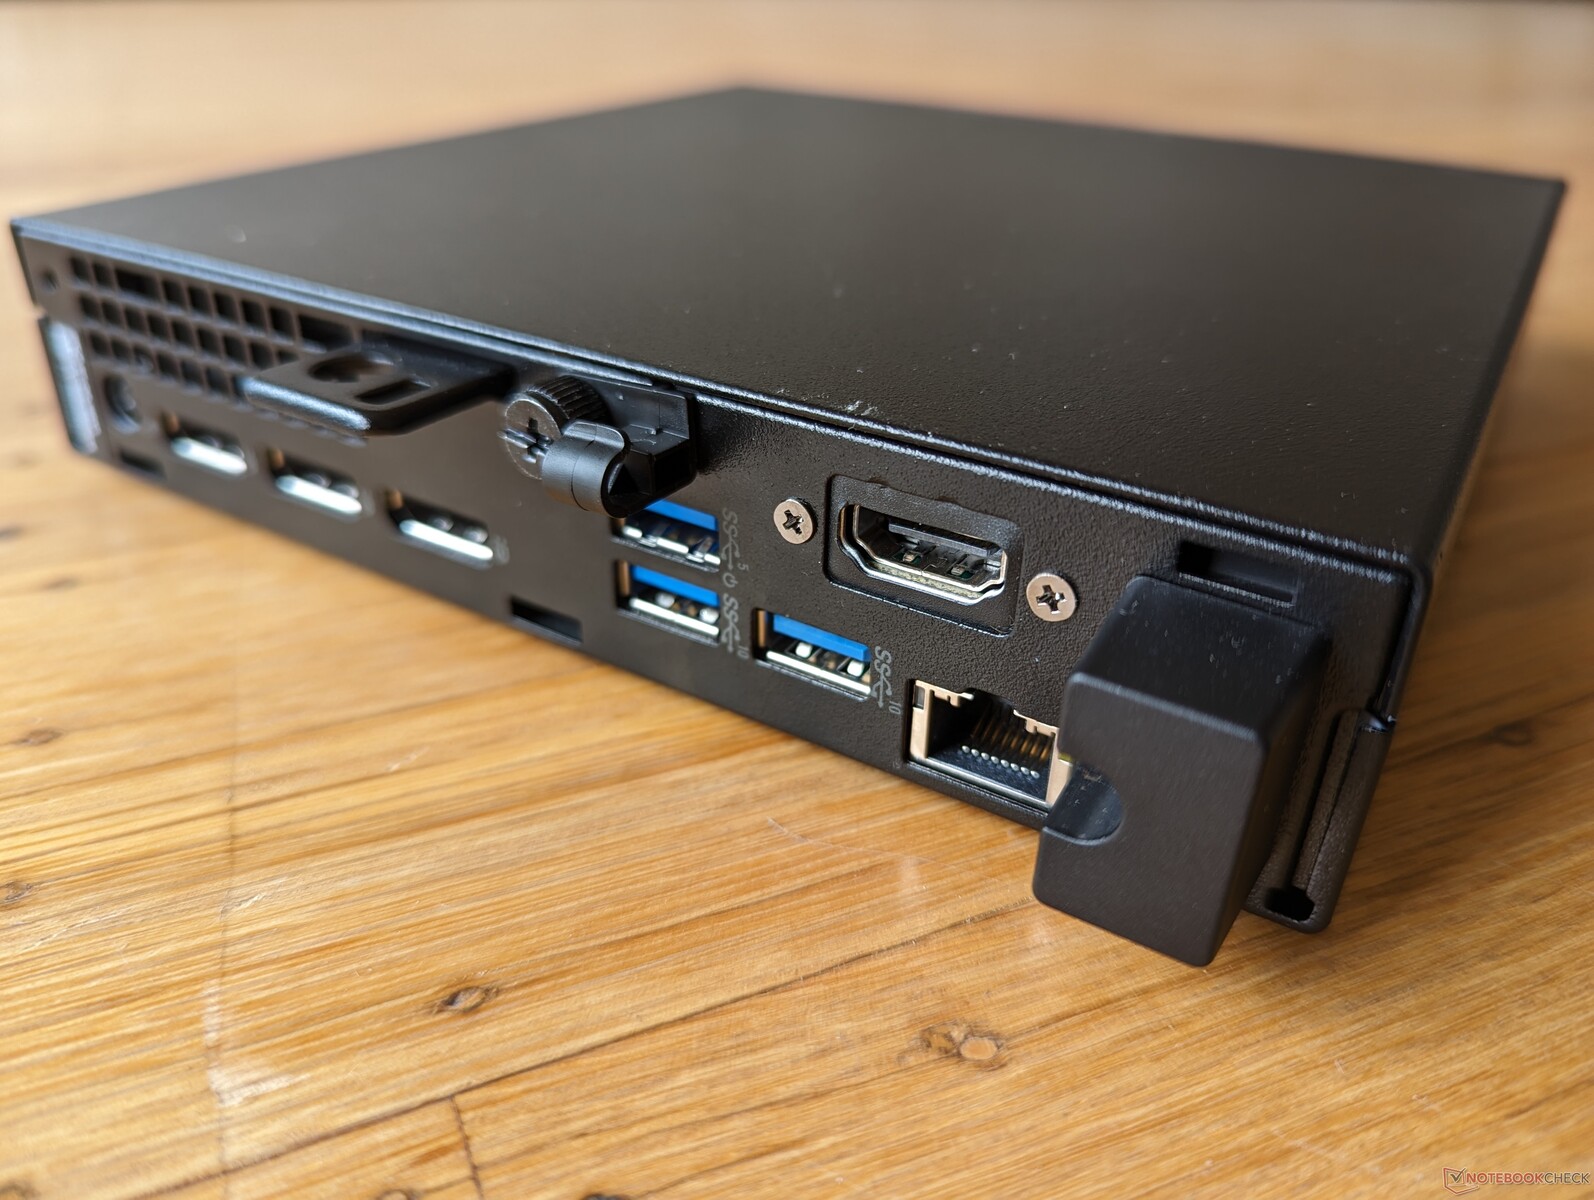
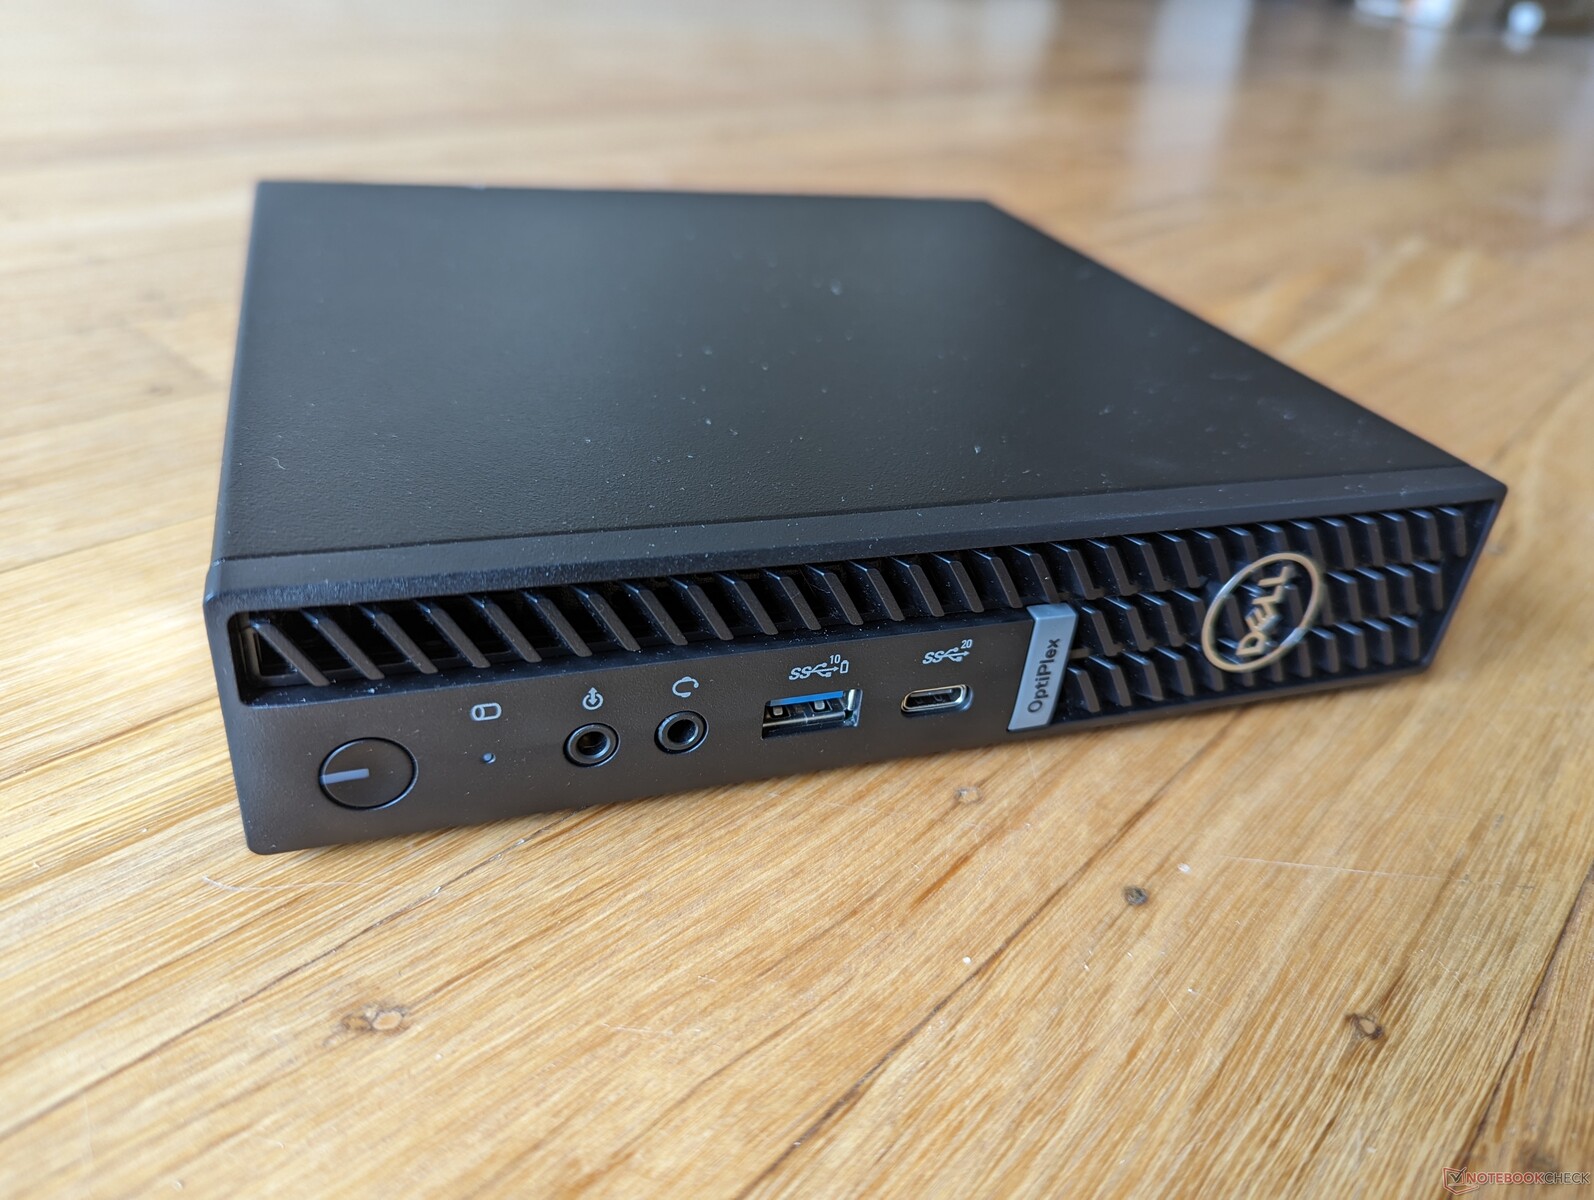
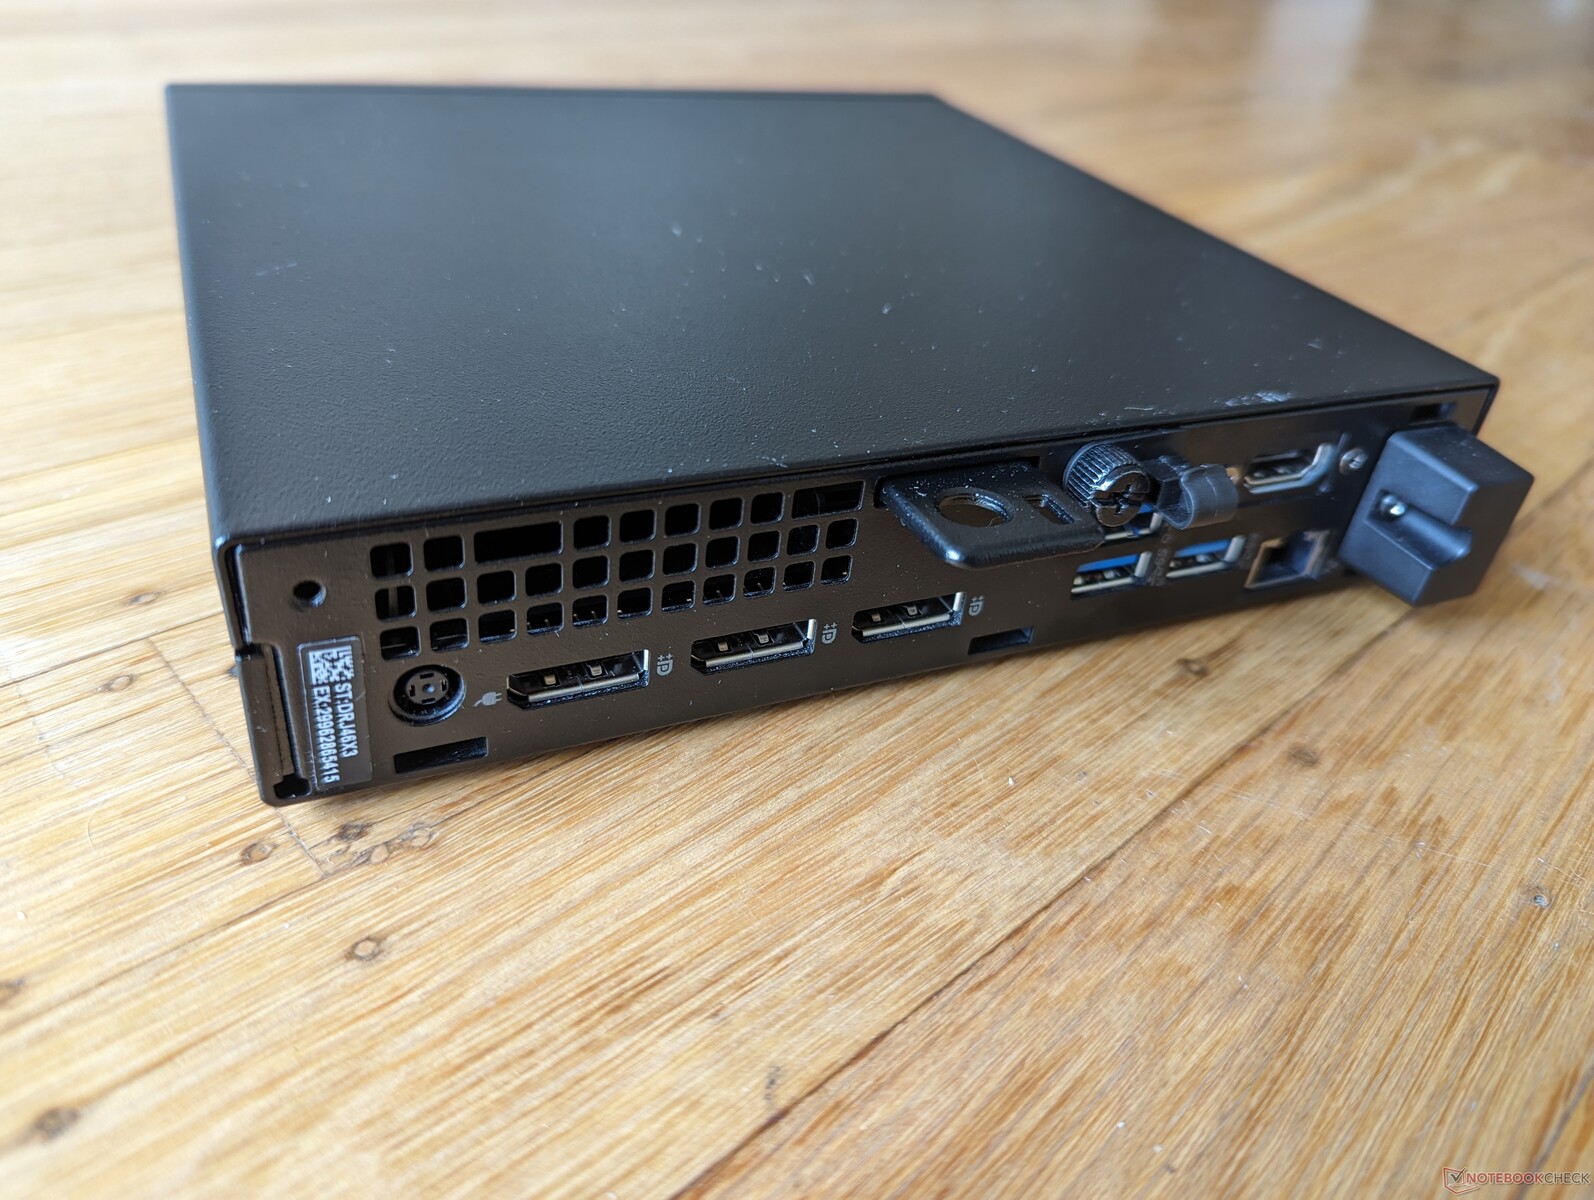
Bağlanabilirlik
Port seçenekleri çeşitlidir ve en dikkat çekici olanı dört ayrı video çıkış portudur. Ancak tek USB-C portu, çoğu Intel NUC veya Beelink mini PC'deki USB-C portlarının aksine USB4, Thunderbolt, Power Delivery ve hatta DisplayPort'u desteklemiyor.
İletişim
Birlikte verilen Intel AX211, Wi-Fi 6E ve Bluetooth 5.3 bağlantısı sunar. Performans güvenilirdir ve ağlarda 5 GHz veya 6 GHz arasında büyük farklar yoktur.
| Networking | |
| iperf3 transmit AXE11000 | |
| Apple Mac Mini M2 | |
| Beelink SER7 | |
| GMK NucBox K3 Pro | |
| Beelink GTR7 7840HS | |
| Dell OptiPlex Micro | |
| Lenovo IdeaCentre Mini 01IRH8 | |
| iperf3 receive AXE11000 | |
| Apple Mac Mini M2 | |
| GMK NucBox K3 Pro | |
| Beelink GTR7 7840HS | |
| Beelink SER7 | |
| Dell OptiPlex Micro | |
| Lenovo IdeaCentre Mini 01IRH8 | |
| iperf3 transmit AXE11000 6GHz | |
| Dell OptiPlex Micro | |
| iperf3 receive AXE11000 6GHz | |
| Dell OptiPlex Micro | |
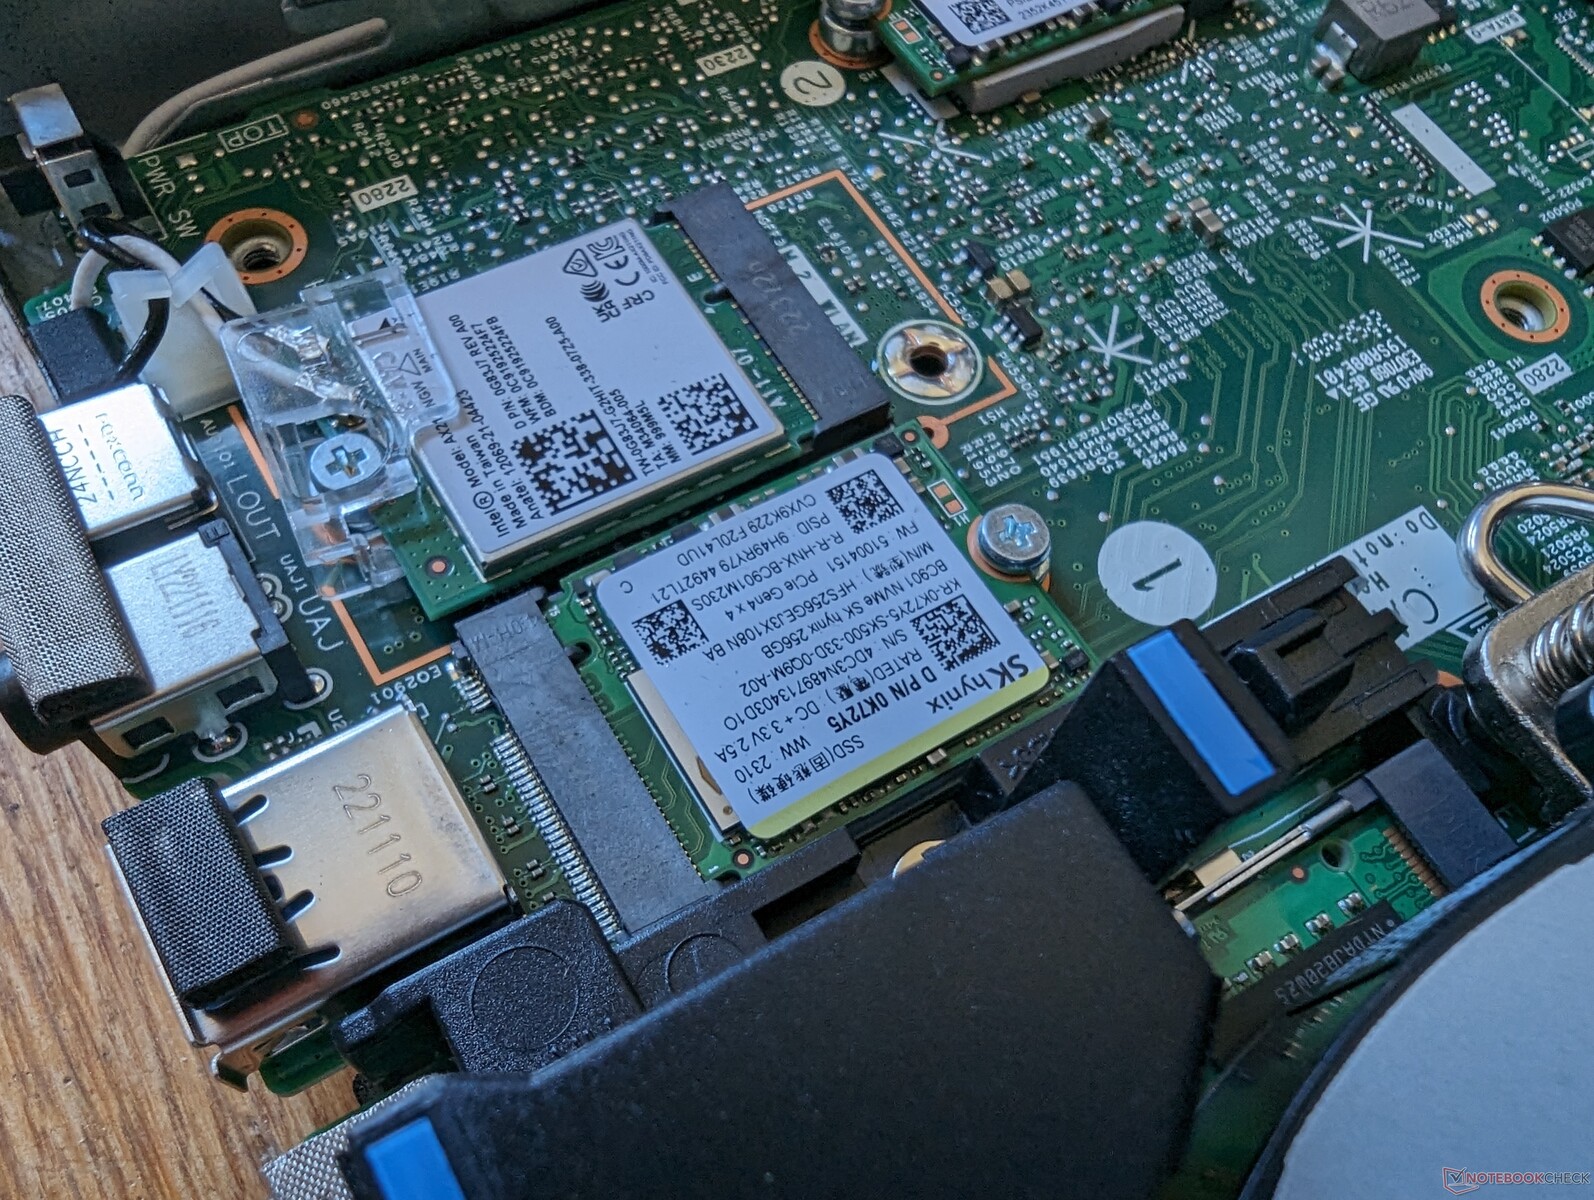
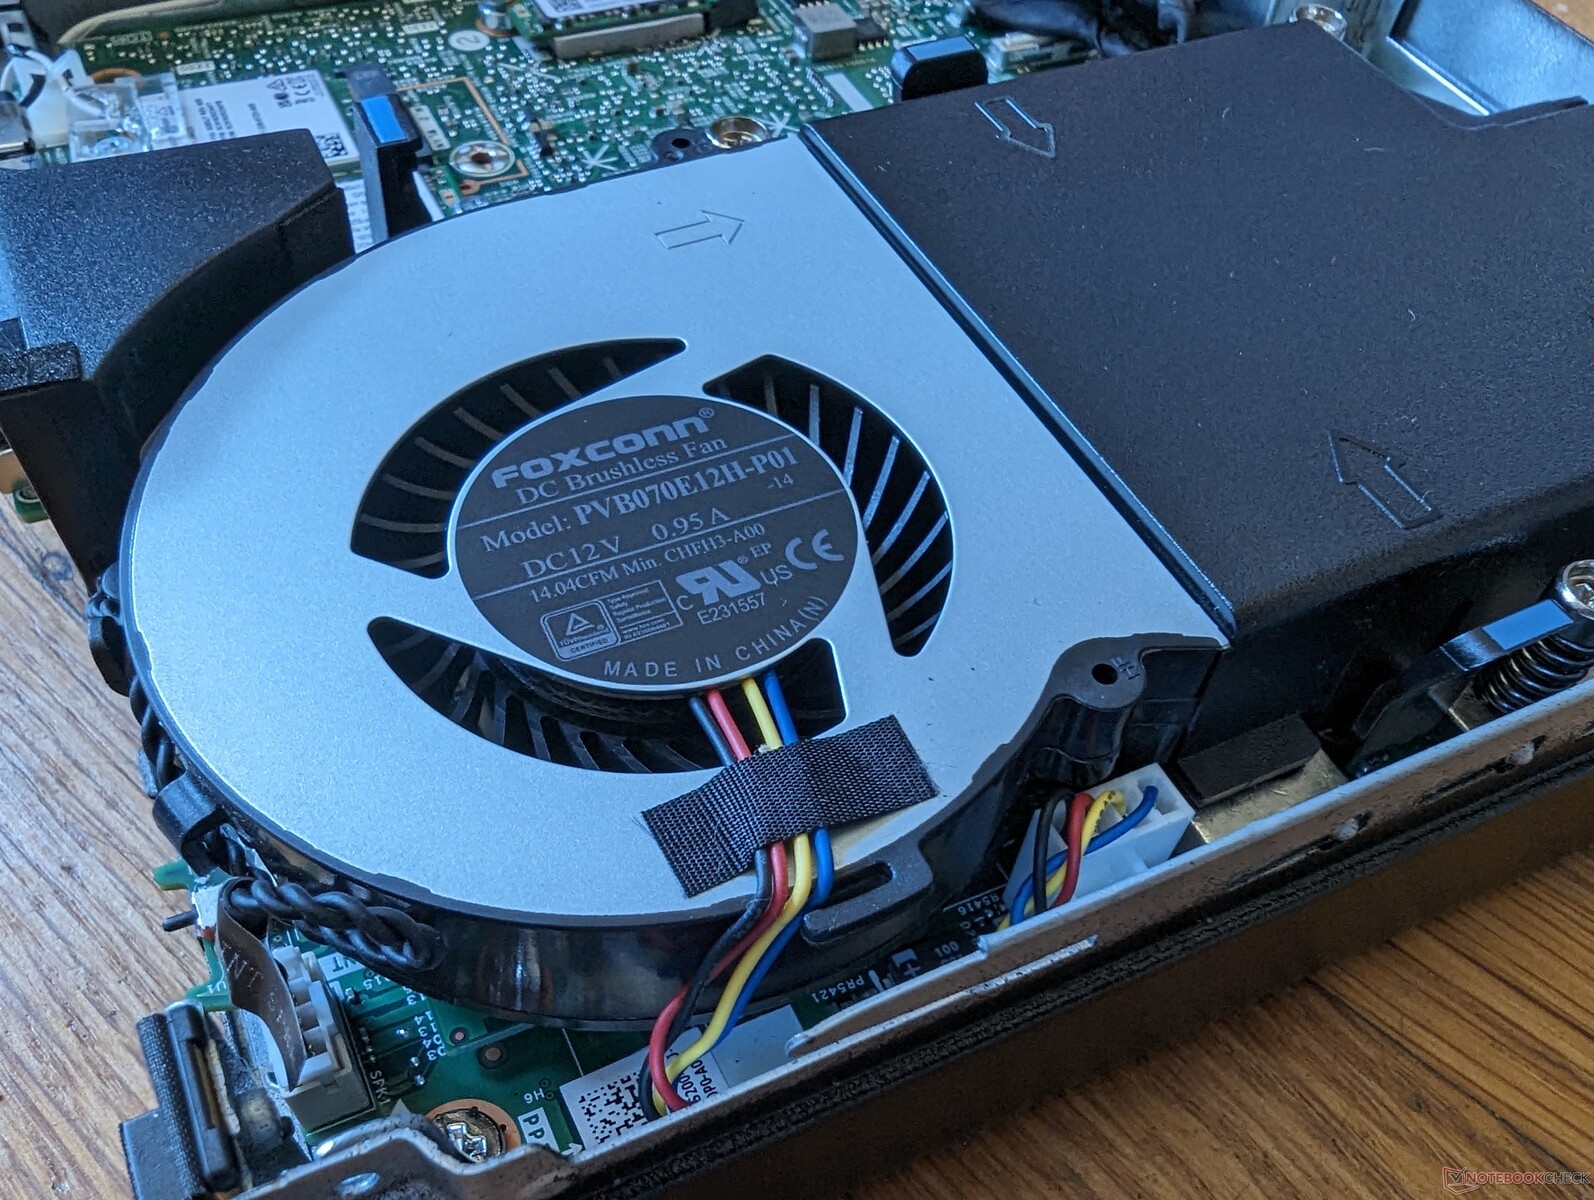
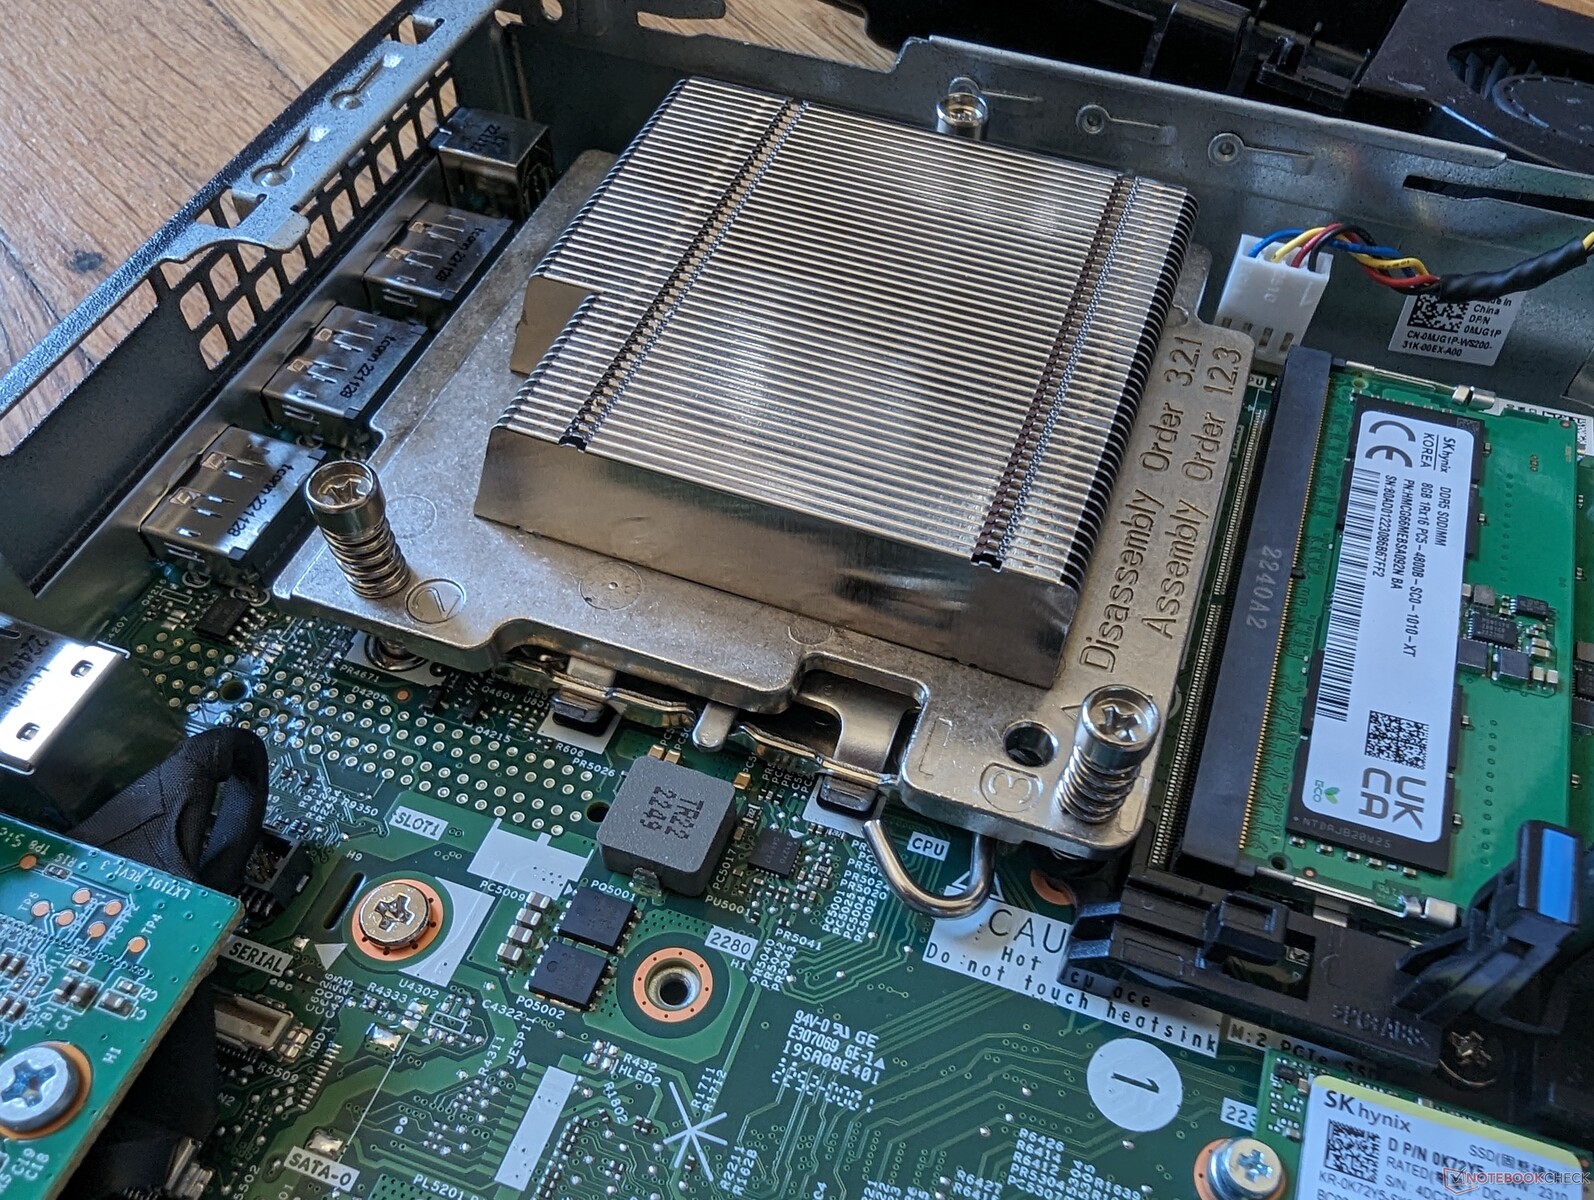
Bakım
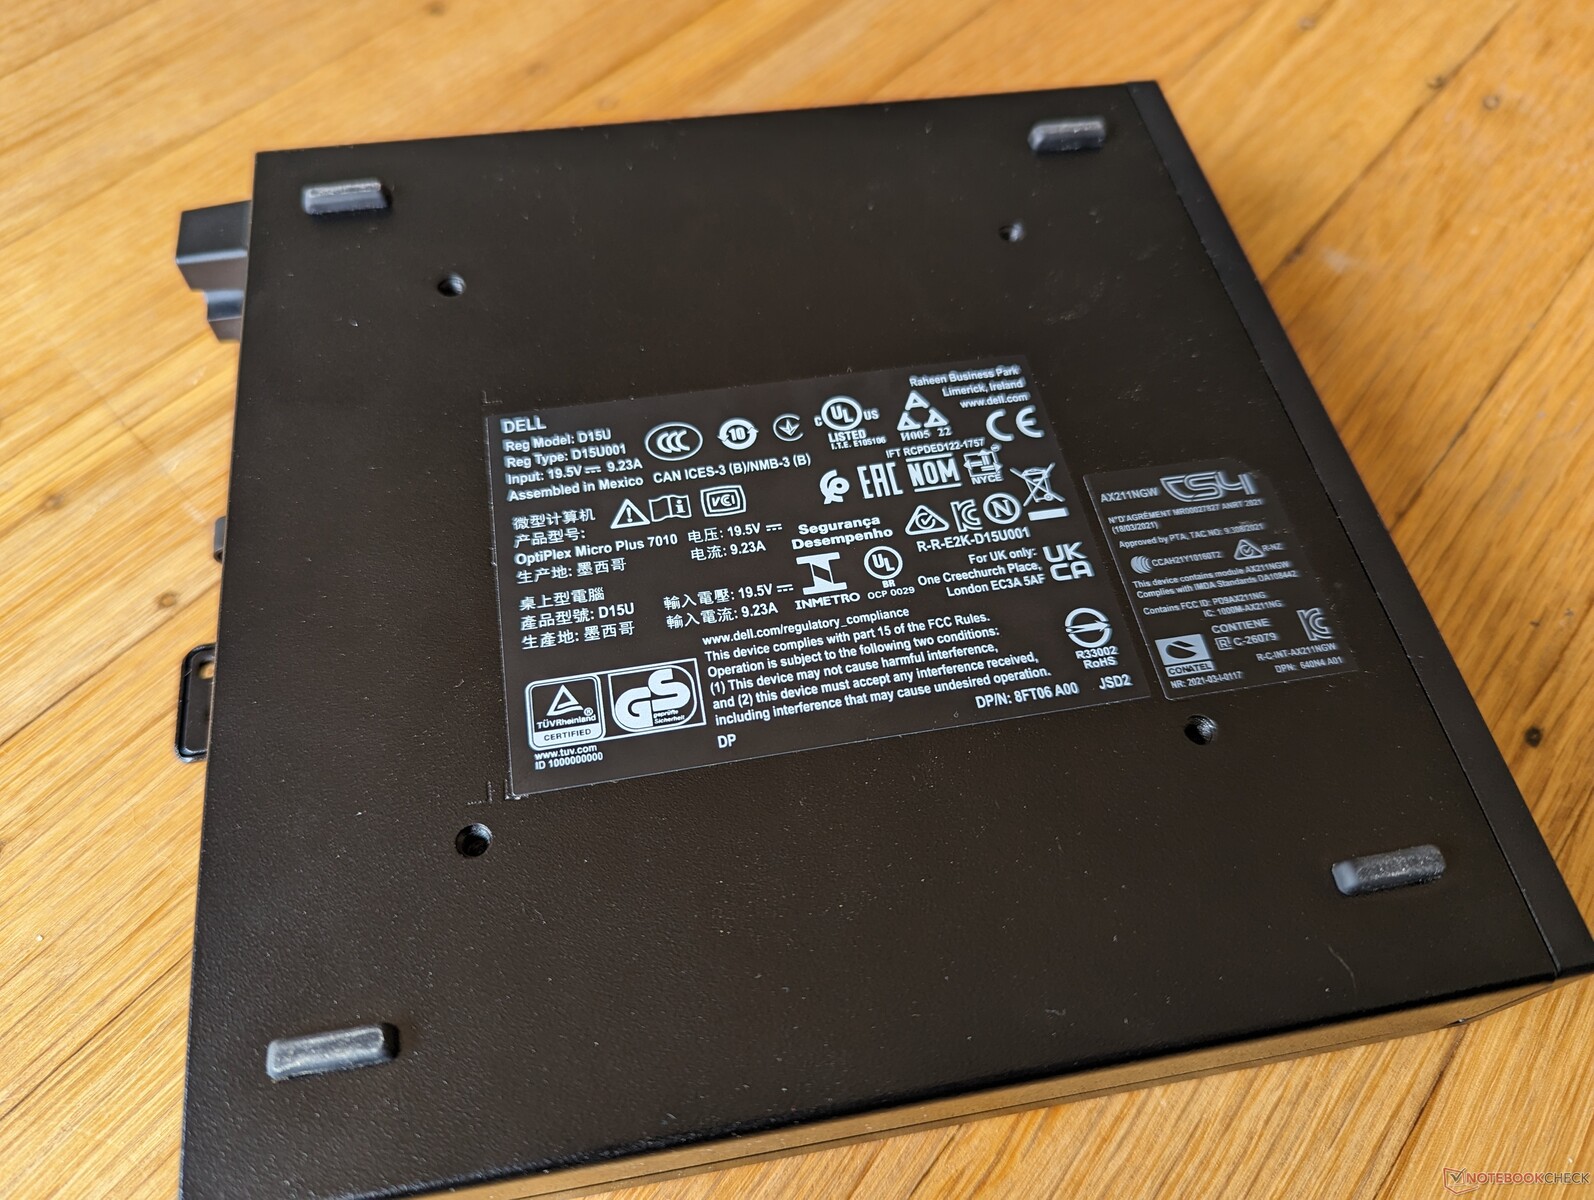
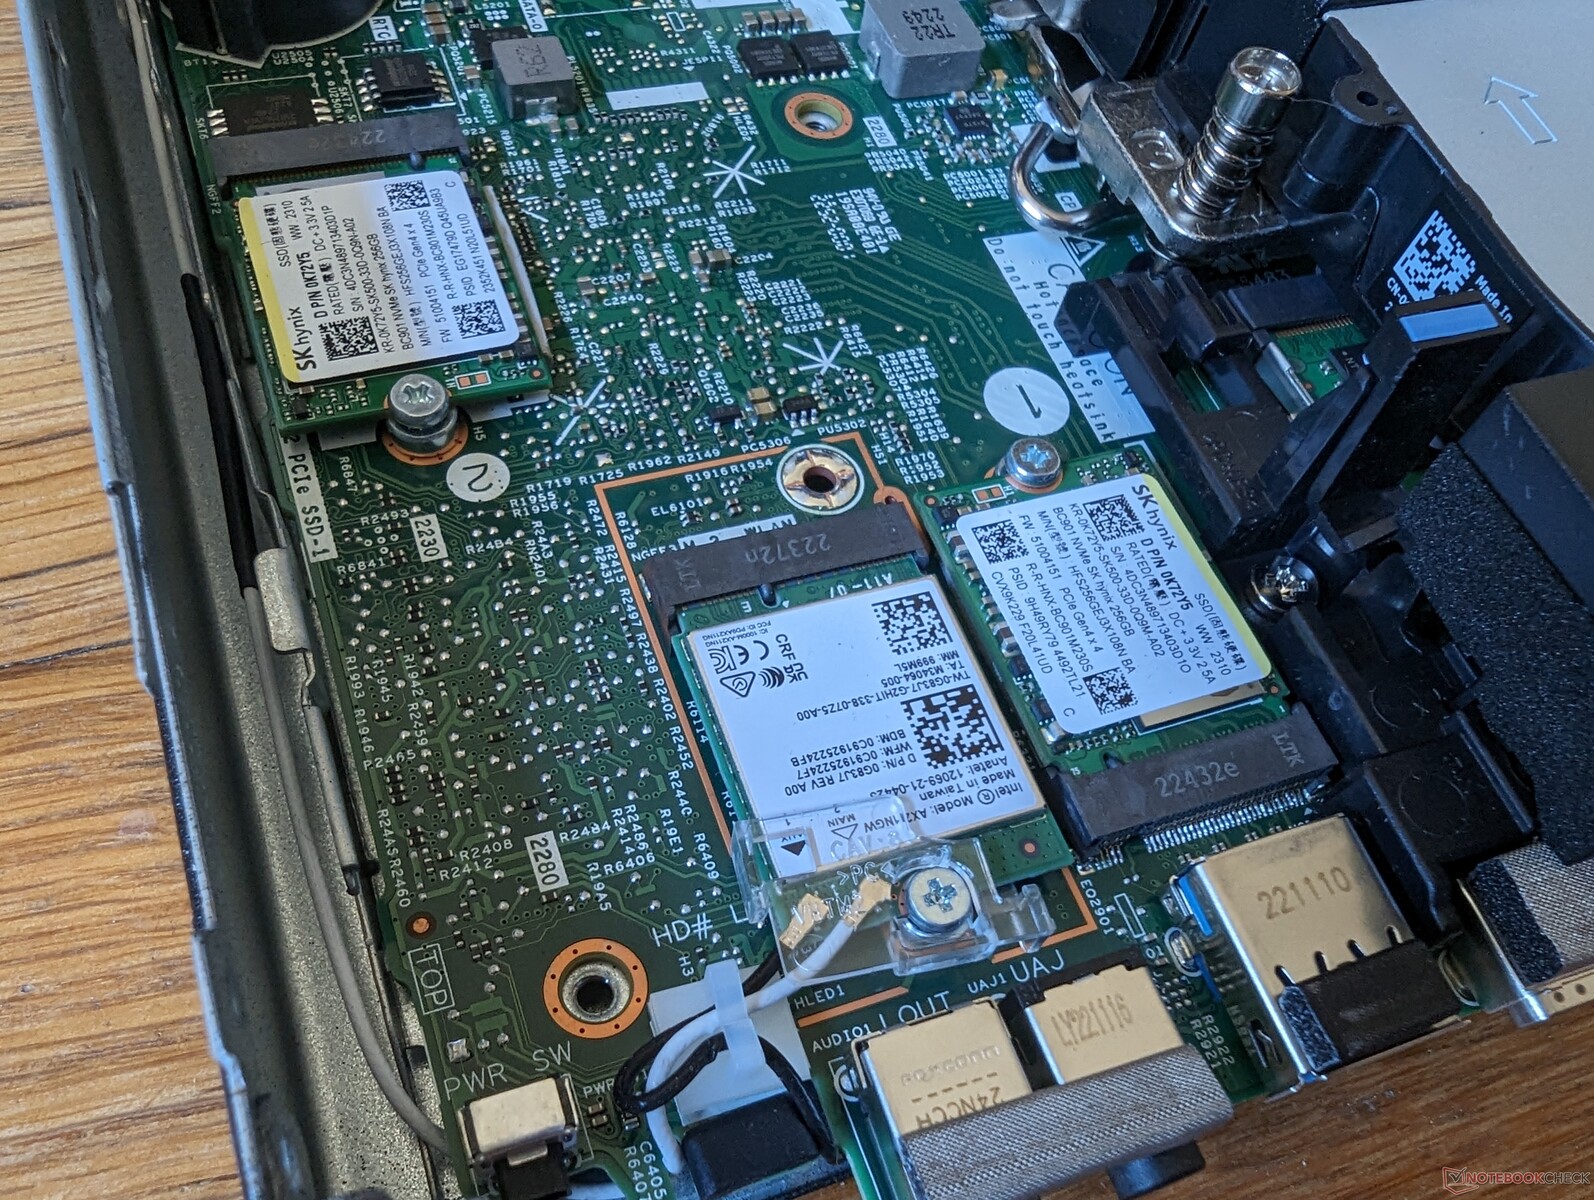
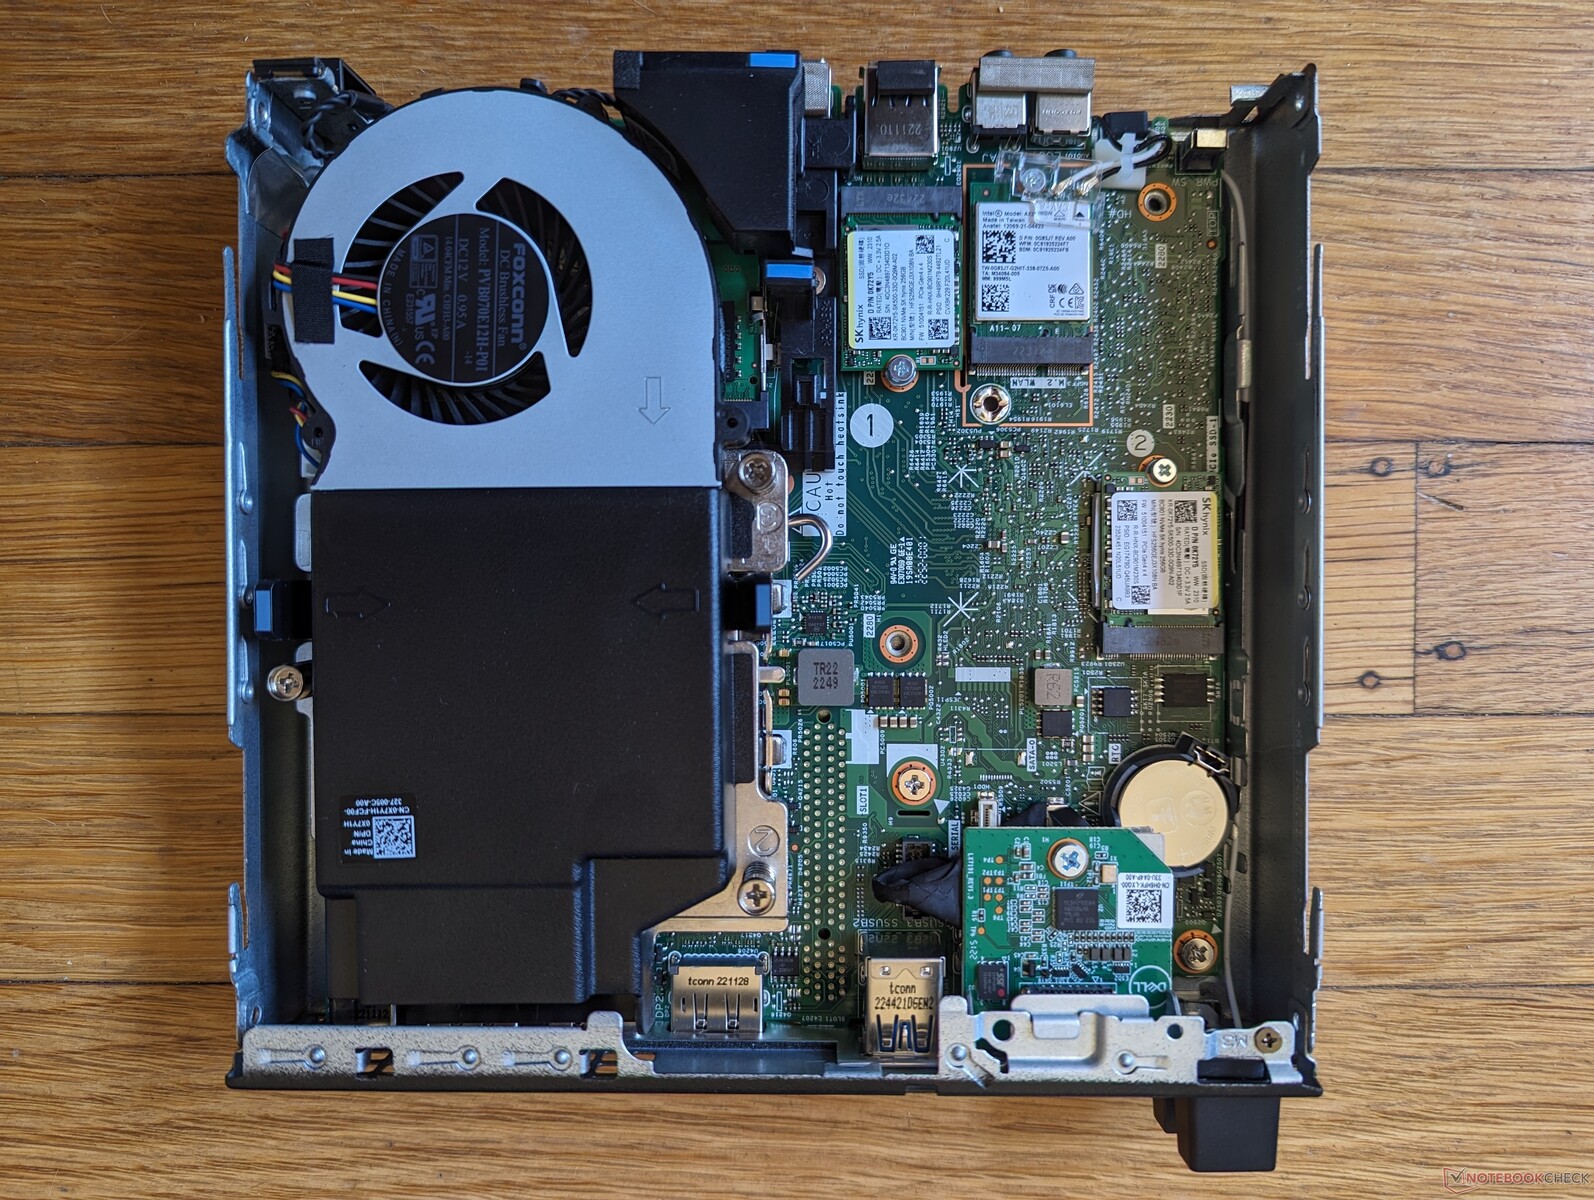
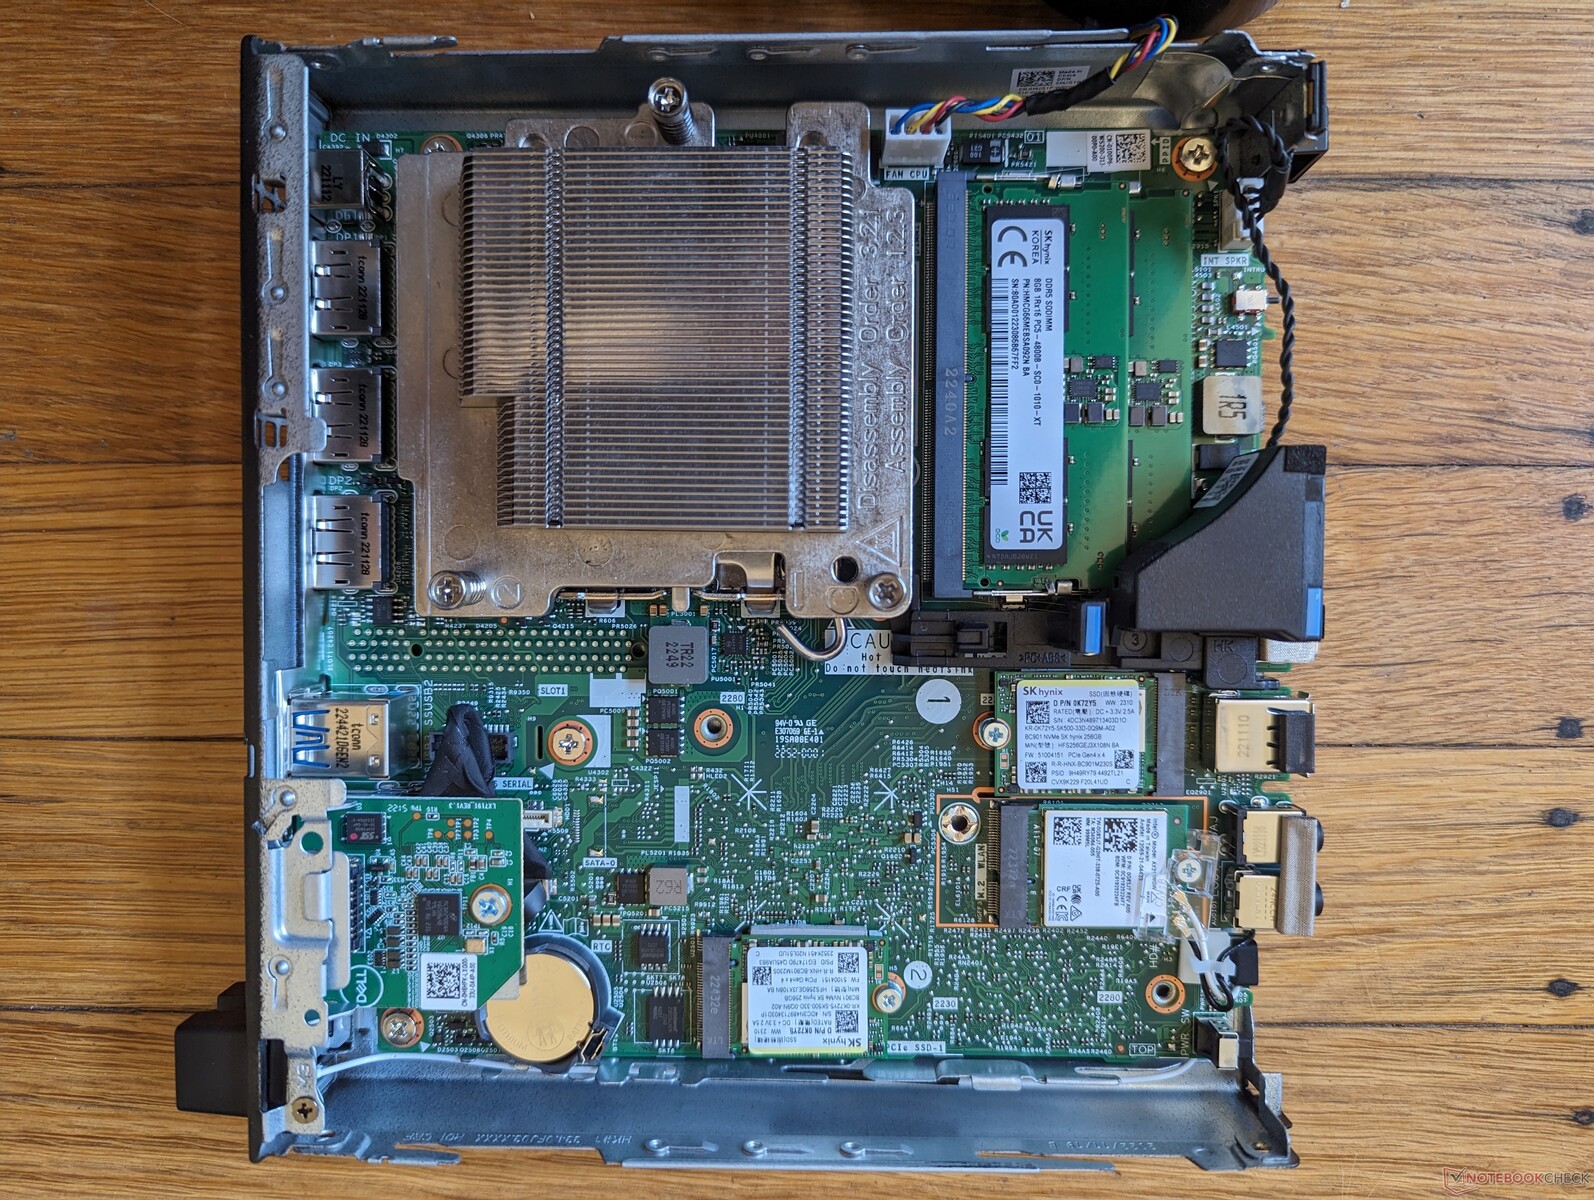
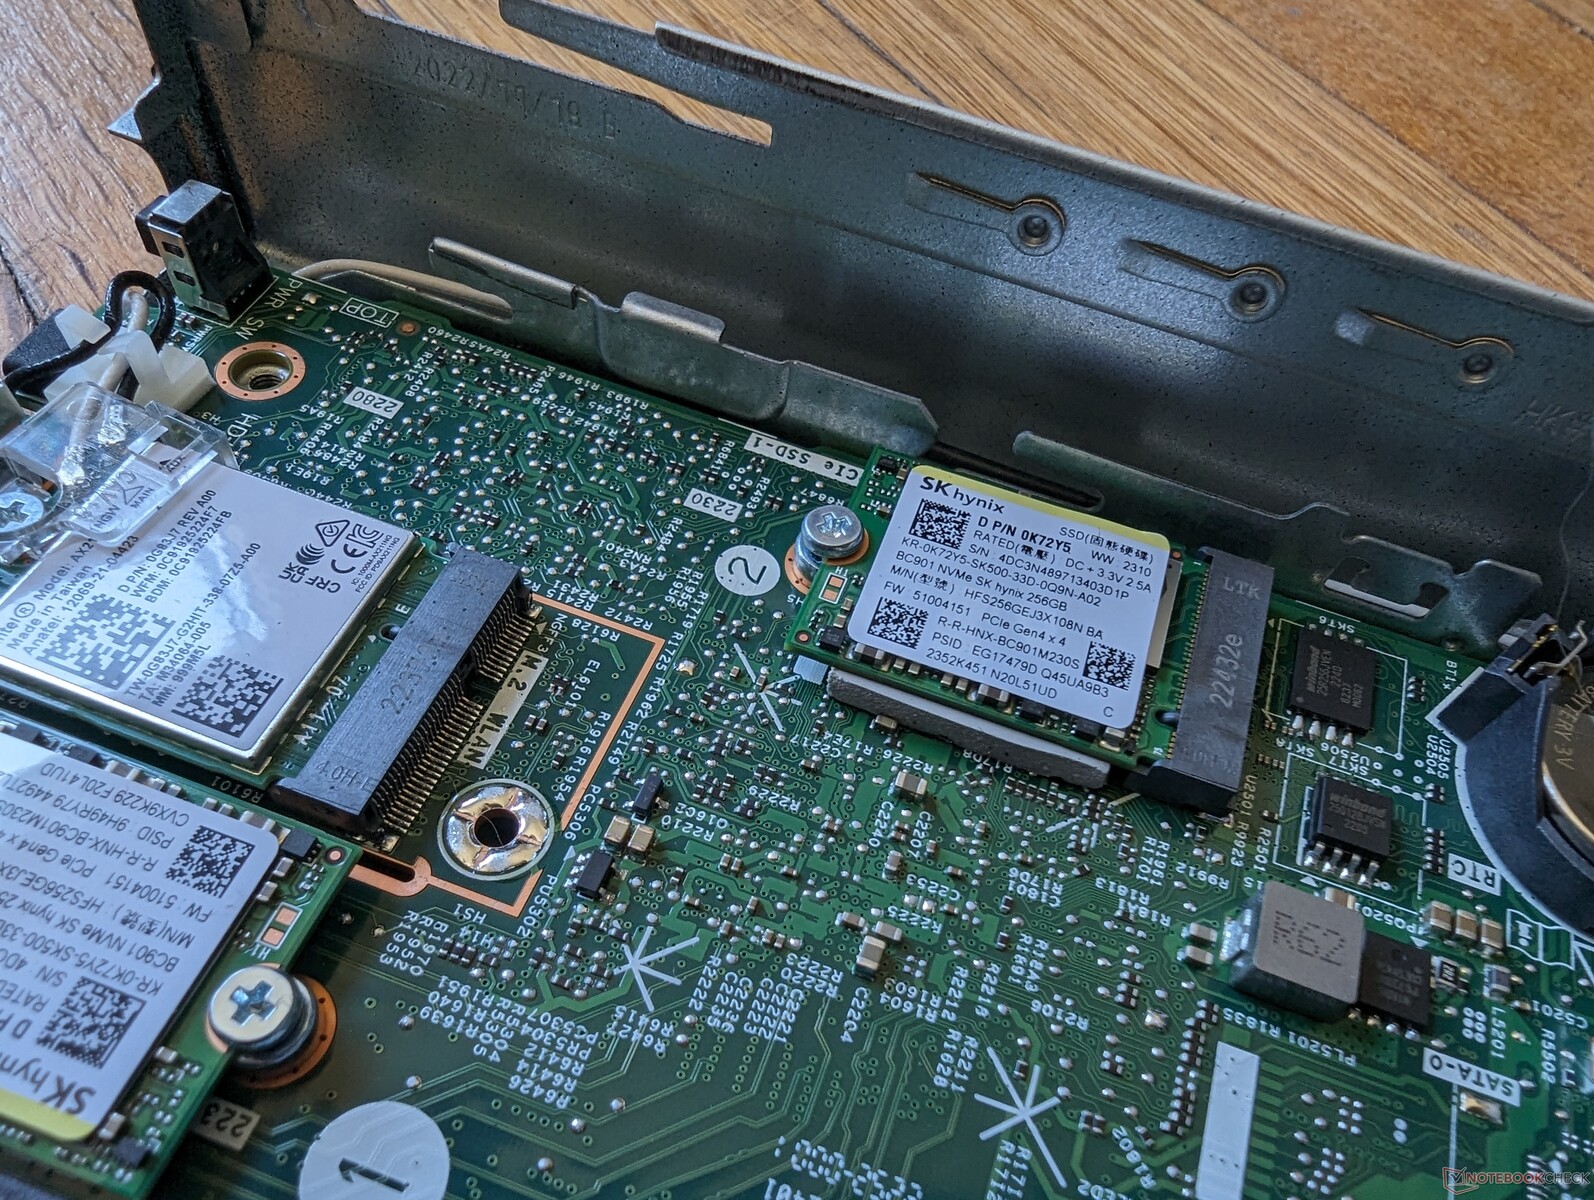
Üst panel, çıkarılabilir WLAN modülünü ve iki SSD yuvasını ortaya çıkarmak için arkadan sadece tek bir başparmak vidasını çıkardıktan sonra kolayca kayar. İki SODIMM yuvasına erişmek için fanın çıkarılması gerekir, ancak kolay servis için tüm işlem aletsizdir.
FCLGA1700 işlemcinin diğer mini PC'lerin çoğundan farklı olarak çıkarılabilir ve değiştirilebilir olduğunu unutmayın.
Aksesuarlar ve Garanti
Kutuda harici güç tuğlası ve evraklar dışında ekstra bir şey yok. Dikey standın ayrı satılması çok kötü çünkü sistem oldukça kolay bir şekilde devrilebilir.
Dell'in diğer üst düzey iş merkezli bilgisayarlarında olduğu gibi üç yıllık sınırlı üretici garantisi geçerlidir.
Performans - Masaüstü İşlemci Gücü
Test Koşulları
Aşağıdaki kıyaslamaları çalıştırmadan önce Windows'u Performans moduna ayarladık. Dell Optimizer önceden yüklenmiş olarak geliyor, ancak çoğu Dell dizüstü bilgisayarın aksine özel güç profilleri sunmuyor.
İşlemci
CPU performansı form faktörü için inanılmaz. H serisi ile karşılaştırıldığında Core i7-13700H gibi dizüstü bilgisayarlarda bulunduğu gibi Inspiron 16 Plus 7630masaüstü serisi Core i7-13700, çoğunlukla daha yüksek güç zarfı ve daha hızlı saat hızları sayesinde yüzde 15 ila 30 daha hızlı çoklu iş parçacığı performansı sunar. Diğerlerine göre avantajları Apple M2 cPU ağırlıklı yükler söz konusu olduğunda fark edilir.
Ne yazık ki OptiPlex Micro'daki Core i7-13700, aynı işlemciye sahip daha büyük bir masaüstü bilgisayarla karşılaştırıldığında yavaşlamaya daha yatkındır. Örneğin, tam boyutlu bir kulede çalışan referans Core i7-13700, mini bilgisayarımızdan yüzde 40 ila 60 daha hızlı çok iş parçacıklı karşılaştırma puanları döndürür. Bu, Dell ünitesinin yavaş olduğu anlamına gelmiyor, ancak küçük soğutma çözümünün sınırlayıcı bir faktör olduğu inkar edilemez. Örneğin, CineBench R15 xT'yi bir döngüde çalıştırırken, performans ilk birkaç döngüden sonra yaklaşık yüzde 20 oranında düşerek yavaşlama davranışına işaret ediyordu.
Cinebench R15 Multi Loop
Cinebench R23: Multi Core | Single Core
Cinebench R20: CPU (Multi Core) | CPU (Single Core)
Cinebench R15: CPU Multi 64Bit | CPU Single 64Bit
Blender: v2.79 BMW27 CPU
7-Zip 18.03: 7z b 4 | 7z b 4 -mmt1
Geekbench 5.5: Multi-Core | Single-Core
HWBOT x265 Benchmark v2.2: 4k Preset
LibreOffice : 20 Documents To PDF
R Benchmark 2.5: Overall mean
| CPU Performance rating | |
| Intel Core i7-13700 | |
| Ortalama Intel Core i7-13700 | |
| Dell OptiPlex Micro | |
| Alienware m16 R1 Intel | |
| Beelink GTR7 7840HS | |
| Lenovo IdeaCentre Mini 01IRH8 | |
| Intel NUC 12, NUC12SNKi72_Serpent Canyon | |
| GMK NucBox K3 Pro | |
| Acemagic AM20 | |
| Apple Mac Mini M2 -5! | |
| Geekom A5 | |
| Acemagic AD15 | |
| Minisforum Venus Series UN1245 | |
| Cinebench R23 / Multi Core | |
| Intel Core i7-13700 | |
| Ortalama Intel Core i7-13700 (21013 - 29725, n=2) | |
| Alienware m16 R1 Intel | |
| Dell OptiPlex Micro | |
| Beelink GTR7 7840HS | |
| Intel NUC 12, NUC12SNKi72_Serpent Canyon | |
| Lenovo IdeaCentre Mini 01IRH8 | |
| Acemagic AM20 | |
| Geekom A5 | |
| GMK NucBox K3 Pro | |
| Acemagic AD15 | |
| Minisforum Venus Series UN1245 | |
| Apple Mac Mini M2 | |
| Cinebench R23 / Single Core | |
| Intel Core i7-13700 | |
| Ortalama Intel Core i7-13700 (1997 - 2020, n=2) | |
| Dell OptiPlex Micro | |
| Alienware m16 R1 Intel | |
| Lenovo IdeaCentre Mini 01IRH8 | |
| Beelink GTR7 7840HS | |
| Intel NUC 12, NUC12SNKi72_Serpent Canyon | |
| GMK NucBox K3 Pro | |
| Minisforum Venus Series UN1245 | |
| Apple Mac Mini M2 | |
| Acemagic AM20 | |
| Acemagic AD15 | |
| Geekom A5 | |
| Cinebench R20 / CPU (Multi Core) | |
| Intel Core i7-13700 | |
| Ortalama Intel Core i7-13700 (7027 - 11361, n=2) | |
| Alienware m16 R1 Intel | |
| Dell OptiPlex Micro | |
| Beelink GTR7 7840HS | |
| Intel NUC 12, NUC12SNKi72_Serpent Canyon | |
| Lenovo IdeaCentre Mini 01IRH8 | |
| Acemagic AM20 | |
| Geekom A5 | |
| GMK NucBox K3 Pro | |
| Acemagic AD15 | |
| Minisforum Venus Series UN1245 | |
| Apple Mac Mini M2 | |
| Cinebench R20 / CPU (Single Core) | |
| Intel Core i7-13700 | |
| Ortalama Intel Core i7-13700 (703 - 776, n=2) | |
| Alienware m16 R1 Intel | |
| Lenovo IdeaCentre Mini 01IRH8 | |
| Beelink GTR7 7840HS | |
| Dell OptiPlex Micro | |
| Intel NUC 12, NUC12SNKi72_Serpent Canyon | |
| GMK NucBox K3 Pro | |
| Minisforum Venus Series UN1245 | |
| Acemagic AM20 | |
| Acemagic AD15 | |
| Geekom A5 | |
| Apple Mac Mini M2 | |
| Cinebench R15 / CPU Multi 64Bit | |
| Intel Core i7-13700 | |
| Ortalama Intel Core i7-13700 (2986 - 4398, n=2) | |
| Alienware m16 R1 Intel | |
| Dell OptiPlex Micro | |
| Beelink GTR7 7840HS | |
| Intel NUC 12, NUC12SNKi72_Serpent Canyon | |
| Lenovo IdeaCentre Mini 01IRH8 | |
| Acemagic AM20 | |
| Geekom A5 | |
| GMK NucBox K3 Pro | |
| Acemagic AD15 | |
| Minisforum Venus Series UN1245 | |
| Apple Mac Mini M2 | |
| Cinebench R15 / CPU Single 64Bit | |
| Intel Core i7-13700 | |
| Beelink GTR7 7840HS | |
| Ortalama Intel Core i7-13700 (279 - 291, n=2) | |
| Dell OptiPlex Micro | |
| Alienware m16 R1 Intel | |
| Lenovo IdeaCentre Mini 01IRH8 | |
| Intel NUC 12, NUC12SNKi72_Serpent Canyon | |
| GMK NucBox K3 Pro | |
| Acemagic AM20 | |
| Minisforum Venus Series UN1245 | |
| Apple Mac Mini M2 | |
| Geekom A5 | |
| Acemagic AD15 | |
| Blender / v2.79 BMW27 CPU | |
| Apple Mac Mini M2 | |
| Minisforum Venus Series UN1245 | |
| GMK NucBox K3 Pro | |
| Acemagic AD15 | |
| Geekom A5 | |
| Acemagic AM20 | |
| Beelink GTR7 7840HS | |
| Lenovo IdeaCentre Mini 01IRH8 | |
| Intel NUC 12, NUC12SNKi72_Serpent Canyon | |
| Dell OptiPlex Micro | |
| Alienware m16 R1 Intel | |
| Ortalama Intel Core i7-13700 (111 - 178, n=2) | |
| Intel Core i7-13700 | |
| 7-Zip 18.03 / 7z b 4 | |
| Intel Core i7-13700 | |
| Ortalama Intel Core i7-13700 (74475 - 108733, n=2) | |
| Alienware m16 R1 Intel | |
| Dell OptiPlex Micro | |
| Beelink GTR7 7840HS | |
| Intel NUC 12, NUC12SNKi72_Serpent Canyon | |
| Lenovo IdeaCentre Mini 01IRH8 | |
| Geekom A5 | |
| Acemagic AM20 | |
| Acemagic AD15 | |
| GMK NucBox K3 Pro | |
| Minisforum Venus Series UN1245 | |
| 7-Zip 18.03 / 7z b 4 -mmt1 | |
| Intel Core i7-13700 | |
| Beelink GTR7 7840HS | |
| Ortalama Intel Core i7-13700 (6466 - 6819, n=2) | |
| Dell OptiPlex Micro | |
| Alienware m16 R1 Intel | |
| Lenovo IdeaCentre Mini 01IRH8 | |
| Intel NUC 12, NUC12SNKi72_Serpent Canyon | |
| GMK NucBox K3 Pro | |
| Acemagic AD15 | |
| Acemagic AM20 | |
| Geekom A5 | |
| Minisforum Venus Series UN1245 | |
| Geekbench 5.5 / Multi-Core | |
| Intel Core i7-13700 | |
| Ortalama Intel Core i7-13700 (15525 - 19602, n=2) | |
| Dell OptiPlex Micro | |
| Alienware m16 R1 Intel | |
| Beelink GTR7 7840HS | |
| Lenovo IdeaCentre Mini 01IRH8 | |
| Intel NUC 12, NUC12SNKi72_Serpent Canyon | |
| GMK NucBox K3 Pro | |
| Apple Mac Mini M2 | |
| Geekom A5 | |
| Acemagic AM20 | |
| Acemagic AD15 | |
| Minisforum Venus Series UN1245 | |
| Geekbench 5.5 / Single-Core | |
| Beelink GTR7 7840HS | |
| Intel Core i7-13700 | |
| Ortalama Intel Core i7-13700 (1958 - 2009, n=2) | |
| Dell OptiPlex Micro | |
| Apple Mac Mini M2 | |
| Alienware m16 R1 Intel | |
| Lenovo IdeaCentre Mini 01IRH8 | |
| GMK NucBox K3 Pro | |
| Minisforum Venus Series UN1245 | |
| Acemagic AD15 | |
| Intel NUC 12, NUC12SNKi72_Serpent Canyon | |
| Acemagic AM20 | |
| Geekom A5 | |
| HWBOT x265 Benchmark v2.2 / 4k Preset | |
| Intel Core i7-13700 | |
| Ortalama Intel Core i7-13700 (21.4 - 33.1, n=2) | |
| Alienware m16 R1 Intel | |
| Dell OptiPlex Micro | |
| Intel NUC 12, NUC12SNKi72_Serpent Canyon | |
| Lenovo IdeaCentre Mini 01IRH8 | |
| Acemagic AM20 | |
| Geekom A5 | |
| GMK NucBox K3 Pro | |
| Acemagic AD15 | |
| Beelink GTR7 7840HS | |
| Minisforum Venus Series UN1245 | |
| LibreOffice / 20 Documents To PDF | |
| Geekom A5 | |
| Minisforum Venus Series UN1245 | |
| Acemagic AD15 | |
| Acemagic AM20 | |
| Alienware m16 R1 Intel | |
| Intel NUC 12, NUC12SNKi72_Serpent Canyon | |
| GMK NucBox K3 Pro | |
| Beelink GTR7 7840HS | |
| Lenovo IdeaCentre Mini 01IRH8 | |
| Dell OptiPlex Micro | |
| Ortalama Intel Core i7-13700 (34.1 - 36.4, n=2) | |
| Intel Core i7-13700 | |
| R Benchmark 2.5 / Overall mean | |
| Acemagic AD15 | |
| Acemagic AM20 | |
| Geekom A5 | |
| Minisforum Venus Series UN1245 | |
| GMK NucBox K3 Pro | |
| Intel NUC 12, NUC12SNKi72_Serpent Canyon | |
| Lenovo IdeaCentre Mini 01IRH8 | |
| Alienware m16 R1 Intel | |
| Dell OptiPlex Micro | |
| Beelink GTR7 7840HS | |
| Ortalama Intel Core i7-13700 (0.4075 - 0.423, n=2) | |
| Intel Core i7-13700 | |
Cinebench R23: Multi Core | Single Core
Cinebench R20: CPU (Multi Core) | CPU (Single Core)
Cinebench R15: CPU Multi 64Bit | CPU Single 64Bit
Blender: v2.79 BMW27 CPU
7-Zip 18.03: 7z b 4 | 7z b 4 -mmt1
Geekbench 5.5: Multi-Core | Single-Core
HWBOT x265 Benchmark v2.2: 4k Preset
LibreOffice : 20 Documents To PDF
R Benchmark 2.5: Overall mean
* ... daha küçük daha iyidir
AIDA64: FP32 Ray-Trace | FPU Julia | CPU SHA3 | CPU Queen | FPU SinJulia | FPU Mandel | CPU AES | CPU ZLib | FP64 Ray-Trace | CPU PhotoWorxx
| Performance rating | |
| Beelink GTR7 7840HS | |
| Beelink SER7 | |
| Ortalama Intel Core i7-13700 | |
| Dell OptiPlex Micro | |
| Lenovo IdeaCentre Mini 01IRH8 | |
| GMK NucBox K3 Pro | |
| AIDA64 / FP32 Ray-Trace | |
| Beelink GTR7 7840HS | |
| Beelink SER7 | |
| Ortalama Intel Core i7-13700 (16408 - 29348, n=2) | |
| Dell OptiPlex Micro | |
| Lenovo IdeaCentre Mini 01IRH8 | |
| GMK NucBox K3 Pro | |
| AIDA64 / FPU Julia | |
| Beelink GTR7 7840HS | |
| Ortalama Intel Core i7-13700 (83757 - 138865, n=2) | |
| Beelink SER7 | |
| Dell OptiPlex Micro | |
| Lenovo IdeaCentre Mini 01IRH8 | |
| GMK NucBox K3 Pro | |
| AIDA64 / CPU SHA3 | |
| Beelink GTR7 7840HS | |
| Ortalama Intel Core i7-13700 (3648 - 6169, n=2) | |
| Beelink SER7 | |
| Dell OptiPlex Micro | |
| Lenovo IdeaCentre Mini 01IRH8 | |
| GMK NucBox K3 Pro | |
| AIDA64 / CPU Queen | |
| Ortalama Intel Core i7-13700 (113697 - 128088, n=2) | |
| Beelink GTR7 7840HS | |
| Dell OptiPlex Micro | |
| Beelink SER7 | |
| Lenovo IdeaCentre Mini 01IRH8 | |
| GMK NucBox K3 Pro | |
| AIDA64 / FPU SinJulia | |
| Beelink GTR7 7840HS | |
| Beelink SER7 | |
| Ortalama Intel Core i7-13700 (10833 - 15314, n=2) | |
| Dell OptiPlex Micro | |
| Lenovo IdeaCentre Mini 01IRH8 | |
| GMK NucBox K3 Pro | |
| AIDA64 / FPU Mandel | |
| Beelink GTR7 7840HS | |
| Beelink SER7 | |
| Ortalama Intel Core i7-13700 (40920 - 72217, n=2) | |
| Dell OptiPlex Micro | |
| Lenovo IdeaCentre Mini 01IRH8 | |
| GMK NucBox K3 Pro | |
| AIDA64 / CPU AES | |
| Beelink GTR7 7840HS | |
| Beelink SER7 | |
| Ortalama Intel Core i7-13700 (76357 - 120512, n=2) | |
| GMK NucBox K3 Pro | |
| Dell OptiPlex Micro | |
| Lenovo IdeaCentre Mini 01IRH8 | |
| AIDA64 / CPU ZLib | |
| Ortalama Intel Core i7-13700 (1045 - 1703, n=2) | |
| Beelink GTR7 7840HS | |
| Dell OptiPlex Micro | |
| Lenovo IdeaCentre Mini 01IRH8 | |
| Beelink SER7 | |
| GMK NucBox K3 Pro | |
| AIDA64 / FP64 Ray-Trace | |
| Beelink GTR7 7840HS | |
| Beelink SER7 | |
| Ortalama Intel Core i7-13700 (8712 - 16164, n=2) | |
| Dell OptiPlex Micro | |
| Lenovo IdeaCentre Mini 01IRH8 | |
| GMK NucBox K3 Pro | |
| AIDA64 / CPU PhotoWorxx | |
| GMK NucBox K3 Pro | |
| Ortalama Intel Core i7-13700 (37819 - 48448, n=2) | |
| Beelink SER7 | |
| Beelink GTR7 7840HS | |
| Dell OptiPlex Micro | |
| Lenovo IdeaCentre Mini 01IRH8 | |
Sistem Performansı
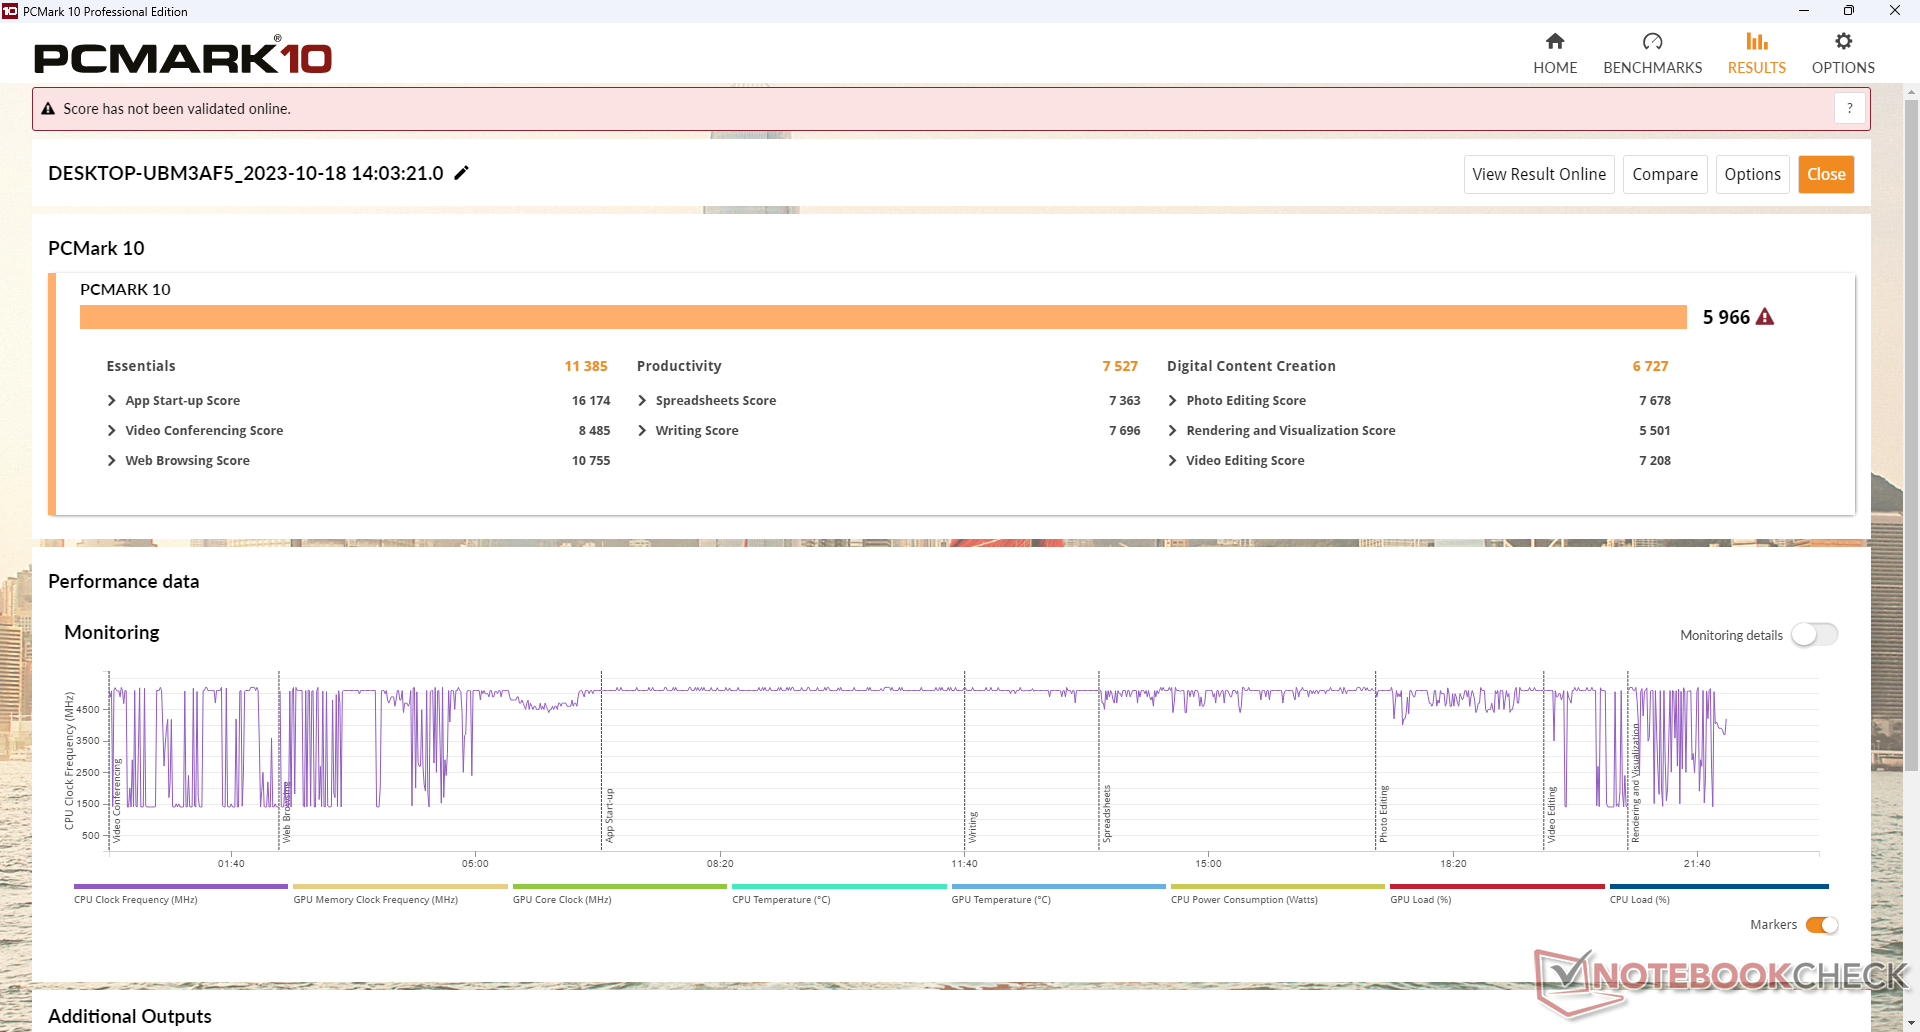
PCMark sonuçları ile karşılaştırılabilirGMK NucBox K3 Pro ancak Beelink SER7 gibi AMD tabanlı mini bilgisayarların gerisinde kalmaya devam ediyor. Bu açık büyük ölçüde rakip Ryzen Zen 3+ veya Zen 4 platformlarındaki daha hızlı entegre Radeon GPU'ya bağlanabilir.
CrossMark: Overall | Productivity | Creativity | Responsiveness
| PCMark 10 / Score | |
| Beelink GTR7 7840HS | |
| Beelink SER7 | |
| Lenovo IdeaCentre Mini 01IRH8 | |
| Dell OptiPlex Micro | |
| Ortalama Intel Core i7-13700, Intel UHD Graphics 770 (n=1) | |
| GMK NucBox K3 Pro | |
| PCMark 10 / Essentials | |
| Lenovo IdeaCentre Mini 01IRH8 | |
| Dell OptiPlex Micro | |
| Ortalama Intel Core i7-13700, Intel UHD Graphics 770 (n=1) | |
| Beelink GTR7 7840HS | |
| Beelink SER7 | |
| GMK NucBox K3 Pro | |
| PCMark 10 / Productivity | |
| Beelink GTR7 7840HS | |
| Beelink SER7 | |
| GMK NucBox K3 Pro | |
| Lenovo IdeaCentre Mini 01IRH8 | |
| Dell OptiPlex Micro | |
| Ortalama Intel Core i7-13700, Intel UHD Graphics 770 (n=1) | |
| PCMark 10 / Digital Content Creation | |
| Beelink GTR7 7840HS | |
| Beelink SER7 | |
| Lenovo IdeaCentre Mini 01IRH8 | |
| Dell OptiPlex Micro | |
| Ortalama Intel Core i7-13700, Intel UHD Graphics 770 (n=1) | |
| GMK NucBox K3 Pro | |
| CrossMark / Overall | |
| Dell OptiPlex Micro | |
| Ortalama Intel Core i7-13700, Intel UHD Graphics 770 (n=1) | |
| Lenovo IdeaCentre Mini 01IRH8 | |
| Beelink SER7 | |
| GMK NucBox K3 Pro | |
| Beelink GTR7 7840HS | |
| Apple Mac Mini M2 | |
| CrossMark / Productivity | |
| Dell OptiPlex Micro | |
| Ortalama Intel Core i7-13700, Intel UHD Graphics 770 (n=1) | |
| Lenovo IdeaCentre Mini 01IRH8 | |
| Beelink SER7 | |
| Beelink GTR7 7840HS | |
| GMK NucBox K3 Pro | |
| Apple Mac Mini M2 | |
| CrossMark / Creativity | |
| Dell OptiPlex Micro | |
| Ortalama Intel Core i7-13700, Intel UHD Graphics 770 (n=1) | |
| Beelink SER7 | |
| Lenovo IdeaCentre Mini 01IRH8 | |
| Apple Mac Mini M2 | |
| GMK NucBox K3 Pro | |
| Beelink GTR7 7840HS | |
| CrossMark / Responsiveness | |
| Beelink GTR7 7840HS | |
| Dell OptiPlex Micro | |
| Ortalama Intel Core i7-13700, Intel UHD Graphics 770 (n=1) | |
| Lenovo IdeaCentre Mini 01IRH8 | |
| GMK NucBox K3 Pro | |
| Beelink SER7 | |
| Apple Mac Mini M2 | |
| PCMark 10 Score | 5966 puan | |
Yardım | ||
| AIDA64 / Memory Copy | |
| GMK NucBox K3 Pro | |
| Beelink SER7 | |
| Beelink GTR7 7840HS | |
| Ortalama Intel Core i7-13700 (61152 - 73900, n=2) | |
| Dell OptiPlex Micro | |
| Lenovo IdeaCentre Mini 01IRH8 | |
| AIDA64 / Memory Read | |
| Ortalama Intel Core i7-13700 (71285 - 81167, n=2) | |
| Dell OptiPlex Micro | |
| GMK NucBox K3 Pro | |
| Beelink SER7 | |
| Beelink GTR7 7840HS | |
| Lenovo IdeaCentre Mini 01IRH8 | |
| AIDA64 / Memory Write | |
| Beelink SER7 | |
| Beelink GTR7 7840HS | |
| Ortalama Intel Core i7-13700 (60029 - 73720, n=2) | |
| Dell OptiPlex Micro | |
| GMK NucBox K3 Pro | |
| Lenovo IdeaCentre Mini 01IRH8 | |
| AIDA64 / Memory Latency | |
| GMK NucBox K3 Pro | |
| Dell OptiPlex Micro | |
| Beelink GTR7 7840HS | |
| Beelink SER7 | |
| Lenovo IdeaCentre Mini 01IRH8 | |
| Ortalama Intel Core i7-13700 (71.8 - 87, n=2) | |
* ... daha küçük daha iyidir
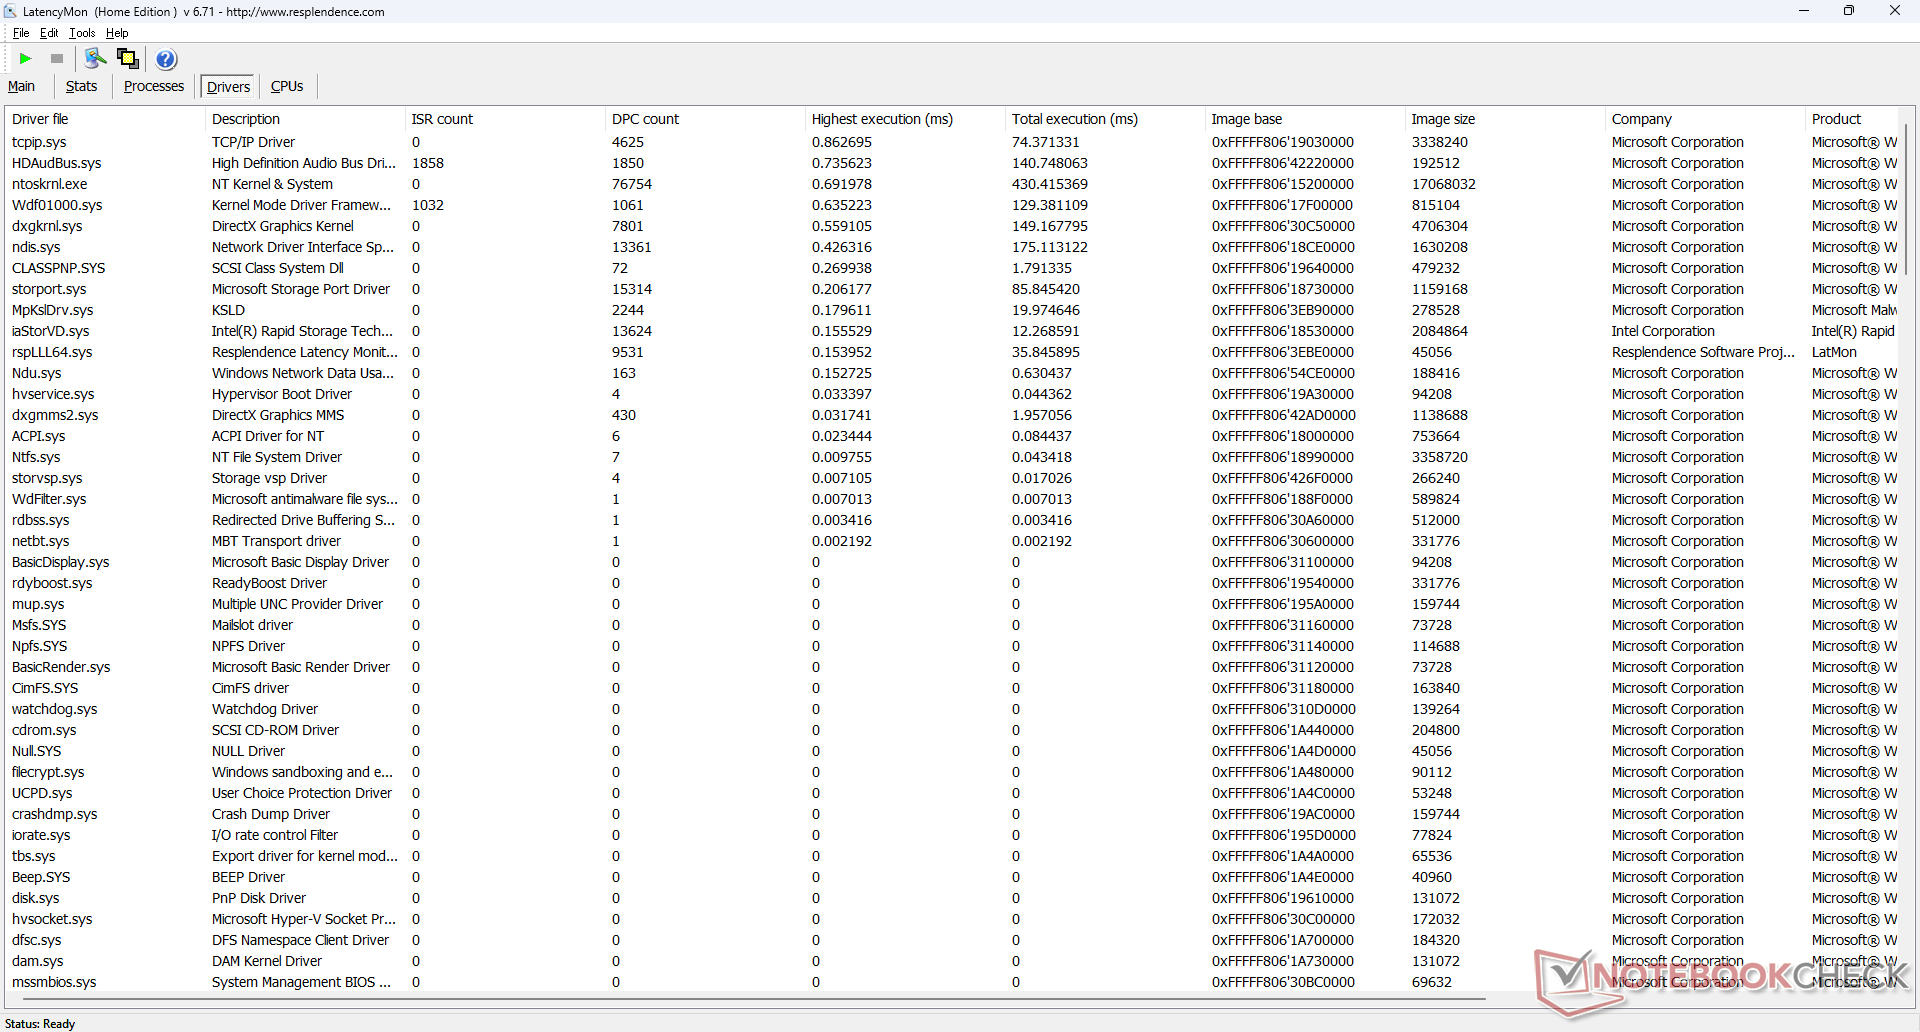
DPC Gecikme Süresi
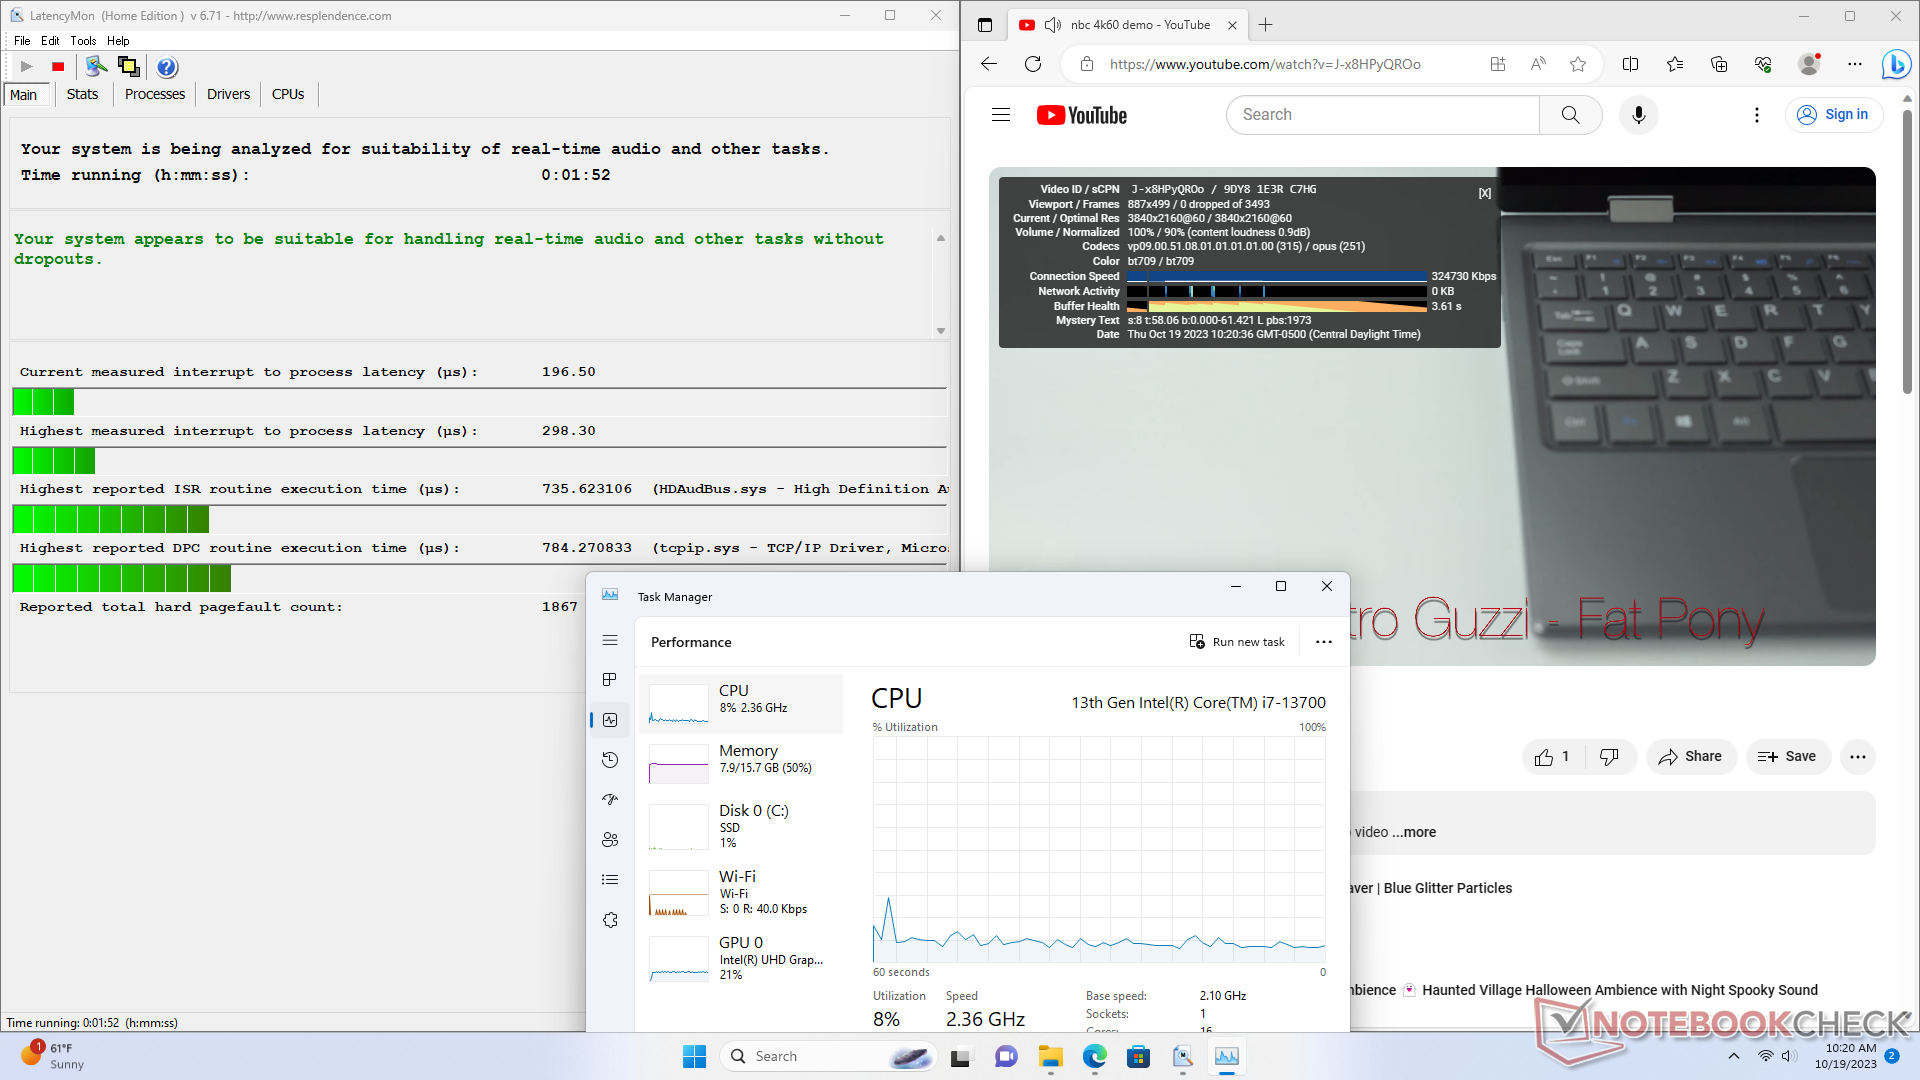
LatencyMon, ana sayfamızın birden fazla tarayıcı sekmesini açarken önemli bir DPC sorunu olmadığını ve 60 FPS'de 4K oynatma sırasında kare düşmediğini ortaya koyuyor.
| DPC Latencies / LatencyMon - interrupt to process latency (max), Web, Youtube, Prime95 | |
| Lenovo IdeaCentre Mini 01IRH8 | |
| GMK NucBox K3 Pro | |
| Beelink GTR7 7840HS | |
| Beelink SER7 | |
| Dell OptiPlex Micro | |
* ... daha küçük daha iyidir
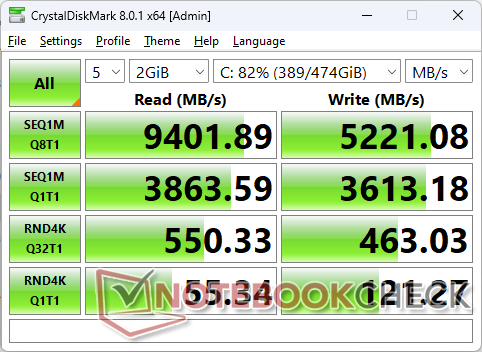
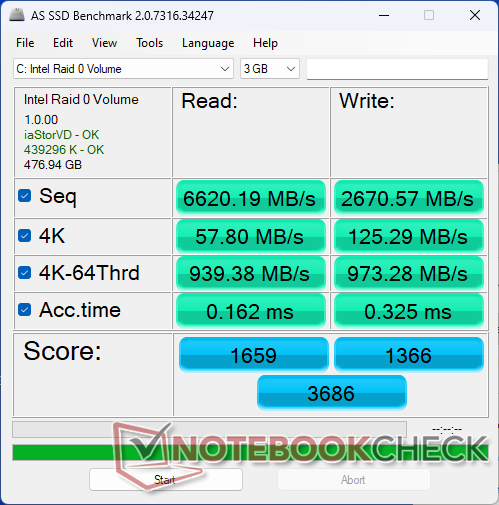
Depolama Cihazları
Ünitemiz iki adet SK hynix BC901 NVMe SSD'ler rAID 0 konfigürasyonunda, her bir sürücü daha tipik olan 80 mm yerine sadece 30 mm uzunluğunda olduğu için nadir görülen bir durumdur. Daha kısa uzunluk ve herhangi bir ısı dağıtıcısının olmaması, sürücüler zorlandığında performans düşüklüğünün meydana gelme olasılığının daha yüksek olduğu anlamına gelir. Ne yazık ki, aşağıdaki DiskSpd döngü testi sonuçlarımızda da görüldüğü gibi, aktarım hızları 1500 ila 2500 MB/s aralığına düşmeden önce yalnızca ilk bir dakika içinde 8600 MB/s'ye kadar çıkabilmektedir.
Sistemin istenirse iki adet tam uzunlukta 2280 M.2 SSD'yi destekleyebileceğini unutmayın.

| Drive Performance rating - Percent | |
| Beelink GTR7 7840HS | |
| Dell OptiPlex Micro | |
| Lenovo IdeaCentre Mini 01IRH8 | |
| Beelink SER7 | |
| GMK NucBox K3 Pro | |
| DiskSpd | |
| seq read | |
| Beelink GTR7 7840HS | |
| Dell OptiPlex Micro | |
| Beelink SER7 | |
| Lenovo IdeaCentre Mini 01IRH8 | |
| GMK NucBox K3 Pro | |
| seq write | |
| Beelink GTR7 7840HS | |
| Beelink SER7 | |
| Dell OptiPlex Micro | |
| GMK NucBox K3 Pro | |
| Lenovo IdeaCentre Mini 01IRH8 | |
| seq q8 t1 read | |
| Dell OptiPlex Micro | |
| Beelink GTR7 7840HS | |
| Beelink SER7 | |
| Lenovo IdeaCentre Mini 01IRH8 | |
| GMK NucBox K3 Pro | |
| seq q8 t1 write | |
| Dell OptiPlex Micro | |
| Beelink GTR7 7840HS | |
| GMK NucBox K3 Pro | |
| Lenovo IdeaCentre Mini 01IRH8 | |
| Beelink SER7 | |
| 4k q1 t1 read | |
| Lenovo IdeaCentre Mini 01IRH8 | |
| Beelink GTR7 7840HS | |
| GMK NucBox K3 Pro | |
| Beelink SER7 | |
| Dell OptiPlex Micro | |
| 4k q1 t1 write | |
| Beelink GTR7 7840HS | |
| GMK NucBox K3 Pro | |
| Lenovo IdeaCentre Mini 01IRH8 | |
| Beelink SER7 | |
| Dell OptiPlex Micro | |
| 4k q32 t16 read | |
| Beelink SER7 | |
| Beelink GTR7 7840HS | |
| GMK NucBox K3 Pro | |
| Lenovo IdeaCentre Mini 01IRH8 | |
| Dell OptiPlex Micro | |
| 4k q32 t16 write | |
| Beelink GTR7 7840HS | |
| Beelink SER7 | |
| GMK NucBox K3 Pro | |
| Lenovo IdeaCentre Mini 01IRH8 | |
| Dell OptiPlex Micro | |
| AS SSD | |
| Score Total | |
| Beelink GTR7 7840HS | |
| Lenovo IdeaCentre Mini 01IRH8 | |
| Dell OptiPlex Micro | |
| GMK NucBox K3 Pro | |
| Beelink SER7 | |
| Score Read | |
| Beelink GTR7 7840HS | |
| Dell OptiPlex Micro | |
| GMK NucBox K3 Pro | |
| Lenovo IdeaCentre Mini 01IRH8 | |
| Beelink SER7 | |
| Score Write | |
| Beelink GTR7 7840HS | |
| Lenovo IdeaCentre Mini 01IRH8 | |
| Dell OptiPlex Micro | |
| GMK NucBox K3 Pro | |
| Beelink SER7 | |
| Seq Read | |
| Dell OptiPlex Micro | |
| Beelink SER7 | |
| Beelink GTR7 7840HS | |
| Lenovo IdeaCentre Mini 01IRH8 | |
| GMK NucBox K3 Pro | |
| Seq Write | |
| Beelink SER7 | |
| Beelink GTR7 7840HS | |
| Dell OptiPlex Micro | |
| GMK NucBox K3 Pro | |
| Lenovo IdeaCentre Mini 01IRH8 | |
| 4K Read | |
| Lenovo IdeaCentre Mini 01IRH8 | |
| Beelink GTR7 7840HS | |
| Dell OptiPlex Micro | |
| GMK NucBox K3 Pro | |
| Beelink SER7 | |
| 4K Write | |
| Beelink GTR7 7840HS | |
| GMK NucBox K3 Pro | |
| Lenovo IdeaCentre Mini 01IRH8 | |
| Beelink SER7 | |
| Dell OptiPlex Micro | |
| 4K-64 Read | |
| Beelink GTR7 7840HS | |
| GMK NucBox K3 Pro | |
| Dell OptiPlex Micro | |
| Lenovo IdeaCentre Mini 01IRH8 | |
| Beelink SER7 | |
| 4K-64 Write | |
| Beelink GTR7 7840HS | |
| Lenovo IdeaCentre Mini 01IRH8 | |
| Dell OptiPlex Micro | |
| GMK NucBox K3 Pro | |
| Beelink SER7 | |
| Access Time Read | |
| Dell OptiPlex Micro | |
| Lenovo IdeaCentre Mini 01IRH8 | |
| GMK NucBox K3 Pro | |
| Beelink SER7 | |
| Beelink GTR7 7840HS | |
| Access Time Write | |
| GMK NucBox K3 Pro | |
| Dell OptiPlex Micro | |
| Lenovo IdeaCentre Mini 01IRH8 | |
| Beelink SER7 | |
| Beelink GTR7 7840HS | |
* ... daha küçük daha iyidir
Disk Throttling: DiskSpd Read Loop, Queue Depth 8
GPU Performansı
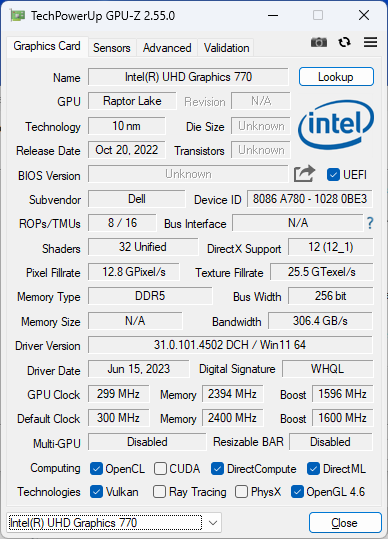
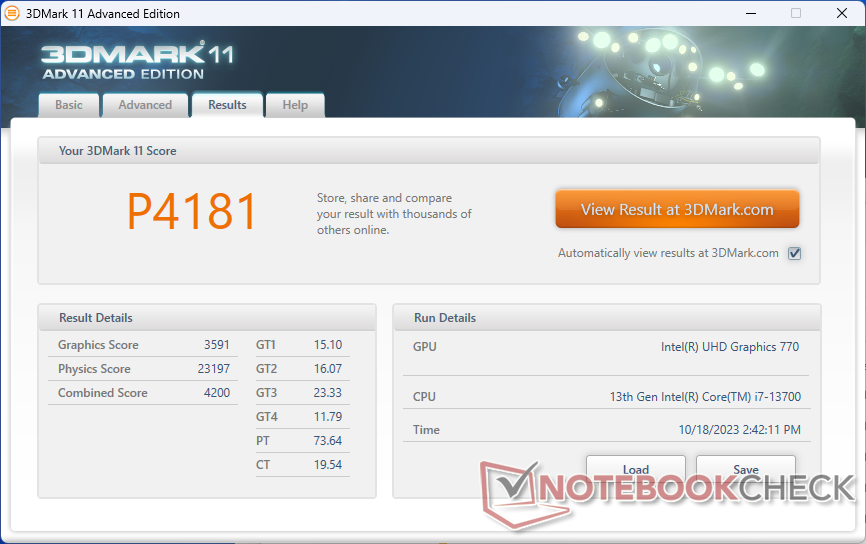
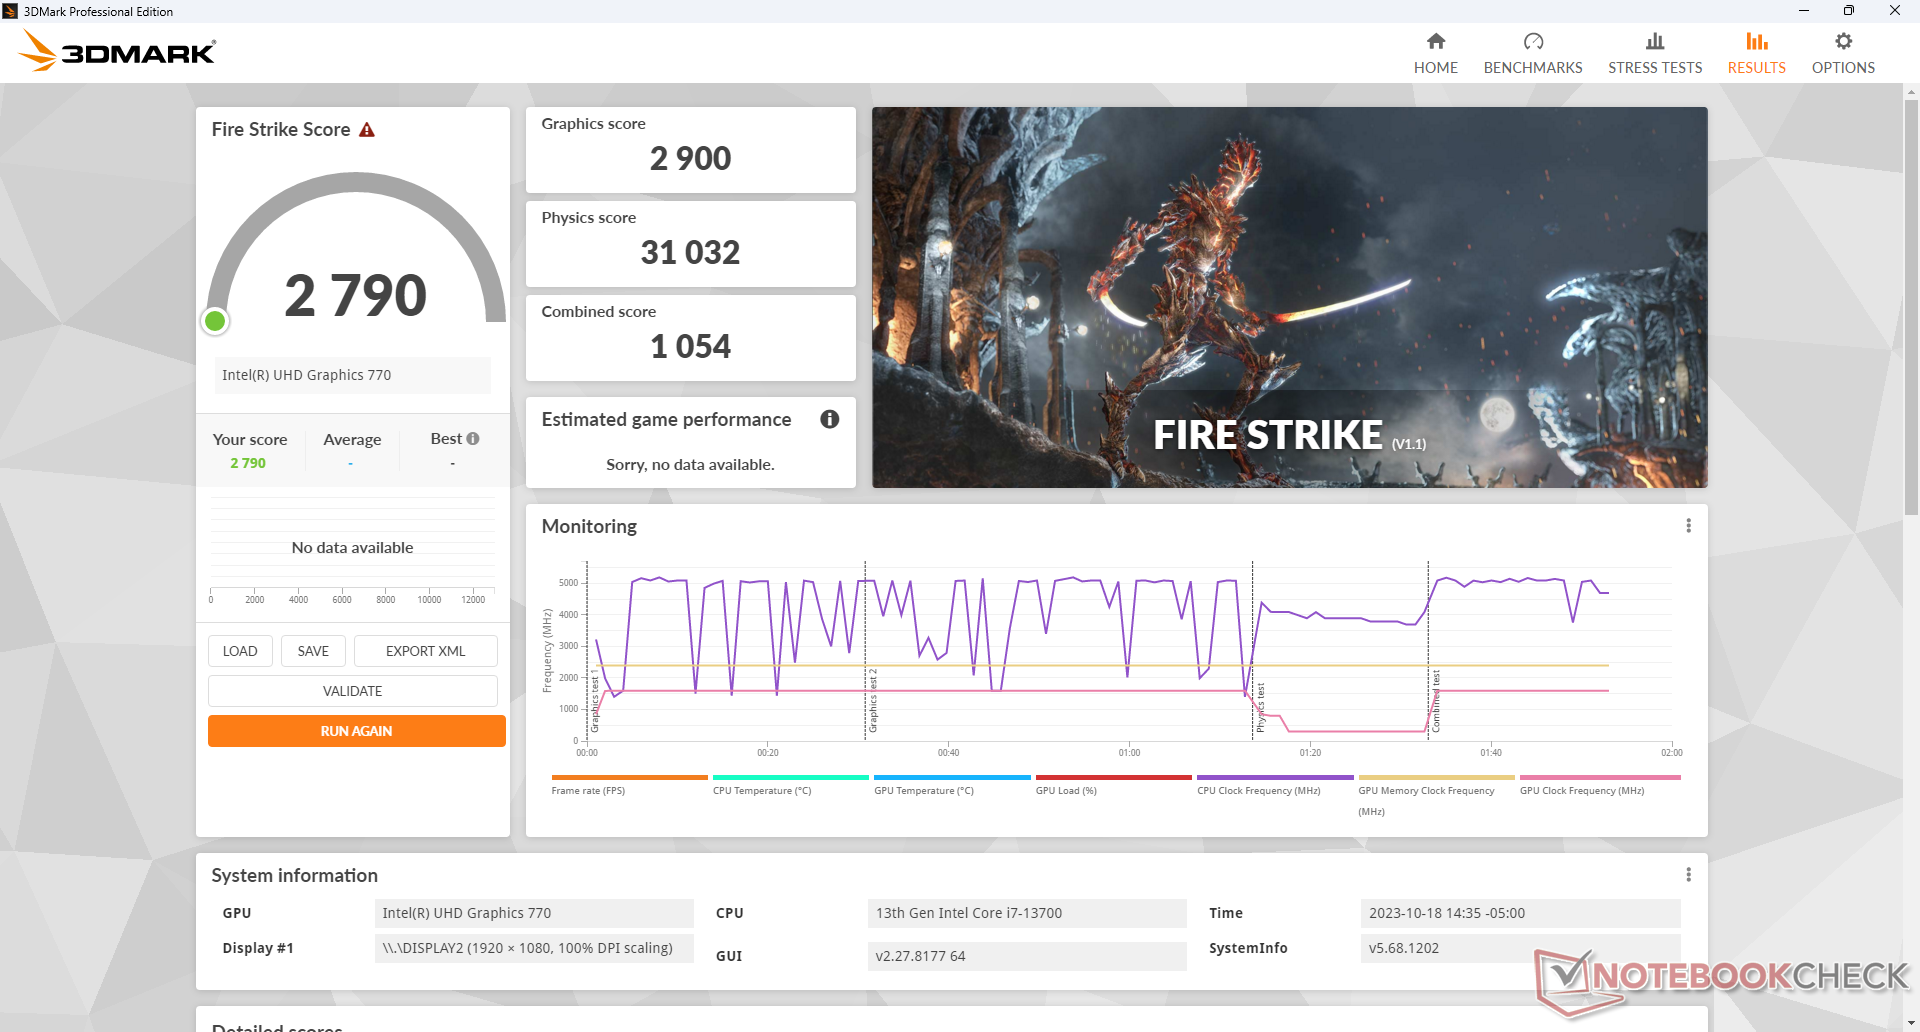
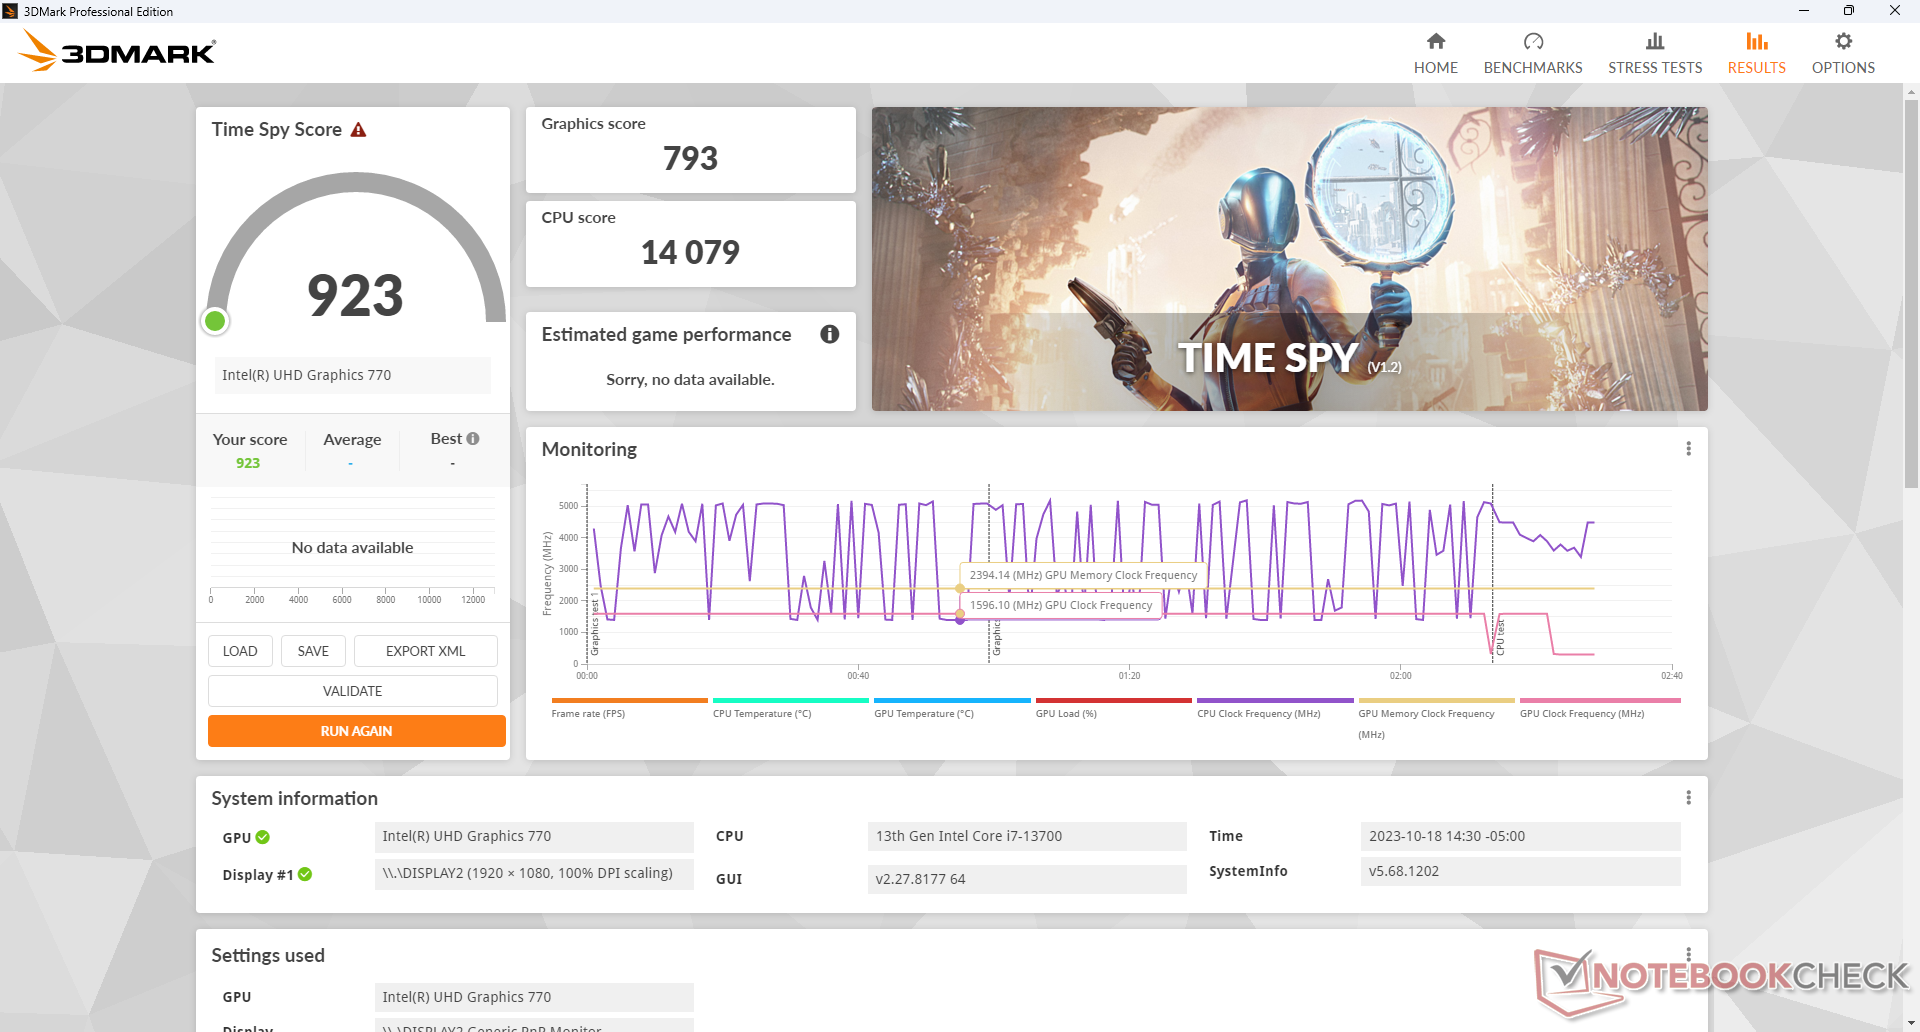
Grafik performansı, özellikle daha etkileyici CPU ile karşılaştırıldığında zayıftır. GrafiklerUHD Graphics 770 modası geçmiştir ve yalnızca akış amaçları veya temel 4K60 video çıkışı için gerçekten kullanışlıdır. Bununla birlikte, OptiPlex Micro bir grafik santrali olarak tasarlanmadığı için bu hedef kitle için bir sorun olmamalıdır.
| 3DMark Performance rating - Percent | |
| Intel NUC 12, NUC12SNKi72_Serpent Canyon | |
| Beelink GTR7 7840HS | |
| Acemagic AM20 | |
| Lenovo IdeaCentre Mini 01IRH8 | |
| Geekom A5 | |
| GMK NucBox K3 Pro | |
| Minisforum Venus Series UN1245 | |
| Dell OptiPlex Micro | |
| Ortalama Intel UHD Graphics 770 | |
| Acemagic AD15 | |
| 3DMark 11 - 1280x720 Performance GPU | |
| Intel NUC 12, NUC12SNKi72_Serpent Canyon | |
| Beelink GTR7 7840HS | |
| Acemagic AM20 | |
| Geekom A5 | |
| Lenovo IdeaCentre Mini 01IRH8 | |
| GMK NucBox K3 Pro | |
| Minisforum Venus Series UN1245 | |
| Dell OptiPlex Micro | |
| Ortalama Intel UHD Graphics 770 (3268 - 3591, n=6) | |
| Acemagic AD15 | |
| 3DMark | |
| 1920x1080 Fire Strike Graphics | |
| Intel NUC 12, NUC12SNKi72_Serpent Canyon | |
| Beelink GTR7 7840HS | |
| Acemagic AM20 | |
| Lenovo IdeaCentre Mini 01IRH8 | |
| GMK NucBox K3 Pro | |
| Geekom A5 | |
| Minisforum Venus Series UN1245 | |
| Dell OptiPlex Micro | |
| Ortalama Intel UHD Graphics 770 (2363 - 2900, n=6) | |
| Acemagic AD15 | |
| 2560x1440 Time Spy Graphics | |
| Intel NUC 12, NUC12SNKi72_Serpent Canyon | |
| Beelink GTR7 7840HS | |
| Acemagic AM20 | |
| Lenovo IdeaCentre Mini 01IRH8 | |
| Geekom A5 | |
| GMK NucBox K3 Pro | |
| Minisforum Venus Series UN1245 | |
| Dell OptiPlex Micro | |
| Ortalama Intel UHD Graphics 770 (666 - 798, n=6) | |
| Acemagic AD15 | |
| 3DMark 11 Performance | 4181 puan | |
| 3DMark Fire Strike Score | 2790 puan | |
| 3DMark Time Spy Score | 923 puan | |
Yardım | ||
| Blender | |
| v3.3 Classroom METAL | |
| Apple Mac Mini M2 | |
| v3.3 Classroom HIP/AMD | |
| Geekom A5 | |
| Acemagic AM20 | |
| v3.3 Classroom CPU | |
| Minisforum Venus Series UN1245 | |
| GMK NucBox K3 Pro | |
| Acemagic AD15 | |
| Apple Mac Mini M2 | |
| Geekom A5 | |
| Acemagic AM20 | |
| Beelink GTR7 7840HS | |
| Lenovo IdeaCentre Mini 01IRH8 | |
| Ortalama Intel UHD Graphics 770 (320 - 533, n=5) | |
| Intel NUC 12, NUC12SNKi72_Serpent Canyon | |
| Dell OptiPlex Micro | |
* ... daha küçük daha iyidir
| Tiny Tina's Wonderlands | |
| 1280x720 Lowest Preset (DX12) | |
| Beelink GTR7 7840HS | |
| Acemagic AM20 | |
| Geekom A5 | |
| Lenovo IdeaCentre Mini 01IRH8 | |
| Minisforum Venus Series UN1245 | |
| Ortalama Intel UHD Graphics 770 (31.3 - 33, n=2) | |
| Dell OptiPlex Micro | |
| Acemagic AD15 | |
| 1920x1080 Low Preset (DX12) | |
| Beelink GTR7 7840HS | |
| Acemagic AM20 | |
| Geekom A5 | |
| Lenovo IdeaCentre Mini 01IRH8 | |
| Minisforum Venus Series UN1245 | |
| Ortalama Intel UHD Graphics 770 (16.4 - 17.2, n=2) | |
| Dell OptiPlex Micro | |
| Acemagic AD15 | |
| The Witcher 3 | |
| 1024x768 Low Graphics & Postprocessing | |
| Beelink GTR7 7840HS | |
| Acemagic AM20 | |
| Lenovo IdeaCentre Mini 01IRH8 | |
| Geekom A5 | |
| GMK NucBox K3 Pro | |
| Minisforum Venus Series UN1245 | |
| Dell OptiPlex Micro | |
| Ortalama Intel UHD Graphics 770 (41.8 - 58, n=4) | |
| Acemagic AD15 | |
| 1366x768 Medium Graphics & Postprocessing | |
| Beelink GTR7 7840HS | |
| GMK NucBox K3 Pro | |
| Lenovo IdeaCentre Mini 01IRH8 | |
| Geekom A5 | |
| Acemagic AM20 | |
| Minisforum Venus Series UN1245 | |
| Dell OptiPlex Micro | |
| Ortalama Intel UHD Graphics 770 (34.2 - 37.9, n=2) | |
| Final Fantasy XV Benchmark | |
| 1280x720 Lite Quality | |
| Beelink GTR7 7840HS | |
| Acemagic AM20 | |
| Geekom A5 | |
| GMK NucBox K3 Pro | |
| Lenovo IdeaCentre Mini 01IRH8 | |
| Minisforum Venus Series UN1245 | |
| Dell OptiPlex Micro | |
| Ortalama Intel UHD Graphics 770 (21.3 - 28.2, n=6) | |
| Acemagic AD15 | |
| 1920x1080 Standard Quality | |
| Beelink GTR7 7840HS | |
| Acemagic AM20 | |
| Geekom A5 | |
| GMK NucBox K3 Pro | |
| Lenovo IdeaCentre Mini 01IRH8 | |
| Minisforum Venus Series UN1245 | |
| Dell OptiPlex Micro | |
| Ortalama Intel UHD Graphics 770 (11.3 - 14.6, n=6) | |
| Acemagic AD15 | |
| 1920x1080 High Quality | |
| Beelink GTR7 7840HS | |
| Acemagic AM20 | |
| Geekom A5 | |
| GMK NucBox K3 Pro | |
| Lenovo IdeaCentre Mini 01IRH8 | |
| Minisforum Venus Series UN1245 | |
| Dell OptiPlex Micro | |
| Ortalama Intel UHD Graphics 770 (8 - 10.2, n=6) | |
| Acemagic AD15 | |
| Dota 2 Reborn | |
| 1280x720 min (0/3) fastest | |
| Beelink GTR7 7840HS | |
| Dell OptiPlex Micro | |
| Minisforum Venus Series UN1245 | |
| Geekom A5 | |
| Ortalama Intel UHD Graphics 770 (102.4 - 154.6, n=4) | |
| Acemagic AM20 | |
| GMK NucBox K3 Pro | |
| Acemagic AD15 | |
| Lenovo IdeaCentre Mini 01IRH8 | |
| 1366x768 med (1/3) | |
| Beelink GTR7 7840HS | |
| Geekom A5 | |
| Acemagic AM20 | |
| Dell OptiPlex Micro | |
| GMK NucBox K3 Pro | |
| Minisforum Venus Series UN1245 | |
| Ortalama Intel UHD Graphics 770 (74.4 - 96.1, n=4) | |
| Lenovo IdeaCentre Mini 01IRH8 | |
| Acemagic AD15 | |
| 1920x1080 high (2/3) | |
| Beelink GTR7 7840HS | |
| Acemagic AM20 | |
| Geekom A5 | |
| GMK NucBox K3 Pro | |
| Lenovo IdeaCentre Mini 01IRH8 | |
| Minisforum Venus Series UN1245 | |
| Dell OptiPlex Micro | |
| Ortalama Intel UHD Graphics 770 (38 - 44.2, n=4) | |
| Acemagic AD15 | |
| 1920x1080 ultra (3/3) best looking | |
| Beelink GTR7 7840HS | |
| Acemagic AM20 | |
| Geekom A5 | |
| GMK NucBox K3 Pro | |
| Lenovo IdeaCentre Mini 01IRH8 | |
| Minisforum Venus Series UN1245 | |
| Dell OptiPlex Micro | |
| Ortalama Intel UHD Graphics 770 (35.4 - 40.8, n=4) | |
| Acemagic AD15 | |
| X-Plane 11.11 | |
| 1280x720 low (fps_test=1) | |
| Beelink GTR7 7840HS | |
| Acemagic AM20 | |
| Geekom A5 | |
| Dell OptiPlex Micro | |
| Ortalama Intel UHD Graphics 770 (28.5 - 53.5, n=3) | |
| Lenovo IdeaCentre Mini 01IRH8 | |
| GMK NucBox K3 Pro | |
| Acemagic AD15 | |
| 1920x1080 med (fps_test=2) | |
| Beelink GTR7 7840HS | |
| Acemagic AM20 | |
| Geekom A5 | |
| GMK NucBox K3 Pro | |
| Lenovo IdeaCentre Mini 01IRH8 | |
| Dell OptiPlex Micro | |
| Ortalama Intel UHD Graphics 770 (21.7 - 33.8, n=3) | |
| Acemagic AD15 | |
| 1920x1080 high (fps_test=3) | |
| Beelink GTR7 7840HS | |
| Acemagic AM20 | |
| Geekom A5 | |
| Dell OptiPlex Micro | |
| Lenovo IdeaCentre Mini 01IRH8 | |
| Ortalama Intel UHD Graphics 770 (18.8 - 30.7, n=3) | |
| GMK NucBox K3 Pro | |
| Acemagic AD15 | |
| Cyberpunk 2077 1.6 | |
| 1280x720 Low Preset | |
| Beelink GTR7 7840HS | |
| Lenovo IdeaCentre Mini 01IRH8 | |
| Ortalama Intel UHD Graphics 770 (18.6 - 22.2, n=2) | |
| Dell OptiPlex Micro | |
| 1920x1080 Low Preset | |
| Beelink GTR7 7840HS | |
| Lenovo IdeaCentre Mini 01IRH8 | |
| Ortalama Intel UHD Graphics 770 (10.2 - 11.8, n=2) | |
| Dell OptiPlex Micro | |
Witcher 3 FPS Chart
| düşük | orta | yüksek | ultra | |
|---|---|---|---|---|
| The Witcher 3 (2015) | 58 | 37.9 | ||
| Dota 2 Reborn (2015) | 153.1 | 96.1 | 44.2 | 40.8 |
| Final Fantasy XV Benchmark (2018) | 28.2 | 14.6 | 10.2 | |
| X-Plane 11.11 (2018) | 51.4 | 32.7 | 29.7 | |
| Cyberpunk 2077 1.6 (2022) | 10.2 | |||
| Tiny Tina's Wonderlands (2022) | 16.4 |
Emisyonlar
Sistem Gürültüsü
Dahili fan, 23,2 dB(A)'lık sessiz bir arka plana karşı minimum 28,2 dB(A) ile her zaman aktiftir. Tarayıcılar veya elektronik tablolar gibi tipik yükleri çalıştırırken 30 dB(A) civarında nispeten sessiz kalır, ancak Prime95 stresi gibi aşırı yükler, diğer mini PC'lerin çoğundan daha yüksek olacak şekilde neredeyse 50 dB(A) fan gürültüsüne neden olabilir. Başka bir deyişle, OptiPlex Micro yalnızca zorlu uygulamalar devreye girdiğinde gürültülü hale gelir.
Ses yüksekliği
| Boşta |
| 28.2 / 28.2 / 29.1 dB |
| Çalışırken |
| 30.2 / 49.1 dB |
 | ||
30 dB sessiz 40 dB(A) duyulabilirlik 50 dB(A) gürültülü |
||
min: | ||
| Dell OptiPlex Micro UHD Graphics 770, i7-13700 | Apple Mac Mini M2 M2 10-Core GPU, M2, Apple SSD AP0512Z | Lenovo IdeaCentre Mini 01IRH8 Iris Xe G7 96EUs, i7-13700H, Samsung PM9B1 512GB MZVL4512HBLU | GMK NucBox K3 Pro UHD Graphics 64EUs, i7-12650H, Lexar NM610 Pro NM610P001T-HNNNG | Beelink GTR7 7840HS Radeon 780M, R7 7840HS, Crucial P3 Plus CT1000P3PSSD8 | Beelink SER7 Radeon 780M, R7 7840HS, Crucial P3 Plus CT1000P3PSSD8 | |
|---|---|---|---|---|---|---|
| Noise | 15% | 2% | 4% | 1% | 5% | |
| kapalı / ortam * (dB) | 23.2 | 24.7 -6% | 23.4 -1% | 23.1 -0% | 25.6 -10% | 24.5 -6% |
| Idle Minimum * (dB) | 28.2 | 24.7 12% | 30.4 -8% | 25 11% | 28.1 -0% | 25.1 11% |
| Idle Average * (dB) | 28.2 | 24.7 12% | 30.4 -8% | 25.5 10% | 28.1 -0% | 25.1 11% |
| Idle Maximum * (dB) | 29.1 | 24.7 15% | 30.4 -4% | 25.5 12% | 28.1 3% | 25.1 14% |
| Load Average * (dB) | 30.2 | 24.7 18% | 30.7 -2% | 39.9 -32% | 34.9 -16% | 35.9 -19% |
| Witcher 3 ultra * (dB) | 42.6 | 33.9 20% | 39.9 6% | 36.4 15% | 35.6 16% | |
| Load Maximum * (dB) | 49.1 | 29.4 40% | 41 16% | 39.9 19% | 42.4 14% | 45.4 8% |
* ... daha küçük daha iyidir
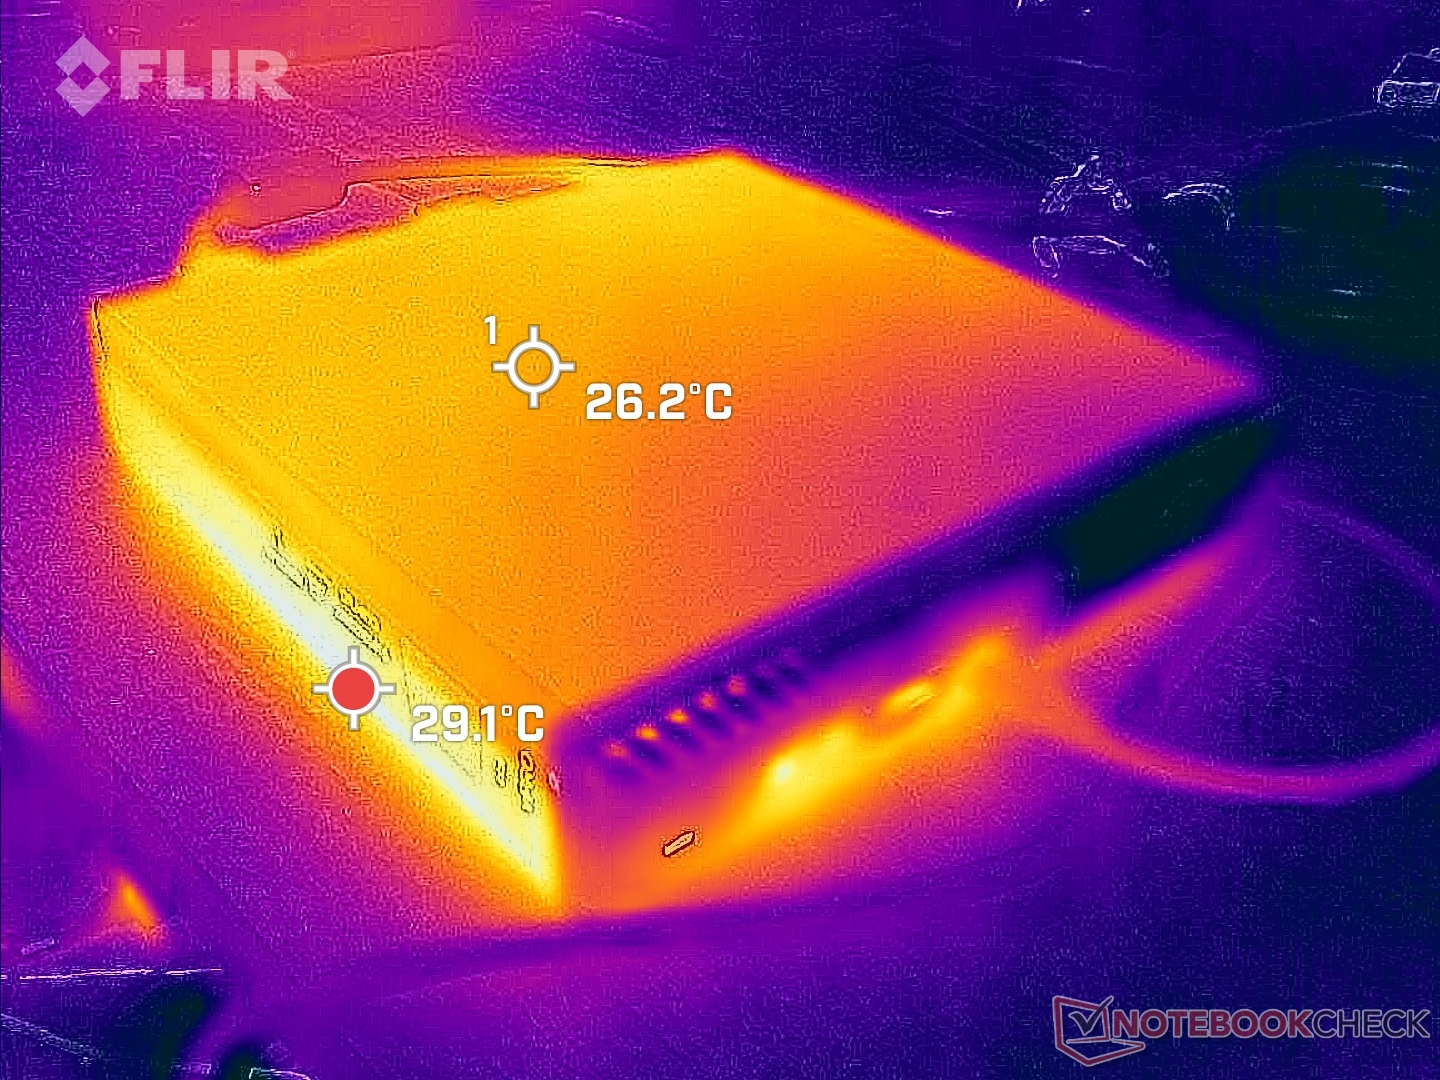
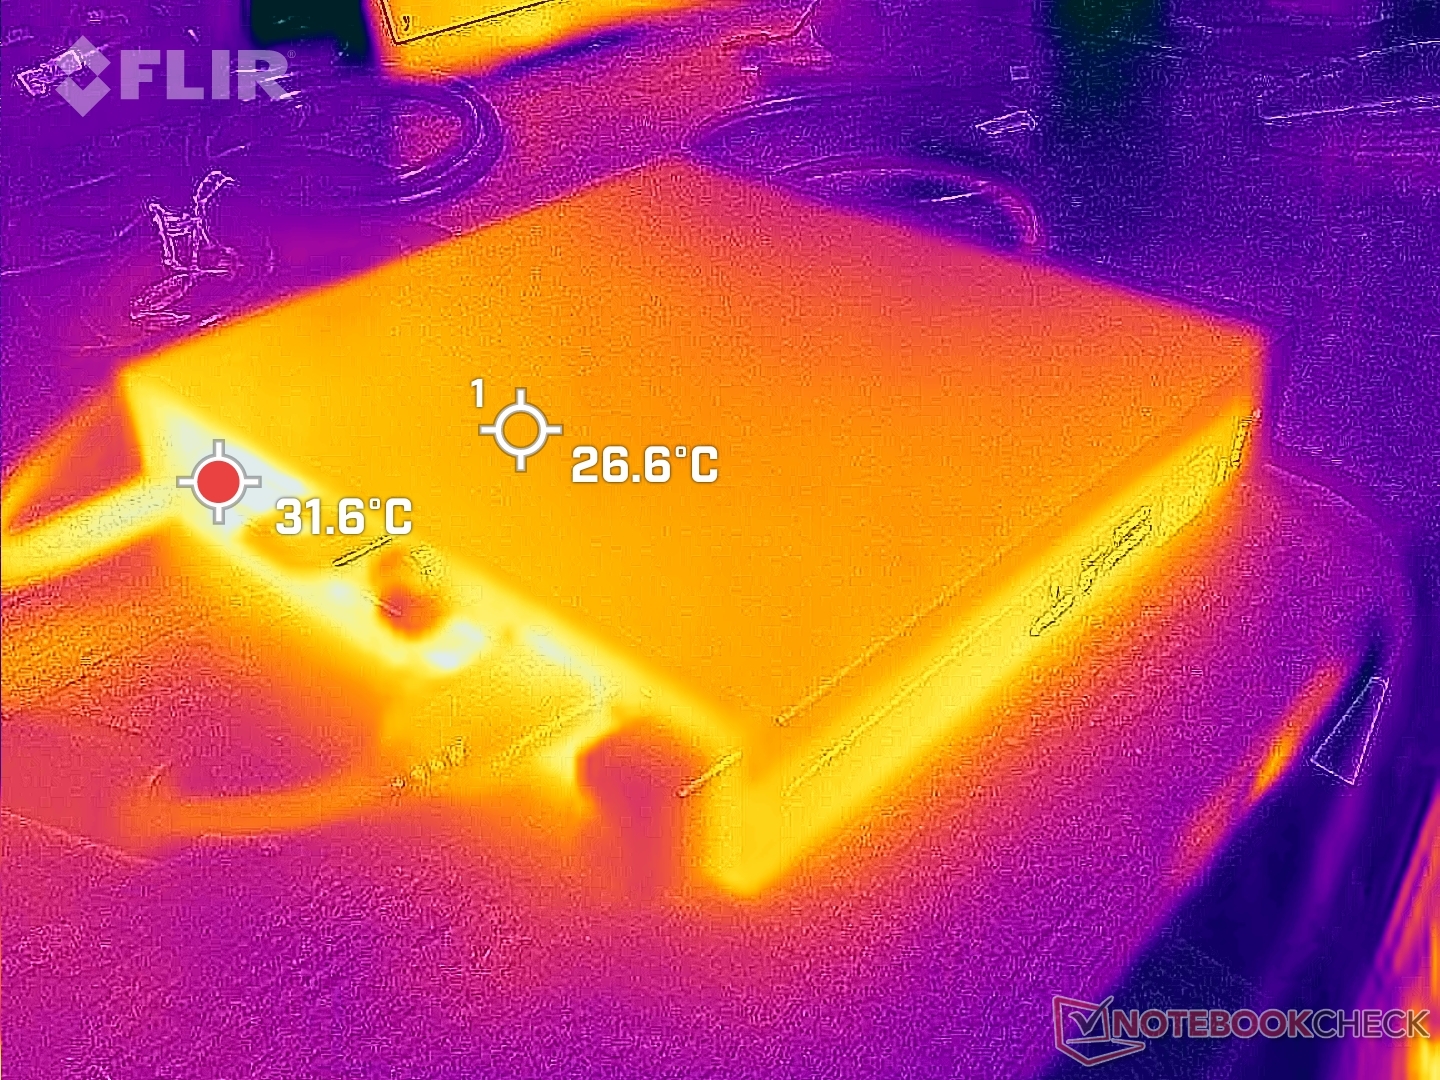
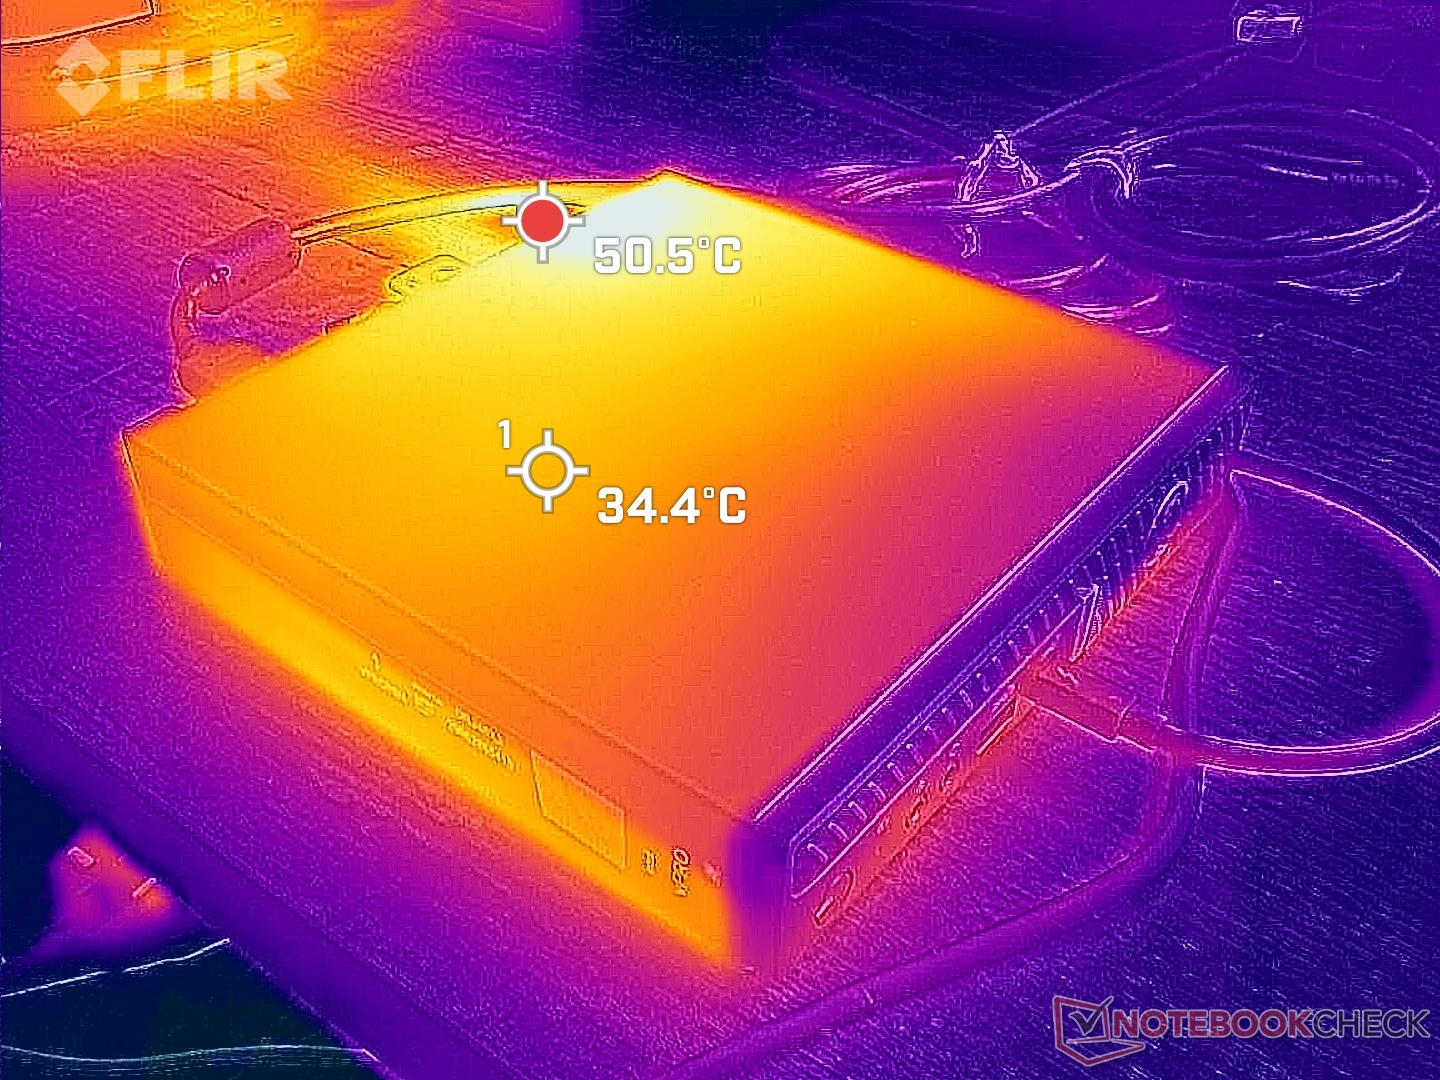
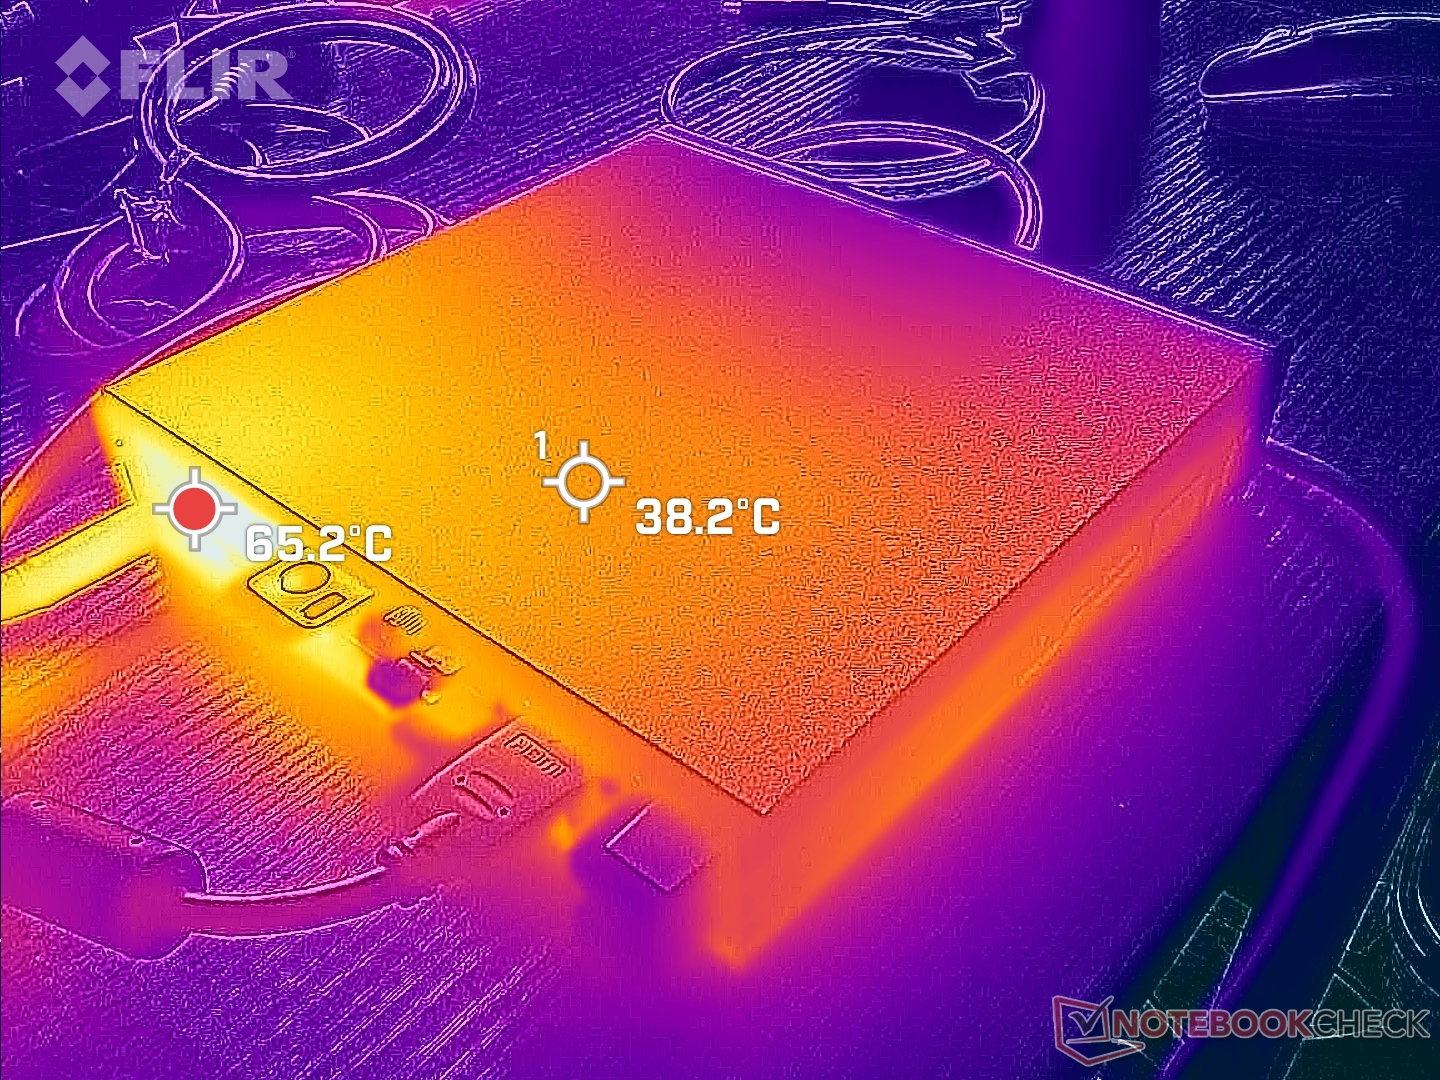
Sıcaklık - Sıcak Üst
Model, çoğunlukla metal bir dış yüzeyde masaüstü sınıfı bir CPU barındırdığı için yüzey sıcaklıkları oldukça sıcak olabilir. Sadece web'de gezinirken üst yüzey 30 C ila 35 C arasındadır ve zorlu yükleri çalıştırırken 51 C'ye kadar çıkabilir. Ünitenin üzerine herhangi bir eşya yerleştirirken kesinlikle sıcaklığa dikkat etmek isteyeceksiniz.
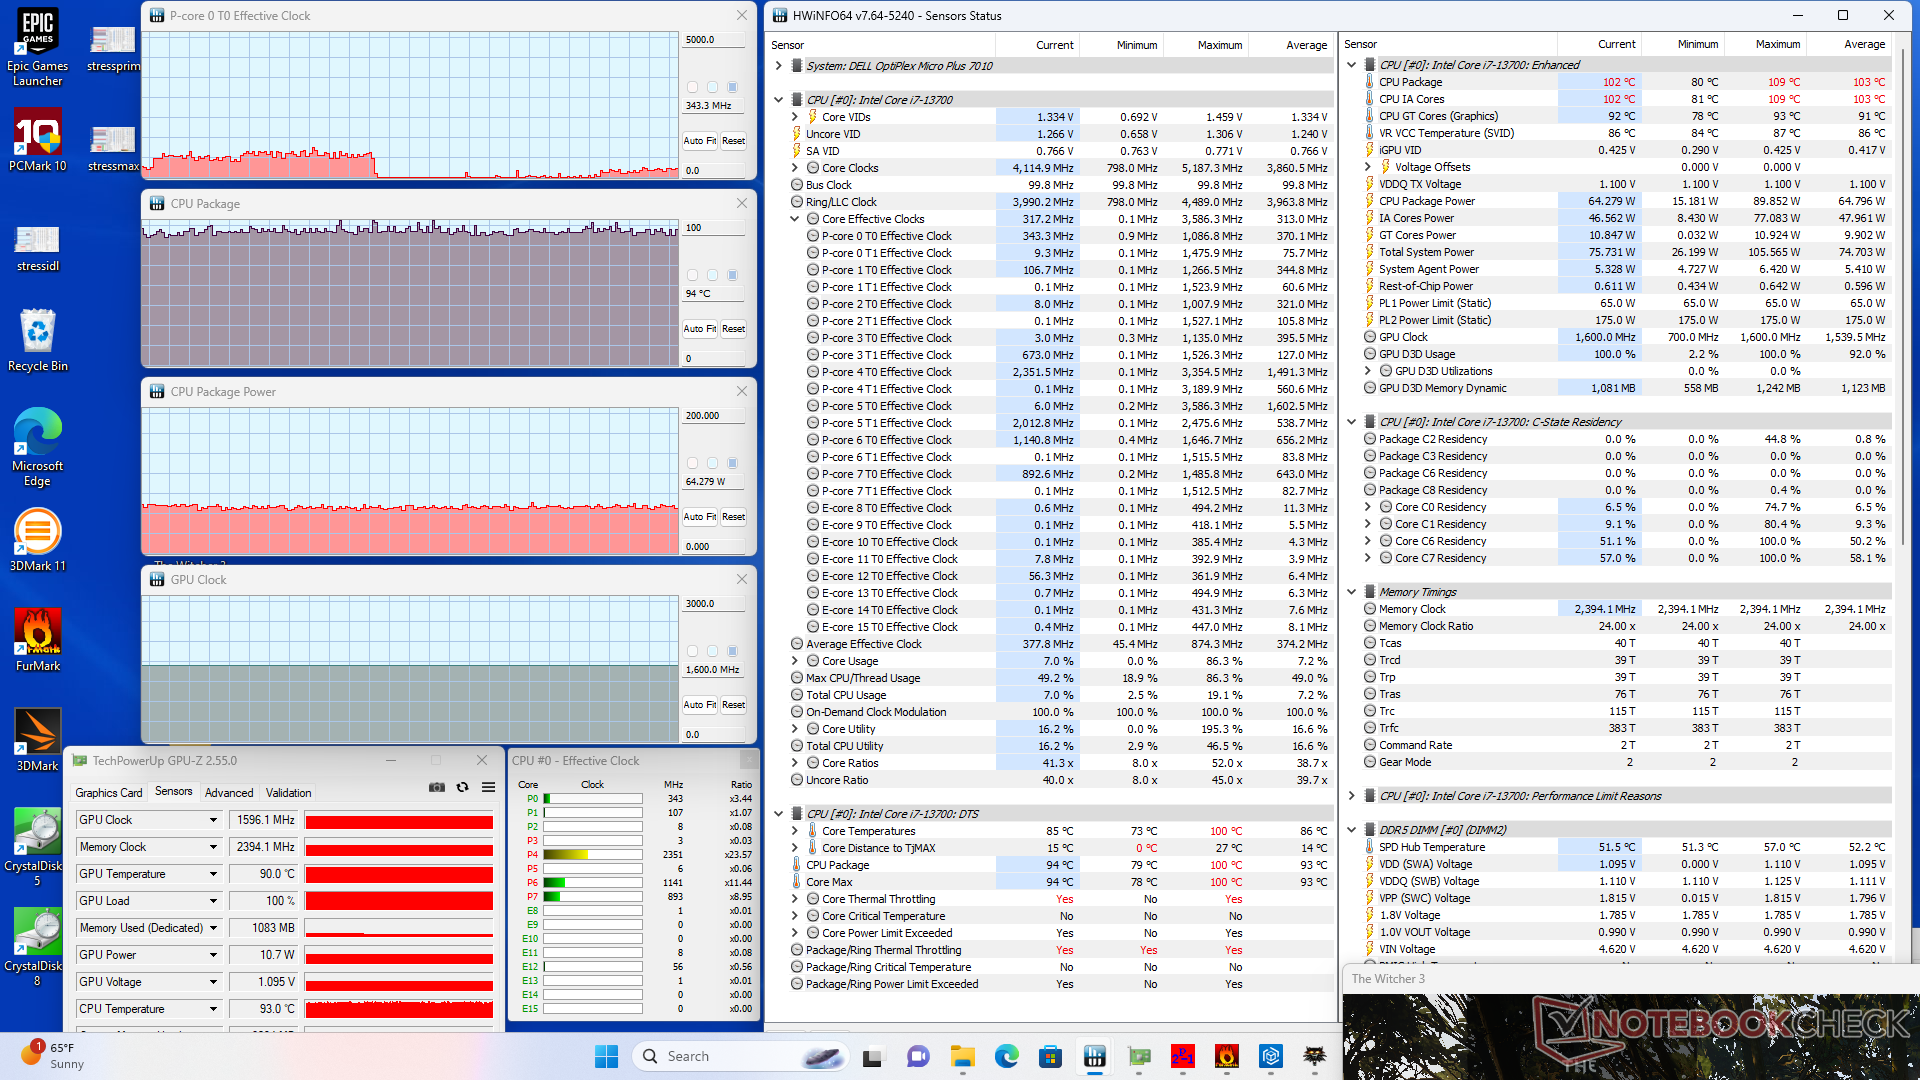
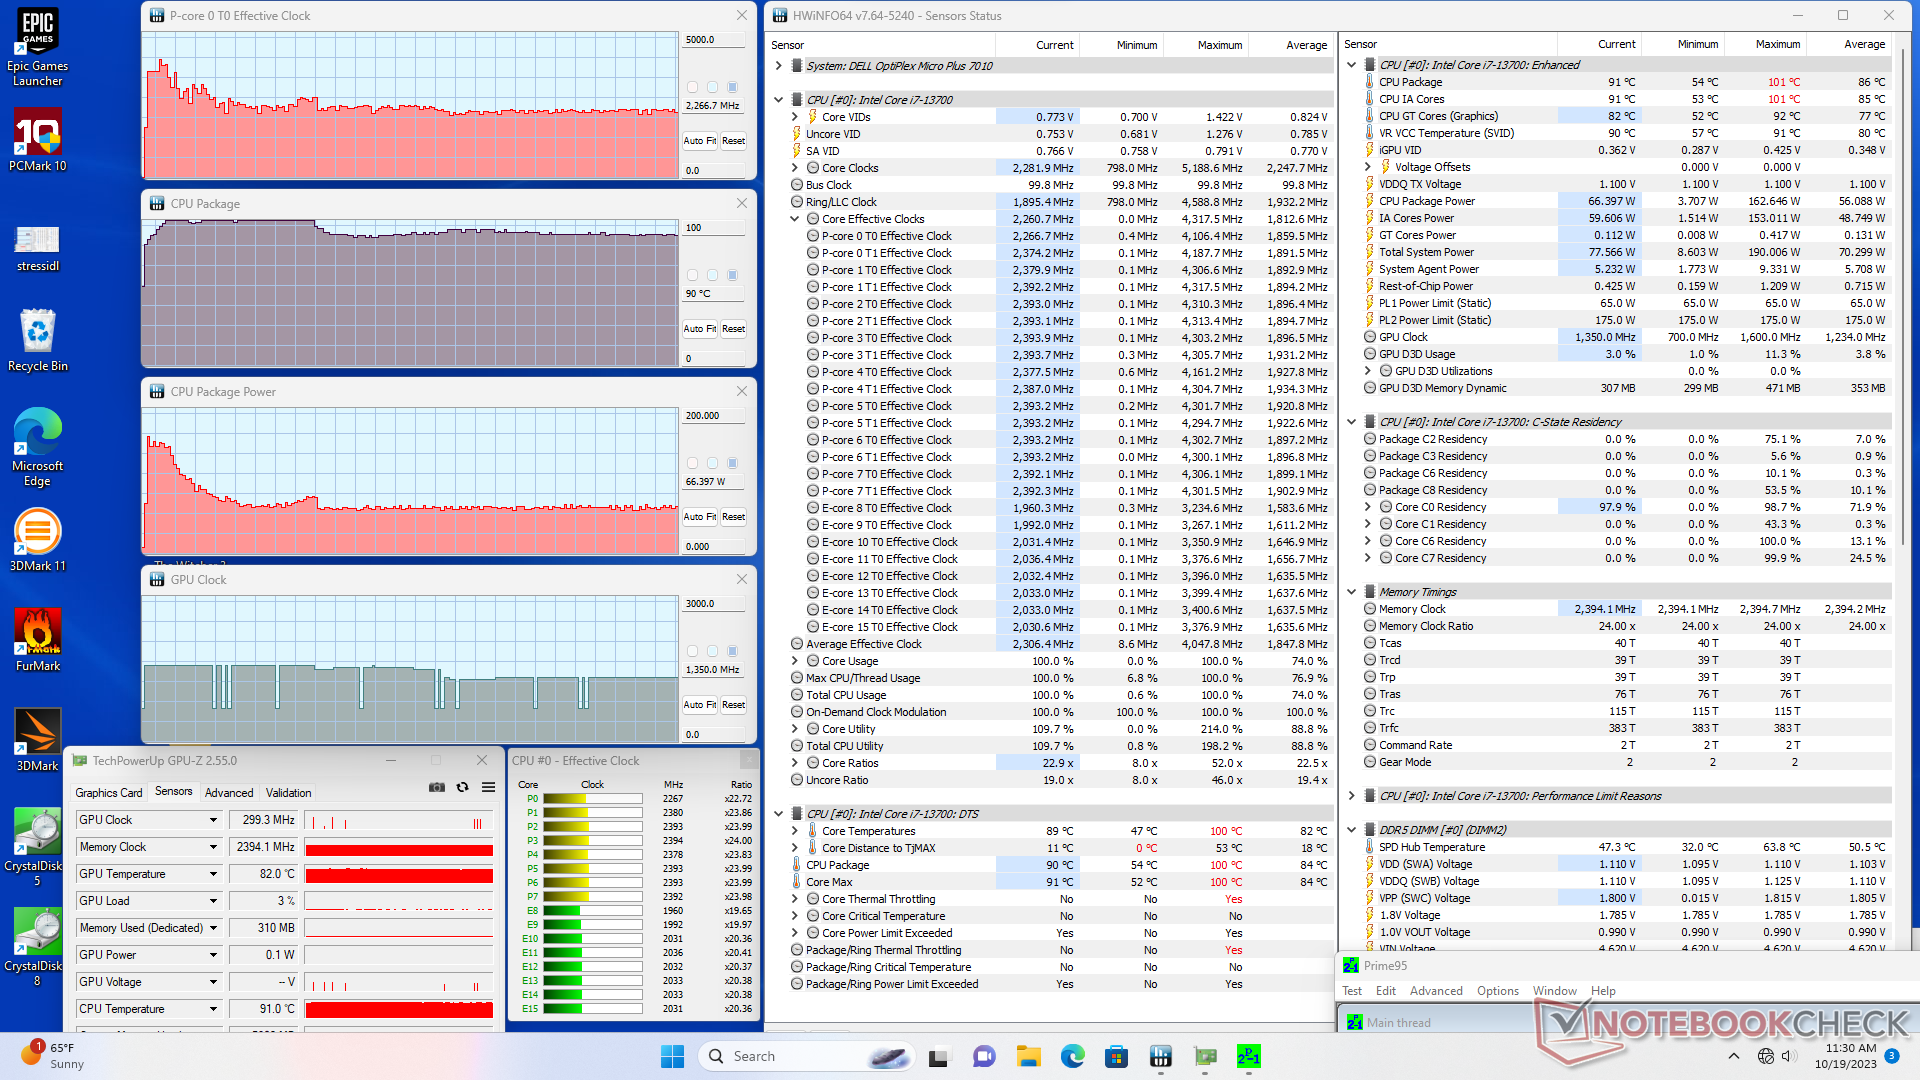
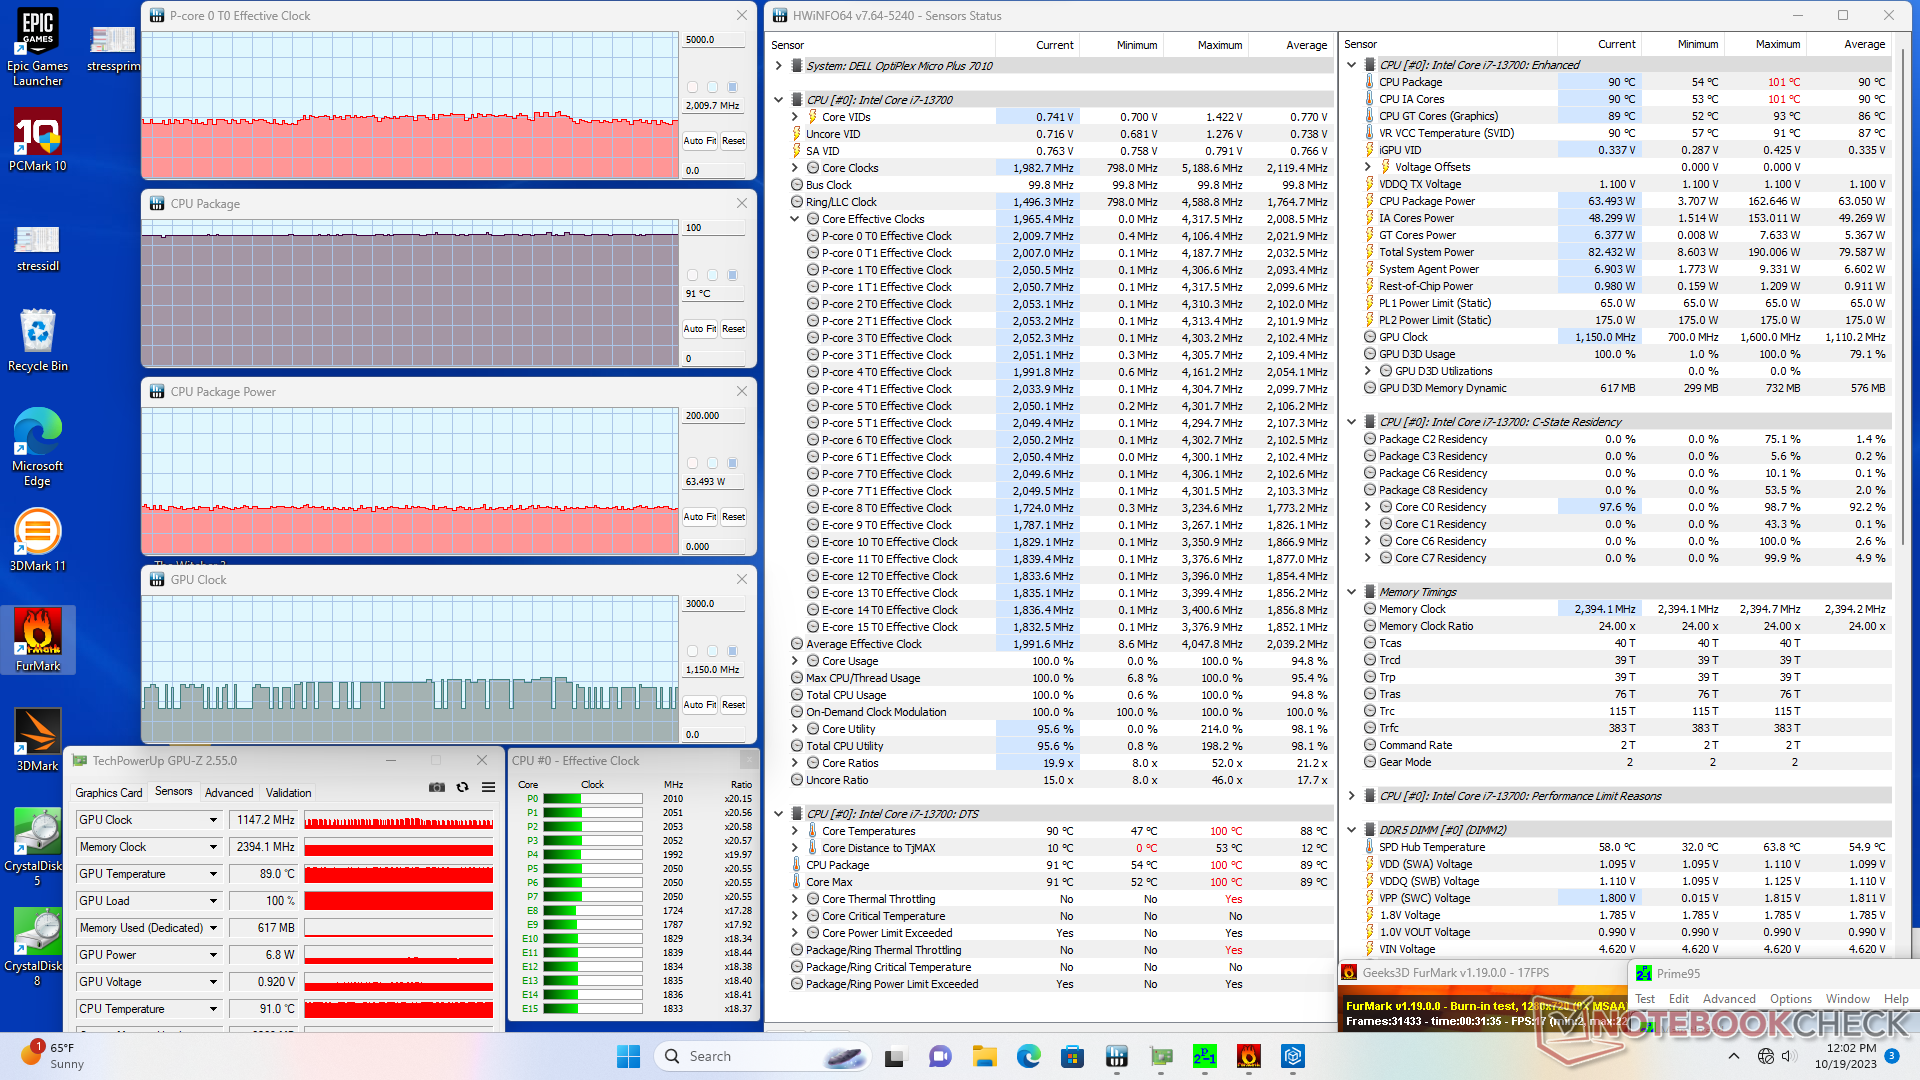
Stres Testi
Çekirdek sıcaklıkları çok yüksek olabilir, bu da yukarıda bahsedilen yüksek yüzey sıcaklıkları ve kısma davranışı ile ilişkilidir. Örneğin Prime95 çalıştırılırken CPU 3,6 GHz'e, 155 W'a ve neredeyse 100 C'ye yükselir ve en fazla bir veya iki dakika sürer. Daha sonra CPU, 90 C'lik biraz daha düşük bir çekirdek sıcaklığını korumak için 2,7 GHz ve 66 W'da stabilize olur.Lenovo IdeaCentre Mini daha yavaş Core i7-13700H ile bunun yerine 81 C'lik daha soğuk bir çekirdek sıcaklığı ile sonuçlanacaktır.
Ayrıca, bu kadar yüksek çekirdek sıcaklıklarına ulaşmak o kadar da zor değildir. Çekirdek sıcaklığı sadece çalıştırıldığında 94 C'de sabitlenir Witcher 3 üzerinde sadece 68 C'ye kıyasla yüksek yükleri temsil etmek içinBeelink GTR7.
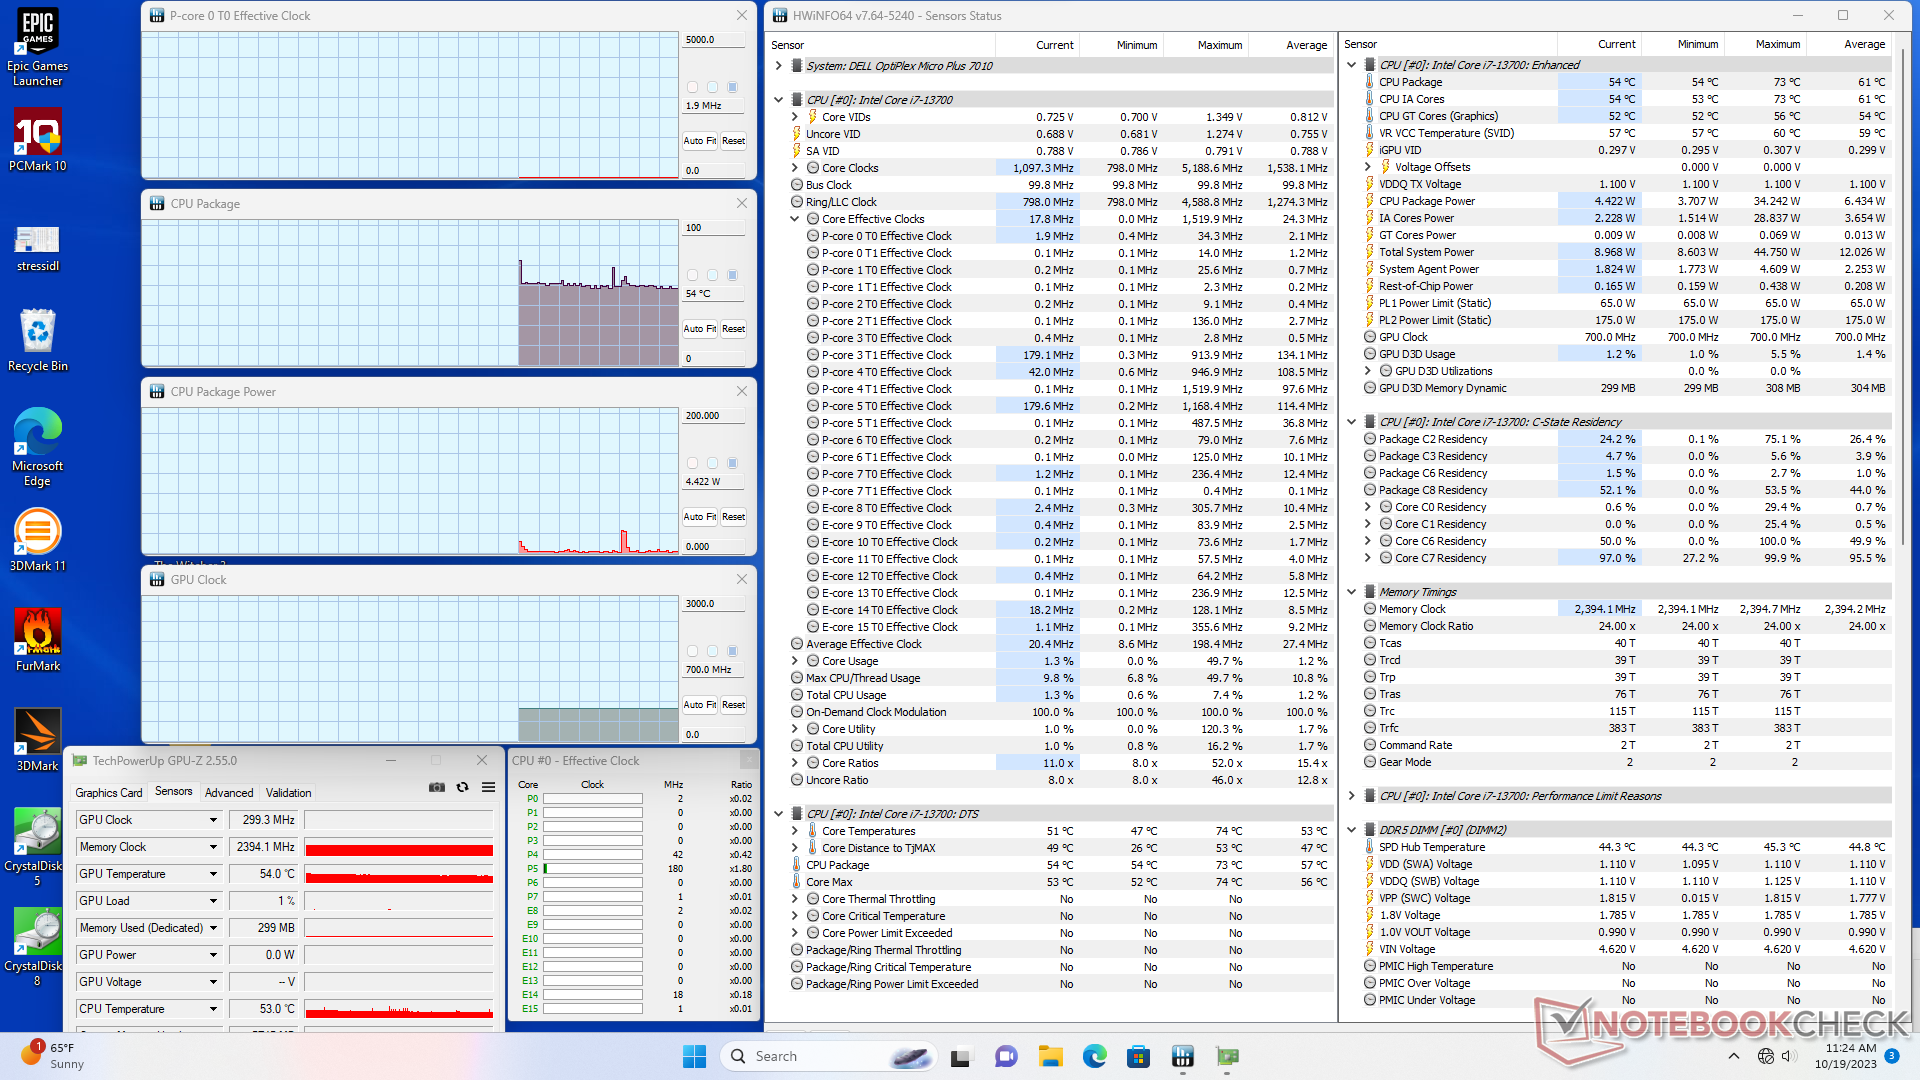
| CPU Saati (GHz) | GPU Saati (MHz) | Ortalama CPU Sıcaklığı (°C) | |
| Sistem Boşta | -- | -- | 54 |
| Prime95 Stres | 2.3 | -- | 90 |
| Prime95 + FurMark Stress | 2.0 | 700 - 1350 | 91 |
| Witcher 3 Stres | ~0,3 | 1596 | 94 |
Konuşmacılar
Model, entegre hoparlörlerin nadir olduğu diğer mini PC'lerden farklı olarak monaural sesi entegre ediyor. Hoparlör küçük ofisler için yeterince yüksek ancak konferans salonları için kesinlikle yeterince güçlü değil.
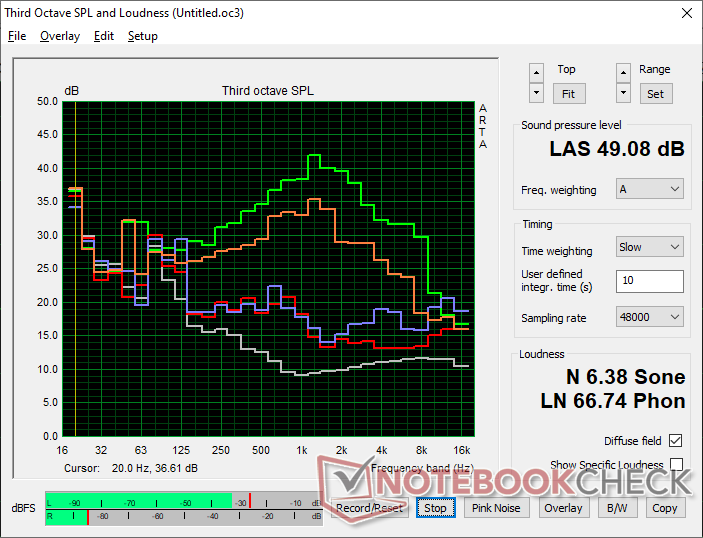
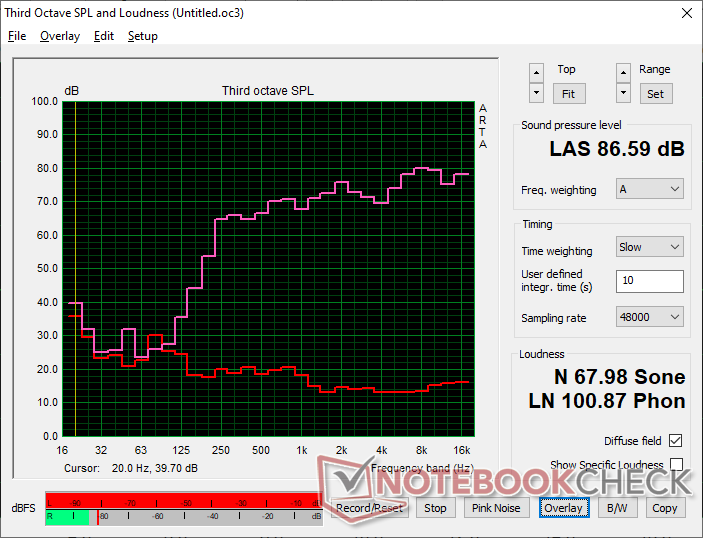
Dell OptiPlex Micro ses analizi
(+) | hoparlörler nispeten yüksek sesle çalabilir (86.6 dB)
Bas 100 - 315Hz
(-) | neredeyse hiç bas yok - ortalama olarak medyandan 22% daha düşük
(±) | Bas doğrusallığı ortalamadır (12.2% delta - önceki frekans)
Ortalar 400 - 2000 Hz
(+) | dengeli ortalar - medyandan yalnızca 2.6% uzakta
(+) | orta frekanslar doğrusaldır (4.1% deltadan önceki frekansa)
Yüksekler 2 - 16 kHz
(+) | dengeli yüksekler - medyandan yalnızca 4.7% uzakta
(+) | yüksekler doğrusaldır (4.4% deltadan önceki frekansa)
Toplam 100 - 16.000 Hz
(±) | Genel sesin doğrusallığı ortalamadır (15.9% ortancaya göre fark)
Aynı sınıfla karşılaştırıldığında
» Bu sınıftaki tüm test edilen cihazların %7%'si daha iyi, 7% benzer, 86% daha kötüydü
» En iyisinin deltası 13% idi, ortalama 24% idi, en kötüsü 64% idi
Test edilen tüm cihazlarla karşılaştırıldığında
» Test edilen tüm cihazların %25'si daha iyi, 5 benzer, % 70 daha kötüydü
» En iyisinin deltası 4% idi, ortalama 23% idi, en kötüsü 134% idi
Apple MacBook Pro 16 2021 M1 Pro ses analizi
(+) | hoparlörler nispeten yüksek sesle çalabilir (84.7 dB)
Bas 100 - 315Hz
(+) | iyi bas - medyandan yalnızca 3.8% uzakta
(+) | bas doğrusaldır (5.2% delta ile önceki frekans)
Ortalar 400 - 2000 Hz
(+) | dengeli ortalar - medyandan yalnızca 1.3% uzakta
(+) | orta frekanslar doğrusaldır (2.1% deltadan önceki frekansa)
Yüksekler 2 - 16 kHz
(+) | dengeli yüksekler - medyandan yalnızca 1.9% uzakta
(+) | yüksekler doğrusaldır (2.7% deltadan önceki frekansa)
Toplam 100 - 16.000 Hz
(+) | genel ses doğrusaldır (4.6% ortancaya göre fark)
Aynı sınıfla karşılaştırıldığında
» Bu sınıftaki tüm test edilen cihazların %0%'si daha iyi, 0% benzer, 100% daha kötüydü
» En iyisinin deltası 5% idi, ortalama 17% idi, en kötüsü 45% idi
Test edilen tüm cihazlarla karşılaştırıldığında
» Test edilen tüm cihazların %0'si daha iyi, 0 benzer, % 100 daha kötüydü
» En iyisinin deltası 4% idi, ortalama 23% idi, en kötüsü 134% idi
Enerji Yönetimi
Güç Tüketimi - Zorlu Küçük Makine
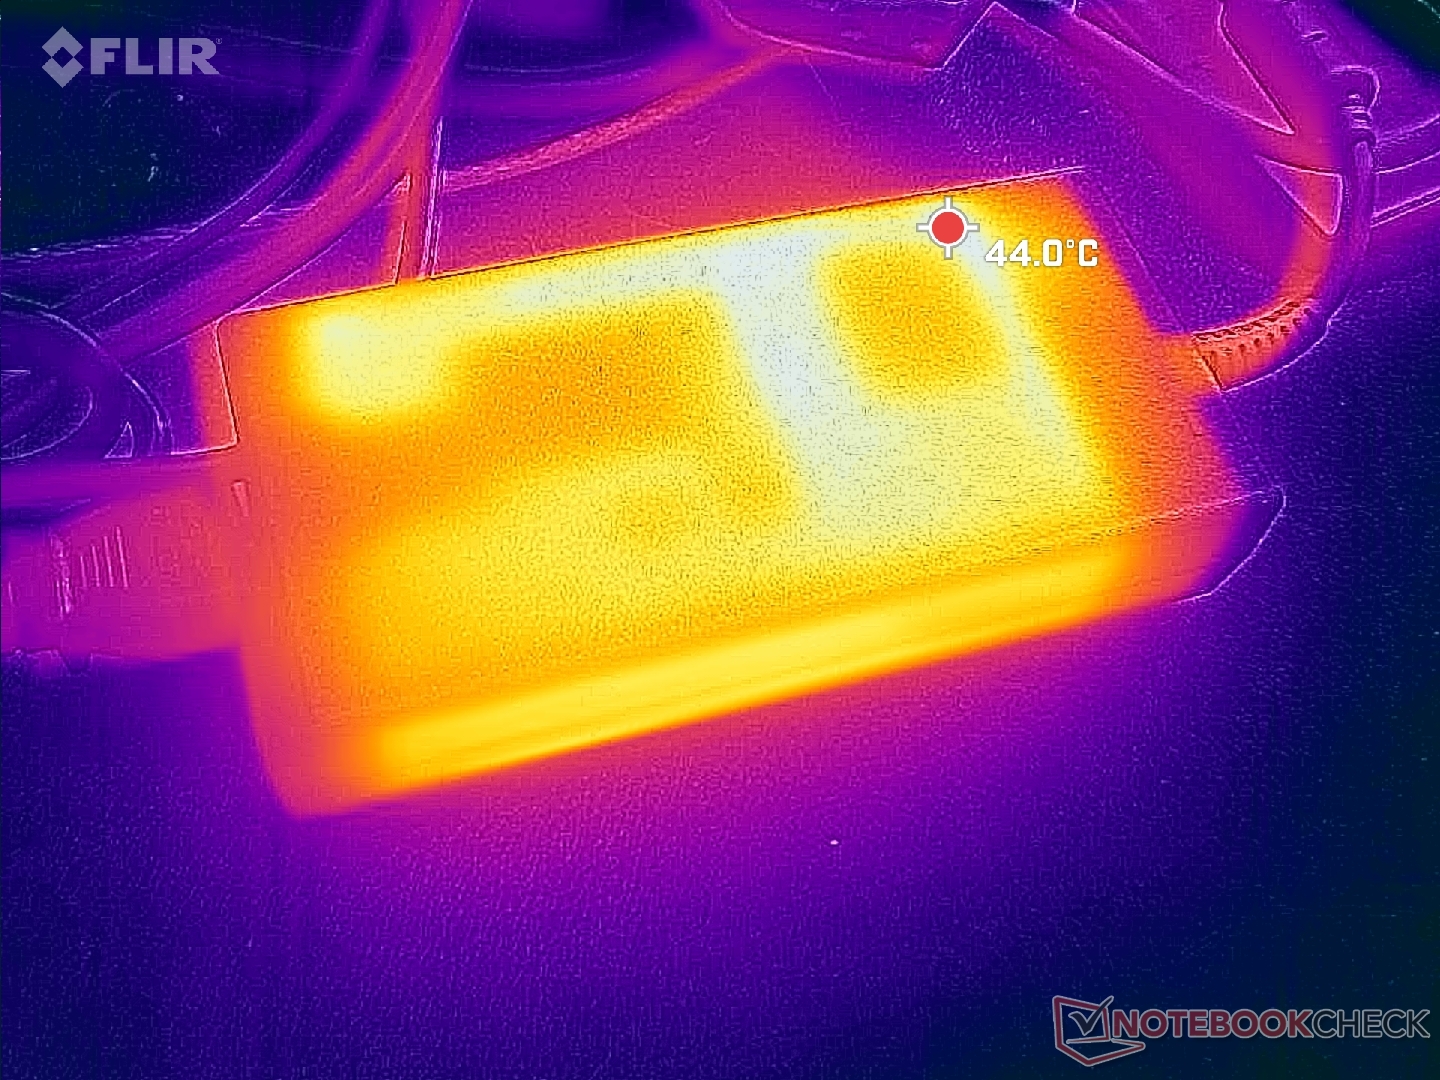
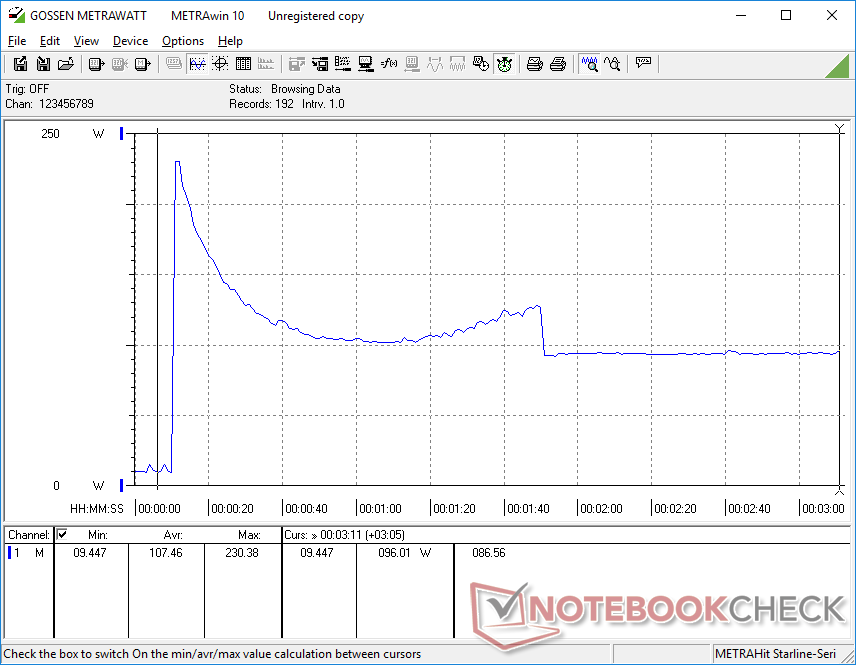
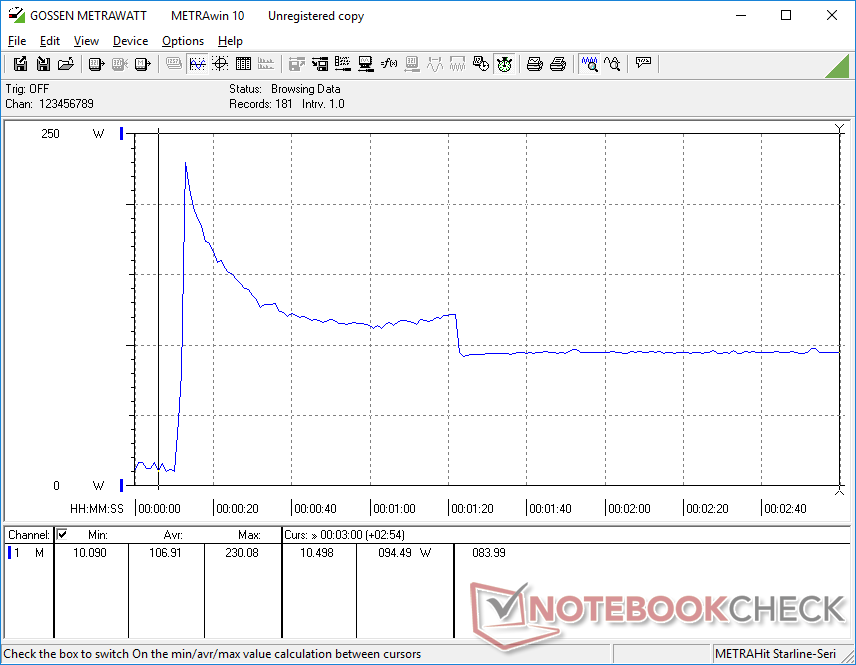
Güç tüketimi oldukça yüksek olabilir, bu da içindeki masaüstü işlemci göz önüne alındığında beklenmedik bir durum değildir. Core i7-13700'ün yüksek Turbo Boost potansiyeli, aşağıdaki grafiklerde gösterildiği gibi uygulamaları başlatırken veya CPU yoğun görevleri çalıştırırken sistemin 190 W ila 230 W kadar çekmesine neden olabilir. Bununla birlikte, mini PC'nin düşük Turbo Boost sürdürülebilirliği, bu tür aşırı güç çekimlerinin yalnızca geçici olduğu anlamına gelir.
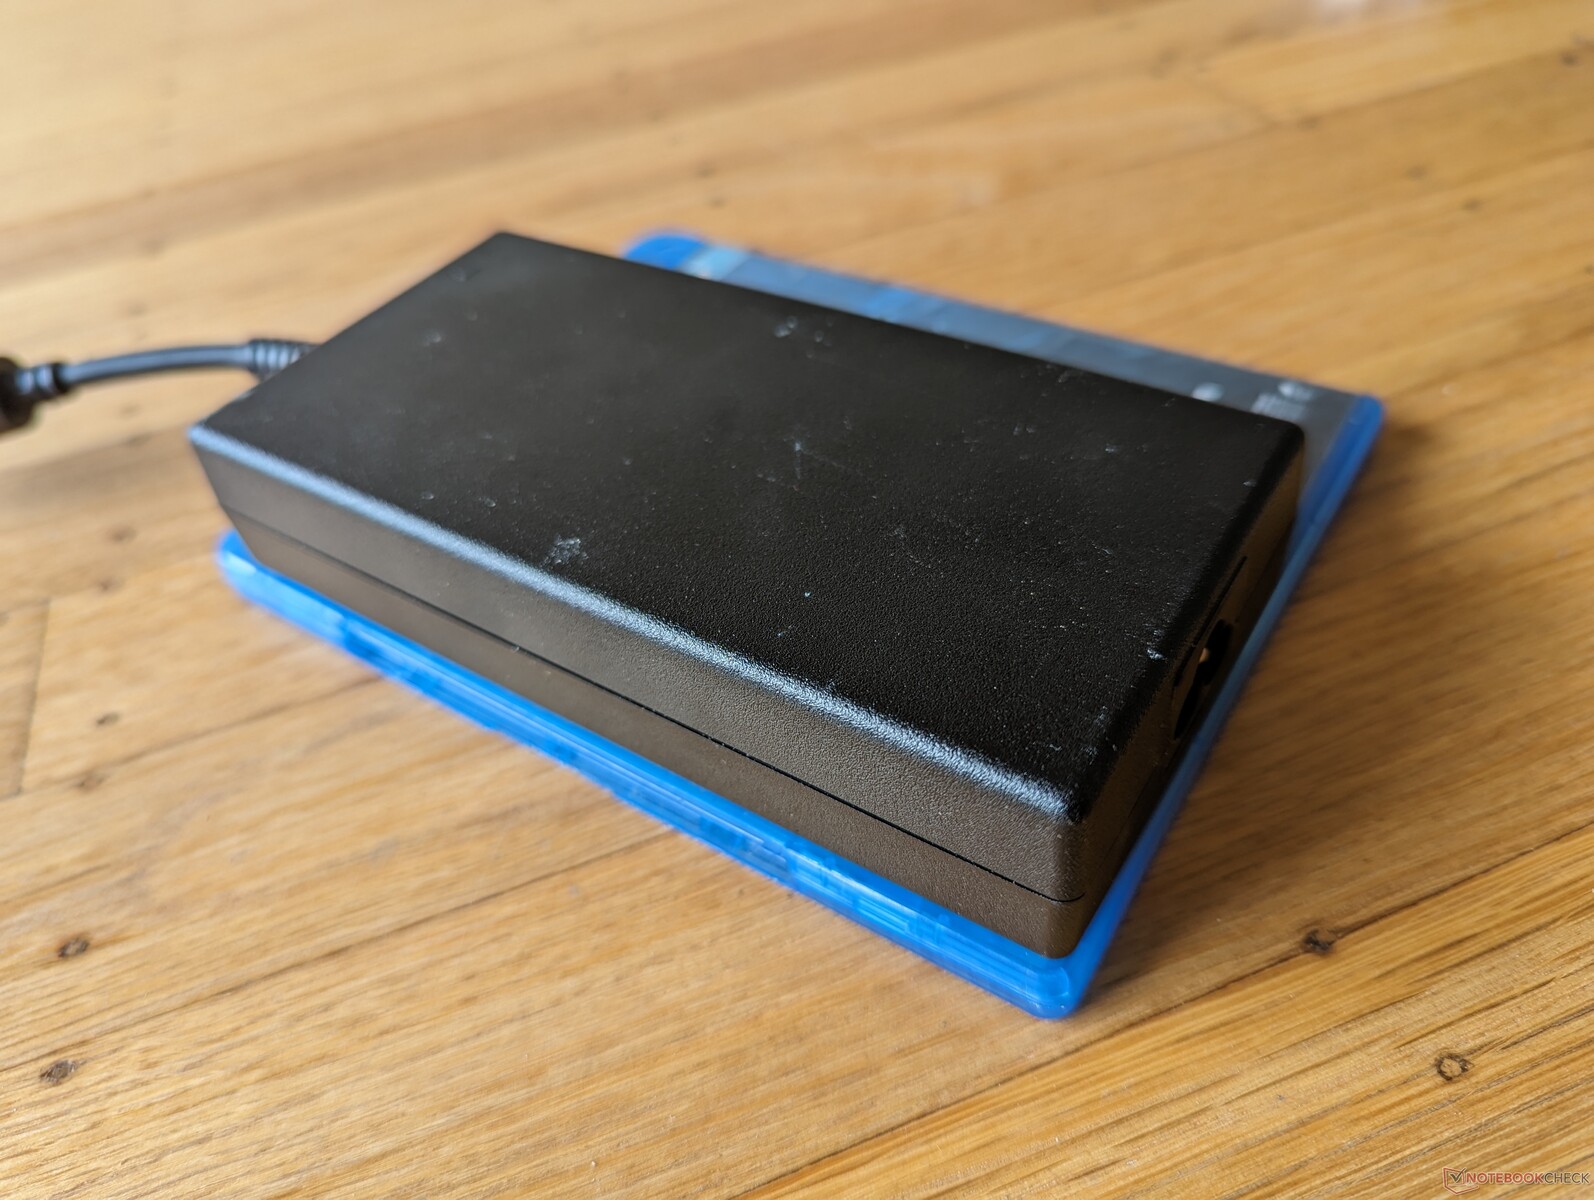
USB-C Güç Dağıtımı desteklenmiyor ve bu nedenle sistemi çalıştırmak için birlikte verilen 180 W güç tuğlası (~15,4 x 7,5 x 3,2 cm) her zaman bağlı olmalıdır. Karşılaştırmak gerekirse, bazı mini bilgisayarlar Beelink SER7 yalnızca üçüncü taraf USB-C AC adaptörleriyle çalışabilirken, Lenovo IdeaCentre Mini gibi diğerlerinin hiçbir harici güç tuğlası yoktur.
| Kapalı / Bekleme modu | |
| Boşta | |
| Çalışırken |
|
Key:
min: | |
| Dell OptiPlex Micro i7-13700, UHD Graphics 770, , , x, | Apple Mac Mini M2 M2, M2 10-Core GPU, Apple SSD AP0512Z, , x, | Lenovo IdeaCentre Mini 01IRH8 i7-13700H, Iris Xe G7 96EUs, Samsung PM9B1 512GB MZVL4512HBLU, , x, | GMK NucBox K3 Pro i7-12650H, UHD Graphics 64EUs, Lexar NM610 Pro NM610P001T-HNNNG, , x, | Beelink GTR7 7840HS R7 7840HS, Radeon 780M, Crucial P3 Plus CT1000P3PSSD8, , x, | Beelink SER7 R7 7840HS, Radeon 780M, Crucial P3 Plus CT1000P3PSSD8, , x, | |
|---|---|---|---|---|---|---|
| Power Consumption | 62% | 4% | -18% | 5% | -8% | |
| Idle Minimum * (Watt) | 3.7 | 2.2 41% | 6.7 -81% | 7.1 -92% | 5.5 -49% | 6.7 -81% |
| Idle Average * (Watt) | 7.2 | 6.7 7% | 10.1 -40% | 5.8 19% | 7.3 -1% | |
| Idle Maximum * (Watt) | 8.7 | 2.6 70% | 7.1 18% | 18.6 -114% | 7.7 11% | 11.6 -33% |
| Load Average * (Watt) | 69.5 | 28.7 59% | 68.5 1% | 45.3 35% | 70.6 -2% | 64.1 8% |
| Witcher 3 ultra * (Watt) | 77.1 | 58.3 24% | 55.2 28% | 79.8 -4% | 75.8 2% | |
| Load Maximum * (Watt) | 230.6 | 51.5 78% | 104.3 55% | 52.9 77% | 111.8 52% | 94.8 59% |
* ... daha küçük daha iyidir
Power Consumption Witcher 3 / Stresstest
Power Consumption external Monitor
Artılar
Eksiler
Karar - Mikro Form Faktörü İçin Büyük CPU
OptiPlex Micro'nun öne çıkan özellikleri arasında çıkarılabilir masaüstü CPU'su, aletsiz servis kolaylığı, hacim başına yüksek işlemci performansı ve dört ayrı video çıkış portu bulunmaktadır. Grafikler, elektronik tablolar ve kelime işlem için iki veya daha fazla monitör arasında çoklu görev yapan kullanıcılar, OptiPlex Micro'nun güvenilir bir "kur ve unut" seçeneği olduğunu göreceklerdir.
Masaüstü bilgisayarlar için tasarlanmış tam teşekküllü Core i7 CPU'yu mini PC form faktöründe çalıştırmanın dezavantajları vardır. Özellikle Turbo Boost potansiyeli daha düşüktür ve bu nedenle ortalama performans, aynı işlemciyle donatılmış daha büyük bir OptiPlex sisteminden oldukça yavaştır. İkinci olarak, çekirdek sıcaklıkları 90 C'nin üzerinde çok yüksektir, bu da teknik olarak güvenli olsa da, özellikle diğer mini PC'lerin çoğu daha soğuk çalışırken genellikle ideal değildir. Ve son olarak, eski entegre GPU çoğu modern 3D render için yetersizdir ve USB4 veya Thunderbolt eGPU desteğinin olmaması bu durumu daha da kötüleştirmektedir. İş yükleriniz biraz grafik düzenleme içeriyorsa Iris Xe veya Radeon 680M/780M grafikli mini PC'leri öneriyoruz.
Ham CPU performansına değer veren mini PC kullanıcıları OptiPlex Micro'yu değerli bulacaktır. Aksi takdirde, Intel NUC 13 Pro veya Beelink GTR7 gibi alternatifler CPU ve GPU performansı açısından daha dengelidir.
SSD azaltma da görmek için talihsiz bir durum. Özel SSD ısı dağıtıcıları muhtemelen sorunu çözebilirdi, ancak bu ağırlık ve fiyatı artıracaktı.
Fiyat ve Bulunabilirlik
Dell şu anda OptiPlex Micro Plus 7010'u 929 USD'den başlayan fiyatlarla piyasaya sürüyor, ancak bu yazı yazıldığı sırada yalnızca daha yavaş Core T serisi CPU'lara sahip konfigürasyonlar mevcut.
Dell OptiPlex Micro
- 10/24/2023 v7 (old)
Allen Ngo
Şeffaflık
İncelenecek cihazların seçimi editör ekibimiz tarafından yapılır. Test örneği, bu incelemenin amacı doğrultusunda üretici veya perakendeci tarafından yazara ödünç olarak sağlanmıştır. Borç verenin bu inceleme üzerinde herhangi bir etkisi olmadığı gibi, üretici de yayınlanmadan önce bu incelemenin bir kopyasını almamıştır. Bu incelemeyi yayınlama zorunluluğu yoktu. Bağımsız bir medya şirketi olarak Notebookcheck, üreticilerin, perakendecilerin veya yayıncıların otoritesine tabi değildir.
Notebookcheck bu şekilde test yapıyor
Notebookcheck, tüm sonuçların karşılaştırılabilir olmasını sağlamak için her yıl yüzlerce dizüstü bilgisayarı ve akıllı telefonu standart prosedürler kullanarak bağımsız olarak inceliyor. Yaklaşık 20 yıldır test yöntemlerimizi sürekli olarak geliştirdik ve bu süreçte endüstri standartlarını belirledik. Test laboratuvarlarımızda deneyimli teknisyenler ve editörler tarafından yüksek kaliteli ölçüm ekipmanları kullanılmaktadır. Bu testler çok aşamalı bir doğrulama sürecini içerir. Karmaşık derecelendirme sistemimiz, nesnelliği koruyan yüzlerce sağlam temellere dayanan ölçüm ve kıyaslamaya dayanmaktadır.Price comparison

