Dell XPS 13 9310 OLED Dizüstü Bilgisayar İncelemesi: IPS’ten Daha Mı İyi?
XPS 13 9310, Intel'in 11. nesil Tiger Lake serisiyle birlikte geçen yılın sonlarında piyasaya sürüldü. O zamanki yapılandırmalar, tümü IPS panelli FHD (1920 x 1200) ve 4K (3840 x 2400) seçeneklerini içeriyordu. Dell, mevcut IPS SKU'larını tamamlamak için OLED'in daha sonraki bir tarihte geleceğine söz vermişti.
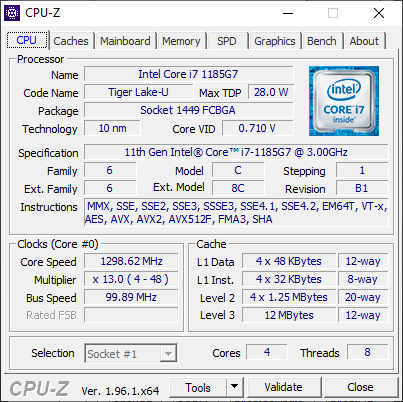
Şu an 2021'in ortasında, vaat edilen OLED SKU sonunda Core i7-1185G7 CPU, 16 GB lehimli RAM ve 3.5K (3456 x 2160) çözünürlüklü dokunmatik ekran ile birlikte müşterilere yaklaşık 1650 USD karşılığında sunuluyor. Diğer amiral gemisi dizüstü bilgisayarların çok daha uzun süredir OLED seçeneklerine sahip olduğu doğru, ancak onu ilk kez 16:10 13.4 inç formunda görüyoruz.
XPS 13 9310 OLED görsel olarak bu yapılandırmalarla aynı olduğundan kasa ve özellikleri hakkında daha fazla bilgi edinmek için XPS 13 9310 FHD, XPS 13 9310 4K, ve XPS 13 9300 ile ilgili mevcut üç incelememize göz atmanızı öneririz. Bu inceleme daha çok normal XPS 13 IPS seçenekleriyle karşılaştırıldığında, OLED dokunmatik ekrana ve kullanıcıların ondan neler bekleyebileceğine odaklanacak.
More Dell reviews:
Potansiyel rakipler karşılaştırması
Derece | Tarih | Model | Ağırlık | Yükseklik | Boyut | Çözünürlük | En iyi fiyat |
|---|---|---|---|---|---|---|---|
| 88.3 % v7 (old) | 06/2021 | Dell XPS 13 9310 OLED i7-1185G7, Iris Xe G7 96EUs | 1.2 kg | 14.8 mm | 13.40" | 3456x2160 | |
| 87.4 % v7 (old) | 01/2021 | Dell XPS 13 9310 Core i7 4K i7-1185G7, Iris Xe G7 96EUs | 1.3 kg | 14.8 mm | 13.40" | 3840x2400 | |
| 88.1 % v7 (old) | 12/2020 | Dell XPS 13 9310 Core i7 FHD i7-1165G7, Iris Xe G7 96EUs | 1.3 kg | 14.8 mm | 13.40" | 1920x1200 | |
| 85.9 % v7 (old) | 11/2019 | Dell XPS 13 7390 Core i7-10710U i7-10710U, UHD Graphics 620 | 1.2 kg | 11.6 mm | 13.30" | 3840x2160 | |
| 86.9 % v7 (old) | 06/2021 | MSI Summit E13 Flip Evo A11MT i7-1185G7, Iris Xe G7 96EUs | 1.4 kg | 14.9 mm | 13.40" | 1920x1200 | |
v (old) | 09/2021 | Asus ZenBook 13 OLED UM325UA R7 5700U, Vega 8 | 1.1 kg | 14.8 mm | 13.30" | 1920x1080 |
Kasa
SD Kart Okuyucu
| SD Card Reader | |
| average JPG Copy Test (av. of 3 runs) | |
| Dell XPS 13 9310 Core i7 FHD (Toshiba Exceria Pro M501 64 GB UHS-II) | |
| Dell XPS 13 9310 Core i7 4K (Toshiba Exceria Pro M501 32 GB UHS-II) | |
| Dell XPS 13 9310 OLED (AV PRO microSD 128 GB V60) | |
| Dell XPS 13 7390 Core i7-10710U (Toshiba Exceria Pro M501 64 GB UHS-II) | |
| MSI Summit E13 Flip Evo A11MT (AV PRO microSD 128 GB V60) | |
| maximum AS SSD Seq Read Test (1GB) | |
| Dell XPS 13 9310 Core i7 4K (Toshiba Exceria Pro M501 32 GB UHS-II) | |
| Dell XPS 13 9310 Core i7 FHD (Toshiba Exceria Pro M501 64 GB UHS-II) | |
| Dell XPS 13 7390 Core i7-10710U (Toshiba Exceria Pro M501 64 GB UHS-II) | |
| Dell XPS 13 9310 OLED (AV PRO microSD 128 GB V60) | |
| MSI Summit E13 Flip Evo A11MT (AV PRO microSD 128 GB V60) | |
İletişim
İletim hızları, bu testi birkaç kez tekrarladıktan sonra bile eski XPS 13 test birimlerimizde deneyimlediklerimizden daha yavaş. Ancak pratikte bağlantı, akış ve tarama için kararlı ve güvenilir kalır.
Webcam


Ekran
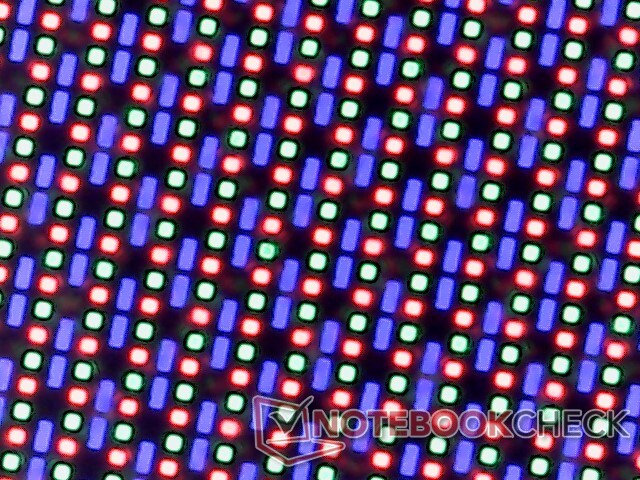
Doğal çözünürlük 4K (3840 x 2400) yerine 3.5K (3456 x 2160) olduğundan, ÜFE, 4K XPS 13 IPS yapılandırmasından (304'e karşı 338) biraz daha düşüktür. Şu anda 13.4 inç 16:10 form faktöründe 4K OLED panel bulunmadığından çözünürlüğün daha düşük olduğundan şüpheleniyoruz. Bununla birlikte, 4K 338 PPI ekranında metin çok küçük olabileceğinden, bazı durumlarda bu OLED lehine çalışabilir.
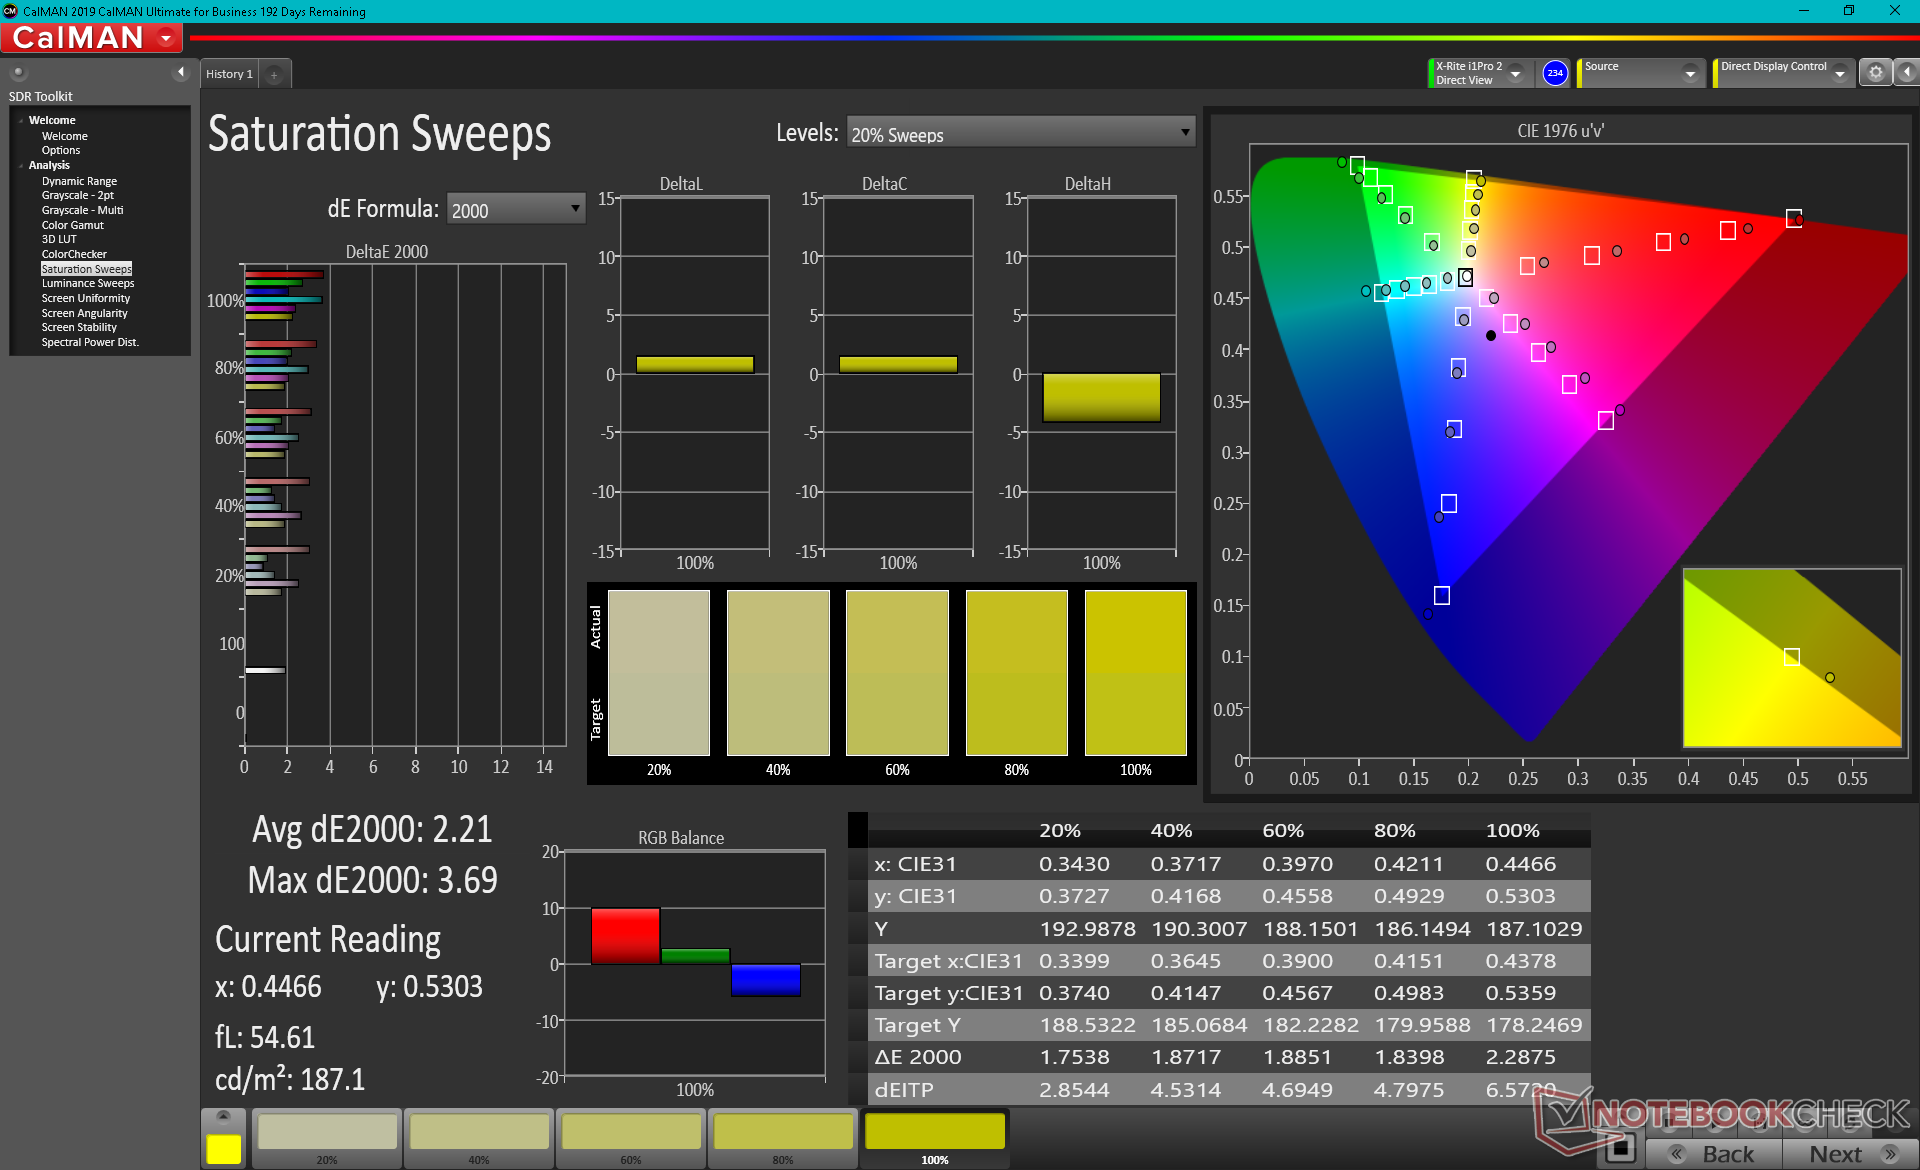
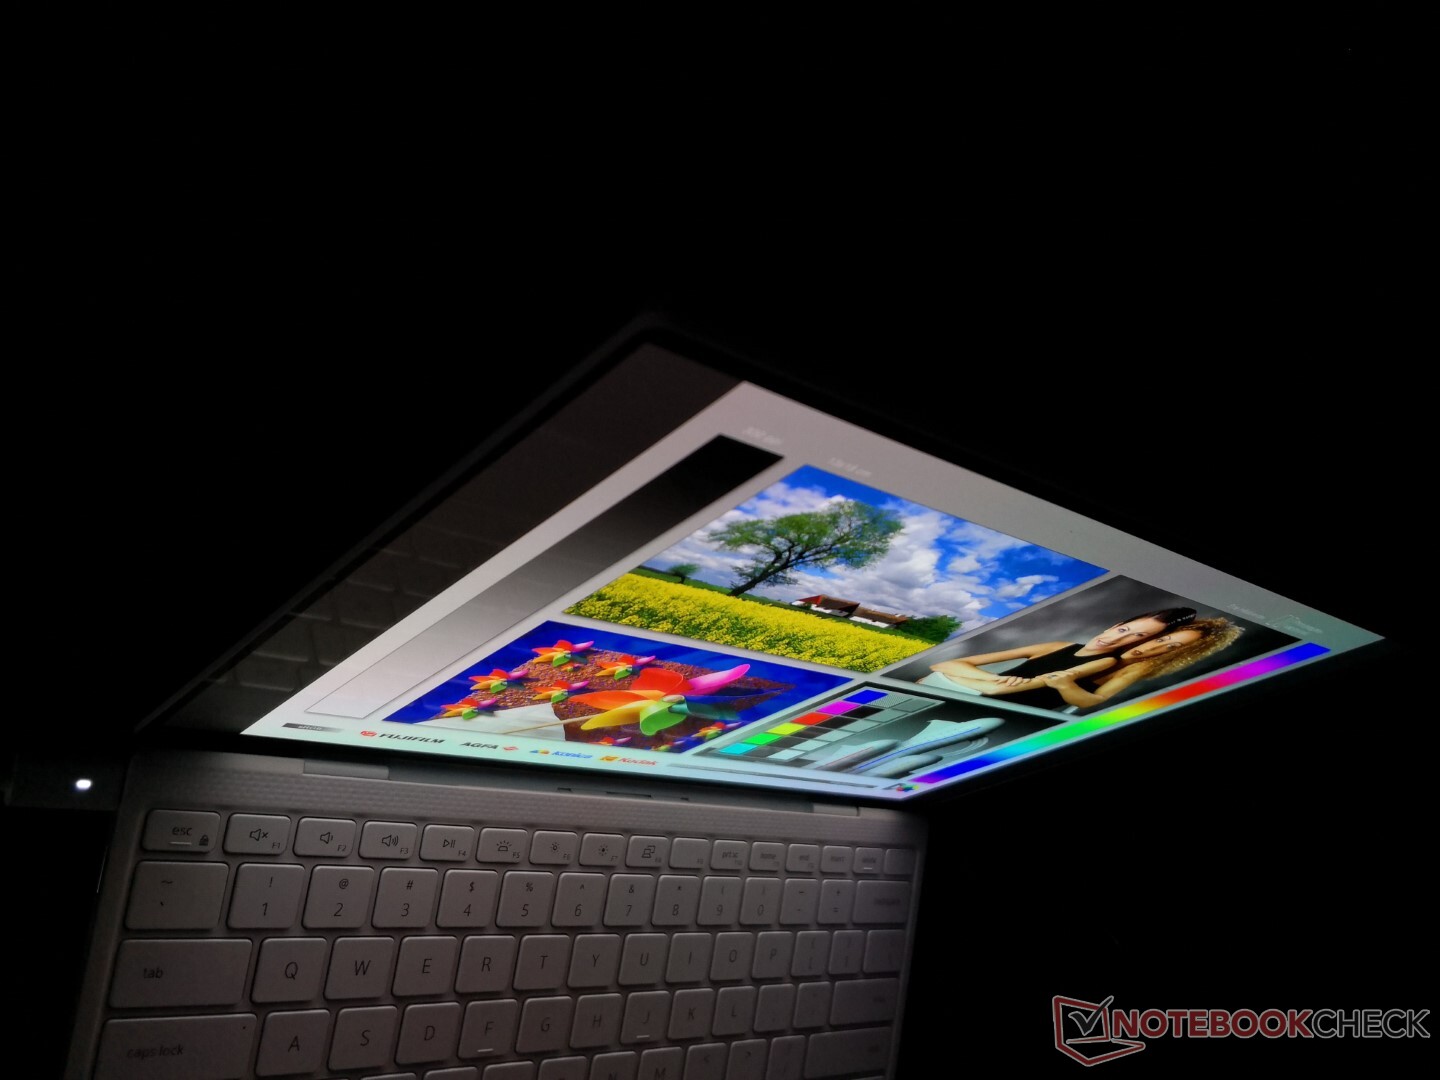
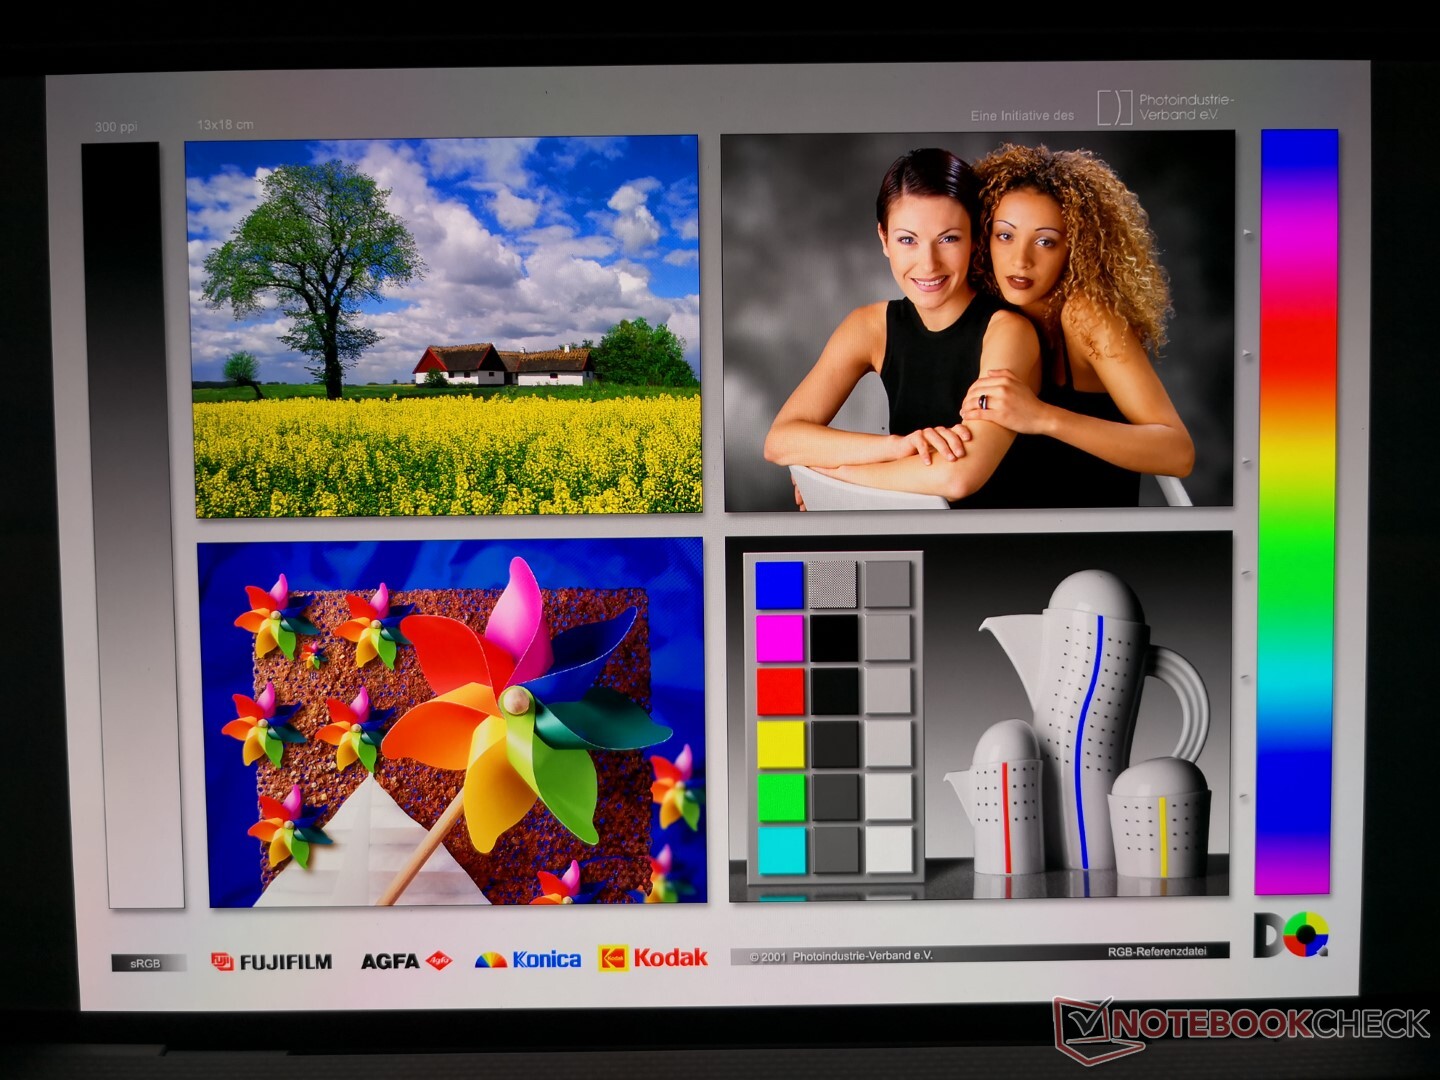
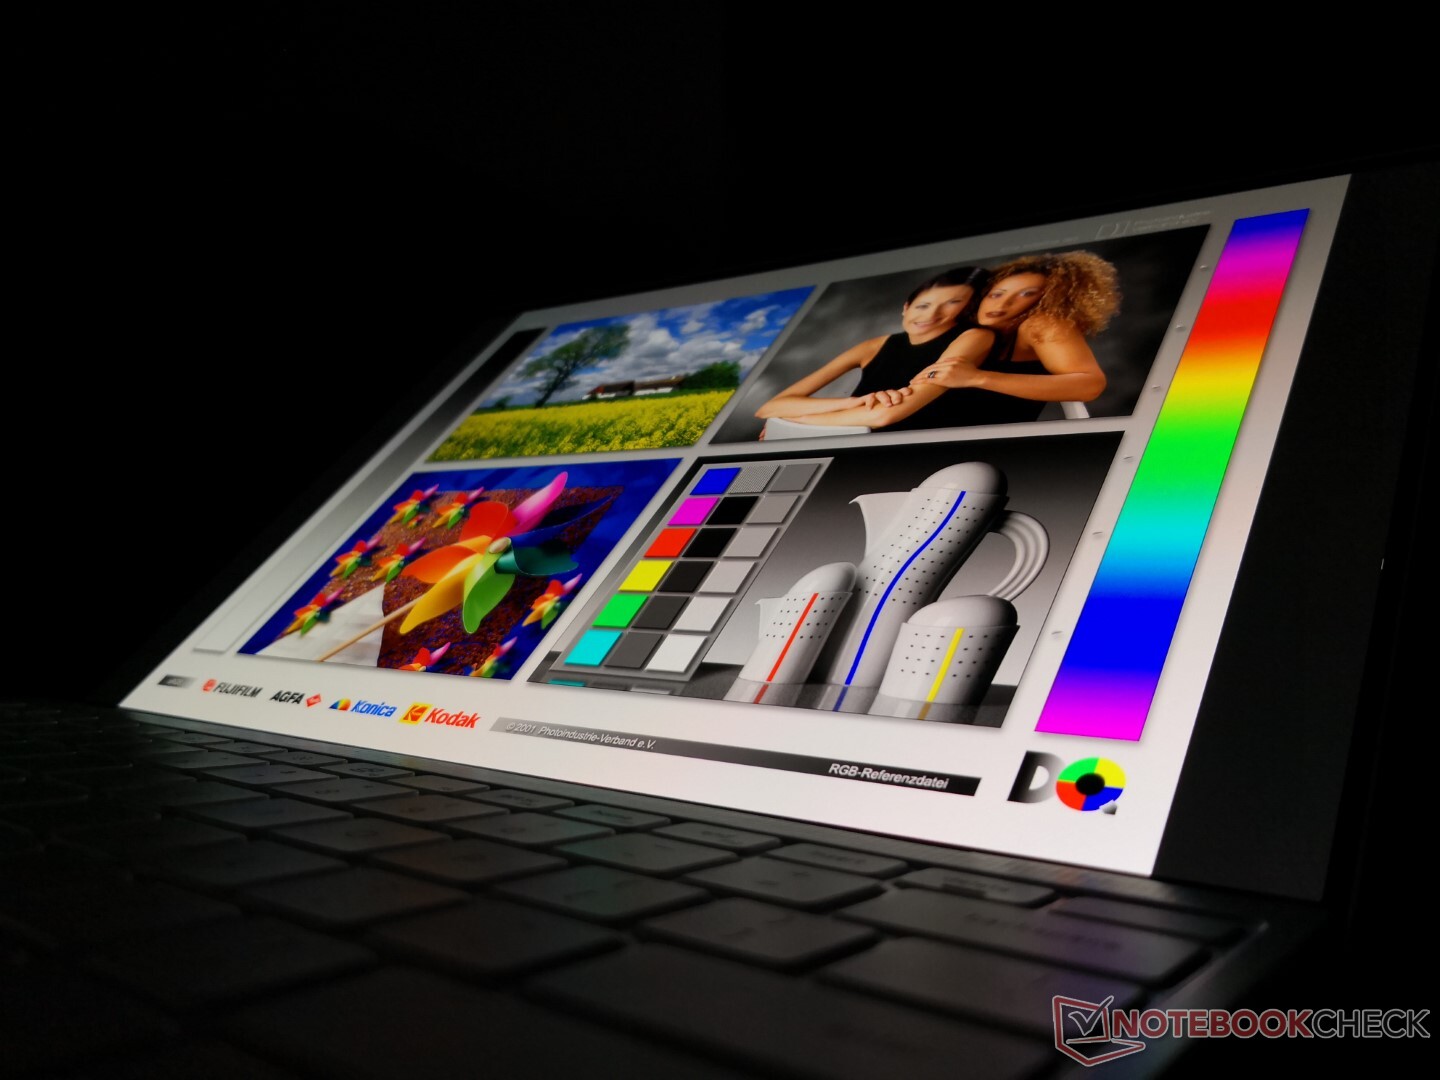
OLED SKU'muzun diğer XPS 13 IPS SKU'larına göre en büyük üç avantajı, daha hızlı siyah beyaz yanıt süreleri, sonsuz kontrast oranı ve daha yüksek DCI-P3 renk kapsamıdır. Özellikle film oynatma sırasında inanılmaz bir görüntü kalitesi için renkler neredeyse hiç gölgelenme olmadan açılır.
Ekran HDR'yi desteklese de, varsayılan Windows 10 ayarları, pil ömrünü uzatmak için pille çalışırken HDR'yi otomatik olarak devre dışı bırakır. HDR'den HDR olmayana veya tam tersi bu geçiş, dizüstü bilgisayar bir prize bağlandığında anlık bir ekran titremesi meydana geliyor. Neyse ki, kullanıcılar Başlat menüsü arama çubuğuna "Windows HD Color" girerek, "HDR Kullan"ın "Açık" olarak ayarlandığından emin olabilirler. Ve ardından Pil seçeneklerini "Pil ömrü için optimize et" yerine "Görüntü kalitesi için optimize et" olarak ayarlayarak varsayılan ayarları kolayca değiştirebilirler. AC adaptör gücü ve pil gücü arasında geçiş yaparken ekran stokları titrediğinde ayarların çalıştığını bileceksiniz.
| |||||||||||||||||||||||||
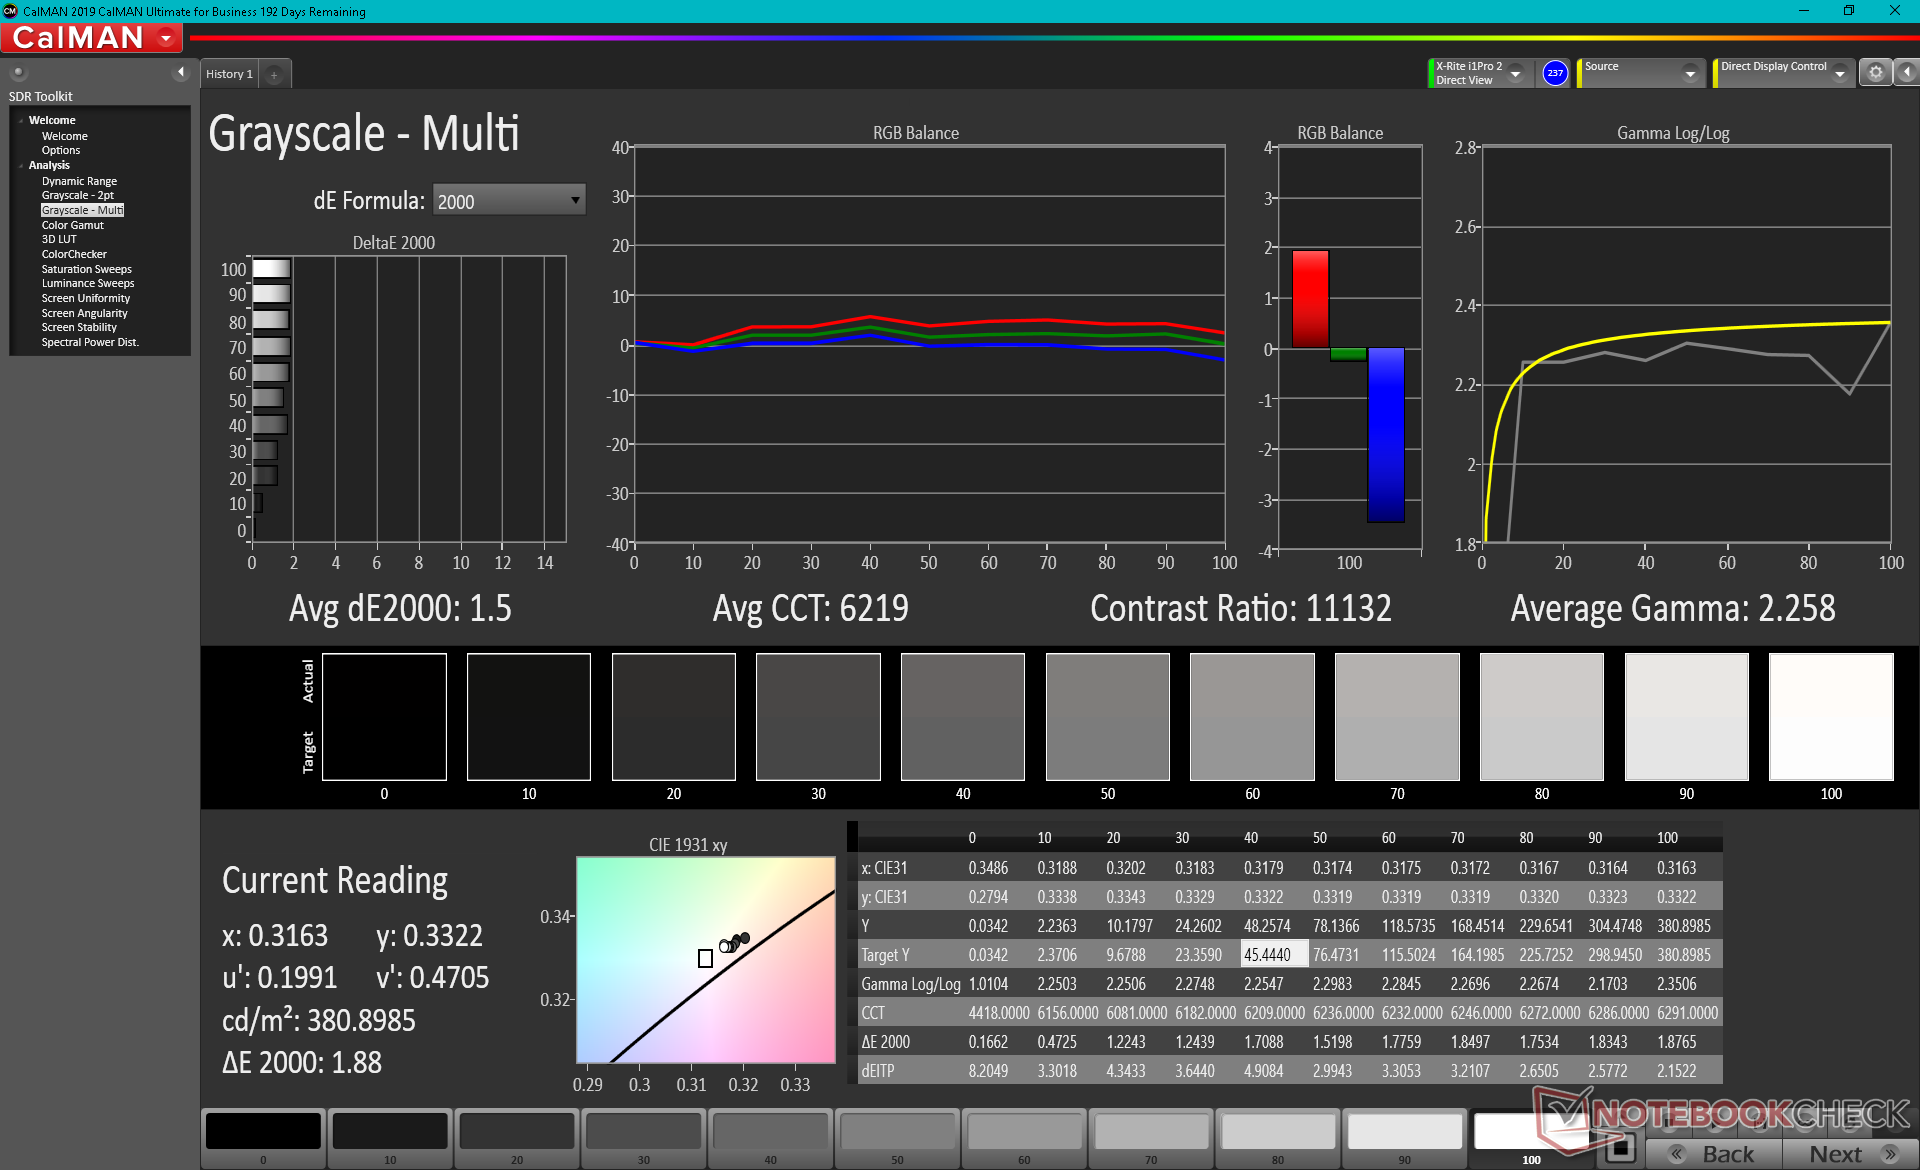
Aydınlatma: 97 %
Batarya modunda parlaklık: 384 cd/m²
Kontrast: ∞:1 (Siyah: 0 cd/m²)
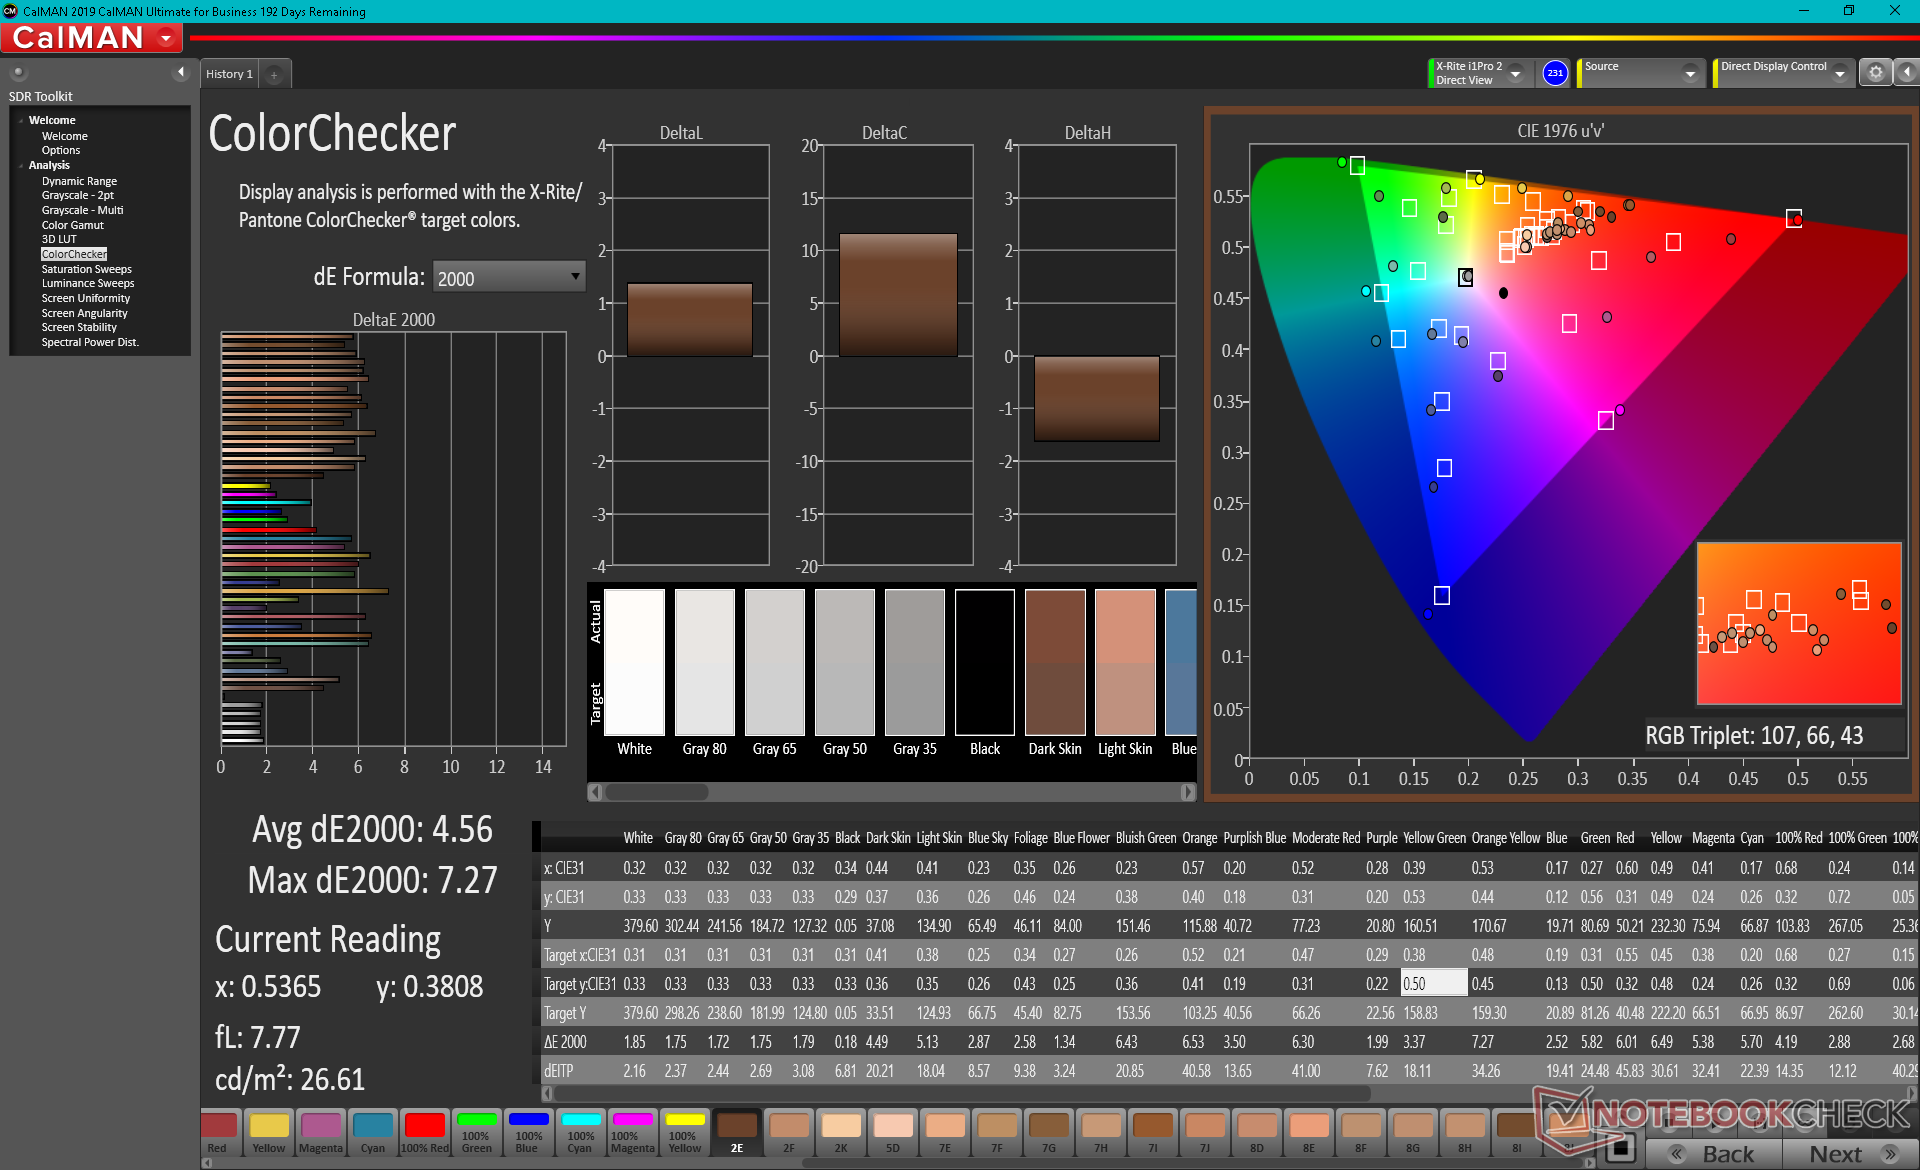
ΔE ColorChecker Calman: 4.56 | ∀{0.5-29.43 Ø4.71}
calibrated: 4.52
ΔE Greyscale Calman: 1.5 | ∀{0.09-98 Ø4.96}
100% sRGB (Argyll 1.6.3 3D)
87.1% AdobeRGB 1998 (Argyll 1.6.3 3D)
97.7% AdobeRGB 1998 (Argyll 3D)
100% sRGB (Argyll 3D)
99.7% Display P3 (Argyll 3D)
Gamma: 2.26
CCT: 6219 K
| Dell XPS 13 9310 OLED Samsung 134XK01, OLED, 13.4", 3456x2160 | Dell XPS 13 9310 Core i7 4K Sharp LQ134R1, IPS, 13.4", 3840x2400 | Dell XPS 13 9310 Core i7 FHD Sharp LQ134N1, IPS, 13.4", 1920x1200 | Dell XPS 13 7390 Core i7-10710U AU Optronics B133ZAN, Dell P/N: 90NTH, IPS, 13.3", 3840x2160 | MSI Summit E13 Flip Evo A11MT Sharp LQ134N1JW53, IPS, 13.4", 1920x1200 | |
|---|---|---|---|---|---|
| Display | -13% | -18% | -25% | -20% | |
| Display P3 Coverage (%) | 99.7 | 80.2 -20% | 70.9 -29% | 63.4 -36% | 69.8 -30% |
| sRGB Coverage (%) | 100 | 100 0% | 99.1 -1% | 93.7 -6% | 98.8 -1% |
| AdobeRGB 1998 Coverage (%) | 97.7 | 78.9 -19% | 72.9 -25% | 64.3 -34% | 70.6 -28% |
| Response Times | -2164% | -1837% | -1836% | -2355% | |
| Response Time Grey 50% / Grey 80% * (ms) | 2.2 ? | 59.2 ? -2591% | 52 ? -2264% | 51.6 ? -2245% | 64 ? -2809% |
| Response Time Black / White * (ms) | 2.2 ? | 40.4 ? -1736% | 33.2 ? -1409% | 33.6 ? -1427% | 44 ? -1900% |
| PWM Frequency (Hz) | 240.4 ? | 2137 ? | 2475 ? | ||
| Screen | 3% | -9% | -50% | 28% | |
| Brightness middle (cd/m²) | 384 | 508.7 32% | 543.3 41% | 408.2 6% | 551.3 44% |
| Brightness (cd/m²) | 387 | 479 24% | 524 35% | 399 3% | 517 34% |
| Brightness Distribution (%) | 97 | 84 -13% | 92 -5% | 89 -8% | 91 -6% |
| Black Level * (cd/m²) | 0.3 | 0.38 | 0.39 | 0.37 | |
| Colorchecker dE 2000 * | 4.56 | 2.72 40% | 3.02 34% | 4.6 -1% | 1.45 68% |
| Colorchecker dE 2000 max. * | 7.27 | 4.7 35% | 7.61 -5% | 11.84 -63% | 2.86 61% |
| Colorchecker dE 2000 calibrated * | 4.52 | 1.92 58% | 1.23 73% | 2.03 55% | 1.7 62% |
| Greyscale dE 2000 * | 1.5 | 3.4 -127% | 5 -233% | 7.5 -400% | 1.3 13% |
| Gamma | 2.26 97% | 2.11 104% | 2.02 109% | 2.12 104% | 2.14 103% |
| CCT | 6219 105% | 6245 104% | 6550 99% | 7966 82% | 6580 99% |
| Color Space (Percent of AdobeRGB 1998) (%) | 87.1 | 70.7 -19% | 66.8 -23% | 59.5 -32% | 65 -25% |
| Color Space (Percent of sRGB) (%) | 100 | 100 0% | 99.6 0% | 93.5 -6% | 99 -1% |
| Contrast (:1) | 1696 | 1430 | 1047 | 1490 | |
| Toplam Ortalama (Program / Ayarlar) | -725% /
-310% | -621% /
-272% | -637% /
-300% | -782% /
-323% |
* ... daha küçük daha iyidir
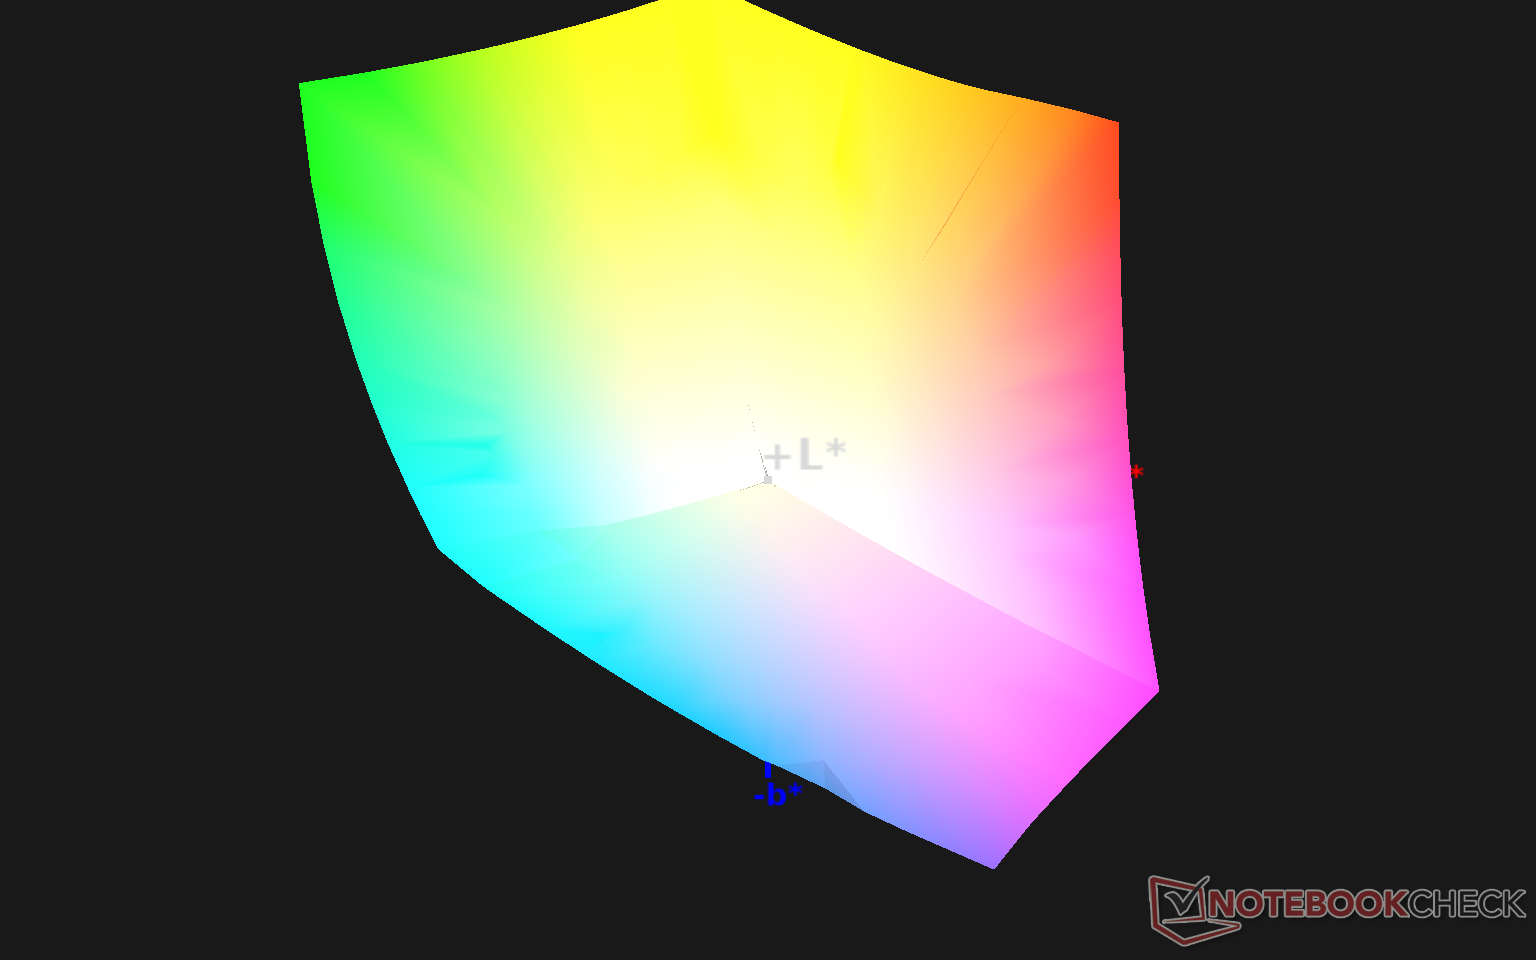
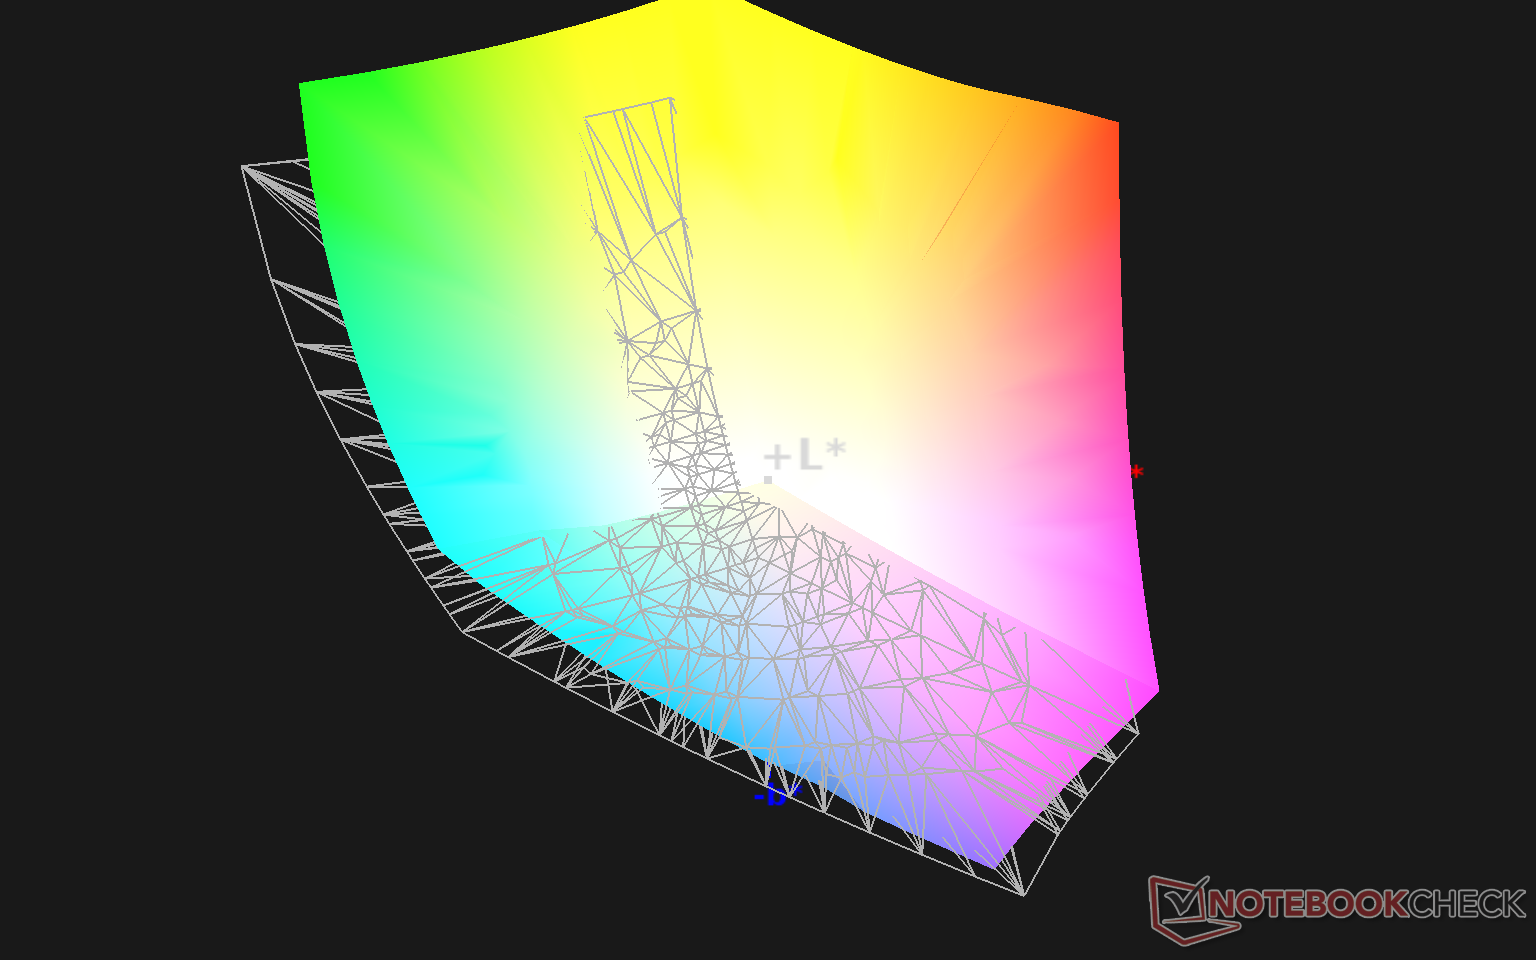
Renk alanı, sRGB'nin tamamını (veya yaklaşık yüzde 158) ve AdobeRGB'nin yüzde 87'sini kapsar. Hacmi, AdobeRGB'den daha fazla kırmızı, sarı ve yeşil alanlara uzanıyor; bu, DCI-P3 uyumlu bir panelden tam olarak bekleyeceğimiz şeydir.
Yanıt Sürelerini Görüntüle
| ↔ Tepki Süresi Siyahtan Beyaza | ||
|---|---|---|
| 2.2 ms ... yükseliş ↗ ve sonbahar↘ birleşimi | ↗ 1 ms yükseliş | 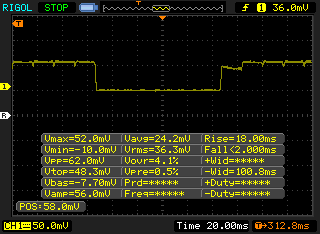 |
| ↘ 1.2 ms sonbahar | ||
| Ekran, testlerimizde çok hızlı yanıt oranları gösteriyor ve hızlı oyun oynamaya çok uygun olmalı. Karşılaştırıldığında, test edilen tüm cihazlar 0.1 (minimum) ile 240 (maksimum) ms arasında değişir. » Tüm cihazların 12 %'si daha iyi. Bu, ölçülen yanıt süresinin test edilen tüm cihazların ortalamasından (19.8 ms) daha iyi olduğu anlamına gelir. | ||
| ↔ Tepki Süresi %50 Griden %80 Griye | ||
| 2.2 ms ... yükseliş ↗ ve sonbahar↘ birleşimi | ↗ 1.2 ms yükseliş | 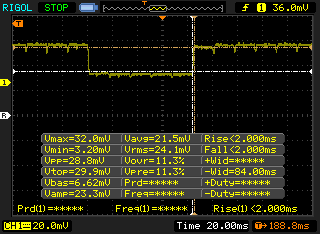 |
| ↘ 1 ms sonbahar | ||
| Ekran, testlerimizde çok hızlı yanıt oranları gösteriyor ve hızlı oyun oynamaya çok uygun olmalı. Karşılaştırıldığında, test edilen tüm cihazlar 0.165 (minimum) ile 636 (maksimum) ms arasında değişir. » Tüm cihazların 11 %'si daha iyi. Bu, ölçülen yanıt süresinin test edilen tüm cihazların ortalamasından (31 ms) daha iyi olduğu anlamına gelir. | ||
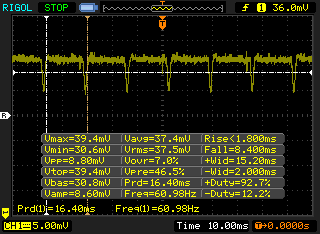
Ekran Titremesi / PWM (Darbe Genişliği Modülasyonu)
| Ekran titriyor / PWM algılandı | 240.4 Hz | ≤ 51 % parlaklık ayarı | 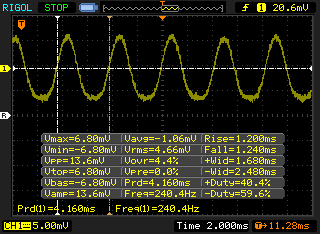 |
Ekran arka ışığı 240.4 Hz'de titriyor (en kötü durum, örneğin PWM kullanılması) 51 % ve altındaki parlaklık ayarında titreme algılandı. Bu parlaklık ayarının üzerinde titreme veya PWM olmamalıdır. 240.4 Hz frekansı nispeten düşüktür, bu nedenle hassas kullanıcılar belirtilen parlaklık ayarında ve altında muhtemelen titremeyi fark edecek ve göz yorgunluğu yaşayacaktır. Karşılaştırıldığında: Test edilen tüm cihazların %52 %'si ekranı karartmak için PWM kullanmıyor. PWM tespit edilirse, ortalama 7757 (minimum: 5 - maksimum: 343500) Hz ölçüldü. | |||
IPS panelleri tipik olarak yalnızca bir adet Sinyal Genişlik Modülasyonu frekansı sergilerken, bu OLED paneli, parlaklık seviyesi ayarına bağlı olarak iki ayrı Sinyal Genişlik Modülasyonu frekansı sergiliyor. Sırasıyla yüzde 0'dan yüzde 51'e ve yüzde 52'den maksimum parlaklığa 240,4 Hz ve 61 Hz frekansını kaydedebiliyoruz. Buna karşılık, XPS 13 4K IPS paneli, yalnızca yüzde 0'dan yüzde 31'e kadar 2137 MHz'lik daha yüksek bir PWM sergileyecekti. Bu nedenle, gözleriniz ekran titremesine duyarlıysa XPS 13 IPS SKU'ları daha iyi bir seçenek olabilir.

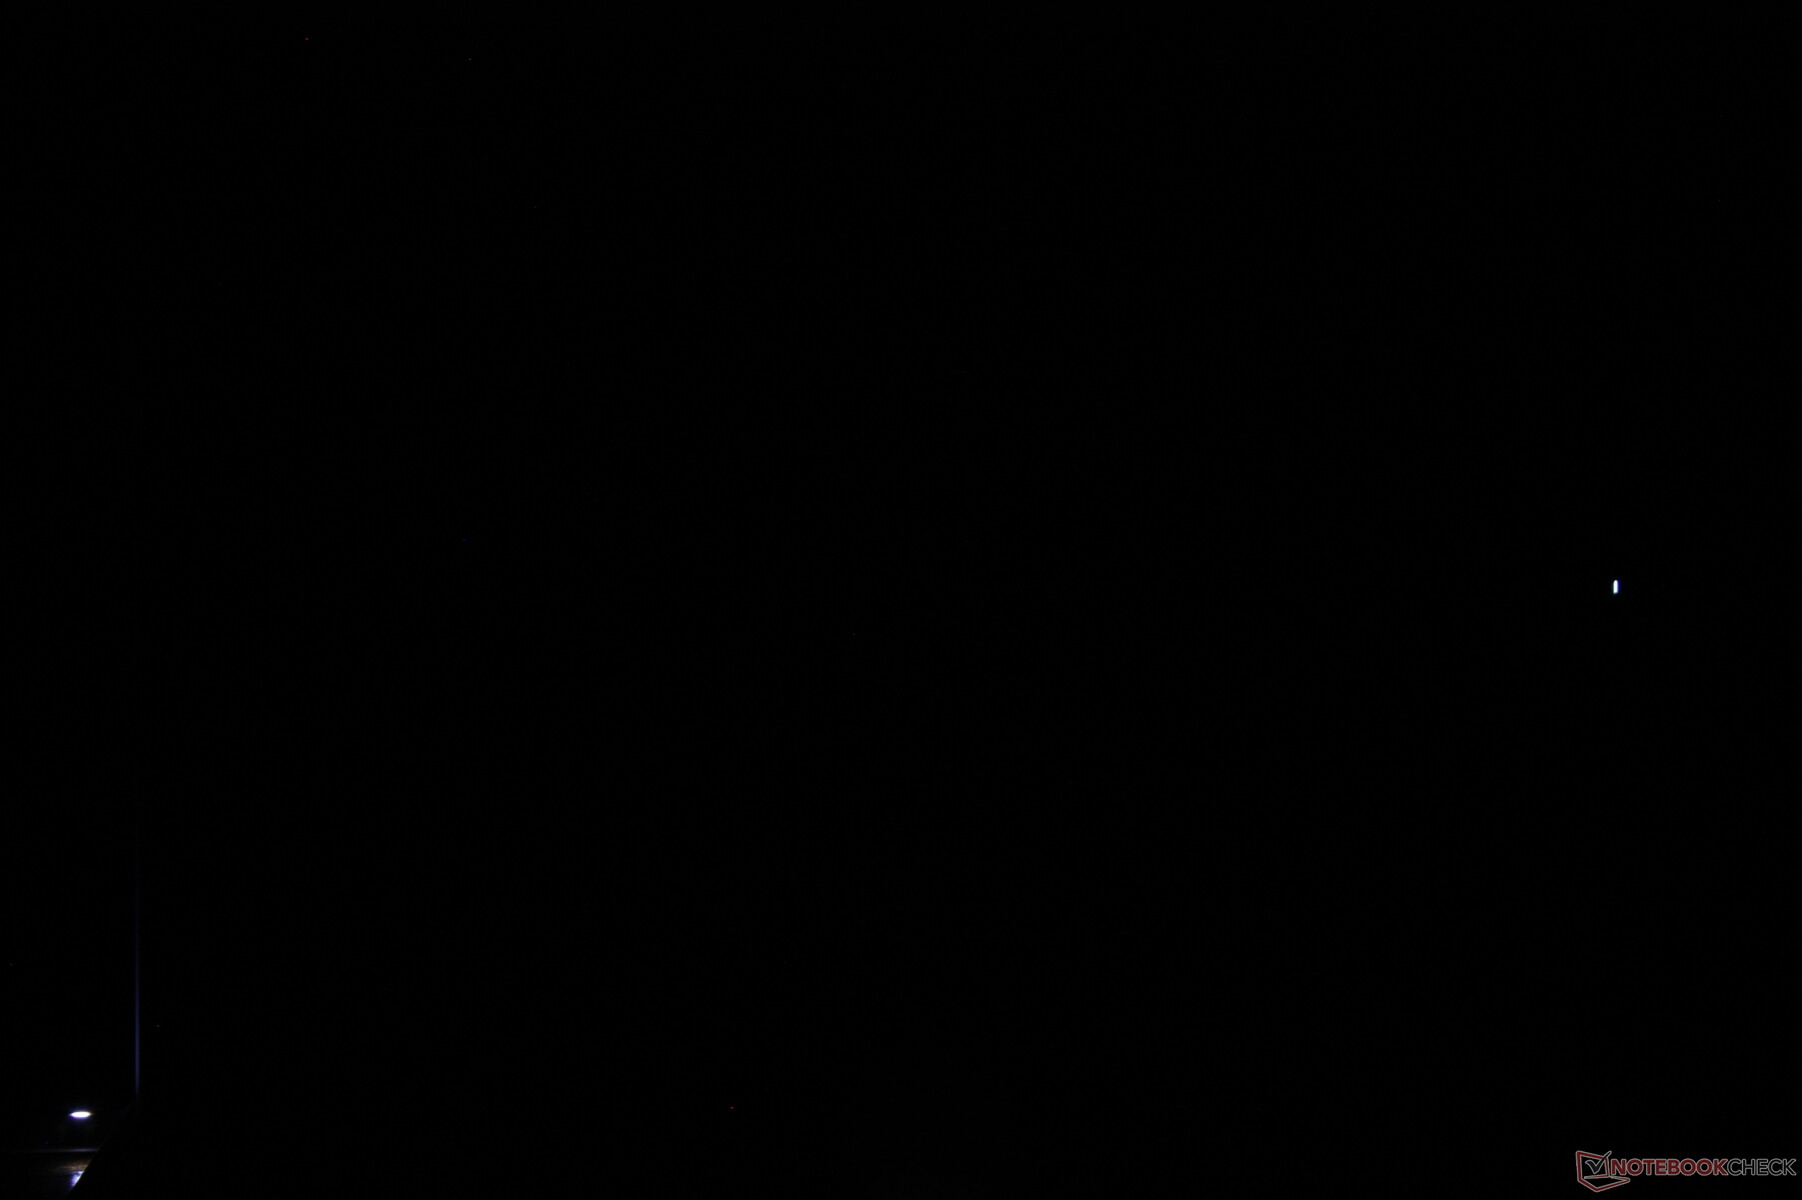
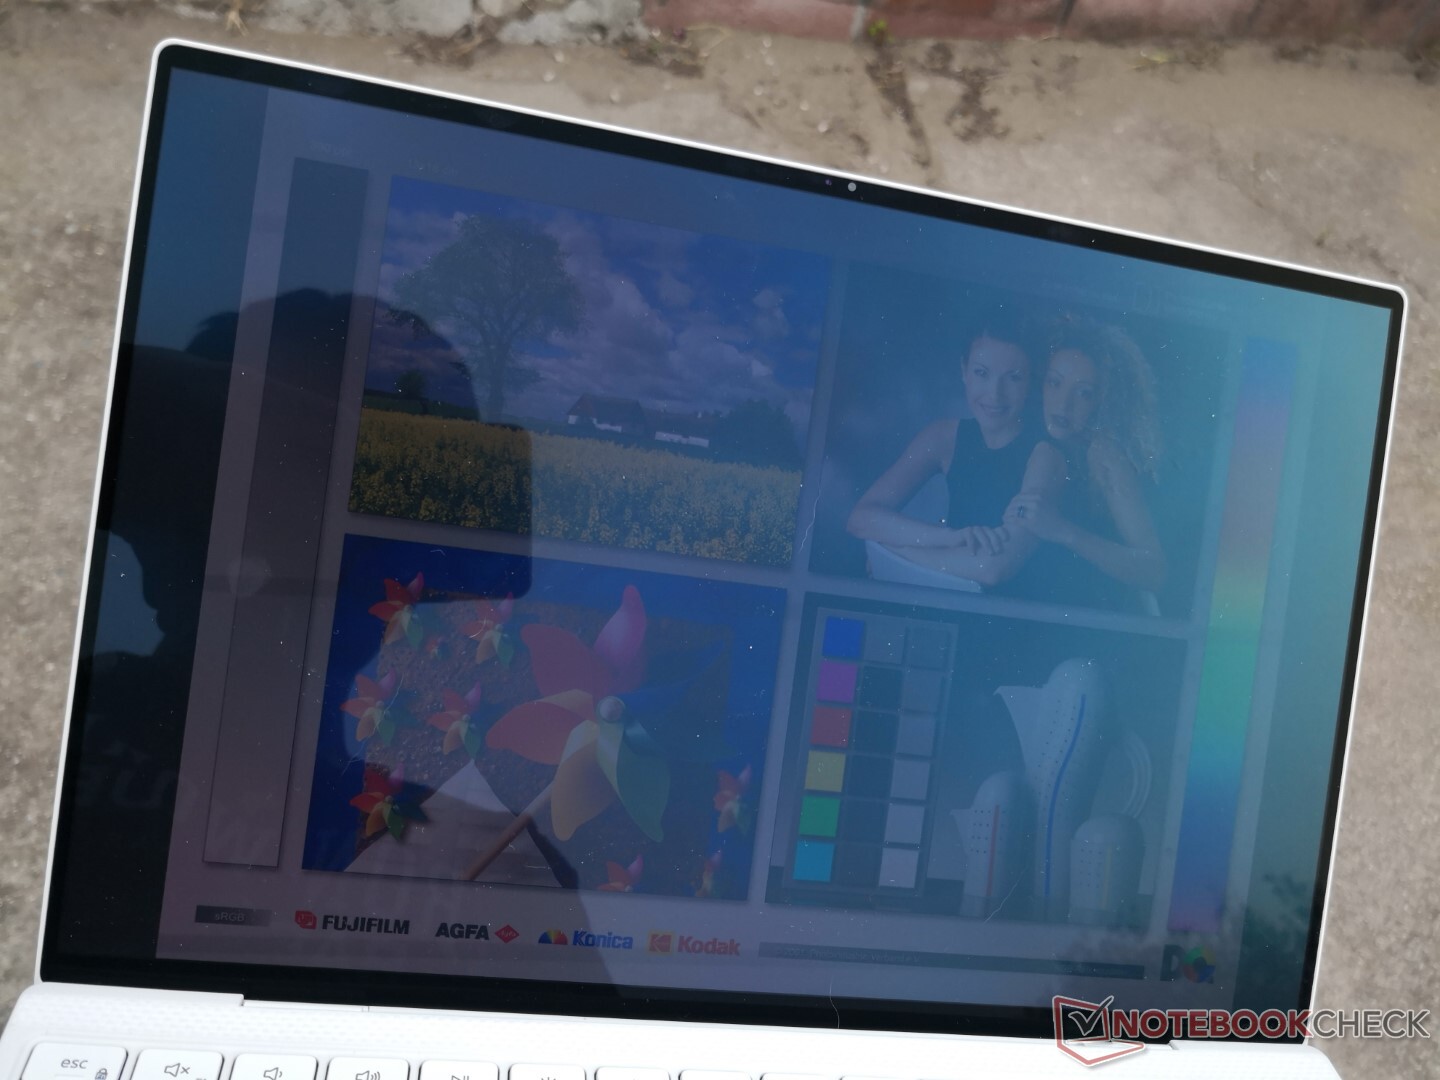
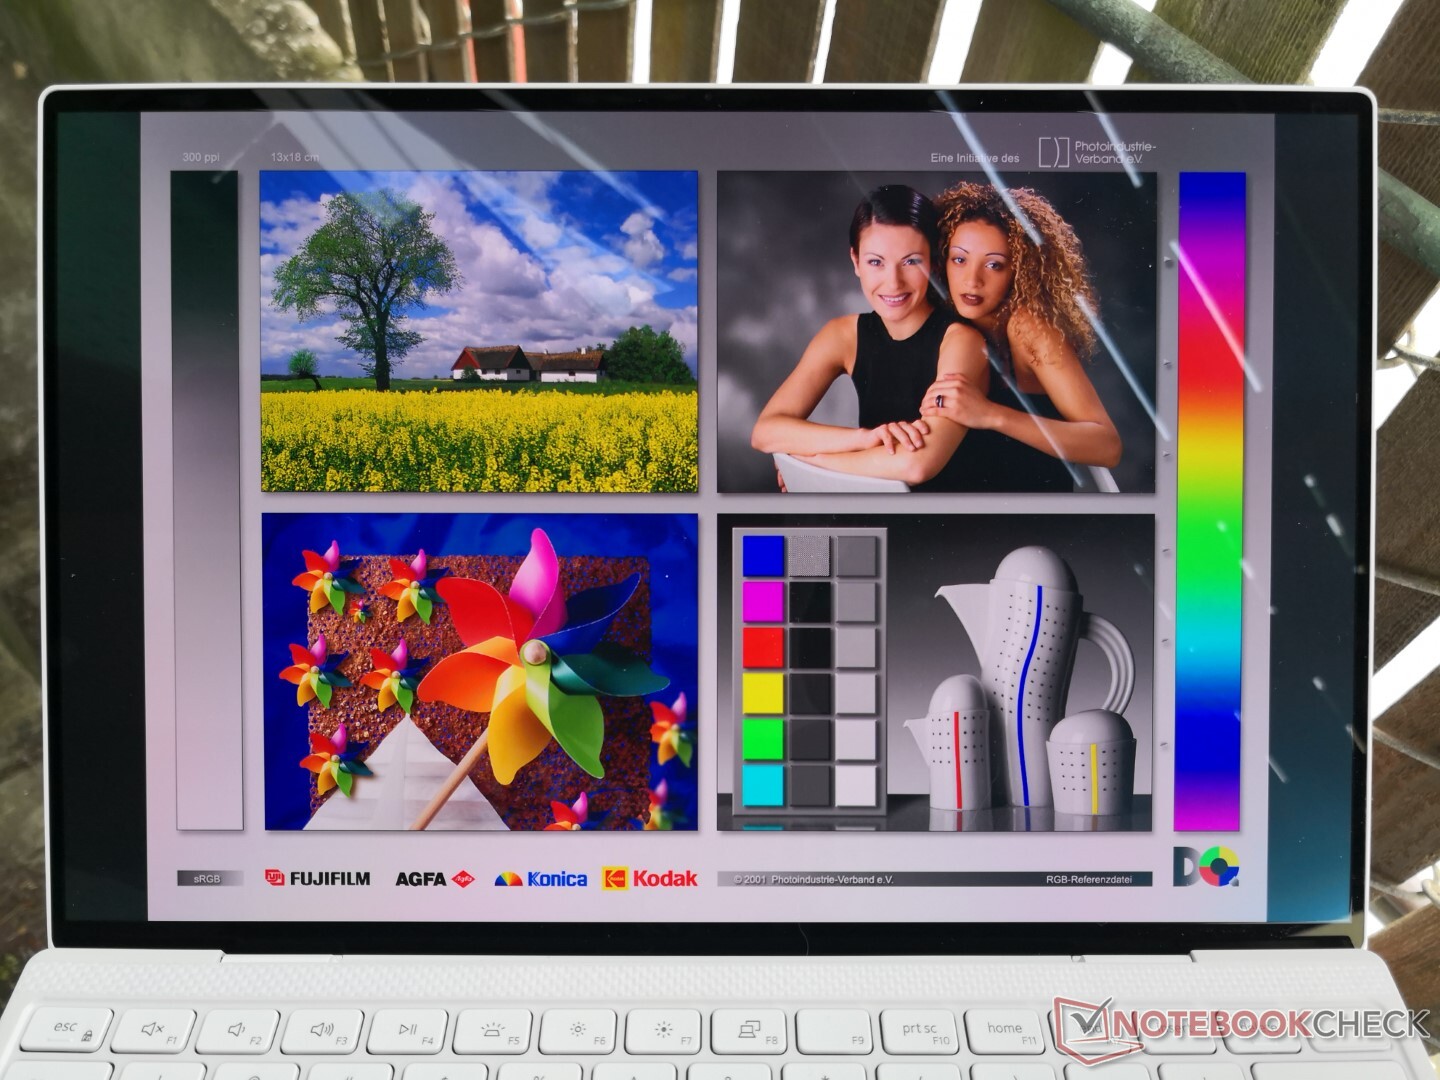
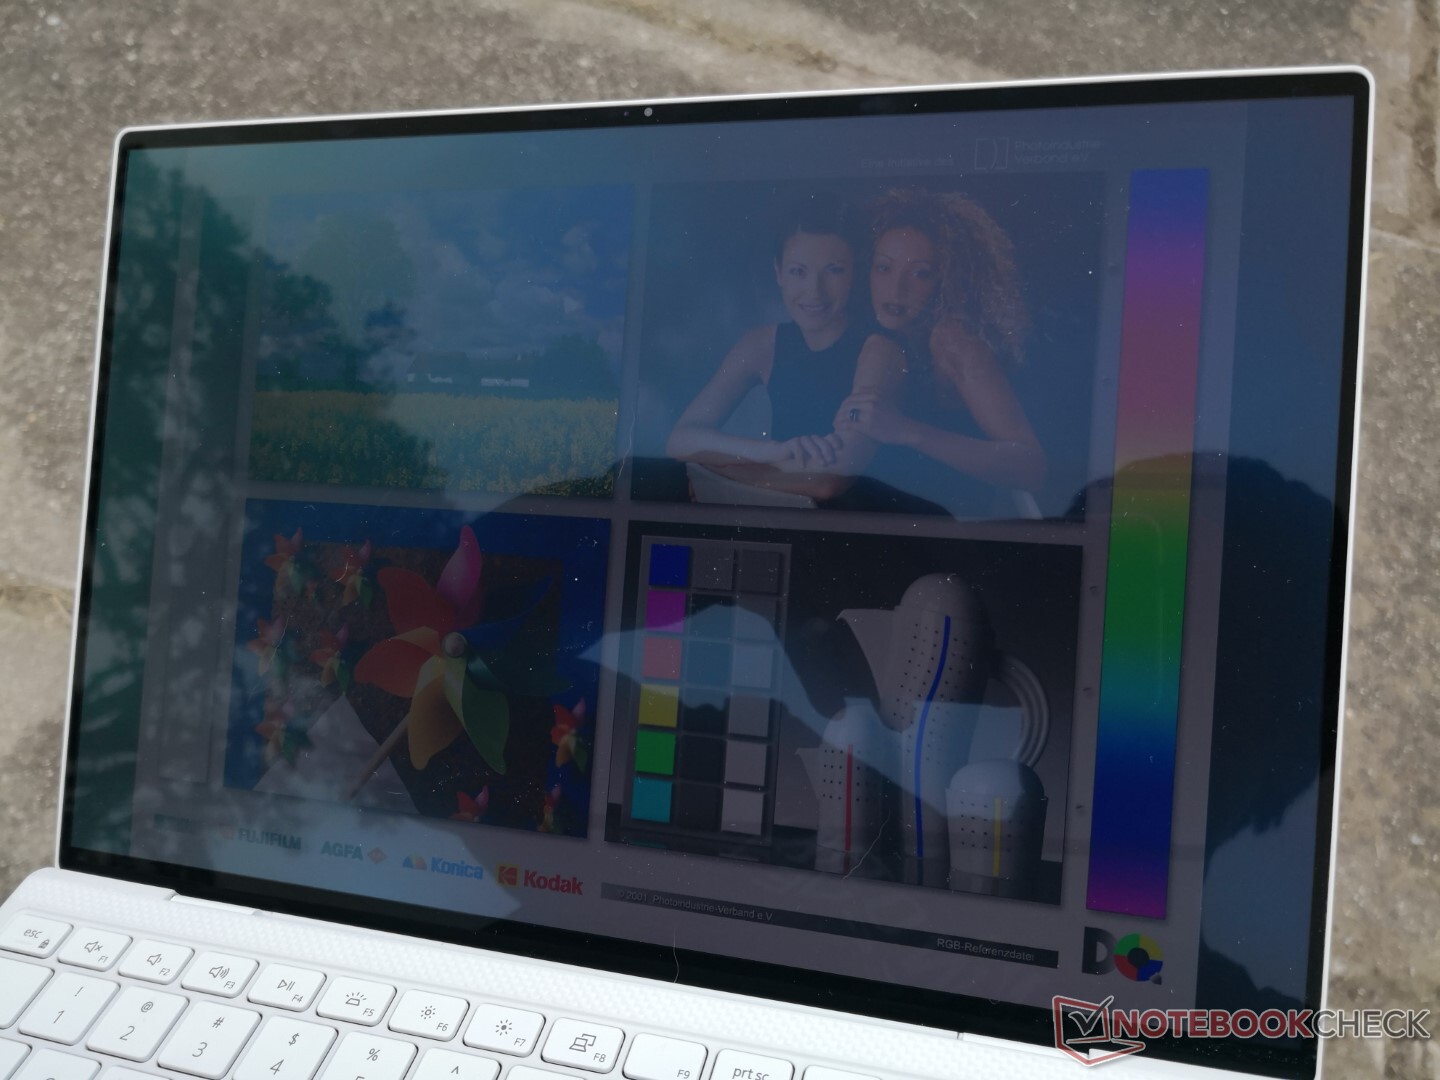
Dış mekan görünürlüğü karışık bir durum. OLED, daha kolay okunabilirlik için daha derin kontrast sunarken, tipik XPS 13 IPS ekranı kadar parlak değildir (384 nit vs. >500 nit). Bu nedenle, parlama çoğu koşulda önemli bir sorun olmaya devam etmektedir. Yansımalar yoğun olduğunda ekranın mavi-yeşil bir renk tonuna sahip olduğunu da belirtmekte fayda var; bu, IPS'de gözlemlenmeyen bir başka benzersiz özelliktir.
Performans
İşlemci
Daha önceki XPS 13 incelemelerimizdes belirtildiği gibi, CPU saat hızları, Dell'in Dinamik Güç politikası nedeniyle karşılaştırmalı testleri veya oyunları çalıştırırken yoğun bir şekilde değişiyor. Bu, puanlar ve kare hızları, sabit olmayan saat hızlarını yansıtmak için dönme eğiliminde olduğundan CineBench R15 xT'yi bir döngüde çalıştırırken veya oyun oynarken gözlemlenebiliyor . Örneğin, CineBench R15 xT puanları 609 ile 765 puan arasında herhangi bir yerde olurken, Witcher 3 kare hızları sadece dünya haritası üzerinde boşta kaldığında 66 ile 95 arasında herhangi bir yerde olabilir.
Cinebench R23: Multi Core | Single Core
Cinebench R15: CPU Multi 64Bit | CPU Single 64Bit
Blender: v2.79 BMW27 CPU
7-Zip 18.03: 7z b 4 -mmt1 | 7z b 4
Geekbench 5.5: Single-Core | Multi-Core
HWBOT x265 Benchmark v2.2: 4k Preset
LibreOffice : 20 Documents To PDF
R Benchmark 2.5: Overall mean
| Cinebench R20 / CPU (Multi Core) | |
| Asus ZenBook 13 UM325S | |
| Lenovo Yoga Slim 7 14ARE05 82A20008GE | |
| Asus ZenBook 13 OLED UM325UA | |
| Dell XPS 13 7390 Core i7-10710U | |
| Ortalama Intel Core i7-1185G7 (1425 - 2493, n=28) | |
| Dell XPS 13 9310 OLED | |
| Dell XPS 13 9305 Core i5 FHD | |
| HP Envy 13-ba1475ng | |
| Asus VivoBook S13 S333JA-DS51 | |
| Asus ZenBook 13 UX325JA | |
| Dell Latitude 7300-P99G | |
| HP Envy 13-ba0001ng | |
| HP Envy 13-aq0003ng | |
| Cinebench R20 / CPU (Single Core) | |
| Ortalama Intel Core i7-1185G7 (489 - 593, n=28) | |
| Dell XPS 13 9310 OLED | |
| Asus ZenBook 13 UM325S | |
| HP Envy 13-ba1475ng | |
| Dell XPS 13 9305 Core i5 FHD | |
| Asus ZenBook 13 OLED UM325UA | |
| Lenovo Yoga Slim 7 14ARE05 82A20008GE | |
| Dell XPS 13 7390 Core i7-10710U | |
| Asus ZenBook 13 UX325JA | |
| HP Envy 13-ba0001ng | |
| Dell Latitude 7300-P99G | |
| Asus VivoBook S13 S333JA-DS51 | |
| HP Envy 13-aq0003ng | |
| Cinebench R23 / Multi Core | |
| Asus ZenBook 13 UM325S | |
| Lenovo Yoga Slim 7 14ARE05 82A20008GE | |
| Asus ZenBook 13 OLED UM325UA | |
| Dell XPS 13 9305 Core i5 FHD | |
| Ortalama Intel Core i7-1185G7 (3610 - 6383, n=24) | |
| Dell XPS 13 9310 OLED | |
| HP Envy 13-ba1475ng | |
| Asus VivoBook S13 S333JA-DS51 | |
| Cinebench R23 / Single Core | |
| Dell XPS 13 9310 OLED | |
| Ortalama Intel Core i7-1185G7 (1251 - 1532, n=24) | |
| Asus ZenBook 13 UM325S | |
| HP Envy 13-ba1475ng | |
| Dell XPS 13 9305 Core i5 FHD | |
| Asus ZenBook 13 OLED UM325UA | |
| Lenovo Yoga Slim 7 14ARE05 82A20008GE | |
| Asus VivoBook S13 S333JA-DS51 | |
| Cinebench R15 / CPU Multi 64Bit | |
| Asus ZenBook 13 UM325S | |
| Asus ZenBook 13 OLED UM325UA | |
| Lenovo Yoga Slim 7 14ARE05 82A20008GE | |
| Dell XPS 13 7390 Core i7-10710U | |
| Ortalama Intel Core i7-1185G7 (617 - 1066, n=32) | |
| Dell XPS 13 9310 OLED | |
| Dell XPS 13 9305 Core i5 FHD | |
| Asus ZenBook 13 UX325JA | |
| HP Envy 13-ba1475ng | |
| Dell Latitude 7300-P99G | |
| Asus VivoBook S13 S333JA-DS51 | |
| HP Envy 13-ba0001ng | |
| HP Envy 13-aq0003ng | |
| Cinebench R15 / CPU Single 64Bit | |
| Asus ZenBook 13 UM325S | |
| Dell XPS 13 9310 OLED | |
| Ortalama Intel Core i7-1185G7 (168 - 230, n=27) | |
| HP Envy 13-ba1475ng | |
| Dell Latitude 7300-P99G | |
| Asus ZenBook 13 OLED UM325UA | |
| Asus ZenBook 13 UX325JA | |
| Dell XPS 13 7390 Core i7-10710U | |
| Lenovo Yoga Slim 7 14ARE05 82A20008GE | |
| HP Envy 13-ba0001ng | |
| HP Envy 13-aq0003ng | |
| Asus VivoBook S13 S333JA-DS51 | |
| Blender / v2.79 BMW27 CPU | |
| Asus ZenBook 13 UX325JA | |
| HP Envy 13-ba0001ng | |
| Asus VivoBook S13 S333JA-DS51 | |
| HP Envy 13-ba1475ng | |
| Dell XPS 13 9310 OLED | |
| Dell XPS 13 9305 Core i5 FHD | |
| Ortalama Intel Core i7-1185G7 (478 - 745, n=28) | |
| Dell XPS 13 7390 Core i7-10710U | |
| Lenovo Yoga Slim 7 14ARE05 82A20008GE | |
| Asus ZenBook 13 OLED UM325UA | |
| Asus ZenBook 13 UM325S | |
| 7-Zip 18.03 / 7z b 4 -mmt1 | |
| Asus ZenBook 13 UM325S | |
| Ortalama Intel Core i7-1185G7 (3678 - 5507, n=27) | |
| HP Envy 13-ba1475ng | |
| HP Envy 13-ba0001ng | |
| Dell XPS 13 9305 Core i5 FHD | |
| Asus ZenBook 13 OLED UM325UA | |
| Dell XPS 13 7390 Core i7-10710U | |
| Lenovo Yoga Slim 7 14ARE05 82A20008GE | |
| Asus ZenBook 13 UX325JA | |
| Asus VivoBook S13 S333JA-DS51 | |
| Dell XPS 13 9310 OLED | |
| 7-Zip 18.03 / 7z b 4 | |
| Asus ZenBook 13 UM325S | |
| Asus ZenBook 13 OLED UM325UA | |
| Lenovo Yoga Slim 7 14ARE05 82A20008GE | |
| Dell XPS 13 7390 Core i7-10710U | |
| Dell XPS 13 9305 Core i5 FHD | |
| Ortalama Intel Core i7-1185G7 (18812 - 27693, n=27) | |
| Dell XPS 13 9310 OLED | |
| HP Envy 13-ba1475ng | |
| Asus VivoBook S13 S333JA-DS51 | |
| HP Envy 13-ba0001ng | |
| Asus ZenBook 13 UX325JA | |
| Geekbench 5.5 / Single-Core | |
| Dell XPS 13 9310 OLED | |
| Ortalama Intel Core i7-1185G7 (1398 - 1626, n=21) | |
| HP Envy 13-ba1475ng | |
| Asus ZenBook 13 UM325S | |
| Dell XPS 13 9305 Core i5 FHD | |
| Asus ZenBook 13 UX325JA | |
| HP Envy 13-ba0001ng | |
| Asus ZenBook 13 OLED UM325UA | |
| Asus VivoBook S13 S333JA-DS51 | |
| Lenovo Yoga Slim 7 14ARE05 82A20008GE | |
| Geekbench 5.5 / Multi-Core | |
| Asus ZenBook 13 UM325S | |
| Asus ZenBook 13 OLED UM325UA | |
| Lenovo Yoga Slim 7 14ARE05 82A20008GE | |
| Dell XPS 13 9310 OLED | |
| Ortalama Intel Core i7-1185G7 (4620 - 5944, n=21) | |
| Dell XPS 13 9305 Core i5 FHD | |
| HP Envy 13-ba1475ng | |
| Asus ZenBook 13 UX325JA | |
| Asus VivoBook S13 S333JA-DS51 | |
| HP Envy 13-ba0001ng | |
| HWBOT x265 Benchmark v2.2 / 4k Preset | |
| Asus ZenBook 13 UM325S | |
| Lenovo Yoga Slim 7 14ARE05 82A20008GE | |
| Asus ZenBook 13 OLED UM325UA | |
| Ortalama Intel Core i7-1185G7 (5.02 - 8.13, n=27) | |
| Dell XPS 13 9310 OLED | |
| Dell XPS 13 7390 Core i7-10710U | |
| HP Envy 13-ba1475ng | |
| Asus VivoBook S13 S333JA-DS51 | |
| HP Envy 13-ba0001ng | |
| Asus ZenBook 13 UX325JA | |
| LibreOffice / 20 Documents To PDF | |
| Lenovo Yoga Slim 7 14ARE05 82A20008GE | |
| Asus VivoBook S13 S333JA-DS51 | |
| Asus ZenBook 13 OLED UM325UA | |
| Dell XPS 13 9305 Core i5 FHD | |
| HP Envy 13-ba0001ng | |
| HP Envy 13-ba1475ng | |
| Asus ZenBook 13 UM325S | |
| Asus ZenBook 13 UX325JA | |
| Ortalama Intel Core i7-1185G7 (41.3 - 61.7, n=26) | |
| Dell XPS 13 9310 OLED | |
| R Benchmark 2.5 / Overall mean | |
| Asus VivoBook S13 S333JA-DS51 | |
| Asus ZenBook 13 UX325JA | |
| HP Envy 13-ba0001ng | |
| Dell XPS 13 9305 Core i5 FHD | |
| Lenovo Yoga Slim 7 14ARE05 82A20008GE | |
| HP Envy 13-ba1475ng | |
| Asus ZenBook 13 OLED UM325UA | |
| Dell XPS 13 9310 OLED | |
| Ortalama Intel Core i7-1185G7 (0.55 - 0.615, n=27) | |
| Asus ZenBook 13 UM325S | |
Cinebench R23: Multi Core | Single Core
Cinebench R15: CPU Multi 64Bit | CPU Single 64Bit
Blender: v2.79 BMW27 CPU
7-Zip 18.03: 7z b 4 -mmt1 | 7z b 4
Geekbench 5.5: Single-Core | Multi-Core
HWBOT x265 Benchmark v2.2: 4k Preset
LibreOffice : 20 Documents To PDF
R Benchmark 2.5: Overall mean
* ... daha küçük daha iyidir
Sistem Performansı
| PCMark 10 Score | 5226 puan | |
Yardım | ||
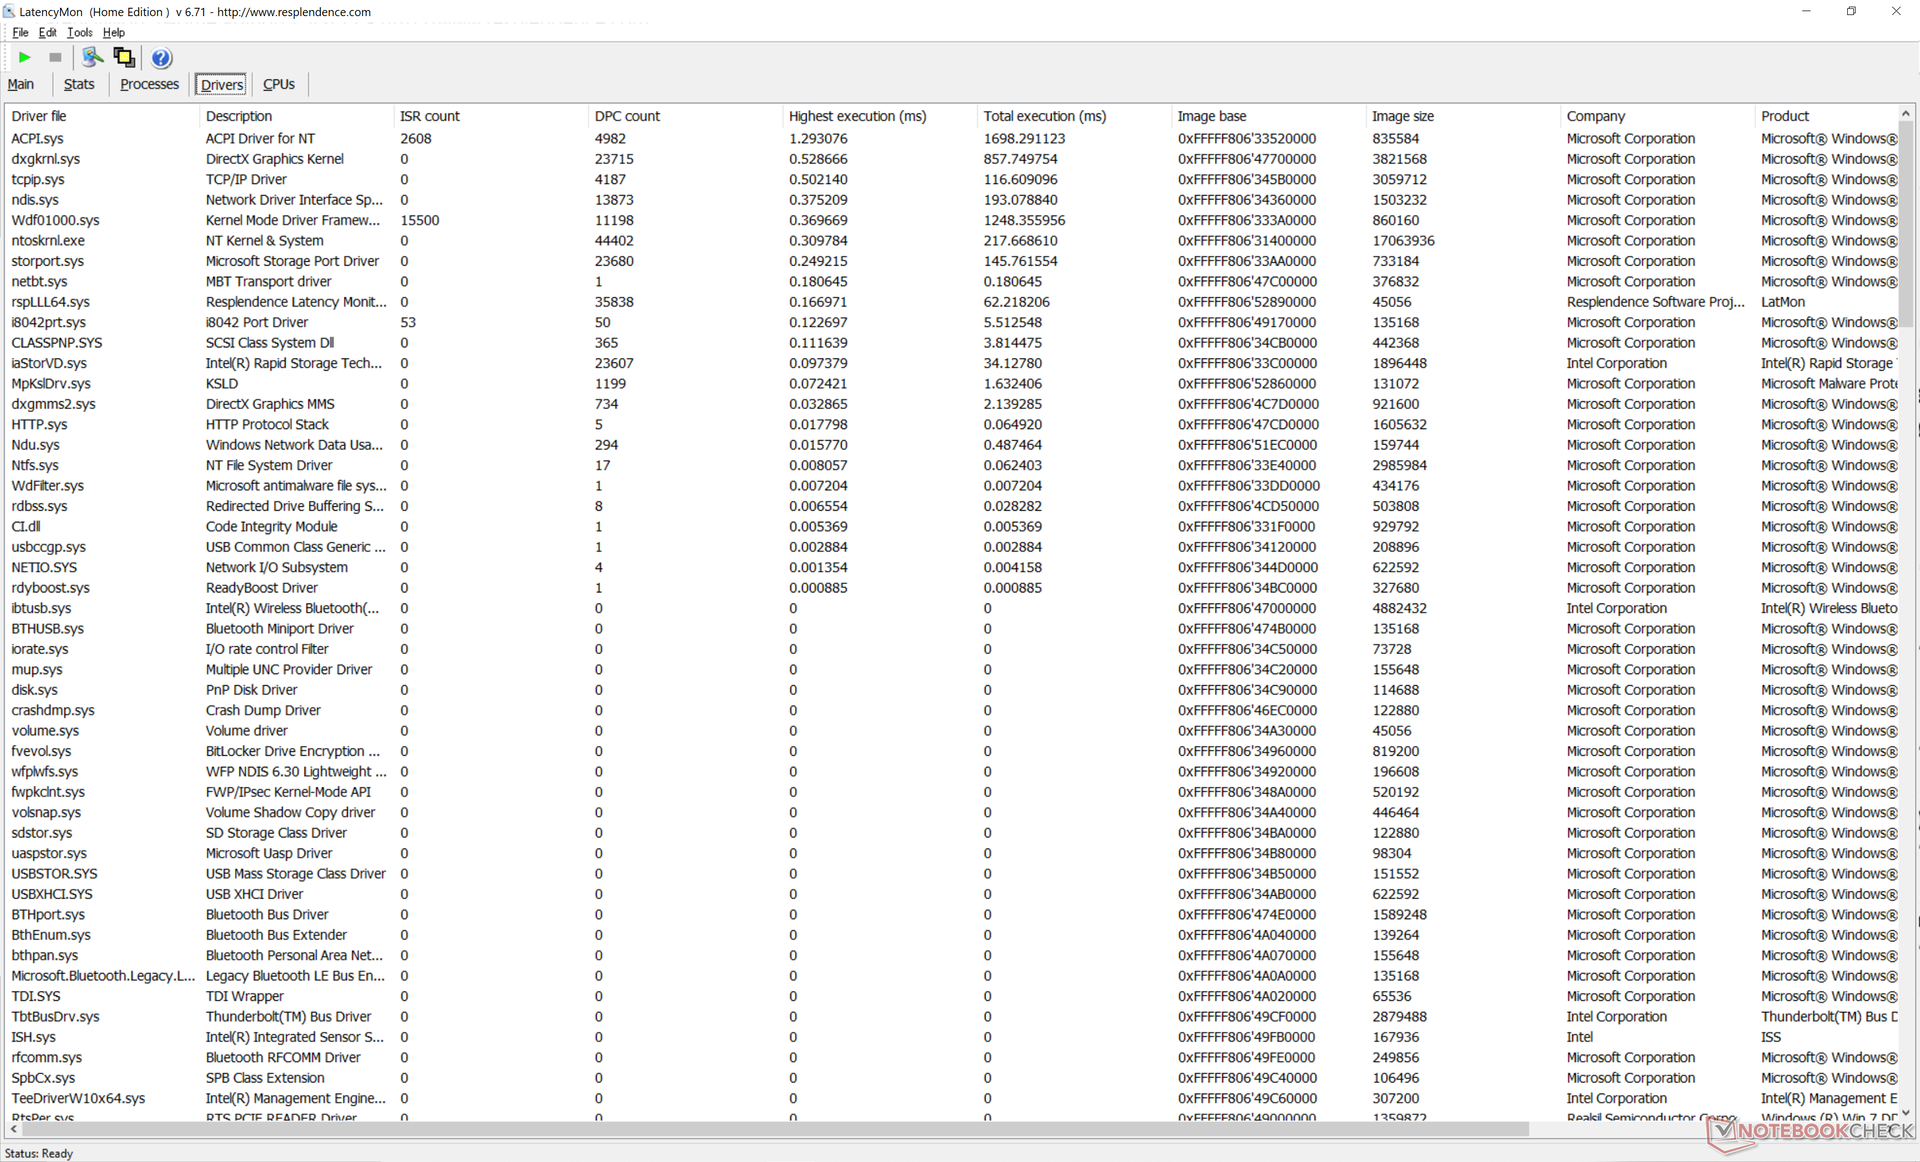
DPC Gecikmesi
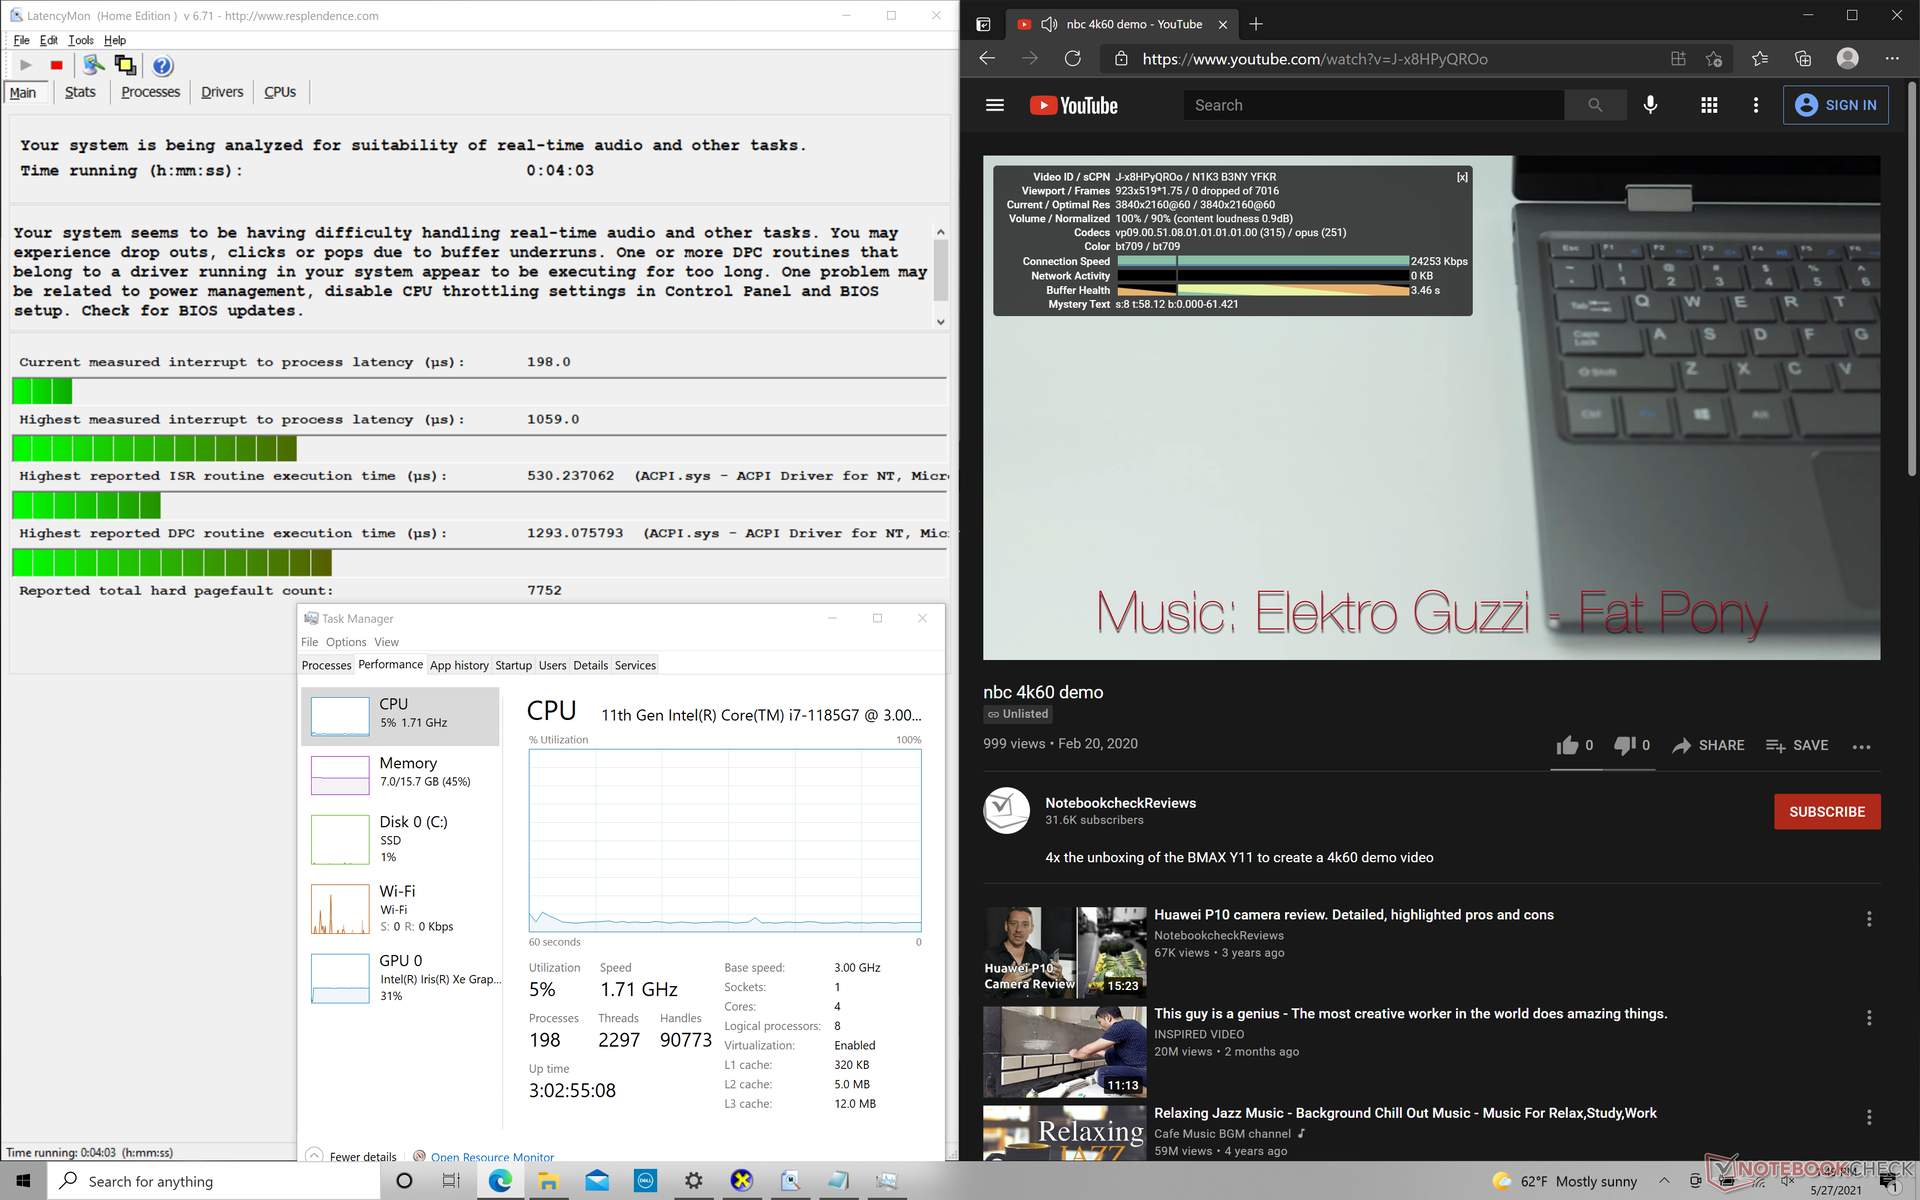
Seri, hafif DPC gecikme sorunları sergilemeye devam ediyor. 60 FPS'de 4K video oynatma, neyse ki, kare kaybı olmadan sorunsuz kalıyor.
| DPC Latencies / LatencyMon - interrupt to process latency (max), Web, Youtube, Prime95 | |
| MSI Summit E13 Flip Evo A11MT | |
| Dell XPS 13 9310 Core i7 4K | |
| Dell XPS 13 9310 OLED | |
| Dell XPS 13 9310 Core i7 FHD | |
* ... daha küçük daha iyidir
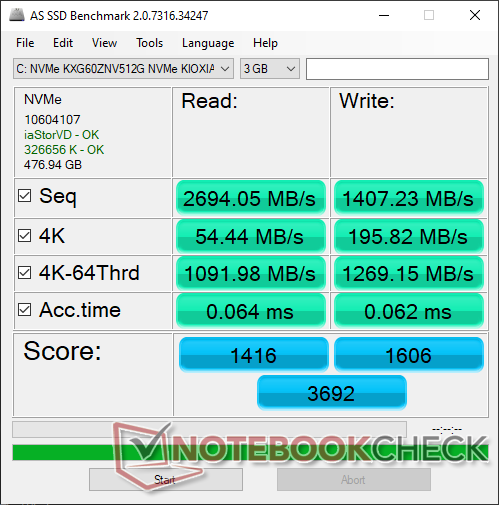
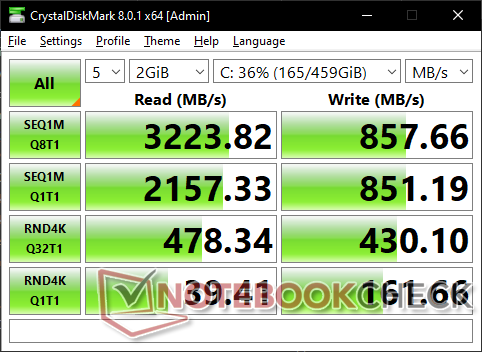
Storage Devices
| Dell XPS 13 9310 OLED Toshiba XG6 KXG60ZNV512G | Dell XPS 13 9310 Core i7 FHD Micron 2300 512GB MTFDHBA512TDV | Dell XPS 13 7390 Core i7-10710U SK Hynix PC601 NVMe 512 GB | MSI Summit E13 Flip Evo A11MT Phison 1TB SM2801T24GKBB4S-E162 | |
|---|---|---|---|---|
| AS SSD | -43% | -25% | 23% | |
| Seq Read (MB/s) | 2694 | 2091 -22% | 1804 -33% | 3789 41% |
| Seq Write (MB/s) | 1407 | 1396 -1% | 1000 -29% | 2257 60% |
| 4K Read (MB/s) | 54.4 | 49.29 -9% | 45.1 -17% | 54.2 0% |
| 4K Write (MB/s) | 195.8 | 104.2 -47% | 115 -41% | 78.7 -60% |
| 4K-64 Read (MB/s) | 1092 | 827 -24% | 893 -18% | 1330 22% |
| 4K-64 Write (MB/s) | 1269 | 1636 29% | 732 -42% | 2038 61% |
| Access Time Read * (ms) | 0.064 | 0.066 -3% | 0.044 31% | 0.042 34% |
| Access Time Write * (ms) | 0.062 | 0.365 -489% | 0.095 -53% | 0.04 35% |
| Score Read (Points) | 1416 | 1086 -23% | 1119 -21% | 1763 25% |
| Score Write (Points) | 1606 | 1880 17% | 947 -41% | 2343 46% |
| Score Total (Points) | 3692 | 3499 -5% | 2608 -29% | 4938 34% |
| Copy ISO MB/s (MB/s) | 1782 | 1544 -13% | 1515 -15% | 2270 27% |
| Copy Program MB/s (MB/s) | 1023 | 613 -40% | 535 -48% | 670 -35% |
| Copy Game MB/s (MB/s) | 1148 | 1451 26% | 1211 5% | 1525 33% |
| CrystalDiskMark 5.2 / 6 | 41% | 30% | 95% | |
| Write 4K (MB/s) | 156.8 | 97.5 -38% | 134 -15% | 311.1 98% |
| Read 4K (MB/s) | 39.66 | 50.9 28% | 42.91 8% | 56.6 43% |
| Write Seq (MB/s) | 854 | 1811 112% | 1841 116% | 2397 181% |
| Read Seq (MB/s) | 2167 | 1836 -15% | 1707 -21% | 2277 5% |
| Write 4K Q32T1 (MB/s) | 441.1 | 521 18% | 394.7 -11% | 803 82% |
| Read 4K Q32T1 (MB/s) | 395.5 | 357.5 -10% | 398.5 1% | 849 115% |
| Write Seq Q32T1 (MB/s) | 858 | 2879 236% | 2250 162% | 2410 181% |
| Read Seq Q32T1 (MB/s) | 3258 | 3204 -2% | 3265 0% | 4954 52% |
| Toplam Ortalama (Program / Ayarlar) | -1% /
-13% | 3% /
-5% | 59% /
49% |
* ... daha küçük daha iyidir

Disk Throttling: DiskSpd Read Loop, Queue Depth 8
GPU(Ekran Kartı) Performansı
| 3DMark 11 | |
| 1280x720 Performance GPU | |
| Razer Blade Stealth i7-1165G7 GTX 1650 Ti Max-Q | |
| Dell XPS 13 9310 OLED | |
| Ortalama Intel Iris Xe Graphics G7 96EUs (2867 - 7676, n=209) | |
| Dell XPS 13 9305 Core i5 FHD | |
| Asus ZenBook 13 UM325S | |
| Asus ZenBook 13 OLED UM325UA | |
| Lenovo Yoga Slim 7 14ARE05 82A20008GE | |
| HP Envy 13-ba0001ng | |
| Asus ZenBook 13 UX325JA | |
| HP Envy 13-aq0003ng | |
| Huawei MateBook X Pro 2020 i7 | |
| Asus VivoBook S13 S333JA-DS51 | |
| Dell XPS 13 7390 Core i7-10710U | |
| Dell Latitude 7300-P99G | |
| 1280x720 Performance Combined | |
| Razer Blade Stealth i7-1165G7 GTX 1650 Ti Max-Q | |
| Dell XPS 13 9305 Core i5 FHD | |
| Ortalama Intel Iris Xe Graphics G7 96EUs (1926 - 7661, n=208) | |
| Lenovo Yoga Slim 7 14ARE05 82A20008GE | |
| HP Envy 13-ba0001ng | |
| Dell XPS 13 9310 OLED | |
| Asus ZenBook 13 UM325S | |
| HP Envy 13-aq0003ng | |
| Asus ZenBook 13 OLED UM325UA | |
| Huawei MateBook X Pro 2020 i7 | |
| Asus ZenBook 13 UX325JA | |
| Asus VivoBook S13 S333JA-DS51 | |
| Dell XPS 13 7390 Core i7-10710U | |
| Dell Latitude 7300-P99G | |
| 3DMark 11 Performance | 6398 puan | |
| 3DMark Cloud Gate Standard Score | 15019 puan | |
| 3DMark Fire Strike Score | 4449 puan | |
| 3DMark Time Spy Score | 1526 puan | |
Yardım | ||
| Final Fantasy XV Benchmark | |
| 1280x720 Lite Quality | |
| MSI Summit E13 Flip Evo A11MT | |
| Ortalama Intel Iris Xe Graphics G7 96EUs (14.9 - 56.5, n=189) | |
| Dell XPS 13 9305 Core i5 FHD | |
| Dell XPS 13 9310 OLED | |
| Asus ZenBook 13 UM325S | |
| Dell XPS 13 9310 Core i7 FHD | |
| Asus ZenBook 13 OLED UM325UA | |
| Dell XPS 13 9310 Core i7 4K | |
| Asus VivoBook S13 S333JA-DS51 | |
| 1920x1080 Standard Quality | |
| MSI Summit E13 Flip Evo A11MT | |
| Ortalama Intel Iris Xe Graphics G7 96EUs (10.5 - 31.2, n=185) | |
| Dell XPS 13 9305 Core i5 FHD | |
| Dell XPS 13 9310 OLED | |
| Dell XPS 13 9310 Core i7 FHD | |
| Dell XPS 13 9310 Core i7 4K | |
| Asus ZenBook 13 UM325S | |
| Asus ZenBook 13 OLED UM325UA | |
| Asus VivoBook S13 S333JA-DS51 | |
| 1920x1080 High Quality | |
| Dell XPS 13 9305 Core i5 FHD | |
| MSI Summit E13 Flip Evo A11MT | |
| Ortalama Intel Iris Xe Graphics G7 96EUs (8.15 - 27.8, n=178) | |
| Dell XPS 13 9310 Core i7 FHD | |
| Dell XPS 13 9310 OLED | |
| Dell XPS 13 9310 Core i7 4K | |
| Asus ZenBook 13 UM325S | |
| Asus ZenBook 13 OLED UM325UA | |
| Asus VivoBook S13 S333JA-DS51 | |
| Strange Brigade | |
| 1280x720 lowest AF:1 | |
| MSI Summit E13 Flip Evo A11MT | |
| Dell XPS 13 9310 Core i7 FHD | |
| Dell XPS 13 9310 OLED | |
| Ortalama Intel Iris Xe Graphics G7 96EUs (48.5 - 115.1, n=172) | |
| Dell XPS 13 9305 Core i5 FHD | |
| 1920x1080 medium AA:medium AF:4 | |
| MSI Summit E13 Flip Evo A11MT | |
| Dell XPS 13 9310 Core i7 FHD | |
| Ortalama Intel Iris Xe Graphics G7 96EUs (18.2 - 51.4, n=170) | |
| Dell XPS 13 9310 OLED | |
| Dell XPS 13 9305 Core i5 FHD | |
| 1920x1080 high AA:high AF:8 | |
| MSI Summit E13 Flip Evo A11MT | |
| Dell XPS 13 9310 Core i7 FHD | |
| Dell XPS 13 9310 OLED | |
| Ortalama Intel Iris Xe Graphics G7 96EUs (15.4 - 39.8, n=169) | |
| Dell XPS 13 9305 Core i5 FHD | |
| 1920x1080 ultra AA:ultra AF:16 | |
| MSI Summit E13 Flip Evo A11MT | |
| Dell XPS 13 9310 Core i7 FHD | |
| Ortalama Intel Iris Xe Graphics G7 96EUs (13.2 - 31.7, n=167) | |
| Dell XPS 13 9310 OLED | |
| düşük | orta | yüksek | ultra | QHD | 4K | |
|---|---|---|---|---|---|---|
| The Witcher 3 (2015) | 98.6 | 61.1 | 32 | 13.9 | ||
| Dota 2 Reborn (2015) | 76.1 | 74.7 | 41.6 | 43.4 | 21.5 | |
| Final Fantasy XV Benchmark (2018) | 35 | 19.9 | 15.1 | 15.1 | 15.1 | |
| X-Plane 11.11 (2018) | 25.1 | 35.2 | 29.4 | 17.1 | ||
| Strange Brigade (2018) | 88.4 | 33.2 | 29.7 | 22.3 | 16.9 |
Emisyonlar
Sistem gürültüsü
| Dell XPS 13 9310 OLED Iris Xe G7 96EUs, i7-1185G7, Toshiba XG6 KXG60ZNV512G | Dell XPS 13 9310 Core i7 4K Iris Xe G7 96EUs, i7-1185G7, Micron 2300 512GB MTFDHBA512TDV | Dell XPS 13 9310 Core i7 FHD Iris Xe G7 96EUs, i7-1165G7, Micron 2300 512GB MTFDHBA512TDV | Dell XPS 13 7390 Core i7-10710U UHD Graphics 620, i7-10710U, SK Hynix PC601 NVMe 512 GB | MSI Summit E13 Flip Evo A11MT Iris Xe G7 96EUs, i7-1185G7, Phison 1TB SM2801T24GKBB4S-E162 | |
|---|---|---|---|---|---|
| Noise | -7% | -3% | -19% | -15% | |
| kapalı / ortam * (dB) | 24.8 | 27.7 -12% | 25.7 -4% | 28 -13% | 24.5 1% |
| Idle Minimum * (dB) | 25 | 27.8 -11% | 25.7 -3% | 28 -12% | 24.7 1% |
| Idle Average * (dB) | 25 | 27.8 -11% | 25.7 -3% | 28 -12% | 24.7 1% |
| Idle Maximum * (dB) | 25 | 27.8 -11% | 25.9 -4% | 28 -12% | 26.4 -6% |
| Load Average * (dB) | 25.3 | 27.9 -10% | 26.2 -4% | 33.7 -33% | 37.8 -49% |
| Witcher 3 ultra * (dB) | 35.8 | 32.8 8% | 36.5 -2% | 41.4 -16% | |
| Load Maximum * (dB) | 35.8 | 37 -3% | 36.6 -2% | 46.5 -30% | 48.8 -36% |
* ... daha küçük daha iyidir
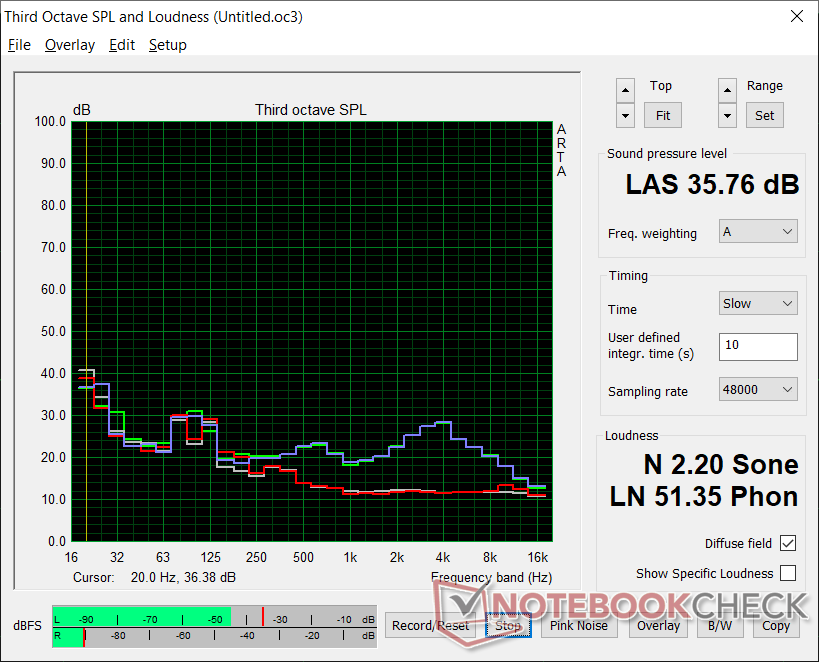
Ses yüksekliği
| Boşta |
| 25 / 25 / 25 dB |
| Çalışırken |
| 25.3 / 35.8 dB |
 | ||
30 dB sessiz 40 dB(A) duyulabilirlik 50 dB(A) gürültülü |
||
min: | ||
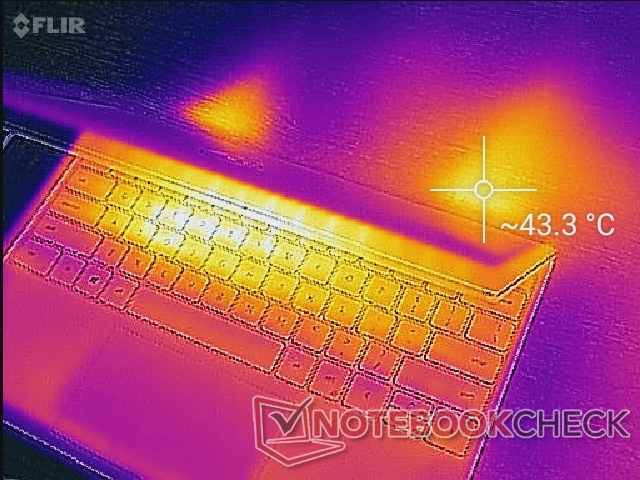
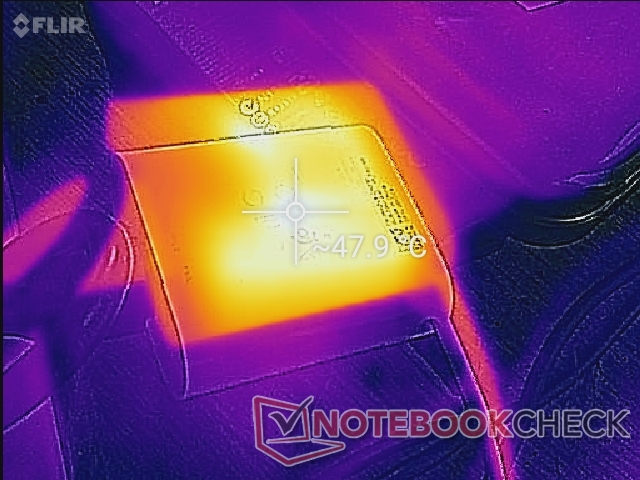
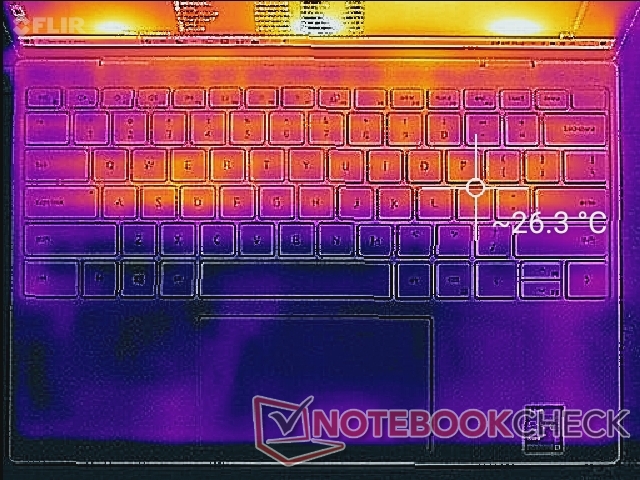
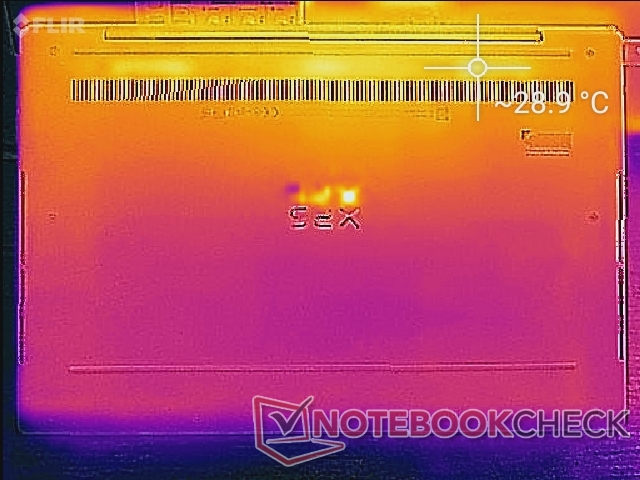
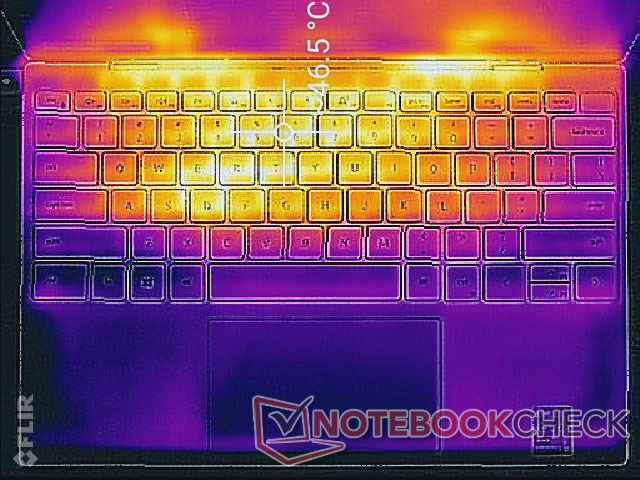
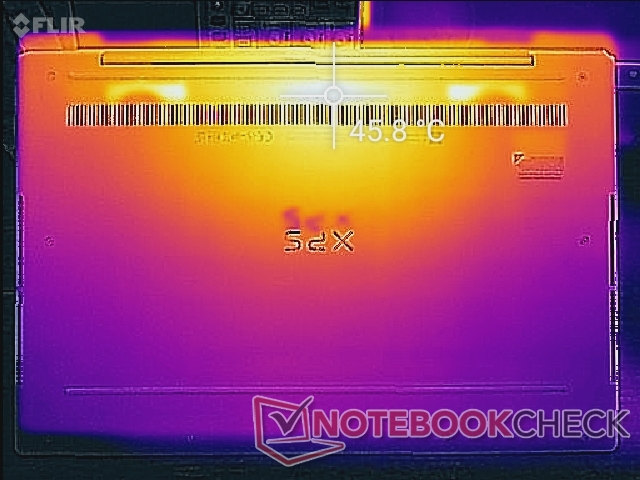
Sıcaklık
Hoparlörler

Enerji yönetimi
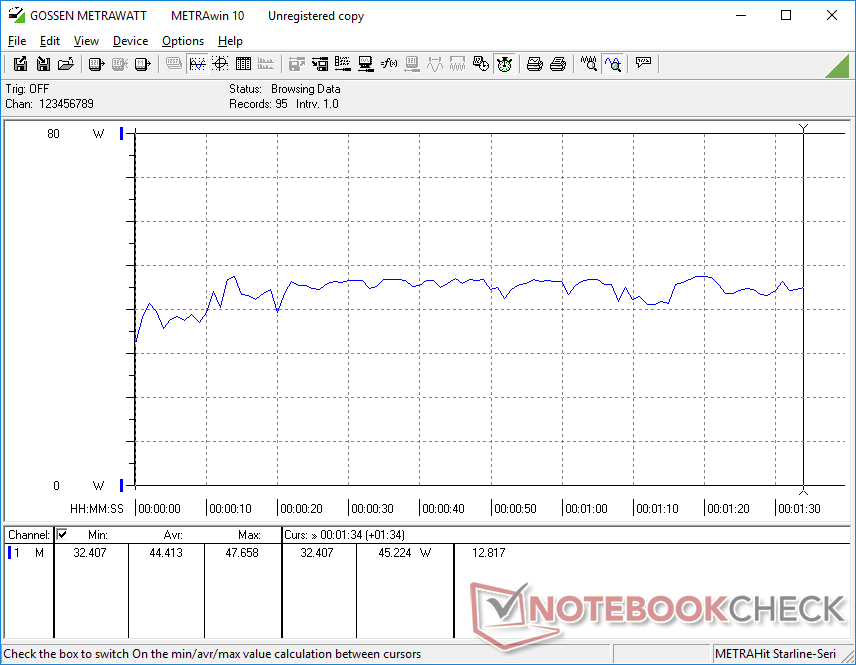
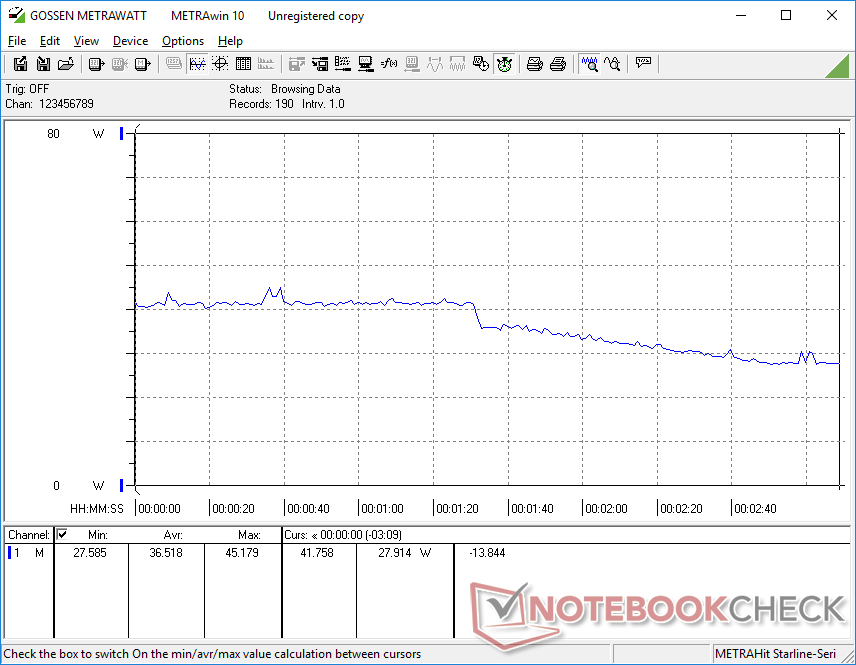
Güç tüketimi
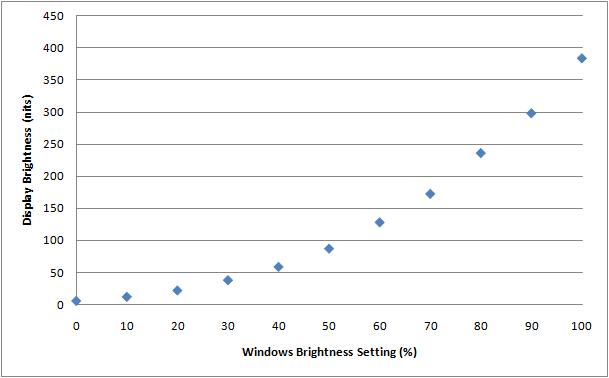
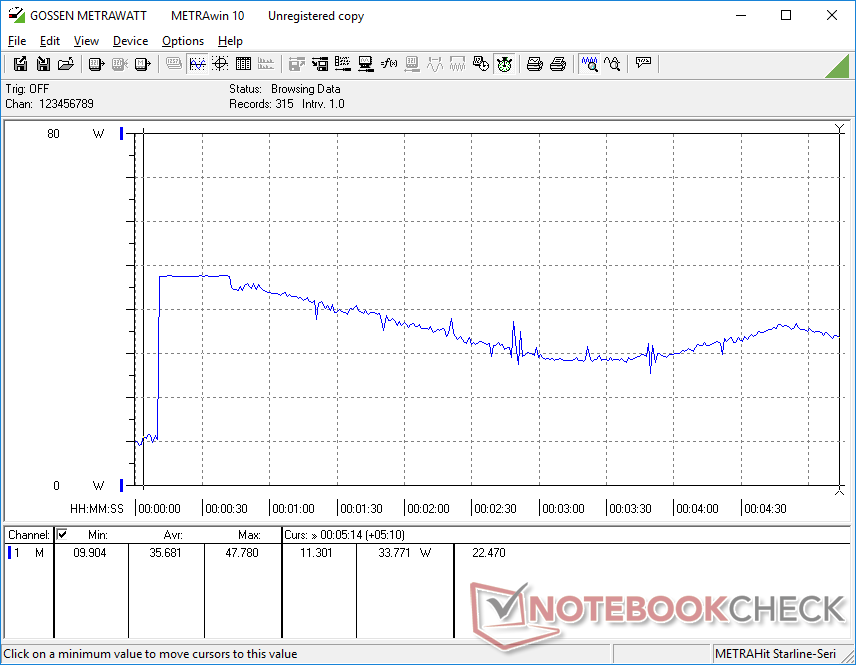
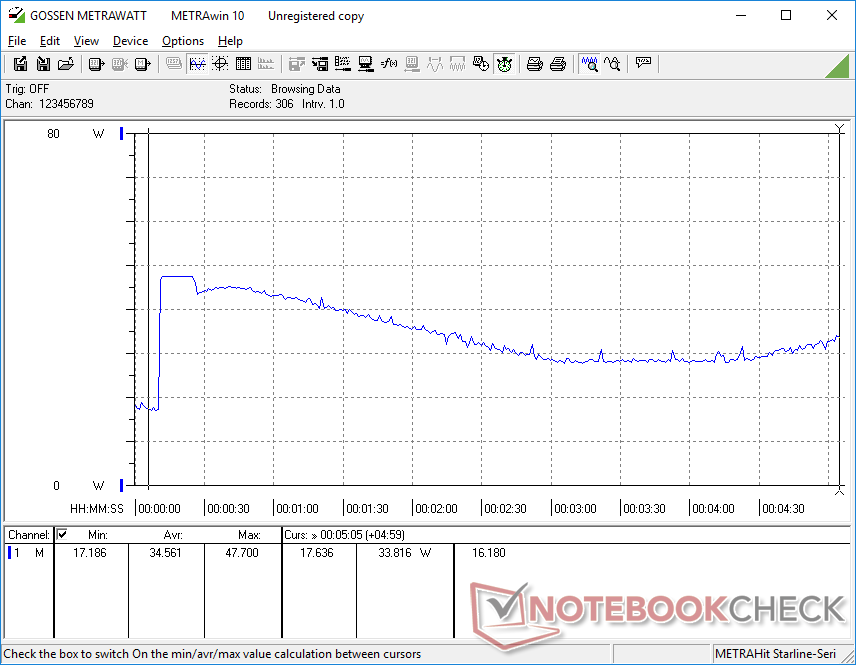
Güç tüketimi davranışı, Razer Blade 15 OLED'de gözlemlediğimiz ile aynı. Özetle, OLED ekranı bir IPS panelinden daha parlak ayarlarda ve daha parlak renklerde çalıştırmak için daha fazla güç gerekir. Tersine, daha düşük ayarlarda ve daha koyu renklerde bir OLED ekranı çalıştırmak daha az güç gerektirir. Örneğin, XPS 13 OLED'imizde tamamen beyazı maksimum parlaklık ayarında görüntülemek, minimum parlaklık ayarından 6,2 W daha fazla tüketirken, fark XPS 13 FHD IPS ve XPS 13 4K IPS SKU'larında sırasıyla yalnızca 2 W ve 4 W olacaktır. . Bu, OLED için tipik bir IPS FHD çözümünden yaklaşık 3 kat daha fazla güç demektir.
Tek tek OLED pikselleri sonsuz kontrast için kapatıldığından, tamamen siyahın görüntülenmesi, parlaklık ayarı ne olursa olsun aynı miktarda güç tüketir. Aşağıdaki tabloda gösterildiği gibi koşullar altındayken sadece 6 W'lık bir tüketimi ölçebiliyoruz.
| Tam Ekranda Renk | Parlaklık Ayarı | Güç Tüketimi (W) |
|---|---|---|
| Beyaz | 0% | 6.1 |
| Beyaz | 100% | 12.3 |
| Siyah | 0% | 6 |
| Siyah | 100% | 6 |
| Kapalı / Bekleme modu | |
| Boşta | |
| Çalışırken |
|
Key:
min: | |
| Dell XPS 13 9310 OLED i7-1185G7, Iris Xe G7 96EUs, Toshiba XG6 KXG60ZNV512G, OLED, 3456x2160, 13.4" | Dell XPS 13 9310 Core i7 4K i7-1185G7, Iris Xe G7 96EUs, Micron 2300 512GB MTFDHBA512TDV, IPS, 3840x2400, 13.4" | Dell XPS 13 9310 Core i7 FHD i7-1165G7, Iris Xe G7 96EUs, Micron 2300 512GB MTFDHBA512TDV, IPS, 1920x1200, 13.4" | Dell XPS 13 7390 Core i7-10710U i7-10710U, UHD Graphics 620, SK Hynix PC601 NVMe 512 GB, IPS, 3840x2160, 13.3" | MSI Summit E13 Flip Evo A11MT i7-1185G7, Iris Xe G7 96EUs, Phison 1TB SM2801T24GKBB4S-E162, IPS, 1920x1200, 13.4" | |
|---|---|---|---|---|---|
| Power Consumption | -1% | 17% | 2% | -13% | |
| Idle Minimum * (Watt) | 5.7 | 4.3 25% | 3.9 32% | 4.7 18% | 4.8 16% |
| Idle Average * (Watt) | 6 | 8.3 -38% | 5.9 2% | 8.3 -38% | 8.4 -40% |
| Idle Maximum * (Watt) | 12.3 | 8.8 28% | 6.3 49% | 9 27% | 8.6 30% |
| Load Average * (Watt) | 44.4 | 46.2 -4% | 39.7 11% | 42 5% | 47.1 -6% |
| Witcher 3 ultra * (Watt) | 36.5 | 42.2 -16% | 34.8 5% | 51.6 -41% | |
| Load Maximum * (Watt) | 47.8 | 47.3 1% | 47.5 1% | 49 -3% | 65.9 -38% |
* ... daha küçük daha iyidir
Pil ömrü
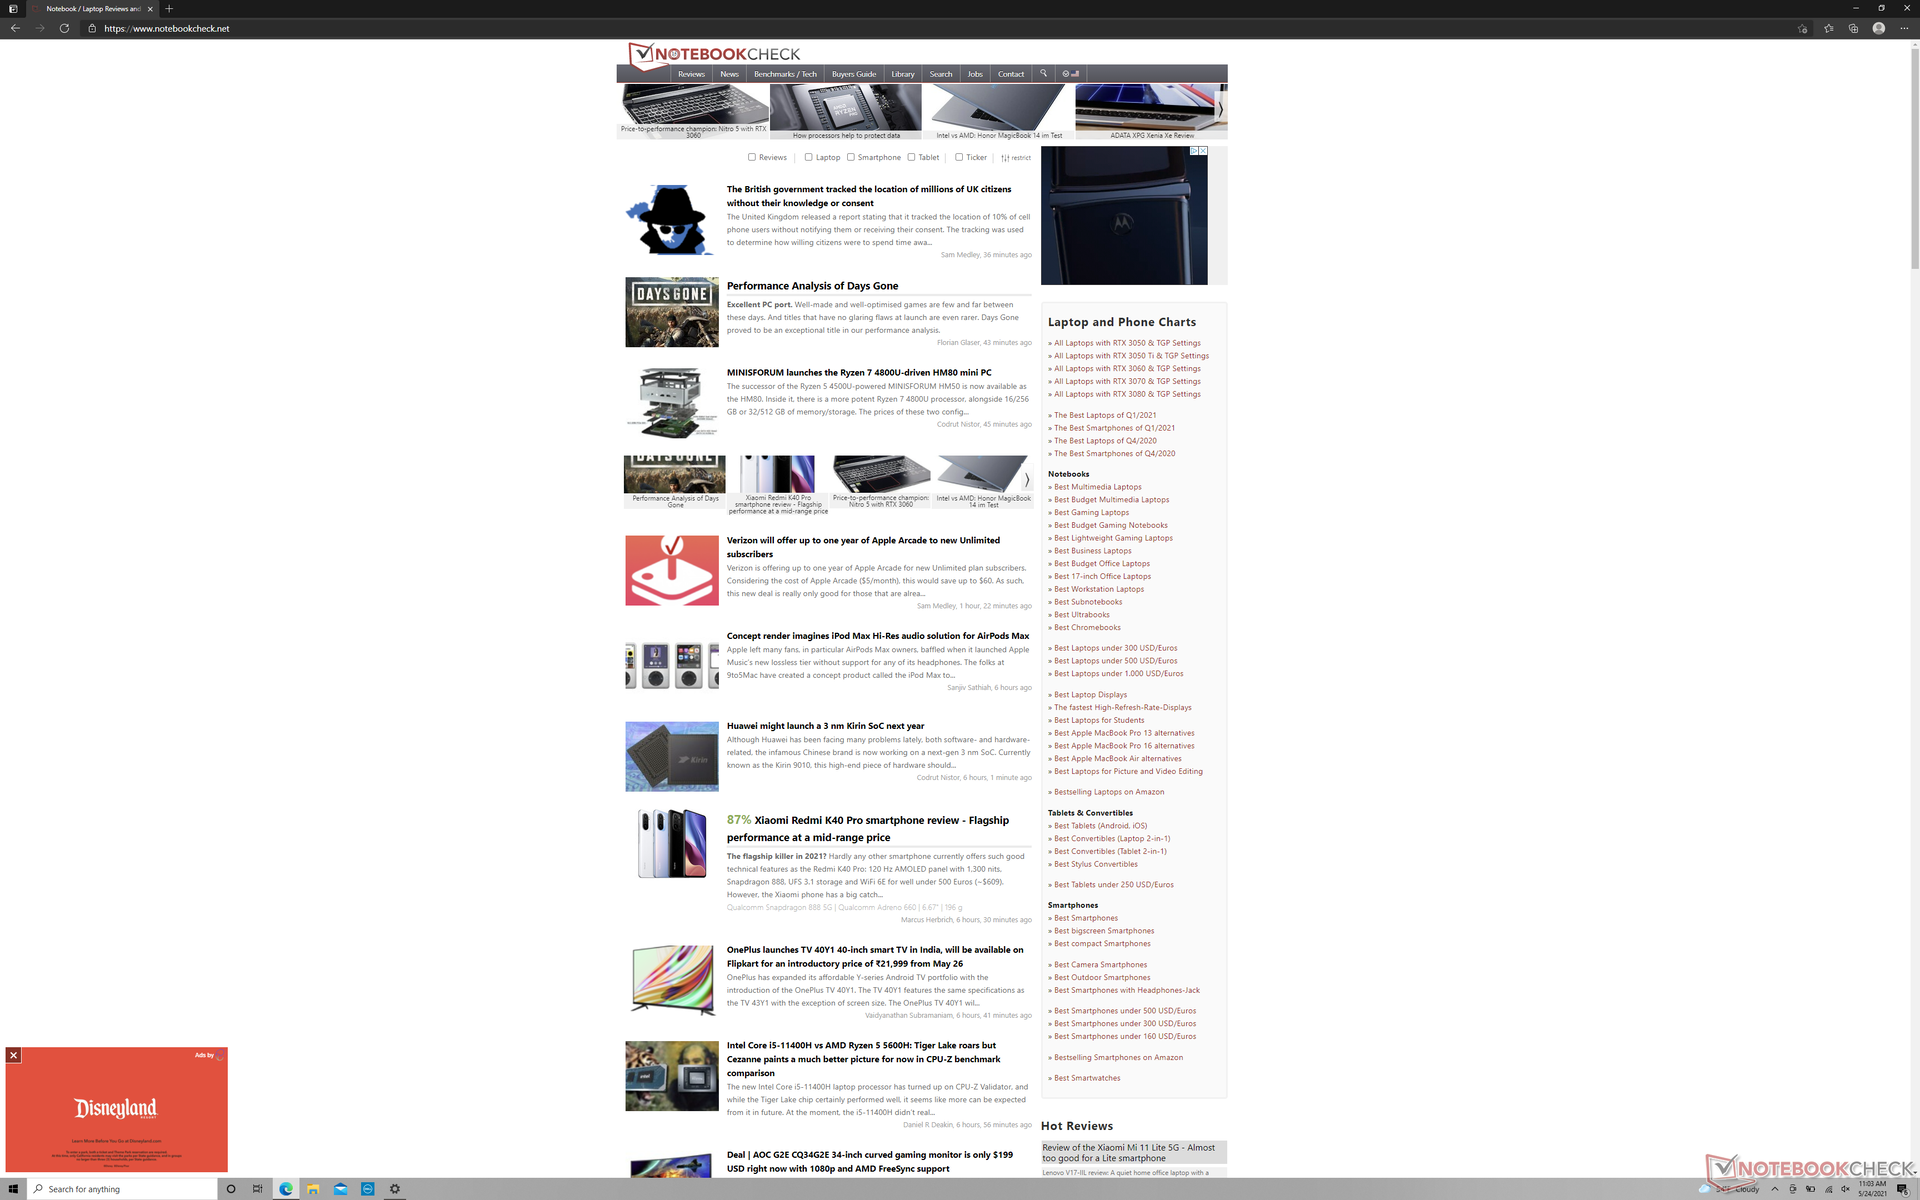
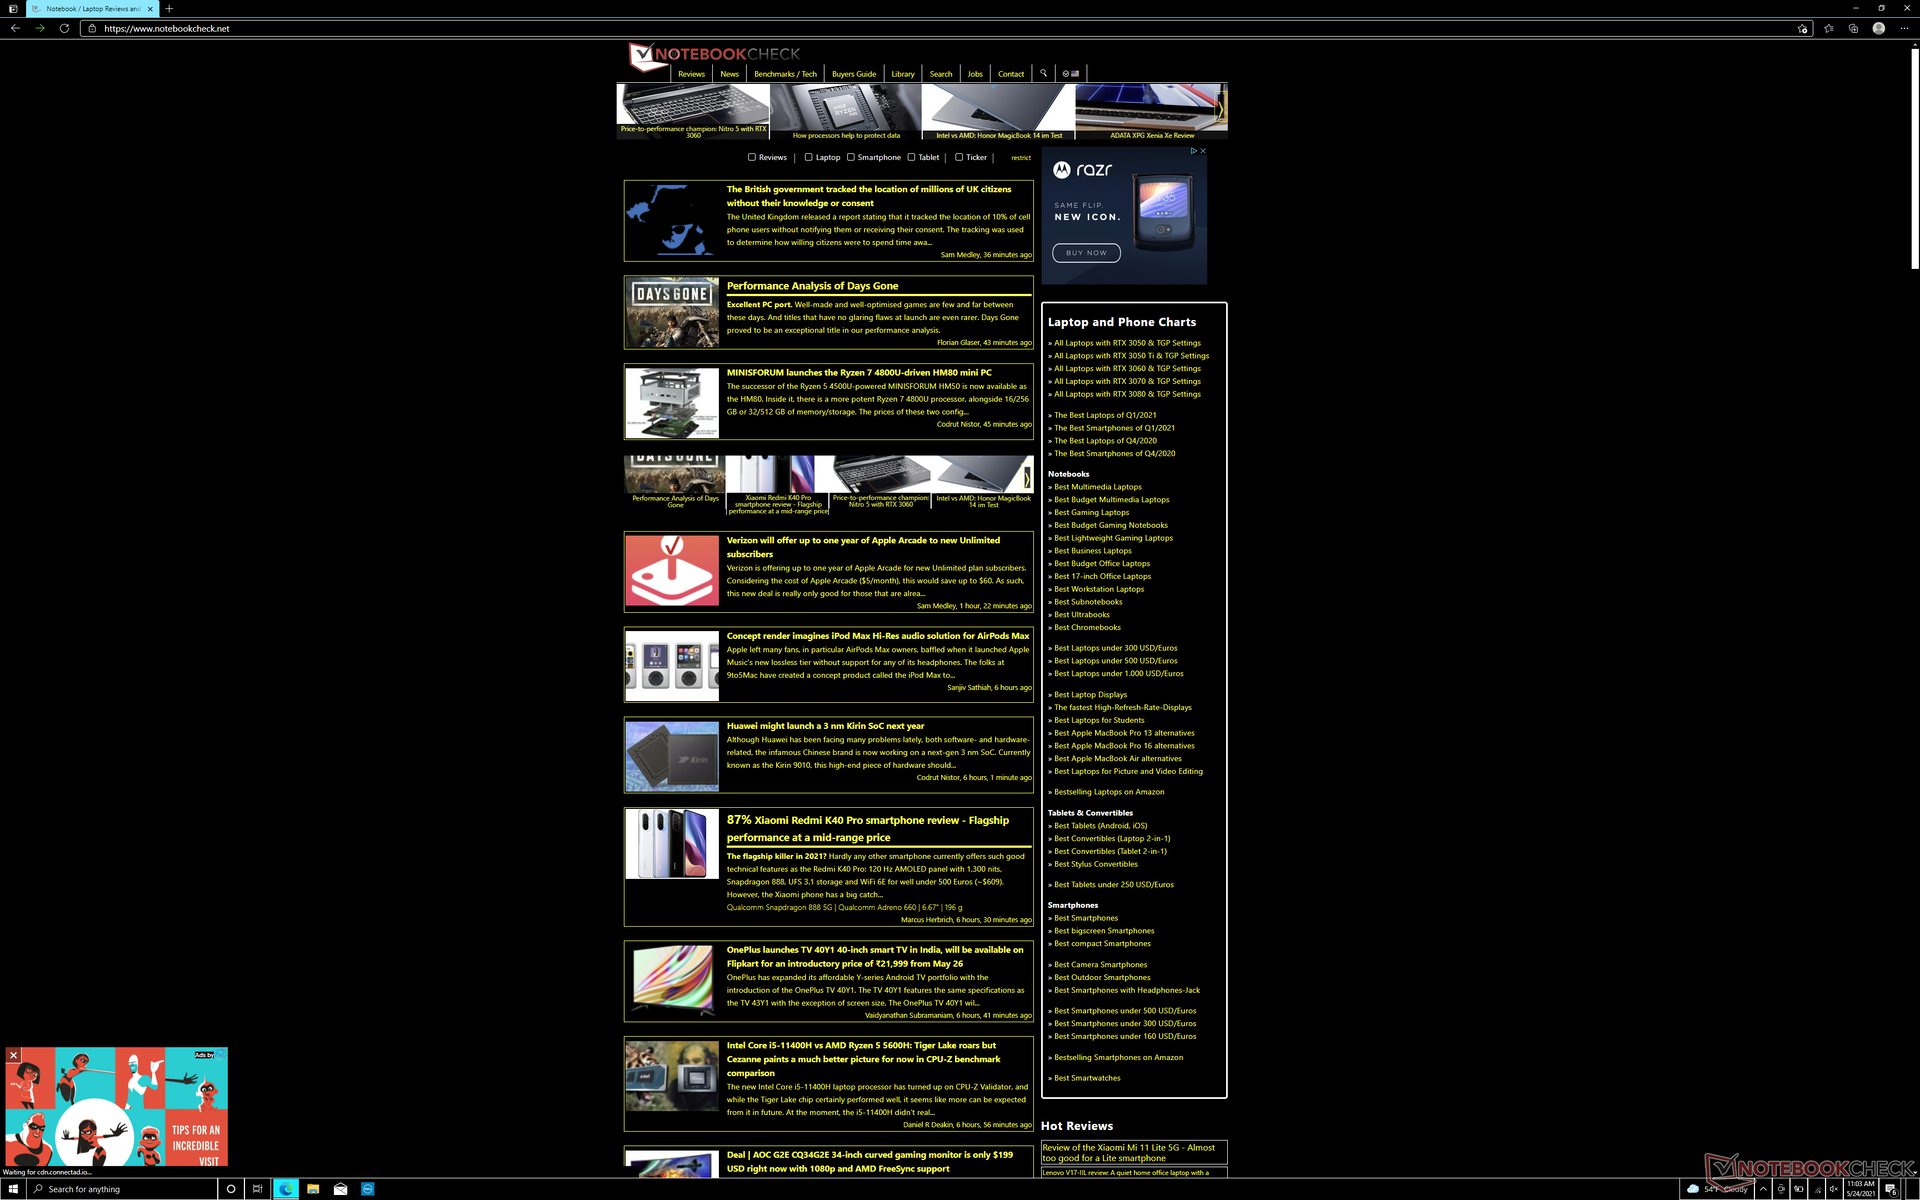
Çalışma süreleri, yukarıdaki güç tüketimi bulgularımızın kanıtladığı gibi, parlaklığa ve renge büyük ölçüde bağlıdır. Ekranı 150 nit'e ayarlıyken Dengeli modda internette gezinirken, tam şarjla 6 saat 31 dakikalık bir çalışma süresi kaydedebildik. Aynı testi bunun yerine Windows Yüksek Karşıtlık Modu açıkken çalıştırırken, çalışma zamanları iki katına çıkarak 13 saat 40 dakikaya kadar uzayacaktı. Yüksek kontrast modu elbette her zaman ideal değildir, ancak ekranı daha koyu renklere değiştirerek pil ömrünün ne kadar uzatılabileceğini göstermeye yardımcı olur. Bu, bu senaryolarda ekranın çoğu beyaz olduğundan, özellikle web'de veya sözcük işlemede gezinirken geçerlidir.
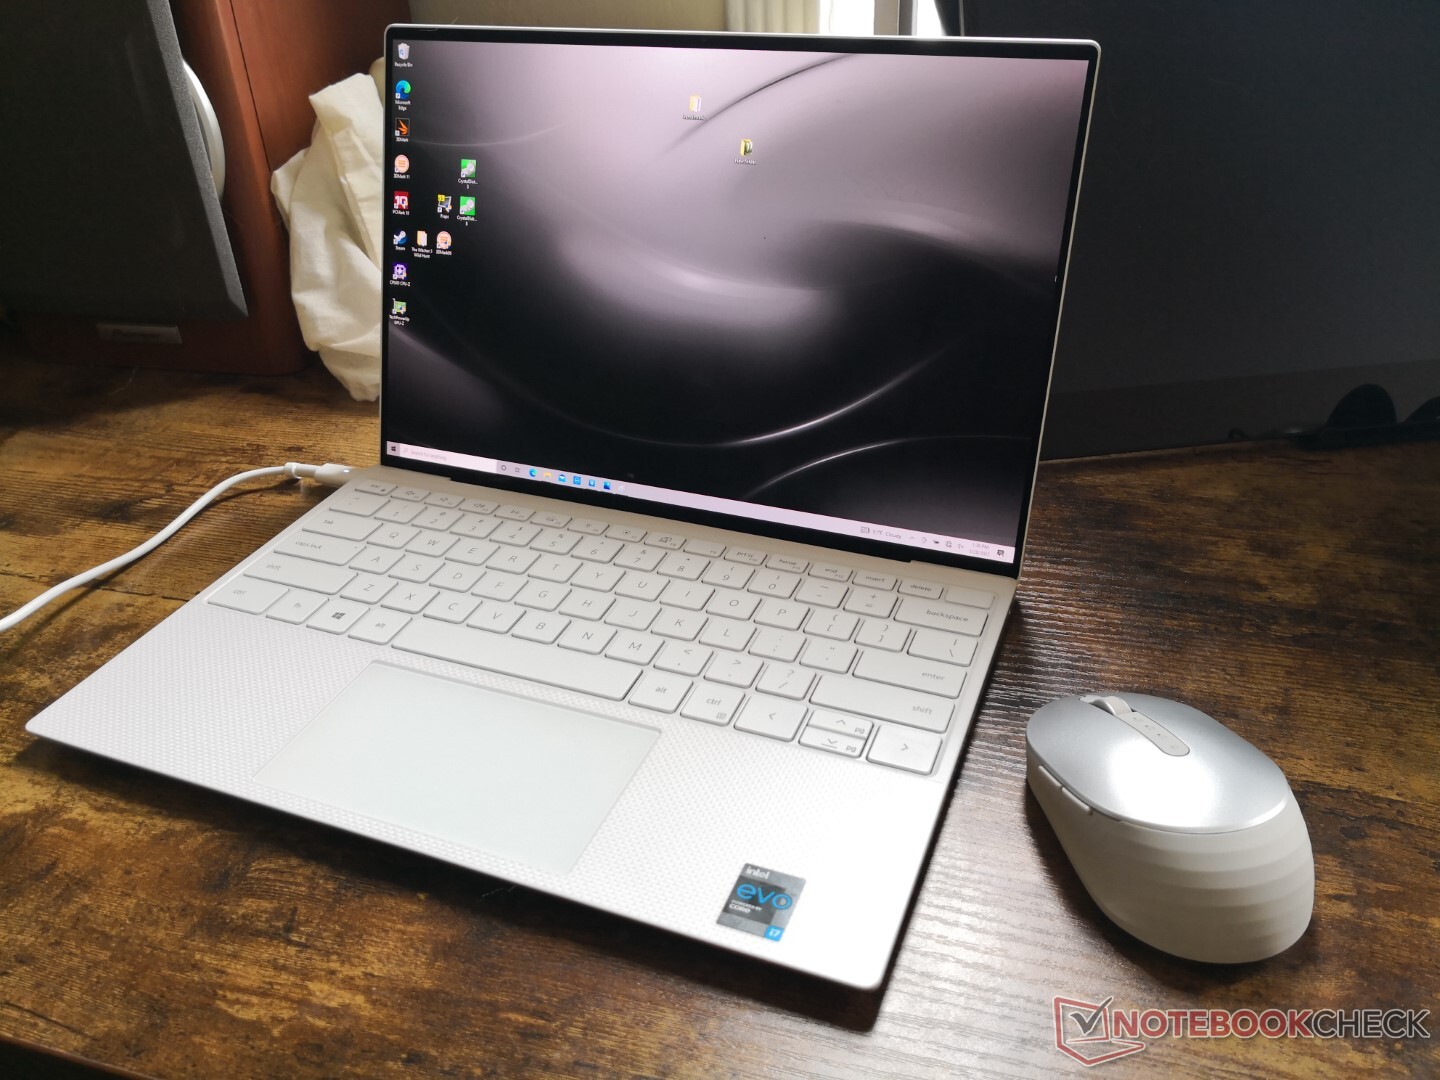
Pil ömrü, XPS 13 4K IPS SKU'dan ve özellikle farkın birkaç saat olabileceği XPS 13 FHD IPS SKU'dan belirgin şekilde daha kısadır. Uzun çalışma süreleri önemliyse daha koyu veya daha gri renk temaları önerilir. Belki de tesadüf değil, Dell varsayılan Windows duvar kağıdını ve gezgin pencerelerini, normal XPS 13 IPS SKU'larında ve diğer dizüstü bilgisayarların çoğunda her zaman gördüğümüz olağan parlak mavi ve beyaz yerine griye ayarladı.
| Dell XPS 13 9310 OLED i7-1185G7, Iris Xe G7 96EUs, 52 Wh | Dell XPS 13 9310 Core i7 4K i7-1185G7, Iris Xe G7 96EUs, 52 Wh | Dell XPS 13 9310 Core i7 FHD i7-1165G7, Iris Xe G7 96EUs, 52 Wh | Dell XPS 13 7390 Core i7-10710U i7-10710U, UHD Graphics 620, 52 Wh | MSI Summit E13 Flip Evo A11MT i7-1185G7, Iris Xe G7 96EUs, 70 Wh | |
|---|---|---|---|---|---|
| Pil Çalışma Süresi | 11% | 69% | 29% | 72% | |
| WiFi v1.3 (h) | 6.5 | 7.2 11% | 11 69% | 8.4 29% | 11.2 72% |
| Reader / Idle (h) | 30 | 21.1 | |||
| Load (h) | 3.2 | 1.8 |
Artılar
Eksiler
Son Görüş
En son HP Spectre x360 13 ile karar kıldığımz gibi, OLED, ekranlar söz konusu olduğunda tüm teknolojinin sonu değil. IPS'ye göre kesinlikle avantajları var, ancak dezavantajları listesi tartışmasız aynı derecede önemli.
En büyük ve en belirgin avantajlar resim kalitesiyle ilgilidir. OLED'in fark edilir derecede daha iyi bir görüntüleme deneyimi için üstün renkler, siyah seviyeleri ve siyah-beyaz/gri-gri tepki süreleri sunduğu tartışılmaz. Bu, günlük iş yükleriniz için önemli bir lüksse, OLED, IPS'den çok daha çekici görünecektir.
OLED'in görsel avantajlarının fark edilmesi kolay, ancak diğer alanlarda birkaç ödün veriyor.
OLED dezavantajları genellikle belirgin değildir ve ilk bakışta fark edilemez. İlk olarak, hem parlaklık hem de çözünürlük, XPS 13 4K seçeneğine göre sırasıyla daha sönük ve daha düşüktür. İkinci olarak, potansiyel olarak daha belirgin bir titreme için daha düşük frekanslarda darbe genişlik modülasyonu mevcuttur. Ve son olarak, güç tüketimi, IPS'ye göre potansiyel olarak daha kısa pil ömrü için mevcut renklere ve parlaklığa bağlı olarak daha fazla değişiklik gösterecektir.
XPS 13 OLED'in maliyetinin XPS 13 4K IPS ile hemen hemen aynı olduğunu unutmayın. Böylece, önceki birçok OLED dizüstü bilgisayarın aksine, kullanıcıların artık yalnızca bir OLED panelinin lüksü için yüksek primler ödemeleri gerekmiyor. Bu, kullanıcılar artıları ve eksileri konusunda eğitildikleri sürece, günümüzde OLED'in önerilmesini kolaylaştırıyor.
Fiyat ve Bulunabilirlik
Dell, XPS 13 9310 OLED SKU'yu kısa süre önce piyasaya sürdü ve bu yazı yazıldığı gibi çoğu perakendecide henüz yaygın olarak bulunmuyor. Sistem şu anda Best Buy'da 1949 ABD Doları karşılığında stokta yok, yani şu anda bir OLED SKU için en iyi seçeneğiniz doğrudan Dell.com üzerinden sipariş vermektir.
Dell XPS 13 9310 OLED
- 08/31/2022 v7 (old)
Allen Ngo
Price comparison

