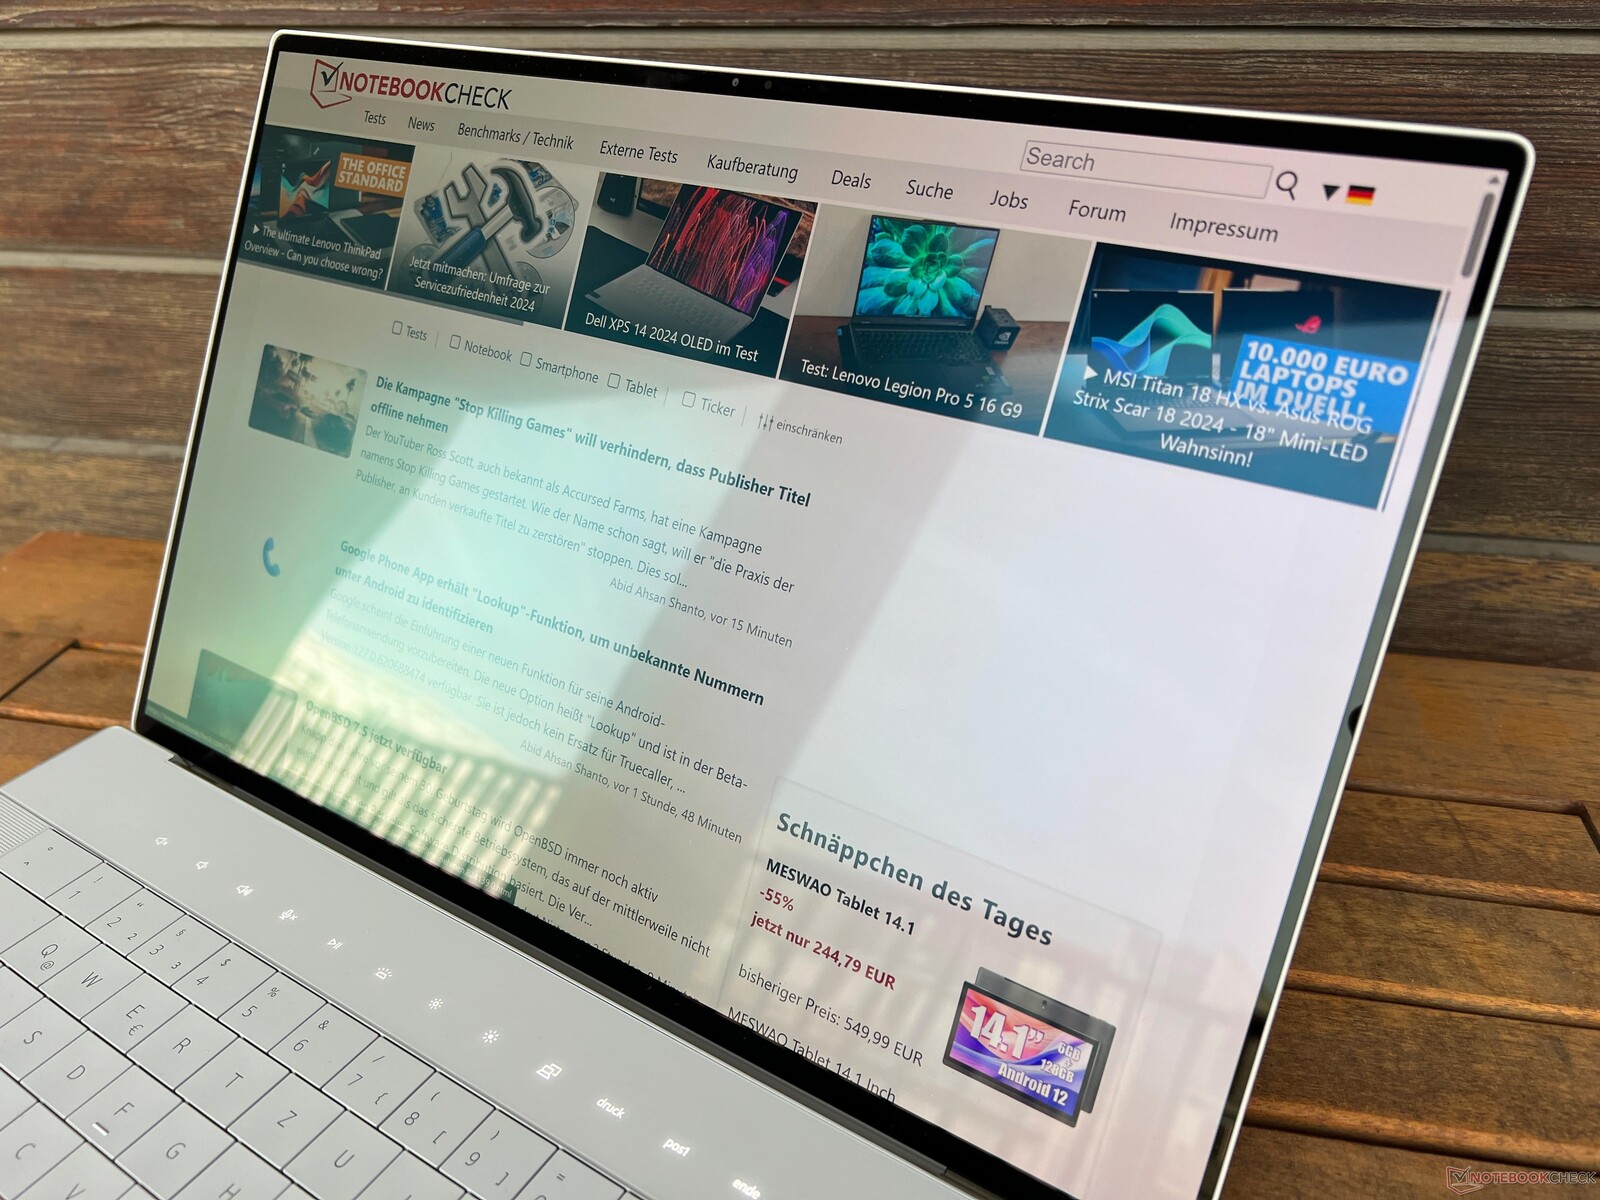
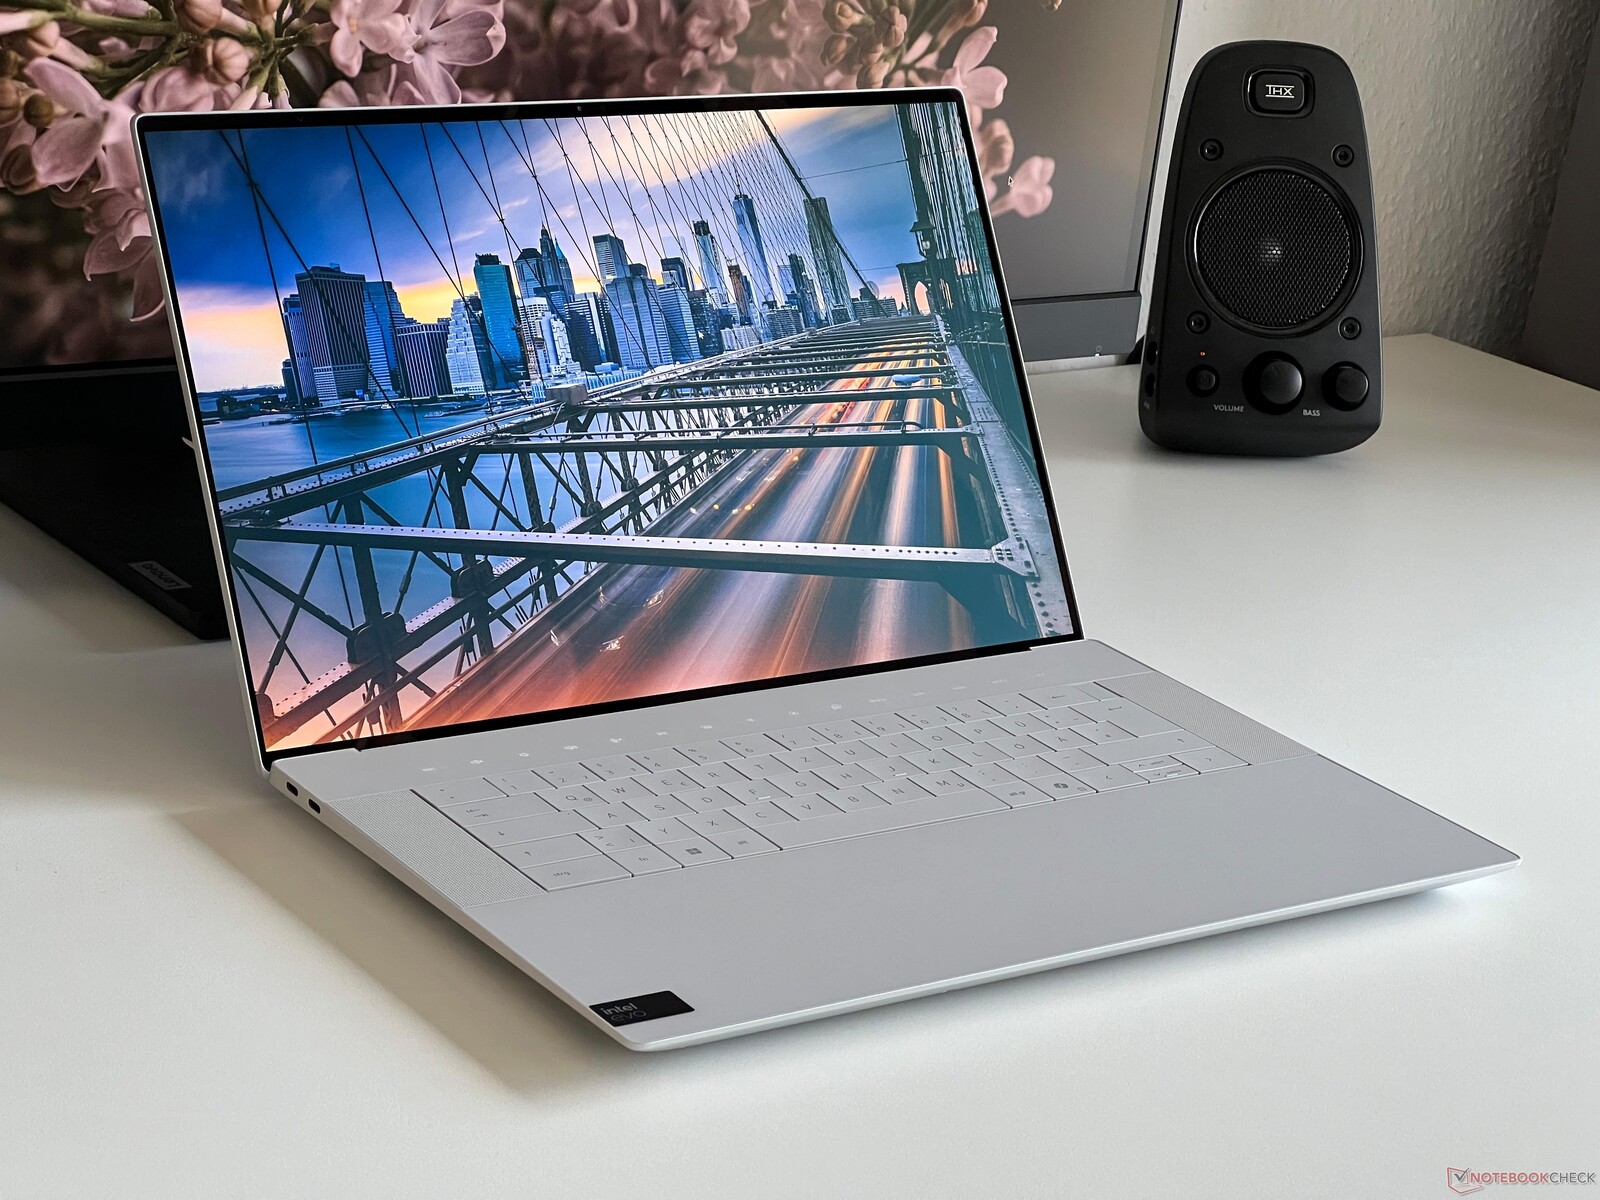
Dell XPS 16 9640 incelemesi - 4K OLED ve sinir bozucu bir dokunmatik çubuğa sahip multimedya dizüstü bilgisayar
Dell, tanınmış multimedya dizüstü bilgisayarı XPS 15'i iki yeni modelle değiştirdi: İlk olarak, daha kompakt Daha önce kapsamlı bir şekilde test ettiğimiz XPS 14-Ve konsepti bizim için epeyce soru işaretini ortaya çıkardı. Bugün, daha büyük olan 16 inçlik modele, yani XPS 16'ya bir göz atacağız. Genel olarak tarifi aynıdır ve Intel'in yeni Meteor Lake işlemcilerinin yanı sıra, Nvidia'nın özel grafik kartlarını kullanır - ancak bu sefer RTX 4070 Dizüstü Bilgisayara kadar daha güçlü modelleri de kullanır. Bu inceleme sırasında daha ayrıntılı olarak tartışacağımız bazı ek farklılıklar da var.
Test cihazımız, Core Ultra 7 155H, RTX 4070 Dizüstü Bilgisayar, 32 GB RAM, 1 TB SSD ve 2.899 ABD Doları karşılığında yüksek çözünürlüklü OLED dokunmatik ekran içeren iyi donanımlı bir yapılandırmadır. Sonuç olarak, XPS 16 diğer yüksek kaliteli multimedya dizüstü bilgisayarlar ve ROG Zephyrus G16 gibi oyun/multimedya hibritleriyle rekabet etmektedir.
Karşılaştırmalı olarak olası rakipler
Derecelendirme | Tarih | Modeli | Ağırlık | Yükseklik | Boyut | Çözünürlük | Fiyat |
|---|---|---|---|---|---|---|---|
| 88.6 % v7 (old) | 04/2024 | Dell XPS 16 9640 Ultra 7 155H, GeForce RTX 4070 Laptop GPU | 2.3 kg | 18.7 mm | 16.30" | 3840x2400 | |
| 90.4 % v7 (old) | 03/2024 | Samsung Galaxy Book4 Ultra Ultra 7 155H, GeForce RTX 4050 Laptop GPU | 1.8 kg | 17 mm | 16.00" | 2880x1800 | |
| 90 % v7 (old) | 03/2024 | Honor MagicBook Pro 16 2024 Ultra 7 155H, GeForce RTX 4060 Laptop GPU | 1.9 kg | 17.9 mm | 16.00" | 3072x1920 | |
| 92.3 % v7 (old) | 02/2024 | Asus ROG Zephyrus G16 2024 GU605M Ultra 7 155H, GeForce RTX 4070 Laptop GPU | 1.8 kg | 16.4 mm | 16.00" | 2560x1600 | |
| 88.4 % v7 (old) | Lenovo Yoga Pro 9 16-IRP G8 i7-13705H, GeForce RTX 4060 Laptop GPU | 2.2 kg | 18.2 mm | 16.00" | 3200x2000 | ||
| 88.6 % v7 (old) | 11/2023 | Schenker VISION 16 Pro (M23) i7-13700H, GeForce RTX 4070 Laptop GPU | 1.6 kg | 17.1 mm | 16.00" | 2560x1600 | |
| 90.3 % v7 (old) | 06/2023 | Dell XPS 15 9530 RTX 4070 i7-13700H, GeForce RTX 4070 Laptop GPU | 1.9 kg | 18 mm | 15.60" | 3456x2160 |
Kasa - Sağlam alüminyum kasa
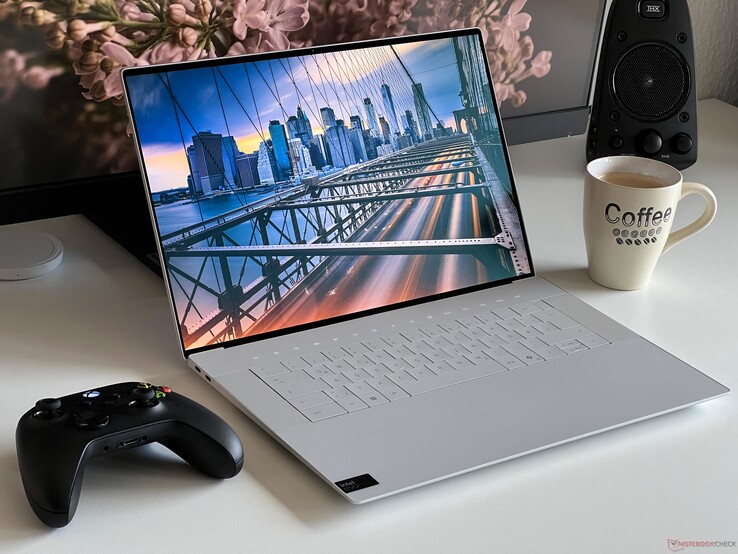
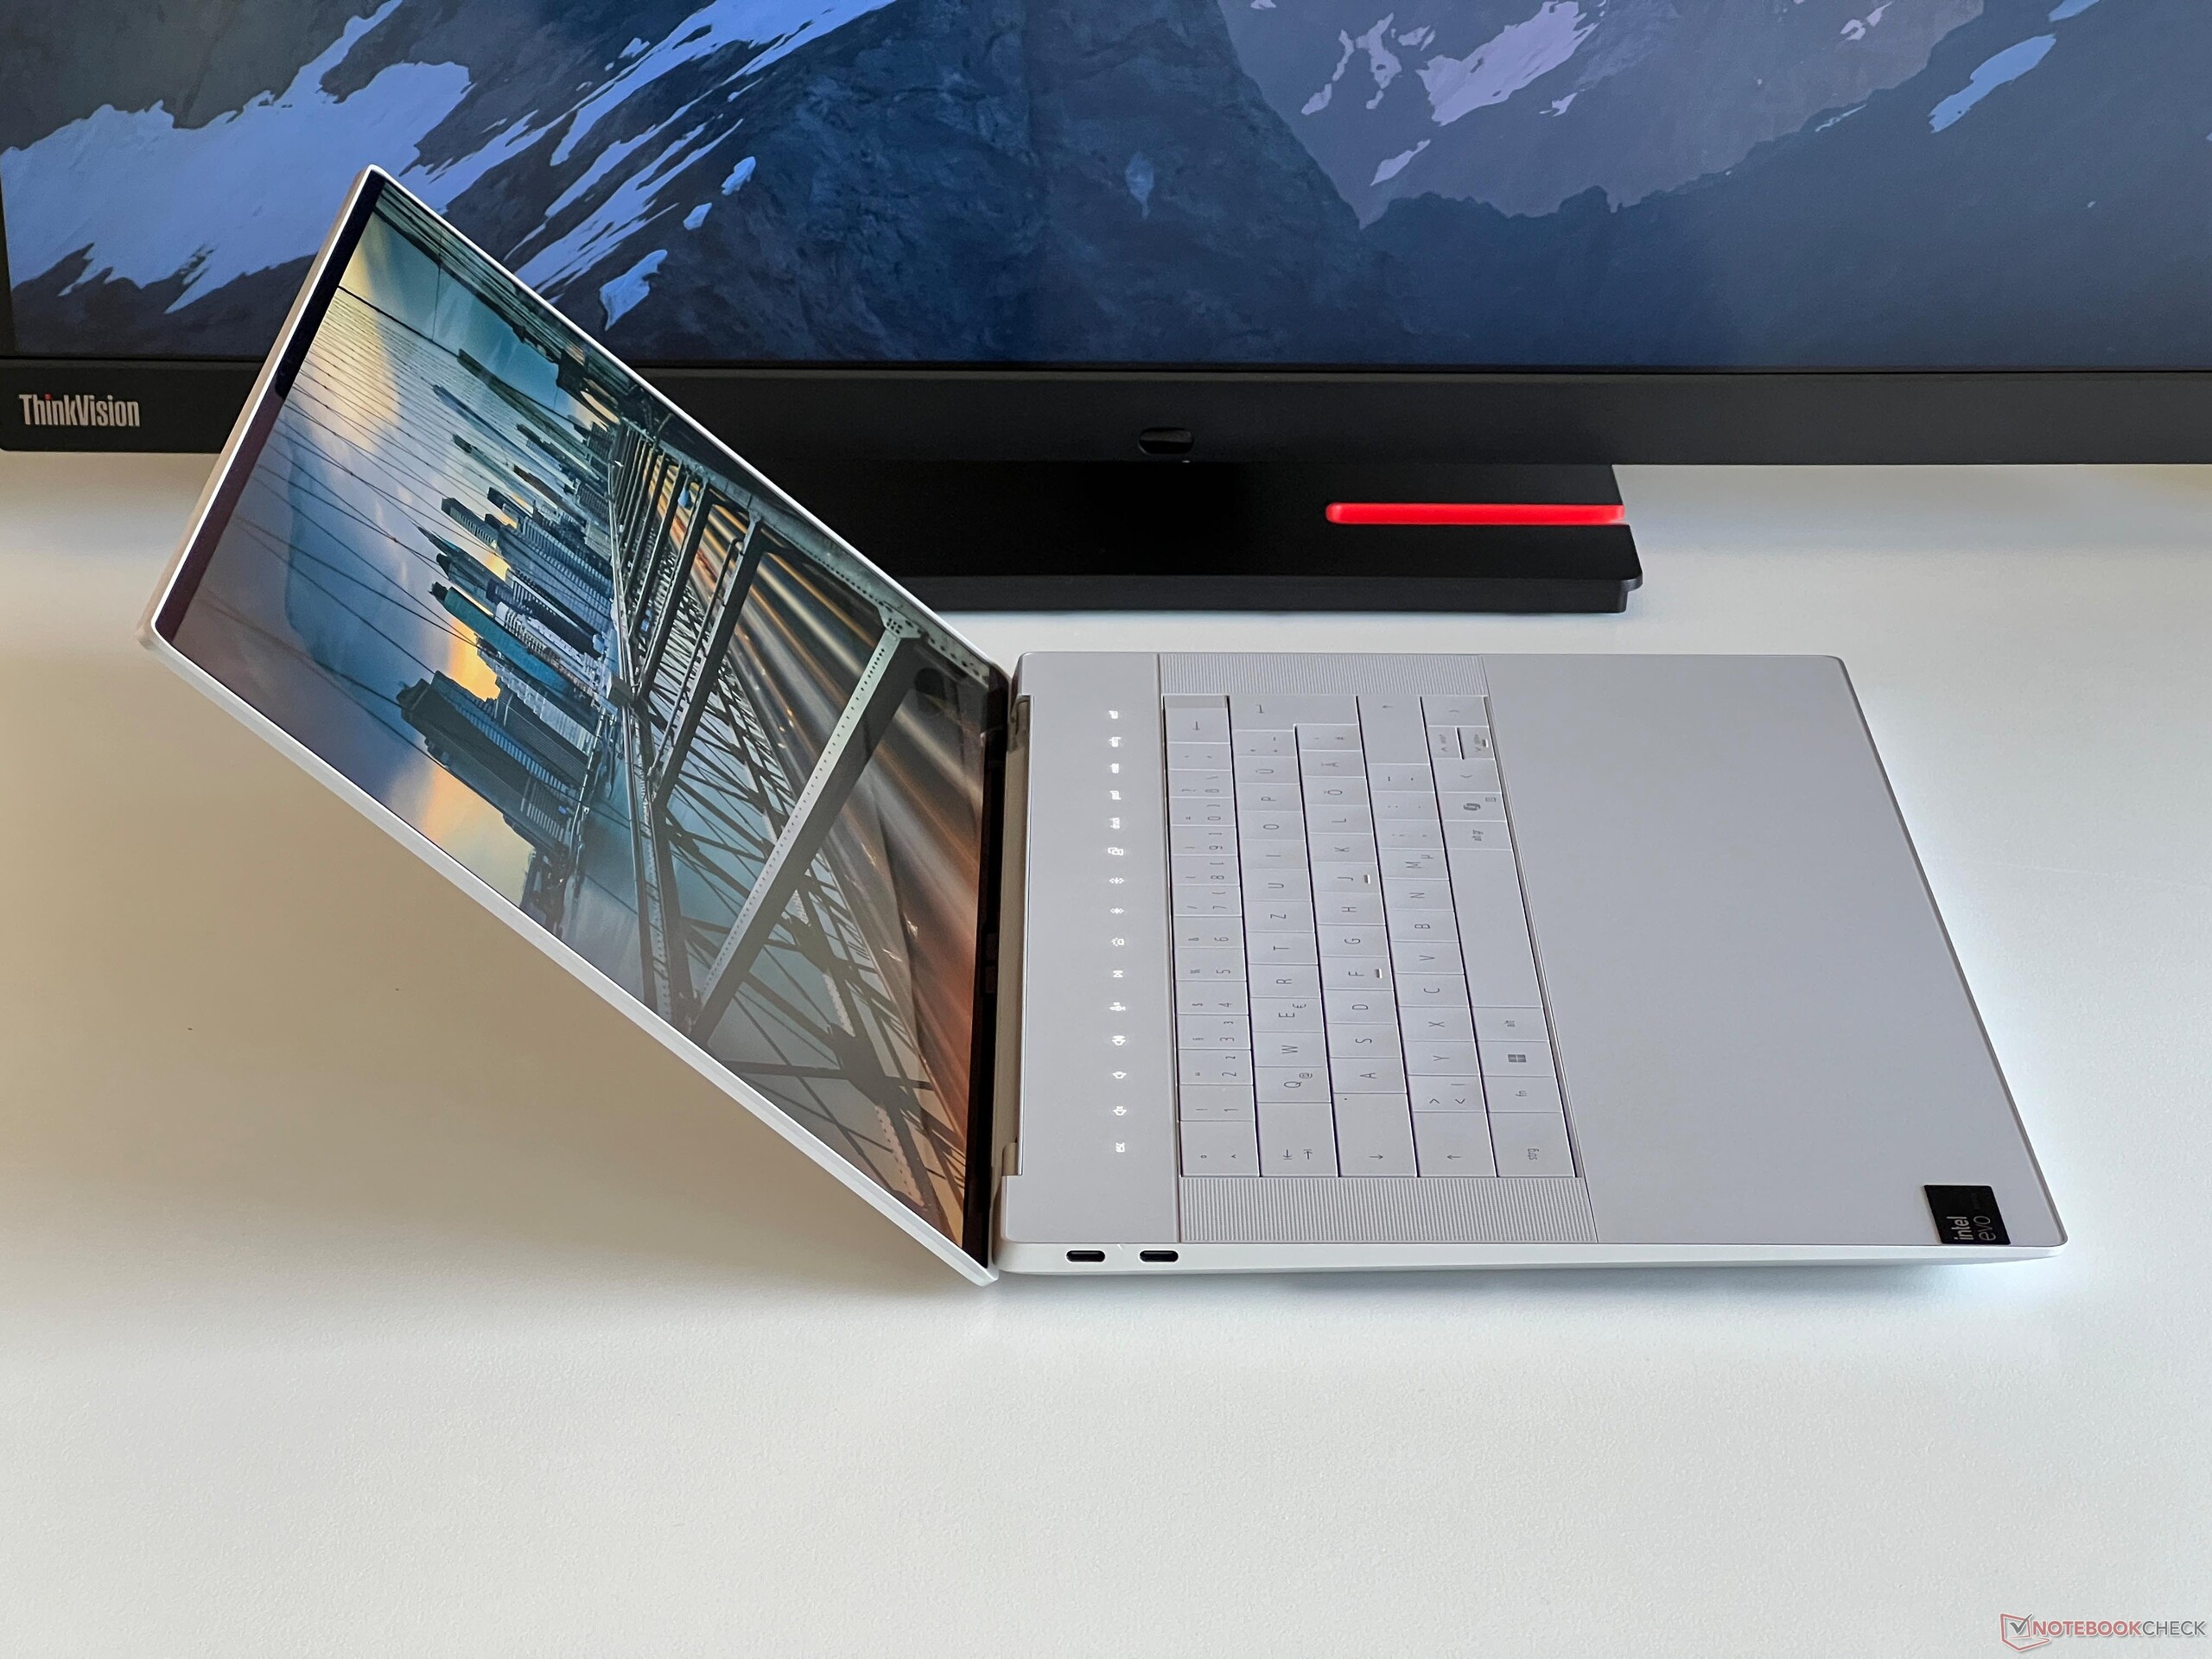
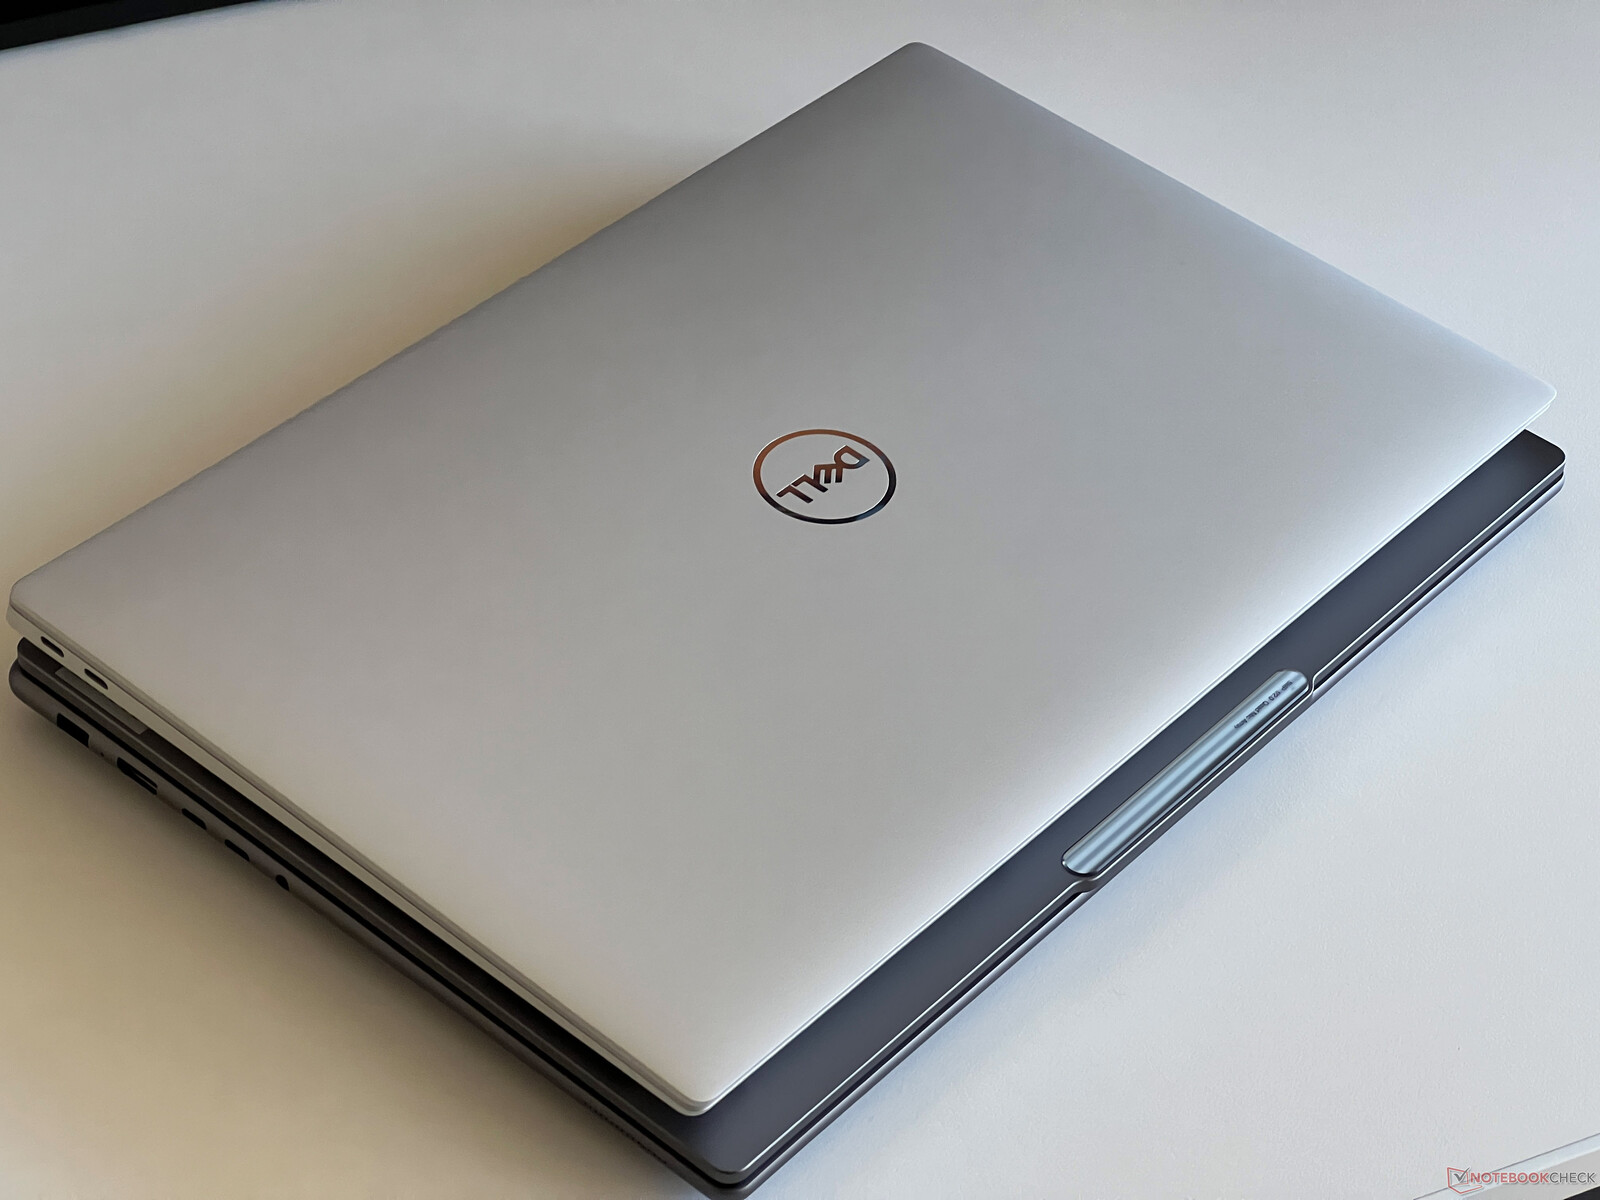
Dell, mevcut XPS serisinin üç varyantı için de aynı temel tasarımı kullanmıştır ve bu tasarımda XPS 13 Plus ve büyük, kesintisiz cam avuç içi dayanağı ve dokunmatik çubuk içeren sıra dışı klavyesi. Tasarım çekici ve bizim açık renkli versiyonumuzun yanı sıra Dell dizüstü bilgisayarın koyu gri bir versiyonunu da sunuyor. Çerçeveleri dört tarafta da ince ve bu da modern bir görünüm sağlıyor. XPS 16, daha büyük ayak izi nedeniyle, Dell kadar hantal görünmüyor daha küçük XPS 14.
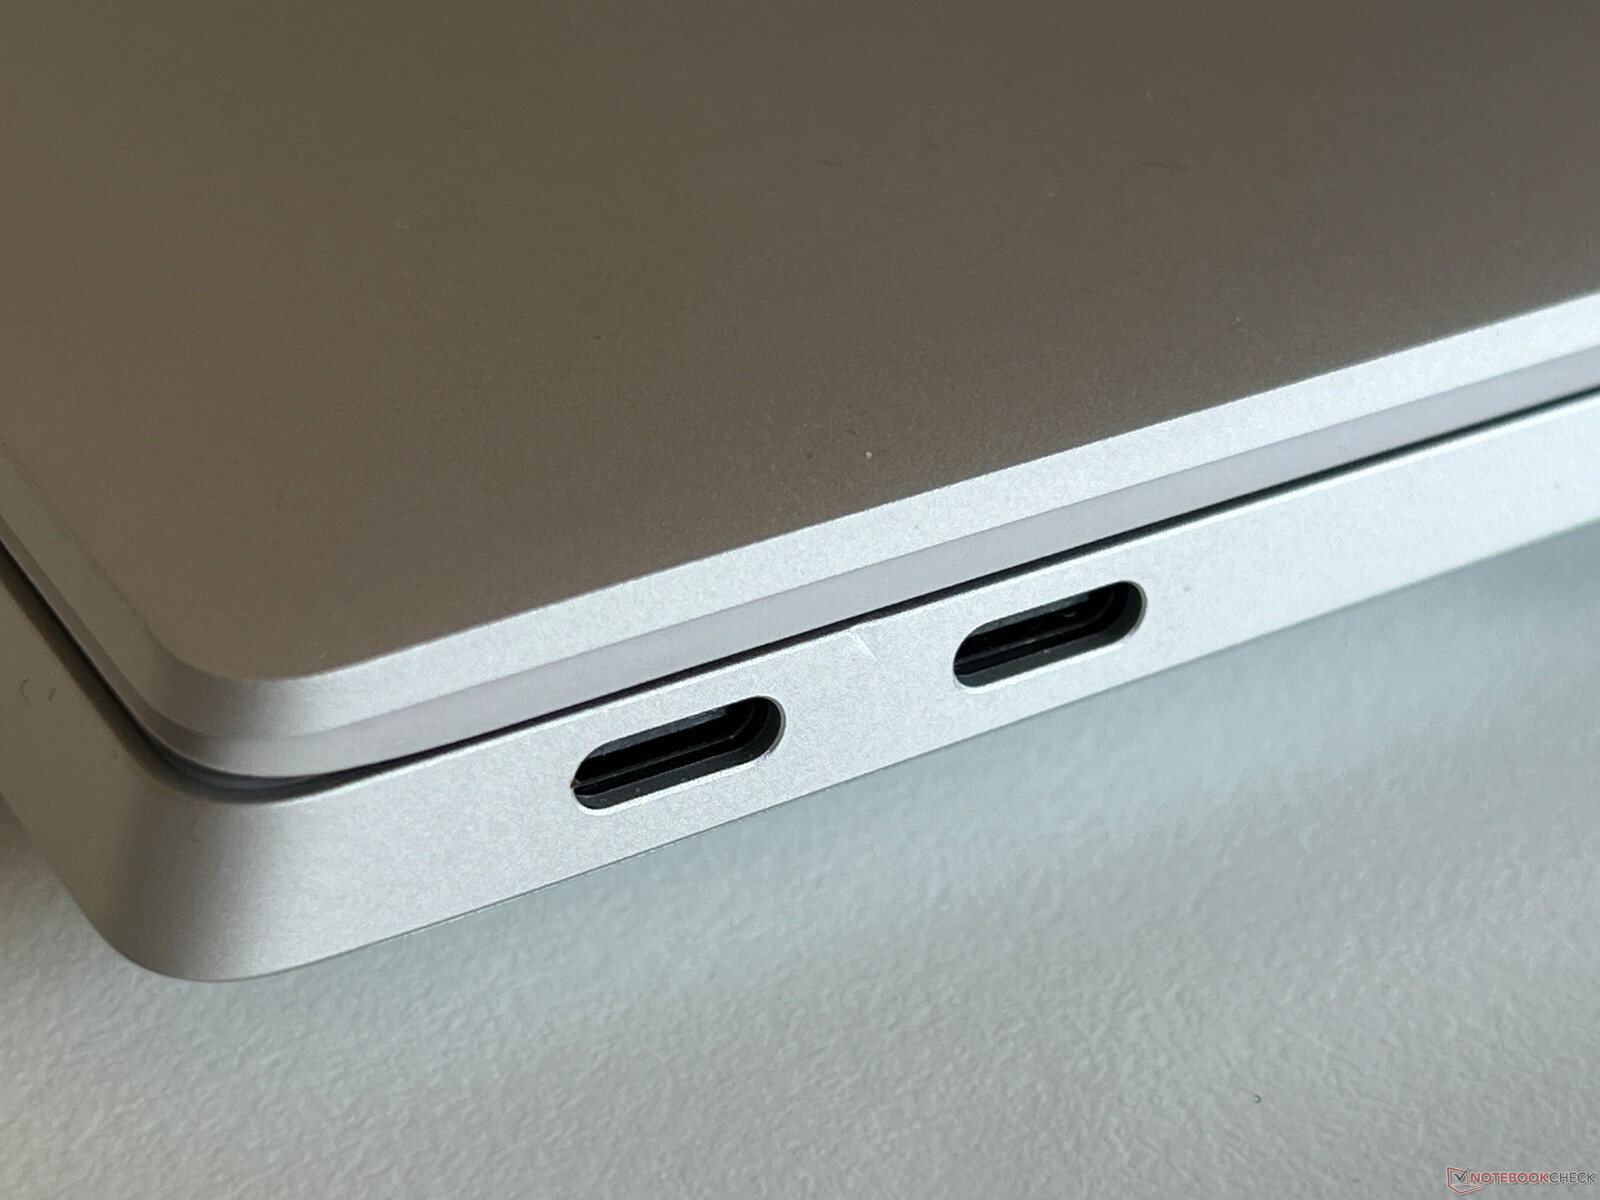
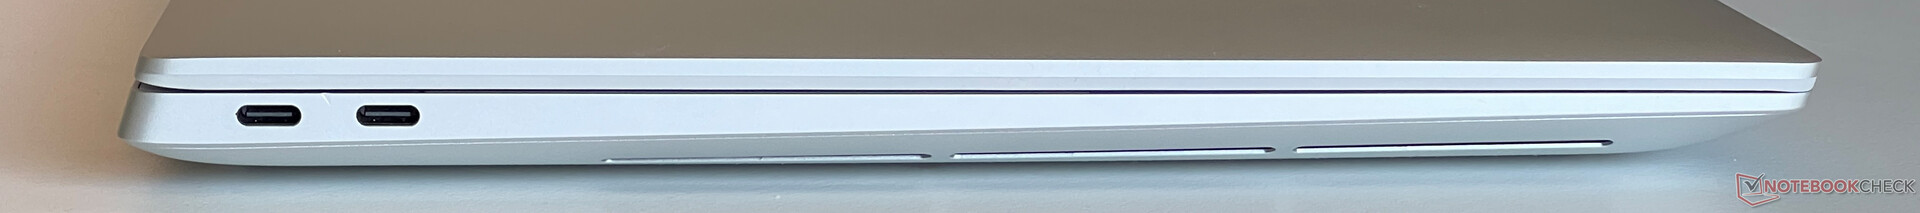
Kasa çok sağlam ve genel olarak çok iyi inşa edilmiş, ancak test cihazımızın sol tarafındaki iki USB-C bağlantı noktası arasında küçük bir kusur olduğunu fark ettik. Ekran da çok sağlam ve kapak, açılma açısı ayarlandığında (maks. 135 derece) sadece hafifçe zıplıyor. Ancak, ön kenarın şekli nedeniyle kapağı tek elle açmak zordur.
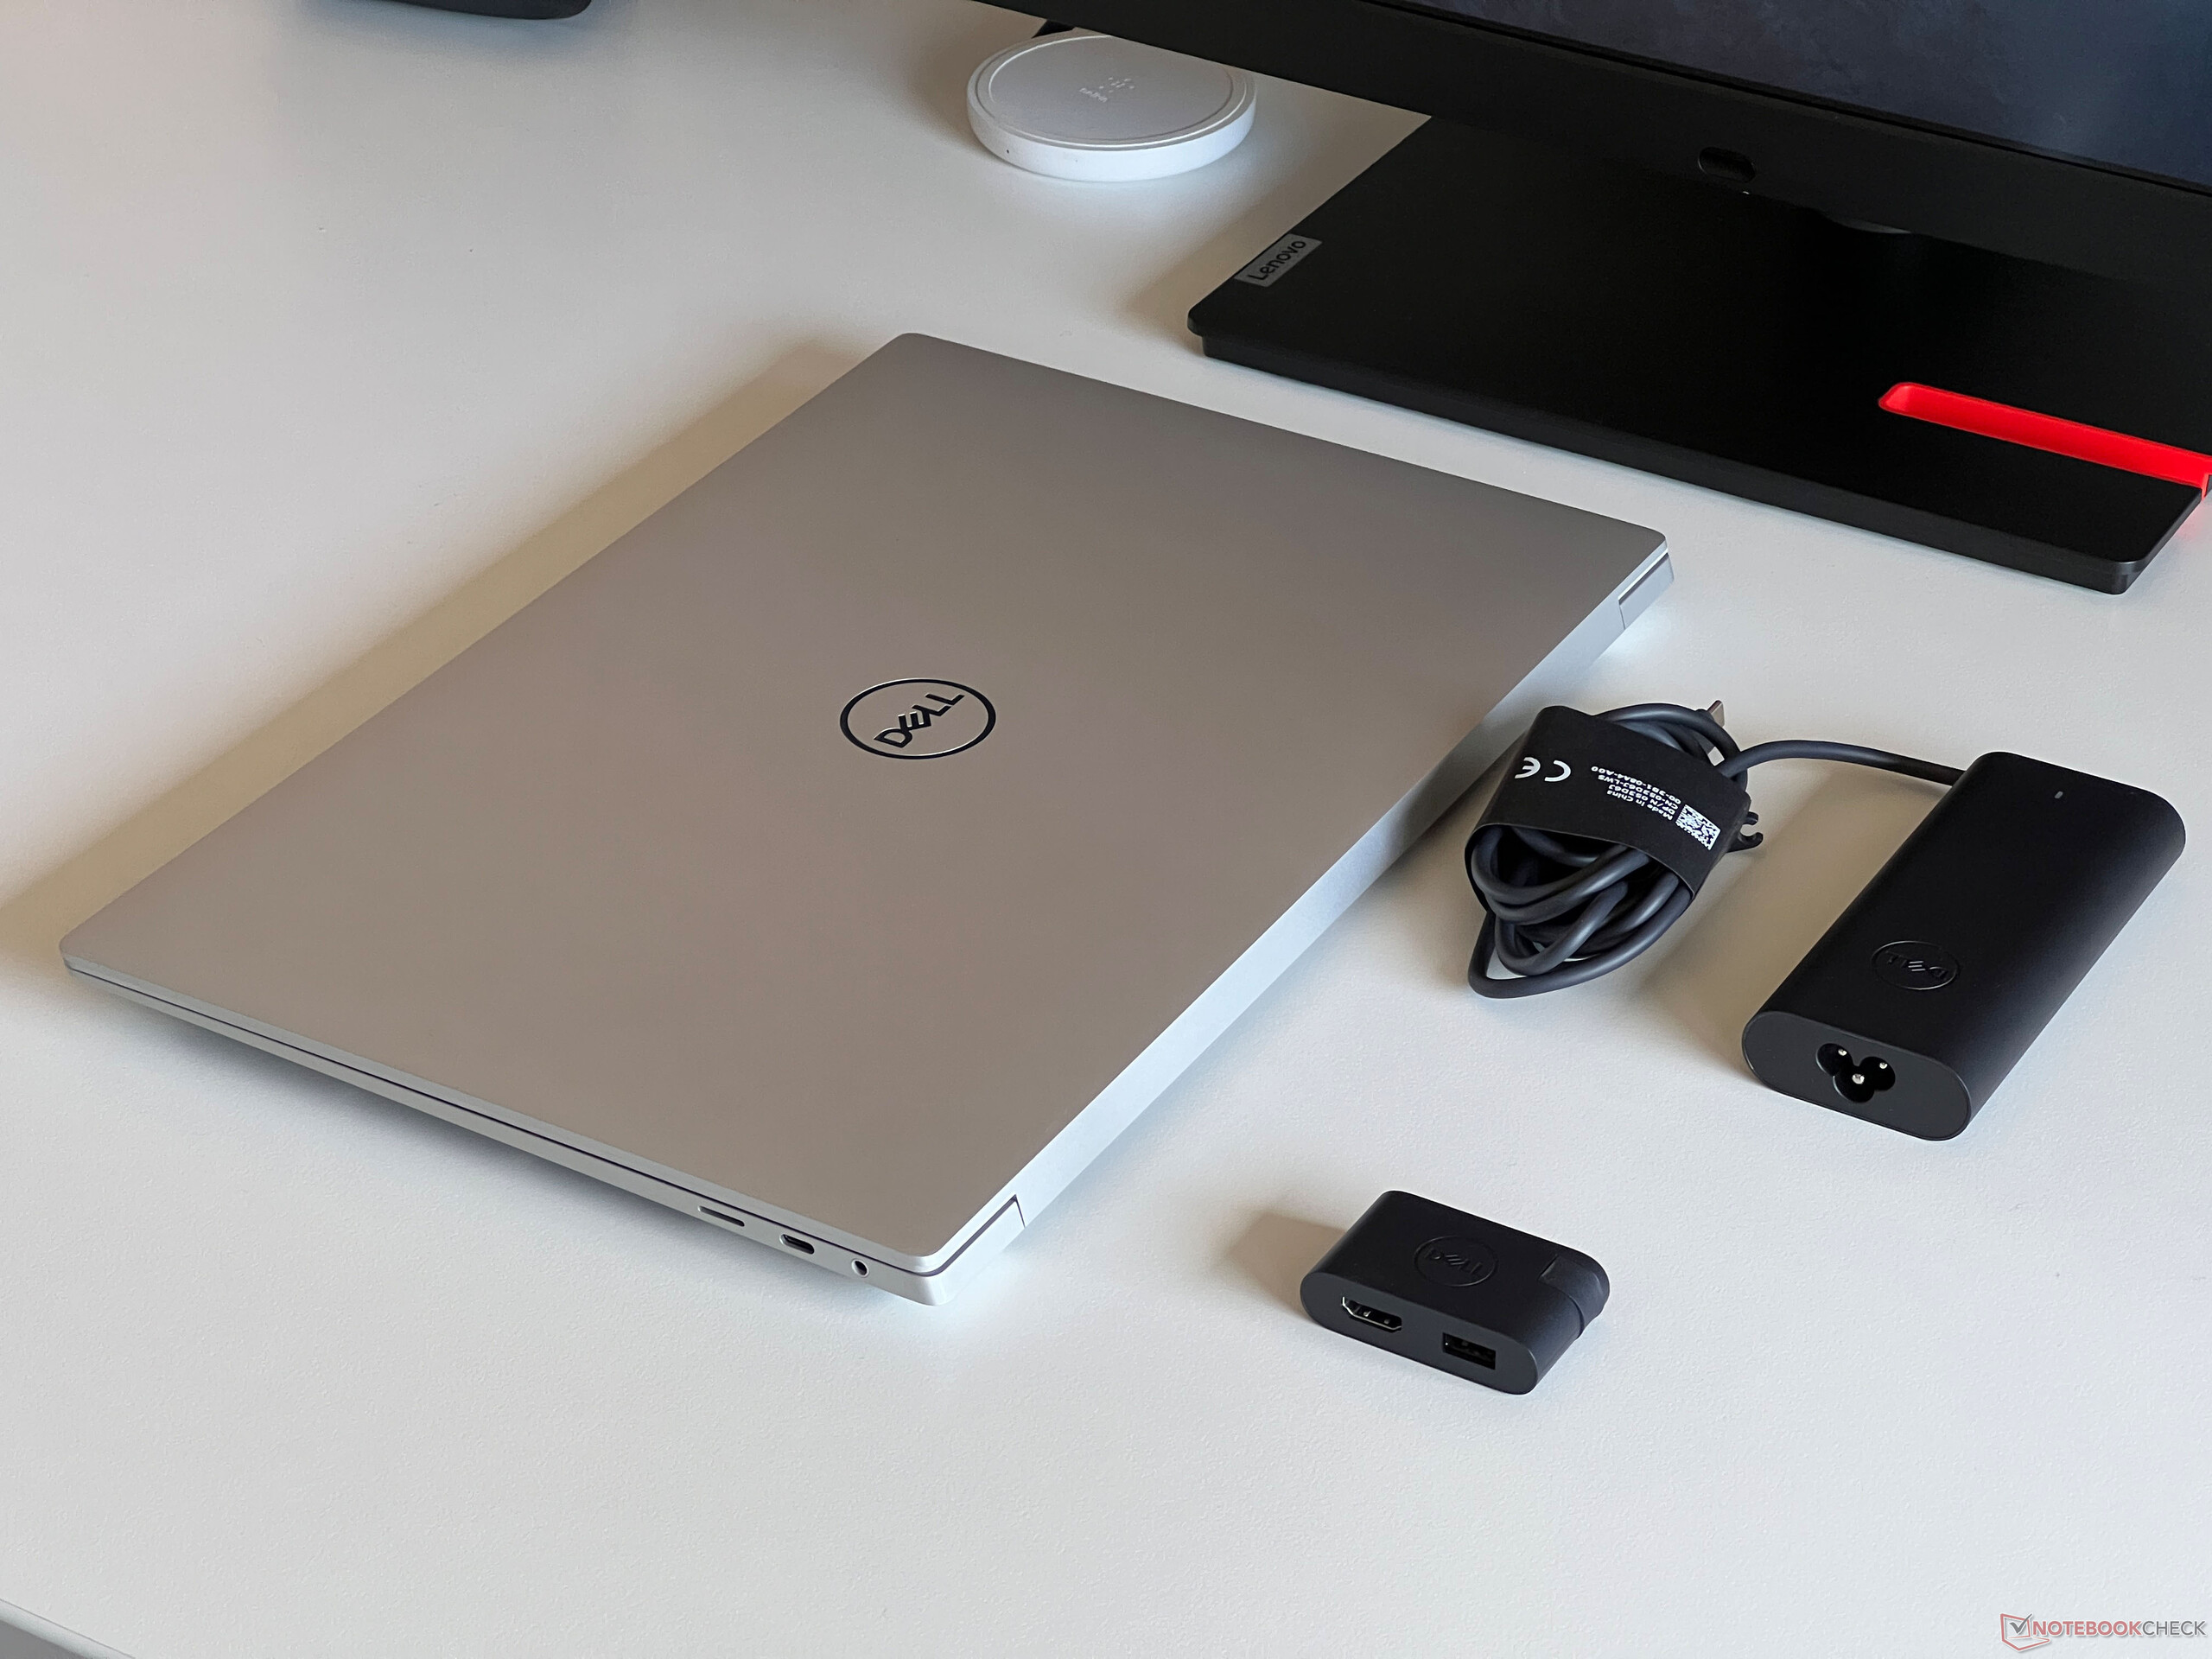
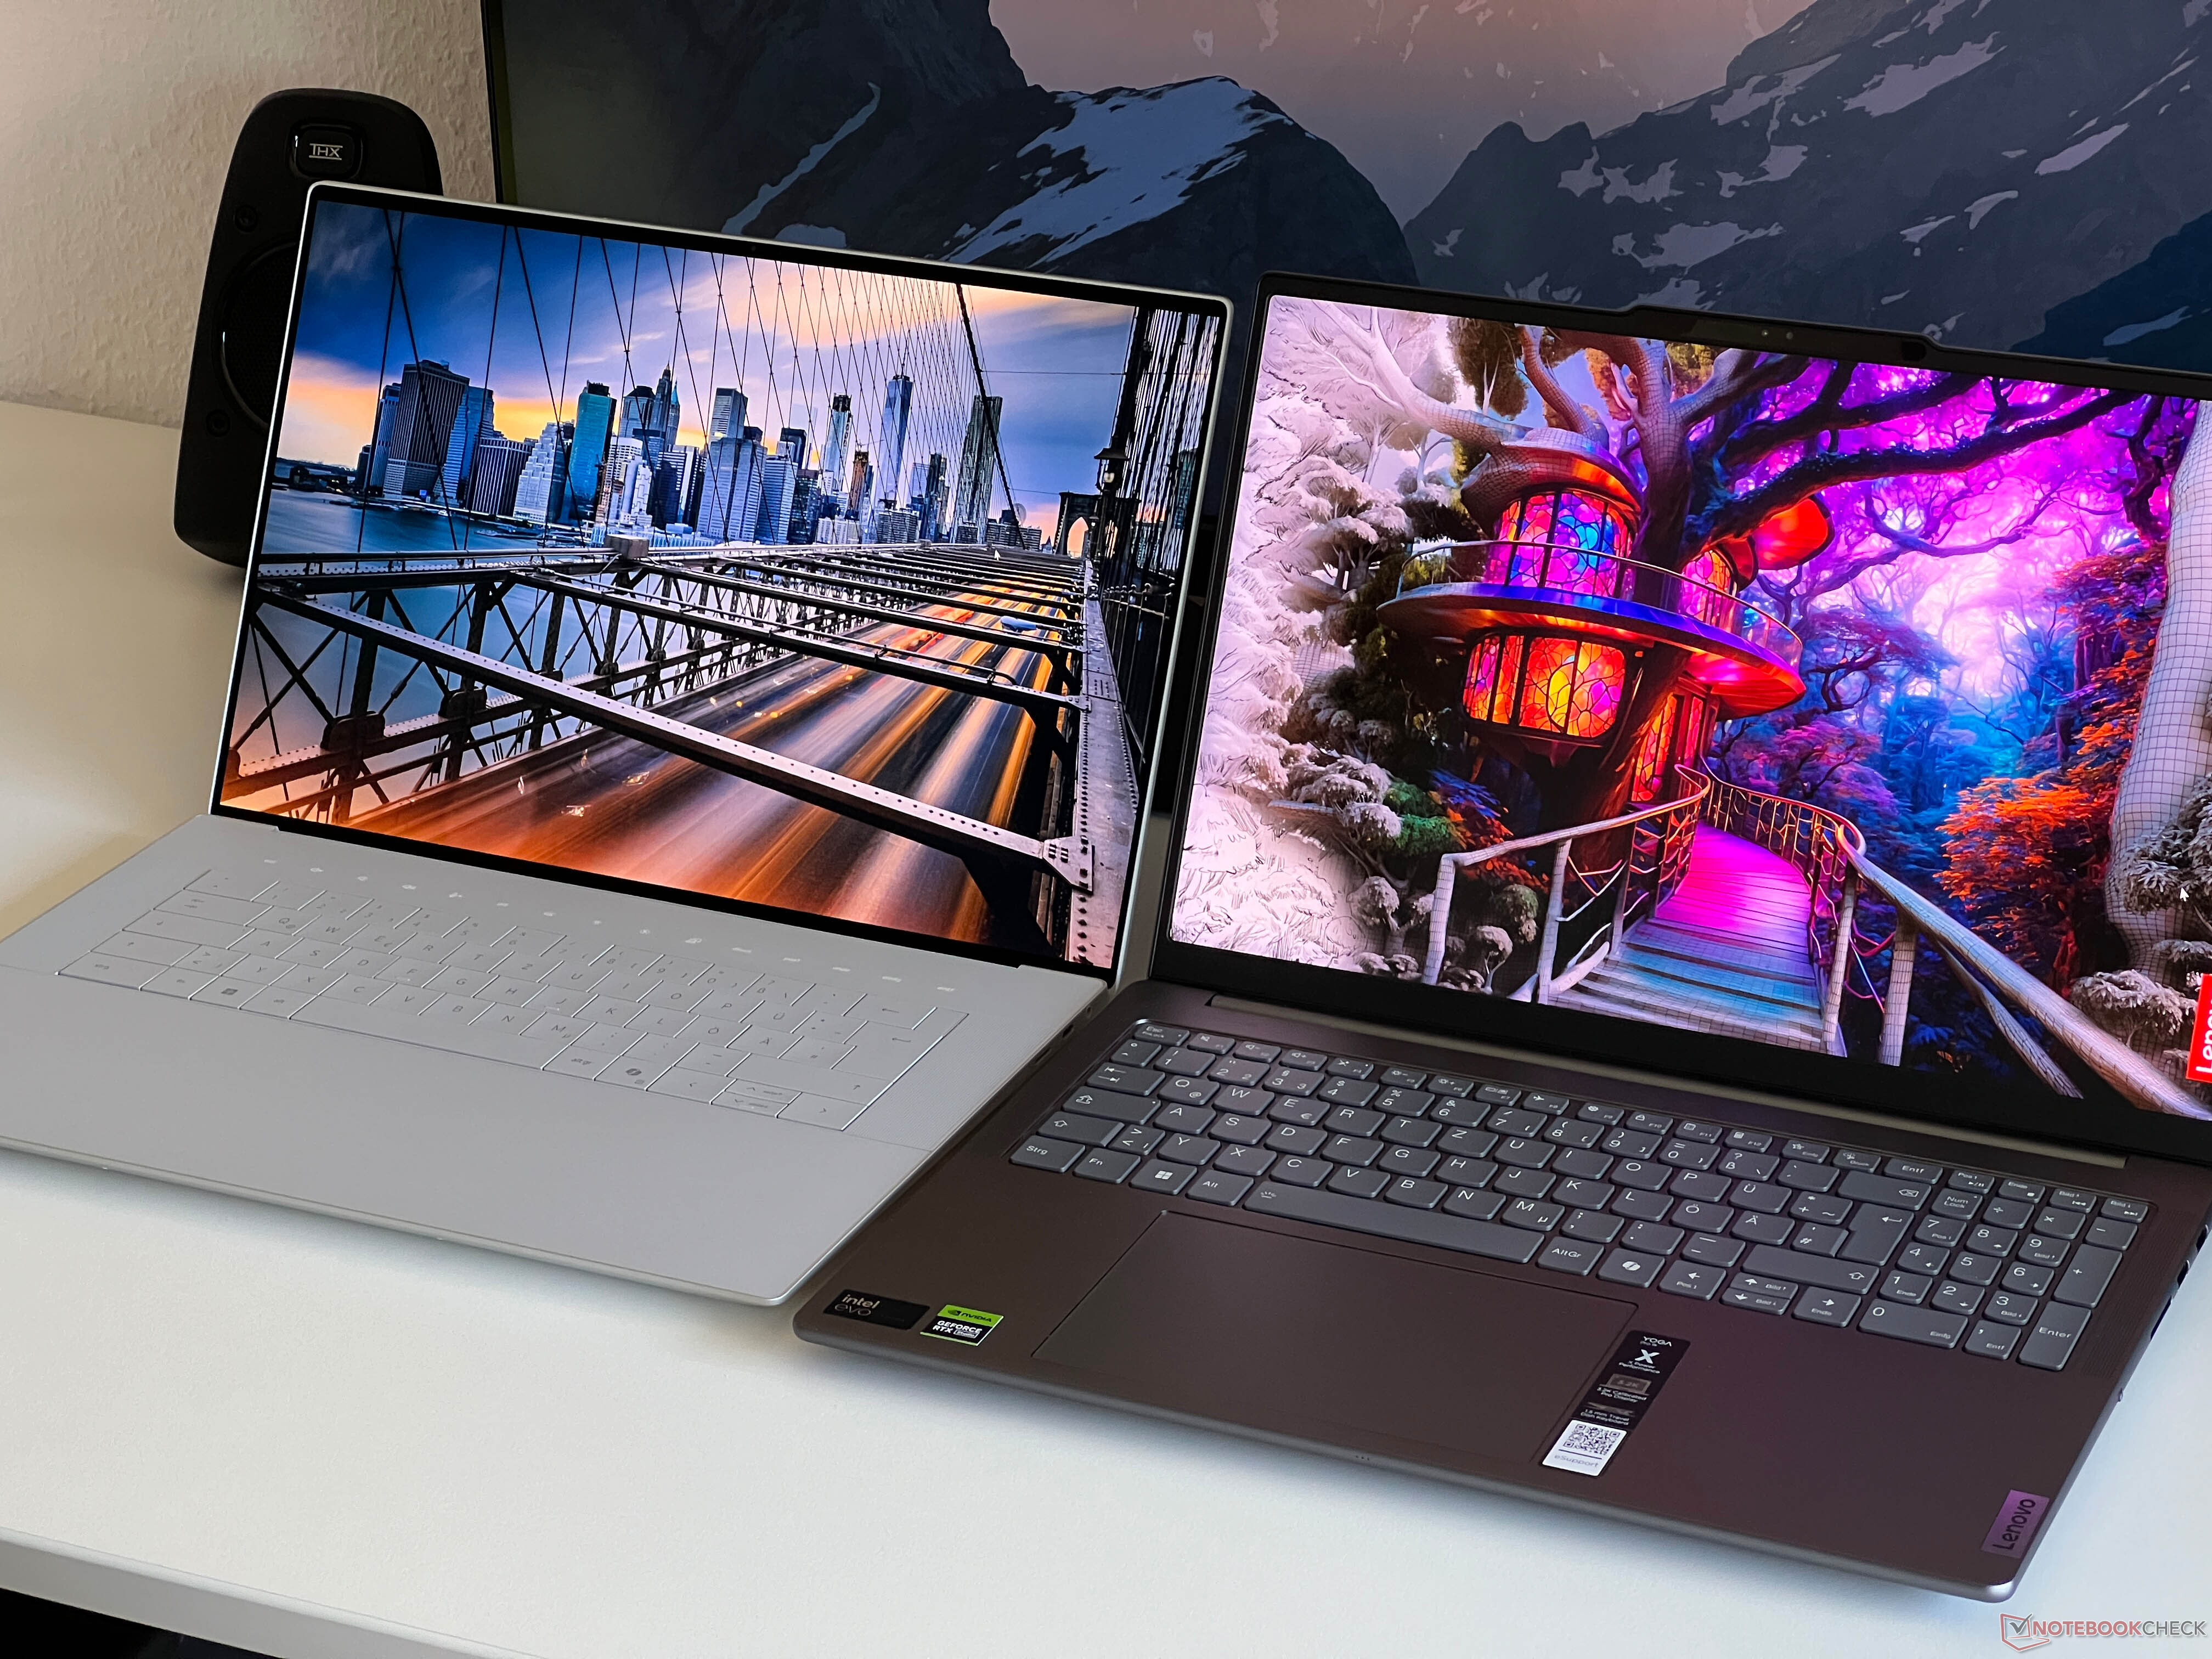
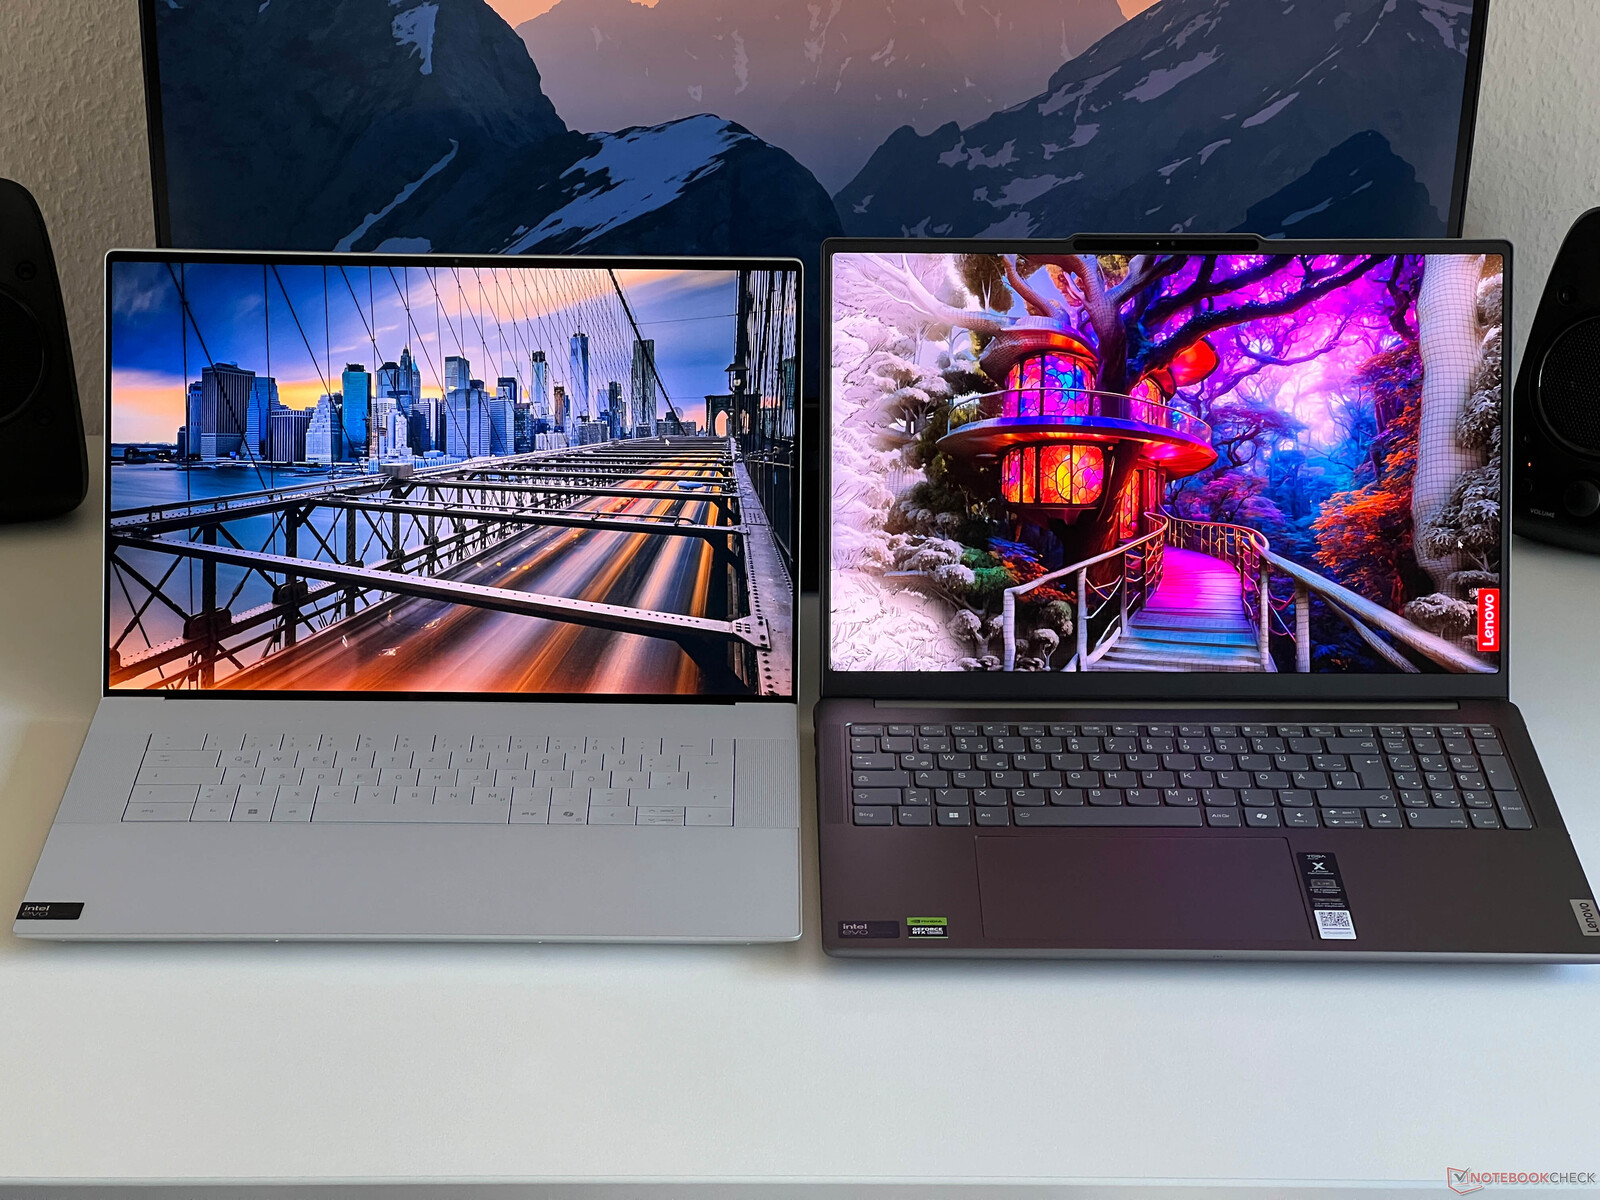
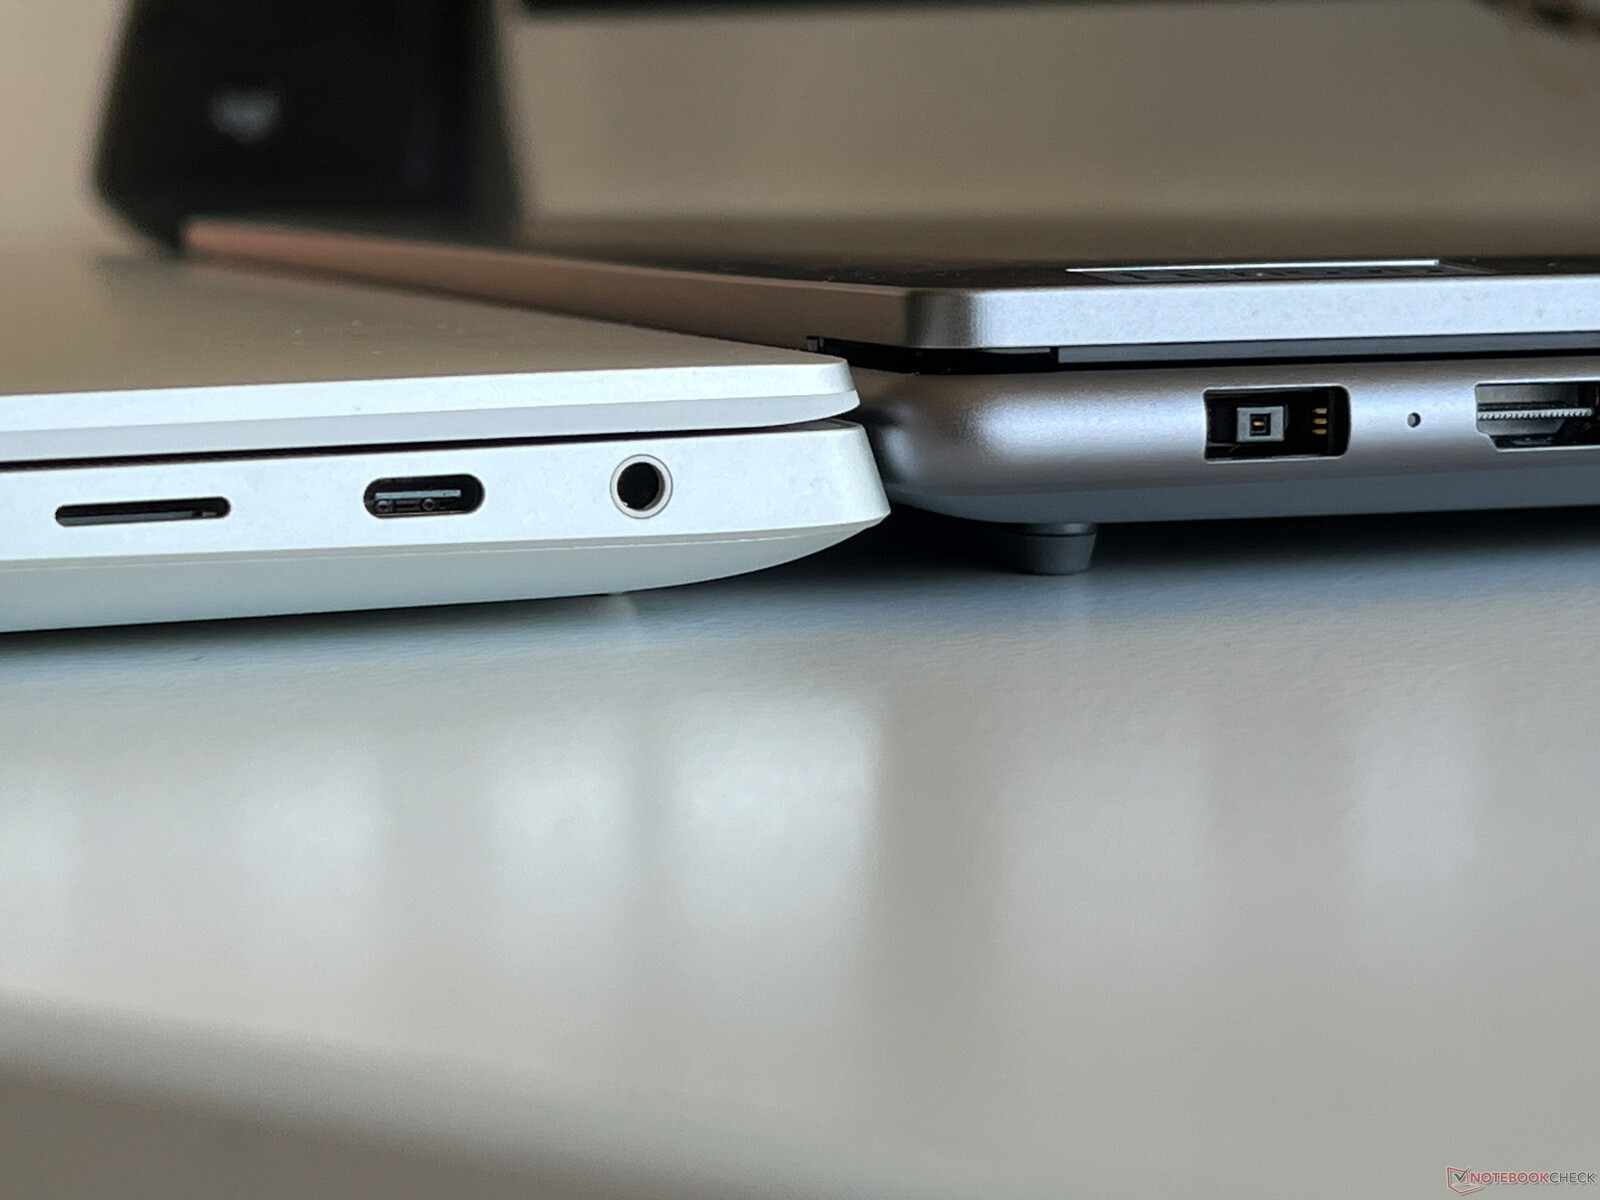
Daha önce de belirtildiği gibi, 16 inçlik modelin yeni tasarımı XPS 14'ten daha güzel görünüyor ve özellikle ayak izi ve kasasının kalınlığı açısından rekabete kıyasla büyük farklılıklar yok. Mevcut Yoga Pro 9 16 2024 ile karşılaştırıldığında (aşağıdaki karşılaştırma resimlerine bakın), XPS daha ince çerçevelerden yararlanıyor. Bununla birlikte, 2,313 kg ağırlığıyla XPS 16 hala karşılaştırma grubumuzdaki en ağır cihaz.
Bağlanabilirlik - Sadece 2x Thunderbolt 4 ile en hızlı XPS 16
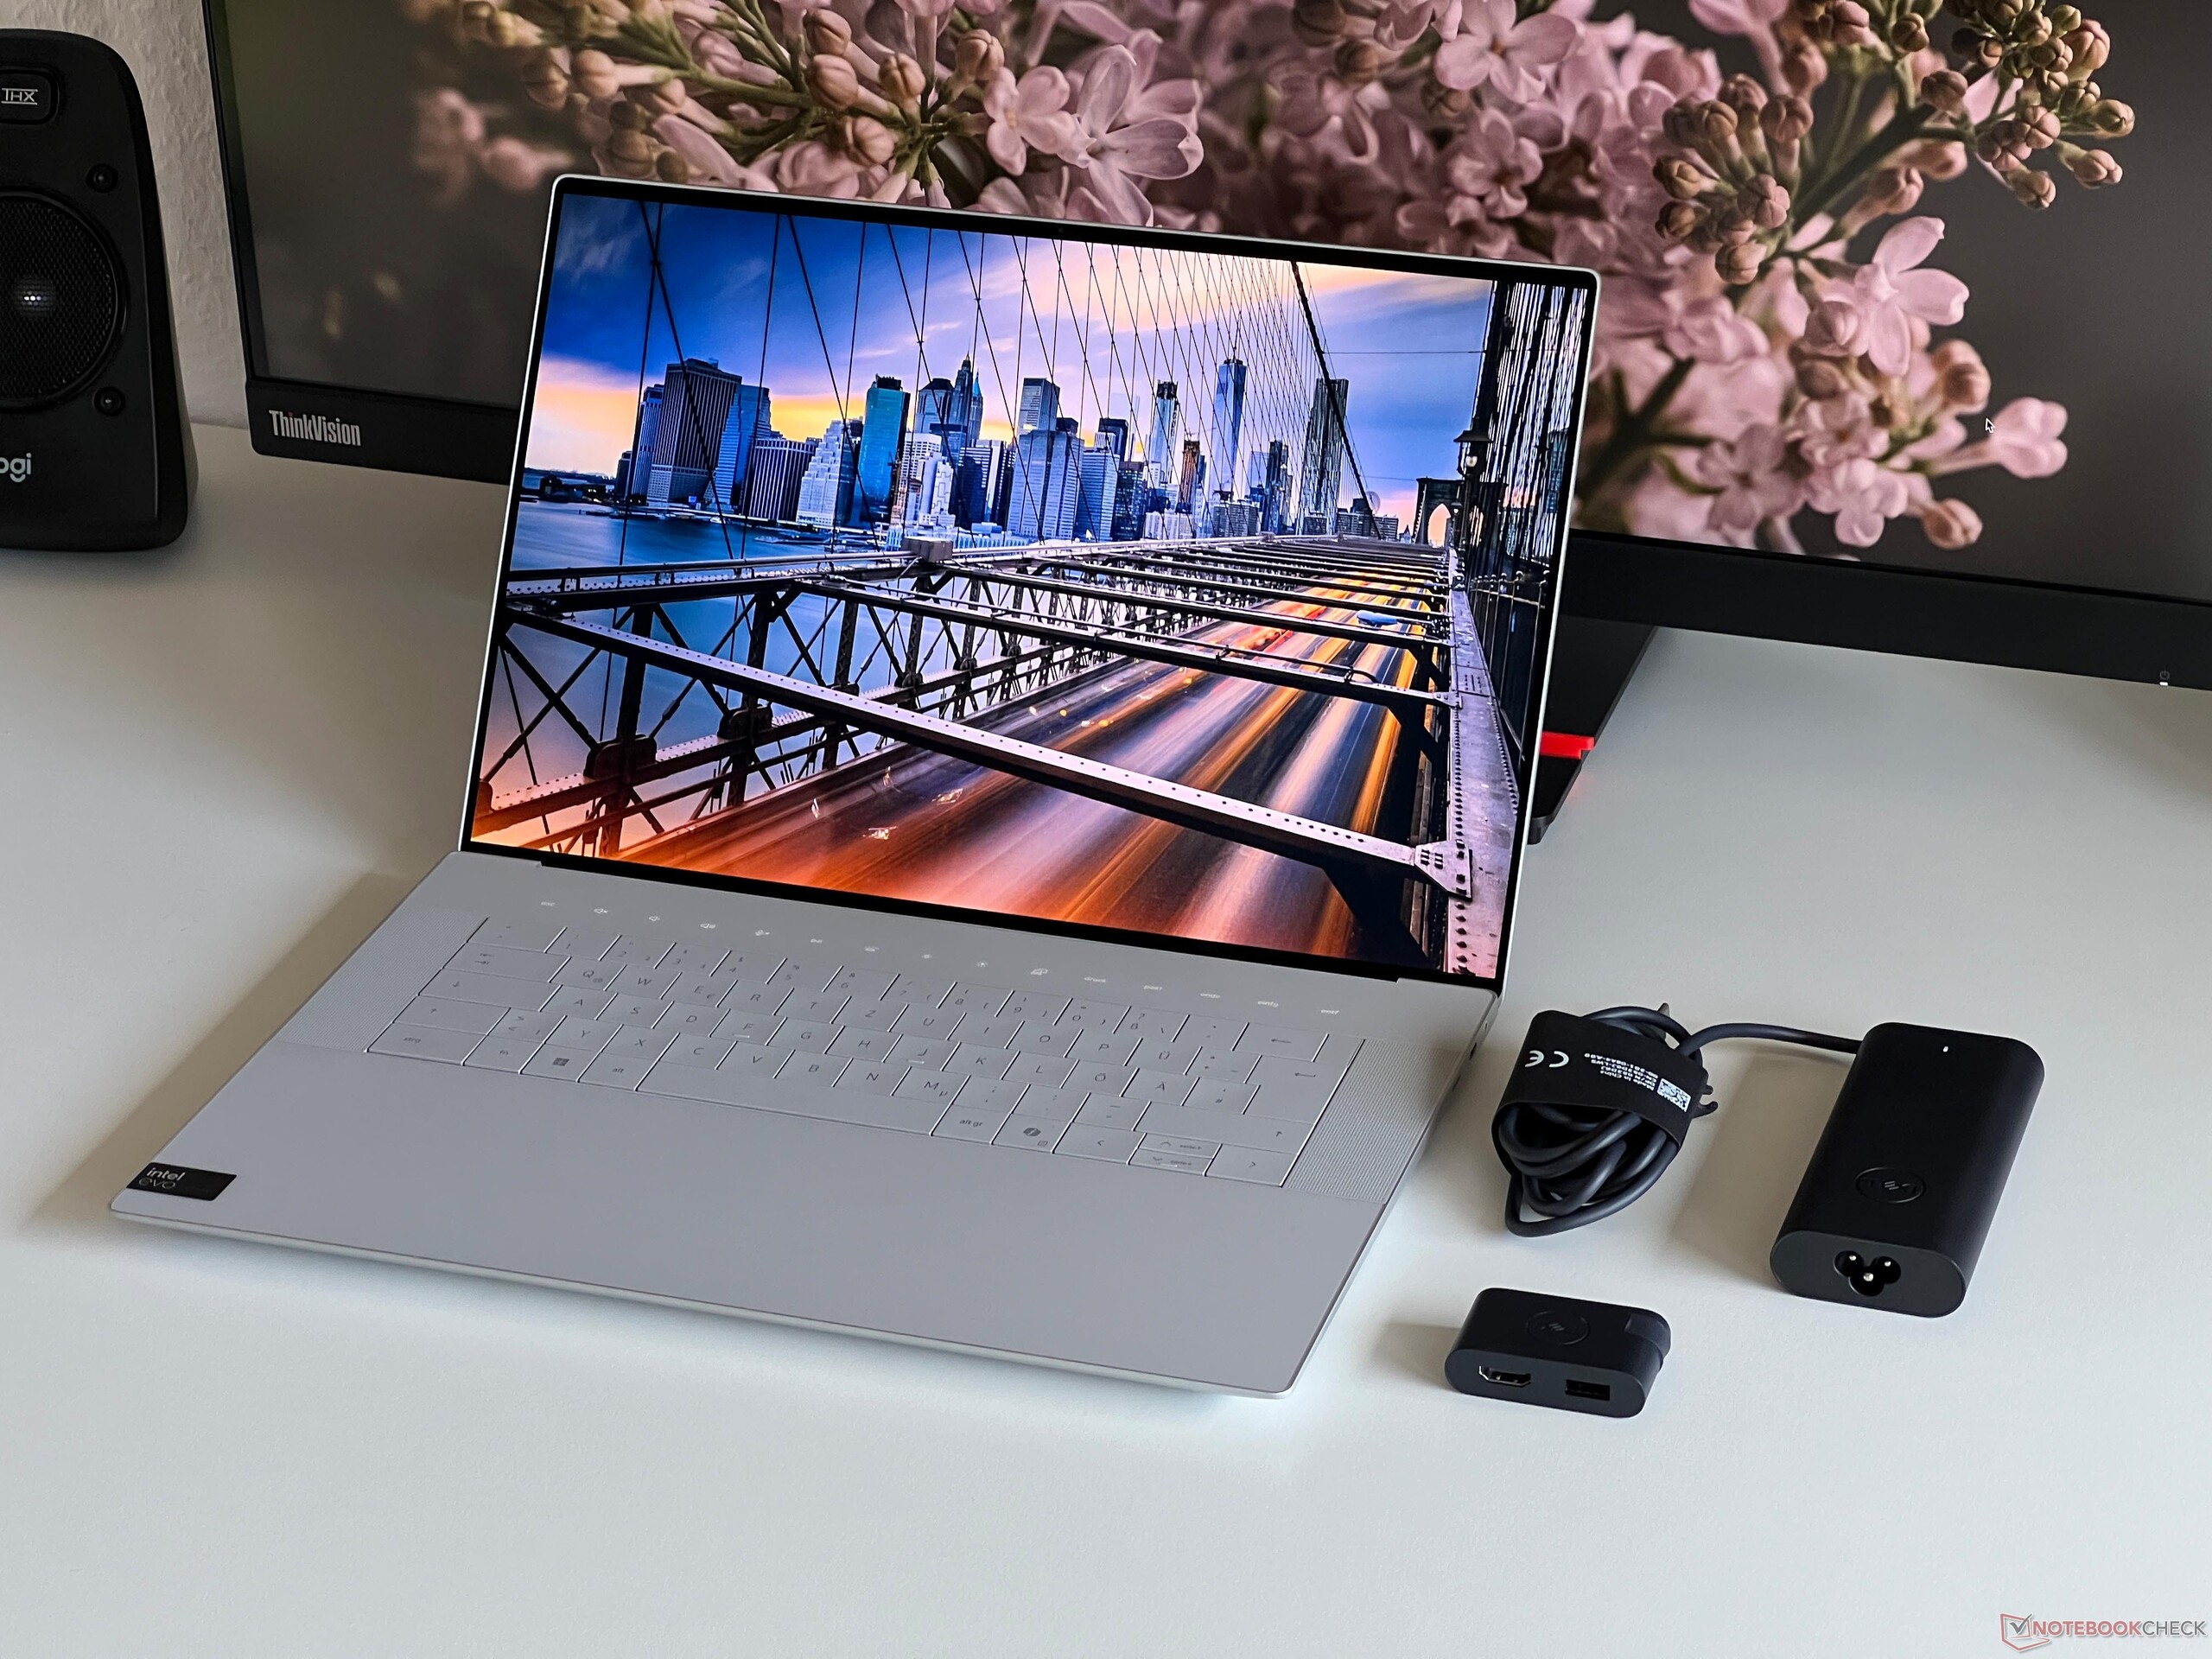
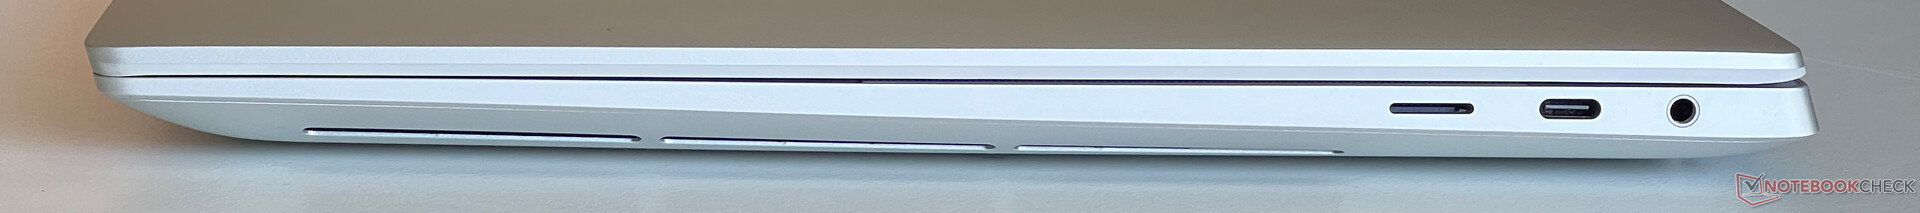
XPS 16, daha küçük olan XPS 16 ile aynı bağlantı seçeneklerine sahiptir XPS 14dell ek alanı kullanılmadan bırakıyor. Toplam 3x USB-C bağlantı noktası ve bir kart okuyucu var ve hepsi bu kadar. Daha da kötüsü, hızlı RTX 4070 dizüstü bilgisayara sahip modellerin yalnızca sol tarafındaki iki bağlantı noktası Thunderbolt 4'ü desteklerken, sağ tarafta yalnızca USB-C 3.2 Gen 2 destekleniyor. Buna karşılık, daha yavaş varyantlardaki üç bağlantı noktasının tümü Thunderbolt 4'ü destekliyor. Ayrıca, tüm USB-C çıkışları iGPU üzerinden bağlanıyor. Teslimat kapsamında ayrıca bir USB-A bağlantı noktası ve bir HDMI çıkışı bulunan küçük bir yerleştirme istasyonu da yer alıyor.
SD kart okuyucu
MicroSD kart okuyucu (yaylı mekanizma) cihazın sağ tarafında yer alıyor ve kompakt hafıza kartlarını neredeyse tamamen içine alıyor. Referans kartımızla (Angelbird AV Pro V60) birlikte, aktarım hızları maksimum 204 MB/s civarına ulaştı ve görüntü dosyalarını kopyalarken 148 MB/s gibi iyi bir değer ölçtük.
| SD Card Reader | |
| average JPG Copy Test (av. of 3 runs) | |
| Dell XPS 15 9530 RTX 4070 (Toshiba Exceria Pro SDXC 64 GB UHS-II) | |
| Dell XPS 16 9640 (Angelbird AV Pro V60) | |
| Sınıf ortalaması Multimedia (23 - 531, n=40, son 2 yıl) | |
| Samsung Galaxy Book4 Ultra (Angelbird AV Pro V60) | |
| Asus ROG Zephyrus G16 2024 GU605M | |
| Lenovo Yoga Pro 9 16-IRP G8 (Angelibird AV Pro V60) | |
| Schenker VISION 16 Pro (M23) (Angelbird AV Pro V60) | |
| maximum AS SSD Seq Read Test (1GB) | |
| Dell XPS 16 9640 (Angelbird AV Pro V60) | |
| Sınıf ortalaması Multimedia (37.3 - 1455, n=39, son 2 yıl) | |
| Dell XPS 15 9530 RTX 4070 (Toshiba Exceria Pro SDXC 64 GB UHS-II) | |
| Asus ROG Zephyrus G16 2024 GU605M | |
| Samsung Galaxy Book4 Ultra (Angelbird AV Pro V60) | |
| Lenovo Yoga Pro 9 16-IRP G8 (Angelibird AV Pro V60) | |
| Schenker VISION 16 Pro (M23) (Angelbird AV Pro V60) | |
İletişim
Daha küçük olanın aksine XPS 14dell, XPS 16'ya Intel'den bir Wi-Fi-7 modülü yerleştirmiştir. Ayrıca Bluetooth 5.4'ü de destekliyor. Wi-Fi 7 performansını henüz test edemedik, ancak Asus referans yönlendiricimizle birlikte performansı, örneğin Wi-Fi 6E modüllü XPS 14'ten biraz daha kötüydü. Yine de, herhangi bir sınırlama fark etmemeniz gerekir ve testimiz sırasında hiçbir bağlantı sorunu yaşamadık.
| Networking | |
| Dell XPS 16 9640 | |
| iperf3 transmit AXE11000 | |
| iperf3 receive AXE11000 | |
| Samsung Galaxy Book4 Ultra | |
| iperf3 transmit AXE11000 | |
| iperf3 receive AXE11000 | |
| Honor MagicBook Pro 16 2024 | |
| iperf3 transmit AXE11000 | |
| iperf3 receive AXE11000 | |
| Asus ROG Zephyrus G16 2024 GU605M | |
| iperf3 transmit AXE11000 | |
| iperf3 receive AXE11000 | |
| Lenovo Yoga Pro 9 16-IRP G8 | |
| iperf3 transmit AXE11000 | |
| iperf3 receive AXE11000 | |
| Schenker VISION 16 Pro (M23) | |
| iperf3 transmit AXE11000 | |
| iperf3 receive AXE11000 | |
| Dell XPS 15 9530 RTX 4070 | |
| iperf3 transmit AXE11000 | |
| iperf3 receive AXE11000 | |
Web kamerası
Dell, üst ekran çerçevesine bir 1080p web kamerası ve Windows Hello aracılığıyla yüz tanıma için bir IR kamera yerleştirdi. Web kamerasının kalitesi iyi aydınlatma koşullarında gayet iyi. Ayrıca kamera, işletim sisteminin bir parçası olarak stüdyo efektlerini (arka plan yumuşak odak, göz izleme, otomatik çerçeveleme) destekliyor, yani o anda hangi uygulamanın kullanıldığına bakılmaksızın çalışıyor.


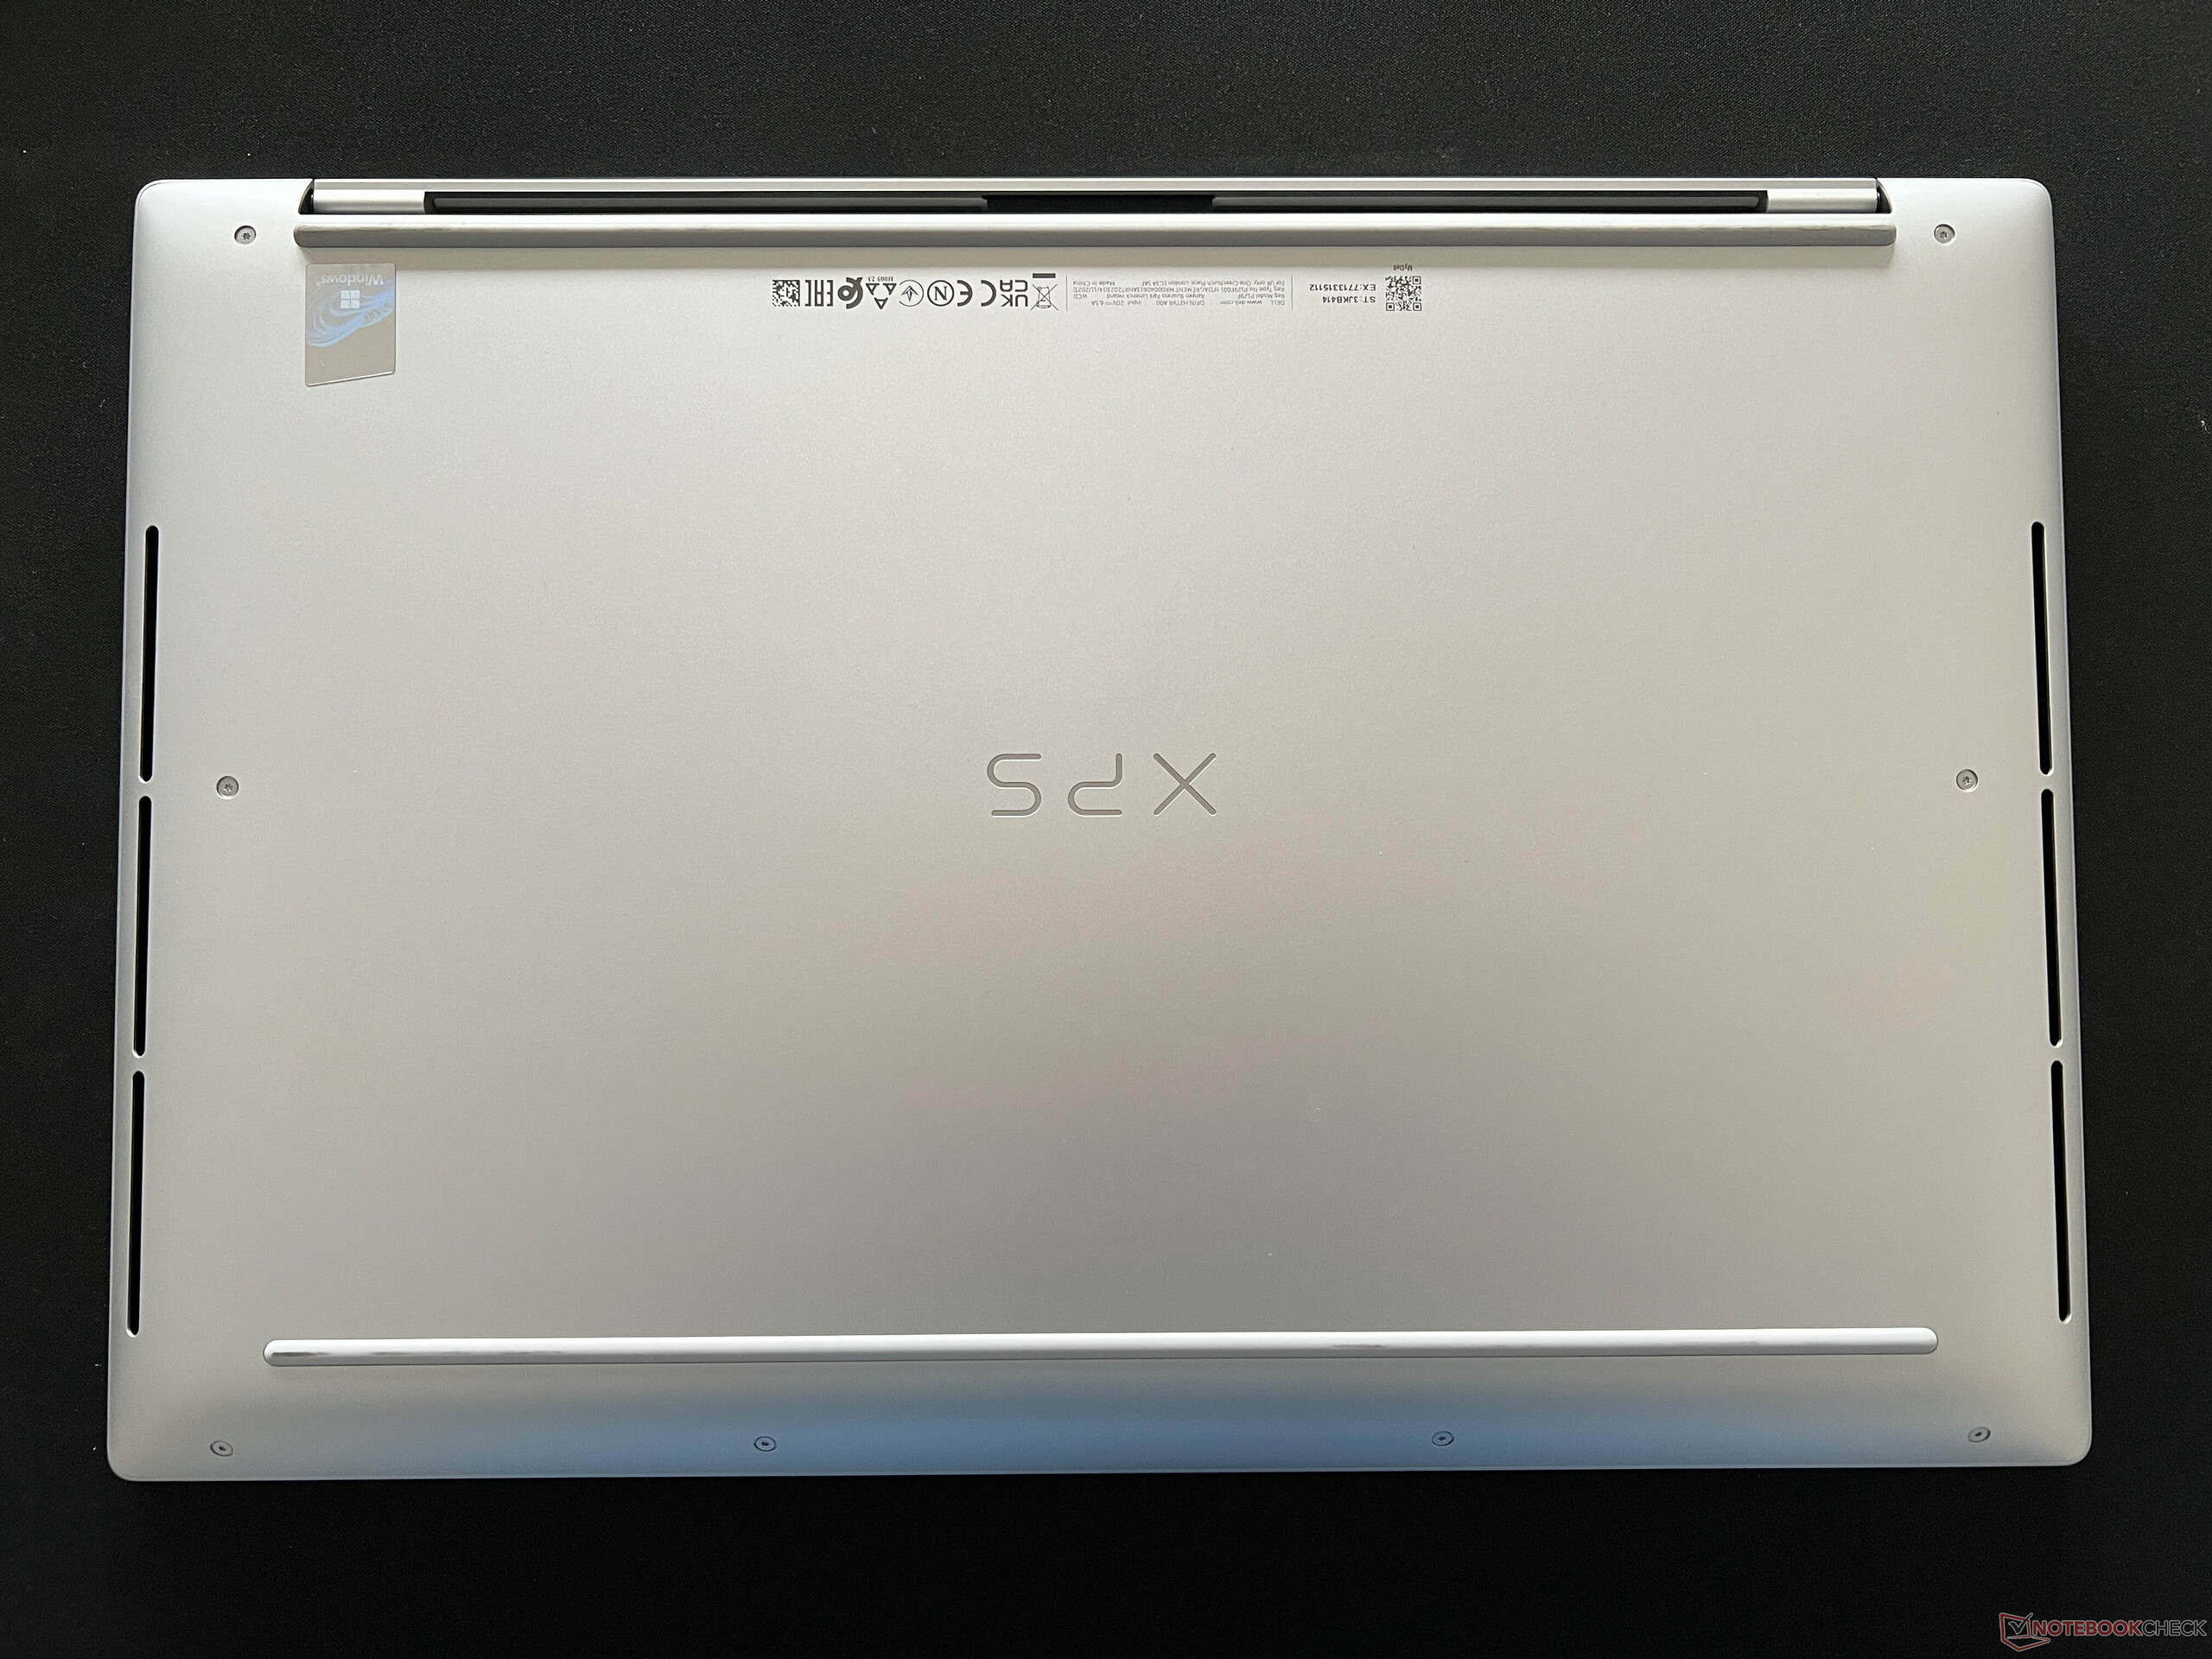
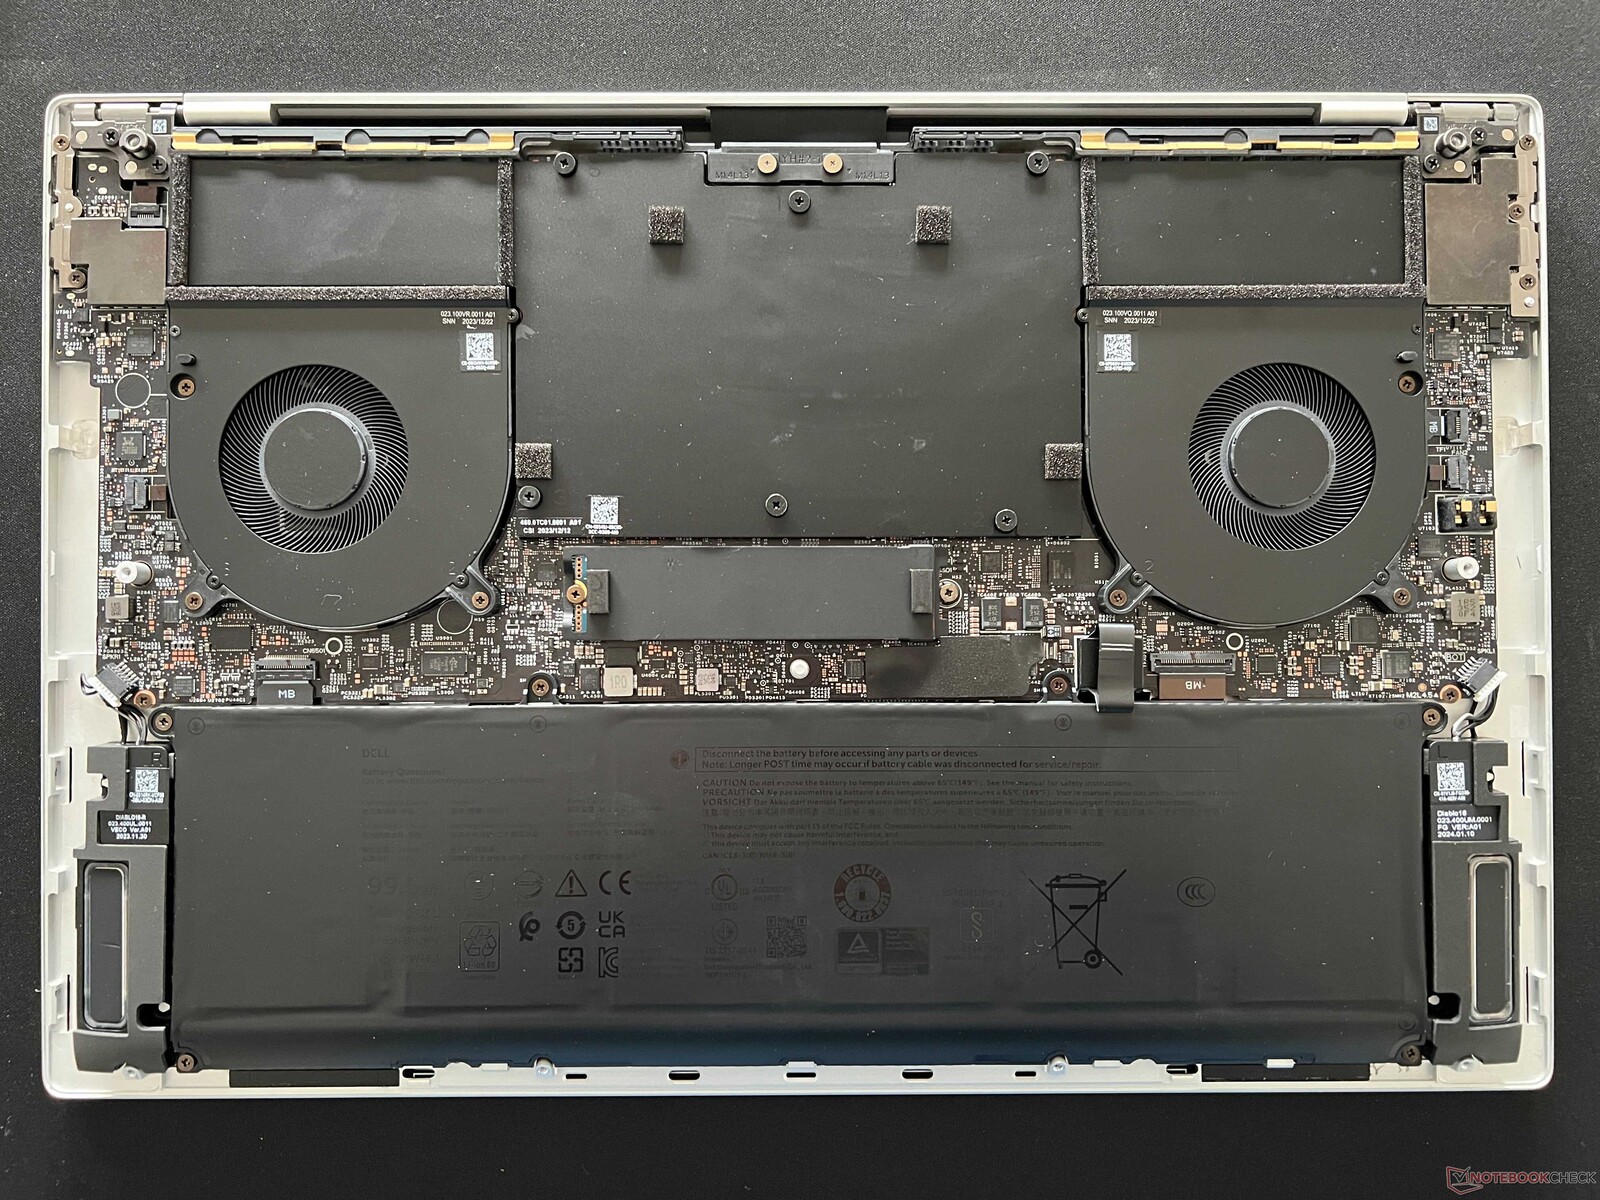
Bakım
Alt kasa kapağı Torx vidalarla (T5) sabitlenmiştir ve kolayca çıkarılabilir. İç yapıya soğutma ünitesi ve batarya hakimdir. Yalnızca M.2-2280 SSD üzerinde bakım yapabilir ve dizüstü bilgisayarın fanlarını temizleyebilirsiniz; ayrıca gerekirse pili değiştirebilirsiniz. WLAN modülü ve RAM dahil olmak üzere diğer tüm bileşenler lehimlenmiştir.
Giriş aygıtları - Klavyeye alışmak biraz zaman alıyor ve rahatsız edici işlev tuşları
Daha önce de belirtildiği gibi XPS 14dell, daha büyük XPS 16 modelinde de eski XPS 13 Plus ile aynı klavye tasarımını kullanıyor ve bu modelde tuşlar arasında boşluk bulunmuyor. Sayısal tuş takımı bulunmuyor, bunun yerine klavyenin yanındaki boşluk dizüstü bilgisayarın hoparlörleri için kullanılıyor. Tuşların kendileri hafif içbükey ve tuş vuruşları hassas olduğu için üzerlerinde yazmak çok rahat hissettiriyor. Bununla birlikte, sık sık yanlışlıkla yanlış tuşa bastığımız için ara sıra sorun yaşadığımızı fark ettik, bu nedenle bu klavyeye alışmak için kesinlikle biraz zamana ihtiyacınız var. Ayrıca küçük dikey ok tuşlarını büyük parmaklarla basmak için rahatsız edici bulduk ve daha büyük tuşların tuş vuruş sesi çok daha yüksek (boşluk çubuğu, enter tuşu). Güç düğmesi sağ üstte (parmak izi tarayıcısı dahil), genellikle silme tuşunun olmasını beklediğiniz yerde bulunuyor - bu da bizi bir sonraki soruna getiriyor.
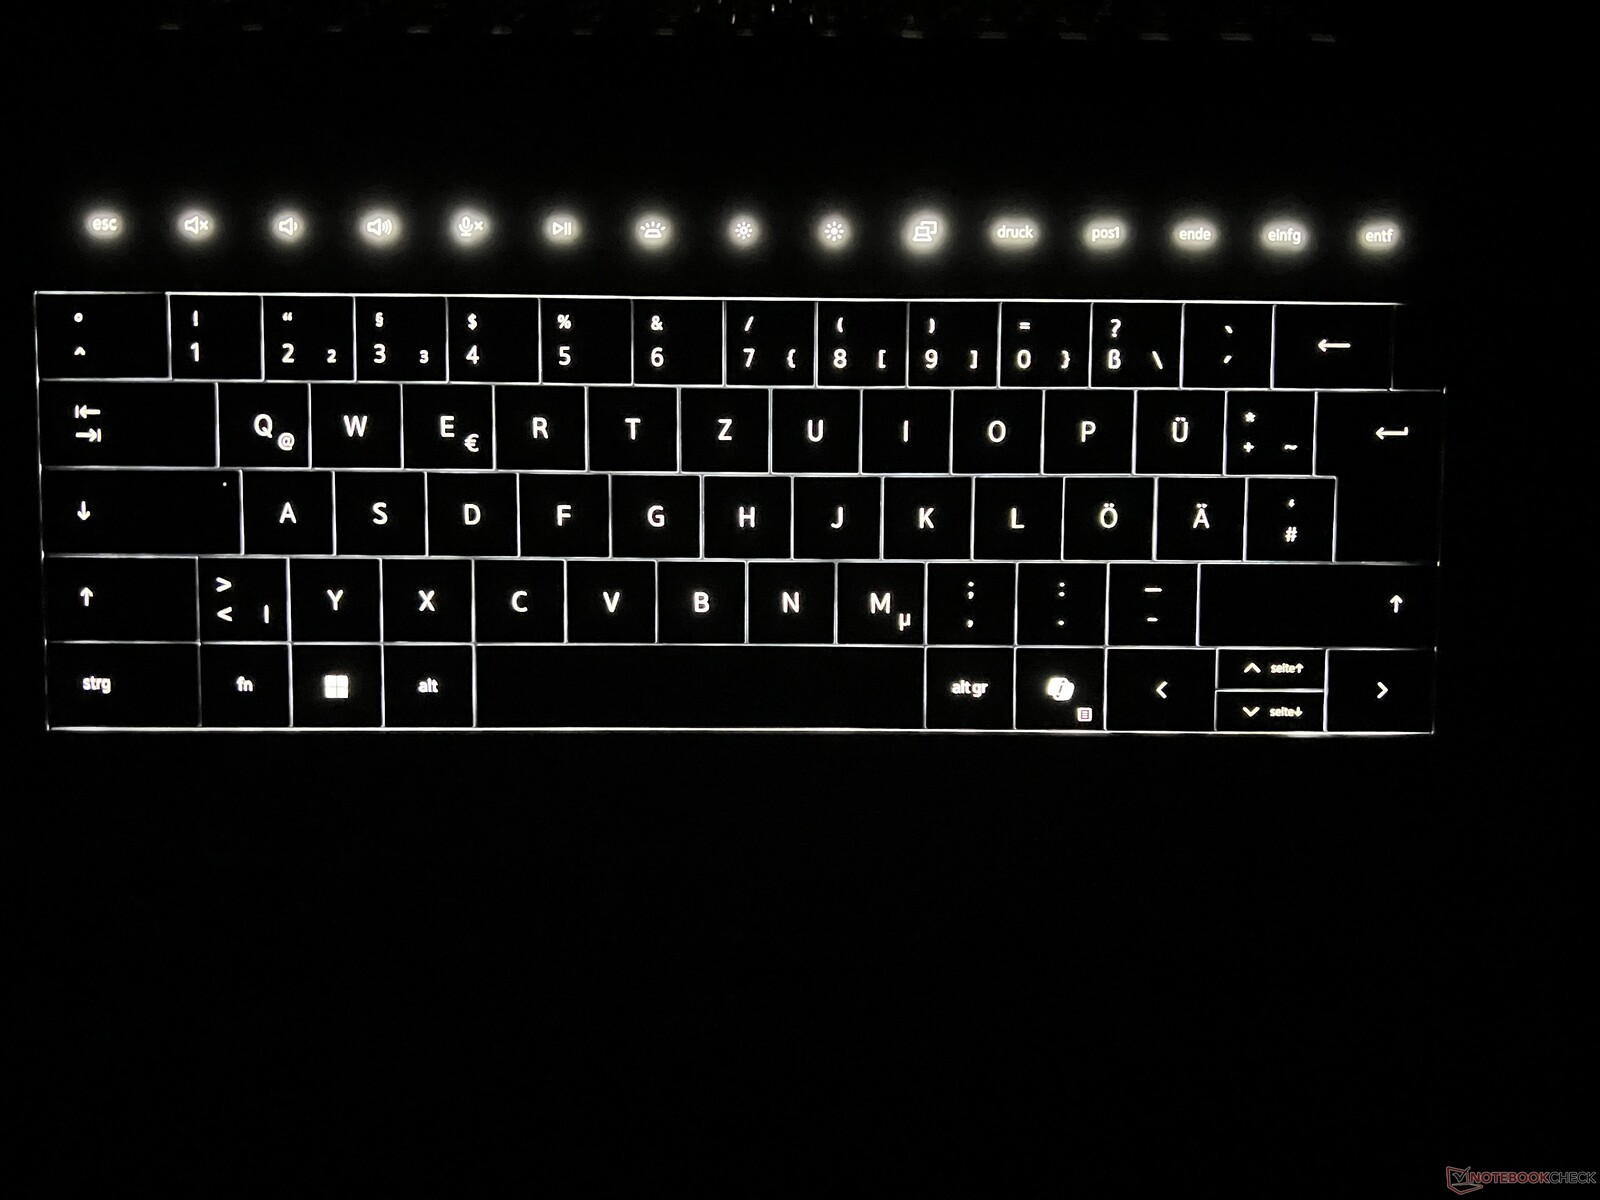
Fonksiyon tuşları dokunmatik bir çubuk olarak yerleştirilmiş ve bu da kullanıcılar için cihaza herhangi bir ek değer katmadığı gibi oldukça da can sıkıcı. Sonuç olarak, silme tuşuna körlemesine bile basamıyorsunuz ve her zaman tuşlara bakmanız gerekiyor. Arka aydınlatması da bir o kadar can sıkıcı, çünkü tek bir tuşa dokunmasanız bile saatlerce video izlerken değil, hareketsizlik dönemlerinde kapanıyor. Ayrıca, arka aydınlatma devre dışı bırakıldığında nereye basacağınızı bilemezsiniz, bu da aydınlatma yeniden etkinleştirilene kadar yanlış tuşlara basabileceğiniz anlamına gelir. Beyaz arka aydınlatmanın kendisi bir sensör aracılığıyla sürekli olarak uyarlanır ve yoğunluğu hiç etkileyemezsiniz - ya da en azından biz böyle bir seçenek bulamadık. Sensör ayrıca arka aydınlatmayı daha önce manuel olarak devre dışı bırakıp bırakmadığınızla da ilgilenmez ve aydınlatma koşulları değişir değişmez yeniden etkinleştirilir.
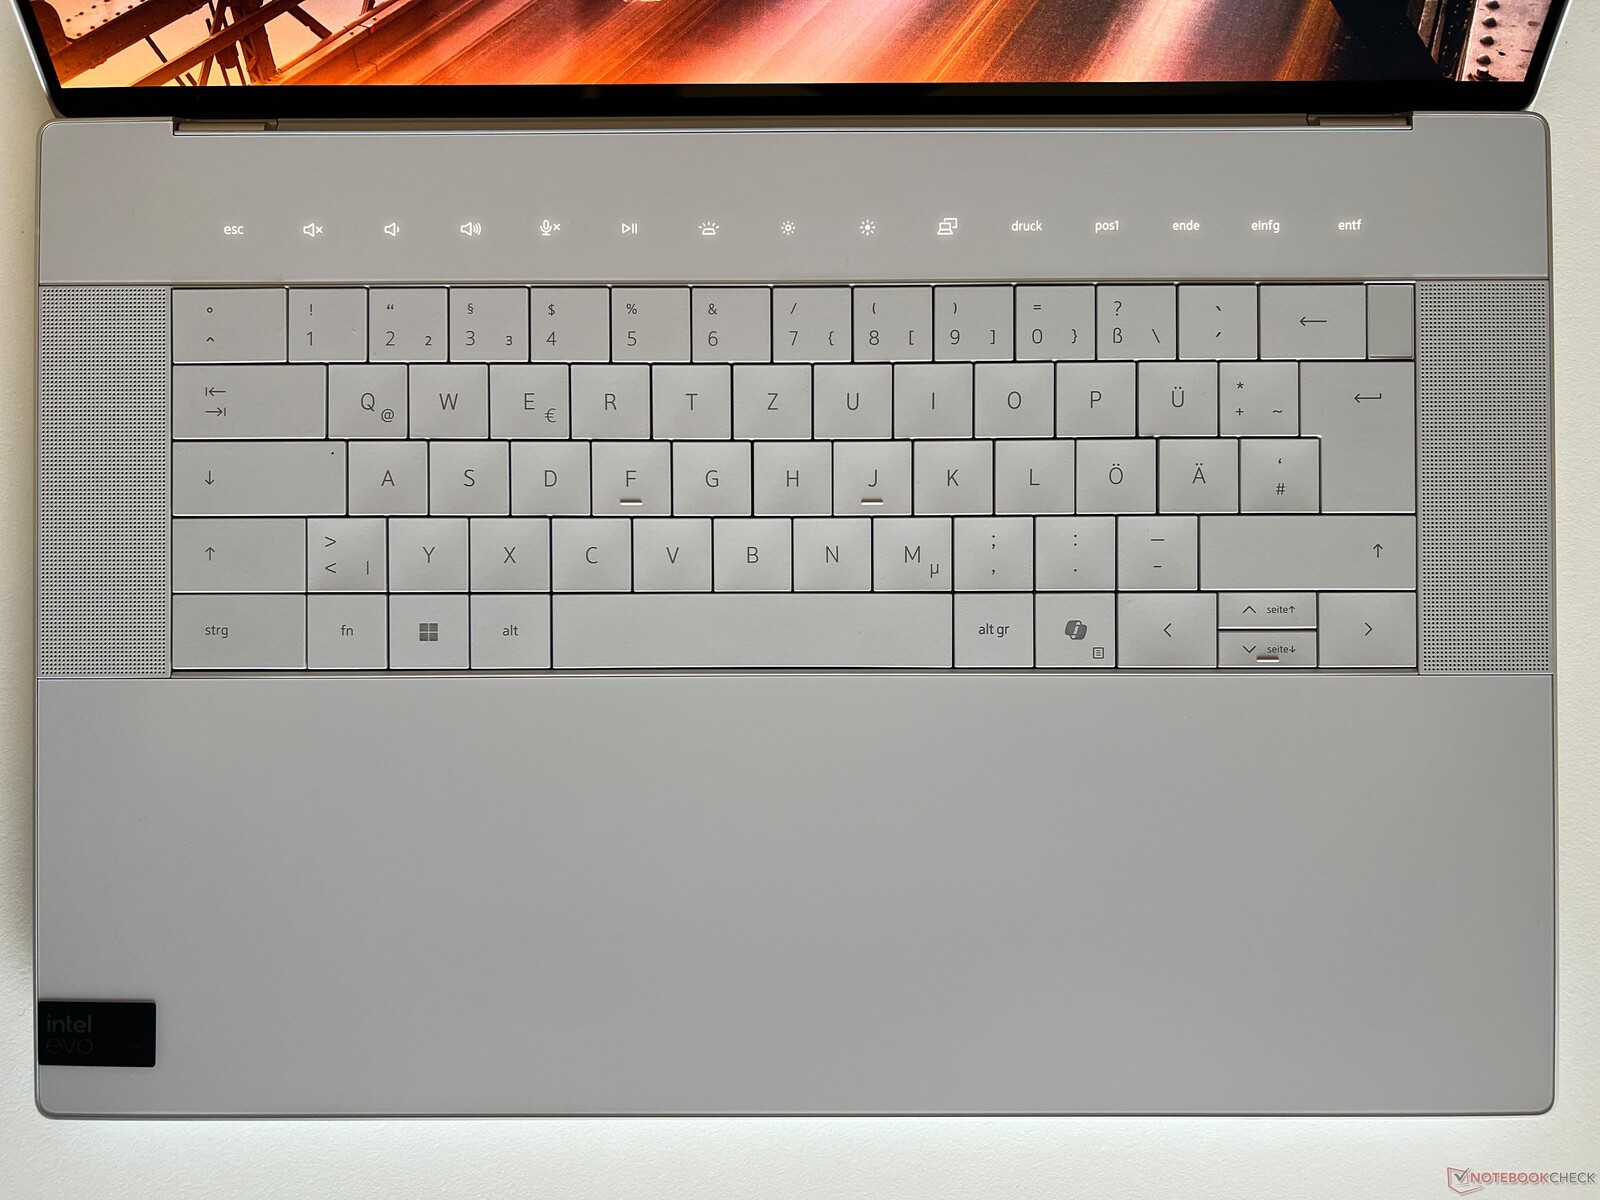
Dokunmatik yüzey avuç içi dayanağına tamamen entegre edilmiştir ve görünür bir sınırı yoktur. Dokunmatik yüzey avuç içi dayanağının tüm yüksekliğini kullanıyor ve genişliği sol Fn tuşunun ortasından sol ok tuşunun ortasına kadar uzanıyor. Genel olarak iyi çalışıyor ve eşit bir tıklama ile güzel ve pürüzsüz, ancak alanı terk ederseniz veya gerçek dokunmatik yüzey alanının biraz dışında hareketlere başlarsanız zaman zaman bazı sorunlarla karşılaştık. Ancak dokunmatik çubuğun aksine bu sadece küçük bir eleştiri noktası. İsteğe bağlı OLED panel de kapasitif bir dokunmatik ekranla donatılmıştır ve bu mükemmel çalışır.
Ekran - 90 Hz 4K OLED
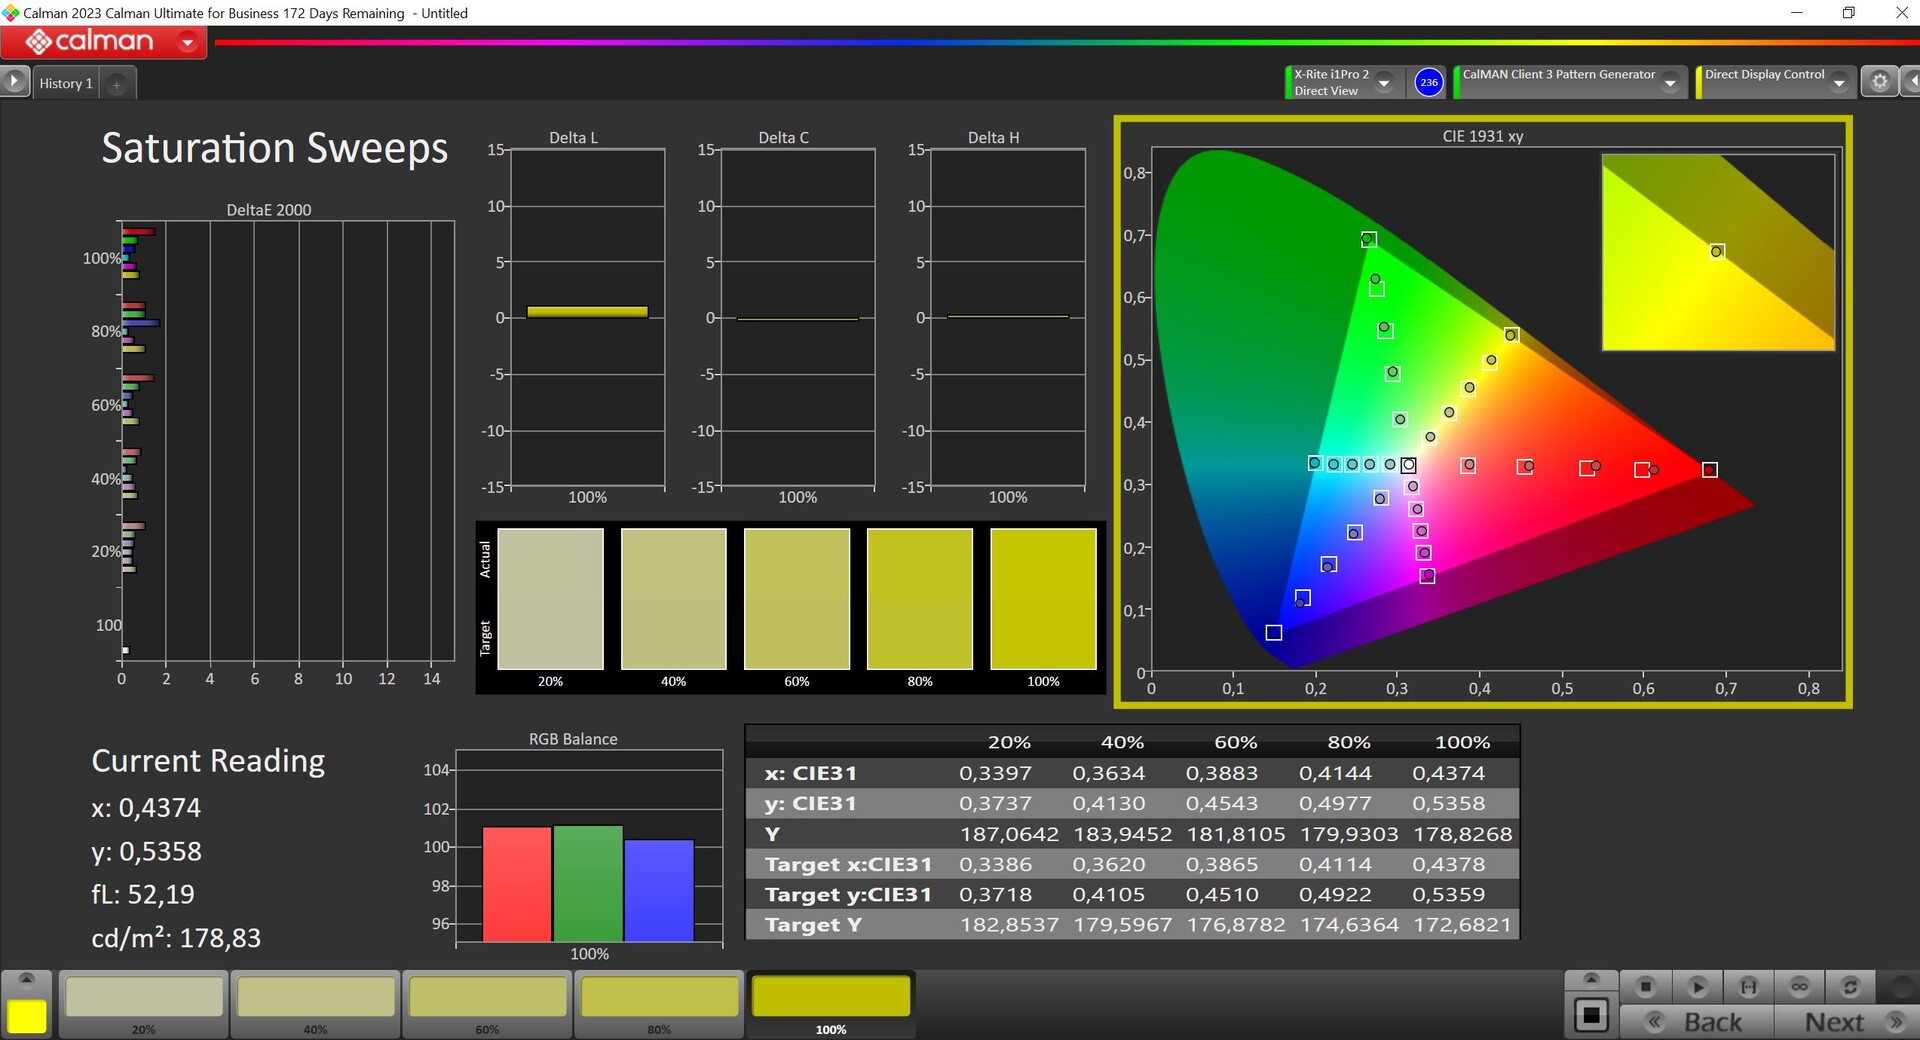
Dell, yeni XPS 16 için yansıtıcı yüzeye sahip iki farklı 16,3 inç panel sunuyor. Dokunmatik ekran içermeyen 1080p model (500 cd/m²) standart olarak sunuluyor, ancak 300 ABD doları karşılığında Samsung'un 3.840 x 2.400 piksel çözünürlüğe sahip OLED dokunmatik ekranını da alabiliyorsunuz ki test cihazımızda da bu panel bulunuyor. İyi öznel görüntü kalitesine rağmen, XPS 16'daki panel, daha yüksek çözünürlüğüne rağmen Samsung'un en yeni OLED nesline kıyasla (örneğin Galaxy Book4 Ultra'da yüklü olan) bazı dezavantajlar gösteriyor. Her şeyden önce, yenileme hızı 120 Hz yerine sadece 90 Hz'dir ve parlak içerik görüntülendiğinde daha yakından incelendiğinde bir raster etkisi görülebilir. Dell XPS 16, ortalama ~367 cd/m² ile maksimum SDR parlaklığı söz konusu olduğunda da biraz geride kalıyor. Siyah değeri 0'dır, bu da son derece yüksek bir kontrast oranına yol açar. HDR modunda (manuel olarak etkinleştirilmesi gerekir) maksimum 580 cd/m² değerini kaydettik. 0-90 arasındaki tüm parlaklık seviyelerinde 360 Hz frekanslı PWM algılayabildik.
| |||||||||||||||||||||||||
Aydınlatma: 96 %
Batarya modunda parlaklık: 366 cd/m²
Kontrast: ∞:1 (Siyah: 0 cd/m²)
ΔE ColorChecker Calman: 1.3 | ∀{0.5-29.43 Ø4.71}
calibrated: 1
ΔE Greyscale Calman: 2.2 | ∀{0.09-98 Ø4.96}
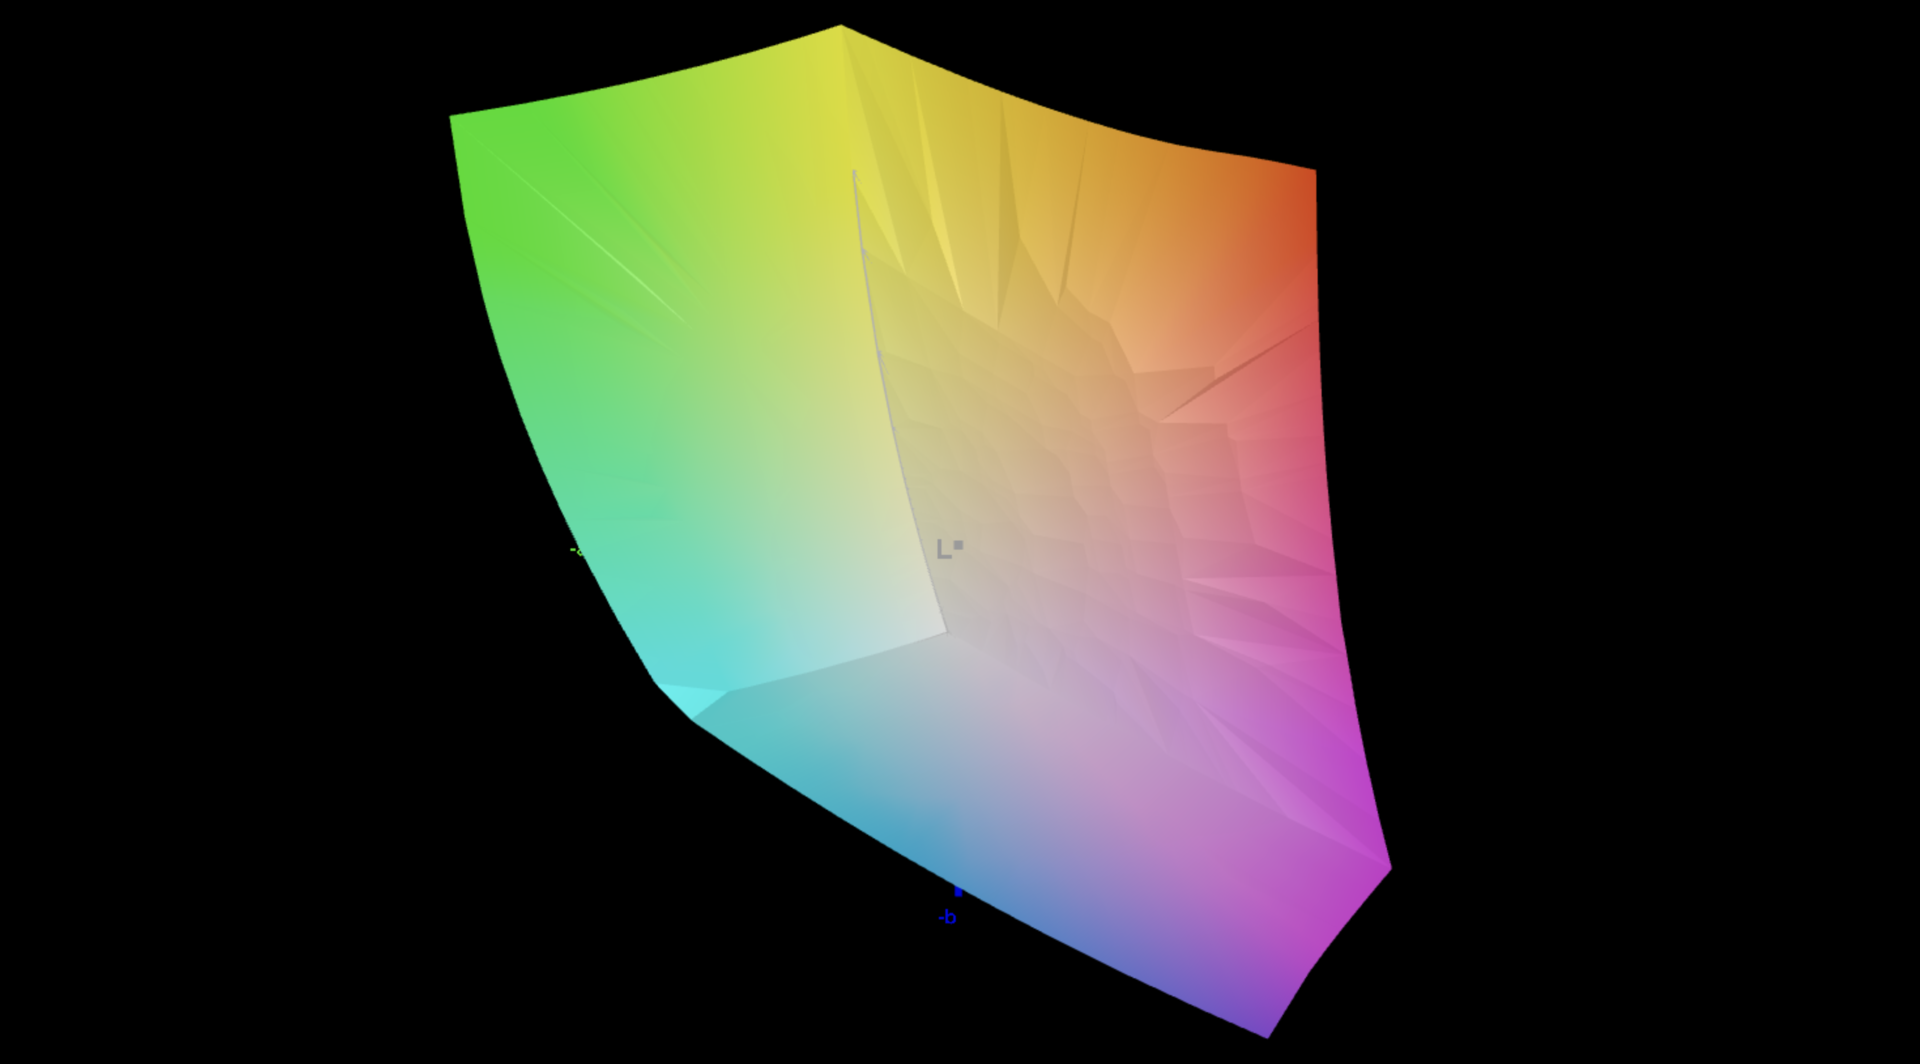
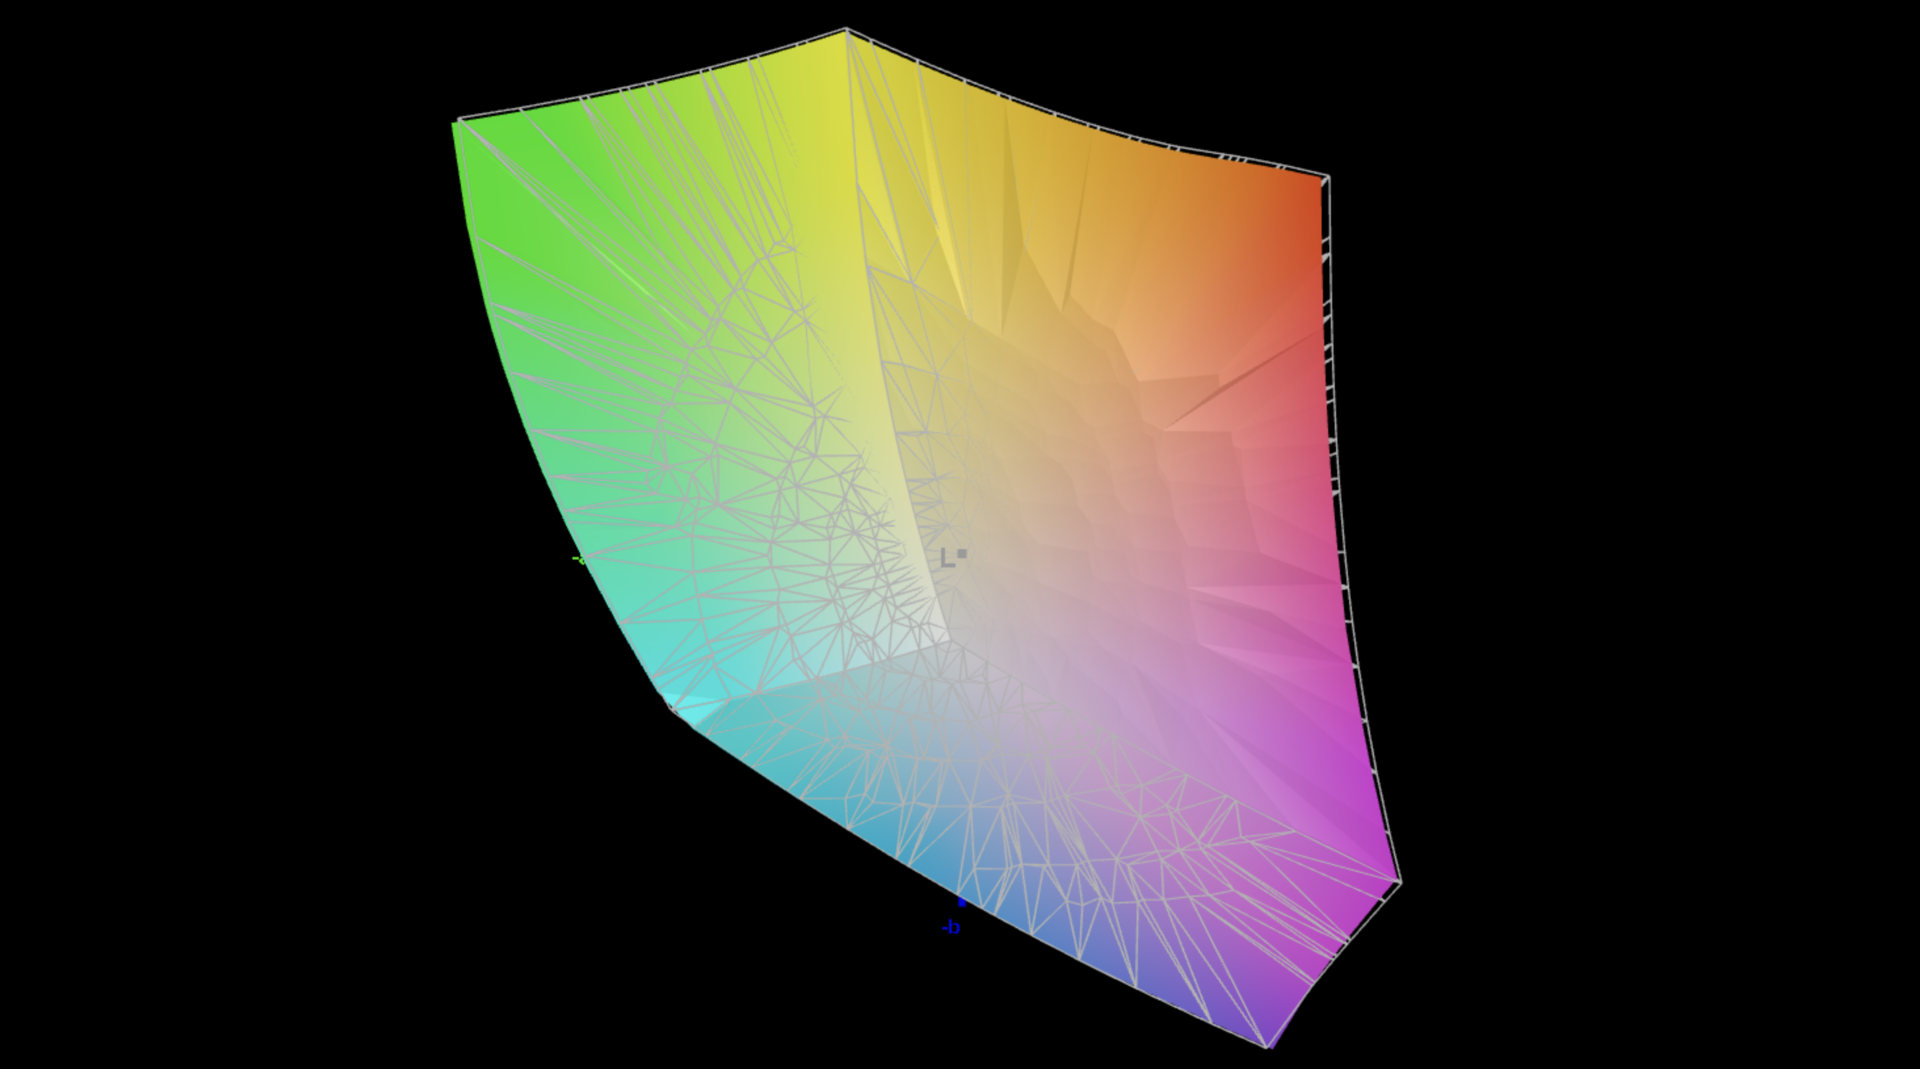
87.8% AdobeRGB 1998 (Argyll 3D)
100% sRGB (Argyll 3D)
98.3% Display P3 (Argyll 3D)
Gamma: 2.14
CCT: 6680 K
| Dell XPS 16 9640 SDC4196, OLED, 3840x2400, 16.3" | Samsung Galaxy Book4 Ultra ATNA60CL07-0, OLED, 2880x1800, 16" | Honor MagicBook Pro 16 2024 TL160MDMP01, IPS, 3072x1920, 16" | Asus ROG Zephyrus G16 2024 GU605M ATNA60DL01-0, OLED, 2560x1600, 16" | Lenovo Yoga Pro 9 16-IRP G8 LEN160-3.2K, Mini-LED, 3200x2000, 16" | Schenker VISION 16 Pro (M23) NE160QDM-NZ1, IPS, 2560x1600, 16" | Dell XPS 15 9530 RTX 4070 Samsung 156XG01, OLED, 3456x2160, 15.6" | |
|---|---|---|---|---|---|---|---|
| Display | 0% | 1% | 4% | 2% | -17% | 5% | |
| Display P3 Coverage (%) | 98.3 | 98.6 0% | 98.8 1% | 99.9 2% | 97 -1% | 68.8 -30% | 99.8 2% |
| sRGB Coverage (%) | 100 | 99.9 0% | 100 0% | 100 0% | 99.8 0% | 98.8 -1% | 100 0% |
| AdobeRGB 1998 Coverage (%) | 87.8 | 88.5 1% | 89.1 1% | 96.9 10% | 95.1 8% | 70 -20% | 98.4 12% |
| Response Times | 27% | -614% | 72% | -1295% | -1212% | -117% | |
| Response Time Grey 50% / Grey 80% * (ms) | 0.82 ? | 0.54 ? 34% | 6.3 ? -668% | 0.22 ? 73% | 14 ? -1607% | 13.7 ? -1571% | 1.68 ? -105% |
| Response Time Black / White * (ms) | 0.85 ? | 0.69 ? 19% | 5.6 ? -559% | 0.25 ? 71% | 9.2 ? -982% | 8.1 ? -853% | 1.94 ? -128% |
| PWM Frequency (Hz) | 360 ? | 240 ? | 960 ? | 5800 ? | 239 | ||
| Screen | 6% | 5% | 4% | 22% | -58% | -64% | |
| Brightness middle (cd/m²) | 366 | 390 7% | 551 51% | 416 14% | 539 47% | 384 5% | 389.5 6% |
| Brightness (cd/m²) | 367 | 393 7% | 524 43% | 418 14% | 546 49% | 371 1% | 392 7% |
| Brightness Distribution (%) | 96 | 98 2% | 91 -5% | 96 0% | 96 0% | 88 -8% | 98 2% |
| Black Level * (cd/m²) | 0.52 | 0.18 | 0.3 | ||||
| Colorchecker dE 2000 * | 1.3 | 1.4 -8% | 1.7 -31% | 1.6 -23% | 1.4 -8% | 3.4 -162% | 4.95 -281% |
| Colorchecker dE 2000 max. * | 3.6 | 2.7 25% | 4.1 -14% | 2.1 42% | 2.1 42% | 9.2 -156% | 8.65 -140% |
| Colorchecker dE 2000 calibrated * | 1 | 1 -0% | 1.3 -30% | 1.53 -53% | |||
| Greyscale dE 2000 * | 2.2 | 2.1 5% | 2.4 -9% | 2.7 -23% | 2.2 -0% | 3.4 -55% | 2 9% |
| Gamma | 2.14 103% | 2.27 97% | 2.2 100% | 2.16 102% | 2.19 100% | 2.16 102% | 2.27 97% |
| CCT | 6680 97% | 6431 101% | 6842 95% | 6331 103% | 6479 100% | 7462 87% | 6265 104% |
| Contrast (:1) | 1060 | 2994 | 1280 | ||||
| Toplam Ortalama (Program / Ayarlar) | 11% /
8% | -203% /
-99% | 27% /
16% | -424% /
-223% | -429% /
-240% | -59% /
-56% |
* ... daha küçük daha iyidir

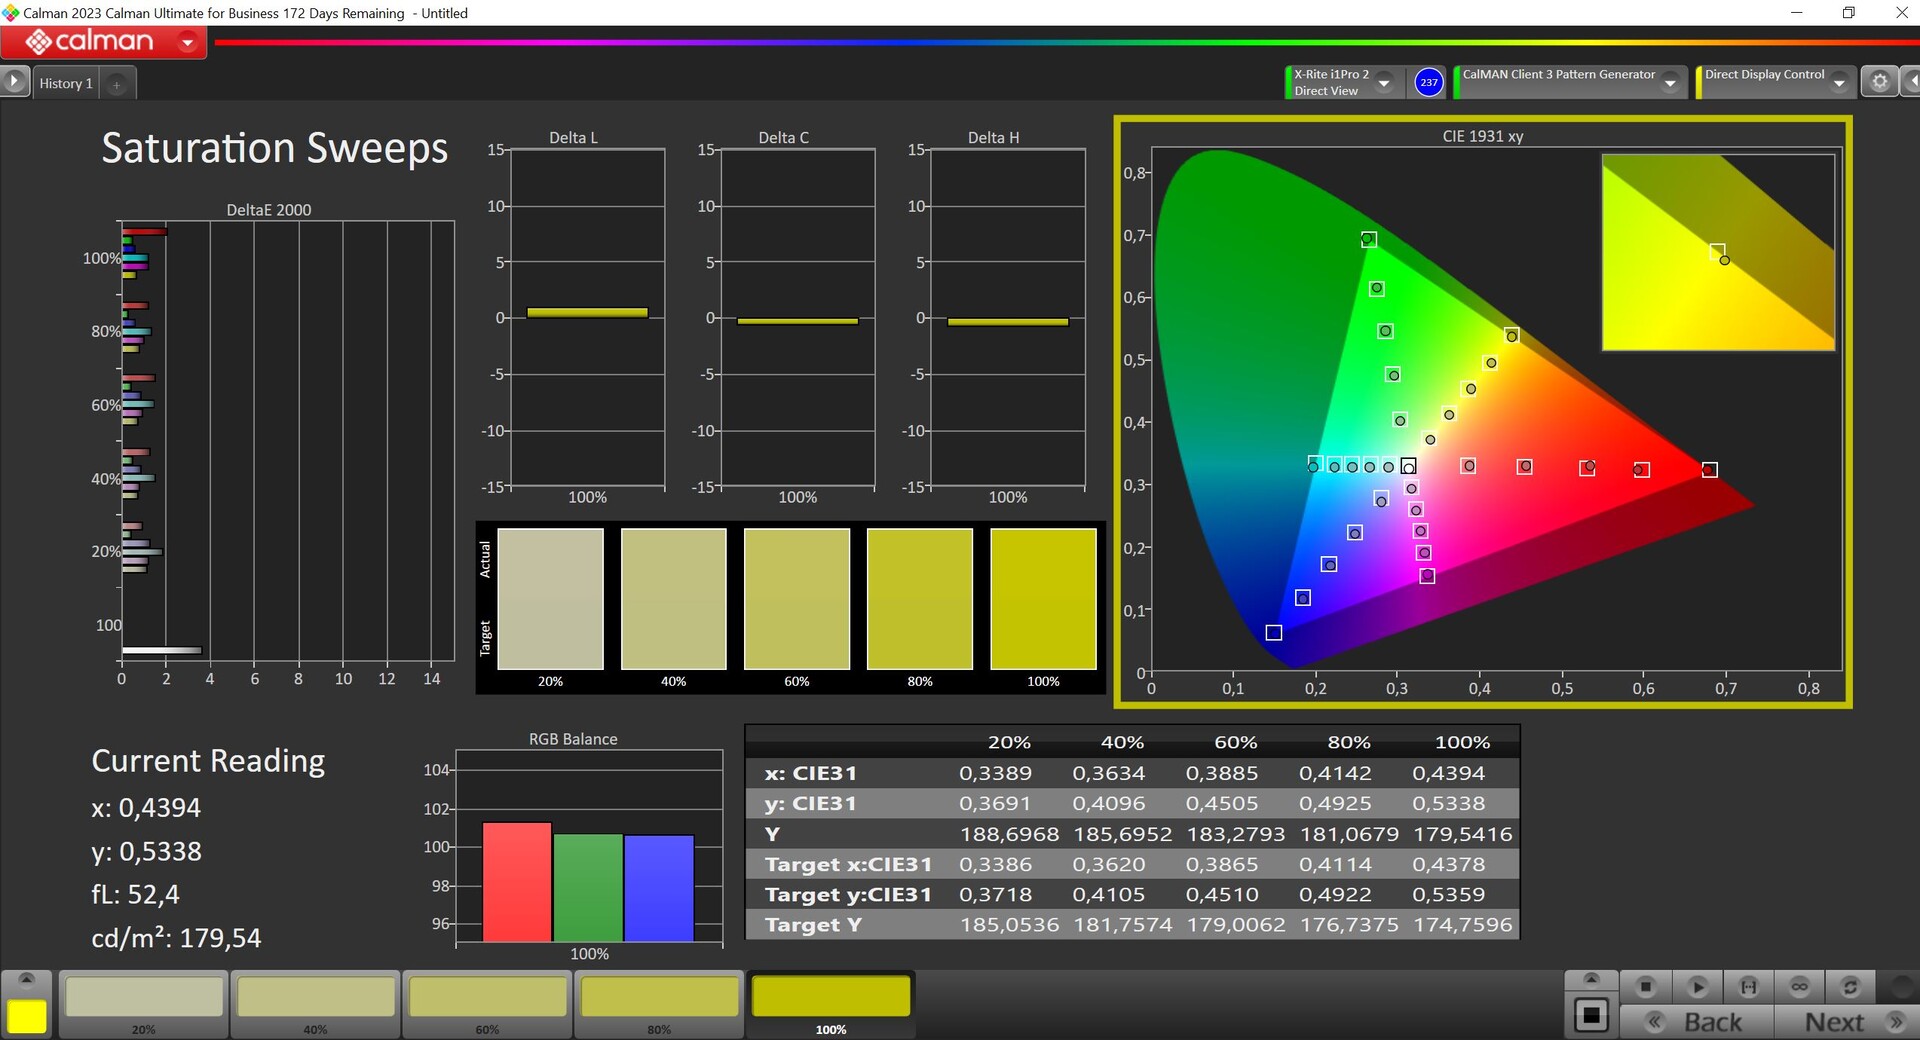

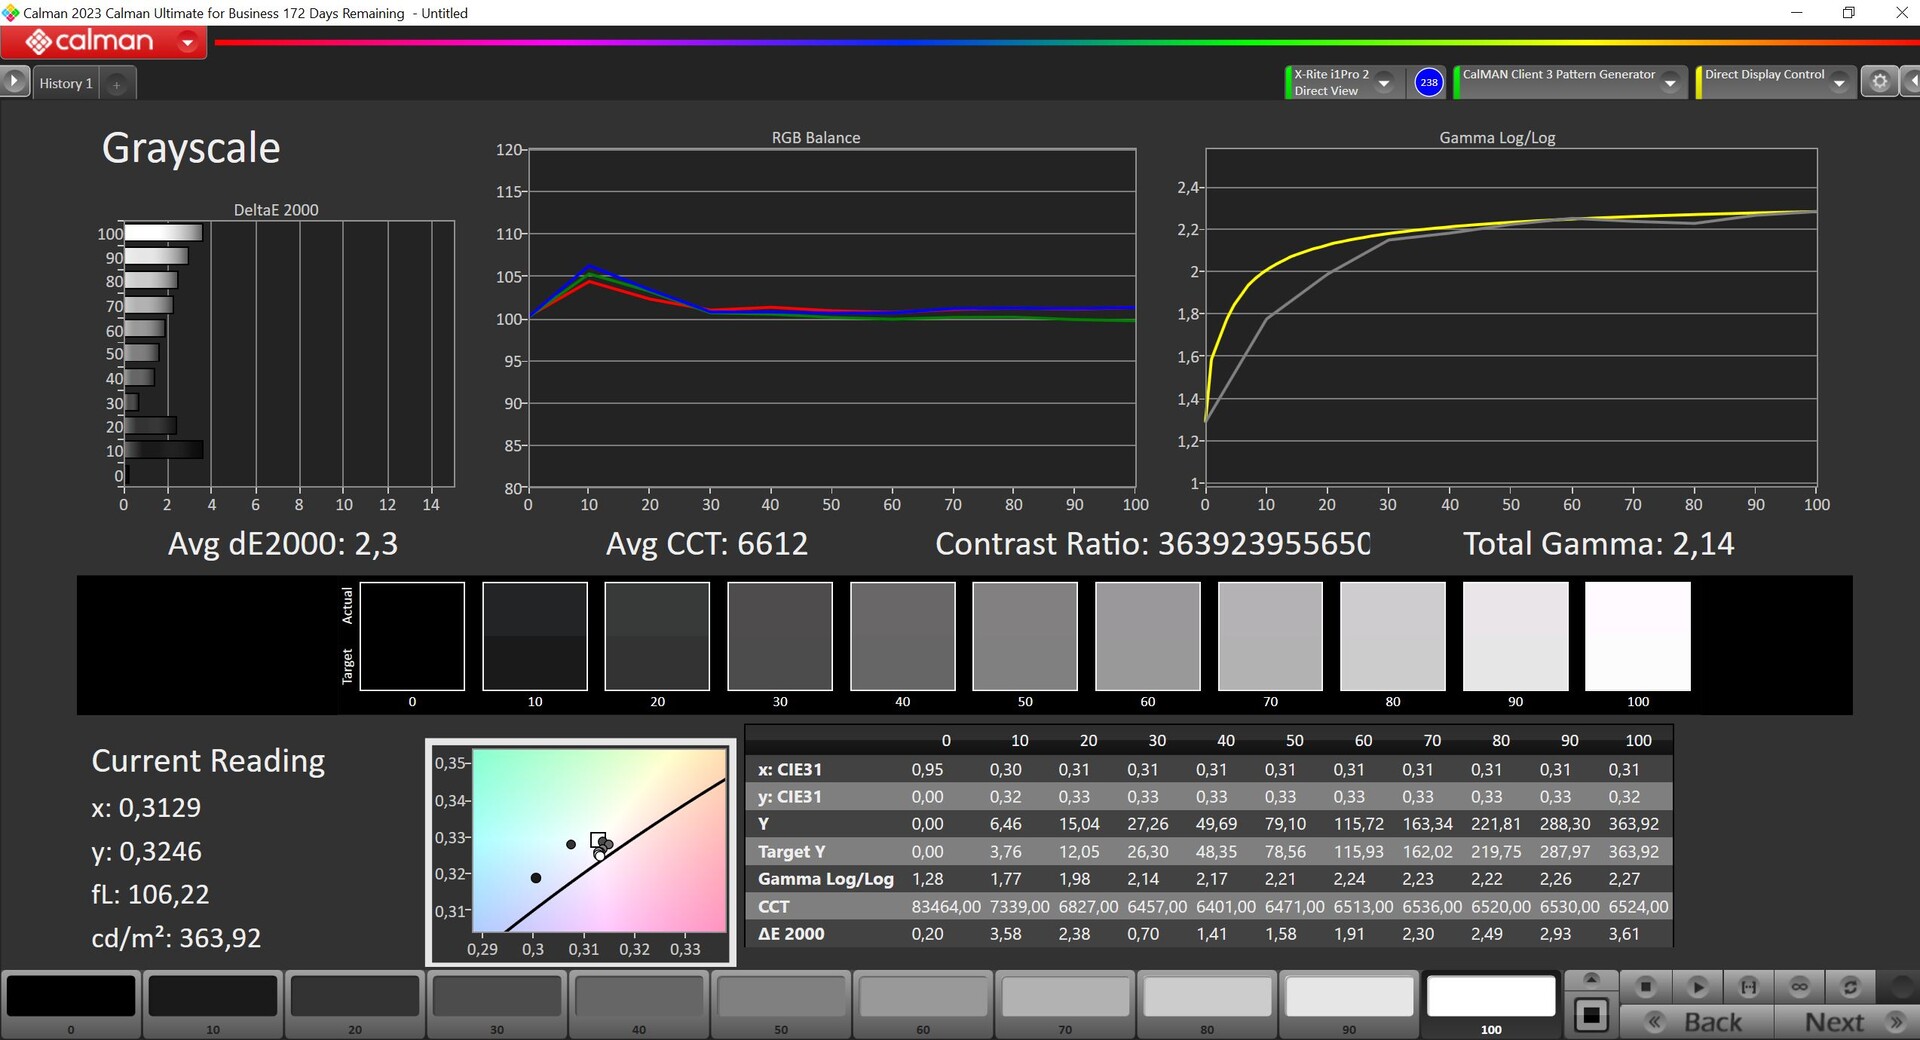


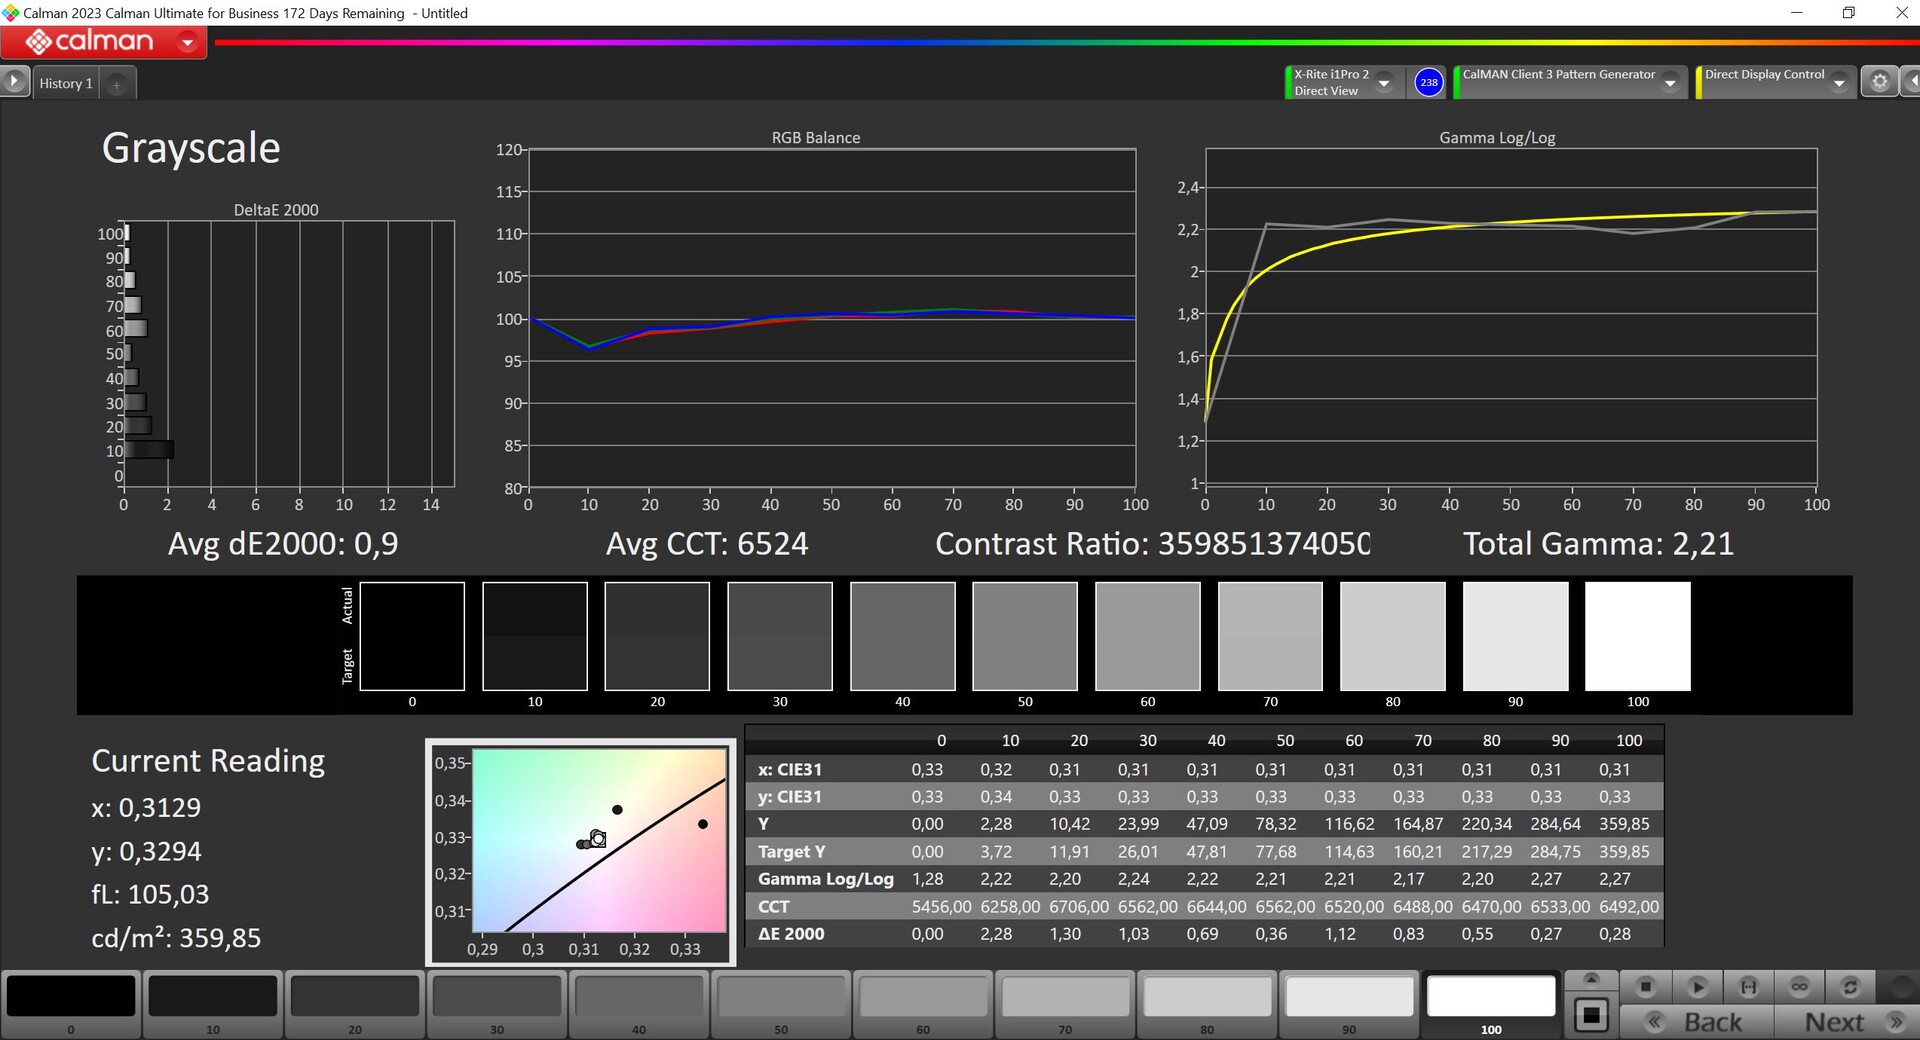
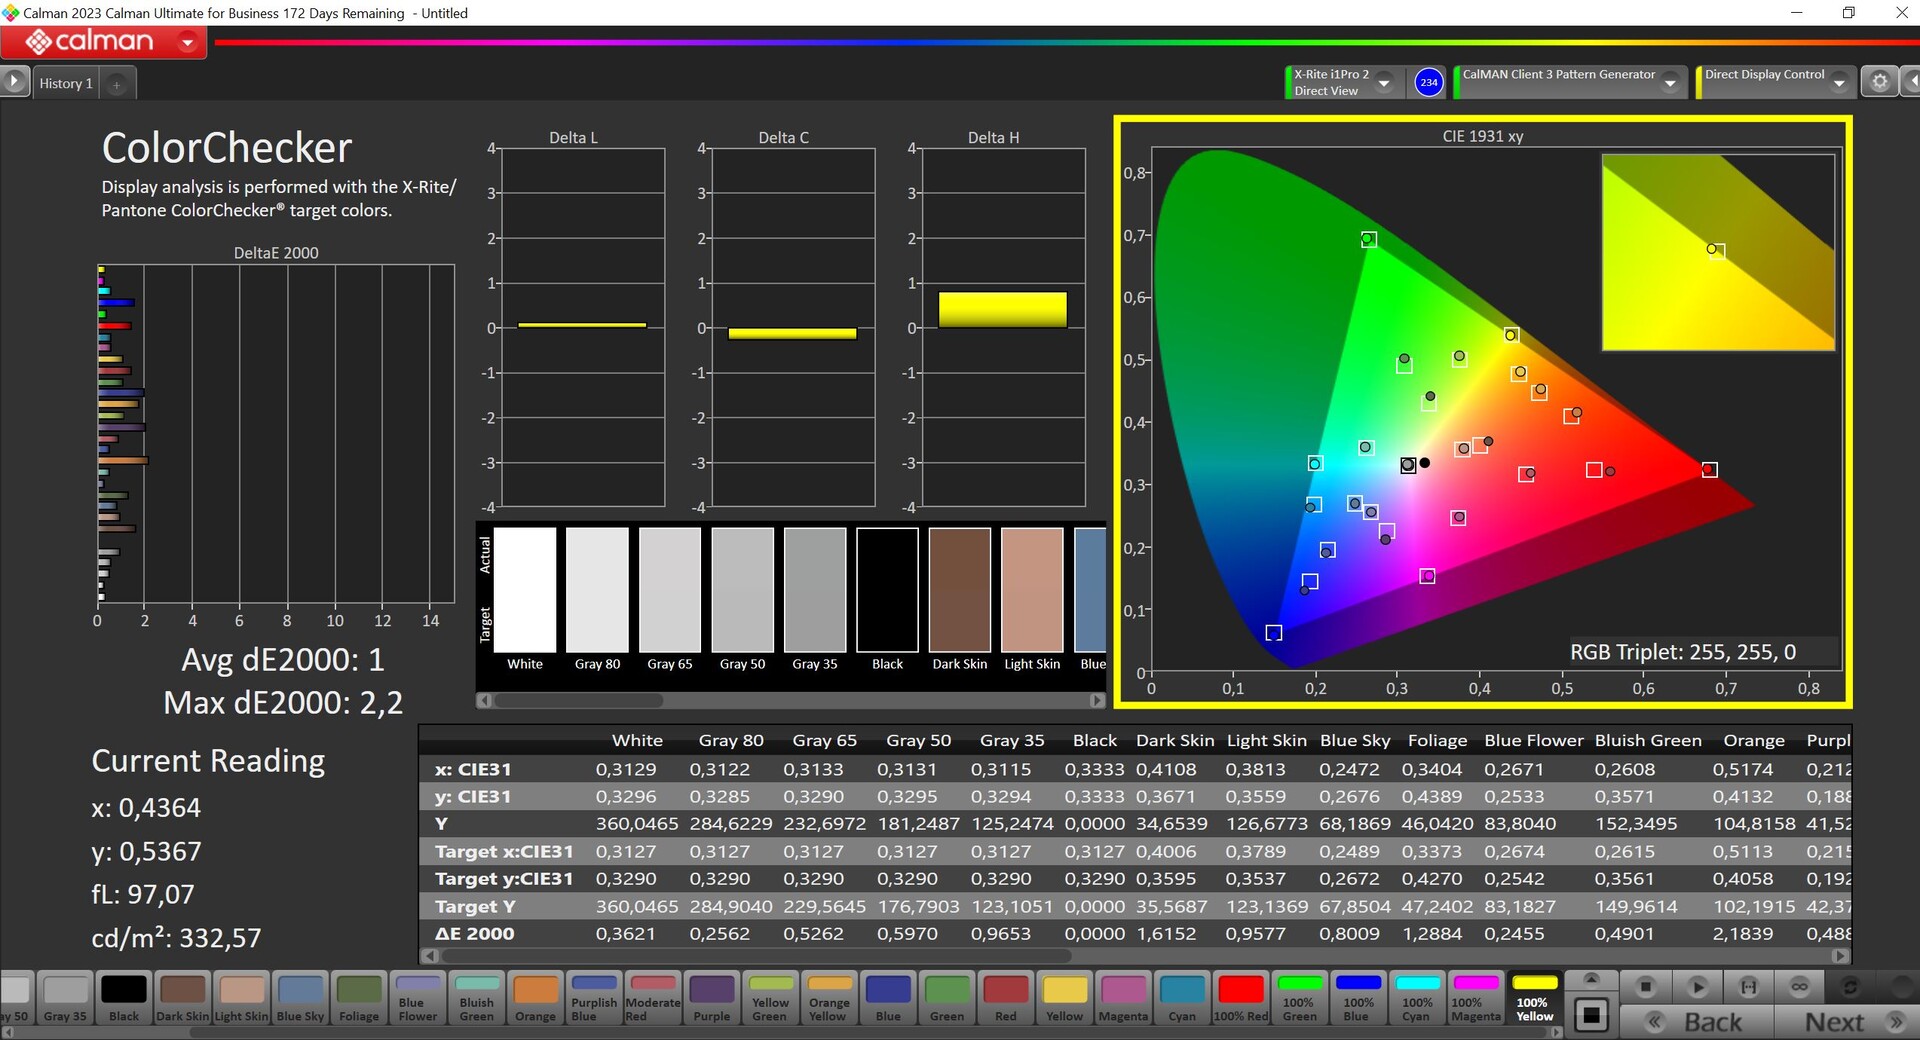
Paneli profesyonel CalMAN yazılımını (X-Rite i1 Pro 2) kullanarak analiz ettik. Dell farklı renk profilleri sunuyor ve önceden seçilen Vivid profili zaten çok doğru renkler sunuyor - yalnızca gri tonlar hala bazı hafif sapmalar gösteriyor. Kendi kalibrasyonumuzu kullanarak (ilgili profili yukarıda ücretsiz olarak indirebilirsiniz), tasviri daha da iyileştirebildik. Fotoğrafları düzenlemeyi seviyorsanız, renk alanını sRGB ile sınırlayan doğru Internet profilinin keyfini çıkaracaksınız.

Yanıt Sürelerini Görüntüle
| ↔ Tepki Süresi Siyahtan Beyaza | ||
|---|---|---|
| 0.85 ms ... yükseliş ↗ ve sonbahar↘ birleşimi | ↗ 0.46 ms yükseliş | 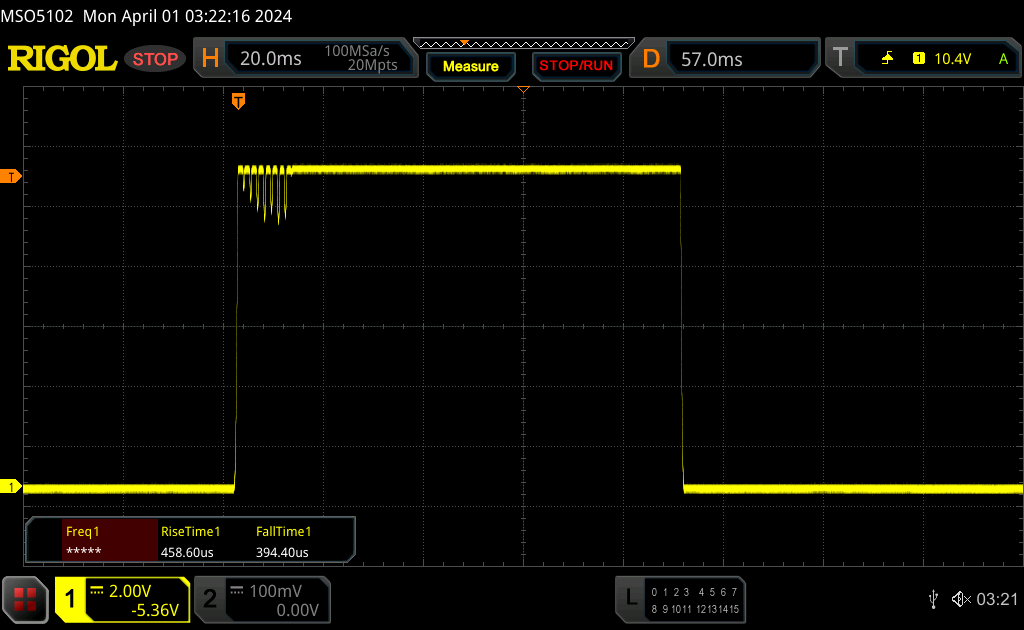 |
| ↘ 0.39 ms sonbahar | ||
| Ekran, testlerimizde çok hızlı yanıt oranları gösteriyor ve hızlı oyun oynamaya çok uygun olmalı. Karşılaştırıldığında, test edilen tüm cihazlar 0.1 (minimum) ile 240 (maksimum) ms arasında değişir. » Tüm cihazların 3 %'si daha iyi. Bu, ölçülen yanıt süresinin test edilen tüm cihazların ortalamasından (19.8 ms) daha iyi olduğu anlamına gelir. | ||
| ↔ Tepki Süresi %50 Griden %80 Griye | ||
| 0.82 ms ... yükseliş ↗ ve sonbahar↘ birleşimi | ↗ 0.43 ms yükseliş | 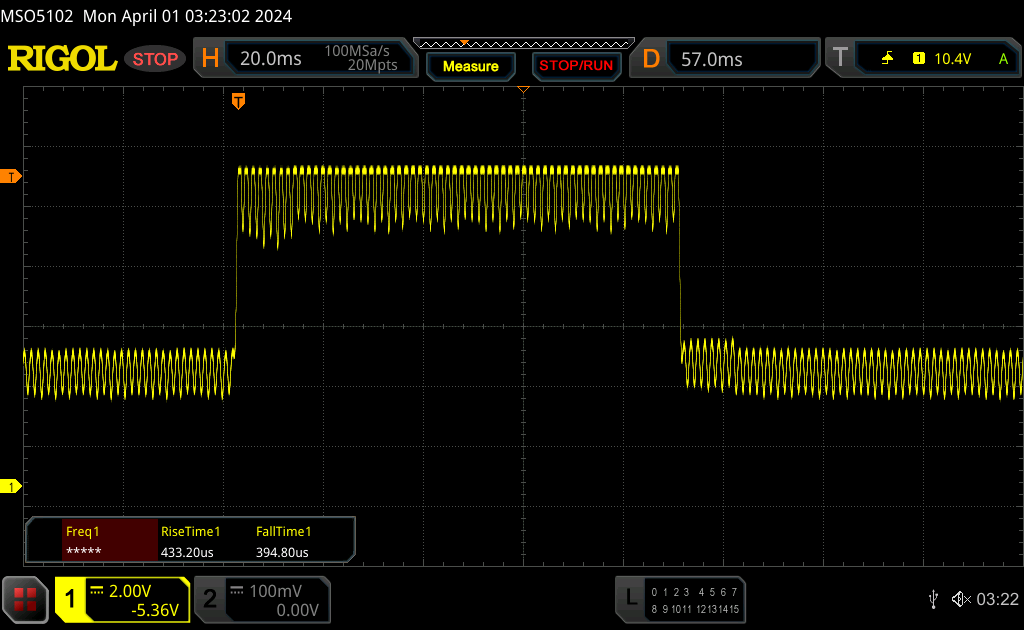 |
| ↘ 0.39 ms sonbahar | ||
| Ekran, testlerimizde çok hızlı yanıt oranları gösteriyor ve hızlı oyun oynamaya çok uygun olmalı. Karşılaştırıldığında, test edilen tüm cihazlar 0.165 (minimum) ile 636 (maksimum) ms arasında değişir. » Tüm cihazların 3 %'si daha iyi. Bu, ölçülen yanıt süresinin test edilen tüm cihazların ortalamasından (31 ms) daha iyi olduğu anlamına gelir. | ||
Ekran Titremesi / PWM (Darbe Genişliği Modülasyonu)
| Ekran titriyor / PWM algılandı | 360 Hz | ≤ 90 % parlaklık ayarı | 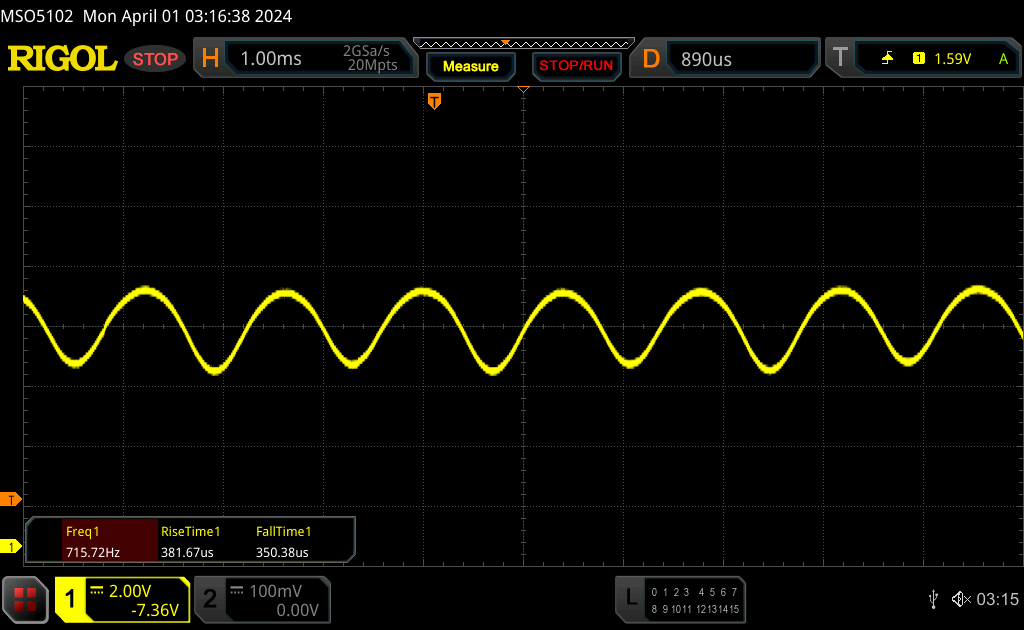 |
Ekran arka ışığı 360 Hz'de titriyor (en kötü durum, örneğin PWM kullanılması) 90 % ve altındaki parlaklık ayarında titreme algılandı. Bu parlaklık ayarının üzerinde titreme veya PWM olmamalıdır. 360 Hz frekansı nispeten yüksektir, bu nedenle PWM'ye duyarlı çoğu kullanıcı herhangi bir titremeyi fark etmemelidir. Ancak bazı kullanıcıların 500 Hz ve üzeri PWM'ye hâlâ duyarlı olduğuna dair raporlar var, bu nedenle dikkatli olun. Karşılaştırıldığında: Test edilen tüm cihazların %52 %'si ekranı karartmak için PWM kullanmıyor. PWM tespit edilirse, ortalama 7757 (minimum: 5 - maksimum: 343500) Hz ölçüldü. | |||

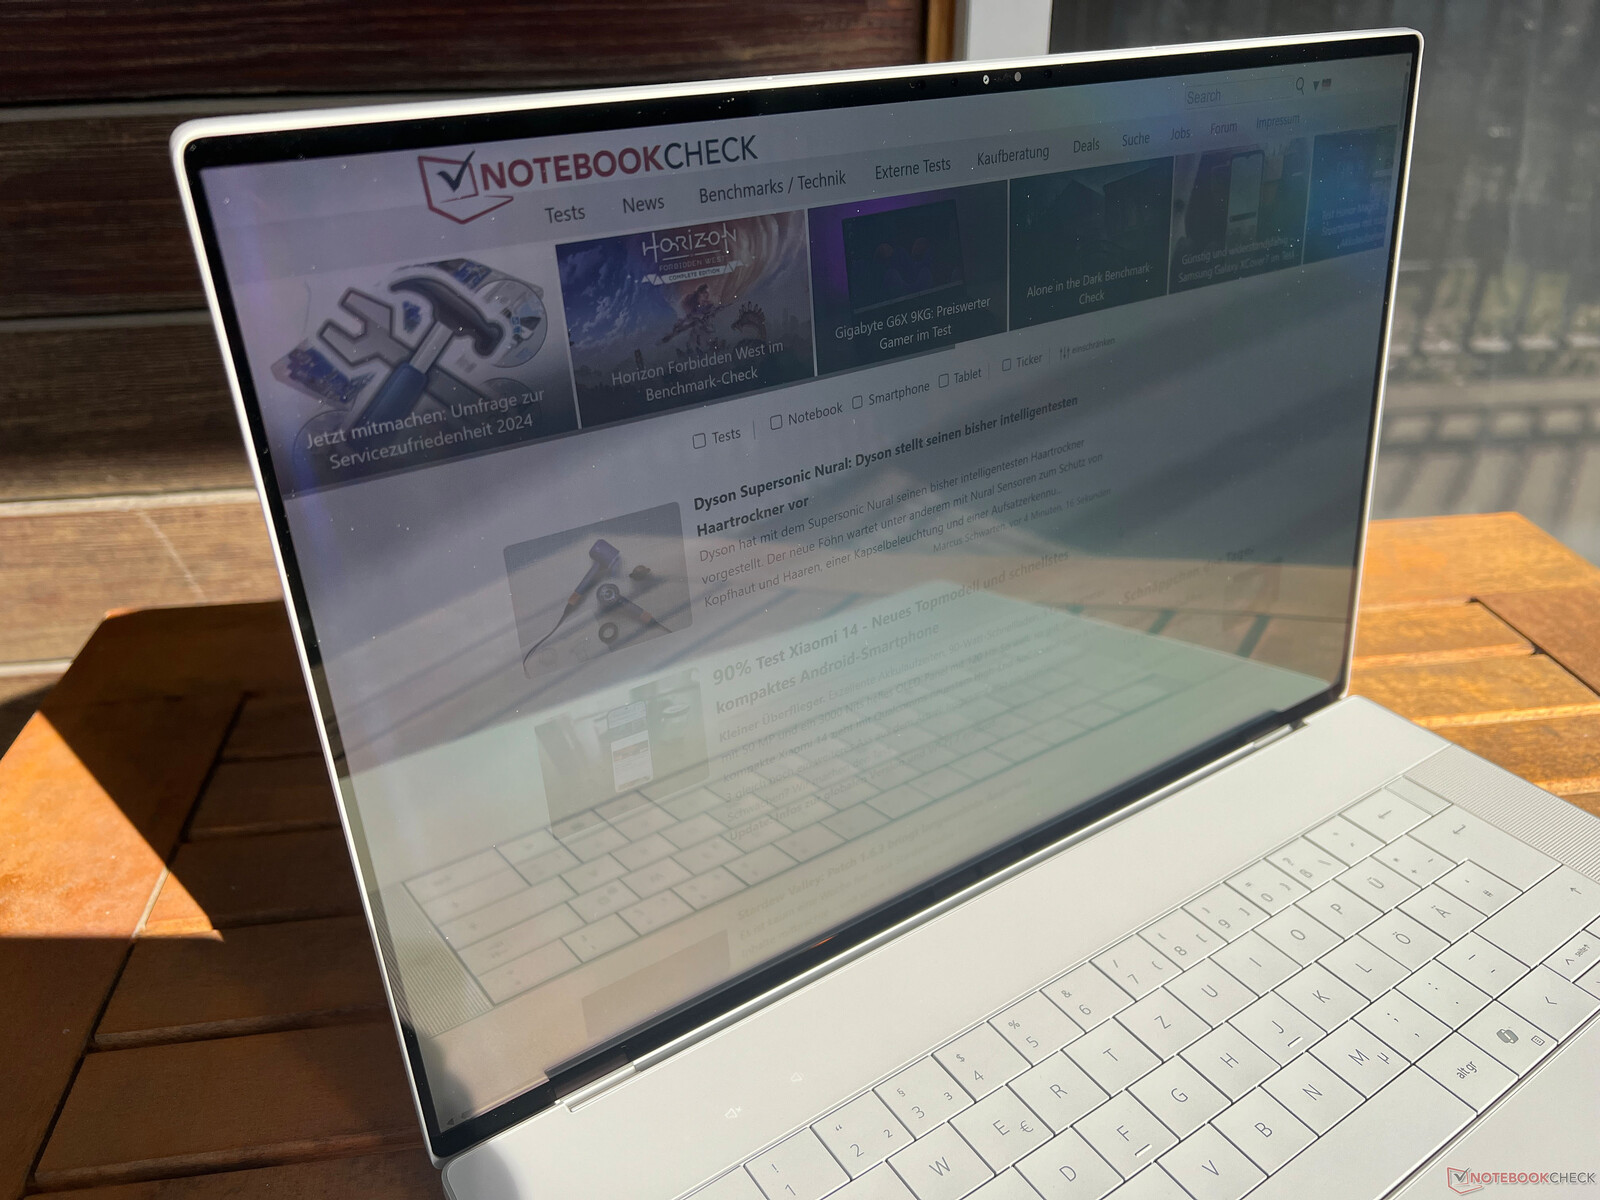
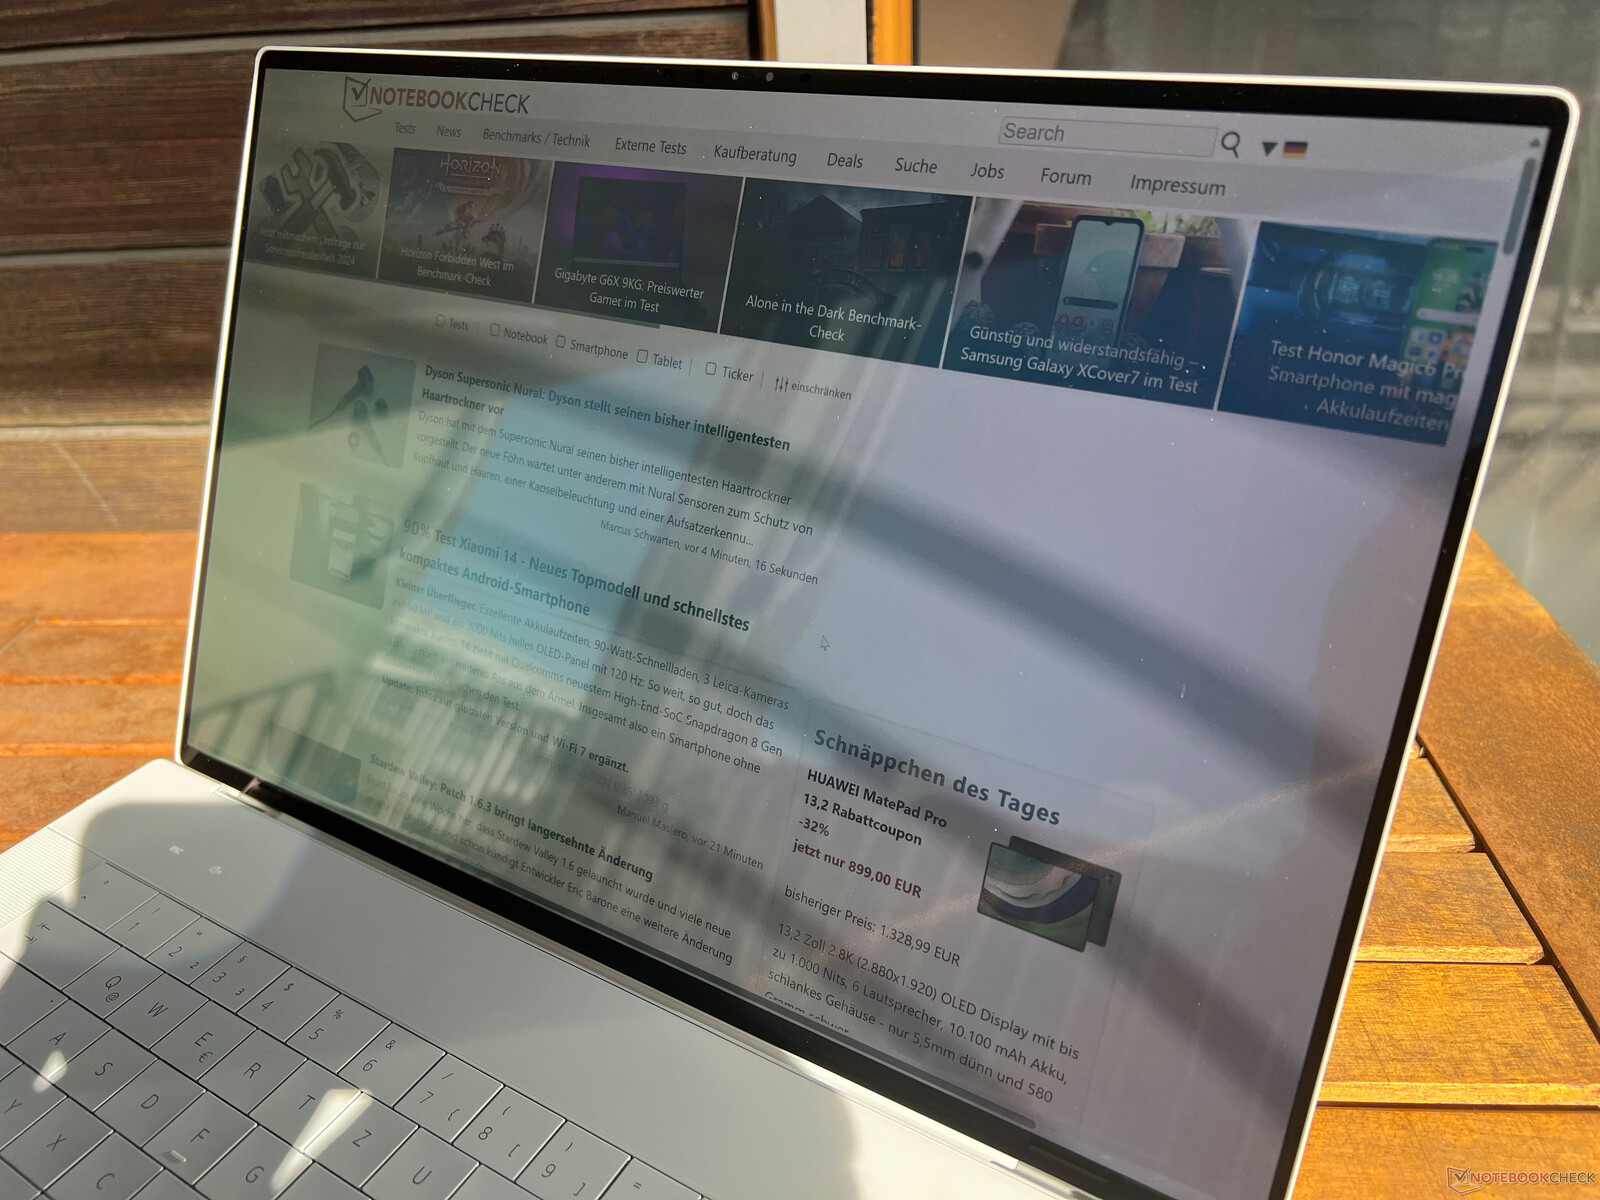
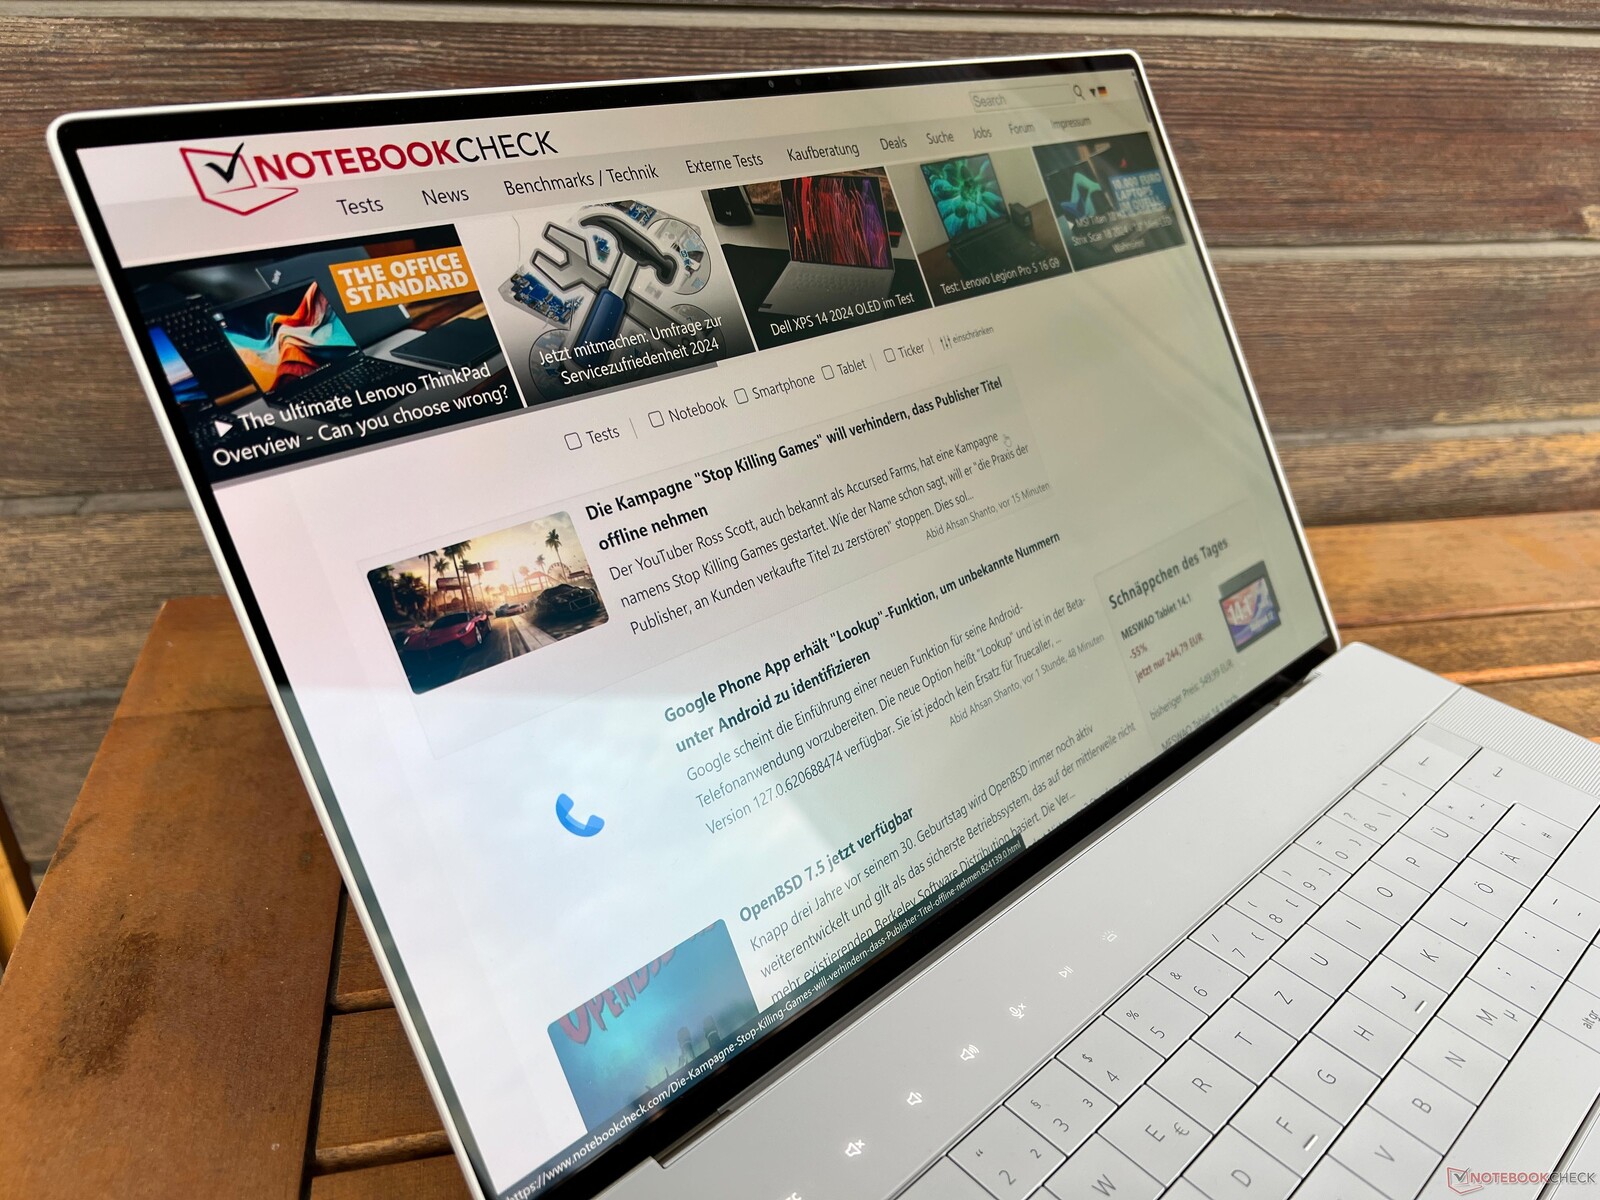
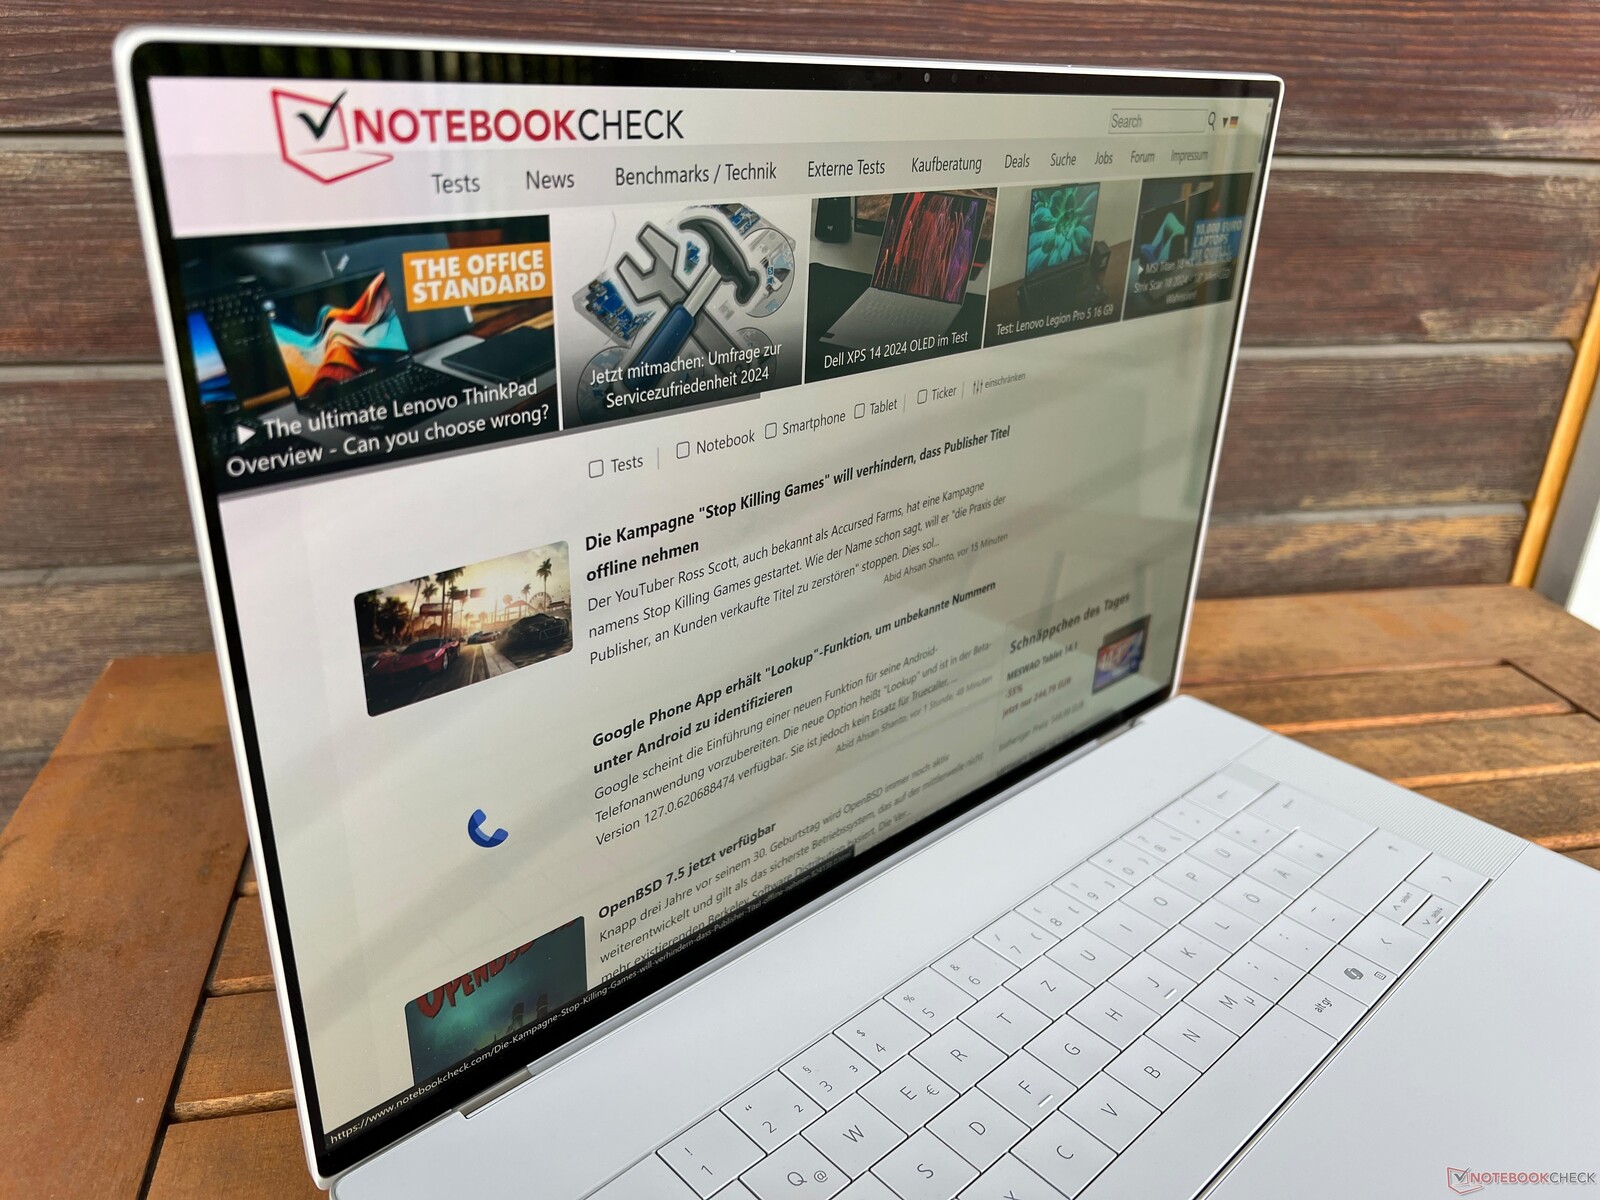
Dokunmatik ekran çok yansıtıcıdır ve yansımalar iç mekanlarda da sorun olabilir. Dışarıda da ışık kaynaklarından veya parlak yüzeylerden gelen yansımalardan kaçınmaya çalışmanız gerekecektir. Dizüstü bilgisayarı bulutlu günlerde kullanmak mümkündür, ancak çok fazla güneş ışığı alan parlak günlerde sorunlu olabilir. Görüş açısı stabilitesi genel olarak çok iyi, ancak ekranın merkezinden büyük sapmalar varsa, tipik OLED mavi parıltısı görülebilir.

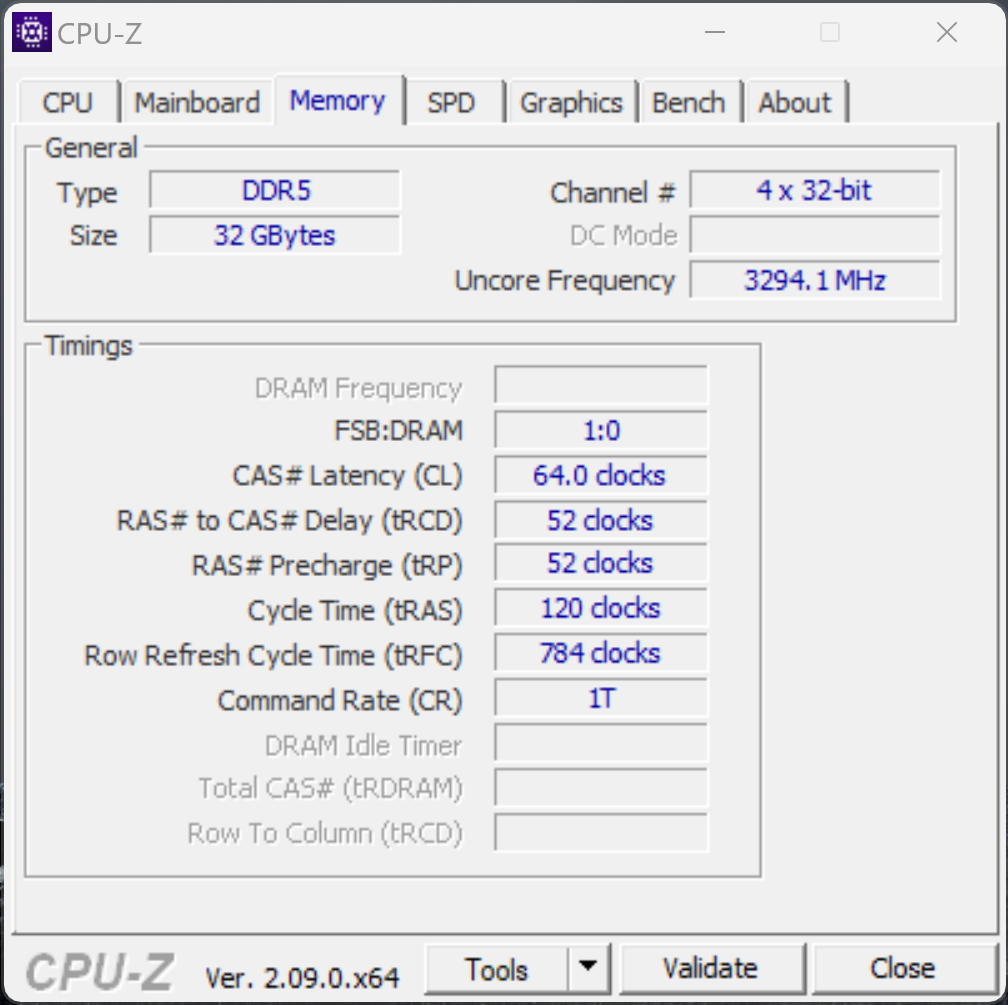
Performans - Gelişmiş Optimus ve 64 GB'a kadar RAM'e sahip XPS 16
Daha küçük olanlarda olduğu gibi XPS 14yeni XPS 16, özel bir grafik kartı olmadan yapılandırılabilir - ancak yalnızca 16 GB RAM (LPDDR5x-6400) ile birlikte. 32 GB RAM yalnızca özel GPU'larla birlikte kullanılabilir ve daha hızlı LPDDR5x-7467 RAM yalnızca RTX 4070 Dizüstü Bilgisayar. Eğer 64 GB RAM istiyorsanız, aynı zamanda Core Ultra 9 185H ve en azından RTX 4060 Dizüstü Bilgisayar. XPS 16, bir MUX anahtarı ve Gelişmiş Optimus grafik anahtarlaması ile donatılmıştır.
Test koşulları
Dell, kullanıcıların Windows performans ayarlarıyla da birleştirilebilen çeşitli enerji profilleri seçmelerine olanak tanır. Varsayılan profil Optimize edilmiştir, ancak grafik kartının tam performansı yalnızca Ultra Performans modu kullanılarak kullanılabilir. Bu iki profil kullanıldığında fan gürültüsü emisyonları çok benzer olduğundan, kıyaslamalarımız ve ölçümlerimiz için Ultra Performans modunu seçtik.
| Enerji profili | CPU yükü | CB R23 Multi | GPU yükü | Time Spy grafik | Cyberpunk 2077 QHD Ultra |
maks. fan gürültü emisyonları |
|---|---|---|---|---|---|---|
| Sessiz | 80 -> 75 watt | 18.296 puan | 50 watt | 8.186 puan | 30,8 fps | 43,3 dB(A) |
| Optimize edilmiş | 80 -> 75 watt | 18.248 puan | 50 watt | 8.532 puan | 37,4fps | 48,1 dB(A) |
| Ultra Performans | 100 -> 85 watt | 18.518 puan | 60 watt | 9.638 puan | 39,6 fps | 49,7 dB(A) |
Testimiz sırasında, grafik değiştirme işlemi sırasında bir hatayla karşılaştık, çünkü V-Sync tam ekran modunda her zaman aktifti. Pencereli modda ve grafik sürücüsünde Nvidia GPU manuel olarak seçildiğinde sorun oluşmadı. Harici bir monitör bağlandığında, normal Optimus anahtarlama aktiftir (tüm Thunderbolt bağlantı noktaları Intel GPU üzerinden çalıştığı için) ve sorun burada da bulunabilir.
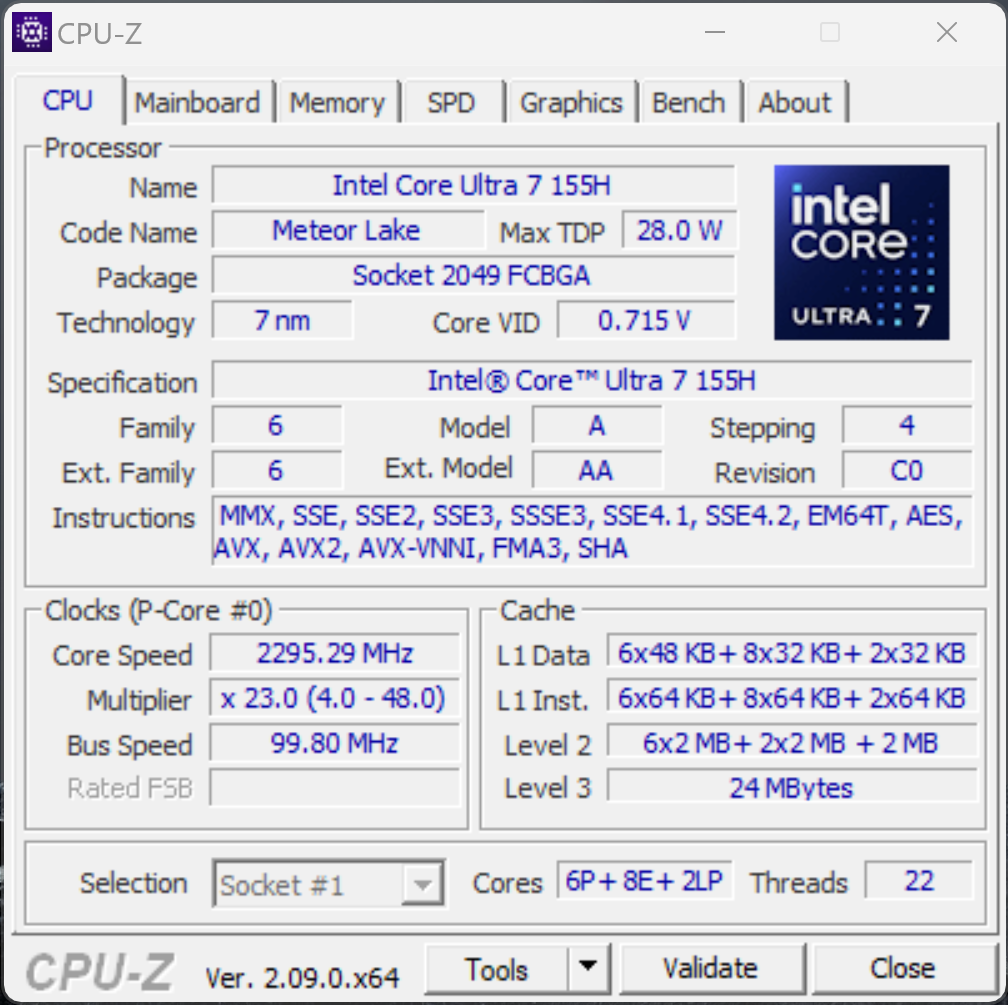
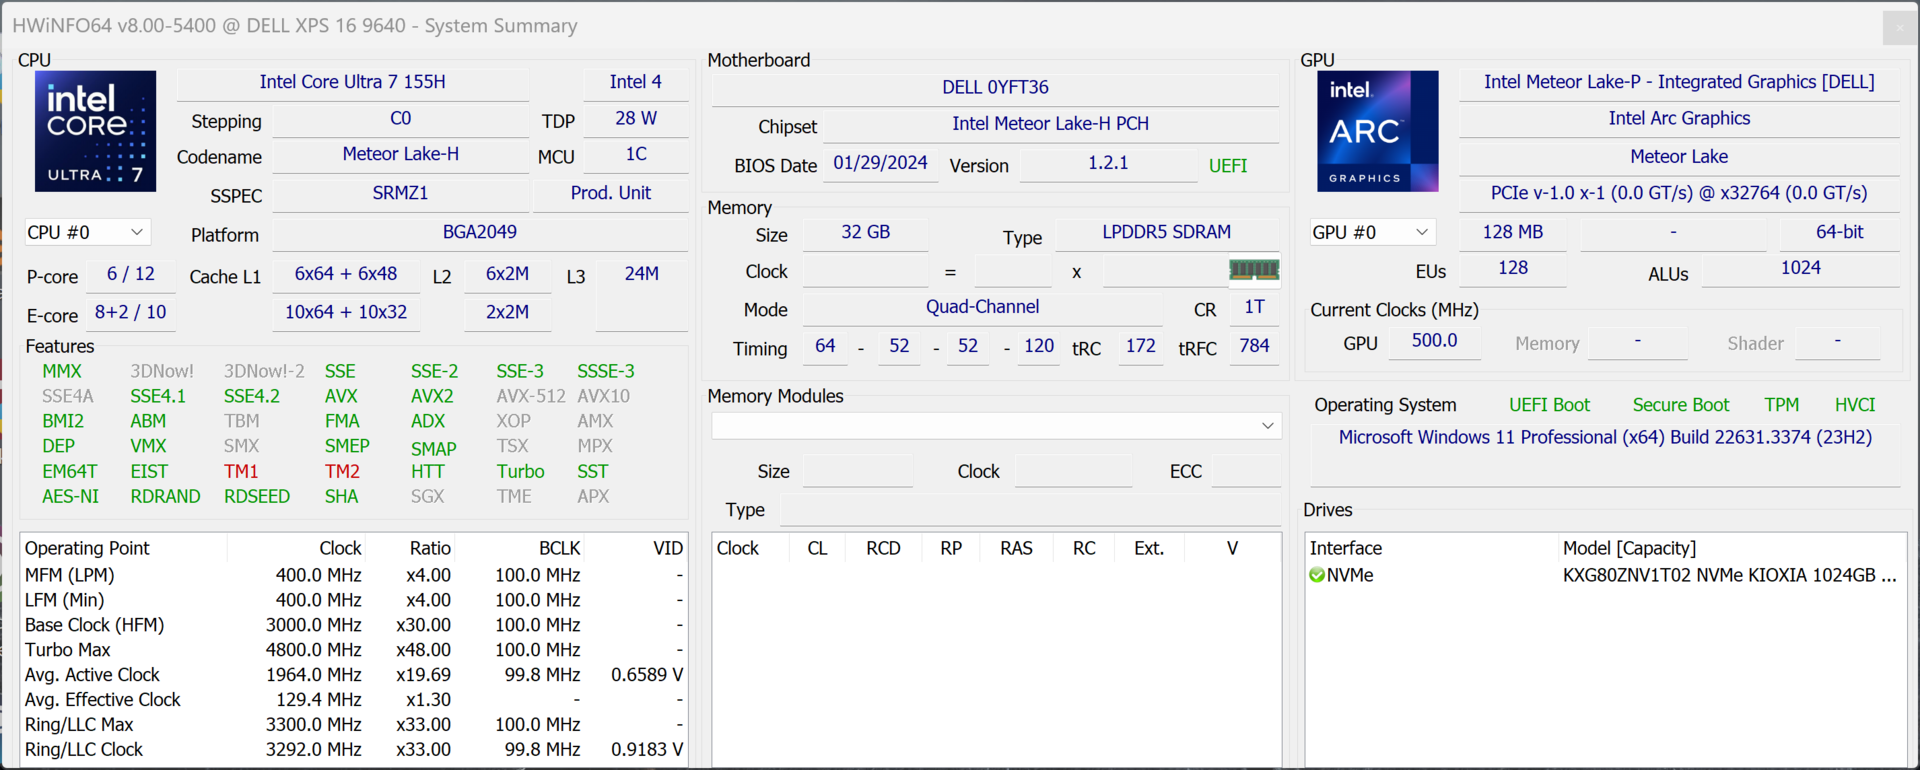
İşlemci - Core Ultra 7 155H
Bu Core Ultra 7 155H intel'in mevcut Meteor Lake neslinin bir parçasıdır ve eski Core i7-13700H. 16 çekirdeğe (22 iş parçacığı) sahiptir ve maksimum 4,8 GHz çekirdek saat hızına ulaşır. Ayrıca, yüksek güç limitleri (100/85 watt) sayesinde genel çok çekirdekli performansı da harika. Bununla birlikte, eski Raptor Lake yongalarına göre neredeyse hiçbir performans avantajı yoktur ve tek tek cihazlar arasındaki farklar, farklı güç sınırlarının bir sonucudur. Öte yandan, tek çekirdek performansı söz konusu olduğunda, yeni Meteor Lake yongaları 13700H gibi eski Raptor Lake modellerine göre hafif bir dezavantaja sahiptir. Batarya kullanımında, işlemcinin 75/45 watt tüketmesine izin veriliyor (bu sayede 75 watt oldukça uzun bir süre tutulabiliyor) ve çok çekirdekli performansı sadece yaklaşık %4 düşüyor. Buna karşılık, daha uzun süreli yük altında farklar daha büyüktür. Diğer CPU kıyaslamalarını şurada bulabilirsiniz teknoloji bölümümüz.
Cinebench R15 Multi continuous test
Cinebench R23: Multi Core | Single Core
Cinebench R20: CPU (Multi Core) | CPU (Single Core)
Cinebench R15: CPU Multi 64Bit | CPU Single 64Bit
Blender: v2.79 BMW27 CPU
7-Zip 18.03: 7z b 4 | 7z b 4 -mmt1
Geekbench 6.7: Multi-Core | Single-Core
Geekbench 5.5: Multi-Core | Single-Core
HWBOT x265 Benchmark v2.2: 4k Preset
LibreOffice : 20 Documents To PDF
R Benchmark 2.5: Overall mean
| CPU Performance rating | |
| Lenovo Yoga Pro 9 16-IRP G8 | |
| Honor MagicBook Pro 16 2024 | |
| Dell XPS 16 9640 | |
| Sınıf ortalaması Multimedia | |
| Asus ROG Zephyrus G16 2024 GU605M | |
| Dell XPS 15 9530 RTX 4070 -2! | |
| Samsung Galaxy Book4 Ultra | |
| Schenker VISION 16 Pro (M23) -2! | |
| Ortalama Intel Core Ultra 7 155H | |
| Cinebench R23 / Multi Core | |
| Lenovo Yoga Pro 9 16-IRP G8 | |
| Honor MagicBook Pro 16 2024 | |
| Dell XPS 16 9640 | |
| Asus ROG Zephyrus G16 2024 GU605M | |
| Sınıf ortalaması Multimedia (4861 - 33362, n=76, son 2 yıl) | |
| Samsung Galaxy Book4 Ultra | |
| Dell XPS 15 9530 RTX 4070 | |
| Ortalama Intel Core Ultra 7 155H (9769 - 19007, n=52) | |
| Schenker VISION 16 Pro (M23) | |
| Cinebench R23 / Single Core | |
| Sınıf ortalaması Multimedia (1128 - 2459, n=68, son 2 yıl) | |
| Schenker VISION 16 Pro (M23) | |
| Lenovo Yoga Pro 9 16-IRP G8 | |
| Dell XPS 15 9530 RTX 4070 | |
| Dell XPS 16 9640 | |
| Samsung Galaxy Book4 Ultra | |
| Honor MagicBook Pro 16 2024 | |
| Ortalama Intel Core Ultra 7 155H (1496 - 1815, n=52) | |
| Asus ROG Zephyrus G16 2024 GU605M | |
| Cinebench R20 / CPU (Multi Core) | |
| Lenovo Yoga Pro 9 16-IRP G8 | |
| Honor MagicBook Pro 16 2024 | |
| Dell XPS 16 9640 | |
| Asus ROG Zephyrus G16 2024 GU605M | |
| Sınıf ortalaması Multimedia (1887 - 12912, n=59, son 2 yıl) | |
| Samsung Galaxy Book4 Ultra | |
| Dell XPS 15 9530 RTX 4070 | |
| Ortalama Intel Core Ultra 7 155H (3798 - 7409, n=50) | |
| Schenker VISION 16 Pro (M23) | |
| Cinebench R20 / CPU (Single Core) | |
| Lenovo Yoga Pro 9 16-IRP G8 | |
| Sınıf ortalaması Multimedia (425 - 853, n=59, son 2 yıl) | |
| Schenker VISION 16 Pro (M23) | |
| Dell XPS 15 9530 RTX 4070 | |
| Asus ROG Zephyrus G16 2024 GU605M | |
| Samsung Galaxy Book4 Ultra | |
| Honor MagicBook Pro 16 2024 | |
| Dell XPS 16 9640 | |
| Ortalama Intel Core Ultra 7 155H (601 - 696, n=50) | |
| Cinebench R15 / CPU Multi 64Bit | |
| Lenovo Yoga Pro 9 16-IRP G8 | |
| Honor MagicBook Pro 16 2024 | |
| Dell XPS 16 9640 | |
| Asus ROG Zephyrus G16 2024 GU605M | |
| Dell XPS 15 9530 RTX 4070 | |
| Sınıf ortalaması Multimedia (856 - 5224, n=63, son 2 yıl) | |
| Samsung Galaxy Book4 Ultra | |
| Ortalama Intel Core Ultra 7 155H (1932 - 2880, n=56) | |
| Schenker VISION 16 Pro (M23) | |
| Cinebench R15 / CPU Single 64Bit | |
| Sınıf ortalaması Multimedia (184.8 - 326, n=61, son 2 yıl) | |
| Schenker VISION 16 Pro (M23) | |
| Lenovo Yoga Pro 9 16-IRP G8 | |
| Dell XPS 15 9530 RTX 4070 | |
| Honor MagicBook Pro 16 2024 | |
| Asus ROG Zephyrus G16 2024 GU605M | |
| Dell XPS 16 9640 | |
| Samsung Galaxy Book4 Ultra | |
| Ortalama Intel Core Ultra 7 155H (99.6 - 268, n=52) | |
| Blender / v2.79 BMW27 CPU | |
| Sınıf ortalaması Multimedia (100 - 557, n=60, son 2 yıl) | |
| Ortalama Intel Core Ultra 7 155H (175 - 381, n=47) | |
| Schenker VISION 16 Pro (M23) | |
| Samsung Galaxy Book4 Ultra | |
| Dell XPS 15 9530 RTX 4070 | |
| Asus ROG Zephyrus G16 2024 GU605M | |
| Honor MagicBook Pro 16 2024 | |
| Dell XPS 16 9640 | |
| Lenovo Yoga Pro 9 16-IRP G8 | |
| 7-Zip 18.03 / 7z b 4 | |
| Lenovo Yoga Pro 9 16-IRP G8 | |
| Dell XPS 16 9640 | |
| Honor MagicBook Pro 16 2024 | |
| Asus ROG Zephyrus G16 2024 GU605M | |
| Samsung Galaxy Book4 Ultra | |
| Schenker VISION 16 Pro (M23) | |
| Dell XPS 15 9530 RTX 4070 | |
| Ortalama Intel Core Ultra 7 155H (41739 - 70254, n=50) | |
| Sınıf ortalaması Multimedia (26062 - 130368, n=57, son 2 yıl) | |
| 7-Zip 18.03 / 7z b 4 -mmt1 | |
| Schenker VISION 16 Pro (M23) | |
| Dell XPS 15 9530 RTX 4070 | |
| Lenovo Yoga Pro 9 16-IRP G8 | |
| Sınıf ortalaması Multimedia (3666 - 7545, n=58, son 2 yıl) | |
| Samsung Galaxy Book4 Ultra | |
| Honor MagicBook Pro 16 2024 | |
| Dell XPS 16 9640 | |
| Asus ROG Zephyrus G16 2024 GU605M | |
| Ortalama Intel Core Ultra 7 155H (4594 - 5621, n=50) | |
| Geekbench 6.7 / Multi-Core | |
| Sınıf ortalaması Multimedia (4983 - 29415, n=71, son 2 yıl) | |
| Lenovo Yoga Pro 9 16-IRP G8 | |
| Dell XPS 16 9640 | |
| Asus ROG Zephyrus G16 2024 GU605M | |
| Honor MagicBook Pro 16 2024 | |
| Samsung Galaxy Book4 Ultra | |
| Ortalama Intel Core Ultra 7 155H (7732 - 13656, n=55) | |
| Geekbench 6.7 / Single-Core | |
| Sınıf ortalaması Multimedia (1534 - 4335, n=70, son 2 yıl) | |
| Lenovo Yoga Pro 9 16-IRP G8 | |
| Honor MagicBook Pro 16 2024 | |
| Samsung Galaxy Book4 Ultra | |
| Dell XPS 16 9640 | |
| Asus ROG Zephyrus G16 2024 GU605M | |
| Ortalama Intel Core Ultra 7 155H (1901 - 2473, n=52) | |
| Geekbench 5.5 / Multi-Core | |
| Lenovo Yoga Pro 9 16-IRP G8 | |
| Dell XPS 16 9640 | |
| Dell XPS 15 9530 RTX 4070 | |
| Honor MagicBook Pro 16 2024 | |
| Sınıf ortalaması Multimedia (4652 - 20422, n=58, son 2 yıl) | |
| Asus ROG Zephyrus G16 2024 GU605M | |
| Samsung Galaxy Book4 Ultra | |
| Ortalama Intel Core Ultra 7 155H (10017 - 13556, n=52) | |
| Schenker VISION 16 Pro (M23) | |
| Geekbench 5.5 / Single-Core | |
| Sınıf ortalaması Multimedia (805 - 2974, n=58, son 2 yıl) | |
| Dell XPS 15 9530 RTX 4070 | |
| Schenker VISION 16 Pro (M23) | |
| Samsung Galaxy Book4 Ultra | |
| Honor MagicBook Pro 16 2024 | |
| Lenovo Yoga Pro 9 16-IRP G8 | |
| Dell XPS 16 9640 | |
| Asus ROG Zephyrus G16 2024 GU605M | |
| Ortalama Intel Core Ultra 7 155H (1462 - 1824, n=52) | |
| HWBOT x265 Benchmark v2.2 / 4k Preset | |
| Lenovo Yoga Pro 9 16-IRP G8 | |
| Dell XPS 16 9640 | |
| Honor MagicBook Pro 16 2024 | |
| Asus ROG Zephyrus G16 2024 GU605M | |
| Sınıf ortalaması Multimedia (5.26 - 36.1, n=58, son 2 yıl) | |
| Dell XPS 15 9530 RTX 4070 | |
| Samsung Galaxy Book4 Ultra | |
| Schenker VISION 16 Pro (M23) | |
| Ortalama Intel Core Ultra 7 155H (9.93 - 21.2, n=50) | |
| LibreOffice / 20 Documents To PDF | |
| Sınıf ortalaması Multimedia (23.9 - 146.7, n=59, son 2 yıl) | |
| Asus ROG Zephyrus G16 2024 GU605M | |
| Ortalama Intel Core Ultra 7 155H (37.5 - 79.2, n=49) | |
| Lenovo Yoga Pro 9 16-IRP G8 | |
| Schenker VISION 16 Pro (M23) | |
| Honor MagicBook Pro 16 2024 | |
| Samsung Galaxy Book4 Ultra | |
| Dell XPS 16 9640 | |
| Dell XPS 15 9530 RTX 4070 | |
| R Benchmark 2.5 / Overall mean | |
| Dell XPS 16 9640 | |
| Ortalama Intel Core Ultra 7 155H (0.4457 - 0.53, n=49) | |
| Samsung Galaxy Book4 Ultra | |
| Asus ROG Zephyrus G16 2024 GU605M | |
| Sınıf ortalaması Multimedia (0.3604 - 0.947, n=58, son 2 yıl) | |
| Honor MagicBook Pro 16 2024 | |
| Lenovo Yoga Pro 9 16-IRP G8 | |
| Dell XPS 15 9530 RTX 4070 | |
| Schenker VISION 16 Pro (M23) | |
* ... daha küçük daha iyidir
AIDA64: FP32 Ray-Trace | FPU Julia | CPU SHA3 | CPU Queen | FPU SinJulia | FPU Mandel | CPU AES | CPU ZLib | FP64 Ray-Trace | CPU PhotoWorxx
| Performance rating | |
| Honor MagicBook Pro 16 2024 | |
| Lenovo Yoga Pro 9 16-IRP G8 | |
| Dell XPS 16 9640 | |
| Asus ROG Zephyrus G16 2024 GU605M | |
| Sınıf ortalaması Multimedia | |
| Samsung Galaxy Book4 Ultra | |
| Schenker VISION 16 Pro (M23) | |
| Dell XPS 15 9530 RTX 4070 | |
| Ortalama Intel Core Ultra 7 155H | |
| AIDA64 / FP32 Ray-Trace | |
| Sınıf ortalaması Multimedia (2214 - 50388, n=55, son 2 yıl) | |
| Lenovo Yoga Pro 9 16-IRP G8 | |
| Honor MagicBook Pro 16 2024 | |
| Dell XPS 16 9640 | |
| Asus ROG Zephyrus G16 2024 GU605M | |
| Dell XPS 15 9530 RTX 4070 | |
| Samsung Galaxy Book4 Ultra | |
| Schenker VISION 16 Pro (M23) | |
| Ortalama Intel Core Ultra 7 155H (6670 - 18470, n=50) | |
| AIDA64 / FPU Julia | |
| Honor MagicBook Pro 16 2024 | |
| Lenovo Yoga Pro 9 16-IRP G8 | |
| Dell XPS 16 9640 | |
| Asus ROG Zephyrus G16 2024 GU605M | |
| Sınıf ortalaması Multimedia (12867 - 201874, n=56, son 2 yıl) | |
| Samsung Galaxy Book4 Ultra | |
| Schenker VISION 16 Pro (M23) | |
| Ortalama Intel Core Ultra 7 155H (40905 - 93181, n=50) | |
| Dell XPS 15 9530 RTX 4070 | |
| AIDA64 / CPU SHA3 | |
| Honor MagicBook Pro 16 2024 | |
| Lenovo Yoga Pro 9 16-IRP G8 | |
| Dell XPS 16 9640 | |
| Sınıf ortalaması Multimedia (626 - 8623, n=56, son 2 yıl) | |
| Asus ROG Zephyrus G16 2024 GU605M | |
| Samsung Galaxy Book4 Ultra | |
| Ortalama Intel Core Ultra 7 155H (1940 - 4436, n=50) | |
| Schenker VISION 16 Pro (M23) | |
| Dell XPS 15 9530 RTX 4070 | |
| AIDA64 / CPU Queen | |
| Lenovo Yoga Pro 9 16-IRP G8 | |
| Dell XPS 15 9530 RTX 4070 | |
| Schenker VISION 16 Pro (M23) | |
| Asus ROG Zephyrus G16 2024 GU605M | |
| Dell XPS 16 9640 | |
| Samsung Galaxy Book4 Ultra | |
| Honor MagicBook Pro 16 2024 | |
| Ortalama Intel Core Ultra 7 155H (64698 - 94181, n=50) | |
| Sınıf ortalaması Multimedia (13483 - 181505, n=43, son 2 yıl) | |
| AIDA64 / FPU SinJulia | |
| Lenovo Yoga Pro 9 16-IRP G8 | |
| Asus ROG Zephyrus G16 2024 GU605M | |
| Honor MagicBook Pro 16 2024 | |
| Dell XPS 16 9640 | |
| Samsung Galaxy Book4 Ultra | |
| Ortalama Intel Core Ultra 7 155H (5639 - 10647, n=50) | |
| Schenker VISION 16 Pro (M23) | |
| Sınıf ortalaması Multimedia (886 - 28794, n=56, son 2 yıl) | |
| Dell XPS 15 9530 RTX 4070 | |
| AIDA64 / FPU Mandel | |
| Dell XPS 16 9640 | |
| Honor MagicBook Pro 16 2024 | |
| Sınıf ortalaması Multimedia (6395 - 105740, n=55, son 2 yıl) | |
| Lenovo Yoga Pro 9 16-IRP G8 | |
| Asus ROG Zephyrus G16 2024 GU605M | |
| Samsung Galaxy Book4 Ultra | |
| Ortalama Intel Core Ultra 7 155H (18236 - 47685, n=50) | |
| Dell XPS 15 9530 RTX 4070 | |
| Schenker VISION 16 Pro (M23) | |
| AIDA64 / CPU AES | |
| Honor MagicBook Pro 16 2024 | |
| Lenovo Yoga Pro 9 16-IRP G8 | |
| Dell XPS 16 9640 | |
| Asus ROG Zephyrus G16 2024 GU605M | |
| Ortalama Intel Core Ultra 7 155H (45713 - 152179, n=50) | |
| Samsung Galaxy Book4 Ultra | |
| Schenker VISION 16 Pro (M23) | |
| Sınıf ortalaması Multimedia (8171 - 126790, n=56, son 2 yıl) | |
| Dell XPS 15 9530 RTX 4070 | |
| AIDA64 / CPU ZLib | |
| Honor MagicBook Pro 16 2024 | |
| Lenovo Yoga Pro 9 16-IRP G8 | |
| Dell XPS 16 9640 | |
| Asus ROG Zephyrus G16 2024 GU605M | |
| Sınıf ortalaması Multimedia (143.8 - 2022, n=56, son 2 yıl) | |
| Samsung Galaxy Book4 Ultra | |
| Ortalama Intel Core Ultra 7 155H (557 - 1250, n=50) | |
| Schenker VISION 16 Pro (M23) | |
| Dell XPS 15 9530 RTX 4070 | |
| AIDA64 / FP64 Ray-Trace | |
| Sınıf ortalaması Multimedia (1014 - 26875, n=56, son 2 yıl) | |
| Lenovo Yoga Pro 9 16-IRP G8 | |
| Dell XPS 16 9640 | |
| Honor MagicBook Pro 16 2024 | |
| Asus ROG Zephyrus G16 2024 GU605M | |
| Dell XPS 15 9530 RTX 4070 | |
| Schenker VISION 16 Pro (M23) | |
| Samsung Galaxy Book4 Ultra | |
| Ortalama Intel Core Ultra 7 155H (3569 - 9802, n=50) | |
| AIDA64 / CPU PhotoWorxx | |
| Lenovo Yoga Pro 9 16-IRP G8 | |
| Dell XPS 16 9640 | |
| Samsung Galaxy Book4 Ultra | |
| Sınıf ortalaması Multimedia (8187 - 88154, n=56, son 2 yıl) | |
| Asus ROG Zephyrus G16 2024 GU605M | |
| Ortalama Intel Core Ultra 7 155H (32719 - 54223, n=50) | |
| Honor MagicBook Pro 16 2024 | |
| Schenker VISION 16 Pro (M23) | |
| Dell XPS 15 9530 RTX 4070 | |
Sistem performansı
Günlük kullanımda, yeni XPS 16 9640 çok duyarlı bir cihaz ve sentetik kıyaslamalarda da herhangi bir anormallik gözlemlemedik. Testimiz sırasında dizüstü bilgisayarla hiçbir sorun yaşamadık.
CrossMark: Overall | Productivity | Creativity | Responsiveness
WebXPRT 3: Overall
WebXPRT 4: Overall
Mozilla Kraken 1.1: Total
| PCMark 10 / Score | |
| Sınıf ortalaması Multimedia (4325 - 10386, n=54, son 2 yıl) | |
| Ortalama Intel Core Ultra 7 155H, NVIDIA GeForce RTX 4070 Laptop GPU (7084 - 7761, n=4) | |
| Schenker VISION 16 Pro (M23) | |
| Lenovo Yoga Pro 9 16-IRP G8 | |
| Dell XPS 15 9530 RTX 4070 | |
| Asus ROG Zephyrus G16 2024 GU605M | |
| Dell XPS 16 9640 | |
| Samsung Galaxy Book4 Ultra | |
| Honor MagicBook Pro 16 2024 | |
| PCMark 10 / Essentials | |
| Dell XPS 15 9530 RTX 4070 | |
| Lenovo Yoga Pro 9 16-IRP G8 | |
| Schenker VISION 16 Pro (M23) | |
| Sınıf ortalaması Multimedia (8025 - 11664, n=53, son 2 yıl) | |
| Samsung Galaxy Book4 Ultra | |
| Dell XPS 16 9640 | |
| Ortalama Intel Core Ultra 7 155H, NVIDIA GeForce RTX 4070 Laptop GPU (10038 - 10393, n=4) | |
| Asus ROG Zephyrus G16 2024 GU605M | |
| Honor MagicBook Pro 16 2024 | |
| PCMark 10 / Productivity | |
| Sınıf ortalaması Multimedia (7323 - 18233, n=53, son 2 yıl) | |
| Schenker VISION 16 Pro (M23) | |
| Ortalama Intel Core Ultra 7 155H, NVIDIA GeForce RTX 4070 Laptop GPU (9192 - 9518, n=4) | |
| Asus ROG Zephyrus G16 2024 GU605M | |
| Dell XPS 16 9640 | |
| Samsung Galaxy Book4 Ultra | |
| Lenovo Yoga Pro 9 16-IRP G8 | |
| Dell XPS 15 9530 RTX 4070 | |
| Honor MagicBook Pro 16 2024 | |
| PCMark 10 / Digital Content Creation | |
| Ortalama Intel Core Ultra 7 155H, NVIDIA GeForce RTX 4070 Laptop GPU (10100 - 13035, n=4) | |
| Lenovo Yoga Pro 9 16-IRP G8 | |
| Schenker VISION 16 Pro (M23) | |
| Honor MagicBook Pro 16 2024 | |
| Dell XPS 15 9530 RTX 4070 | |
| Asus ROG Zephyrus G16 2024 GU605M | |
| Sınıf ortalaması Multimedia (3651 - 16240, n=53, son 2 yıl) | |
| Dell XPS 16 9640 | |
| Samsung Galaxy Book4 Ultra | |
| CrossMark / Overall | |
| Schenker VISION 16 Pro (M23) | |
| Dell XPS 15 9530 RTX 4070 | |
| Sınıf ortalaması Multimedia (866 - 2728, n=62, son 2 yıl) | |
| Dell XPS 16 9640 | |
| Lenovo Yoga Pro 9 16-IRP G8 | |
| Ortalama Intel Core Ultra 7 155H, NVIDIA GeForce RTX 4070 Laptop GPU (1687 - 1848, n=4) | |
| Samsung Galaxy Book4 Ultra | |
| Honor MagicBook Pro 16 2024 | |
| Asus ROG Zephyrus G16 2024 GU605M | |
| CrossMark / Productivity | |
| Schenker VISION 16 Pro (M23) | |
| Sınıf ortalaması Multimedia (931 - 2489, n=62, son 2 yıl) | |
| Dell XPS 15 9530 RTX 4070 | |
| Dell XPS 16 9640 | |
| Lenovo Yoga Pro 9 16-IRP G8 | |
| Honor MagicBook Pro 16 2024 | |
| Ortalama Intel Core Ultra 7 155H, NVIDIA GeForce RTX 4070 Laptop GPU (1589 - 1750, n=4) | |
| Samsung Galaxy Book4 Ultra | |
| Asus ROG Zephyrus G16 2024 GU605M | |
| CrossMark / Creativity | |
| Sınıf ortalaması Multimedia (907 - 3465, n=62, son 2 yıl) | |
| Dell XPS 15 9530 RTX 4070 | |
| Lenovo Yoga Pro 9 16-IRP G8 | |
| Dell XPS 16 9640 | |
| Schenker VISION 16 Pro (M23) | |
| Asus ROG Zephyrus G16 2024 GU605M | |
| Ortalama Intel Core Ultra 7 155H, NVIDIA GeForce RTX 4070 Laptop GPU (1860 - 2014, n=4) | |
| Samsung Galaxy Book4 Ultra | |
| Honor MagicBook Pro 16 2024 | |
| CrossMark / Responsiveness | |
| Schenker VISION 16 Pro (M23) | |
| Dell XPS 16 9640 | |
| Dell XPS 15 9530 RTX 4070 | |
| Honor MagicBook Pro 16 2024 | |
| Ortalama Intel Core Ultra 7 155H, NVIDIA GeForce RTX 4070 Laptop GPU (1424 - 1683, n=4) | |
| Lenovo Yoga Pro 9 16-IRP G8 | |
| Sınıf ortalaması Multimedia (605 - 2024, n=62, son 2 yıl) | |
| Samsung Galaxy Book4 Ultra | |
| Asus ROG Zephyrus G16 2024 GU605M | |
| WebXPRT 3 / Overall | |
| Sınıf ortalaması Multimedia (136.4 - 596, n=65, son 2 yıl) | |
| Dell XPS 15 9530 RTX 4070 | |
| Schenker VISION 16 Pro (M23) | |
| Lenovo Yoga Pro 9 16-IRP G8 | |
| Honor MagicBook Pro 16 2024 | |
| Asus ROG Zephyrus G16 2024 GU605M | |
| Dell XPS 16 9640 | |
| Samsung Galaxy Book4 Ultra | |
| Ortalama Intel Core Ultra 7 155H, NVIDIA GeForce RTX 4070 Laptop GPU (264 - 294, n=4) | |
| WebXPRT 4 / Overall | |
| Sınıf ortalaması Multimedia (167.3 - 402, n=67, son 2 yıl) | |
| Dell XPS 15 9530 RTX 4070 | |
| Schenker VISION 16 Pro (M23) | |
| Lenovo Yoga Pro 9 16-IRP G8 | |
| Honor MagicBook Pro 16 2024 | |
| Samsung Galaxy Book4 Ultra | |
| Asus ROG Zephyrus G16 2024 GU605M | |
| Dell XPS 16 9640 | |
| Ortalama Intel Core Ultra 7 155H, NVIDIA GeForce RTX 4070 Laptop GPU (247 - 257, n=4) | |
| Mozilla Kraken 1.1 / Total | |
| Ortalama Intel Core Ultra 7 155H, NVIDIA GeForce RTX 4070 Laptop GPU (546 - 568, n=3) | |
| Asus ROG Zephyrus G16 2024 GU605M | |
| Honor MagicBook Pro 16 2024 | |
| Lenovo Yoga Pro 9 16-IRP G8 | |
| Dell XPS 15 9530 RTX 4070 | |
| Schenker VISION 16 Pro (M23) | |
| Sınıf ortalaması Multimedia (228 - 835, n=68, son 2 yıl) | |
| Samsung Galaxy Book4 Ultra | |
* ... daha küçük daha iyidir
| PCMark 10 Score | 7084 puan | |
Yardım | ||
| AIDA64 / Memory Copy | |
| Dell XPS 16 9640 | |
| Samsung Galaxy Book4 Ultra | |
| Asus ROG Zephyrus G16 2024 GU605M | |
| Honor MagicBook Pro 16 2024 | |
| Ortalama Intel Core Ultra 7 155H (62397 - 96791, n=50) | |
| Sınıf ortalaması Multimedia (11299 - 132135, n=56, son 2 yıl) | |
| Lenovo Yoga Pro 9 16-IRP G8 | |
| Dell XPS 15 9530 RTX 4070 | |
| Schenker VISION 16 Pro (M23) | |
| AIDA64 / Memory Read | |
| Samsung Galaxy Book4 Ultra | |
| Asus ROG Zephyrus G16 2024 GU605M | |
| Dell XPS 16 9640 | |
| Sınıf ortalaması Multimedia (11624 - 174586, n=56, son 2 yıl) | |
| Ortalama Intel Core Ultra 7 155H (60544 - 90647, n=50) | |
| Lenovo Yoga Pro 9 16-IRP G8 | |
| Honor MagicBook Pro 16 2024 | |
| Schenker VISION 16 Pro (M23) | |
| Dell XPS 15 9530 RTX 4070 | |
| AIDA64 / Memory Write | |
| Lenovo Yoga Pro 9 16-IRP G8 | |
| Sınıf ortalaması Multimedia (11755 - 134998, n=56, son 2 yıl) | |
| Honor MagicBook Pro 16 2024 | |
| Samsung Galaxy Book4 Ultra | |
| Dell XPS 16 9640 | |
| Asus ROG Zephyrus G16 2024 GU605M | |
| Ortalama Intel Core Ultra 7 155H (58692 - 93451, n=50) | |
| Dell XPS 15 9530 RTX 4070 | |
| Schenker VISION 16 Pro (M23) | |
| AIDA64 / Memory Latency | |
| Ortalama Intel Core Ultra 7 155H (116.2 - 233, n=50) | |
| Honor MagicBook Pro 16 2024 | |
| Samsung Galaxy Book4 Ultra | |
| Asus ROG Zephyrus G16 2024 GU605M | |
| Dell XPS 16 9640 | |
| Sınıf ortalaması Multimedia (7 - 535, n=55, son 2 yıl) | |
| Lenovo Yoga Pro 9 16-IRP G8 | |
| Dell XPS 15 9530 RTX 4070 | |
| Schenker VISION 16 Pro (M23) | |
* ... daha küçük daha iyidir
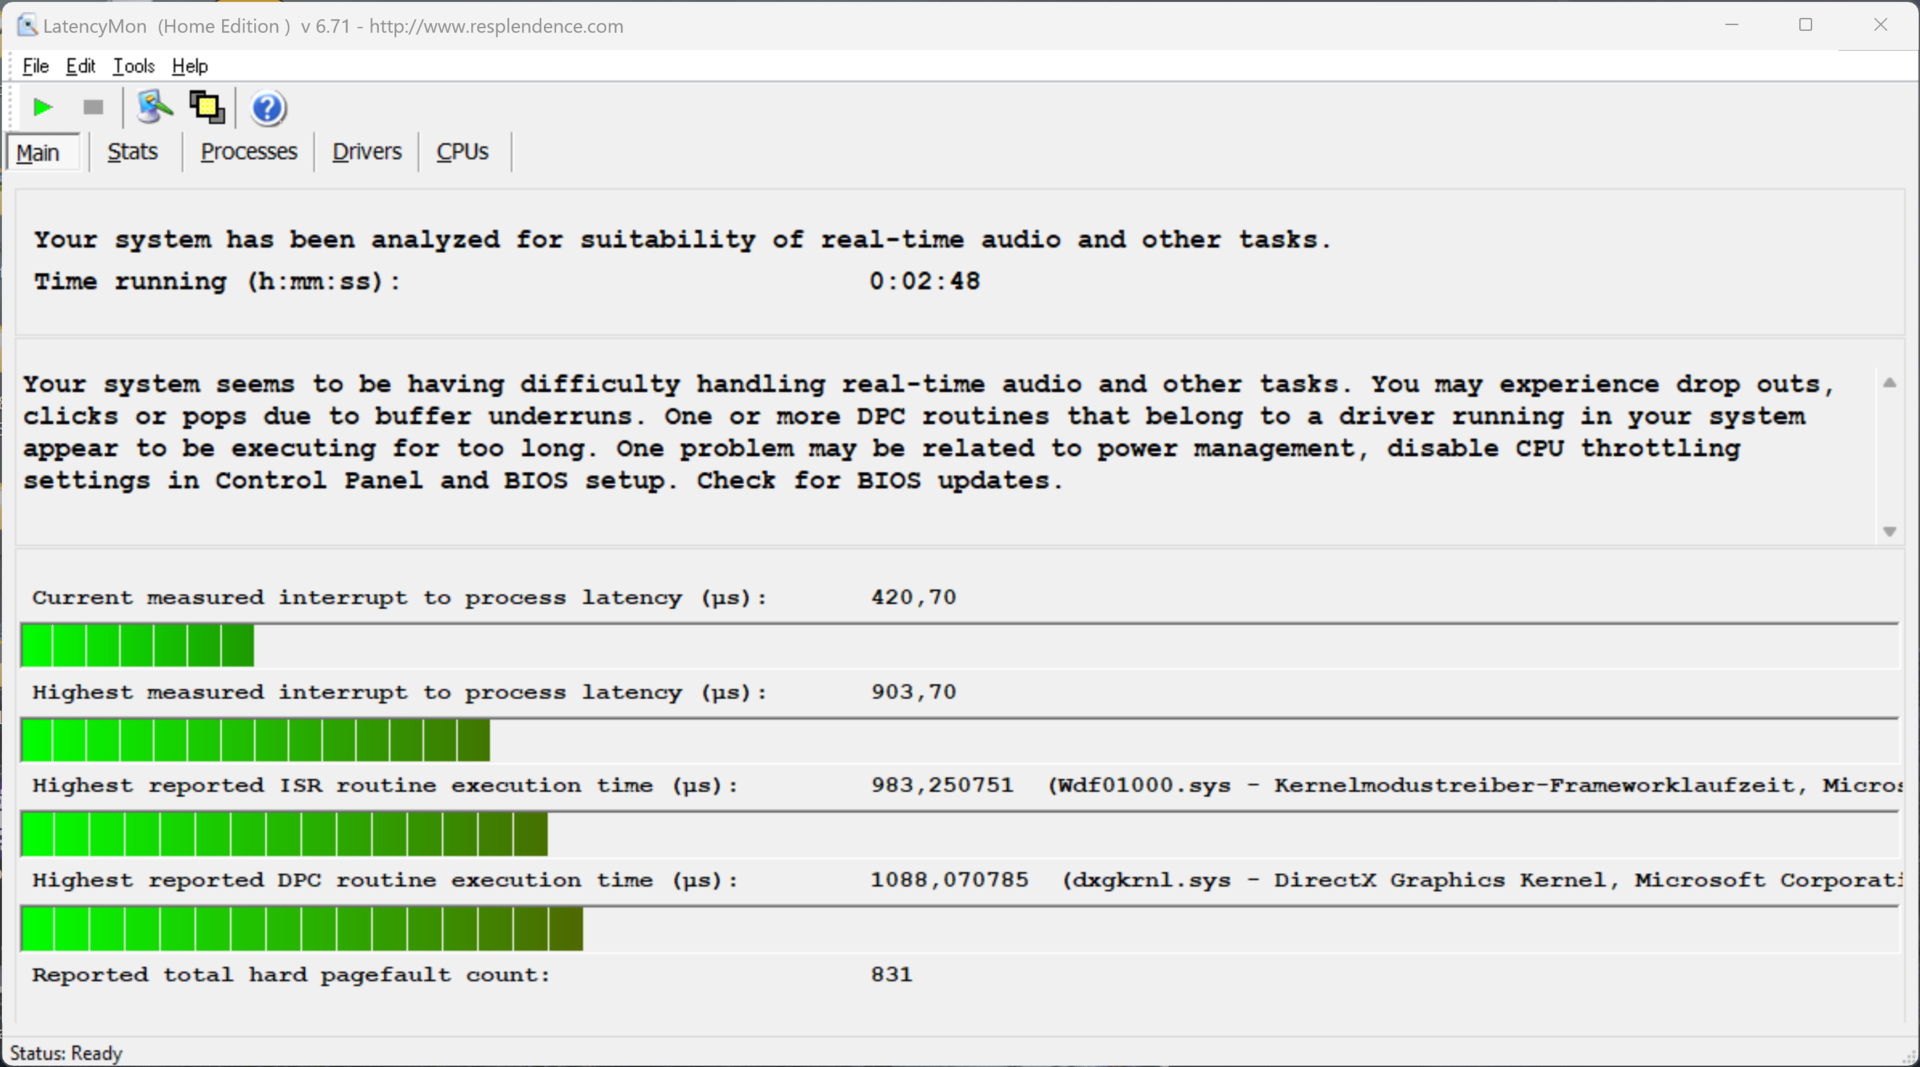
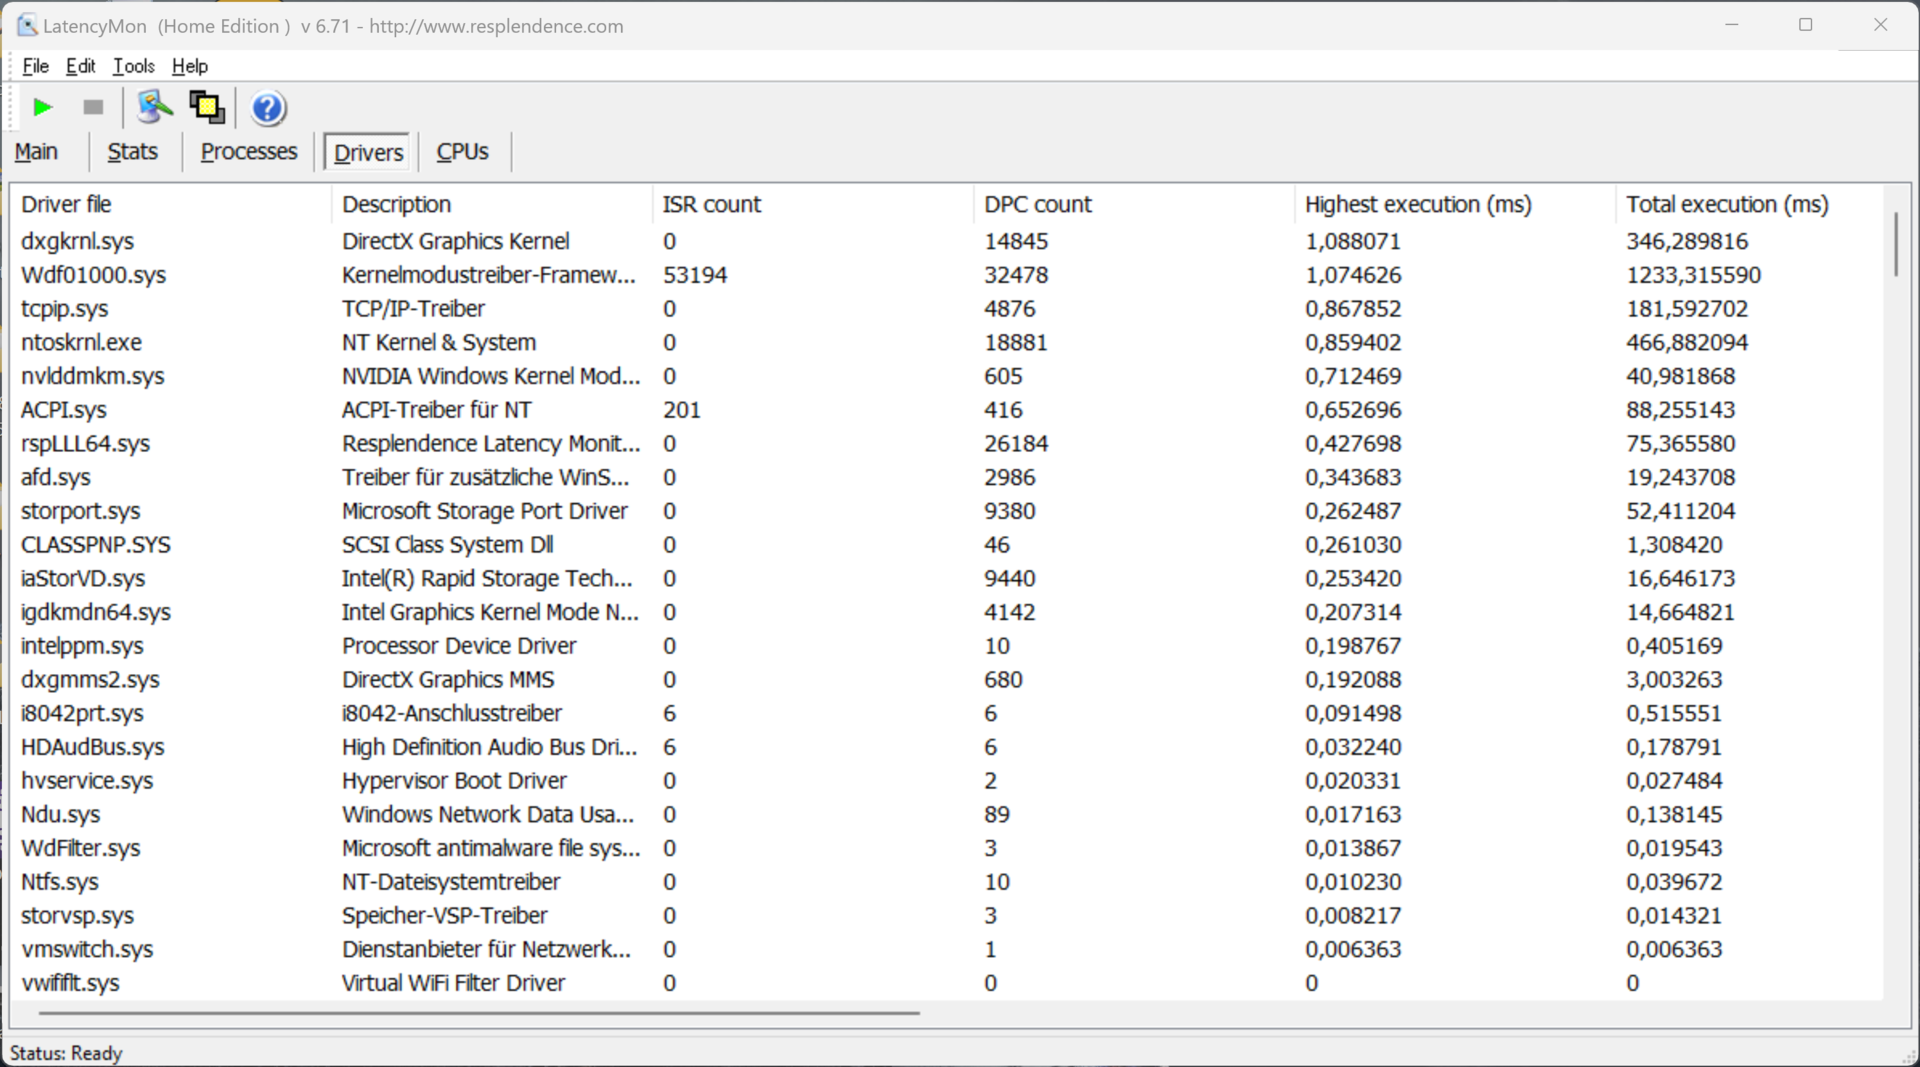
DPC gecikme süresi
Standartlaştırılmış gecikme testimizde (internette gezinme, 4K YouTube oynatma, CPU yükü), mevcut BIOS sürümüne sahip test cihazımız, gerçek zamanlı ses uygulamalarını kullanırken yalnızca küçük sınırlamalar gösterdi.
| DPC Latencies / LatencyMon - interrupt to process latency (max), Web, Youtube, Prime95 | |
| Lenovo Yoga Pro 9 16-IRP G8 | |
| Asus ROG Zephyrus G16 2024 GU605M | |
| Honor MagicBook Pro 16 2024 | |
| Dell XPS 15 9530 RTX 4070 | |
| Dell XPS 16 9640 | |
| Schenker VISION 16 Pro (M23) | |
| Samsung Galaxy Book4 Ultra | |
* ... daha küçük daha iyidir
Depolama cihazı
Test cihazımıza Kioxia XG8'in 1 TB'lık bir versiyonu takıldı ve dizüstü bilgisayar ilk kez açıldıktan sonra kullanıcılara 834 GB sunuldu. PCIe-4.0 SSD'nin performansı çok iyi ve her şeyden önce çok kararlı. Ek bir SSD için yuva bulunmamaktadır. Diğer SSD kıyaslamaları listelenmiştir burada.

| Drive Performance rating - Percent | |
| Schenker VISION 16 Pro (M23) | |
| Dell XPS 16 9640 | |
| Samsung Galaxy Book4 Ultra | |
| Honor MagicBook Pro 16 2024 | |
| Lenovo Yoga Pro 9 16-IRP G8 | |
| Dell XPS 15 9530 RTX 4070 | |
| Ortalama Kioxia XG8 KXG80ZNV1T02 | |
| Sınıf ortalaması Multimedia | |
| Asus ROG Zephyrus G16 2024 GU605M | |
* ... daha küçük daha iyidir
Reading continuous performance: DiskSpd Read Loop, Queue Depth 8
Grafik kartı
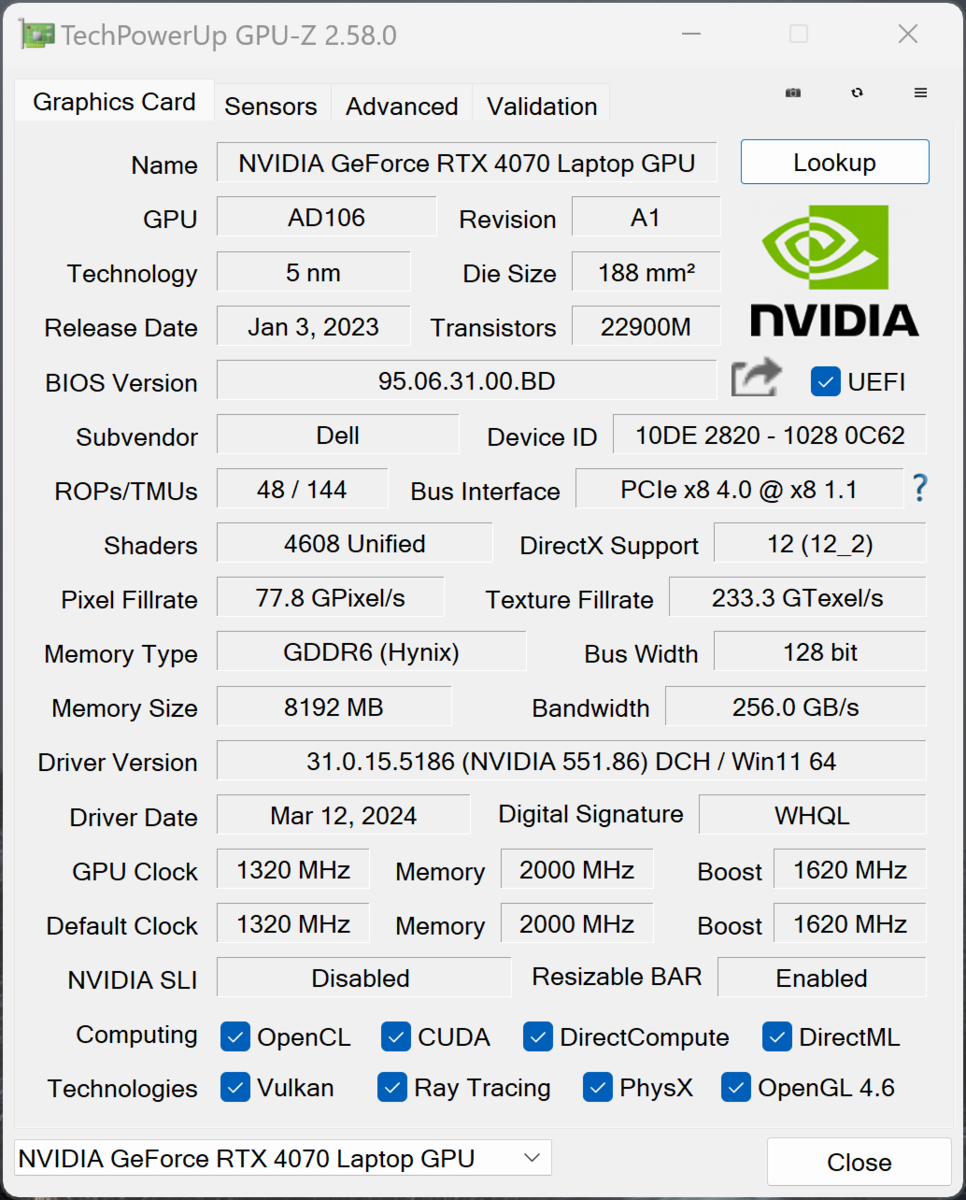
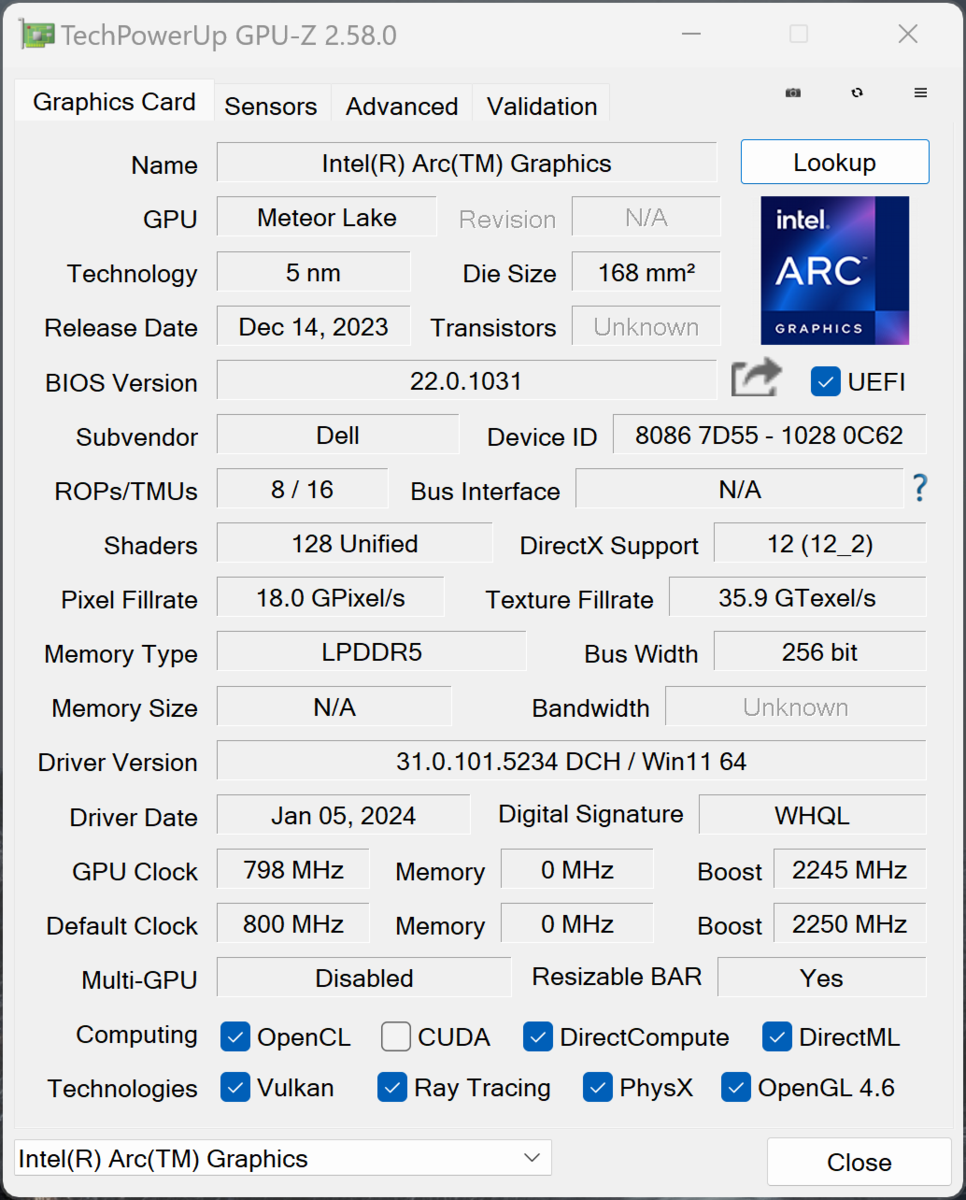
Test cihazımız aşağıdakilerle donatılmıştır GeForce RTX 4070 Dizüstü Bilgisayar 8 GB VRAM ile, seçilen enerji profiline bağlı olarak TGP'si 50-60 watt'tır. XPS 16 bir MUX anahtarına sahiptir ve Advanced Optimus aracılığıyla grafik anahtarlamayı destekler - basit grafik hesaplamaları entegre Intel Ark Grafikleri.
Sonuç olarak, performansı eskisine göre daha iyidir XPS 15 rTX 4070 Dizüstü Bilgisayarın 50 watt'lık versiyonunu içeriyor, ancak bu segmentteki rakipler daha hızlı modeller ve sonuç olarak daha fazla GPU performansı sunuyor. Geçen yılın Yoga Pro 9 16 100 watt'lık versiyonu ile RTX 4060 Dizüstü Bilgisayarörneğin, çok daha yavaş değildir. Bu açıdan çok daha fazlası mümkün olabilirdi.
Grafik performansı sürekli yük altında sabit kalıyor, ancak GPU'nun pil modunda maksimum 50 watt tüketmesine izin veriliyor ve bu da %10'un biraz altında bir performans düşüşüne yol açıyor. Daha fazla GPU kıyaslaması bulunabilir burada.
| 3DMark Performance rating - Percent | |
| Ortalama NVIDIA GeForce RTX 4070 Laptop GPU | |
| Schenker VISION 16 Pro (M23) -1! | |
| Asus ROG Zephyrus G16 2024 GU605M | |
| Dell XPS 16 9640 | |
| Lenovo Yoga Pro 9 16-IRP G8 | |
| Honor MagicBook Pro 16 2024 | |
| Dell XPS 15 9530 RTX 4070 -1! | |
| Samsung Galaxy Book4 Ultra | |
| Sınıf ortalaması Multimedia | |
| 3DMark 11 - 1280x720 Performance GPU | |
| Schenker VISION 16 Pro (M23) | |
| Ortalama NVIDIA GeForce RTX 4070 Laptop GPU (24229 - 46434, n=67) | |
| Asus ROG Zephyrus G16 2024 GU605M | |
| Lenovo Yoga Pro 9 16-IRP G8 | |
| Dell XPS 16 9640 | |
| Honor MagicBook Pro 16 2024 | |
| Dell XPS 15 9530 RTX 4070 | |
| Samsung Galaxy Book4 Ultra | |
| Sınıf ortalaması Multimedia (3749 - 60002, n=58, son 2 yıl) | |
| Geekbench 6.7 - GPU OpenCL | |
| Ortalama NVIDIA GeForce RTX 4070 Laptop GPU (85488 - 129836, n=45) | |
| Asus ROG Zephyrus G16 2024 GU605M | |
| Dell XPS 16 9640 | |
| Honor MagicBook Pro 16 2024 | |
| Lenovo Yoga Pro 9 16-IRP G8 | |
| Samsung Galaxy Book4 Ultra | |
| Sınıf ortalaması Multimedia (9994 - 187922, n=69, son 2 yıl) | |
| 3DMark 11 Performance | 29315 puan | |
| 3DMark Fire Strike Score | 21848 puan | |
| 3DMark Time Spy Score | 9774 puan | |
Yardım | ||
| Blender / v3.3 Classroom OPTIX/RTX | |
| Sınıf ortalaması Multimedia (12 - 105, n=23, son 2 yıl) | |
| Samsung Galaxy Book4 Ultra | |
| Dell XPS 15 9530 RTX 4070 | |
| Lenovo Yoga Pro 9 16-IRP G8 | |
| Schenker VISION 16 Pro (M23) | |
| Honor MagicBook Pro 16 2024 | |
| Asus ROG Zephyrus G16 2024 GU605M | |
| Ortalama NVIDIA GeForce RTX 4070 Laptop GPU (18 - 30, n=68) | |
| Dell XPS 16 9640 | |
| Blender / v3.3 Classroom CUDA | |
| Sınıf ortalaması Multimedia (20 - 186, n=23, son 2 yıl) | |
| Samsung Galaxy Book4 Ultra | |
| Dell XPS 15 9530 RTX 4070 | |
| Lenovo Yoga Pro 9 16-IRP G8 | |
| Honor MagicBook Pro 16 2024 | |
| Dell XPS 16 9640 | |
| Schenker VISION 16 Pro (M23) | |
| Ortalama NVIDIA GeForce RTX 4070 Laptop GPU (32 - 50, n=67) | |
| Asus ROG Zephyrus G16 2024 GU605M | |
| Blender / v3.3 Classroom CPU | |
| Sınıf ortalaması Multimedia (134.5 - 1042, n=63, son 2 yıl) | |
| Schenker VISION 16 Pro (M23) | |
| Samsung Galaxy Book4 Ultra | |
| Dell XPS 15 9530 RTX 4070 | |
| Asus ROG Zephyrus G16 2024 GU605M | |
| Honor MagicBook Pro 16 2024 | |
| Lenovo Yoga Pro 9 16-IRP G8 | |
| Dell XPS 16 9640 | |
| Ortalama NVIDIA GeForce RTX 4070 Laptop GPU (158 - 440, n=67) | |
* ... daha küçük daha iyidir
Oyun performansı
RTX 4070 Dizüstü Bilgisayar ile XPS 16 9640'ın oyun performansı çok kötü değil - test ettiğimiz tüm oyunlar QHD çözünürlükte maksimum ayrıntılarla sorunsuz bir şekilde oynanabiliyordu. Ancak ekranın doğal çözünürlüğü olan 3.840 x 2.400 piksel için ya ayrıntıları azaltmanız ya da Nvidia'nın DLSS'si gibi yükseltme teknolojilerinden yararlanmanız gerekiyor. Rakipleriyle karşılaştırıldığında XPS, RTX 4070 Laptop ve RTX 4060 Laptop'un hızlı versiyonlarıyla donatılmış modellerden bir kez daha daha düşük (Honor MagicBook Pro, Lenovo Yoga Pro 9 16). Oyun performansı uzun oturumlarda bile sabit kalır.
| Performance rating - Percent | |
| Schenker VISION 16 Pro (M23) | |
| Lenovo Yoga Pro 9 16-IRP G8 | |
| Honor MagicBook Pro 16 2024 | |
| Asus ROG Zephyrus G16 2024 GU605M | |
| Dell XPS 16 9640 | |
| Dell XPS 15 9530 RTX 4070 | |
| Samsung Galaxy Book4 Ultra | |
| Sınıf ortalaması Multimedia | |
| The Witcher 3 - 1920x1080 Ultra Graphics & Postprocessing (HBAO+) | |
| Schenker VISION 16 Pro (M23) | |
| Asus ROG Zephyrus G16 2024 GU605M | |
| Lenovo Yoga Pro 9 16-IRP G8 | |
| Dell XPS 16 9640 | |
| Honor MagicBook Pro 16 2024 | |
| Dell XPS 15 9530 RTX 4070 | |
| Sınıf ortalaması Multimedia (11 - 121, n=10, son 2 yıl) | |
| Samsung Galaxy Book4 Ultra | |
| GTA V - 1920x1080 Highest AA:4xMSAA + FX AF:16x | |
| Lenovo Yoga Pro 9 16-IRP G8 | |
| Dell XPS 16 9640 | |
| Honor MagicBook Pro 16 2024 | |
| Asus ROG Zephyrus G16 2024 GU605M | |
| Schenker VISION 16 Pro (M23) | |
| Samsung Galaxy Book4 Ultra | |
| Dell XPS 15 9530 RTX 4070 | |
| Sınıf ortalaması Multimedia (7.92 - 141.6, n=58, son 2 yıl) | |
| Final Fantasy XV Benchmark - 1920x1080 High Quality | |
| Schenker VISION 16 Pro (M23) | |
| Asus ROG Zephyrus G16 2024 GU605M | |
| Lenovo Yoga Pro 9 16-IRP G8 | |
| Dell XPS 16 9640 | |
| Honor MagicBook Pro 16 2024 | |
| Dell XPS 15 9530 RTX 4070 | |
| Samsung Galaxy Book4 Ultra | |
| Sınıf ortalaması Multimedia (7.61 - 144.4, n=60, son 2 yıl) | |
| Strange Brigade - 1920x1080 ultra AA:ultra AF:16 | |
| Schenker VISION 16 Pro (M23) | |
| Lenovo Yoga Pro 9 16-IRP G8 | |
| Dell XPS 16 9640 | |
| Honor MagicBook Pro 16 2024 | |
| Asus ROG Zephyrus G16 2024 GU605M | |
| Dell XPS 15 9530 RTX 4070 | |
| Samsung Galaxy Book4 Ultra | |
| Sınıf ortalaması Multimedia (13.3 - 303, n=60, son 2 yıl) | |
| Dota 2 Reborn - 1920x1080 ultra (3/3) best looking | |
| Schenker VISION 16 Pro (M23) | |
| Lenovo Yoga Pro 9 16-IRP G8 | |
| Honor MagicBook Pro 16 2024 | |
| Dell XPS 15 9530 RTX 4070 | |
| Asus ROG Zephyrus G16 2024 GU605M | |
| Samsung Galaxy Book4 Ultra | |
| Sınıf ortalaması Multimedia (29 - 179.9, n=62, son 2 yıl) | |
| Dell XPS 16 9640 | |
| X-Plane 11.11 - 1920x1080 high (fps_test=3) | |
| Schenker VISION 16 Pro (M23) | |
| Lenovo Yoga Pro 9 16-IRP G8 | |
| Honor MagicBook Pro 16 2024 | |
| Dell XPS 15 9530 RTX 4070 | |
| Dell XPS 16 9640 | |
| Dell XPS 16 9640 | |
| Samsung Galaxy Book4 Ultra | |
| Asus ROG Zephyrus G16 2024 GU605M | |
| Sınıf ortalaması Multimedia (16.9 - 141.1, n=57, son 2 yıl) | |
| The Witcher 3 | |
| 1920x1080 Ultra Graphics & Postprocessing (HBAO+) | |
| Ortalama NVIDIA GeForce RTX 4070 Laptop GPU (69.8 - 133.7, n=57) | |
| Schenker VISION 16 Pro (M23) | |
| Asus ROG Zephyrus G16 2024 GU605M | |
| Lenovo Yoga Pro 9 16-IRP G8 | |
| Dell XPS 16 9640 | |
| Honor MagicBook Pro 16 2024 | |
| Dell XPS 15 9530 RTX 4070 | |
| Sınıf ortalaması Multimedia (11 - 121, n=10, son 2 yıl) | |
| Samsung Galaxy Book4 Ultra | |
| 2560x1440 Ultra Graphics & Postprocessing (HBAO+) | |
| Ortalama NVIDIA GeForce RTX 4070 Laptop GPU (47 - 93.1, n=16) | |
| Sınıf ortalaması Multimedia (78 - 88, n=2, son 2 yıl) | |
| Asus ROG Zephyrus G16 2024 GU605M | |
| Dell XPS 16 9640 | |
| Honor MagicBook Pro 16 2024 | |
| Dell XPS 15 9530 RTX 4070 | |
| Samsung Galaxy Book4 Ultra | |
| Far Cry 5 | |
| 1920x1080 Ultra Preset AA:T | |
| Ortalama NVIDIA GeForce RTX 4070 Laptop GPU (92 - 158, n=37) | |
| Lenovo Yoga Pro 9 16-IRP G8 | |
| Schenker VISION 16 Pro (M23) | |
| Dell XPS 16 9640 | |
| Asus ROG Zephyrus G16 2024 GU605M | |
| Honor MagicBook Pro 16 2024 | |
| Samsung Galaxy Book4 Ultra | |
| Sınıf ortalaması Multimedia (17 - 145, n=19, son 2 yıl) | |
| 2560x1440 Ultra Preset AA:T | |
| Ortalama NVIDIA GeForce RTX 4070 Laptop GPU (79 - 128, n=33) | |
| Schenker VISION 16 Pro (M23) | |
| Lenovo Yoga Pro 9 16-IRP G8 | |
| Asus ROG Zephyrus G16 2024 GU605M | |
| Dell XPS 16 9640 | |
| Sınıf ortalaması Multimedia (45 - 106, n=4, son 2 yıl) | |
| Honor MagicBook Pro 16 2024 | |
| Samsung Galaxy Book4 Ultra | |
| Baldur's Gate 3 | |
| 1920x1080 Ultra Preset AA:T | |
| Ortalama NVIDIA GeForce RTX 4070 Laptop GPU (66.7 - 128.5, n=30) | |
| Dell XPS 16 9640 | |
| Sınıf ortalaması Multimedia (7.8 - 158.7, n=67, son 2 yıl) | |
| 2560x1440 Ultra Preset AA:T | |
| Ortalama NVIDIA GeForce RTX 4070 Laptop GPU (54.4 - 89.6, n=25) | |
| Sınıf ortalaması Multimedia (28.7 - 121, n=25, son 2 yıl) | |
| Dell XPS 16 9640 | |
| Horizon Forbidden West | |
| 1920x1080 Very High Preset AA:T | |
| Ortalama NVIDIA GeForce RTX 4070 Laptop GPU (53.2 - 76.7, n=10) | |
| Dell XPS 16 9640 | |
| Sınıf ortalaması Multimedia (12.4 - 64.4, n=3, son 2 yıl) | |
| 2560x1440 Very High Preset AA:T | |
| Ortalama NVIDIA GeForce RTX 4070 Laptop GPU (40.3 - 59.1, n=9) | |
| Sınıf ortalaması Multimedia (n=1son 2 yıl) | |
| Dell XPS 16 9640 | |
Witcher 3 FPS diagram
| düşük | orta | yüksek | ultra | QHD | 4K | |
|---|---|---|---|---|---|---|
| GTA V (2015) | 177 | 170.7 | 103.6 | 81.3 | ||
| The Witcher 3 (2015) | 399 | 327 | 195 | 87.8 | 73 | |
| Dota 2 Reborn (2015) | 89.8 | 89.6 | 89.5 | 89.7 | 115.7 | |
| Final Fantasy XV Benchmark (2018) | 150.2 | 123.2 | 93.1 | 70 | ||
| X-Plane 11.11 (2018) | 125.1 | 108.5 | 84.7 | 68.9 | ||
| Far Cry 5 (2018) | 140 | 126 | 122 | 115 | 94 | |
| Strange Brigade (2018) | 423 | 258 | 202 | 175 | 116 | |
| F1 23 (2023) | 214 | 189.7 | 175.1 | 55.5 | 35.2 | |
| Baldur's Gate 3 (2023) | 135.7 | 107.1 | 93.5 | 91.8 | 63.8 | |
| Cyberpunk 2077 (2023) | 112 | 87.6 | 74.7 | 64.3 | 39.6 | |
| Horizon Forbidden West (2024) | 96.6 | 83.7 | 58.5 | 53.2 | 40.3 |
Emisyonlar - Dell, XPS 16'ya bir Buhar Odası yerleştirdi
Gürültü emisyonları
Bunun aksine daha küçük XPS 14'in geleneksel soğutucusu yerine Dell, daha büyük XPS 16'ya iki fanlı bir Vapor Chamber soğutma ünitesi yerleştirdi. Özellikle düşük yük altında fanlar genellikle devre dışı kalıyor ya da çok sessiz çalışıyor ancak daha yüksek yük altında yine de oldukça hızlı bir şekilde ses çıkarıyor. Özellikle Optimize Edilmiş (maks. 48,1 dB(A)) ve Ultra Performans (maks. 49,7 dB(A)) profilleri arasındaki küçük fark bizi şaşırttı; her ikisi de kulaklığa ihtiyaç duymadan oyun oynayabilmek için çok yüksekti. Maksimum 43,3 dB(A) ile Sessiz profil aslında hiç de sessiz değil. Oldukça az sayıda rakip, örneğin MagicBook Pro ya da Zephyrus G16daha düşük gürültü emisyonu ile daha iyi performans sunar. Test örneğimizden gelen herhangi bir ek elektronik ses fark etmedik.
Ses yüksekliği
| Boşta |
| 24.5 / 24.5 / 27.5 dB |
| Çalışırken |
| 39.6 / 49.7 dB |
 | ||
30 dB sessiz 40 dB(A) duyulabilirlik 50 dB(A) gürültülü |
||
min: | ||
| Dell XPS 16 9640 GeForce RTX 4070 Laptop GPU, Ultra 7 155H, Kioxia XG8 KXG80ZNV1T02 | Samsung Galaxy Book4 Ultra GeForce RTX 4050 Laptop GPU, Ultra 7 155H, Samsung PM9A1 MZVL2512HCJQ | Honor MagicBook Pro 16 2024 GeForce RTX 4060 Laptop GPU, Ultra 7 155H, WD PC SN740 SDDPNQD-1T00 | Asus ROG Zephyrus G16 2024 GU605M GeForce RTX 4070 Laptop GPU, Ultra 7 155H, WD PC SN560 SDDPNQE-1T00 | Lenovo Yoga Pro 9 16-IRP G8 GeForce RTX 4060 Laptop GPU, i7-13705H, Samsung PM9A1 MZVL21T0HCLR | Schenker VISION 16 Pro (M23) GeForce RTX 4070 Laptop GPU, i7-13700H, Samsung 990 Pro 1 TB | Dell XPS 15 9530 RTX 4070 GeForce RTX 4070 Laptop GPU, i7-13700H, SK hynix PC801 HFS001TEJ9X101N | |
|---|---|---|---|---|---|---|---|
| Noise | 7% | 8% | 1% | -3% | -10% | 13% | |
| kapalı / ortam * (dB) | 24.5 | 24.2 1% | 24 2% | 23.9 2% | 24.7 -1% | 25.9 -6% | 23.1 6% |
| Idle Minimum * (dB) | 24.5 | 24.2 1% | 24 2% | 23.9 2% | 24.7 -1% | 25.9 -6% | 23.1 6% |
| Idle Average * (dB) | 24.5 | 24.2 1% | 24 2% | 27.8 -13% | 26.2 -7% | 25.9 -6% | 23.1 6% |
| Idle Maximum * (dB) | 27.5 | 24.2 12% | 27.2 1% | 30.1 -9% | 26.2 5% | 32 -16% | 24.2 12% |
| Load Average * (dB) | 39.6 | 37.9 4% | 29 27% | 34.2 14% | 39.7 -0% | 47.2 -19% | 27.1 32% |
| Witcher 3 ultra * (dB) | 49.7 | 41.7 16% | 42.1 15% | 46.4 7% | 53.2 -7% | 53.1 -7% | 40.1 19% |
| Load Maximum * (dB) | 49.7 | 41.7 16% | 45 9% | 46.4 7% | 53.2 -7% | 53.1 -7% | 44.6 10% |
* ... daha küçük daha iyidir
Sıcaklık
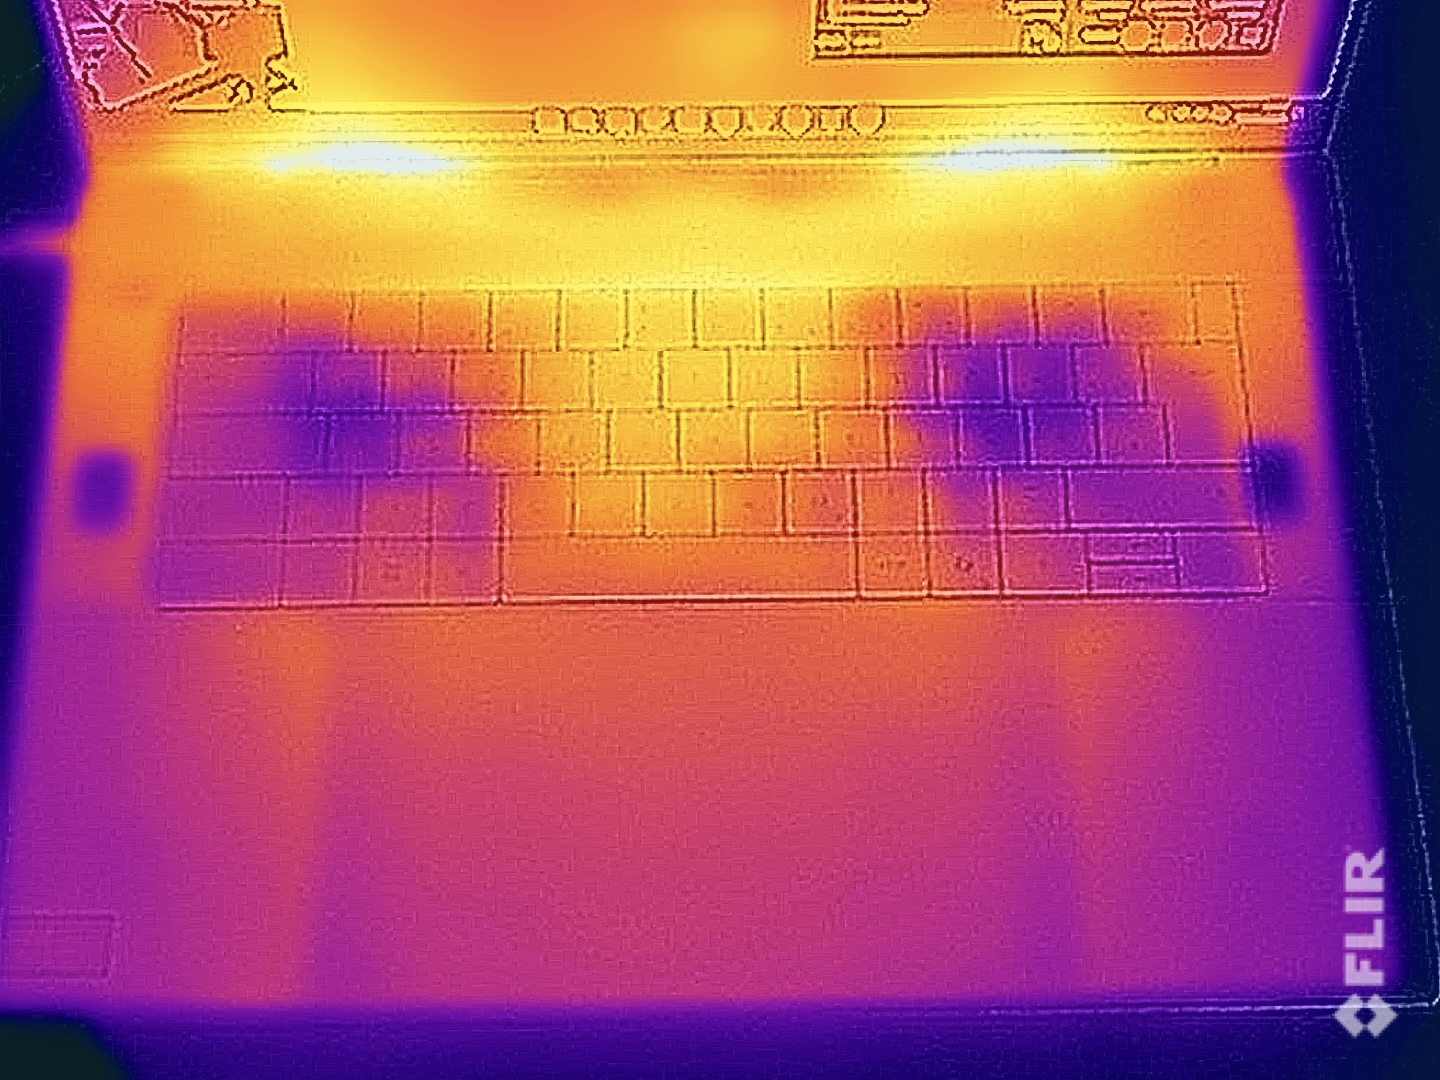
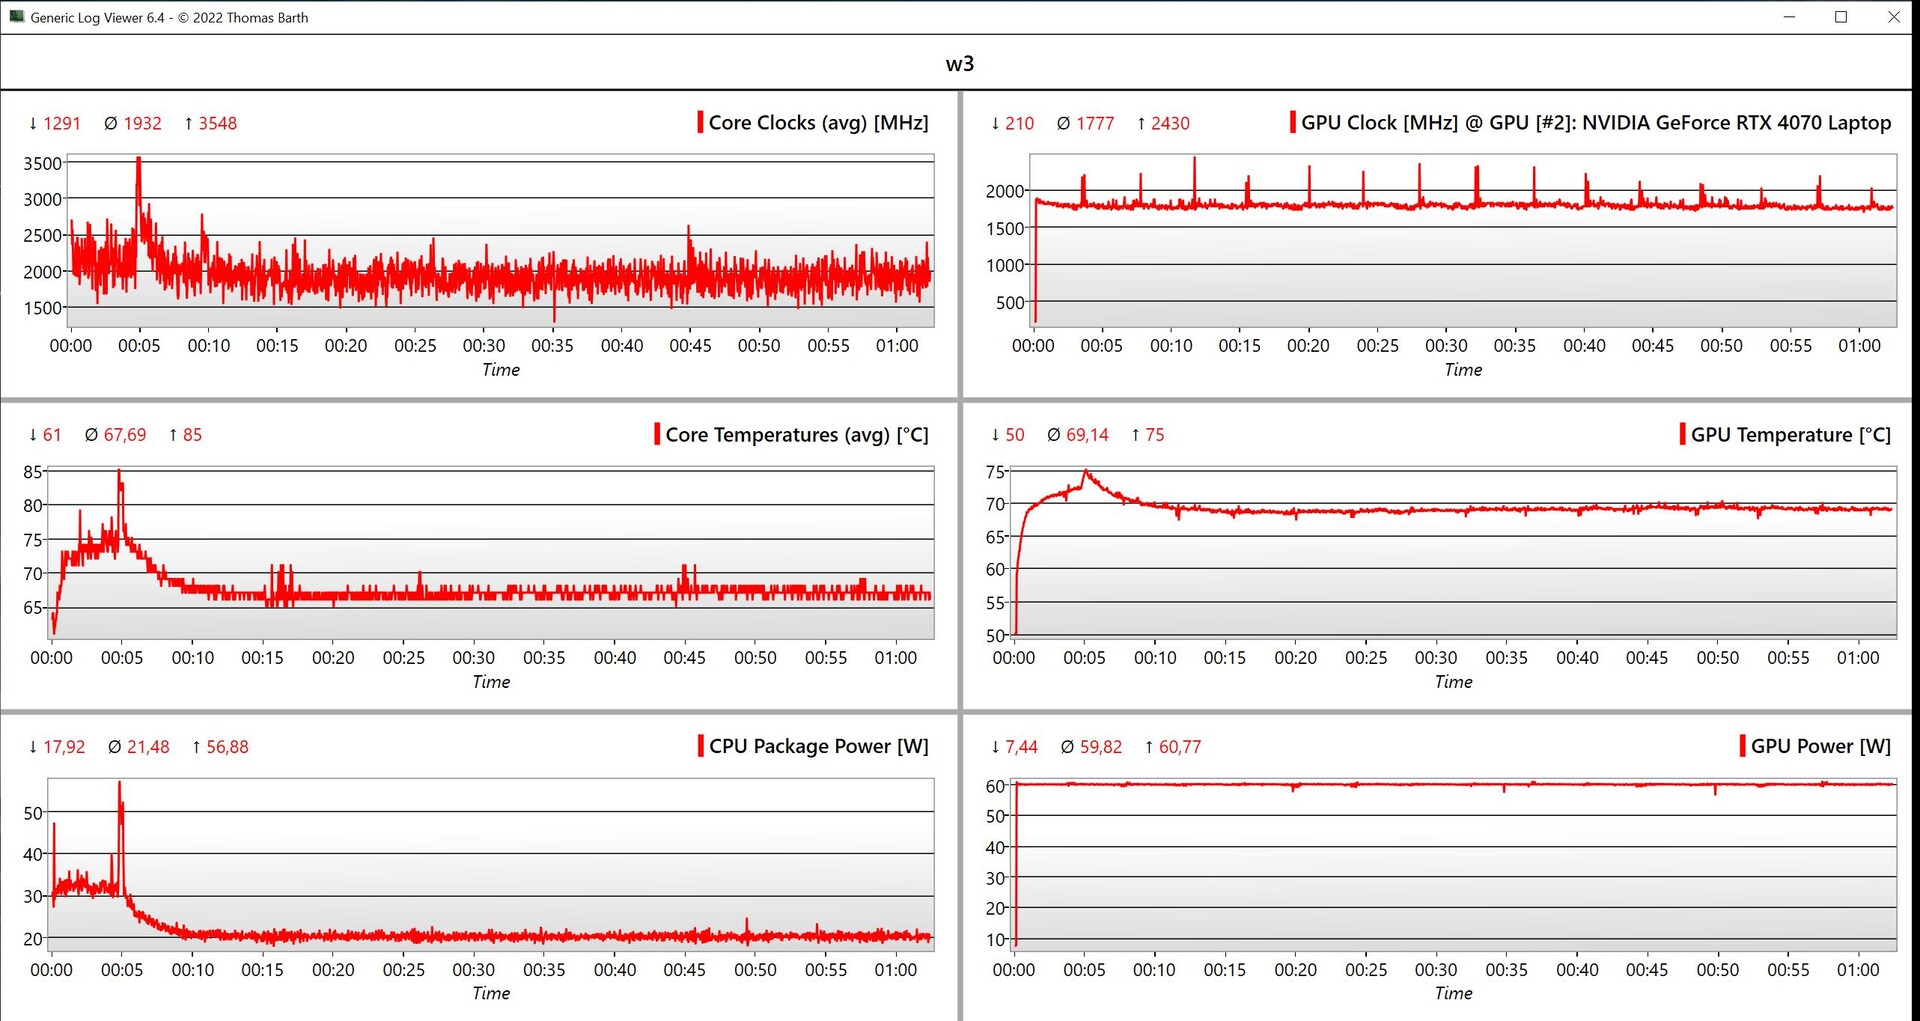
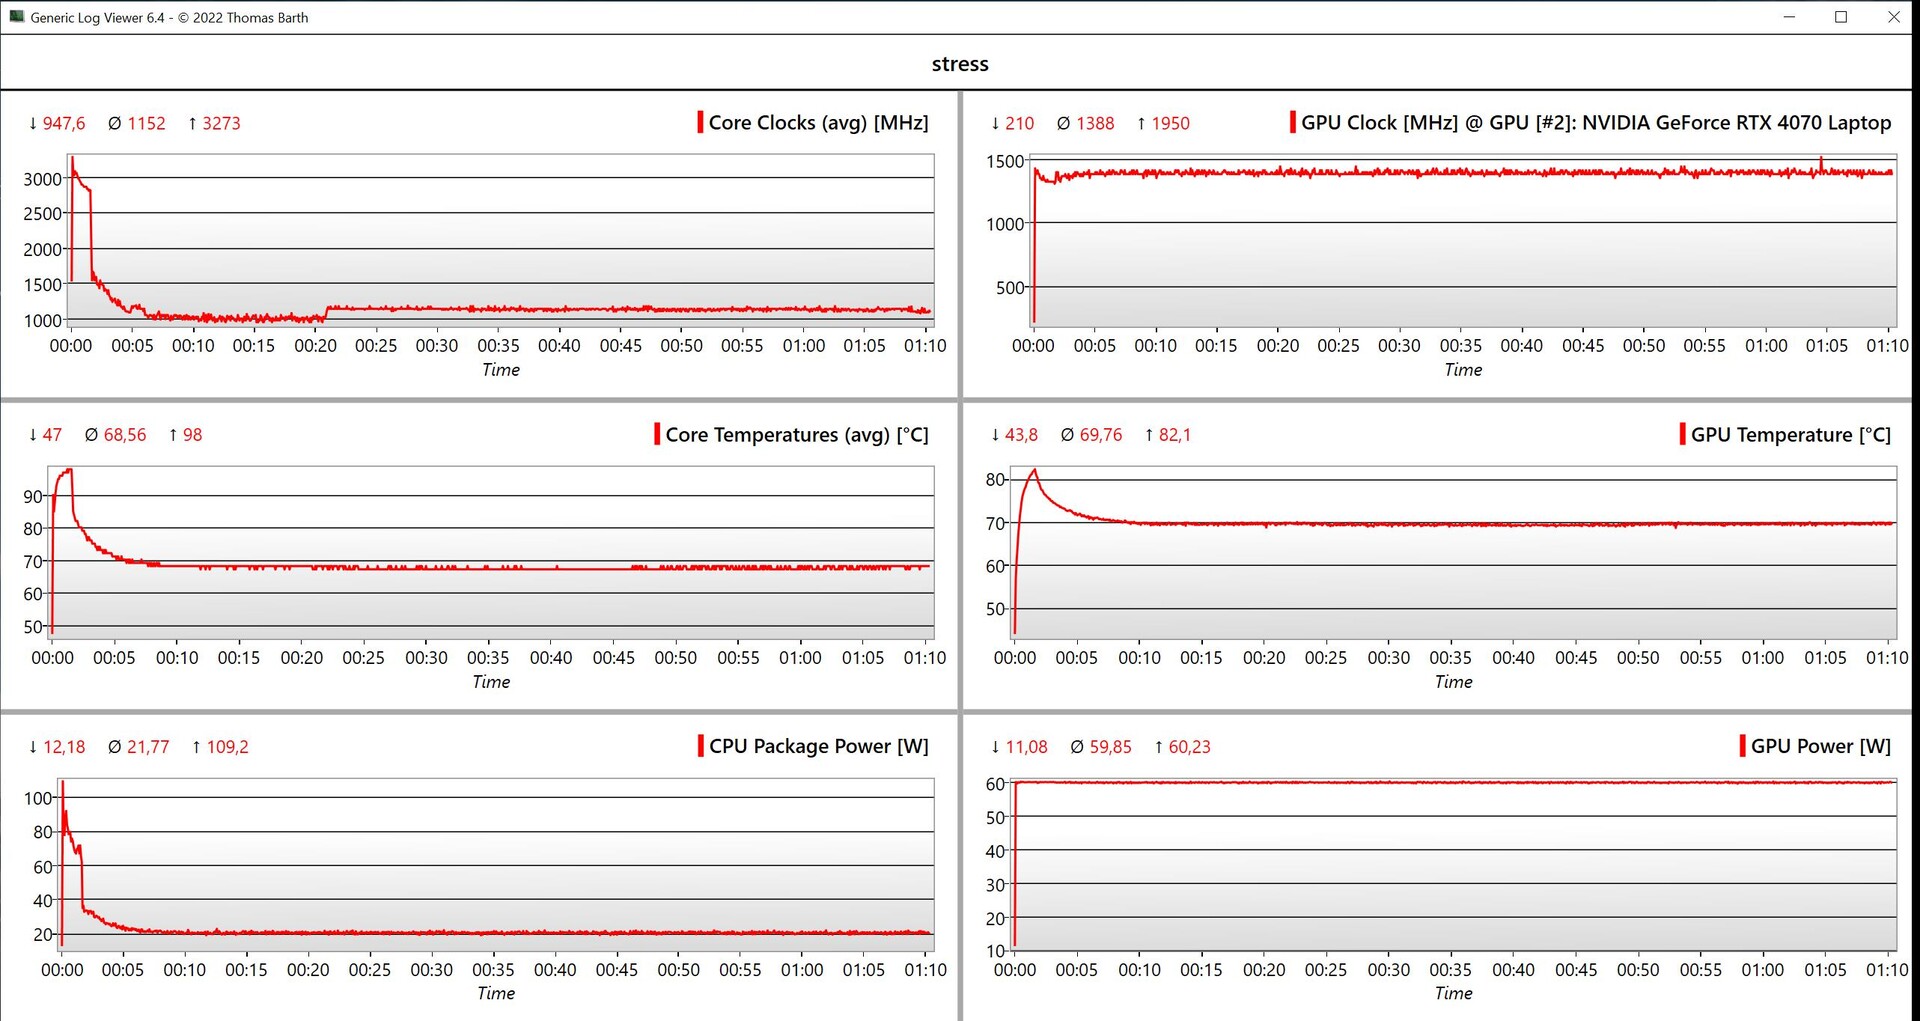
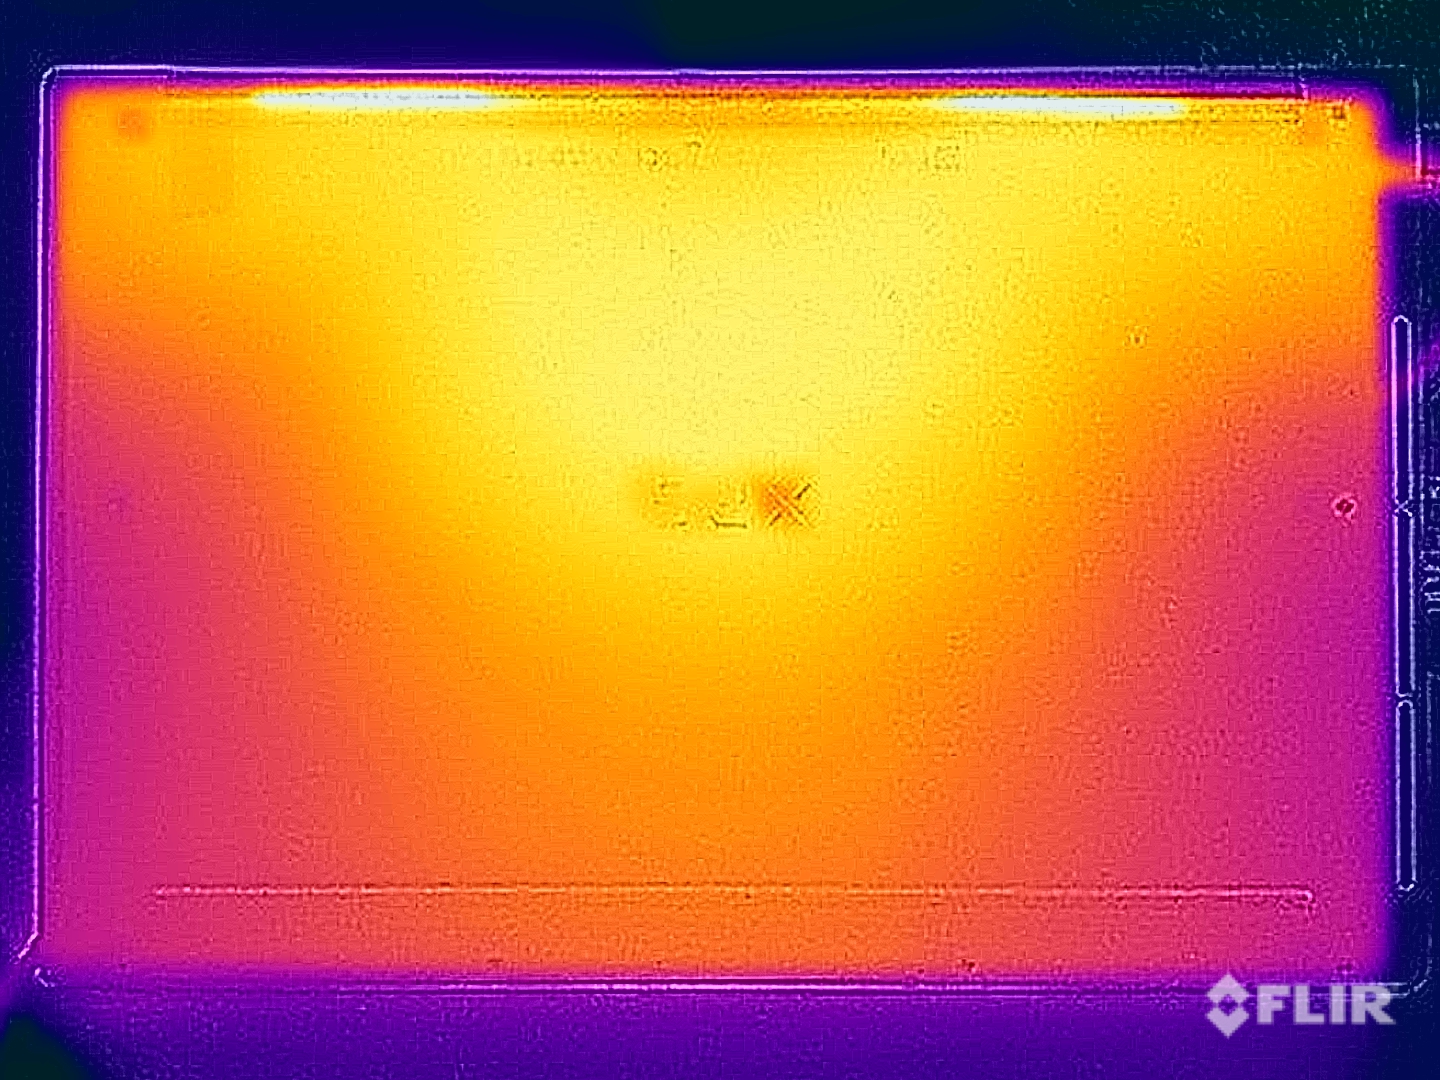
Dizüstü bilgisayarın yüzey sıcaklıkları, Dell'in bileşenlerin performansını artırabileceğini veya fanların hızını azaltabileceğini gösteriyor, çünkü stres testi sırasında bile hiçbir zaman 40 ° C'den fazla ölçüm yapmadık. Alüminyum kasa, basit görevler sırasında ve rölantide çalışırken neredeyse hiç ısınmıyor. Kombine CPU/GPU yükü kullanılarak yapılan stres testinde, grafik kartı 60 watt'ta sabit kalırken, işlemci sadece 20 watt ile yetinmek zorunda kaldı.
(+) Üst taraftaki maksimum sıcaklık, 36.8 °C / 98 F ortalamasına kıyasla 39.4 °C / 103 F'dir. , Multimedia sınıfı için 21 ile 71 °C arasında değişir.
(+) Alt kısım, 39.1 °C / 102 F ortalamasına kıyasla maksimum 36.9 °C / 98 F'ye kadar ısınır
(+) Boşta kullanımda, üst tarafın ortalama sıcaklığı 26.3 °C / 79 F olup, cihazın 31.3 °C / 88 F.
(±) The Witcher 3 oynarken, üst tarafın ortalama sıcaklığı 34 °C / 93 F olup, cihazın 31.3 °C / 88 F.
(+) Avuç içi dayanakları ve dokunmatik yüzey, maksimum 30.2 °C / 86.4 F ile cilt sıcaklığından daha soğuktur ve bu nedenle dokunulduğunda soğuktur.
(±) Benzer cihazların avuç içi dayanağı alanının ortalama sıcaklığı 28.7 °C / 83.7 F (-1.5 °C / -2.7 F) idi.
| Dell XPS 16 9640 Intel Core Ultra 7 155H, NVIDIA GeForce RTX 4070 Laptop GPU | Samsung Galaxy Book4 Ultra Intel Core Ultra 7 155H, NVIDIA GeForce RTX 4050 Laptop GPU | Honor MagicBook Pro 16 2024 Intel Core Ultra 7 155H, NVIDIA GeForce RTX 4060 Laptop GPU | Asus ROG Zephyrus G16 2024 GU605M Intel Core Ultra 7 155H, NVIDIA GeForce RTX 4070 Laptop GPU | Lenovo Yoga Pro 9 16-IRP G8 Intel Core i7-13705H, NVIDIA GeForce RTX 4060 Laptop GPU | Schenker VISION 16 Pro (M23) Intel Core i7-13700H, NVIDIA GeForce RTX 4070 Laptop GPU | Dell XPS 15 9530 RTX 4070 Intel Core i7-13700H, NVIDIA GeForce RTX 4070 Laptop GPU | |
|---|---|---|---|---|---|---|---|
| Heat | 5% | 3% | -17% | -10% | -15% | -18% | |
| Maximum Upper Side * (°C) | 39.4 | 38.5 2% | 39.7 -1% | 50.3 -28% | 41.6 -6% | 46.7 -19% | 45.6 -16% |
| Maximum Bottom * (°C) | 36.9 | 41.2 -12% | 42.9 -16% | 48 -30% | 50 -36% | 54.1 -47% | 42 -14% |
| Idle Upper Side * (°C) | 28.2 | 23.5 17% | 23.7 16% | 28.8 -2% | 26.8 5% | 26.5 6% | 34.4 -22% |
| Idle Bottom * (°C) | 27.4 | 24.1 12% | 23.5 14% | 29.8 -9% | 27.9 -2% | 26.8 2% | 33.2 -21% |
* ... daha küçük daha iyidir
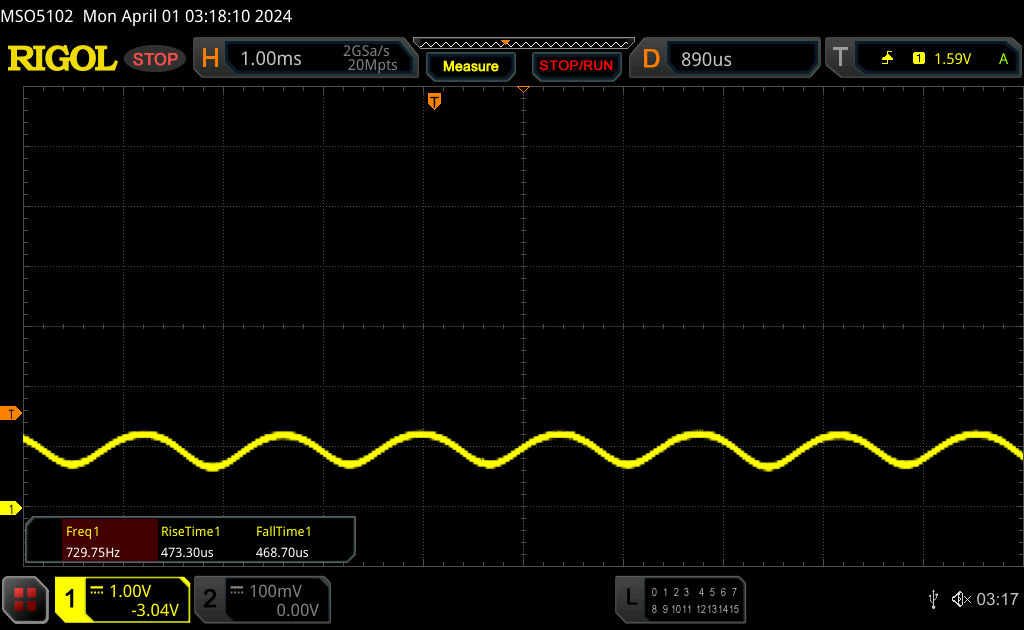
Konuşmacılar
XPS 16'nın ses sistemi, toplam 10 watt çıkışa sahip dört hoparlörden oluşuyor. Ortaya çıkan ses iyi ve hayal kırıklığına uğramayacaksınız, ancak rakipler gibi ROG Zephyrus G16 daha da iyi olabileceğini gösteriyor. Analizimize göre, yeni XPS 16 da eskisinin biraz gerisinde kalıyor XPS 15.
Dell XPS 16 9640 ses analizi
(+) | hoparlörler nispeten yüksek sesle çalabilir (83.4 dB)
Bas 100 - 315Hz
(±) | azaltılmış bas - ortalama olarak medyandan 11.2% daha düşük
(±) | Bas doğrusallığı ortalamadır (8.9% delta - önceki frekans)
Ortalar 400 - 2000 Hz
(+) | dengeli ortalar - medyandan yalnızca 4.5% uzakta
(+) | orta frekanslar doğrusaldır (3% deltadan önceki frekansa)
Yüksekler 2 - 16 kHz
(+) | dengeli yüksekler - medyandan yalnızca 1.4% uzakta
(+) | yüksekler doğrusaldır (2% deltadan önceki frekansa)
Toplam 100 - 16.000 Hz
(+) | genel ses doğrusaldır (10% ortancaya göre fark)
Aynı sınıfla karşılaştırıldığında
» Bu sınıftaki tüm test edilen cihazların %13%'si daha iyi, 2% benzer, 84% daha kötüydü
» En iyisinin deltası 5% idi, ortalama 17% idi, en kötüsü 45% idi
Test edilen tüm cihazlarla karşılaştırıldığında
» Test edilen tüm cihazların %4'si daha iyi, 1 benzer, % 94 daha kötüydü
» En iyisinin deltası 4% idi, ortalama 23% idi, en kötüsü 134% idi
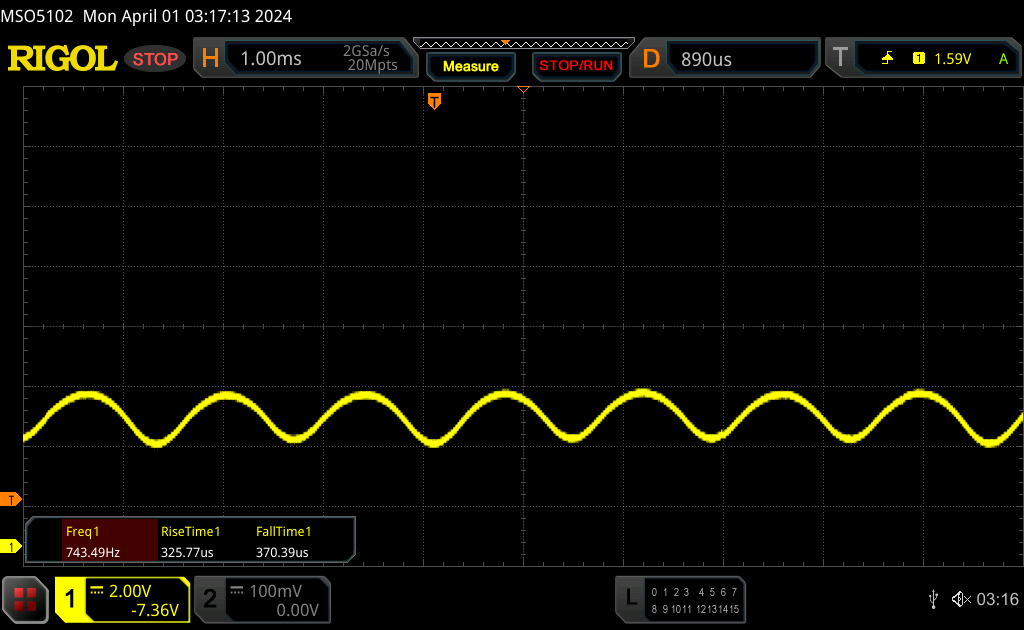
Asus ROG Zephyrus G16 2024 GU605M ses analizi
(+) | hoparlörler nispeten yüksek sesle çalabilir (83.3 dB)
Bas 100 - 315Hz
(+) | iyi bas - medyandan yalnızca 3.8% uzakta
(±) | Bas doğrusallığı ortalamadır (8.1% delta - önceki frekans)
Ortalar 400 - 2000 Hz
(+) | dengeli ortalar - medyandan yalnızca 3.5% uzakta
(+) | orta frekanslar doğrusaldır (2.4% deltadan önceki frekansa)
Yüksekler 2 - 16 kHz
(+) | dengeli yüksekler - medyandan yalnızca 2.2% uzakta
(+) | yüksekler doğrusaldır (3.7% deltadan önceki frekansa)
Toplam 100 - 16.000 Hz
(+) | genel ses doğrusaldır (7.3% ortancaya göre fark)
Aynı sınıfla karşılaştırıldığında
» Bu sınıftaki tüm test edilen cihazların %1%'si daha iyi, 0% benzer, 99% daha kötüydü
» En iyisinin deltası 6% idi, ortalama 18% idi, en kötüsü 132% idi
Test edilen tüm cihazlarla karşılaştırıldığında
» Test edilen tüm cihazların %1'si daha iyi, 0 benzer, % 99 daha kötüydü
» En iyisinin deltası 4% idi, ortalama 23% idi, en kötüsü 134% idi
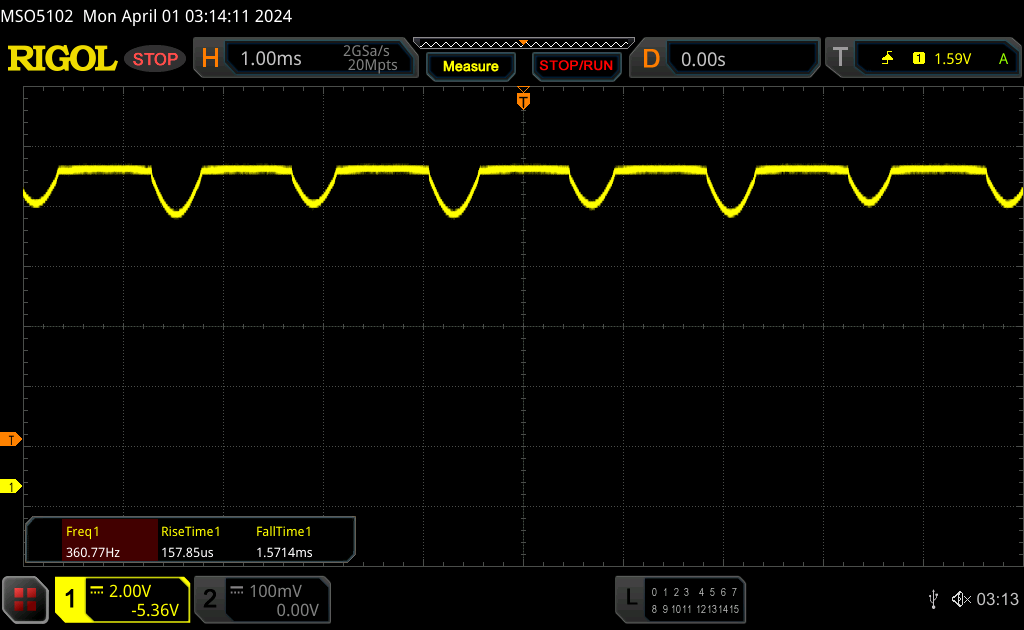
Lenovo Yoga Pro 9 16-IRP G8 ses analizi
(±) | hoparlör ses yüksekliği ortalama ama iyi (80.5 dB)
Bas 100 - 315Hz
(+) | iyi bas - medyandan yalnızca 4.9% uzakta
(±) | Bas doğrusallığı ortalamadır (9.1% delta - önceki frekans)
Ortalar 400 - 2000 Hz
(+) | dengeli ortalar - medyandan yalnızca 3.2% uzakta
(+) | orta frekanslar doğrusaldır (6.5% deltadan önceki frekansa)
Yüksekler 2 - 16 kHz
(+) | dengeli yüksekler - medyandan yalnızca 2.9% uzakta
(+) | yüksekler doğrusaldır (3% deltadan önceki frekansa)
Toplam 100 - 16.000 Hz
(+) | genel ses doğrusaldır (8.4% ortancaya göre fark)
Aynı sınıfla karşılaştırıldığında
» Bu sınıftaki tüm test edilen cihazların %9%'si daha iyi, 2% benzer, 89% daha kötüydü
» En iyisinin deltası 5% idi, ortalama 17% idi, en kötüsü 45% idi
Test edilen tüm cihazlarla karşılaştırıldığında
» Test edilen tüm cihazların %2'si daha iyi, 1 benzer, % 97 daha kötüydü
» En iyisinin deltası 4% idi, ortalama 23% idi, en kötüsü 134% idi
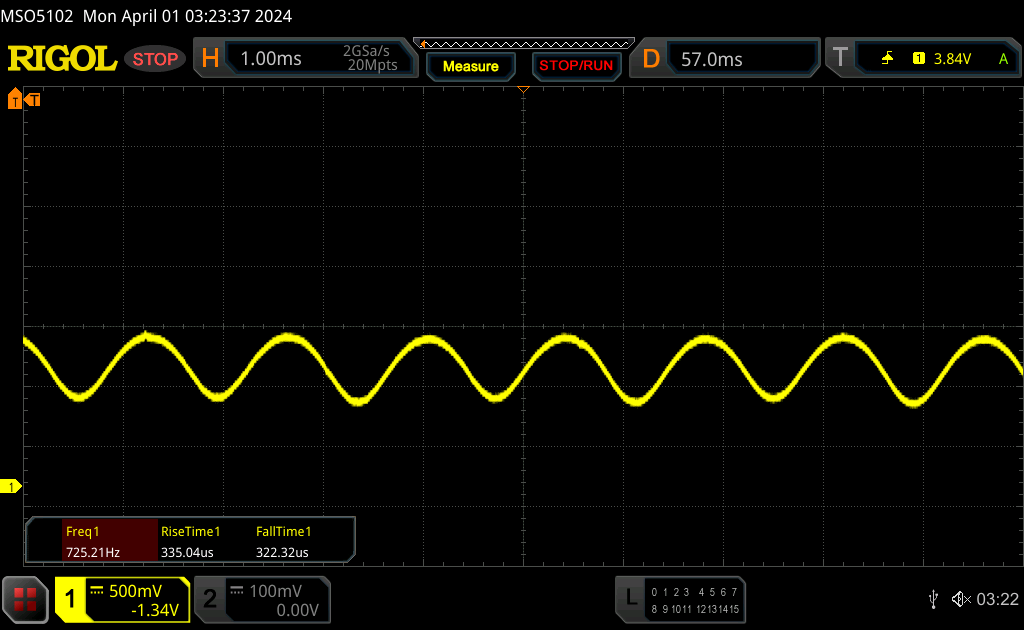
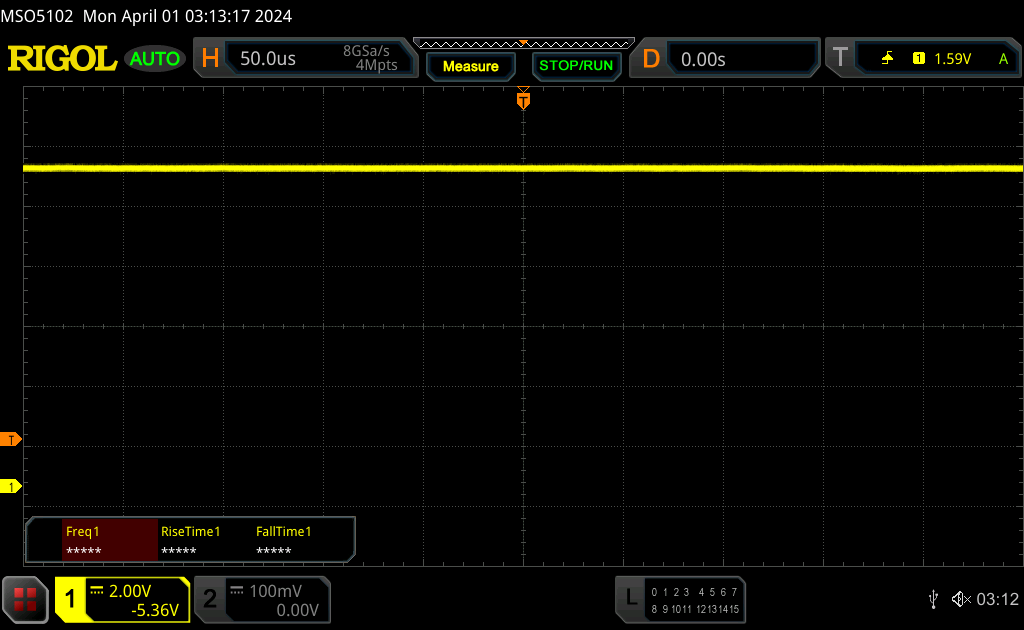
Dell XPS 15 9530 RTX 4070 ses analizi
(+) | hoparlörler nispeten yüksek sesle çalabilir (83.4 dB)
Bas 100 - 315Hz
(+) | iyi bas - medyandan yalnızca 3.9% uzakta
(+) | bas doğrusaldır (6.8% delta ile önceki frekans)
Ortalar 400 - 2000 Hz
(+) | dengeli ortalar - medyandan yalnızca 4.4% uzakta
(+) | orta frekanslar doğrusaldır (4.1% deltadan önceki frekansa)
Yüksekler 2 - 16 kHz
(+) | dengeli yüksekler - medyandan yalnızca 1.1% uzakta
(+) | yüksekler doğrusaldır (3.3% deltadan önceki frekansa)
Toplam 100 - 16.000 Hz
(+) | genel ses doğrusaldır (6.4% ortancaya göre fark)
Aynı sınıfla karşılaştırıldığında
» Bu sınıftaki tüm test edilen cihazların %4%'si daha iyi, 1% benzer, 95% daha kötüydü
» En iyisinin deltası 5% idi, ortalama 17% idi, en kötüsü 45% idi
Test edilen tüm cihazlarla karşılaştırıldığında
» Test edilen tüm cihazların %1'si daha iyi, 0 benzer, % 99 daha kötüydü
» En iyisinin deltası 4% idi, ortalama 23% idi, en kötüsü 134% idi
Güç yönetimi - 99,5 Wh pil sayesinde çok fazla dayanıklılık
Güç tüketimi
Tüketim ölçümlerimizde, yüksek çözünürlüklü OLED dokunmatik ekran şaşırtıcı derecede tutumlu olduğunu kanıtladı, çünkü koyu renkli standart arka plan görüntüsüne rağmen, 10,6 watt'lık maksimum tüketim 16,3 inçlik bir ekran için fazla değil. Yük altında herhangi bir sürprizle karşılaşmadık. Stres testi sırasında tüketimi kısa bir süre 138 watt civarına ulaştı, ancak 1,5 dakika sonra 125 watt'ta ve daha sonra 115 watt'ta sabitlendi. Çok fazla boşluk olmayabilir ama genel olarak 130 watt'lık kompakt güç kaynağı yeterli büyüklükte.
| Kapalı / Bekleme modu | |
| Boşta | |
| Çalışırken |
|
Key:
min: | |
| Dell XPS 16 9640 Ultra 7 155H, GeForce RTX 4070 Laptop GPU, Kioxia XG8 KXG80ZNV1T02, OLED, 3840x2400, 16.3" | Samsung Galaxy Book4 Ultra Ultra 7 155H, GeForce RTX 4050 Laptop GPU, Samsung PM9A1 MZVL2512HCJQ, OLED, 2880x1800, 16" | Honor MagicBook Pro 16 2024 Ultra 7 155H, GeForce RTX 4060 Laptop GPU, WD PC SN740 SDDPNQD-1T00, IPS, 3072x1920, 16" | Asus ROG Zephyrus G16 2024 GU605M Ultra 7 155H, GeForce RTX 4070 Laptop GPU, WD PC SN560 SDDPNQE-1T00, OLED, 2560x1600, 16" | Lenovo Yoga Pro 9 16-IRP G8 i7-13705H, GeForce RTX 4060 Laptop GPU, Samsung PM9A1 MZVL21T0HCLR, Mini-LED, 3200x2000, 16" | Schenker VISION 16 Pro (M23) i7-13700H, GeForce RTX 4070 Laptop GPU, Samsung 990 Pro 1 TB, IPS, 2560x1600, 16" | Dell XPS 15 9530 RTX 4070 i7-13700H, GeForce RTX 4070 Laptop GPU, SK hynix PC801 HFS001TEJ9X101N, OLED, 3456x2160, 15.6" | Ortalama NVIDIA GeForce RTX 4070 Laptop GPU | Sınıf ortalaması Multimedia | |
|---|---|---|---|---|---|---|---|---|---|
| Power Consumption | 22% | -20% | -11% | -58% | -16% | -57% | -73% | 8% | |
| Idle Minimum * (Watt) | 7.7 | 4.8 38% | 5.2 32% | 8.3 -8% | 10.9 -42% | 8.6 -12% | 20 -160% | 13.2 ? -71% | 5.72 ? 26% |
| Idle Average * (Watt) | 10.3 | 7.5 27% | 14.4 -40% | 12.5 -21% | 22.6 -119% | 12 -17% | 20.7 -101% | 18.2 ? -77% | 10.2 ? 1% |
| Idle Maximum * (Watt) | 10.6 | 7.9 25% | 15.4 -45% | 12.8 -21% | 23.5 -122% | 12.4 -17% | 22.4 -111% | 24.6 ? -132% | 12.4 ? -17% |
| Load Average * (Watt) | 76.5 | 79.3 -4% | 105.4 -38% | 71.3 7% | 84.6 -11% | 80 -5% | 77.1 -1% | 97 ? -27% | 65.5 ? 14% |
| Witcher 3 ultra * (Watt) | 126.4 | 79.2 37% | 107.6 15% | 127.5 -1% | 159.5 -26% | 147.7 -17% | 95.4 25% | ||
| Load Maximum * (Watt) | 138.5 | 125 10% | 195.2 -41% | 169.1 -22% | 177.3 -28% | 173.1 -25% | 133.4 4% | 221 ? -60% | 114 ? 18% |
* ... daha küçük daha iyidir
Power consumption Witcher 3 / stress test
Power consumption with external monitor
Çalışma Zamanları
Dell, 99,5 Wh kapasiteye sahip yeni XPS 16'ya mümkün olan en büyük pili yerleştirdi ve toplamda çalışma süreleri çok iyi. WLAN testimizde 150 cd/m²'de (test cihazının maksimum SDR parlaklığının %57'sine karşılık gelir), 60 Hz'de 10:29 saat (90 Hz'de 09:56 saat) ve tam parlaklıkta ve 60 Hz'de 8 saatin biraz üzerinde (90 Hz'de ~07:20 saat) ölçtük. Video testi sırasında 150 cd/m²'de çok iyi bir 16,5 saat kaydettik ve burada Meteor Lake işlemci iki düşük güç verimliliği çekirdeğinden yararlanıyor. Tam parlaklıkta bir HDR video 6,5 saatin biraz üzerinde oynatılabildi ve tam yük altında test 1,5 saatin biraz altında sona erdi.
XPS 16 iki şarj hızı sunuyor: Normal modda, cihaz açıldığında pilin tamamen şarj olması 151 dakika sürüyor (93 dakika sonra %80); ekspres modda ise 97 dakika sürüyor (50 dakika sonra %80).
| Dell XPS 16 9640 Ultra 7 155H, GeForce RTX 4070 Laptop GPU, 99.5 Wh | Samsung Galaxy Book4 Ultra Ultra 7 155H, GeForce RTX 4050 Laptop GPU, 76 Wh | Honor MagicBook Pro 16 2024 Ultra 7 155H, GeForce RTX 4060 Laptop GPU, 75 Wh | Asus ROG Zephyrus G16 2024 GU605M Ultra 7 155H, GeForce RTX 4070 Laptop GPU, 90 Wh | Lenovo Yoga Pro 9 16-IRP G8 i7-13705H, GeForce RTX 4060 Laptop GPU, 75 Wh | Schenker VISION 16 Pro (M23) i7-13700H, GeForce RTX 4070 Laptop GPU, 80 Wh | Dell XPS 15 9530 RTX 4070 i7-13700H, GeForce RTX 4070 Laptop GPU, 86 Wh | Sınıf ortalaması Multimedia | |
|---|---|---|---|---|---|---|---|---|
| Pil Çalışma Süresi | -0% | -13% | -27% | -49% | -31% | -12% | 9% | |
| H.264 (h) | 16.5 | 17.9 8% | 13.1 -21% | 11.2 -32% | 7.5 -55% | 7.8 -53% | 16.4 ? -1% | |
| WiFi v1.3 (h) | 10.5 | 10.9 4% | 12.2 16% | 7.3 -30% | 6.4 -39% | 7.8 -26% | 8 -24% | 12.2 ? 16% |
| Load (h) | 1.5 | 1.3 -13% | 1 -33% | 1.2 -20% | 0.7 -53% | 1.3 -13% | 1.5 0% | 1.668 ? 11% |
Artılar
Eksiler
Karar - Yeni XPS tasarımı 16 inçlik bir cihaz olarak daha iyi çalışıyor
Toplamda, yeni Dell XPS 16 aşağıdakilerden daha iyi bir izlenim bırakıyor 14 inçlik daha küçük model. Ağırlığına rağmen dizüstü bilgisayarın tasarımı çok hantal hissettirmiyor ve ince çerçeveleri sayesinde rakiplerine kıyasla kapladığı alan da avantajlı. Yine de, bu modelin de tasarımı ön planda tuttuğunu ve özellikle 60 watt'lık RTX 4070 Dizüstü Bilgisayar'in grafik performansı sadece ortalama. Buna karşılık, Meteor Lake işlemcileri eski Raptor-Lake modellerine göre herhangi bir avantaj sunmasa bile CPU performansı iyi.
Cihazın 4K OLED dokunmatik ekranı doğru renklerle iyi bir görüntü kalitesi sunuyor ancak en güncel OLED panellerle karşılaştırıldığında, hafif içerikleri görüntülerken net bir tarama etkisi fark edebilirsiniz; ayrıca 90 Hz yenileme hızı artık tamamen güncel değil. Yeni giriş aygıtları da çok iyi değil, klavyeye alışmak biraz zaman alıyor ve özellikle dokunmatik çubuk günlük kullanımda oldukça rahatsız edici. Bağlantı söz konusu olduğunda, daha küçük XPS 14'te olduğu gibi üç USB-C bağlantı noktasıyla yetinmeniz gerekecek; RTX 4070 Dizüstü Bilgisayarlı daha pahalı XPS 16'da yalnızca 2x Thunderbolt var gibi görünüyor ve daha zayıf modellerin her ikisi de 3x Thunderbolt 4'e sahip.
Dell XPS 16 tasarıma odaklanırken aynı zamanda iyi bir CPU performansı sunuyor, ancak giriş cihazı ergonomisi ve GPU performansı sonuç olarak zarar görüyor. Ayrıca, 2.899 ABD doları ile son derece pahalıdır.
Dizüstü bilgisayarın hoparlörleri ve çalışma süreleri hakkında söyleyecek olumsuz bir şeyimiz yok ve genel olarak, test örneğimizde iki USB-C bağlantı noktası arasında küçük bir yapı kusuru görülmesine rağmen, yapısı ve kasa stabilitesi iyi. Yüzey sıcaklıkları yük altında bile çok düşük kalıyor, ancak fanlar çok gürültülü ve tüm enerji profilleri arasında büyük farklar olmadığını gördük. Yapılandırma seçenekleri, özellikle RAM söz konusu olduğunda oldukça az sınırlama gösteriyor. Maksimum 64 GB RAM seçebilirsiniz, ancak yalnızca Core Ultra 9 185H ile birlikte.
Bir konuda açık olmalısınız, yani performans XPS 16'nın benzersiz satış noktası değildir - rekabet, özellikle GPU'lar söz konusu olduğunda çok daha fazla performans sunar. Aynı zamanda, 2.899 ABD doları ile Dell XPS 16'nın fiyatı son derece yüksek ve birçok rakibi daha iyi fiyat-performans oranları sunuyor.
Fiyat ve bulunabilirlik
Yeni XPS 16 9640 şu anda 1.699 ABD Dolarından başlayan fiyatlarla doğrudan Dell'den sipariş edilebilir.
Dell XPS 16 9640
- 04/09/2024 v7 (old)
Andreas Osthoff
Şeffaflık
İncelenecek cihazların seçimi editör ekibimiz tarafından yapılır. Test örneği, bu incelemenin amacı doğrultusunda üretici veya perakendeci tarafından yazara ödünç olarak sağlanmıştır. Borç verenin bu inceleme üzerinde herhangi bir etkisi olmadığı gibi, üretici de yayınlanmadan önce bu incelemenin bir kopyasını almamıştır. Bu incelemeyi yayınlama zorunluluğu yoktu. Bağımsız bir medya şirketi olarak Notebookcheck, üreticilerin, perakendecilerin veya yayıncıların otoritesine tabi değildir.
Notebookcheck bu şekilde test yapıyor
Notebookcheck, tüm sonuçların karşılaştırılabilir olmasını sağlamak için her yıl yüzlerce dizüstü bilgisayarı ve akıllı telefonu standart prosedürler kullanarak bağımsız olarak inceliyor. Yaklaşık 20 yıldır test yöntemlerimizi sürekli olarak geliştirdik ve bu süreçte endüstri standartlarını belirledik. Test laboratuvarlarımızda deneyimli teknisyenler ve editörler tarafından yüksek kaliteli ölçüm ekipmanları kullanılmaktadır. Bu testler çok aşamalı bir doğrulama sürecini içerir. Karmaşık derecelendirme sistemimiz, nesnelliği koruyan yüzlerce sağlam temellere dayanan ölçüm ve kıyaslamaya dayanmaktadır.Price comparison

