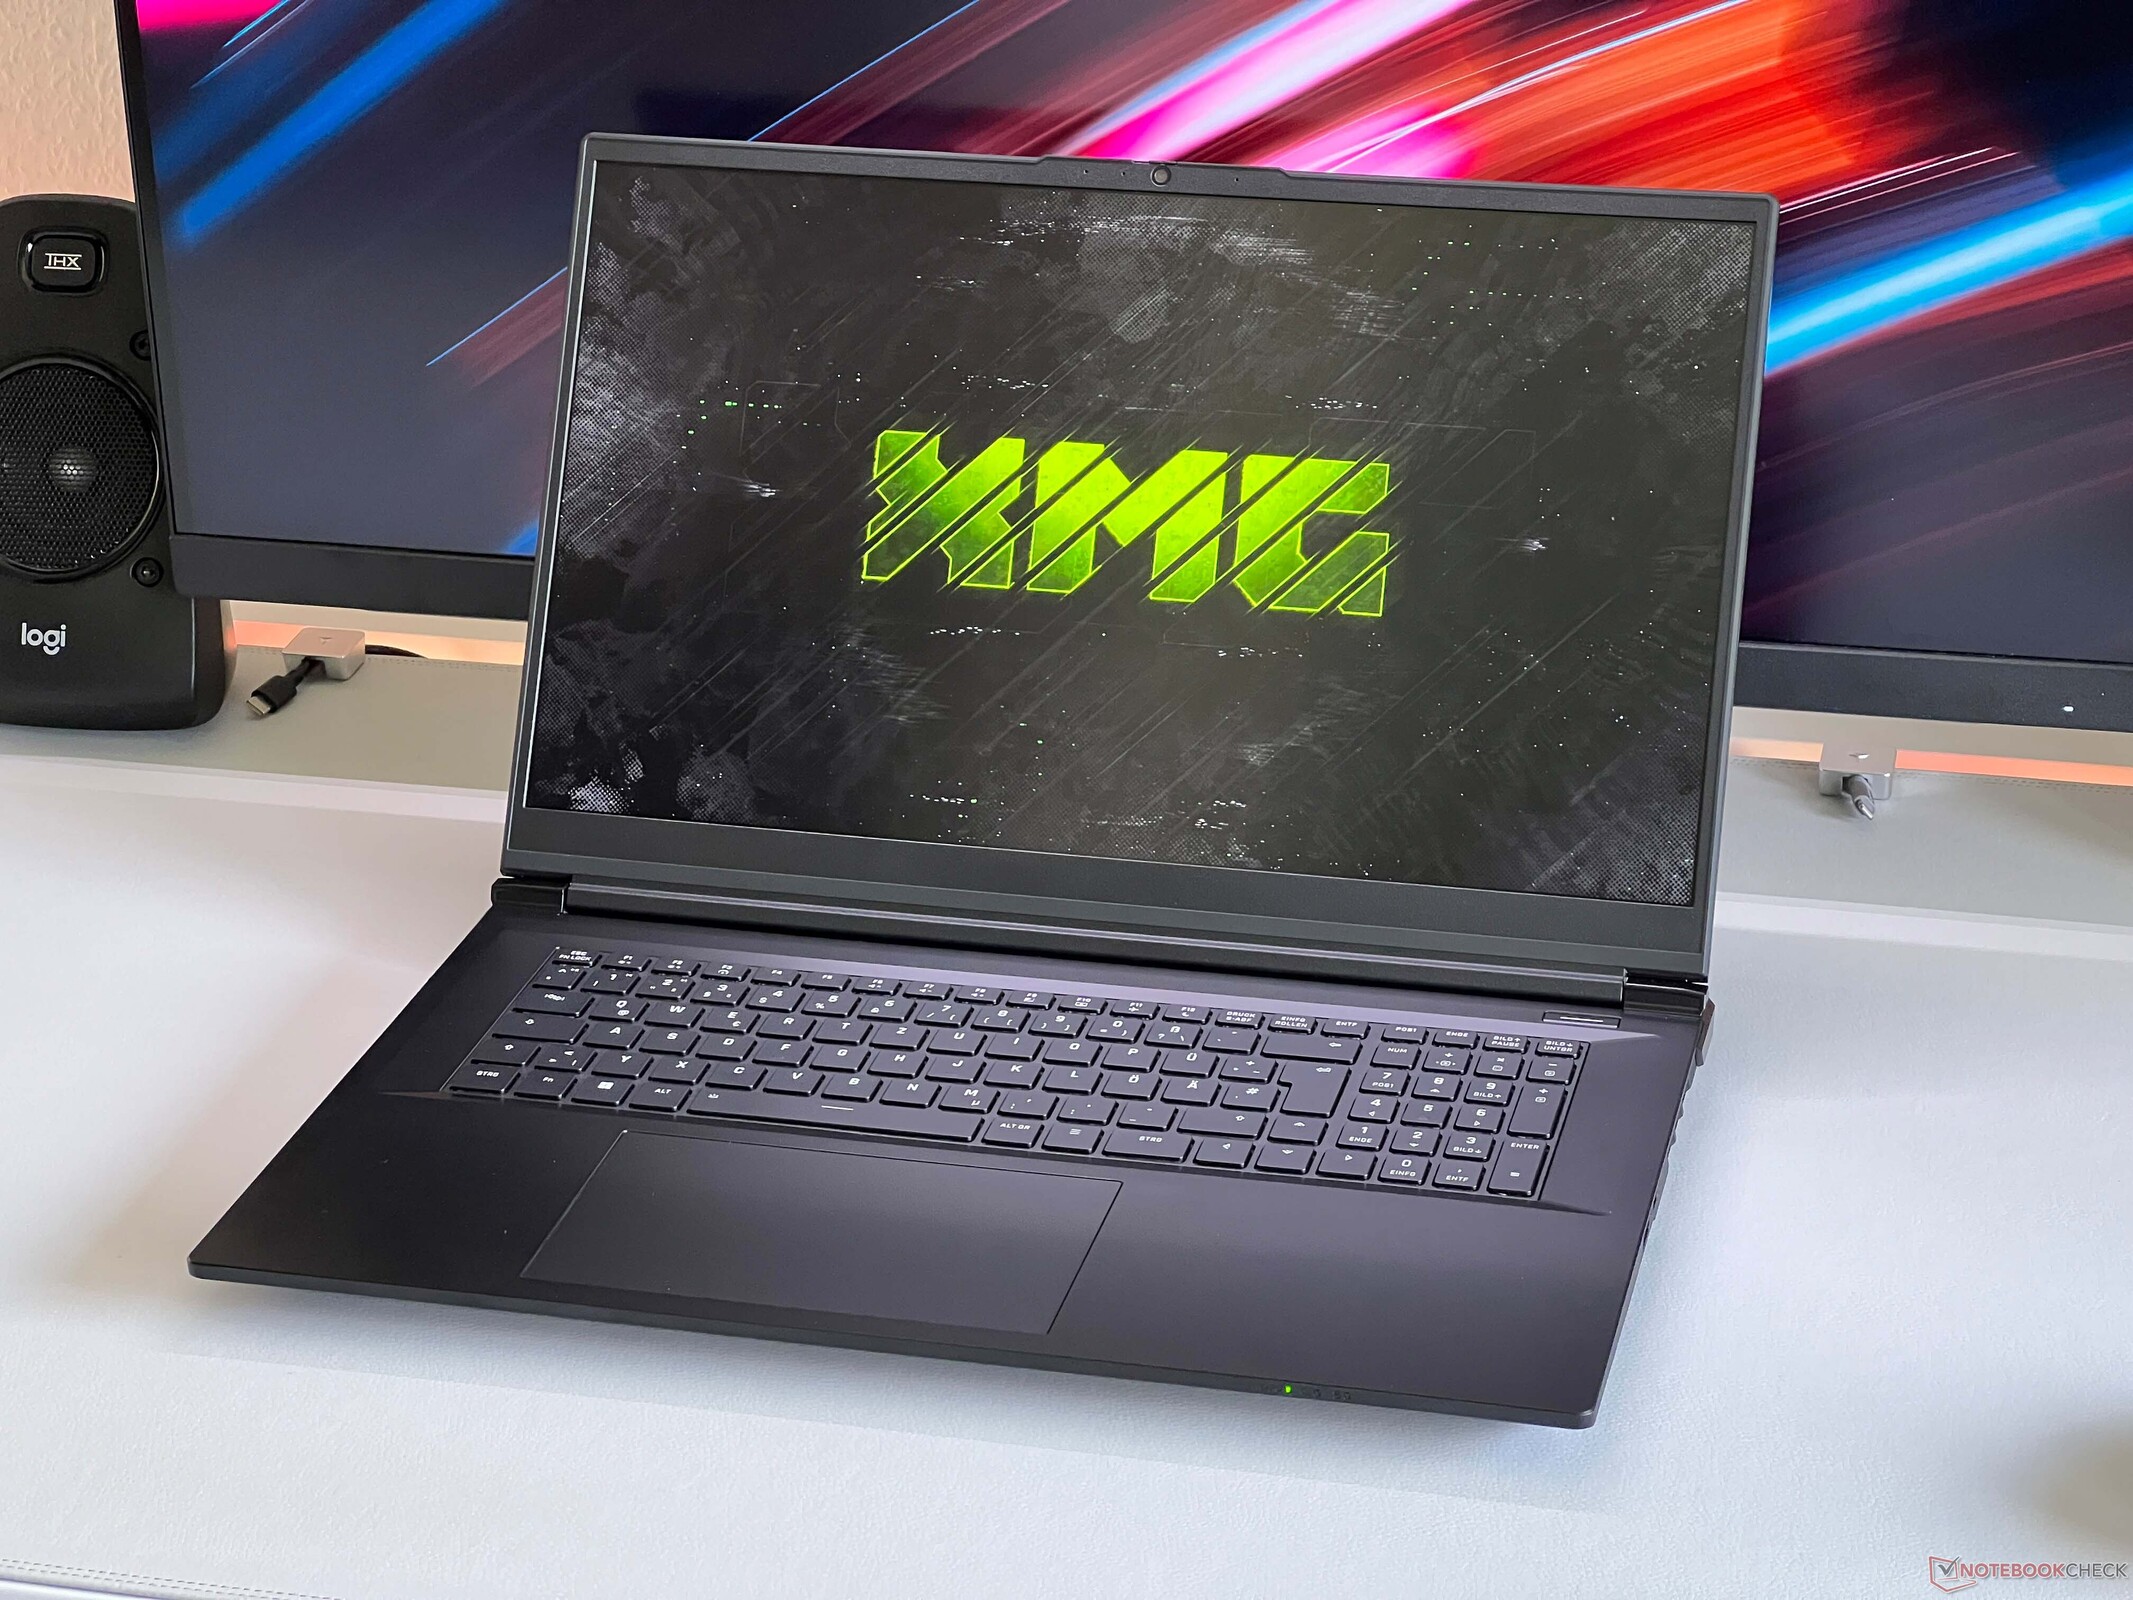
Karar - XMG Focus 17, bazı ödünlerle birlikte yüksek bir performans sunuyor
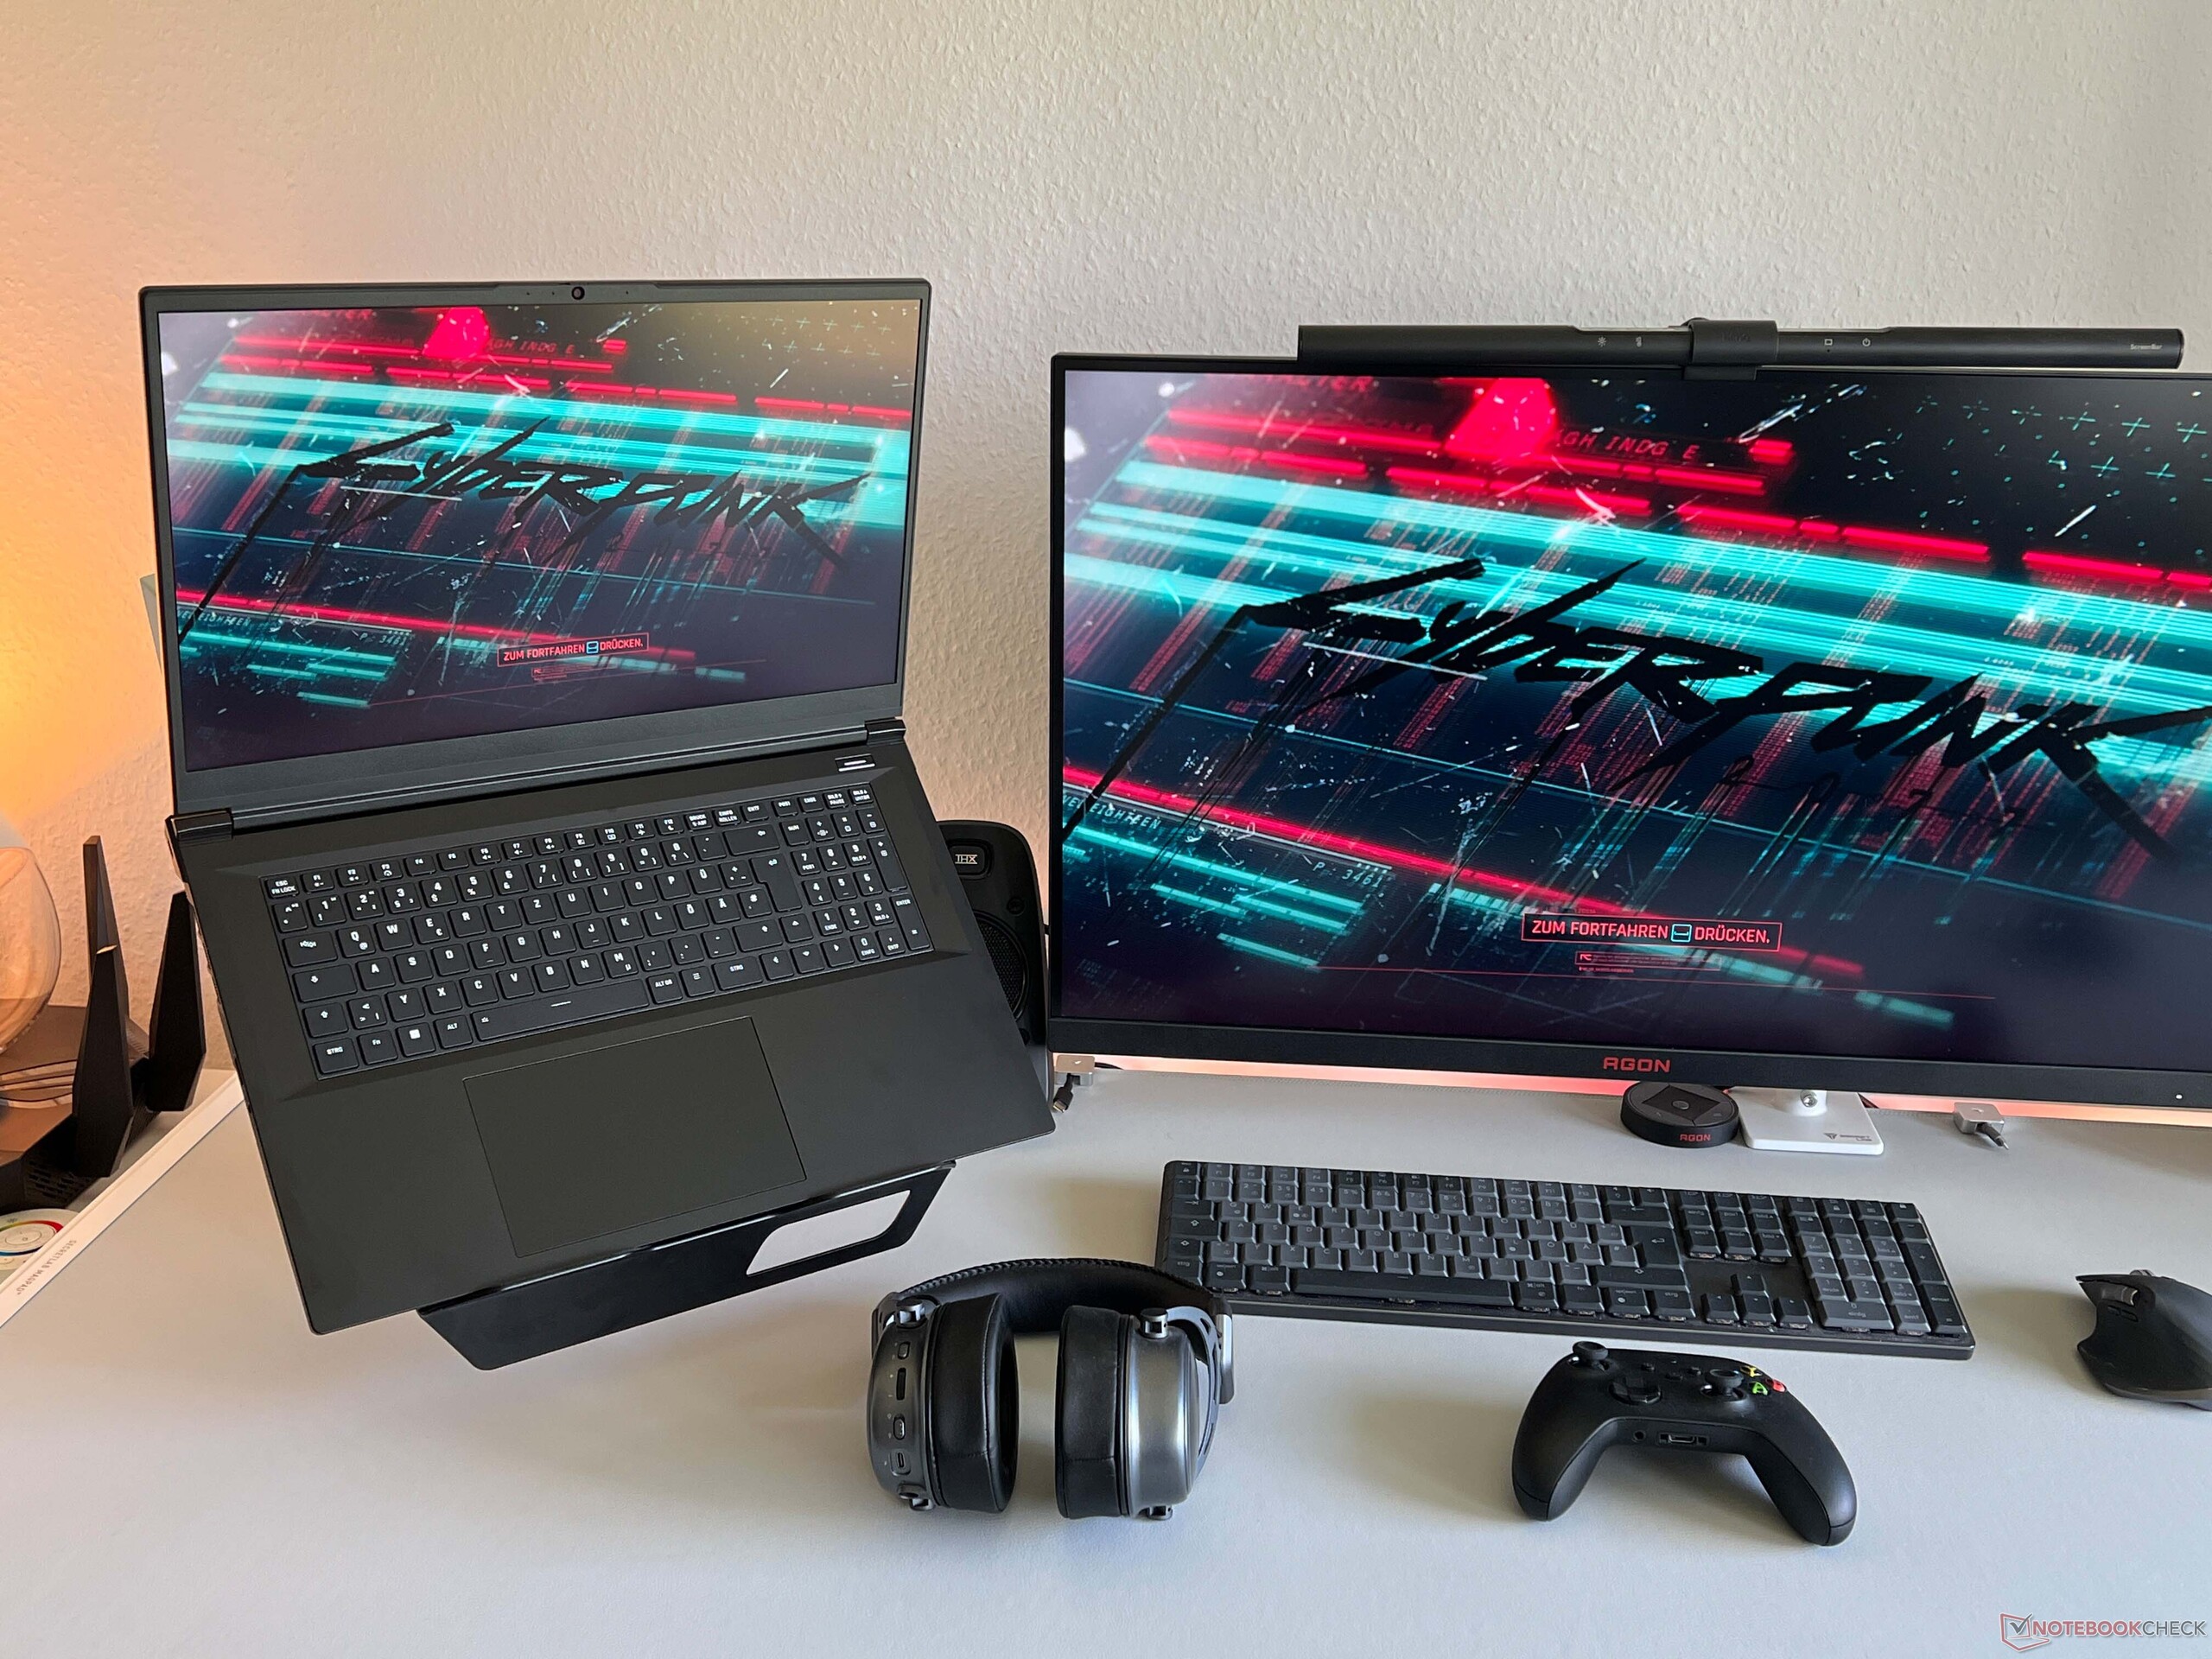
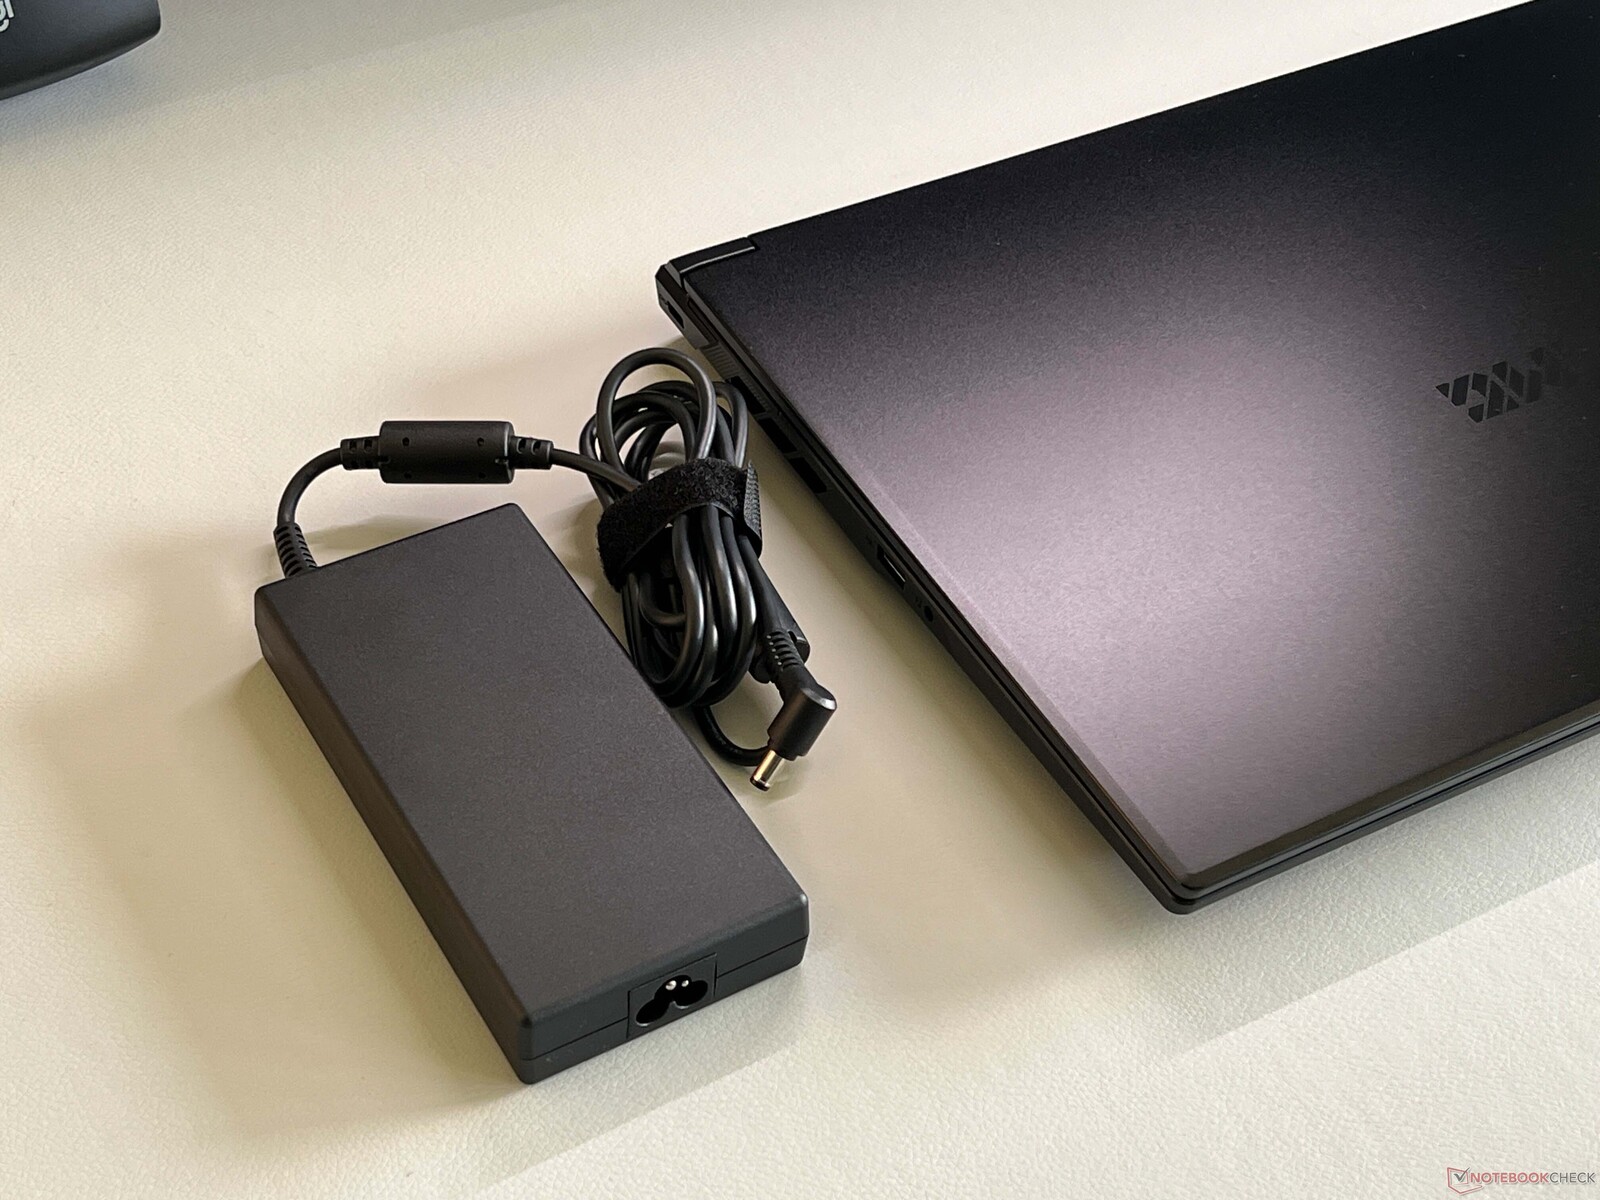
Yeni Focus 17 M25 ile XMG, mümkün olan en düşük fiyata mümkün olan en yüksek performansı sunmayı hedefliyor. Bunu başarmak için, yeni GeForce RTX 5070 Ti dizüstü bilgisayar GPU'su (12 GB VRAM) en hızlı 140 watt'lık varyantta daha eski Core i9-13900HX. Bununla birlikte, özellikle oyunlarda performansı hala yeterli. Bu da doğal QHD çözünürlükte oyun oynamayı sorunsuz bir şekilde mümkün kılıyor. Tam güce geçildiğinde fanlar çok gürültülü çalışıyor, ancak bu rakiplerinden farklı değil. Bununla birlikte, soğutma ünitesi günlük kullanımda çok sessiz kalır ve kapsamlı enerji profilleri, performans üzerinde olumsuz bir etki yaratmadan sessiz bir sistem yapılandırmanıza olanak tanır.
Mat 240 Hz IPS ekran da oyun oynamak için çok uygun. Ne yazık ki 16:9 ekran rakiplerinin parlaklığını yakalamakta zorlanıyor. Ek ödünler arasında Thunderbolt/USB 4.0 ve Advanced Optimus'un olmaması yer alıyor, ancak bunlar yönetilebilir. Hoparlörler de oldukça zayıf ve 230 watt'lık güç kaynağı sınırda küçük.
Sonuç olarak, mükemmel bir fiyata hızlı bir oyun makinesi elde edersiniz ve 12 GB VRAM ile GPU, örneğin standart RTX 5070 dizüstü bilgisayar GPU'sundan daha geleceğe dönüktür.
Artılar
Eksiler
Fiyat ve bulunabilirlik
Yeni XMG Focus 17 M25, Bestware 'den 1.849 $'dan başlayan fiyatlarla sipariş edilebilir - inceleme sırasındaki döviz kuruna göre yaklaşık 2.100 $.
İçindekiler
- Karar - XMG Focus 17, bazı ödünlerle birlikte yüksek bir performans sunuyor
- Teknik Özellikler
- Kılıf ve özellikler
- Giriş cihazları
- Ekran - 240 Hz IPS
- Performans - 96 GB'a kadar RAM ile 5070 Ti dizüstü bilgisayar GPU'su
- Emisyonlar ve enerji
- Notebookcheck genel değerlendirmesi
- Karşılaştırılan olası alternatifler
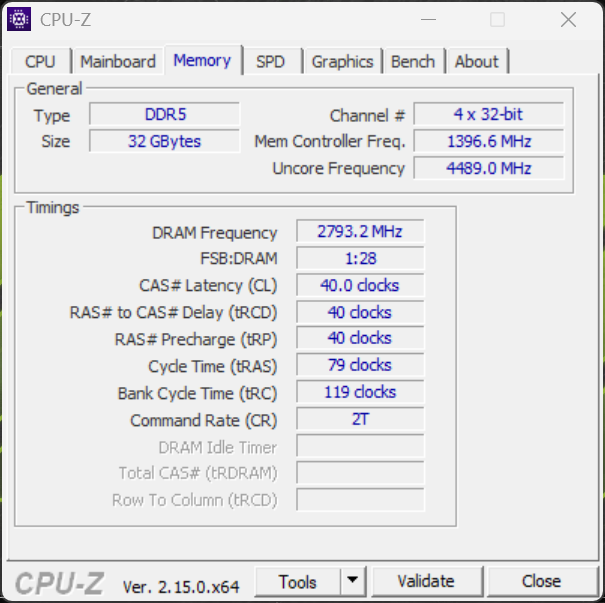
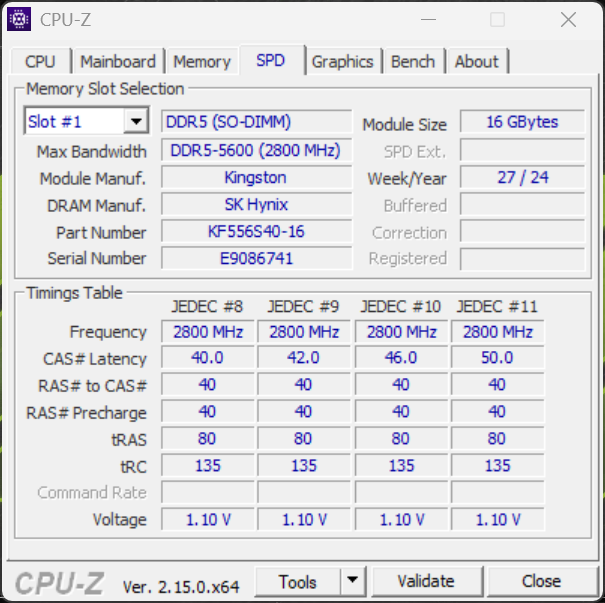
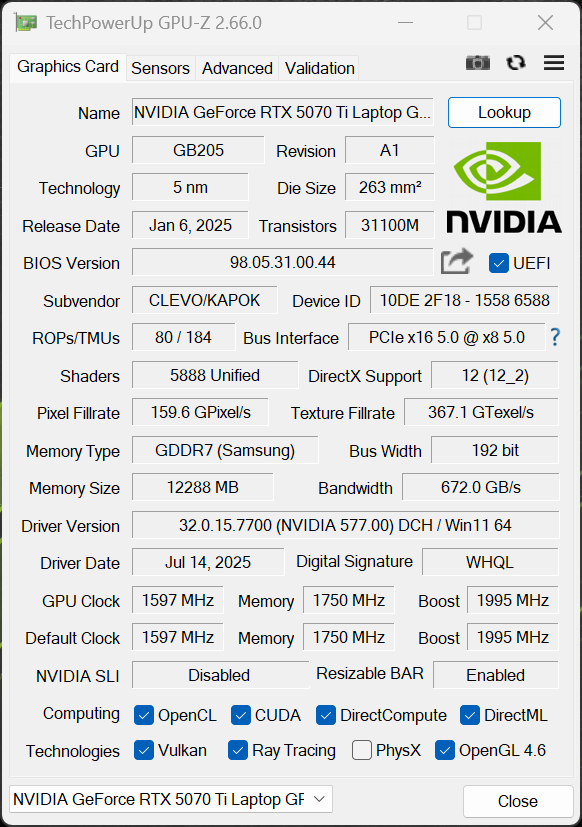
Yeni Focus 17 M25 ile XMG, düşük fiyata maksimum performans sunmayı amaçlayan 17 inçlik bir dizüstü oyun bilgisayarı sunuyor. Core i9-13900HX için başlangıç fiyatı, 16 GB RAM, 1 TB SSD ve yeni GeForce RTX 5070 Ti dizüstü bilgisayar GPU'su (140 watt) 1.849 € (2.100 $), 32 GB RAM, Wi-Fi 7 ve Windows 11 Home inceleme yapılandırmamız ise 1.990 € (2.300 $).
Gerçek bir 17 inç rakibi neredeyse hiç yok, çünkü MSI Vector 17 HX rTX 5070 Ti ile şu anda yaklaşık 3.100 € (3.600 $) karşılığında satılmaktadır. 16-inç segmentinde karşılaştırılabilir birkaç cihaz var, ancak bu aynı zamanda Focus 17'nin fiyat avantajına sahip olduğu bir alan.
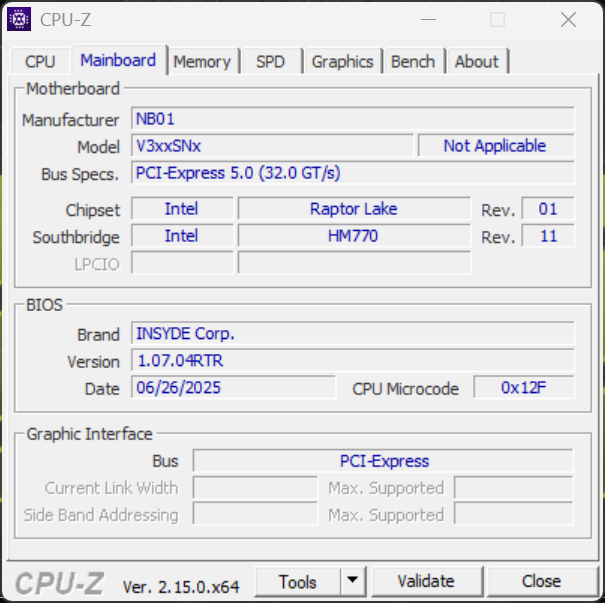
Teknik Özellikler
Kılıf ve özellikler
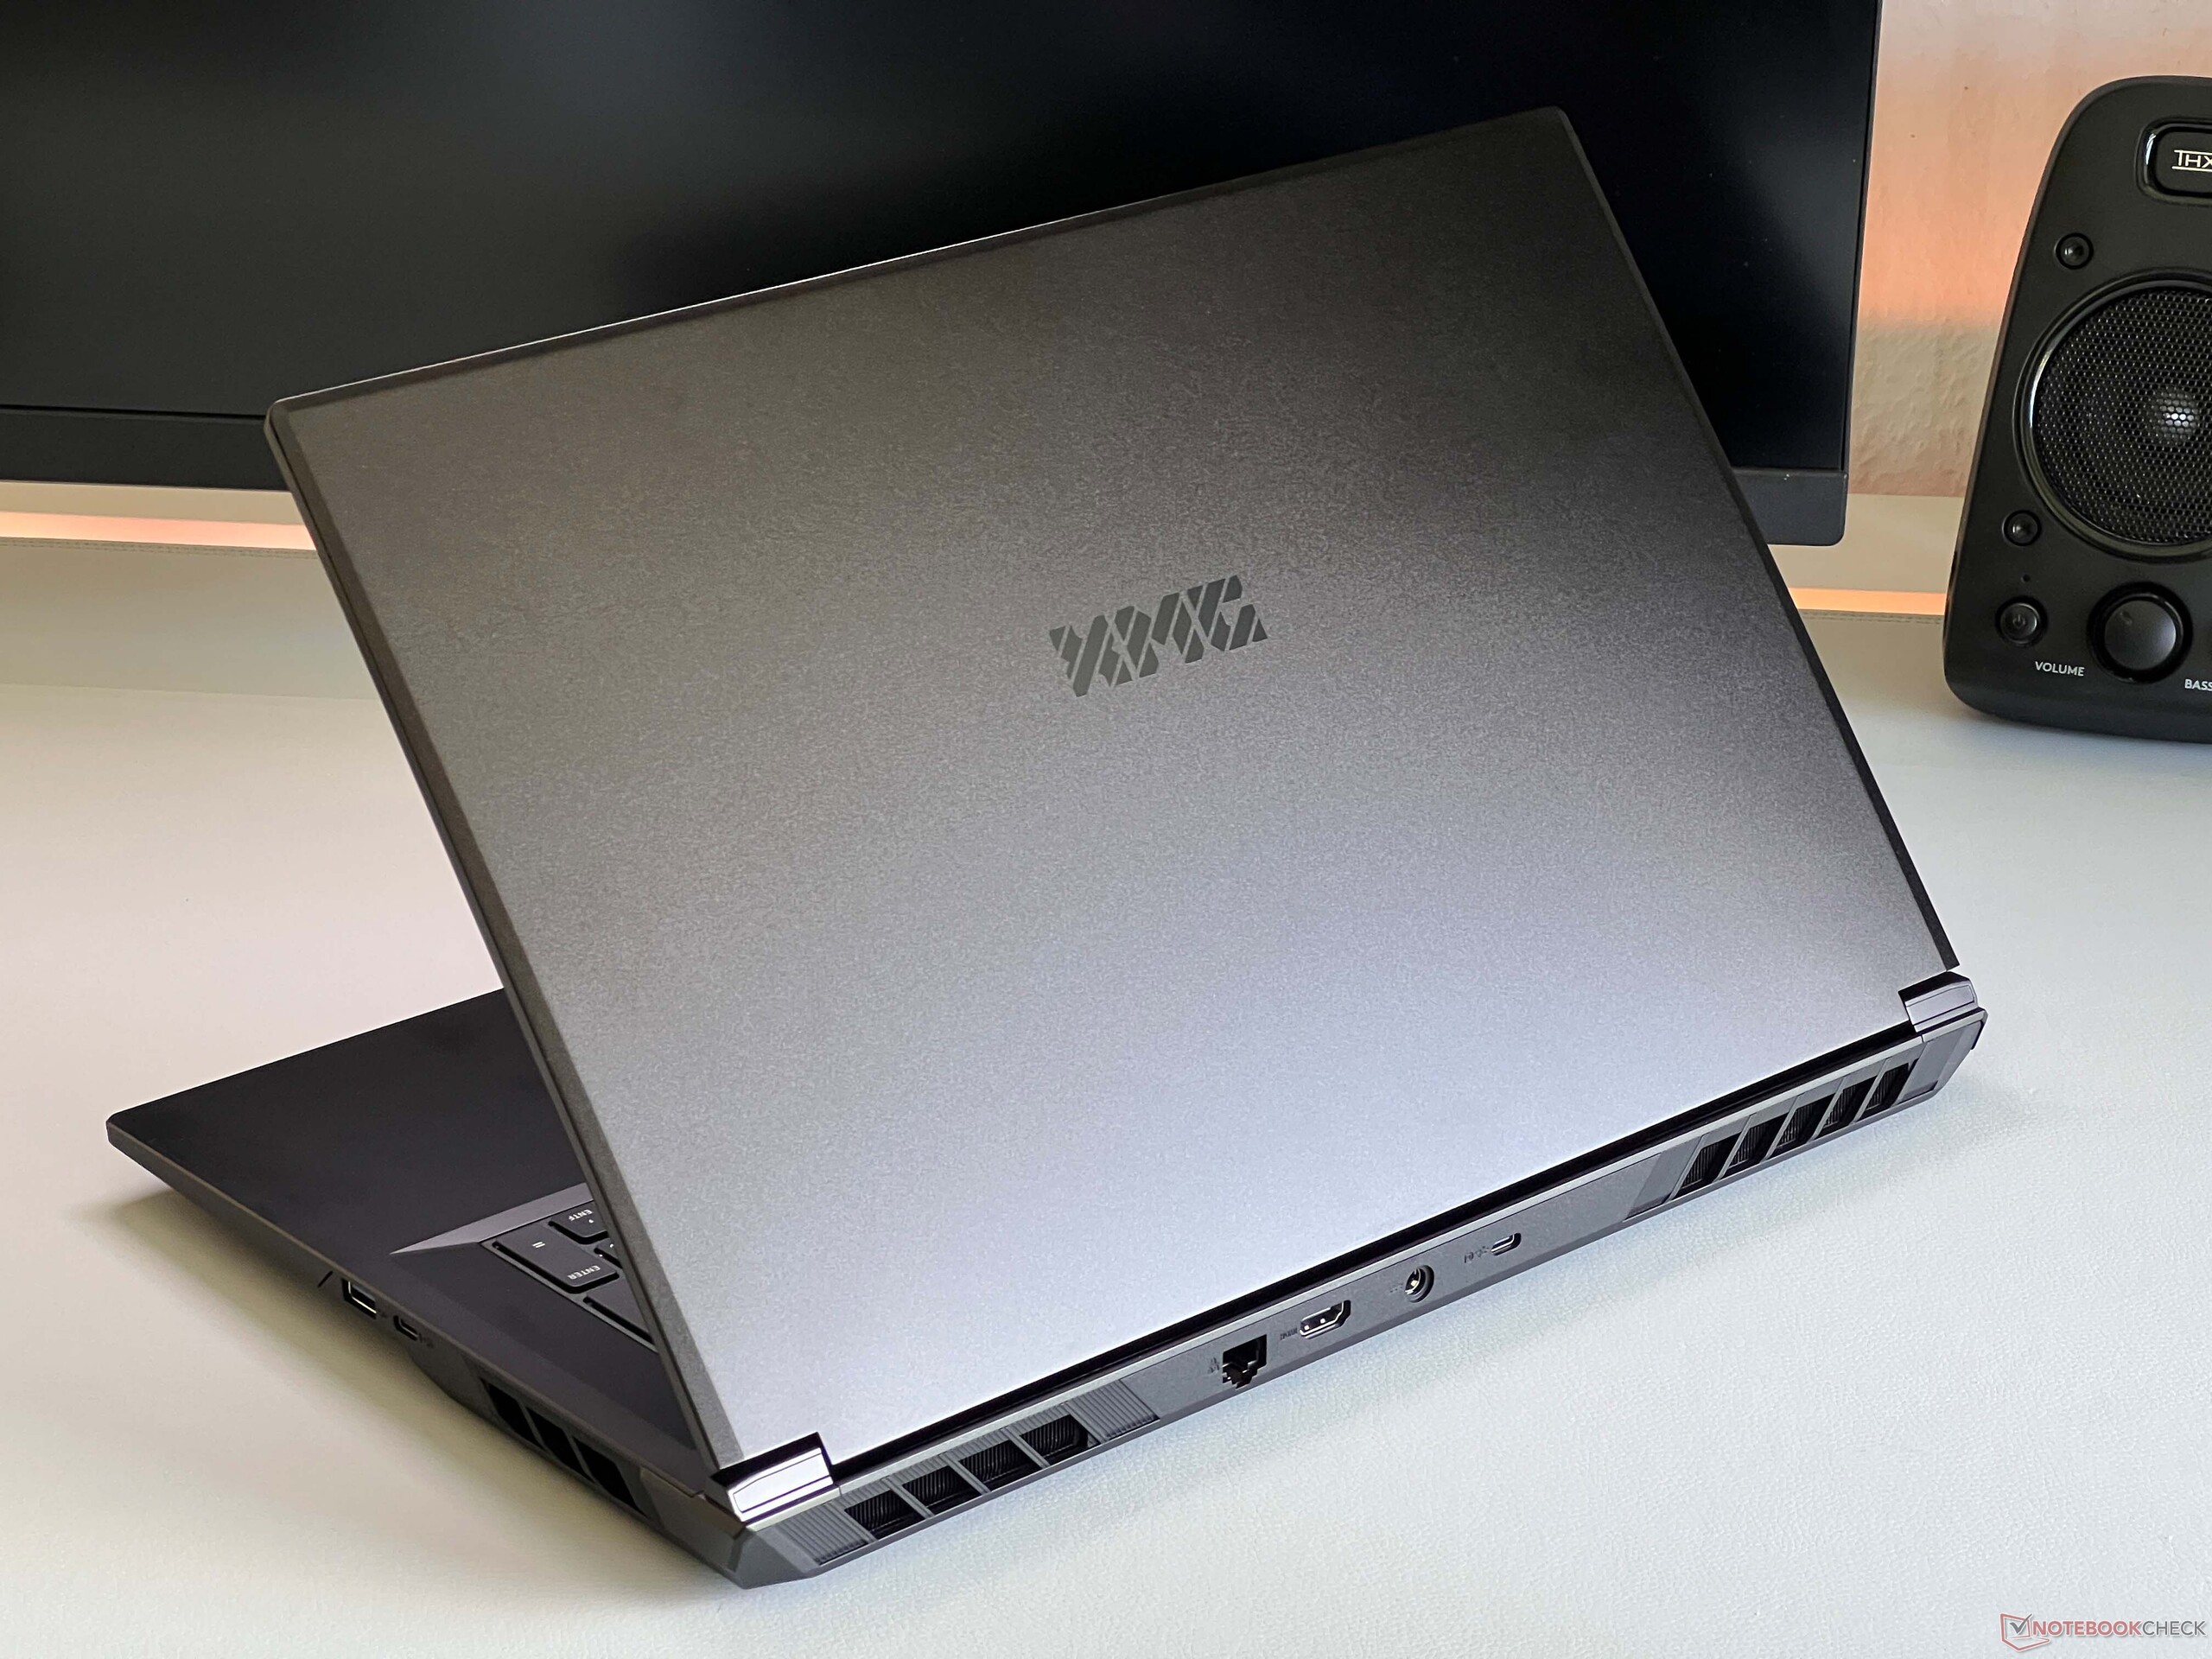
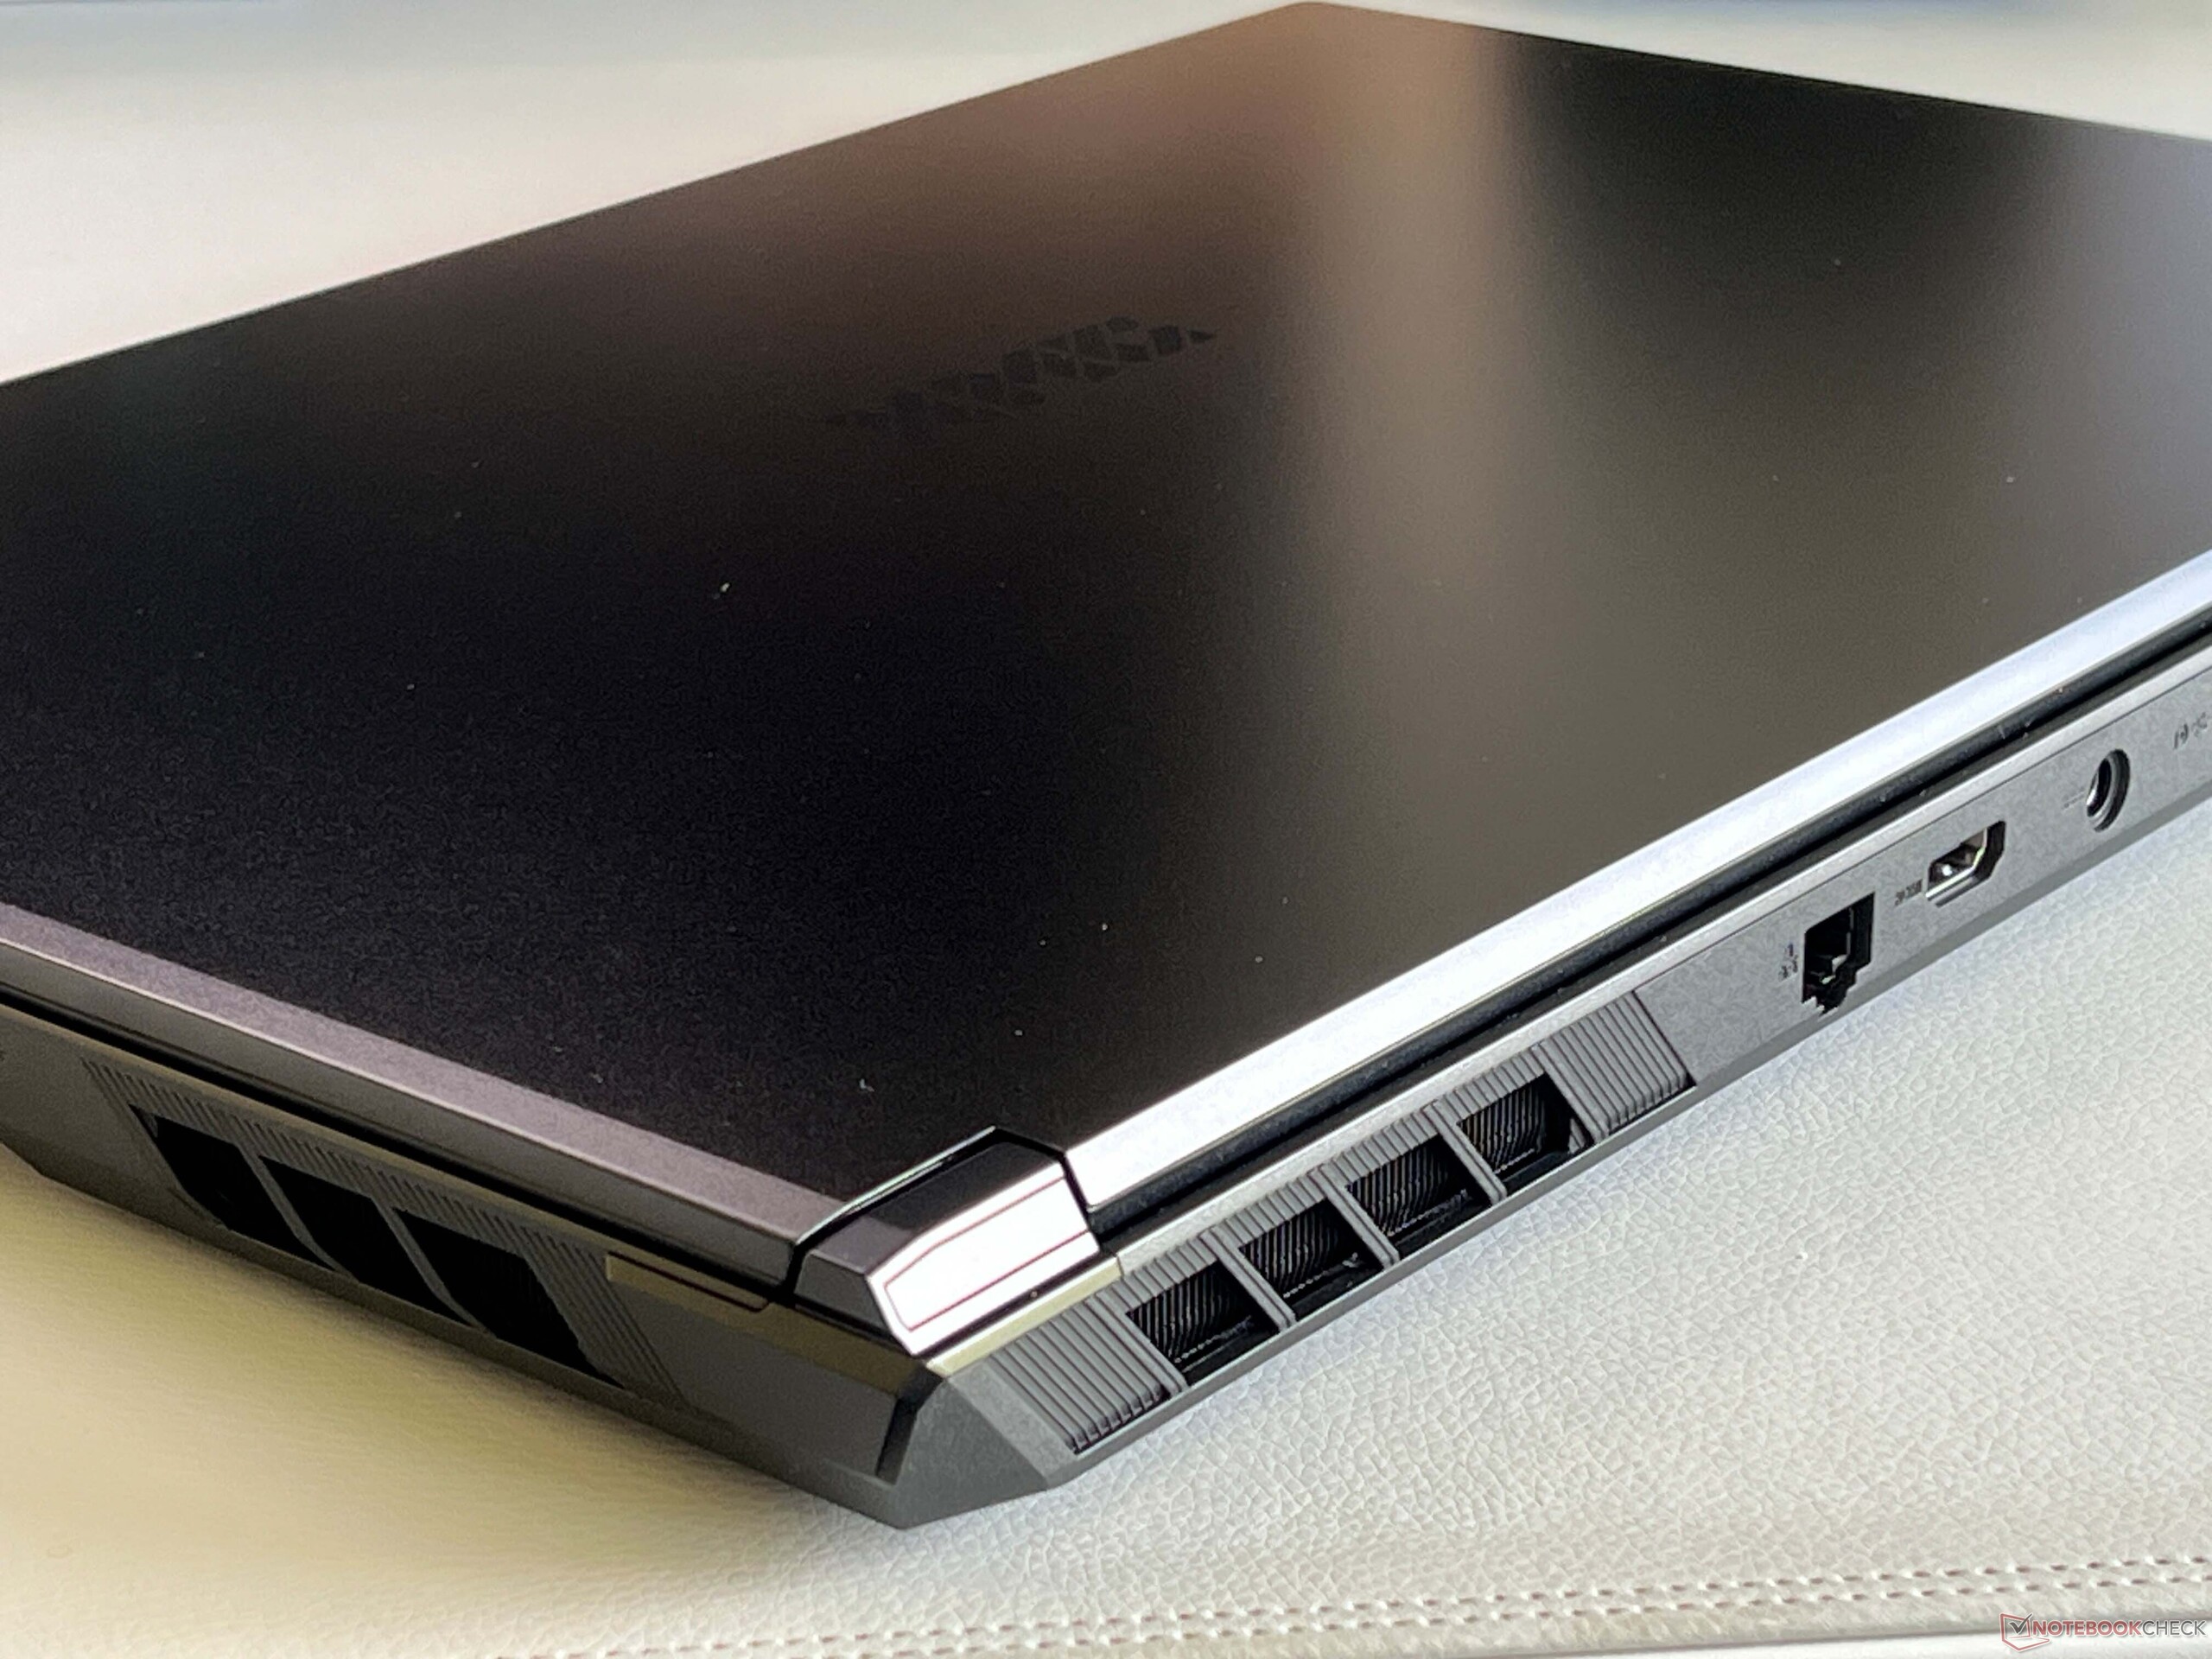
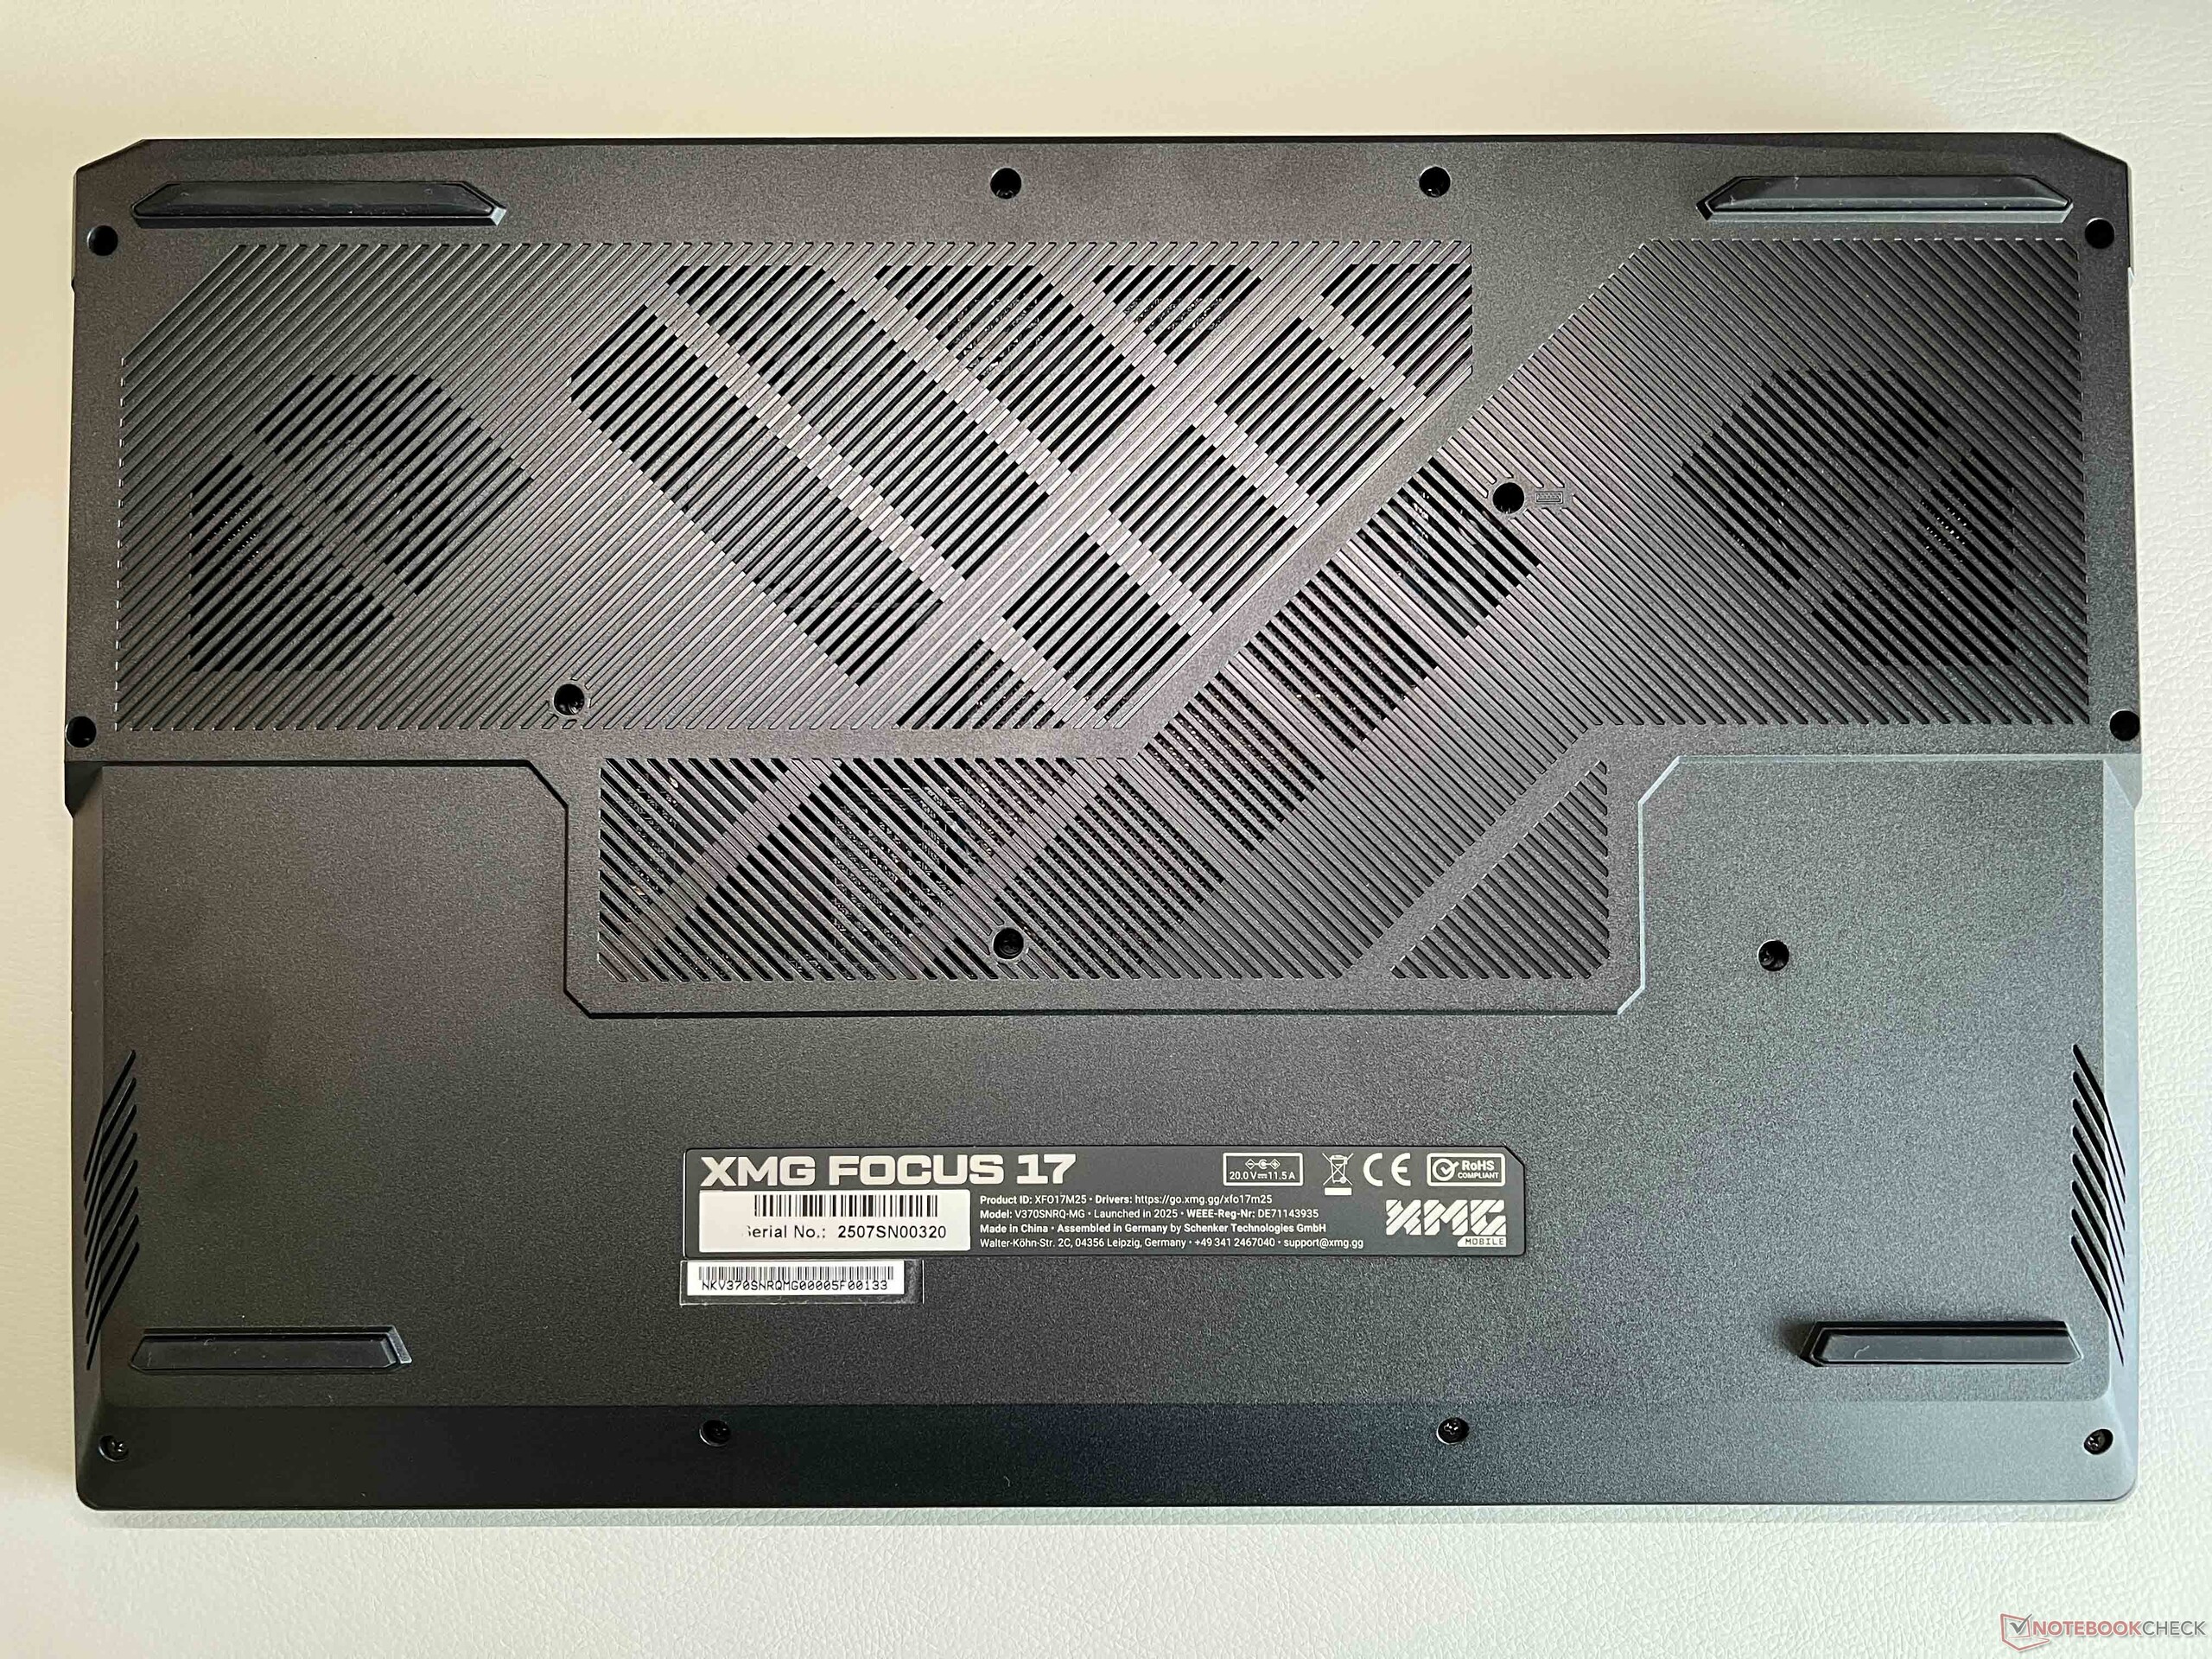
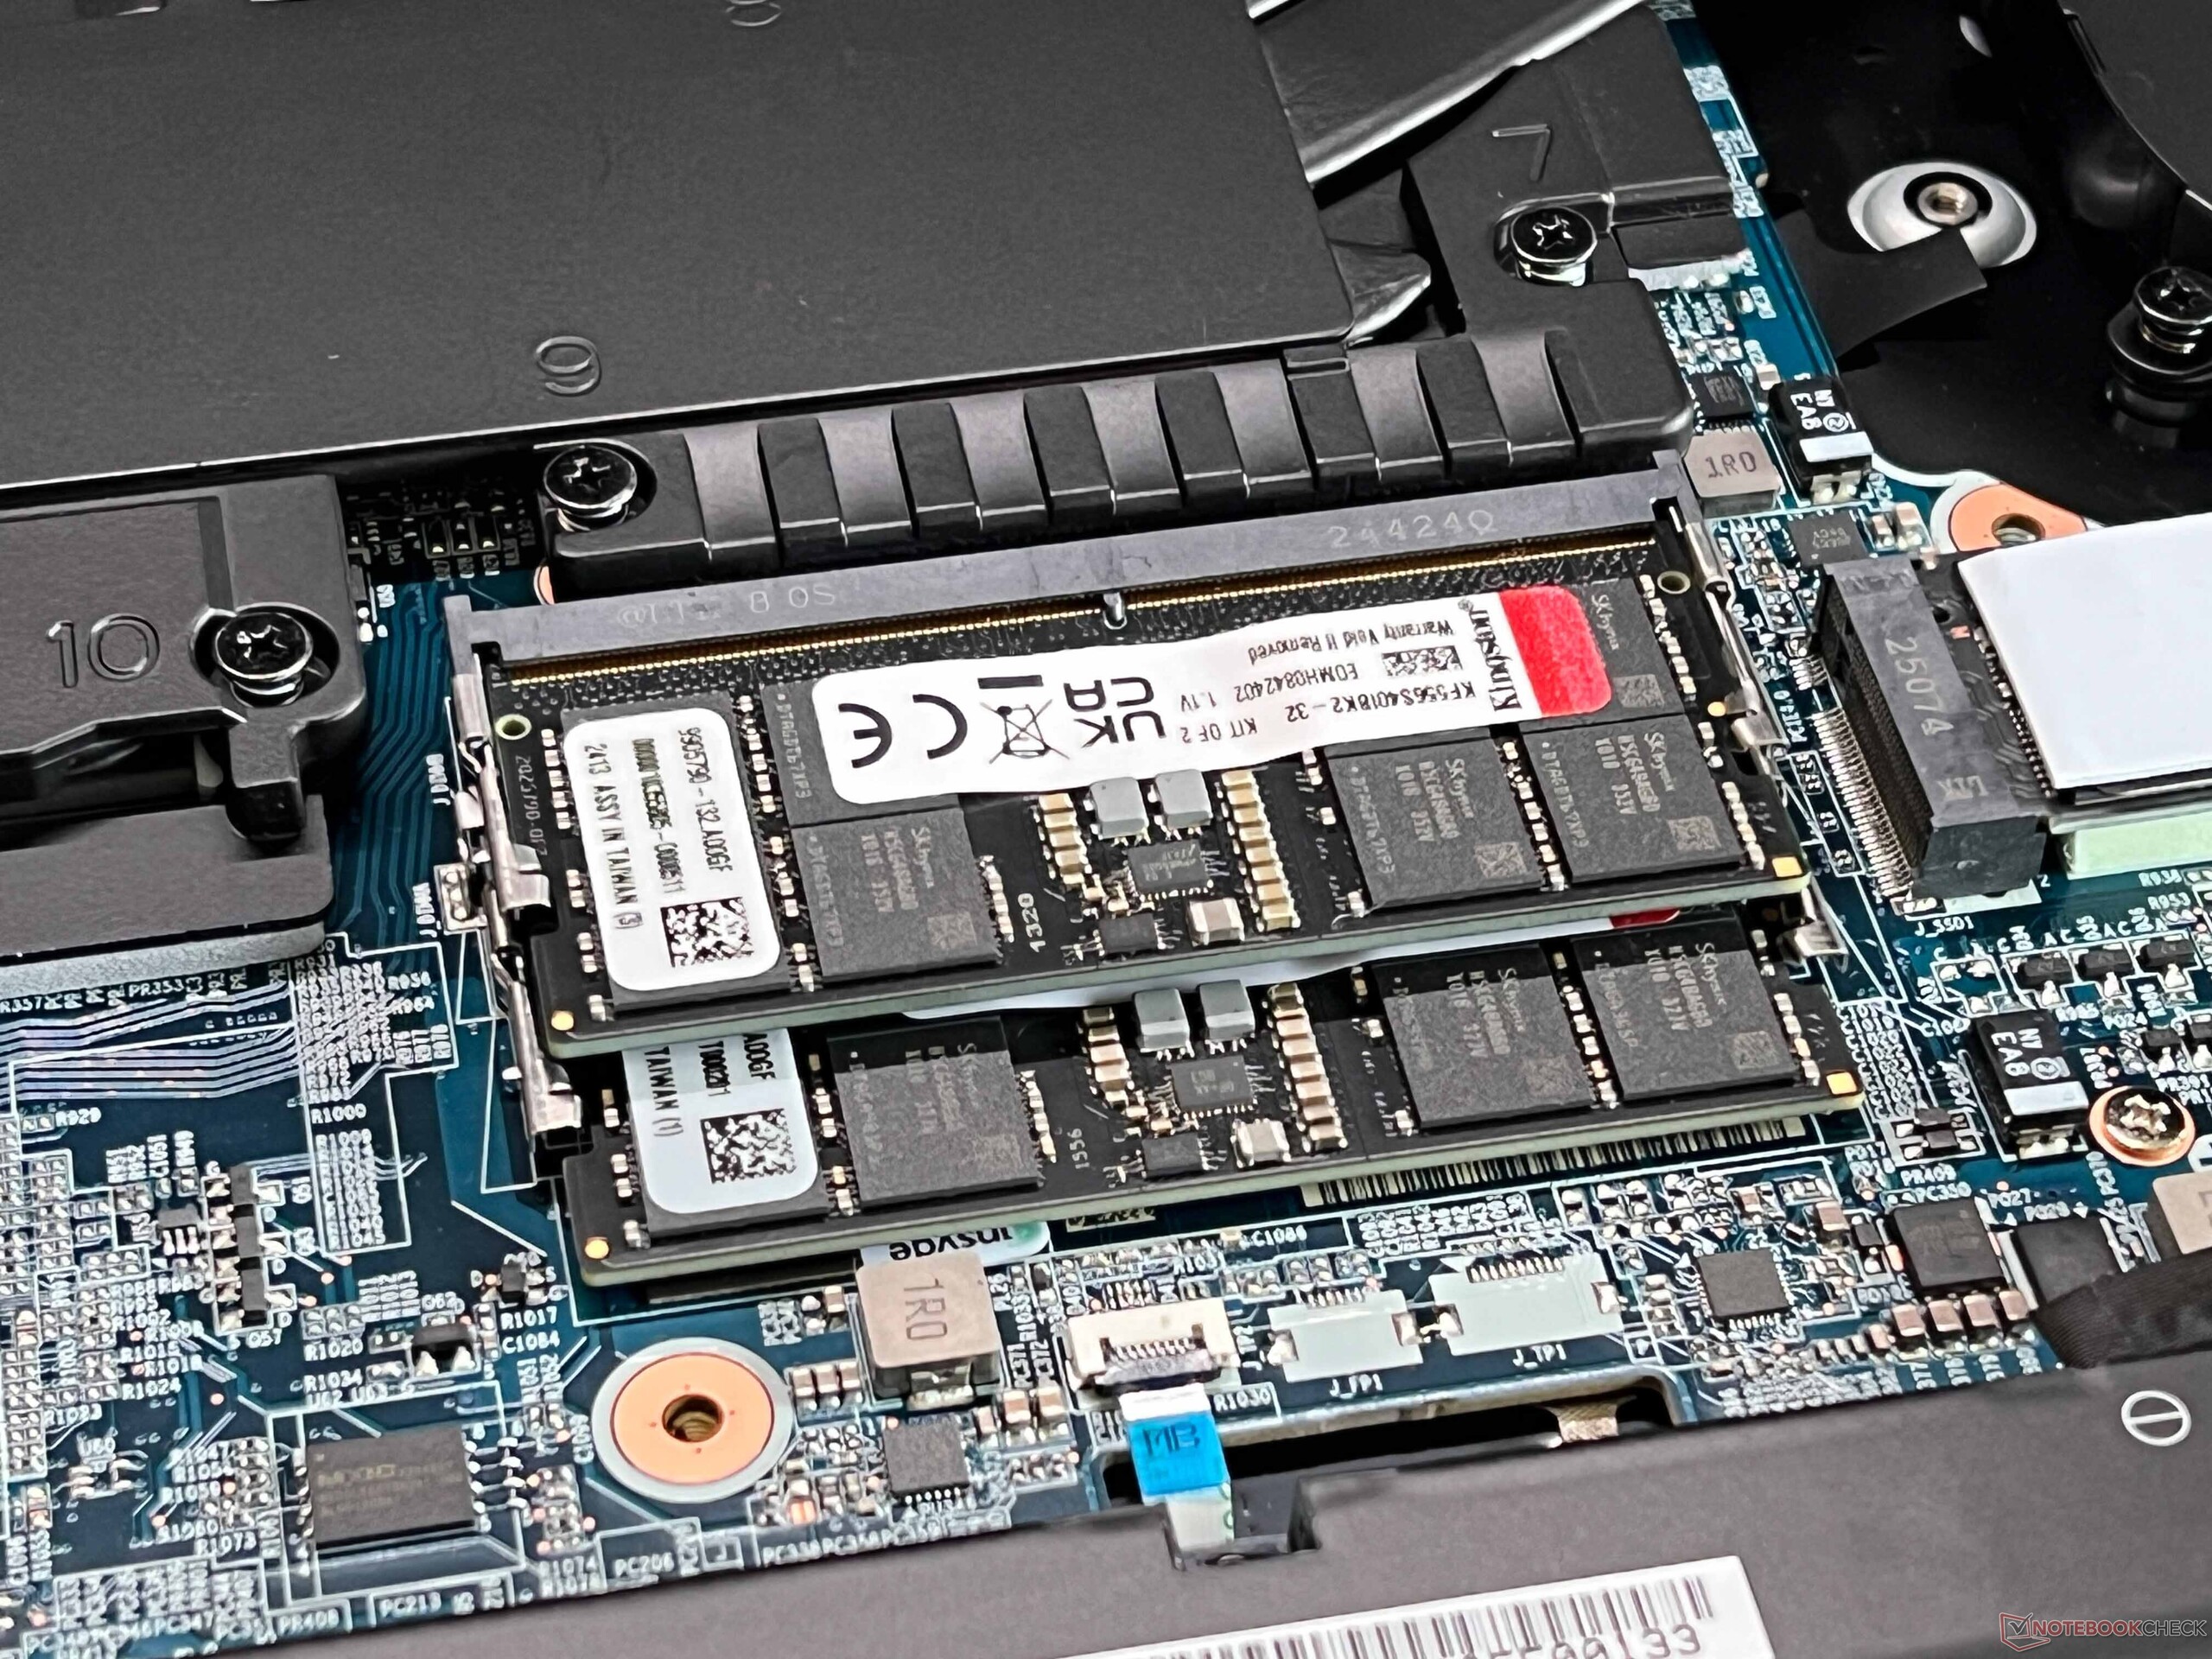
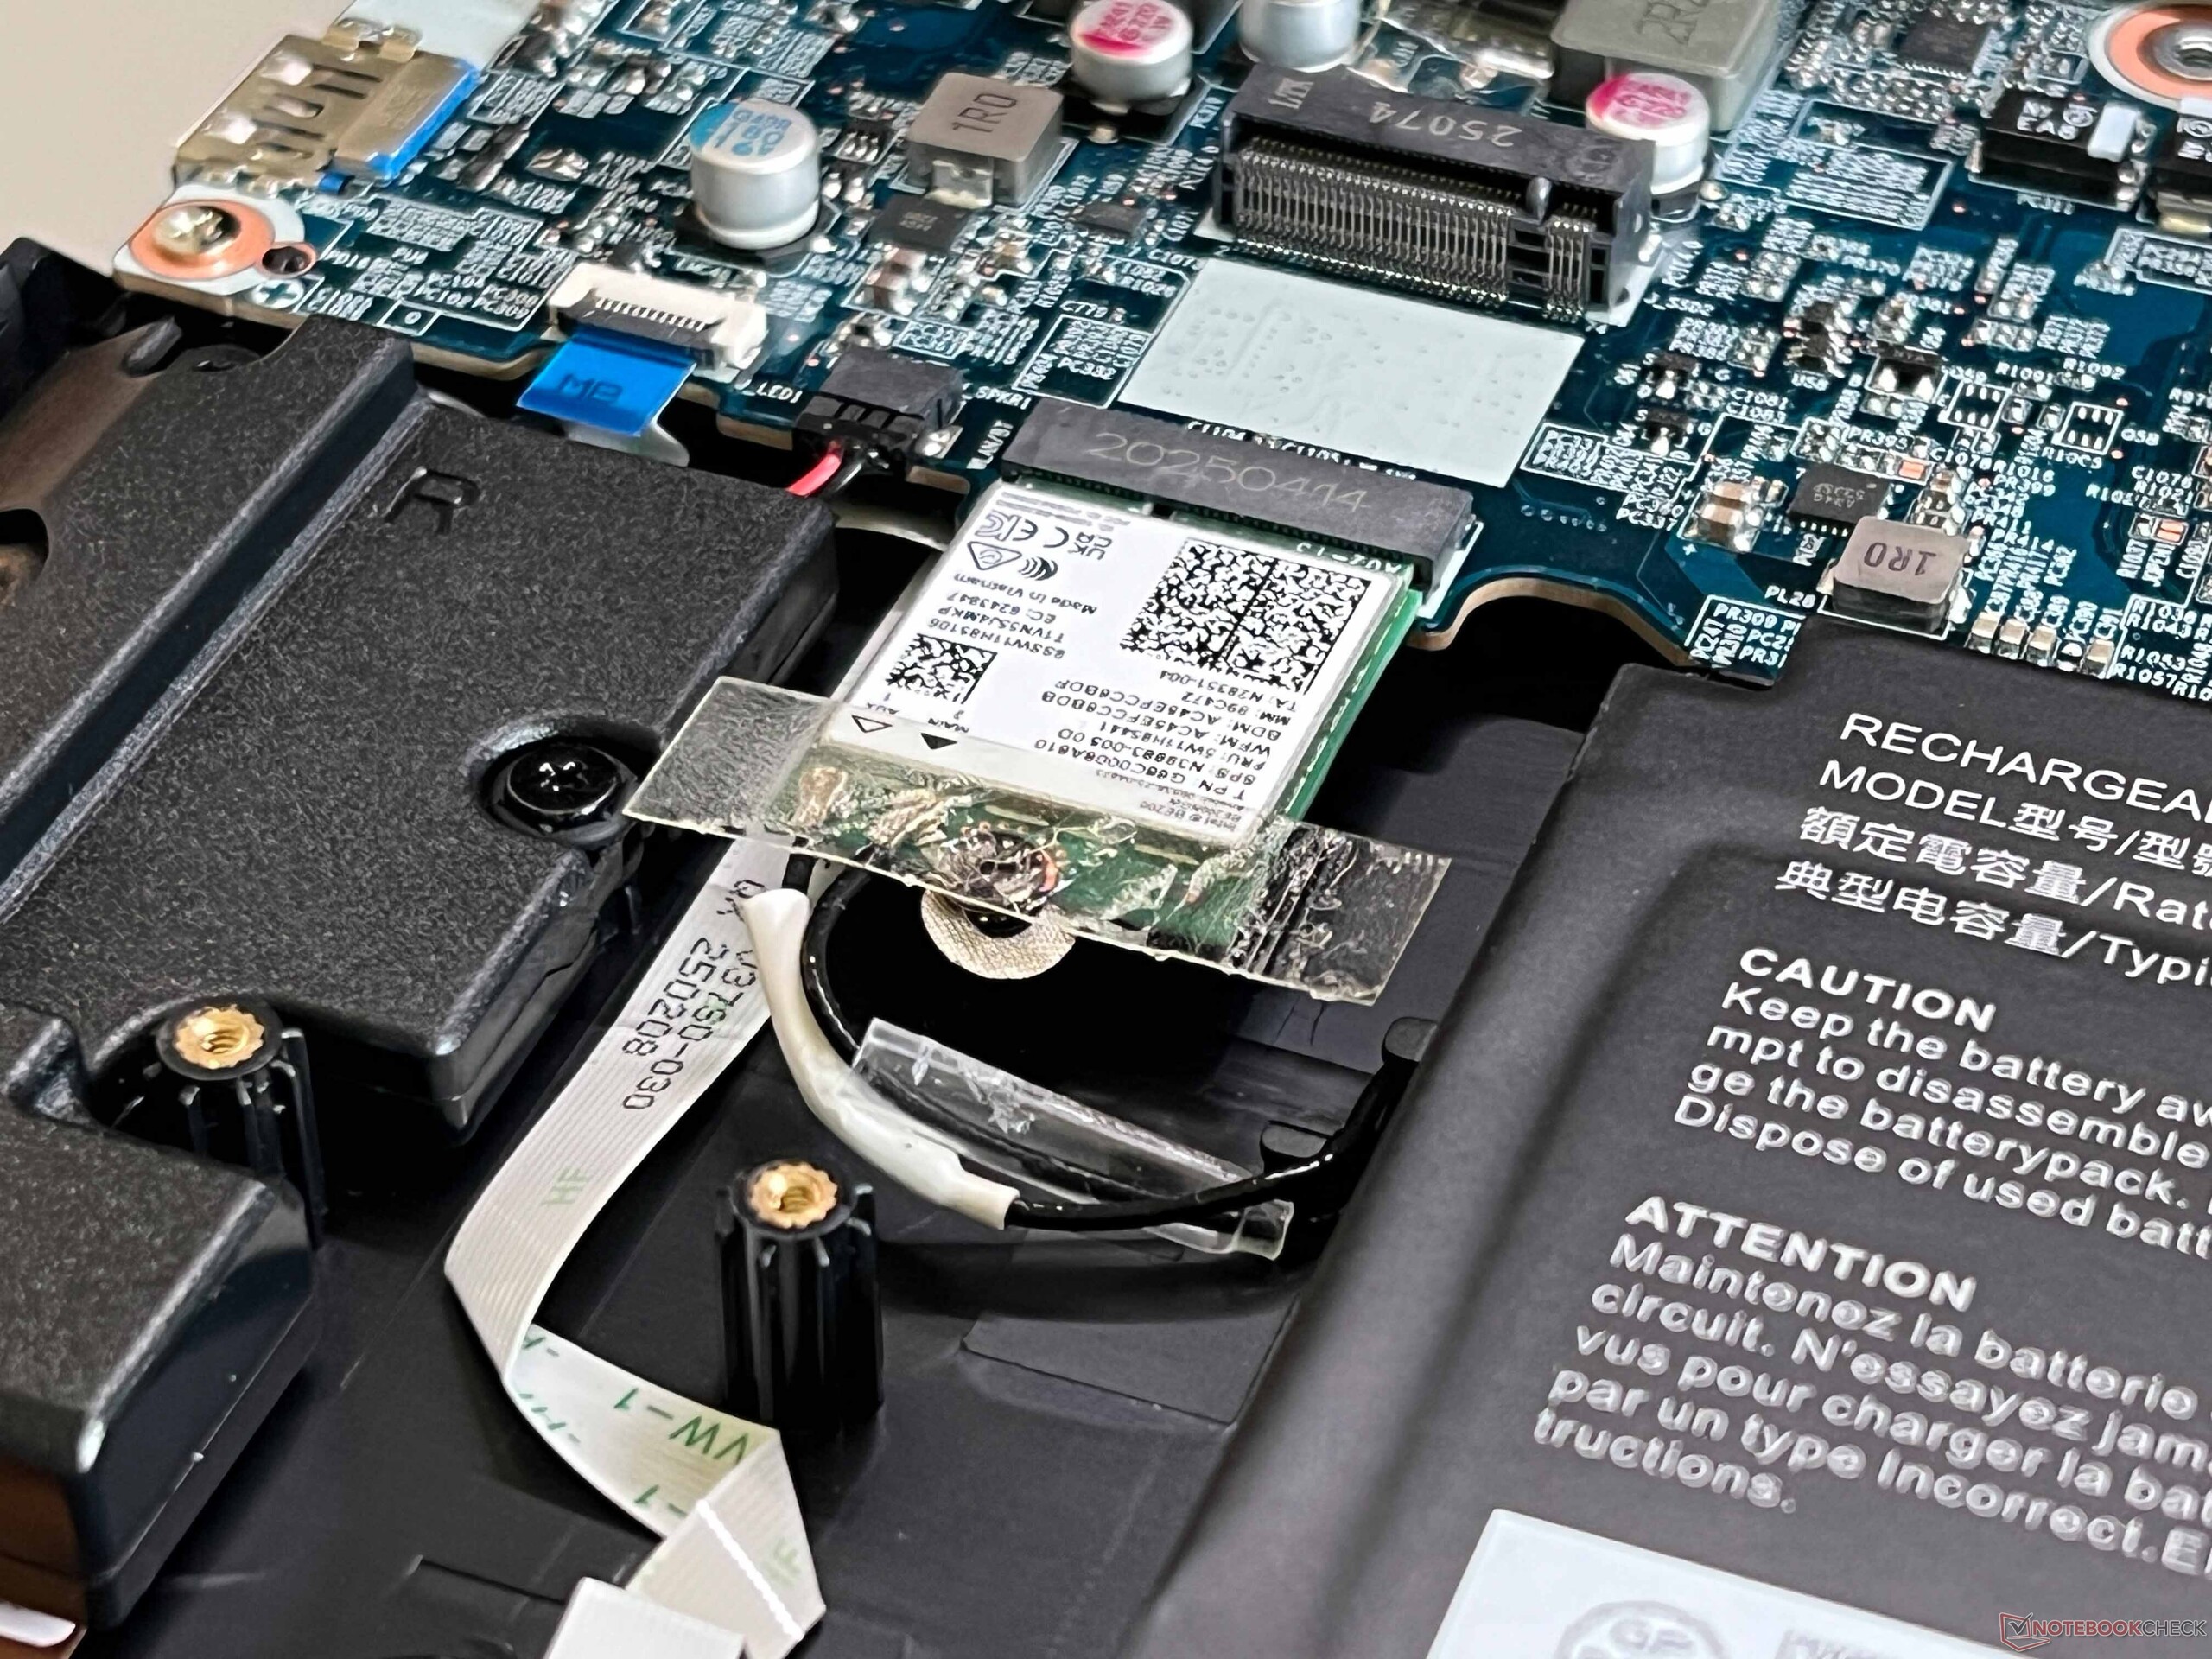
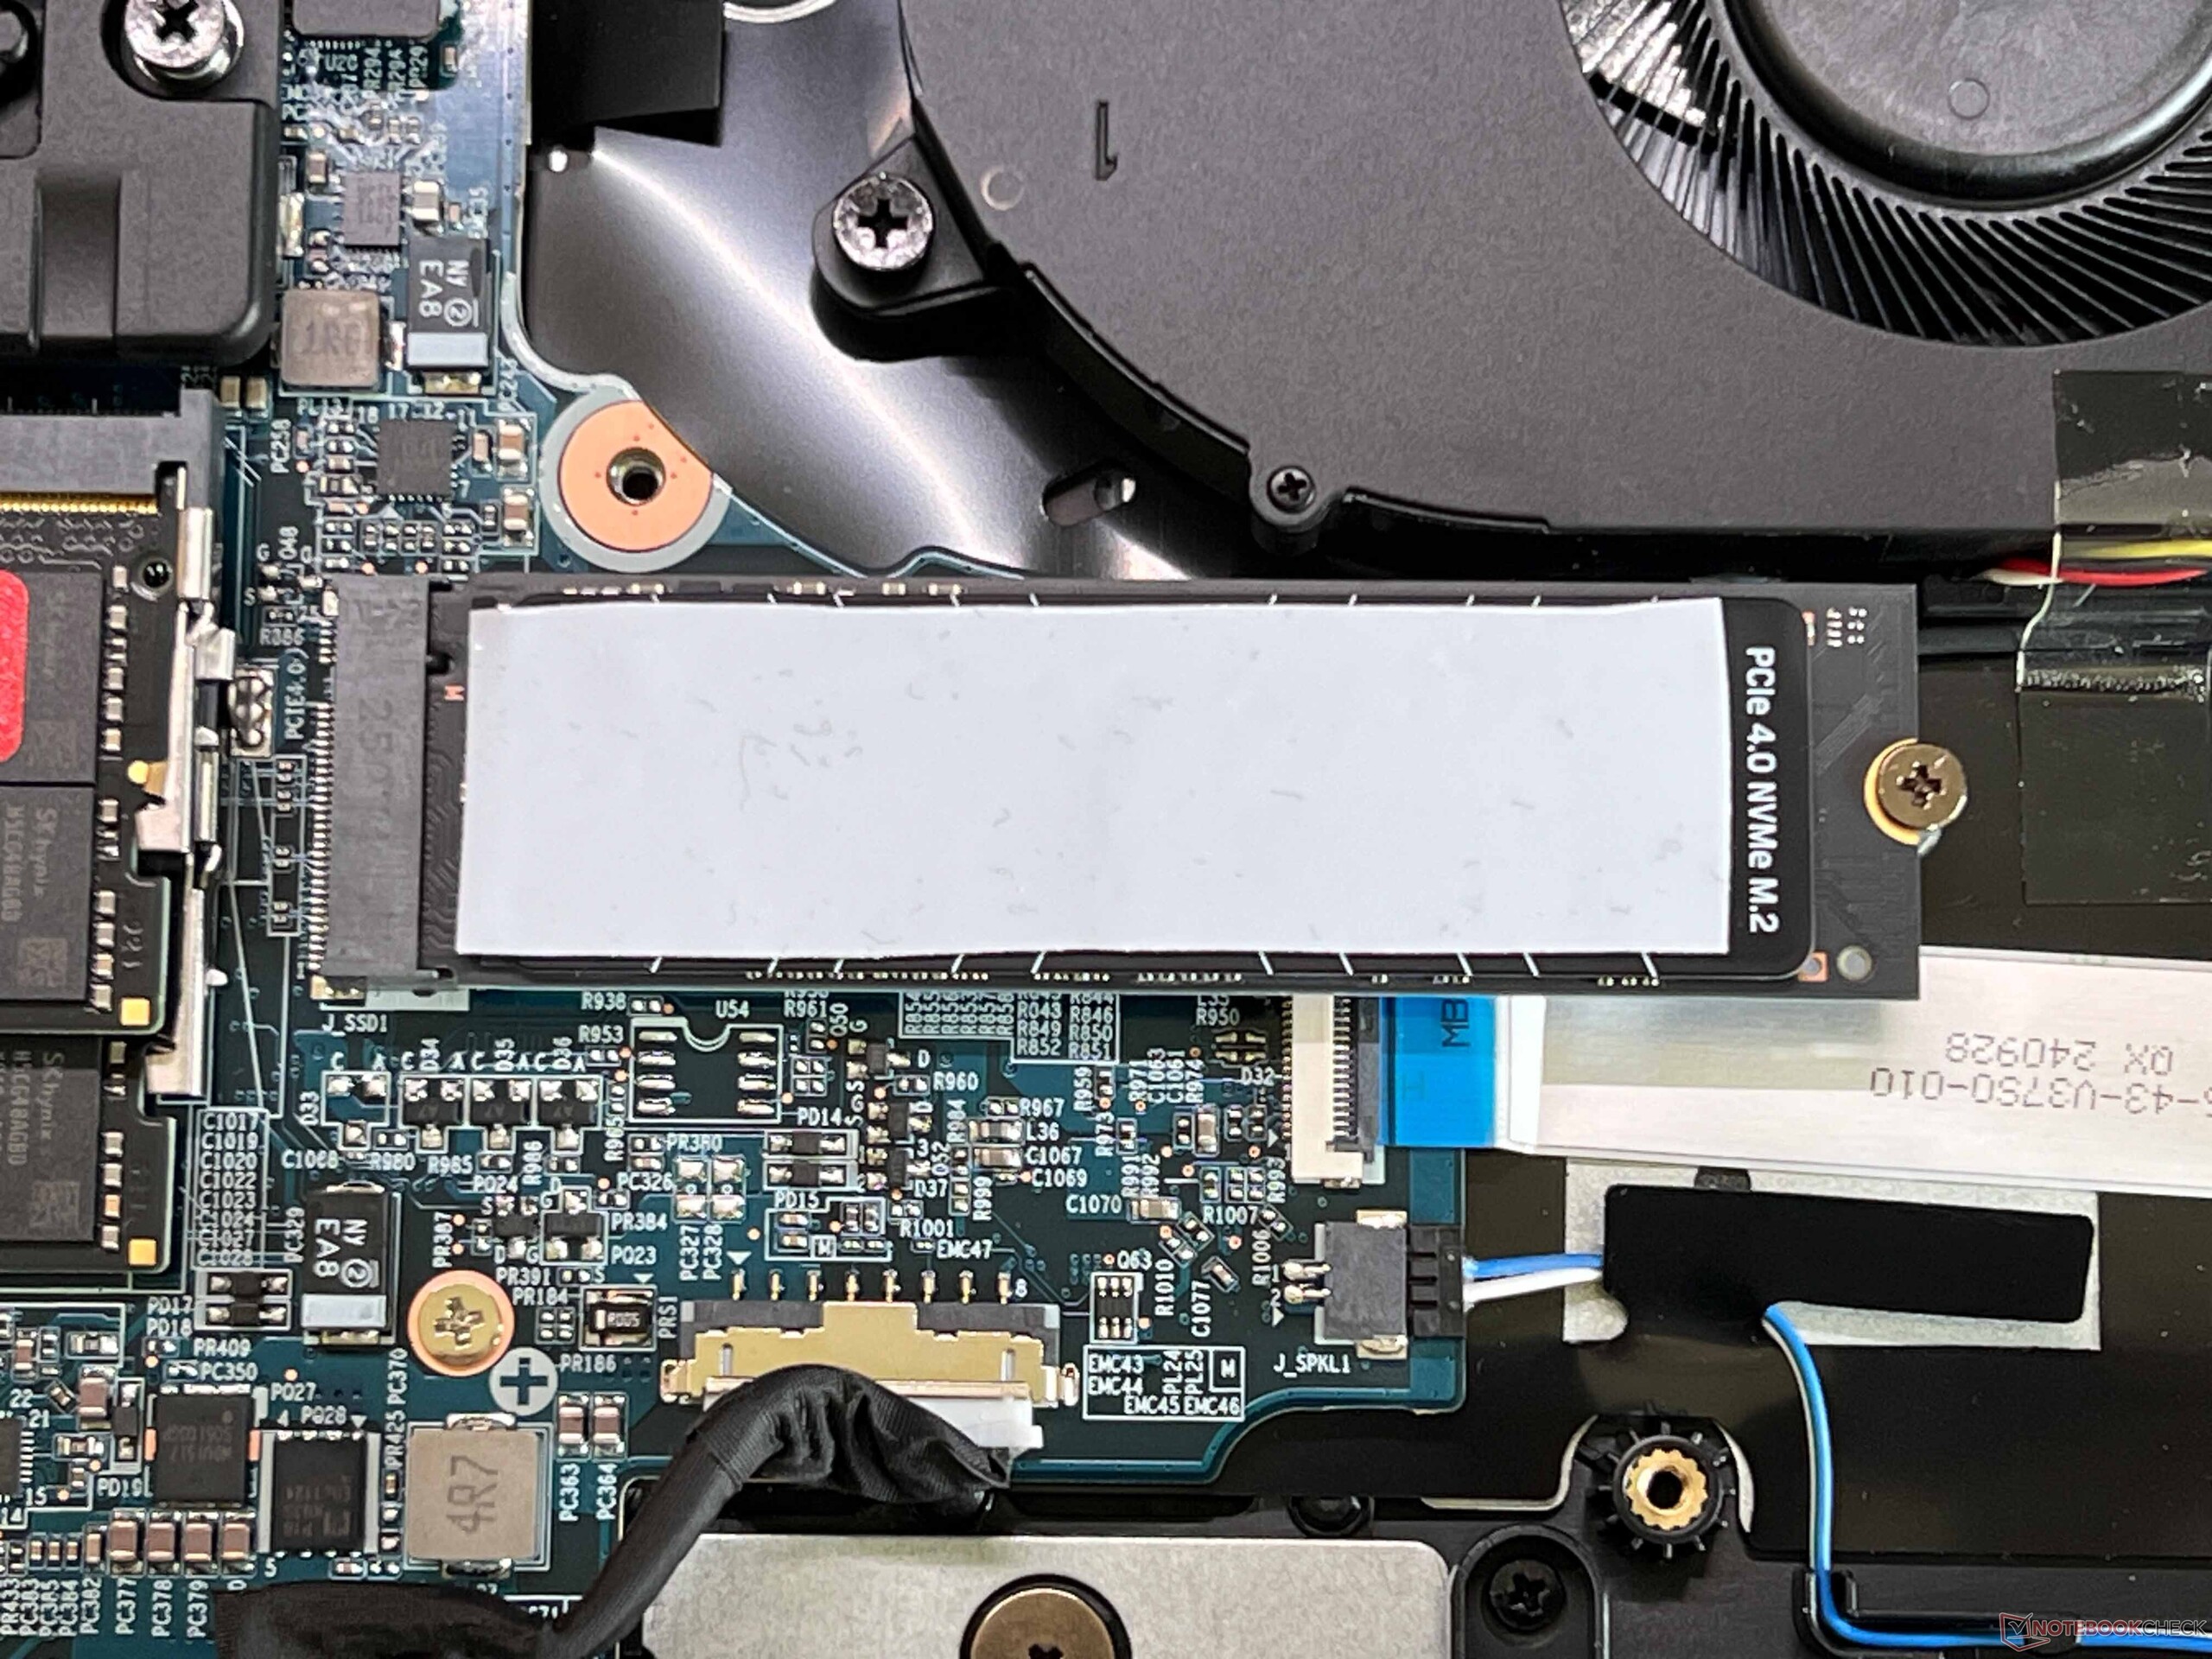
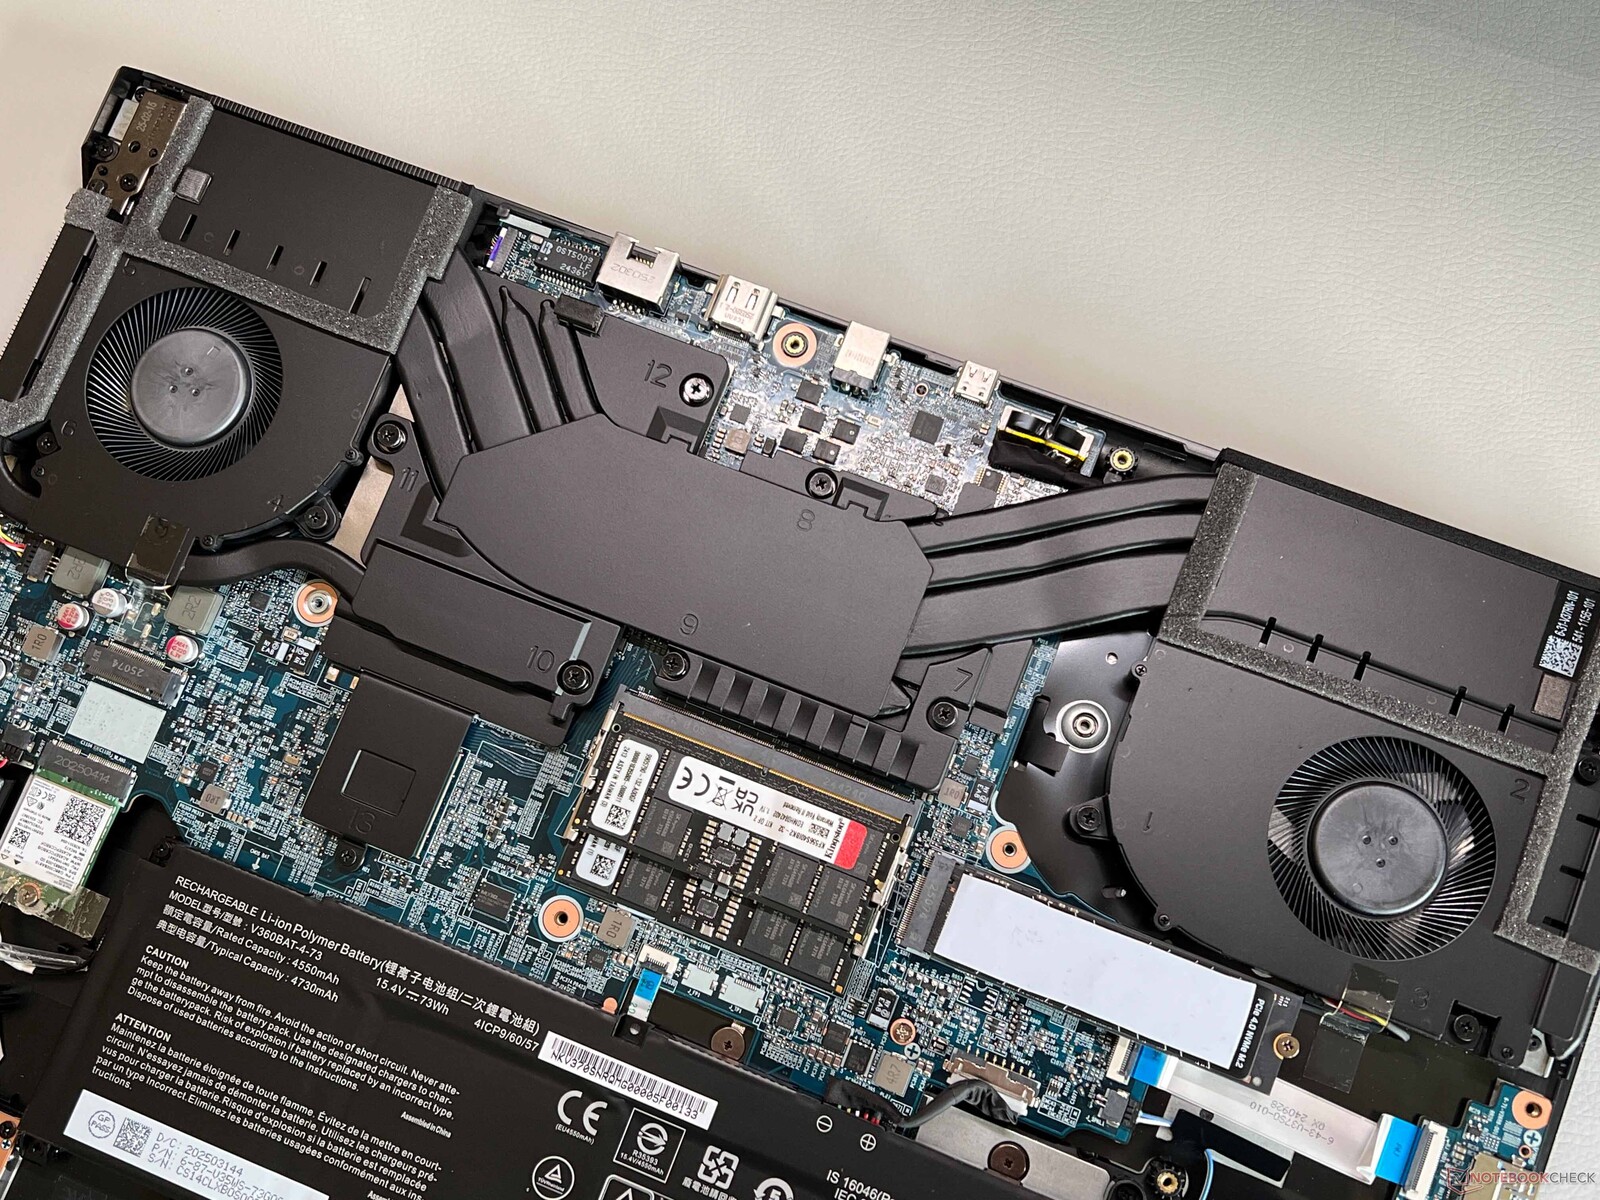
Siyah yüzeyleri ile kasa tasarımı oldukça sade ve klavye dışında herhangi bir aydınlatma unsuru bulunmuyor. Kapak alüminyumdan yapılmıştır, ancak kasanın geri kalanı plastikten yapılmıştır ve yüzeyler genellikle kire karşı çok hassastır. Ana ünite basınç uygulandığında hafif gıcırdama sesleri çıkarsa da, ne yapı kalitesi ne de sağlamlık önemli bir sorun teşkil etmiyor. Ekranın maksimum açılma açısı 130 derecedir, ancak menteşeler hafifçe sallanır. RAM ve SSD'ler için ikişer yuva bulunduğundan, Wi-Fi modülü ve pil gerektiğinde değiştirilebildiğinden ve fanların temizlenmesi de kolay olduğundan bakım seçenekleri genel olarak çok iyi.
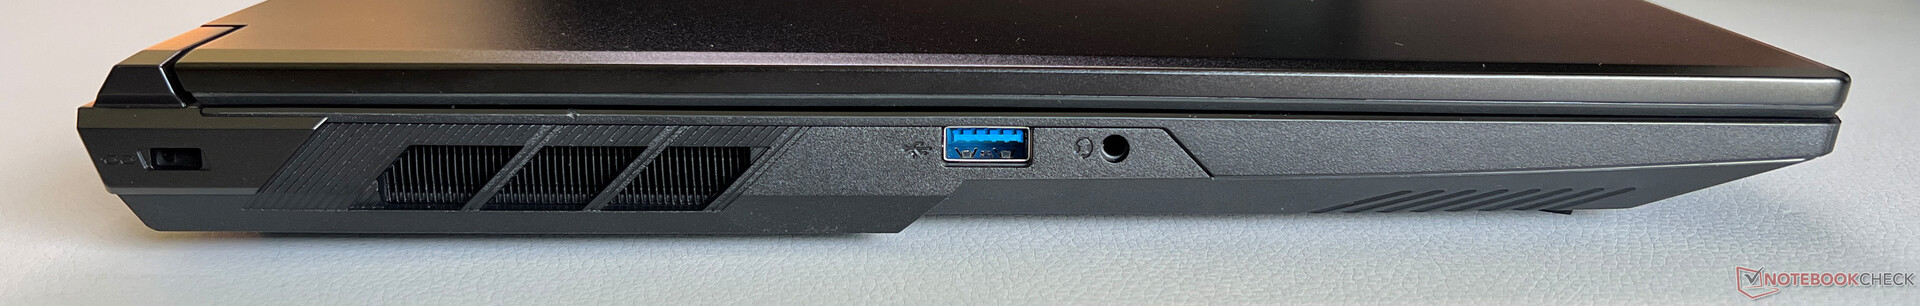
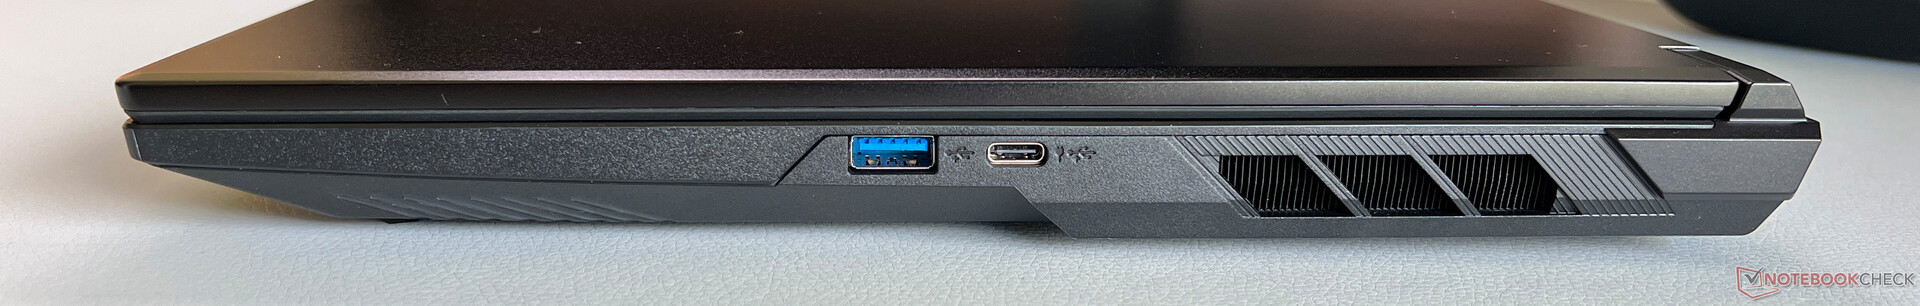
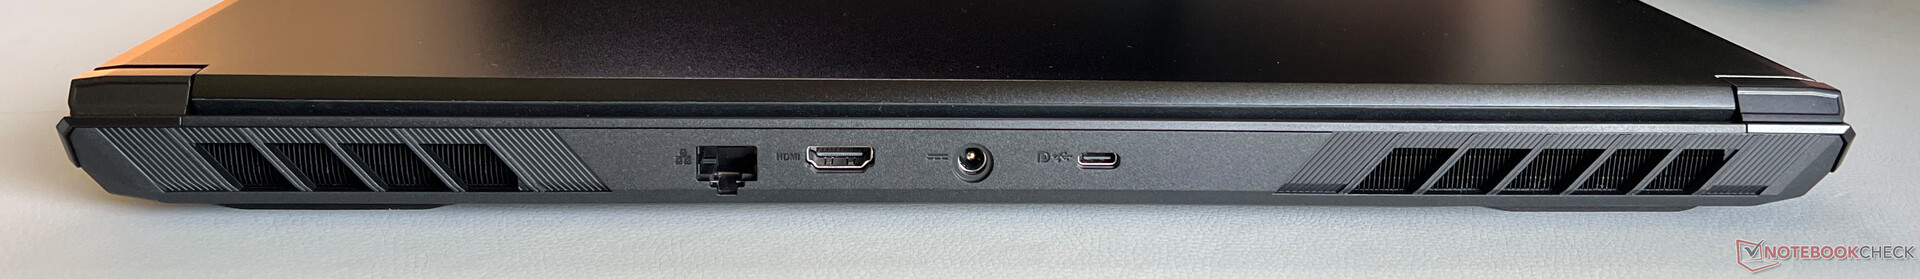
Thunderbolt yok, ancak yeterli USB bağlantı noktalarının yanı sıra iyi ve istikrarlı aktarım hızlarıyla etkileyici bir Intel Wi-Fi 7 modülü var. 1080p web kamerası (mekanik deklanşör dahil) yalnızca ortalama fotoğraflar çeker ve IR modülü yoktur.


| Networking | |
| Schenker XMG Focus 17 M25 | |
| iperf3 transmit AXE11000 | |
| iperf3 receive AXE11000 | |
| MSI Vector 17 HX AI A2XWIG | |
| iperf3 transmit AXE11000 | |
| iperf3 receive AXE11000 | |
| iperf3 transmit AXE11000 6GHz | |
| iperf3 receive AXE11000 6GHz | |
| Lenovo Legion 5 Pro 16IAX10H | |
| iperf3 transmit AXE11000 | |
| iperf3 receive AXE11000 | |
| MSI Vector 16 HX AI A2XWHG | |
| iperf3 transmit AXE11000 | |
| iperf3 receive AXE11000 | |
| Schenker XMG Pro 16 (E25) | |
| iperf3 transmit AXE11000 | |
| iperf3 receive AXE11000 | |


Sürdürülebilirlik
Üretici sürdürülebilirlikle ilgili herhangi bir açıklama yapmamıştır. Ambalaj tamamen geri dönüştürülebilir.
Giriş cihazları
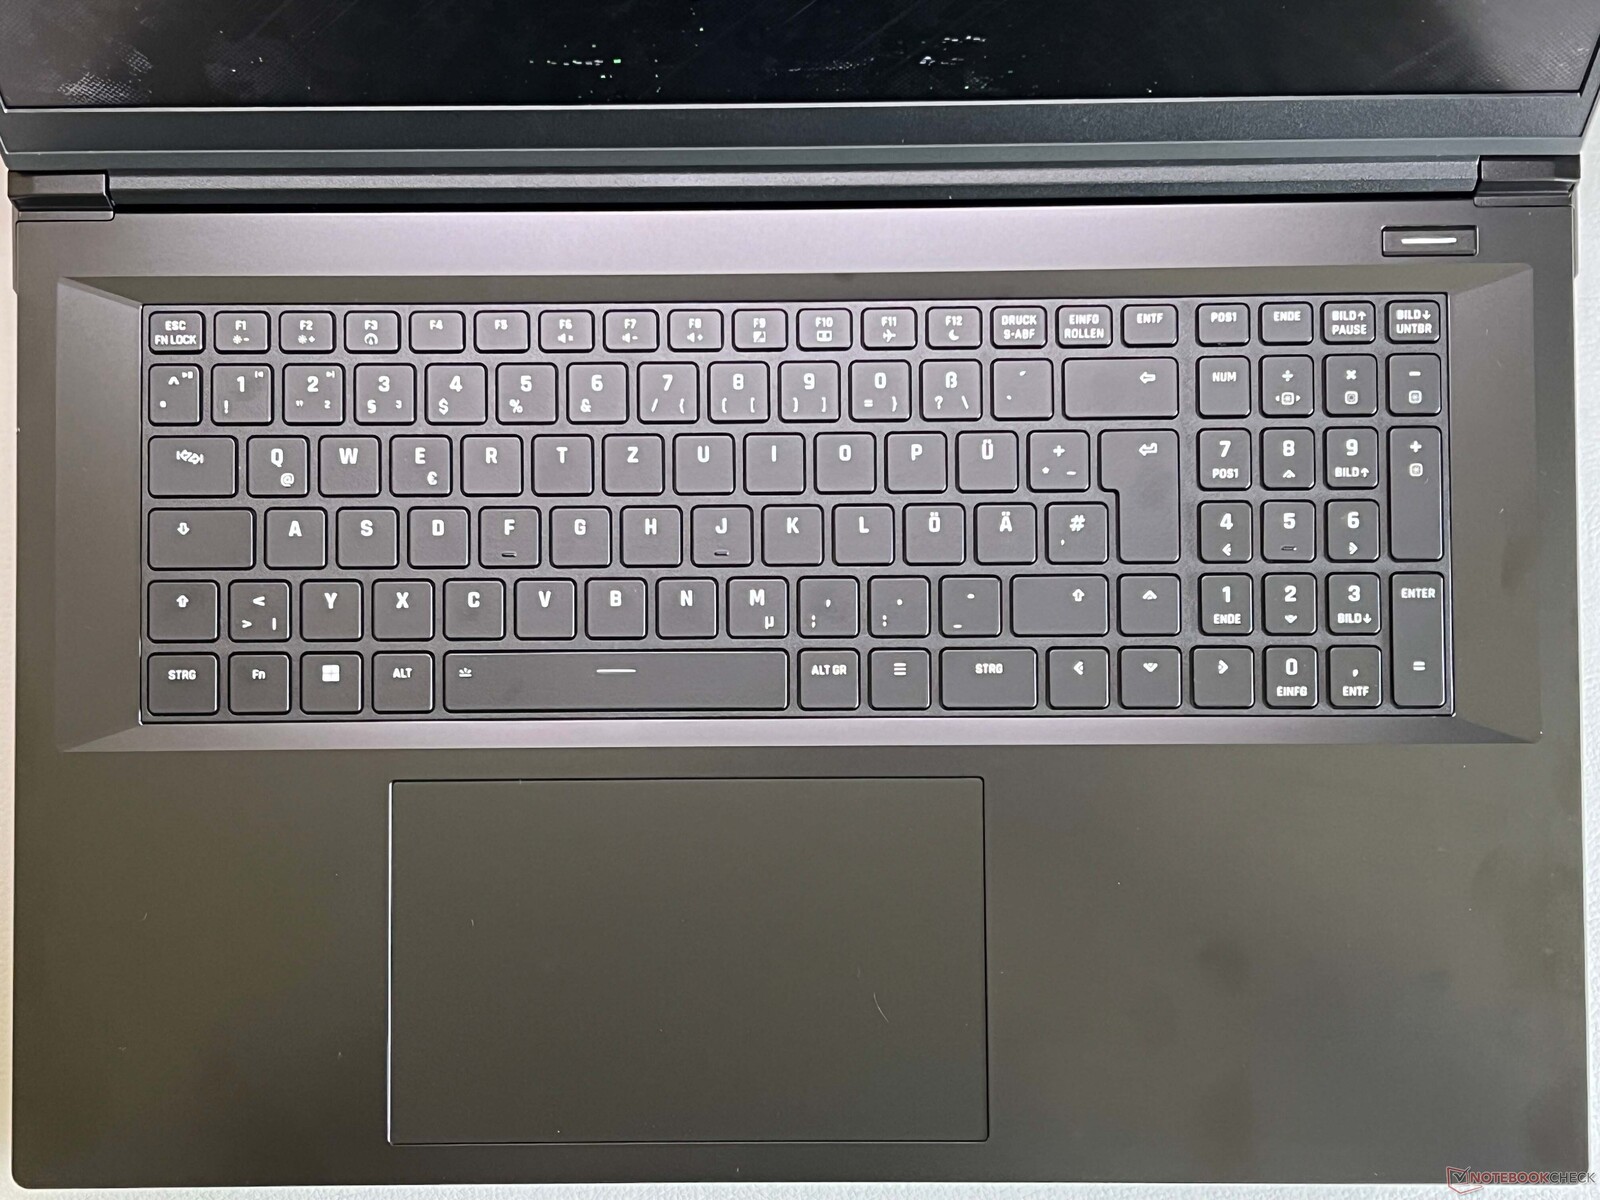
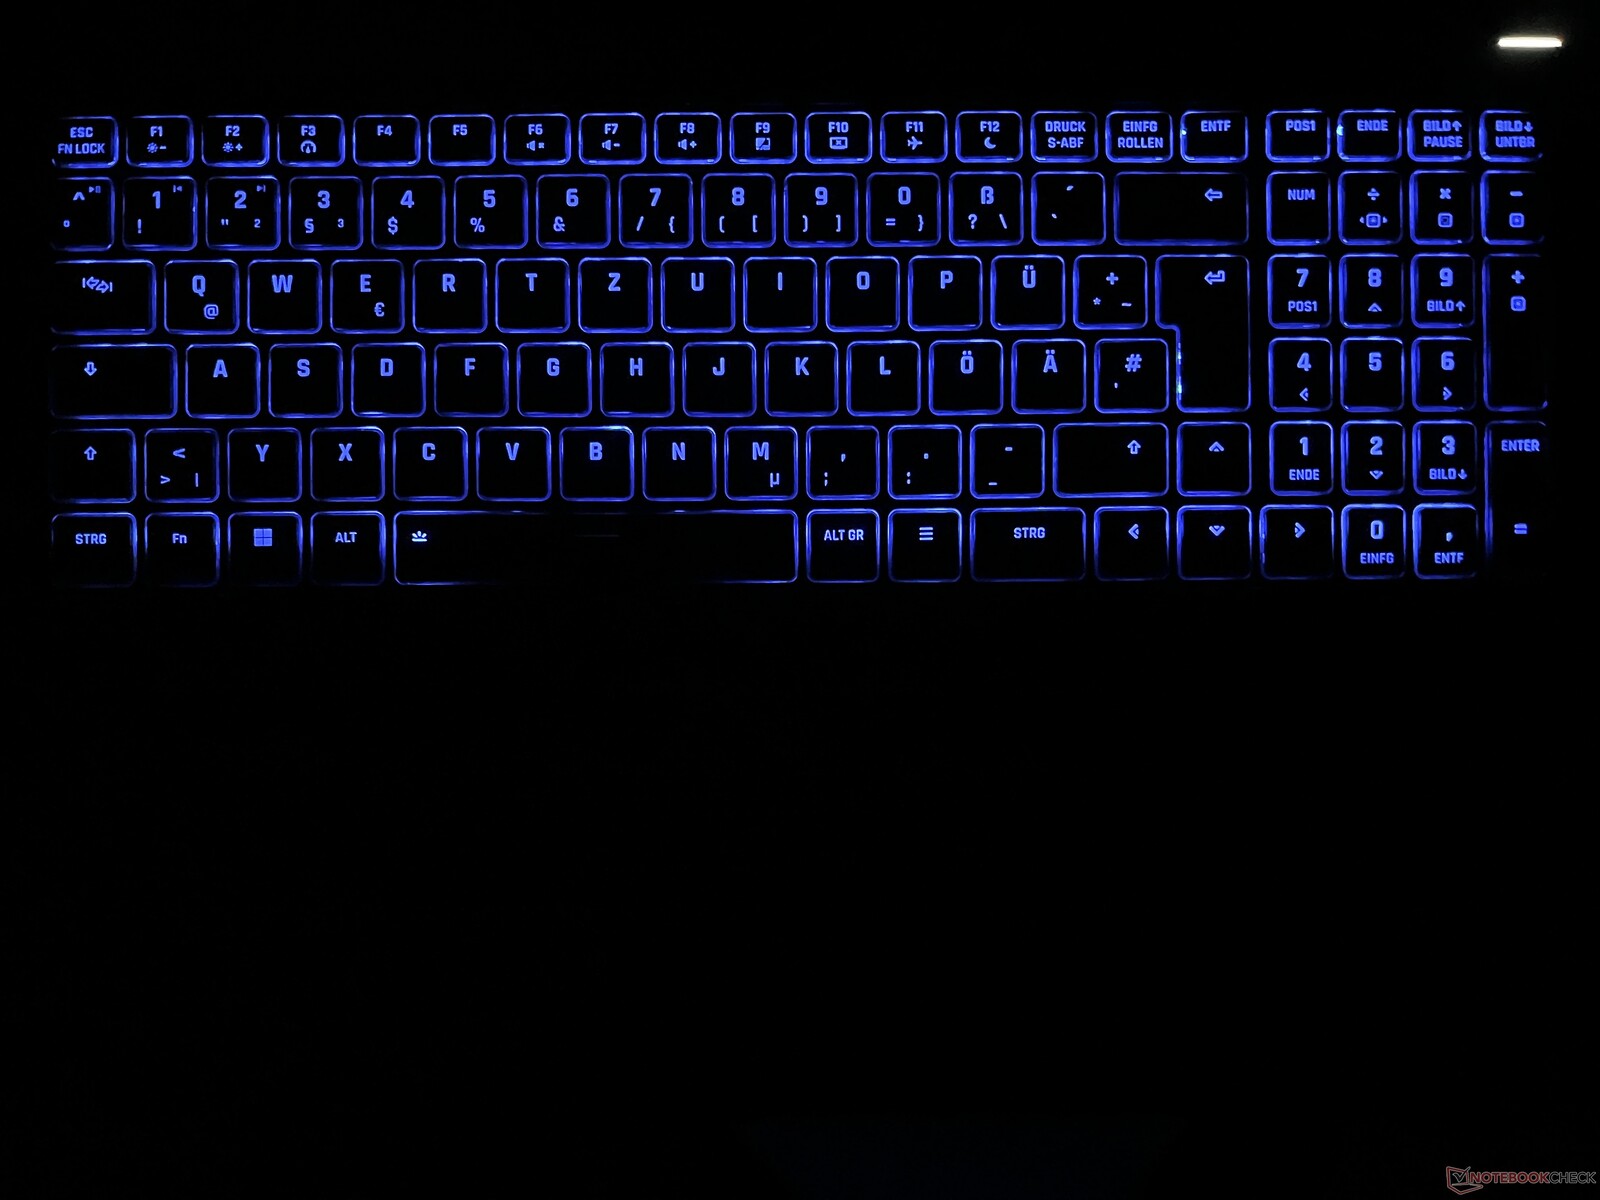
XMG, özel bir sayı tuş takımı ve tek bölgeli RGB aydınlatmaya sahip bir klavye takmıştır. Yeterli tuş hareketi ve hassas geribildirim ile yazı yazmak rahat. Ayrıca tuşlar çok gürültülü değil. Büyük tıklama yüzeyi nispeten yumuşak bir dokunuşa sahip. Yeterince büyük (15 x 9 cm) ve çok iyi dolgulu (tıkırtı yok). Sadece alt kısımdaki mekanik tıklamalar çok gürültülü.
Ekran - 240 Hz IPS
Focus, 16:9 en boy oranına ve 2.560 x 1.440 piksel QHD çözünürlüğe sahip 17,3 inç IPS panel kullanıyor. Mat panelin görüntü kalitesi iyi, parlak alanlar çok az grenli görünüyor, ancak bu günlük kullanımda neredeyse hiç fark edilmiyor. Renkler canlı ve 240 Hz yenileme hızı sayesinde hareketler akıcı. Tepki süreleri de hızlı ve PWM titremesi yok.
XMG, test modelimizin maksimum 347 cd/m² (ortalama 325 cd/m²) ile aşmayı başardığı 300 cd/m²'lik bir parlaklık belirtmiştir. Kontrast oranı maksimum 1.335:1 ile iyi, ancak profesyonel CalMAN yazılımı ile yaptığımız analiz, fabrika ayarlarında belirgin bir mavi renk tonunu ve çok soğuk bir renk sıcaklığını vurguluyor. Bunun da ötesinde, önemli renk sapmaları da var. Kalibrasyonumuzla (profil sağdaki kutudan ücretsiz olarak indirilebilir), görüntülenen görüntüleri önemli ölçüde iyileştirmeyi başardık. Hem P3 hem de sRGB renk alanları tamamen kapsanıyor, ancak sRGB profili yok. Genel olarak, panel oyun oynamak için çok uygun, ancak özellikle parlaklık açısından rakipleri daha üstün.
| |||||||||||||||||||||||||
Aydınlatma: 84 %
Batarya modunda parlaklık: 347 cd/m²
Kontrast: 1335:1 (Siyah: 0.26 cd/m²)
ΔE ColorChecker Calman: 3.3 | ∀{0.5-29.43 Ø4.73}
calibrated: 0.9
ΔE Greyscale Calman: 4.5 | ∀{0.09-98 Ø4.97}
86% AdobeRGB 1998 (Argyll 3D)
99.9% sRGB (Argyll 3D)
98.3% Display P3 (Argyll 3D)
Gamma: 2.05
CCT: 7365 K
| Schenker XMG Focus 17 M25 NE173QHM-NZ1, IPS, 2560x1440, 17.3", 240 Hz | MSI Vector 17 HX AI A2XWIG B170QAN01.2 (AUO84A6), IPS, 2560x1600, 17", 240 Hz | Lenovo Legion 5 Pro 16IAX10H ATNA60HS01-0 (Samsung SDC420A), OLED, 2560x1600, 16", 165 Hz | MSI Vector 16 HX AI A2XWHG B160QAN02.3 (AUO7DB2), IPS, 2560x1600, 16", 240 Hz | Schenker XMG Pro 16 (E25) NE160QDM-NZL, IPS, 2560x1600, 16", 300 Hz | |
|---|---|---|---|---|---|
| Display | 1% | 4% | -1% | -12% | |
| Display P3 Coverage (%) | 98.3 | 99.6 1% | 99.9 2% | 96.6 -2% | 74.7 -24% |
| sRGB Coverage (%) | 99.9 | 100 0% | 100 0% | 99.8 0% | 99.8 0% |
| AdobeRGB 1998 Coverage (%) | 86 | 87.4 2% | 94.1 9% | 84.4 -2% | 75.4 -12% |
| Response Times | 56% | 84% | 45% | 26% | |
| Response Time Grey 50% / Grey 80% * (ms) | 13.7 ? | 3.6 ? 74% | 2 ? 85% | 4.3 ? 69% | 10.5 ? 23% |
| Response Time Black / White * (ms) | 7.6 ? | 4.8 ? 37% | 1.4 ? 82% | 6 ? 21% | 5.4 ? 29% |
| PWM Frequency (Hz) | 1300 | ||||
| PWM Amplitude * (%) | 16.7 | ||||
| Screen | 4% | 12% | -2% | 19% | |
| Brightness middle (cd/m²) | 347 | 488 41% | 518 49% | 473 36% | 538 55% |
| Brightness (cd/m²) | 325 | 473 46% | 522 61% | 426 31% | 508 56% |
| Brightness Distribution (%) | 84 | 91 8% | 97 15% | 85 1% | 88 5% |
| Black Level * (cd/m²) | 0.26 | 0.74 -185% | 0.42 -62% | 0.47 -81% | |
| Contrast (:1) | 1335 | 659 -51% | 1126 -16% | 1145 -14% | |
| Colorchecker dE 2000 * | 3.3 | 1.67 49% | 2.49 25% | 3.47 -5% | 1.9 42% |
| Colorchecker dE 2000 max. * | 8.4 | 3.43 59% | 5.25 37% | 7.24 14% | 4 52% |
| Colorchecker dE 2000 calibrated * | 0.9 | 0.8 11% | 2.15 -139% | 1.36 -51% | |
| Greyscale dE 2000 * | 4.5 | 2.08 54% | 3.02 33% | 3.1 31% | 2.7 40% |
| Gamma | 2.05 107% | 2.55 86% | 2.37 93% | 2.486 88% | 2.24 98% |
| CCT | 7365 88% | 6240 104% | 6426 101% | 6832 95% | 7027 93% |
| Toplam Ortalama (Program / Ayarlar) | 20% /
10% | 33% /
22% | 14% /
5% | 11% /
13% |
* ... daha küçük daha iyidir


Yanıt Sürelerini Görüntüle
| ↔ Tepki Süresi Siyahtan Beyaza | ||
|---|---|---|
| 7.6 ms ... yükseliş ↗ ve sonbahar↘ birleşimi | ↗ 3.1 ms yükseliş | 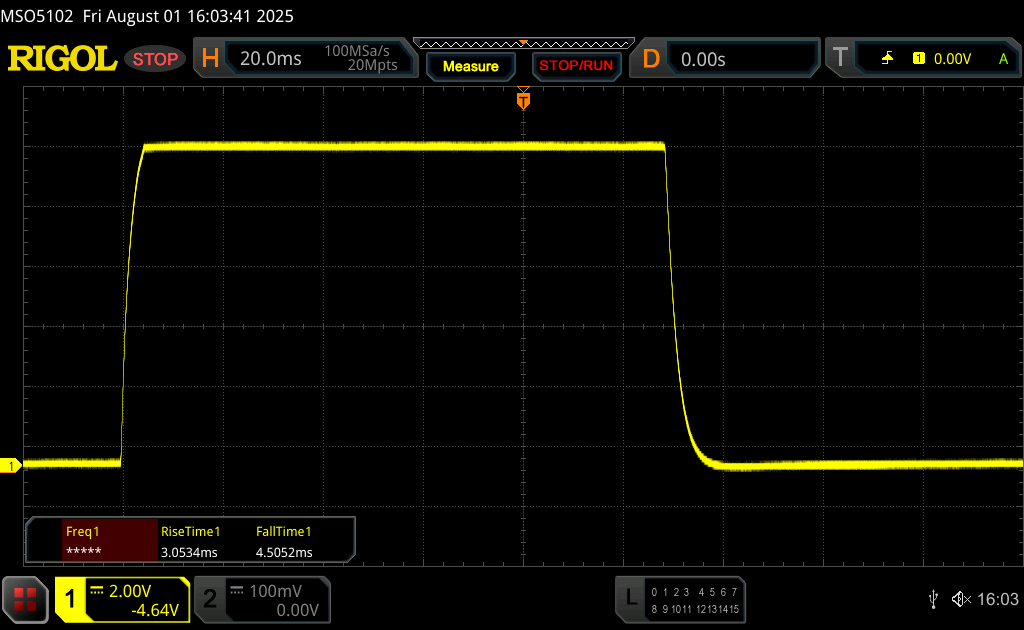 |
| ↘ 4.5 ms sonbahar | ||
| Ekran, testlerimizde çok hızlı yanıt oranları gösteriyor ve hızlı oyun oynamaya çok uygun olmalı. Karşılaştırıldığında, test edilen tüm cihazlar 0.1 (minimum) ile 240 (maksimum) ms arasında değişir. » Tüm cihazların 22 %'si daha iyi. Bu, ölçülen yanıt süresinin test edilen tüm cihazların ortalamasından (19.9 ms) daha iyi olduğu anlamına gelir. | ||
| ↔ Tepki Süresi %50 Griden %80 Griye | ||
| 13.7 ms ... yükseliş ↗ ve sonbahar↘ birleşimi | ↗ 6.5 ms yükseliş | 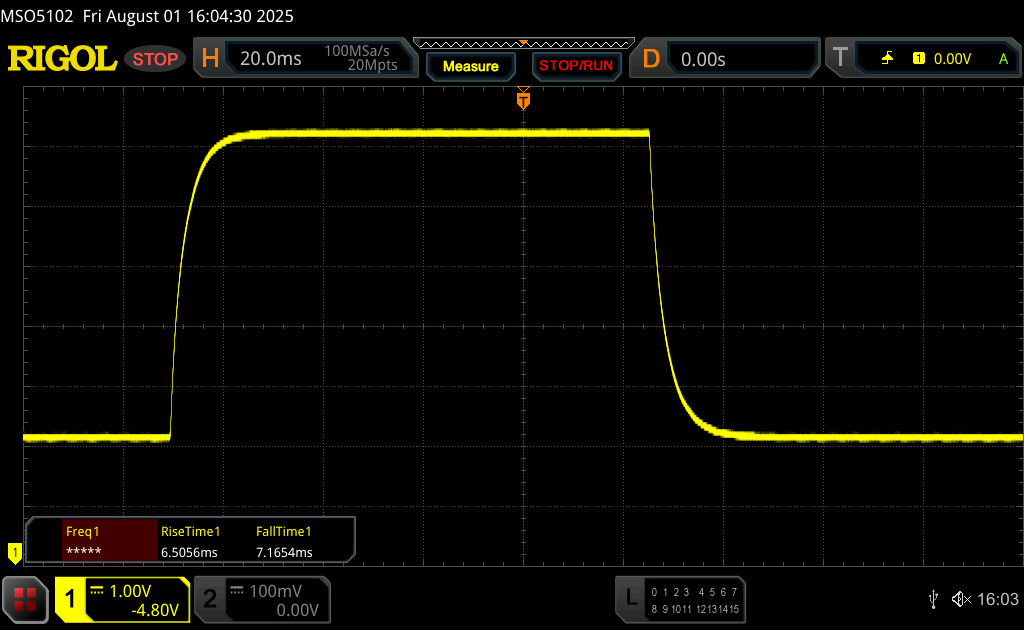 |
| ↘ 7.2 ms sonbahar | ||
| Ekran, testlerimizde iyi yanıt oranları gösteriyor ancak rekabetçi oyuncular için çok yavaş olabilir. Karşılaştırıldığında, test edilen tüm cihazlar 0.165 (minimum) ile 636 (maksimum) ms arasında değişir. » Tüm cihazların 27 %'si daha iyi. Bu, ölçülen yanıt süresinin test edilen tüm cihazların ortalamasından (31.1 ms) daha iyi olduğu anlamına gelir. | ||
Ekran Titremesi / PWM (Darbe Genişliği Modülasyonu)
| Ekran titriyor / PWM algılanmadı |  | ||
Karşılaştırıldığında: Test edilen tüm cihazların %52 %'si ekranı karartmak için PWM kullanmıyor. PWM tespit edilirse, ortalama 7798 (minimum: 5 - maksimum: 343500) Hz ölçüldü. | |||


Performans - 96 GB'a kadar RAM ile 5070 Ti dizüstü bilgisayar GPU'su
Test koşulları
Kontrol Merkezi'nde her biri alt profiller sunan çeşitli güç profilleri mevcuttur. Maksimum oyun performansı yalnızca Performans/Turbo modunda mevcuttur. Maksimum GPU performansı genellikle Performans/Otomatik modda mevcut olsa da, eş zamanlı CPU yükü ile oyun oynarken performans farklılık gösterir (maksimum TGP sonra 100 watt).
| Enerji profili | CPU TDP | CB24 Multi | GPU TGP | Time Spy Grafik | CP2077 QHD Ultra | maks. fan hacmi |
|---|---|---|---|---|---|---|
| Sessiz | 30/28 watt | 591 puan | 100 watt | 14.202 puan | 61,2fps | 37 dB(A) |
| Eğlence | 115/45 watt | 1.013 puan | 100 watt | 14.463 puan | 68,1fps | 46,6 dB(A) |
| Performans (Otomatik) | 150/120 watt | 1.624 puan | 140/100 watt | 14.833 puan | 69,8 fps | 51,9 dB(A) |
| Performans (Turbo) | 150/135 watt | 1.675 puan | 140 watt | 17.211 puan | 81fps | 56,2 dB(A) |
| Pil | 30 watt | 619 puan | 35 watt | 3.423 puan | 17,9 fps | 33,6 dB(A) |
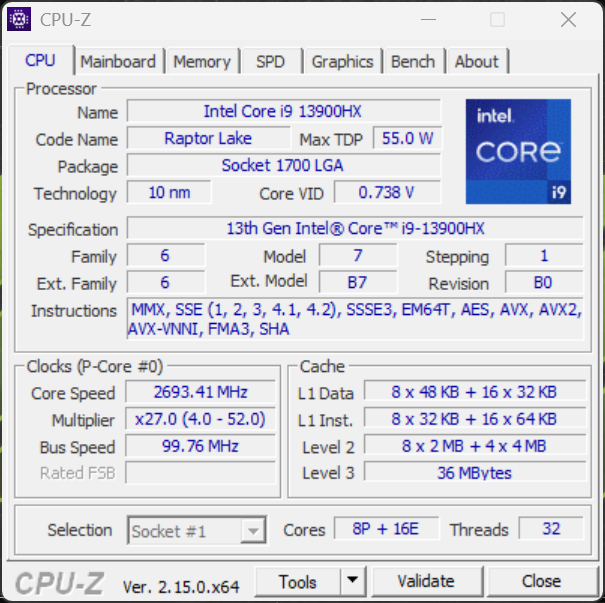
İşlemci - Core i9-13900HX
Standart olarak, Focus 17 M25'te eski Core i9-13900HX. Bununla birlikte, Core i9-14900HX de isteğe bağlı olarak mevcuttur. CPU performansı iyi olmaya devam ediyor, ancak beklendiği gibi Raptor Lake Core Ultra 9 275HX. Ancak, daha pahalı olan Vektör 17 275HX ile daha düşük güç sınırları nedeniyle yalnızca minimum düzeyde daha hızlıdır.
Cinebench R15 Multi Sustained Test
Cinebench 2024: CPU Multi Core | CPU Single Core
Cinebench R23: Multi Core | Single Core
Cinebench R20: CPU (Multi Core) | CPU (Single Core)
Cinebench R15: CPU Multi 64Bit | CPU Single 64Bit
Blender: v2.79 BMW27 CPU
7-Zip 18.03: 7z b 4 | 7z b 4 -mmt1
Geekbench 6.7: Multi-Core | Single-Core
Geekbench 5.5: Multi-Core | Single-Core
HWBOT x265 Benchmark v2.2: 4k Preset
LibreOffice : 20 Documents To PDF
R Benchmark 2.5: Overall mean
| CPU Performance rating | |
| Schenker XMG Pro 16 (E25) | |
| Lenovo Legion 5 Pro 16IAX10H -2! | |
| MSI Vector 17 HX AI A2XWIG -2! | |
| Schenker XMG Focus 17 M25 | |
| Ortalama Intel Core i9-13900HX | |
| MSI Vector 16 HX AI A2XWHG | |
| Sınıf ortalaması Gaming | |
| Cinebench 2024 / CPU Multi Core | |
| Schenker XMG Pro 16 (E25) | |
| Schenker XMG Focus 17 M25 | |
| Ortalama Intel Core i9-13900HX (n=1) | |
| MSI Vector 16 HX AI A2XWHG | |
| Sınıf ortalaması Gaming (486 - 2298, n=92, son 2 yıl) | |
| Cinebench 2024 / CPU Single Core | |
| Schenker XMG Pro 16 (E25) | |
| MSI Vector 16 HX AI A2XWHG | |
| Schenker XMG Focus 17 M25 | |
| Ortalama Intel Core i9-13900HX (n=1) | |
| Sınıf ortalaması Gaming (95 - 138.2, n=92, son 2 yıl) | |
| Cinebench R23 / Multi Core | |
| Lenovo Legion 5 Pro 16IAX10H | |
| Schenker XMG Pro 16 (E25) | |
| MSI Vector 17 HX AI A2XWIG | |
| Schenker XMG Focus 17 M25 | |
| Ortalama Intel Core i9-13900HX (24270 - 32623, n=23) | |
| MSI Vector 16 HX AI A2XWHG | |
| Sınıf ortalaması Gaming (10488 - 40970, n=113, son 2 yıl) | |
| Cinebench R23 / Single Core | |
| Lenovo Legion 5 Pro 16IAX10H | |
| Schenker XMG Pro 16 (E25) | |
| MSI Vector 17 HX AI A2XWIG | |
| MSI Vector 16 HX AI A2XWHG | |
| Schenker XMG Focus 17 M25 | |
| Ortalama Intel Core i9-13900HX (1867 - 2105, n=20) | |
| Sınıf ortalaması Gaming (1166 - 2356, n=113, son 2 yıl) | |
| Cinebench R20 / CPU (Multi Core) | |
| Lenovo Legion 5 Pro 16IAX10H | |
| Schenker XMG Pro 16 (E25) | |
| MSI Vector 17 HX AI A2XWIG | |
| Schenker XMG Focus 17 M25 | |
| Ortalama Intel Core i9-13900HX (9152 - 12541, n=21) | |
| MSI Vector 16 HX AI A2XWHG | |
| Sınıf ortalaması Gaming (4029 - 16108, n=112, son 2 yıl) | |
| Cinebench R20 / CPU (Single Core) | |
| Lenovo Legion 5 Pro 16IAX10H | |
| Schenker XMG Pro 16 (E25) | |
| MSI Vector 17 HX AI A2XWIG | |
| MSI Vector 16 HX AI A2XWHG | |
| Schenker XMG Focus 17 M25 | |
| Ortalama Intel Core i9-13900HX (722 - 810, n=21) | |
| Sınıf ortalaması Gaming (442 - 895, n=112, son 2 yıl) | |
| Cinebench R15 / CPU Multi 64Bit | |
| Lenovo Legion 5 Pro 16IAX10H | |
| Schenker XMG Pro 16 (E25) | |
| MSI Vector 17 HX AI A2XWIG | |
| Ortalama Intel Core i9-13900HX (3913 - 4970, n=22) | |
| Schenker XMG Focus 17 M25 | |
| MSI Vector 16 HX AI A2XWHG | |
| Sınıf ortalaması Gaming (1578 - 6271, n=113, son 2 yıl) | |
| Cinebench R15 / CPU Single 64Bit | |
| MSI Vector 17 HX AI A2XWIG | |
| MSI Vector 17 HX AI A2XWIG | |
| Schenker XMG Pro 16 (E25) | |
| Lenovo Legion 5 Pro 16IAX10H | |
| MSI Vector 16 HX AI A2XWHG | |
| Schenker XMG Focus 17 M25 | |
| Sınıf ortalaması Gaming (188.8 - 343, n=112, son 2 yıl) | |
| Ortalama Intel Core i9-13900HX (247 - 304, n=22) | |
| Blender / v2.79 BMW27 CPU | |
| Sınıf ortalaması Gaming (80 - 330, n=110, son 2 yıl) | |
| MSI Vector 16 HX AI A2XWHG | |
| Ortalama Intel Core i9-13900HX (101 - 153, n=22) | |
| MSI Vector 17 HX AI A2XWIG | |
| Schenker XMG Focus 17 M25 | |
| Lenovo Legion 5 Pro 16IAX10H | |
| Schenker XMG Pro 16 (E25) | |
| 7-Zip 18.03 / 7z b 4 | |
| Schenker XMG Focus 17 M25 | |
| Schenker XMG Pro 16 (E25) | |
| Lenovo Legion 5 Pro 16IAX10H | |
| Ortalama Intel Core i9-13900HX (90675 - 127283, n=21) | |
| MSI Vector 17 HX AI A2XWIG | |
| Sınıf ortalaması Gaming (33491 - 148086, n=111, son 2 yıl) | |
| MSI Vector 16 HX AI A2XWHG | |
| 7-Zip 18.03 / 7z b 4 -mmt1 | |
| Schenker XMG Focus 17 M25 | |
| Schenker XMG Pro 16 (E25) | |
| Ortalama Intel Core i9-13900HX (6340 - 7177, n=21) | |
| Lenovo Legion 5 Pro 16IAX10H | |
| MSI Vector 17 HX AI A2XWIG | |
| MSI Vector 16 HX AI A2XWHG | |
| Sınıf ortalaması Gaming (4199 - 7436, n=111, son 2 yıl) | |
| Geekbench 6.7 / Multi-Core | |
| Schenker XMG Pro 16 (E25) | |
| Lenovo Legion 5 Pro 16IAX10H | |
| MSI Vector 17 HX AI A2XWIG | |
| MSI Vector 16 HX AI A2XWHG | |
| Schenker XMG Focus 17 M25 | |
| Ortalama Intel Core i9-13900HX (15031 - 18014, n=3) | |
| Sınıf ortalaması Gaming (6625 - 22104, n=112, son 2 yıl) | |
| Geekbench 6.7 / Single-Core | |
| Schenker XMG Pro 16 (E25) | |
| MSI Vector 17 HX AI A2XWIG | |
| Lenovo Legion 5 Pro 16IAX10H | |
| MSI Vector 16 HX AI A2XWHG | |
| Schenker XMG Focus 17 M25 | |
| Sınıf ortalaması Gaming (1490 - 3259, n=112, son 2 yıl) | |
| Ortalama Intel Core i9-13900HX (2548 - 2892, n=3) | |
| Geekbench 5.5 / Multi-Core | |
| Schenker XMG Pro 16 (E25) | |
| Lenovo Legion 5 Pro 16IAX10H | |
| MSI Vector 17 HX AI A2XWIG | |
| Schenker XMG Focus 17 M25 | |
| Ortalama Intel Core i9-13900HX (17614 - 21075, n=22) | |
| MSI Vector 16 HX AI A2XWHG | |
| Sınıf ortalaması Gaming (6460 - 27010, n=111, son 2 yıl) | |
| Geekbench 5.5 / Single-Core | |
| Schenker XMG Pro 16 (E25) | |
| Lenovo Legion 5 Pro 16IAX10H | |
| MSI Vector 17 HX AI A2XWIG | |
| MSI Vector 16 HX AI A2XWHG | |
| Schenker XMG Focus 17 M25 | |
| Sınıf ortalaması Gaming (986 - 2474, n=111, son 2 yıl) | |
| Ortalama Intel Core i9-13900HX (1345 - 2093, n=22) | |
| HWBOT x265 Benchmark v2.2 / 4k Preset | |
| Schenker XMG Pro 16 (E25) | |
| Lenovo Legion 5 Pro 16IAX10H | |
| MSI Vector 17 HX AI A2XWIG | |
| MSI Vector 16 HX AI A2XWHG | |
| Schenker XMG Focus 17 M25 | |
| Ortalama Intel Core i9-13900HX (23.5 - 34.4, n=22) | |
| Sınıf ortalaması Gaming (11.5 - 44.3, n=111, son 2 yıl) | |
| LibreOffice / 20 Documents To PDF | |
| Sınıf ortalaması Gaming (19 - 88.8, n=111, son 2 yıl) | |
| Schenker XMG Pro 16 (E25) | |
| Schenker XMG Focus 17 M25 | |
| Ortalama Intel Core i9-13900HX (32.8 - 51.1, n=21) | |
| MSI Vector 16 HX AI A2XWHG | |
| MSI Vector 17 HX AI A2XWIG | |
| Lenovo Legion 5 Pro 16IAX10H | |
| R Benchmark 2.5 / Overall mean | |
| Sınıf ortalaması Gaming (0.3439 - 0.759, n=112, son 2 yıl) | |
| MSI Vector 16 HX AI A2XWHG | |
| MSI Vector 17 HX AI A2XWIG | |
| Lenovo Legion 5 Pro 16IAX10H | |
| Schenker XMG Pro 16 (E25) | |
| Schenker XMG Focus 17 M25 | |
| Ortalama Intel Core i9-13900HX (0.375 - 0.4564, n=22) | |
* ... daha küçük daha iyidir
AIDA64: FP32 Ray-Trace | FPU Julia | CPU SHA3 | CPU Queen | FPU SinJulia | FPU Mandel | CPU AES | CPU ZLib | FP64 Ray-Trace | CPU PhotoWorxx
| Performance rating | |
| Lenovo Legion 5 Pro 16IAX10H | |
| Schenker XMG Pro 16 (E25) | |
| Schenker XMG Focus 17 M25 | |
| MSI Vector 17 HX AI A2XWIG | |
| Ortalama Intel Core i9-13900HX | |
| Sınıf ortalaması Gaming | |
| MSI Vector 16 HX AI A2XWHG | |
| AIDA64 / FP32 Ray-Trace | |
| Lenovo Legion 5 Pro 16IAX10H | |
| Schenker XMG Pro 16 (E25) | |
| Sınıf ortalaması Gaming (10227 - 85542, n=110, son 2 yıl) | |
| MSI Vector 17 HX AI A2XWIG | |
| MSI Vector 16 HX AI A2XWHG | |
| Schenker XMG Focus 17 M25 | |
| Ortalama Intel Core i9-13900HX (17589 - 27615, n=22) | |
| AIDA64 / FPU Julia | |
| Lenovo Legion 5 Pro 16IAX10H | |
| Schenker XMG Pro 16 (E25) | |
| MSI Vector 17 HX AI A2XWIG | |
| MSI Vector 16 HX AI A2XWHG | |
| Sınıf ortalaması Gaming (51376 - 238426, n=110, son 2 yıl) | |
| Schenker XMG Focus 17 M25 | |
| Ortalama Intel Core i9-13900HX (88686 - 137015, n=22) | |
| AIDA64 / CPU SHA3 | |
| Schenker XMG Pro 16 (E25) | |
| Lenovo Legion 5 Pro 16IAX10H | |
| MSI Vector 17 HX AI A2XWIG | |
| Schenker XMG Focus 17 M25 | |
| MSI Vector 16 HX AI A2XWHG | |
| Sınıf ortalaması Gaming (2180 - 9817, n=110, son 2 yıl) | |
| Ortalama Intel Core i9-13900HX (4362 - 7029, n=22) | |
| AIDA64 / CPU Queen | |
| Lenovo Legion 5 Pro 16IAX10H | |
| Schenker XMG Focus 17 M25 | |
| Ortalama Intel Core i9-13900HX (125644 - 141385, n=22) | |
| Schenker XMG Pro 16 (E25) | |
| MSI Vector 17 HX AI A2XWIG | |
| Sınıf ortalaması Gaming (49785 - 173351, n=101, son 2 yıl) | |
| MSI Vector 16 HX AI A2XWHG | |
| AIDA64 / FPU SinJulia | |
| Schenker XMG Focus 17 M25 | |
| Ortalama Intel Core i9-13900HX (12334 - 17179, n=22) | |
| Sınıf ortalaması Gaming (4424 - 33636, n=110, son 2 yıl) | |
| Schenker XMG Pro 16 (E25) | |
| Lenovo Legion 5 Pro 16IAX10H | |
| MSI Vector 17 HX AI A2XWIG | |
| MSI Vector 16 HX AI A2XWHG | |
| AIDA64 / FPU Mandel | |
| Schenker XMG Pro 16 (E25) | |
| Lenovo Legion 5 Pro 16IAX10H | |
| MSI Vector 17 HX AI A2XWIG | |
| MSI Vector 16 HX AI A2XWHG | |
| Sınıf ortalaması Gaming (25115 - 128721, n=110, son 2 yıl) | |
| Schenker XMG Focus 17 M25 | |
| Ortalama Intel Core i9-13900HX (43850 - 69202, n=22) | |
| AIDA64 / CPU AES | |
| Ortalama Intel Core i9-13900HX (89413 - 237881, n=22) | |
| Lenovo Legion 5 Pro 16IAX10H | |
| Schenker XMG Pro 16 (E25) | |
| Schenker XMG Focus 17 M25 | |
| MSI Vector 17 HX AI A2XWIG | |
| Sınıf ortalaması Gaming (39258 - 247074, n=110, son 2 yıl) | |
| MSI Vector 16 HX AI A2XWHG | |
| AIDA64 / CPU ZLib | |
| Lenovo Legion 5 Pro 16IAX10H | |
| Schenker XMG Pro 16 (E25) | |
| Schenker XMG Focus 17 M25 | |
| Ortalama Intel Core i9-13900HX (1284 - 1958, n=22) | |
| MSI Vector 17 HX AI A2XWIG | |
| Sınıf ortalaması Gaming (574 - 2531, n=110, son 2 yıl) | |
| MSI Vector 16 HX AI A2XWHG | |
| AIDA64 / FP64 Ray-Trace | |
| Lenovo Legion 5 Pro 16IAX10H | |
| Schenker XMG Pro 16 (E25) | |
| Sınıf ortalaması Gaming (5509 - 45446, n=110, son 2 yıl) | |
| MSI Vector 16 HX AI A2XWHG | |
| MSI Vector 17 HX AI A2XWIG | |
| Schenker XMG Focus 17 M25 | |
| Ortalama Intel Core i9-13900HX (9481 - 15279, n=22) | |
| AIDA64 / CPU PhotoWorxx | |
| Schenker XMG Pro 16 (E25) | |
| Lenovo Legion 5 Pro 16IAX10H | |
| MSI Vector 17 HX AI A2XWIG | |
| Schenker XMG Focus 17 M25 | |
| Ortalama Intel Core i9-13900HX (42994 - 51994, n=22) | |
| Sınıf ortalaması Gaming (12271 - 89891, n=110, son 2 yıl) | |
| MSI Vector 16 HX AI A2XWHG | |
Sistem performansı
Focus 17 günlük durumlarda çok hızlı bir yol arkadaşıdır ve kıyaslama sonuçları da iyidir. Test sırasında sistem kararlılığıyla ilgili herhangi bir sorunla karşılaşmadık.
PCMark 10: Score | Essentials | Productivity | Digital Content Creation
CrossMark: Overall | Productivity | Creativity | Responsiveness
WebXPRT 3: Overall
WebXPRT 4: Overall
Mozilla Kraken 1.1: Total
| Performance rating | |
| Lenovo Legion 5 Pro 16IAX10H | |
| Schenker XMG Pro 16 (E25) | |
| MSI Vector 17 HX AI A2XWIG | |
| Schenker XMG Focus 17 M25 | |
| Ortalama Intel Core i9-13900HX, NVIDIA GeForce RTX 5070 Ti Laptop | |
| Sınıf ortalaması Gaming | |
| MSI Vector 16 HX AI A2XWHG | |
| PCMark 10 / Score | |
| Schenker XMG Pro 16 (E25) | |
| MSI Vector 17 HX AI A2XWIG | |
| Sınıf ortalaması Gaming (5828 - 11574, n=96, son 2 yıl) | |
| Lenovo Legion 5 Pro 16IAX10H | |
| MSI Vector 16 HX AI A2XWHG | |
| Schenker XMG Focus 17 M25 | |
| Ortalama Intel Core i9-13900HX, NVIDIA GeForce RTX 5070 Ti Laptop (n=1) | |
| PCMark 10 / Essentials | |
| Schenker XMG Pro 16 (E25) | |
| Schenker XMG Focus 17 M25 | |
| Ortalama Intel Core i9-13900HX, NVIDIA GeForce RTX 5070 Ti Laptop (n=1) | |
| MSI Vector 17 HX AI A2XWIG | |
| Lenovo Legion 5 Pro 16IAX10H | |
| MSI Vector 16 HX AI A2XWHG | |
| Sınıf ortalaması Gaming (8810 - 12600, n=100, son 2 yıl) | |
| PCMark 10 / Productivity | |
| Sınıf ortalaması Gaming (6845 - 18766, n=98, son 2 yıl) | |
| Lenovo Legion 5 Pro 16IAX10H | |
| Schenker XMG Pro 16 (E25) | |
| MSI Vector 16 HX AI A2XWHG | |
| MSI Vector 17 HX AI A2XWIG | |
| Schenker XMG Focus 17 M25 | |
| Ortalama Intel Core i9-13900HX, NVIDIA GeForce RTX 5070 Ti Laptop (n=1) | |
| PCMark 10 / Digital Content Creation | |
| MSI Vector 17 HX AI A2XWIG | |
| Schenker XMG Pro 16 (E25) | |
| Lenovo Legion 5 Pro 16IAX10H | |
| Sınıf ortalaması Gaming (7602 - 19657, n=98, son 2 yıl) | |
| Schenker XMG Focus 17 M25 | |
| Ortalama Intel Core i9-13900HX, NVIDIA GeForce RTX 5070 Ti Laptop (n=1) | |
| MSI Vector 16 HX AI A2XWHG | |
| CrossMark / Overall | |
| Schenker XMG Focus 17 M25 | |
| Ortalama Intel Core i9-13900HX, NVIDIA GeForce RTX 5070 Ti Laptop (n=1) | |
| MSI Vector 17 HX AI A2XWIG | |
| Schenker XMG Pro 16 (E25) | |
| Lenovo Legion 5 Pro 16IAX10H | |
| Sınıf ortalaması Gaming (1366 - 2409, n=98, son 2 yıl) | |
| MSI Vector 16 HX AI A2XWHG | |
| CrossMark / Productivity | |
| MSI Vector 17 HX AI A2XWIG | |
| Lenovo Legion 5 Pro 16IAX10H | |
| Schenker XMG Focus 17 M25 | |
| Ortalama Intel Core i9-13900HX, NVIDIA GeForce RTX 5070 Ti Laptop (n=1) | |
| Schenker XMG Pro 16 (E25) | |
| Sınıf ortalaması Gaming (1386 - 2254, n=98, son 2 yıl) | |
| MSI Vector 16 HX AI A2XWHG | |
| CrossMark / Creativity | |
| Schenker XMG Pro 16 (E25) | |
| Schenker XMG Focus 17 M25 | |
| Ortalama Intel Core i9-13900HX, NVIDIA GeForce RTX 5070 Ti Laptop (n=1) | |
| Lenovo Legion 5 Pro 16IAX10H | |
| MSI Vector 17 HX AI A2XWIG | |
| MSI Vector 16 HX AI A2XWHG | |
| Sınıf ortalaması Gaming (1343 - 2729, n=98, son 2 yıl) | |
| CrossMark / Responsiveness | |
| Schenker XMG Focus 17 M25 | |
| Ortalama Intel Core i9-13900HX, NVIDIA GeForce RTX 5070 Ti Laptop (n=1) | |
| MSI Vector 17 HX AI A2XWIG | |
| Lenovo Legion 5 Pro 16IAX10H | |
| Schenker XMG Pro 16 (E25) | |
| Sınıf ortalaması Gaming (1226 - 2334, n=98, son 2 yıl) | |
| MSI Vector 16 HX AI A2XWHG | |
| WebXPRT 3 / Overall | |
| Lenovo Legion 5 Pro 16IAX10H | |
| Schenker XMG Pro 16 (E25) | |
| MSI Vector 17 HX AI A2XWIG | |
| MSI Vector 16 HX AI A2XWHG | |
| Sınıf ortalaması Gaming (242 - 532, n=101, son 2 yıl) | |
| Ortalama Intel Core i9-13900HX, NVIDIA GeForce RTX 5070 Ti Laptop (n=1) | |
| Schenker XMG Focus 17 M25 | |
| WebXPRT 4 / Overall | |
| Schenker XMG Pro 16 (E25) | |
| MSI Vector 17 HX AI A2XWIG | |
| Lenovo Legion 5 Pro 16IAX10H | |
| MSI Vector 16 HX AI A2XWHG | |
| Schenker XMG Focus 17 M25 | |
| Ortalama Intel Core i9-13900HX, NVIDIA GeForce RTX 5070 Ti Laptop (n=1) | |
| Sınıf ortalaması Gaming (176.4 - 354, n=101, son 2 yıl) | |
| Mozilla Kraken 1.1 / Total | |
| Schenker XMG Focus 17 M25 | |
| Ortalama Intel Core i9-13900HX, NVIDIA GeForce RTX 5070 Ti Laptop (n=1) | |
| Sınıf ortalaması Gaming (391 - 590, n=106, son 2 yıl) | |
| MSI Vector 16 HX AI A2XWHG | |
| MSI Vector 17 HX AI A2XWIG | |
| Lenovo Legion 5 Pro 16IAX10H | |
| Schenker XMG Pro 16 (E25) | |
* ... daha küçük daha iyidir
| PCMark 10 Score | 7560 puan | |
Yardım | ||
| AIDA64 / Memory Copy | |
| Schenker XMG Pro 16 (E25) | |
| Schenker XMG Focus 17 M25 | |
| Lenovo Legion 5 Pro 16IAX10H | |
| MSI Vector 17 HX AI A2XWIG | |
| Ortalama Intel Core i9-13900HX (67716 - 79193, n=22) | |
| Sınıf ortalaması Gaming (21750 - 129946, n=110, son 2 yıl) | |
| MSI Vector 16 HX AI A2XWHG | |
| AIDA64 / Memory Read | |
| Schenker XMG Pro 16 (E25) | |
| Schenker XMG Focus 17 M25 | |
| Lenovo Legion 5 Pro 16IAX10H | |
| MSI Vector 17 HX AI A2XWIG | |
| Ortalama Intel Core i9-13900HX (73998 - 88462, n=22) | |
| MSI Vector 16 HX AI A2XWHG | |
| Sınıf ortalaması Gaming (22956 - 118858, n=110, son 2 yıl) | |
| AIDA64 / Memory Write | |
| Schenker XMG Pro 16 (E25) | |
| Lenovo Legion 5 Pro 16IAX10H | |
| MSI Vector 17 HX AI A2XWIG | |
| Sınıf ortalaması Gaming (22297 - 135096, n=110, son 2 yıl) | |
| Schenker XMG Focus 17 M25 | |
| Ortalama Intel Core i9-13900HX (65472 - 77045, n=22) | |
| MSI Vector 16 HX AI A2XWHG | |
| AIDA64 / Memory Latency | |
| MSI Vector 17 HX AI A2XWIG | |
| Lenovo Legion 5 Pro 16IAX10H | |
| MSI Vector 16 HX AI A2XWHG | |
| Sınıf ortalaması Gaming (75.3 - 259, n=110, son 2 yıl) | |
| Schenker XMG Pro 16 (E25) | |
| Ortalama Intel Core i9-13900HX (75.3 - 91.1, n=22) | |
| Schenker XMG Focus 17 M25 | |
* ... daha küçük daha iyidir
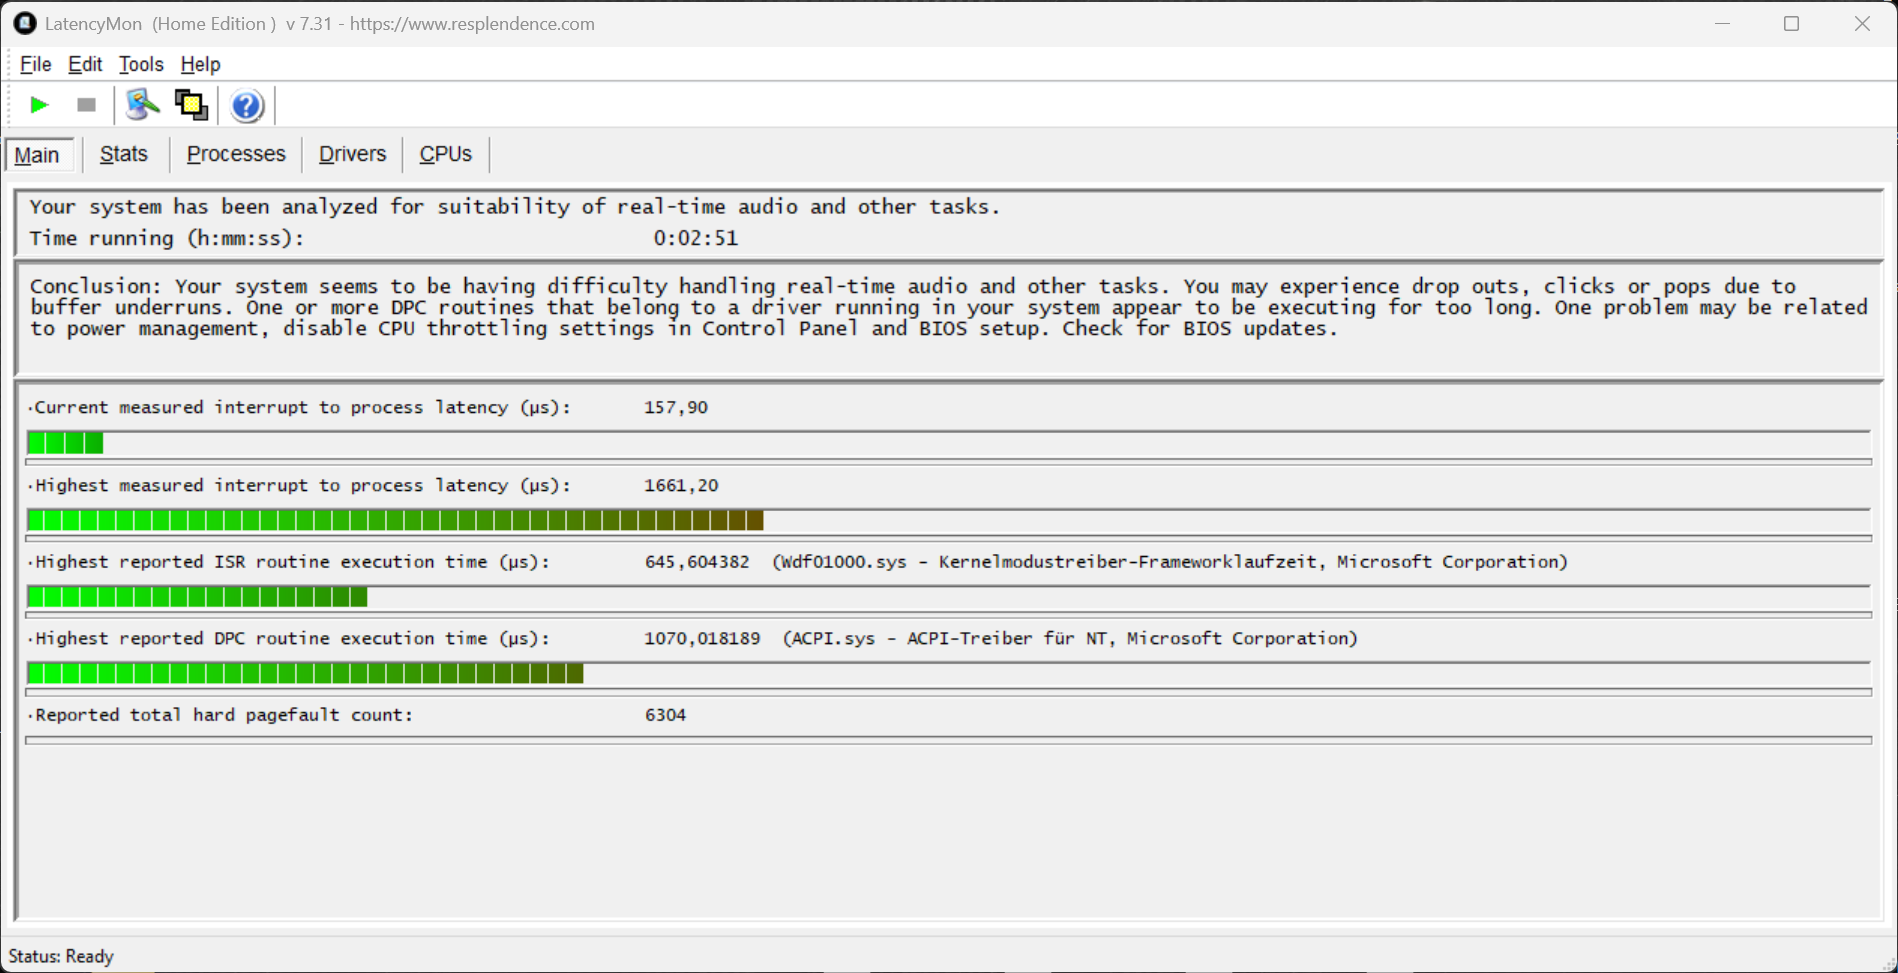
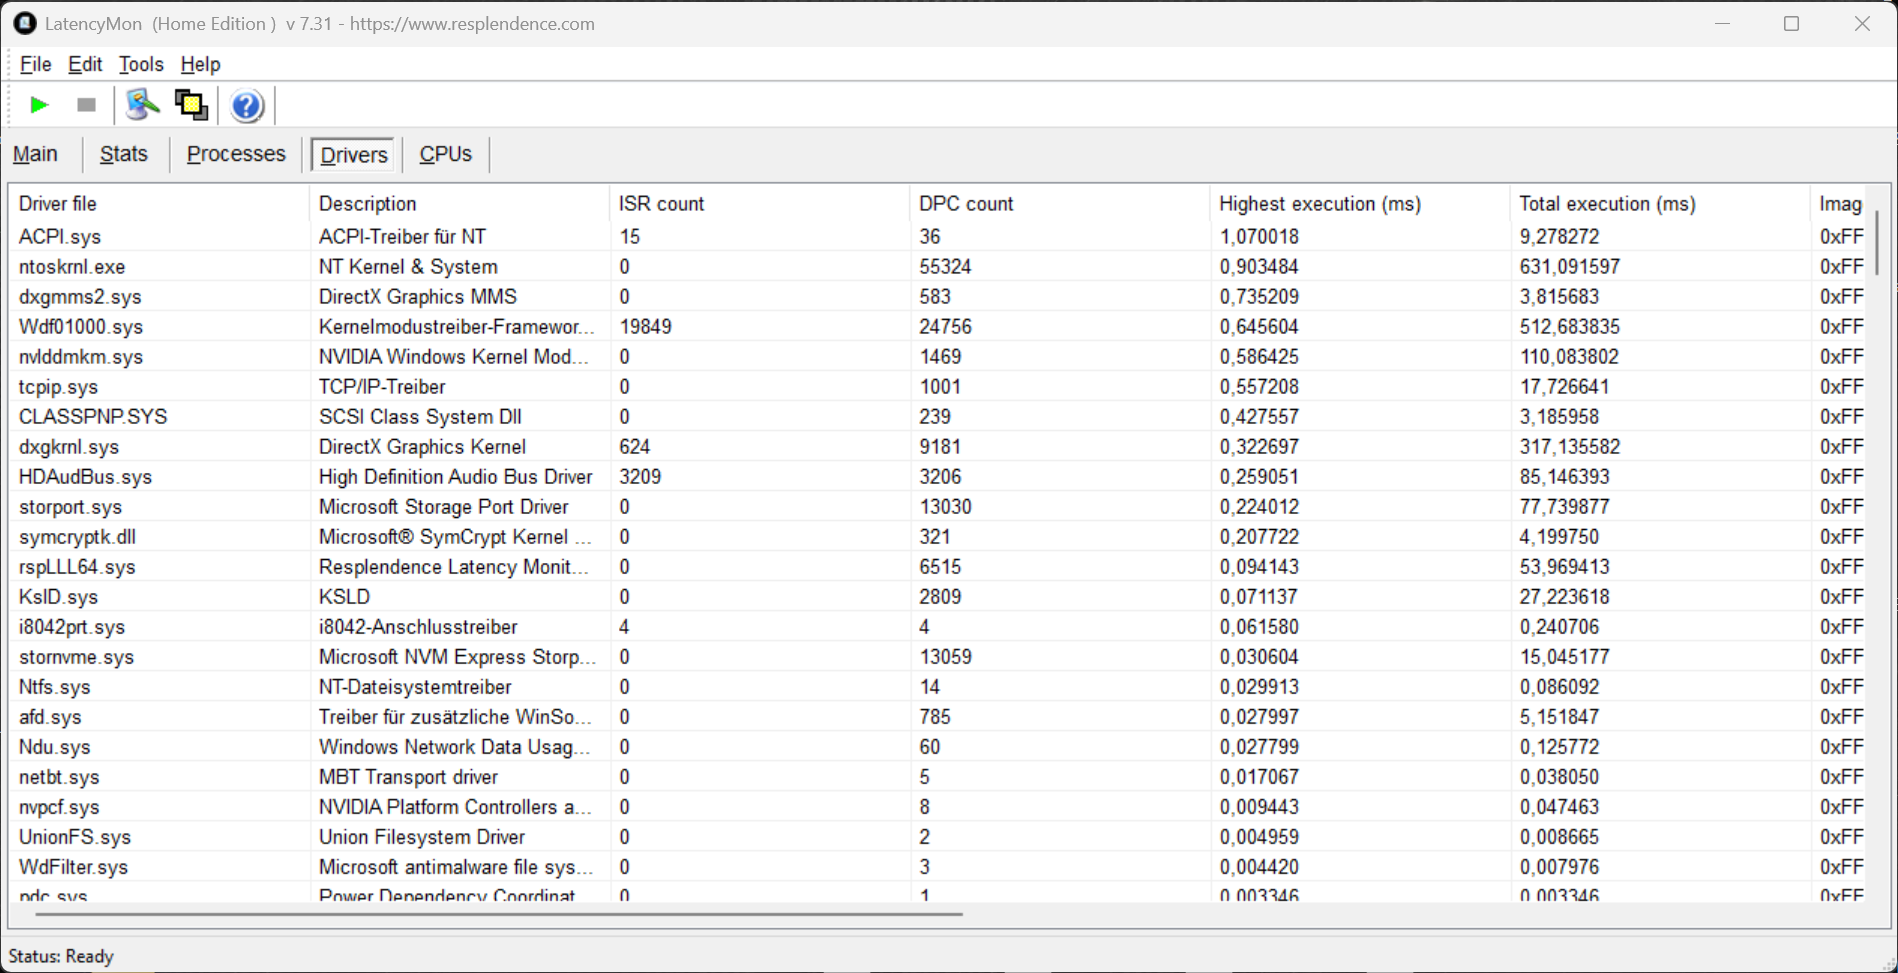
DPC gecikme süreleri
Standartlaştırılmış gecikme testimizde (web'de gezinme, 4K YouTube oynatma, CPU yükü), inceleme cihazı (mevcut BIOS sürümüyle) gerçek zamanlı ses uygulamalarını kullanırken hafif sınırlamalar gösterdi.
| DPC Latencies / LatencyMon - interrupt to process latency (max), Web, Youtube, Prime95 | |
| MSI Vector 16 HX AI A2XWHG | |
| Schenker XMG Pro 16 (E25) | |
| Schenker XMG Focus 17 M25 | |
| MSI Vector 17 HX AI A2XWIG | |
| Lenovo Legion 5 Pro 16IAX10H | |
* ... daha küçük daha iyidir
Yığın depolama
Focus, M.2 2280 SSD'ler (PCIe 4.0) için iki yuva sunmaktadır ve inceleme birimimiz 500 GB Kingston sürücü (399 GB boş) ile donatılmıştır. Aktarım hızları çok iyi ve uzun yük altında bile sabit kalıyor.

* ... daha küçük daha iyidir
Sustained Performance Read: DiskSpd Read Loop, Queue Depth 8
GPU performansı
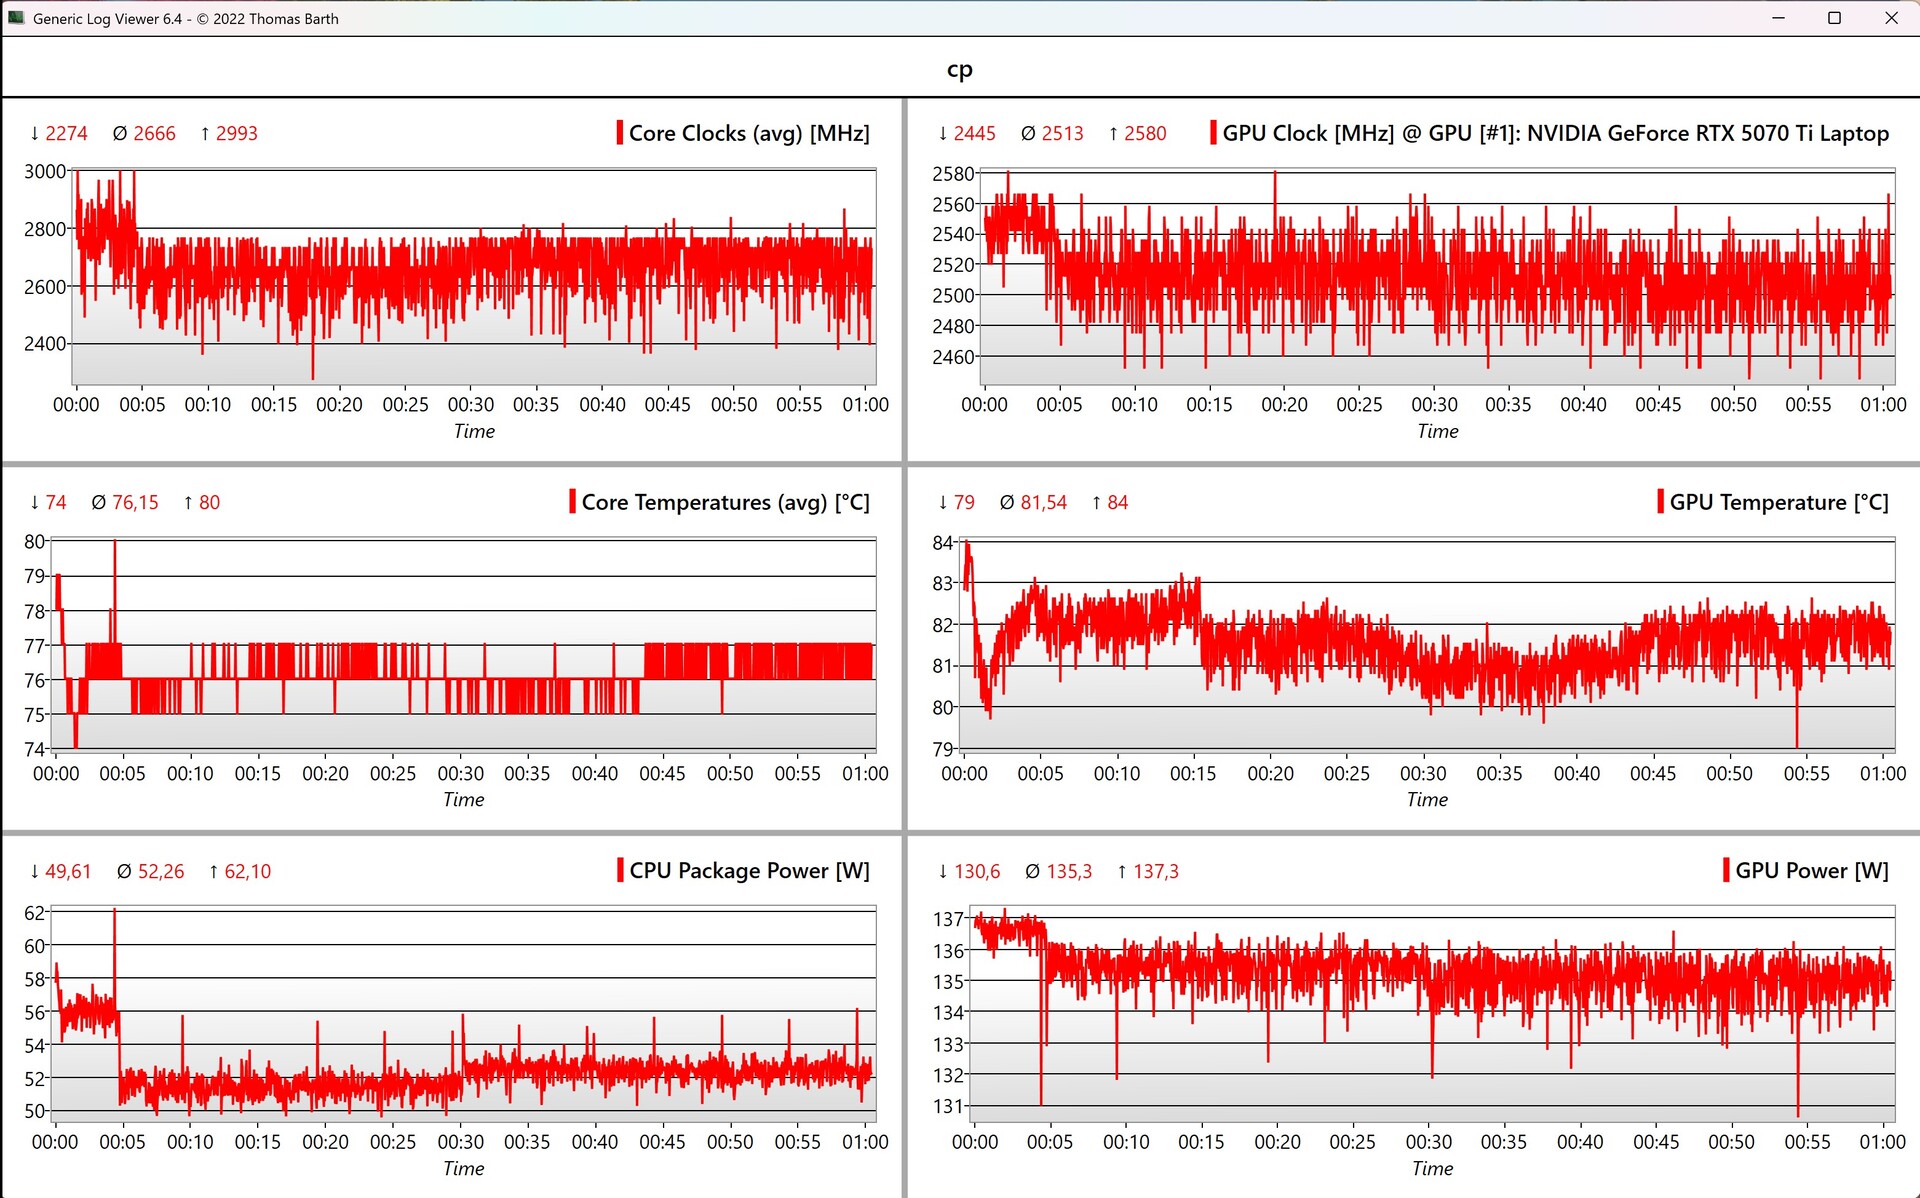
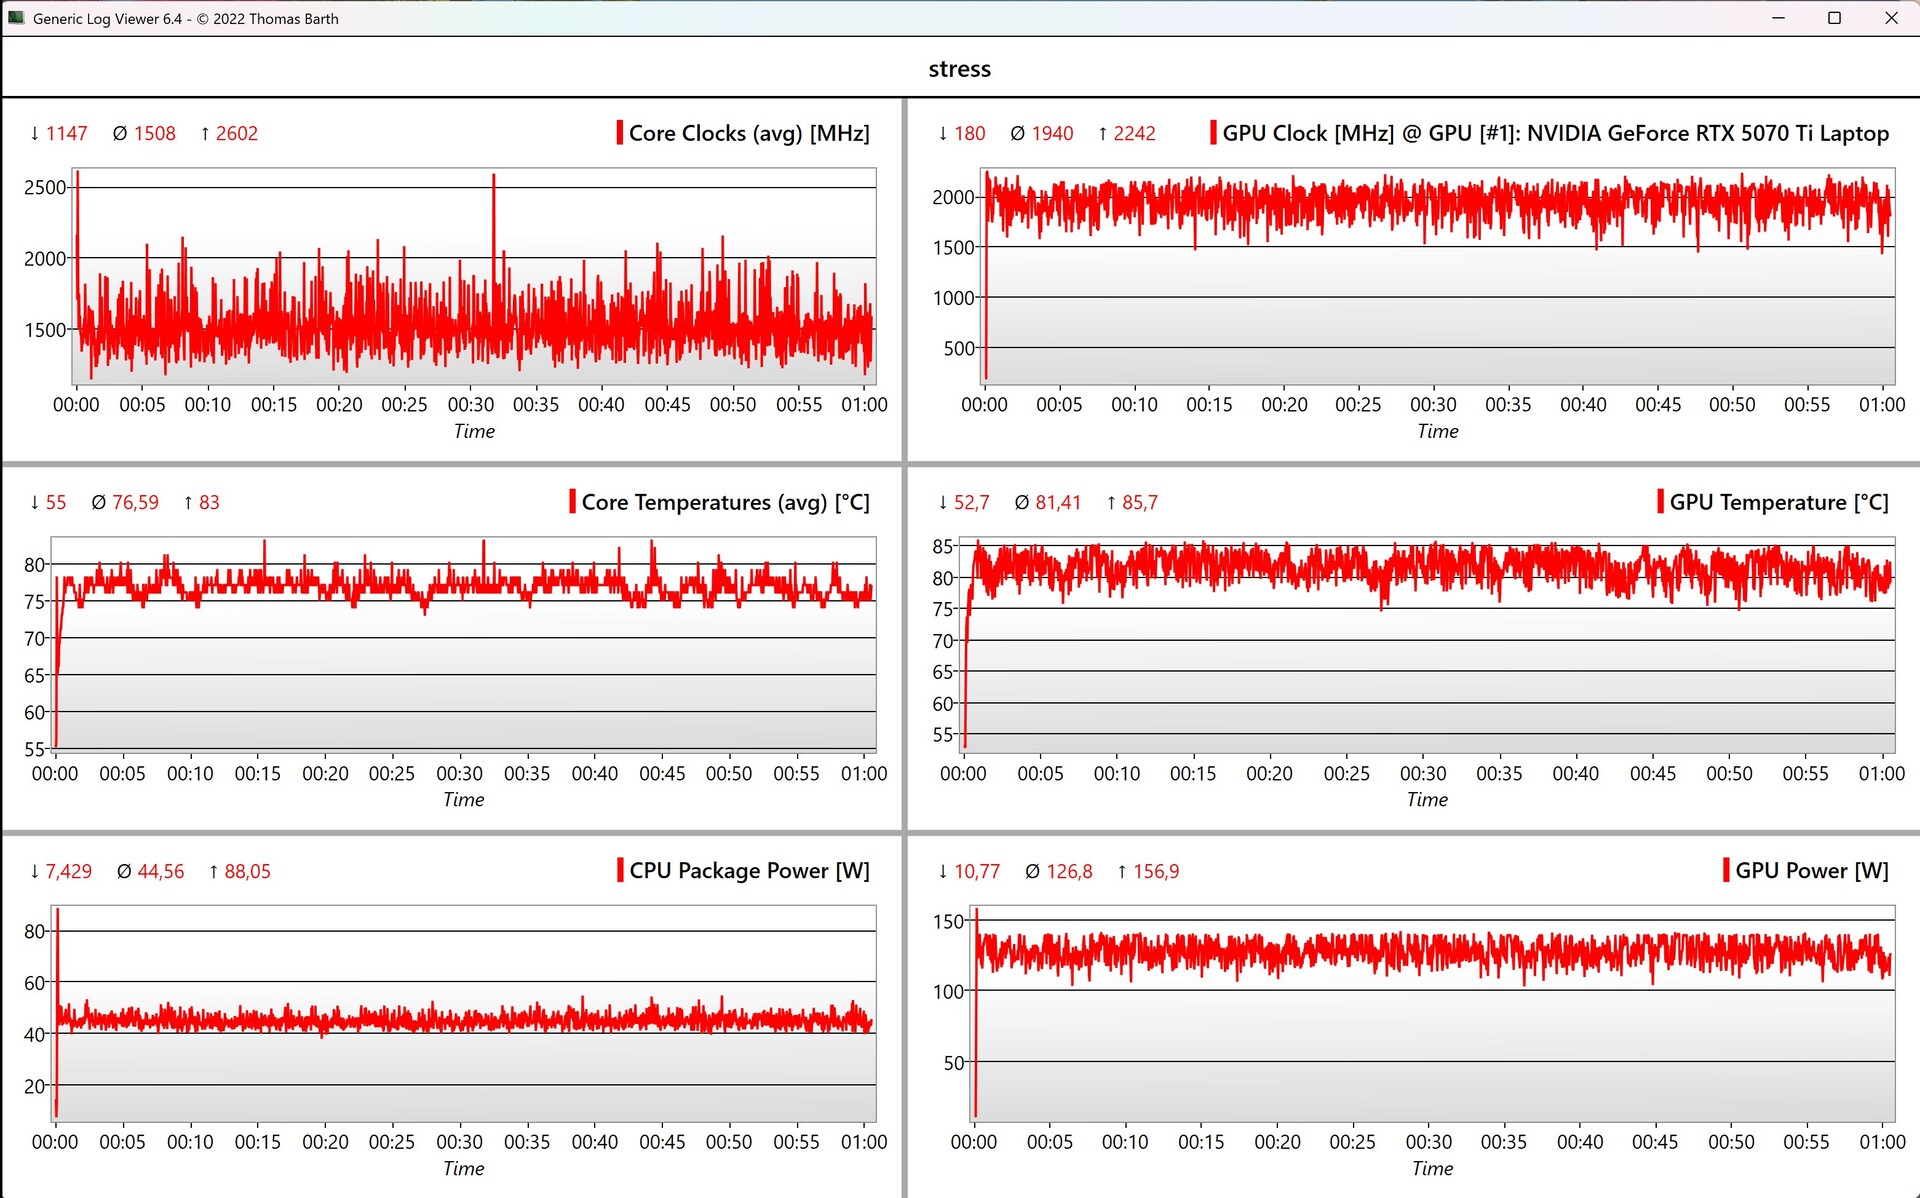
Das Focus 17 özel olarak yeni GeForce RTX 5070 Ti dizüstü bilgisayar GPU'su (TGP 140 watt, 12 GB VRAM). Grafik anahtarlama Optimus teknolojisi ile gerçekleştirilir ve çok iş parçacıklı bir anahtar entegre edilmiştir. Sentetik kıyaslamalarda grafik performansı mükemmeldi. Ayrıca, GPU performansı sürekli yük altında sabit kaldı.
Oyun performansı da çok iyi, tüm oyunlar QHD çözünürlükte sorunsuz çalışıyor. Bununla birlikte, CPU performansı birkaç dakika sonra biraz düştüğü için performans tamamen istikrarlı değildi. Başlığa bağlı olarak küçük farklılıklar olacaktır. Örneğin Cyberpunk 2077 ile yaptığımız testte, performans yaklaşık 5 dakika sonra yaklaşık %5 düştü.
| 3DMark 11 Performance | 43731 puan | |
| 3DMark Fire Strike Score | 33824 puan | |
| 3DMark Time Spy Score | 17276 puan | |
| 3DMark Steel Nomad Score | 3932 puan | |
| 3DMark Steel Nomad Light Score | 17797 puan | |
| 3DMark Steel Nomad Light Unlimited Score | 18318 puan | |
Yardım | ||
| Blender / v3.3 Classroom OPTIX/RTX | |
| Sınıf ortalaması Gaming (9 - 32, n=112, son 2 yıl) | |
| MSI Vector 16 HX AI A2XWHG | |
| Ortalama NVIDIA GeForce RTX 5070 Ti Laptop (13 - 19, n=14) | |
| Lenovo Legion 5 Pro 16IAX10H | |
| Schenker XMG Pro 16 (E25) | |
| MSI Vector 17 HX AI A2XWIG | |
| Schenker XMG Focus 17 M25 | |
| Blender / v3.3 Classroom CUDA | |
| Sınıf ortalaması Gaming (15 - 228, n=112, son 2 yıl) | |
| Schenker XMG Focus 17 M25 | |
| Ortalama NVIDIA GeForce RTX 5070 Ti Laptop (24 - 33, n=14) | |
| Schenker XMG Pro 16 (E25) | |
| MSI Vector 16 HX AI A2XWHG | |
| Lenovo Legion 5 Pro 16IAX10H | |
| MSI Vector 17 HX AI A2XWIG | |
| Blender / v3.3 Classroom CPU | |
| Sınıf ortalaması Gaming (122 - 565, n=108, son 2 yıl) | |
| MSI Vector 16 HX AI A2XWHG | |
| Ortalama NVIDIA GeForce RTX 5070 Ti Laptop (122 - 361, n=14) | |
| Schenker XMG Focus 17 M25 | |
| MSI Vector 17 HX AI A2XWIG | |
| Lenovo Legion 5 Pro 16IAX10H | |
| Schenker XMG Pro 16 (E25) | |
* ... daha küçük daha iyidir
| Performance rating - Percent | |
| MSI Vector 17 HX AI A2XWIG | |
| Lenovo Legion 5 Pro 16IAX10H | |
| Schenker XMG Focus 17 M25 | |
| MSI Vector 16 HX AI A2XWHG -1! | |
| Schenker XMG Pro 16 (E25) | |
| Sınıf ortalaması Gaming | |
| Cyberpunk 2077 - 1920x1080 Ultra Preset (FSR off) | |
| MSI Vector 17 HX AI A2XWIG | |
| Lenovo Legion 5 Pro 16IAX10H | |
| Schenker XMG Pro 16 (E25) | |
| MSI Vector 16 HX AI A2XWHG | |
| Schenker XMG Focus 17 M25 | |
| Sınıf ortalaması Gaming (17.7 - 169.9, n=121, son 2 yıl) | |
| Baldur's Gate 3 - 1920x1080 Ultra Preset AA:T | |
| MSI Vector 17 HX AI A2XWIG | |
| Schenker XMG Pro 16 (E25) | |
| Schenker XMG Focus 17 M25 | |
| MSI Vector 16 HX AI A2XWHG | |
| Lenovo Legion 5 Pro 16IAX10H | |
| Sınıf ortalaması Gaming (59.4 - 246, n=107, son 2 yıl) | |
| GTA V - 1920x1080 Highest AA:4xMSAA + FX AF:16x | |
| Schenker XMG Pro 16 (E25) | |
| MSI Vector 17 HX AI A2XWIG | |
| Schenker XMG Focus 17 M25 | |
| Lenovo Legion 5 Pro 16IAX10H | |
| MSI Vector 16 HX AI A2XWHG | |
| Sınıf ortalaması Gaming (48.3 - 186.9, n=103, son 2 yıl) | |
| Final Fantasy XV Benchmark - 1920x1080 High Quality | |
| MSI Vector 17 HX AI A2XWIG | |
| Lenovo Legion 5 Pro 16IAX10H | |
| MSI Vector 16 HX AI A2XWHG | |
| Schenker XMG Focus 17 M25 | |
| Schenker XMG Pro 16 (E25) | |
| Sınıf ortalaması Gaming (41 - 215, n=104, son 2 yıl) | |
| Strange Brigade - 1920x1080 ultra AA:ultra AF:16 | |
| MSI Vector 17 HX AI A2XWIG | |
| Lenovo Legion 5 Pro 16IAX10H | |
| Schenker XMG Focus 17 M25 | |
| Sınıf ortalaması Gaming (76.3 - 456, n=94, son 2 yıl) | |
| Schenker XMG Pro 16 (E25) | |
| Dota 2 Reborn - 1920x1080 ultra (3/3) best looking | |
| Schenker XMG Pro 16 (E25) | |
| Lenovo Legion 5 Pro 16IAX10H | |
| MSI Vector 17 HX AI A2XWIG | |
| Schenker XMG Focus 17 M25 | |
| MSI Vector 16 HX AI A2XWHG | |
| Sınıf ortalaması Gaming (84.8 - 248, n=113, son 2 yıl) | |
| X-Plane 11.11 - 1920x1080 high (fps_test=3) | |
| Schenker XMG Focus 17 M25 | |
| Schenker XMG Pro 16 (E25) | |
| Lenovo Legion 5 Pro 16IAX10H | |
| MSI Vector 17 HX AI A2XWIG | |
| MSI Vector 16 HX AI A2XWHG | |
| Sınıf ortalaması Gaming (52.1 - 143.5, n=116, son 2 yıl) | |
| F1 24 - 2560x1440 Ultra High Preset AA:T AF:16x | |
| Schenker XMG Pro 16 (E25) | |
| Sınıf ortalaması Gaming (29.8 - 106.9, n=60, son 2 yıl) | |
| Schenker XMG Focus 17 M25 | |
| Ortalama NVIDIA GeForce RTX 5070 Ti Laptop (53.2 - 72.1, n=10) | |
| F1 25 - 2560x1440 Ultra Max Preset AA:T AF:16x | |
| Ortalama NVIDIA GeForce RTX 5070 Ti Laptop (18 - 26, n=7) | |
| Sınıf ortalaması Gaming (5 - 37.5, n=24, son 2 yıl) | |
| Lenovo Legion 5 Pro 16IAX10H | |
| Assassin's Creed Shadows - 2560x1440 Ultra High | |
| Schenker XMG Focus 17 M25 | |
| Sınıf ortalaması Gaming (22 - 64, n=48, son 2 yıl) | |
| Lenovo Legion 5 Pro 16IAX10H | |
| Ortalama NVIDIA GeForce RTX 5070 Ti Laptop (40 - 48, n=9) | |
Cyberpunk 2077 ultra FPS diagram
| düşük | orta | yüksek | ultra | QHD DLSS | QHD | |
|---|---|---|---|---|---|---|
| GTA V (2015) | 152.9 | 139.1 | ||||
| Dota 2 Reborn (2015) | 223 | 192.9 | 178.8 | 165.4 | ||
| Final Fantasy XV Benchmark (2018) | 223 | 197.6 | 156.8 | 129.5 | ||
| X-Plane 11.11 (2018) | 165 | 142.2 | 124.6 | |||
| Strange Brigade (2018) | 438 | 362 | 328 | 303 | 229 | |
| Baldur's Gate 3 (2023) | 202.6 | 172.8 | 154.2 | 153.9 | 108.6 | |
| Cyberpunk 2077 (2023) | 149.4 | 139.8 | 126.4 | 115.7 | 93.9 | 81 |
| F1 24 (2024) | 247 | 236 | 232 | 98.7 | 98.4 | 66.4 |
| Assassin's Creed Shadows (2025) | 90 | 84 | 72 | 55 | 47 |
Emisyonlar ve enerji
Gürültü emisyonları
Günlük kullanımda, hızlı güç profili kullanıldığında bile iki fan genellikle çok sessiz kalır ve yük aşaması sona erdikten sonra fan hızı da çok hızlı bir şekilde düşer. En hızlı modda oyun oynarken 56,2 dB(A) ile çok yüksek ses çıkar ve kulaklık kullanılması önerilir. Sessiz mod ise maksimum 37 dB(A) ile çok sessizdir ve oyun performansı hala kabul edilebilir düzeydedir. İnceleme ünitesinde başka hiçbir elektronik ses tespit edilmedi.
Ses yüksekliği
| Boşta |
| 24.8 / 24.8 / 27.7 dB |
| Çalışırken |
| 51 / 56.2 dB |
 | ||
30 dB sessiz 40 dB(A) duyulabilirlik 50 dB(A) gürültülü |
||
min: | ||
| Schenker XMG Focus 17 M25 GeForce RTX 5070 Ti Laptop, i9-13900HX, Kingston Fury Renegade SFYRS500G | MSI Vector 17 HX AI A2XWIG GeForce RTX 5080 Laptop, Ultra 9 275HX, Western Digital PC SN5000S SDEPNSJ-2T00-1032 | Lenovo Legion 5 Pro 16IAX10H GeForce RTX 5070 Ti Laptop, Ultra 9 275HX, Western Digital PC SN8000S SDEPNRK-1T00 | MSI Vector 16 HX AI A2XWHG GeForce RTX 5070 Ti Laptop, Ultra 7 255HX, Micron 2400 MTFDKBA512QFM | Schenker XMG Pro 16 (E25) GeForce RTX 5070 Ti Laptop, Ultra 9 275HX, Samsung 9100 Pro 1 TB | |
|---|---|---|---|---|---|
| Noise | -0% | -2% | -10% | 5% | |
| kapalı / ortam * (dB) | 24.8 | 24 3% | 24 3% | 25 -1% | 23.3 6% |
| Idle Minimum * (dB) | 24.8 | 24 3% | 24 3% | 33 -33% | 25 -1% |
| Idle Average * (dB) | 24.8 | 30.82 -24% | 24 3% | 34 -37% | 25 -1% |
| Idle Maximum * (dB) | 27.7 | 31.31 -13% | 30.9 -12% | 38 -37% | 25 10% |
| Load Average * (dB) | 51 | 31.12 39% | 55.9 -10% | 46 10% | 45.5 11% |
| Cyberpunk 2077 ultra * (dB) | 56.2 | 59.24 -5% | 56.72 -1% | 47 16% | 53.3 5% |
| Load Maximum * (dB) | 56.2 | 59.24 -5% | 56.72 -1% | 49 13% | 53.3 5% |
* ... daha küçük daha iyidir
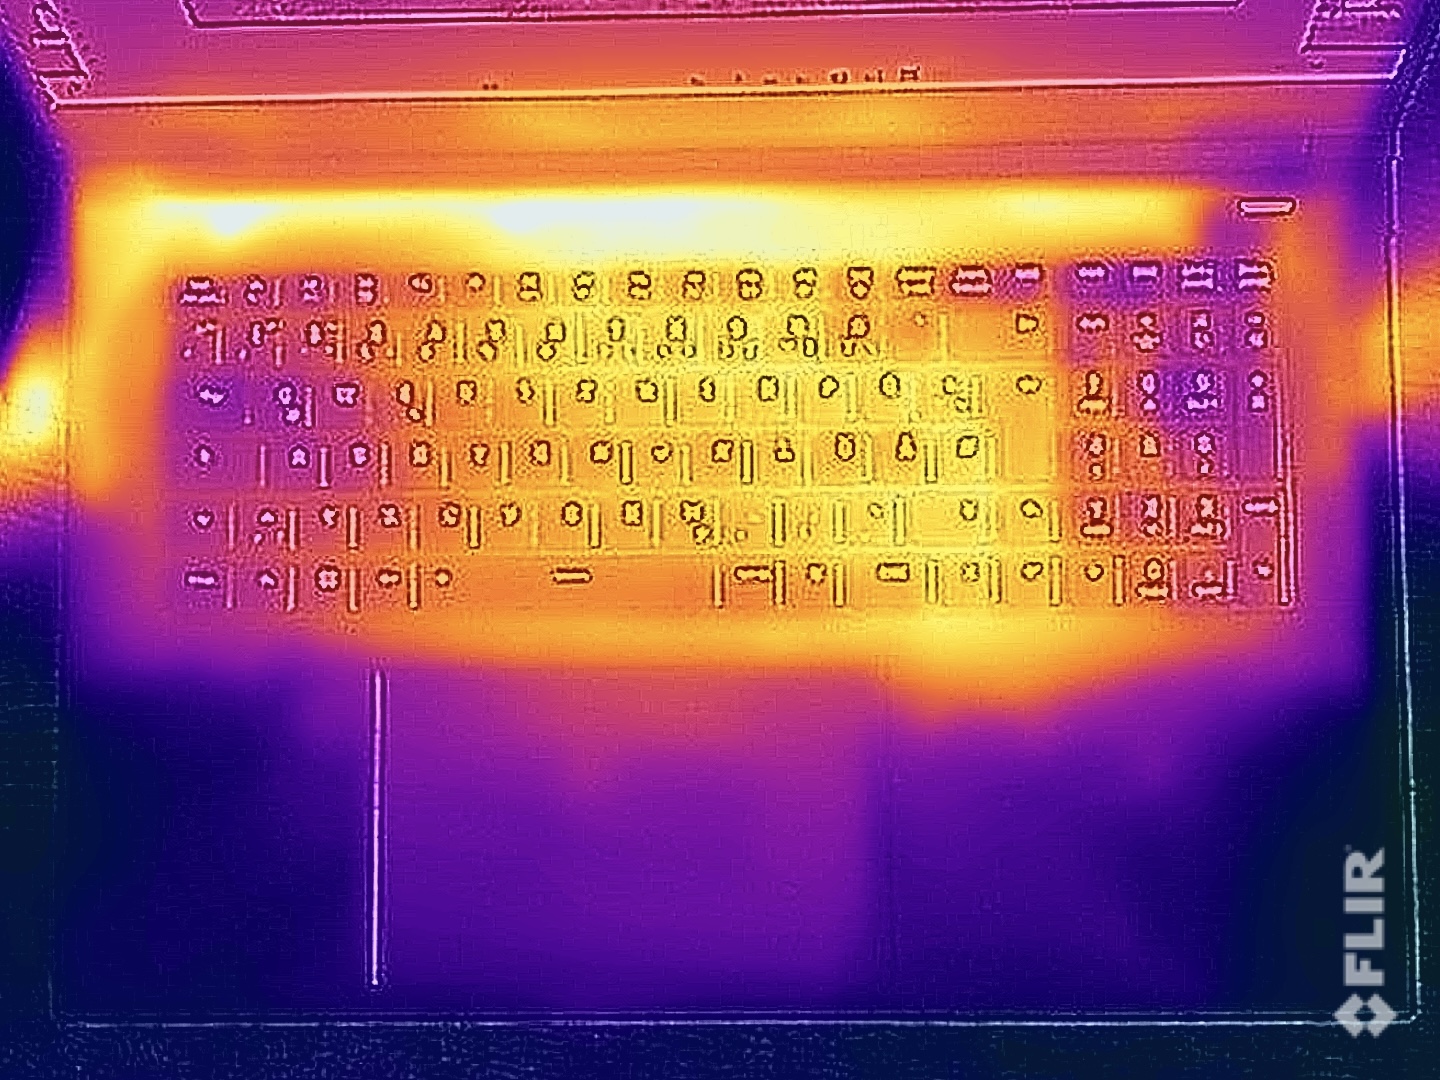
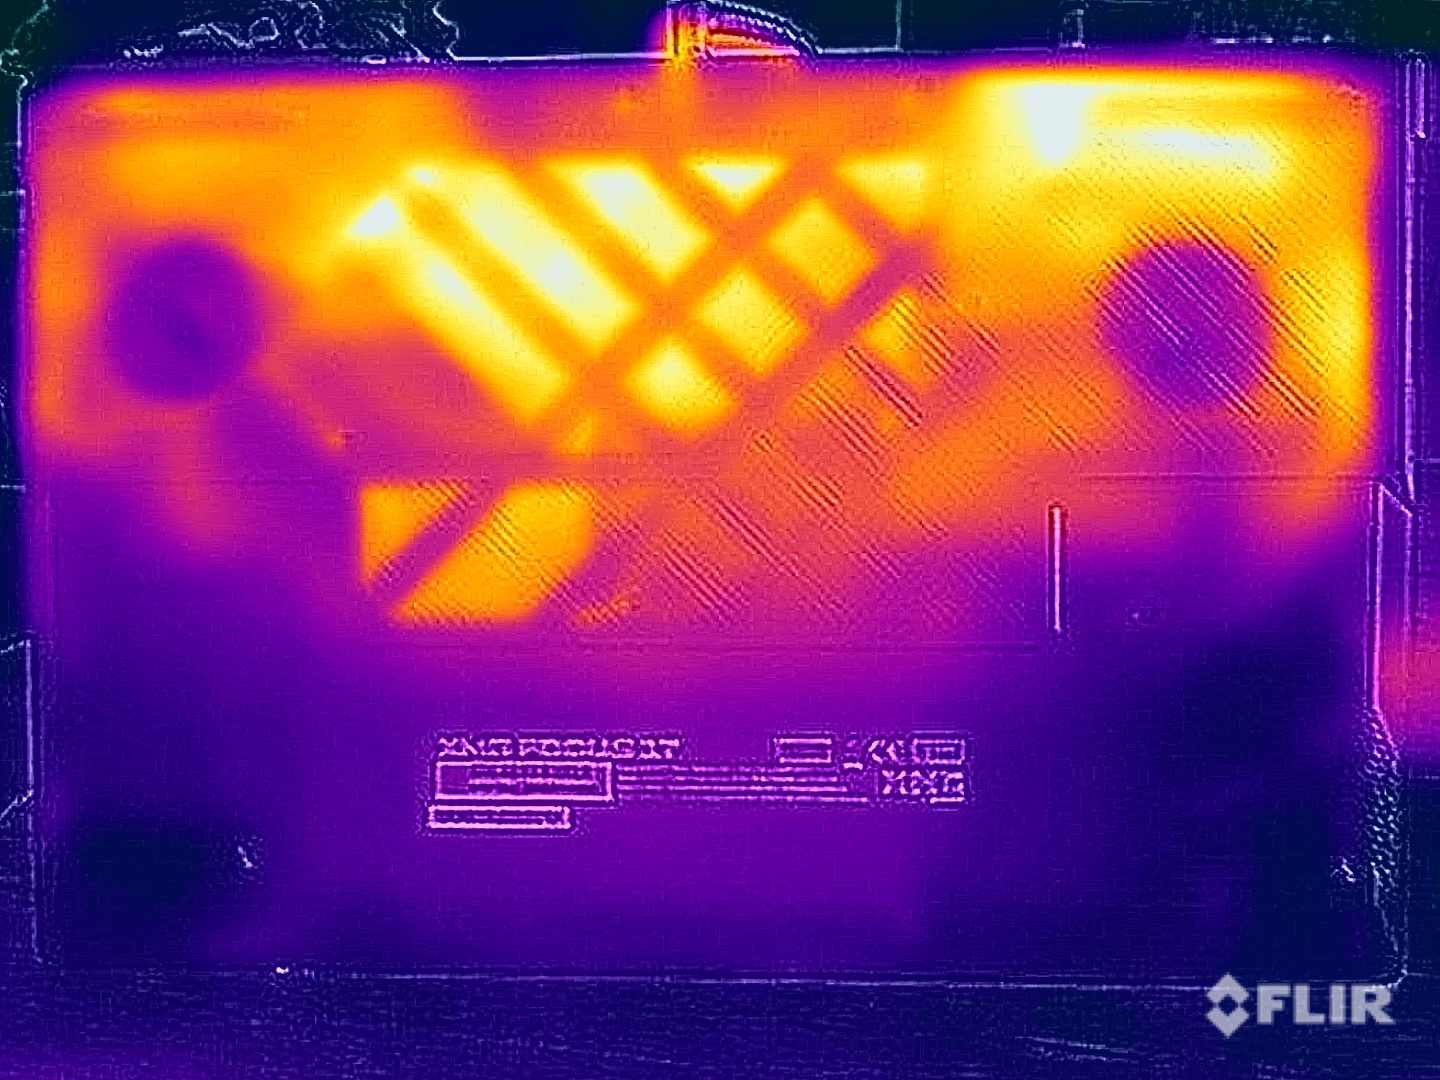
Sıcaklık
Yüzey sıcaklıkları sorunsuz ve özellikle klavye oyun oynarken bile çok ısınmıyor. Alt panel maksimum 48°C'ye ulaşsa da, boyutu göz önüne alındığında, muhtemelen Focus 17'yi kucağınıza koymayacaksınız. Stres testinde GPU yaklaşık 130 watt (81°C) ve CPU 45 watt (77°C) ile çalıştı.
(±) Üst taraftaki maksimum sıcaklık, 40.4 °C / 105 F ortalamasına kıyasla 41.2 °C / 106 F'dir. , Gaming sınıfı için 21.2 ile 68.8 °C arasında değişir.
(-) Alt kısım, 43.2 °C / 110 F ortalamasına kıyasla maksimum 48.8 °C / 120 F'ye kadar ısınır
(+) Boşta kullanımda, üst tarafın ortalama sıcaklığı 26.6 °C / 80 F olup, cihazın 33.9 °C / 93 F.
(±) 3: The average temperature for the upper side is 35.6 °C / 96 F, compared to the average of 33.9 °C / 93 F for the class Gaming.
(+) Avuç içi dayanakları ve dokunmatik yüzey, maksimum 28 °C / 82.4 F ile cilt sıcaklığından daha soğuktur ve bu nedenle dokunulduğunda soğuktur.
(±) Benzer cihazların avuç içi dayanağı alanının ortalama sıcaklığı 28.8 °C / 83.8 F (+0.8 °C / 1.4 F) idi.
| Schenker XMG Focus 17 M25 Intel Core i9-13900HX, NVIDIA GeForce RTX 5070 Ti Laptop | MSI Vector 17 HX AI A2XWIG Intel Core Ultra 9 275HX, NVIDIA GeForce RTX 5080 Laptop | Lenovo Legion 5 Pro 16IAX10H Intel Core Ultra 9 275HX, NVIDIA GeForce RTX 5070 Ti Laptop | MSI Vector 16 HX AI A2XWHG Intel Core Ultra 7 255HX, NVIDIA GeForce RTX 5070 Ti Laptop | Schenker XMG Pro 16 (E25) Intel Core Ultra 9 275HX, NVIDIA GeForce RTX 5070 Ti Laptop | |
|---|---|---|---|---|---|
| Heat | -24% | -24% | -13% | -194% | |
| Maximum Upper Side * (°C) | 41.2 | 53 -29% | 48 -17% | 53 -29% | 43.2 -5% |
| Maximum Bottom * (°C) | 48.8 | 54 -11% | 50 -2% | 52 -7% | 46 6% |
| Idle Upper Side * (°C) | 27.6 | 39 -41% | 38 -38% | 33 -20% | 27.7 -0% |
| Idle Bottom * (°C) | 30.1 | 34 -13% | 42 -40% | 29 4% | 264 -777% |
* ... daha küçük daha iyidir
Konuşmacılar
İki stereo hoparlör, sesin çok ince görünmesi ve düşük maksimum ses seviyesi ile etkileyici değildir.
Schenker XMG Focus 17 M25 ses analizi
(±) | hoparlör ses yüksekliği ortalama ama iyi (78.5 dB)
Bas 100 - 315Hz
(-) | neredeyse hiç bas yok - ortalama olarak medyandan 21.9% daha düşük
(±) | Bas doğrusallığı ortalamadır (13.4% delta - önceki frekans)
Ortalar 400 - 2000 Hz
(+) | dengeli ortalar - medyandan yalnızca 2.8% uzakta
(±) | Ortaların doğrusallığı ortalamadır (7.3% delta - önceki frekans)
Yüksekler 2 - 16 kHz
(+) | dengeli yüksekler - medyandan yalnızca 3.9% uzakta
(+) | yüksekler doğrusaldır (5.8% deltadan önceki frekansa)
Toplam 100 - 16.000 Hz
(±) | Genel sesin doğrusallığı ortalamadır (18.8% ortancaya göre fark)
Aynı sınıfla karşılaştırıldığında
» Bu sınıftaki tüm test edilen cihazların %62%'si daha iyi, 8% benzer, 30% daha kötüydü
» En iyisinin deltası 6% idi, ortalama 18% idi, en kötüsü 132% idi
Test edilen tüm cihazlarla karşılaştırıldığında
» Test edilen tüm cihazların %43'si daha iyi, 8 benzer, % 49 daha kötüydü
» En iyisinin deltası 4% idi, ortalama 24% idi, en kötüsü 134% idi
MSI Vector 17 HX AI A2XWIG ses analizi
(±) | hoparlör ses yüksekliği ortalama ama iyi (80.39 dB)
Bas 100 - 315Hz
(±) | azaltılmış bas - ortalama olarak medyandan 10.4% daha düşük
(±) | Bas doğrusallığı ortalamadır (7.4% delta - önceki frekans)
Ortalar 400 - 2000 Hz
(±) | daha yüksek ortalar - ortalama olarak medyandan 6.2% daha yüksek
(+) | orta frekanslar doğrusaldır (4.7% deltadan önceki frekansa)
Yüksekler 2 - 16 kHz
(+) | dengeli yüksekler - medyandan yalnızca 4.3% uzakta
(±) | Yükseklerin doğrusallığı ortalamadır (8.7% delta - önceki frekans)
Toplam 100 - 16.000 Hz
(±) | Genel sesin doğrusallığı ortalamadır (15.6% ortancaya göre fark)
Aynı sınıfla karşılaştırıldığında
» Bu sınıftaki tüm test edilen cihazların %36%'si daha iyi, 6% benzer, 58% daha kötüydü
» En iyisinin deltası 6% idi, ortalama 18% idi, en kötüsü 132% idi
Test edilen tüm cihazlarla karşılaştırıldığında
» Test edilen tüm cihazların %23'si daha iyi, 5 benzer, % 72 daha kötüydü
» En iyisinin deltası 4% idi, ortalama 24% idi, en kötüsü 134% idi
Lenovo Legion 5 Pro 16IAX10H ses analizi
(±) | hoparlör ses yüksekliği ortalama ama iyi (78.2 dB)
Bas 100 - 315Hz
(-) | neredeyse hiç bas yok - ortalama olarak medyandan 21.1% daha düşük
(±) | Bas doğrusallığı ortalamadır (8% delta - önceki frekans)
Ortalar 400 - 2000 Hz
(±) | daha yüksek ortalar - ortalama olarak medyandan 6.3% daha yüksek
(+) | orta frekanslar doğrusaldır (6.5% deltadan önceki frekansa)
Yüksekler 2 - 16 kHz
(+) | dengeli yüksekler - medyandan yalnızca 1.6% uzakta
(+) | yüksekler doğrusaldır (4.9% deltadan önceki frekansa)
Toplam 100 - 16.000 Hz
(±) | Genel sesin doğrusallığı ortalamadır (18.3% ortancaya göre fark)
Aynı sınıfla karşılaştırıldığında
» Bu sınıftaki tüm test edilen cihazların %58%'si daha iyi, 9% benzer, 33% daha kötüydü
» En iyisinin deltası 6% idi, ortalama 18% idi, en kötüsü 132% idi
Test edilen tüm cihazlarla karşılaştırıldığında
» Test edilen tüm cihazların %40'si daha iyi, 8 benzer, % 52 daha kötüydü
» En iyisinin deltası 4% idi, ortalama 24% idi, en kötüsü 134% idi
MSI Vector 16 HX AI A2XWHG ses analizi
(+) | hoparlörler nispeten yüksek sesle çalabilir (86 dB)
Bas 100 - 315Hz
(±) | azaltılmış bas - ortalama olarak medyandan 12.3% daha düşük
(±) | Bas doğrusallığı ortalamadır (8.5% delta - önceki frekans)
Ortalar 400 - 2000 Hz
(±) | daha yüksek ortalar - ortalama olarak medyandan 9.9% daha yüksek
(+) | orta frekanslar doğrusaldır (6.8% deltadan önceki frekansa)
Yüksekler 2 - 16 kHz
(+) | dengeli yüksekler - medyandan yalnızca 1.8% uzakta
(+) | yüksekler doğrusaldır (2.9% deltadan önceki frekansa)
Toplam 100 - 16.000 Hz
(±) | Genel sesin doğrusallığı ortalamadır (15.8% ortancaya göre fark)
Aynı sınıfla karşılaştırıldığında
» Bu sınıftaki tüm test edilen cihazların %37%'si daha iyi, 7% benzer, 56% daha kötüydü
» En iyisinin deltası 6% idi, ortalama 18% idi, en kötüsü 132% idi
Test edilen tüm cihazlarla karşılaştırıldığında
» Test edilen tüm cihazların %24'si daha iyi, 5 benzer, % 71 daha kötüydü
» En iyisinin deltası 4% idi, ortalama 24% idi, en kötüsü 134% idi
Schenker XMG Pro 16 (E25) ses analizi
(±) | hoparlör ses yüksekliği ortalama ama iyi (79.2 dB)
Bas 100 - 315Hz
(±) | azaltılmış bas - ortalama olarak medyandan 14.2% daha düşük
(±) | Bas doğrusallığı ortalamadır (10.6% delta - önceki frekans)
Ortalar 400 - 2000 Hz
(±) | daha yüksek ortalar - ortalama olarak medyandan 8.2% daha yüksek
(±) | Ortaların doğrusallığı ortalamadır (9.9% delta - önceki frekans)
Yüksekler 2 - 16 kHz
(+) | dengeli yüksekler - medyandan yalnızca 3.8% uzakta
(+) | yüksekler doğrusaldır (5.9% deltadan önceki frekansa)
Toplam 100 - 16.000 Hz
(±) | Genel sesin doğrusallığı ortalamadır (18.5% ortancaya göre fark)
Aynı sınıfla karşılaştırıldığında
» Bu sınıftaki tüm test edilen cihazların %60%'si daha iyi, 8% benzer, 32% daha kötüydü
» En iyisinin deltası 6% idi, ortalama 18% idi, en kötüsü 132% idi
Test edilen tüm cihazlarla karşılaştırıldığında
» Test edilen tüm cihazların %41'si daha iyi, 8 benzer, % 51 daha kötüydü
» En iyisinin deltası 4% idi, ortalama 24% idi, en kötüsü 134% idi
Güç tüketimi
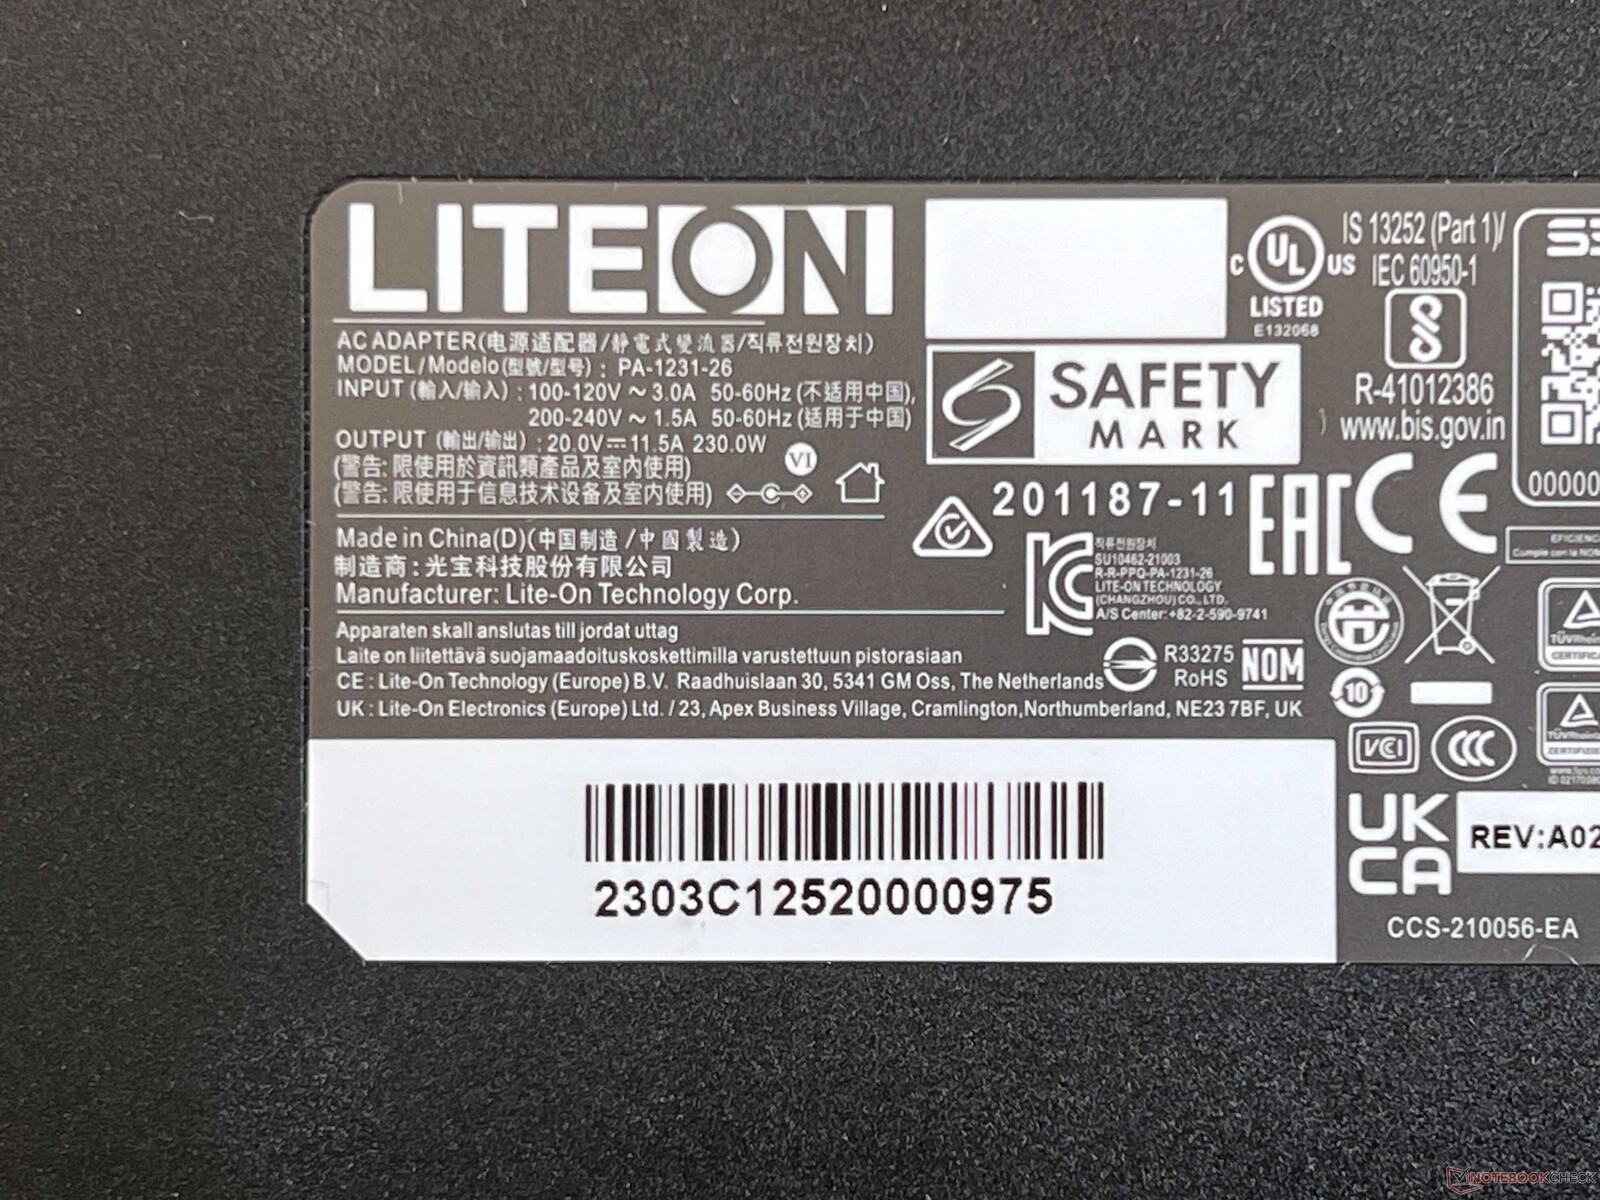
Focus boşta çalışırken maksimum 18 watt ile oldukça ekonomik kaldı. Bununla birlikte, tam yük altında 290 watt'a kadar ölçüm yaptık ve daha sonra yaklaşık 245 watt'a yerleşti. Oyun oynarken 255 watt'a bile ulaştı. Pakette yalnızca 230 watt'lık bir güç kaynağı bulunduğu için bu biraz sorunlu bir durum. Batarya yük altında boşalmasa da 280 watt'lık bir güç kaynağı daha iyi bir seçim olabilirdi.
| Kapalı / Bekleme modu | |
| Boşta | |
| Çalışırken |
|
Key:
min: | |
| Schenker XMG Focus 17 M25 GeForce RTX 5070 Ti Laptop, i9-13900HX, Kingston Fury Renegade SFYRS500G | MSI Vector 17 HX AI A2XWIG GeForce RTX 5080 Laptop, Ultra 9 275HX, Western Digital PC SN5000S SDEPNSJ-2T00-1032 | Lenovo Legion 5 Pro 16IAX10H GeForce RTX 5070 Ti Laptop, Ultra 9 275HX, Western Digital PC SN8000S SDEPNRK-1T00 | MSI Vector 16 HX AI A2XWHG GeForce RTX 5070 Ti Laptop, Ultra 7 255HX, Micron 2400 MTFDKBA512QFM | Schenker XMG Pro 16 (E25) GeForce RTX 5070 Ti Laptop, Ultra 9 275HX, Samsung 9100 Pro 1 TB | |
|---|---|---|---|---|---|
| Power Consumption | -0% | -9% | -1% | 2% | |
| Idle Minimum * (Watt) | 12 | 10 17% | 14 -17% | 7.1 41% | 11.7 2% |
| Idle Average * (Watt) | 17.5 | 15.4 12% | 14.3 18% | 15.9 9% | 16.6 5% |
| Idle Maximum * (Watt) | 18.1 | 18.7 -3% | 20.1 -11% | 29.5 -63% | 17.1 6% |
| Load Average * (Watt) | 121.1 | 89.7 26% | 177 -46% | 124 -2% | 122.4 -1% |
| Cyberpunk 2077 ultra * (Watt) | 255 | 308 -21% | 255 -0% | 222 13% | 245 4% |
| Cyberpunk 2077 ultra external monitor * (Watt) | 244 | 300 -23% | 255 -5% | 217 11% | 241 1% |
| Load Maximum * (Watt) | 292.1 | 321 -10% | 294 -1% | 336 -15% | 291.5 -0% |
* ... daha küçük daha iyidir
Power consumption Cyberpunk / stress test
Power consumption with an external monitor
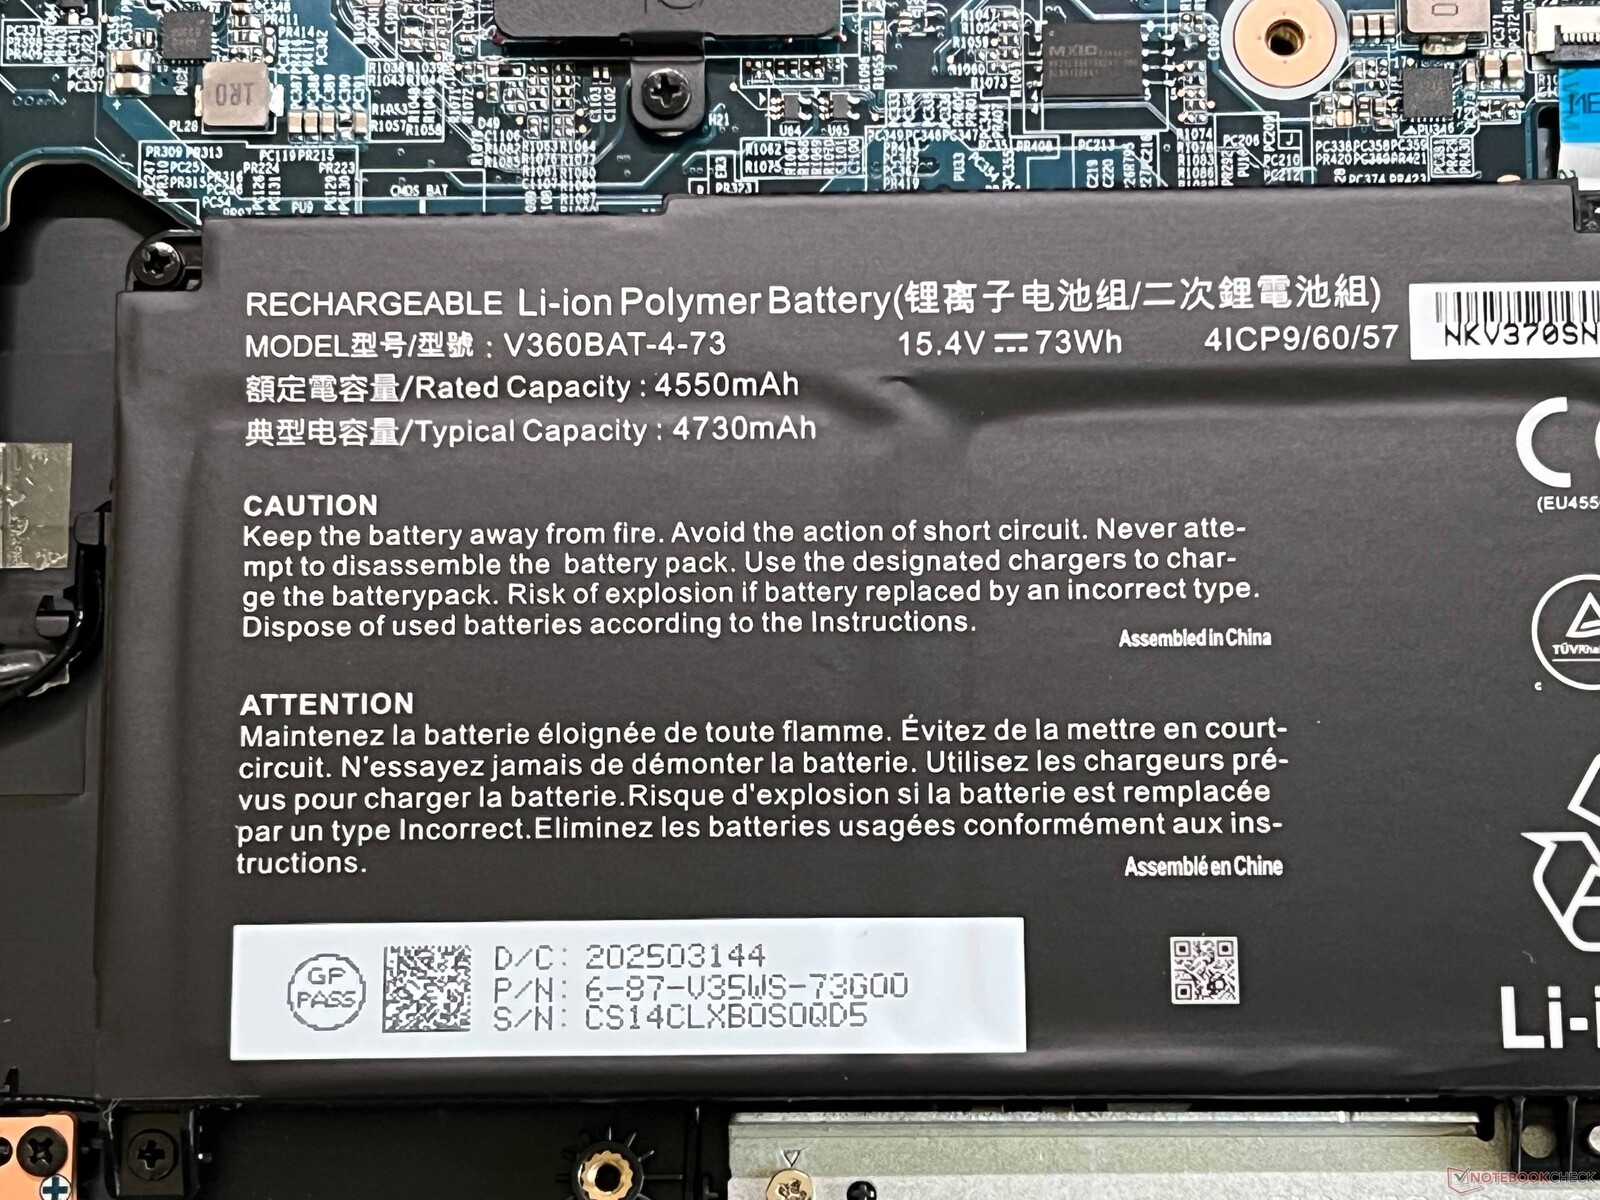
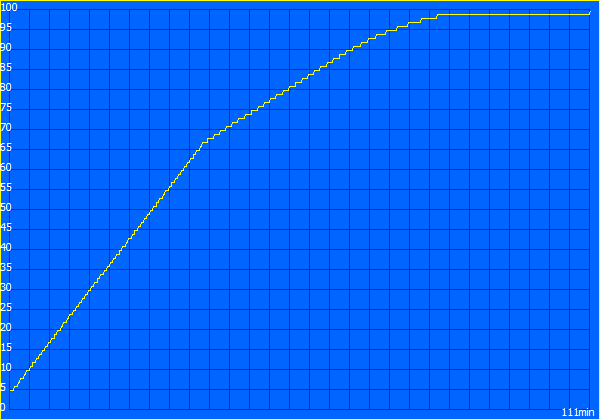
Pil ömrü
73 Wh pil ile pil ömrü sadece ortalama olarak tanımlanabilir. Wi-Fi testimizde 150 cd/m²'de (maksimum parlaklığın %35'i) 6 saatin biraz altında, tam parlaklıkta ise 4,5 saat ölçtük.
Notebookcheck genel değerlendirmesi
Schenker XMG Focus 17 M25
- 08/04/2025 v8
Andreas Osthoff
 Total Sustainability Score:
 Karşılaştırılan olası alternatifler
Şeffaflık
İncelenecek cihazların seçimi editör ekibimiz tarafından yapılır. Test örneği, bu incelemenin amacı doğrultusunda üretici veya perakendeci tarafından yazara ödünç olarak sağlanmıştır. Borç verenin bu inceleme üzerinde herhangi bir etkisi olmadığı gibi, üretici de yayınlanmadan önce bu incelemenin bir kopyasını almamıştır. Bu incelemeyi yayınlama zorunluluğu yoktu. Bağımsız bir medya şirketi olarak Notebookcheck, üreticilerin, perakendecilerin veya yayıncıların otoritesine tabi değildir.
Notebookcheck bu şekilde test yapıyor
Notebookcheck, tüm sonuçların karşılaştırılabilir olmasını sağlamak için her yıl yüzlerce dizüstü bilgisayarı ve akıllı telefonu standart prosedürler kullanarak bağımsız olarak inceliyor. Yaklaşık 20 yıldır test yöntemlerimizi sürekli olarak geliştirdik ve bu süreçte endüstri standartlarını belirledik. Test laboratuvarlarımızda deneyimli teknisyenler ve editörler tarafından yüksek kaliteli ölçüm ekipmanları kullanılmaktadır. Bu testler çok aşamalı bir doğrulama sürecini içerir. Karmaşık derecelendirme sistemimiz, nesnelliği koruyan yüzlerce sağlam temellere dayanan ölçüm ve kıyaslamaya dayanmaktadır.