Karar - iyi, ama rekabeti geride bırakacak kadar iyi mi?
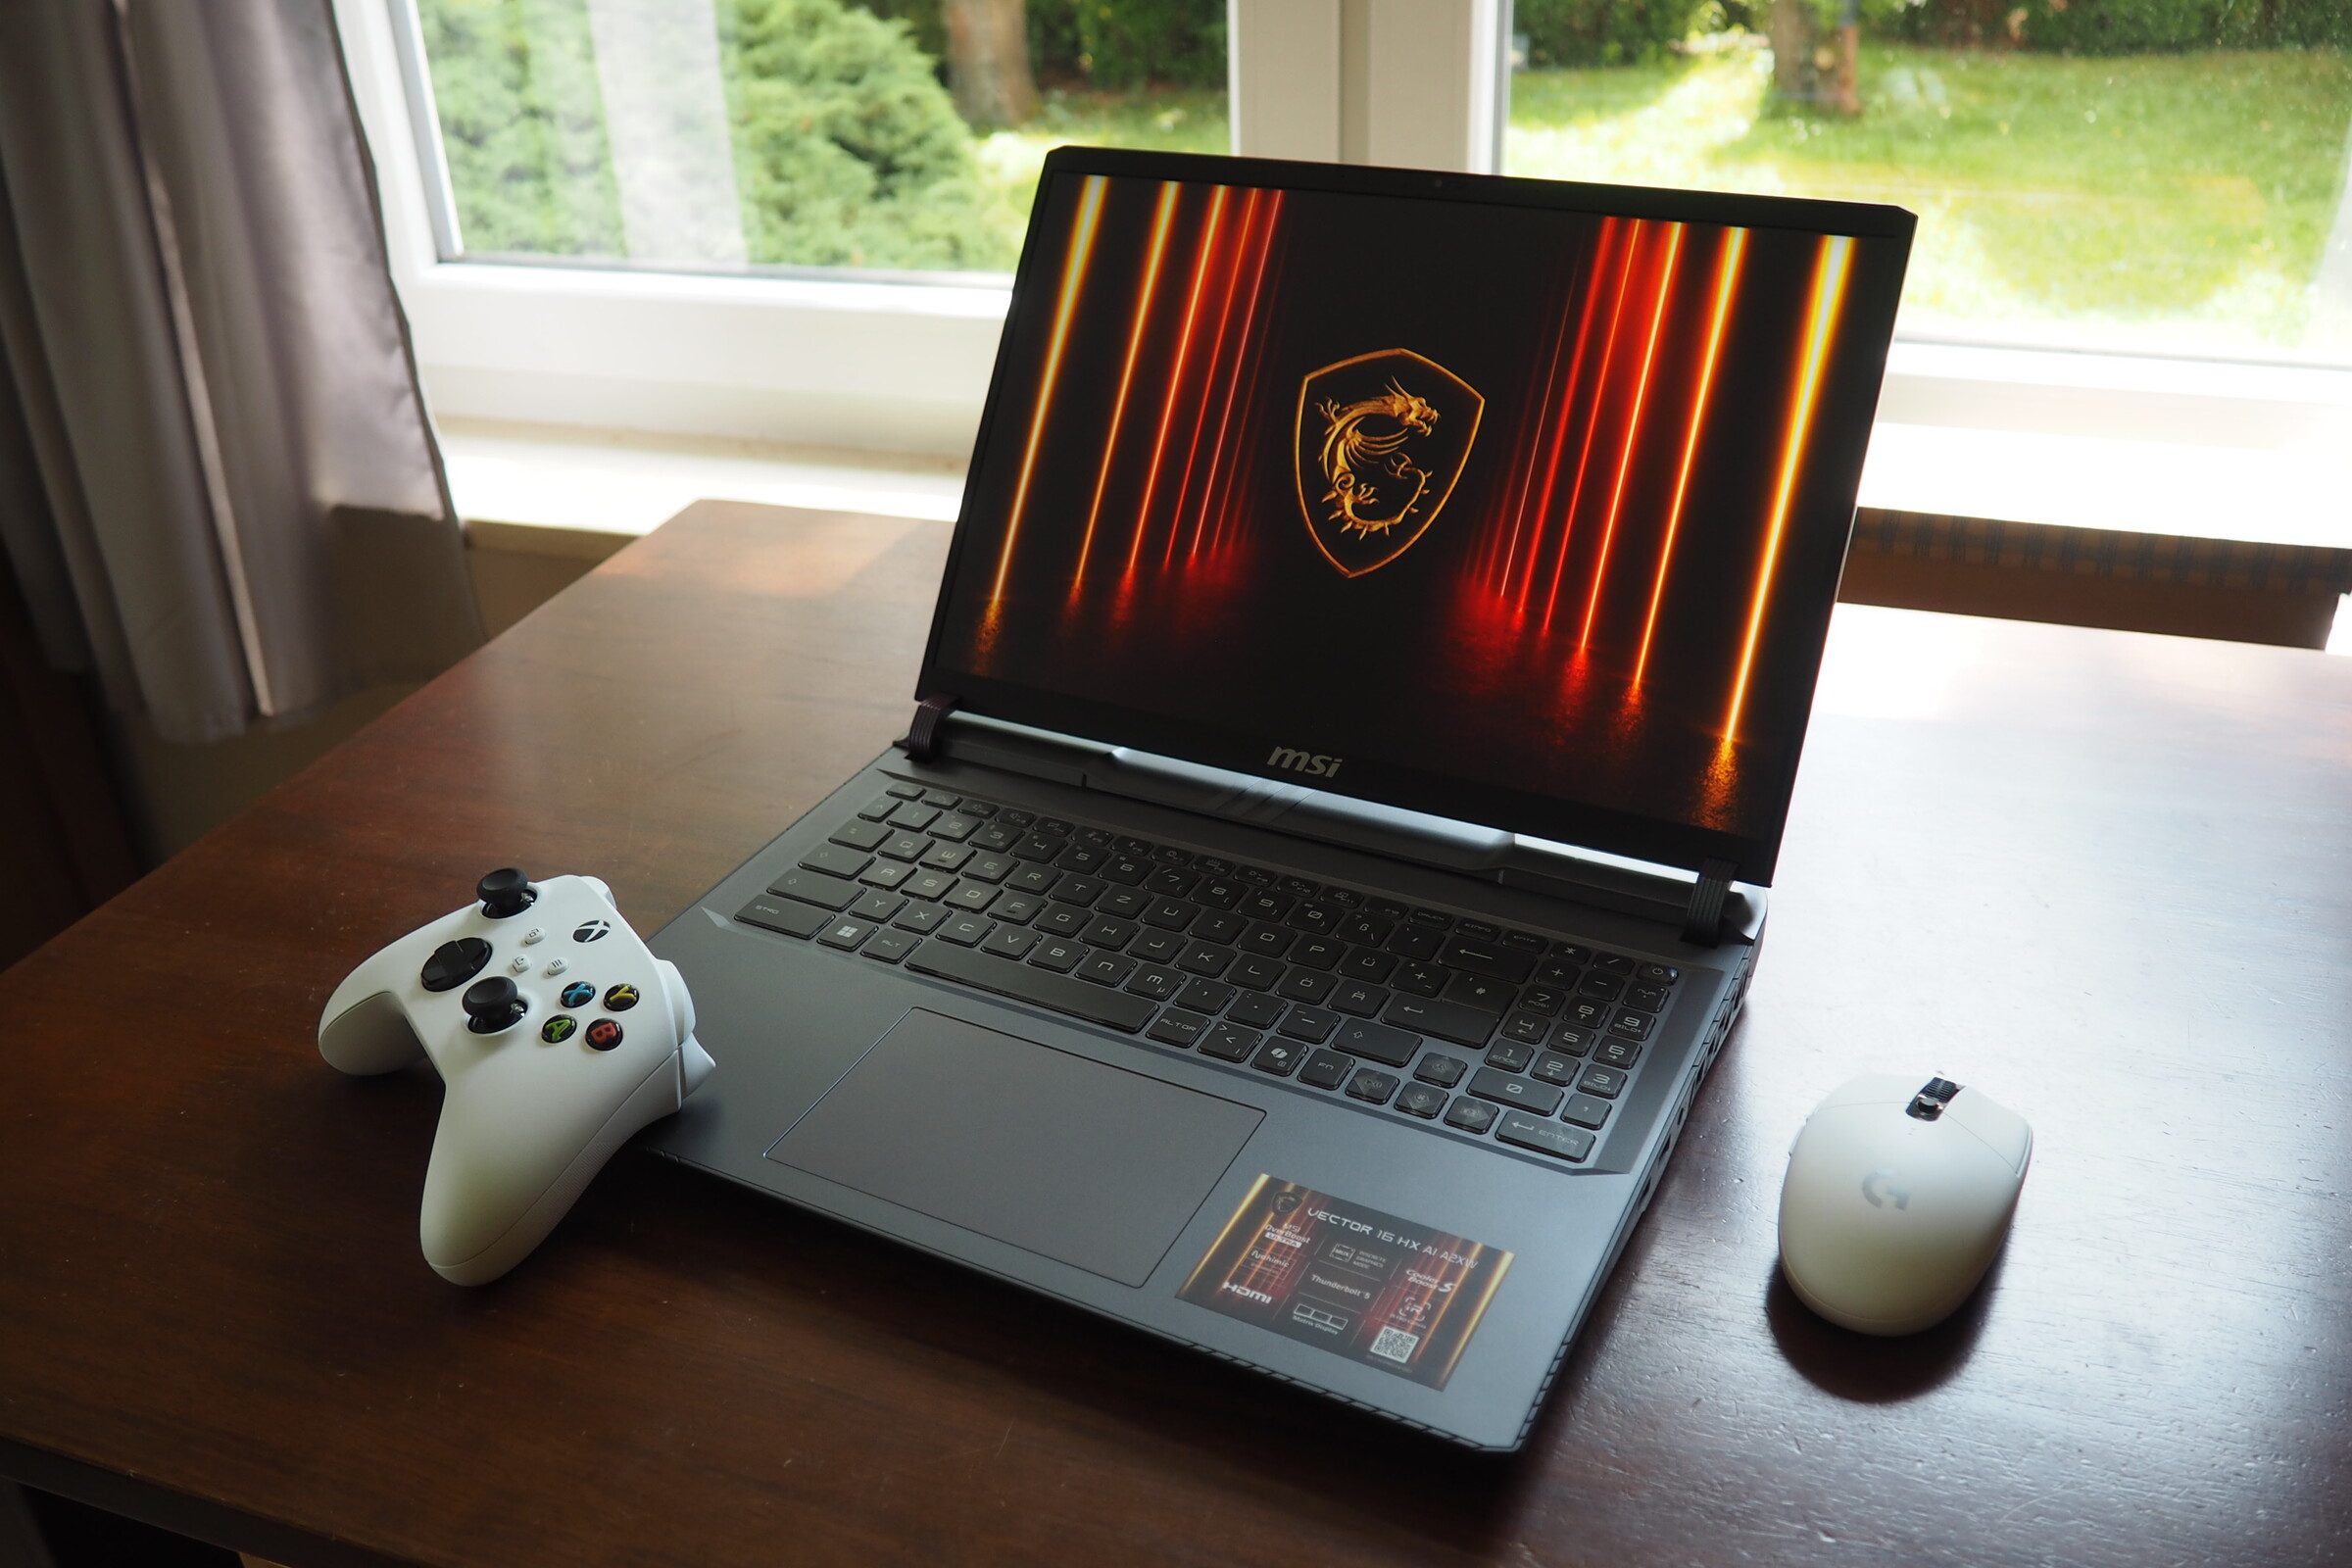
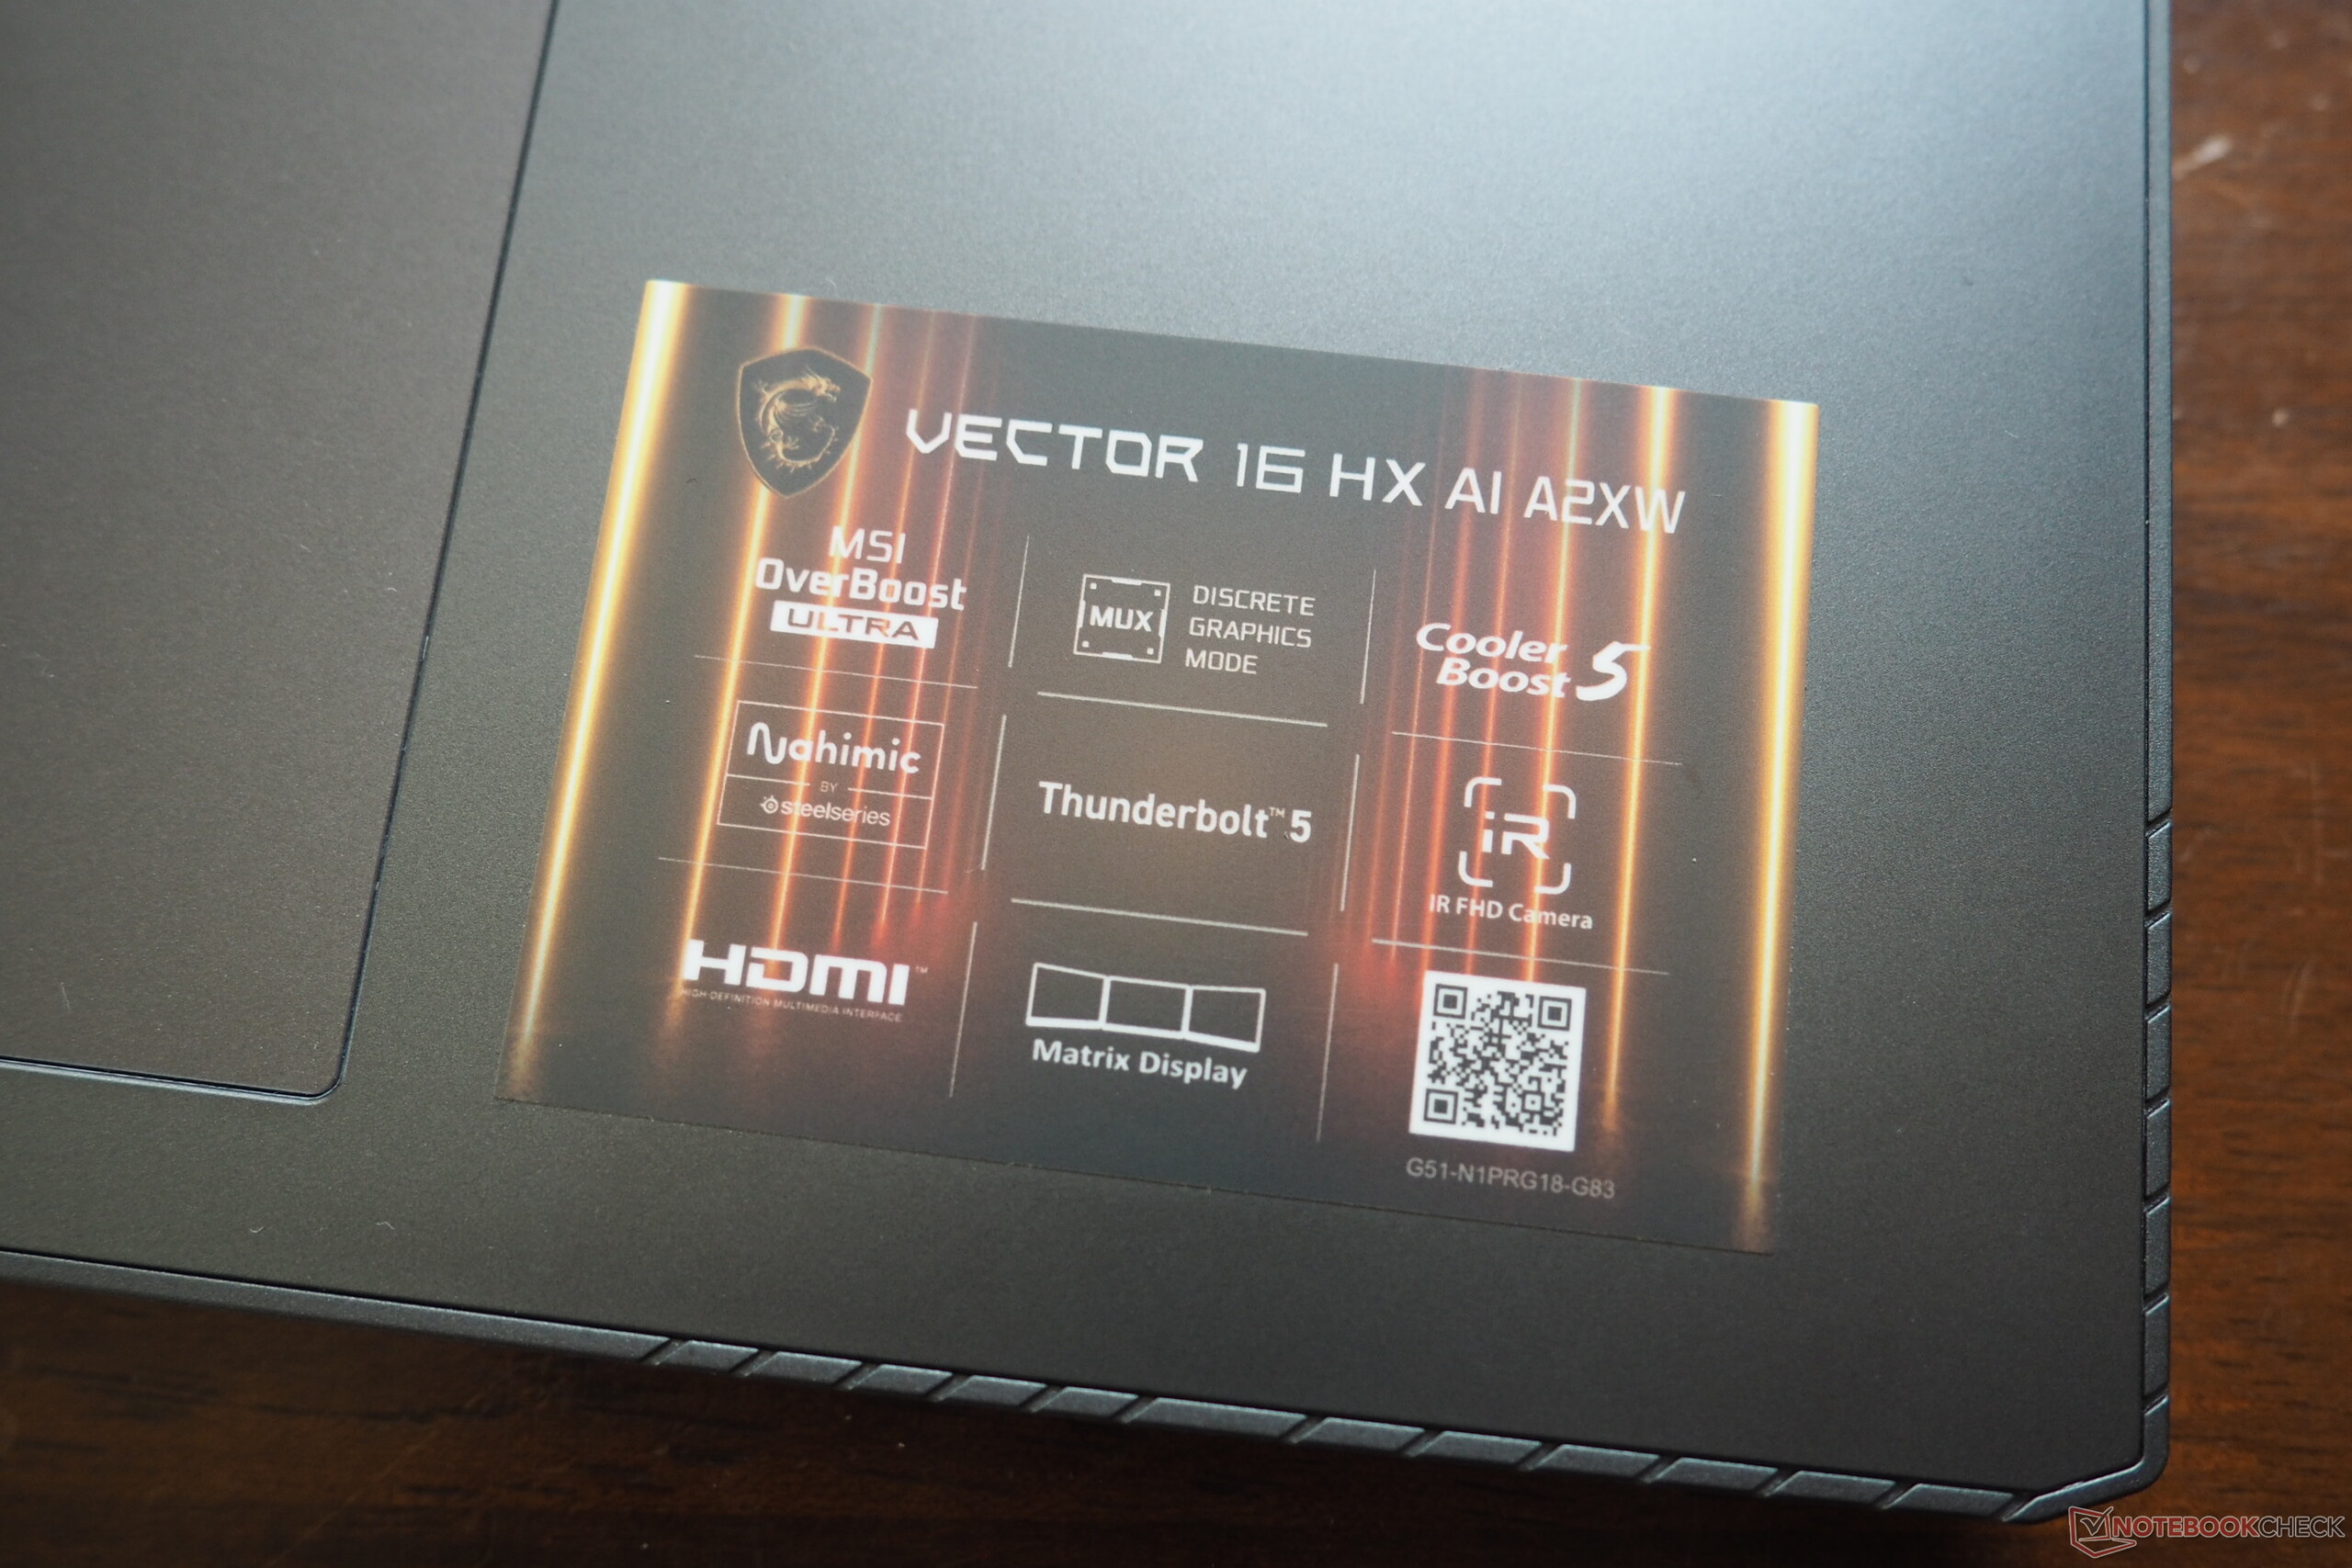
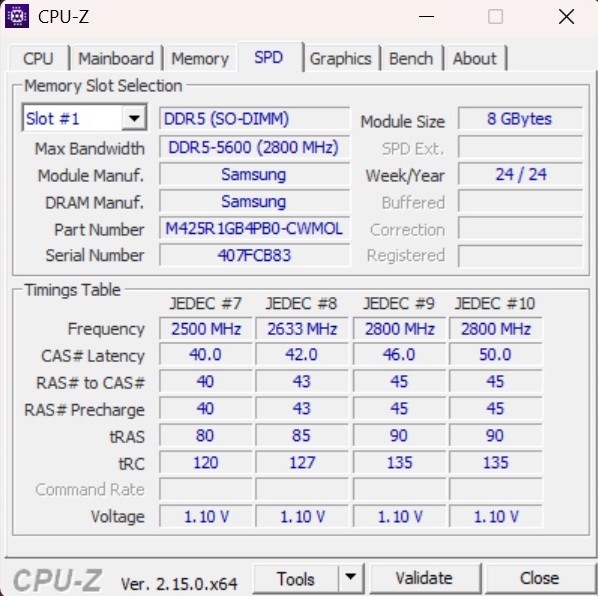
İlk bakışta MSI, Vector 16 HX AI ile yüksek puan alıyor. Test edilen A2XWHG(074) konfigürasyonu yaklaşık 2.000 € fiyatla güçlü bir özellik seti sunuyor, ancak nispeten mütevazı 512 GB SSD dikkate değer bir sınırlama olarak göze çarpıyor. 16 GB DDR5-5600 RAM (2x 8 GB SO-DIMM) büyük bir heyecan yaratmasa da Core Ultra 7 255HX ve 12 GB GDDR7 VRAM'e sahip GeForce RTX 5070 Ti, bol miktarda oyun gücü vaat ediyor. IPS ekran, keskin 2.560 x 1.600 çözünürlüğü, akıcı 240 hertz yenileme hızı ve sRGB ve DCI-P3 renk alanlarının neredeyse tamamını kapsamasıyla etkileyicidir. Öne çıkan özellikler arasında iki Thunderbolt 5 bağlantı noktası içeren bol miktarda bağlantı yer alıyor.
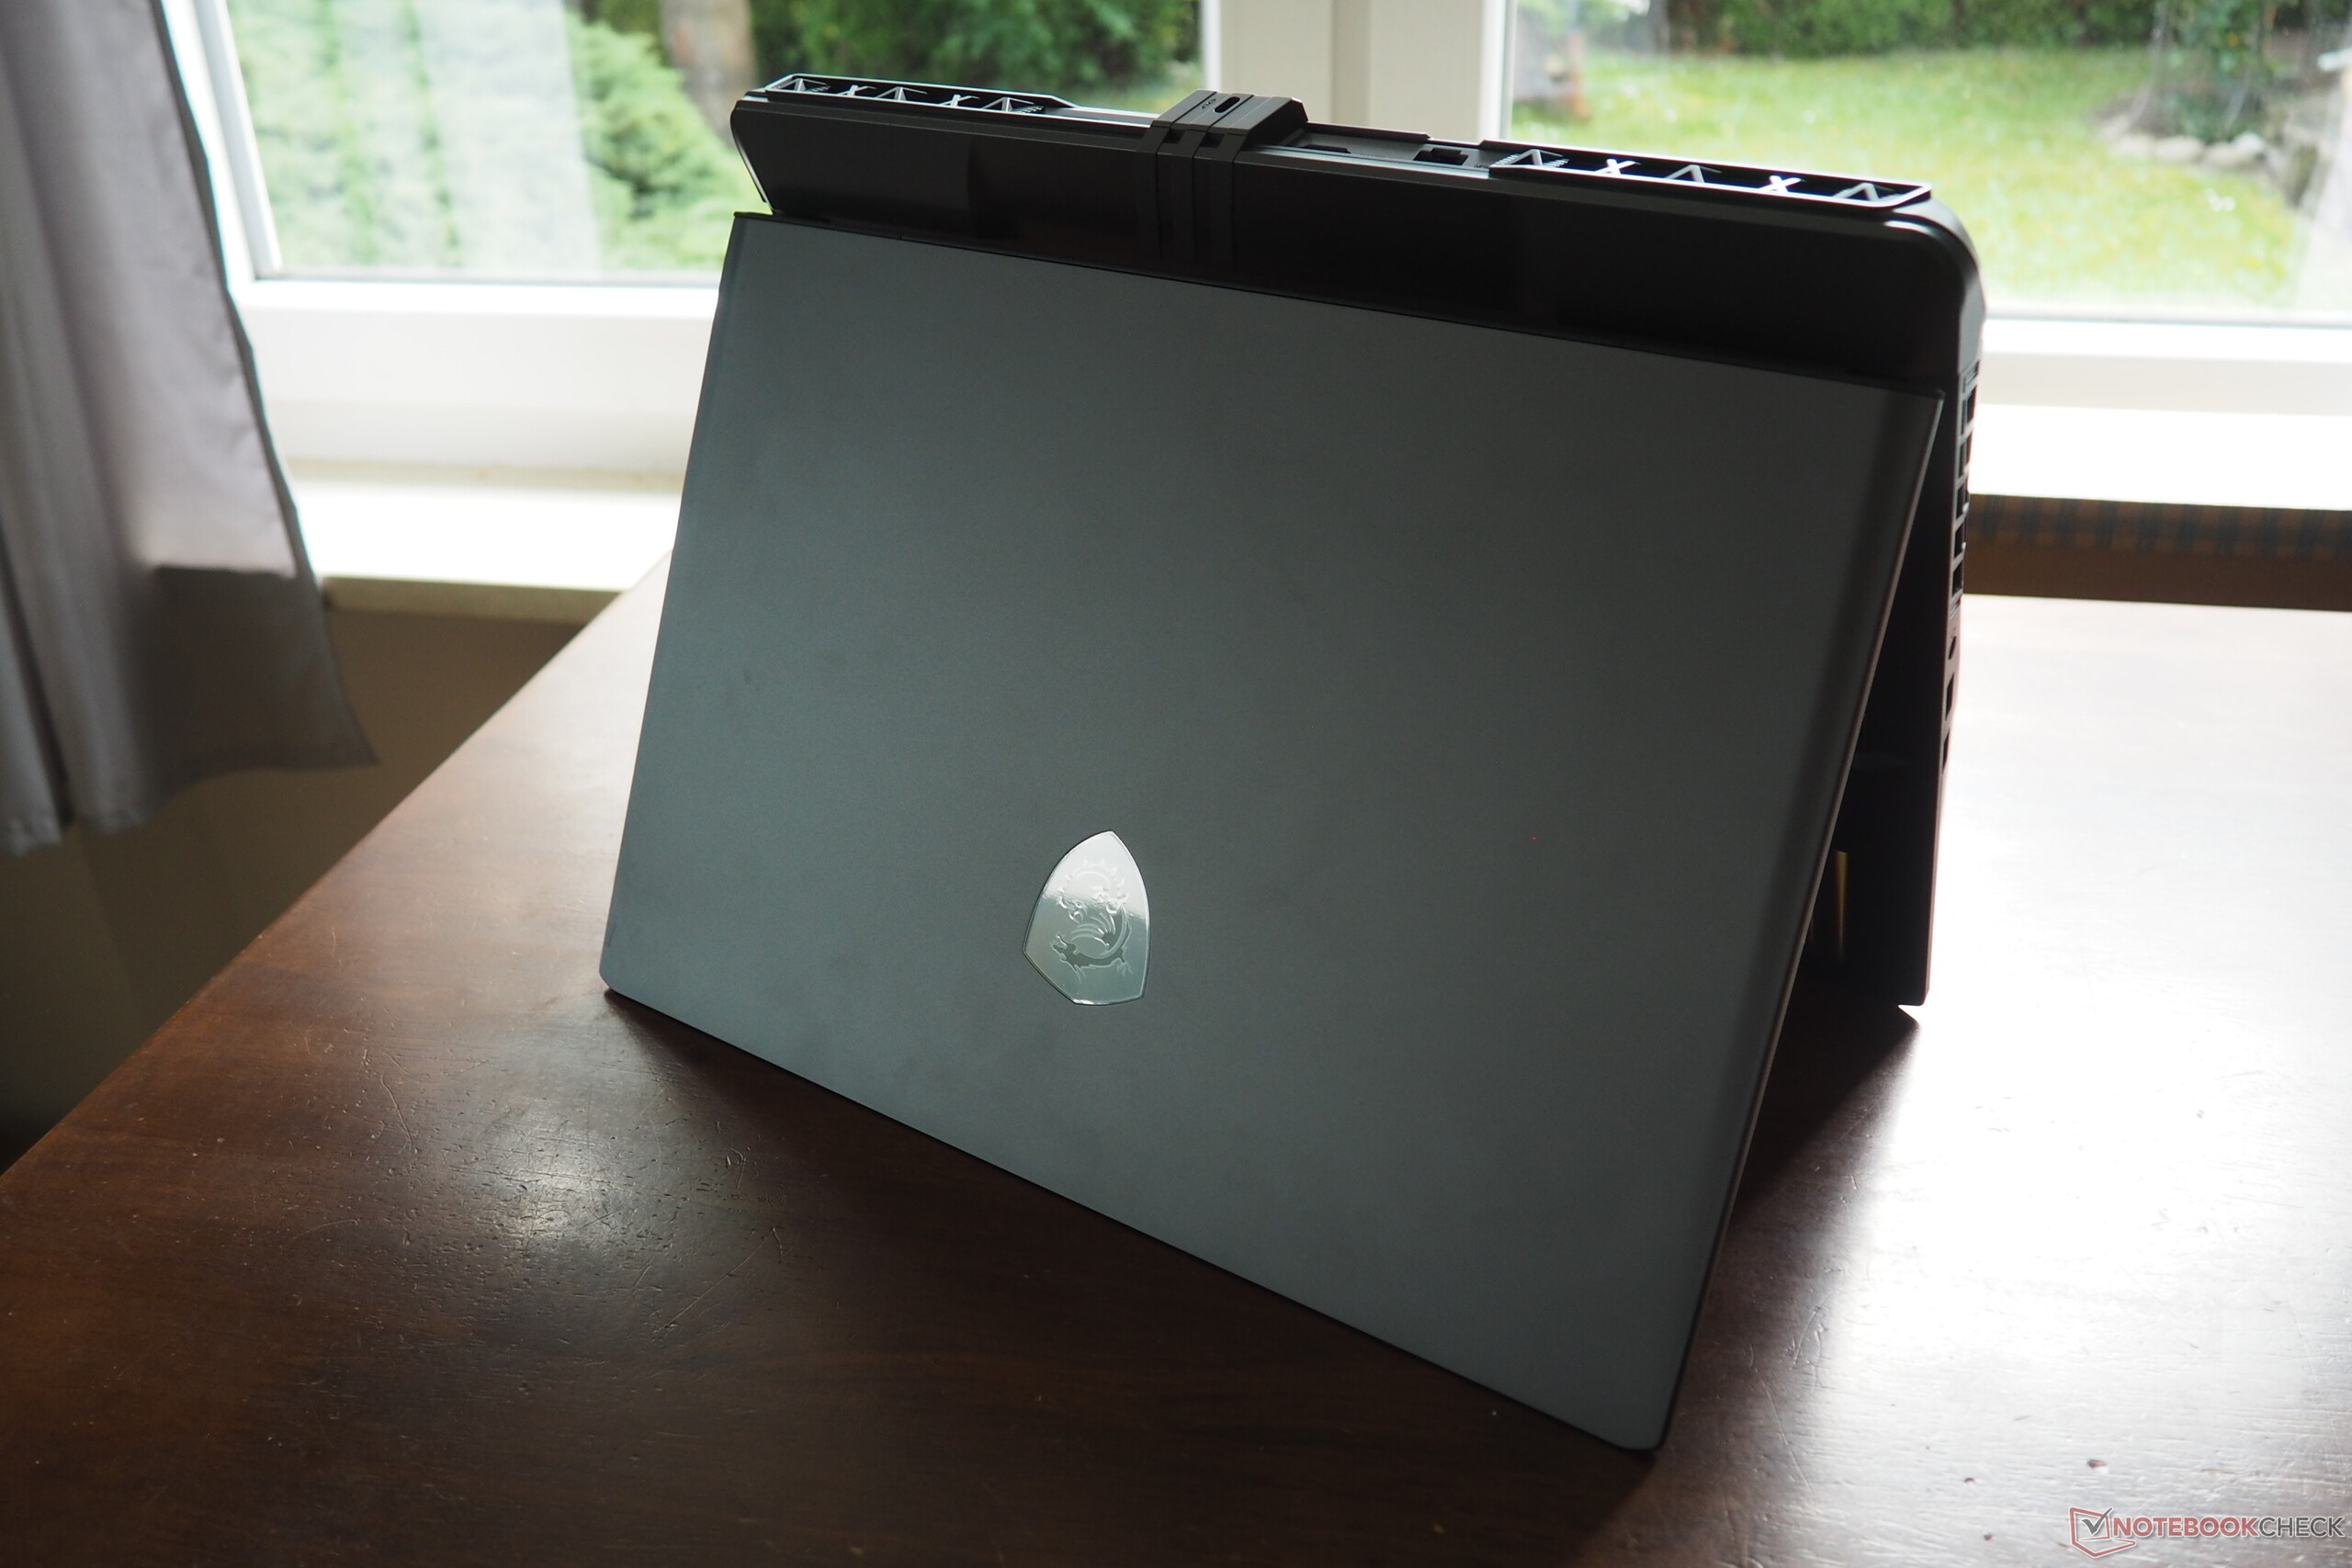
Tek tek yönlere daha yakından baktığınızda, bir dizi eleştiri ortaya çıkıyor. Örneğin, kasa genel olarak iyi tasarlanmış olsa da, nispeten sınırlı bir açılma açısı ve fark edilir derecede hantal bir arka kısım sunuyor. Tipik MSI tarzında klavye düzeni de kişisel bir tercih meselesi. Güç kaynağı hem boyut hem de ağırlık açısından oldukça ağır ve RTX 5080 veya 5090 içeren bir dizüstü bilgisayar için daha uygun olurdu. Bununla birlikte, en sinir bozucu bulduğumuz şey, yetersiz fan kontrolü oldu. AI modunda, Vector 16 boştayken bile açıkça duyulabilir. Bir bütün olarak ele alındığında, bu 16 inçlik makine, 'Çok İyi'nin biraz gerisinde kalsa da, yine de sağlam bir genel derecelendirme kazanıyor.
Artılar
Eksiler
Fiyat ve bulunabilirlik
Core Ultra 7 255HX ve GeForce RTX 5070 Ti ile donatılmış MSI Vector 16 HX AI A2XWHG, yaklaşık 2.100 USD'den başlayan fiyatlarla çeşitli çevrimiçi perakendecilerden temin edilebilir. Bulunabilirlik bölgeye göre değişebilir.
- $1,580.00msi Vector 16 HX AI 16” 144Hz FHD+ Gaming Laptop: Intel Core Ultra 7-255HX, NVIDIA Geforce RTX 5070Ti, 16GB DDR5, 512GB NVMe SSD, Thunderbolt 5, Wi-Fi 6E, Win 11 Home: Cosmo Gray A2XWHG-212US
- $2,749.00MSI Vector 16 HX AI A2XW Vector 16 HX AI A2XWIG-420US 16" Gaming Notebook - QHD+ - 240 Hz - Intel Core Ultra 9 275HX - 32 GB - 1 TB SSD - Cosmos Gray
- $1,756.00MSI Vector 16 HX AI A2XWHG-275US 16" Gaming Notebook - Full HD Plus - 144 Hz - Intel Core Ultra 7 255HX - 16 GB - 1 TB SSD - Cosmos Gray
Vector 16'nın rakipleri arasında 16 ila 17 inç aralığında yeni çıkan diğer oyun dizüstü bilgisayarları da yer alıyor Schenker XMG Pro 16 E25, the Alienware 16 Area-51ve MSI'ın kendi Katana 17 HX. Bu önceki modelCore i9-14900HX ile incelediğimiz ve GeForce RTX 4080karşılaştırma tablolarımızda da yer almaktadır.
Teknik Özellikler
Şasi
Şasi, tasarım dilini büyük ölçüde koruyor selefözellikle bağlantı noktası seçimi ve düzeninde ince iyileştirmelerle. Yapı kalitesi açısından, biraz dayanıksız ve dayanıksız Katana 17'ye kıyasla belirgin bir şekilde daha sağlam ve birinci sınıf bir his veriyor. Sadece kapak metalden yapılmış olsa da, ana ünite hala sağlam ve iyi inşa edilmiş bir his veriyor. Cesur çizgiler ve çarpıcı şekiller açıkça bir oyun kitlesini hedefliyor. Vector 16 HX AI, 2,6 kg'lık ağırlığıyla diğer 16 inçlik rakiplerinin arasında yer alıyor ve sadece Alienware 16, 3,3 kg'lık ağır çerçevesiyle öne çıkıyor. Genel olarak, yapı kalitesi şikayet için çok az yer bırakıyor.
Bağlanabilirlik ve özellikler
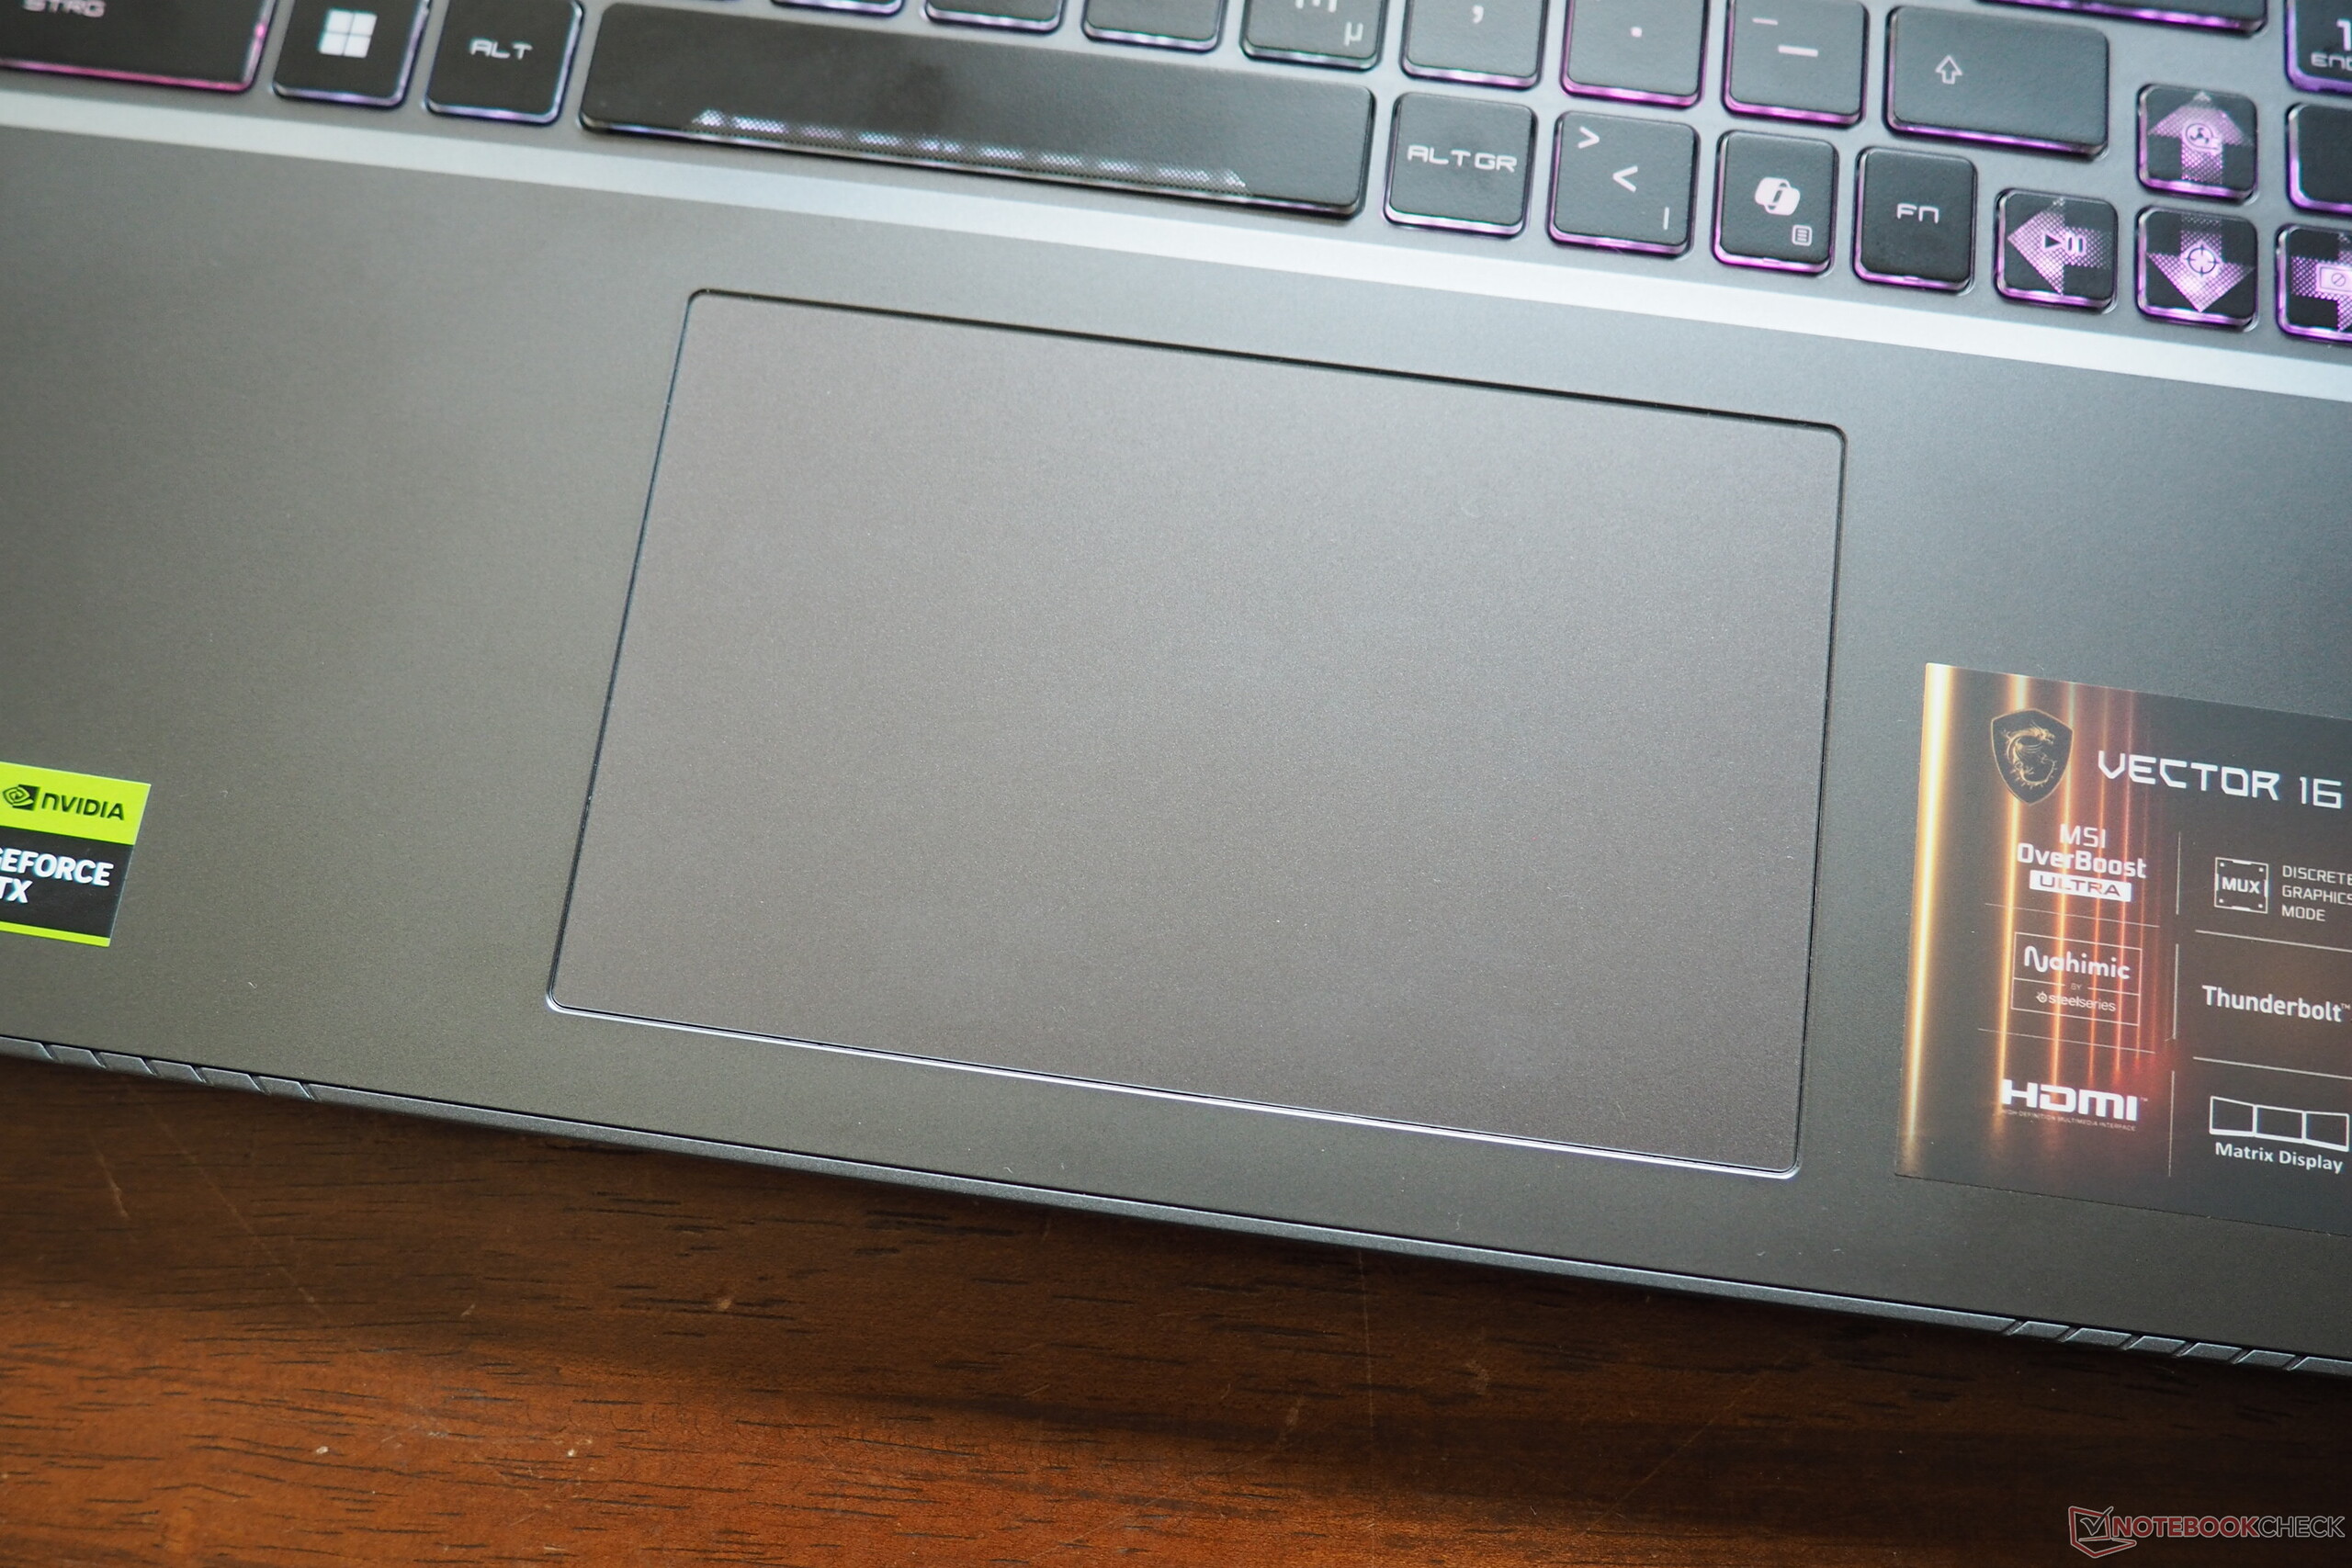
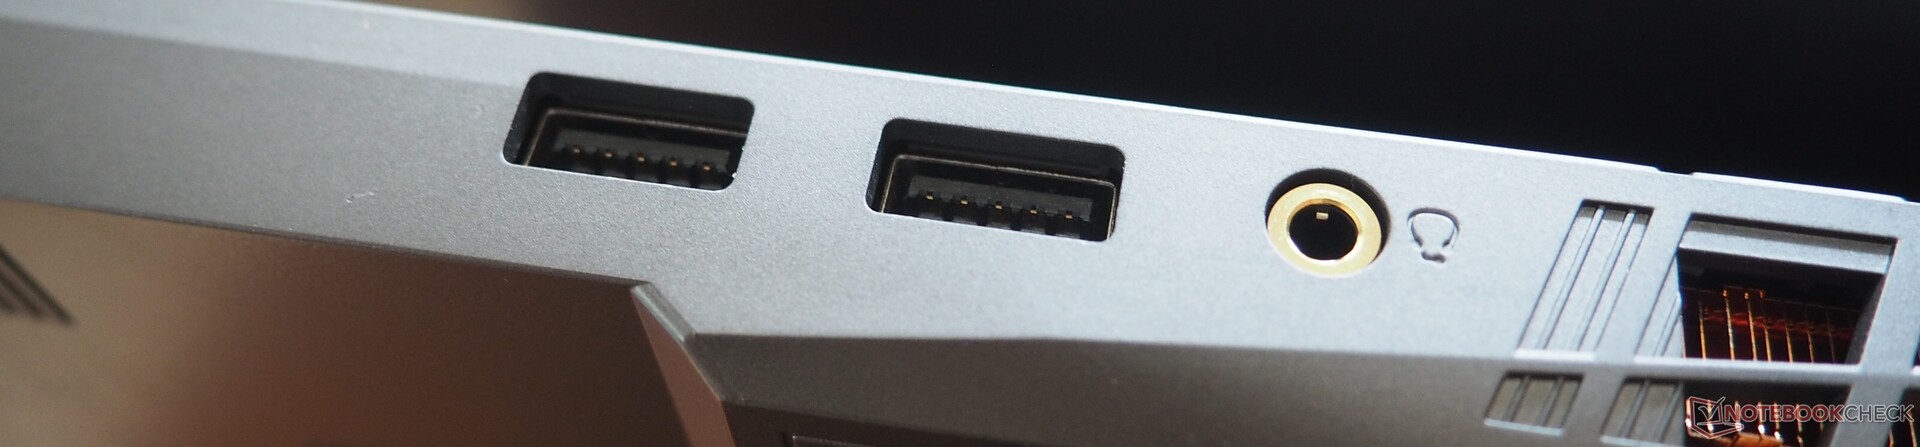
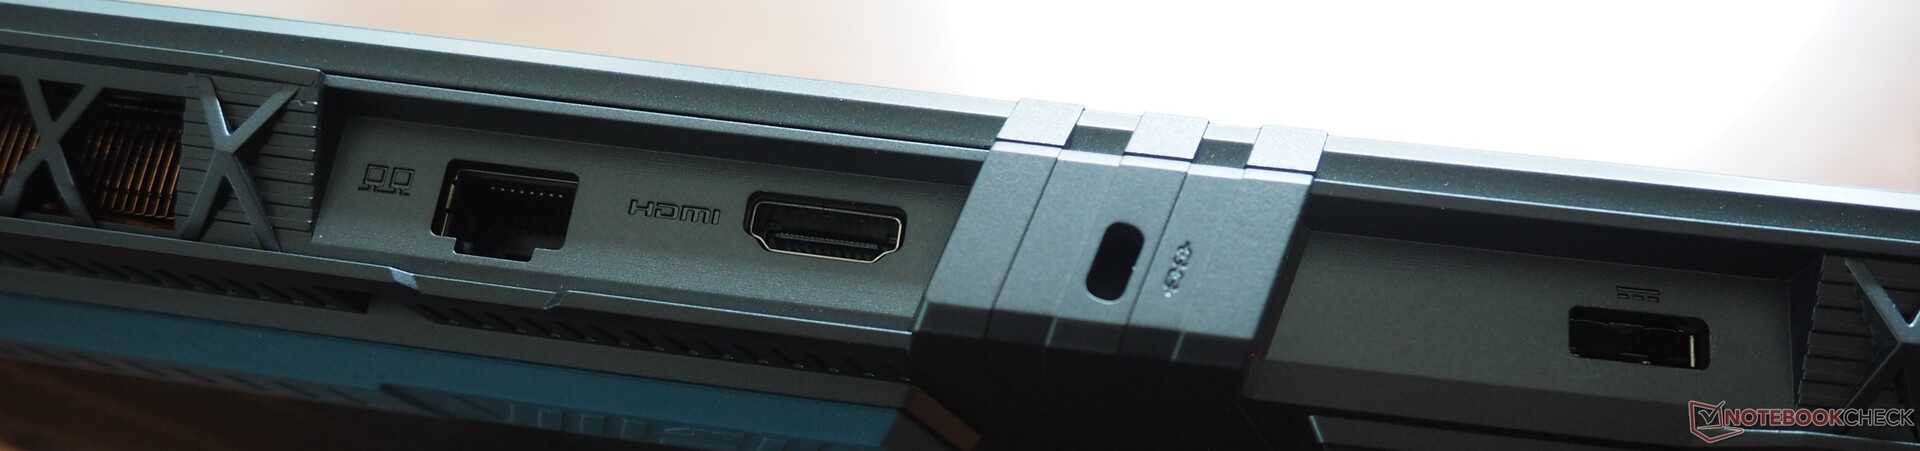
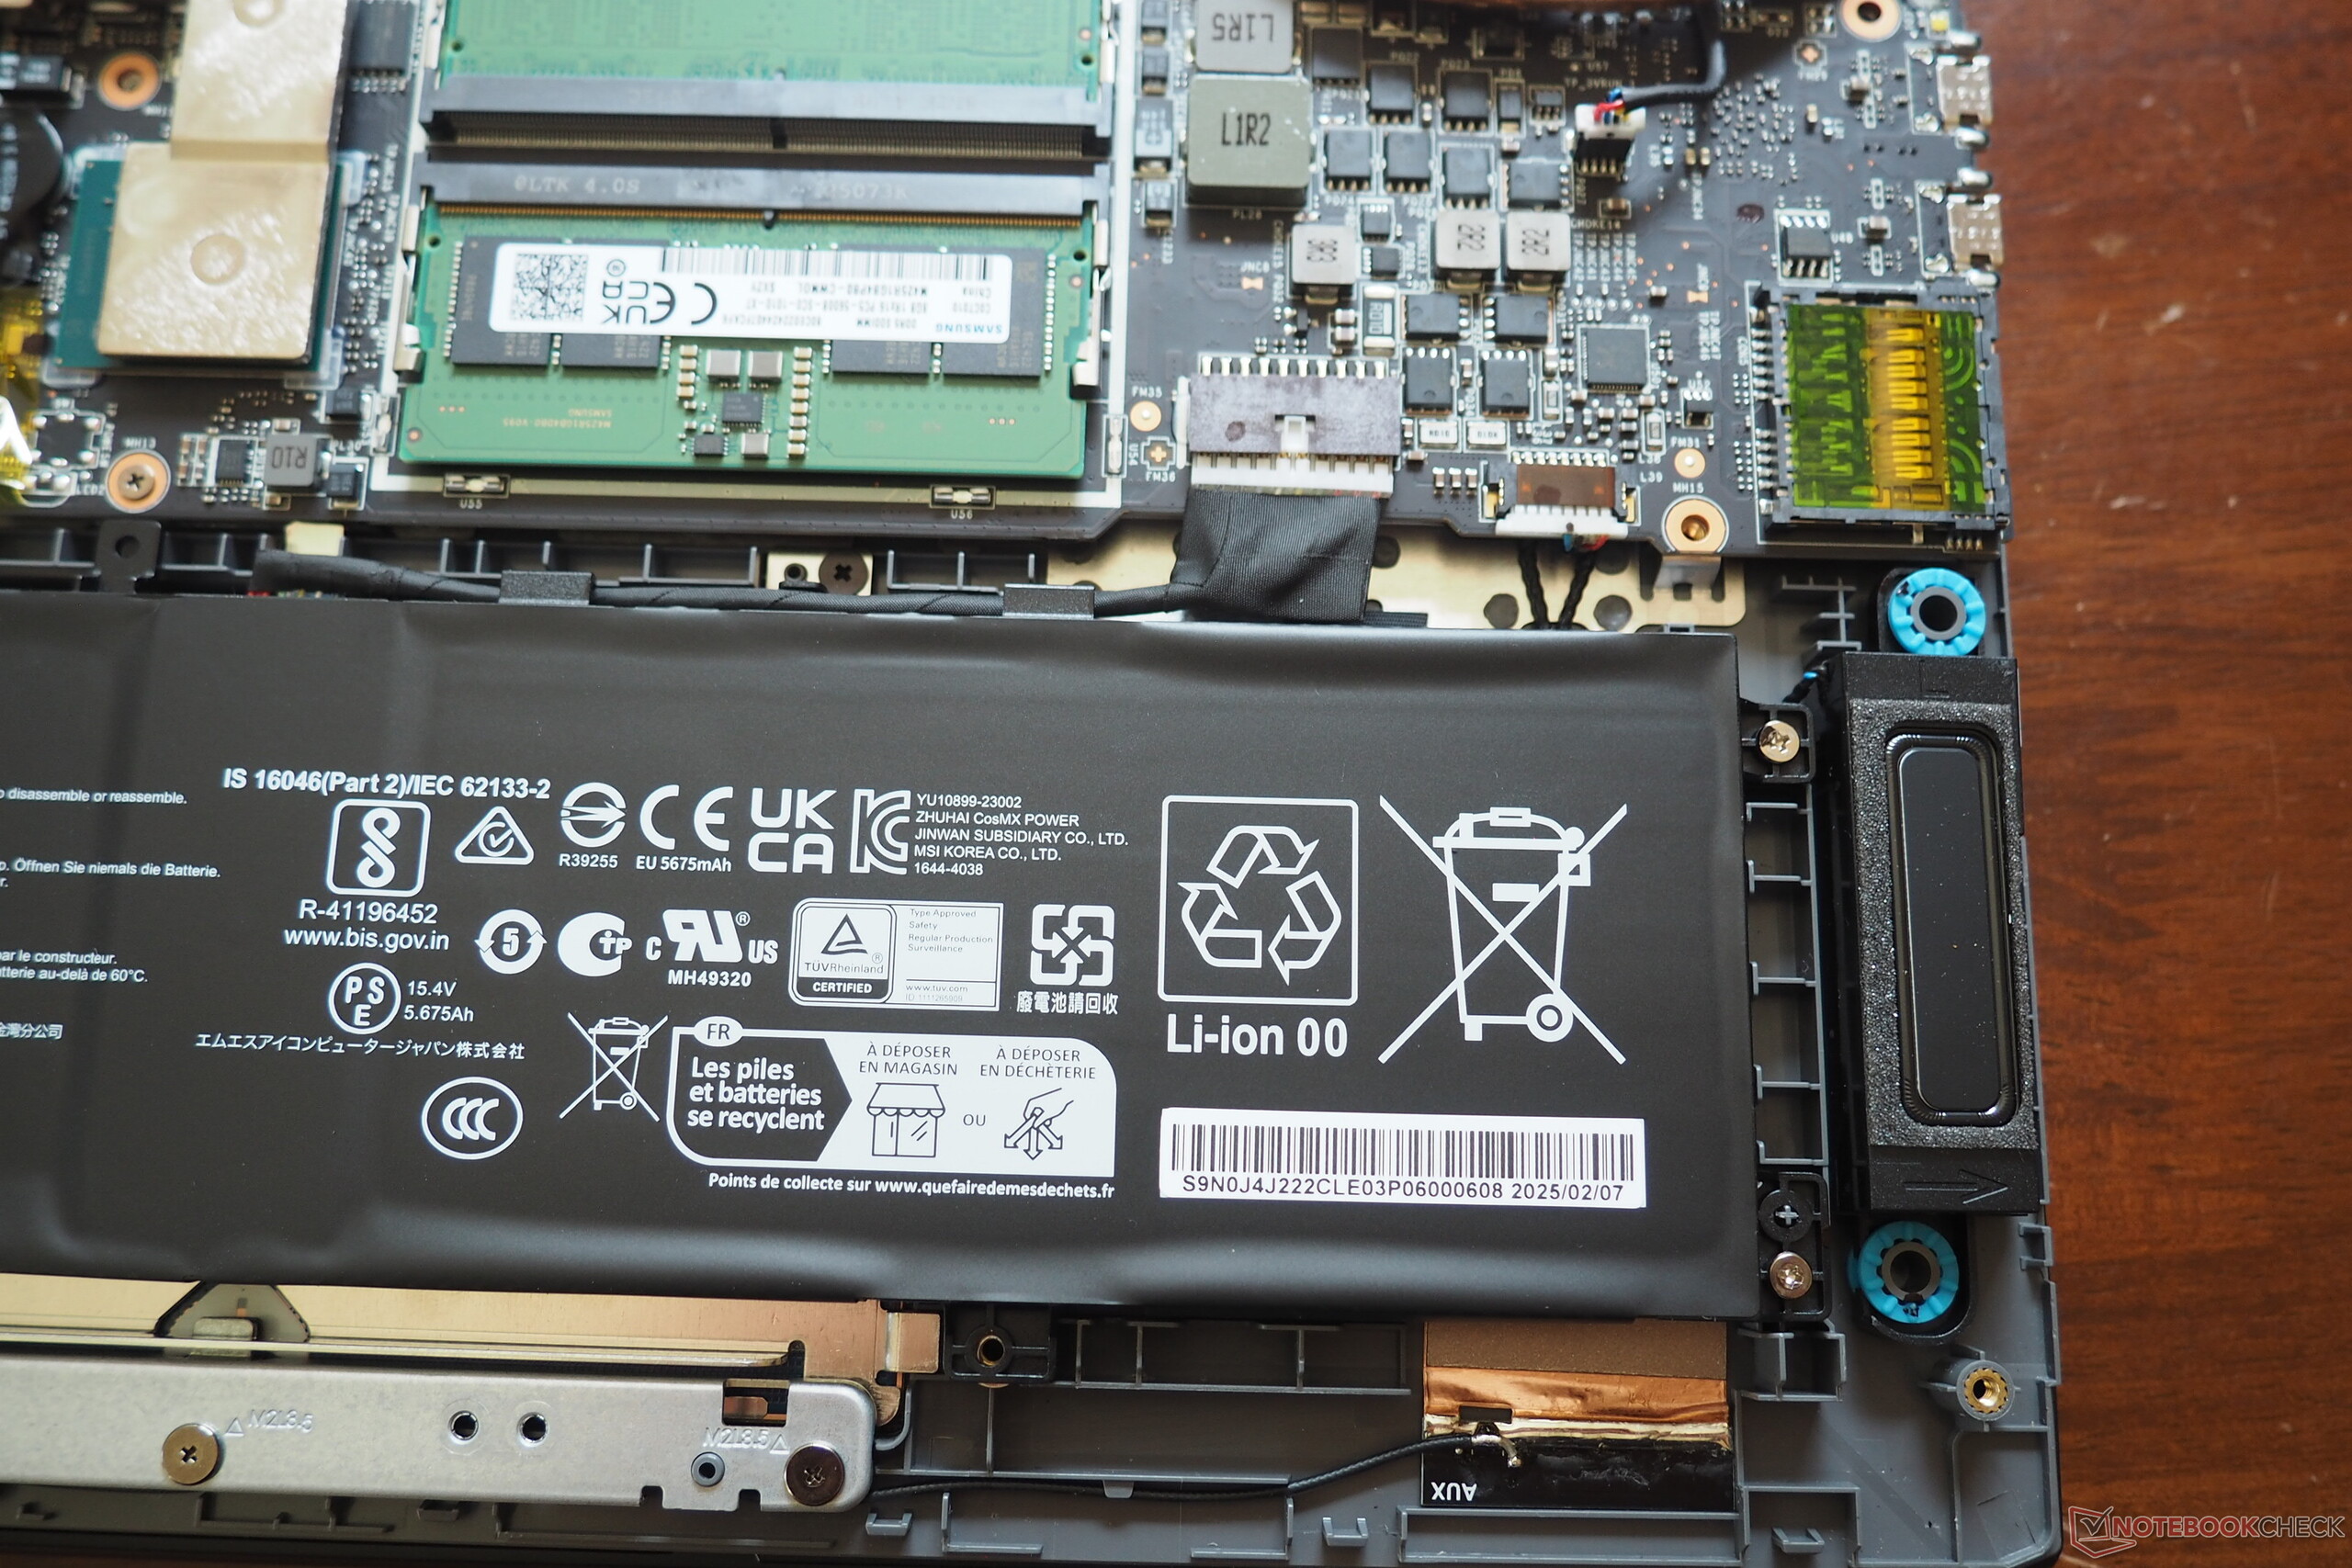
MSI bağlantı konusunda elinden geleni yapıyor. Sol tarafta Power Delivery, USB 4 ve DisplayPort 2.1 destekli iki adet Thunderbolt 5 bağlantı noktası bulunuyor. Sağ tarafta ise iki adet USB-A 3.1 Gen2 bağlantı noktası bulunuyor. HDMI 2.1 çıkışı, 2.5 Gbit Ethernet portu, birleşik ses jakı, Kensington kilit yuvası ve orta hızda bir kart okuyucu ile seçim tamamlanıyor. Kablosuz iletişim, veri alırken özellikle güçlü performans sunan Intel'in Wi-Fi 6E modülü (AX211) tarafından gerçekleştirilir. Full HD web kamerası dizüstü bilgisayar standartlarına göre iyi olsa da özellikle etkileyici değil. Kasanın açılması diğer cihazlara kıyasla daha zor ve zaman alıcı olduğundan, önceki modelde olduğu gibi bakım biraz garip kalıyor.

SD Kart Okuyucu
| SD Card Reader | |
| average JPG Copy Test (av. of 3 runs) | |
| Alienware 16 Area-51 (Toshiba Exceria Pro SDXC 64 GB UHS-II) | |
| Schenker XMG Pro 16 (E25) (Angelbird AV Pro V60) | |
| Sınıf ortalaması Gaming (20.9 - 210, n=55, son 2 yıl) | |
| MSI Vector 16 HX A14V (Toshiba Exceria Pro SDXC 64 GB UHS-II) | |
| MSI Vector 16 HX AI A2XWHG (AV PRO microSD 128 GB V60) | |
| maximum AS SSD Seq Read Test (1GB) | |
| Schenker XMG Pro 16 (E25) (Angelbird AV Pro V60) | |
| Alienware 16 Area-51 (Toshiba Exceria Pro SDXC 64 GB UHS-II) | |
| Sınıf ortalaması Gaming (25.5 - 261, n=52, son 2 yıl) | |
| MSI Vector 16 HX A14V (Toshiba Exceria Pro SDXC 64 GB UHS-II) | |
| MSI Vector 16 HX AI A2XWHG (AV PRO microSD 128 GB V60) | |
İletişim
Web kamerası


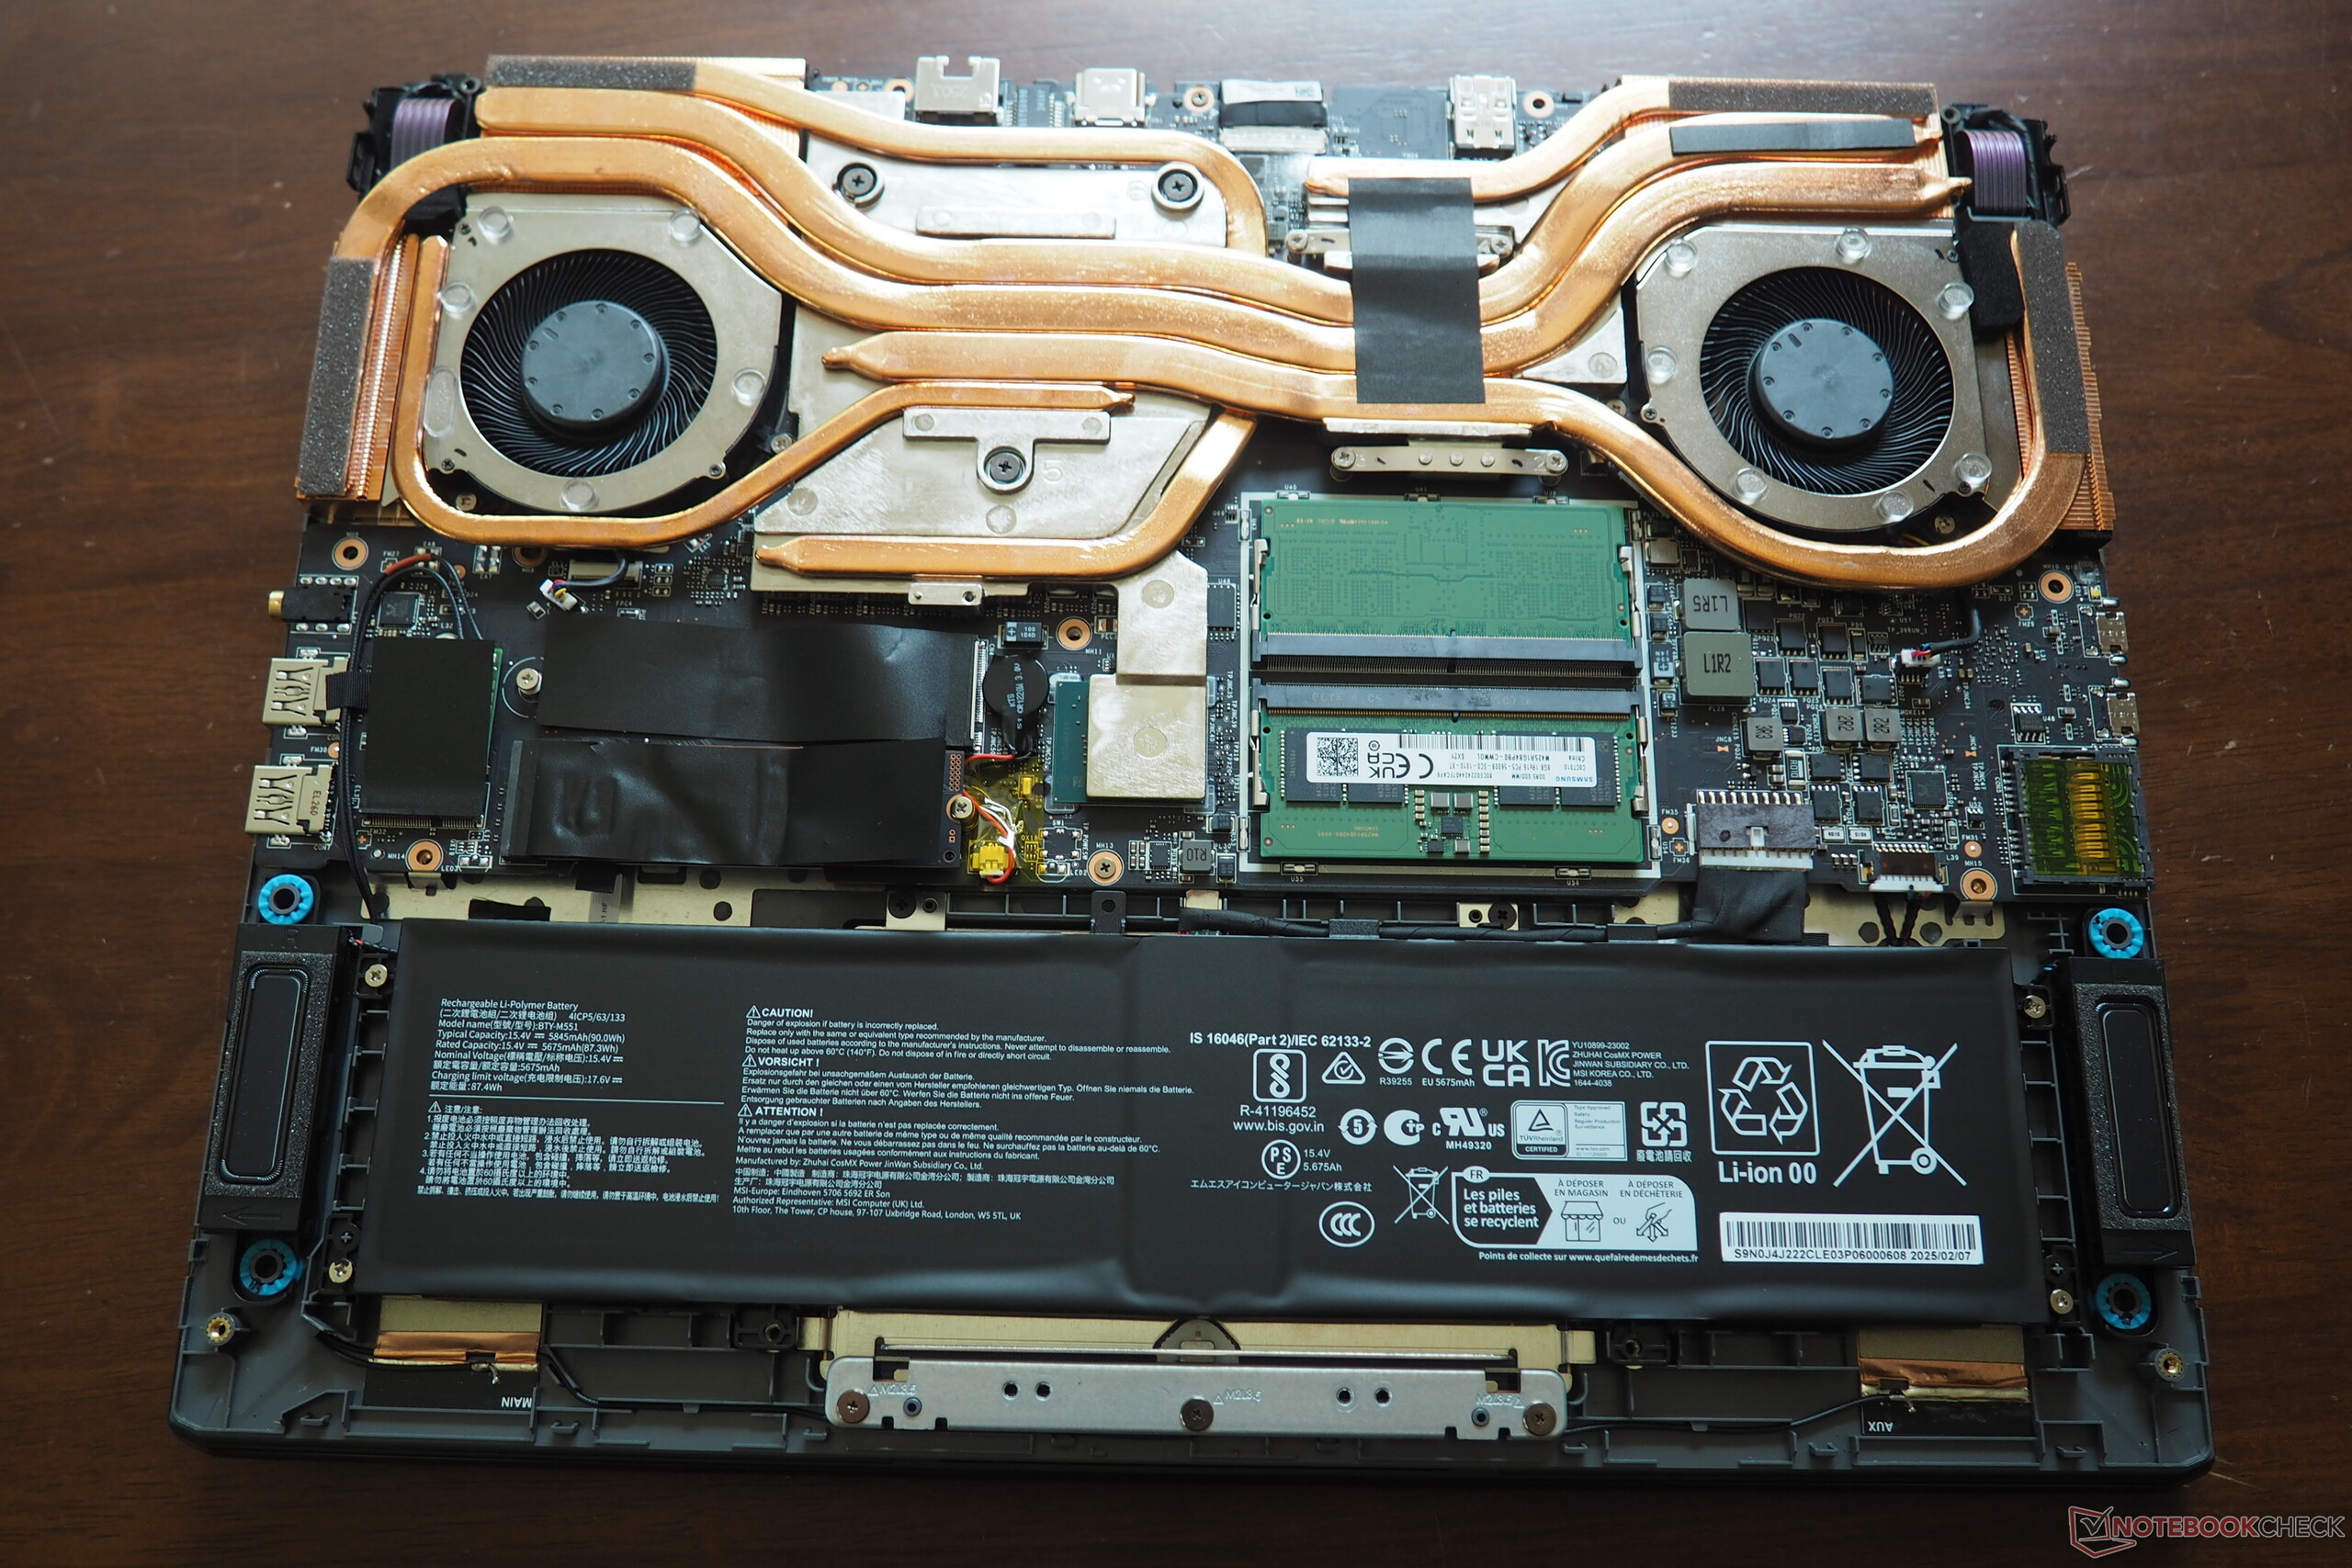
Bakım
Giriş cihazları
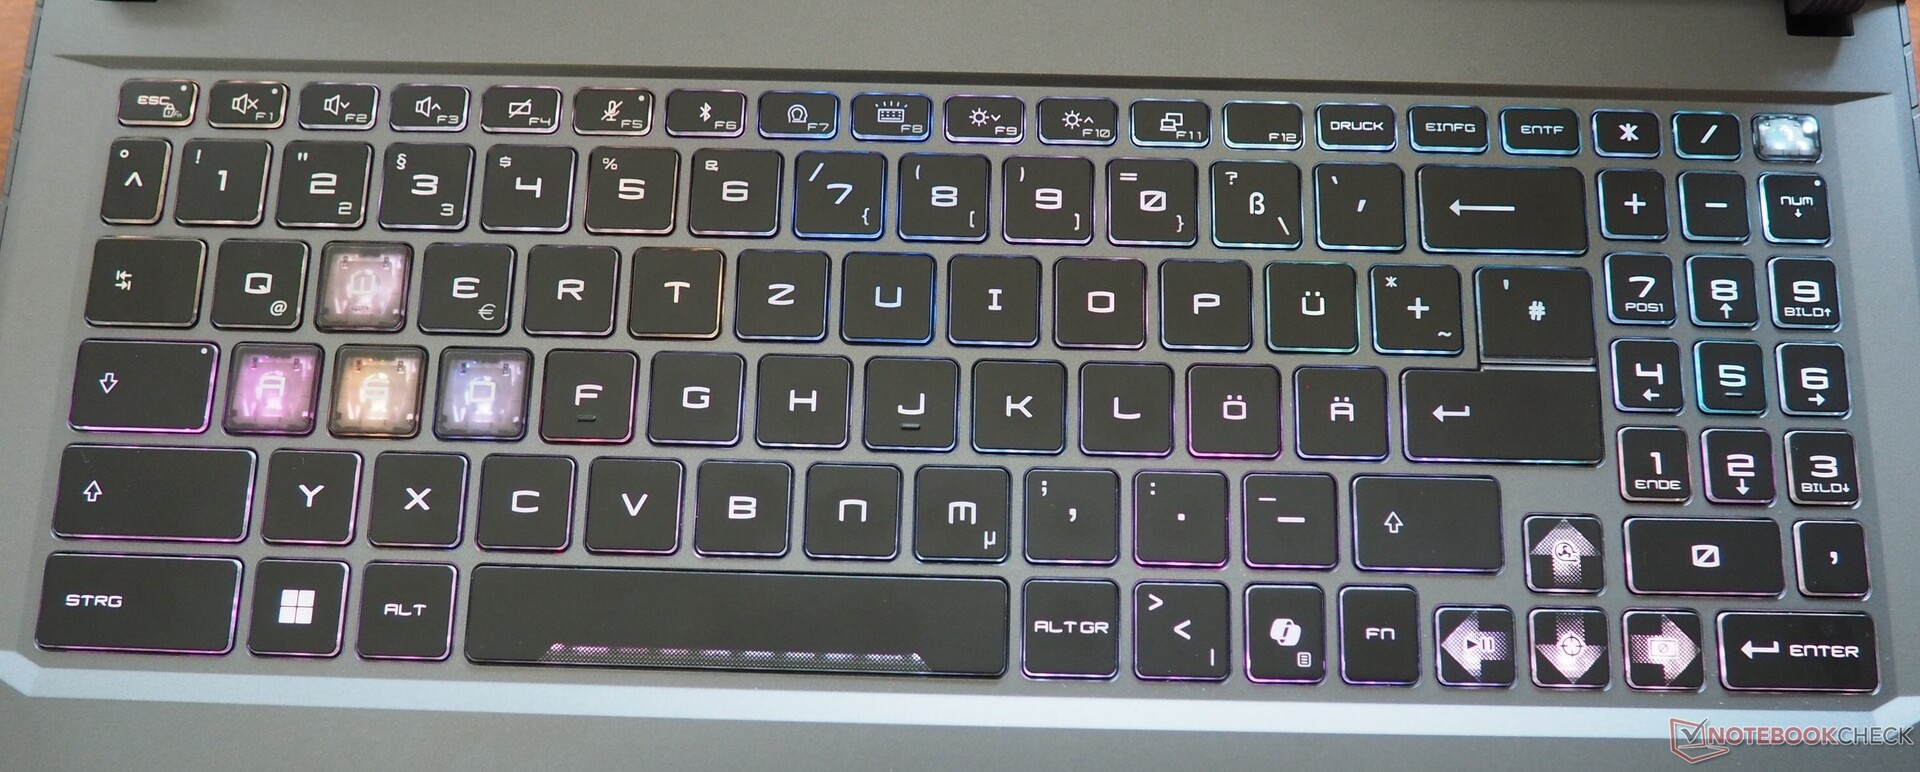
MSI birkaç yıldır alışılmadık klavye düzenini sürdürüyor ve buna alışmak biraz zaman alıyor. Birçok tuşun yerleşimi standart düzene uymuyor. Daha yaygın olan dört sütunlu sayı tuşu yerine üç sütunlu bir tuş takımı kullanma kararı da bize biraz garip geldi. Yazma hissi açısından klavye genel olarak iyi bir performans sergiliyor, ancak mekanik modellerin dokunsal kalitesiyle doğal olarak eşleşemiyor. Artı bir nokta, bireysel olarak özelleştirilebilen kapsamlı RGB aydınlatmasıdır. Dokunmatik yüzey 13 cm'ye 8 cm boyutlarında ve pürüzsüz bir kayma ve sağlam bir hassasiyet sunuyor. Alt kenardaki tıklanabilir alanlar güvenilir bir şekilde yanıt veriyor, ancak bizim zevkimize göre biraz dayanıksız hissediyorlar.
Ekran
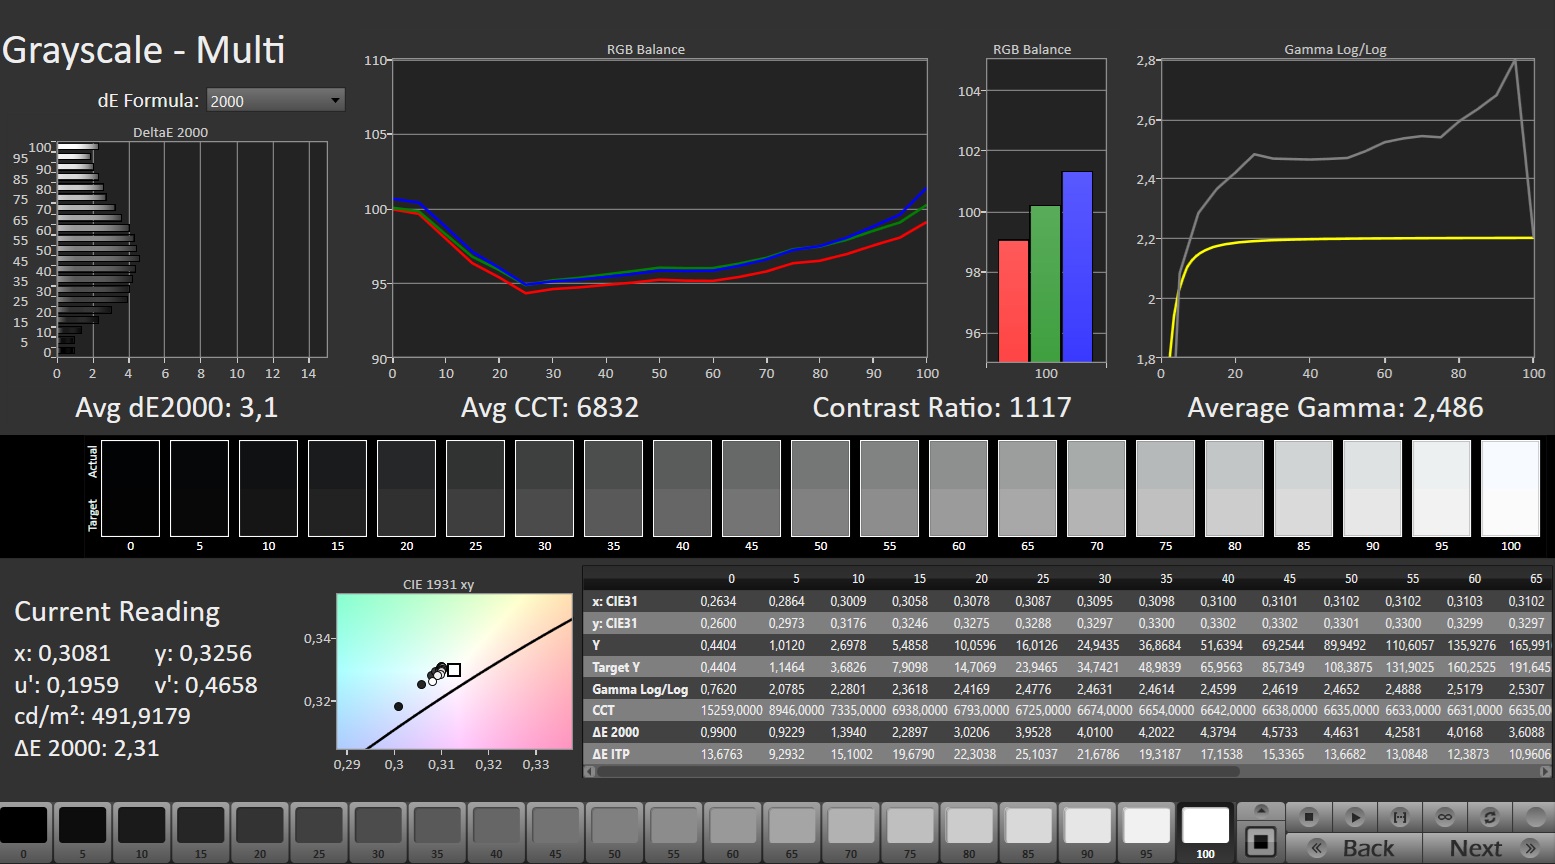
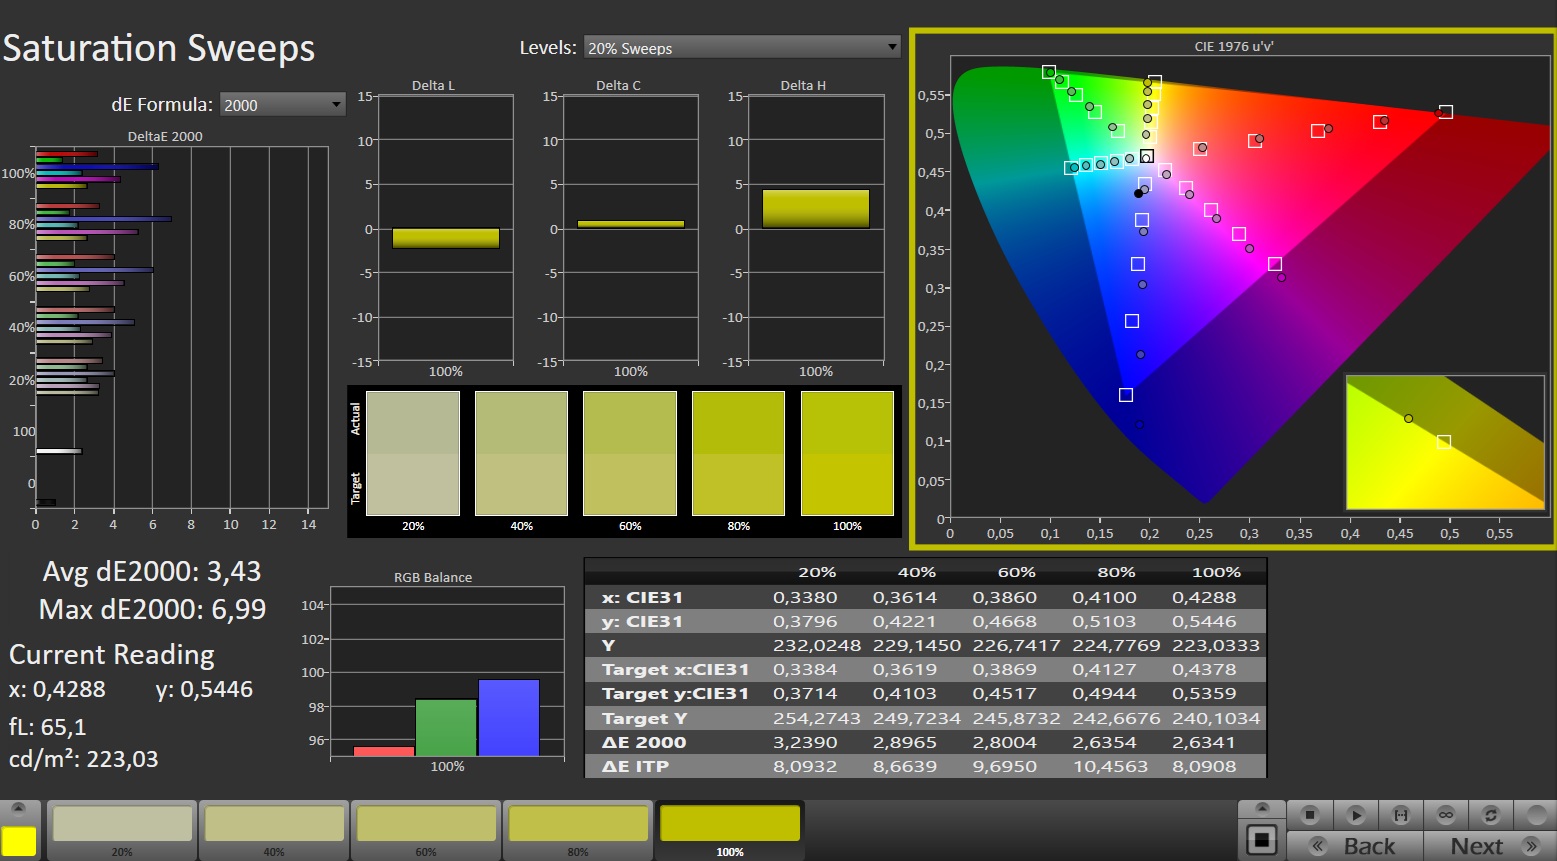
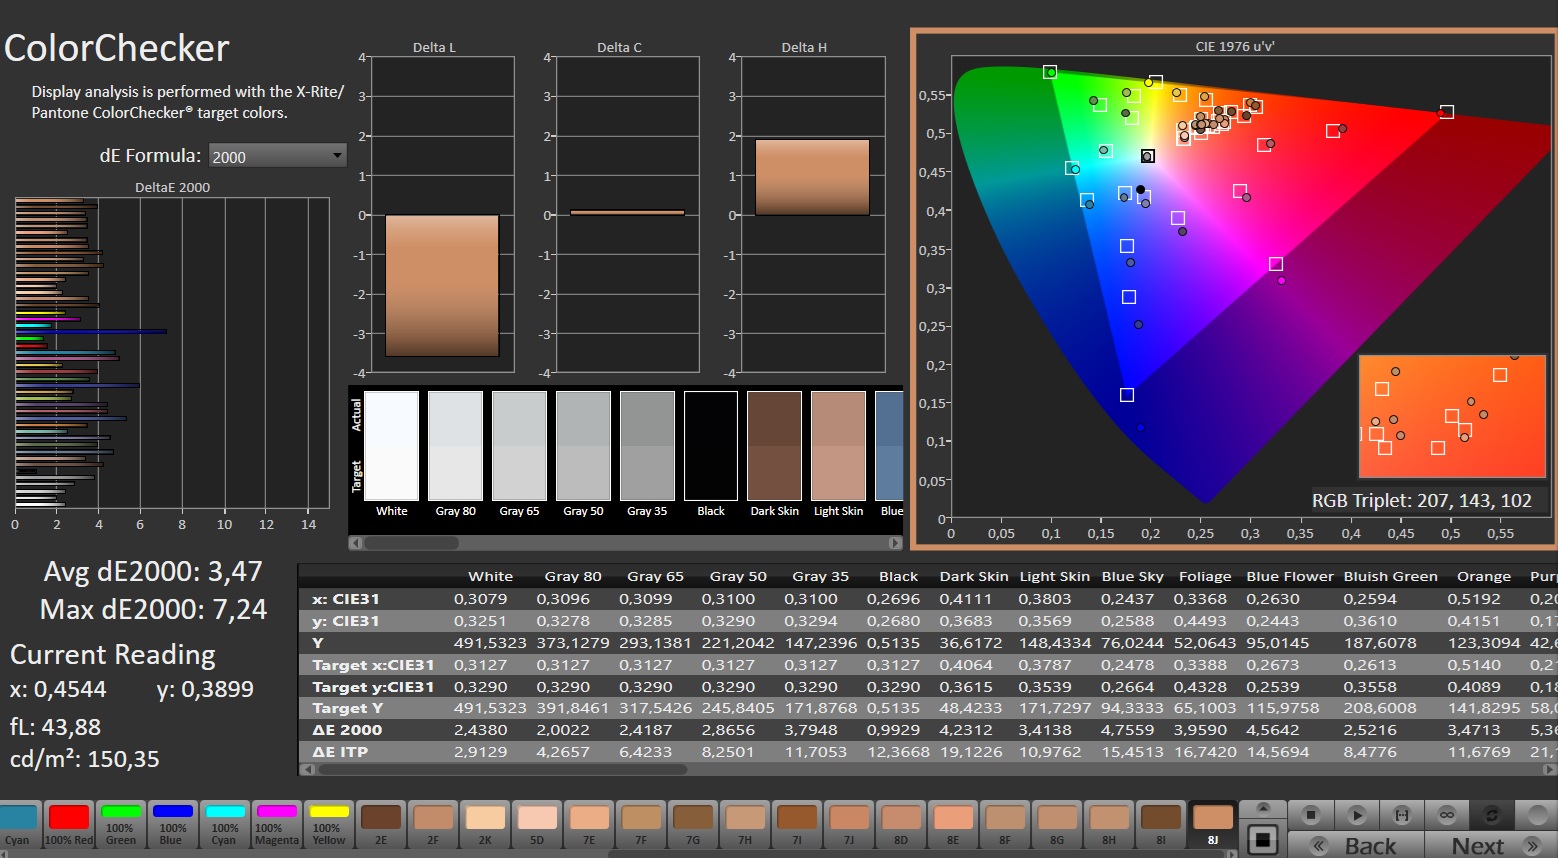
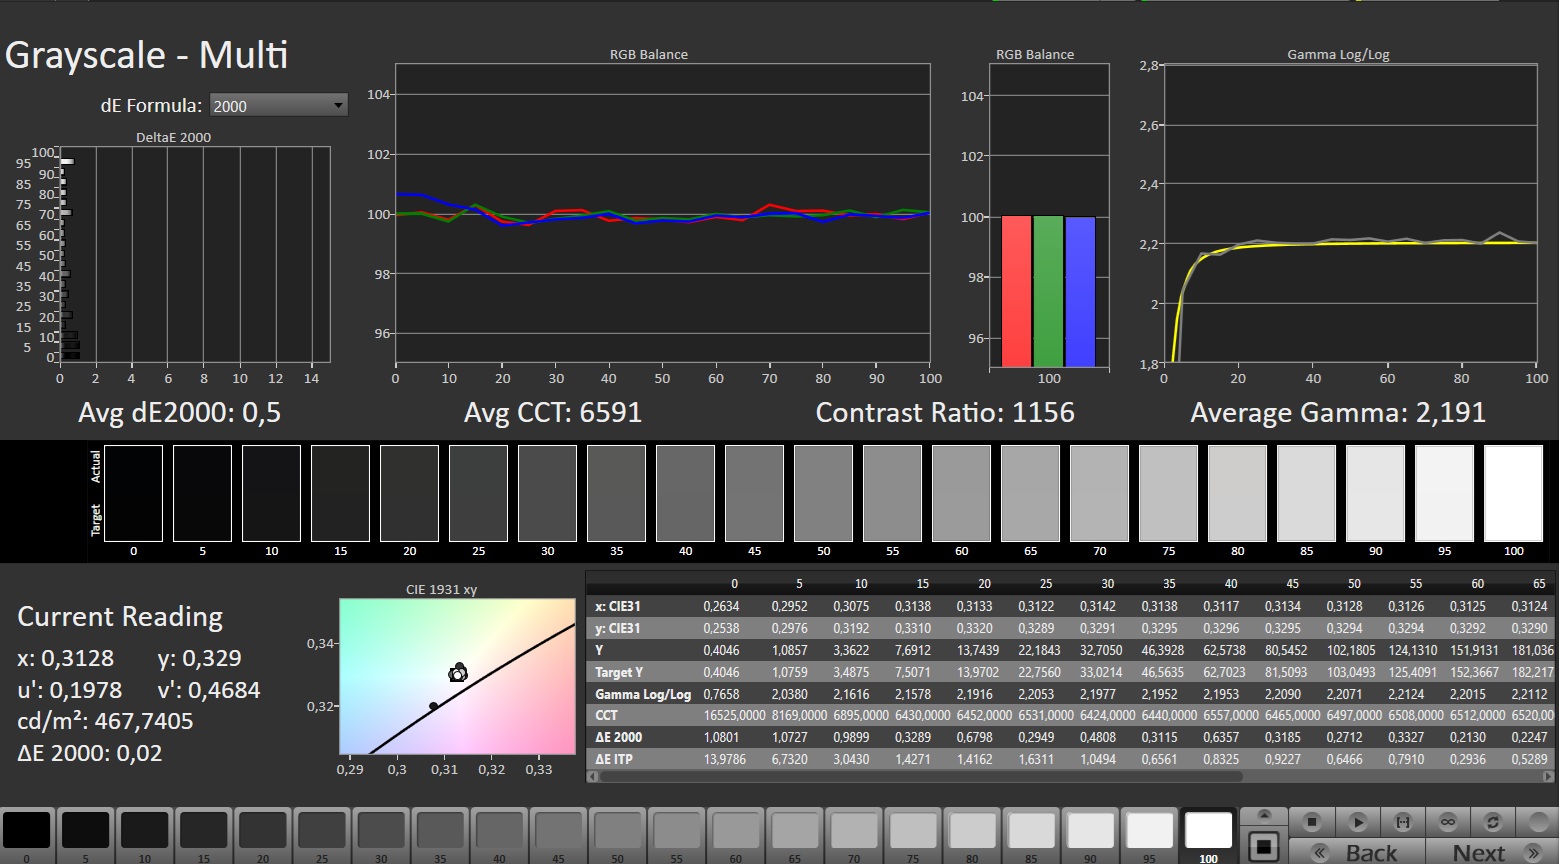
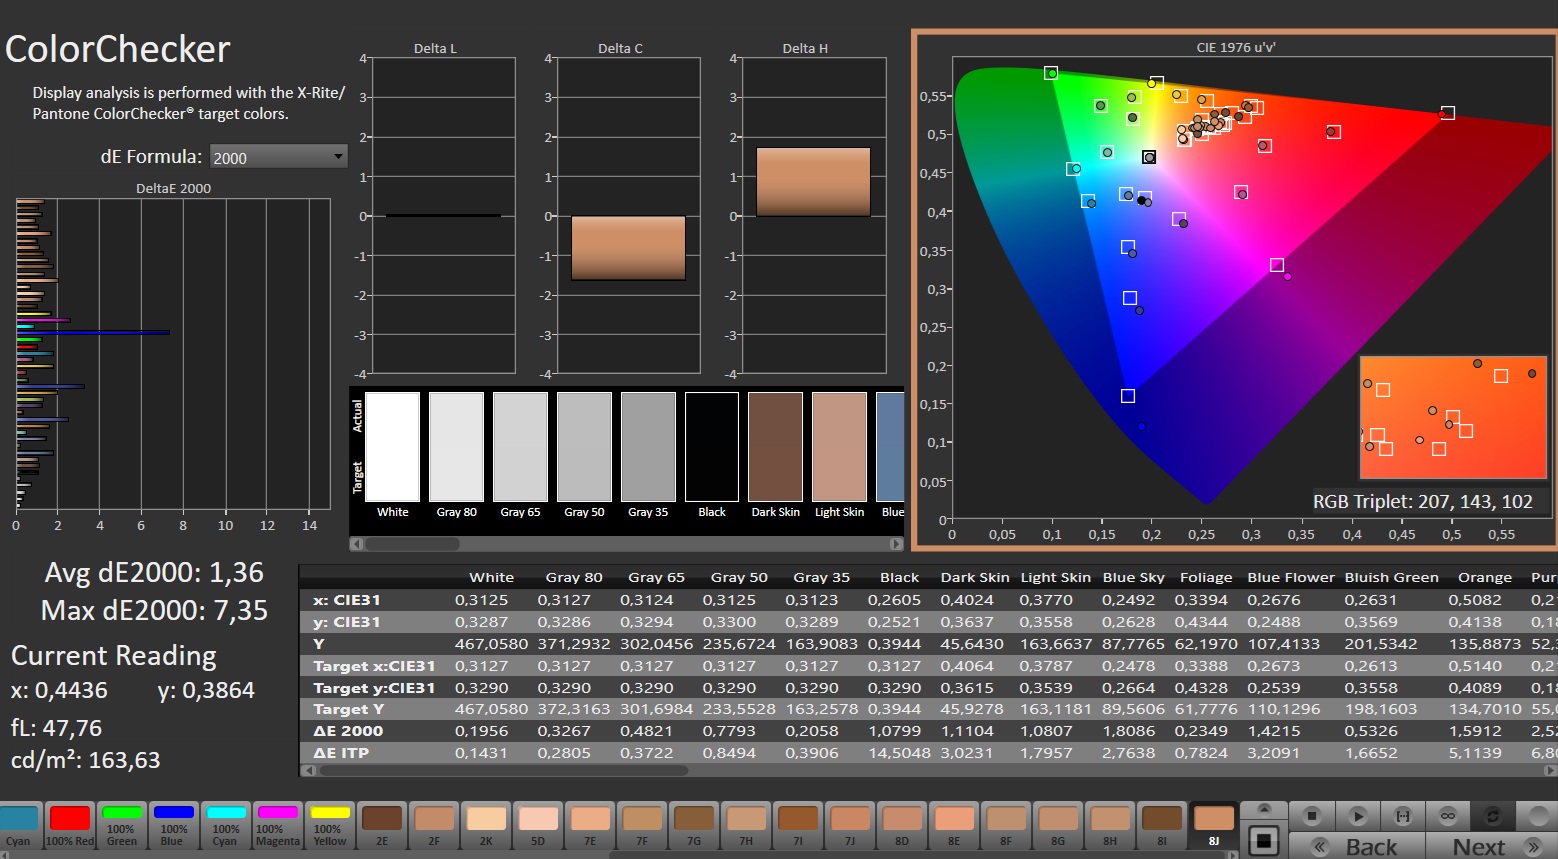
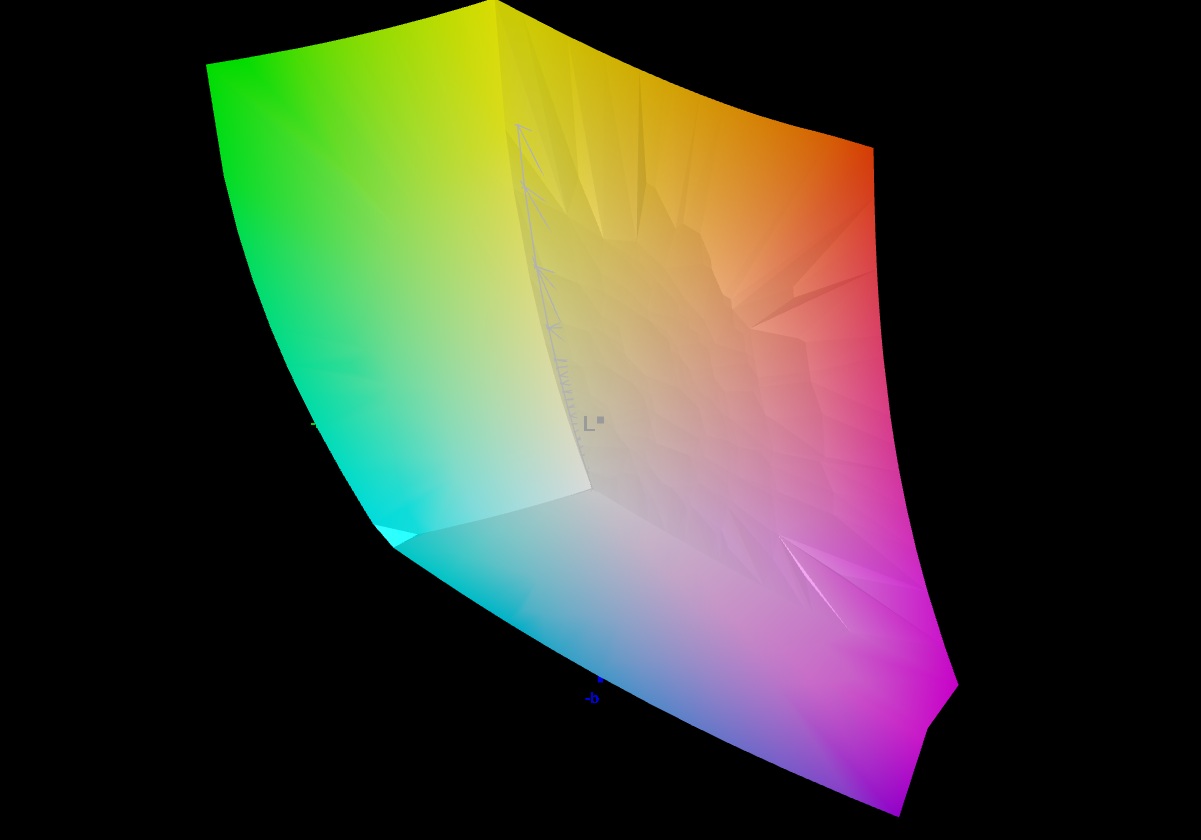
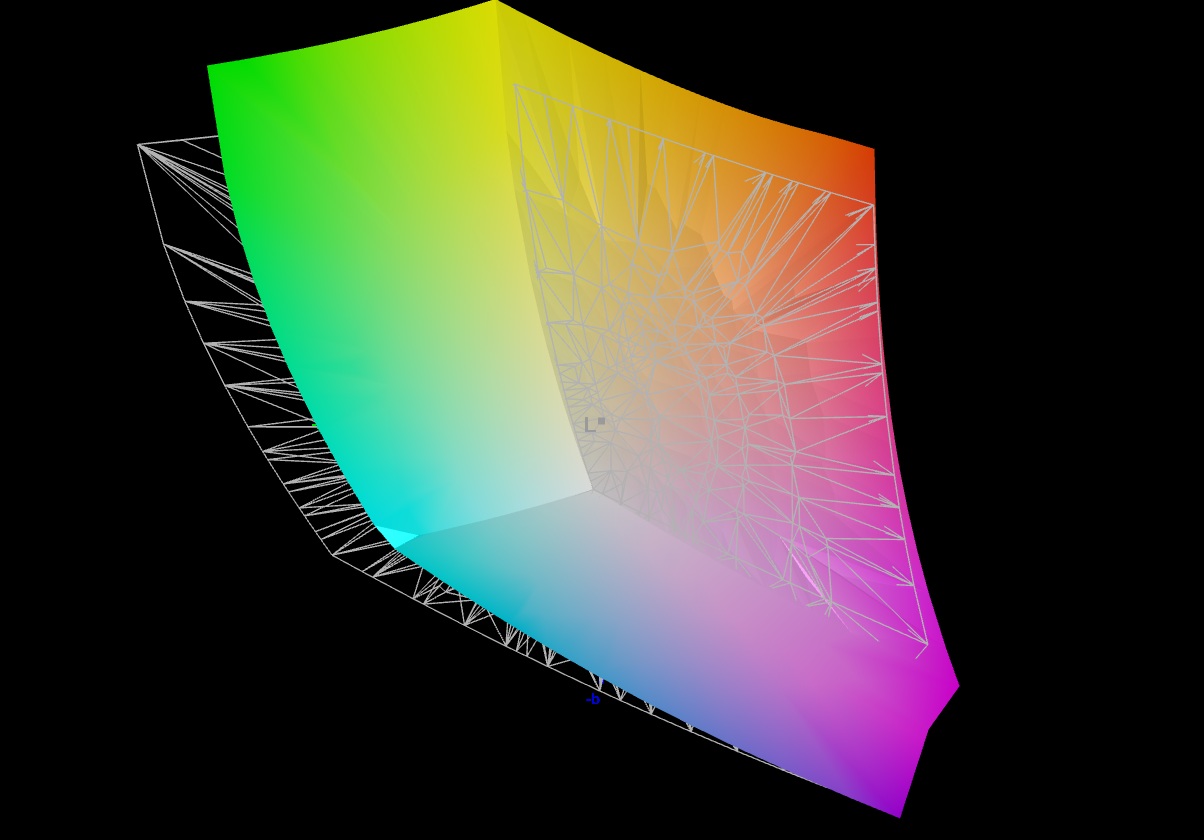
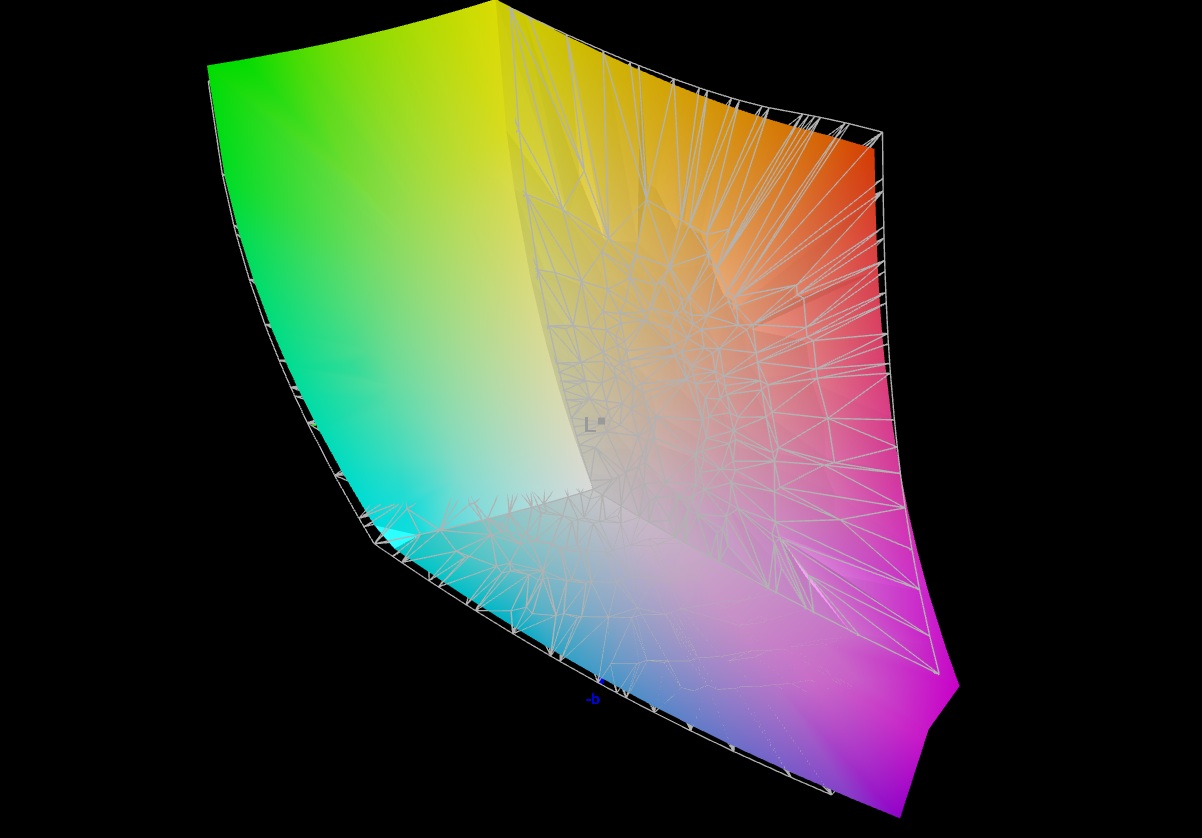
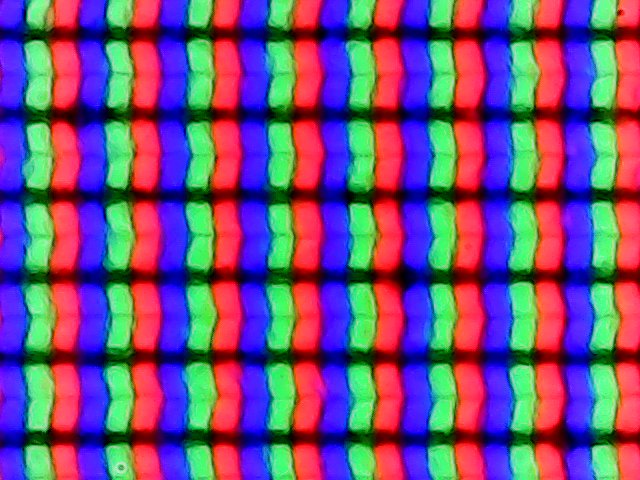
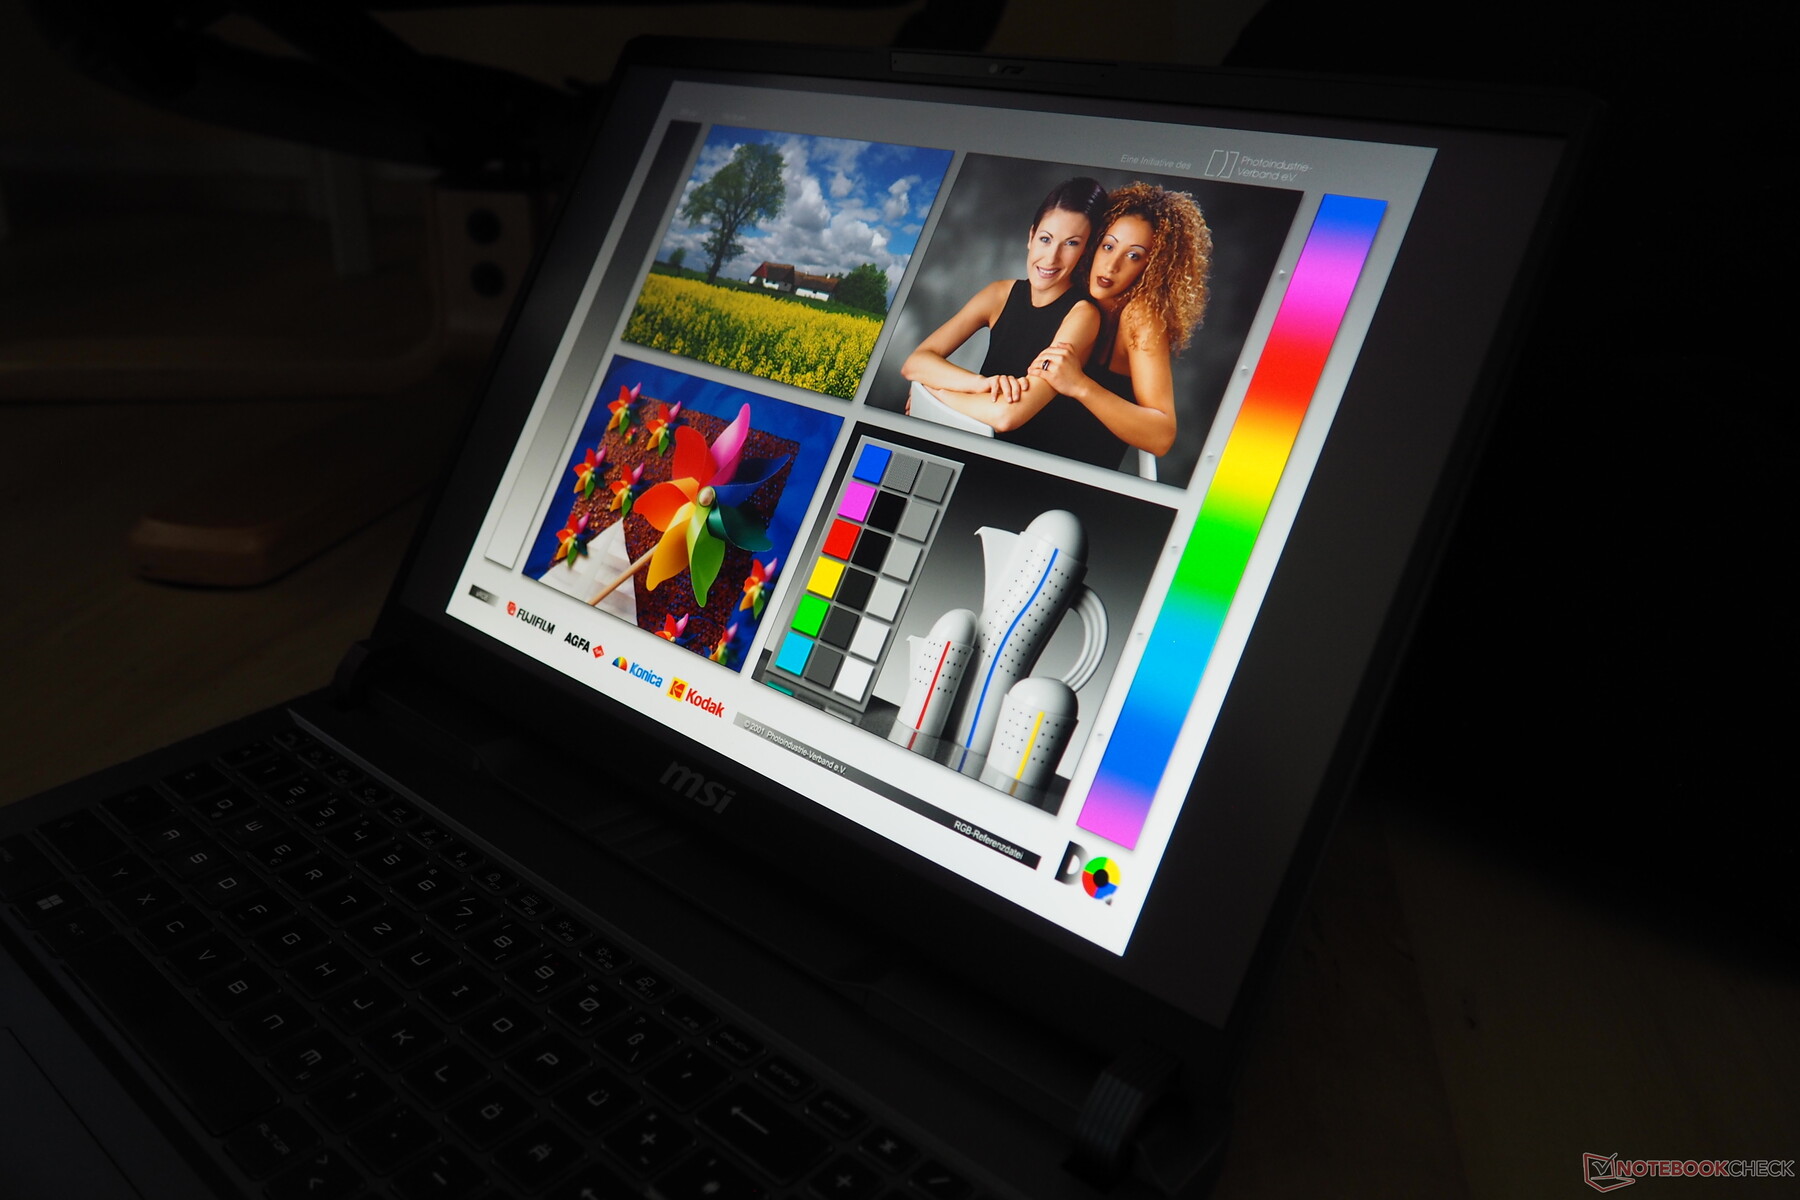
Ekran, şu anda popüler olan 16:10 en boy oranını benimsiyor ve büyük bir kusur olmadan performans gösteriyor. IPS panel çoğu alanda OLED seviyelerine ulaşmasa da Vector 16 diğer oyun dizüstü bilgisayarlarına kıyasla kendi başına ayakta duruyor. Yüksek tempolu 3D oyunlar için bile yeterince hızlı olması gereken iyi bir tepki süresiyle başlıyor. Ekran ayrıca 426 cd/m²'lik sağlam bir ortalama parlaklık sunarak Katana 17'nin 272 cd/m²'lik yetersiz performansını açıkça geride bırakıyor. Ortalama siyah seviyesi 0,42 cd/m² olmasına rağmen 16 inçlik panel yine de 1.000:1 kontrast oranı eşiğini aşıyor. Kutudan çıktığı andaki renk doğruluğu da etkileyici ve kalibrasyonla daha da iyileştirilebilir. Ekranda titreme gözlemlemedik ve görüş açıları tipik IPS standartlarıyla uyumlu.
| |||||||||||||||||||||||||
Aydınlatma: 85 %
Batarya modunda parlaklık: 473 cd/m²
Kontrast: 1126:1 (Siyah: 0.42 cd/m²)
ΔE ColorChecker Calman: 3.47 | ∀{0.5-29.43 Ø4.73}
calibrated: 1.36
ΔE Greyscale Calman: 3.1 | ∀{0.09-98 Ø4.97}
84.4% AdobeRGB 1998 (Argyll 3D)
99.8% sRGB (Argyll 3D)
96.6% Display P3 (Argyll 3D)
Gamma: 2.486
CCT: 6832 K
| MSI Vector 16 HX AI A2XWHG B160QAN02.3 (AUO7DB2), IPS, 2560x1600, 16", 240 Hz | MSI Vector 16 HX A14V Chi Mei N160GME-GTB, IPS, 2560x1600, 16", 240 Hz | MSI Katana 17 HX B14WGK CSOT MNH301CA3-1, IPS, 2560x1440, 17.3", 240 Hz | Schenker XMG Pro 16 (E25) NE160QDM-NZL, IPS, 2560x1600, 16", 300 Hz | Alienware 16 Area-51 AU Optronics B160QAN, IPS, 2560x1600, 16", 240 Hz | |
|---|---|---|---|---|---|
| Display | 0% | 2% | -11% | 2% | |
| Display P3 Coverage (%) | 96.6 | 95.4 -1% | 97.3 1% | 74.7 -23% | 96 -1% |
| sRGB Coverage (%) | 99.8 | 99.7 0% | 99.6 0% | 99.8 0% | 100 0% |
| AdobeRGB 1998 Coverage (%) | 84.4 | 85.4 1% | 89 5% | 75.4 -11% | 89.2 6% |
| Response Times | -62% | -37% | -67% | -16% | |
| Response Time Grey 50% / Grey 80% * (ms) | 4.3 ? | 5.7 ? -33% | 5.2 ? -21% | 10.5 ? -144% | 4.8 ? -12% |
| Response Time Black / White * (ms) | 6 ? | 11.4 ? -90% | 9.2 ? -53% | 5.4 ? 10% | 7.2 ? -20% |
| PWM Frequency (Hz) | |||||
| Screen | 5% | 13% | 16% | 2% | |
| Brightness middle (cd/m²) | 473 | 557.2 18% | 296 -37% | 538 14% | 554 17% |
| Brightness (cd/m²) | 426 | 506 19% | 272 -36% | 508 19% | 532 25% |
| Brightness Distribution (%) | 85 | 83 -2% | 87 2% | 88 4% | 88 4% |
| Black Level * (cd/m²) | 0.42 | 0.41 2% | 0.27 36% | 0.47 -12% | 0.52 -24% |
| Contrast (:1) | 1126 | 1359 21% | 1096 -3% | 1145 2% | 1065 -5% |
| Colorchecker dE 2000 * | 3.47 | 2.91 16% | 1.35 61% | 1.9 45% | 2.81 19% |
| Colorchecker dE 2000 max. * | 7.24 | 5.94 18% | 4.76 34% | 4 45% | 8.32 -15% |
| Colorchecker dE 2000 calibrated * | 1.36 | 1.63 -20% | 0.78 43% | 0.65 52% | |
| Greyscale dE 2000 * | 3.1 | 3.8 -23% | 2.7 13% | 2.7 13% | 4.7 -52% |
| Gamma | 2.486 88% | 2.23 99% | 2.201 100% | 2.24 98% | 2.3 96% |
| CCT | 6832 95% | 6408 101% | 6770 96% | 7027 93% | 6476 100% |
| Toplam Ortalama (Program / Ayarlar) | -19% /
-5% | -7% /
3% | -21% /
-3% | -4% /
-0% |
* ... daha küçük daha iyidir
Yanıt Sürelerini Görüntüle
| ↔ Tepki Süresi Siyahtan Beyaza | ||
|---|---|---|
| 6 ms ... yükseliş ↗ ve sonbahar↘ birleşimi | ↗ 2.2 ms yükseliş | 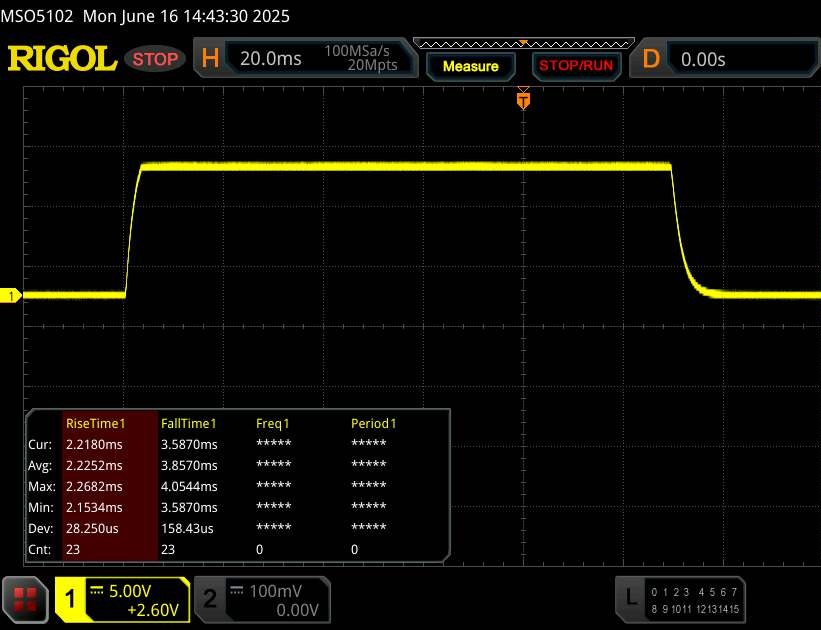 |
| ↘ 3.8 ms sonbahar | ||
| Ekran, testlerimizde çok hızlı yanıt oranları gösteriyor ve hızlı oyun oynamaya çok uygun olmalı. Karşılaştırıldığında, test edilen tüm cihazlar 0.1 (minimum) ile 240 (maksimum) ms arasında değişir. » Tüm cihazların 18 %'si daha iyi. Bu, ölçülen yanıt süresinin test edilen tüm cihazların ortalamasından (19.9 ms) daha iyi olduğu anlamına gelir. | ||
| ↔ Tepki Süresi %50 Griden %80 Griye | ||
| 4.3 ms ... yükseliş ↗ ve sonbahar↘ birleşimi | ↗ 1.8 ms yükseliş | 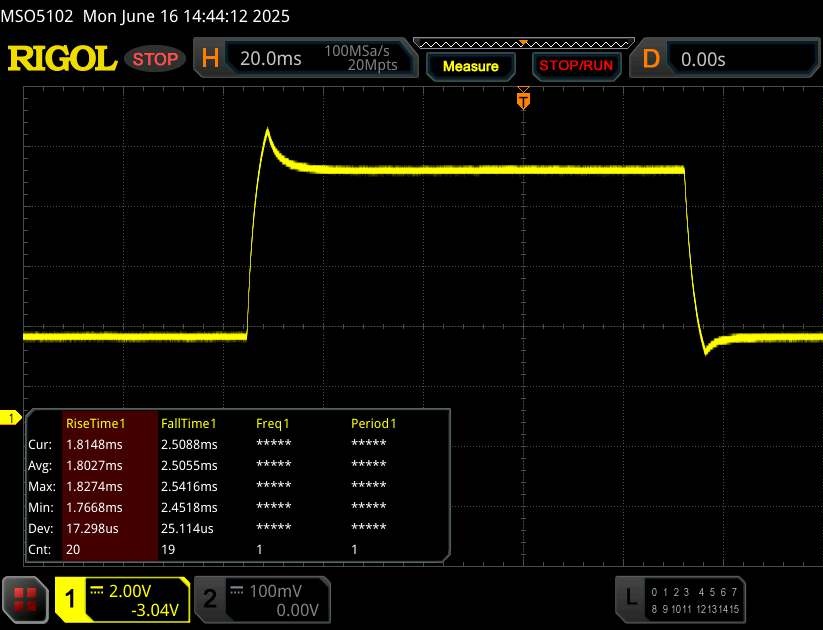 |
| ↘ 2.5 ms sonbahar | ||
| Ekran, testlerimizde çok hızlı yanıt oranları gösteriyor ve hızlı oyun oynamaya çok uygun olmalı. Karşılaştırıldığında, test edilen tüm cihazlar 0.165 (minimum) ile 636 (maksimum) ms arasında değişir. » Tüm cihazların 16 %'si daha iyi. Bu, ölçülen yanıt süresinin test edilen tüm cihazların ortalamasından (31.1 ms) daha iyi olduğu anlamına gelir. | ||
Ekran Titremesi / PWM (Darbe Genişliği Modülasyonu)
| Ekran titriyor / PWM algılanmadı |  | ||
Karşılaştırıldığında: Test edilen tüm cihazların %52 %'si ekranı karartmak için PWM kullanmıyor. PWM tespit edilirse, ortalama 7798 (minimum: 5 - maksimum: 343500) Hz ölçüldü. | |||
Performans
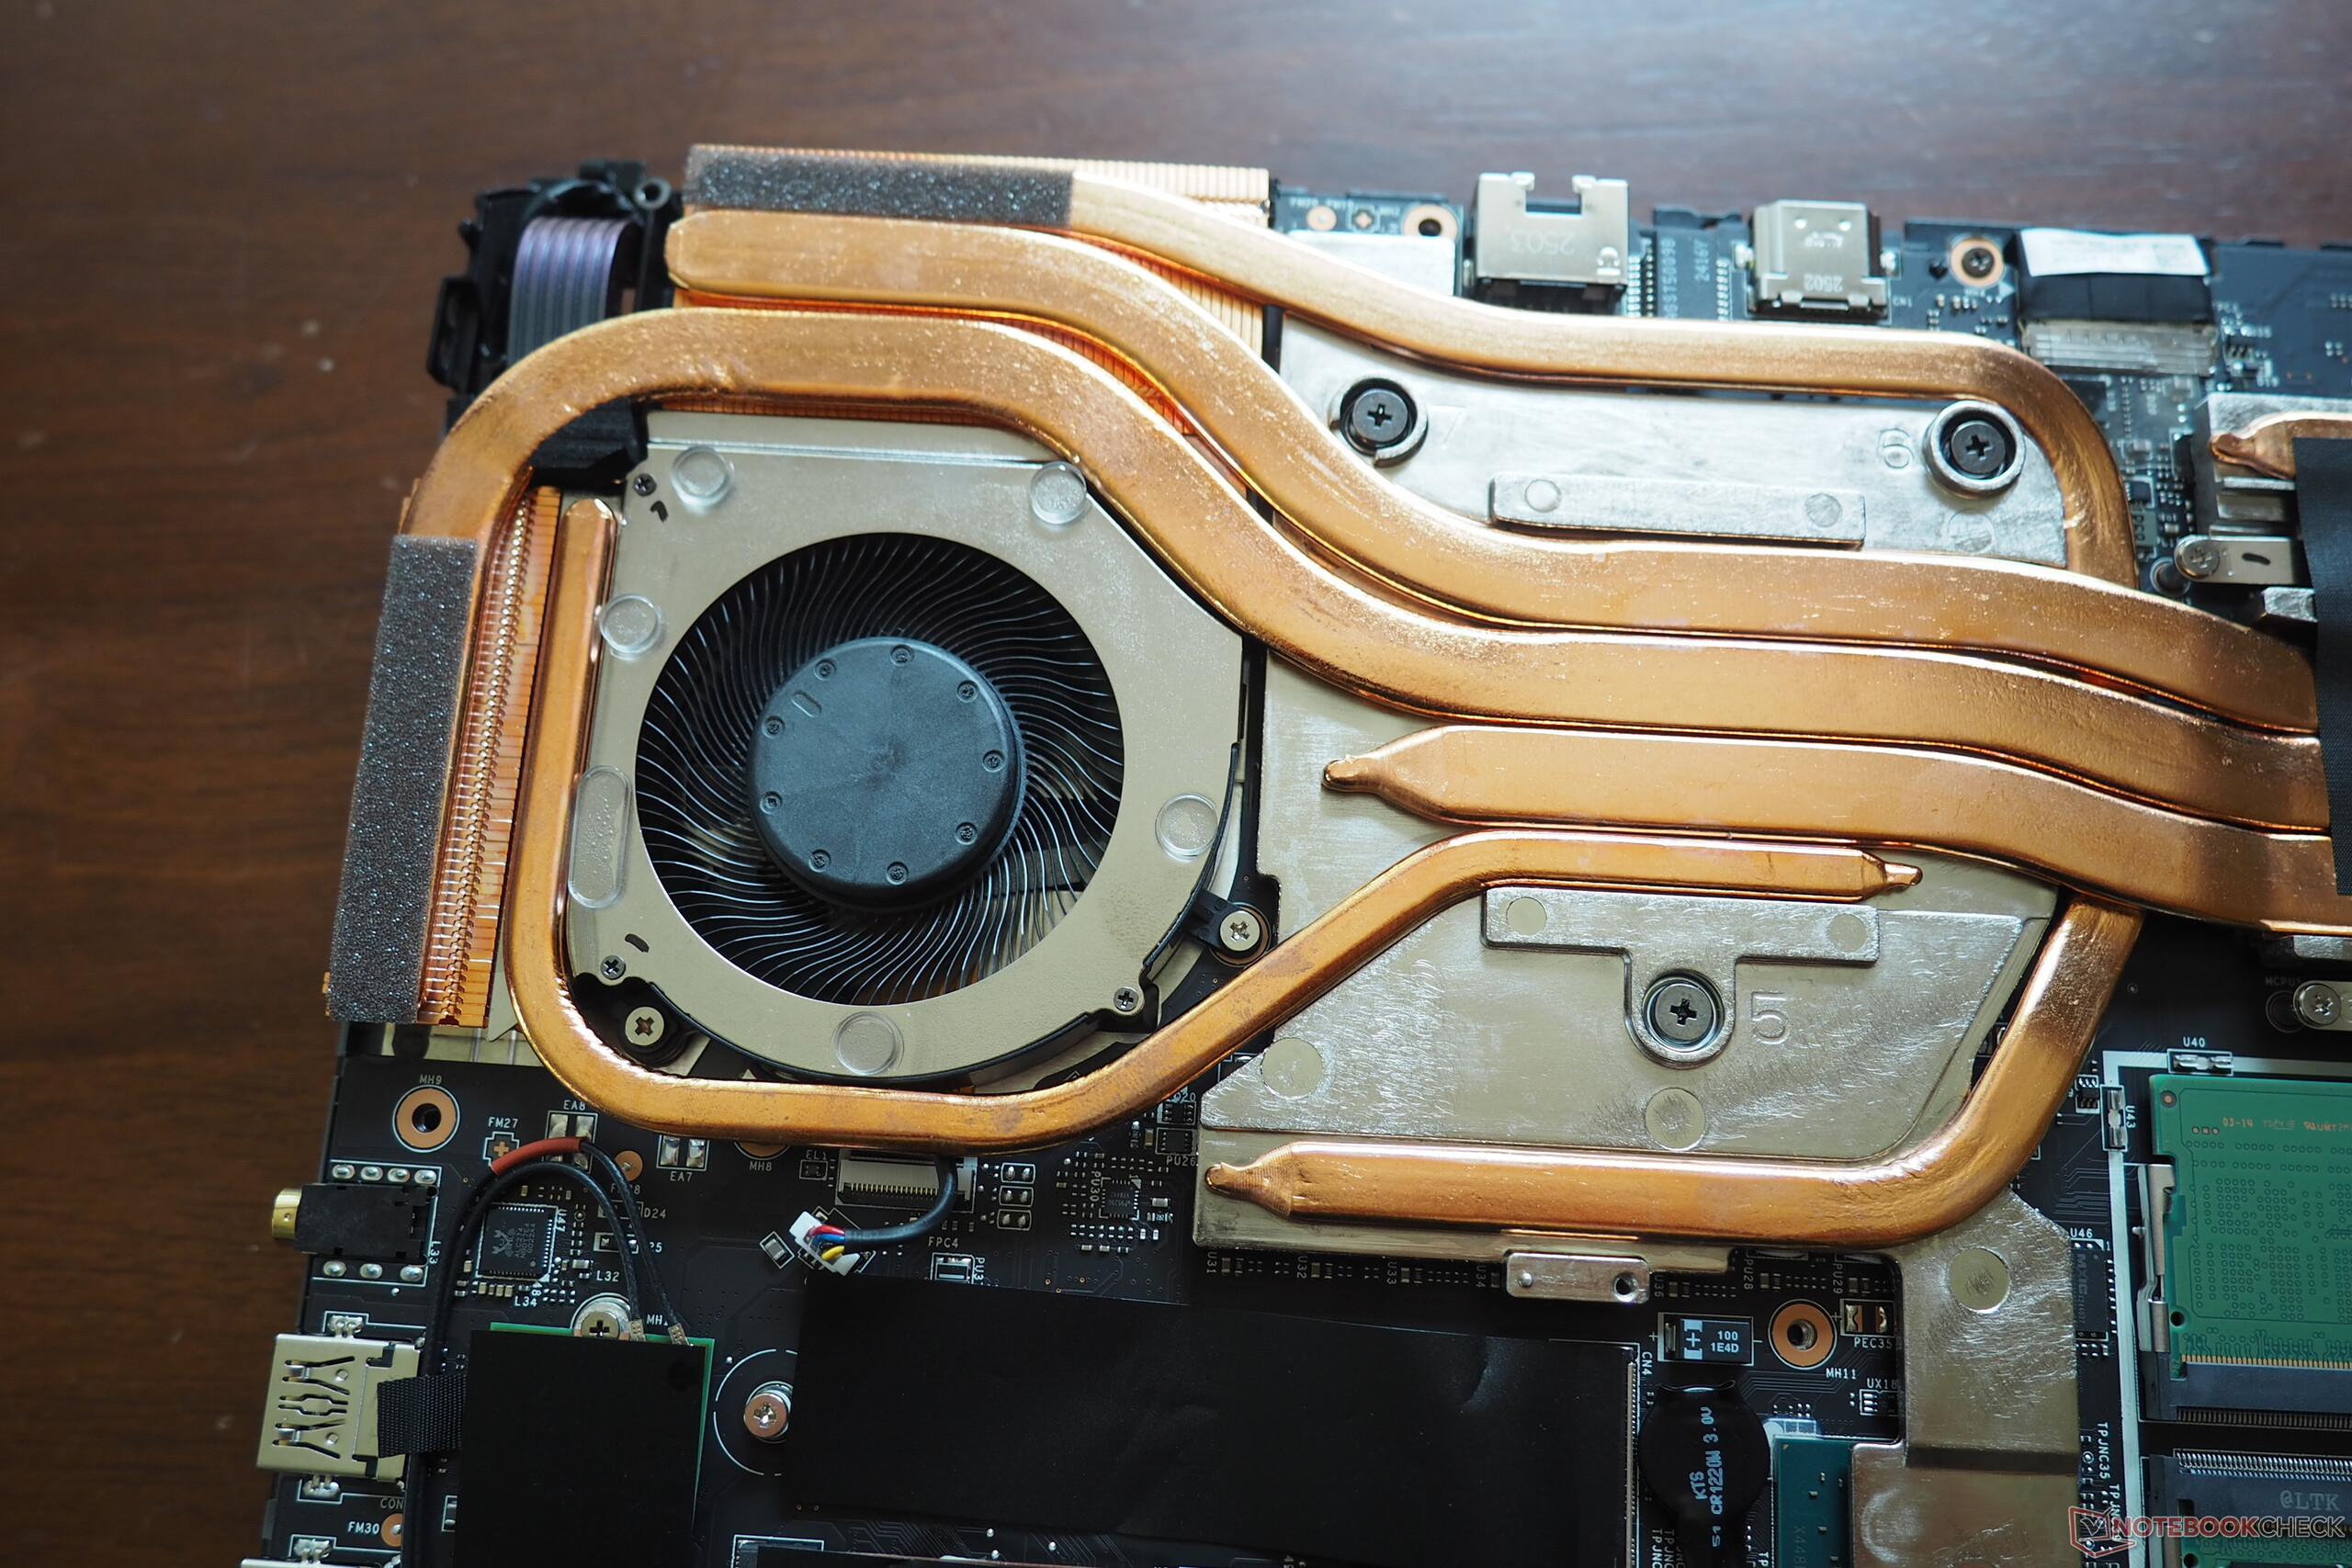
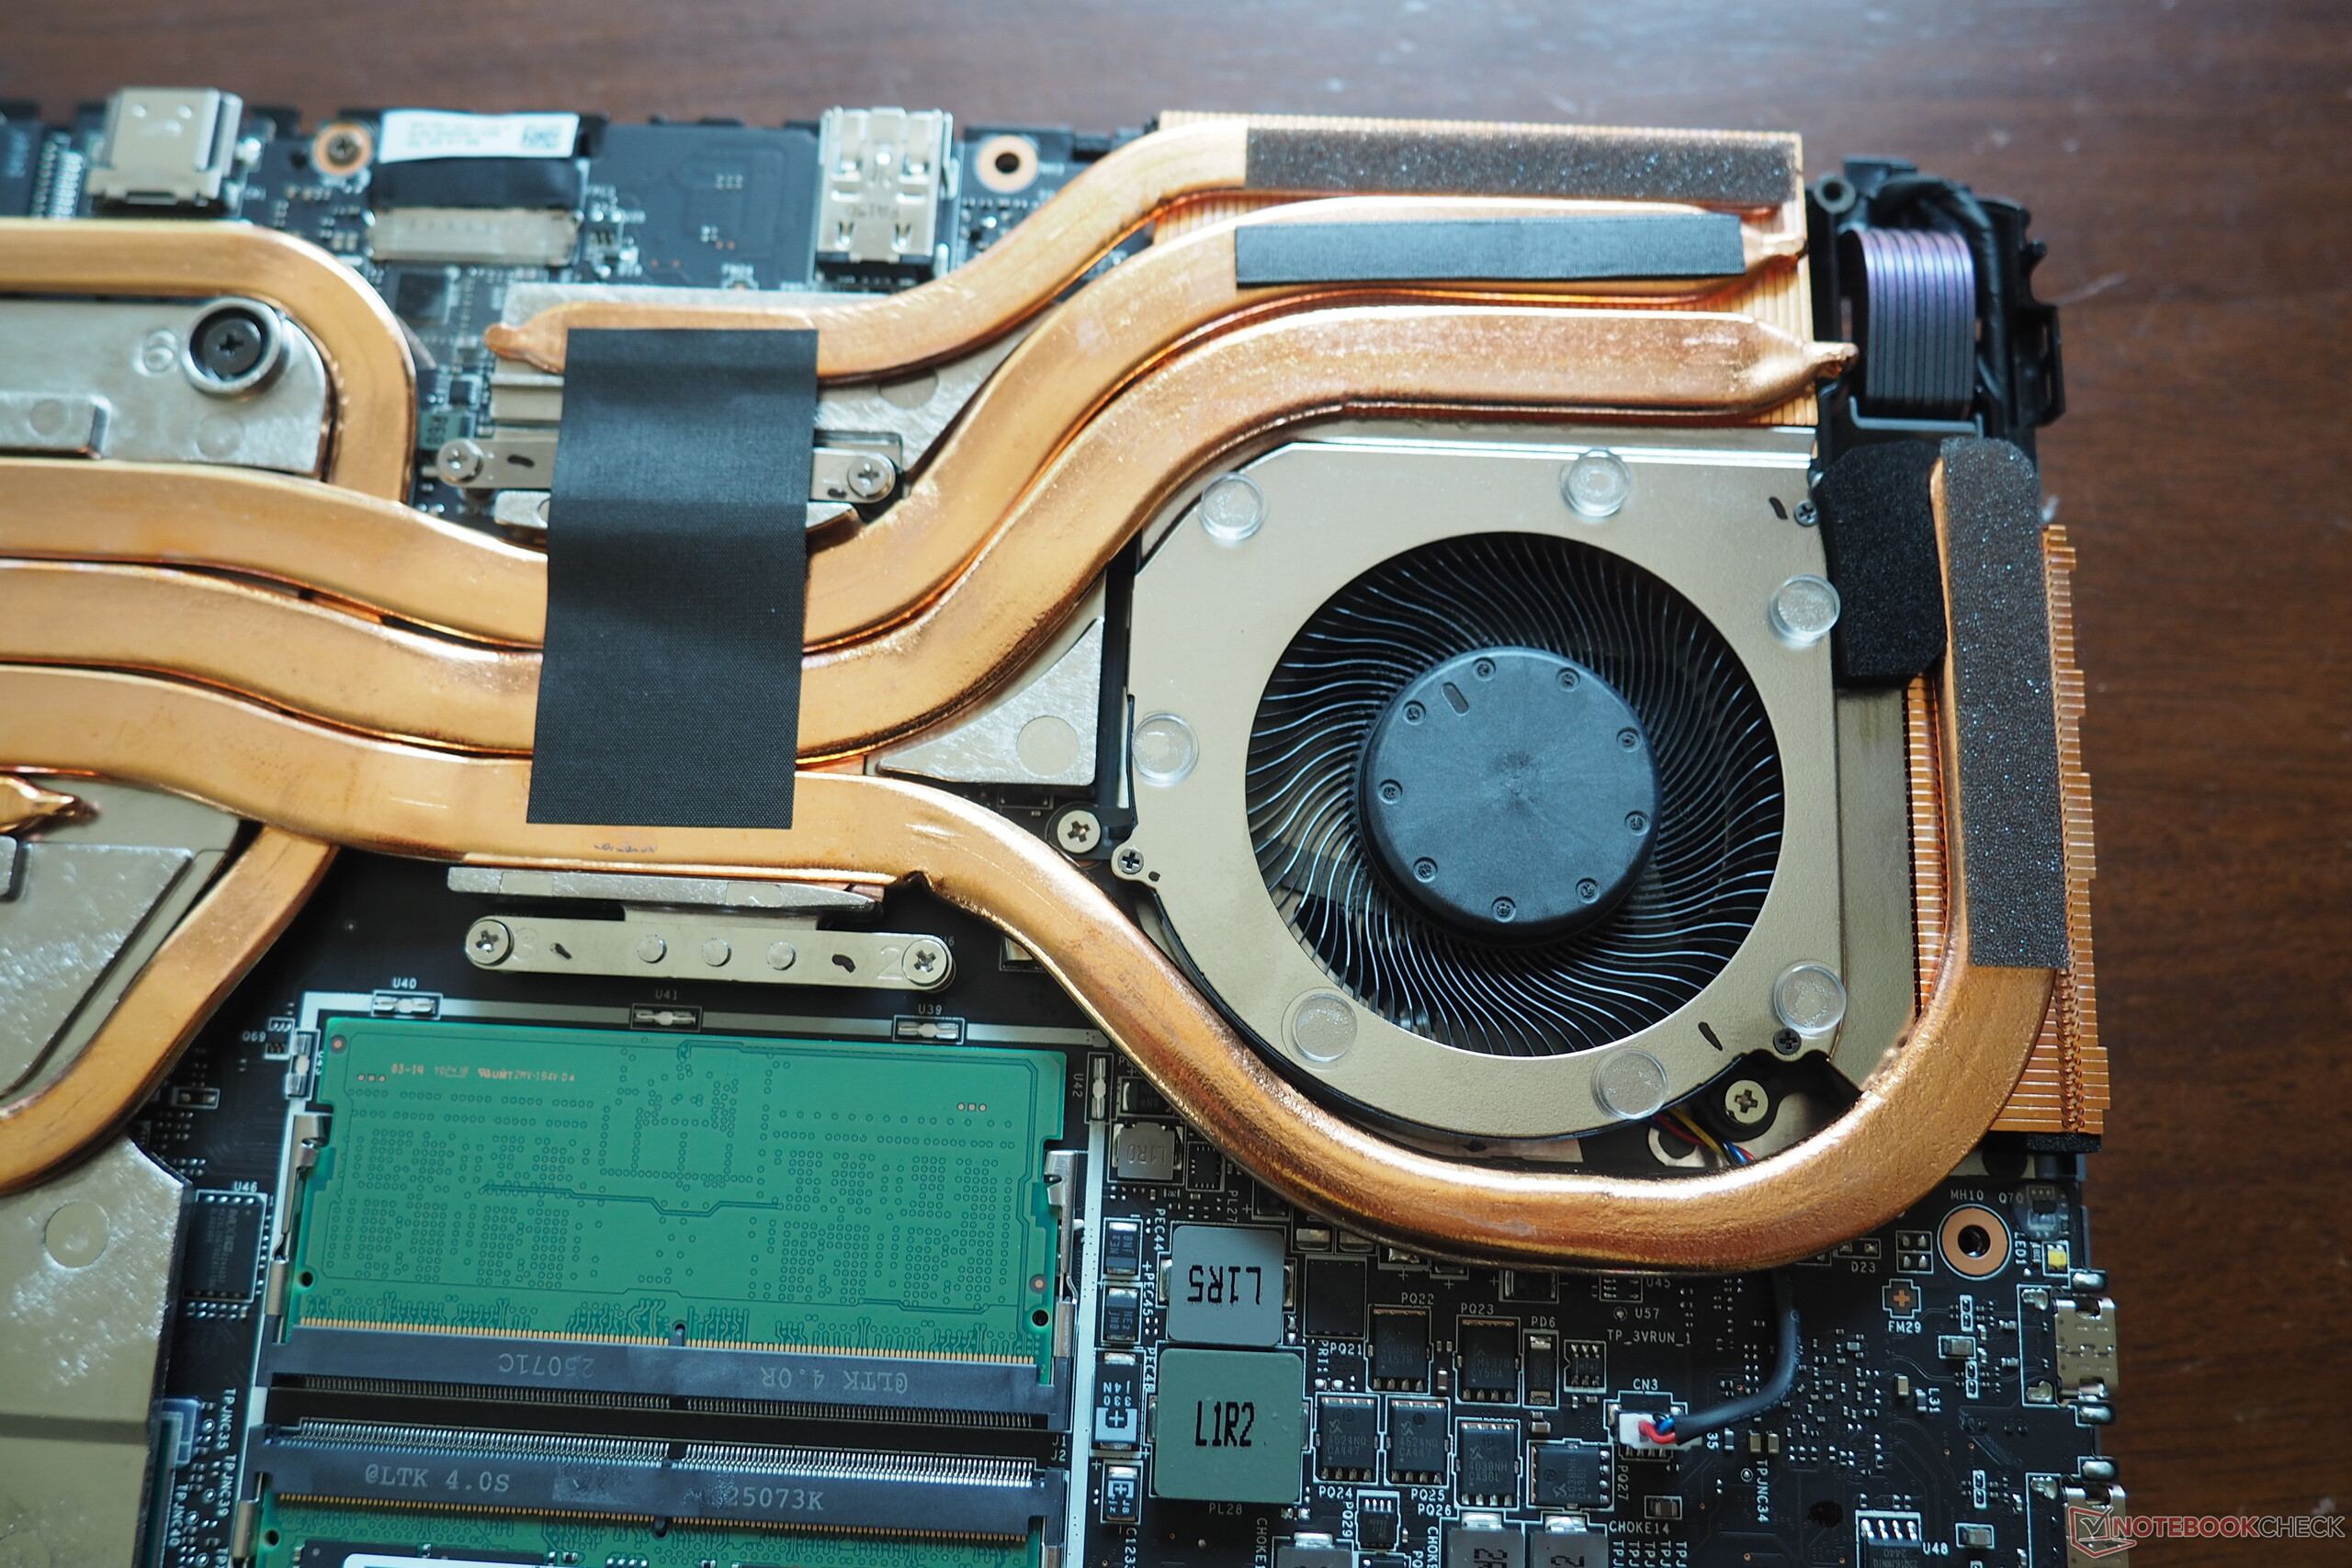
CPU ve GPU gücü açısından Vector 16 HX, oyun dizüstü bilgisayarlarının orta sınıfı ile mutlak üst sınıfı arasında rahatça oturur. SSD ve RAM kapasitesi, her biri iki yuva sayesinde kolayca yükseltilebilir veya gerektiğinde genişletilebilir.
Test koşulları
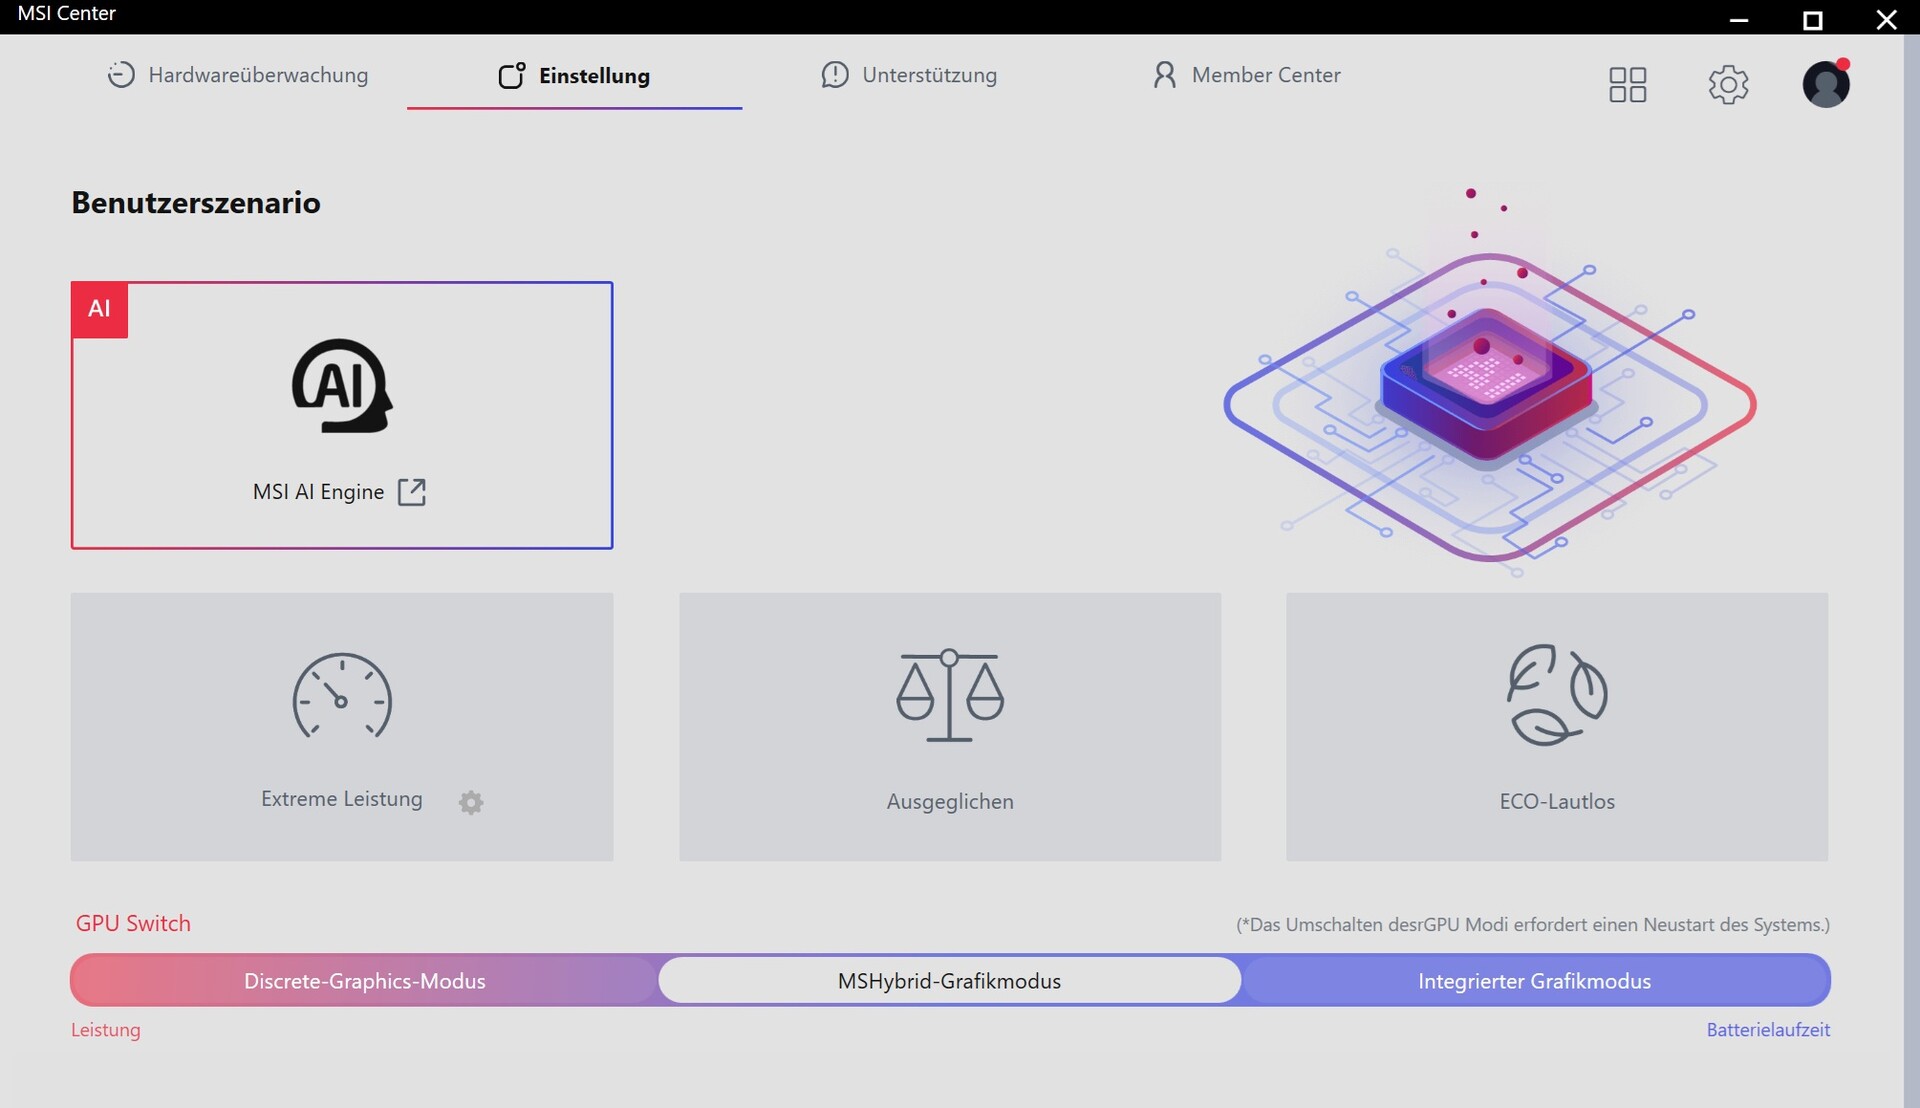
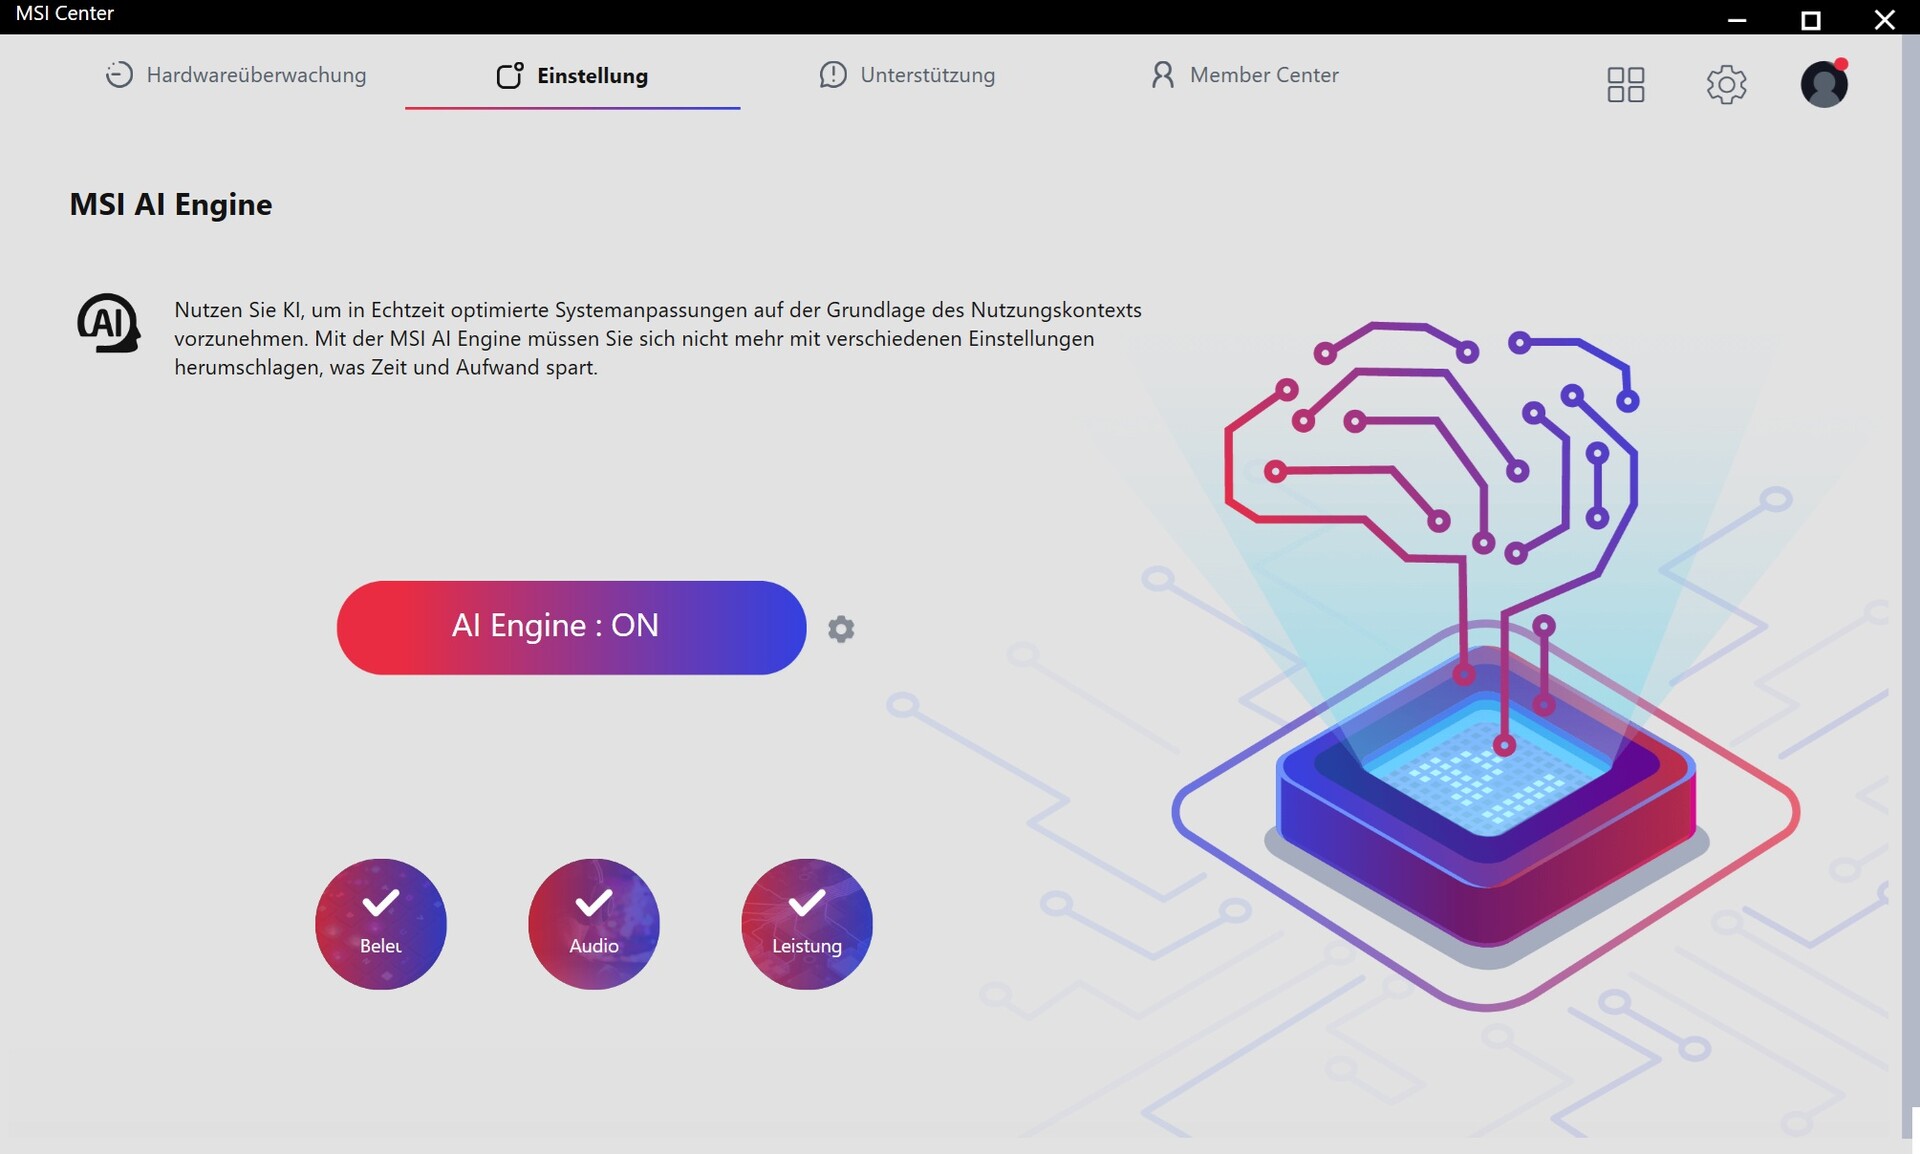
MSI Center, ölçümler için AI profilinin kullanıldığı dört çalışma modu içeriyor ve testlerimize göre bu modlar çoğunlukla "Maksimum performans" modundan ziyade "Dengeli" moda dayanıyor. Genel olarak ikincisini tavsiye etmiyoruz çünkü 16 inçlik model yük altında 60 dB(A)'nın biraz altında absürt bir ses çıkarıyor. GPU performansı maksimum profilde neredeyse %10 artıyor.
| MSI Center Mode | MSI AI Engine | Olağanüstü performans | Balanced | ECO Silent |
| Cyberpunk 2077 Gürültü | 47 dB(A) | 60 dB(A) | 47 dB(A) | 41 dB(A) |
| Cyberpunk 2077 Performans (FHD/Ultra) | 119.6 fps | 129.9 fps | 117.1 fps | 51.5 fps |
| Cinebench R15 Çoklu Skor | 4118 Puan | 5196 Puan | 4037 Puan | 1064 Puan |
| CPU PL1 | 80 watt | 110 watt | 80 watt | 15 watt |
| CPU PL2 | 80 watt | 220 watt | 80 watt | 15 watt |
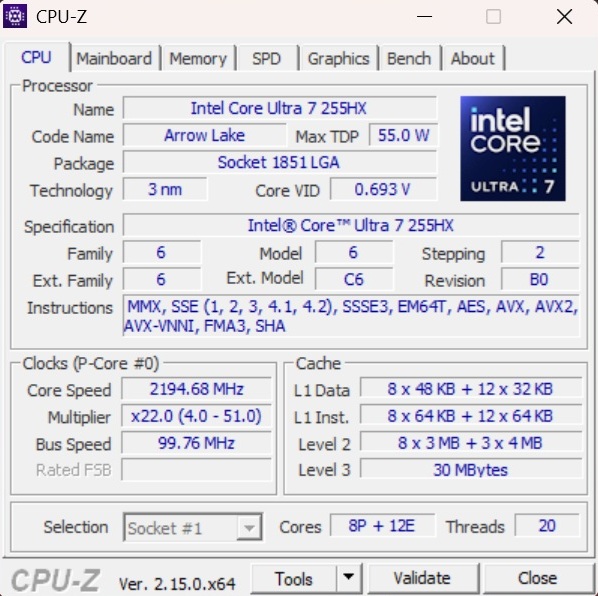
İşlemci
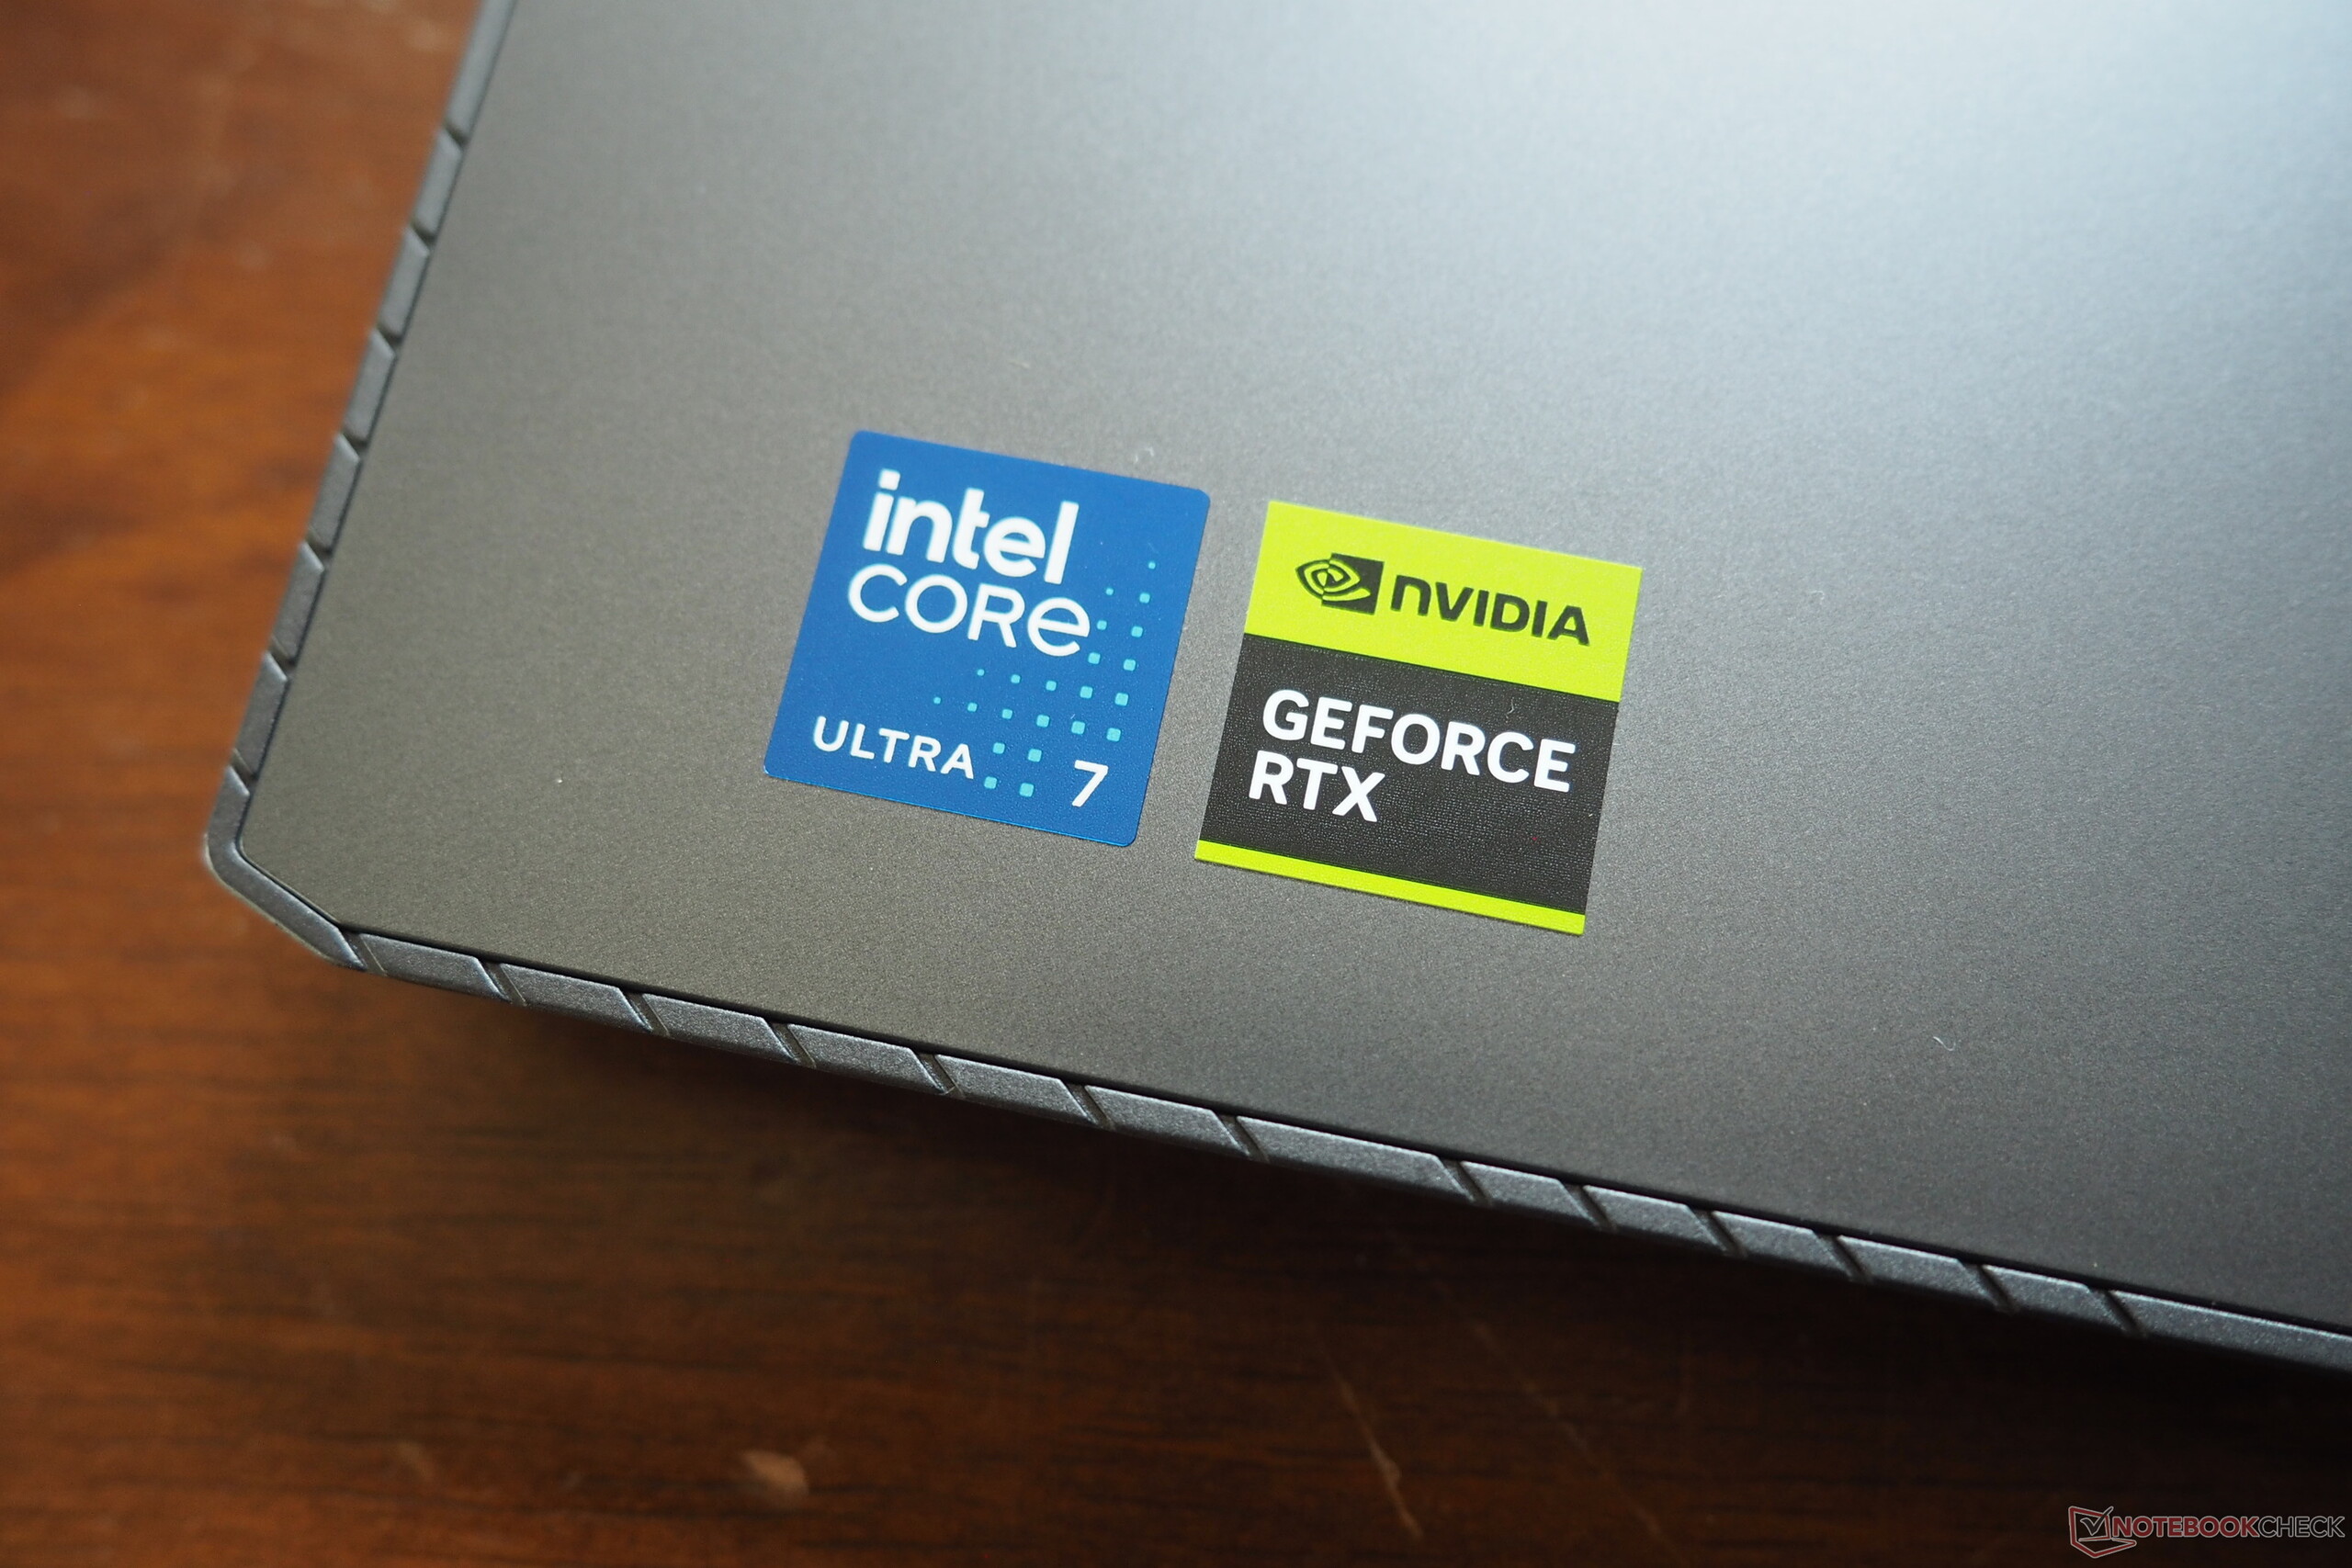
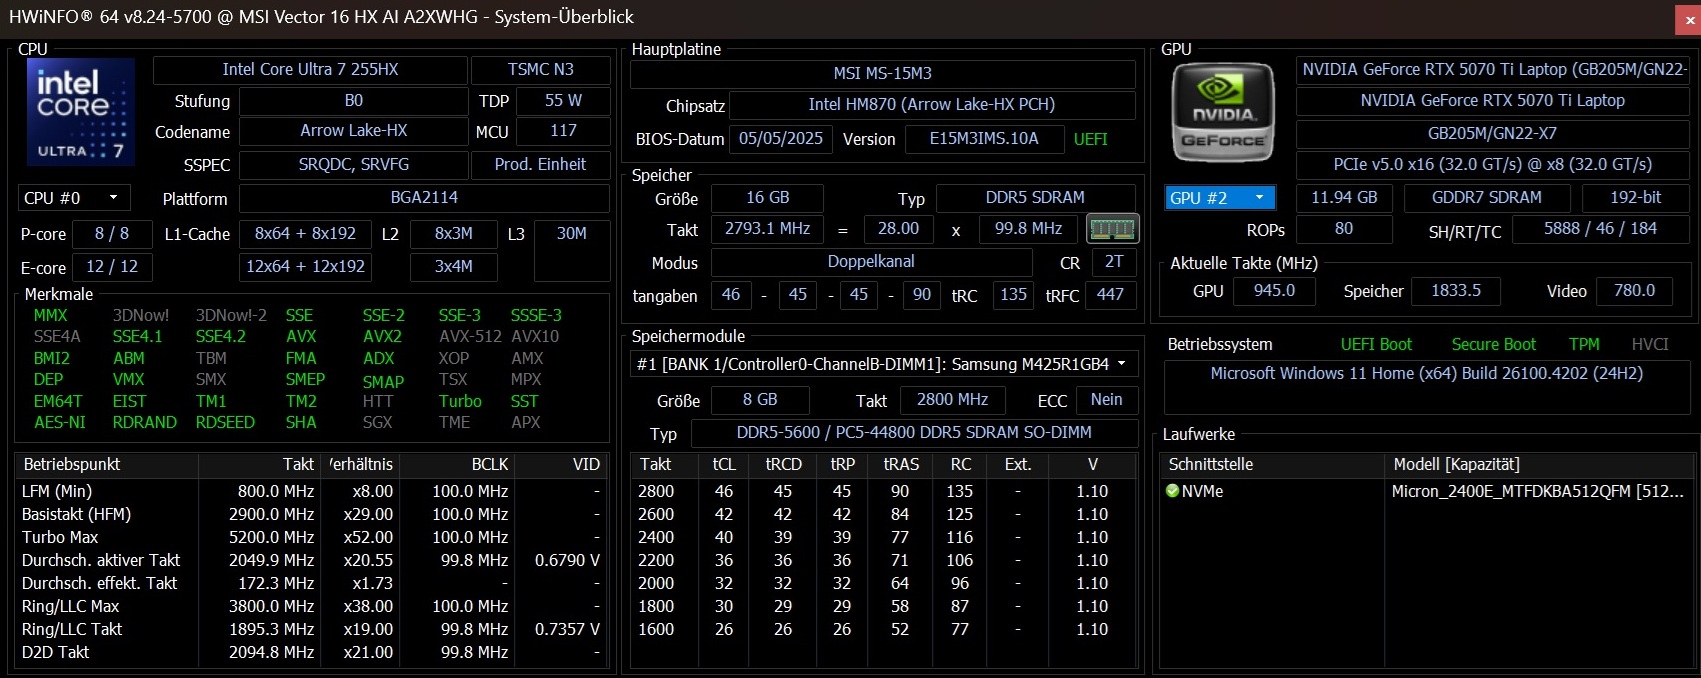
Intel'in Core Ultra 7 255HX vector 16'da prömiyerini kutluyor. Arrow Lake neslinden 3 nm modeli, her biri Hyper-Threading içermeyen 8 performans çekirdeği ve 12 verimlilik çekirdeği ile donatılmıştır. Karşılaştırma testinde 255HX, eski üst düzey Core i9-14900HX yongasından biraz daha kötü performans gösterirken Core i7-14650HX katana 17'nin Core Ultra 9 275HX ortalama olarak yalnızca yaklaşık %10 daha hızlıdır, bu da 255HX için saygıdeğer bir sonuçtur.
Cinebench R15 multi sustained test
* ... daha küçük daha iyidir
AIDA64: FP32 Ray-Trace | FPU Julia | CPU SHA3 | CPU Queen | FPU SinJulia | FPU Mandel | CPU AES | CPU ZLib | FP64 Ray-Trace | CPU PhotoWorxx
| Performance rating | |
| Schenker XMG Pro 16 (E25) | |
| Alienware 16 Area-51 | |
| MSI Vector 16 HX A14V | |
| Ortalama Intel Core Ultra 7 255HX | |
| Sınıf ortalaması Gaming | |
| MSI Vector 16 HX AI A2XWHG | |
| MSI Katana 17 HX B14WGK | |
| AIDA64 / FP32 Ray-Trace | |
| Schenker XMG Pro 16 (E25) | |
| Alienware 16 Area-51 | |
| Ortalama Intel Core Ultra 7 255HX (27732 - 34250, n=5) | |
| Sınıf ortalaması Gaming (10227 - 85542, n=110, son 2 yıl) | |
| MSI Vector 16 HX A14V | |
| MSI Vector 16 HX AI A2XWHG | |
| MSI Katana 17 HX B14WGK | |
| AIDA64 / FPU Julia | |
| Schenker XMG Pro 16 (E25) | |
| Alienware 16 Area-51 | |
| Ortalama Intel Core Ultra 7 255HX (140290 - 167758, n=5) | |
| MSI Vector 16 HX A14V | |
| MSI Vector 16 HX AI A2XWHG | |
| Sınıf ortalaması Gaming (51376 - 238426, n=110, son 2 yıl) | |
| MSI Katana 17 HX B14WGK | |
| AIDA64 / CPU SHA3 | |
| Schenker XMG Pro 16 (E25) | |
| Alienware 16 Area-51 | |
| Ortalama Intel Core Ultra 7 255HX (6445 - 7694, n=5) | |
| MSI Vector 16 HX A14V | |
| MSI Vector 16 HX AI A2XWHG | |
| Sınıf ortalaması Gaming (2180 - 9817, n=110, son 2 yıl) | |
| MSI Katana 17 HX B14WGK | |
| AIDA64 / CPU Queen | |
| MSI Vector 16 HX A14V | |
| Alienware 16 Area-51 | |
| Schenker XMG Pro 16 (E25) | |
| Ortalama Intel Core Ultra 7 255HX (115802 - 135237, n=5) | |
| Sınıf ortalaması Gaming (49785 - 173351, n=101, son 2 yıl) | |
| MSI Vector 16 HX AI A2XWHG | |
| MSI Katana 17 HX B14WGK | |
| AIDA64 / FPU SinJulia | |
| MSI Vector 16 HX A14V | |
| Sınıf ortalaması Gaming (4424 - 33636, n=110, son 2 yıl) | |
| Schenker XMG Pro 16 (E25) | |
| Alienware 16 Area-51 | |
| Ortalama Intel Core Ultra 7 255HX (11066 - 12286, n=5) | |
| MSI Vector 16 HX AI A2XWHG | |
| MSI Katana 17 HX B14WGK | |
| AIDA64 / FPU Mandel | |
| Schenker XMG Pro 16 (E25) | |
| Alienware 16 Area-51 | |
| Ortalama Intel Core Ultra 7 255HX (72938 - 87947, n=5) | |
| MSI Vector 16 HX AI A2XWHG | |
| MSI Vector 16 HX A14V | |
| Sınıf ortalaması Gaming (25115 - 128721, n=110, son 2 yıl) | |
| MSI Katana 17 HX B14WGK | |
| AIDA64 / CPU AES | |
| MSI Vector 16 HX A14V | |
| Alienware 16 Area-51 | |
| Schenker XMG Pro 16 (E25) | |
| Ortalama Intel Core Ultra 7 255HX (96832 - 116158, n=5) | |
| Sınıf ortalaması Gaming (39258 - 247074, n=110, son 2 yıl) | |
| MSI Vector 16 HX AI A2XWHG | |
| MSI Katana 17 HX B14WGK | |
| AIDA64 / CPU ZLib | |
| MSI Vector 16 HX A14V | |
| Schenker XMG Pro 16 (E25) | |
| Alienware 16 Area-51 | |
| Ortalama Intel Core Ultra 7 255HX (1510 - 1850, n=5) | |
| Sınıf ortalaması Gaming (574 - 2531, n=110, son 2 yıl) | |
| MSI Vector 16 HX AI A2XWHG | |
| MSI Katana 17 HX B14WGK | |
| AIDA64 / FP64 Ray-Trace | |
| Alienware 16 Area-51 | |
| Schenker XMG Pro 16 (E25) | |
| Ortalama Intel Core Ultra 7 255HX (15137 - 18315, n=5) | |
| Sınıf ortalaması Gaming (5509 - 45446, n=110, son 2 yıl) | |
| MSI Vector 16 HX A14V | |
| MSI Vector 16 HX AI A2XWHG | |
| MSI Katana 17 HX B14WGK | |
| AIDA64 / CPU PhotoWorxx | |
| Alienware 16 Area-51 | |
| Schenker XMG Pro 16 (E25) | |
| MSI Vector 16 HX A14V | |
| Ortalama Intel Core Ultra 7 255HX (39697 - 54070, n=5) | |
| Sınıf ortalaması Gaming (12271 - 89891, n=110, son 2 yıl) | |
| MSI Vector 16 HX AI A2XWHG | |
| MSI Katana 17 HX B14WGK | |
Sistem performansı
Sistem performansı göze çarpmıyor, 16 inçlik cihaz beklenen aralıkta performans gösteriyor. İlginç: Daha zayıf olduğu düşünülen bileşenlere (CPU/GPU) rağmen, aynı anda test edilen Katana 17 daha hızlı açılıyor.
PCMark 10: Score | Essentials | Productivity | Digital Content Creation
CrossMark: Overall | Productivity | Creativity | Responsiveness
WebXPRT 3: Overall
WebXPRT 4: Overall
Mozilla Kraken 1.1: Total
| Performance rating | |
| Alienware 16 Area-51 | |
| Schenker XMG Pro 16 (E25) | |
| MSI Vector 16 HX A14V | |
| Sınıf ortalaması Gaming | |
| Ortalama Intel Core Ultra 7 255HX, NVIDIA GeForce RTX 5070 Ti Laptop | |
| MSI Vector 16 HX AI A2XWHG | |
| MSI Katana 17 HX B14WGK | |
| PCMark 10 / Score | |
| Alienware 16 Area-51 | |
| MSI Vector 16 HX A14V | |
| Schenker XMG Pro 16 (E25) | |
| Sınıf ortalaması Gaming (5828 - 11574, n=96, son 2 yıl) | |
| Ortalama Intel Core Ultra 7 255HX, NVIDIA GeForce RTX 5070 Ti Laptop (7842 - 7858, n=2) | |
| MSI Vector 16 HX AI A2XWHG | |
| MSI Katana 17 HX B14WGK | |
| PCMark 10 / Essentials | |
| MSI Vector 16 HX A14V | |
| Schenker XMG Pro 16 (E25) | |
| Alienware 16 Area-51 | |
| Ortalama Intel Core Ultra 7 255HX, NVIDIA GeForce RTX 5070 Ti Laptop (10737 - 10773, n=2) | |
| MSI Vector 16 HX AI A2XWHG | |
| Sınıf ortalaması Gaming (8810 - 12600, n=100, son 2 yıl) | |
| MSI Katana 17 HX B14WGK | |
| PCMark 10 / Productivity | |
| Sınıf ortalaması Gaming (6845 - 18766, n=98, son 2 yıl) | |
| MSI Vector 16 HX A14V | |
| Schenker XMG Pro 16 (E25) | |
| MSI Vector 16 HX AI A2XWHG | |
| Ortalama Intel Core Ultra 7 255HX, NVIDIA GeForce RTX 5070 Ti Laptop (9270 - 9510, n=2) | |
| Alienware 16 Area-51 | |
| MSI Katana 17 HX B14WGK | |
| PCMark 10 / Digital Content Creation | |
| Alienware 16 Area-51 | |
| MSI Vector 16 HX A14V | |
| Schenker XMG Pro 16 (E25) | |
| Sınıf ortalaması Gaming (7602 - 19657, n=98, son 2 yıl) | |
| Ortalama Intel Core Ultra 7 255HX, NVIDIA GeForce RTX 5070 Ti Laptop (12817 - 13186, n=2) | |
| MSI Vector 16 HX AI A2XWHG | |
| MSI Katana 17 HX B14WGK | |
| CrossMark / Overall | |
| Schenker XMG Pro 16 (E25) | |
| MSI Vector 16 HX A14V | |
| Alienware 16 Area-51 | |
| Ortalama Intel Core Ultra 7 255HX, NVIDIA GeForce RTX 5070 Ti Laptop (1944 - 2097, n=2) | |
| Sınıf ortalaması Gaming (1366 - 2409, n=98, son 2 yıl) | |
| MSI Katana 17 HX B14WGK | |
| MSI Vector 16 HX AI A2XWHG | |
| CrossMark / Productivity | |
| MSI Vector 16 HX A14V | |
| Schenker XMG Pro 16 (E25) | |
| Alienware 16 Area-51 | |
| Ortalama Intel Core Ultra 7 255HX, NVIDIA GeForce RTX 5070 Ti Laptop (1845 - 1959, n=2) | |
| MSI Katana 17 HX B14WGK | |
| Sınıf ortalaması Gaming (1386 - 2254, n=98, son 2 yıl) | |
| MSI Vector 16 HX AI A2XWHG | |
| CrossMark / Creativity | |
| Schenker XMG Pro 16 (E25) | |
| MSI Vector 16 HX A14V | |
| Alienware 16 Area-51 | |
| Ortalama Intel Core Ultra 7 255HX, NVIDIA GeForce RTX 5070 Ti Laptop (2249 - 2400, n=2) | |
| MSI Vector 16 HX AI A2XWHG | |
| Sınıf ortalaması Gaming (1343 - 2729, n=98, son 2 yıl) | |
| MSI Katana 17 HX B14WGK | |
| CrossMark / Responsiveness | |
| Alienware 16 Area-51 | |
| MSI Vector 16 HX A14V | |
| MSI Katana 17 HX B14WGK | |
| Schenker XMG Pro 16 (E25) | |
| Sınıf ortalaması Gaming (1226 - 2334, n=98, son 2 yıl) | |
| Ortalama Intel Core Ultra 7 255HX, NVIDIA GeForce RTX 5070 Ti Laptop (1468 - 1713, n=2) | |
| MSI Vector 16 HX AI A2XWHG | |
| WebXPRT 3 / Overall | |
| Schenker XMG Pro 16 (E25) | |
| Alienware 16 Area-51 | |
| MSI Vector 16 HX A14V | |
| Ortalama Intel Core Ultra 7 255HX, NVIDIA GeForce RTX 5070 Ti Laptop (319 - 325, n=2) | |
| MSI Vector 16 HX AI A2XWHG | |
| Sınıf ortalaması Gaming (242 - 532, n=101, son 2 yıl) | |
| MSI Katana 17 HX B14WGK | |
| WebXPRT 4 / Overall | |
| Schenker XMG Pro 16 (E25) | |
| Alienware 16 Area-51 | |
| Ortalama Intel Core Ultra 7 255HX, NVIDIA GeForce RTX 5070 Ti Laptop (305 - 306, n=2) | |
| MSI Vector 16 HX AI A2XWHG | |
| MSI Vector 16 HX A14V | |
| Sınıf ortalaması Gaming (176.4 - 354, n=101, son 2 yıl) | |
| MSI Katana 17 HX B14WGK | |
| Mozilla Kraken 1.1 / Total | |
| MSI Katana 17 HX B14WGK | |
| Sınıf ortalaması Gaming (391 - 590, n=106, son 2 yıl) | |
| MSI Vector 16 HX A14V | |
| MSI Vector 16 HX AI A2XWHG | |
| Ortalama Intel Core Ultra 7 255HX, NVIDIA GeForce RTX 5070 Ti Laptop (425 - 425, n=2) | |
| Alienware 16 Area-51 | |
| Schenker XMG Pro 16 (E25) | |
* ... daha küçük daha iyidir
| PCMark 10 Score | 7842 puan | |
Yardım | ||
| AIDA64 / Memory Copy | |
| Schenker XMG Pro 16 (E25) | |
| Alienware 16 Area-51 | |
| Ortalama Intel Core Ultra 7 255HX (68939 - 104987, n=5) | |
| MSI Vector 16 HX A14V | |
| Sınıf ortalaması Gaming (21750 - 129946, n=110, son 2 yıl) | |
| MSI Vector 16 HX AI A2XWHG | |
| MSI Katana 17 HX B14WGK | |
| AIDA64 / Memory Read | |
| Schenker XMG Pro 16 (E25) | |
| Alienware 16 Area-51 | |
| Ortalama Intel Core Ultra 7 255HX (82336 - 95821, n=5) | |
| MSI Vector 16 HX A14V | |
| MSI Vector 16 HX AI A2XWHG | |
| Sınıf ortalaması Gaming (22956 - 118858, n=110, son 2 yıl) | |
| MSI Katana 17 HX B14WGK | |
| AIDA64 / Memory Write | |
| Ortalama Intel Core Ultra 7 255HX (66479 - 133486, n=5) | |
| Schenker XMG Pro 16 (E25) | |
| Alienware 16 Area-51 | |
| MSI Vector 16 HX A14V | |
| Sınıf ortalaması Gaming (22297 - 135096, n=110, son 2 yıl) | |
| MSI Vector 16 HX AI A2XWHG | |
| MSI Katana 17 HX B14WGK | |
| AIDA64 / Memory Latency | |
| Alienware 16 Area-51 | |
| Ortalama Intel Core Ultra 7 255HX (104.2 - 110, n=5) | |
| MSI Vector 16 HX AI A2XWHG | |
| Sınıf ortalaması Gaming (75.3 - 259, n=110, son 2 yıl) | |
| Schenker XMG Pro 16 (E25) | |
| MSI Katana 17 HX B14WGK | |
| MSI Vector 16 HX A14V | |
* ... daha küçük daha iyidir
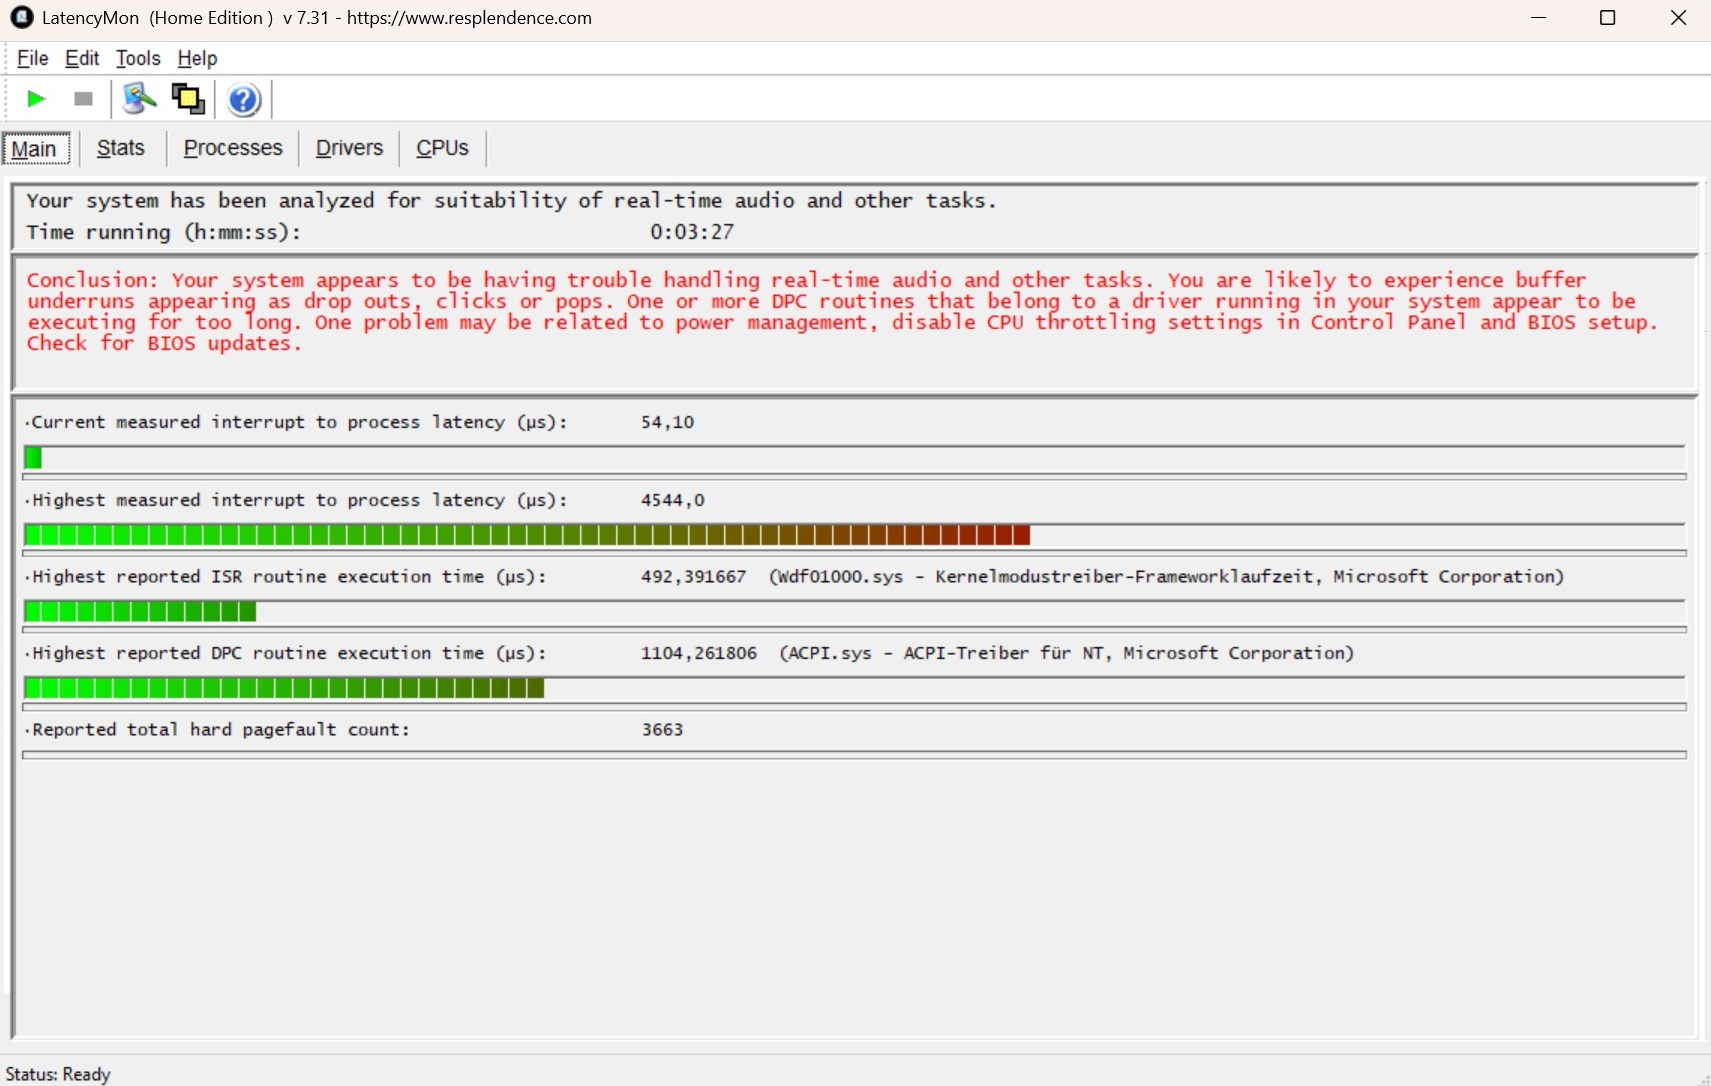
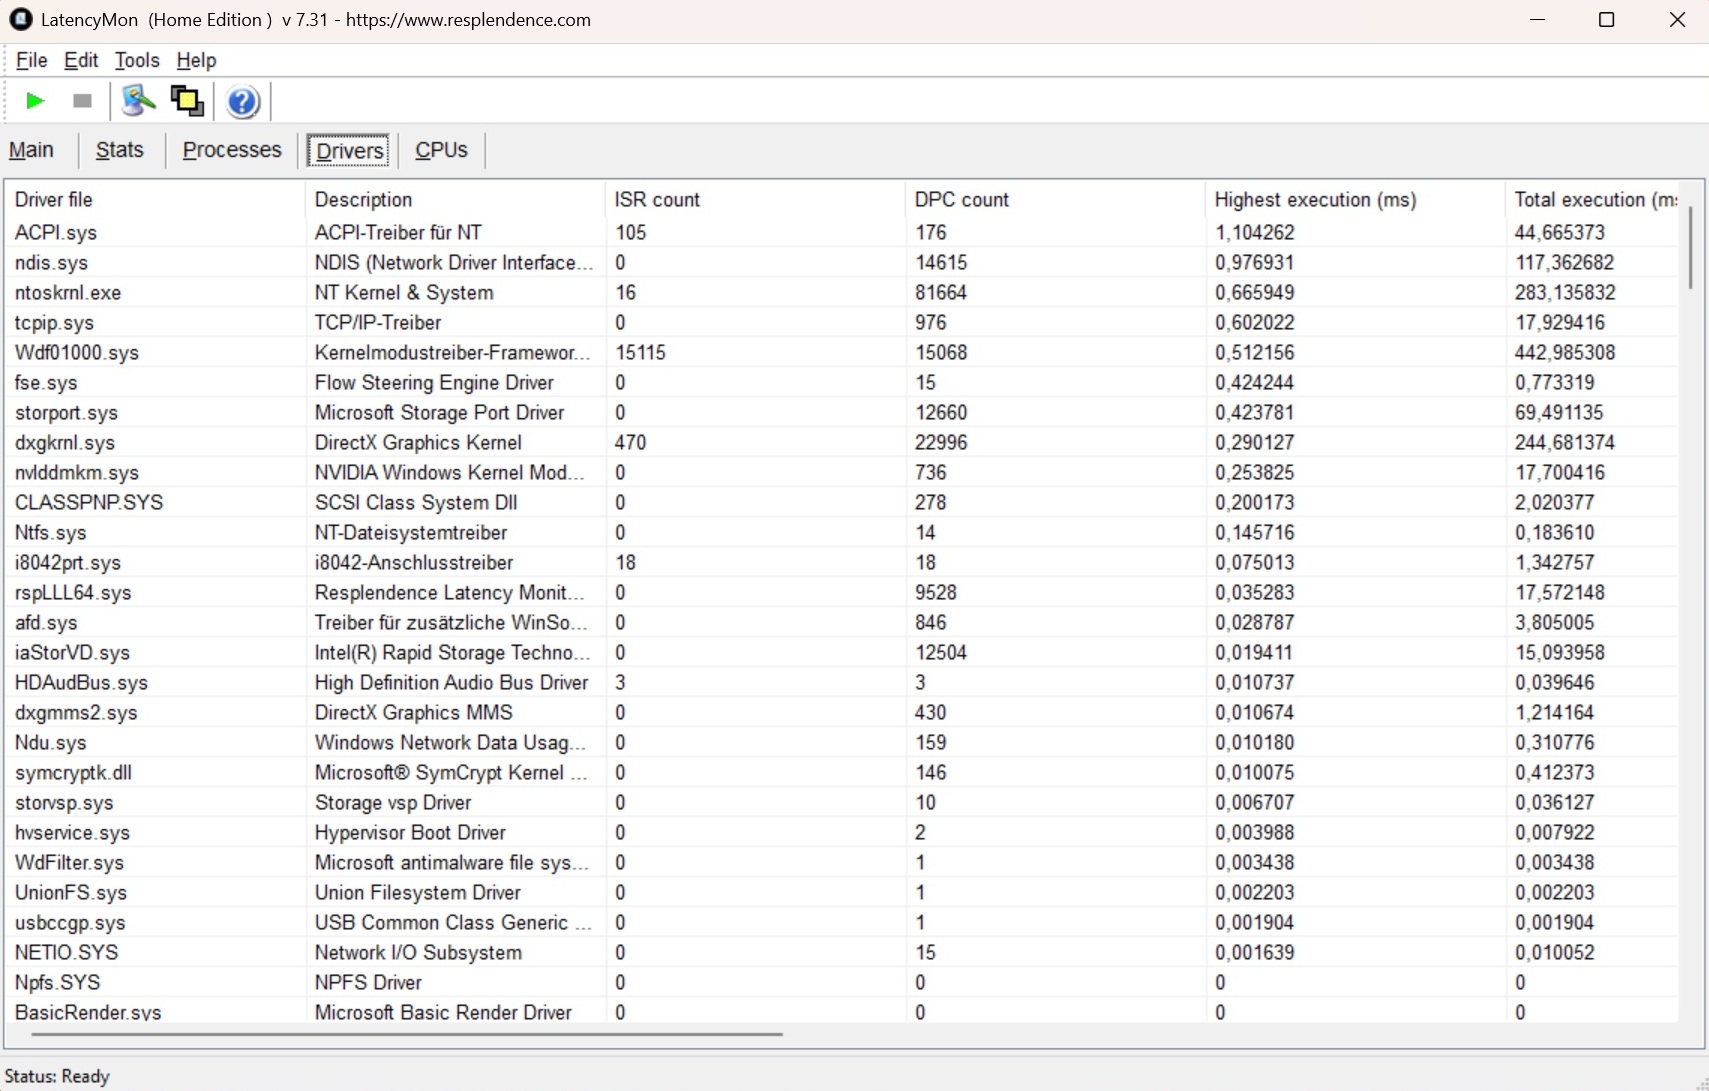
DPC gecikme süreleri
MSI hala gecikme sorunu üzerinde çalışmalıdır. LatencyMon'a göre, hem Vector 16 hem de Katana 17 aşırı yüksek değerlere ulaşıyor ve bu da kopmalara neden olabiliyor.
| DPC Latencies / LatencyMon - interrupt to process latency (max), Web, Youtube, Prime95 | |
| MSI Katana 17 HX B14WGK | |
| MSI Vector 16 HX AI A2XWHG | |
| Alienware 16 Area-51 | |
| Schenker XMG Pro 16 (E25) | |
| MSI Vector 16 HX A14V | |
* ... daha küçük daha iyidir
Depolama
Yığın depolama açısından da iyileştirme için yer var. Dahili Micron sürücünün okuma hızı bir NVMe modeli için oldukça iyi olsa da, yazma hızı arzulanan bir şey bırakıyor. Bununla birlikte, 16 inçlik sürücü döngü testinde düşüşlerle uğraşmak zorunda kalmadı.

* ... daha küçük daha iyidir
Sustained read performance: DiskSpd read loop, queue depth 8
GPU performansı
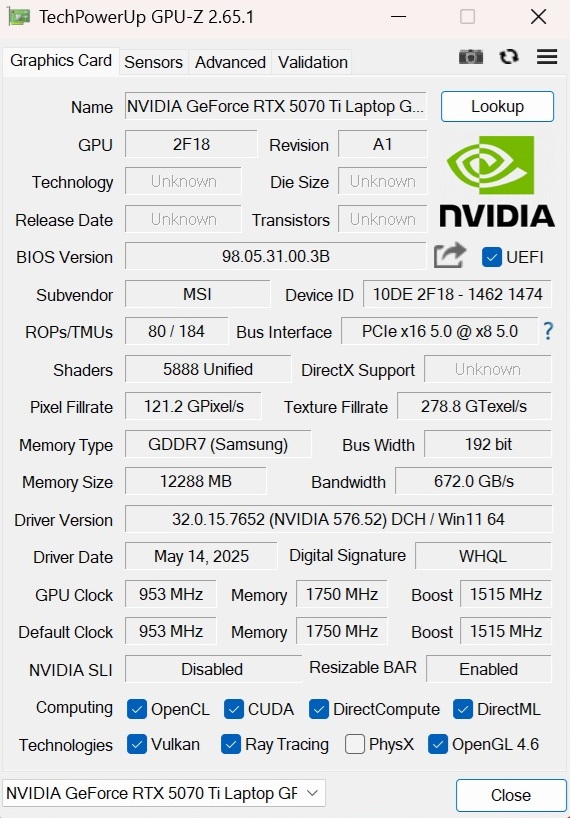
Bu GeForce RTX 5070 Ti bize göre asıl olması gereken RTX 5070 12 GB yerine 8 GB VRAM ile artık güncel değil. Ancak Ti versiyonu hem sentetik kıyaslamalarda hem de oyunlarda iyi bir izlenim bırakıyor. Vector 16'daki sonuçlar, bu grafik kartı için daha önce belirlenen ortalamaya dayanmaktadır. MSI, Blackwell temsilcisine Dynamic Boost dahil maksimum 140 watt TGP veriyor. Bu RTX 5080 alienware 16'nın RTX 5070 Ti'den yaklaşık %20 daha iyi performans göstermesi.
| 3DMark 06 Standard Score | 60964 puan | |
| 3DMark 11 Performance | 41662 puan | |
| 3DMark Cloud Gate Standard Score | 61167 puan | |
| 3DMark Fire Strike Score | 36625 puan | |
| 3DMark Time Spy Score | 15886 puan | |
Yardım | ||
* ... daha küçük daha iyidir
Oyun performansı
RTX 5070 Ti, Full HD ve QHD ekranlar için uygun bir arkadaştır. Standart çözünürlüğümüz olan 2.560 x 1.440 pikselde, zayıf bir şekilde optimize edilmiş Oblivion Yeniden Düzenlendi tüm oyunlar 40+ fps'de çalıştı - tabii ki maksimum ayrıntılarda. Yükseltme etkinleştirildiğinde durum daha da iyi görünüyor. DLSS (4) ve (Çoklu) Çerçeve Üretimi dahil olmak üzere, genellikle aşağıdaki gibi önemli ölçüde daha yüksek değerler elde edilebilir Stalker 2 gösterir (tabloya bakın), bu da daha düzgün bir görüntü sağlar.
| Doom: The Dark Ages | |
| 2560x1440 Ultra Nightmare AA:T | |
| Medion Erazer Beast 18 X1 MD62731 | |
| MSI Vector 16 HX AI A2XWHG | |
| Sınıf ortalaması Gaming (30.4 - 92.2, n=19, son 2 yıl) | |
| Ortalama NVIDIA GeForce RTX 5070 Ti Laptop (45.7 - 59.1, n=3) | |
| MSI Katana 17 HX B14WGK | |
| 2560x1440 Ultra Nightmare - DLSS Quality | |
| Medion Erazer Beast 18 X1 MD62731 | |
| MSI Vector 16 HX AI A2XWHG | |
| Ortalama NVIDIA GeForce RTX 5070 Ti Laptop (61 - 82.5, n=3) | |
| Sınıf ortalaması Gaming (48 - 107.3, n=18, son 2 yıl) | |
| MSI Katana 17 HX B14WGK | |
| The Elder Scrolls IV Oblivion Remastered | |
| 2560x1440 Ultra Preset AA:T | |
| Medion Erazer Beast 18 X1 MD62731 | |
| Ortalama NVIDIA GeForce RTX 5070 Ti Laptop (28 - 30.9, n=3) | |
| MSI Vector 16 HX AI A2XWHG | |
| Sınıf ortalaması Gaming (12.7 - 45.9, n=14, son 2 yıl) | |
| MSI Katana 17 HX B14WGK | |
| 2560x1440 Ultra Preset + Quality DLSS | |
| Medion Erazer Beast 18 X1 MD62731 | |
| Ortalama NVIDIA GeForce RTX 5070 Ti Laptop (41.9 - 47.4, n=3) | |
| MSI Vector 16 HX AI A2XWHG | |
| Sınıf ortalaması Gaming (25.3 - 59.7, n=12, son 2 yıl) | |
| MSI Katana 17 HX B14WGK | |
| Kingdom Come Deliverance 2 | |
| 2560x1440 Ultra Preset | |
| Medion Erazer Beast 18 X1 MD62731 | |
| Ortalama NVIDIA GeForce RTX 5070 Ti Laptop (59 - 65, n=3) | |
| Sınıf ortalaması Gaming (36.8 - 97.2, n=13, son 2 yıl) | |
| MSI Vector 16 HX AI A2XWHG | |
| MSI Katana 17 HX B14WGK | |
| 2560x1440 Ultra Preset + Quality DLSS | |
| Medion Erazer Beast 18 X1 MD62731 | |
| Ortalama NVIDIA GeForce RTX 5070 Ti Laptop (79.2 - 94.7, n=3) | |
| Sınıf ortalaması Gaming (50.3 - 115.5, n=13, son 2 yıl) | |
| MSI Vector 16 HX AI A2XWHG | |
| MSI Katana 17 HX B14WGK | |
| Until Dawn | |
| 2560x1440 Ultra Preset | |
| Medion Erazer Beast 18 X1 MD62731 | |
| Sınıf ortalaması Gaming (30.4 - 76.6, n=11, son 2 yıl) | |
| MSI Vector 16 HX AI A2XWHG | |
| Ortalama NVIDIA GeForce RTX 5070 Ti Laptop (n=1) | |
| MSI Katana 17 HX B14WGK | |
| 2560x1440 Ultra Preset + Quality DLSS + Ray Tracing | |
| Medion Erazer Beast 18 X1 MD62731 | |
| MSI Vector 16 HX AI A2XWHG | |
| Ortalama NVIDIA GeForce RTX 5070 Ti Laptop (n=1) | |
| Sınıf ortalaması Gaming (39.5 - 86.3, n=10, son 2 yıl) | |
| MSI Katana 17 HX B14WGK | |
| Space Marine 2 | |
| 2560x1440 Ultra Preset AA:T | |
| Medion Erazer Beast 18 X1 MD62731 | |
| MSI Vector 16 HX AI A2XWHG | |
| Ortalama NVIDIA GeForce RTX 5070 Ti Laptop (n=1) | |
| Sınıf ortalaması Gaming (48.2 - 107.4, n=11, son 2 yıl) | |
| MSI Katana 17 HX B14WGK | |
| 2560x1440 Ultra Preset + Quality DLSS | |
| Medion Erazer Beast 18 X1 MD62731 | |
| MSI Vector 16 HX AI A2XWHG | |
| Ortalama NVIDIA GeForce RTX 5070 Ti Laptop (n=1) | |
| Sınıf ortalaması Gaming (58.5 - 100.8, n=10, son 2 yıl) | |
| MSI Katana 17 HX B14WGK | |
| Senua's Saga Hellblade 2 | |
| 2560x1440 High Preset | |
| Medion Erazer Beast 18 X1 MD62731 | |
| MSI Vector 16 HX AI A2XWHG | |
| Ortalama NVIDIA GeForce RTX 5070 Ti Laptop (n=1) | |
| Sınıf ortalaması Gaming (24.2 - 63.1, n=12, son 2 yıl) | |
| MSI Katana 17 HX B14WGK | |
| 2560x1440 High Preset + Quality DLSS | |
| Medion Erazer Beast 18 X1 MD62731 | |
| MSI Vector 16 HX AI A2XWHG | |
| Ortalama NVIDIA GeForce RTX 5070 Ti Laptop (n=1) | |
| Sınıf ortalaması Gaming (39.6 - 81.9, n=10, son 2 yıl) | |
| MSI Katana 17 HX B14WGK | |
| Ghost of Tsushima | |
| 2560x1440 Very High Preset AA:T | |
| Medion Erazer Beast 18 X1 MD62731 | |
| MSI Vector 16 HX AI A2XWHG | |
| Ortalama NVIDIA GeForce RTX 5070 Ti Laptop (n=1) | |
| Sınıf ortalaması Gaming (22.7 - 100.3, n=14, son 2 yıl) | |
| MSI Katana 17 HX B14WGK | |
| 2560x1440 Very High Preset + Quality DLSS | |
| Medion Erazer Beast 18 X1 MD62731 | |
| MSI Vector 16 HX AI A2XWHG | |
| Ortalama NVIDIA GeForce RTX 5070 Ti Laptop (n=1) | |
| Sınıf ortalaması Gaming (55.2 - 105.2, n=11, son 2 yıl) | |
| MSI Katana 17 HX B14WGK | |
| Horizon Forbidden West | |
| 2560x1440 Very High Preset AA:T | |
| Medion Erazer Beast 18 X1 MD62731 | |
| MSI Vector 16 HX AI A2XWHG | |
| Ortalama NVIDIA GeForce RTX 5070 Ti Laptop (n=1) | |
| Sınıf ortalaması Gaming (39.6 - 100.9, n=10, son 2 yıl) | |
| MSI Katana 17 HX B14WGK | |
| 2560x1440 Very High Preset + DLSS Quality | |
| Medion Erazer Beast 18 X1 MD62731 | |
| MSI Vector 16 HX AI A2XWHG | |
| Ortalama NVIDIA GeForce RTX 5070 Ti Laptop (n=1) | |
| Sınıf ortalaması Gaming (58.4 - 116.6, n=8, son 2 yıl) | |
| MSI Katana 17 HX B14WGK | |
| GTA V - 1920x1080 Highest AA:4xMSAA + FX AF:16x | |
| Schenker XMG Pro 16 (E25) | |
| MSI Vector 16 HX AI A2XWHG | |
| Ortalama NVIDIA GeForce RTX 5070 Ti Laptop (98 - 166.3, n=14) | |
| MSI Vector 16 HX A14V | |
| Sınıf ortalaması Gaming (48.3 - 186.9, n=103, son 2 yıl) | |
| MSI Katana 17 HX B14WGK | |
| Final Fantasy XV Benchmark - 1920x1080 High Quality | |
| Alienware 16 Area-51 | |
| MSI Vector 16 HX A14V | |
| MSI Vector 16 HX AI A2XWHG | |
| Ortalama NVIDIA GeForce RTX 5070 Ti Laptop (108.9 - 181.4, n=15) | |
| Schenker XMG Pro 16 (E25) | |
| Sınıf ortalaması Gaming (41 - 215, n=104, son 2 yıl) | |
| Strange Brigade - 1920x1080 ultra AA:ultra AF:16 | |
| Alienware 16 Area-51 | |
| MSI Vector 16 HX A14V | |
| Ortalama NVIDIA GeForce RTX 5070 Ti Laptop (136.4 - 353, n=12) | |
| Sınıf ortalaması Gaming (76.3 - 456, n=94, son 2 yıl) | |
| Schenker XMG Pro 16 (E25) | |
| Dota 2 Reborn - 1920x1080 ultra (3/3) best looking | |
| MSI Vector 16 HX A14V | |
| Schenker XMG Pro 16 (E25) | |
| MSI Vector 16 HX AI A2XWHG | |
| Ortalama NVIDIA GeForce RTX 5070 Ti Laptop (115.5 - 193.9, n=15) | |
| Alienware 16 Area-51 | |
| Sınıf ortalaması Gaming (84.8 - 248, n=113, son 2 yıl) | |
| MSI Katana 17 HX B14WGK | |
| düşük | orta | yüksek | ultra | QHD DLSS | QHD | |
|---|---|---|---|---|---|---|
| GTA V (2015) | 185.6 | 179 | 144.8 | 138.8 | ||
| Dota 2 Reborn (2015) | 209 | 183.9 | 175.8 | 164.7 | ||
| Final Fantasy XV Benchmark (2018) | 208 | 163.1 | 119.7 | |||
| X-Plane 11.11 (2018) | 138.7 | 114.7 | 106.6 | |||
| Baldur's Gate 3 (2023) | 179.1 | 151.9 | 147.4 | 99.1 | ||
| Cyberpunk 2077 (2023) | 138.5 | 135.4 | 119.6 | 75 | ||
| Counter-Strike 2 (2023) | 316 | 265 | 222 | 174.1 | ||
| Prince of Persia The Lost Crown (2024) | 358 | 358 | 357 | 356 | ||
| Helldivers 2 (2024) | 143.8 | 141.7 | 141.4 | 101.6 | ||
| Dragon's Dogma 2 (2024) | 83 | 74.8 | ||||
| Horizon Forbidden West (2024) | 131.1 | 97.5 | 96 | 93.1 | 72.6 | |
| Ghost of Tsushima (2024) | 106.5 | 102 | 83.8 | 83.9 | 60.7 | |
| Senua's Saga Hellblade 2 (2024) | 77.2 | 55 | 59.1 | 40 | ||
| Star Wars Outlaws (2024) | 70.7 | 66.5 | 55.9 | 56.8 | 40.3 | |
| Space Marine 2 (2024) | 90.9 | 88.8 | 87.7 | 84.6 | 73.1 | |
| Until Dawn (2024) | 99.3 | 85.9 | 67.7 | 61.4 | 48 | |
| Stalker 2 (2024) | 84.6 | 73.6 | 62 | 100.8 | 46.9 | |
| Kingdom Come Deliverance 2 (2025) | 145.2 | 118.8 | 84.1 | 79.2 | 59 | |
| Civilization 7 (2025) | 192.1 | 187.5 | 129.1 | |||
| The Elder Scrolls IV Oblivion Remastered (2025) | 86.9 | 78.2 | 40 | 41.9 | 28 | |
| Doom: The Dark Ages (2025) | 94.8 | 84.3 | 82.7 | 79.1 | 57.9 |
Bizim Cyberpunk 2077 Test ayrıca GPU performansının daha uzun bir süre boyunca sabit kaldığını da kanıtlıyor. Cinebench döngüsünde CPU için de benzer bir durum söz konusuydu.
Cyberpunk 2077 ultra FPS chart
Emisyonlar
Gürültü seviyeleri
MSI fan kontrolünü yeniden gözden geçirmeli. AI profili ile, daha önce de belirtildiği gibi, iki kasa fanı boştayken zaten oldukça duyulabilir. 3D modunda, Vector 16, özel bir CPU yükü olmadığı sürece 46 ila 49 dB arasında kayıt yaparak birkaç rakipten biraz daha sessizdir. Ancak bu, 16 inçlik dizüstü bilgisayarın sessiz olduğu anlamına gelmez.
Ses yüksekliği
| Boşta |
| 33 / 34 / 38 dB |
| Çalışırken |
| 46 / 49 dB |
 | ||
30 dB sessiz 40 dB(A) duyulabilirlik 50 dB(A) gürültülü |
||
min: | ||
| MSI Vector 16 HX AI A2XWHG Ultra 7 255HX, GeForce RTX 5070 Ti Laptop | MSI Vector 16 HX A14V i9-14900HX, GeForce RTX 4080 Laptop GPU | MSI Katana 17 HX B14WGK i7-14650HX, GeForce RTX 5070 Laptop | Schenker XMG Pro 16 (E25) Ultra 9 275HX, GeForce RTX 5070 Ti Laptop | Alienware 16 Area-51 Ultra 9 275HX, GeForce RTX 5080 Laptop | |
|---|---|---|---|---|---|
| Noise | -4% | -4% | 10% | 13% | |
| kapalı / ortam * (dB) | 25 | 23.2 7% | 25 -0% | 23.3 7% | 23.6 6% |
| Idle Minimum * (dB) | 33 | 33.5 -2% | 31 6% | 25 24% | 25.4 23% |
| Idle Average * (dB) | 34 | 33.5 1% | 32 6% | 25 26% | 27.8 18% |
| Idle Maximum * (dB) | 38 | 33.5 12% | 34 11% | 25 34% | 28.1 26% |
| Load Average * (dB) | 46 | 52.1 -13% | 50 -9% | 45.5 1% | 28.8 37% |
| Cyberpunk 2077 ultra * (dB) | 47 | 58 -23% | 53.3 -13% | 50.4 -7% | |
| Load Maximum * (dB) | 49 | 62 -27% | 59 -20% | 53.3 -9% | 56.4 -15% |
| Witcher 3 ultra * (dB) | 62 |
* ... daha küçük daha iyidir
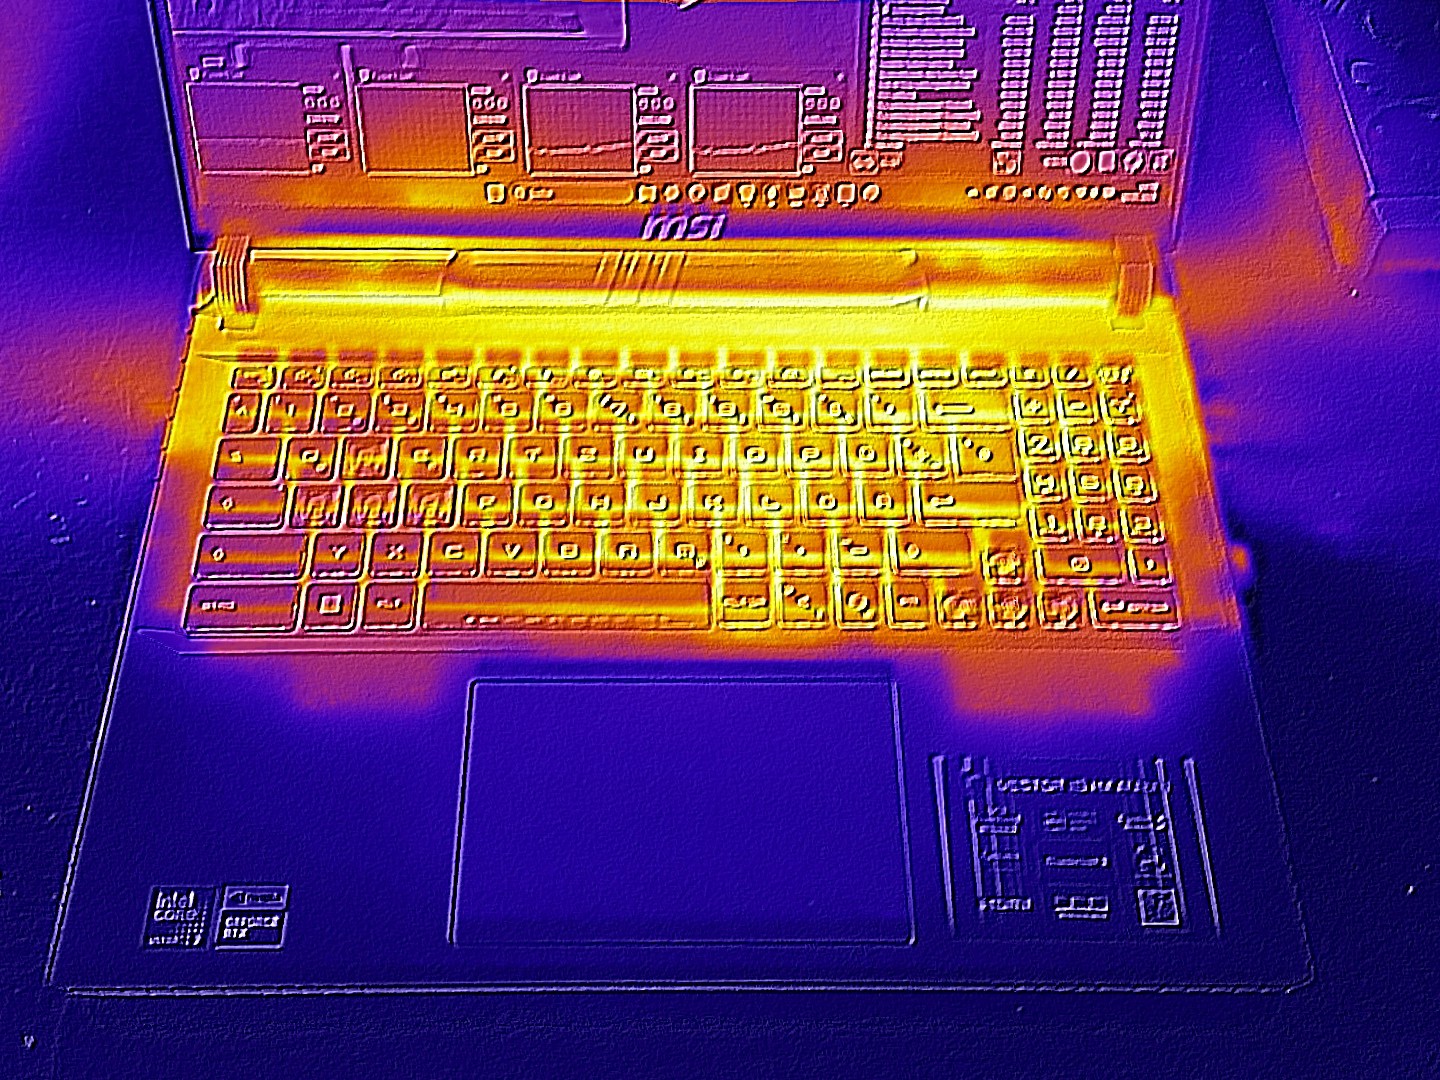
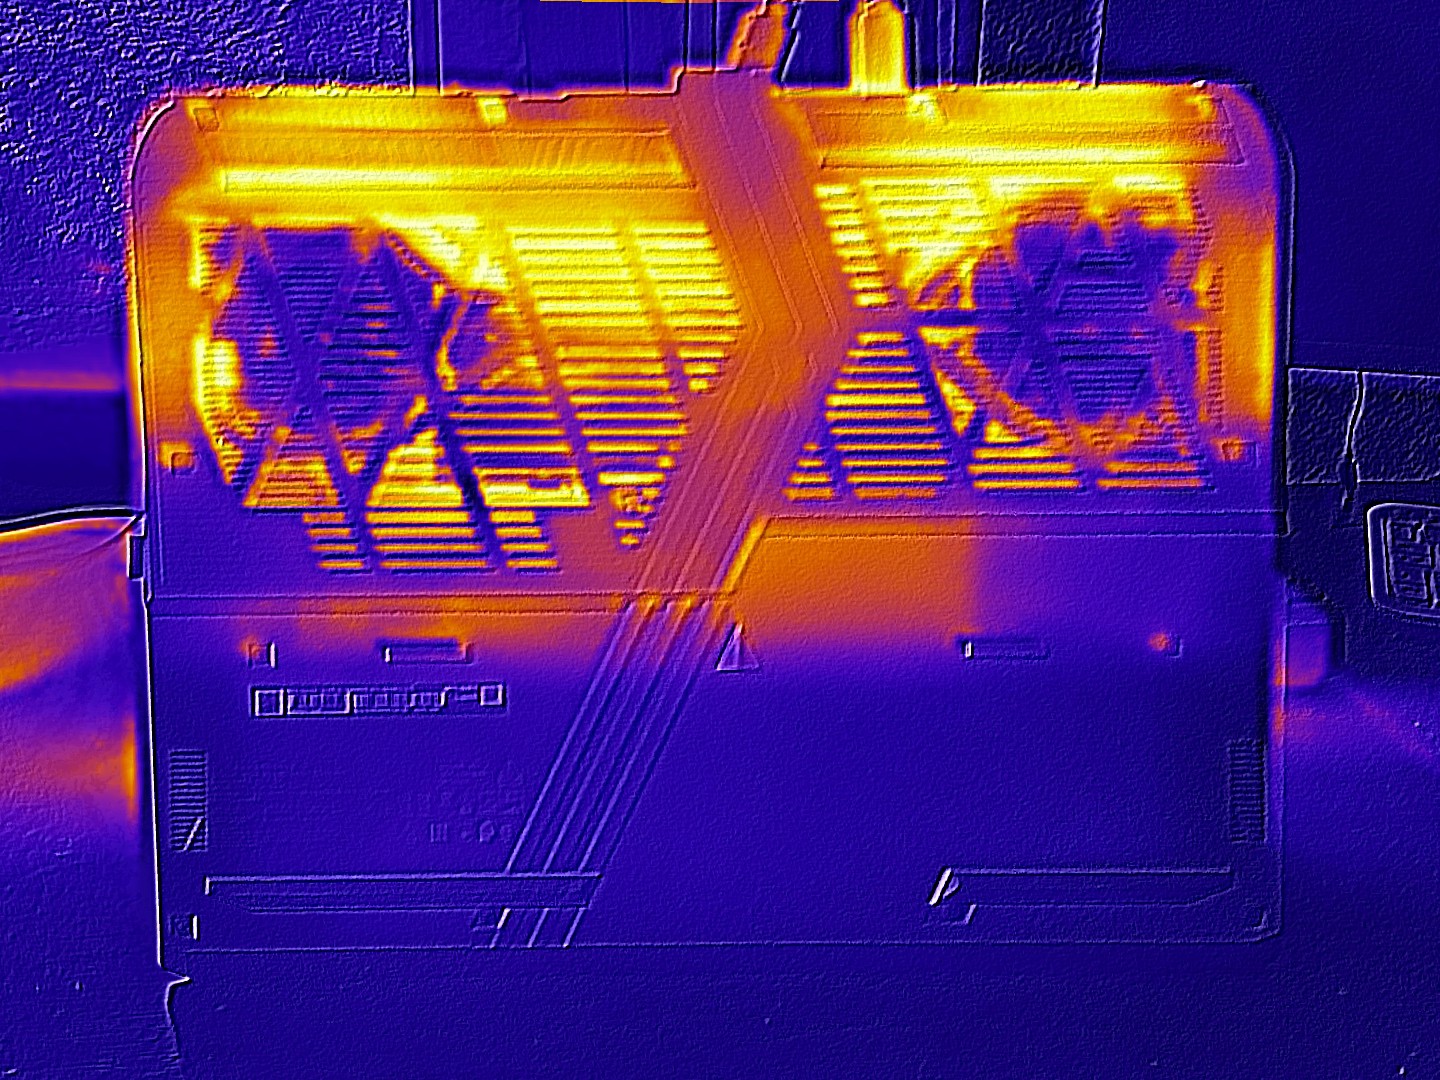
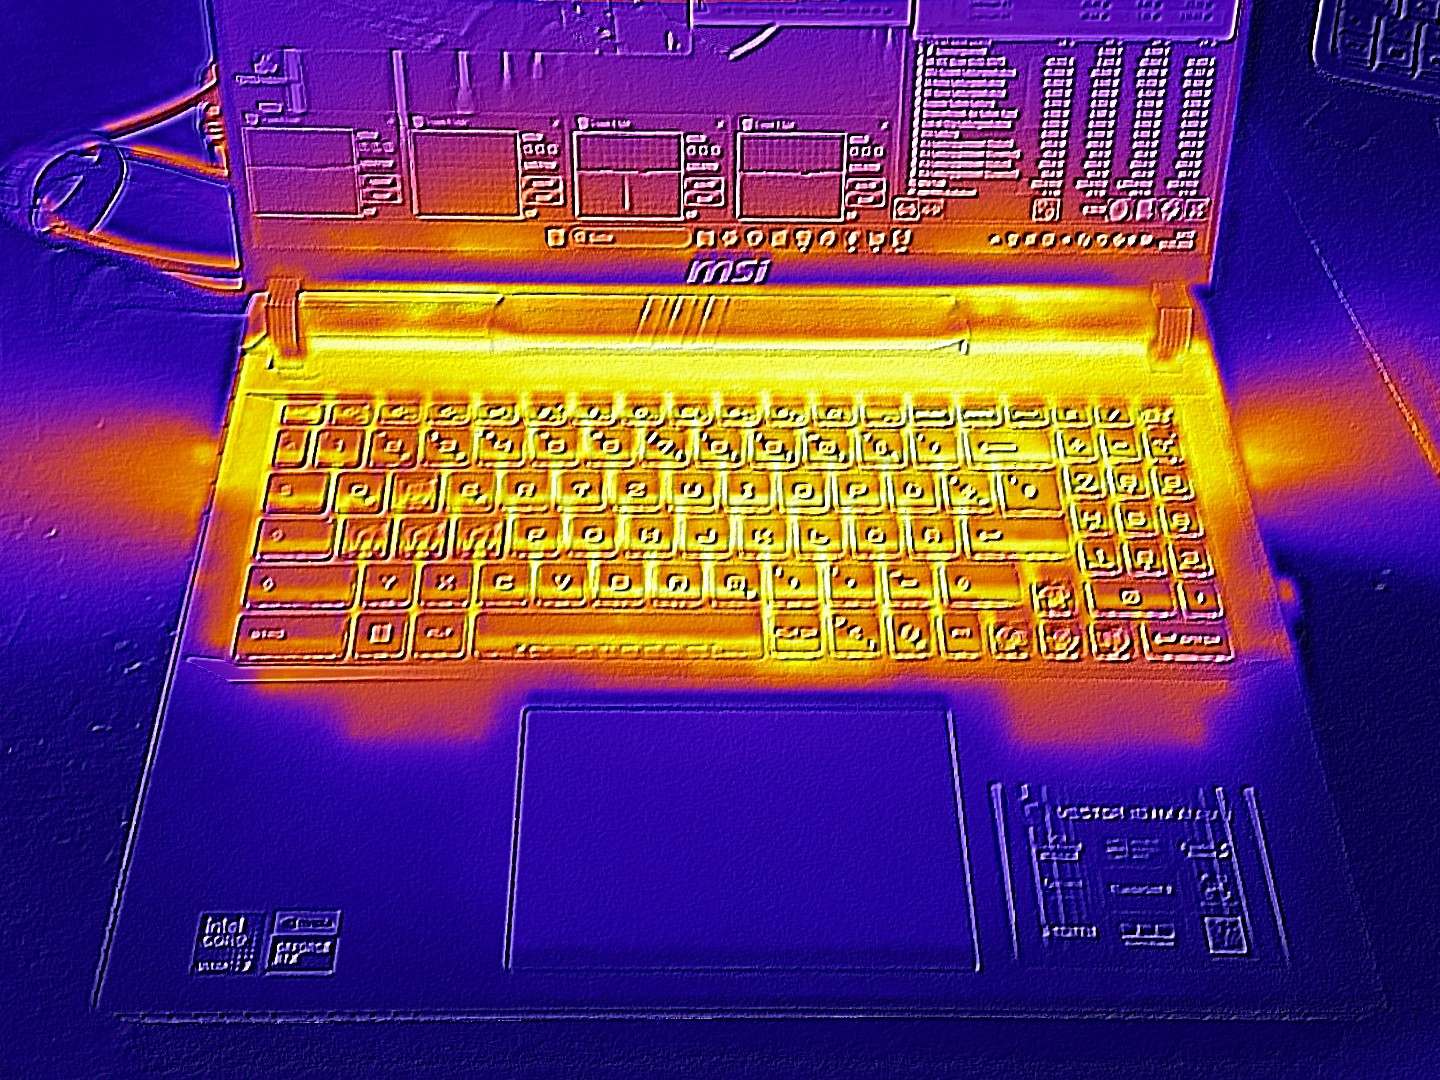
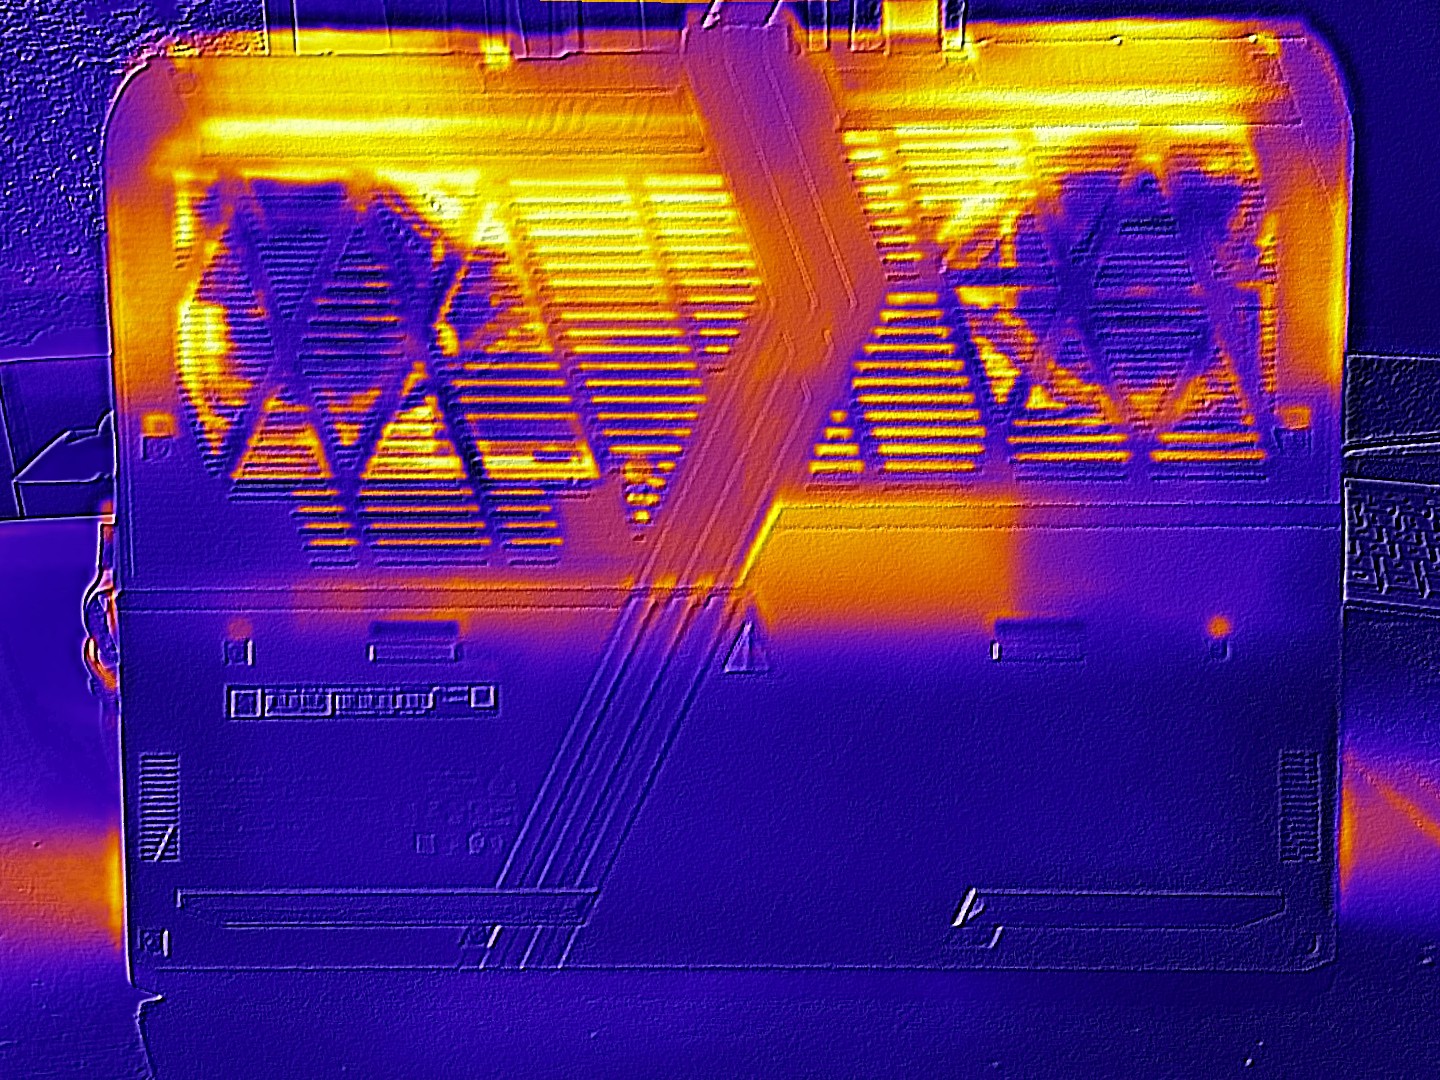
Sıcaklık
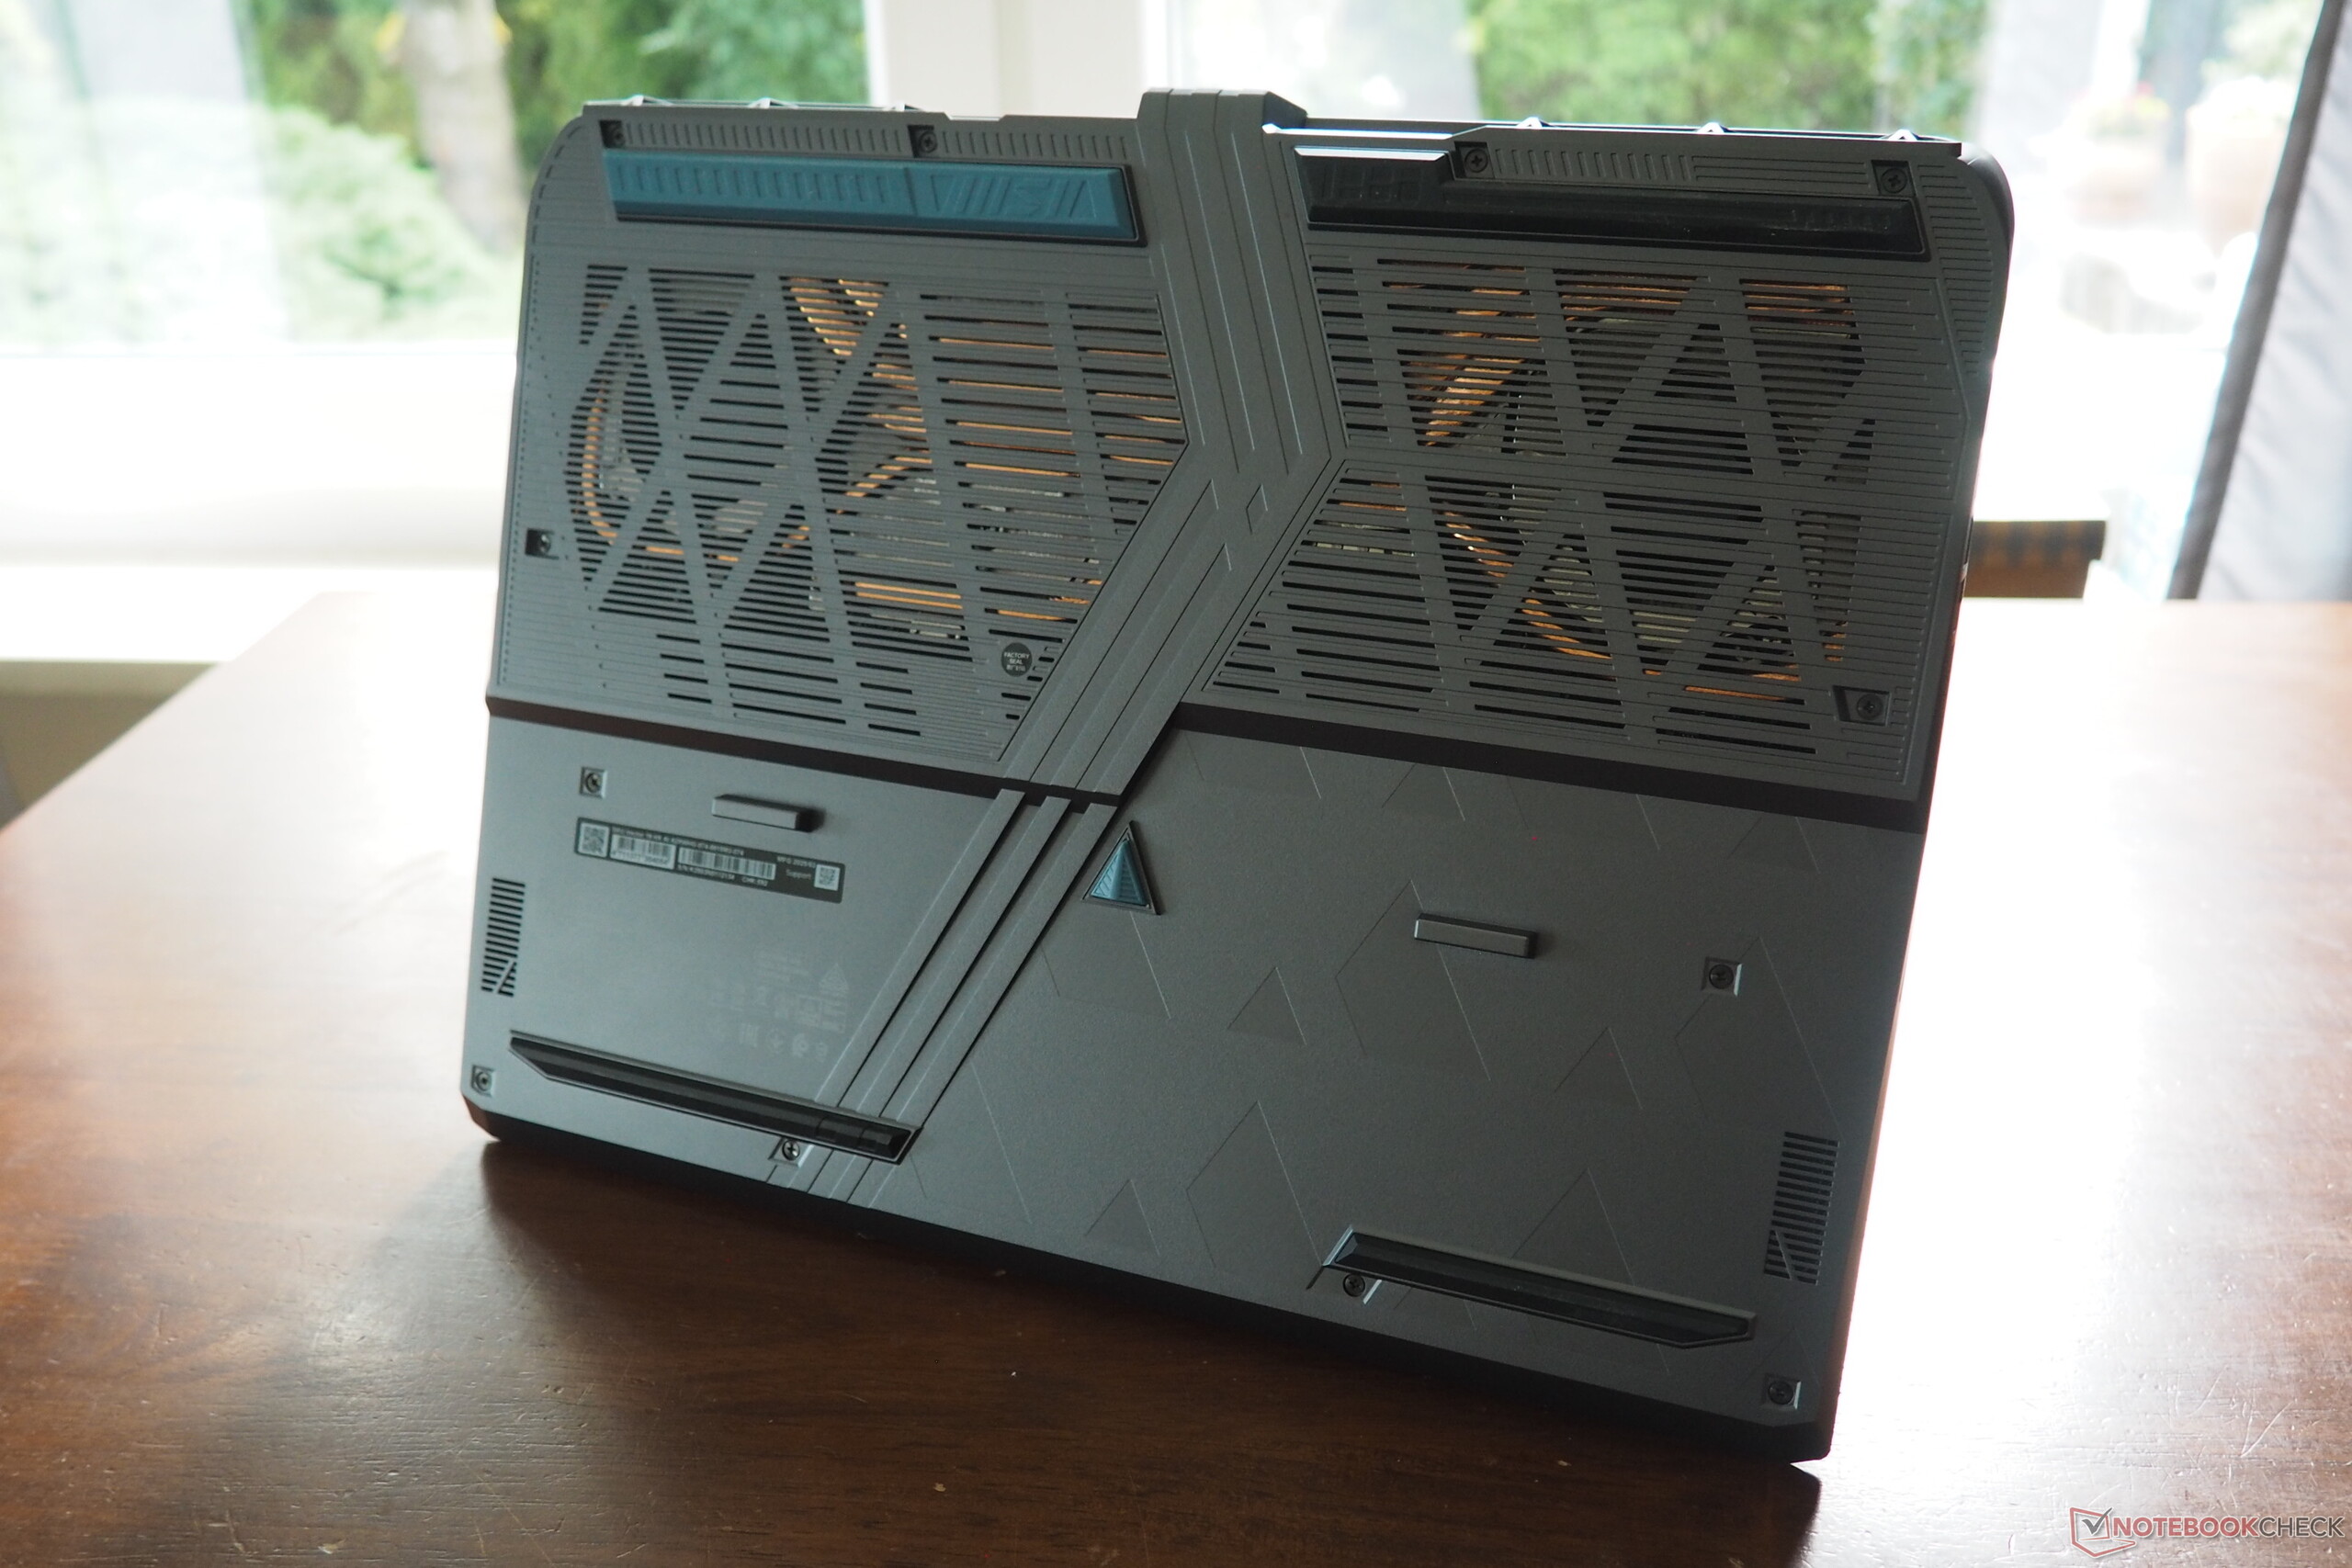
Yük altında kasa en çok arka üçte birlik kısma doğru ısınıyor. Üst yüzeyde 53 °C ve alt yüzeyde 52 °C'lik tepe sıcaklıkları idealden daha düşük ve rakip cihazlarınkinden biraz daha yüksektir. Ancak boştayken kasa genellikle 30 °C'nin altında kalır ve rahatça serin tutar.
(-) Üst taraftaki maksimum sıcaklık, 40.4 °C / 105 F ortalamasına kıyasla 53 °C / 127 F'dir. , Gaming sınıfı için 21.2 ile 68.8 °C arasında değişir.
(-) Alt kısım, 43.2 °C / 110 F ortalamasına kıyasla maksimum 52 °C / 126 F'ye kadar ısınır
(+) Boşta kullanımda, üst tarafın ortalama sıcaklığı 28.1 °C / 83 F olup, cihazın 33.9 °C / 93 F.
(-) 3: The average temperature for the upper side is 43.9 °C / 111 F, compared to the average of 33.9 °C / 93 F for the class Gaming.
(±) Avuç içi dayanakları ve dokunmatik yüzey maksimum 37 °C / 98.6 F ile dokunulamayacak kadar ısınabilir.
(-) Benzer cihazların avuç içi dayanağı alanının ortalama sıcaklığı 28.8 °C / 83.8 F (-8.2 °C / -14.8 F) idi.
| MSI Vector 16 HX AI A2XWHG Ultra 7 255HX, GeForce RTX 5070 Ti Laptop | MSI Vector 16 HX A14V i9-14900HX, GeForce RTX 4080 Laptop GPU | MSI Katana 17 HX B14WGK i7-14650HX, GeForce RTX 5070 Laptop | Schenker XMG Pro 16 (E25) Ultra 9 275HX, GeForce RTX 5070 Ti Laptop | Alienware 16 Area-51 Ultra 9 275HX, GeForce RTX 5080 Laptop | |
|---|---|---|---|---|---|
| Heat | 22% | -4% | -191% | 3% | |
| Maximum Upper Side * (°C) | 53 | 36.4 31% | 52 2% | 43.2 18% | 43.8 17% |
| Maximum Bottom * (°C) | 52 | 35.6 32% | 56 -8% | 46 12% | 40 23% |
| Idle Upper Side * (°C) | 33 | 26.6 19% | 33 -0% | 27.7 16% | 35.8 -8% |
| Idle Bottom * (°C) | 29 | 27 7% | 32 -10% | 264 -810% | 35.2 -21% |
* ... daha küçük daha iyidir
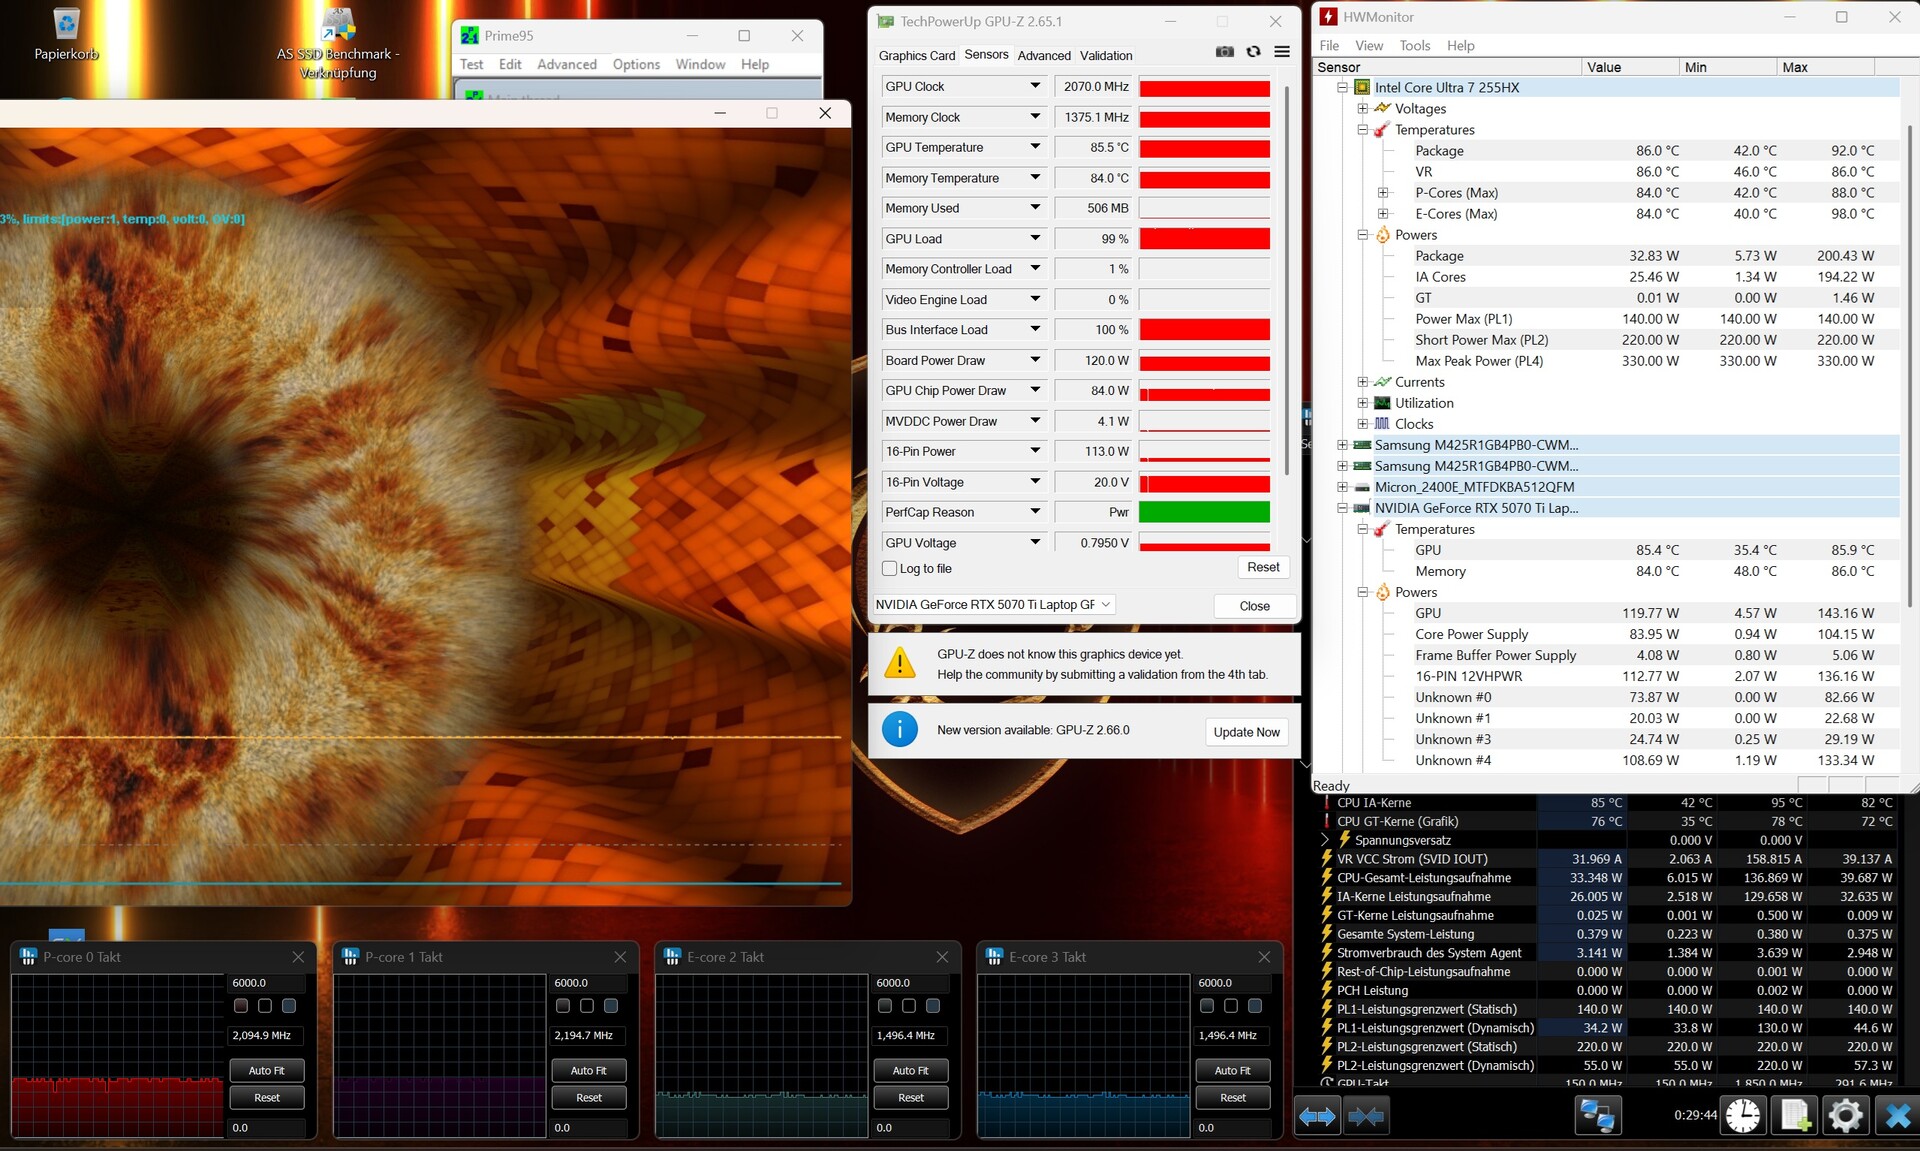
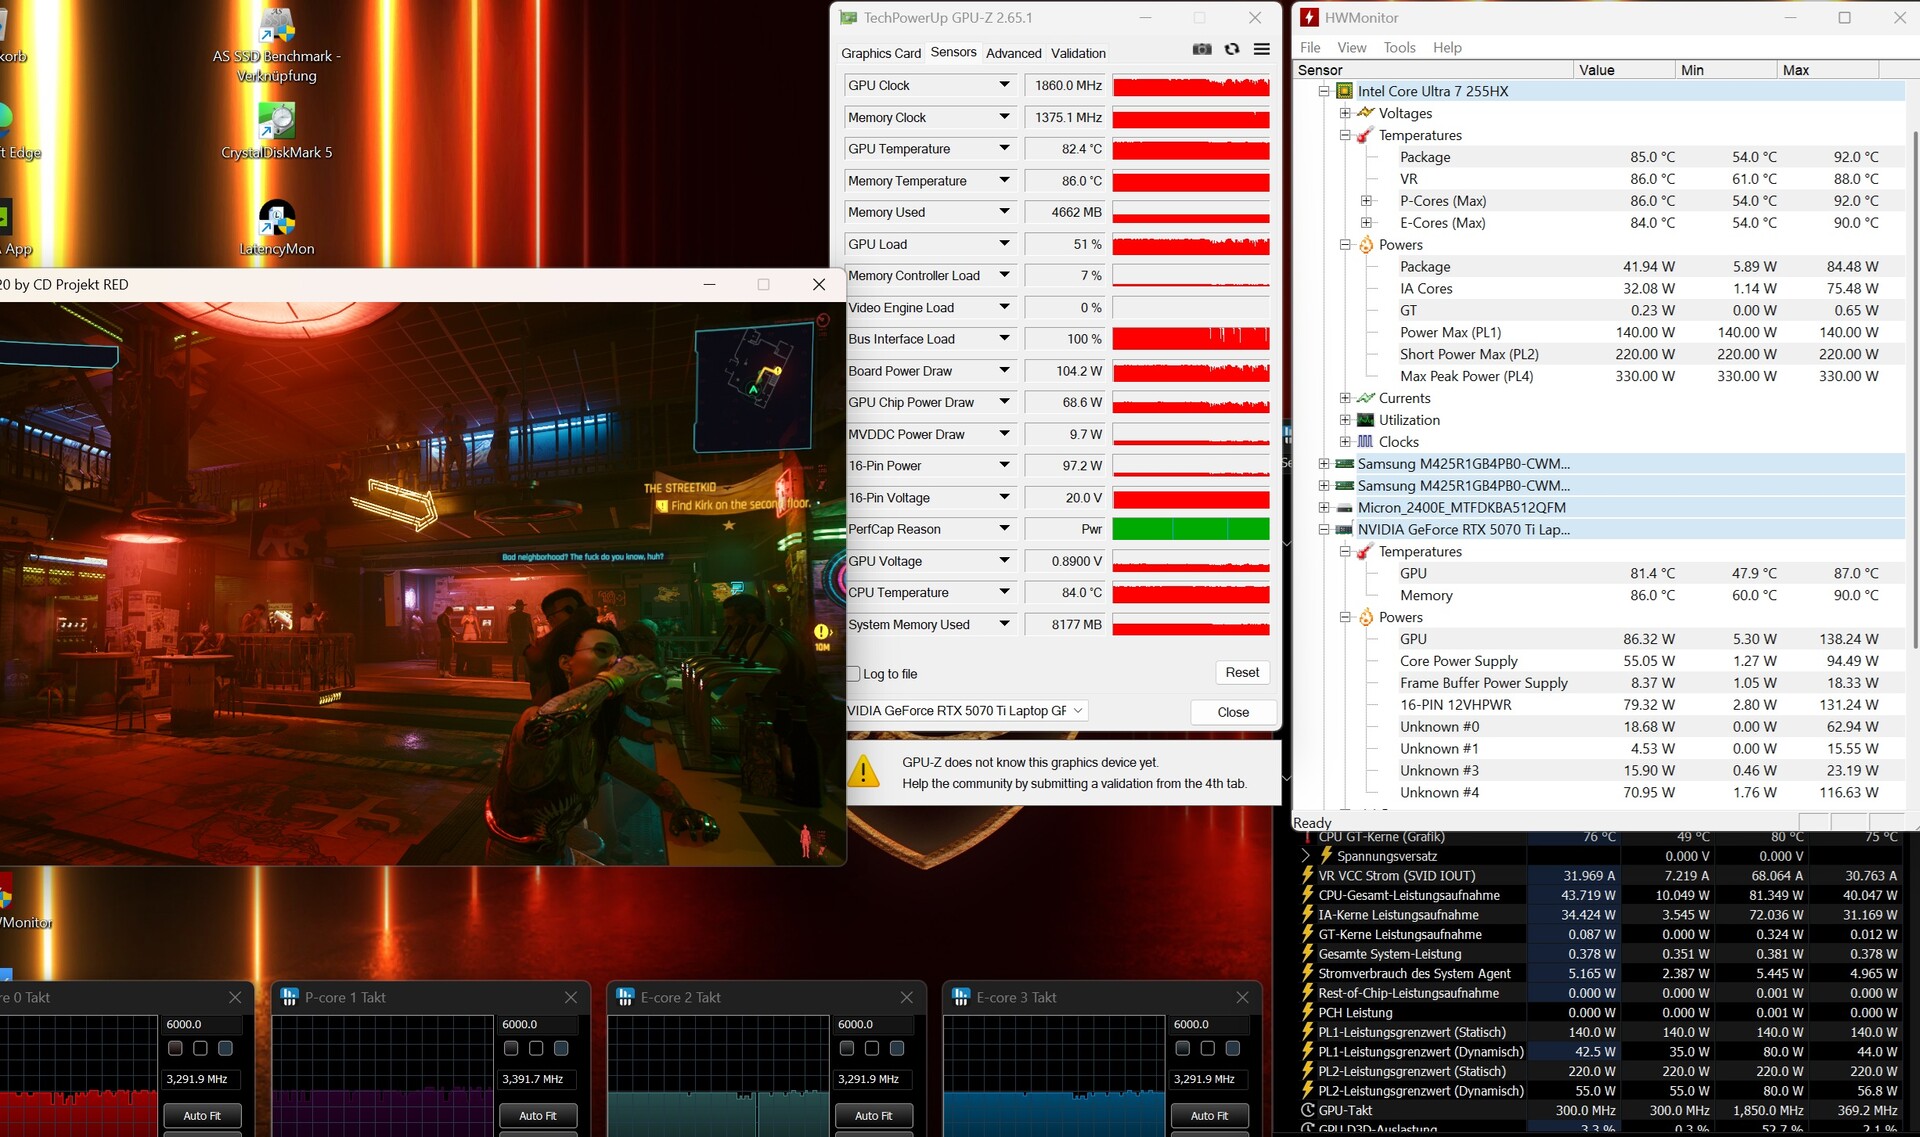
Stres testi
FurMark ve Prime95 kullanılarak yapılan stres testi karışık sonuçlar vermiştir. Hem CPU hem de GPU için yaklaşık 86 °C'lik sıcaklıklar ne özellikle düşük ne de aşırı yüksektir. Cyberpunk 2077'de bileşen sıcaklıkları sadece biraz daha düşüktü.
Konuşmacılar
Ses kalitesi, oyun dizüstü bilgisayarları için orta sıralarda yer alıyor. Çoğu zaman olduğu gibi, bas daha belirgin olabilirdi. Bununla birlikte, dahili ses sistemi Katana 17'de bulunandan açıkça daha iyi (karşılaştırma tablosuna bakın).
MSI Vector 16 HX AI A2XWHG ses analizi
(+) | hoparlörler nispeten yüksek sesle çalabilir (86 dB)
Bas 100 - 315Hz
(±) | azaltılmış bas - ortalama olarak medyandan 12.3% daha düşük
(±) | Bas doğrusallığı ortalamadır (8.5% delta - önceki frekans)
Ortalar 400 - 2000 Hz
(±) | daha yüksek ortalar - ortalama olarak medyandan 9.9% daha yüksek
(+) | orta frekanslar doğrusaldır (6.8% deltadan önceki frekansa)
Yüksekler 2 - 16 kHz
(+) | dengeli yüksekler - medyandan yalnızca 1.8% uzakta
(+) | yüksekler doğrusaldır (2.9% deltadan önceki frekansa)
Toplam 100 - 16.000 Hz
(±) | Genel sesin doğrusallığı ortalamadır (15.8% ortancaya göre fark)
Aynı sınıfla karşılaştırıldığında
» Bu sınıftaki tüm test edilen cihazların %37%'si daha iyi, 7% benzer, 56% daha kötüydü
» En iyisinin deltası 6% idi, ortalama 18% idi, en kötüsü 132% idi
Test edilen tüm cihazlarla karşılaştırıldığında
» Test edilen tüm cihazların %24'si daha iyi, 5 benzer, % 71 daha kötüydü
» En iyisinin deltası 4% idi, ortalama 24% idi, en kötüsü 134% idi
MSI Katana 17 HX B14WGK ses analizi
(+) | hoparlörler nispeten yüksek sesle çalabilir (84 dB)
Bas 100 - 315Hz
(-) | neredeyse hiç bas yok - ortalama olarak medyandan 19% daha düşük
(±) | Bas doğrusallığı ortalamadır (10.6% delta - önceki frekans)
Ortalar 400 - 2000 Hz
(±) | daha yüksek ortalar - ortalama olarak medyandan 8.7% daha yüksek
(±) | Ortaların doğrusallığı ortalamadır (7.5% delta - önceki frekans)
Yüksekler 2 - 16 kHz
(+) | dengeli yüksekler - medyandan yalnızca 4.6% uzakta
(±) | Yükseklerin doğrusallığı ortalamadır (9.7% delta - önceki frekans)
Toplam 100 - 16.000 Hz
(±) | Genel sesin doğrusallığı ortalamadır (20.6% ortancaya göre fark)
Aynı sınıfla karşılaştırıldığında
» Bu sınıftaki tüm test edilen cihazların %74%'si daha iyi, 5% benzer, 21% daha kötüydü
» En iyisinin deltası 6% idi, ortalama 18% idi, en kötüsü 132% idi
Test edilen tüm cihazlarla karşılaştırıldığında
» Test edilen tüm cihazların %55'si daha iyi, 8 benzer, % 37 daha kötüydü
» En iyisinin deltası 4% idi, ortalama 24% idi, en kötüsü 134% idi
Güç yönetimi
Güç tüketimi
Boşta güç çekimi ortalama 16 watt civarındadır ve bu değer diğer birçok RTX 5070 (Ti) dizüstü bilgisayarınkinden daha düşüktür. Yük altında, 16 inçlik sistem 124 watt (3DMark 06) ile stres testi sırasında en yüksek 336 watt arasında güç tüketiyor. Oyun sırasında güç tüketimi genellikle 220 watt civarında seyrediyor. Harici monitörler kullanıldığında, sistemin varsayılan olarak özel GPU'ya geçtiğini ve bunun da daha yüksek boşta güç kullanımına neden olduğunu lütfen unutmayın.
| Kapalı / Bekleme modu | |
| Boşta | |
| Çalışırken |
|
Key:
min: | |
| MSI Vector 16 HX AI A2XWHG Ultra 7 255HX, GeForce RTX 5070 Ti Laptop | MSI Vector 16 HX A14V i9-14900HX, GeForce RTX 4080 Laptop GPU | MSI Katana 17 HX B14WGK i7-14650HX, GeForce RTX 5070 Laptop | Schenker XMG Pro 16 (E25) Ultra 9 275HX, GeForce RTX 5070 Ti Laptop | Alienware 16 Area-51 Ultra 9 275HX, GeForce RTX 5080 Laptop | Sınıf ortalaması Gaming | |
|---|---|---|---|---|---|---|
| Power Consumption | -33% | 5% | -5% | -67% | -10% | |
| Idle Minimum * (Watt) | 7.1 | 15.8 -123% | 9.7 -37% | 11.7 -65% | 27 -280% | 13.3 ? -87% |
| Idle Average * (Watt) | 15.9 | 23.3 -47% | 15 6% | 16.6 -4% | 33.5 -111% | 19 ? -19% |
| Idle Maximum * (Watt) | 29.5 | 30 -2% | 23.7 20% | 17.1 42% | 41.4 -40% | 24.5 ? 17% |
| Load Average * (Watt) | 124 | 123.9 -0% | 126 -2% | 122.4 1% | 124.7 -1% | 108.1 ? 13% |
| Cyberpunk 2077 ultra external monitor * (Watt) | 217 | 202 7% | 241 -11% | 249 -15% | ||
| Cyberpunk 2077 ultra * (Watt) | 222 | 205 8% | 245 -10% | 256 -15% | ||
| Load Maximum * (Watt) | 336 | 306 9% | 227 32% | 291.5 13% | 367.2 -9% | 254 ? 24% |
| Witcher 3 ultra * (Watt) | 285 |
* ... daha küçük daha iyidir
Power consumption: Cyberpunk/stress test
Power consumption with external monitor
Pil çalışma süresi
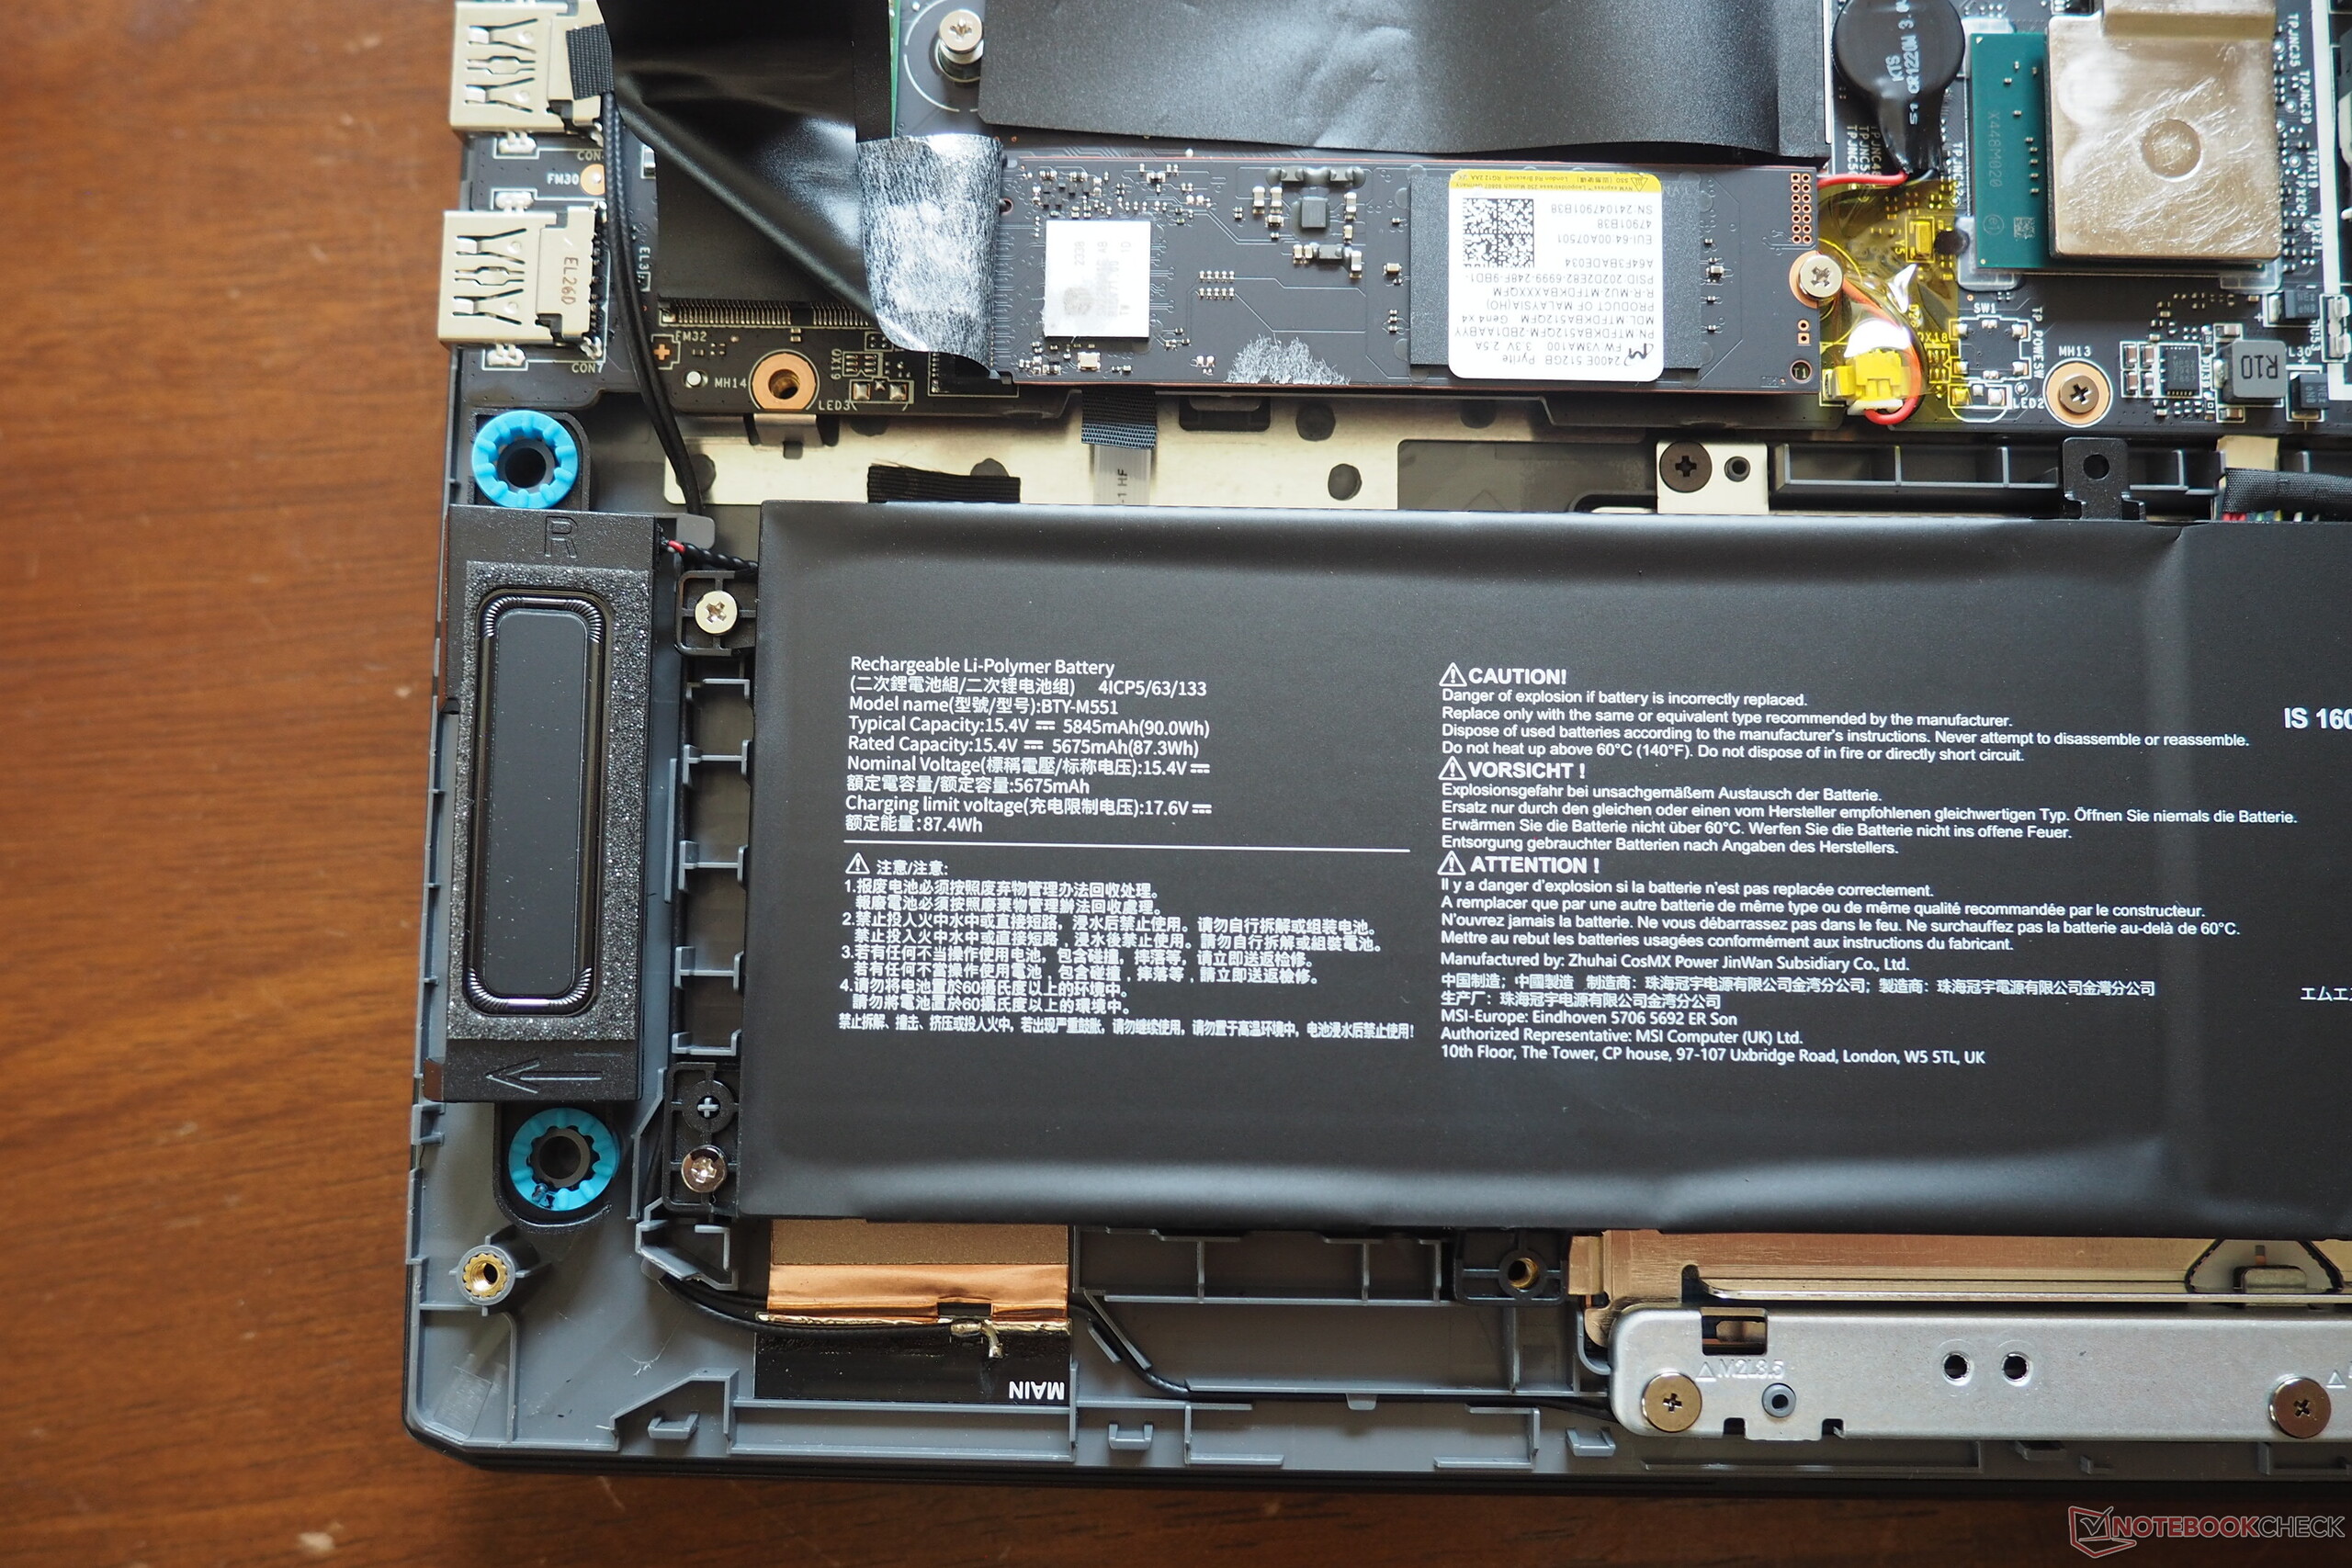
90 Wh'lık cömert bir kapasiteye sahip olan pil, dayanıklılığıyla göz dolduruyor. Wi-Fi testimiz sırasında 150 cd/m² azaltılmış parlaklıkta 16 inç dizüstü bilgisayar yedi saatin biraz altında çalıştı. Bu çalışma süresi övgüye değer olsa da, Schenker XMG Pro 16 etkileyici dokuz saatlik pil ömrüyle hala üstünlüğünü koruyor.
| MSI Vector 16 HX AI A2XWHG Ultra 7 255HX, GeForce RTX 5070 Ti Laptop, 90 Wh | MSI Vector 16 HX A14V i9-14900HX, GeForce RTX 4080 Laptop GPU, 90 Wh | MSI Katana 17 HX B14WGK i7-14650HX, GeForce RTX 5070 Laptop, 75 Wh | Schenker XMG Pro 16 (E25) Ultra 9 275HX, GeForce RTX 5070 Ti Laptop, 99.8 Wh | Alienware 16 Area-51 Ultra 9 275HX, GeForce RTX 5080 Laptop, 96 Wh | Sınıf ortalaması Gaming | |
|---|---|---|---|---|---|---|
| Pil Çalışma Süresi | -21% | -27% | 30% | -60% | 0% | |
| WiFi v1.3 (h) | 7 | 5.5 -21% | 5.1 -27% | 9.1 30% | 2.8 -60% | 7.01 ? 0% |
| Reader / Idle (h) | 10.7 | 3.1 | 8.71 ? | |||
| Load (h) | 1.4 | 1.47 ? |
Notebookcheck genel değerlendirmesi
MSI Vector 16, büyük ölçüde başarılı bir RTX 5070 (Ti) modelidir, ancak yetersiz fan kontrolü nedeniyle biraz hayal kırıklığına uğramıştır.
MSI Vector 16 HX AI A2XWHG
- 06/20/2025 v8
Florian Glaser
 Total Sustainability Score:
 Comparable models for reference
Resim | Modeli / incelemeler | Fiyat | Ağırlık | Yükseklik | Ekran |
|---|---|---|---|---|---|
1. 84%  | MSI Vector 16 HX AI A2XWHG Intel Core Ultra 7 255HX ⎘ NVIDIA GeForce RTX 5070 Ti Laptop ⎘ 16 GB Bellek, 512 GB SSD | Amazon: Liste fiyatı: 2000 EUR | 2.6 kg | 28.6 mm | 16.00" 2560x1600 189 PPI IPS |
2. 88% v7 (old) 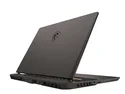 | MSI Vector 16 HX A14V Intel Core i9-14900HX ⎘ NVIDIA GeForce RTX 4080 Laptop GPU ⎘ 32 GB Bellek, 1024 GB SSD | Amazon: 1. $2,099.99 msi Vector 16 HX AI 16” 24... 2. $2,189.00 msi Vector 16 HX AI Gaming L... 3. $2,469.99 msi Vector 16 HX AI Gaming L... Liste fiyatı: 2700 USD | 2.7 kg | 28.55 mm | 16.00" 2560x1600 189 PPI IPS |
3. 77.3%  | MSI Katana 17 HX B14WGK Intel Core i7-14650HX ⎘ NVIDIA GeForce RTX 5070 Laptop ⎘ 16 GB Bellek, 1024 GB SSD | Amazon: Liste fiyatı: 1800 EUR | 2.7 kg | 28 mm | 17.30" 2560x1440 170 PPI IPS |
4. 87.4%  | Schenker XMG Pro 16 (E25) Intel Core Ultra 9 275HX ⎘ NVIDIA GeForce RTX 5070 Ti Laptop ⎘ 32 GB Bellek, 1024 GB SSD | Amazon: Liste fiyatı: 2480€ | 2.5 kg | 26.5 mm | 16.00" 2560x1600 189 PPI IPS |
5. 85.7%  | Alienware 16 Area-51 Intel Core Ultra 9 275HX ⎘ NVIDIA GeForce RTX 5080 Laptop ⎘ 32 GB Bellek, 1024 GB SSD | Amazon: 1. $2,348.99 Alienware 16 Area-51 Gaming ... 2. $4,299.99 Alienware 16 Area-51 Gaming ... 3. $3,799.99 Alienware 16 Area-51 Gaming ... Liste fiyatı: 3500 USD | 3.3 kg | 28.5 mm | 16.00" 2560x1600 189 PPI IPS |
Şeffaflık
İncelenecek cihazların seçimi editör ekibimiz tarafından yapılır. Test örneği, bu incelemenin amacı doğrultusunda üretici veya perakendeci tarafından yazara ödünç olarak sağlanmıştır. Borç verenin bu inceleme üzerinde herhangi bir etkisi olmadığı gibi, üretici de yayınlanmadan önce bu incelemenin bir kopyasını almamıştır. Bu incelemeyi yayınlama zorunluluğu yoktu. Bağımsız bir medya şirketi olarak Notebookcheck, üreticilerin, perakendecilerin veya yayıncıların otoritesine tabi değildir.
Notebookcheck bu şekilde test yapıyor
Notebookcheck, tüm sonuçların karşılaştırılabilir olmasını sağlamak için her yıl yüzlerce dizüstü bilgisayarı ve akıllı telefonu standart prosedürler kullanarak bağımsız olarak inceliyor. Yaklaşık 20 yıldır test yöntemlerimizi sürekli olarak geliştirdik ve bu süreçte endüstri standartlarını belirledik. Test laboratuvarlarımızda deneyimli teknisyenler ve editörler tarafından yüksek kaliteli ölçüm ekipmanları kullanılmaktadır. Bu testler çok aşamalı bir doğrulama sürecini içerir. Karmaşık derecelendirme sistemimiz, nesnelliği koruyan yüzlerce sağlam temellere dayanan ölçüm ve kıyaslamaya dayanmaktadır.