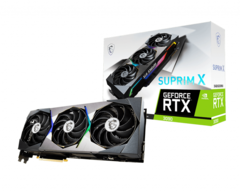
GeForce RTX 3090 Suprim X incelemede - MSI'nın yeni üst düzey grafik kartı serisi
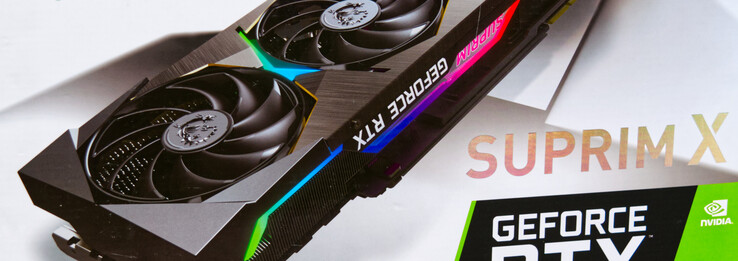
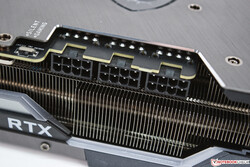
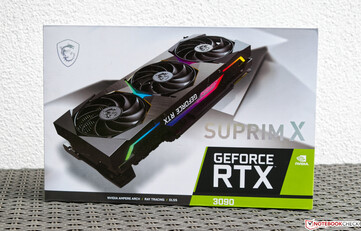
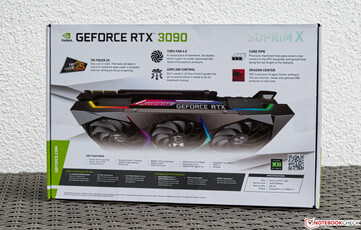
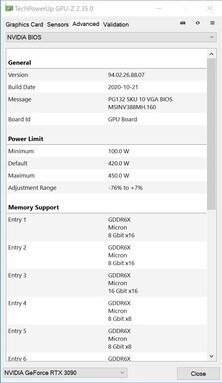
Şimdiye kadar, Gaming X Trio, MSI portföyünün özel üst düzey modeller için tasarlanmış bir parçasıydı. Son yıllarda, ara sıra seçilen bileşenler ve özel ayarlamalar sayesinde daha da fazla performans sunan Lightning Z modelleri de ortaya çıktı. Şimdi MSI, Suprim X modelleriyle üst düzey sektöre yeni bir bölüm getiriyor. MSI, bu isim altında yeni Ampere ekran kartlarının RTX 3070, 3080 ve 3090 modellerini sunuyor. Aynı zamanda, Suprim X modelleri daha yüksek TDP'ye sahip bir BIOS sunduğundan biraz daha az performansla idare edilmesi gereken Gaming X Trio modelleri de var. RTX 3090'ı temel alan en üst modele bir göz attık ve grafik kartını kutusundan çıkardıktan sonra sonuçlar konusunda çok heyecanlandık. Kuşkusuz, bu durumda çok yer olmalı, çünkü grafik kartı toplam uzunluğu 34 santimetre gibi muazzam bir şekilde ölçüyor. Ağırlık 1,7 kilograma kadar çıkıyor, bu nedenle MSI, aşırı uzunluk nedeniyle grafik kartını sonunda sabitlemek için ayrı bir stand da içeriyor. Stand olmadan, grafik kartı kasada çok sarkar ve sizi uzun vadede PCIe yuvasının hasar görmesinden korkar. Dikey olarak monte ederseniz herhangi bir sorun olmamalıdır. Dahası, soğutucu çok kalın olduğundan toplam üç yuvaya ihtiyaç duyulmaktadır MSI GeForce RTX 3090 Suprim X'in yapım kalitesi çok yüksektir. Bu grafik kartı çok üst düzey görünüyor ve hissettiriyor. Ön ve arka kısım alüminyumdan yapılmıştır, ancak ön kısımda bazı plastik elemanlar da vardır. Ancak, bunlar yüksek kaliteli izlenimi hiç mahvetmez. 420 watt'ın da kontrol altında tutulması gerektiğinden, toplam yedi güçlü ısı borusu ısıyı devasa soğutucuya dağıtır. Dahası, RGB aydınlatmaya her zaman güvenebilirsiniz. MSI GeForce RTX 3090 Suprim X, tam anlamıyla bir pencere yan panelli bir kasa için yalvaran birçok aydınlatılmış öğeye sahiptir. Daha önce de belirtildiği gibi, MSI GeForce RTX 3090 Suprim X, 420 watt BIOS ile donatılmıştır, yani üç adet 8- pin güç konektörleri kaçınılmazdır. Harici olarak, 60 Hz'e kadar 8K ekranlar 2.1 standardı sayesinde HDMI üzerinden bağlanabilir. Aynı şekilde 120 Hz'de 4K da bu bağlantıyla mümkündür ve bu testte de doğrulanabilmiştir. Ayrıca, üç DisplayPort 1.4a bağlantısı vardır.
Top 10
» Top 10 Multimedia Notebook listesi
» Top 10 oyun notebooku
» Top 10 bütçeye uygun Ofis/İş Notebook Listesi
» Top 10 Premium Ofis/İş notebookları
» Top 10 Çalışma istasyonu laptopları
» Top 10 Subnotebook listesi
» Top 10 Ultrabooklar
» En iyi 10 dönüştürülebilir modeli
» Seçimi en iyi 10 tablet
» Notebookcheck Top 10 Windows Tabletleri
» Top 10 Subnotebook listesi
» NotebookCheck tarafından incelenen en iyi Notebook ekranları
» Notebookcheck'in 500 Euro altındaki en iyi 10 Notebook listesi
» NotebookCheck tarafından seçilen 300 Euro altındaki en iyi 10 Notebook
» Notebookcheck'in 500 Euro altındaki en iyi 10 Notebook listesi
» Notebookcheck'in Top 10 akıllı telefon listesi
» Notebookcheck'in Top 10 hafif oyun notebookları
The MSI GeForce RTX 3090 Suprim X compared with other NVIDIA GPUs
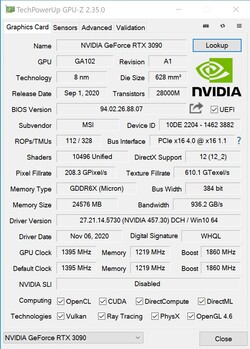
| Specification | RTX 3090 (Suprim X) | RTX 3090 (FE) | RTX 3080 FE | RTX 3070 FE | Titan RTX | TITAN X Pascal | RTX 2080 Ti | RTX 2080 |
| Chip | GA102 | GA102 | GA102 | GA104 | TU102 | GP102 | TU102 | TU104 |
| FinFET process | 8 nm | 8 nm | 8 nm | 8 nm | 12 nm | 16 nm | 12 nm | 12 nm |
| CUDA cores | 10,496 | 10,496 | 8,704 | 5,888 | 4,608 | 3,584 | 4,352 | 2,944 |
| Texture units | 328 | 328 | 272 | 184 | 288 | 224 | 272 | 184 |
| Tensor cores | 328 3rd Gen. | 328 3rd Gen. | 272 3rd Gen. | 184 3rd Gen. | 576 2nd Gen. | - | 544 2nd Gen. | 368 2nd Gen. |
| RT cores | 82 | 82 | 68 | 46 | 72 | - | 68 | 46 |
| GPU base clock | 1,395 MHz | 1,395 MHz | 1,440 MHz | 1,500 MHz | 1,350 MHz | 1,417 MHz | 1,350 MHz | 1,515 MHz |
| GPU boost clock | 1,860 MHz | 1,695 MHz | 1,710 MHz | 1,750 MHz | 1,770 MHz | 1,531 MHz | 1,545 MHz | 1,710 MHz |
| Memory bus | 384-bit | 384-bit | 320-bit | 256-bit | 384-bit | 384-bit | 352-bit | 256-bit |
| Memory bandwidth | 936 GB/s | 936 GB/s | 760 GB/s | 448 GB/s | 672 GB/s | 480.4 GB/s | 616 GB/s | 448 GB/s |
| Video memory | 24 GB GDDR6X | 24 GB GDDR6X | 10 GB GDDR6X | 8 GB GDDR6 | 24 GB GDDR6 | 12 GB GDDR5X | 11 GB GDDR6 | 8 GB GDDR6 |
| Power consumption | 420 W | 350 W | 320 W | 220 W | 280 W | 250 W | 250 W | 215 W |
Temel olarak AMD Ryzen 9 5900X ile test sistemimiz
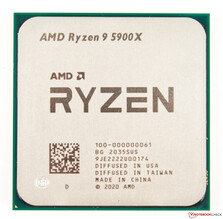
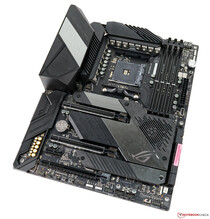
Asus X570 ROG Crosshair VIII tabanlı güncel bir AMD platformu test sistemi olarak hizmet veriyor. CPU (AMD Ryzen 9 5900X) iyi bir CPU performansı sunuyor ve soğutma için bir AIO su soğutucusu (Alphacool Eisbaer 280 mm) kullanıyoruz. 32 GB RAM, Corsair'den geliyor ve 4,000 MHz'de çalışıyor. Acer Predator XB321HK'yi monitör olarak kullanıyoruz. UHD özelliği nedeniyle bizi sınırlamaz. Bu noktada, test platformunu sağladığı için AMD'ye ve RAM kiti için Corsair'e teşekkür ederiz.
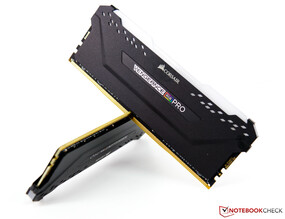
Yaklaşan kıyaslamalar ve testler için aşağıdaki sistemi kullanıyoruz: Lian Li O11 DynamicAMD Ryzen 9 5900XMSI GeForce RTX 3090 Suprim X (Nvidia sürücüsü 457.30) Asus X570 ROG Crosshair VIII Hero Wi-Fi (BIOS 2402, varsayılan ayarlar, DDR4 için XMP 1 -4000) Corsair RM1000X 1,000-watt güç kaynağı ünitesiCorsair Vengeance RGB Pro DDR4-4000 2 x 16 GB RAM kitiCorsair MP600 2 TB M.2 PCIe 4.0 SSDCrucial MX500 2 TB (oyunlar için)
MSI GeForce RTX 3090 Suprim X'in saat hızları
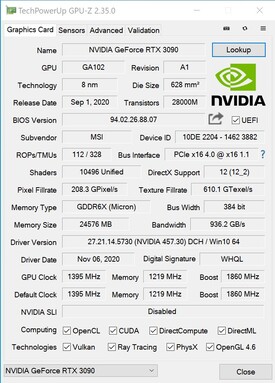
MSI, temel saat hızını referans modelle uyumlu olarak tutar. Yine de, 1.860 MHz'de MSI, RTX 3090 Suprim X'in hızlandırılmış saat hızını önemli ölçüde artırır. Ek olarak, OC modu MSI Dragon Center'da etkinleştirilebilir ve bu da saat hızını daha da yüksek bir 1.875 MHz'e çıkarır. Bu incelemedeki tüm testler, varsayılan ayarlar altında ve OC modu olmadan gerçekleştirildi. VRAM de değişmeden kalır, bu nedenle bellek bant genişliği referans modelle aynıdır.
Sentetik testler
Sentetik kıyaslamalarda, MSI GeForce RTX 3090 Suprim X ve AMD Radeon RX 6800 XT neredeyse eşit. GeForce RTX 3080 ile olan boşluk açıkça görülebilir ve yüksek çözünürlüklerde artar. GeForce RTX 2080 Ti ile karşılaştırıldığında, yeni amiral gemisinin liderliği% 40 ila 50'ye yükseliyor. Nvidia Titan RTX, RTX 2080 Ti ile aynı yongaya dayanıyor ve benzer bir marjla geride kalıyor MSI GeForce RTX 3090 Suprim X'teki iyi soğutma ve daha yüksek TDP nedeniyle, performans Nvidia'nın Founders Edition'dan daha iyi olmalı . Ancak, bu modeli henüz test edemediğimiz için şu anda referans modelin performansıyla ilgili geçerli açıklamalar yapamıyoruz.
| 3DMark | |
| 1920x1080 Fire Strike Graphics | |
| Radeon RX 6800 XT | |
| MSI GeForce RTX 3090 Suprim X | |
| GeForce RTX 3080 | |
| Titan RTX | |
| GeForce RTX 2080 Ti (Desktop) | |
| GeForce RTX 3070 | |
| GeForce RTX 2080 (Desktop) | |
| Radeon VII | |
| GeForce RTX 2080 Super (Desktop) | |
| Radeon RX 5700 XT (Desktop) | |
| GeForce RTX 2070 Super (Desktop) | |
| GeForce RTX 2070 (Desktop) | |
| Radeon RX 5700 (Desktop) | |
| RX Vega 64 | |
| GeForce RTX 2060 Super (Desktop) | |
| GeForce RTX 2060 (Desktop) | |
| Fire Strike Extreme Graphics | |
| Radeon RX 6800 XT | |
| MSI GeForce RTX 3090 Suprim X | |
| GeForce RTX 3080 | |
| Titan RTX | |
| GeForce RTX 3070 | |
| GeForce RTX 2080 Ti (Desktop) | |
| Radeon VII | |
| GeForce RTX 2080 (Desktop) | |
| GeForce RTX 2080 Super (Desktop) | |
| Radeon RX 5700 XT (Desktop) | |
| GeForce RTX 2070 Super (Desktop) | |
| GeForce RTX 2070 (Desktop) | |
| Radeon RX 5700 (Desktop) | |
| RX Vega 64 | |
| GeForce RTX 2060 Super (Desktop) | |
| GeForce RTX 2060 (Desktop) | |
| 3840x2160 Fire Strike Ultra Graphics | |
| Radeon RX 6800 XT | |
| MSI GeForce RTX 3090 Suprim X | |
| GeForce RTX 3080 | |
| Titan RTX | |
| GeForce RTX 3070 | |
| GeForce RTX 2080 Ti (Desktop) | |
| Radeon VII | |
| GeForce RTX 2080 (Desktop) | |
| GeForce RTX 2080 Super (Desktop) | |
| Radeon RX 5700 XT (Desktop) | |
| GeForce RTX 2070 Super (Desktop) | |
| GeForce RTX 2070 (Desktop) | |
| RX Vega 64 | |
| Radeon RX 5700 (Desktop) | |
| GeForce RTX 2060 Super (Desktop) | |
| GeForce RTX 2060 (Desktop) | |
| 2560x1440 Time Spy Graphics | |
| MSI GeForce RTX 3090 Suprim X | |
| Radeon RX 6800 XT | |
| GeForce RTX 3080 | |
| Titan RTX | |
| GeForce RTX 2080 Ti (Desktop) | |
| GeForce RTX 3070 | |
| GeForce RTX 2080 Super (Desktop) | |
| GeForce RTX 2080 (Desktop) | |
| GeForce RTX 2070 Super (Desktop) | |
| GeForce RTX 2070 (Desktop) | |
| Radeon VII | |
| GeForce RTX 2060 Super (Desktop) | |
| Radeon RX 5700 XT (Desktop) | |
| GeForce RTX 2060 (Desktop) | |
| Radeon RX 5700 (Desktop) | |
| RX Vega 64 | |
| Unigine Superposition | |
| 1280x720 720p Low | |
| Titan RTX | |
| Radeon RX 6800 XT | |
| MSI GeForce RTX 3090 Suprim X | |
| GeForce RTX 3070 | |
| GeForce RTX 3080 | |
| 1920x1080 1080p High | |
| MSI GeForce RTX 3090 Suprim X | |
| Radeon RX 6800 XT | |
| GeForce RTX 3080 | |
| Titan RTX | |
| GeForce RTX 3070 | |
| 1920x1080 1080p Extreme | |
| MSI GeForce RTX 3090 Suprim X | |
| GeForce RTX 3080 | |
| Radeon RX 6800 XT | |
| Titan RTX | |
| GeForce RTX 3070 | |
| 3840x2160 4k Optimized | |
| MSI GeForce RTX 3090 Suprim X | |
| GeForce RTX 3080 | |
| Radeon RX 6800 XT | |
| Titan RTX | |
| GeForce RTX 3070 | |
| 7680x4320 8k Optimized | |
| MSI GeForce RTX 3090 Suprim X | |
| GeForce RTX 3080 | |
| Titan RTX | |
| Radeon RX 6800 XT | |
| GeForce RTX 3070 | |
| Unigine Heaven 4.0 | |
| Extreme Preset OpenGL | |
| MSI GeForce RTX 3090 Suprim X | |
| GeForce RTX 3080 | |
| Titan RTX | |
| GeForce RTX 2080 Ti (Desktop) | |
| Radeon RX 6800 XT | |
| GeForce RTX 3070 | |
| GeForce RTX 2080 Super (Desktop) | |
| GeForce RTX 2080 (Desktop) | |
| GeForce RTX 2070 Super (Desktop) | |
| GeForce RTX 2070 (Desktop) | |
| GeForce RTX 2060 Super (Desktop) | |
| GeForce RTX 2060 (Desktop) | |
| Radeon RX 5700 XT (Desktop) | |
| Radeon VII | |
| Radeon RX 5700 (Desktop) | |
| Extreme Preset DX11 | |
| MSI GeForce RTX 3090 Suprim X | |
| Radeon RX 6800 XT | |
| Titan RTX | |
| GeForce RTX 3080 | |
| GeForce RTX 2080 Ti (Desktop) | |
| GeForce RTX 3070 | |
| GeForce RTX 2080 (Desktop) | |
| GeForce RTX 2080 Super (Desktop) | |
| GeForce RTX 2070 Super (Desktop) | |
| GeForce RTX 2070 (Desktop) | |
| GeForce RTX 2060 Super (Desktop) | |
| Radeon VII | |
| Radeon RX 5700 XT (Desktop) | |
| GeForce RTX 2060 (Desktop) | |
| Radeon RX 5700 (Desktop) | |
| Unigine Valley 1.0 | |
| 1920x1080 Extreme HD DirectX AA:x8 | |
| MSI GeForce RTX 3090 Suprim X | |
| Radeon RX 6800 XT | |
| Titan RTX | |
| GeForce RTX 3080 | |
| GeForce RTX 2080 Ti (Desktop) | |
| GeForce RTX 3070 | |
| GeForce RTX 2080 Super (Desktop) | |
| GeForce RTX 2080 (Desktop) | |
| GeForce RTX 2070 Super (Desktop) | |
| GeForce RTX 2070 (Desktop) | |
| Radeon VII | |
| GeForce RTX 2060 Super (Desktop) | |
| Radeon RX 5700 XT (Desktop) | |
| Radeon RX 5700 (Desktop) | |
| GeForce RTX 2060 (Desktop) | |
| 1920x1080 Extreme HD Preset OpenGL AA:x8 | |
| MSI GeForce RTX 3090 Suprim X | |
| GeForce RTX 3080 | |
| Titan RTX | |
| Radeon RX 6800 XT | |
| GeForce RTX 2080 Ti (Desktop) | |
| GeForce RTX 3070 | |
| GeForce RTX 2080 Super (Desktop) | |
| GeForce RTX 2080 (Desktop) | |
| GeForce RTX 2070 Super (Desktop) | |
| GeForce RTX 2070 (Desktop) | |
| GeForce RTX 2060 Super (Desktop) | |
| Radeon RX 5700 XT (Desktop) | |
| GeForce RTX 2060 (Desktop) | |
| Radeon RX 5700 (Desktop) | |
| Radeon VII | |
| SiSoft Sandra 2016 | |
| GP Financial Analysis (FP High/Double Precision) | |
| Radeon VII | |
| Radeon RX 6800 XT | |
| MSI GeForce RTX 3090 Suprim X | |
| GeForce RTX 3080 | |
| GeForce RTX 2080 Ti (Desktop) | |
| GeForce RTX 2080 (Desktop) | |
| GeForce RTX 2080 Super (Desktop) | |
| GeForce RTX 3070 | |
| GeForce RTX 2070 Super (Desktop) | |
| GeForce RTX 2070 (Desktop) | |
| GeForce RTX 2060 Super (Desktop) | |
| GeForce RTX 2060 (Desktop) | |
| Radeon RX 5700 XT (Desktop) | |
| Radeon RX 5700 (Desktop) | |
| GP Cryptography (Higher Security AES256+SHA2-512) | |
| MSI GeForce RTX 3090 Suprim X | |
| GeForce RTX 3080 | |
| Radeon RX 6800 XT | |
| GeForce RTX 2080 Ti (Desktop) | |
| GeForce RTX 3070 | |
| GeForce RTX 2080 (Desktop) | |
| Radeon VII | |
| GeForce RTX 2080 Super (Desktop) | |
| GeForce RTX 2070 Super (Desktop) | |
| GeForce RTX 2070 (Desktop) | |
| GeForce RTX 2060 Super (Desktop) | |
| GeForce RTX 2060 (Desktop) | |
| Image Processing | |
| Radeon RX 6800 XT | |
| MSI GeForce RTX 3090 Suprim X | |
| GeForce RTX 3080 | |
| Radeon VII | |
| GeForce RTX 3070 | |
| GeForce RTX 2080 Ti (Desktop) | |
| GeForce RTX 2080 Super (Desktop) | |
| GeForce RTX 2080 (Desktop) | |
| GeForce RTX 2070 Super (Desktop) | |
| GeForce RTX 2070 (Desktop) | |
| GeForce RTX 2060 Super (Desktop) | |
| Radeon RX 5700 XT (Desktop) | |
| GeForce RTX 2060 (Desktop) | |
| Radeon RX 5700 (Desktop) | |
Oyun kıyaslamaları
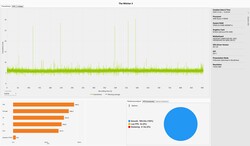
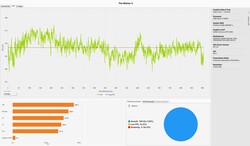
Öncelikle MSI GeForce RTX 3090 Suprim X'in tüm modern başlıkları sorunsuzca işleyebileceğini söyleyebiliriz. Bazen, ortalama kare hızının 2160p'de 60-FPS işaretinin altına düştüğü oyunlar vardır. Bununla birlikte, sorunsuz oyun oynamak mümkündür ve bir slayt gösterisi izlediğiniz izlenimini edinmezsiniz GeForce RTX 3080 ile karşılaştırıldığında, GeForce RTX 3090 kendini tekrar tekrar biraz ayırabilir. Bununla birlikte, grafik kartı, performans farkından da yararlanabilmek için her zaman çok yüksek çözünürlük gerektirir. Bununla birlikte, AMD'nin Radeon RX 6800 XT'sine kıyasla GeForce RTX 3090'ın performansı artı sentetik kıyaslamalarda gördüğümüzden çok daha büyük. Performans oyuna bağlı olarak değişir, ancak AMD Radeon RX 6800 XT her zaman tonu belirler. En yeni grafiklerle çok iyi ölçeklendiği için çerçeve sürelerini ve çerçeve ilerlemesini kaydetmek için The Witcher 3 (Ultra ön ayar) oyununu kullanıyoruz. kartları. Çerçeve zamanlarında herhangi bir anormallik yoktur. Bununla birlikte, düzgün oynanışı etkilemeyen yalnızca birkaç izole aykırı değer vardır. Çerçeve ilerlemesi söz konusu olduğunda, kare hızları ilk üçte birinde biraz daha iyi; ileride stabilize oluyorlar ve tüm dönem boyunca 168 FPS ile çok iyi bir sonuç gösteriyorlar. Karşılaştırma amacıyla: Asus GeForce RTX 3080 ROG Strix Gaming OC, 139 FPS'ye ulaştı.
| Far Cry New Dawn - 3840x2160 Ultra Preset | |
| MSI GeForce RTX 3090 Suprim X | |
| Radeon RX 6800 XT | |
| GeForce RTX 3080 | |
| Titan RTX | |
| Titan RTX | |
| GeForce RTX 2080 Ti (Desktop) | |
| GeForce RTX 3070 | |
| GeForce RTX 2080 Super (Desktop) | |
| GeForce RTX 2080 (Desktop) | |
| Radeon VII | |
| GeForce RTX 2070 Super (Desktop) | |
| Radeon RX 5700 XT (Desktop) | |
| GeForce RTX 2070 (Desktop) | |
| Radeon RX 5700 (Desktop) | |
| GeForce RTX 2060 Super (Desktop) | |
| RX Vega 64 | |
| GeForce RTX 2060 (Desktop) | |
| Far Cry 5 - 3840x2160 Ultra Preset AA:T | |
| MSI GeForce RTX 3090 Suprim X | |
| GeForce RTX 3080 | |
| Radeon RX 6800 XT | |
| Titan RTX | |
| Titan RTX | |
| GeForce RTX 2080 Ti (Desktop) | |
| GeForce RTX 3070 | |
| GeForce RTX 2080 Super (Desktop) | |
| GeForce RTX 2080 (Desktop) | |
| Radeon VII | |
| GeForce RTX 2070 Super (Desktop) | |
| Radeon RX 5700 XT (Desktop) | |
| GeForce RTX 2070 (Desktop) | |
| GeForce RTX 2060 Super (Desktop) | |
| Radeon RX 5700 (Desktop) | |
| RX Vega 64 | |
| GeForce RTX 2060 (Desktop) | |
| F1 2020 - 3840x2160 Ultra High Preset AA:T AF:16x | |
| MSI GeForce RTX 3090 Suprim X | |
| Radeon RX 6800 XT | |
| GeForce RTX 3080 | |
| Titan RTX | |
| GeForce RTX 3070 | |
| Borderlands 3 - 3840x2160 Badass Overall Quality (DX11) | |
| MSI GeForce RTX 3090 Suprim X | |
| GeForce RTX 3080 | |
| Radeon RX 6800 XT | |
| Titan RTX | |
| Titan RTX | |
| GeForce RTX 3070 | |
| GeForce RTX 2080 Ti (Desktop) | |
| Metro Exodus - 3840x2160 Ultra Quality AF:16x | |
| MSI GeForce RTX 3090 Suprim X | |
| GeForce RTX 3080 | |
| Radeon RX 6800 XT | |
| Titan RTX | |
| Titan RTX | |
| GeForce RTX 3070 | |
| GeForce RTX 2080 Ti (Desktop) | |
| RX Vega 64 | |
| GeForce RTX 2080 Super (Desktop) | |
| GeForce RTX 2080 (Desktop) | |
| Radeon VII | |
| GeForce RTX 2070 Super (Desktop) | |
| GeForce RTX 2070 (Desktop) | |
| GeForce RTX 2060 Super (Desktop) | |
| Radeon RX 5700 XT (Desktop) | |
| Radeon RX 5700 (Desktop) | |
| GeForce RTX 2060 (Desktop) | |
| Red Dead Redemption 2 - 3840x2160 Maximum Settings | |
| MSI GeForce RTX 3090 Suprim X | |
| GeForce RTX 3080 | |
| Radeon RX 6800 XT | |
| GeForce RTX 3070 | |
| Titan RTX | |
| Rise of the Tomb Raider - 3840x2160 High Preset AA:FX AF:4x | |
| MSI GeForce RTX 3090 Suprim X | |
| GeForce RTX 3080 | |
| Radeon RX 6800 XT | |
| GeForce RTX 2080 Ti (Desktop) | |
| GeForce RTX 3070 | |
| GeForce RTX 2080 Super (Desktop) | |
| GeForce RTX 2080 (Desktop) | |
| GeForce RTX 2070 Super (Desktop) | |
| GeForce RTX 2070 (Desktop) | |
| Radeon VII | |
| GeForce RTX 2060 Super (Desktop) | |
| RX Vega 64 | |
| GeForce RTX 2060 (Desktop) | |
| Shadow of the Tomb Raider - 3840x2160 Highest Preset AA:T | |
| MSI GeForce RTX 3090 Suprim X | |
| GeForce RTX 3080 | |
| Radeon RX 6800 XT | |
| Titan RTX | |
| Titan RTX | |
| GeForce RTX 3070 | |
| GeForce RTX 2080 Ti (Desktop) | |
| GeForce RTX 2080 Super (Desktop) | |
| GeForce RTX 2080 (Desktop) | |
| Radeon VII | |
| GeForce RTX 2070 Super (Desktop) | |
| GeForce RTX 2070 (Desktop) | |
| Radeon RX 5700 XT (Desktop) | |
| GeForce RTX 2060 Super (Desktop) | |
| Radeon RX 5700 (Desktop) | |
| GeForce RTX 2060 (Desktop) | |
| RX Vega 64 | |
| Mafia Definitive Edition - 3840x2160 High Preset | |
| MSI GeForce RTX 3090 Suprim X | |
| GeForce RTX 3080 | |
| Titan RTX | |
| Radeon RX 6800 XT | |
| GeForce RTX 3070 | |
| Watch Dogs Legion - 3840x2160 Ultra Preset (DX12) | |
| MSI GeForce RTX 3090 Suprim X | |
| GeForce RTX 3080 | |
| Radeon RX 6800 XT | |
| Titan RTX | |
| GeForce RTX 3070 | |
| The Witcher 3 - 3840x2160 High Graphics & Postprocessing (Nvidia HairWorks Off) | |
| MSI GeForce RTX 3090 Suprim X | |
| GeForce RTX 3080 | |
| Radeon RX 6800 XT | |
| Titan RTX | |
| Titan RTX | |
| GeForce RTX 2080 Ti (Desktop) | |
| GeForce RTX 3070 | |
| GeForce RTX 2080 Super (Desktop) | |
| GeForce RTX 2080 (Desktop) | |
| GeForce RTX 2070 Super (Desktop) | |
| GeForce RTX 2070 (Desktop) | |
| GeForce RTX 2060 Super (Desktop) | |
| Radeon VII | |
| Radeon RX 5700 XT (Desktop) | |
| GeForce RTX 2060 (Desktop) | |
| RX Vega 64 | |
| Radeon RX 5700 (Desktop) | |
| düşük | orta | yüksek | ultra | QHD | 4K | |
|---|---|---|---|---|---|---|
| GTA V (2015) | 184 | 176 | 175 | 114 | 109 | 164 |
| The Witcher 3 (2015) | 355 | 335 | 292 | 160 | 128 | |
| Dota 2 Reborn (2015) | 169.9 | 143.2 | 144.3 | 140.3 | 142.8 | |
| Rise of the Tomb Raider (2016) | 300 | 263 | 257 | 240 | 128 | |
| Final Fantasy XV Benchmark (2018) | 219 | 189 | 156 | 133 | 87.6 | |
| X-Plane 11.11 (2018) | 151 | 126 | 96.8 | 83 | ||
| Far Cry 5 (2018) | 179 | 162 | 153 | 141 | 137 | 106 |
| Strange Brigade (2018) | 525 | 415 | 372 | 330 | 255 | 158 |
| Shadow of the Tomb Raider (2018) | 201 | 193 | 177 | 188 | 162 | 95.6 |
| Battlefield V (2018) | 184 | 164 | 151 | 141 | 124 | 94 |
| Apex Legends (2019) | 144 | 144 | 144 | 144 | 144 | 139 |
| Far Cry New Dawn (2019) | 134 | 117 | 117 | 106 | 105 | 96 |
| Metro Exodus (2019) | 190 | 166 | 155 | 132 | 112 | 76.3 |
| The Division 2 (2019) | 239 | 221 | 188 | 160 | 128 | 77.5 |
| Anno 1800 (2019) | 145 | 145 | 105 | 54.8 | 53.9 | 52.5 |
| Rage 2 (2019) | 264 | 192 | 168 | 163 | 110 | 56.7 |
| Control (2019) | 238 | 215 | 177 | 123 | 66 | |
| Borderlands 3 (2019) | 178 | 157 | 145 | 135 | 117 | 73.4 |
| Star Wars Jedi Fallen Order (2019) | 133 | 132 | 131 | 130 | 111 | |
| Red Dead Redemption 2 (2019) | 175 | 174 | 155 | 115 | 96 | 67 |
| Hunt Showdown (2020) | 270 | 278 | 252 | 217 | 121 | |
| Doom Eternal (2020) | 314 | 310 | 298 | 296 | 295 | 188 |
| F1 2020 (2020) | 386 | 336 | 322 | 266 | 219 | 144 |
| Death Stranding (2020) | 209 | 207 | 203 | 210 | 176 | 110 |
| Horizon Zero Dawn (2020) | 203 | 196 | 181 | 166 | 148 | 95 |
| Crysis Remastered (2020) | 266 | 209 | 130 | 102 | 86.7 | 64.9 |
| Serious Sam 4 (2020) | 138.7 | 129.8 | 125.3 | 121.3 | 118.4 | 115.1 |
| Mafia Definitive Edition (2020) | 180 | 161 | 157 | 149 | 89.1 | |
| Star Wars Squadrons (2020) | 454 | 419 | 403 | 389 | 305 | 197 |
| FIFA 21 (2020) | 202 | 194 | 195 | 202 | 207 | 213 |
| Watch Dogs Legion (2020) | 128 | 127 | 111 | 103 | 89.7 | 60.3 |
| Dirt 5 (2020) | 191 | 149 | 127 | 112 | 100 | 73.8 |
| Assassin´s Creed Valhalla (2020) | 137 | 112 | 97 | 88 | 76 | 55 |
| Call of Duty Black Ops Cold War (2020) | 251 | 223 | 172 | 161 | 122 | 76.1 |
| Yakuza Like a Dragon (2020) | 116 | 114 | 115 | 116 | 116 | 80.2 |
Hesaplama performansı
LuxMark ve ComputeMark'ta, MSI GeForce RTX 3090 Suprim X, daha iyi ham performans nedeniyle GeForce RTX 3080'den biraz daha iyi puan alıyor. Bununla birlikte, GeForce RTX 3090, LuxMark Sala testinde AMD'nin RX 6800 XT'sini açık bir şekilde yenilgiye uğratmak zorunda. Her mimarinin, programlar ve sürücüler tarafından farklı şekilde desteklenen avantajları ve dezavantajları vardır. SPECviewperf testleri esas olarak iş istasyonlarına yöneliktir. Bunlar, sürücü optimizasyonları nedeniyle Quadro ve FirePro modellerinde tüketici modellerine göre daha fazla performans sunar.
| LuxMark v2.0 64Bit | |
| Room GPUs-only | |
| MSI GeForce RTX 3090 Suprim X | |
| ASUS GeForce RTX 3080 ROG STRIX OC GAMING | |
| AMD Radeon RX 6800 XT | |
| Nvidia Titan RTX | |
| MSI RTX 2080 Ti Gaming X Trio | |
| KFA2 GeForce RTX 2080 Ti EX | |
| MSI GeForce RTX 3070 Gaming X Trio | |
| AMD Radeon VII | |
| MSI RTX 2080 Gaming X Trio | |
| Nvidia GeForce RTX 2080 Super | |
| Nvidia GeForce RTX 2070 Super | |
| MSI RTX 2070 Gaming Z 8G | |
| Nvidia GeForce RTX 2060 Super | |
| MSI RTX 2060 Gaming Z 6G | |
| AMD Radeon RX 5700 XT | |
| AMD Radeon RX 5700 | |
| Sala GPUs-only | |
| AMD Radeon RX 6800 XT | |
| MSI GeForce RTX 3090 Suprim X | |
| ASUS GeForce RTX 3080 ROG STRIX OC GAMING | |
| Nvidia Titan RTX | |
| MSI RTX 2080 Ti Gaming X Trio | |
| MSI GeForce RTX 3070 Gaming X Trio | |
| KFA2 GeForce RTX 2080 Ti EX | |
| MSI RTX 2080 Gaming X Trio | |
| Nvidia GeForce RTX 2080 Super | |
| Nvidia GeForce RTX 2070 Super | |
| MSI RTX 2070 Gaming Z 8G | |
| Nvidia GeForce RTX 2060 Super | |
| AMD Radeon VII | |
| AMD Radeon RX 5700 XT | |
| MSI RTX 2060 Gaming Z 6G | |
| AMD Radeon RX 5700 | |
| ComputeMark v2.1 | |
| 1024x600 Normal, QJuliaRayTrace | |
| MSI GeForce RTX 3090 Suprim X | |
| ASUS GeForce RTX 3080 ROG STRIX OC GAMING | |
| MSI GeForce RTX 3070 Gaming X Trio | |
| AMD Radeon RX 6800 XT | |
| MSI RTX 2080 Ti Gaming X Trio | |
| Nvidia Titan RTX | |
| KFA2 GeForce RTX 2080 Ti EX | |
| MSI RTX 2080 Gaming X Trio | |
| Nvidia GeForce RTX 2080 Super | |
| Nvidia GeForce RTX 2070 Super | |
| AMD Radeon VII | |
| AMD Radeon RX 5700 XT | |
| MSI RTX 2070 Gaming Z 8G | |
| Nvidia GeForce RTX 2060 Super | |
| MSI RTX 2060 Gaming Z 6G | |
| AMD Radeon RX 5700 | |
| 1024x600 Normal, Mandel Scalar | |
| MSI GeForce RTX 3090 Suprim X | |
| AMD Radeon RX 6800 XT | |
| ASUS GeForce RTX 3080 ROG STRIX OC GAMING | |
| MSI GeForce RTX 3070 Gaming X Trio | |
| AMD Radeon VII | |
| MSI RTX 2080 Ti Gaming X Trio | |
| Nvidia Titan RTX | |
| KFA2 GeForce RTX 2080 Ti EX | |
| AMD Radeon RX 5700 XT | |
| MSI RTX 2080 Gaming X Trio | |
| Nvidia GeForce RTX 2080 Super | |
| AMD Radeon RX 5700 | |
| Nvidia GeForce RTX 2070 Super | |
| MSI RTX 2070 Gaming Z 8G | |
| Nvidia GeForce RTX 2060 Super | |
| MSI RTX 2060 Gaming Z 6G | |
| 1024x600 Normal, Mandel Vector | |
| AMD Radeon RX 6800 XT | |
| MSI GeForce RTX 3090 Suprim X | |
| ASUS GeForce RTX 3080 ROG STRIX OC GAMING | |
| MSI GeForce RTX 3070 Gaming X Trio | |
| MSI RTX 2080 Ti Gaming X Trio | |
| Nvidia Titan RTX | |
| AMD Radeon VII | |
| KFA2 GeForce RTX 2080 Ti EX | |
| AMD Radeon RX 5700 XT | |
| MSI RTX 2080 Gaming X Trio | |
| Nvidia GeForce RTX 2080 Super | |
| AMD Radeon RX 5700 | |
| Nvidia GeForce RTX 2070 Super | |
| MSI RTX 2070 Gaming Z 8G | |
| Nvidia GeForce RTX 2060 Super | |
| MSI RTX 2060 Gaming Z 6G | |
| 1024x600 Normal, Fluid 2DTexArr | |
| MSI GeForce RTX 3090 Suprim X | |
| ASUS GeForce RTX 3080 ROG STRIX OC GAMING | |
| AMD Radeon RX 6800 XT | |
| Nvidia Titan RTX | |
| MSI RTX 2080 Ti Gaming X Trio | |
| KFA2 GeForce RTX 2080 Ti EX | |
| MSI GeForce RTX 3070 Gaming X Trio | |
| Nvidia GeForce RTX 2080 Super | |
| MSI RTX 2080 Gaming X Trio | |
| Nvidia GeForce RTX 2070 Super | |
| AMD Radeon VII | |
| MSI RTX 2070 Gaming Z 8G | |
| Nvidia GeForce RTX 2060 Super | |
| AMD Radeon RX 5700 XT | |
| AMD Radeon RX 5700 | |
| MSI RTX 2060 Gaming Z 6G | |
| 1024x600 Normal, Fluid 3DTex | |
| MSI GeForce RTX 3090 Suprim X | |
| AMD Radeon RX 6800 XT | |
| ASUS GeForce RTX 3080 ROG STRIX OC GAMING | |
| Nvidia Titan RTX | |
| MSI RTX 2080 Ti Gaming X Trio | |
| AMD Radeon VII | |
| KFA2 GeForce RTX 2080 Ti EX | |
| MSI GeForce RTX 3070 Gaming X Trio | |
| Nvidia GeForce RTX 2080 Super | |
| MSI RTX 2080 Gaming X Trio | |
| Nvidia GeForce RTX 2070 Super | |
| MSI RTX 2070 Gaming Z 8G | |
| AMD Radeon RX 5700 XT | |
| AMD Radeon RX 5700 | |
| Nvidia GeForce RTX 2060 Super | |
| MSI RTX 2060 Gaming Z 6G | |
| 1024x600 Normal, Score | |
| MSI GeForce RTX 3090 Suprim X | |
| ASUS GeForce RTX 3080 ROG STRIX OC GAMING | |
| AMD Radeon RX 6800 XT | |
| MSI GeForce RTX 3070 Gaming X Trio | |
| MSI RTX 2080 Ti Gaming X Trio | |
| Nvidia Titan RTX | |
| KFA2 GeForce RTX 2080 Ti EX | |
| AMD Radeon VII | |
| Nvidia GeForce RTX 2080 Super | |
| MSI RTX 2080 Gaming X Trio | |
| AMD Radeon RX 5700 XT | |
| Nvidia GeForce RTX 2070 Super | |
| MSI RTX 2070 Gaming Z 8G | |
| AMD Radeon RX 5700 | |
| Nvidia GeForce RTX 2060 Super | |
| MSI RTX 2060 Gaming Z 6G | |
| SPECviewperf 13 | |
| Solidworks (sw-04) | |
| AMD Radeon RX 6800 XT | |
| Nvidia Titan RTX | |
| AMD Radeon RX 5700 XT | |
| MSI RTX 2080 Ti Gaming X Trio | |
| KFA2 GeForce RTX 2080 Ti EX | |
| AMD Radeon RX 5700 | |
| MSI RTX 2080 Gaming X Trio | |
| Nvidia GeForce RTX 2080 Super | |
| MSI GeForce RTX 3090 Suprim X | |
| AMD Radeon VII | |
| Nvidia GeForce RTX 2070 Super | |
| ASUS GeForce RTX 3080 ROG STRIX OC GAMING | |
| MSI RTX 2070 Gaming Z 8G | |
| MSI GeForce RTX 3070 Gaming X Trio | |
| MSI RTX 2060 Gaming Z 6G | |
| Nvidia GeForce RTX 2060 Super | |
| Siemens NX (snx-03) | |
| Nvidia Titan RTX | |
| AMD Radeon RX 6800 XT | |
| AMD Radeon RX 5700 XT | |
| AMD Radeon RX 5700 | |
| AMD Radeon VII | |
| MSI GeForce RTX 3090 Suprim X | |
| ASUS GeForce RTX 3080 ROG STRIX OC GAMING | |
| MSI RTX 2080 Ti Gaming X Trio | |
| MSI GeForce RTX 3070 Gaming X Trio | |
| KFA2 GeForce RTX 2080 Ti EX | |
| Nvidia GeForce RTX 2080 Super | |
| MSI RTX 2080 Gaming X Trio | |
| Nvidia GeForce RTX 2070 Super | |
| MSI RTX 2070 Gaming Z 8G | |
| Nvidia GeForce RTX 2060 Super | |
| MSI RTX 2060 Gaming Z 6G | |
| Showcase (showcase-02) | |
| MSI GeForce RTX 3090 Suprim X | |
| AMD Radeon RX 6800 XT | |
| Nvidia Titan RTX | |
| KFA2 GeForce RTX 2080 Ti EX | |
| MSI RTX 2080 Ti Gaming X Trio | |
| MSI GeForce RTX 3070 Gaming X Trio | |
| Nvidia GeForce RTX 2080 Super | |
| AMD Radeon RX 5700 XT | |
| Nvidia GeForce RTX 2070 Super | |
| AMD Radeon RX 5700 | |
| Nvidia GeForce RTX 2060 Super | |
| MSI RTX 2060 Gaming Z 6G | |
| Medical (medical-02) | |
| AMD Radeon RX 6800 XT | |
| MSI GeForce RTX 3090 Suprim X | |
| ASUS GeForce RTX 3080 ROG STRIX OC GAMING | |
| Nvidia Titan RTX | |
| MSI RTX 2080 Ti Gaming X Trio | |
| AMD Radeon RX 5700 XT | |
| KFA2 GeForce RTX 2080 Ti EX | |
| MSI GeForce RTX 3070 Gaming X Trio | |
| AMD Radeon VII | |
| Nvidia GeForce RTX 2080 Super | |
| MSI RTX 2080 Gaming X Trio | |
| AMD Radeon RX 5700 | |
| Nvidia GeForce RTX 2070 Super | |
| MSI RTX 2070 Gaming Z 8G | |
| Nvidia GeForce RTX 2060 Super | |
| MSI RTX 2060 Gaming Z 6G | |
| Maya (maya-05) | |
| MSI GeForce RTX 3090 Suprim X | |
| MSI RTX 2080 Ti Gaming X Trio | |
| KFA2 GeForce RTX 2080 Ti EX | |
| Nvidia Titan RTX | |
| ASUS GeForce RTX 3080 ROG STRIX OC GAMING | |
| AMD Radeon RX 6800 XT | |
| Nvidia GeForce RTX 2080 Super | |
| Nvidia GeForce RTX 2070 Super | |
| MSI RTX 2070 Gaming Z 8G | |
| Nvidia GeForce RTX 2060 Super | |
| MSI GeForce RTX 3070 Gaming X Trio | |
| MSI RTX 2060 Gaming Z 6G | |
| AMD Radeon RX 5700 XT | |
| AMD Radeon VII | |
| AMD Radeon RX 5700 | |
| Energy (energy-02) | |
| AMD Radeon RX 6800 XT | |
| Nvidia Titan RTX | |
| MSI GeForce RTX 3090 Suprim X | |
| ASUS GeForce RTX 3080 ROG STRIX OC GAMING | |
| AMD Radeon VII | |
| MSI RTX 2080 Ti Gaming X Trio | |
| KFA2 GeForce RTX 2080 Ti EX | |
| MSI GeForce RTX 3070 Gaming X Trio | |
| AMD Radeon RX 5700 XT | |
| AMD Radeon RX 5700 | |
| Nvidia GeForce RTX 2080 Super | |
| Nvidia GeForce RTX 2070 Super | |
| MSI RTX 2070 Gaming Z 8G | |
| Nvidia GeForce RTX 2060 Super | |
| MSI RTX 2060 Gaming Z 6G | |
| Creo (creo-02) | |
| MSI GeForce RTX 3090 Suprim X | |
| Nvidia Titan RTX | |
| MSI RTX 2080 Ti Gaming X Trio | |
| KFA2 GeForce RTX 2080 Ti EX | |
| ASUS GeForce RTX 3080 ROG STRIX OC GAMING | |
| AMD Radeon RX 6800 XT | |
| MSI GeForce RTX 3070 Gaming X Trio | |
| MSI RTX 2080 Gaming X Trio | |
| Nvidia GeForce RTX 2080 Super | |
| MSI RTX 2070 Gaming Z 8G | |
| Nvidia GeForce RTX 2060 Super | |
| Nvidia GeForce RTX 2070 Super | |
| MSI RTX 2060 Gaming Z 6G | |
| AMD Radeon RX 5700 XT | |
| AMD Radeon RX 5700 | |
| AMD Radeon VII | |
| Catia (catia-05) | |
| AMD Radeon RX 6800 XT | |
| Nvidia Titan RTX | |
| AMD Radeon RX 5700 XT | |
| AMD Radeon VII | |
| AMD Radeon RX 5700 | |
| MSI GeForce RTX 3090 Suprim X | |
| ASUS GeForce RTX 3080 ROG STRIX OC GAMING | |
| MSI RTX 2080 Ti Gaming X Trio | |
| KFA2 GeForce RTX 2080 Ti EX | |
| MSI GeForce RTX 3070 Gaming X Trio | |
| Nvidia GeForce RTX 2080 Super | |
| Nvidia GeForce RTX 2070 Super | |
| MSI RTX 2070 Gaming Z 8G | |
| Nvidia GeForce RTX 2060 Super | |
| MSI RTX 2060 Gaming Z 6G | |
| 3ds Max (3dsmax-06) | |
| MSI GeForce RTX 3090 Suprim X | |
| AMD Radeon RX 6800 XT | |
| MSI RTX 2080 Ti Gaming X Trio | |
| KFA2 GeForce RTX 2080 Ti EX | |
| Nvidia Titan RTX | |
| MSI GeForce RTX 3070 Gaming X Trio | |
| ASUS GeForce RTX 3080 ROG STRIX OC GAMING | |
| Nvidia GeForce RTX 2080 Super | |
| Nvidia GeForce RTX 2070 Super | |
| MSI RTX 2070 Gaming Z 8G | |
| Nvidia GeForce RTX 2060 Super | |
| MSI RTX 2060 Gaming Z 6G | |
| AMD Radeon RX 5700 XT | |
| AMD Radeon VII | |
| AMD Radeon RX 5700 | |
| SPECviewperf 12 | |
| 1900x1060 Solidworks (sw-03) | |
| AMD Radeon RX 6800 XT | |
| Nvidia Titan RTX | |
| AMD Radeon RX 5700 XT | |
| MSI RTX 2080 Ti Gaming X Trio | |
| AMD Radeon RX 5700 | |
| KFA2 GeForce RTX 2080 Ti EX | |
| AMD Radeon VII | |
| MSI GeForce RTX 3090 Suprim X | |
| ASUS GeForce RTX 3080 ROG STRIX OC GAMING | |
| Nvidia GeForce RTX 2080 Super | |
| MSI RTX 2080 Gaming X Trio | |
| Nvidia GeForce RTX 2070 Super | |
| MSI GeForce RTX 3070 Gaming X Trio | |
| MSI RTX 2070 Gaming Z 8G | |
| Nvidia GeForce RTX 2060 Super | |
| MSI RTX 2060 Gaming Z 6G | |
| 1900x1060 Siemens NX (snx-02) | |
| Nvidia Titan RTX | |
| AMD Radeon RX 6800 XT | |
| AMD Radeon RX 5700 XT | |
| AMD Radeon RX 5700 | |
| AMD Radeon VII | |
| MSI GeForce RTX 3090 Suprim X | |
| ASUS GeForce RTX 3080 ROG STRIX OC GAMING | |
| MSI GeForce RTX 3070 Gaming X Trio | |
| MSI RTX 2080 Ti Gaming X Trio | |
| Nvidia GeForce RTX 2080 Super | |
| KFA2 GeForce RTX 2080 Ti EX | |
| MSI RTX 2080 Gaming X Trio | |
| Nvidia GeForce RTX 2070 Super | |
| MSI RTX 2070 Gaming Z 8G | |
| Nvidia GeForce RTX 2060 Super | |
| MSI RTX 2060 Gaming Z 6G | |
| 1900x1060 Showcase (showcase-01) | |
| MSI GeForce RTX 3090 Suprim X | |
| AMD Radeon RX 6800 XT | |
| ASUS GeForce RTX 3080 ROG STRIX OC GAMING | |
| Nvidia Titan RTX | |
| MSI RTX 2080 Ti Gaming X Trio | |
| KFA2 GeForce RTX 2080 Ti EX | |
| MSI GeForce RTX 3070 Gaming X Trio | |
| Nvidia GeForce RTX 2080 Super | |
| AMD Radeon RX 5700 XT | |
| Nvidia GeForce RTX 2070 Super | |
| AMD Radeon RX 5700 | |
| Nvidia GeForce RTX 2060 Super | |
| MSI RTX 2060 Gaming Z 6G | |
| 1900x1060 Medical (medical-01) | |
| Nvidia Titan RTX | |
| AMD Radeon RX 6800 XT | |
| AMD Radeon VII | |
| MSI RTX 2080 Ti Gaming X Trio | |
| ASUS GeForce RTX 3080 ROG STRIX OC GAMING | |
| KFA2 GeForce RTX 2080 Ti EX | |
| AMD Radeon RX 5700 XT | |
| Nvidia GeForce RTX 2080 Super | |
| MSI RTX 2080 Gaming X Trio | |
| MSI GeForce RTX 3090 Suprim X | |
| Nvidia GeForce RTX 2070 Super | |
| AMD Radeon RX 5700 | |
| MSI RTX 2070 Gaming Z 8G | |
| Nvidia GeForce RTX 2060 Super | |
| MSI GeForce RTX 3070 Gaming X Trio | |
| MSI RTX 2060 Gaming Z 6G | |
| 1900x1060 Maya (maya-04) | |
| ASUS GeForce RTX 3080 ROG STRIX OC GAMING | |
| MSI GeForce RTX 3090 Suprim X | |
| MSI RTX 2080 Ti Gaming X Trio | |
| KFA2 GeForce RTX 2080 Ti EX | |
| MSI GeForce RTX 3070 Gaming X Trio | |
| MSI RTX 2080 Gaming X Trio | |
| Nvidia GeForce RTX 2060 Super | |
| MSI RTX 2070 Gaming Z 8G | |
| Nvidia GeForce RTX 2080 Super | |
| Nvidia Titan RTX | |
| MSI RTX 2060 Gaming Z 6G | |
| Nvidia GeForce RTX 2070 Super | |
| AMD Radeon RX 6800 XT | |
| AMD Radeon VII | |
| AMD Radeon RX 5700 XT | |
| AMD Radeon RX 5700 | |
| 1900x1060 Energy (energy-01) | |
| AMD Radeon RX 6800 XT | |
| Nvidia Titan RTX | |
| MSI GeForce RTX 3090 Suprim X | |
| ASUS GeForce RTX 3080 ROG STRIX OC GAMING | |
| MSI RTX 2080 Ti Gaming X Trio | |
| AMD Radeon VII | |
| KFA2 GeForce RTX 2080 Ti EX | |
| Nvidia GeForce RTX 2080 Super | |
| AMD Radeon RX 5700 XT | |
| MSI GeForce RTX 3070 Gaming X Trio | |
| MSI RTX 2080 Gaming X Trio | |
| Nvidia GeForce RTX 2070 Super | |
| AMD Radeon RX 5700 | |
| MSI RTX 2070 Gaming Z 8G | |
| Nvidia GeForce RTX 2060 Super | |
| MSI RTX 2060 Gaming Z 6G | |
| 1900x1060 Creo (creo-01) | |
| AMD Radeon RX 6800 XT | |
| Nvidia Titan RTX | |
| MSI GeForce RTX 3090 Suprim X | |
| ASUS GeForce RTX 3080 ROG STRIX OC GAMING | |
| AMD Radeon RX 5700 XT | |
| MSI RTX 2080 Ti Gaming X Trio | |
| KFA2 GeForce RTX 2080 Ti EX | |
| AMD Radeon RX 5700 | |
| MSI GeForce RTX 3070 Gaming X Trio | |
| AMD Radeon VII | |
| Nvidia GeForce RTX 2080 Super | |
| MSI RTX 2080 Gaming X Trio | |
| Nvidia GeForce RTX 2070 Super | |
| MSI RTX 2070 Gaming Z 8G | |
| MSI RTX 2060 Gaming Z 6G | |
| Nvidia GeForce RTX 2060 Super | |
| 1900x1060 Catia (catia-04) | |
| AMD Radeon RX 6800 XT | |
| Nvidia Titan RTX | |
| AMD Radeon VII | |
| AMD Radeon RX 5700 XT | |
| AMD Radeon RX 5700 | |
| MSI GeForce RTX 3090 Suprim X | |
| ASUS GeForce RTX 3080 ROG STRIX OC GAMING | |
| MSI RTX 2080 Ti Gaming X Trio | |
| KFA2 GeForce RTX 2080 Ti EX | |
| MSI GeForce RTX 3070 Gaming X Trio | |
| MSI RTX 2080 Gaming X Trio | |
| Nvidia GeForce RTX 2080 Super | |
| Nvidia GeForce RTX 2070 Super | |
| MSI RTX 2070 Gaming Z 8G | |
| Nvidia GeForce RTX 2060 Super | |
| MSI RTX 2060 Gaming Z 6G | |
| 1900x1060 3ds Max (3dsmax-05) | |
| MSI GeForce RTX 3090 Suprim X | |
| ASUS GeForce RTX 3080 ROG STRIX OC GAMING | |
| MSI RTX 2080 Ti Gaming X Trio | |
| Nvidia Titan RTX | |
| MSI GeForce RTX 3070 Gaming X Trio | |
| KFA2 GeForce RTX 2080 Ti EX | |
| MSI RTX 2080 Gaming X Trio | |
| Nvidia GeForce RTX 2080 Super | |
| Nvidia GeForce RTX 2070 Super | |
| MSI RTX 2070 Gaming Z 8G | |
| Nvidia GeForce RTX 2060 Super | |
| MSI RTX 2060 Gaming Z 6G | |
| AMD Radeon RX 5700 XT | |
| AMD Radeon RX 6800 XT | |
| AMD Radeon VII | |
| AMD Radeon RX 5700 | |
| SPECviewperf 2020 | |
| 3840x2160 Solidworks (solidworks-05) | |
| MSI GeForce RTX 3090 Suprim X | |
| MSI GeForce RTX 3070 Gaming X Trio | |
| AMD Radeon RX 6800 XT | |
| 3840x2160 Siemens NX (snx-04) | |
| AMD Radeon RX 6800 XT | |
| MSI GeForce RTX 3090 Suprim X | |
| MSI GeForce RTX 3070 Gaming X Trio | |
| 3840x2160 Medical (medical-03) | |
| AMD Radeon RX 6800 XT | |
| MSI GeForce RTX 3090 Suprim X | |
| MSI GeForce RTX 3070 Gaming X Trio | |
| 3840x2160 Maya (maya-06) | |
| MSI GeForce RTX 3090 Suprim X | |
| MSI GeForce RTX 3070 Gaming X Trio | |
| AMD Radeon RX 6800 XT | |
| 3840x2160 Energy (energy-03) | |
| MSI GeForce RTX 3090 Suprim X | |
| AMD Radeon RX 6800 XT | |
| MSI GeForce RTX 3070 Gaming X Trio | |
| 3840x2160 Creo (creo-03) | |
| MSI GeForce RTX 3090 Suprim X | |
| MSI GeForce RTX 3070 Gaming X Trio | |
| AMD Radeon RX 6800 XT | |
| 3840x2160 CATIA (catia-06) | |
| MSI GeForce RTX 3090 Suprim X | |
| MSI GeForce RTX 3070 Gaming X Trio | |
| AMD Radeon RX 6800 XT | |
| 3840x2160 3ds Max (3dsmax-07) | |
| MSI GeForce RTX 3090 Suprim X | |
| AMD Radeon RX 6800 XT | |
| MSI GeForce RTX 3070 Gaming X Trio | |
MSI GeForce RTX 3090 Suprim X Emisyonları
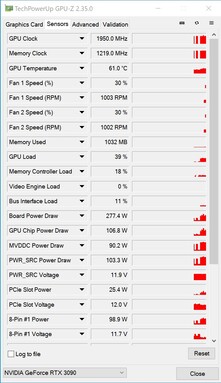
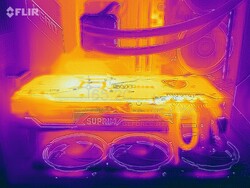
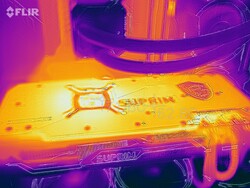
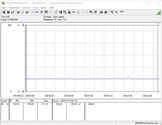
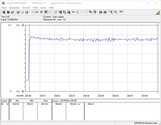
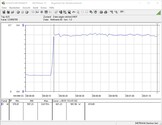
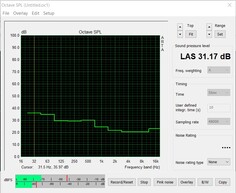
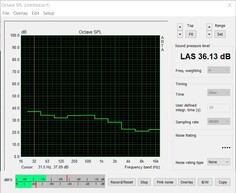
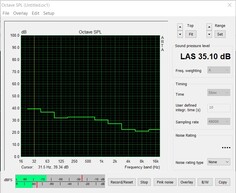
GeForce RTX 3090 ile herhangi bir güç tasarrufu mucizesi bekleyemeyeceğiniz herkes için açıkça anlaşılmalıdır. MSI, GeForce RTX 3090 Suprim X'in güç tüketimini 420 watt'a kadar daha yüksek bir TDP ile daha da artırır. Karşılaştırma amacıyla: Referans model, 350 watt'a kadar belirlenmiş bir TDP'ye sahiptir. MSI 70 watt daha eklese de, inceleme örneğimiz yük testinde oldukça iyi performans gösteriyor. 70 ° C (~ 158 ° F), kasa kapalıyken stres testindeki en yüksek sıcaklıktır. Bu iyi bir değerdir ve soğutma konseptinin en iyi şekilde çalıştığını gösterir. Üç adet 100 milimetrelik fan genellikle hareketsiz durur ve yalnızca 50 ° C'nin (~ 122 ° F) biraz altında dönmeye başlar. Bu, grafik kartının boşta kullanımda duyulamayacağı anlamına gelir; kasada iyi bir hava akışı olduğunda fanların çalışması gerekmez. Yük altında, kasanın yanında 20 santimetre mesafede ve grafik kartının yüksekliğinde tüm sistem için 36,1 dB (A) gürültü seviyesi ölçüyoruz. Grafik kartı sessiz modda çalışmaya bırakılırsa, gürültü seviyesi biraz 35.1 dB (A) 'ya düşer. Beklendiği gibi güç tüketimi yüksektir. Ölçümlerimizin tüm sistemi (dokuz adet 120 milimetrelik fan dahil) referans aldığını da belirtmek gerekir. Boşta kullanımda, soketten 106 watt'ın hemen altında çekilir; aynı zamanda, oyun sırasında yük altında ölçüm cihazımızda 597 watt görüntülenir. Şimdi güç hedefini 450 watt'a çıkarırsanız, oyun sırasında 600 watt'ı kolayca aşarsınız. Şimdiye kadar test ettiğimiz diğer ekran kartları ile karşılaştırıldığında MSI GeForce RTX 3090 Suprim X bu alana geniş bir farkla liderlik ediyor. MSI GeForce RTX 3090 Suprim X'i satın alanların kesinlikle güçlü bir güç kaynağı ünitesine sahip olması gerekiyor. Tavsiyemiz minimum 850 watt'lık bir güç kaynağı ünitesidir.
| Power Consumption | |
| 1920x1080 The Witcher 3 ultra (external Monitor) | |
| MSI GeForce RTX 3090 Suprim X (Idle: 105.9 W) | |
| ASUS GeForce RTX 3080 ROG STRIX OC GAMING (Idle: 88.3 W) | |
| AMD Radeon RX 6800 XT (Idle: 99.5 W) | |
| KFA2 GeForce RTX 2080 Ti EX (Idle: 100.5 W) | |
| AMD Radeon RX Vega 64 (Idle: 74.3 W) | |
| MSI RTX 2080 Gaming X Trio (Idle: 87.78 W) | |
| MSI GeForce RTX 3070 Gaming X Trio (Idle: 95.1 W) | |
| Nvidia GeForce RTX 2080 Super (Idle: 78.87 W) | |
| AMD Radeon RX 5700 XT (Idle: 69.8 W) | |
| Nvidia GeForce RTX 2070 Super (96.8 fps, Idle: 80.5 W) | |
| MSI RTX 2070 Gaming Z 8G (Idle: 73.3 W) | |
| AMD Radeon VII (Idle: 81.39 W) | |
| Nvidia GeForce RTX 2060 Super (82.7 fps, Idle: 77.12 W) | |
| AMD Radeon RX 5700 (84.2 fps, Idle: 64.5 W) | |
| MSI RTX 2060 Gaming Z 6G (Idle: 74.66 W) | |
| 1280x720 FurMark 1.19 GPU Stress Test (external Monitor) | |
| MSI GeForce RTX 3090 Suprim X (Idle: 105.9 W) | |
| ASUS GeForce RTX 3080 ROG STRIX OC GAMING (Idle: 88.3 W) | |
| AMD Radeon RX 6800 XT (Idle: 99.5 W) | |
| AMD Radeon VII (Idle: 81.39 W) | |
| MSI RTX 2080 Gaming X Trio | |
| KFA2 GeForce RTX 2080 Ti EX (Idle: 100.5 W) | |
| MSI GeForce RTX 3070 Gaming X Trio (Idle: 95.1 W) | |
| Nvidia GeForce RTX 2080 Super (Idle: 78.87 W) | |
| MSI RTX 2070 Gaming Z 8G (Idle: 73.3 W) | |
| AMD Radeon RX 5700 XT (239 fps, Idle: 69.8 W) | |
| Nvidia GeForce RTX 2070 Super (283 fps, Idle: 80.5 W) | |
| MSI RTX 2060 Gaming Z 6G (Idle: 74.66 W) | |
| Nvidia GeForce RTX 2060 Super (237 fps, Idle: 77.12 W) | |
| AMD Radeon RX 5700 (207 fps, Idle: 64.5 W) | |
* ... daha küçük daha iyidir
Artılar
Eksiler
Karar - Çok güç aç ve son derece hızlı
GeForce RTX 3090 şüphesiz şu anda piyasadaki en hızlı oyun grafik kartıdır. MSI GeForce RTX 3090 Suprim X ile testte MSI'dan özel bir modelimiz vardı; sadece çok iyi bir oyun performansı ile ikna edebilmekle kalmadı, aynı zamanda yeni Suprim X modelinin de görünüşüne gelince sunabileceği adil bir parça var. Bu, hem görünüm hem de his olarak yansıtılan çok kaliteli işçilikle tamamlanıyor. Yine de, çok yüksek performansa çok yüksek bir enerji talebinin eşlik ettiğini bilmelisiniz. Monitörsüz test sistemi için neredeyse 600 watt, bahsedilmeden bırakılamaz. GeForce RTX 3090'ın en büyük avantajı 24 GB VRAM'dir, çünkü GeForce RTX 3080'in iki katından daha büyüktür. Uzun vadede bu RTX 3080 için son olabilir. AMD ile farklı bir yaklaşım benimsiyor. RX 6000 grafik kartları ve 16 GB VRAM ile üç modelin hepsini sunuyor. Saf oyun performansına bakan MSI GeForce RTX 3090 Suprim X, GeForce RTX 3080'e karşı açıkça kendini koruyabilir. Radeon RX 6800 XT ile AMD, RTX 3080'in arkasında. Sonuç olarak AMD, Nvidia için yalnızca Radeon RX 6900 XT ile tehdit oluşturabilir. Şu anda bir Radeon RX 6900 XT ile karşılaştırma yapmak için geçerli veriye sahip değiliz. Nvidia'nın en büyük artı noktaları şu anda ışın izleme ve DLSS'dir. İlki, AMD'nin yeni Big Navi grafik kartları tarafından da sunuluyor, ancak AMD burada performans açısından hala önemli ölçüde geride kalıyor MSI, GeForce RTX 3090 Suprim X ile yeni bir üst düzey seri tanıttı. Yeni üst model, ödünsüz oyun keyfi sunuyor , ancak her zaman CPU limitinde çalışmamak için çok yüksek çözünürlükler gerekiyor. Maalesef mevcut piyasa durumu aylardır gergin ve yeni bir ekran kartı almak isteyenler mevcut olanı almak zorunda. İstediğiniz kartı almak şu anda adeta bir mucize. Buna ek olarak, MSI GeForce RTX 3090 Suprim X için de geçerli olan fiyatlar fırladı. MSI'ya göre, inceleme örneğimizin MSRP'si 1.649 Euro (~ 1.998 $). Bununla birlikte, grafik kartı Geizhals'da neredeyse 2.000 Euro (~ 2.423 $) ve bazen çok daha fazlası için listeleniyor.RTX 3090 için tüm kıyaslamalar ve test sonuçları GeForce RTX 3090 grafik kartı sitesinde bulunabilir (düzenli olarak güncellenir) .


