Gigabyte G5 KF incelemesi: RTX 4060 ile 969 Euro'ya oyun dizüstü bilgisayarı
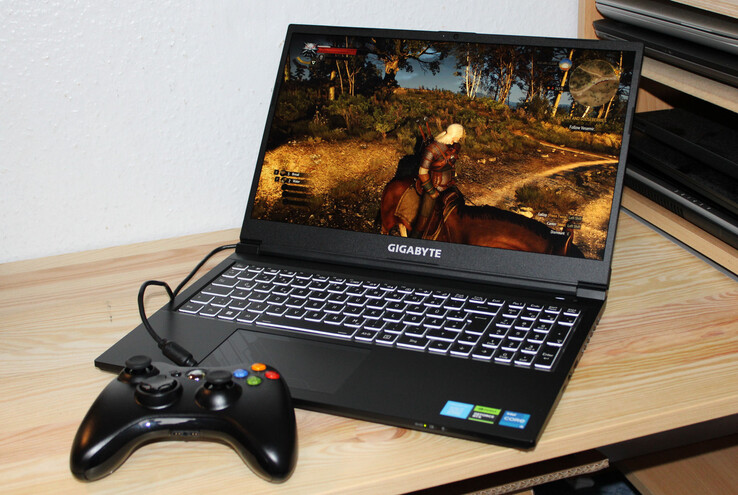
G5 KF, düşük fiyat segmentinde bir oyun dizüstü bilgisayarıdır - 15,6 inçlik cihaz size yaklaşık 969 € (1.026 ABD Doları) ödeyecektir. Ancak Windows lisansı fiyata dahil değildir. Gigabyte dizüstü bilgisayar, aşağıdakilerle rekabet ediyor MSI Cyborg 15 A12VF, Intel NUC X15, Lenovo Legion Slim 5 16APH8veAsus TUF A15 FA507.
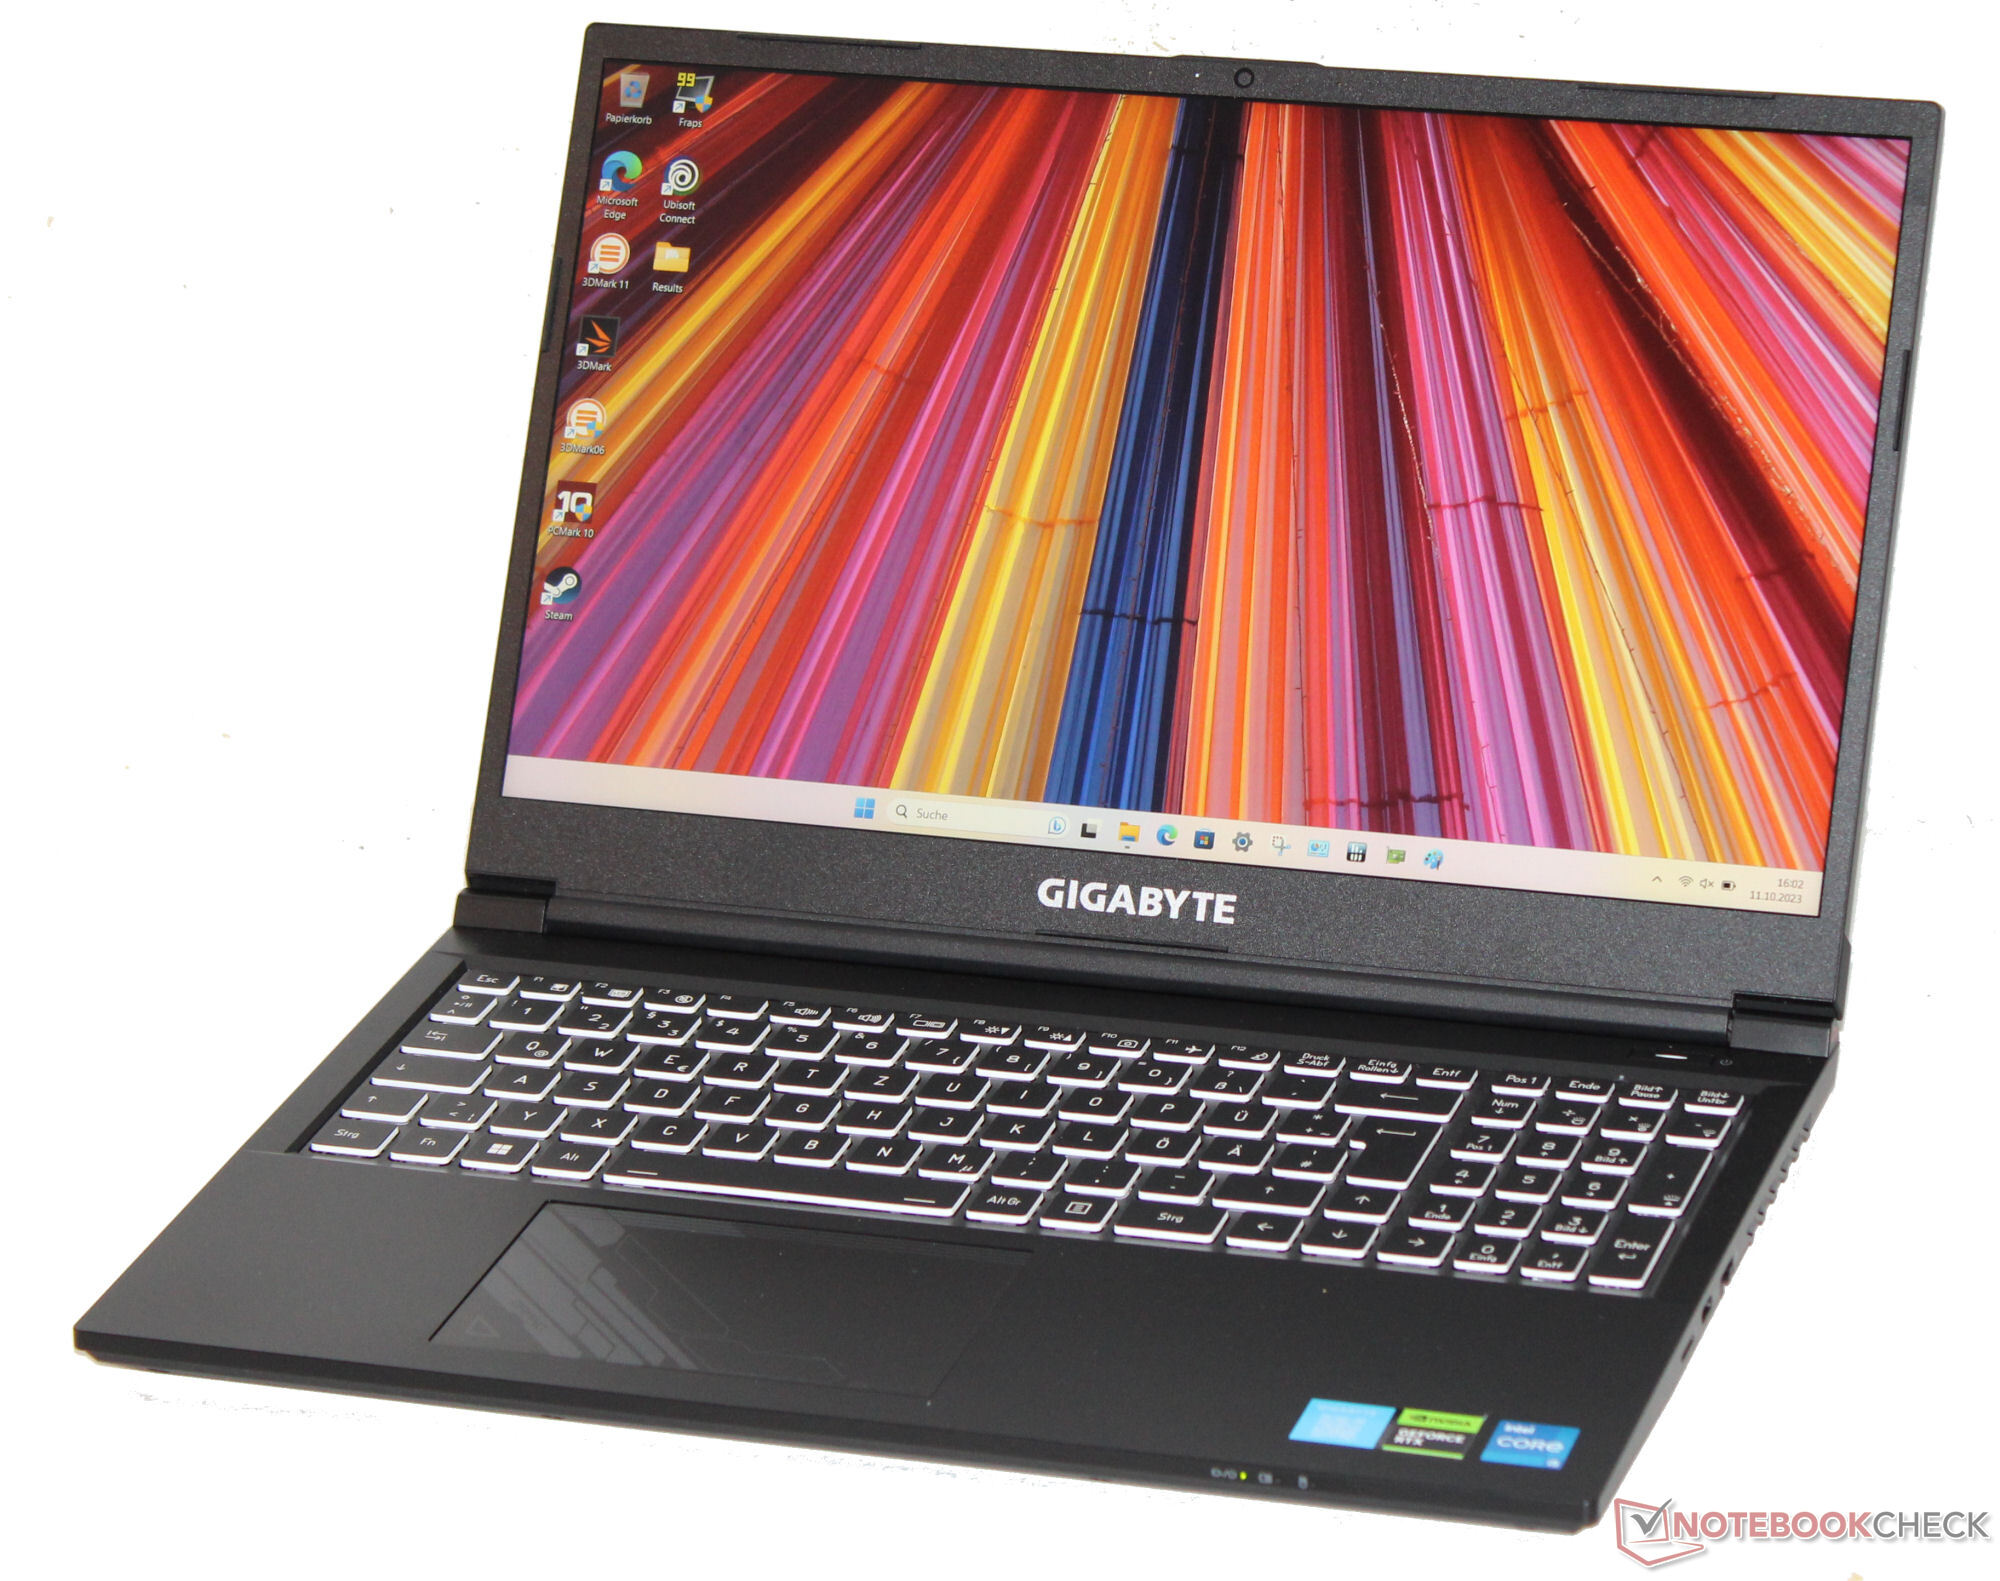
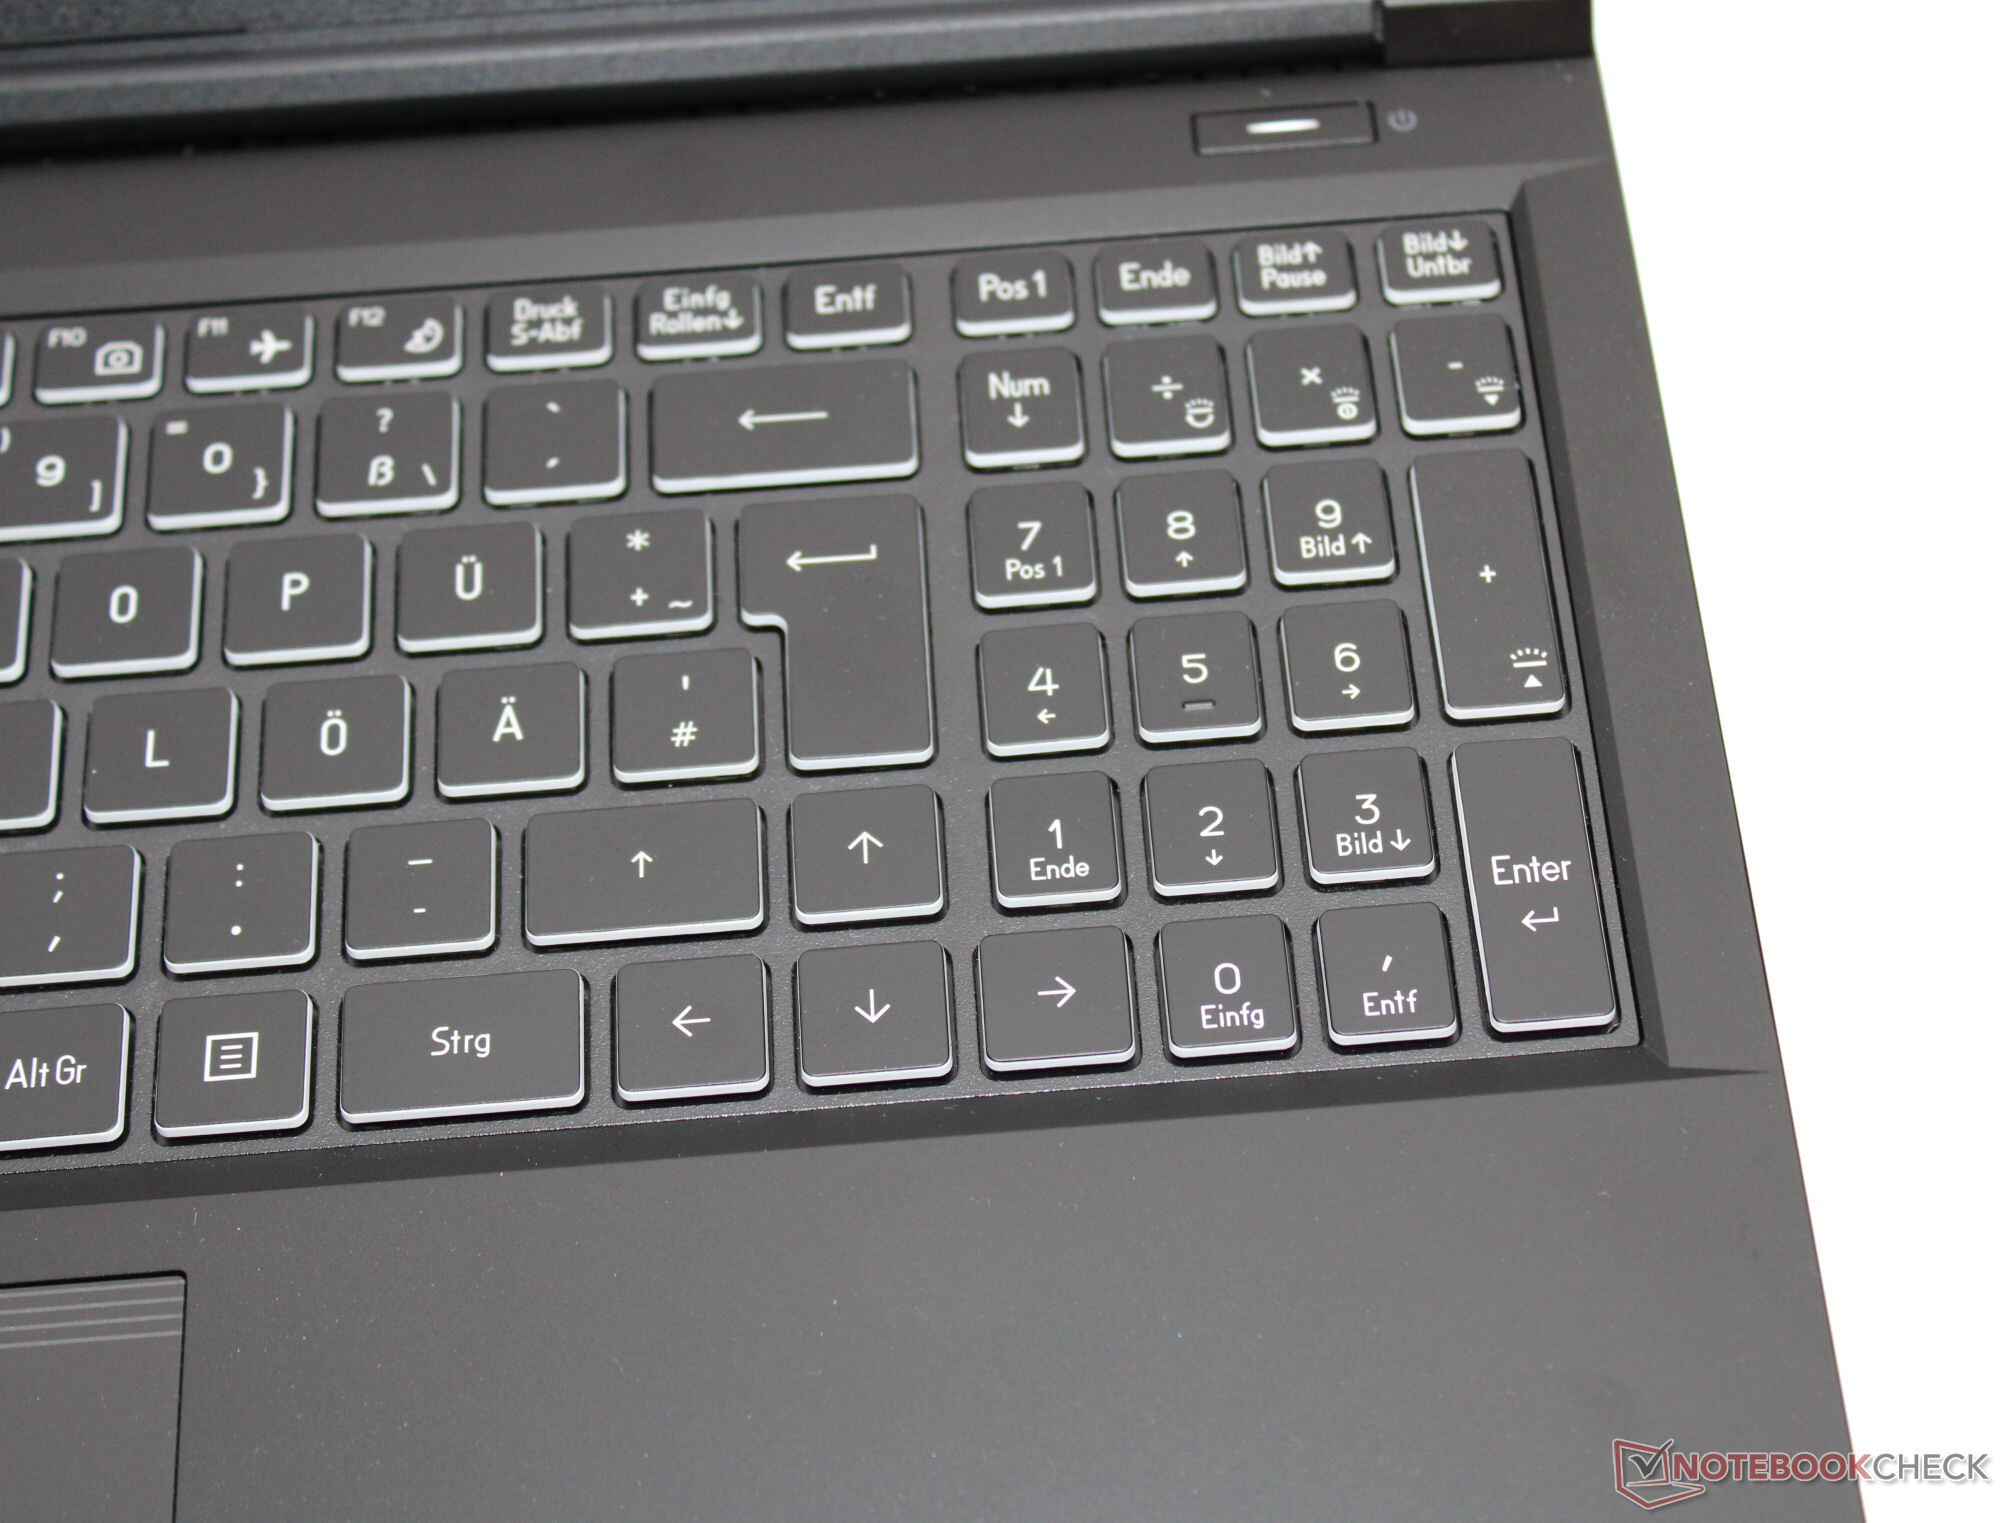
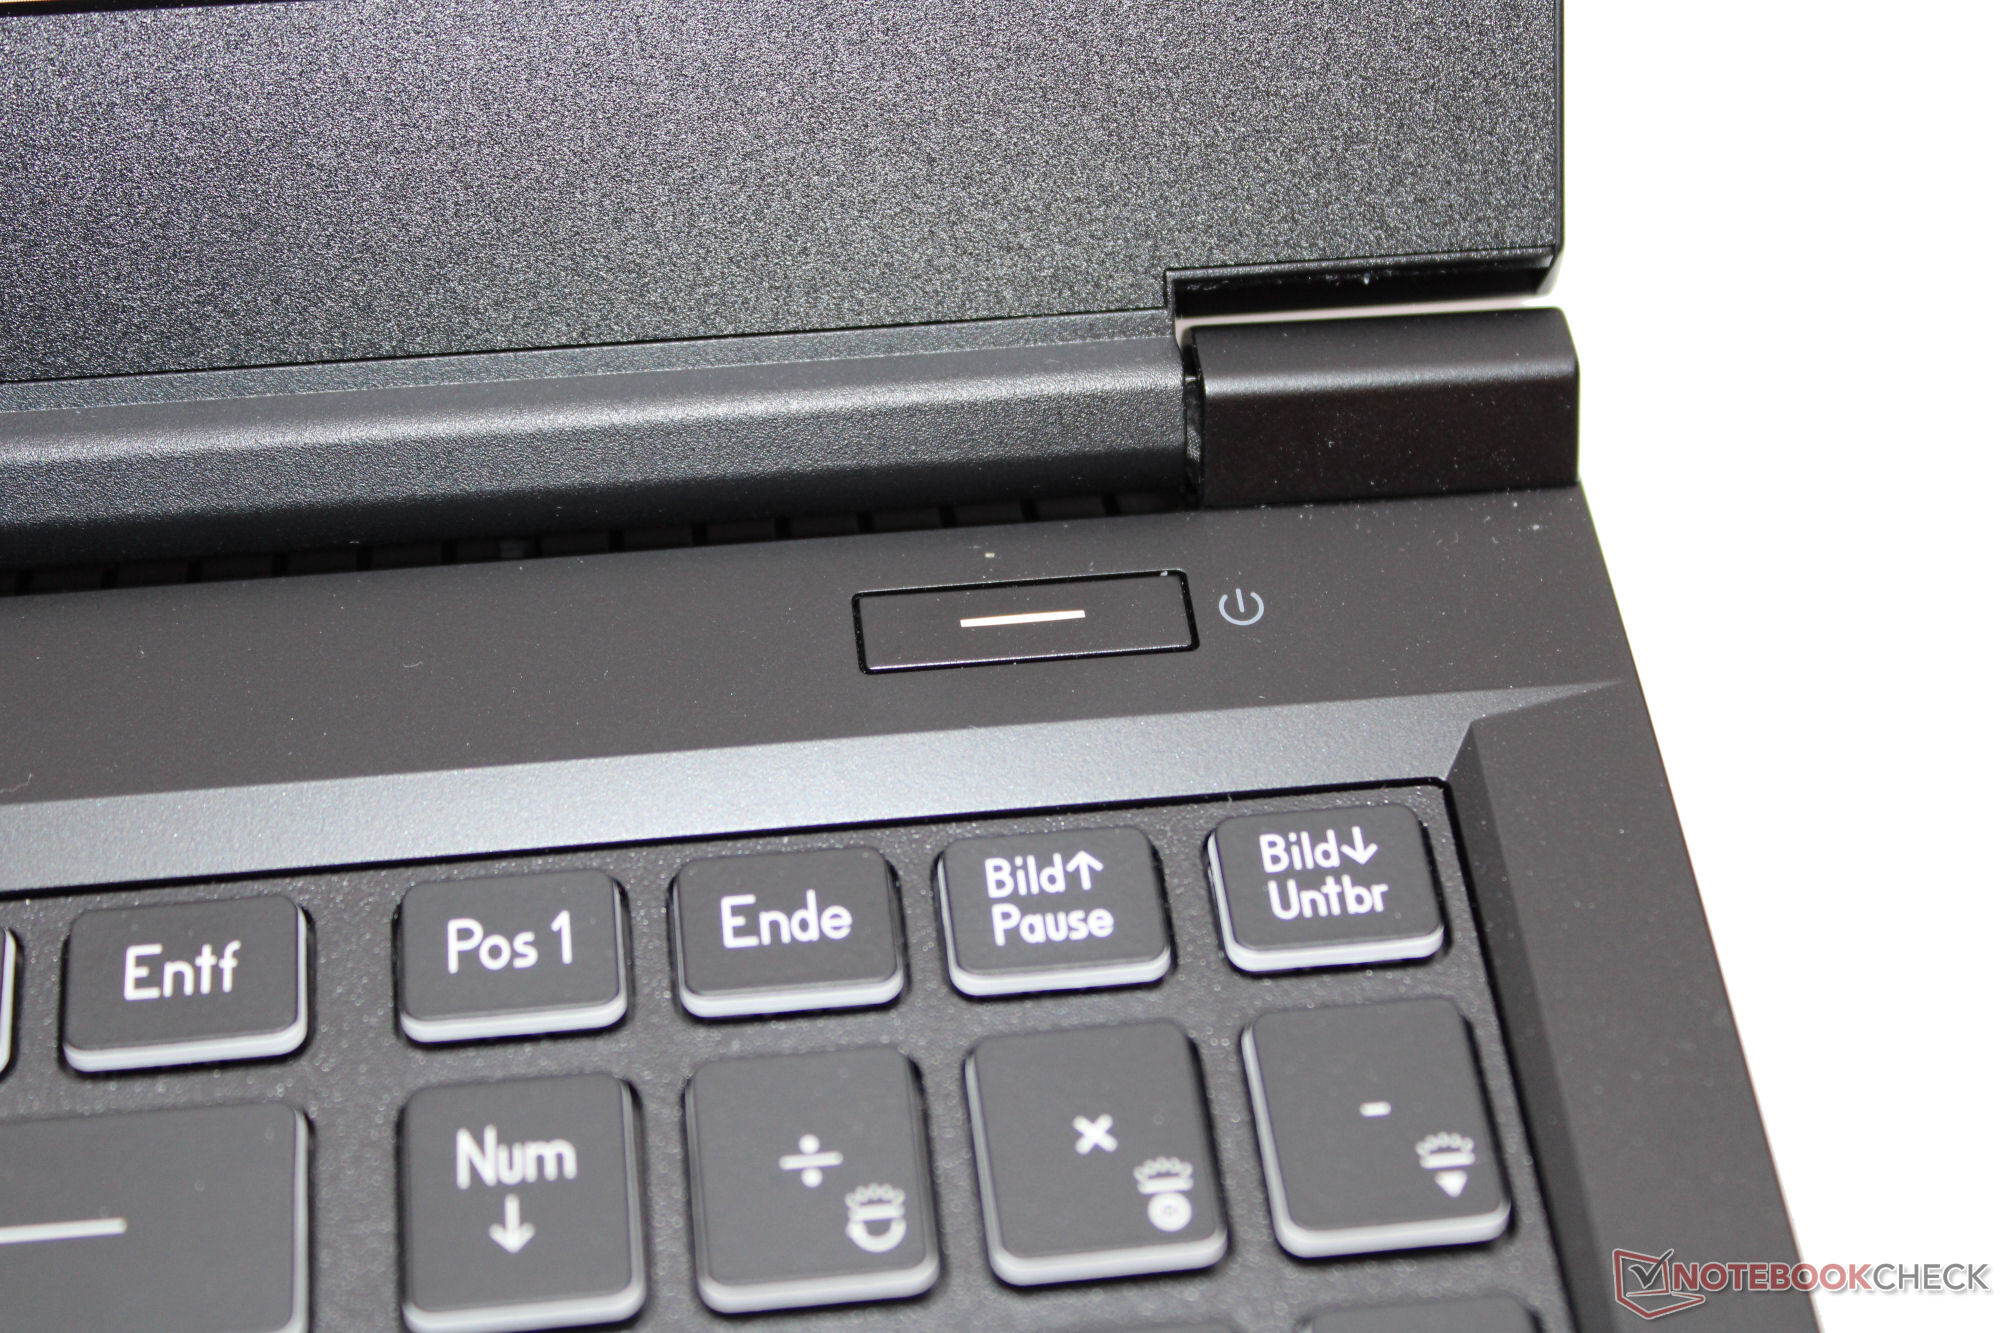
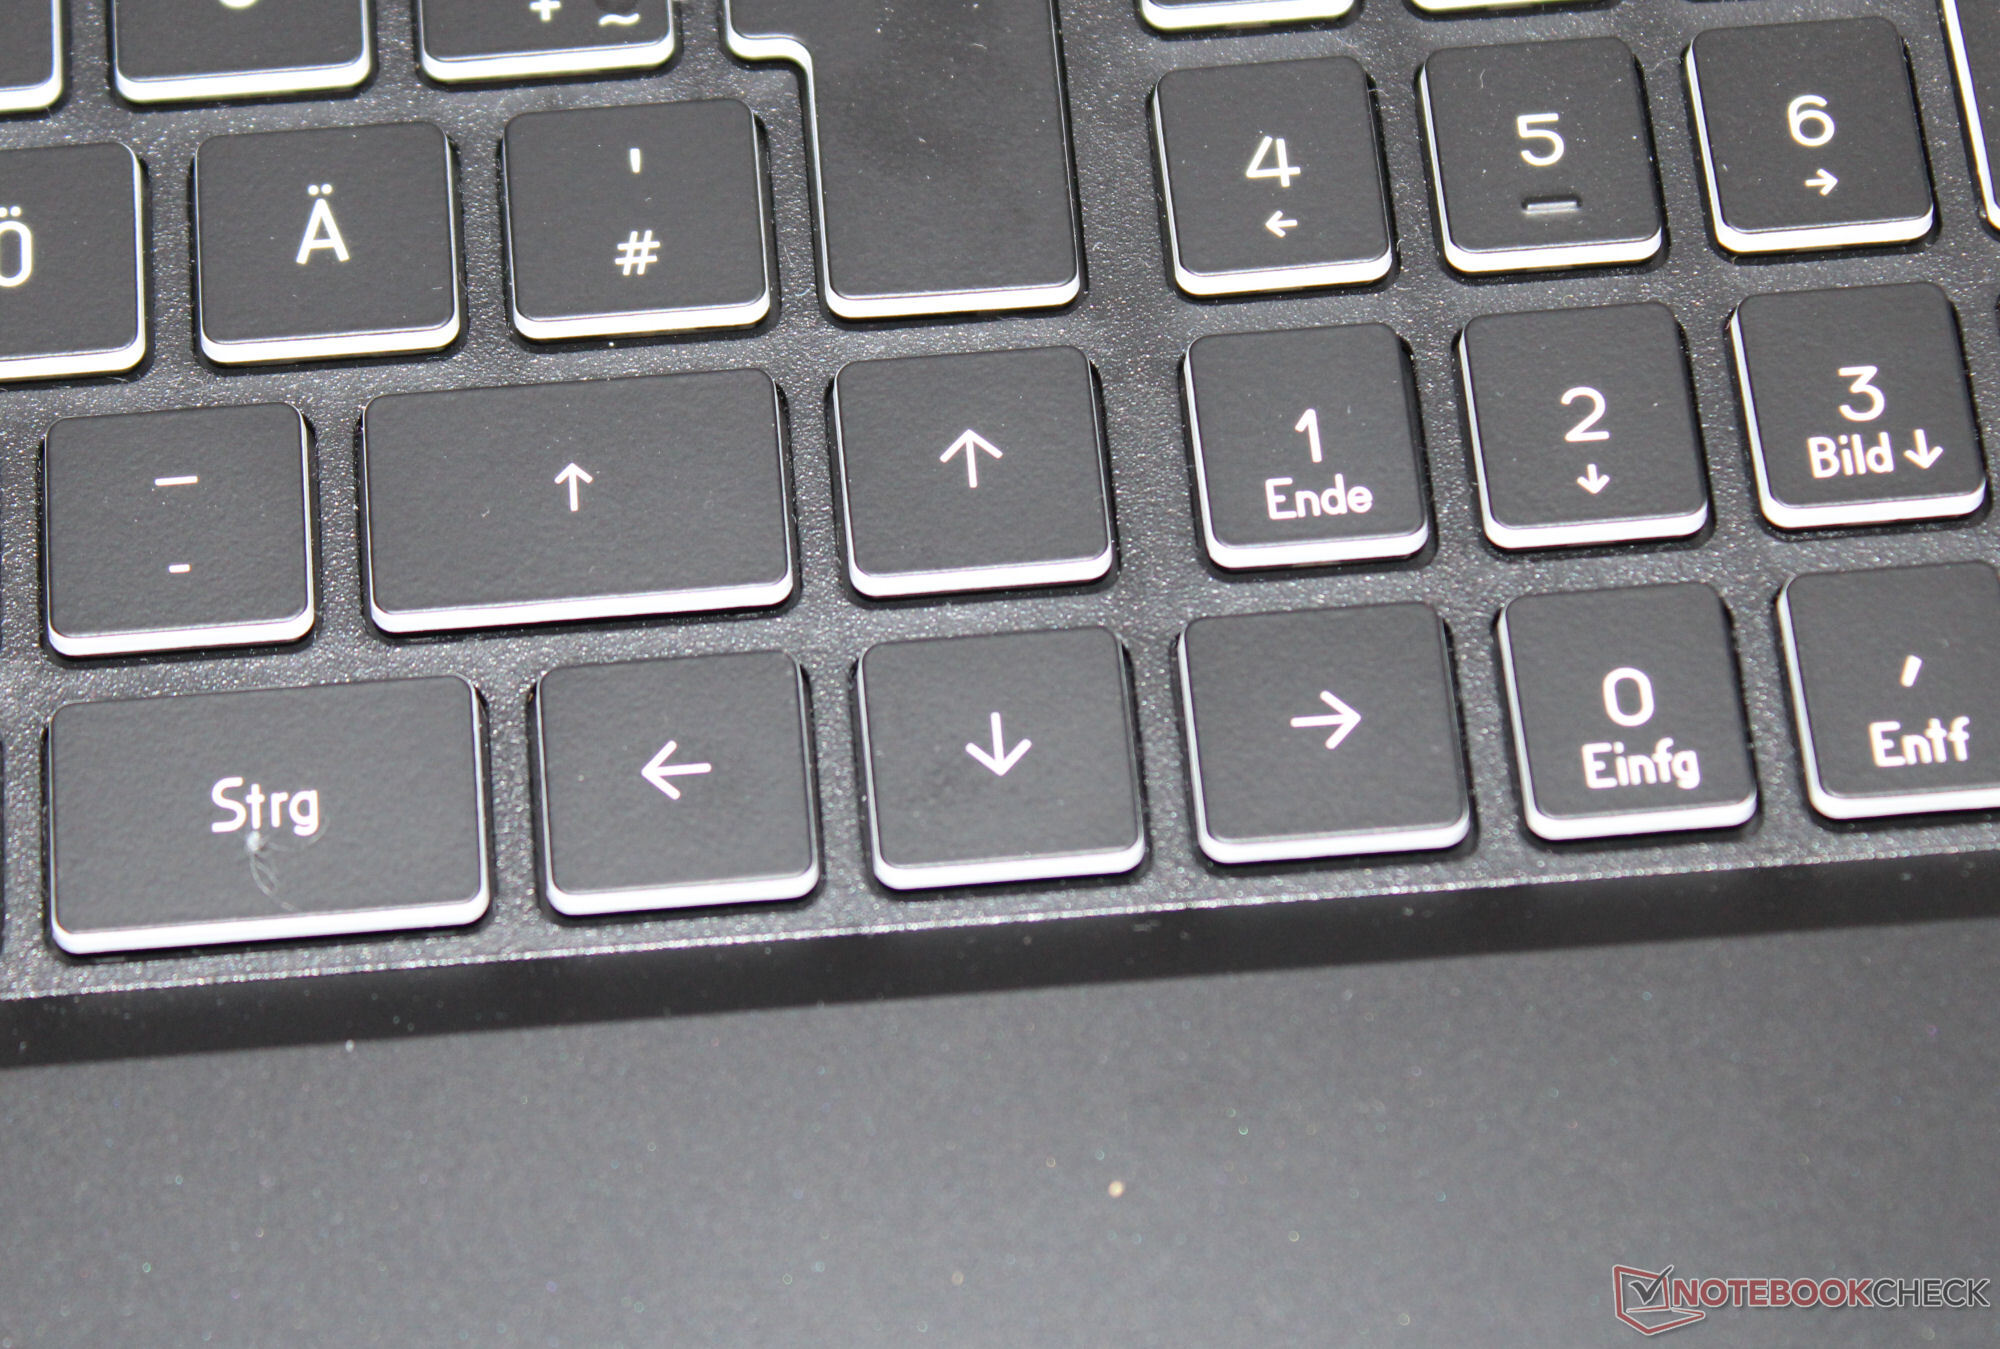
G5 KF, G5 KE'nin devamı niteliğindedir ve aynı fiziksel tasarımı paylaşmaktadır. Bu nedenle aşağıdakilere başvurabilirsiniz g5 KE incelememiz kasa, özellikler, giriş aygıtları ve ekran hakkında daha fazla bilgi için.
Karşılaştırmalı olarak olası rakipler
Derecelendirme | Tarih | Modeli | Ağırlık | Yükseklik | Boyut | Çözünürlük | Fiyat |
|---|---|---|---|---|---|---|---|
| 81.8 % v7 (old) | 10/2023 | Gigabyte G5 KF i5-12500H, GeForce RTX 4060 Laptop GPU | 1.9 kg | 22.7 mm | 15.60" | 1920x1080 | |
| 82.4 % v7 (old) | 06/2023 | MSI Cyborg 15 A12VF i7-12650H, GeForce RTX 4060 Laptop GPU | 2 kg | 22.9 mm | 15.60" | 1920x1080 | |
| 84.4 % v7 (old) | 10/2023 | Intel NUC X15 LAPAC71H i7-12700H, A730M | 2.2 kg | 26.7 mm | 15.60" | 1920x1080 | |
| 86.3 % v7 (old) | Asus TUF A15 FA507 R7 7735HS, GeForce RTX 4050 Laptop GPU | 2.2 kg | 24.9 mm | 15.60" | 1920x1080 | ||
| 87.7 % v7 (old) | 09/2023 | Lenovo Legion Slim 5 16APH8 R7 7840HS, GeForce RTX 4060 Laptop GPU | 2.4 kg | 25.2 mm | 16.00" | 2560x1600 |
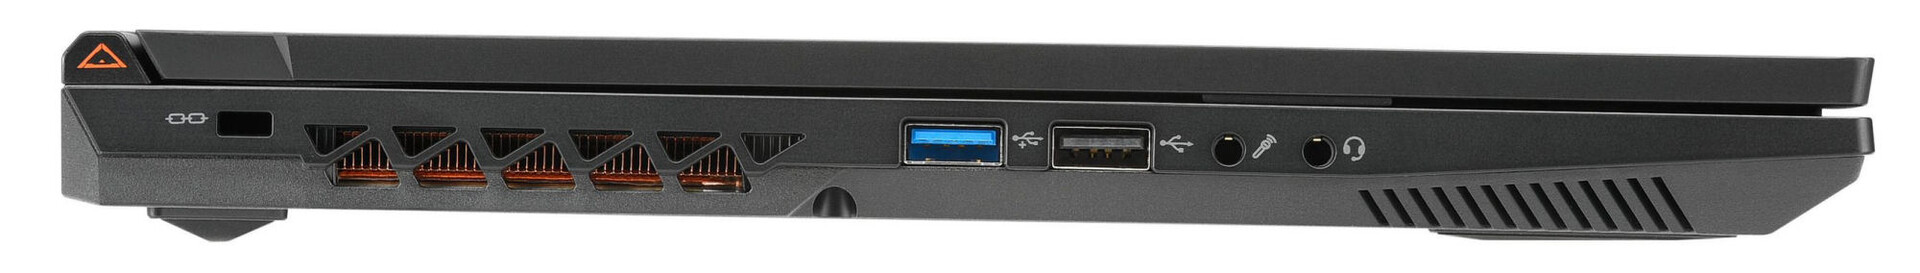
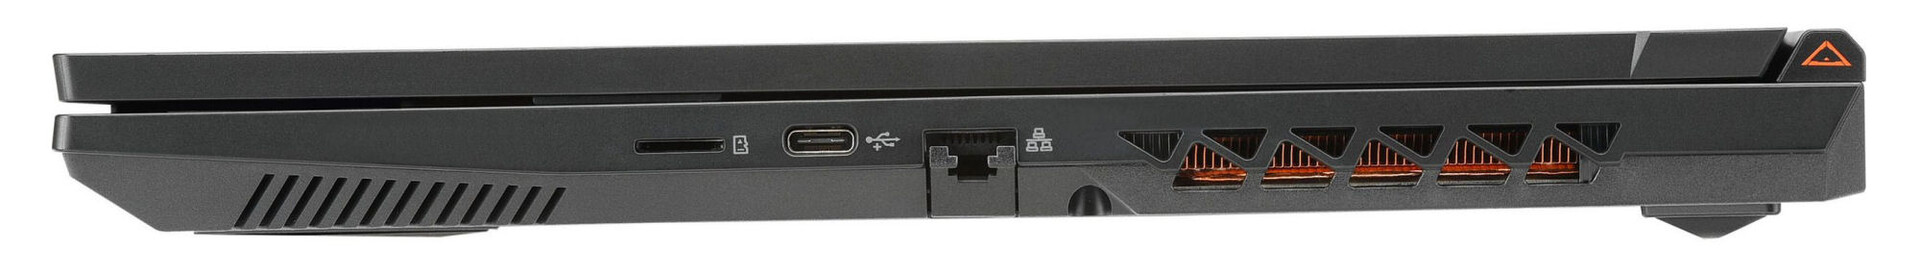
| SD Card Reader | |
| average JPG Copy Test (av. of 3 runs) | |
| Sınıf ortalaması Gaming (20.9 - 210, n=55, son 2 yıl) | |
| Gigabyte G5 KE (AV PRO microSD 128 GB V60) | |
| Gigabyte G5 KF | |
| Lenovo Legion Slim 5 16APH8 (PNY EliteX-Pro60 V60 256 GB) | |
| maximum AS SSD Seq Read Test (1GB) | |
| Sınıf ortalaması Gaming (25.5 - 261, n=52, son 2 yıl) | |
| Gigabyte G5 KE (AV PRO microSD 128 GB V60) | |
| Gigabyte G5 KF | |
| Lenovo Legion Slim 5 16APH8 (PNY EliteX-Pro60 V60 256 GB) | |
| Networking | |
| iperf3 transmit AXE11000 | |
| Gigabyte G5 KE | |
| MSI Cyborg 15 A12VF | |
| Lenovo Legion Slim 5 16APH8 | |
| Intel NUC X15 LAPAC71H | |
| Gigabyte G5 KF | |
| Sınıf ortalaması Gaming (560 - 1862, n=88, son 2 yıl) | |
| Ortalama Intel Wi-Fi 6E AX211 (64 - 1921, n=276) | |
| Asus TUF A15 FA507 | |
| iperf3 receive AXE11000 | |
| Gigabyte G5 KE | |
| MSI Cyborg 15 A12VF | |
| Gigabyte G5 KF | |
| Intel NUC X15 LAPAC71H | |
| Lenovo Legion Slim 5 16APH8 | |
| Sınıf ortalaması Gaming (680 - 1745, n=88, son 2 yıl) | |
| Ortalama Intel Wi-Fi 6E AX211 (582 - 1890, n=276) | |
| Asus TUF A15 FA507 | |
| iperf3 transmit AXE11000 6GHz | |
| Lenovo Legion Slim 5 16APH8 | |
| Gigabyte G5 KF | |
| Sınıf ortalaması Gaming (723 - 1868, n=36, son 2 yıl) | |
| Ortalama Intel Wi-Fi 6E AX211 (385 - 1851, n=226) | |
| iperf3 receive AXE11000 6GHz | |
| Gigabyte G5 KF | |
| Sınıf ortalaması Gaming (975 - 1775, n=35, son 2 yıl) | |
| Ortalama Intel Wi-Fi 6E AX211 (700 - 1857, n=226) | |
| Lenovo Legion Slim 5 16APH8 | |


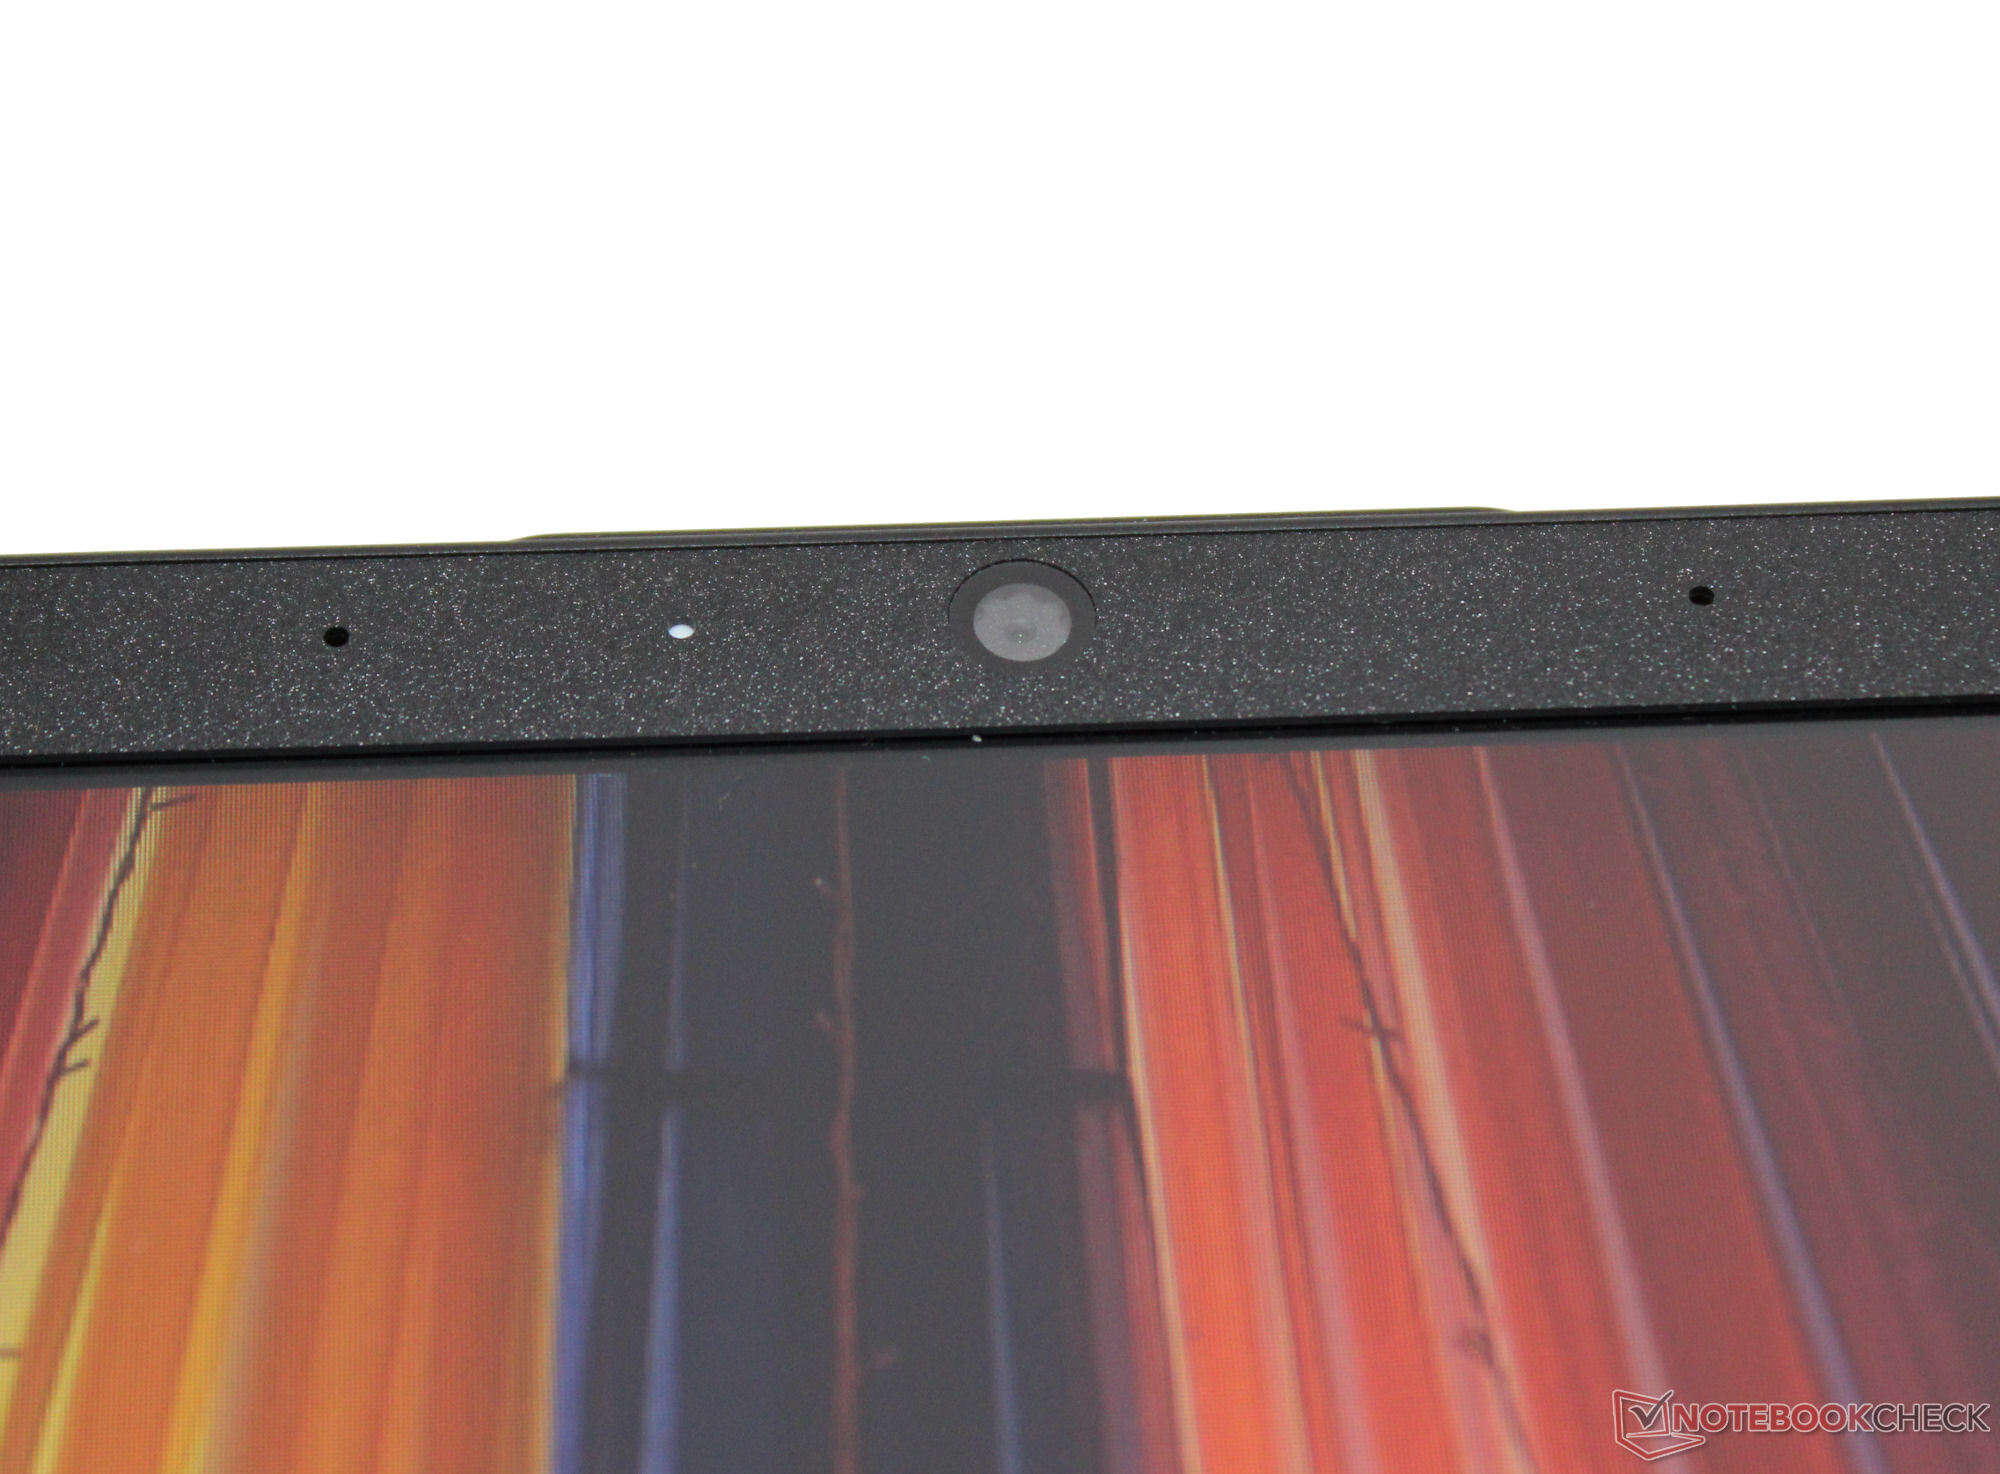
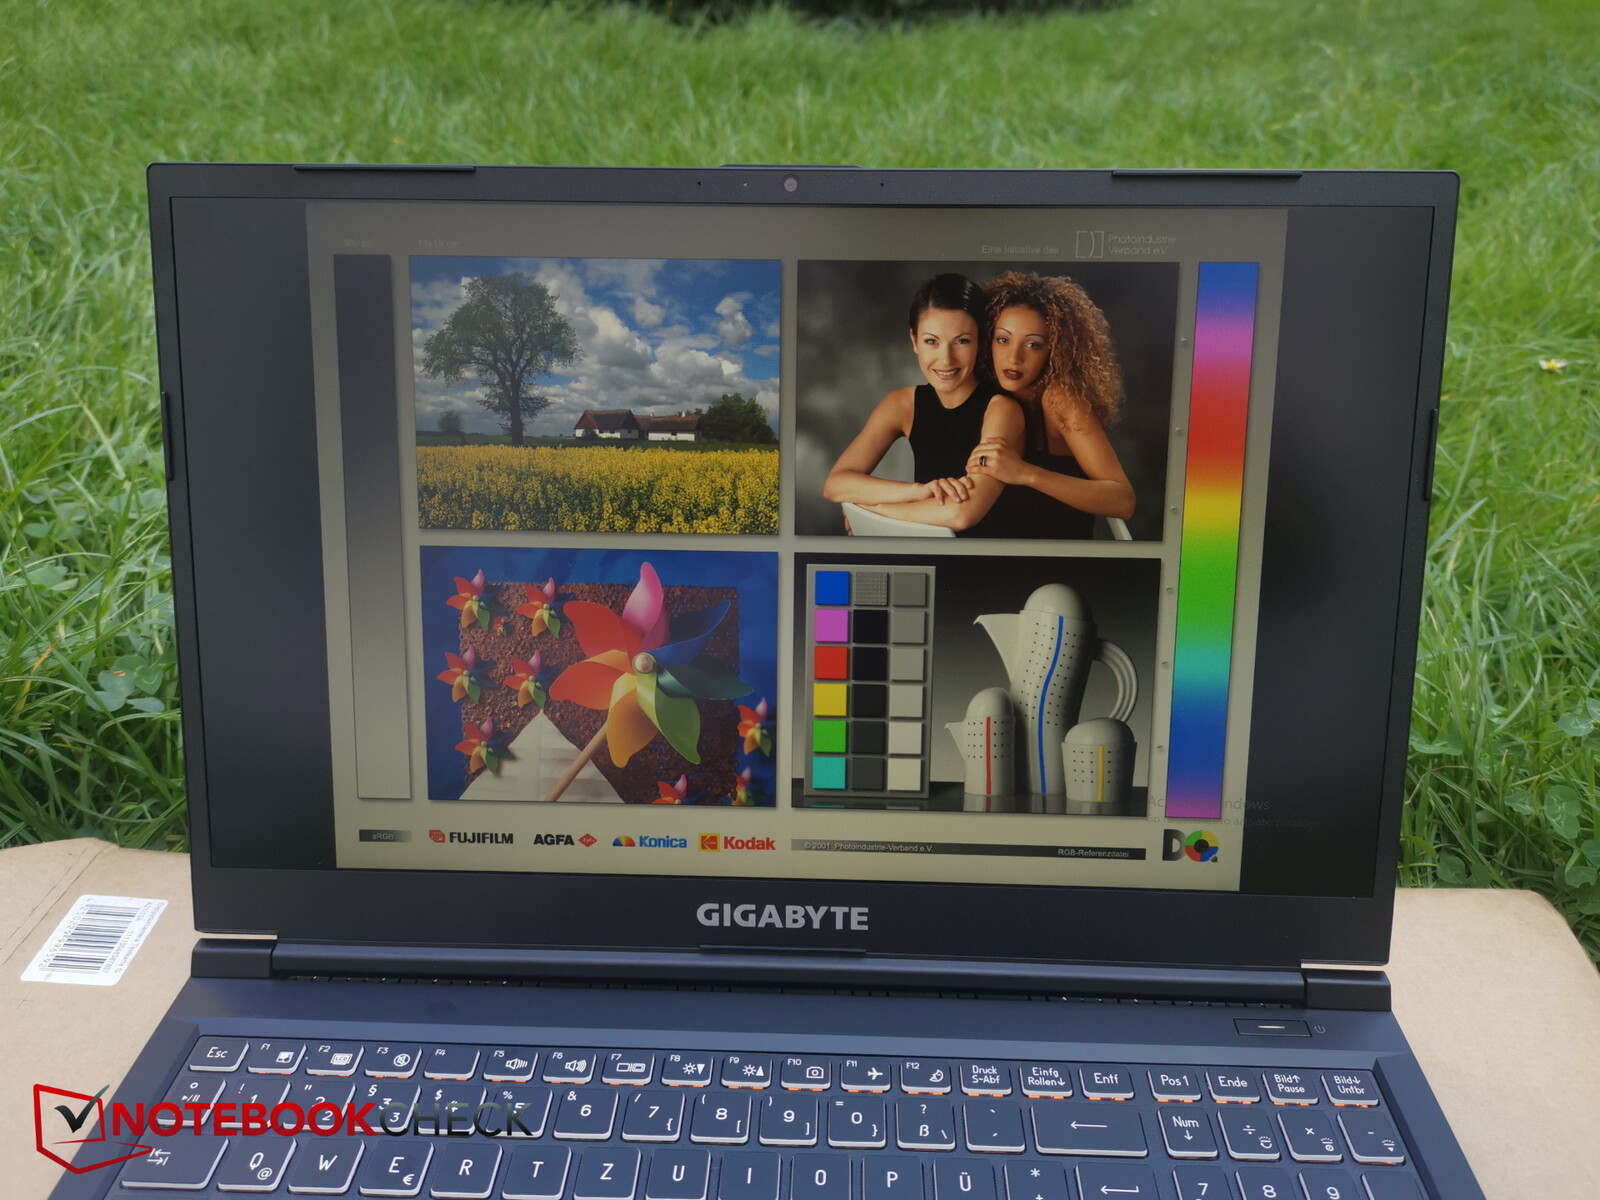
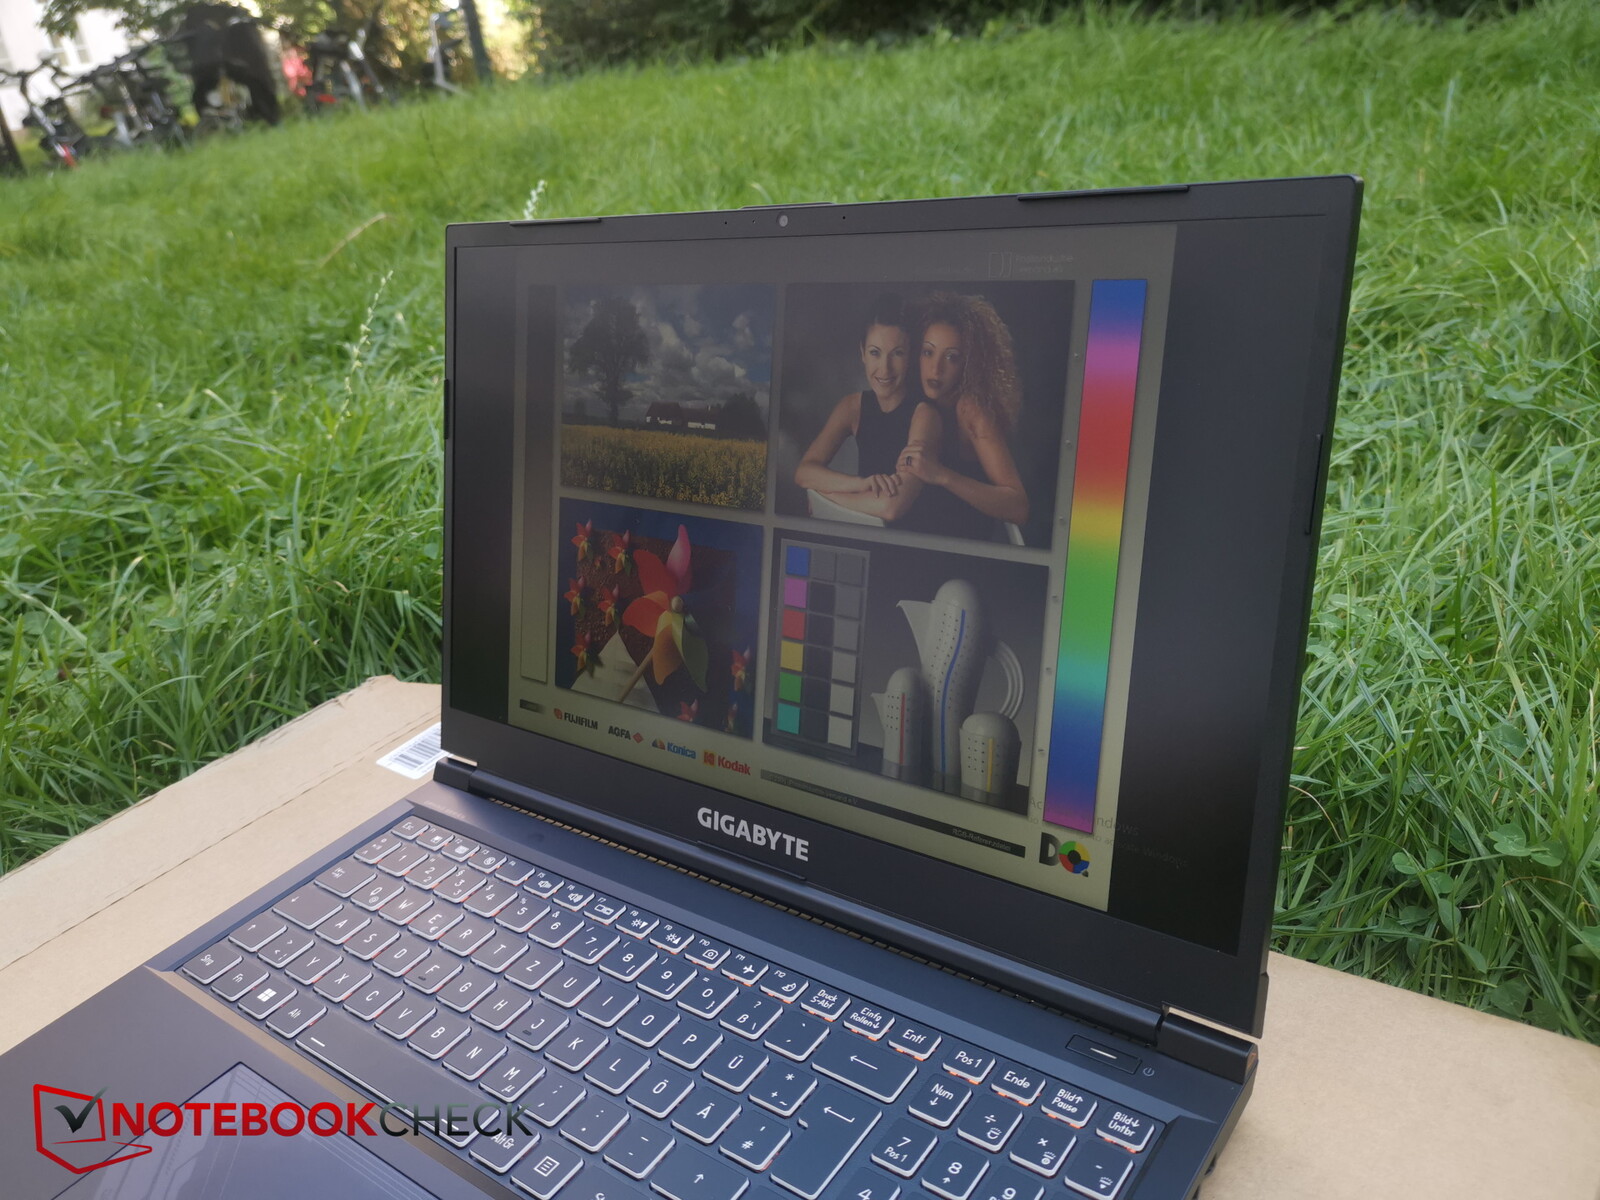
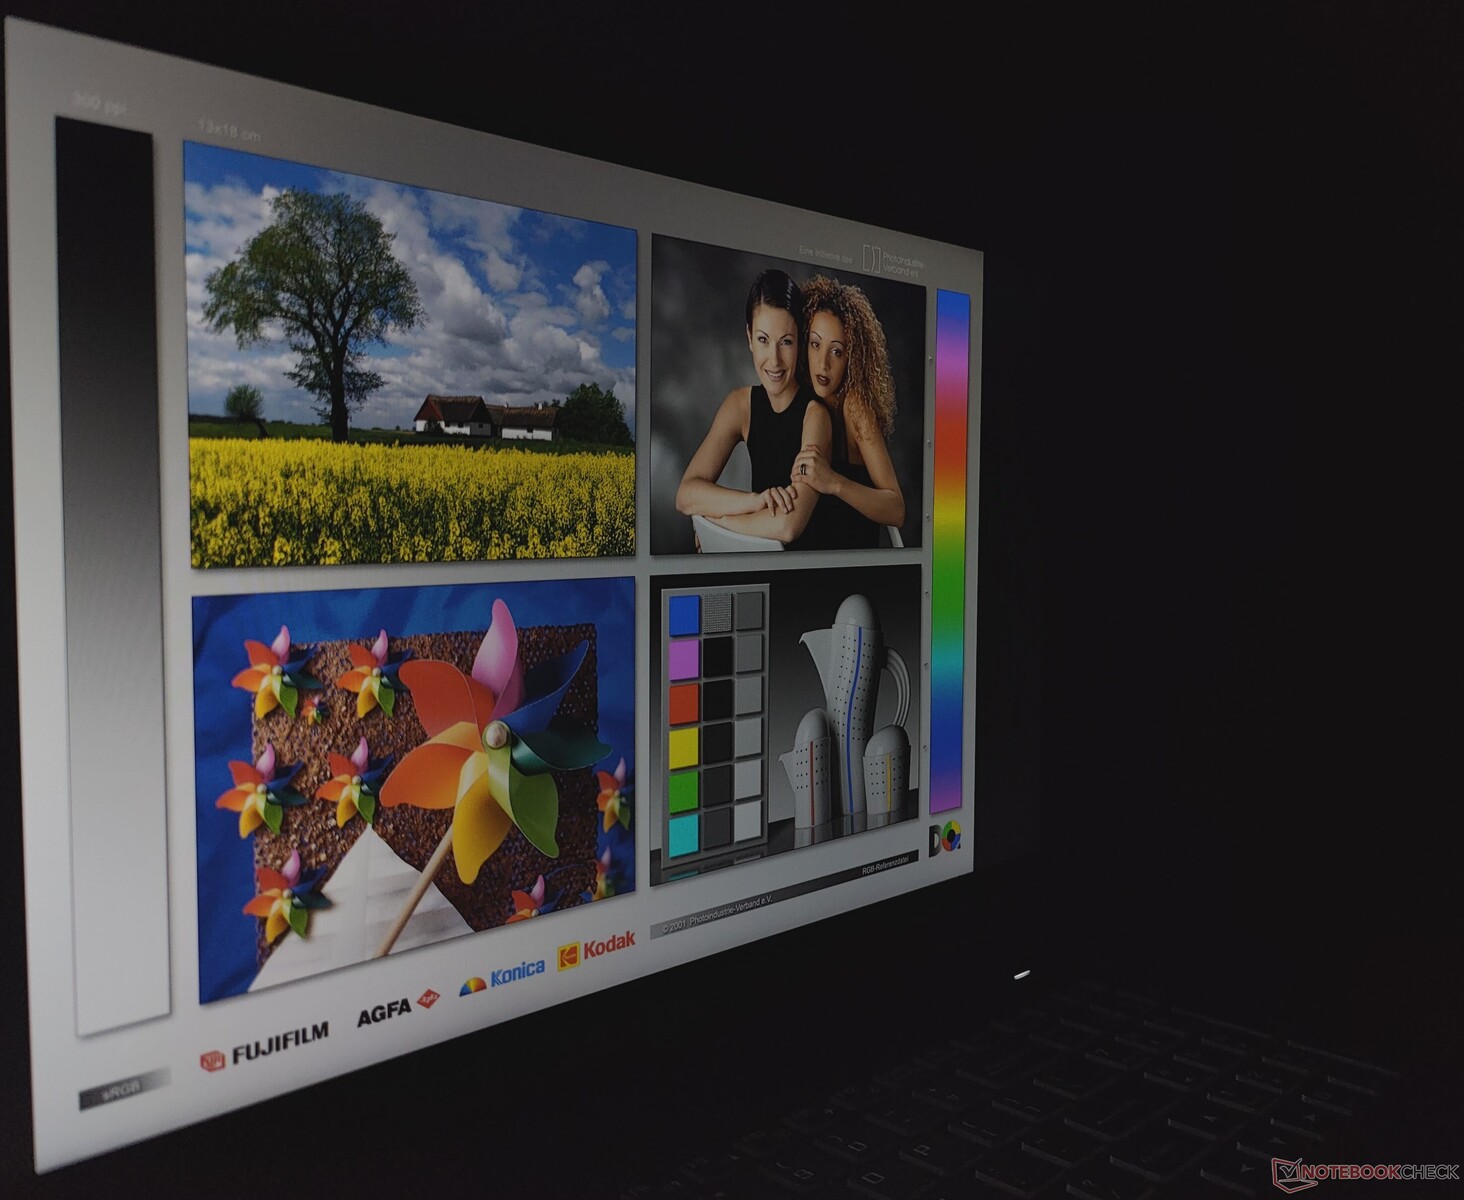
Ekran - 144Hz FHD panel
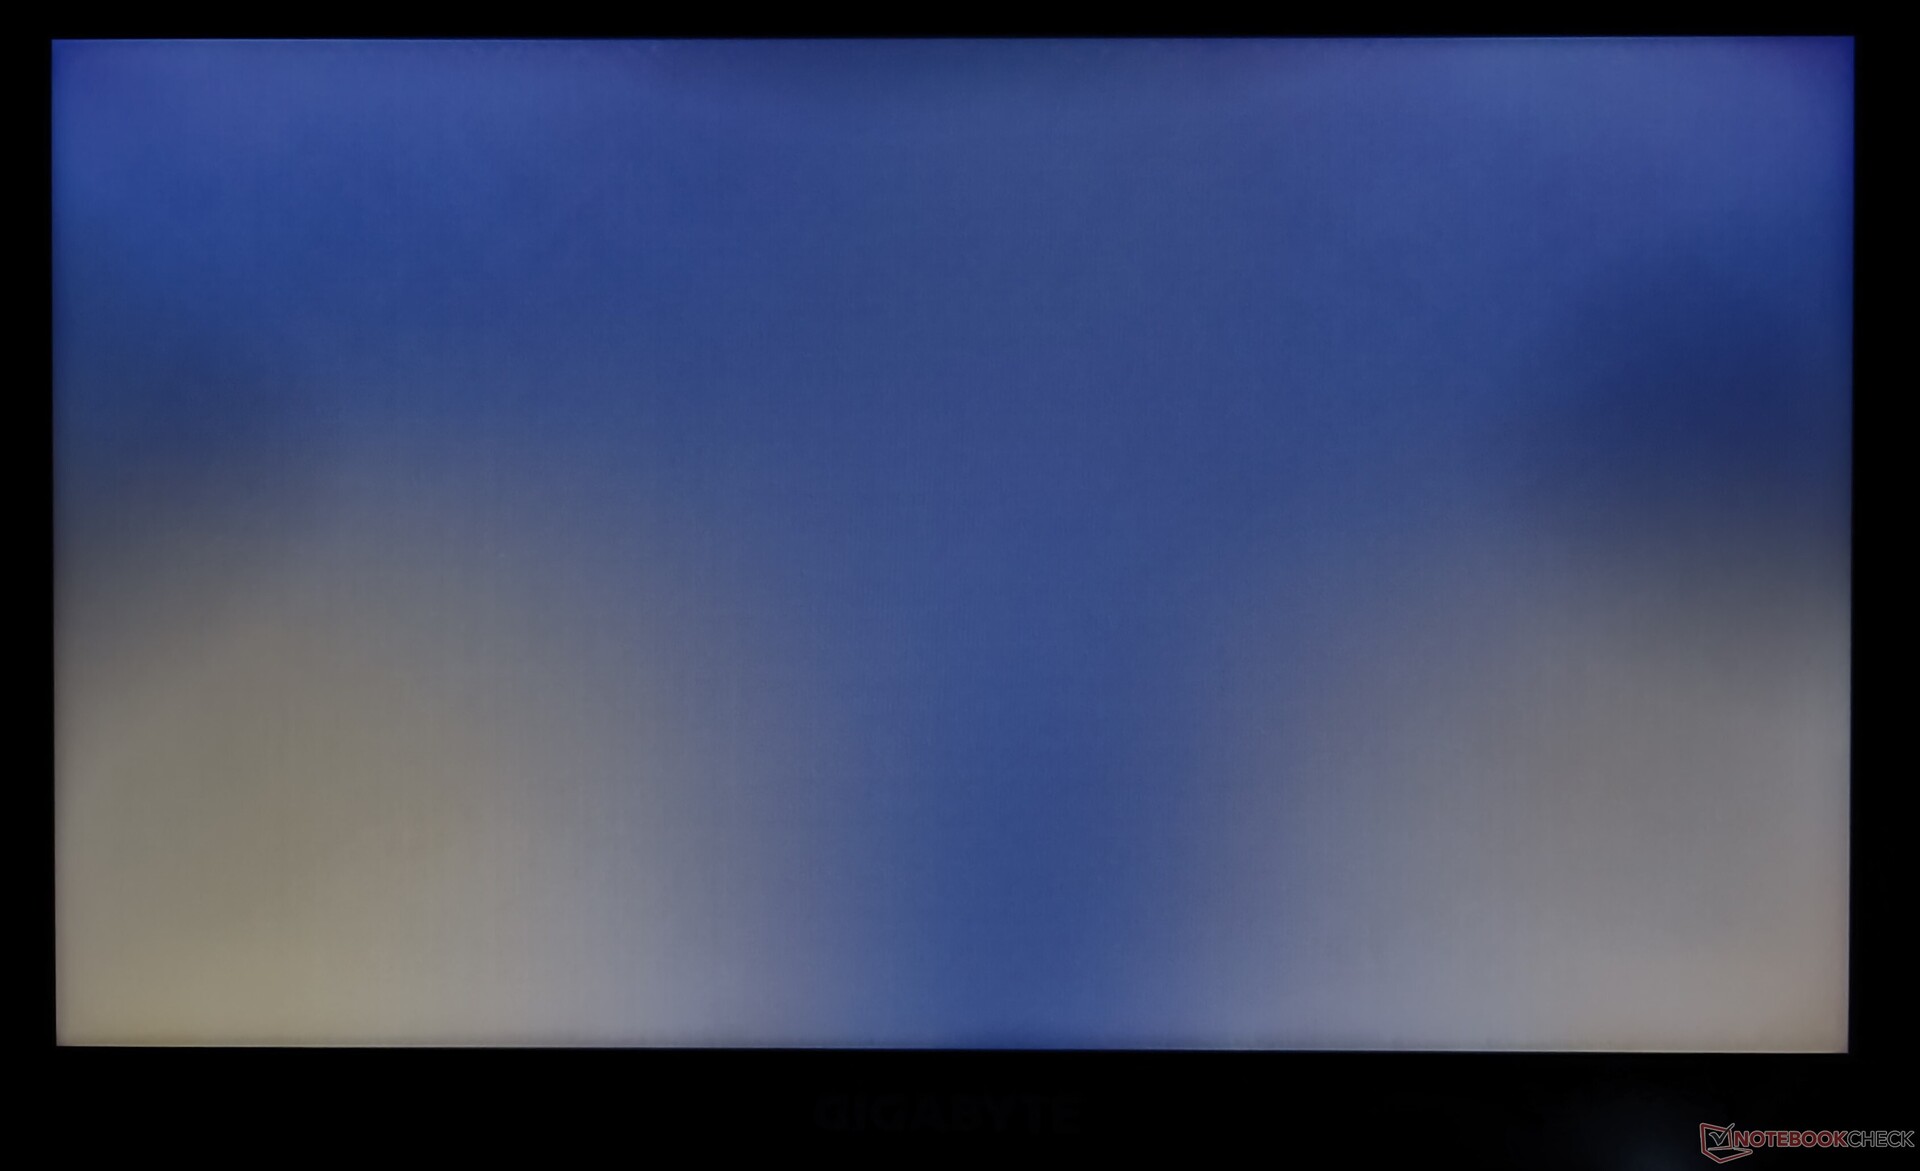
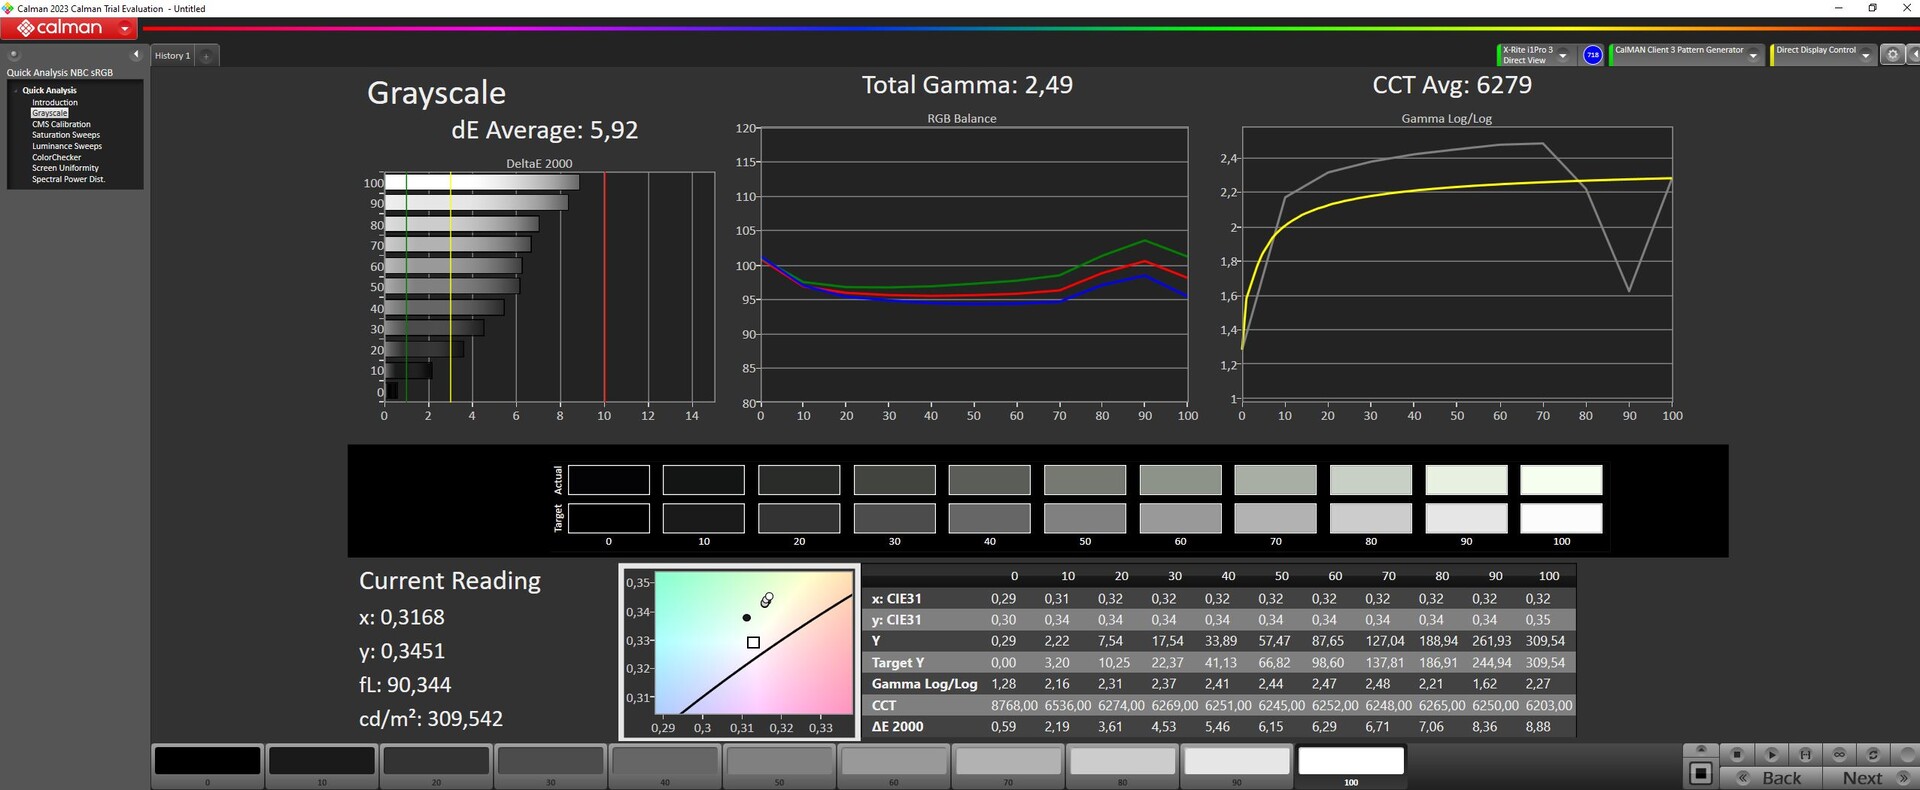
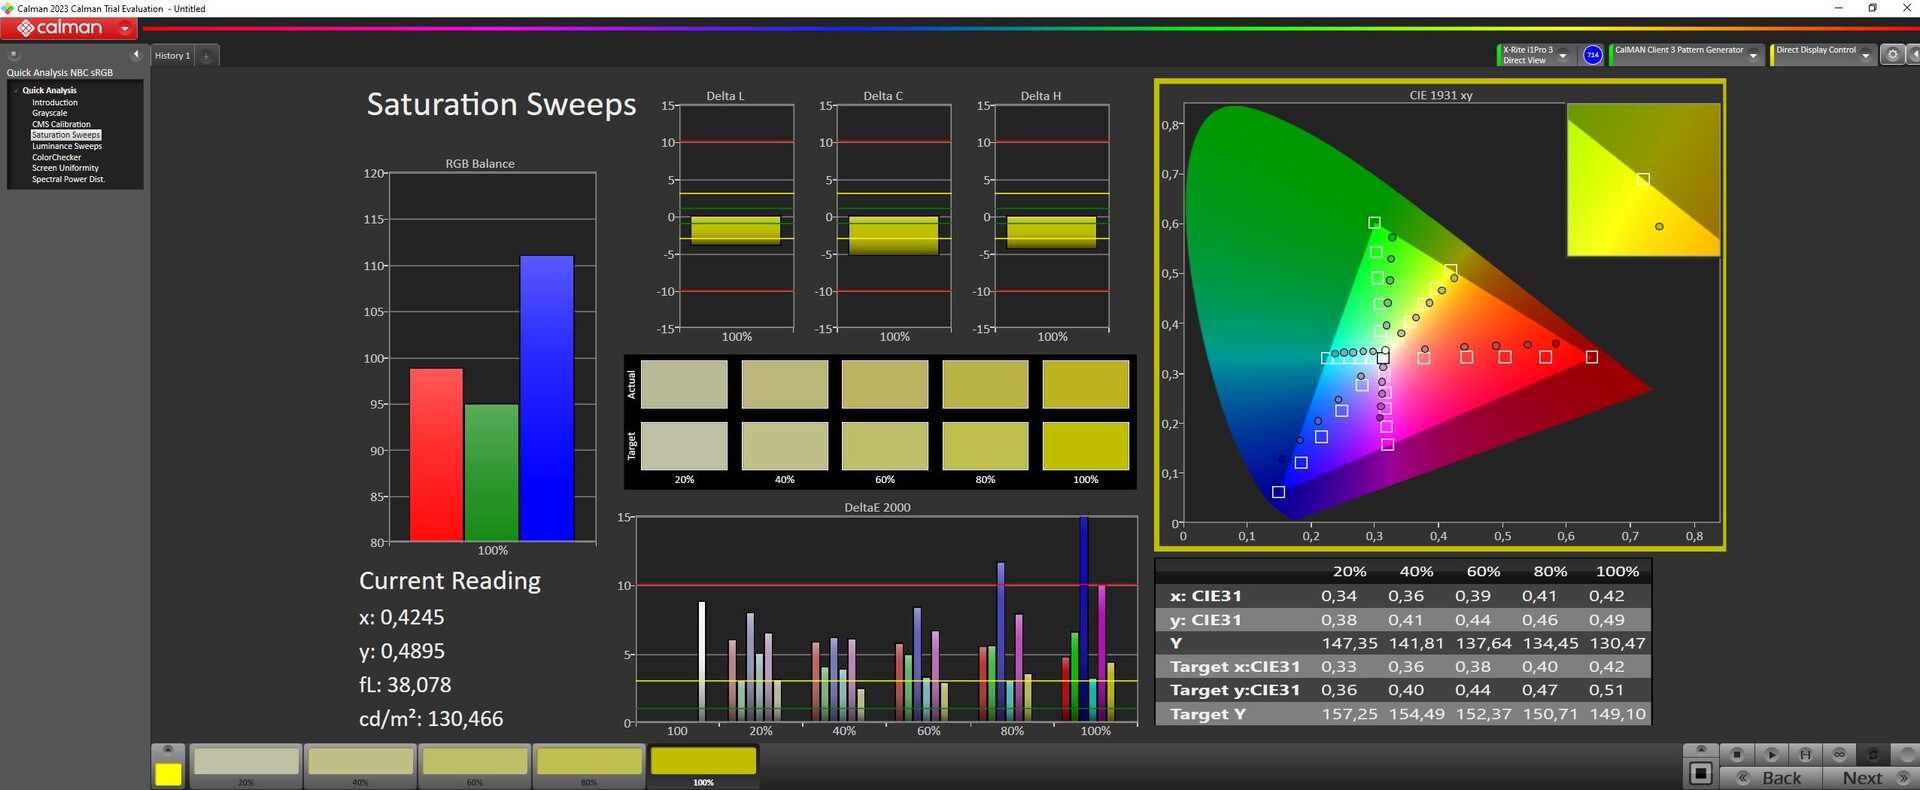
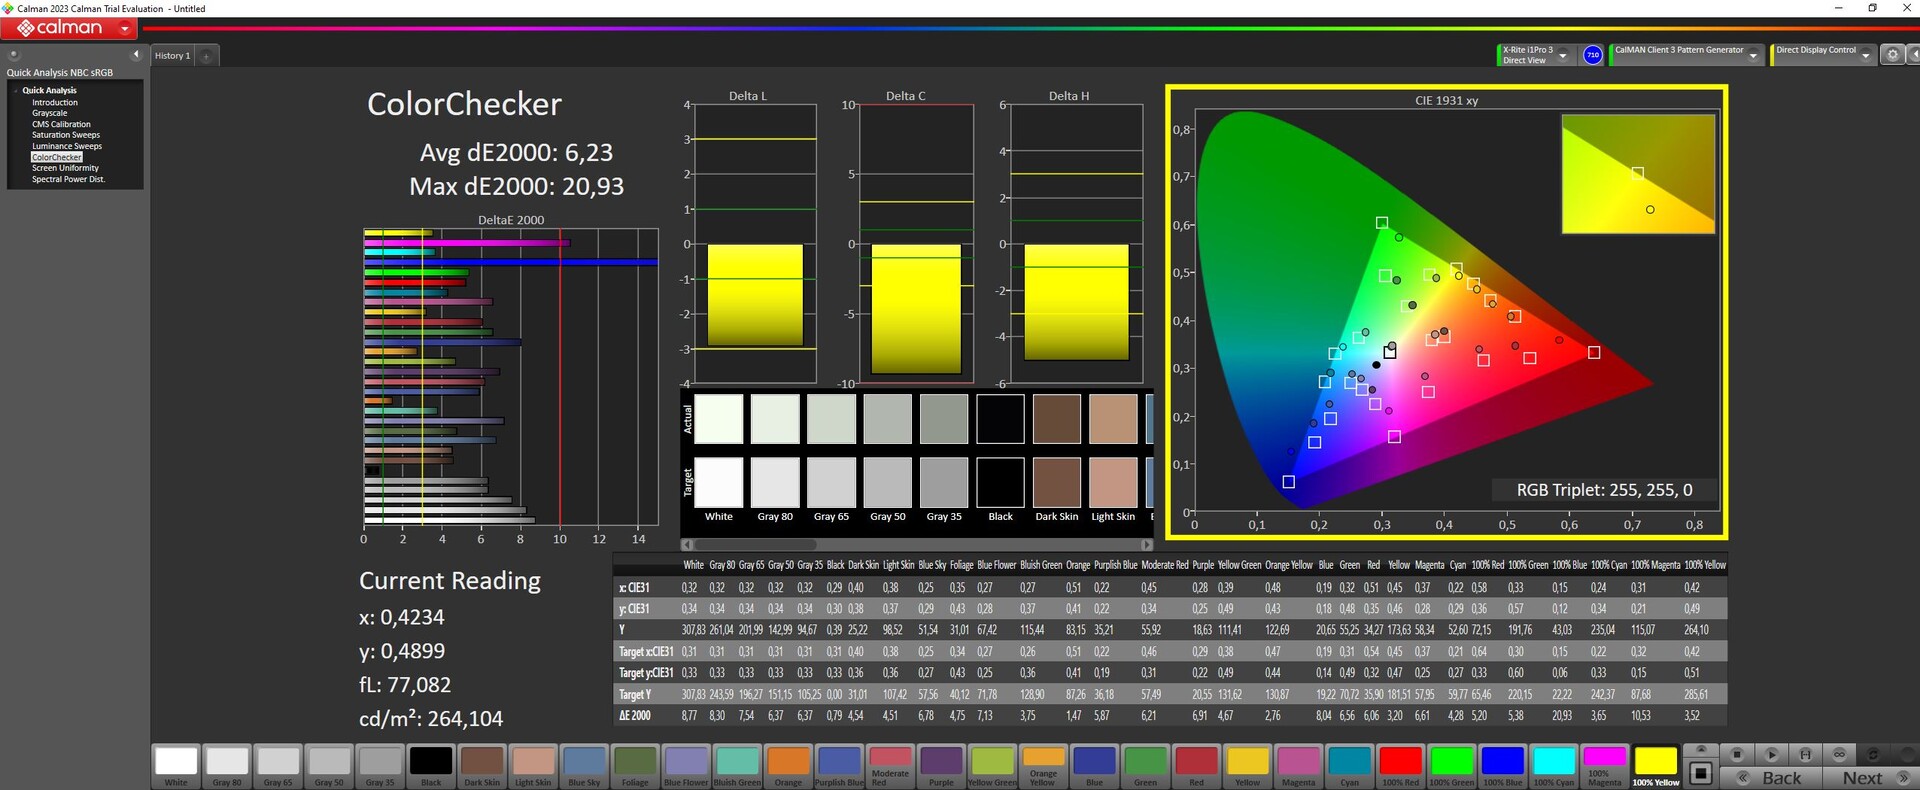
Mat FHD ekran (Chi Mei tarafından üretilmiştir) yeni modele de taşınmıştır G5 KE. İyi bir görüş açısına sahip olmasına rağmen, 144Hz IPS panel parlaklık ve kontrast söz konusu olduğunda standartlara uygun değildir. Ekran, olağan renk alanlarını (sRGB, AdobeRG ve DCI-P3) yeniden üretemiyor. Ancak en azından herhangi bir parlaklık seviyesinde PWM titreşimi göstermiyor. Başka panel seçeneği mevcut değil. Şunlar Asus TUF A15, Intel NUC X15 ve Lenovo Slim 5 16APH8 hepsi daha iyi ekranlarla donatıldı.
| |||||||||||||||||||||||||
Aydınlatma: 85 %
Batarya modunda parlaklık: 297 cd/m²
Kontrast: 874:1 (Siyah: 0.34 cd/m²)
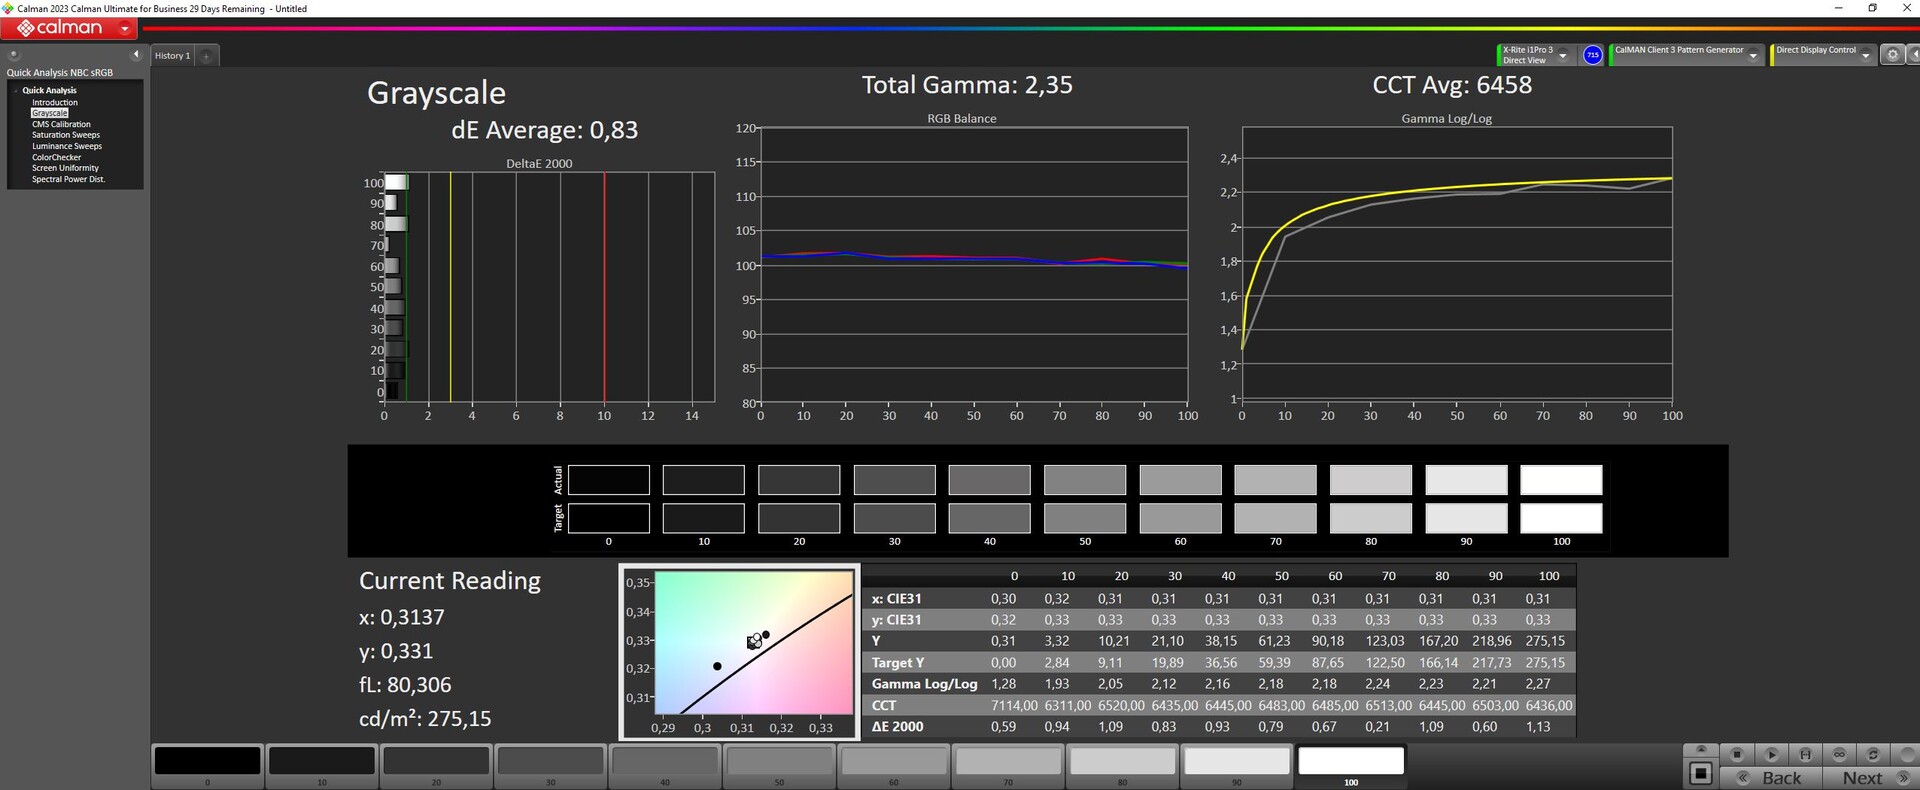
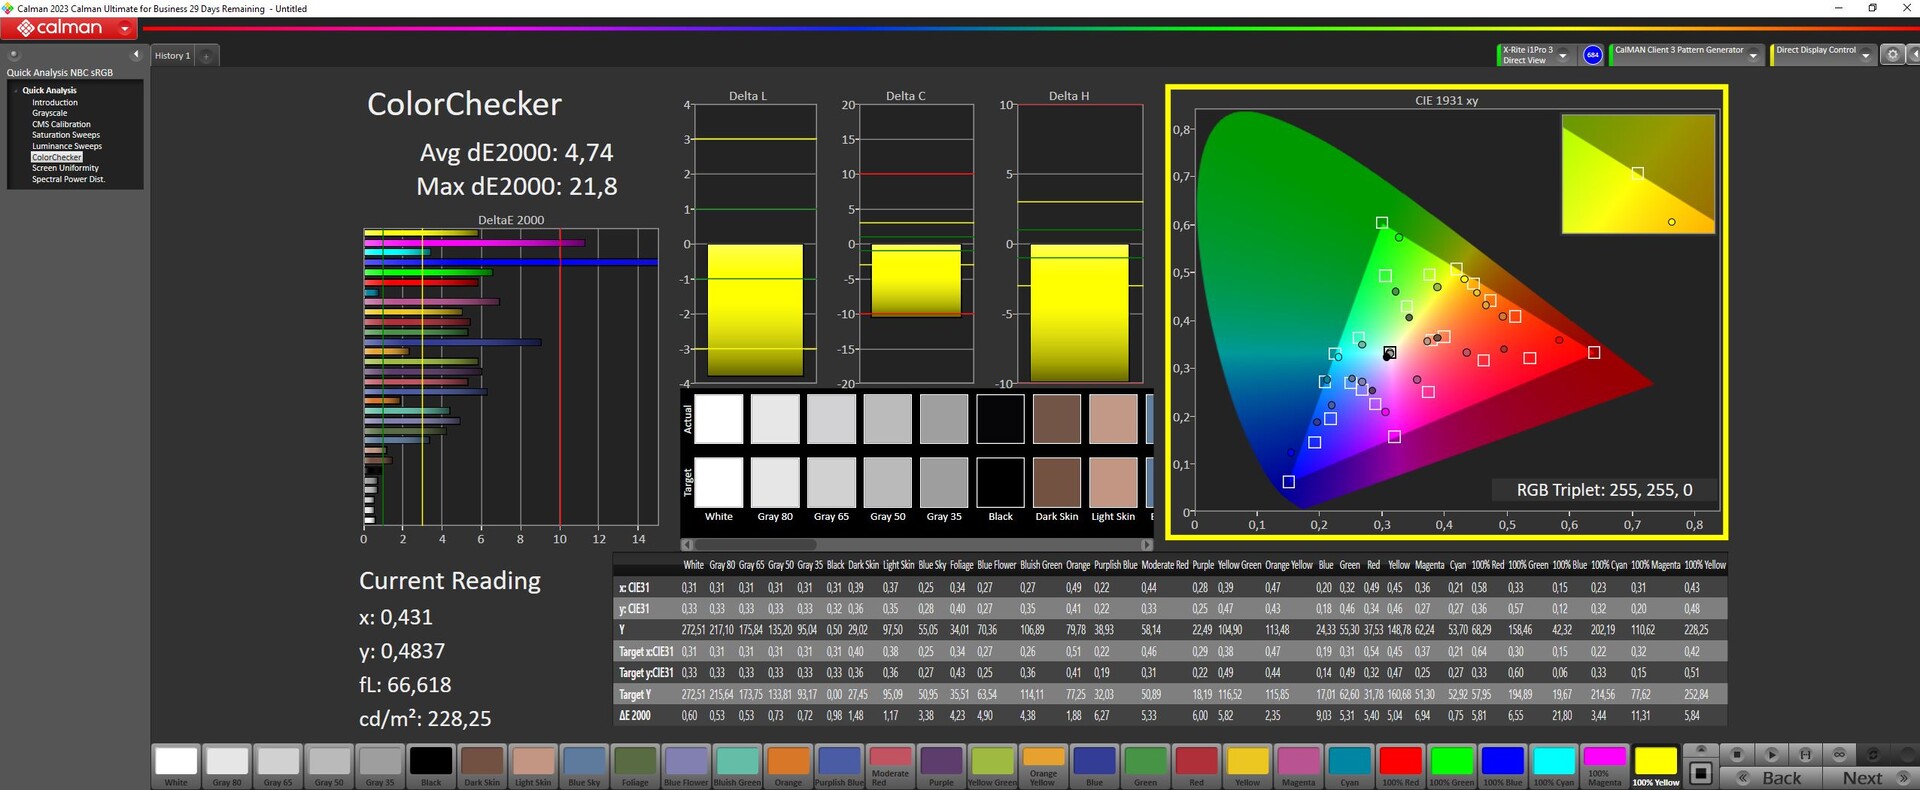
ΔE ColorChecker Calman: 6.23 | ∀{0.5-29.43 Ø4.71}
calibrated: 4.74
ΔE Greyscale Calman: 5.92 | ∀{0.09-98 Ø4.96}
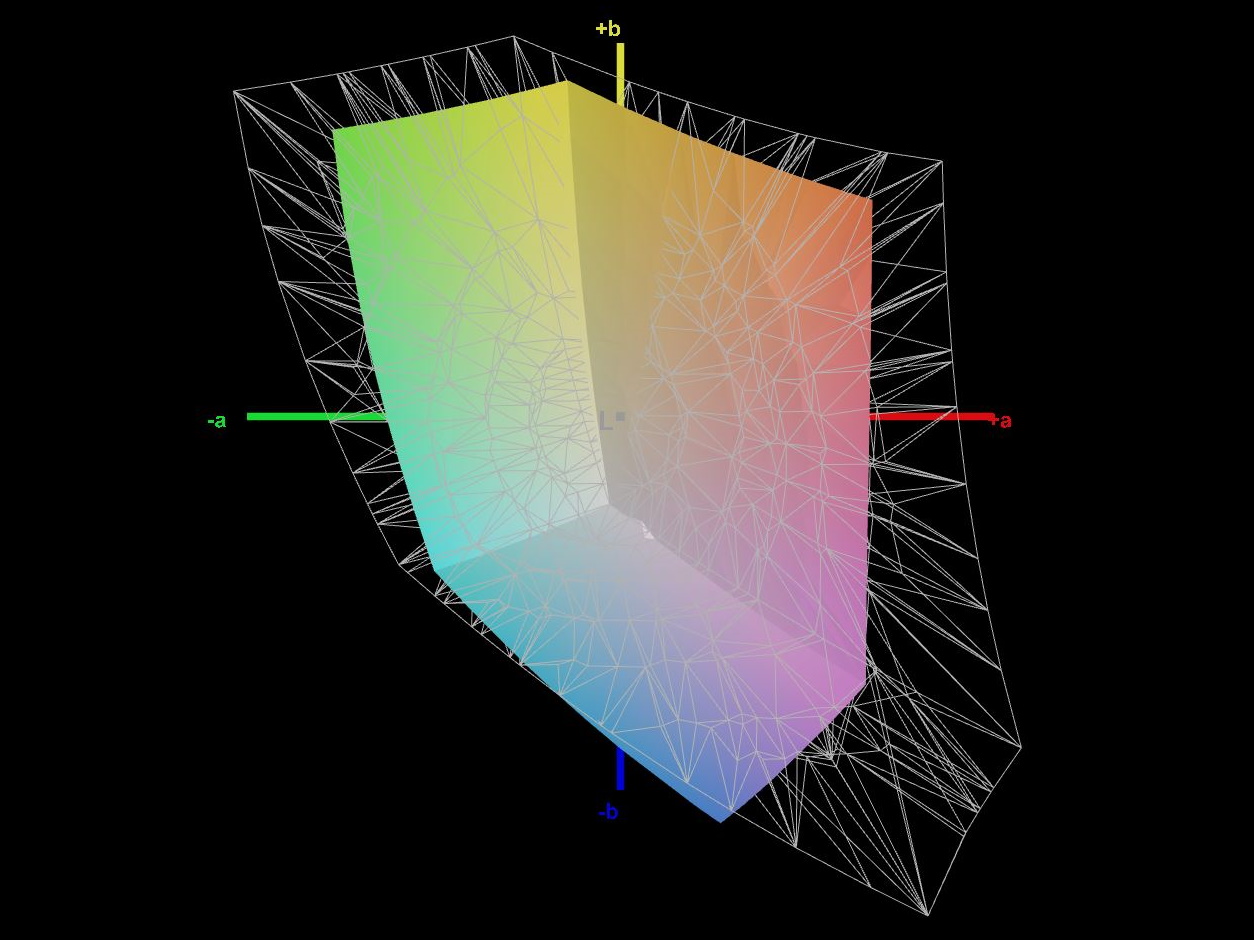
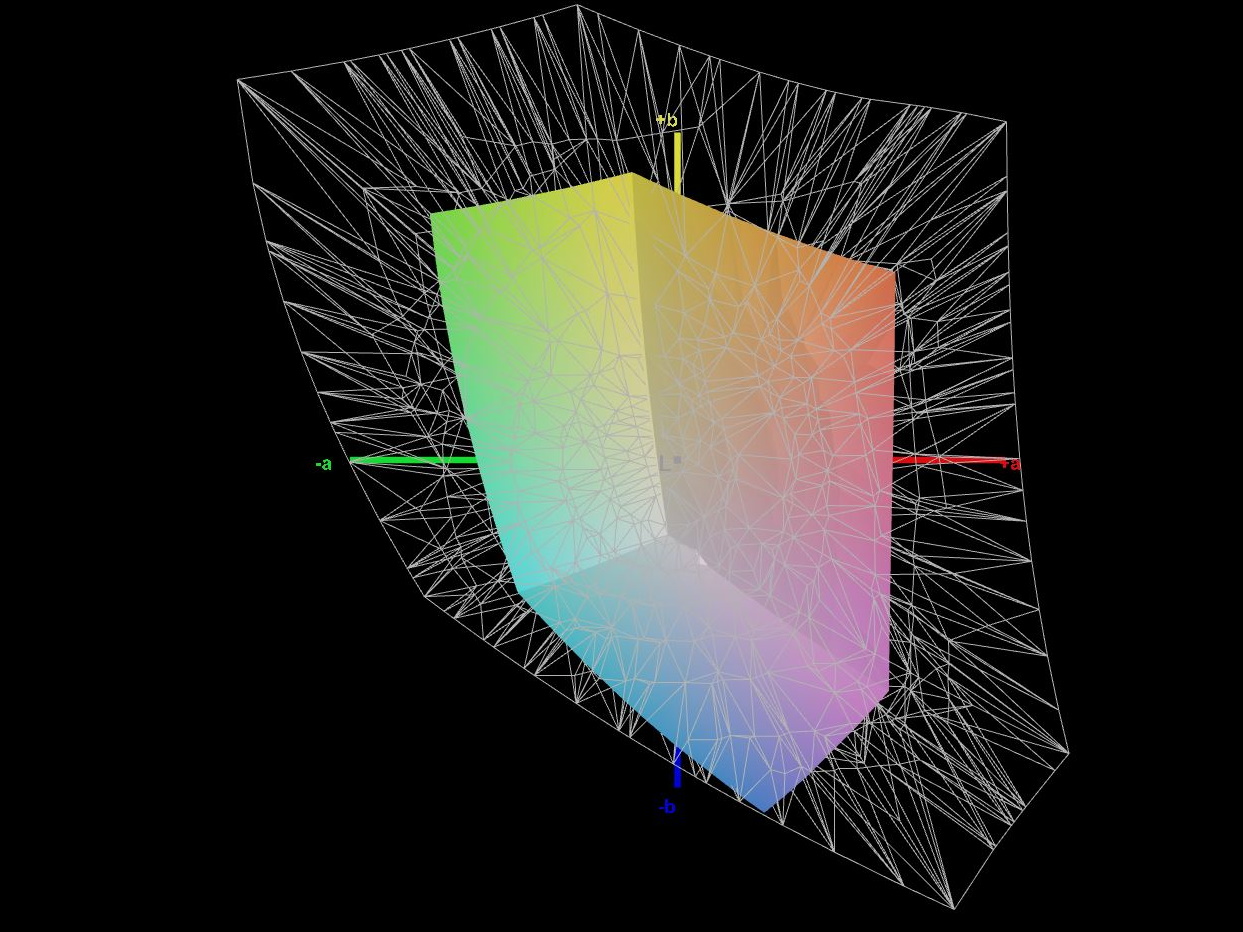
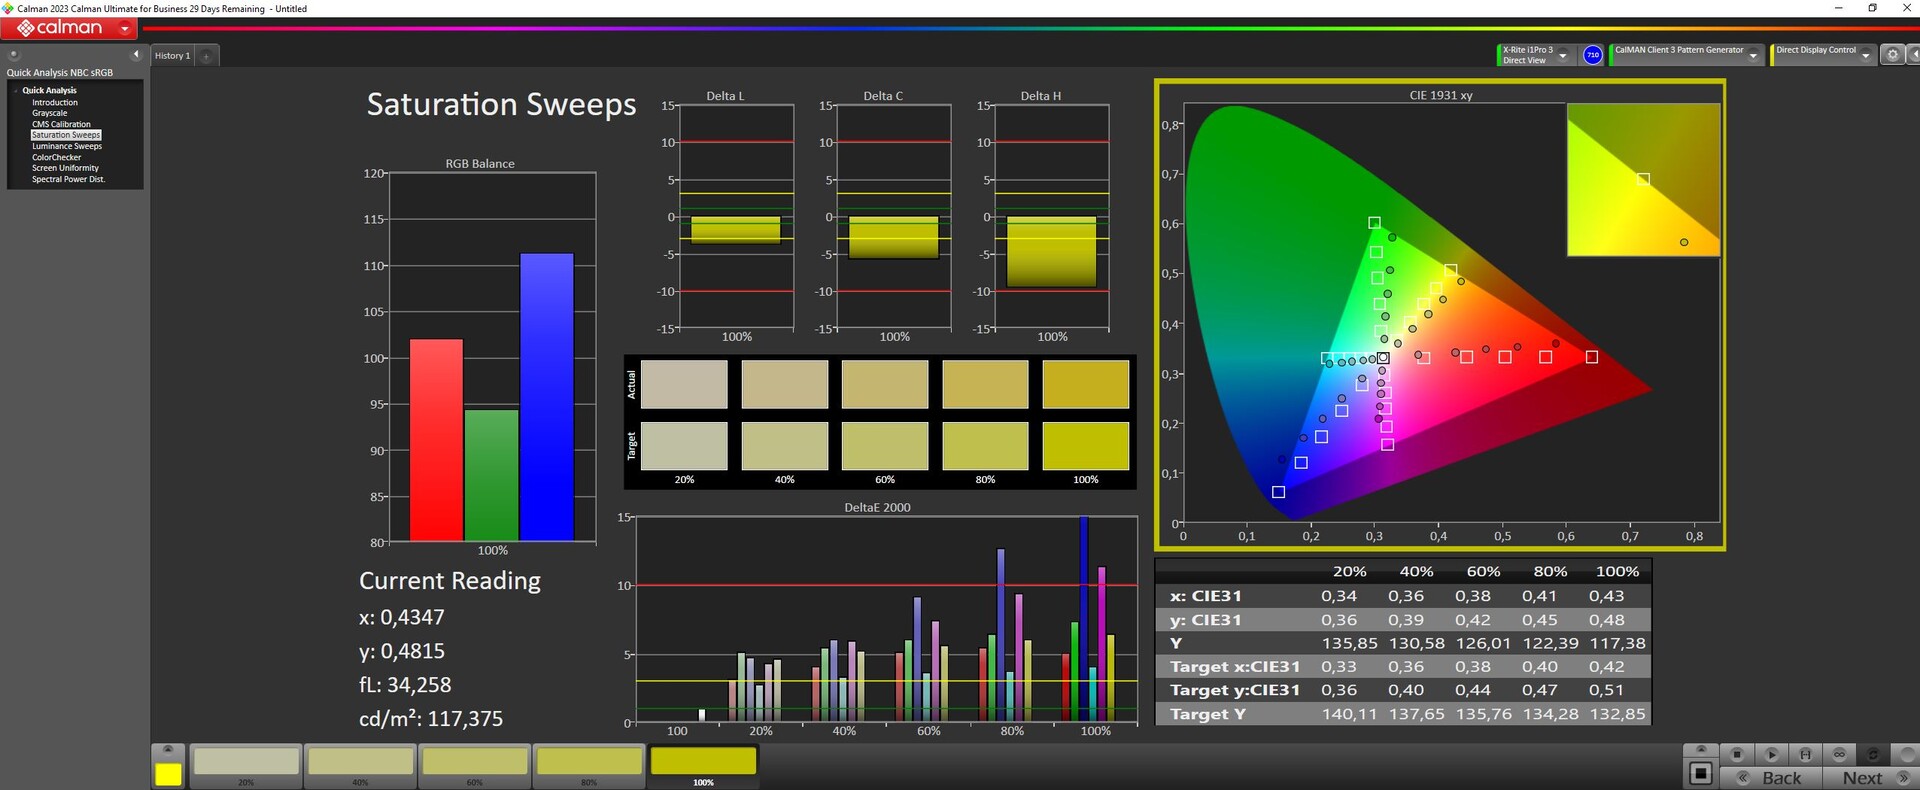
44.7% AdobeRGB 1998 (Argyll 3D)
64.3% sRGB (Argyll 3D)
43.2% Display P3 (Argyll 3D)
Gamma: 2.49
CCT: 6279 K
| Gigabyte G5 KF Chi Mei N156HRA-EA1, IPS, 1920x1080, 15.6" | MSI Cyborg 15 A12VF AU Optronics B156HAN15.1, IPS, 1920x1080, 15.6" | Intel NUC X15 LAPAC71H BOE HF NV156FHM-N4G, IPS, 1920x1080, 15.6" | Asus TUF A15 FA507 N156HMA-GA1, IPS, 1920x1080, 15.6" | Lenovo Legion Slim 5 16APH8 BOE NJ NE160QDM-NYC, IPS, 2560x1600, 16" | Gigabyte G5 KE Chi Mei N156HRA-EA1, IPS, 1920x1080, 15.6" | |
|---|---|---|---|---|---|---|
| Display | -2% | 47% | 50% | 58% | -6% | |
| Display P3 Coverage (%) | 43.2 | 42.3 -2% | 64.9 50% | 64.9 50% | 69.3 60% | 40.7 -6% |
| sRGB Coverage (%) | 64.3 | 62.6 -3% | 92.6 44% | 96.5 50% | 100 56% | 61 -5% |
| AdobeRGB 1998 Coverage (%) | 44.7 | 43.7 -2% | 66.3 48% | 66.6 49% | 70 57% | 42.1 -6% |
| Response Times | -9% | 51% | -57% | 43% | -40% | |
| Response Time Grey 50% / Grey 80% * (ms) | 25.1 ? | 22 ? 12% | 7.8 ? 69% | 30.4 ? -21% | 10.7 ? 57% | 26.64 ? -6% |
| Response Time Black / White * (ms) | 10.8 ? | 14 ? -30% | 7.3 ? 32% | 20.8 ? -93% | 7.8 ? 28% | 18.65 ? -73% |
| PWM Frequency (Hz) | ||||||
| Screen | 22% | 51% | 48% | 39% | 1% | |
| Brightness middle (cd/m²) | 297 | 247 -17% | 365 23% | 288 -3% | 371.6 25% | 269 -9% |
| Brightness (cd/m²) | 275 | 234 -15% | 356 29% | 271 -1% | 343 25% | 248 -10% |
| Brightness Distribution (%) | 85 | 89 5% | 86 1% | 91 7% | 84 -1% | 85 0% |
| Black Level * (cd/m²) | 0.34 | 0.25 26% | 0.17 50% | 0.17 50% | 0.44 -29% | 0.5 -47% |
| Contrast (:1) | 874 | 988 13% | 2147 146% | 1694 94% | 845 -3% | 538 -38% |
| Colorchecker dE 2000 * | 6.23 | 3.78 39% | 3.51 44% | 1.9 70% | 1.52 76% | 4.54 27% |
| Colorchecker dE 2000 max. * | 20.93 | 6.42 69% | 6.37 70% | 3.3 84% | 2.68 87% | 17.28 17% |
| Colorchecker dE 2000 calibrated * | 4.74 | 3.94 17% | 1.88 60% | 0.9 81% | 0.33 93% | 3.34 30% |
| Greyscale dE 2000 * | 5.92 | 2.16 64% | 3.83 35% | 2.7 54% | 1.2 80% | 3.8 36% |
| Gamma | 2.49 88% | 2.33 94% | 2.47 89% | 2.32 95% | 2.1 105% | 2.17 101% |
| CCT | 6279 104% | 6906 94% | 7362 88% | 6535 99% | 6503 100% | 7408 88% |
| Toplam Ortalama (Program / Ayarlar) | 4% /
13% | 50% /
50% | 14% /
34% | 47% /
44% | -15% /
-6% |
* ... daha küçük daha iyidir
Yanıt Sürelerini Görüntüle
| ↔ Tepki Süresi Siyahtan Beyaza | ||
|---|---|---|
| 10.8 ms ... yükseliş ↗ ve sonbahar↘ birleşimi | ↗ 9.9 ms yükseliş | 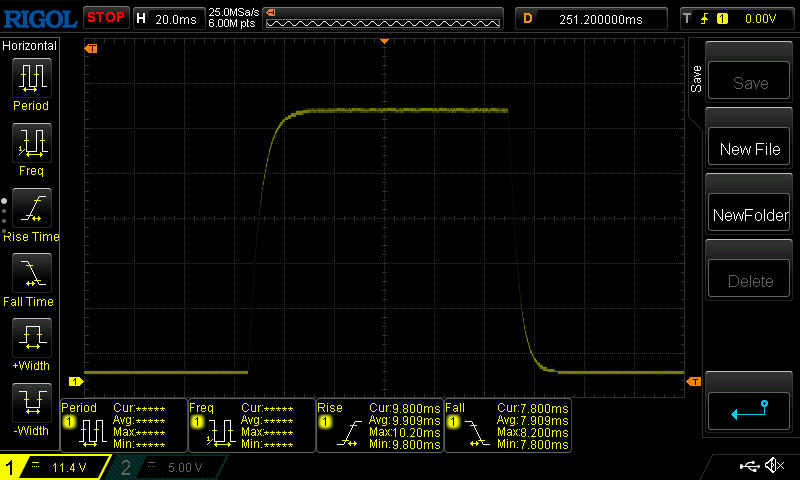 |
| ↘ 7.9 ms sonbahar | ||
| Ekran, testlerimizde iyi yanıt oranları gösteriyor ancak rekabetçi oyuncular için çok yavaş olabilir. Karşılaştırıldığında, test edilen tüm cihazlar 0.1 (minimum) ile 240 (maksimum) ms arasında değişir. » Tüm cihazların 29 %'si daha iyi. Bu, ölçülen yanıt süresinin test edilen tüm cihazların ortalamasından (19.8 ms) daha iyi olduğu anlamına gelir. | ||
| ↔ Tepki Süresi %50 Griden %80 Griye | ||
| 25.1 ms ... yükseliş ↗ ve sonbahar↘ birleşimi | ↗ 11.7 ms yükseliş | 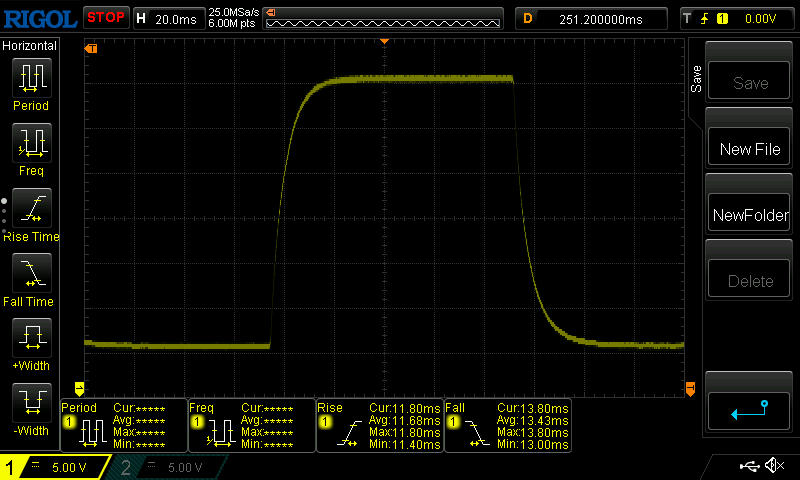 |
| ↘ 13.4 ms sonbahar | ||
| Ekran, testlerimizde nispeten yavaş yanıt oranları gösteriyor ve oyuncular için çok yavaş olabilir. Karşılaştırıldığında, test edilen tüm cihazlar 0.165 (minimum) ile 636 (maksimum) ms arasında değişir. » Tüm cihazların 36 %'si daha iyi. Bu, ölçülen yanıt süresinin test edilen tüm cihazların ortalamasından (30.9 ms) daha iyi olduğu anlamına gelir. | ||
Ekran Titremesi / PWM (Darbe Genişliği Modülasyonu)
| Ekran titriyor / PWM algılanmadı | 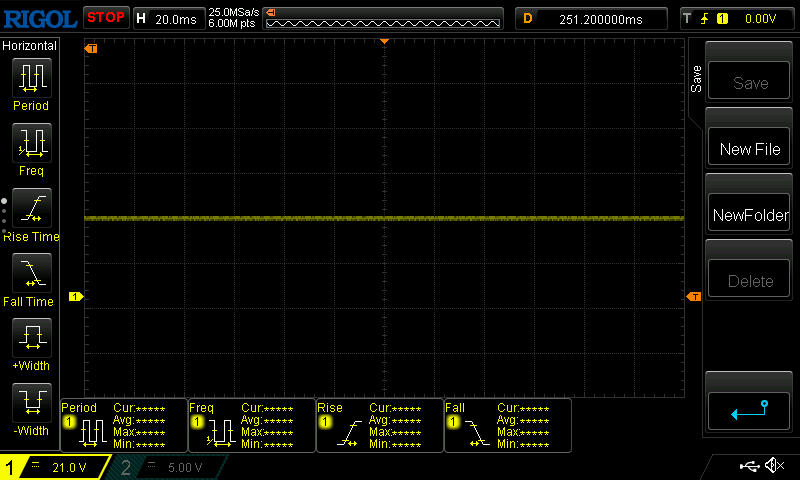 | ||
Karşılaştırıldığında: Test edilen tüm cihazların %52 %'si ekranı karartmak için PWM kullanmıyor. PWM tespit edilirse, ortalama 7748 (minimum: 5 - maksimum: 343500) Hz ölçüldü. | |||
Performans - Alder Lake Ada Lovelace ile buluşuyor
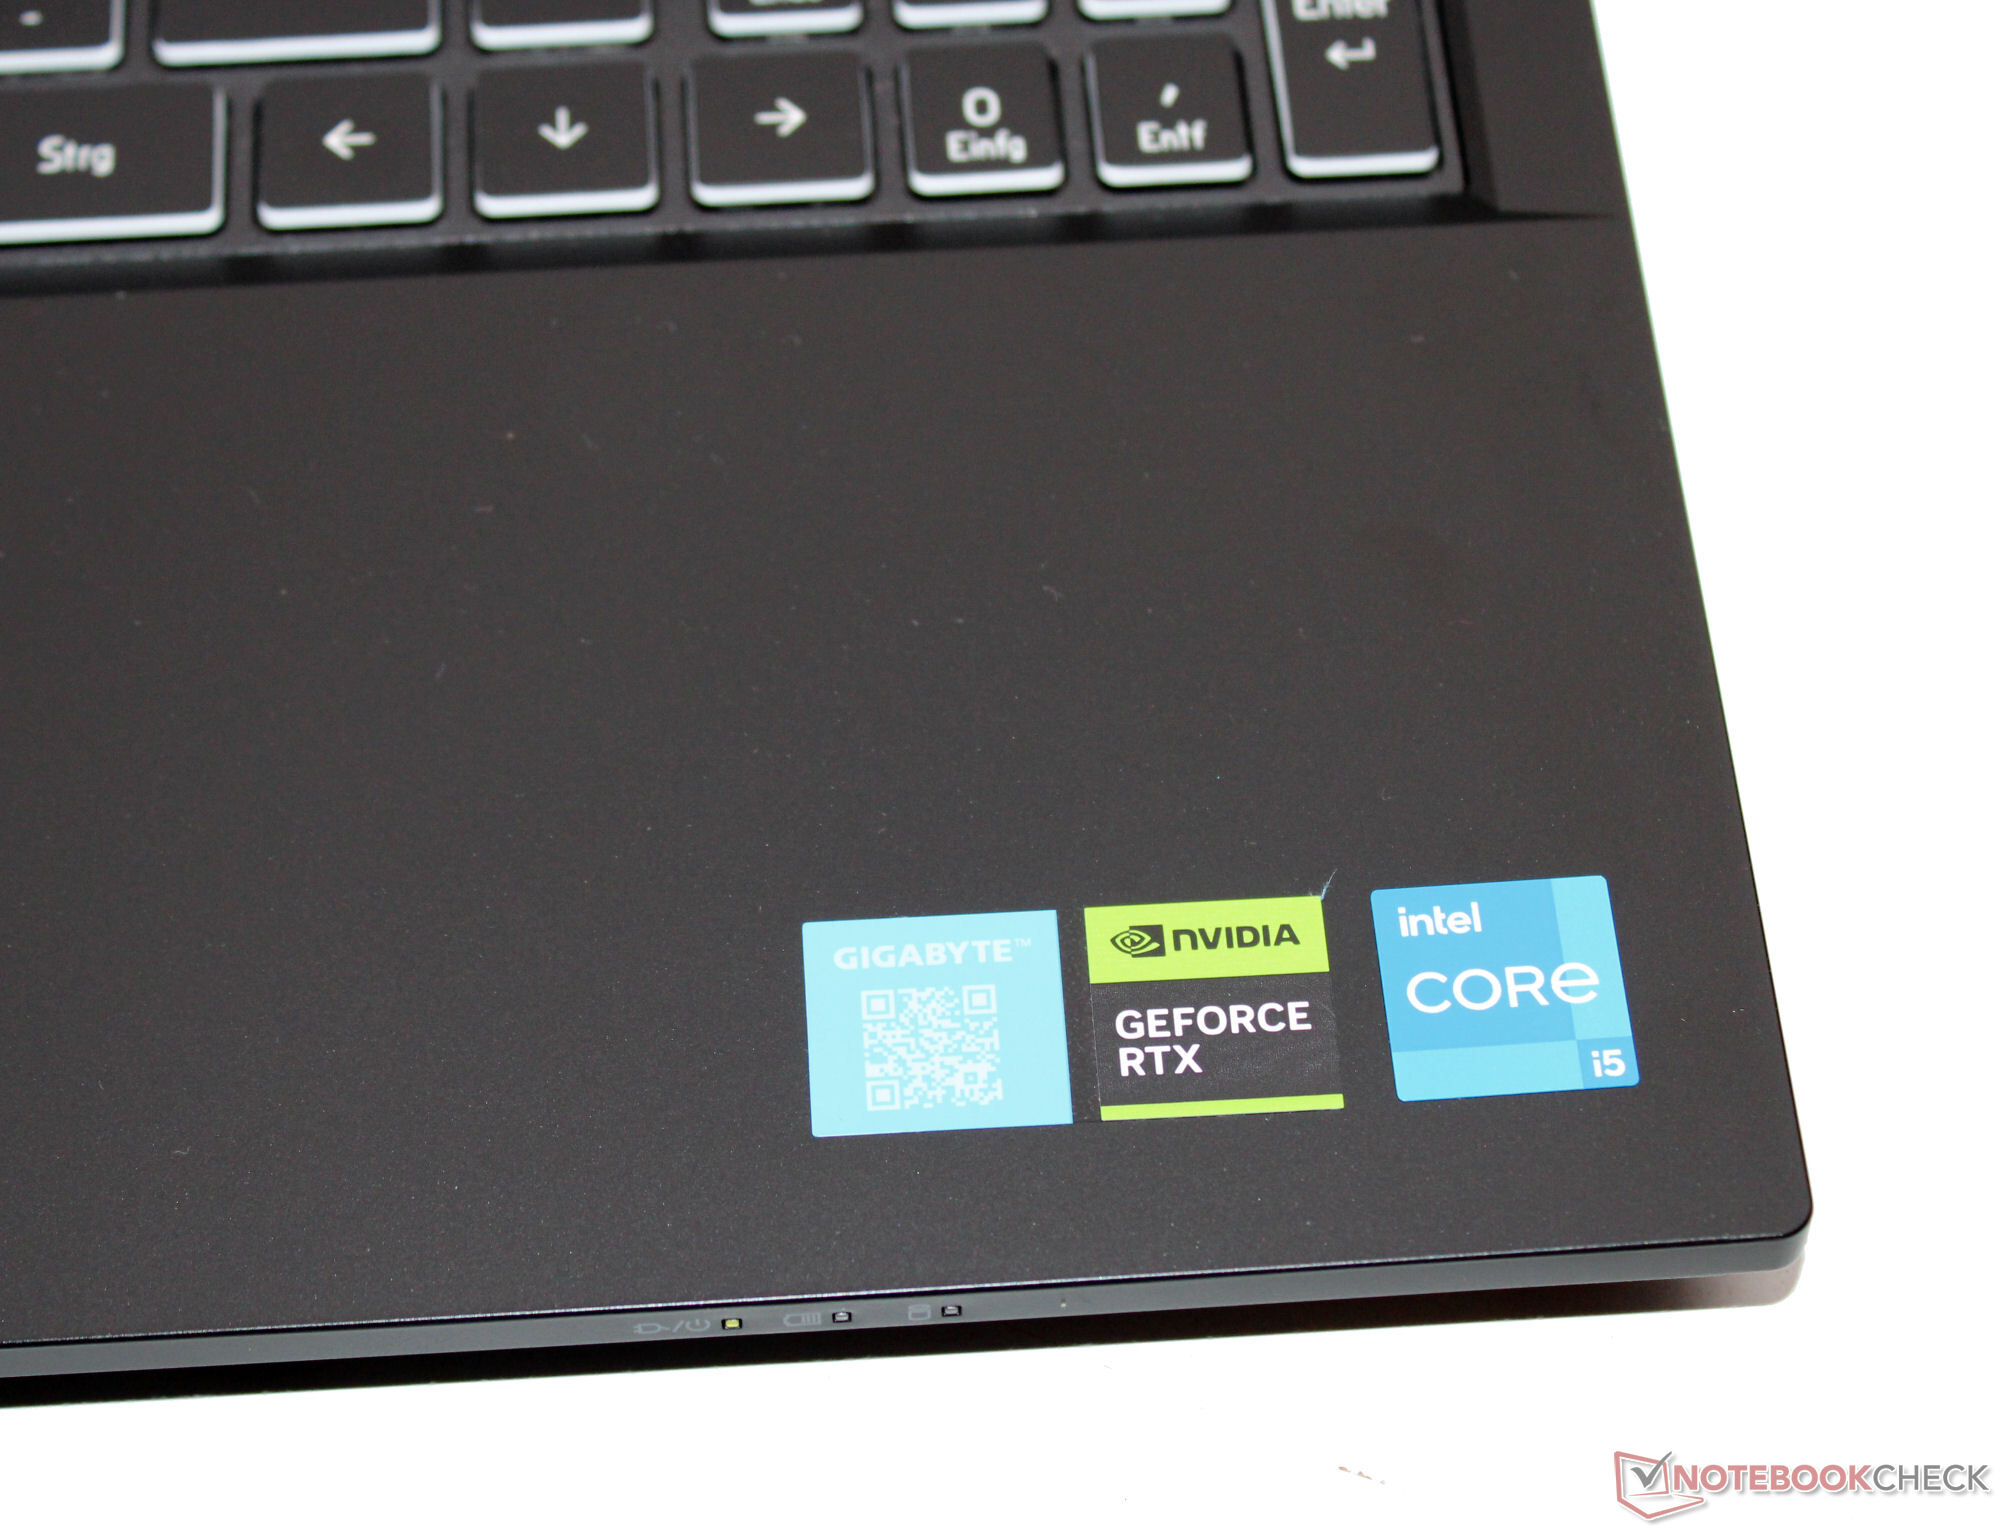
Gigabyte, G5 KF ile ürün yelpazesinde nispeten uygun fiyatlı bir FHD oyun dizüstü bilgisayarına sahip. Dizüstü bilgisayar bir Core i5-12500H ve GeForce RTX 4060ve 1.000 €'nun (1.059 ABD Doları) biraz altında bir fiyata sahip olunabilir. Şirket ayrıca şu modellerle daha ucuz modeller de sunmaktadır RTX 4050 (G5 MF) veya RTX 3050 (G5 GE).
Test koşulları
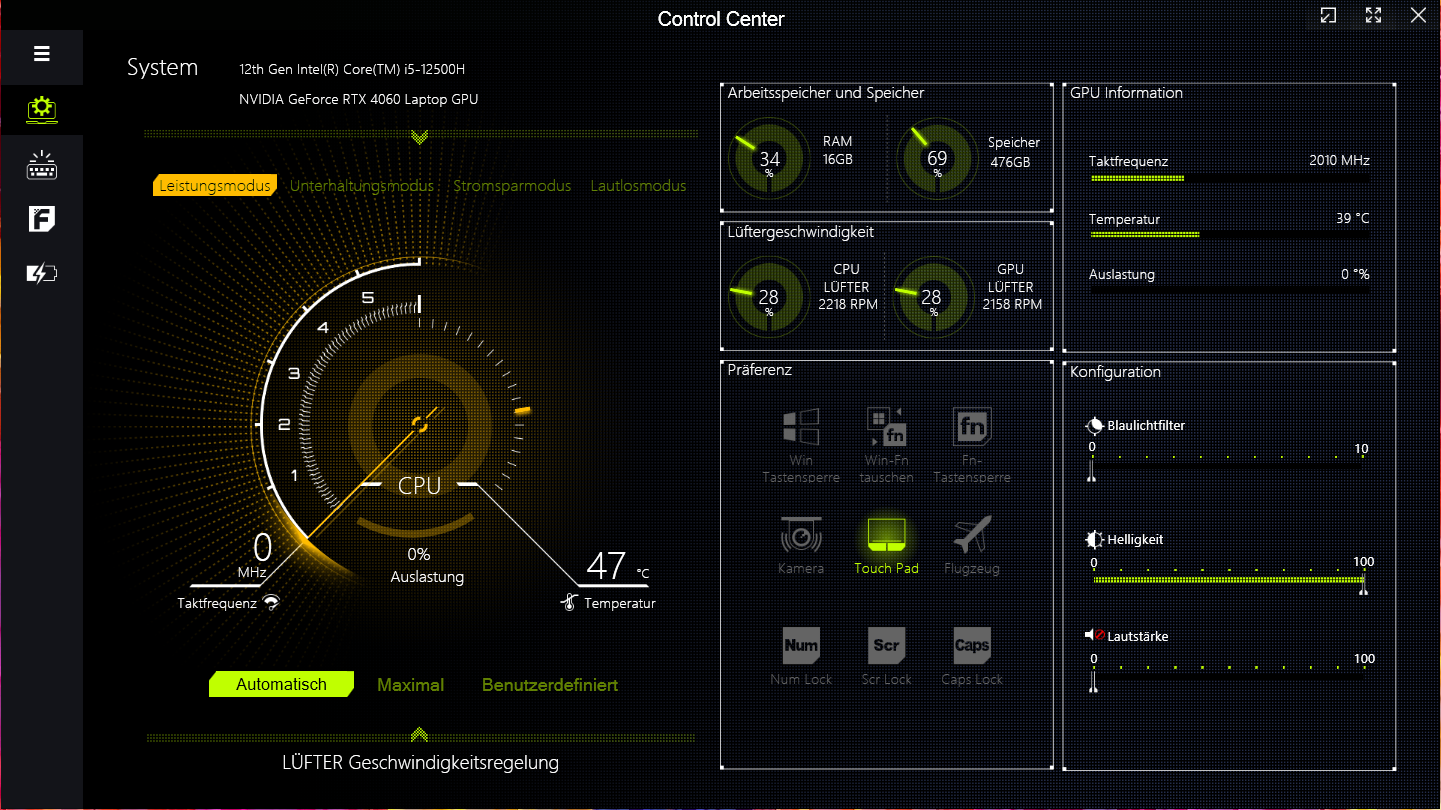
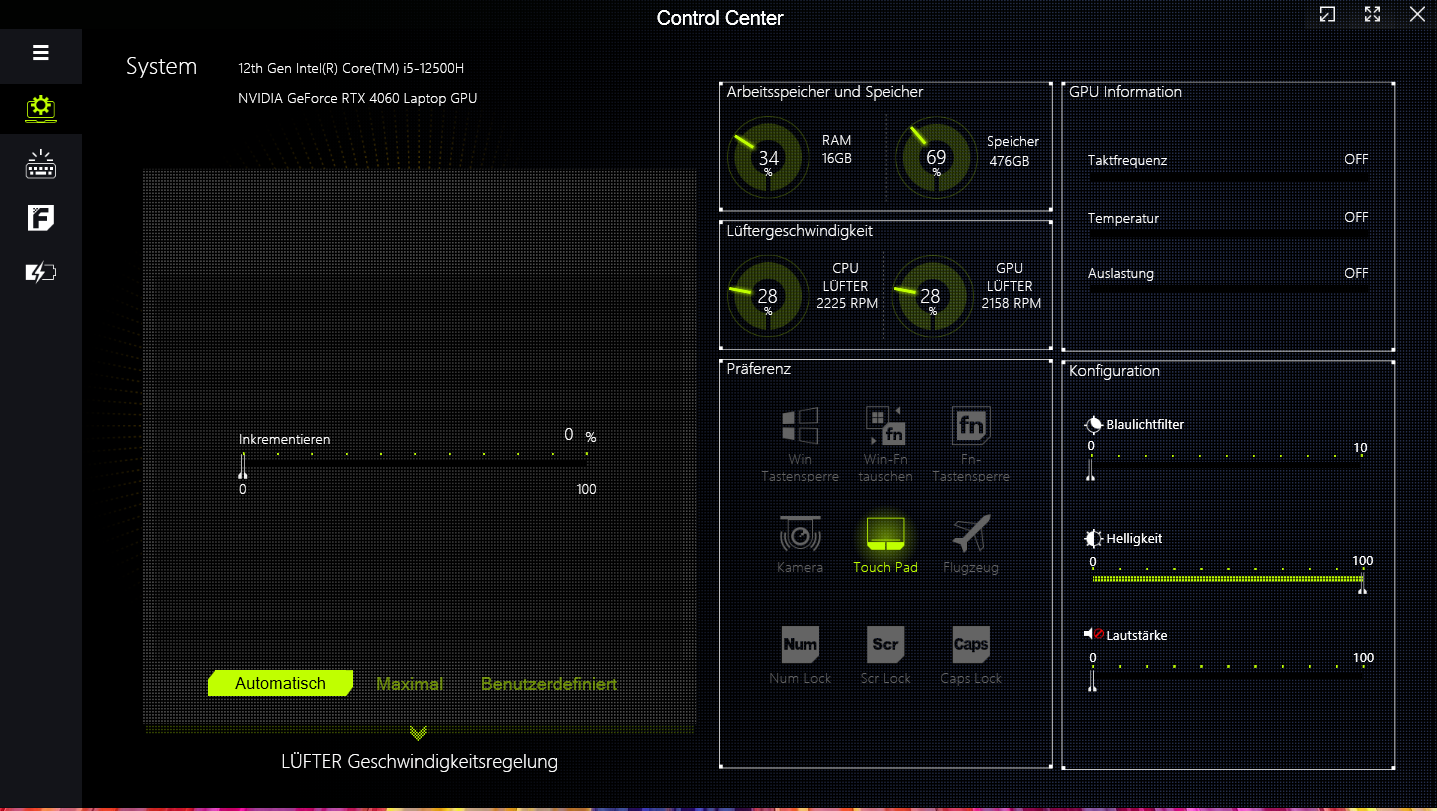
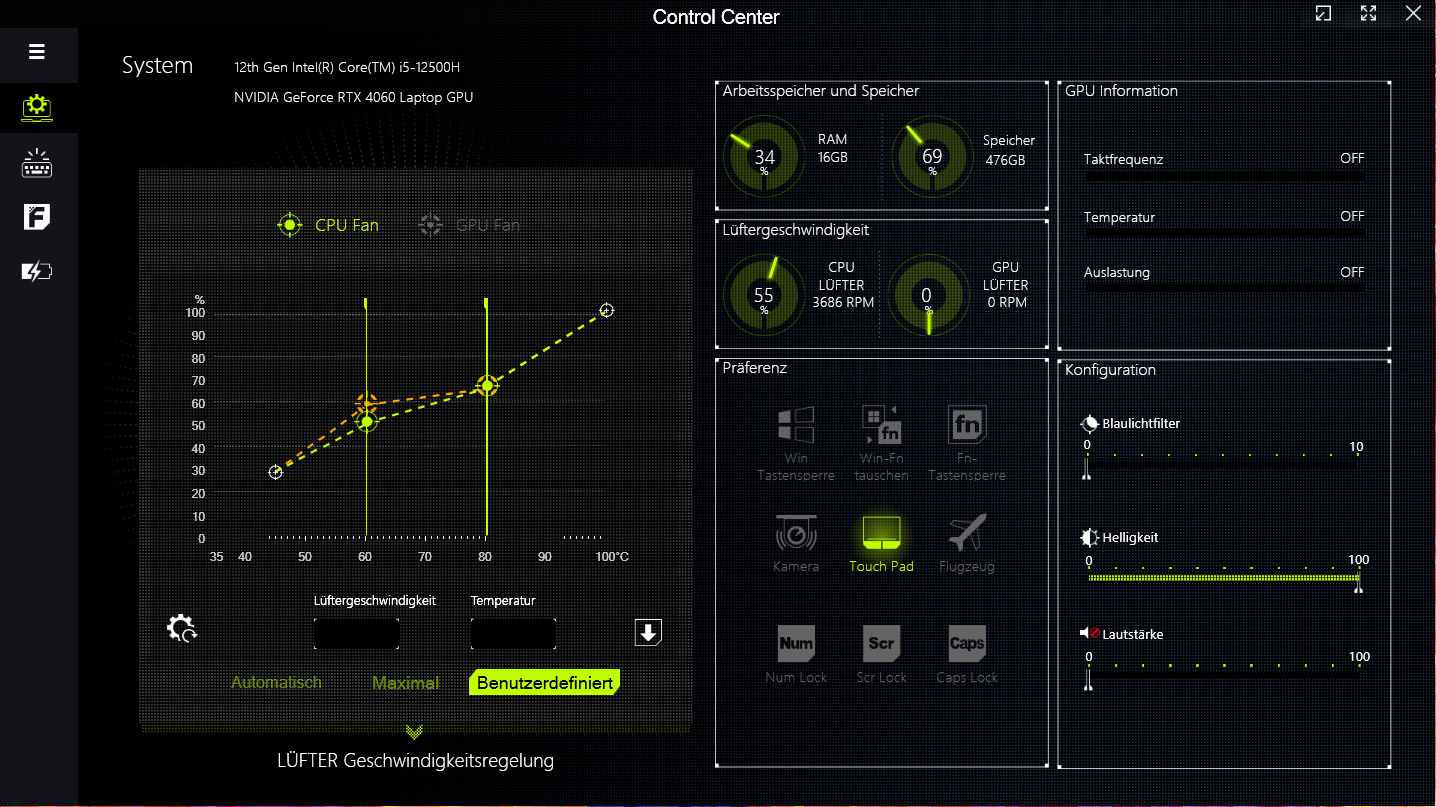
G5, üretici tarafından belirlenen dört performans modu sunar (tabloya bakın). Kontrol Merkezi yazılımını kullanarak bunlar arasında geçiş yapabilirsiniz. Biz kıyaslamalarımız için "Performans modunu" ve pil ömrü testleri için "Enerji tasarrufu modunu" kullandık.
| Performans modu | Eğlence modu | Enerji tasarrufu modu | Sessiz mod | |
|---|---|---|---|---|
| Güç Sınırı 1 (HWInfo) | 60 Watt | 50 Watt | 45 Watt | 15 Watt |
| Güç Sınırı 2 (HWInfo) | 125 Watt | 115 Watt | 30 Watt | 30 Watt |
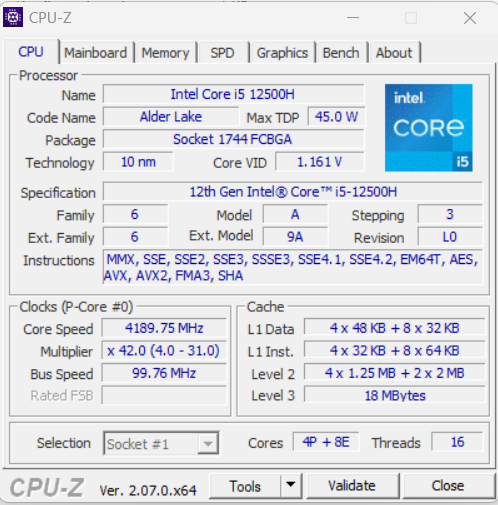
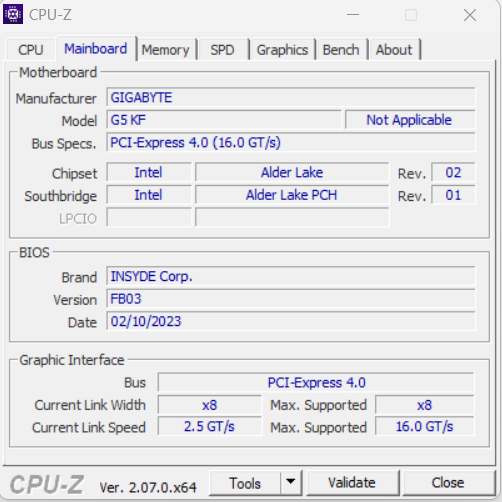
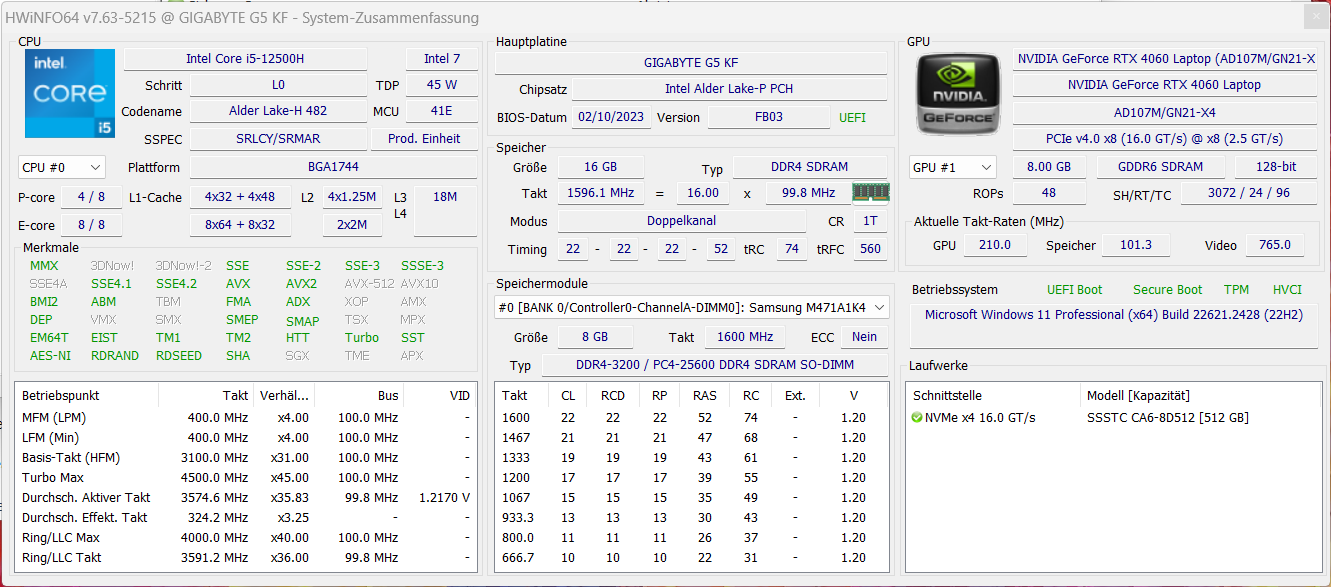
İşlemci
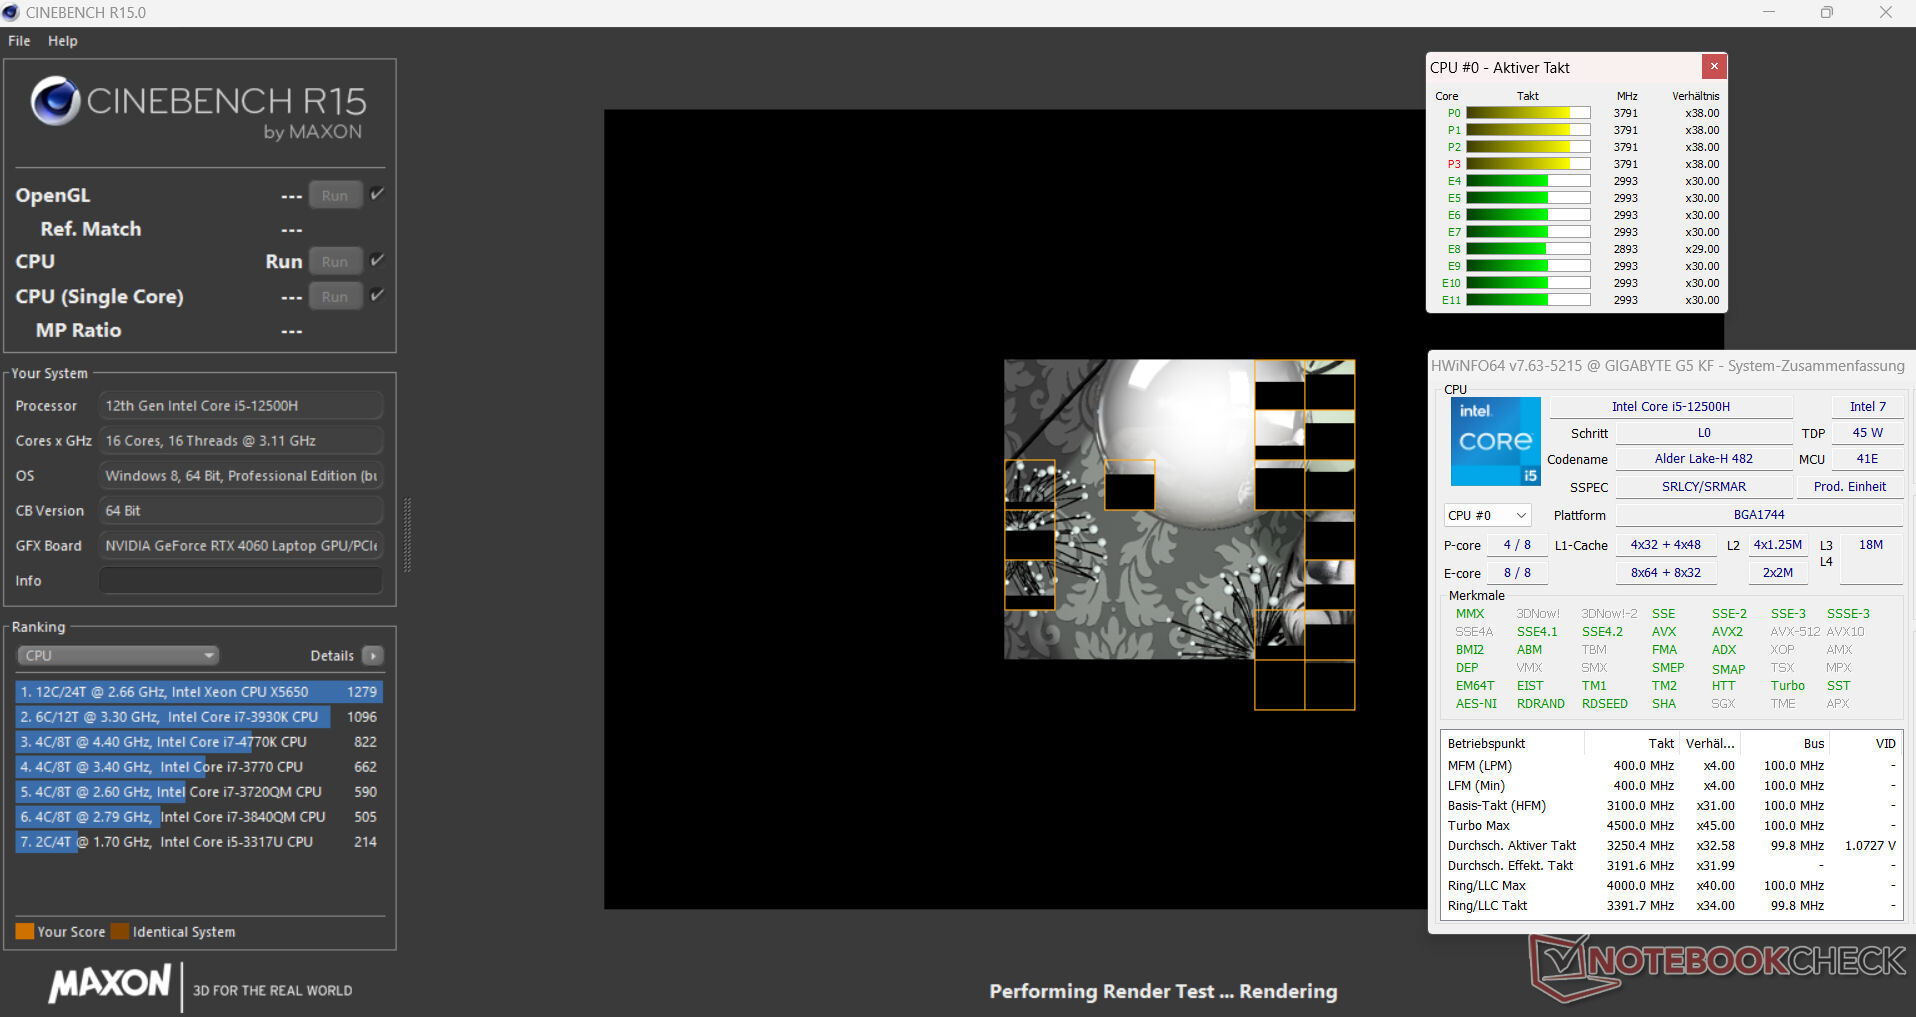
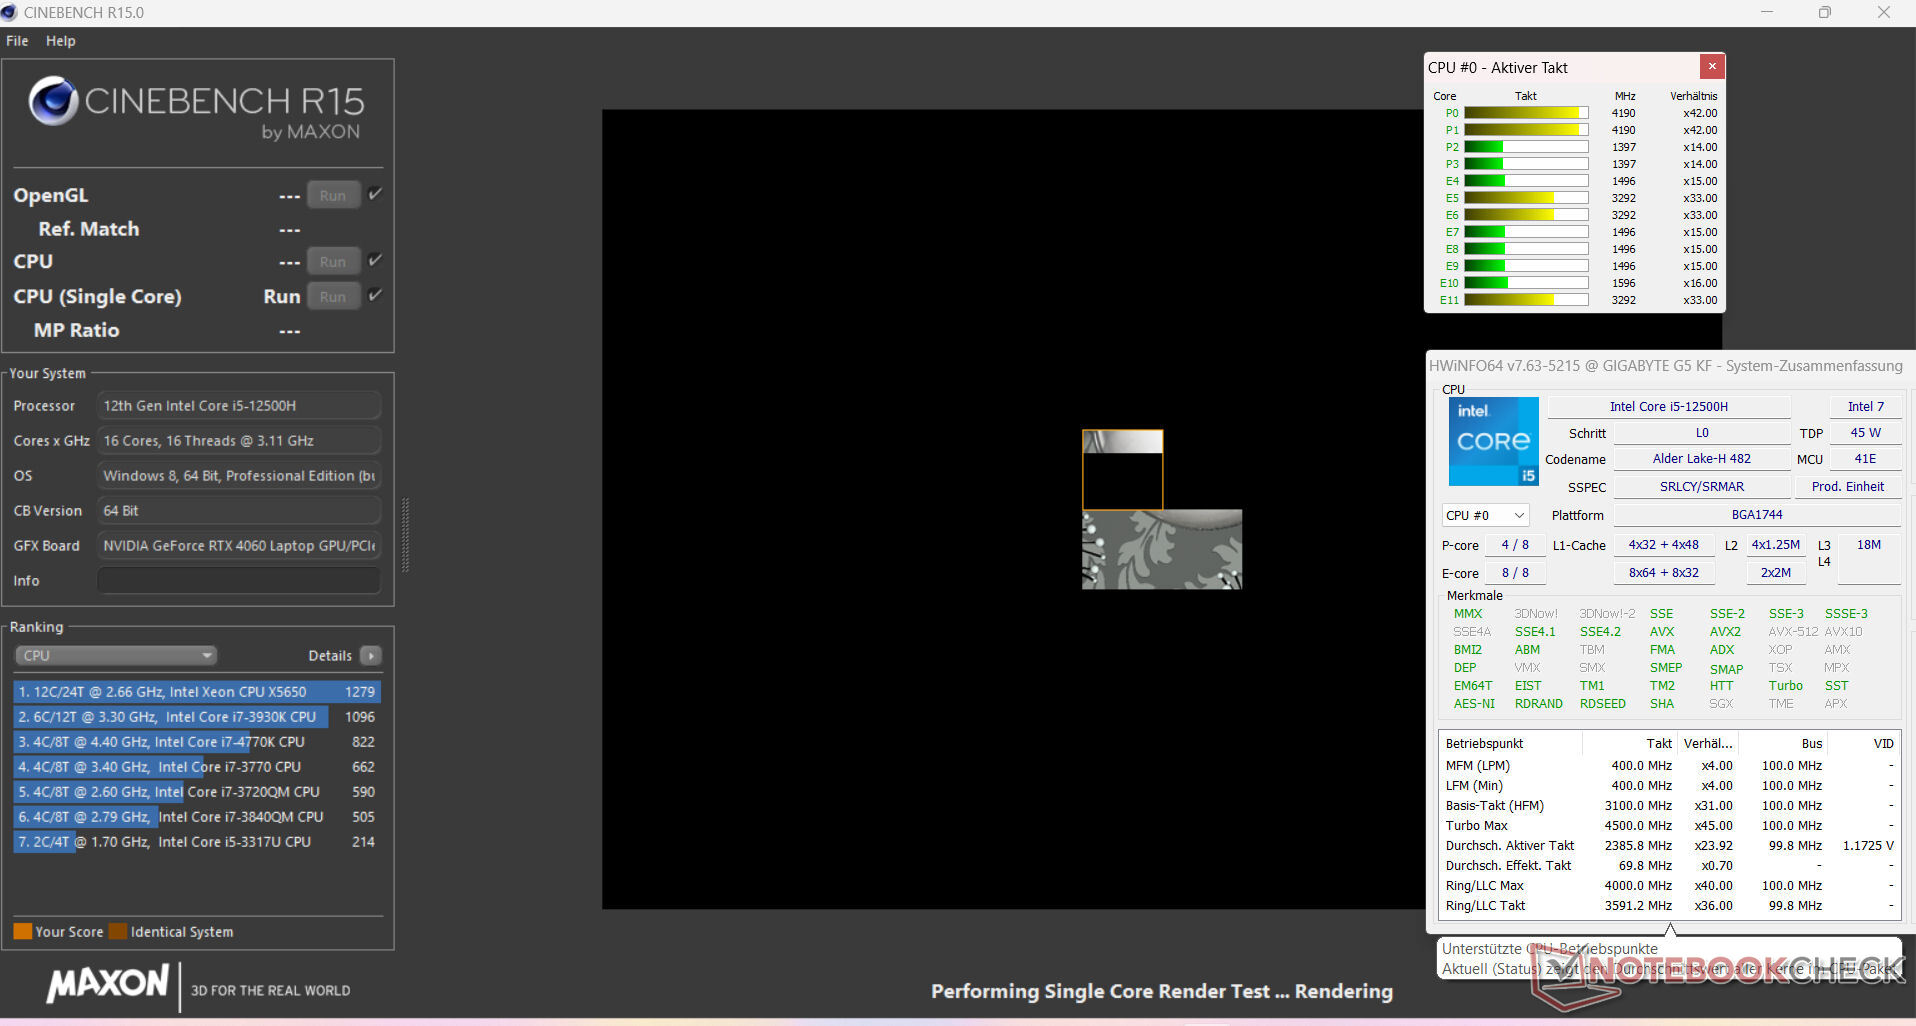
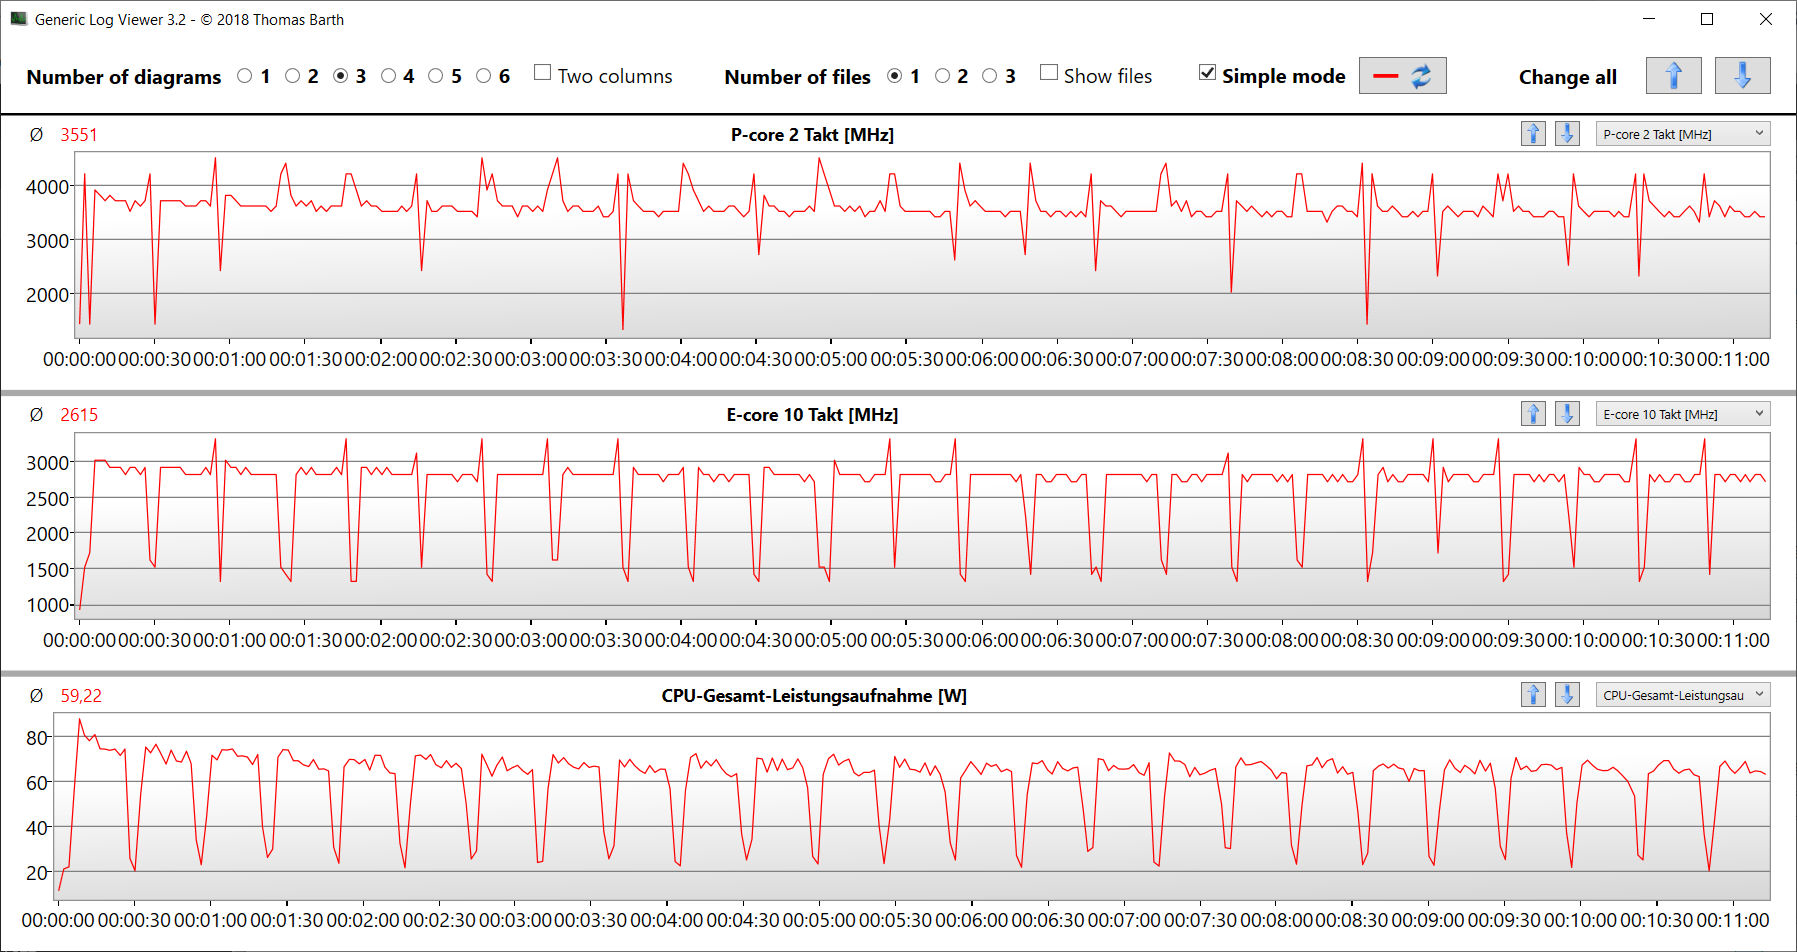
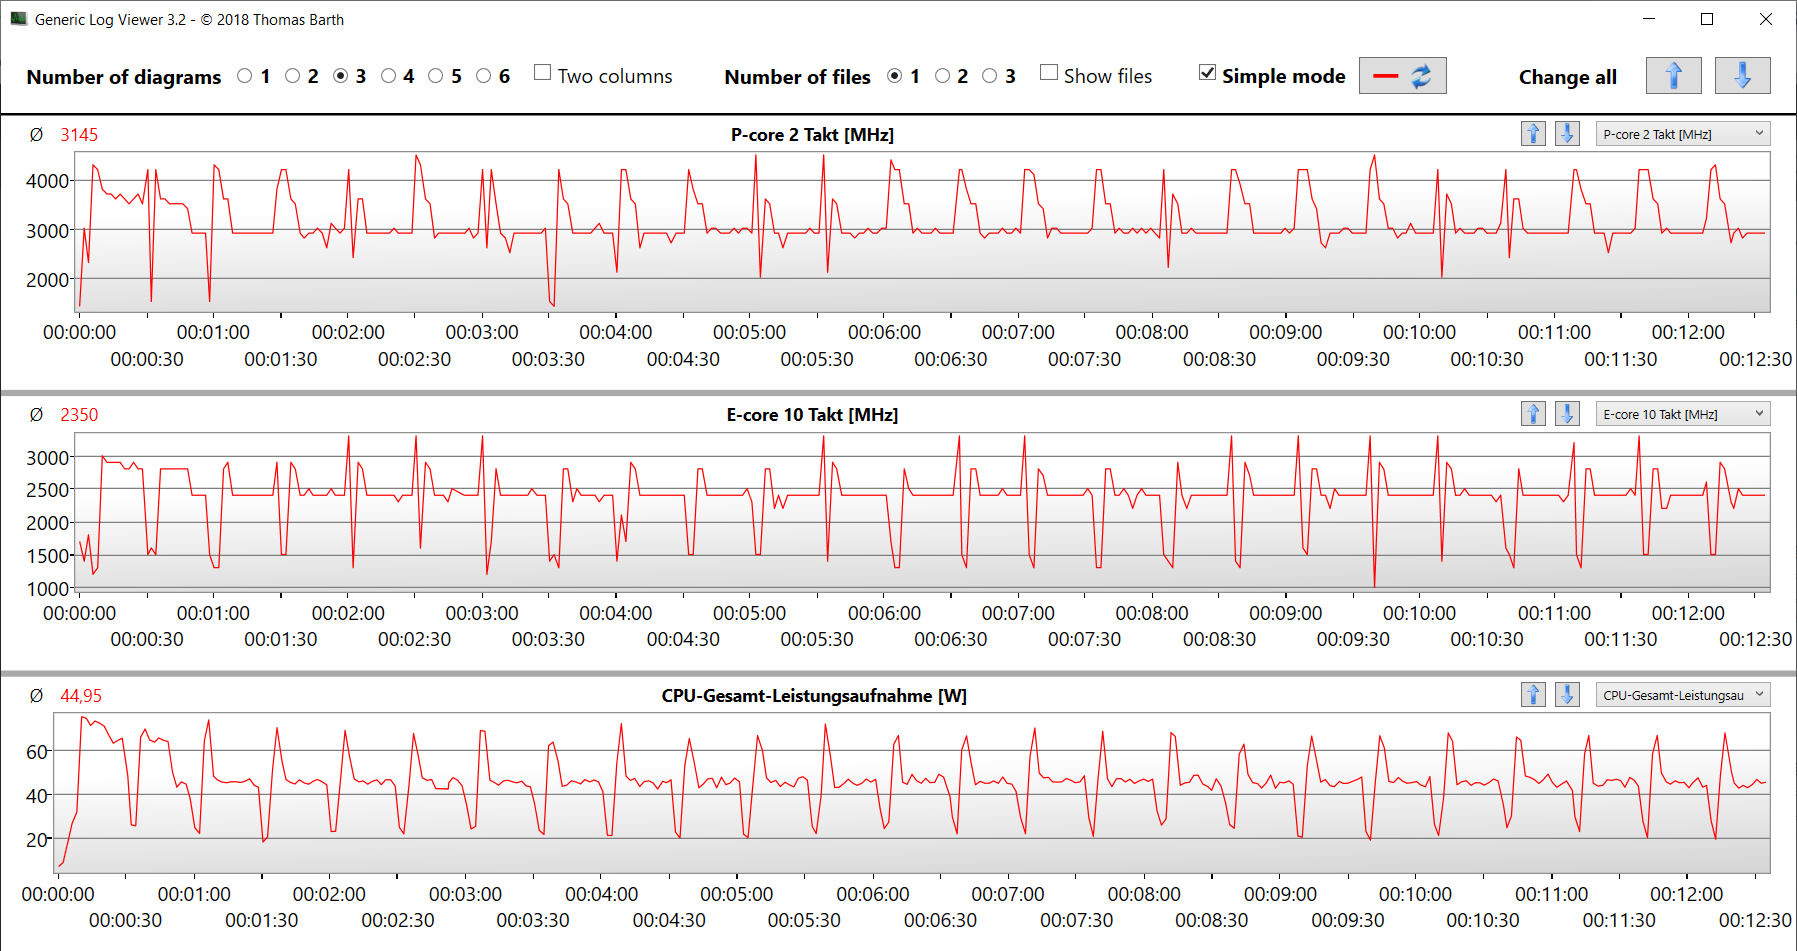
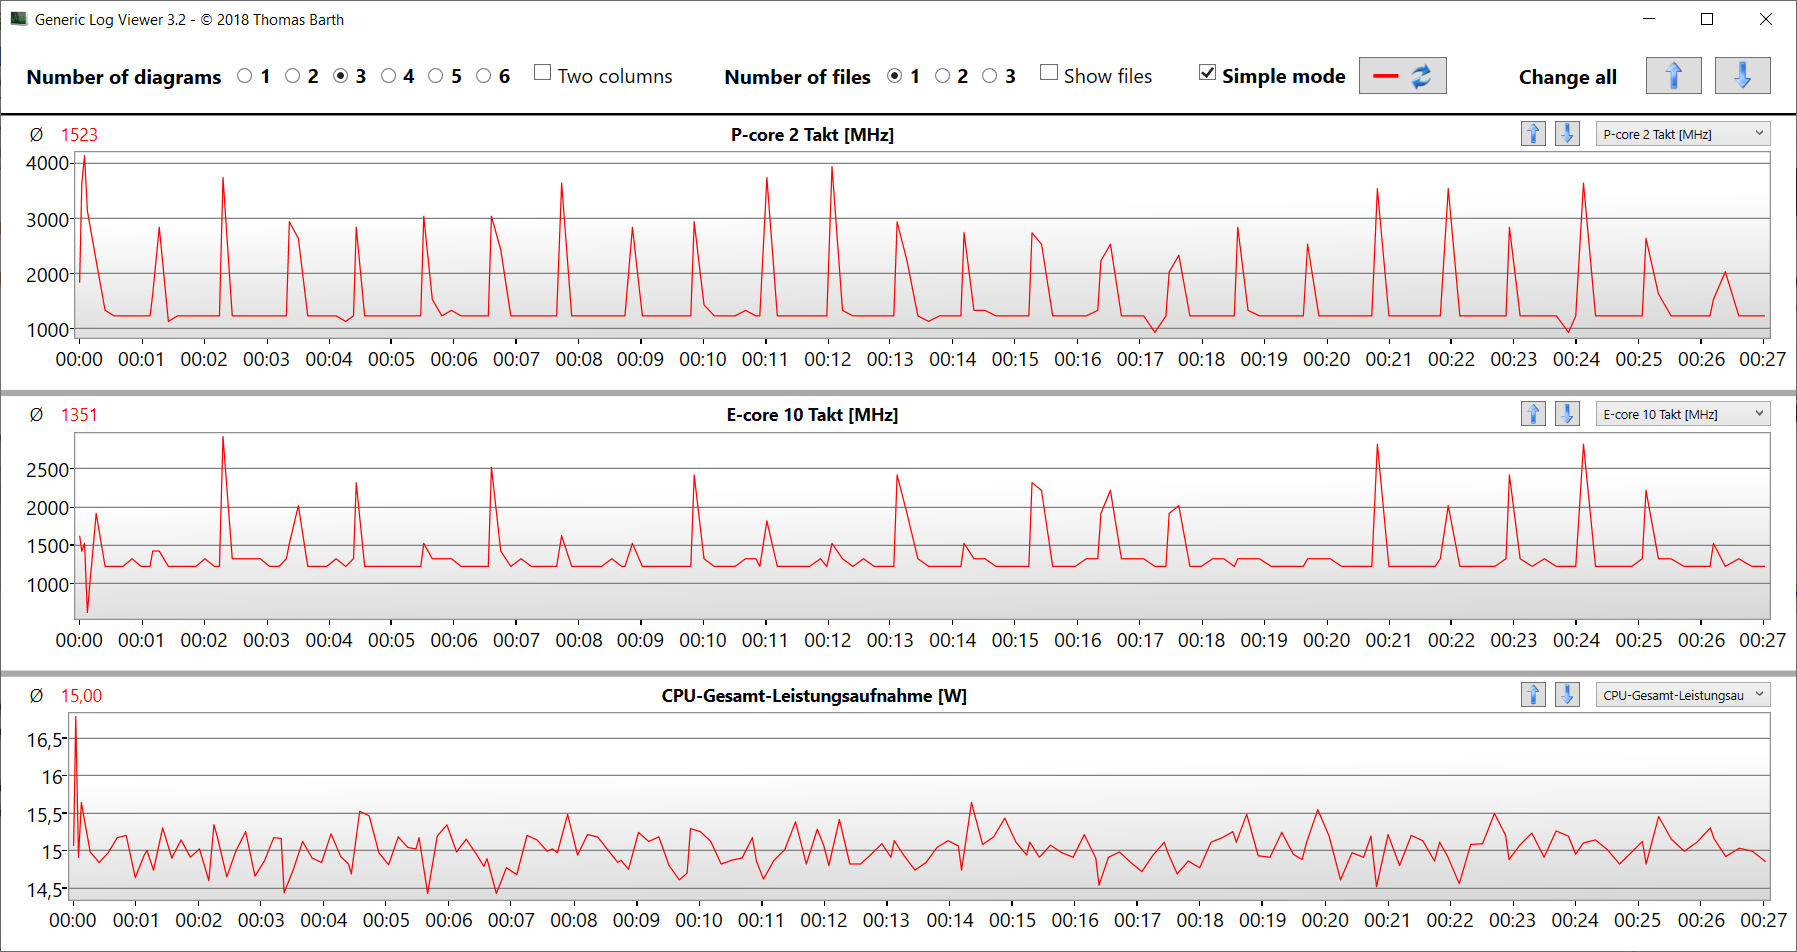
12 CPU çekirdeği üzerinde Core i5-12500H (4 P-çekirdek, 8 E-çekirdek) 4,5 GHz (P) ve 3,3 GHz (E) maksimum frekanslara ulaşabilir. Sürekli çoklu iş parçacığı yüklemesi altında (yani bir döngüde CB15), saat hızı ilk ve ikinci çalıştırma arasında biraz düştü ve bundan sonra nispeten sabit bir seviyede kaldı.
Kıyaslama sonuçları, CPU'dan ortalama olarak (fişe takılıyken) gördüklerimizle aynı seviyededir. Pil gücünde, CB15'teki daha alakalı tek iş parçacığı puanı (159 puan), çok iş parçacığı puanından (741 puan) daha küçük bir düşüş gördü.
Cinebench R15 Multi Sustained load
| CPU Performance rating - Percent | |
| Sınıf ortalaması Gaming | |
| Lenovo Legion Slim 5 16APH8 | |
| Intel NUC X15 LAPAC71H | |
| MSI Cyborg 15 A12VF | |
| Asus TUF A15 FA507 | |
| Gigabyte G5 KE | |
| Ortalama Intel Core i5-12500H | |
| Gigabyte G5 KF | |
| Cinebench R23 | |
| Multi Core | |
| Sınıf ortalaması Gaming (10488 - 42661, n=108, son 2 yıl) | |
| Lenovo Legion Slim 5 16APH8 | |
| Intel NUC X15 LAPAC71H | |
| MSI Cyborg 15 A12VF | |
| Asus TUF A15 FA507 | |
| Gigabyte G5 KF | |
| Ortalama Intel Core i5-12500H (11330 - 14686, n=9) | |
| Gigabyte G5 KE | |
| Single Core | |
| Sınıf ortalaması Gaming (1166 - 2415, n=108, son 2 yıl) | |
| Lenovo Legion Slim 5 16APH8 | |
| Intel NUC X15 LAPAC71H | |
| MSI Cyborg 15 A12VF | |
| Gigabyte G5 KF | |
| Ortalama Intel Core i5-12500H (1558 - 1701, n=9) | |
| Gigabyte G5 KE | |
| Asus TUF A15 FA507 | |
| Cinebench R20 | |
| CPU (Multi Core) | |
| Sınıf ortalaması Gaming (4029 - 16433, n=107, son 2 yıl) | |
| Lenovo Legion Slim 5 16APH8 | |
| Intel NUC X15 LAPAC71H | |
| MSI Cyborg 15 A12VF | |
| Asus TUF A15 FA507 | |
| Gigabyte G5 KF | |
| Ortalama Intel Core i5-12500H (4687 - 5640, n=9) | |
| Gigabyte G5 KE | |
| CPU (Single Core) | |
| Sınıf ortalaması Gaming (442 - 913, n=107, son 2 yıl) | |
| Lenovo Legion Slim 5 16APH8 | |
| Intel NUC X15 LAPAC71H | |
| MSI Cyborg 15 A12VF | |
| Gigabyte G5 KF | |
| Ortalama Intel Core i5-12500H (602 - 656, n=9) | |
| Gigabyte G5 KE | |
| Asus TUF A15 FA507 | |
| Cinebench R15 | |
| CPU Multi 64Bit | |
| Sınıf ortalaması Gaming (1578 - 6330, n=106, son 2 yıl) | |
| Lenovo Legion Slim 5 16APH8 | |
| Intel NUC X15 LAPAC71H | |
| Asus TUF A15 FA507 | |
| MSI Cyborg 15 A12VF | |
| Ortalama Intel Core i5-12500H (1970 - 2283, n=10) | |
| Gigabyte G5 KE | |
| Gigabyte G5 KF | |
| CPU Single 64Bit | |
| Sınıf ortalaması Gaming (188.8 - 350, n=107, son 2 yıl) | |
| Lenovo Legion Slim 5 16APH8 | |
| Intel NUC X15 LAPAC71H | |
| Asus TUF A15 FA507 | |
| Gigabyte G5 KE | |
| MSI Cyborg 15 A12VF | |
| Ortalama Intel Core i5-12500H (220 - 250, n=9) | |
| Gigabyte G5 KF | |
| Blender - v2.79 BMW27 CPU | |
| Gigabyte G5 KF | |
| MSI Cyborg 15 A12VF | |
| Ortalama Intel Core i5-12500H (223 - 288, n=9) | |
| Intel NUC X15 LAPAC71H | |
| Gigabyte G5 KE | |
| Asus TUF A15 FA507 | |
| Lenovo Legion Slim 5 16APH8 | |
| Sınıf ortalaması Gaming (79 - 330, n=105, son 2 yıl) | |
| 7-Zip 18.03 | |
| 7z b 4 | |
| Sınıf ortalaması Gaming (33491 - 148086, n=106, son 2 yıl) | |
| Lenovo Legion Slim 5 16APH8 | |
| Intel NUC X15 LAPAC71H | |
| Asus TUF A15 FA507 | |
| MSI Cyborg 15 A12VF | |
| Gigabyte G5 KE | |
| Ortalama Intel Core i5-12500H (44105 - 54380, n=9) | |
| Gigabyte G5 KF | |
| 7z b 4 -mmt1 | |
| Lenovo Legion Slim 5 16APH8 | |
| Sınıf ortalaması Gaming (4199 - 7436, n=106, son 2 yıl) | |
| Intel NUC X15 LAPAC71H | |
| Asus TUF A15 FA507 | |
| MSI Cyborg 15 A12VF | |
| Gigabyte G5 KE | |
| Ortalama Intel Core i5-12500H (5151 - 5563, n=9) | |
| Gigabyte G5 KF | |
| Geekbench 5.5 | |
| Multi-Core | |
| Sınıf ortalaması Gaming (6460 - 28263, n=106, son 2 yıl) | |
| Intel NUC X15 LAPAC71H | |
| Lenovo Legion Slim 5 16APH8 | |
| MSI Cyborg 15 A12VF | |
| Gigabyte G5 KE | |
| Ortalama Intel Core i5-12500H (7962 - 10828, n=9) | |
| Asus TUF A15 FA507 | |
| Gigabyte G5 KF | |
| Single-Core | |
| Sınıf ortalaması Gaming (986 - 2474, n=106, son 2 yıl) | |
| Lenovo Legion Slim 5 16APH8 | |
| MSI Cyborg 15 A12VF | |
| Intel NUC X15 LAPAC71H | |
| Gigabyte G5 KE | |
| Ortalama Intel Core i5-12500H (1471 - 1693, n=9) | |
| Gigabyte G5 KF | |
| Asus TUF A15 FA507 | |
| HWBOT x265 Benchmark v2.2 - 4k Preset | |
| Sınıf ortalaması Gaming (11.5 - 44.4, n=106, son 2 yıl) | |
| Lenovo Legion Slim 5 16APH8 | |
| Asus TUF A15 FA507 | |
| Intel NUC X15 LAPAC71H | |
| Gigabyte G5 KE | |
| MSI Cyborg 15 A12VF | |
| MSI Cyborg 15 A12VF | |
| Ortalama Intel Core i5-12500H (12 - 16.6, n=9) | |
| Gigabyte G5 KF | |
| LibreOffice - 20 Documents To PDF | |
| Gigabyte G5 KE | |
| Asus TUF A15 FA507 | |
| Gigabyte G5 KF | |
| Sınıf ortalaması Gaming (33.2 - 88.8, n=106, son 2 yıl) | |
| Ortalama Intel Core i5-12500H (40.1 - 58.5, n=9) | |
| MSI Cyborg 15 A12VF | |
| Lenovo Legion Slim 5 16APH8 | |
| Intel NUC X15 LAPAC71H | |
| R Benchmark 2.5 - Overall mean | |
| Gigabyte G5 KF | |
| Ortalama Intel Core i5-12500H (0.4748 - 0.535, n=9) | |
| Asus TUF A15 FA507 | |
| Gigabyte G5 KE | |
| MSI Cyborg 15 A12VF | |
| Intel NUC X15 LAPAC71H | |
| Lenovo Legion Slim 5 16APH8 | |
| Sınıf ortalaması Gaming (0.3439 - 0.759, n=107, son 2 yıl) | |
* ... daha küçük daha iyidir
AIDA64: FP32 Ray-Trace | FPU Julia | CPU SHA3 | CPU Queen | FPU SinJulia | FPU Mandel | CPU AES | CPU ZLib | FP64 Ray-Trace | CPU PhotoWorxx
| Performance rating | |
| Sınıf ortalaması Gaming | |
| Lenovo Legion Slim 5 16APH8 | |
| Asus TUF A15 FA507 | |
| Intel NUC X15 LAPAC71H | |
| Gigabyte G5 KE | |
| MSI Cyborg 15 A12VF | |
| Gigabyte G5 KF | |
| Ortalama Intel Core i5-12500H | |
| AIDA64 / FP32 Ray-Trace | |
| Sınıf ortalaması Gaming (10227 - 85542, n=106, son 2 yıl) | |
| Lenovo Legion Slim 5 16APH8 | |
| Asus TUF A15 FA507 | |
| Intel NUC X15 LAPAC71H | |
| MSI Cyborg 15 A12VF | |
| Gigabyte G5 KE | |
| Ortalama Intel Core i5-12500H (6851 - 13947, n=9) | |
| Gigabyte G5 KF | |
| AIDA64 / FPU Julia | |
| Sınıf ortalaması Gaming (51376 - 372155, n=106, son 2 yıl) | |
| Lenovo Legion Slim 5 16APH8 | |
| Asus TUF A15 FA507 | |
| MSI Cyborg 15 A12VF | |
| Gigabyte G5 KE | |
| Intel NUC X15 LAPAC71H | |
| Gigabyte G5 KF | |
| Ortalama Intel Core i5-12500H (29874 - 68178, n=9) | |
| AIDA64 / CPU SHA3 | |
| Sınıf ortalaması Gaming (2180 - 10115, n=106, son 2 yıl) | |
| Lenovo Legion Slim 5 16APH8 | |
| Asus TUF A15 FA507 | |
| Gigabyte G5 KE | |
| Intel NUC X15 LAPAC71H | |
| MSI Cyborg 15 A12VF | |
| Gigabyte G5 KF | |
| Ortalama Intel Core i5-12500H (2287 - 3337, n=9) | |
| AIDA64 / CPU Queen | |
| Lenovo Legion Slim 5 16APH8 | |
| Sınıf ortalaması Gaming (49785 - 173351, n=90, son 2 yıl) | |
| Asus TUF A15 FA507 | |
| Intel NUC X15 LAPAC71H | |
| MSI Cyborg 15 A12VF | |
| Gigabyte G5 KE | |
| Gigabyte G5 KF | |
| Ortalama Intel Core i5-12500H (77935 - 80703, n=9) | |
| AIDA64 / FPU SinJulia | |
| Lenovo Legion Slim 5 16APH8 | |
| Sınıf ortalaması Gaming (4424 - 33636, n=106, son 2 yıl) | |
| Asus TUF A15 FA507 | |
| MSI Cyborg 15 A12VF | |
| Intel NUC X15 LAPAC71H | |
| Gigabyte G5 KE | |
| Gigabyte G5 KF | |
| Ortalama Intel Core i5-12500H (6590 - 7431, n=9) | |
| AIDA64 / FPU Mandel | |
| Sınıf ortalaması Gaming (25115 - 196829, n=106, son 2 yıl) | |
| Lenovo Legion Slim 5 16APH8 | |
| Asus TUF A15 FA507 | |
| Gigabyte G5 KE | |
| Intel NUC X15 LAPAC71H | |
| MSI Cyborg 15 A12VF | |
| Ortalama Intel Core i5-12500H (18252 - 34041, n=9) | |
| Gigabyte G5 KF | |
| AIDA64 / CPU AES | |
| Intel NUC X15 LAPAC71H | |
| Gigabyte G5 KE | |
| Sınıf ortalaması Gaming (39258 - 247074, n=106, son 2 yıl) | |
| Gigabyte G5 KF | |
| Ortalama Intel Core i5-12500H (50298 - 111567, n=9) | |
| Lenovo Legion Slim 5 16APH8 | |
| Asus TUF A15 FA507 | |
| MSI Cyborg 15 A12VF | |
| AIDA64 / CPU ZLib | |
| Sınıf ortalaması Gaming (574 - 2531, n=106, son 2 yıl) | |
| Lenovo Legion Slim 5 16APH8 | |
| Gigabyte G5 KE | |
| MSI Cyborg 15 A12VF | |
| Ortalama Intel Core i5-12500H (746 - 924, n=9) | |
| Gigabyte G5 KF | |
| Intel NUC X15 LAPAC71H | |
| Asus TUF A15 FA507 | |
| AIDA64 / FP64 Ray-Trace | |
| Sınıf ortalaması Gaming (5509 - 45446, n=106, son 2 yıl) | |
| Lenovo Legion Slim 5 16APH8 | |
| Asus TUF A15 FA507 | |
| Gigabyte G5 KE | |
| Intel NUC X15 LAPAC71H | |
| MSI Cyborg 15 A12VF | |
| Ortalama Intel Core i5-12500H (3848 - 7405, n=9) | |
| Gigabyte G5 KF | |
| AIDA64 / CPU PhotoWorxx | |
| Sınıf ortalaması Gaming (12271 - 89891, n=106, son 2 yıl) | |
| Intel NUC X15 LAPAC71H | |
| MSI Cyborg 15 A12VF | |
| Lenovo Legion Slim 5 16APH8 | |
| Ortalama Intel Core i5-12500H (13686 - 43813, n=9) | |
| Gigabyte G5 KE | |
| Asus TUF A15 FA507 | |
| Gigabyte G5 KF | |
Sistem performansı
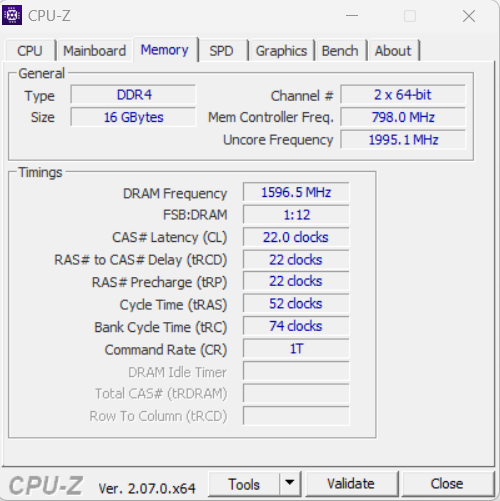
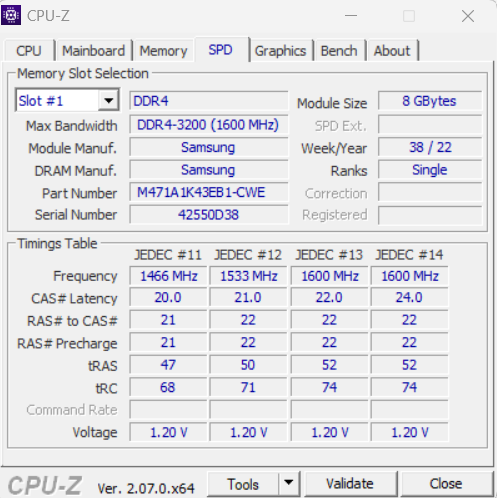
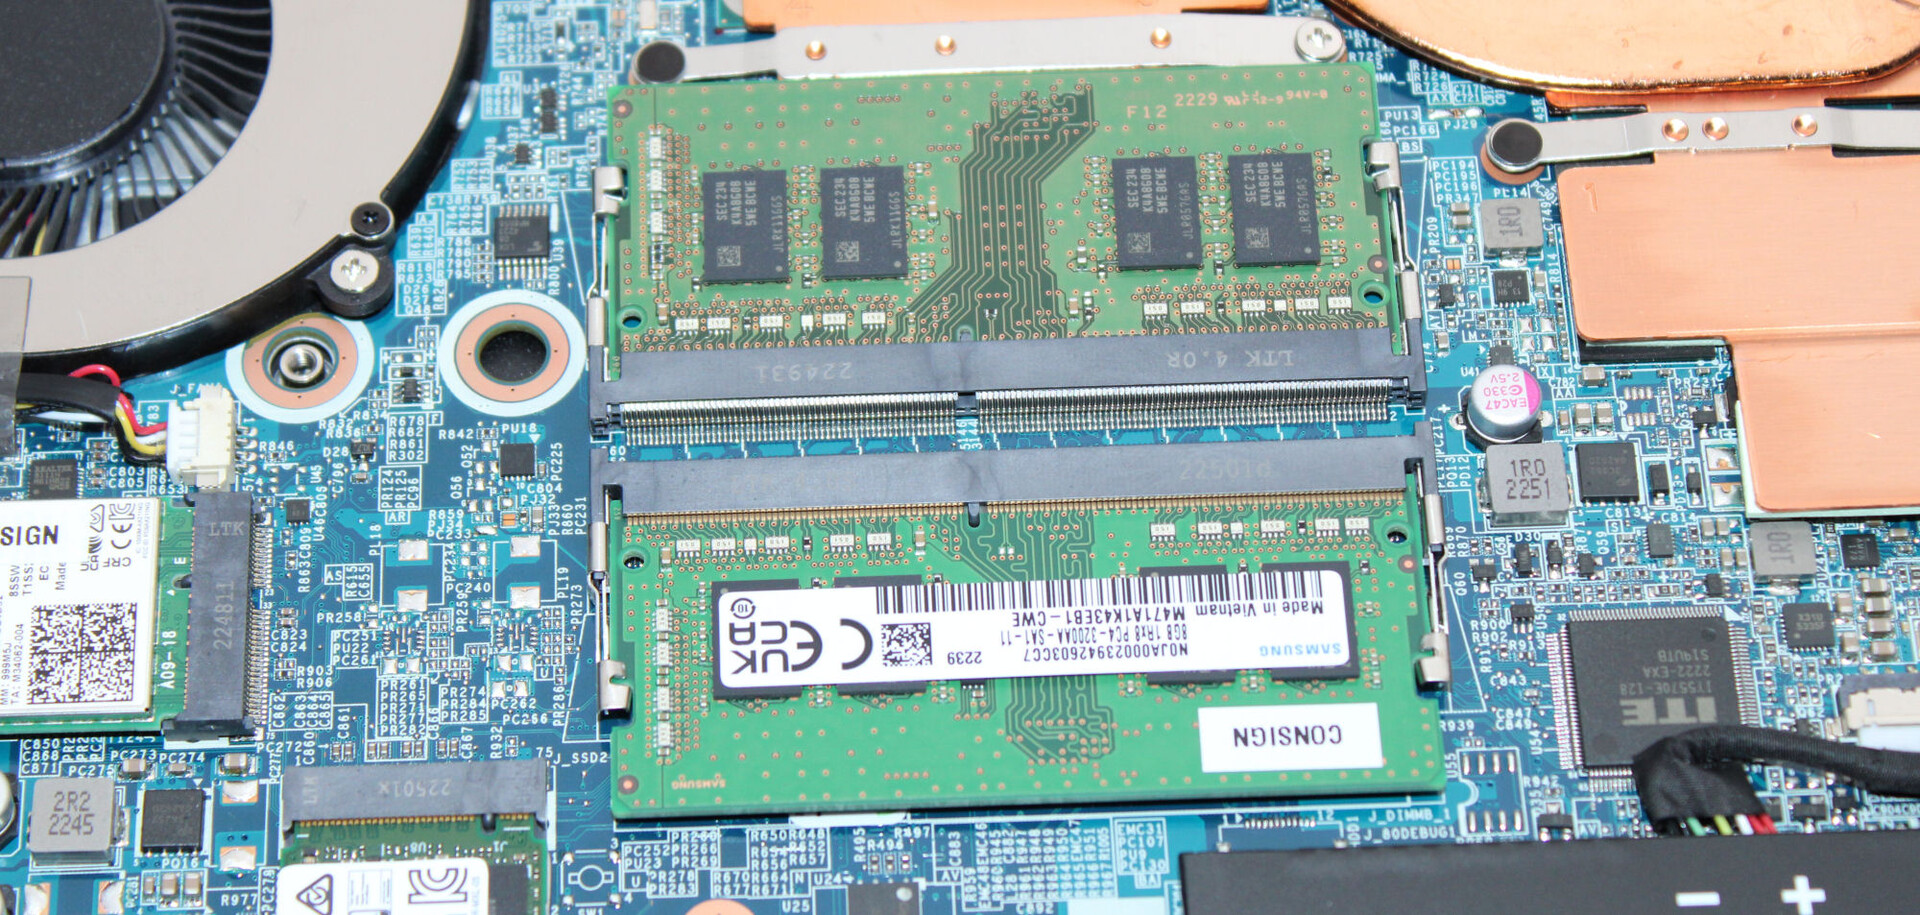
Sistem sorunsuz çalışıyor ve render ve oyun gibi zorlu uygulamaların üstesinden gelmek için yeterli güce sahip. Belleğin aktarım hızları DDR4-3200 RAM için oldukça tipik.
CrossMark: Overall | Productivity | Creativity | Responsiveness
| PCMark 10 / Score | |
| Sınıf ortalaması Gaming (5828 - 12414, n=94, son 2 yıl) | |
| Lenovo Legion Slim 5 16APH8 | |
| Asus TUF A15 FA507 | |
| Gigabyte G5 KE | |
| MSI Cyborg 15 A12VF | |
| Intel NUC X15 LAPAC71H | |
| Gigabyte G5 KF | |
| Ortalama Intel Core i5-12500H, NVIDIA GeForce RTX 4060 Laptop GPU (n=1) | |
| PCMark 10 / Essentials | |
| Lenovo Legion Slim 5 16APH8 | |
| Gigabyte G5 KE | |
| MSI Cyborg 15 A12VF | |
| Sınıf ortalaması Gaming (8810 - 11935, n=98, son 2 yıl) | |
| Asus TUF A15 FA507 | |
| Intel NUC X15 LAPAC71H | |
| Gigabyte G5 KF | |
| Ortalama Intel Core i5-12500H, NVIDIA GeForce RTX 4060 Laptop GPU (n=1) | |
| PCMark 10 / Productivity | |
| Sınıf ortalaması Gaming (6845 - 25323, n=96, son 2 yıl) | |
| Lenovo Legion Slim 5 16APH8 | |
| MSI Cyborg 15 A12VF | |
| Gigabyte G5 KF | |
| Ortalama Intel Core i5-12500H, NVIDIA GeForce RTX 4060 Laptop GPU (n=1) | |
| Gigabyte G5 KE | |
| Asus TUF A15 FA507 | |
| Intel NUC X15 LAPAC71H | |
| PCMark 10 / Digital Content Creation | |
| Sınıf ortalaması Gaming (7602 - 19954, n=96, son 2 yıl) | |
| Lenovo Legion Slim 5 16APH8 | |
| Intel NUC X15 LAPAC71H | |
| Asus TUF A15 FA507 | |
| Gigabyte G5 KE | |
| MSI Cyborg 15 A12VF | |
| Gigabyte G5 KF | |
| Ortalama Intel Core i5-12500H, NVIDIA GeForce RTX 4060 Laptop GPU (n=1) | |
| CrossMark / Overall | |
| Sınıf ortalaması Gaming (1366 - 2409, n=95, son 2 yıl) | |
| Intel NUC X15 LAPAC71H | |
| Lenovo Legion Slim 5 16APH8 | |
| MSI Cyborg 15 A12VF | |
| Gigabyte G5 KE | |
| Gigabyte G5 KF | |
| Ortalama Intel Core i5-12500H, NVIDIA GeForce RTX 4060 Laptop GPU (n=1) | |
| Asus TUF A15 FA507 | |
| CrossMark / Productivity | |
| Sınıf ortalaması Gaming (1386 - 2254, n=95, son 2 yıl) | |
| Intel NUC X15 LAPAC71H | |
| Lenovo Legion Slim 5 16APH8 | |
| Gigabyte G5 KE | |
| MSI Cyborg 15 A12VF | |
| Gigabyte G5 KF | |
| Ortalama Intel Core i5-12500H, NVIDIA GeForce RTX 4060 Laptop GPU (n=1) | |
| Asus TUF A15 FA507 | |
| CrossMark / Creativity | |
| Sınıf ortalaması Gaming (1343 - 2786, n=95, son 2 yıl) | |
| Lenovo Legion Slim 5 16APH8 | |
| Intel NUC X15 LAPAC71H | |
| MSI Cyborg 15 A12VF | |
| Gigabyte G5 KE | |
| Gigabyte G5 KF | |
| Ortalama Intel Core i5-12500H, NVIDIA GeForce RTX 4060 Laptop GPU (n=1) | |
| Asus TUF A15 FA507 | |
| CrossMark / Responsiveness | |
| Intel NUC X15 LAPAC71H | |
| Gigabyte G5 KF | |
| Ortalama Intel Core i5-12500H, NVIDIA GeForce RTX 4060 Laptop GPU (n=1) | |
| Gigabyte G5 KE | |
| Sınıf ortalaması Gaming (1226 - 2334, n=95, son 2 yıl) | |
| MSI Cyborg 15 A12VF | |
| Lenovo Legion Slim 5 16APH8 | |
| Asus TUF A15 FA507 | |
| PCMark 10 Score | 6318 puan | |
Yardım | ||
| AIDA64 / Memory Copy | |
| Sınıf ortalaması Gaming (21750 - 129946, n=106, son 2 yıl) | |
| Intel NUC X15 LAPAC71H | |
| Lenovo Legion Slim 5 16APH8 | |
| MSI Cyborg 15 A12VF | |
| Asus TUF A15 FA507 | |
| Ortalama Intel Core i5-12500H (23850 - 66598, n=9) | |
| Gigabyte G5 KE | |
| Gigabyte G5 KF | |
| AIDA64 / Memory Read | |
| Sınıf ortalaması Gaming (22956 - 118858, n=106, son 2 yıl) | |
| Intel NUC X15 LAPAC71H | |
| MSI Cyborg 15 A12VF | |
| Lenovo Legion Slim 5 16APH8 | |
| Ortalama Intel Core i5-12500H (24879 - 68013, n=9) | |
| Asus TUF A15 FA507 | |
| Gigabyte G5 KE | |
| Gigabyte G5 KF | |
| AIDA64 / Memory Write | |
| Lenovo Legion Slim 5 16APH8 | |
| Sınıf ortalaması Gaming (22297 - 135096, n=106, son 2 yıl) | |
| Intel NUC X15 LAPAC71H | |
| MSI Cyborg 15 A12VF | |
| Asus TUF A15 FA507 | |
| Ortalama Intel Core i5-12500H (23543 - 58797, n=9) | |
| Gigabyte G5 KE | |
| Gigabyte G5 KF | |
| AIDA64 / Memory Latency | |
| Sınıf ortalaması Gaming (75.3 - 259, n=106, son 2 yıl) | |
| Ortalama Intel Core i5-12500H (83.8 - 114.7, n=9) | |
| Gigabyte G5 KE | |
| Lenovo Legion Slim 5 16APH8 | |
| MSI Cyborg 15 A12VF | |
| Intel NUC X15 LAPAC71H | |
| Gigabyte G5 KF | |
| Asus TUF A15 FA507 | |
* ... daha küçük daha iyidir
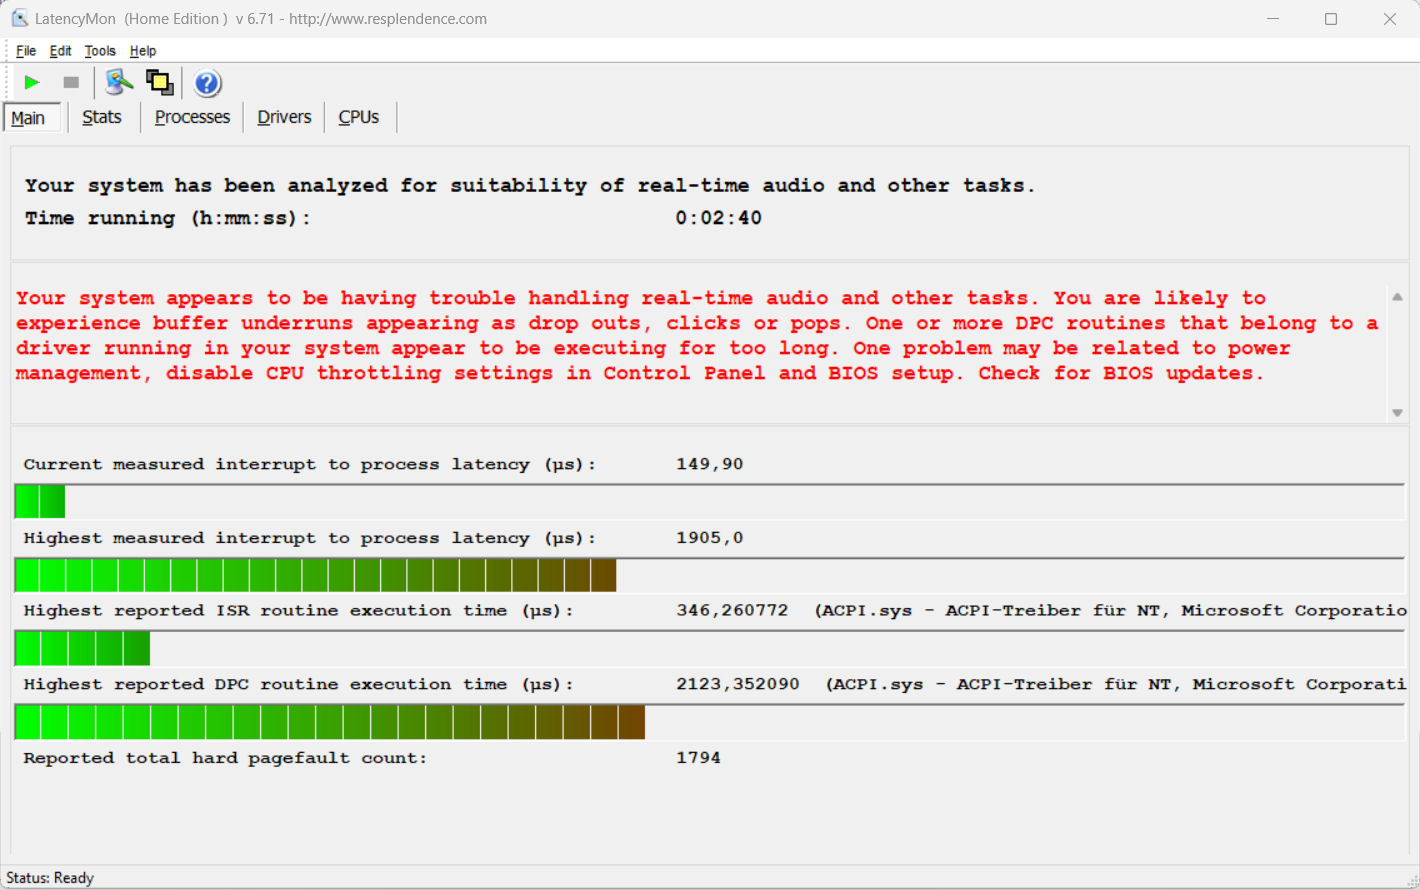
DPC gecikme süresi
Standartlaştırılmış gecikme monitör testimiz (web'de gezinme, 4K video oynatma ve Prime95 yüksek yük) bazı sorunları ortaya çıkardı. Sistem gerçek zamanlı video ve ses işleme için uygun görünmüyor. Umarım bu durum gelecekteki yazılım güncellemeleriyle iyileştirilebilir.
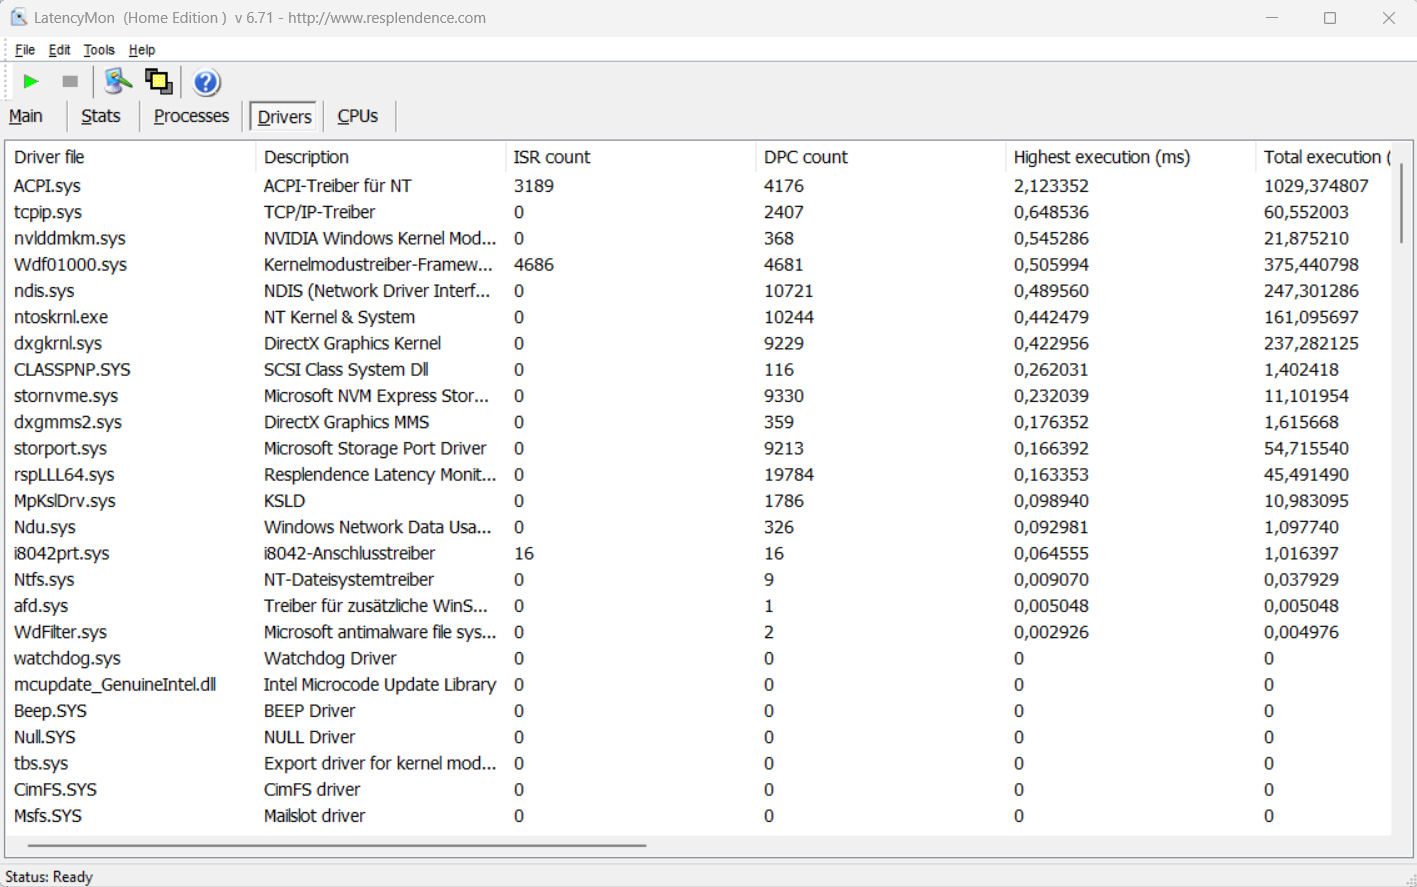
| DPC Latencies / LatencyMon - interrupt to process latency (max), Web, Youtube, Prime95 | |
| Gigabyte G5 KF | |
| MSI Cyborg 15 A12VF | |
| Lenovo Legion Slim 5 16APH8 | |
| Gigabyte G5 KE | |
| Intel NUC X15 LAPAC71H | |
* ... daha küçük daha iyidir
Yığın depolama
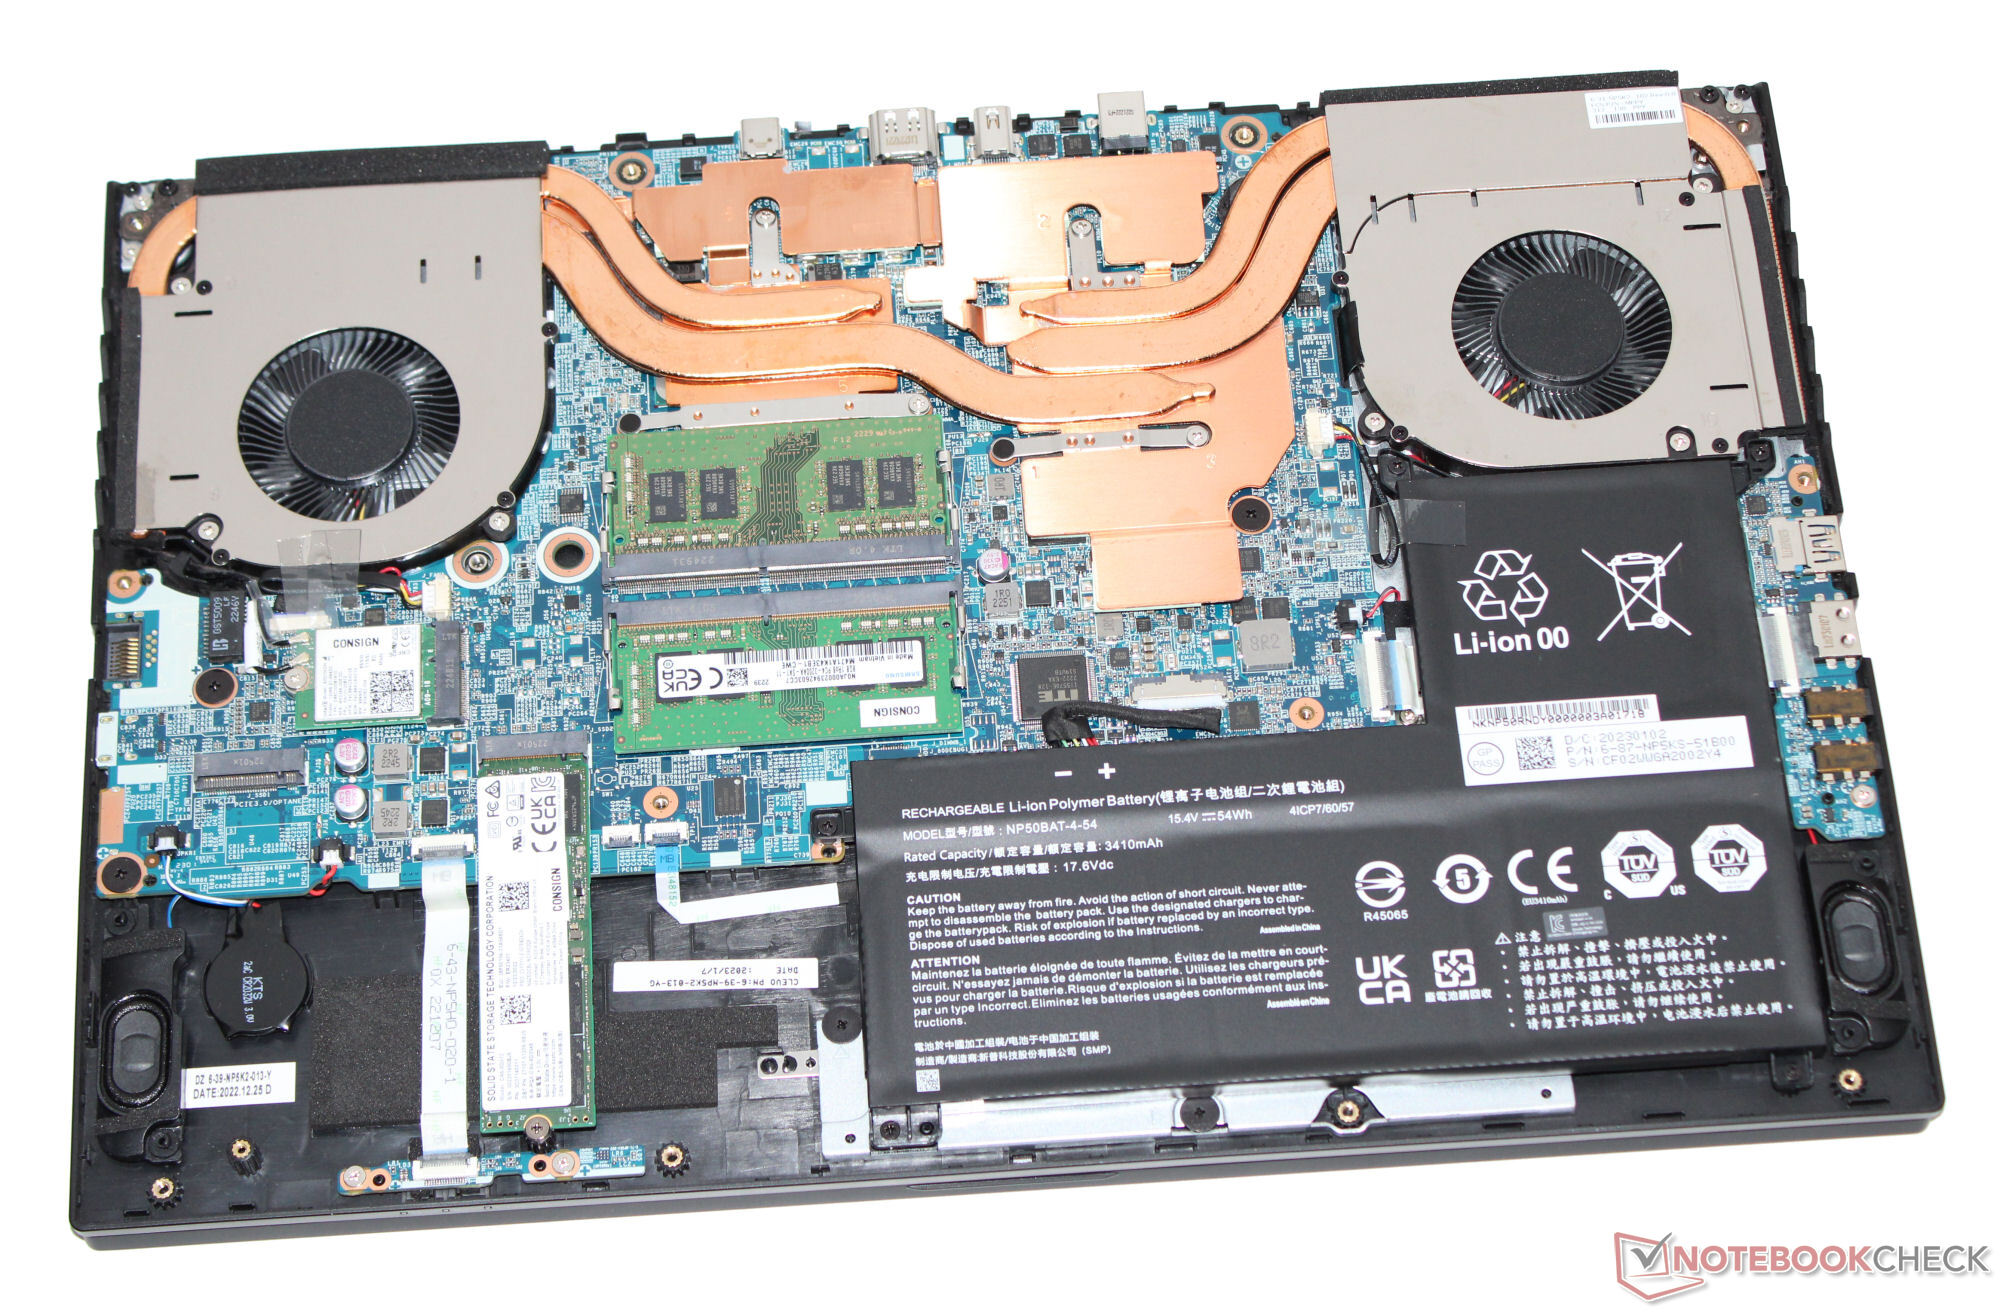
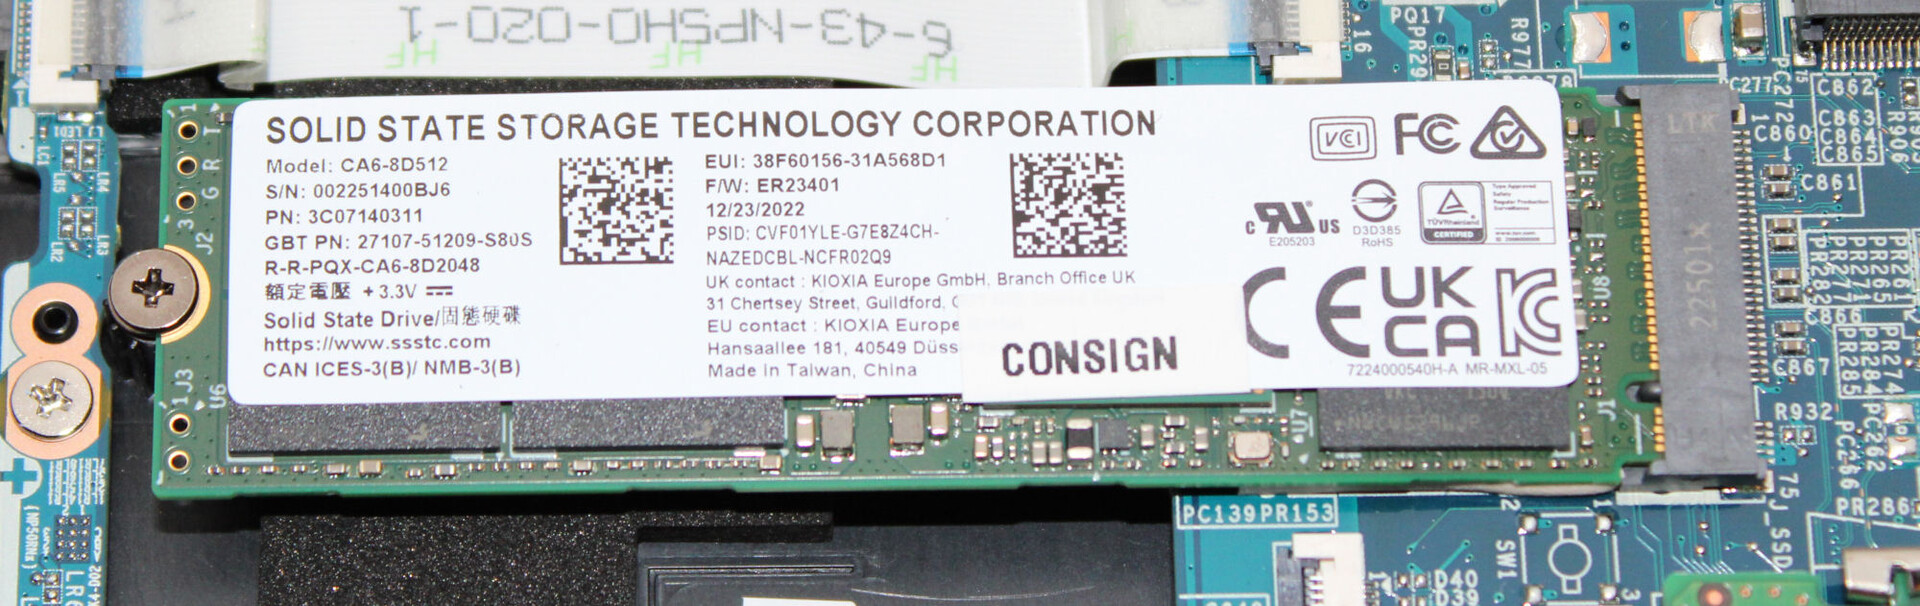
Gigabyte, G5'i SSSTC'nin 512 GB SSD'si (PCIe 4.0, M2. 2280) ile donatmıştır ve bu SSD harika veri aktarım hızları sunmaktadır. Bununla birlikte, termal daralmanın neden olduğu performans düşüşlerine eğilimlidir. Dizüstü bilgisayar ayrıca ikinci bir M.2 2280 SSD'yi barındırmak için bir PCIe 3.0 yuvasına sahiptir.

| Drive Performance rating - Percent | |
| Intel NUC X15 LAPAC71H | |
| Gigabyte G5 KF | |
| Ortalama SSSTC CA6-8D512 | |
| Sınıf ortalaması Gaming | |
| Lenovo Legion Slim 5 16APH8 | |
| Gigabyte G5 KE | |
| MSI Cyborg 15 A12VF | |
| Asus TUF A15 FA507 | |
* ... daha küçük daha iyidir
Dauerleistung Lesen: DiskSpd Read Loop, Queue Depth 8
Grafik kartı
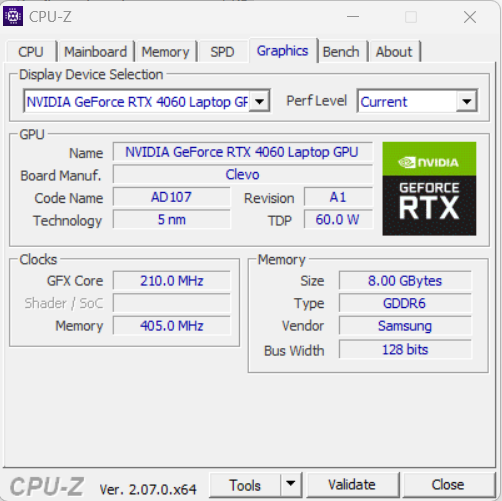
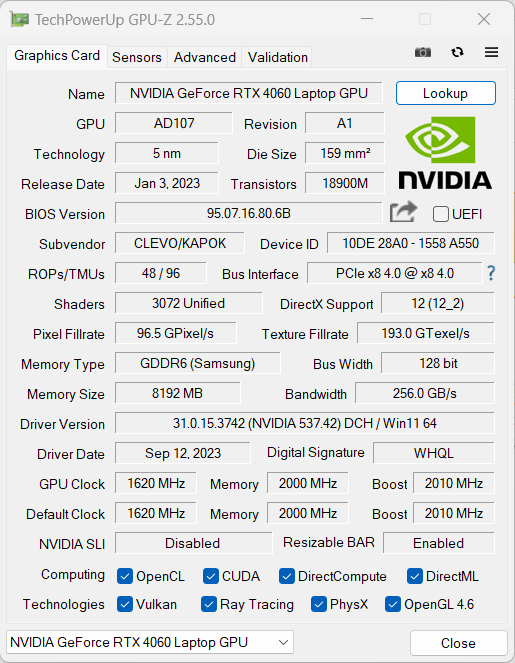
Bu GeForce RTX 4060 3.072 gölgeleme birimi, 128 bit bellek veri yolu ve 8.192 MB hızlı GDDR6 video belleğine sahiptir. Gigabyte, ortalama aralığın alt ucunda yer alan 75 W'lık bir maksimum TGP belirlemiştir. TGP, Witcher 3 testimiz sırasında tamamen kullanıldı.
Karşılaştırma sonuçları, RTX 4060'tan şimdiye kadar gördüklerimizin ortalaması içinde yer alıyor. Daha düşük TGP'sine rağmen, RTX 4060 aşağıdakilerden daha iyi performans gösteriyor RTX 3060 içinde G5 KE. Bunun nedeni Ada Lovelace mimarisinin daha verimli olmasıdır. G5 KF'de dGPU modu yoktur.


| 3DMark Performance rating - Percent | |
| Sınıf ortalaması Gaming | |
| Ortalama NVIDIA GeForce RTX 4060 Laptop GPU | |
| Gigabyte G5 KF | |
| Gigabyte G5 KE | |
| MSI Cyborg 15 A12VF | |
| Lenovo Legion Slim 5 16APH8 -1! | |
| Asus TUF A15 FA507 -1! | |
| Intel NUC X15 LAPAC71H | |
| 3DMark 11 - 1280x720 Performance GPU | |
| Sınıf ortalaması Gaming (21841 - 80022, n=105, son 2 yıl) | |
| Ortalama NVIDIA GeForce RTX 4060 Laptop GPU (28136 - 38912, n=57) | |
| Gigabyte G5 KF | |
| Lenovo Legion Slim 5 16APH8 | |
| Asus TUF A15 FA507 | |
| Gigabyte G5 KE | |
| MSI Cyborg 15 A12VF | |
| Intel NUC X15 LAPAC71H | |
| 3DMark | |
| 1280x720 Cloud Gate Standard Graphics | |
| Ortalama NVIDIA GeForce RTX 4060 Laptop GPU (81407 - 180228, n=29) | |
| Sınıf ortalaması Gaming (86886 - 223650, n=60, son 2 yıl) | |
| Gigabyte G5 KF | |
| MSI Cyborg 15 A12VF | |
| Gigabyte G5 KE | |
| Intel NUC X15 LAPAC71H | |
| 1920x1080 Fire Strike Graphics | |
| Sınıf ortalaması Gaming (12242 - 62849, n=116, son 2 yıl) | |
| Ortalama NVIDIA GeForce RTX 4060 Laptop GPU (20533 - 29656, n=54) | |
| Gigabyte G5 KF | |
| Lenovo Legion Slim 5 16APH8 | |
| Asus TUF A15 FA507 | |
| Gigabyte G5 KE | |
| MSI Cyborg 15 A12VF | |
| Intel NUC X15 LAPAC71H | |
| 2560x1440 Time Spy Graphics | |
| Sınıf ortalaması Gaming (5012 - 26212, n=116, son 2 yıl) | |
| Ortalama NVIDIA GeForce RTX 4060 Laptop GPU (7484 - 11451, n=56) | |
| Gigabyte G5 KF | |
| Lenovo Legion Slim 5 16APH8 | |
| Asus TUF A15 FA507 | |
| Gigabyte G5 KE | |
| MSI Cyborg 15 A12VF | |
| Intel NUC X15 LAPAC71H | |
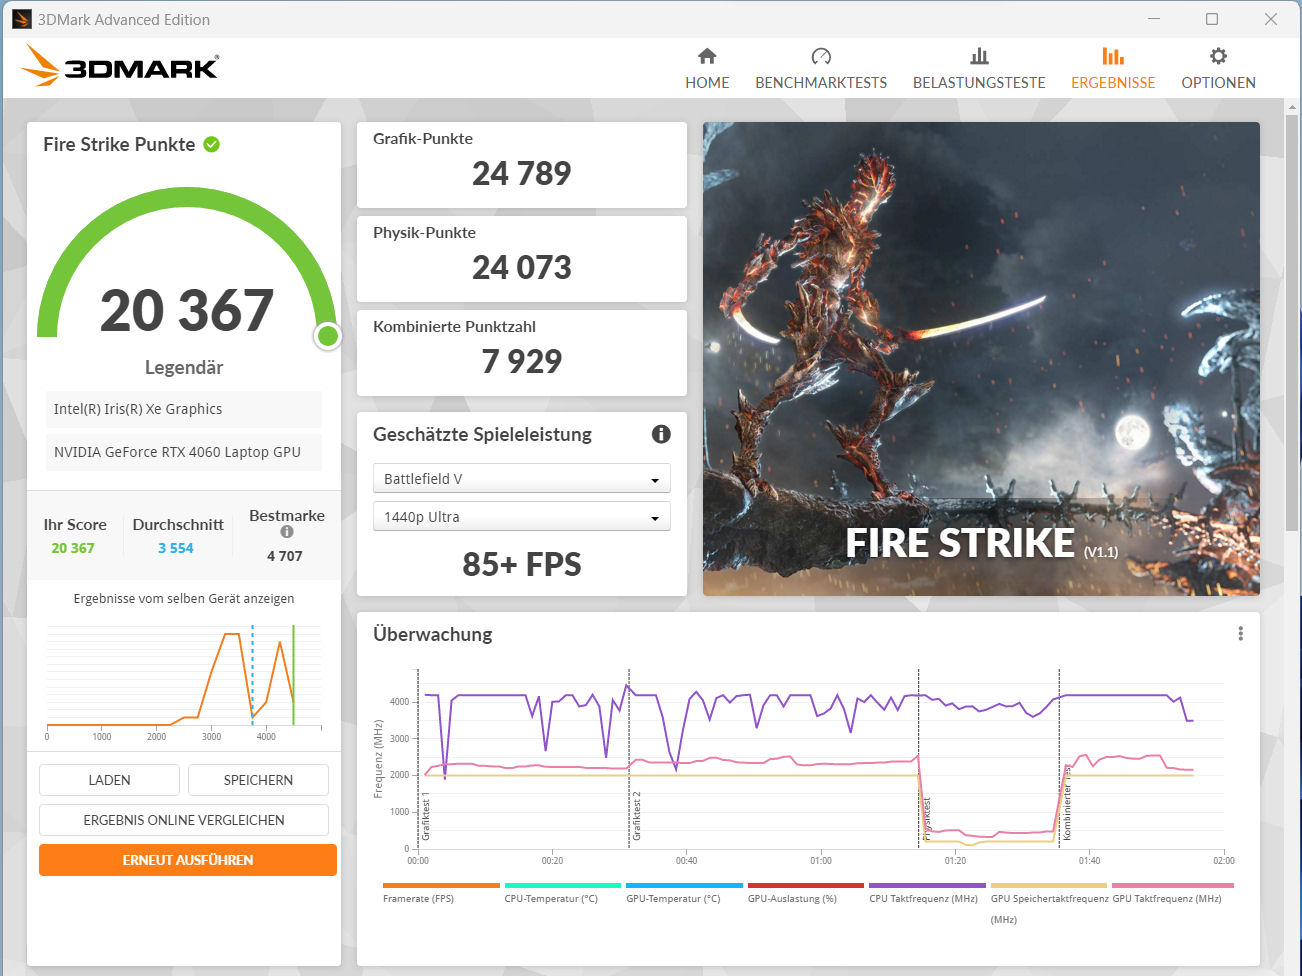
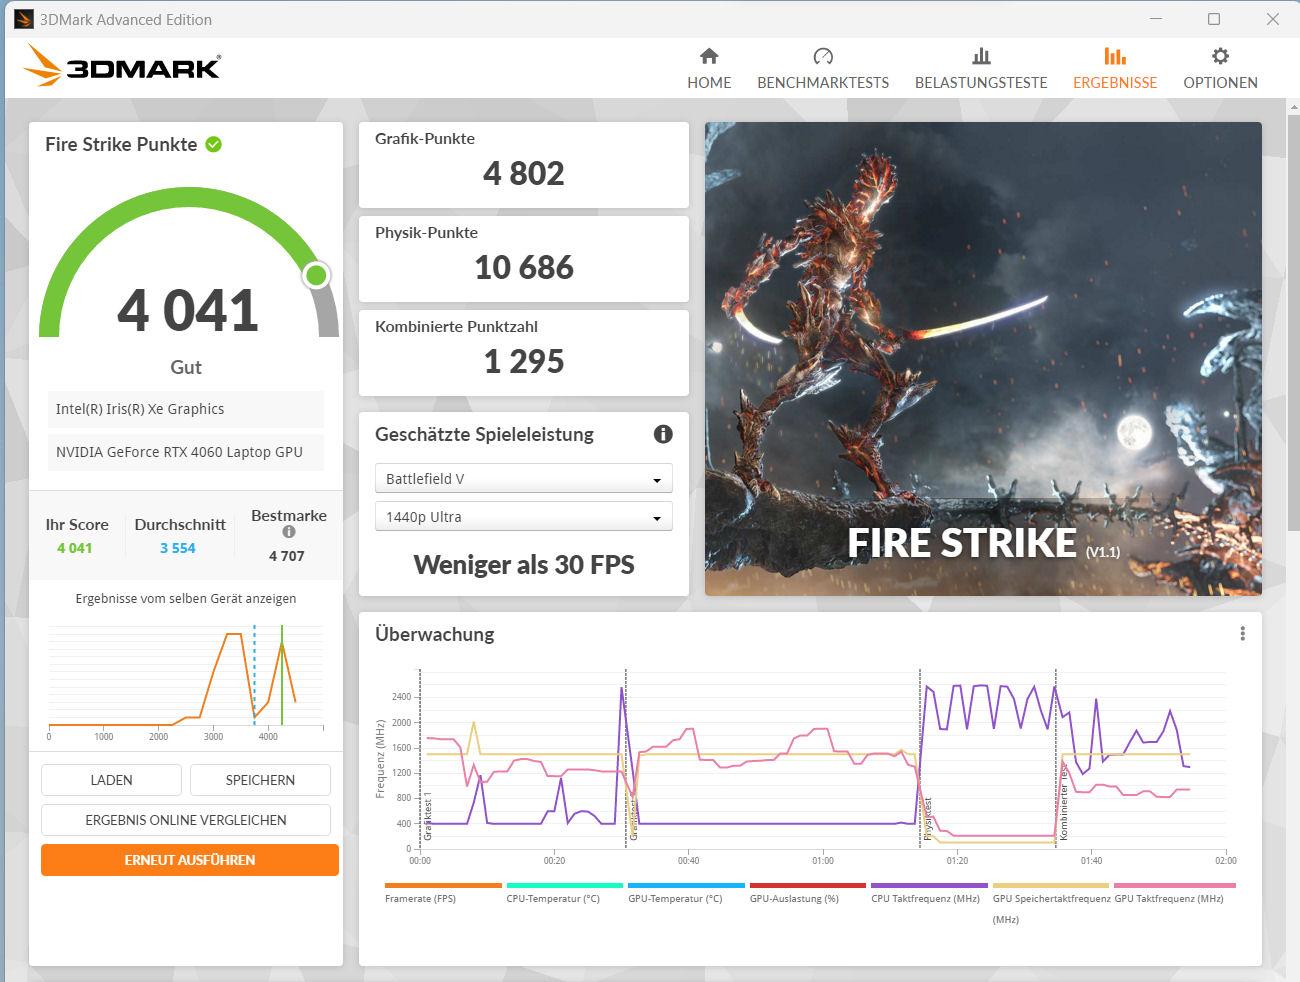
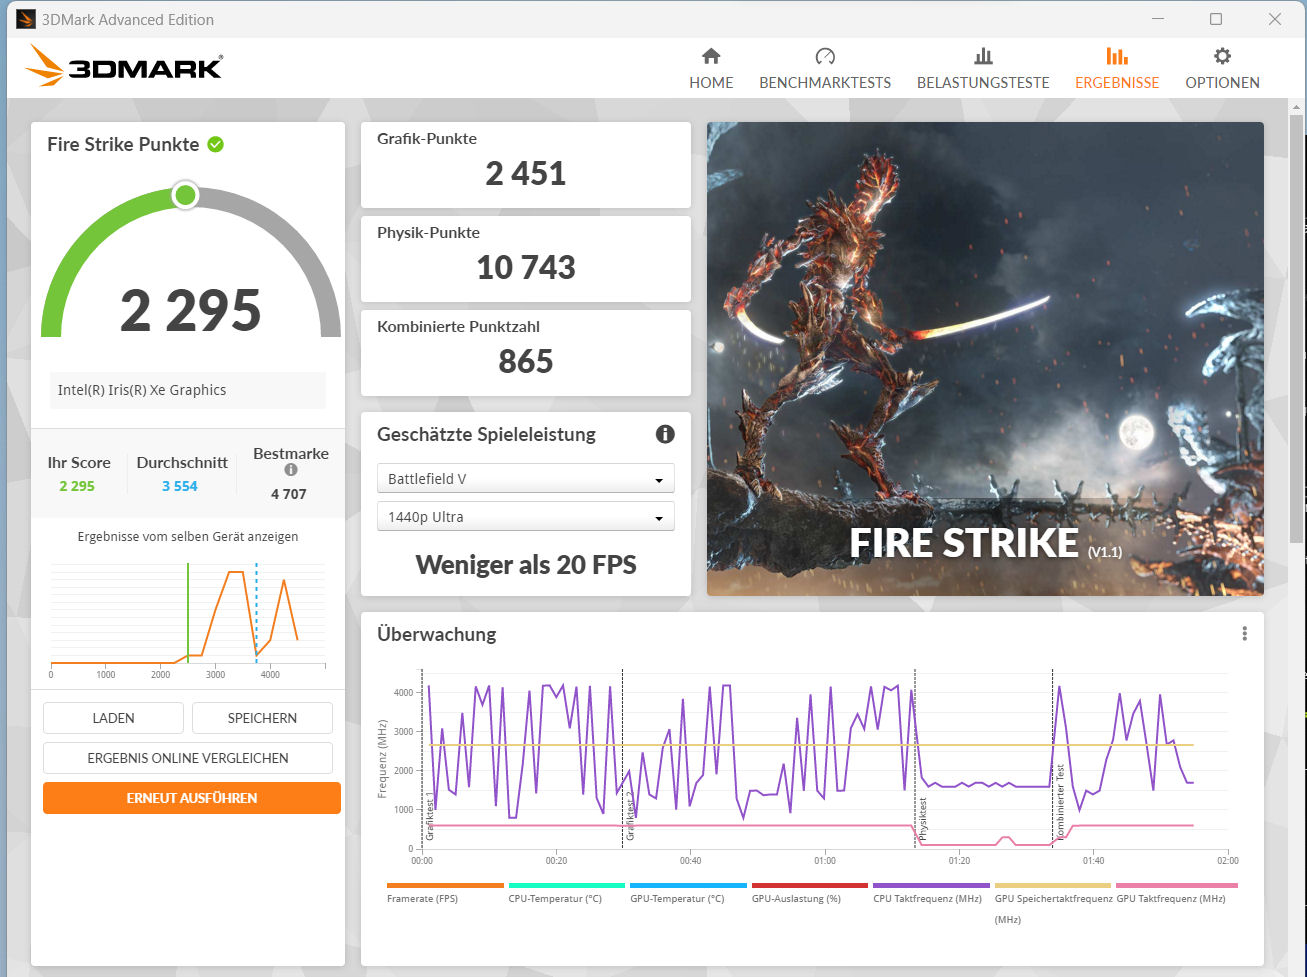
| 3DMark 06 Standard Score | 45111 puan | |
| 3DMark 11 Performance | 28012 puan | |
| 3DMark Cloud Gate Standard Score | 51746 puan | |
| 3DMark Fire Strike Score | 20367 puan | |
| 3DMark Time Spy Score | 9269 puan | |
Yardım | ||
| Blender | |
| v3.3 Classroom OPTIX/RTX | |
| Gigabyte G5 KE | |
| Asus TUF A15 FA507 | |
| Asus TUF A15 FA507 | |
| MSI Cyborg 15 A12VF | |
| Gigabyte G5 KF | |
| Ortalama NVIDIA GeForce RTX 4060 Laptop GPU (19 - 28, n=53) | |
| Lenovo Legion Slim 5 16APH8 | |
| Sınıf ortalaması Gaming (9 - 32, n=107, son 2 yıl) | |
| v3.3 Classroom CUDA | |
| Gigabyte G5 KE | |
| MSI Cyborg 15 A12VF | |
| Asus TUF A15 FA507 | |
| Asus TUF A15 FA507 | |
| Lenovo Legion Slim 5 16APH8 | |
| Ortalama NVIDIA GeForce RTX 4060 Laptop GPU (39 - 53, n=53) | |
| Gigabyte G5 KF | |
| Sınıf ortalaması Gaming (15 - 228, n=107, son 2 yıl) | |
| v3.3 Classroom CPU | |
| Gigabyte G5 KF | |
| MSI Cyborg 15 A12VF | |
| Gigabyte G5 KE | |
| Intel NUC X15 LAPAC71H | |
| Asus TUF A15 FA507 | |
| Asus TUF A15 FA507 | |
| Ortalama NVIDIA GeForce RTX 4060 Laptop GPU (189 - 452, n=53) | |
| Lenovo Legion Slim 5 16APH8 | |
| Sınıf ortalaması Gaming (122 - 565, n=103, son 2 yıl) | |
| V-Ray Benchmark Next 4.10 | |
| GPU | |
| Sınıf ortalaması Gaming (427 - 1627, n=100, son 2 yıl) | |
| Ortalama NVIDIA GeForce RTX 4060 Laptop GPU (483 - 715, n=46) | |
| Gigabyte G5 KF | |
| Asus TUF A15 FA507 | |
| MSI Cyborg 15 A12VF | |
| Gigabyte G5 KE | |
| Intel NUC X15 LAPAC71H | |
| CPU | |
| Sınıf ortalaması Gaming (10048 - 45327, n=98, son 2 yıl) | |
| Ortalama NVIDIA GeForce RTX 4060 Laptop GPU (12680 - 32360, n=46) | |
| Intel NUC X15 LAPAC71H | |
| MSI Cyborg 15 A12VF | |
| Asus TUF A15 FA507 | |
| Gigabyte G5 KE | |
| Gigabyte G5 KF | |
* ... daha küçük daha iyidir
Oyun performansı
Gigabyte dizüstü bilgisayar, oyunları FHD'nin yanı sıra yüksek ila maksimum ayarlarda çalıştırmak için tasarlanmıştır. Dizüstü bilgisayarı destekleyen bir monitöre bağlayarak daha yüksek çözünürlükleri kullanmak mümkündür, ancak bazı ayarları kısmanız gerekebilir. Testlerimizde, kare hızları RTX 4060'ın ortalama olarak yapabileceğinin altındaydı ve kabaca G5 KE'ın performansı.
| Performance rating - Percent | |
| Sınıf ortalaması Gaming | |
| Ortalama NVIDIA GeForce RTX 4060 Laptop GPU | |
| Gigabyte G5 KF | |
| Lenovo Legion Slim 5 16APH8 | |
| Gigabyte G5 KE | |
| MSI Cyborg 15 A12VF | |
| Asus TUF A15 FA507 | |
| Intel NUC X15 LAPAC71H | |
| The Witcher 3 - 1920x1080 Ultra Graphics & Postprocessing (HBAO+) | |
| Sınıf ortalaması Gaming (104.7 - 240, n=7, son 2 yıl) | |
| Ortalama NVIDIA GeForce RTX 4060 Laptop GPU (77 - 159.7, n=42) | |
| Lenovo Legion Slim 5 16APH8 | |
| Gigabyte G5 KF | |
| Gigabyte G5 KE | |
| Asus TUF A15 FA507 | |
| MSI Cyborg 15 A12VF | |
| Intel NUC X15 LAPAC71H | |
| GTA V - 1920x1080 Highest AA:4xMSAA + FX AF:16x | |
| Sınıf ortalaması Gaming (48.3 - 186.9, n=94, son 2 yıl) | |
| Ortalama NVIDIA GeForce RTX 4060 Laptop GPU (76.9 - 126.3, n=48) | |
| Gigabyte G5 KF | |
| Gigabyte G5 KE | |
| Lenovo Legion Slim 5 16APH8 | |
| MSI Cyborg 15 A12VF | |
| Asus TUF A15 FA507 | |
| Intel NUC X15 LAPAC71H | |
| Final Fantasy XV Benchmark - 1920x1080 High Quality | |
| Sınıf ortalaması Gaming (41 - 215, n=95, son 2 yıl) | |
| Ortalama NVIDIA GeForce RTX 4060 Laptop GPU (75.1 - 109.8, n=51) | |
| Lenovo Legion Slim 5 16APH8 | |
| Gigabyte G5 KF | |
| Gigabyte G5 KE | |
| Asus TUF A15 FA507 | |
| MSI Cyborg 15 A12VF | |
| Intel NUC X15 LAPAC71H | |
| Strange Brigade - 1920x1080 ultra AA:ultra AF:16 | |
| Sınıf ortalaması Gaming (76.3 - 458, n=87, son 2 yıl) | |
| Ortalama NVIDIA GeForce RTX 4060 Laptop GPU (135.3 - 210, n=50) | |
| Gigabyte G5 KF | |
| Lenovo Legion Slim 5 16APH8 | |
| Gigabyte G5 KE | |
| Asus TUF A15 FA507 | |
| MSI Cyborg 15 A12VF | |
| Intel NUC X15 LAPAC71H | |
| Dota 2 Reborn - 1920x1080 ultra (3/3) best looking | |
| Sınıf ortalaması Gaming (84.8 - 252, n=108, son 2 yıl) | |
| Ortalama NVIDIA GeForce RTX 4060 Laptop GPU (115 - 183.8, n=53) | |
| Gigabyte G5 KE | |
| Lenovo Legion Slim 5 16APH8 | |
| MSI Cyborg 15 A12VF | |
| Gigabyte G5 KF | |
| Asus TUF A15 FA507 | |
| Intel NUC X15 LAPAC71H | |
| X-Plane 11.11 - 1920x1080 high (fps_test=3) | |
| Ortalama NVIDIA GeForce RTX 4060 Laptop GPU (60.7 - 141.1, n=54) | |
| Sınıf ortalaması Gaming (55.5 - 148.5, n=110, son 2 yıl) | |
| MSI Cyborg 15 A12VF | |
| Gigabyte G5 KF | |
| Gigabyte G5 KE | |
| Lenovo Legion Slim 5 16APH8 | |
| Asus TUF A15 FA507 | |
| Intel NUC X15 LAPAC71H | |
| Starfield - 1920x1080 Ultra Preset | |
| Sınıf ortalaması Gaming (n=1son 2 yıl) | |
| XMG Pro 15 E23 | |
| Ortalama NVIDIA GeForce RTX 4060 Laptop GPU (39.7 - 41, n=3) | |
| Gigabyte G5 KF | |
| Intel NUC X15 LAPAC71H | |
| Lies of P - 1920x1080 Best Preset | |
| XMG Pro 15 E23 | |
| Ortalama NVIDIA GeForce RTX 4060 Laptop GPU (106.2 - 126.6, n=3) | |
| Gigabyte G5 KF | |
| Intel NUC X15 LAPAC71H | |
| EA Sports FC 24 - 1920x1080 Ultra Preset | |
| Gigabyte G5 KF | |
| XMG Pro 15 E23 | |
| Ortalama NVIDIA GeForce RTX 4060 Laptop GPU (136.9 - 138, n=3) | |
| Intel NUC X15 LAPAC71H | |
| Sınıf ortalaması Gaming (n=1son 2 yıl) | |
| Assassin's Creed Mirage - 1920x1080 Ultra High Preset (Adaptive Quality Off) | |
| XMG Pro 15 E23 | |
| Ortalama NVIDIA GeForce RTX 4060 Laptop GPU (65 - 93, n=6) | |
| Gigabyte G5 KF | |
| Intel NUC X15 LAPAC71H | |
| The Crew Motorfest - 1920x1080 Ultra Preset | |
| XMG Pro 15 E23 | |
| Gigabyte G5 KF | |
| Ortalama NVIDIA GeForce RTX 4060 Laptop GPU (60 - 60, n=3) | |
| Intel NUC X15 LAPAC71H | |
| F1 23 - 1920x1080 Ultra High Preset AA:T AF:16x | |
| Ortalama NVIDIA GeForce RTX 4060 Laptop GPU (43.8 - 119.9, n=13) | |
| XMG Pro 15 E23 | |
| Gigabyte G5 KF | |
| Intel NUC X15 LAPAC71H | |
| Baldur's Gate 3 - 1920x1080 Ultra Preset AA:T | |
| Sınıf ortalaması Gaming (59.4 - 246, n=104, son 2 yıl) | |
| XMG Pro 15 E23 | |
| Ortalama NVIDIA GeForce RTX 4060 Laptop GPU (66.5 - 105.5, n=19) | |
| Gigabyte G5 KF | |
| Intel NUC X15 LAPAC71H | |
| Diablo 4 - 3840x2160 Ultra Preset | |
| XMG Pro 15 E23 | |
| Ortalama NVIDIA GeForce RTX 4060 Laptop GPU (n=1) | |
| Lords of the Fallen - 1920x1080 Ultra Preset | |
| XMG Pro 15 E23 | |
| Intel NUC X15 LAPAC71H | |
| Ortalama NVIDIA GeForce RTX 4060 Laptop GPU (32.8 - 38.1, n=3) | |
| Gigabyte G5 KF | |
Dizüstü bilgisayarın daha uzun bir süre boyunca performansını büyük ölçüde koruyup koruyamayacağını kontrol etmek için, "The Witcher 3" oyununu Full HD ve maksimum ayarlarda yaklaşık 60 dakika çalıştırdık. Oyuncu karakteri bu süre boyunca hiç hareket ettirilmedi. Kare hızları çoğunlukla sabit kaldı, ancak bu testin ilerleyen aşamalarında ara sıra birkaç küçük düşüş (yaklaşık 10 FPS) gözlemledik.
Witcher 3 FPS chart
| düşük | orta | yüksek | ultra | |
|---|---|---|---|---|
| GTA V (2015) | 183.5 | 178.3 | 171.5 | 107.6 |
| The Witcher 3 (2015) | 314.3 | 251.1 | 172.8 | 92.5 |
| Dota 2 Reborn (2015) | 158.6 | 146.6 | 137.55 | 131.2 |
| Final Fantasy XV Benchmark (2018) | 186.5 | 126 | 91.9 | |
| X-Plane 11.11 (2018) | 120.4 | 108 | 87.1 | |
| Far Cry 5 (2018) | 151 | 125 | 119 | 110 |
| Strange Brigade (2018) | 379 | 253 | 197.9 | 172.1 |
| Gears Tactics (2020) | 303.9 | 225.6 | 156.5 | 112.2 |
| Cyberpunk 2077 1.6 (2022) | 105.4 | 86.7 | 74.5 | 68.7 |
| Diablo 4 (2023) | 227 | 204 | 180.4 | 151 |
| F1 23 (2023) | 213 | 211 | 157.4 | 51.8 |
| Starfield (2023) | 71.2 | 61.4 | 47 | 39.8 |
| The Crew Motorfest (2023) | 60 | 60 | 60 | 60 |
| Lies of P (2023) | 159.4 | 138.5 | 126.9 | 106.2 |
| Baldur's Gate 3 (2023) | 113.1 | 93.2 | 78 | 75.1 |
| Cyberpunk 2077 (2023) | 105.9 | 91.1 | 78 | 70.5 |
| EA Sports FC 24 (2023) | 198.3 | 172.9 | 142.9 | 138 |
| Assassin's Creed Mirage (2023) | 120 | 115 | 106 | 83 |
| Lords of the Fallen (2023) | 80 | 64.7 | 46.7 | 32.8 |
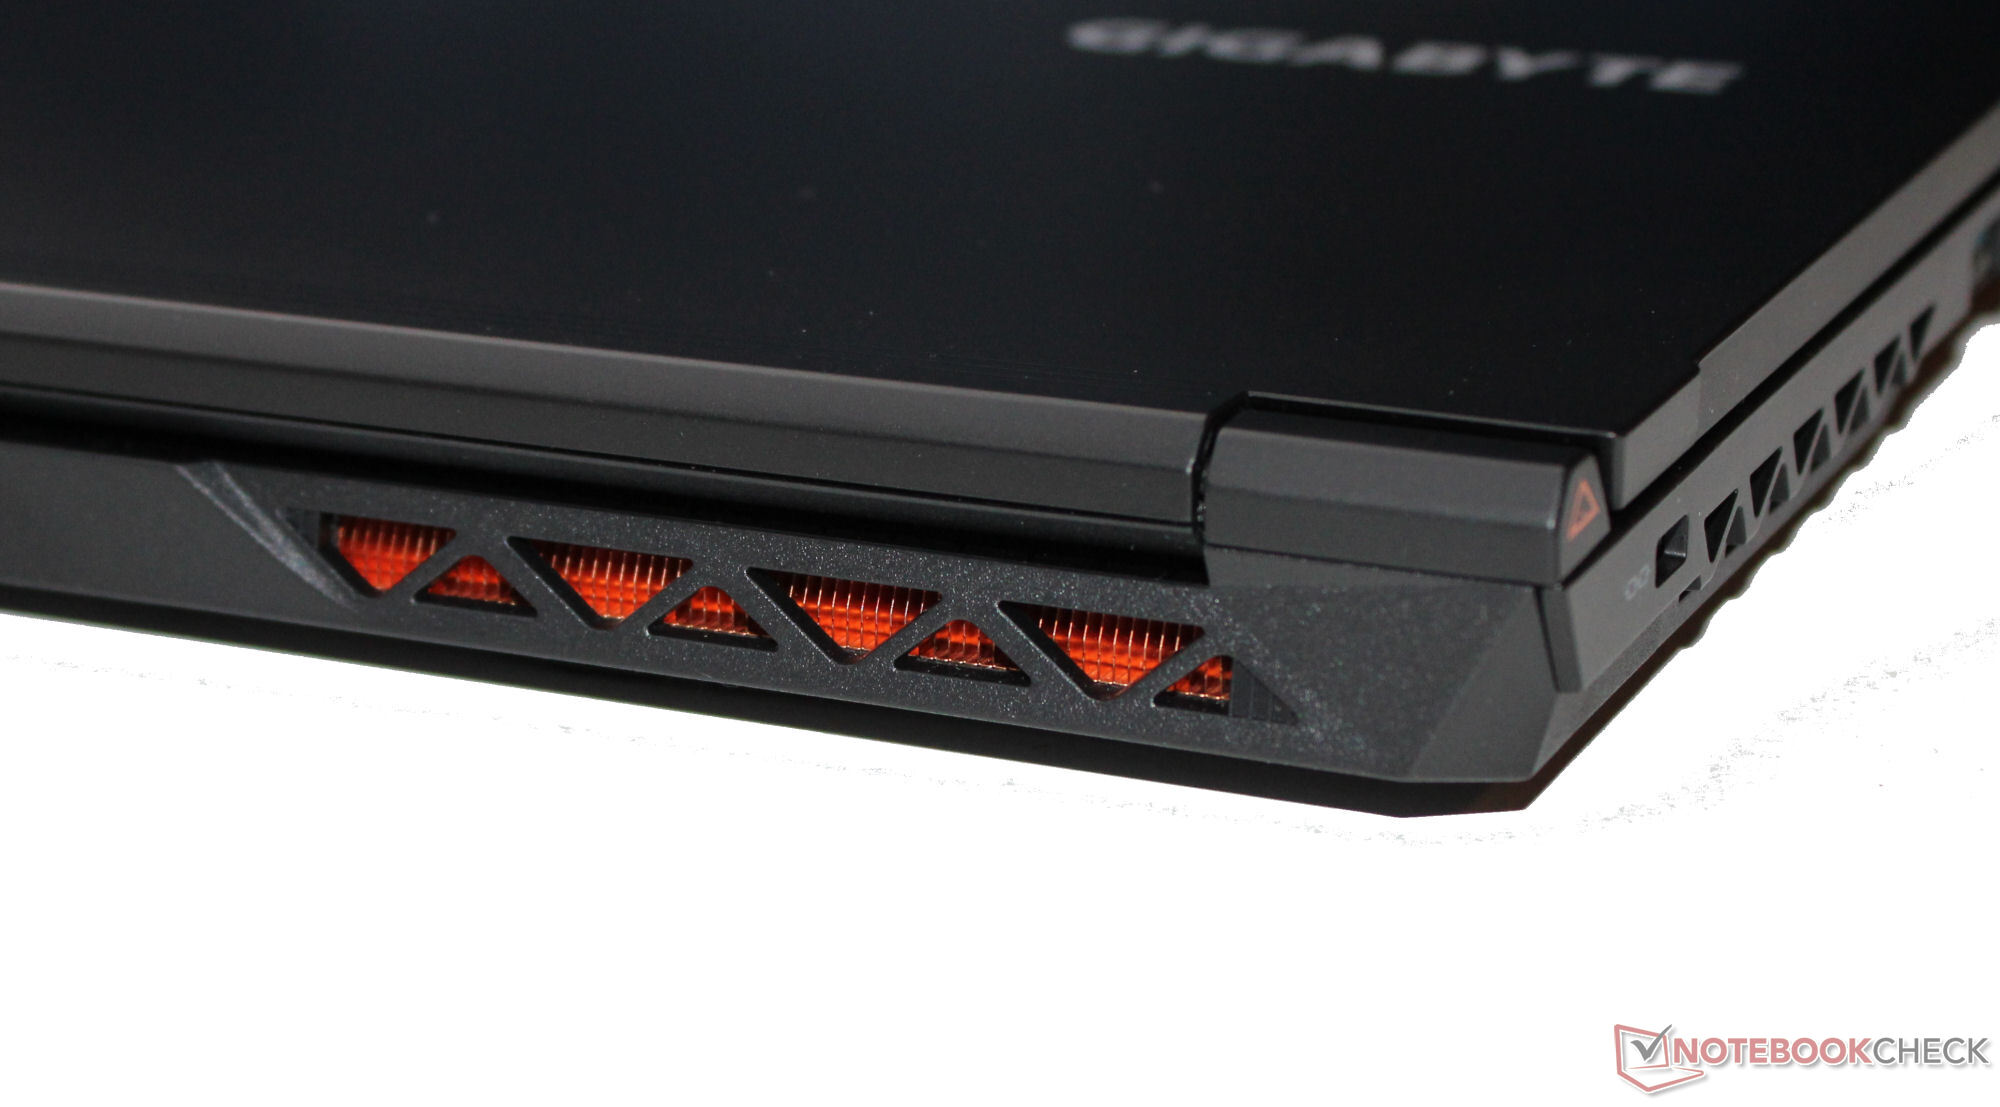
Emisyonlar - Dizüstü bilgisayar oldukça gürültülü olabilir
Gürültü emisyonları
Oyun oynarken, gürültü seviyesi "Performans modunda" 55,5 dB(A)'ya kadar ulaşabilir. "Eğlence moduna" veya daha da iyisi "Sessiz moda" geçerek gürültü miktarını azaltabilirsiniz. Günlük kullanımda (örn. ofis uygulamaları ve internette gezinme), iki fan genellikle düşük hızda döner ve bazen tamamen hareketsiz kalabilir.
Ses yüksekliği
| Boşta |
| 23 / 23 / 28 dB |
| Çalışırken |
| 29.94 / 55.5 dB |
 | ||
30 dB sessiz 40 dB(A) duyulabilirlik 50 dB(A) gürültülü |
||
min: | ||
| Gigabyte G5 KF GeForce RTX 4060 Laptop GPU, i5-12500H, SSSTC CA6-8D512 | MSI Cyborg 15 A12VF GeForce RTX 4060 Laptop GPU, i7-12650H, Samsung PM9B1 1024GB MZVL41T0HBLB | Intel NUC X15 LAPAC71H A730M, i7-12700H, Samsung 990 Pro 1 TB | Asus TUF A15 FA507 GeForce RTX 4050 Laptop GPU, R7 7735HS, Micron 2400 MTFDKBA512QFM | Lenovo Legion Slim 5 16APH8 GeForce RTX 4060 Laptop GPU, R7 7840HS, SK hynix PC801 HFS512GEJ9X115N | Gigabyte G5 KE GeForce RTX 3060 Laptop GPU, i5-12500H, Gigabyte AG4512G-SI B10 | |
|---|---|---|---|---|---|---|
| Noise | -37% | -6% | 9% | -1% | -22% | |
| kapalı / ortam * (dB) | 23 | 27 -17% | 23 -0% | 23.3 -1% | 22.9 -0% | 19.52 15% |
| Idle Minimum * (dB) | 23 | 27 -17% | 23 -0% | 23.3 -1% | 23.1 -0% | 31.05 -35% |
| Idle Average * (dB) | 23 | 37.5 -63% | 24 -4% | 23.3 -1% | 23.1 -0% | 31.05 -35% |
| Idle Maximum * (dB) | 28 | 38 -36% | 24 14% | 23.3 17% | 27.7 1% | 31.05 -11% |
| Load Average * (dB) | 29.94 | 56.3 -88% | 50.61 -69% | 29.6 1% | 33.3 -11% | 55.66 -86% |
| Witcher 3 ultra * (dB) | 55.05 | 50.65 8% | 43 22% | 54 2% | 55.7 -1% | |
| Load Maximum * (dB) | 55.5 | 56.3 -1% | 50.89 8% | 43 23% | 54 3% | 55.51 -0% |
* ... daha küçük daha iyidir
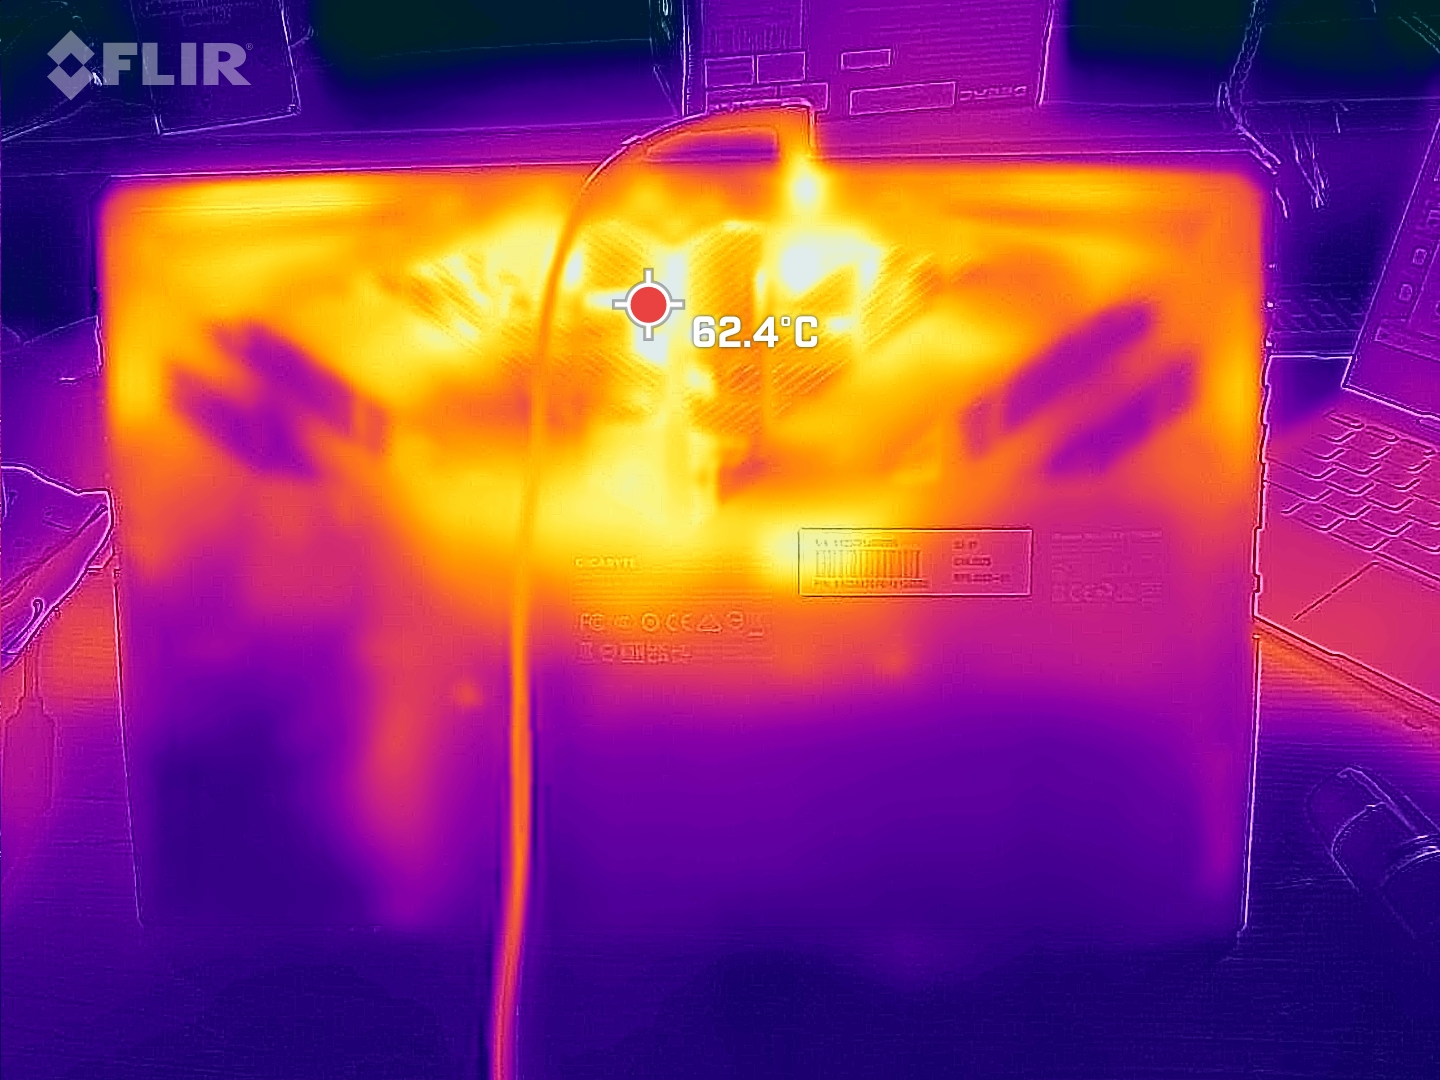
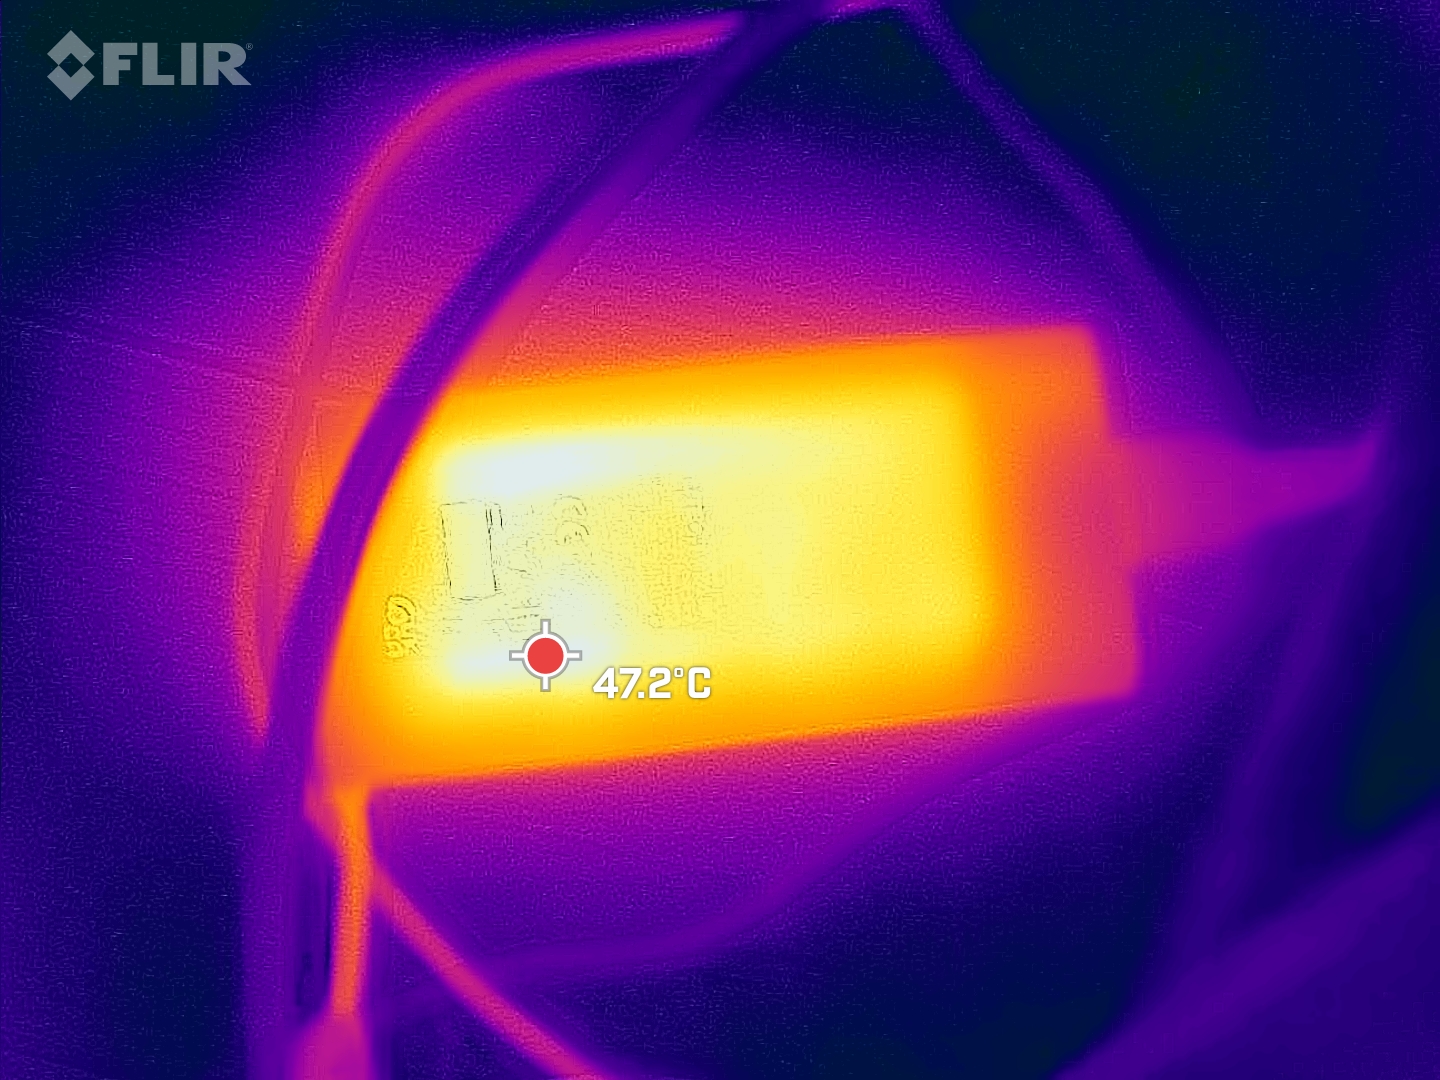
Sıcaklık
Dizüstü bilgisayarın yüzeyindeki bazı noktalar ağır yük altında fark edilir derecede ısınıyor (örn. stres testi, Witcher 3 testi). Buna karşın, rakip cihazlarda kasa sıcaklıkları daha ılımlıdır. Bununla birlikte, G5 KF'nin yüzey sıcaklıkları günlük kullanımda (örneğin ofis uygulamaları, internette gezinme) kabul edilebilir bir aralıkta tutuluyor.
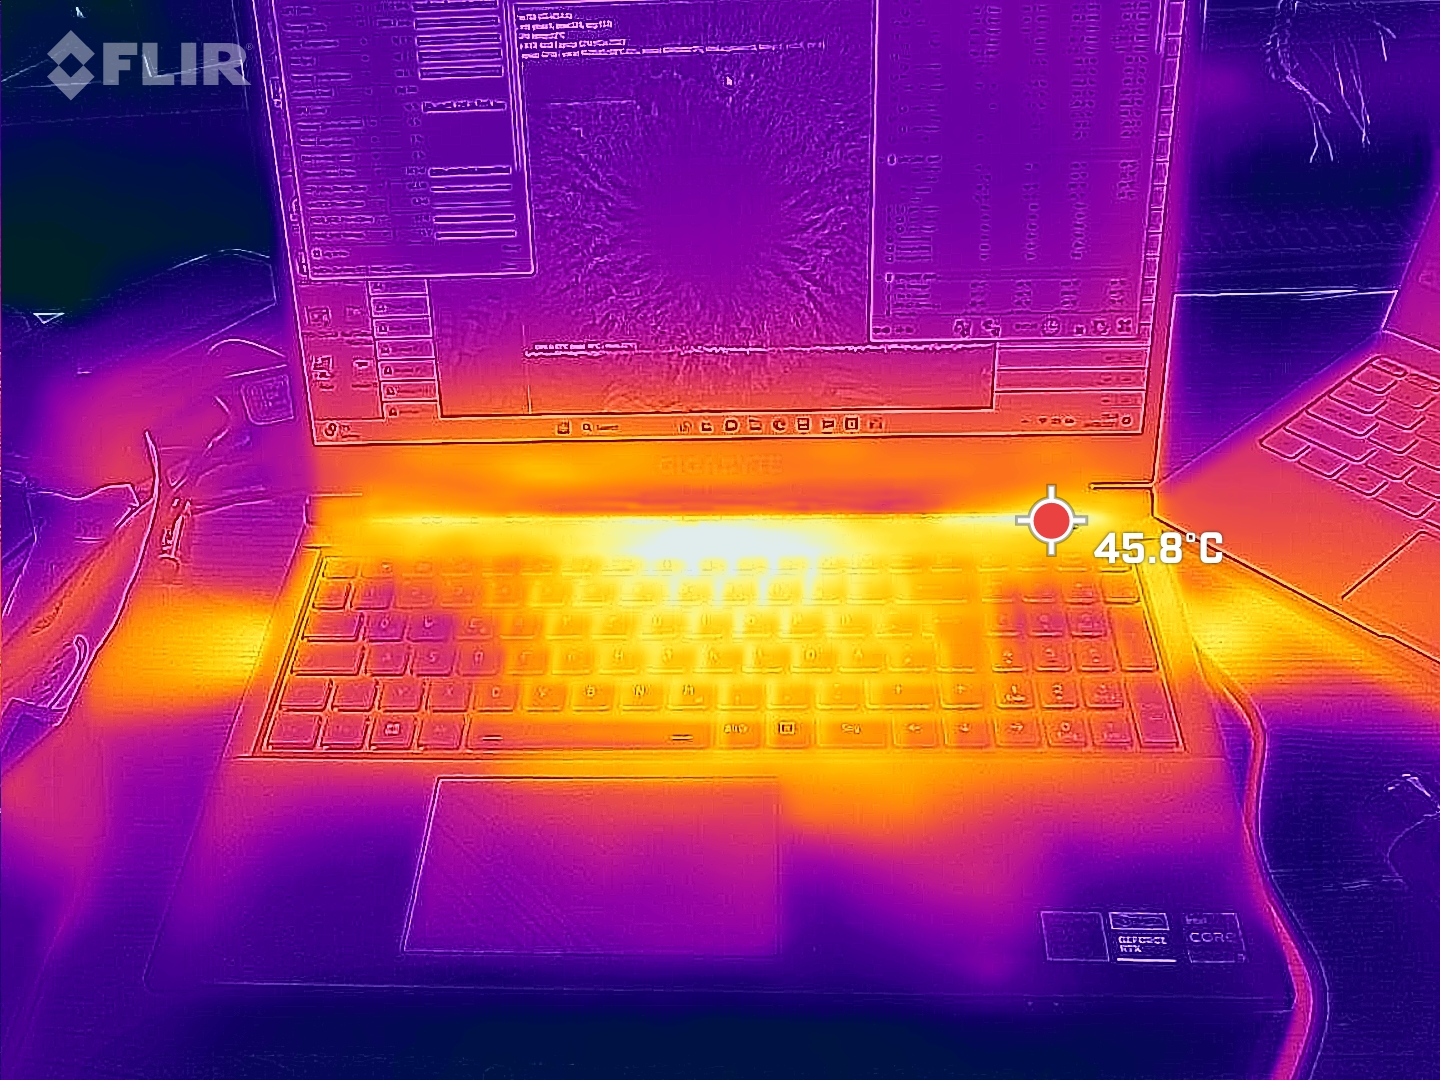
(-) Üst taraftaki maksimum sıcaklık, 40.4 °C / 105 F ortalamasına kıyasla 54 °C / 129 F'dir. , Gaming sınıfı için 21.2 ile 68.8 °C arasında değişir.
(-) Alt kısım, 43.2 °C / 110 F ortalamasına kıyasla maksimum 61 °C / 142 F'ye kadar ısınır
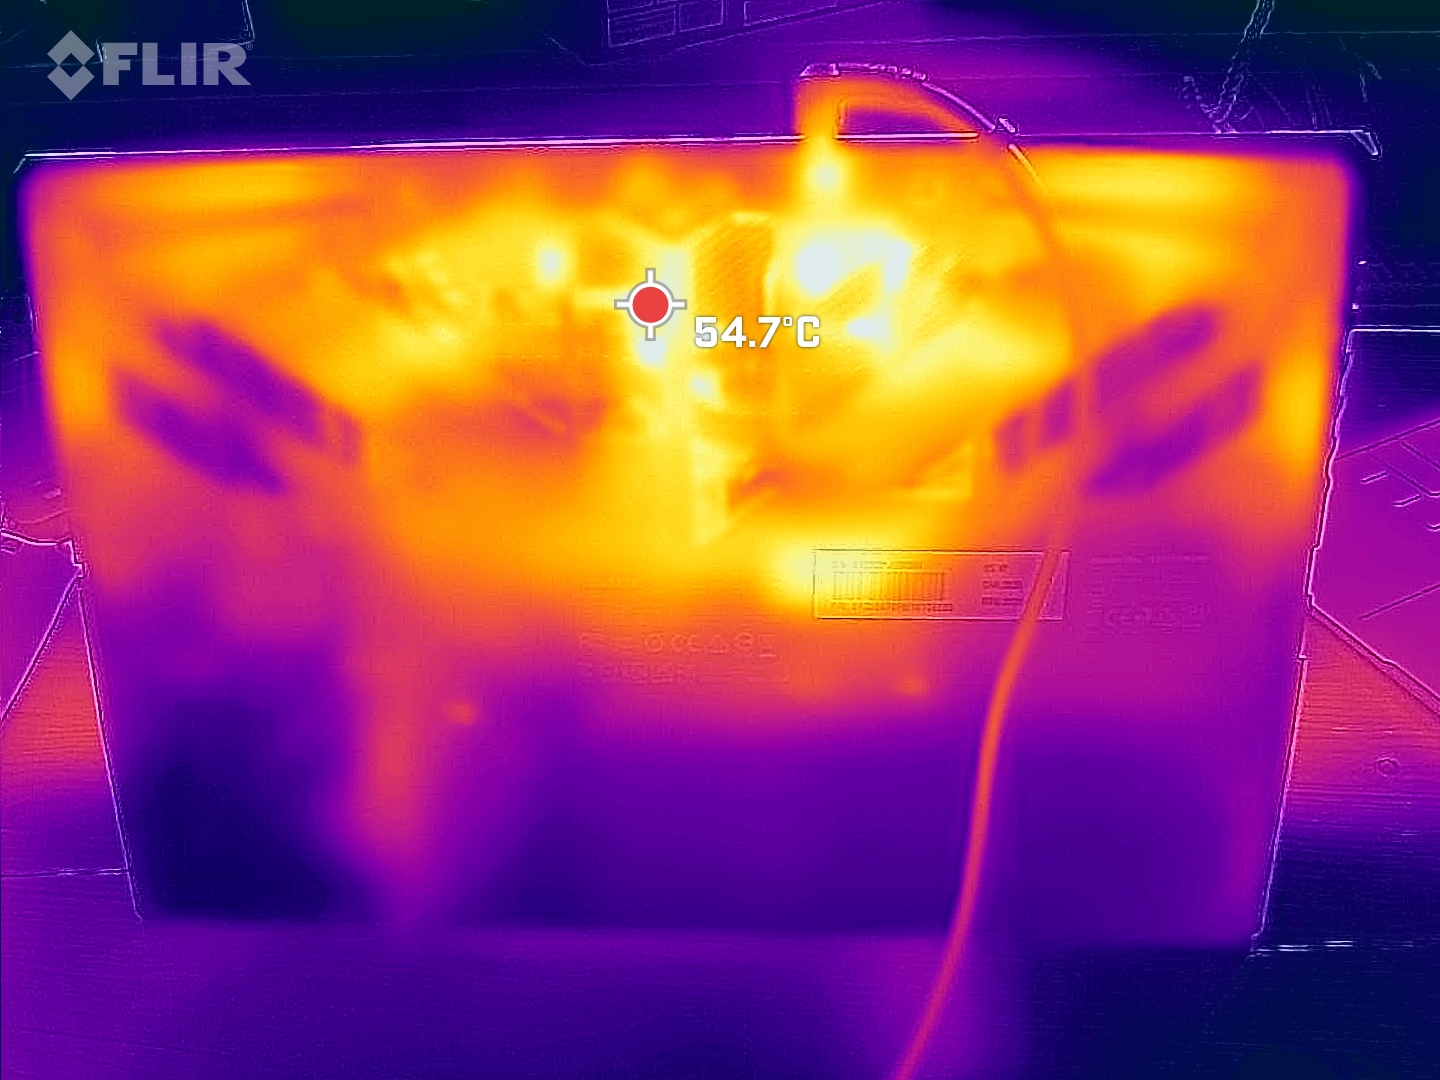
(+) Boşta kullanımda, üst tarafın ortalama sıcaklığı 30.7 °C / 87 F olup, cihazın 33.9 °C / 93 F.
(±) The Witcher 3 oynarken, üst tarafın ortalama sıcaklığı 37.3 °C / 99 F olup, cihazın 33.9 °C / 93 F.
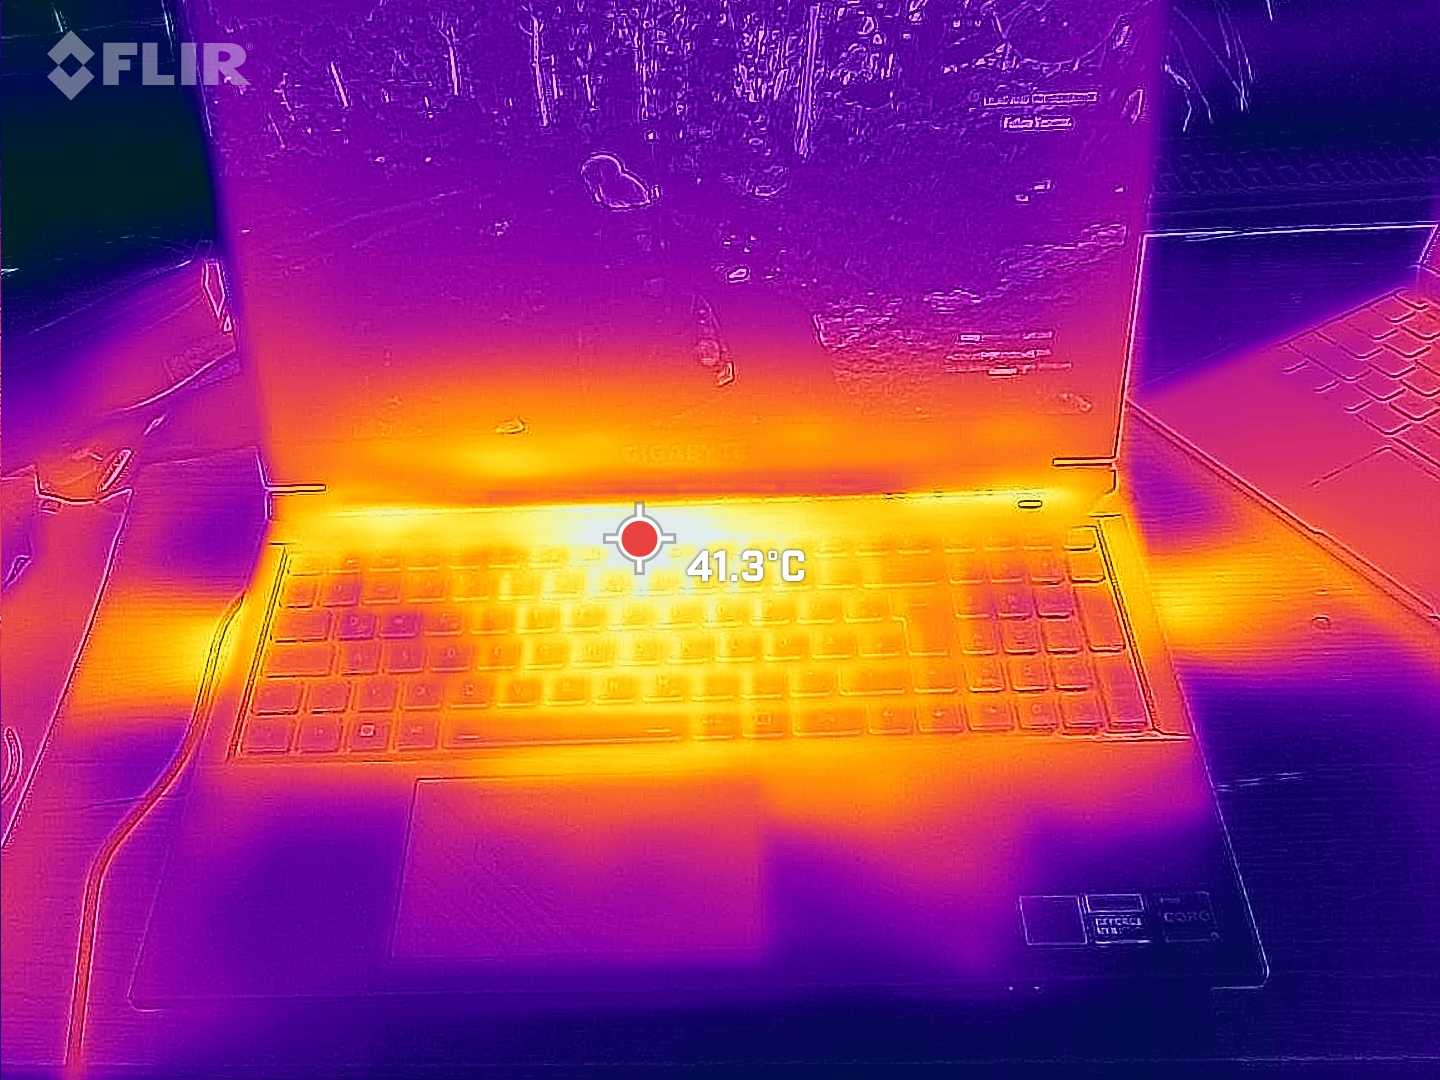
(+) Avuç içi dayanakları ve dokunmatik yüzey maksimum (34 °C / 93.2 F) cilt sıcaklığına ulaşıyor ve bu nedenle sıcak değil.
(-) Benzer cihazların avuç içi dayanağı alanının ortalama sıcaklığı 28.8 °C / 83.8 F (-5.2 °C / -9.4 F) idi.
| Gigabyte G5 KF Intel Core i5-12500H, NVIDIA GeForce RTX 4060 Laptop GPU | MSI Cyborg 15 A12VF Intel Core i7-12650H, NVIDIA GeForce RTX 4060 Laptop GPU | Intel NUC X15 LAPAC71H Intel Core i7-12700H, Intel Arc A730M | Asus TUF A15 FA507 AMD Ryzen 7 7735HS, NVIDIA GeForce RTX 4050 Laptop GPU | Lenovo Legion Slim 5 16APH8 AMD Ryzen 7 7840HS, NVIDIA GeForce RTX 4060 Laptop GPU | Gigabyte G5 KE Intel Core i5-12500H, NVIDIA GeForce RTX 3060 Laptop GPU | |
|---|---|---|---|---|---|---|
| Heat | 23% | 11% | 20% | 25% | 1% | |
| Maximum Upper Side * (°C) | 54 | 47.5 12% | 59 -9% | 48.9 9% | 40.6 25% | 52.6 3% |
| Maximum Bottom * (°C) | 61 | 35.5 42% | 51 16% | 44.6 27% | 42 31% | 62.4 -2% |
| Idle Upper Side * (°C) | 34 | 27.7 19% | 28 18% | 27.1 20% | 27.8 18% | 33.6 1% |
| Idle Bottom * (°C) | 36 | 29.5 18% | 30 17% | 27.5 24% | 26.6 26% | 34.8 3% |
* ... daha küçük daha iyidir
Stres testi
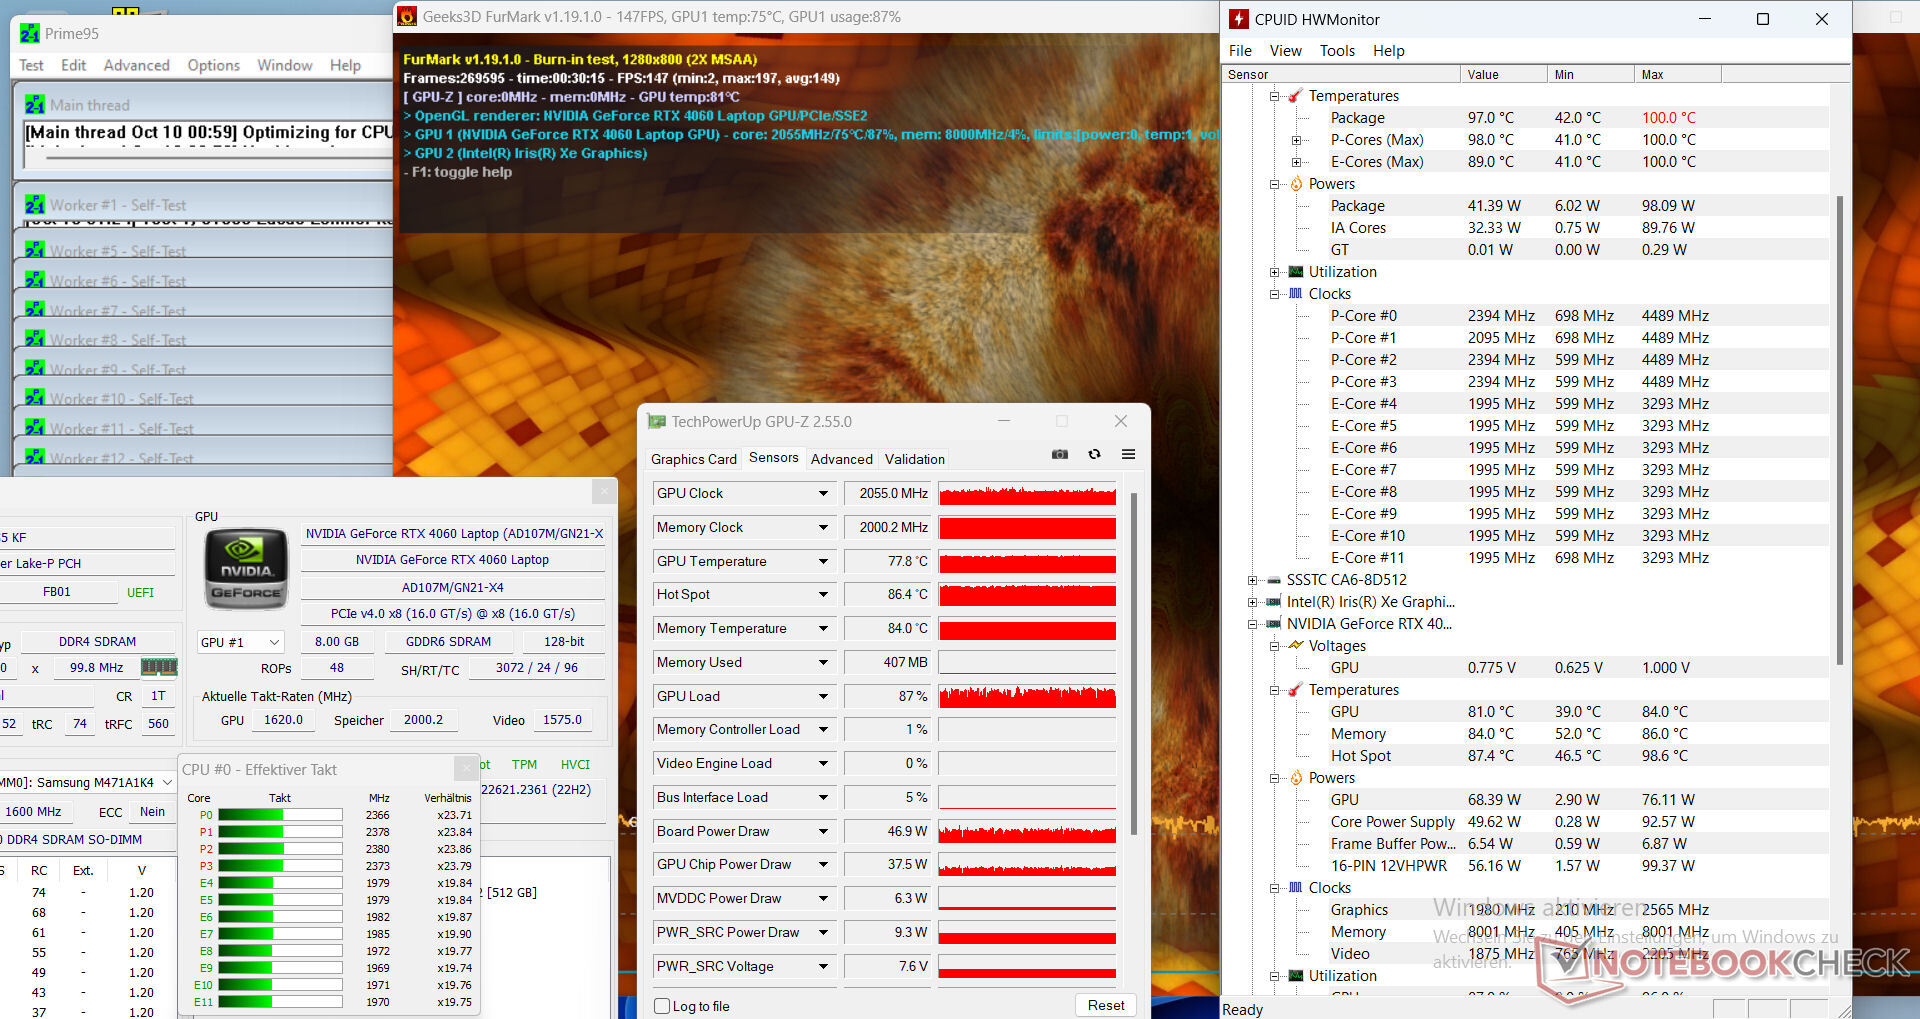
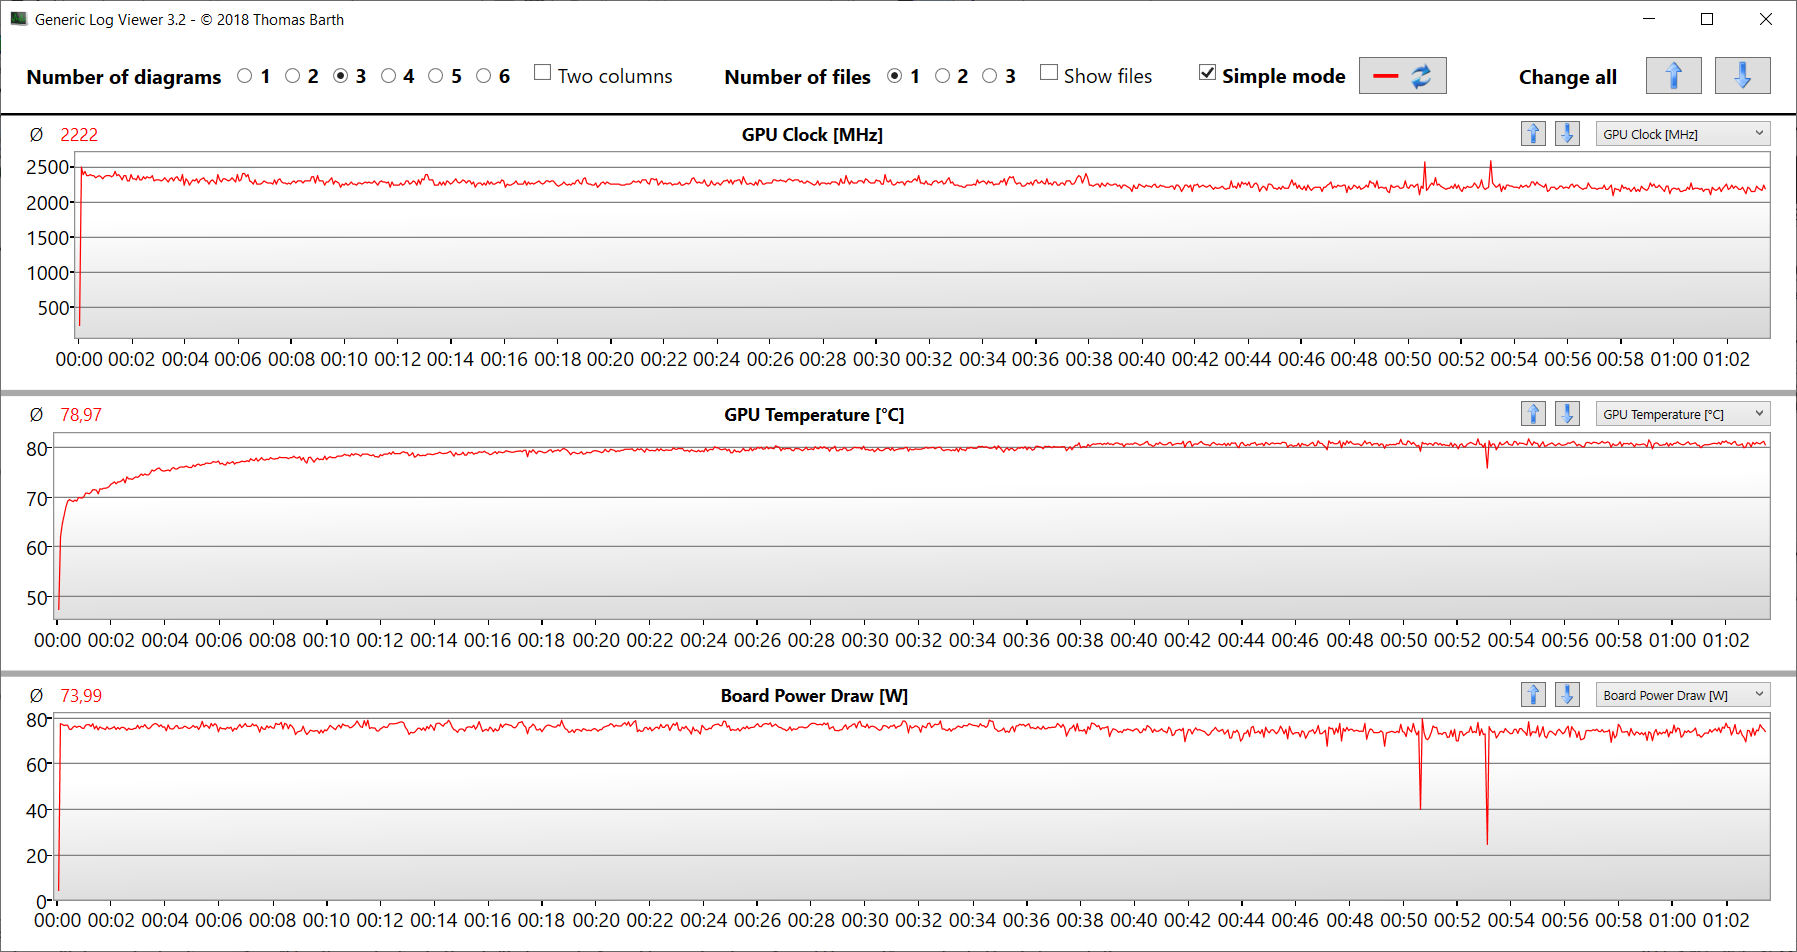
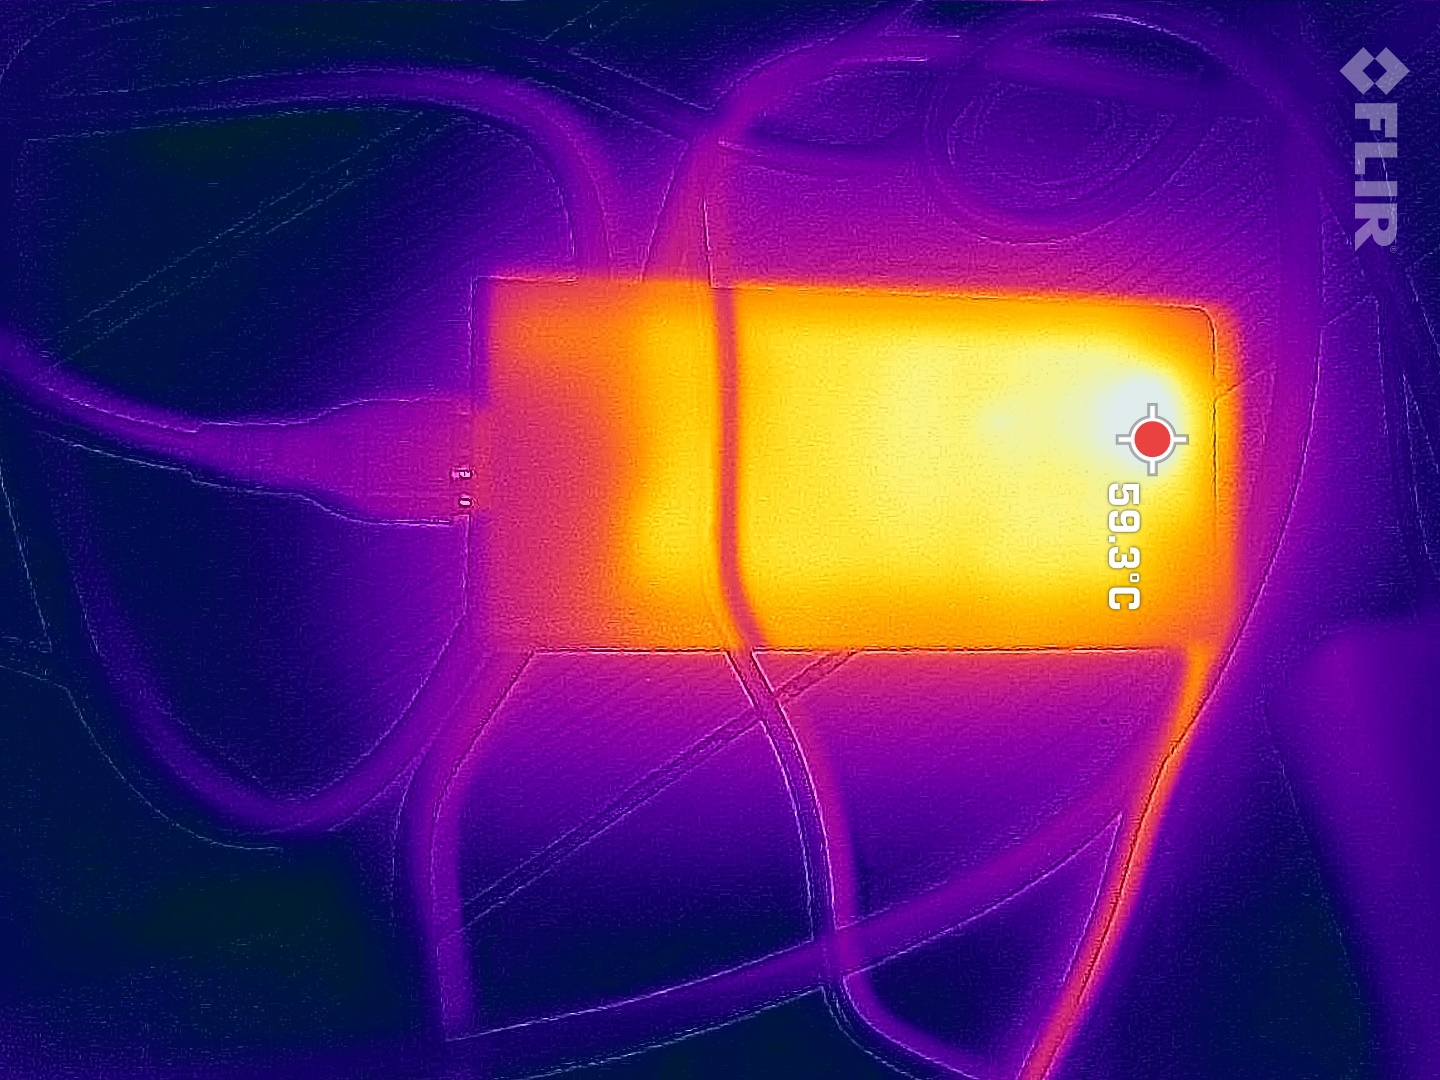
Stres testimiz (Prime95 ve FurMark'ı uzun süre çalıştırmak), sistemin tam yükteki kararlılığını belirlemek için tasarlanmış aşırı bir senaryoyu temsil etmektedir. Yüksek saat hızlarında başladıktan sonra, CPU ve GPU test ilerledikçe yavaşlamaya başladı. Yaklaşık 30 dakika içinde, CPU yaklaşık olarak temel saatinde çalışırken, GPU yaklaşık 2 GHz'e ulaşıyordu.
Güç adaptörü stres testinin 49. dakikasında kapandı ve yüzey sıcaklığı 68°C'ye (154,4°F) yükseldi. Uzun bir süre boyunca, donanımın ihtiyaç duyduğu güç miktarı 150 watt'lık adaptörün sağlayabileceğinden fazla görünüyor. Ancak "tipik" kullanım durumlarında (örneğin oyun, ofis uygulamaları) güç kaynağının kendi kendine kapanmasını beklemiyoruz. Stres testi, gerçek hayatta nadiren gerçekleşen bir durumu simüle ediyor (yani CPU ve GPU'nun aynı anda maksimum kapasitede çalışması).
Konuşmacılar
Stereo hoparlörlerin sesi iyi ancak neredeyse hiç bas yok.
Gigabyte G5 KF ses analizi
(±) | hoparlör ses yüksekliği ortalama ama iyi (78.6 dB)
Bas 100 - 315Hz
(-) | neredeyse hiç bas yok - ortalama olarak medyandan 15.6% daha düşük
(+) | bas doğrusaldır (1.7% delta ile önceki frekans)
Ortalar 400 - 2000 Hz
(±) | daha yüksek ortalar - ortalama olarak medyandan 9.7% daha yüksek
(±) | Ortaların doğrusallığı ortalamadır (10.4% delta - önceki frekans)
Yüksekler 2 - 16 kHz
(+) | dengeli yüksekler - medyandan yalnızca 3.2% uzakta
(+) | yüksekler doğrusaldır (6.9% deltadan önceki frekansa)
Toplam 100 - 16.000 Hz
(±) | Genel sesin doğrusallığı ortalamadır (22.7% ortancaya göre fark)
Aynı sınıfla karşılaştırıldığında
» Bu sınıftaki tüm test edilen cihazların %82%'si daha iyi, 5% benzer, 13% daha kötüydü
» En iyisinin deltası 6% idi, ortalama 18% idi, en kötüsü 132% idi
Test edilen tüm cihazlarla karşılaştırıldığında
» Test edilen tüm cihazların %67'si daha iyi, 6 benzer, % 27 daha kötüydü
» En iyisinin deltası 4% idi, ortalama 23% idi, en kötüsü 134% idi
Asus TUF A15 FA507 ses analizi
(±) | hoparlör ses yüksekliği ortalama ama iyi (79.3 dB)
Bas 100 - 315Hz
(±) | azaltılmış bas - ortalama olarak medyandan 13.7% daha düşük
(+) | bas doğrusaldır (6.2% delta ile önceki frekans)
Ortalar 400 - 2000 Hz
(±) | daha yüksek ortalar - ortalama olarak medyandan 7.6% daha yüksek
(±) | Ortaların doğrusallığı ortalamadır (7.3% delta - önceki frekans)
Yüksekler 2 - 16 kHz
(+) | dengeli yüksekler - medyandan yalnızca 2.1% uzakta
(±) | Yükseklerin doğrusallığı ortalamadır (7.5% delta - önceki frekans)
Toplam 100 - 16.000 Hz
(±) | Genel sesin doğrusallığı ortalamadır (17.2% ortancaya göre fark)
Aynı sınıfla karşılaştırıldığında
» Bu sınıftaki tüm test edilen cihazların %47%'si daha iyi, 11% benzer, 42% daha kötüydü
» En iyisinin deltası 6% idi, ortalama 18% idi, en kötüsü 132% idi
Test edilen tüm cihazlarla karşılaştırıldığında
» Test edilen tüm cihazların %32'si daha iyi, 8 benzer, % 60 daha kötüydü
» En iyisinin deltası 4% idi, ortalama 23% idi, en kötüsü 134% idi
Güç yönetimi - G5 dayanıklılığı ile sizi şaşırtmayacak
Güç tüketimi
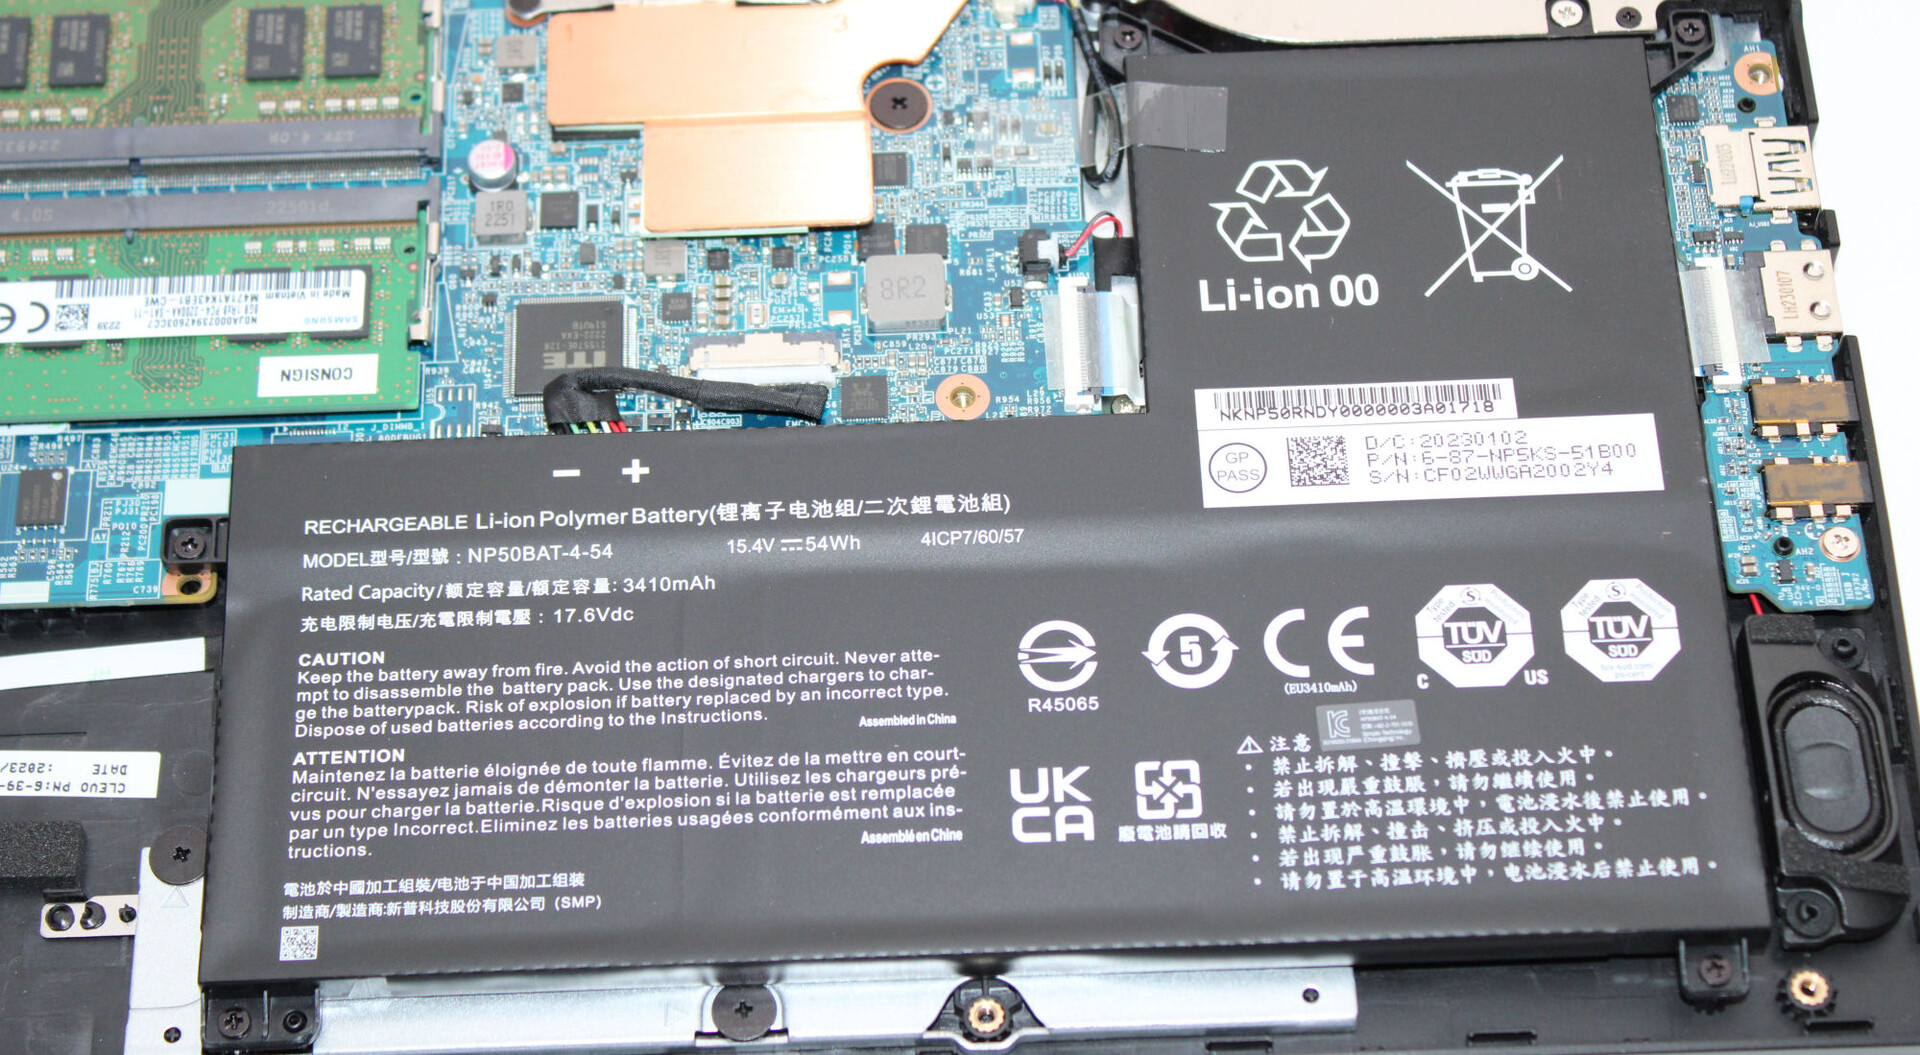
Witcher 3 testimiz boyunca dizüstü bilgisayarın güç kullanımı beklendiği gibi yüksek bir seviyede sabit kaldı. Ancak, stres testi sırasında güç gereksinimi dalgalandı; G5 KF sürekli olarak şarj cihazının nominal değerinden (150 watt) daha fazla güç çekti. Sonuç olarak, adaptör yaklaşık 50 dakika sonra kendi kendine kapandı. Güç kaynağının fazla boşluğu yok gibi görünüyor. Adaptörle birlikte gönderilen 180 watt'lık model G5 KE bu durumda daha iyi bir seçim olurdu.
| Kapalı / Bekleme modu | |
| Boşta | |
| Çalışırken |
|
Key:
min: | |
| Gigabyte G5 KF i5-12500H, GeForce RTX 4060 Laptop GPU, SSSTC CA6-8D512, IPS, 1920x1080, 15.6" | MSI Cyborg 15 A12VF i7-12650H, GeForce RTX 4060 Laptop GPU, Samsung PM9B1 1024GB MZVL41T0HBLB, IPS, 1920x1080, 15.6" | Intel NUC X15 LAPAC71H i7-12700H, A730M, Samsung 990 Pro 1 TB, IPS, 1920x1080, 15.6" | Asus TUF A15 FA507 R7 7735HS, GeForce RTX 4050 Laptop GPU, Micron 2400 MTFDKBA512QFM, IPS, 1920x1080, 15.6" | Lenovo Legion Slim 5 16APH8 R7 7840HS, GeForce RTX 4060 Laptop GPU, SK hynix PC801 HFS512GEJ9X115N, IPS, 2560x1600, 16" | Gigabyte G5 KE i5-12500H, GeForce RTX 3060 Laptop GPU, Gigabyte AG4512G-SI B10, IPS, 1920x1080, 15.6" | Ortalama NVIDIA GeForce RTX 4060 Laptop GPU | Sınıf ortalaması Gaming | |
|---|---|---|---|---|---|---|---|---|
| Power Consumption | 13% | -30% | -7% | -27% | -27% | -44% | -71% | |
| Idle Minimum * (Watt) | 7 | 6 14% | 7.5 -7% | 8 -14% | 9.4 -34% | 7.66 -9% | 11.5 ? -64% | 13 ? -86% |
| Idle Average * (Watt) | 10.2 | 8.8 14% | 11.9 -17% | 12.1 -19% | 15.5 -52% | 10.3 -1% | 16 ? -57% | 19 ? -86% |
| Idle Maximum * (Watt) | 16.1 | 11.9 26% | 13.9 14% | 12.5 22% | 24.4 -52% | 16.05 -0% | 20.3 ? -26% | 24.5 ? -52% |
| Load Average * (Watt) | 59.3 | 89 -50% | 137 -131% | 74.9 -26% | 74.1 -25% | 115.8 -95% | 92.9 ? -57% | 111.1 ? -87% |
| Witcher 3 ultra * (Watt) | 129 | 90.3 30% | 166 -29% | 136.6 -6% | 112.9 12% | 168.7 -31% | ||
| Load Maximum * (Watt) | 183 | 99 46% | 203 -11% | 185 -1% | 206.5 -13% | 234.6 -28% | 210 ? -15% | 260 ? -42% |
* ... daha küçük daha iyidir
Energieaufnahme Witcher 3 / Stresstest
Power consumption with external monitor
Pil ömrü
15,6 inçlik cihaz, Wi-Fi testimizde (bir komut dosyası kullanarak web sitelerine erişme) ve video testimizde (Big Buck Bunny kısa filmini FHD'de ve H.264 formatında kodlanmış olarak bir döngüde oynatma) sırasıyla 5 saat 16 dakika ve 4 saat 28 dakika dayandı. Testler sırasında ekran parlaklığı yaklaşık 150 cd/m²'ye ayarlandı ve kablosuz modüller devre dışı bırakıldı.
Pil ömrü açısından G5, aşağıdaki gibi bir rakiple doğrudan karşılaştırıldığında iyi bir performans göstermedi MSI Cyborg. MSI dizüstü bilgisayar, benzer donanım özelliklerine ve neredeyse aynı pil kapasitesine sahip olmalarına rağmen G5'ten önemli ölçüde daha uzun süre dayanabilir.
| Gigabyte G5 KF i5-12500H, GeForce RTX 4060 Laptop GPU, 54 Wh | MSI Cyborg 15 A12VF i7-12650H, GeForce RTX 4060 Laptop GPU, 53.5 Wh | Intel NUC X15 LAPAC71H i7-12700H, A730M, 62.3 Wh | Asus TUF A15 FA507 R7 7735HS, GeForce RTX 4050 Laptop GPU, 90 Wh | Lenovo Legion Slim 5 16APH8 R7 7840HS, GeForce RTX 4060 Laptop GPU, 80 Wh | Gigabyte G5 KE i5-12500H, GeForce RTX 3060 Laptop GPU, 54 Wh | Sınıf ortalaması Gaming | |
|---|---|---|---|---|---|---|---|
| Pil Çalışma Süresi | 56% | 8% | 87% | 15% | -27% | 27% | |
| Reader / Idle (h) | 8.6 | 13.6 58% | 11.7 36% | 8.27 ? -4% | |||
| H.264 (h) | 4.5 | 8 78% | 12.5 178% | 2.2 -51% | 8.32 ? 85% | ||
| WiFi v1.3 (h) | 5.3 | 7.5 42% | 5.7 8% | 11.7 121% | 7.1 34% | 5.7 8% | 7.11 ? 34% |
| Load (h) | 1.6 | 2.3 44% | 1 -37% | 1.2 -25% | 1 -37% | 1.502 ? -6% | |
| Witcher 3 ultra (h) | 1.3 |
Artılar
Eksiler
Karar - Çok fazla optimizasyon potansiyeline sahip sağlam bir teklif

Teoride daha güçlü olan daha yeni bir GPU'ya sahip olmasına rağmen, G5 KF "sadece" aşağıdakilerle aynı oyun performansını sunabilmektedir selefiçok daha az güç tüketmesine rağmen. Daha verimli RTX 4060 (75 W) daha düşük bir TGP'de çalışır RTX 3060 (115 W) G5 KE'de. Aynı TGP'de G5 KF, KE'den daha iyi performans gösteriyor.
Gigabyte, G5 KF ile bütçeye uygun bir FHD oyun dizüstü bilgisayarı sundu. Ancak kullanıcılar bir dizi kusurla uğraşmak zorunda kalacaklar.
Dizüstü bilgisayar bazı alanlarda yük altında fark edilir derecede ısınıyor ve ayrıca oldukça fazla gürültü üretiyor. Sağlanan performans profillerini kullanarak gürültü sorununu azaltabilirsiniz, ancak performans bir darbe alacaktır. Ne yazık ki, azaltılmış güç adaptörü (180 watt yerine 150 watt) her türlü yük durumunun (örneğin stres testleri) üstesinden gelebilecek kadar yetenekli değil.
Dahili depolama alanı (512 GB) bir oyun dizüstü bilgisayarı için yetersiz kalıyor. Gerçekçi olmak gerekirse, sistem tek bir şarjla 4 ila 5,5 saat dayanabilir - bu da kimseyi şaşırtmayacaktır. Ayrıca, üzerindeki Thunderbolt 4 bağlantı noktası G5 KE uSB 3.2 Gen 2 bağlantı noktası için yol açmıştır. Mat Full HD ekran (15,6 inç, IPS, 144Hz) da herhangi bir ödül kazanmayacak: renk kapsamı, parlaklığı ve kontrastı standartlara uygun değil. Dizüstü bilgisayarın nispeten düşük fiyatı da sistemle birlikte bir Windows lisansının verilmemesinden kaynaklanıyor.
Bu Asus TUF A15 FA507 g5 KF'ye bir alternatiftir. Kağıt üzerinde daha zayıf bir GPU'ya sahip olmasına rağmen, G5'ten yalnızca marjinal olarak daha düşük grafik performansına sahiptir. A15 ayrıca daha iyi CPU performansı, önemli ölçüde daha uzun pil ömrü ve bir USB4 bağlantı noktası sunuyor. TUF A15 şu anda Windows 11 dahil 1.099 € (yaklaşık 1.165 ABD Doları) karşılığında alınabilir.
Fiyat ve bulunabilirlik
Gigabyte G5 KF, Amazon.de adresinden yaklaşık 984 € (950 ABD Doları) karşılığında satın alınabilir veya Amazon.com. ABD Amazon'daki modelin yalnızca 8 GB RAM'e sahip olduğunu ancak Windows 11 ile birlikte geldiğini lütfen unutmayın. Fiyatlar da zamana göre değişebilir. Bütçesi kısıtlı olanlar, her ikisi de aynı fiziksel tasarıma sahip olan daha düşük özellikli G5 MF (RTX 4050, 8 GB RAM) ve G5 GE (RTX 3050, 8 GB RAM) modellerini düşünebilir.
Gigabyte G5 KF
- 10/18/2023 v7 (old)
Sascha Mölck
Şeffaflık
İncelenecek cihazların seçimi editör ekibimiz tarafından yapılır. Test örneği, bu incelemenin amacı doğrultusunda üretici veya perakendeci tarafından yazara ödünç olarak sağlanmıştır. Borç verenin bu inceleme üzerinde herhangi bir etkisi olmadığı gibi, üretici de yayınlanmadan önce bu incelemenin bir kopyasını almamıştır. Bu incelemeyi yayınlama zorunluluğu yoktu. Bağımsız bir medya şirketi olarak Notebookcheck, üreticilerin, perakendecilerin veya yayıncıların otoritesine tabi değildir.
Notebookcheck bu şekilde test yapıyor
Notebookcheck, tüm sonuçların karşılaştırılabilir olmasını sağlamak için her yıl yüzlerce dizüstü bilgisayarı ve akıllı telefonu standart prosedürler kullanarak bağımsız olarak inceliyor. Yaklaşık 20 yıldır test yöntemlerimizi sürekli olarak geliştirdik ve bu süreçte endüstri standartlarını belirledik. Test laboratuvarlarımızda deneyimli teknisyenler ve editörler tarafından yüksek kaliteli ölçüm ekipmanları kullanılmaktadır. Bu testler çok aşamalı bir doğrulama sürecini içerir. Karmaşık derecelendirme sistemimiz, nesnelliği koruyan yüzlerce sağlam temellere dayanan ölçüm ve kıyaslamaya dayanmaktadır.Price comparison

