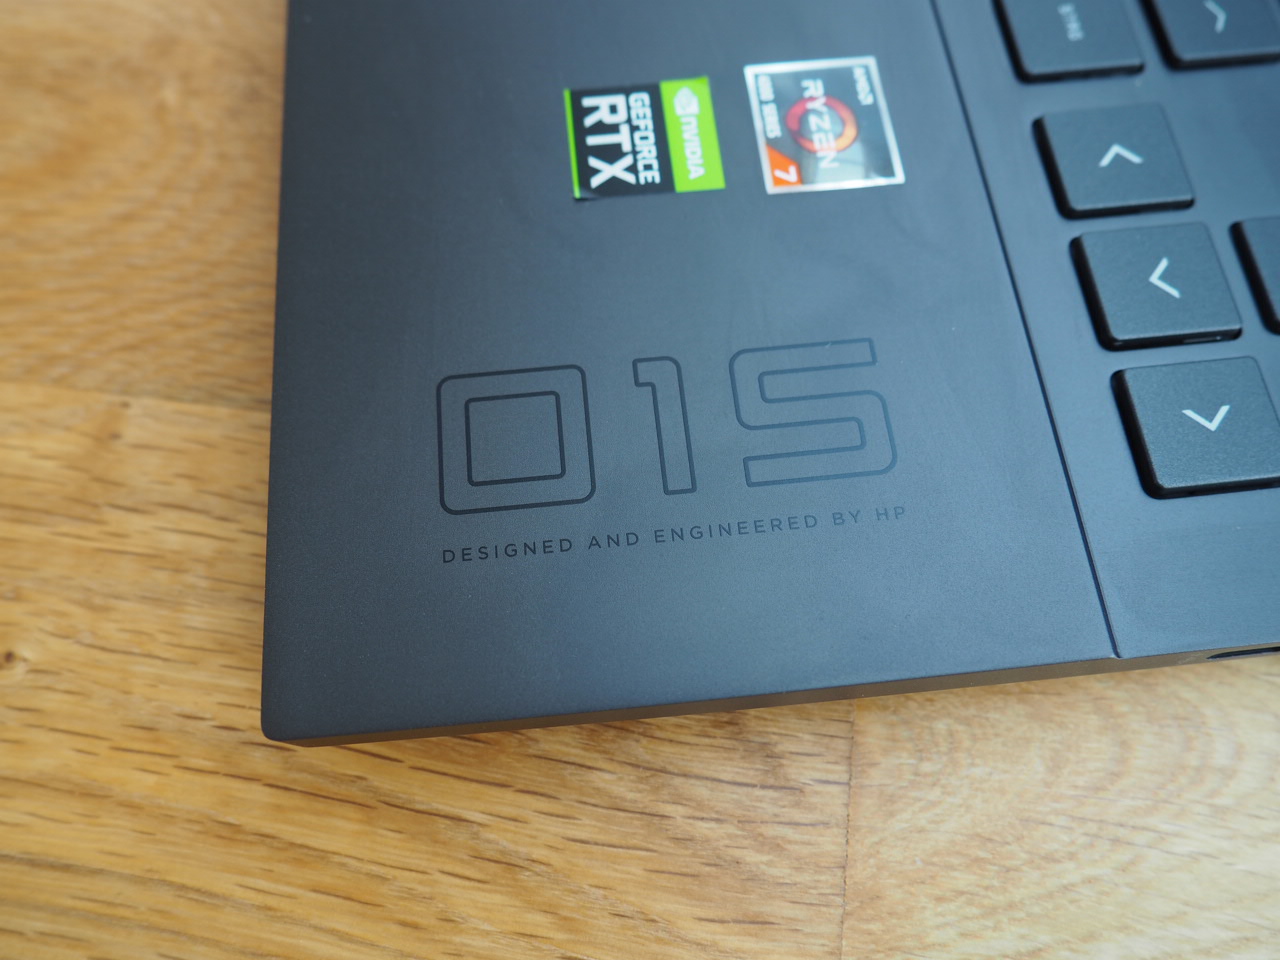
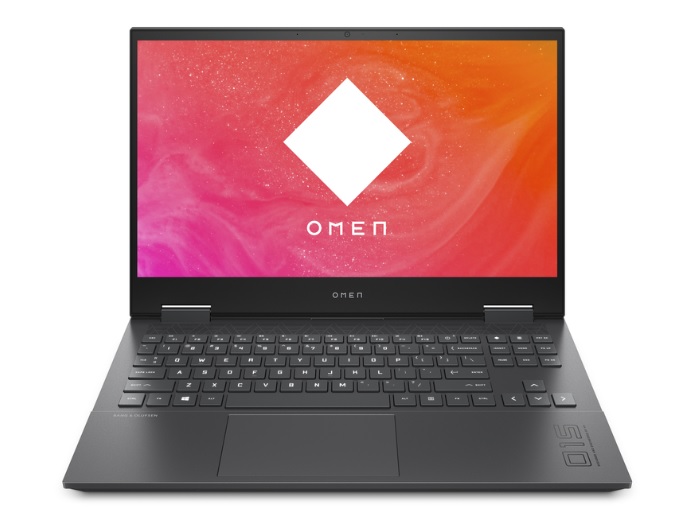
HP Omen 15 dizüstü bilgisayar incelemesi: Güçlü AMD işlemci Intel'i titretiyor

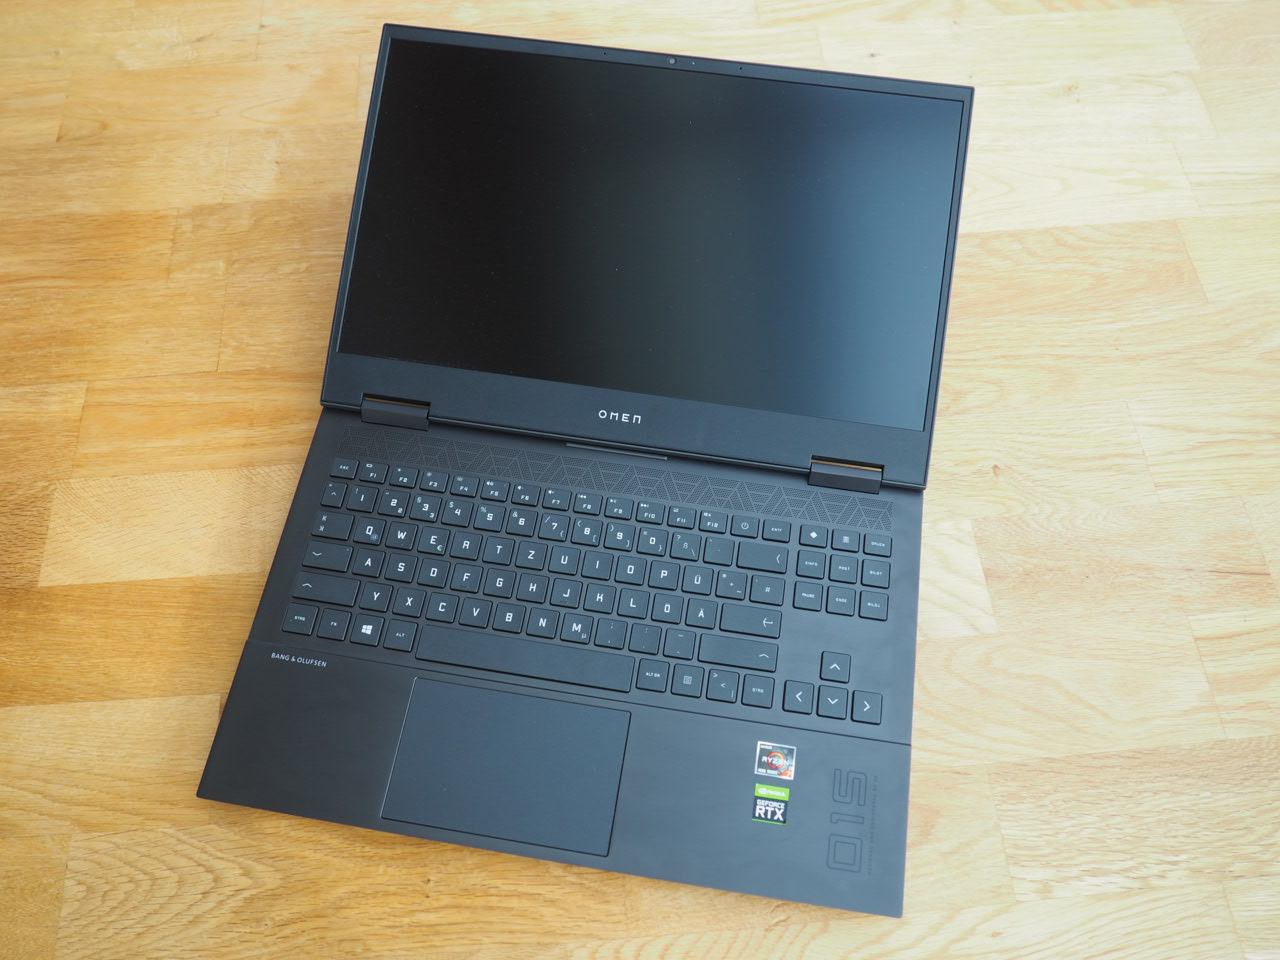
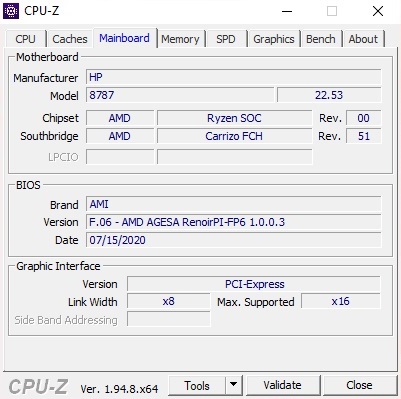
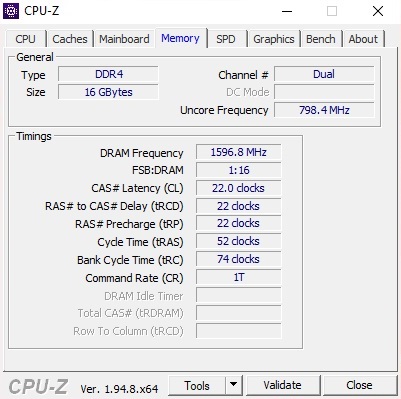
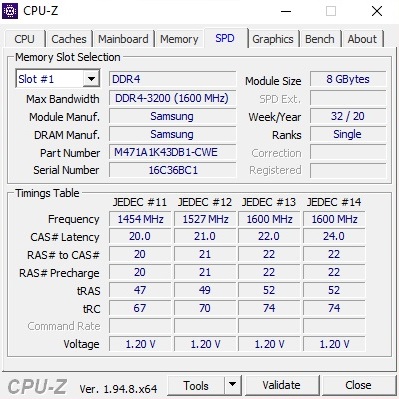
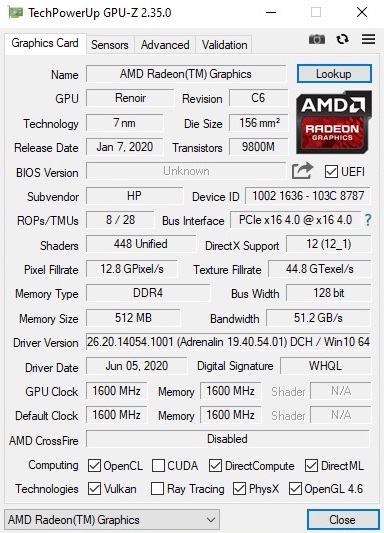
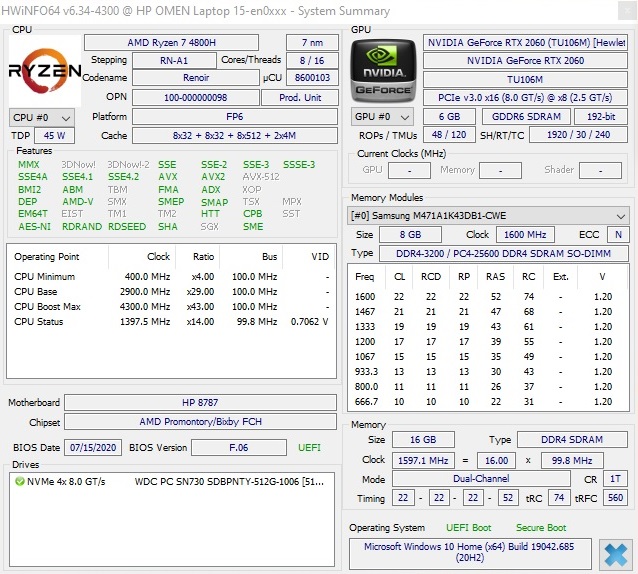
HP'nin Omen 15'i çok geniş bir donanım portföyüne sahiptir. Yalnızca çeşitli Intel modelleri değil, aynı zamanda birkaç AMD çeşidi de vardır. Grafik kartı olarak Nvidia'nın Turing neslinden orta sınıf veya yüksek kaliteli bir çip kullanılır (GeForce GTX 1650 Ti - RTX 2070). En iyi fiyat-performans oranlarından biri şu anda bizim tarafımızdan test edilen Omen 15-en0375ng tarafından yaklaşık 1.260 Euro karşılığında sunulmaktadır (~ 1530 $, başlangıçta belirtildiği gibi bir Ryzen 7 4800H ve GeForce RTX 2060 içerir). Oluşturulan resimler, 1.920 x 1.080 piksellik mat bir IPS panelinde görüntülenir. Ek olarak, çift kanal modunda 2x 8 GB DDR4-3,200 RAM ve yerden tasarruf sağlayan M.2 formatında 512 GB NVMe SSD vardır. Paket, işletim sistemi olarak Windows 10 Home 64 bit ile yuvarlanır.
Omen 15-en0375ng'nin rakipleri arasında Schenker XMG Core 15, Asus TUF A15, Acer Predator Triton 300, Aorus 5 KB ve Lenovo Legion 5 gibi RTX 2060'a sahip diğer 15 inçlik bütçeli oyuncular yer alıyor. Bu dizüstü bilgisayarların her biri tabloda karşılaştırma cihazları olarak görünür.
Possible competitors in comparison
Derecelendirme | Tarih | Modeli | Ağırlık | Yükseklik | Boyut | Çözünürlük | Fiyat |
|---|---|---|---|---|---|---|---|
| 82.8 % v7 (old) | 02/2021 | HP Omen 15-en0375ng R7 4800H, GeForce RTX 2060 Mobile | 2.2 kg | 23 mm | 15.60" | 1920x1080 | |
| 82.1 % v7 (old) | Schenker XMG Core 15 GK5NR0O R7 4800H, GeForce RTX 2060 Mobile | 2 kg | 19.9 mm | 15.60" | 1920x1080 | ||
| 82.7 % v7 (old) | Asus TUF Gaming A15 FA506IV-HN172 R7 4800H, GeForce RTX 2060 Mobile | 2.2 kg | 24.9 mm | 15.60" | 1920x1080 | ||
| 82.1 % v7 (old) | Acer Predator Triton 300 PT315-52-79LP i7-10750H, GeForce RTX 2060 Mobile | 2.1 kg | 19.9 mm | 15.60" | 1920x1080 | ||
| 83.7 % v7 (old) | Aorus 5 KB i7-10750H, GeForce RTX 2060 Mobile | 2.1 kg | 28 mm | 15.60" | 1920x1080 | ||
| 83.3 % v7 (old) | 07/2020 | Lenovo Legion 5 15IMH05H i5-10300H, GeForce RTX 2060 Mobile | 2.5 kg | 26.1 mm | 15.60" | 1920x1080 |
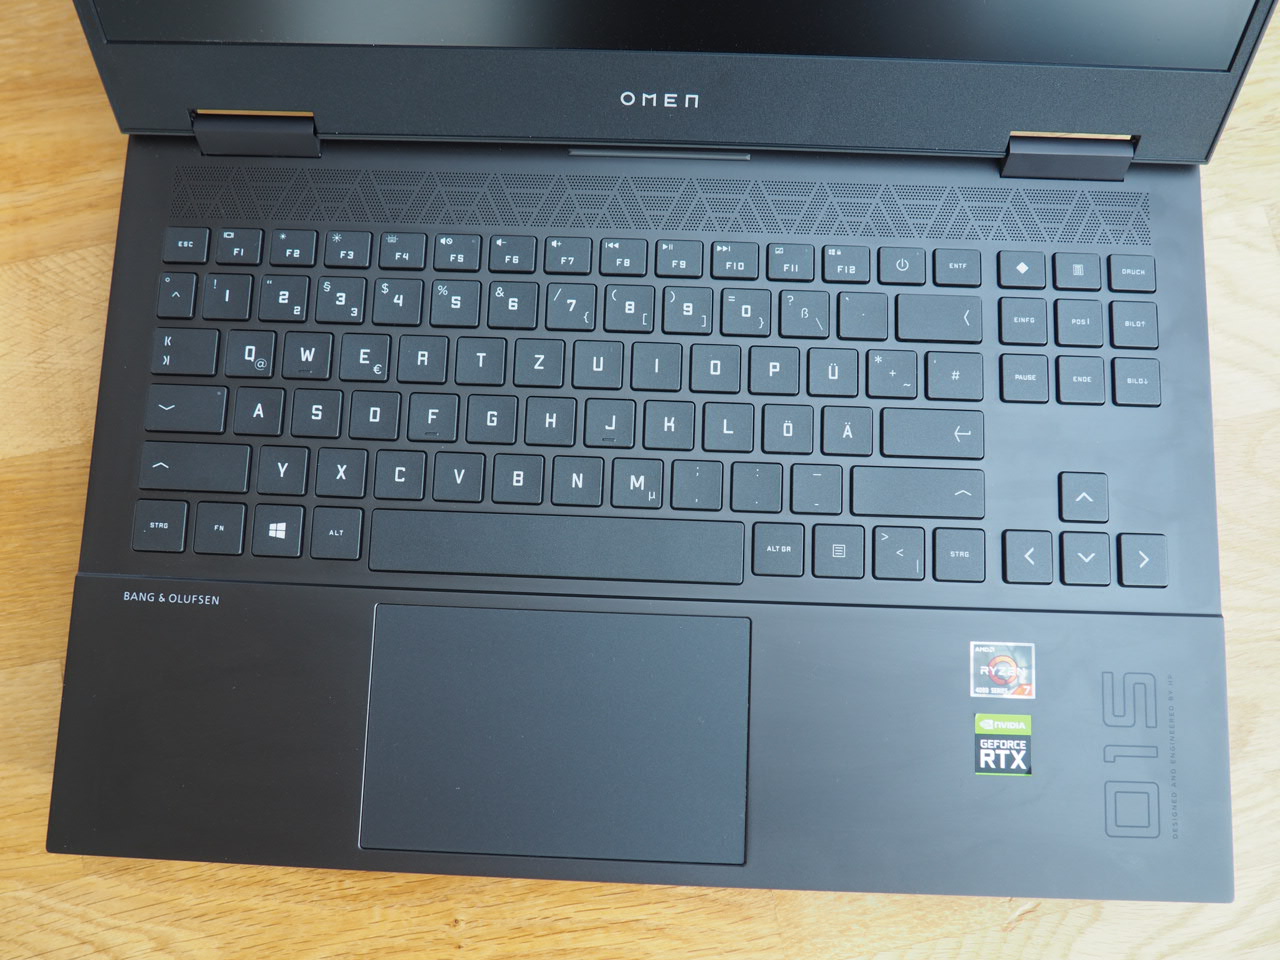
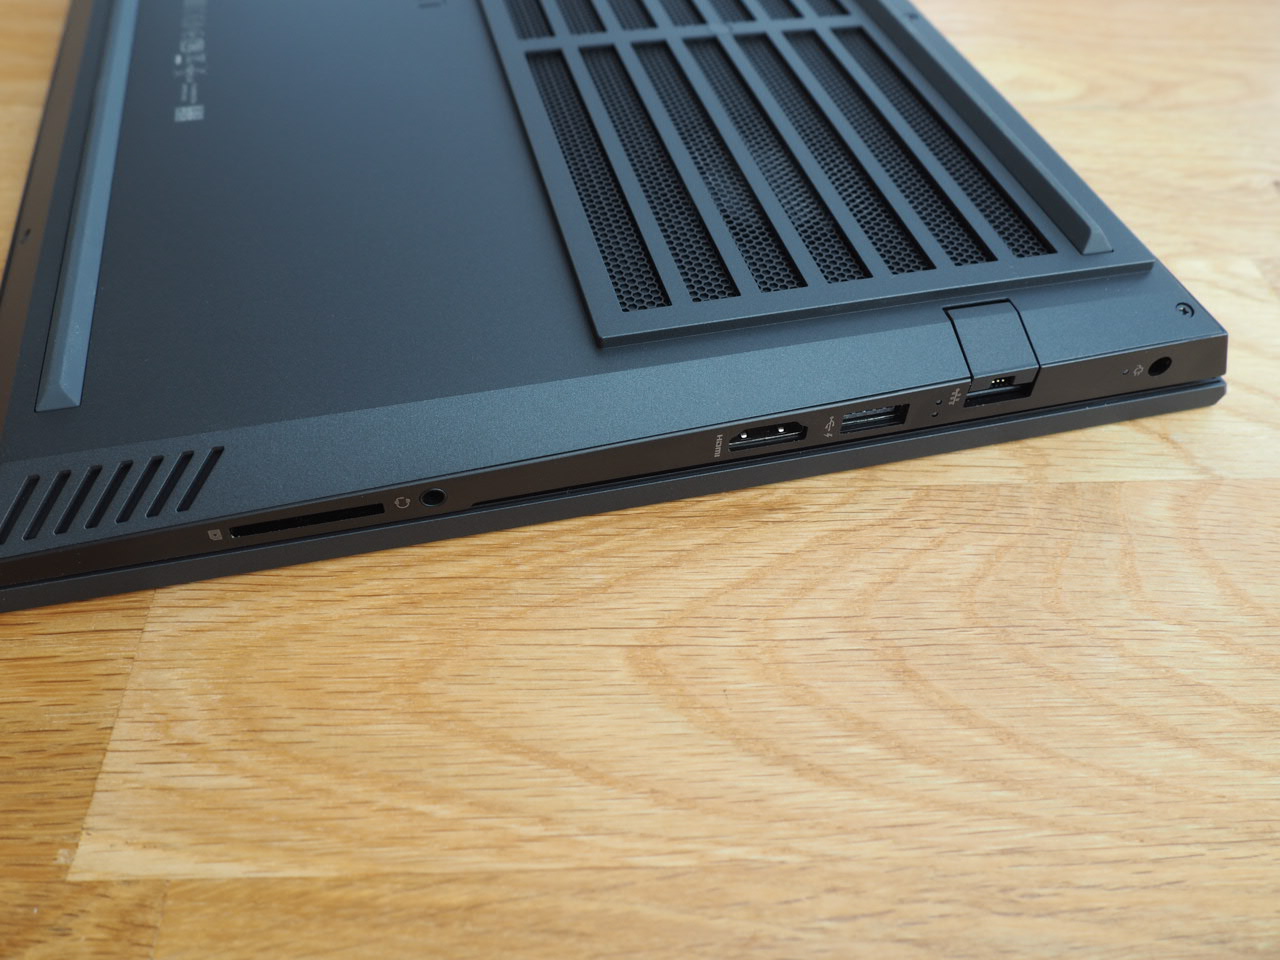
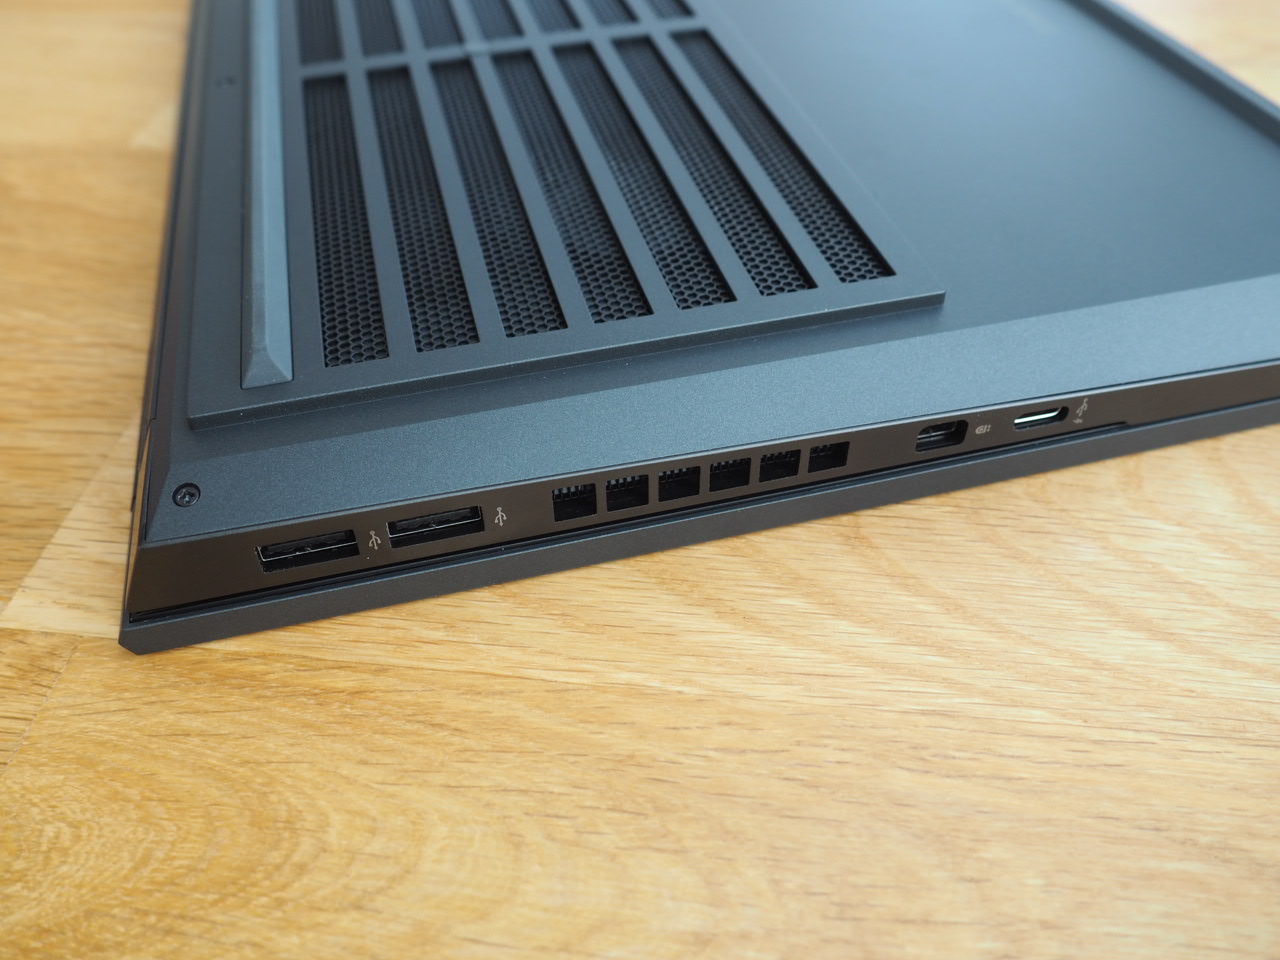
Şasi temelde birkaç ay önce test ettiğimiz Omen 15-ek0456ng ile aynıdır, bu nedenle şasiyi, ekipmanı ve giriş cihazlarını tekrar analiz etmekten kaçınırız. Ancak modeller tamamen aynı değil. Örneğin, AMD sürümünde kırmızı yerine beyaz klavye etiketi veya aydınlatması vardır. Alıcılar ayrıca Thunderbolt 3 bağlantı noktası olmadan da yapmak zorunda kalacak.
SDCardreader
| SD Card Reader | |
| average JPG Copy Test (av. of 3 runs) | |
| Sınıf ortalaması Gaming (20.9 - 210, n=55, son 2 yıl) | |
| Aorus 5 KB (Toshiba Exceria Pro SDXC 64 GB UHS-II) | |
| HP Omen 15-en0375ng (Toshiba Exceria Pro SDXC 64 GB UHS-II) | |
| Schenker XMG Core 15 GK5NR0O (Toshiba Exceria Pro SDXC 64 GB UHS-II) | |
| maximum AS SSD Seq Read Test (1GB) | |
| Sınıf ortalaması Gaming (25.5 - 261, n=52, son 2 yıl) | |
| HP Omen 15-en0375ng (Toshiba Exceria Pro SDXC 64 GB UHS-II) | |
| Aorus 5 KB (Toshiba Exceria Pro SDXC 64 GB UHS-II) | |
| Schenker XMG Core 15 GK5NR0O (Toshiba Exceria Pro SDXC 64 GB UHS-II) | |
İletişim
| Networking | |
| iperf3 transmit AX12 | |
| Aorus 5 KB | |
| Schenker XMG Core 15 GK5NR0O | |
| Acer Predator Triton 300 PT315-52-79LP | |
| Asus TUF Gaming A15 FA506IV-HN172 | |
| HP Omen 15-en0375ng | |
| Lenovo Legion 5 15IMH05H | |
| iperf3 receive AX12 | |
| Schenker XMG Core 15 GK5NR0O | |
| Aorus 5 KB | |
| Acer Predator Triton 300 PT315-52-79LP | |
| Lenovo Legion 5 15IMH05H | |
| Asus TUF Gaming A15 FA506IV-HN172 | |
| HP Omen 15-en0375ng | |
Web kamerası


Görüntüle
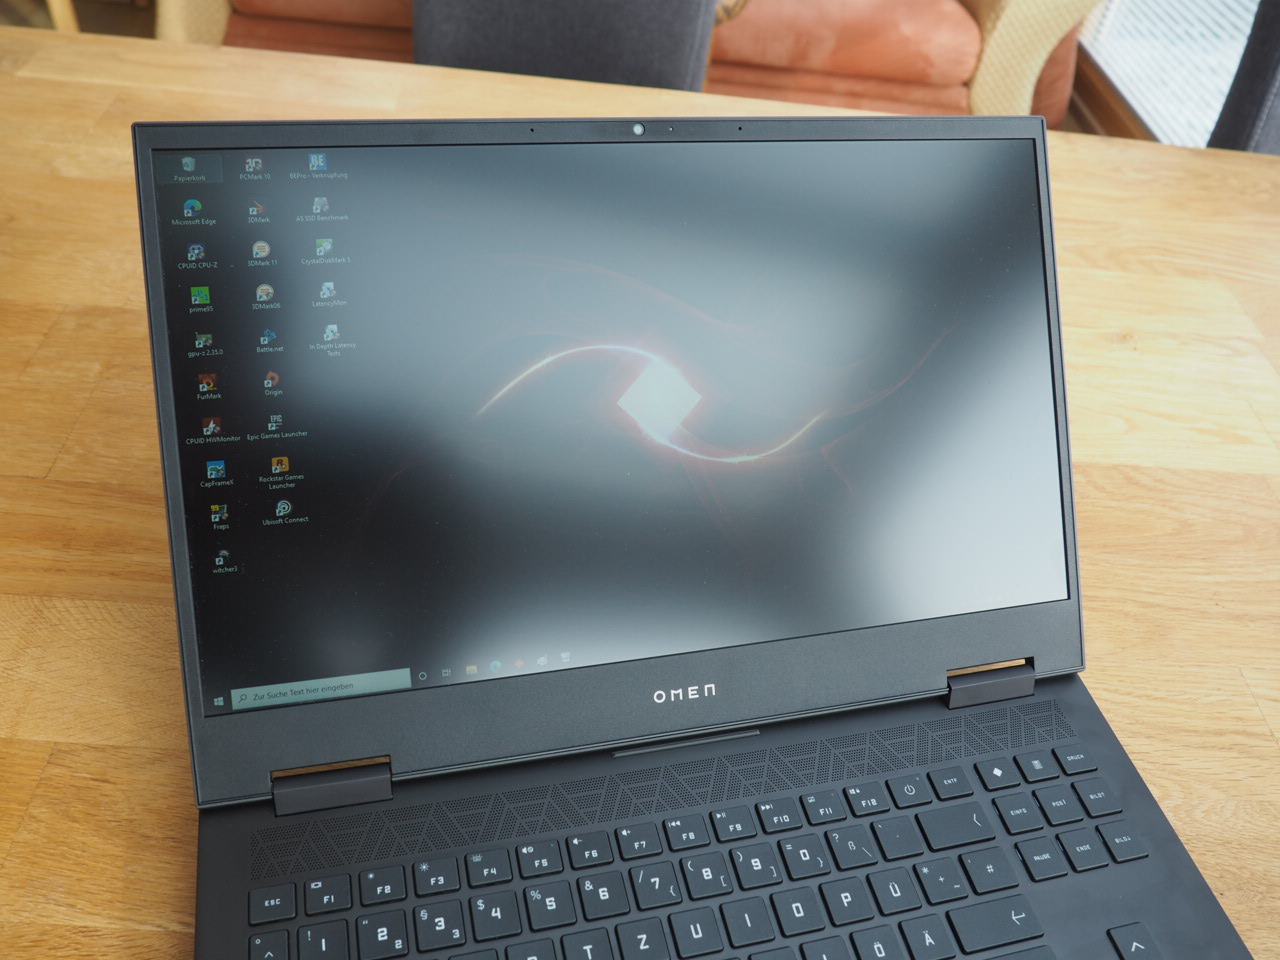
Doğrudan en büyük hayal kırıklıklarından birine geçelim: ekran. Intel varyantı testte 144 Hz'lik iyi bir panel ile gösteriş yaparken, AMD sürümü sadece vasat bir 60 Hz panele sahip.
| |||||||||||||||||||||||||
Aydınlatma: 88 %
Batarya modunda parlaklık: 297 cd/m²
Kontrast: 900:1 (Siyah: 0.33 cd/m²)
ΔE ColorChecker Calman: 4.54 | ∀{0.5-29.43 Ø4.73}
calibrated: 4.66
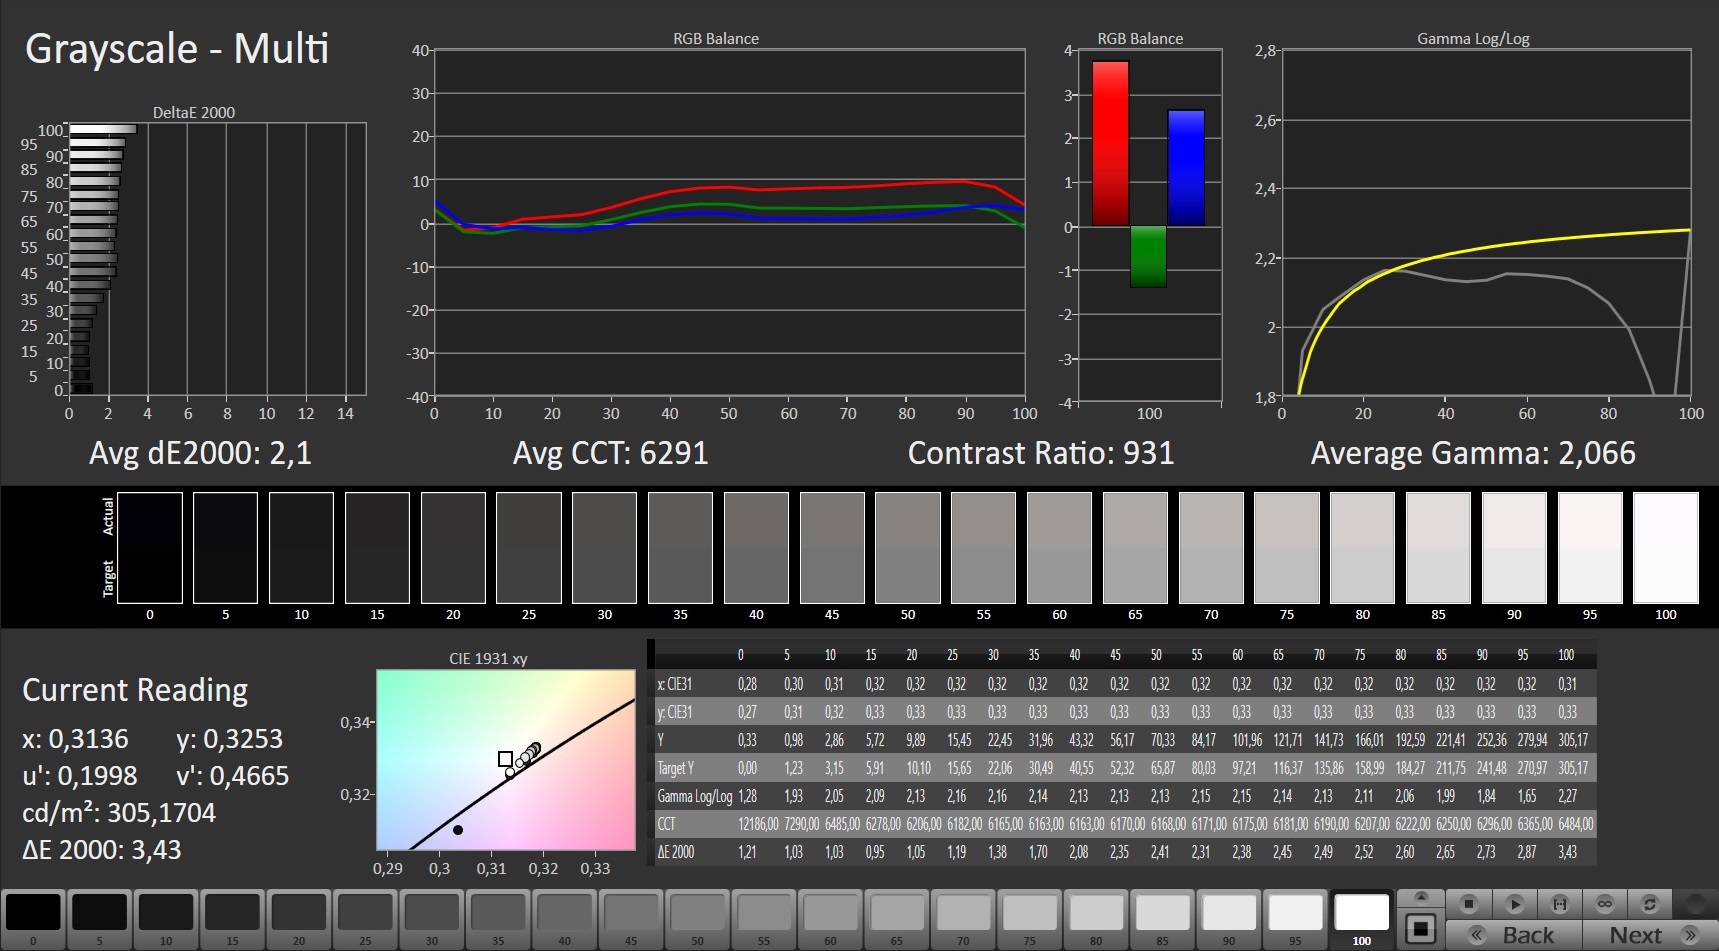
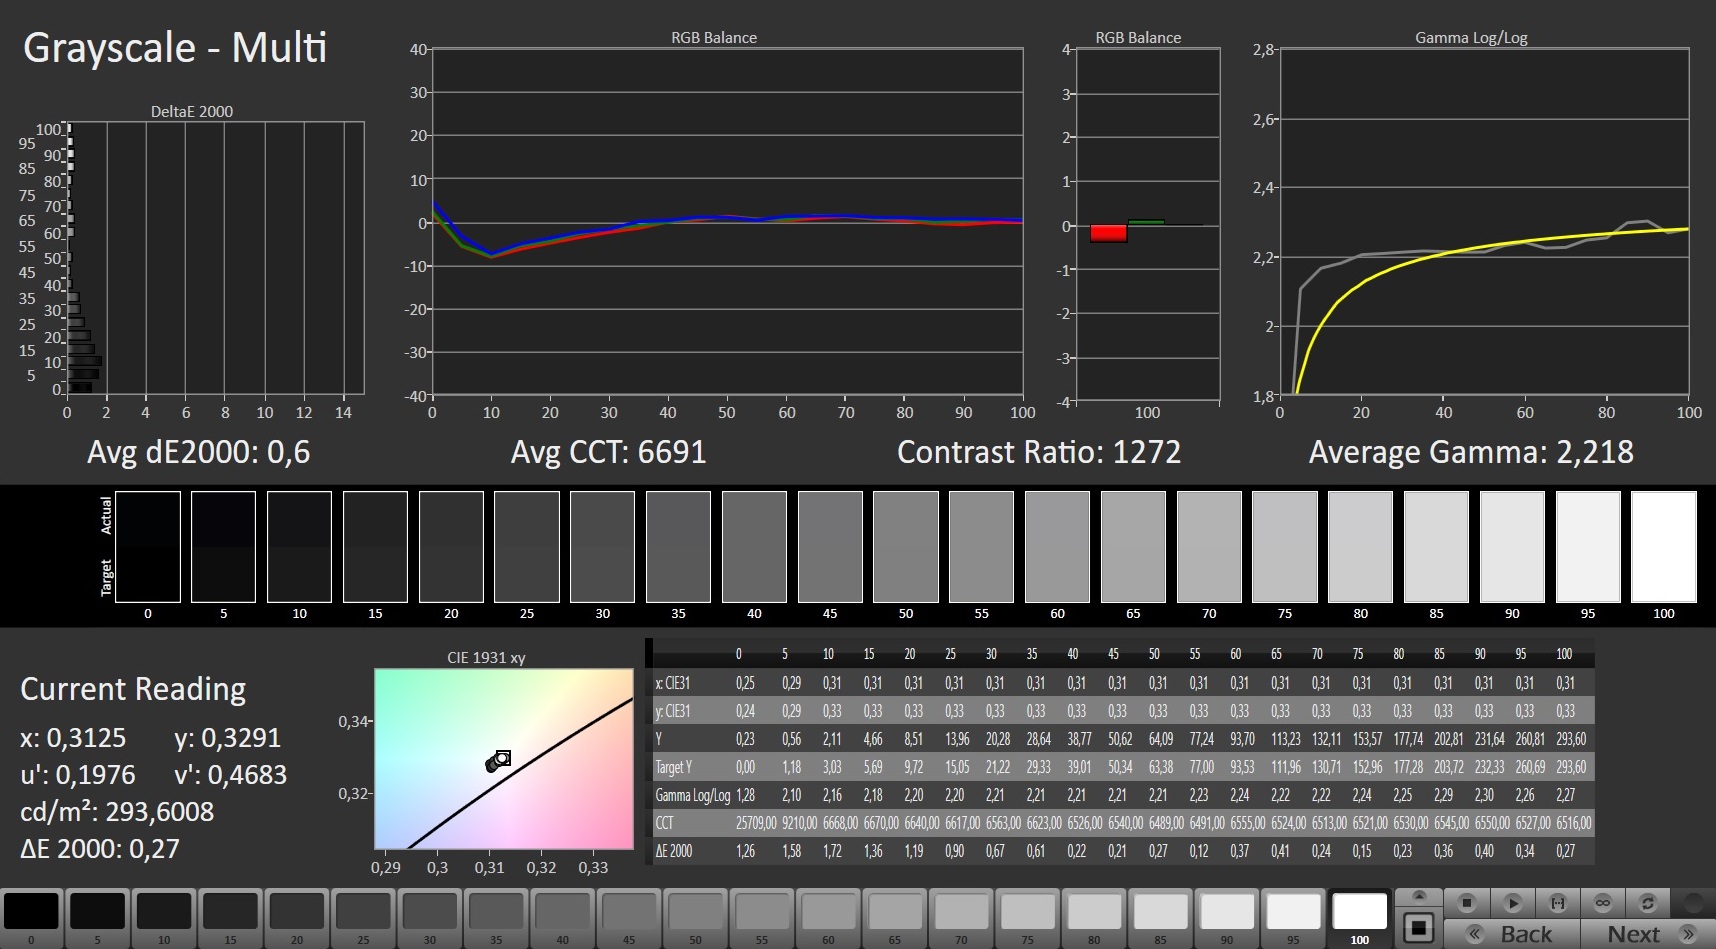
ΔE Greyscale Calman: 2.1 | ∀{0.09-98 Ø4.97}
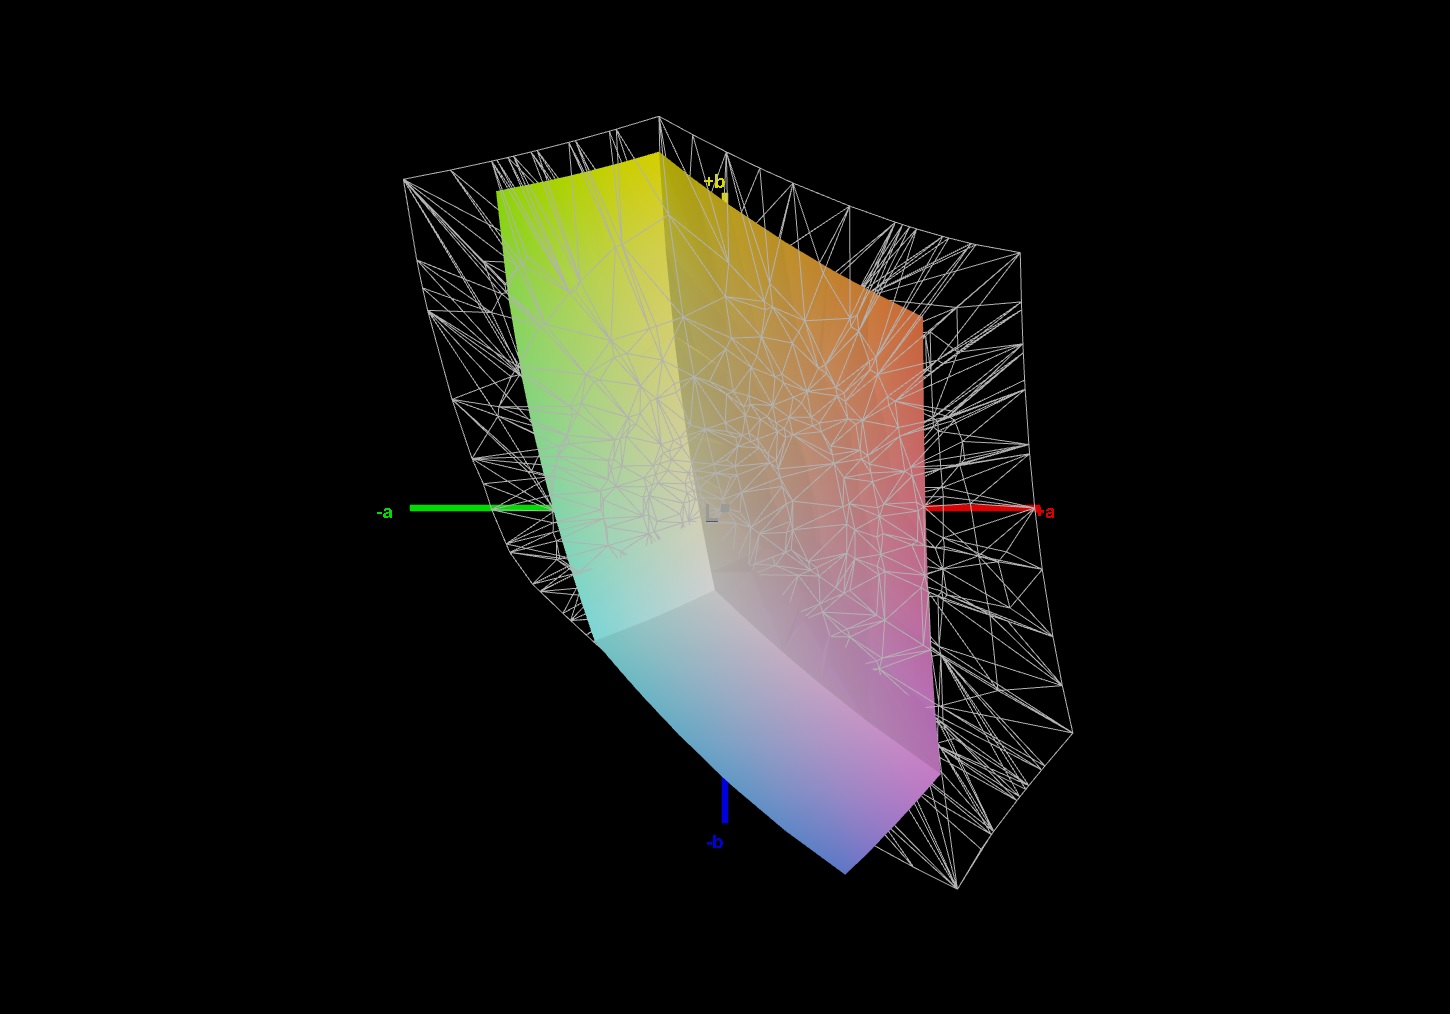
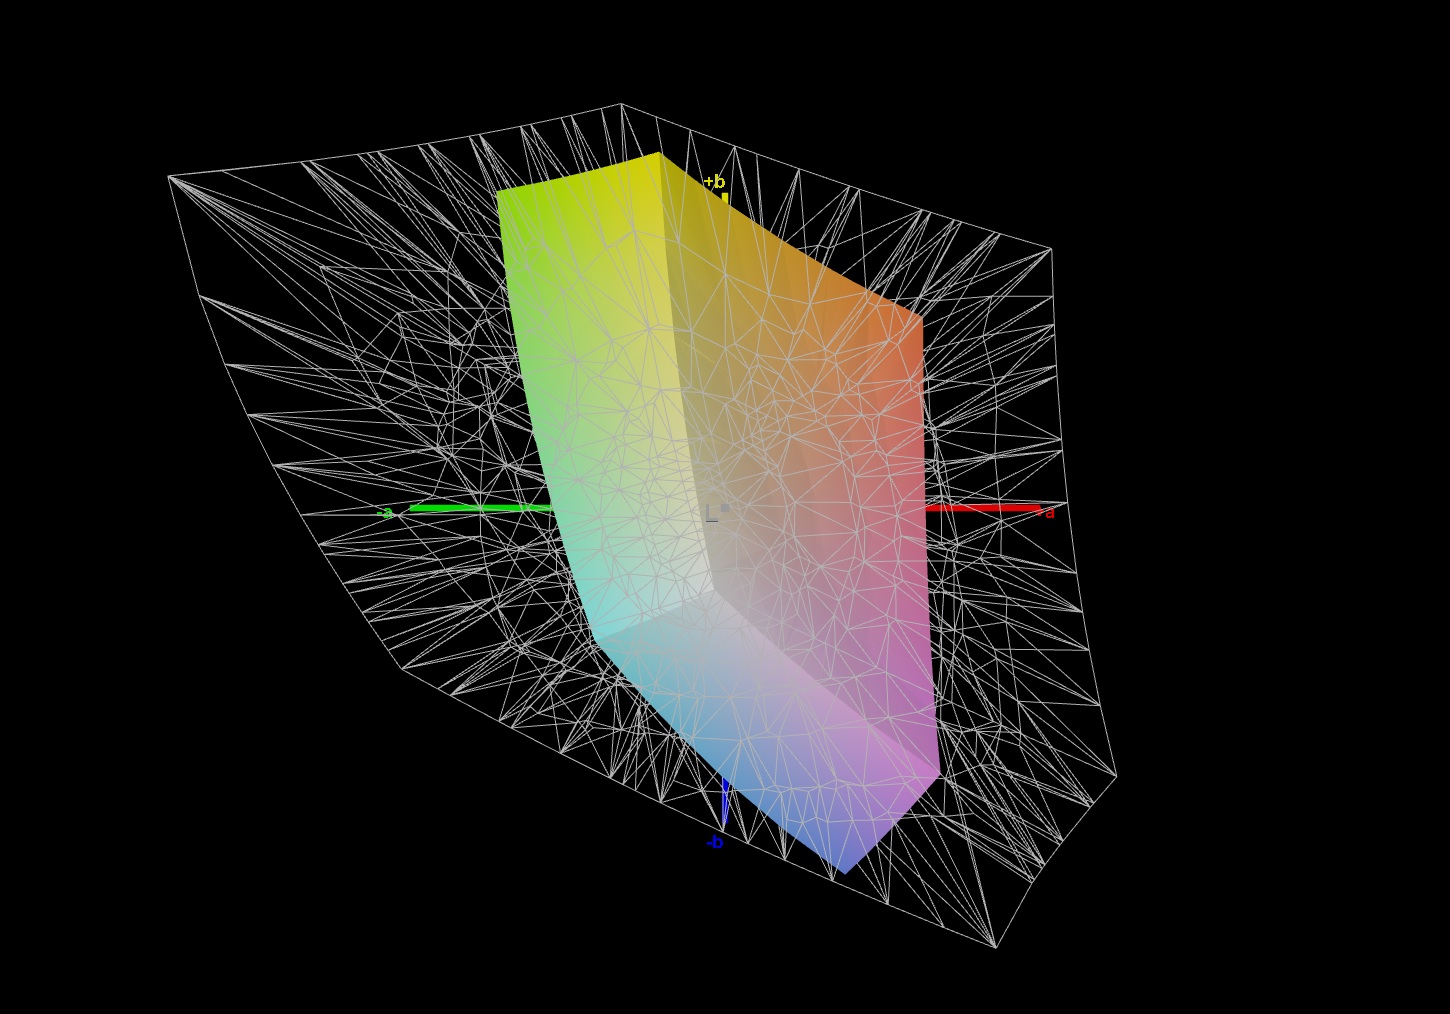
58% sRGB (Argyll 1.6.3 3D)
40% AdobeRGB 1998 (Argyll 1.6.3 3D)
40.42% AdobeRGB 1998 (Argyll 3D)
57.6% sRGB (Argyll 3D)
39.12% Display P3 (Argyll 3D)
Gamma: 2.066
CCT: 6291 K
| HP Omen 15-en0375ng BOE0852, IPS, 1920x1080, 15.6" | Schenker XMG Core 15 GK5NR0O LM156LF-1F02, IPS, 1920x1080, 15.6" | Asus TUF Gaming A15 FA506IV-HN172 LM156LF-2F01, IPS, 1920x1080, 15.6" | Acer Predator Triton 300 PT315-52-79LP BOE08FB, IPS, 1920x1080, 15.6" | Aorus 5 KB LG Philips LP156WFG-SPB2 (LGD05E8), IPS, 1920x1080, 15.6" | Lenovo Legion 5 15IMH05H BOE CQ NV156FHM-NX1, IPS, 1920x1080, 15.6" | |
|---|---|---|---|---|---|---|
| Display | 69% | 0% | 1% | 61% | -1% | |
| Display P3 Coverage (%) | 39.12 | 67.2 72% | 38.92 -1% | 39.51 1% | 63.4 62% | 38.8 -1% |
| sRGB Coverage (%) | 57.6 | 95.9 66% | 58.5 2% | 58.1 1% | 92.8 61% | 57.8 0% |
| AdobeRGB 1998 Coverage (%) | 40.42 | 68.5 69% | 40.22 0% | 40.81 1% | 64.8 60% | 40.09 -1% |
| Response Times | 61% | -14% | 4% | 50% | 16% | |
| Response Time Grey 50% / Grey 80% * (ms) | 30.4 ? | 9.6 ? 68% | 34 ? -12% | 29.2 ? 4% | 14.4 ? 53% | 26 ? 14% |
| Response Time Black / White * (ms) | 20.8 ? | 9.6 ? 54% | 24 ? -15% | 20 ? 4% | 11.2 ? 46% | 17 ? 18% |
| PWM Frequency (Hz) | 200 ? | |||||
| Screen | 0% | 1% | -8% | 33% | 0% | |
| Brightness middle (cd/m²) | 297 | 312 5% | 280 -6% | 279 -6% | 318 7% | 301 1% |
| Brightness (cd/m²) | 275 | 290 5% | 254 -8% | 257 -7% | 298 8% | 277 1% |
| Brightness Distribution (%) | 88 | 87 -1% | 88 0% | 89 1% | 87 -1% | 77 -12% |
| Black Level * (cd/m²) | 0.33 | 0.2 39% | 0.15 55% | 0.31 6% | 0.3 9% | 0.26 21% |
| Contrast (:1) | 900 | 1560 73% | 1867 107% | 900 0% | 1060 18% | 1158 29% |
| Colorchecker dE 2000 * | 4.54 | 4.84 -7% | 5.89 -30% | 5.84 -29% | 2.49 45% | 5.12 -13% |
| Colorchecker dE 2000 max. * | 18.92 | 13.85 27% | 19 -0% | 21.8 -15% | 5.06 73% | 8.86 53% |
| Colorchecker dE 2000 calibrated * | 4.66 | 1.77 62% | 4.79 -3% | 4.54 3% | 1.53 67% | 4.88 -5% |
| Greyscale dE 2000 * | 2.1 | 9 -329% | 4.08 -94% | 3.1 -48% | 1.6 24% | 3.47 -65% |
| Gamma | 2.066 106% | 2.105 105% | 2.33 94% | 2.116 104% | 2.211 100% | 2.37 93% |
| CCT | 6291 103% | 8099 80% | 7303 89% | 6577 99% | 6714 97% | 7062 92% |
| Color Space (Percent of AdobeRGB 1998) (%) | 40 | 68 70% | 37 -7% | 41 2% | 65 63% | 37 -7% |
| Color Space (Percent of sRGB) (%) | 58 | 92 59% | 58 0% | 59 2% | 89 53% | 57 -2% |
| Toplam Ortalama (Program / Ayarlar) | 43% /
21% | -4% /
-1% | -1% /
-5% | 48% /
41% | 5% /
2% |
* ... daha küçük daha iyidir
Tepki süresinin yanı sıra, kontrast da çok daha kötü. AMD modelinin 1400: 1'den fazlası yerine yalnızca 900: 1 oranı vardır. Intel modeli, renk doğruluğu, siyah değeri veya parlaklık gibi diğer disiplinlerde de genellikle öndedir. Omen 15-en0375ng, yetersiz parlaklığı nedeniyle (yaklaşık 275 cd / m²) dış mekan kullanımı için pek uygun değildir.
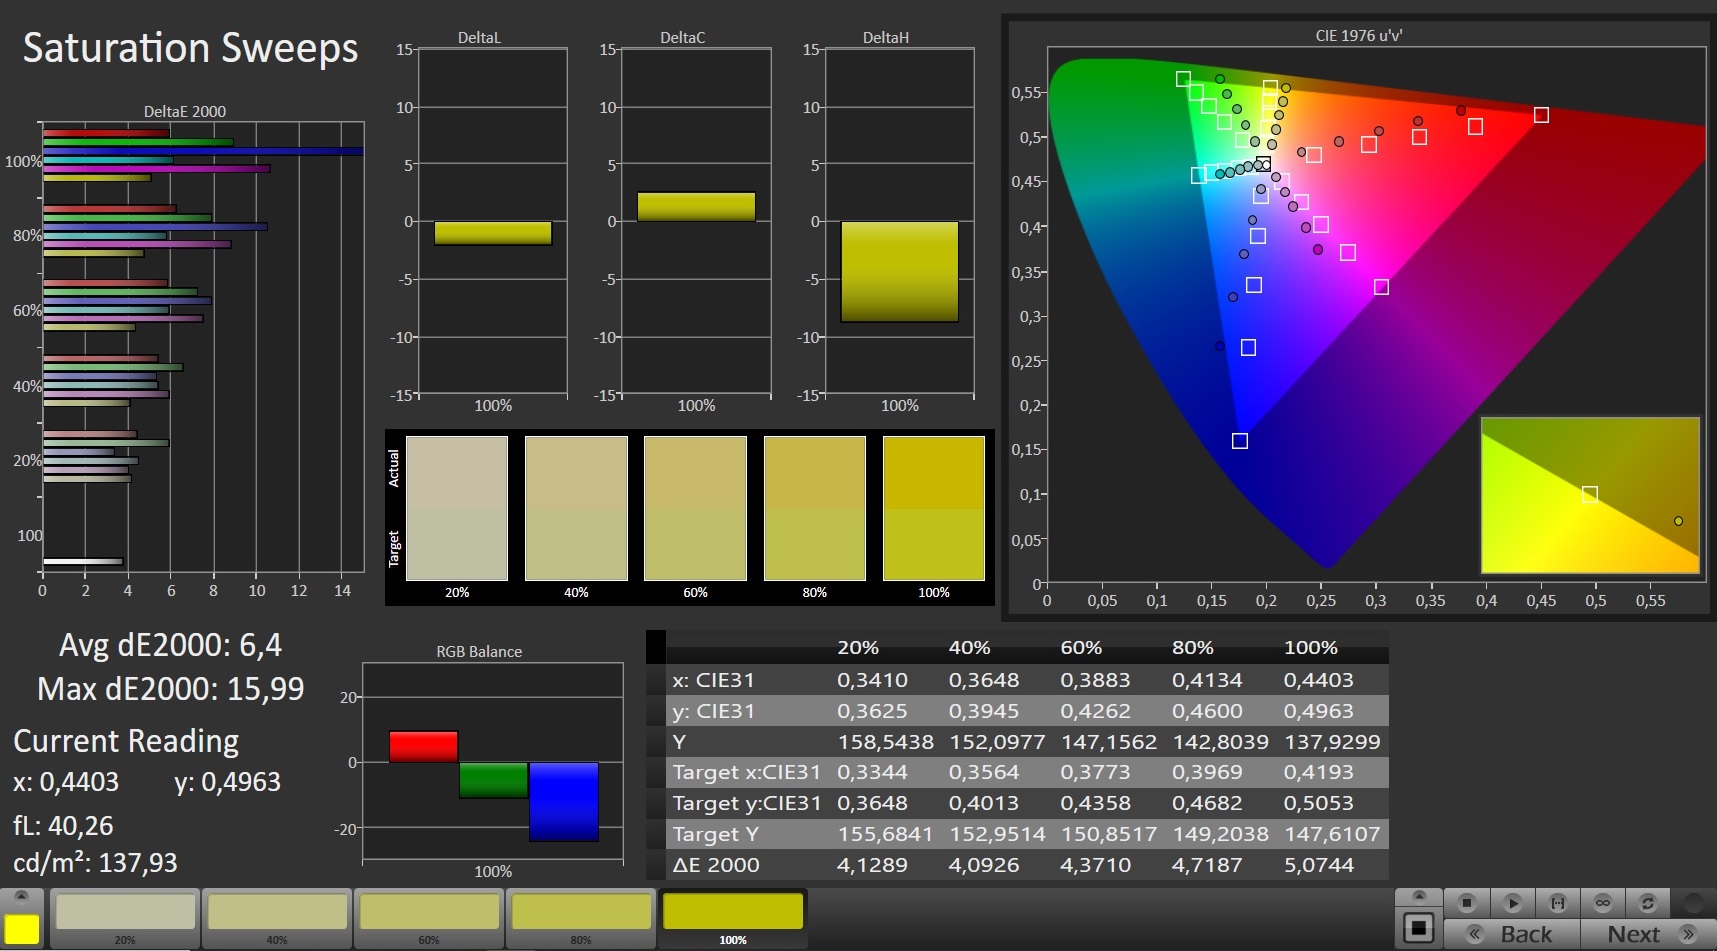
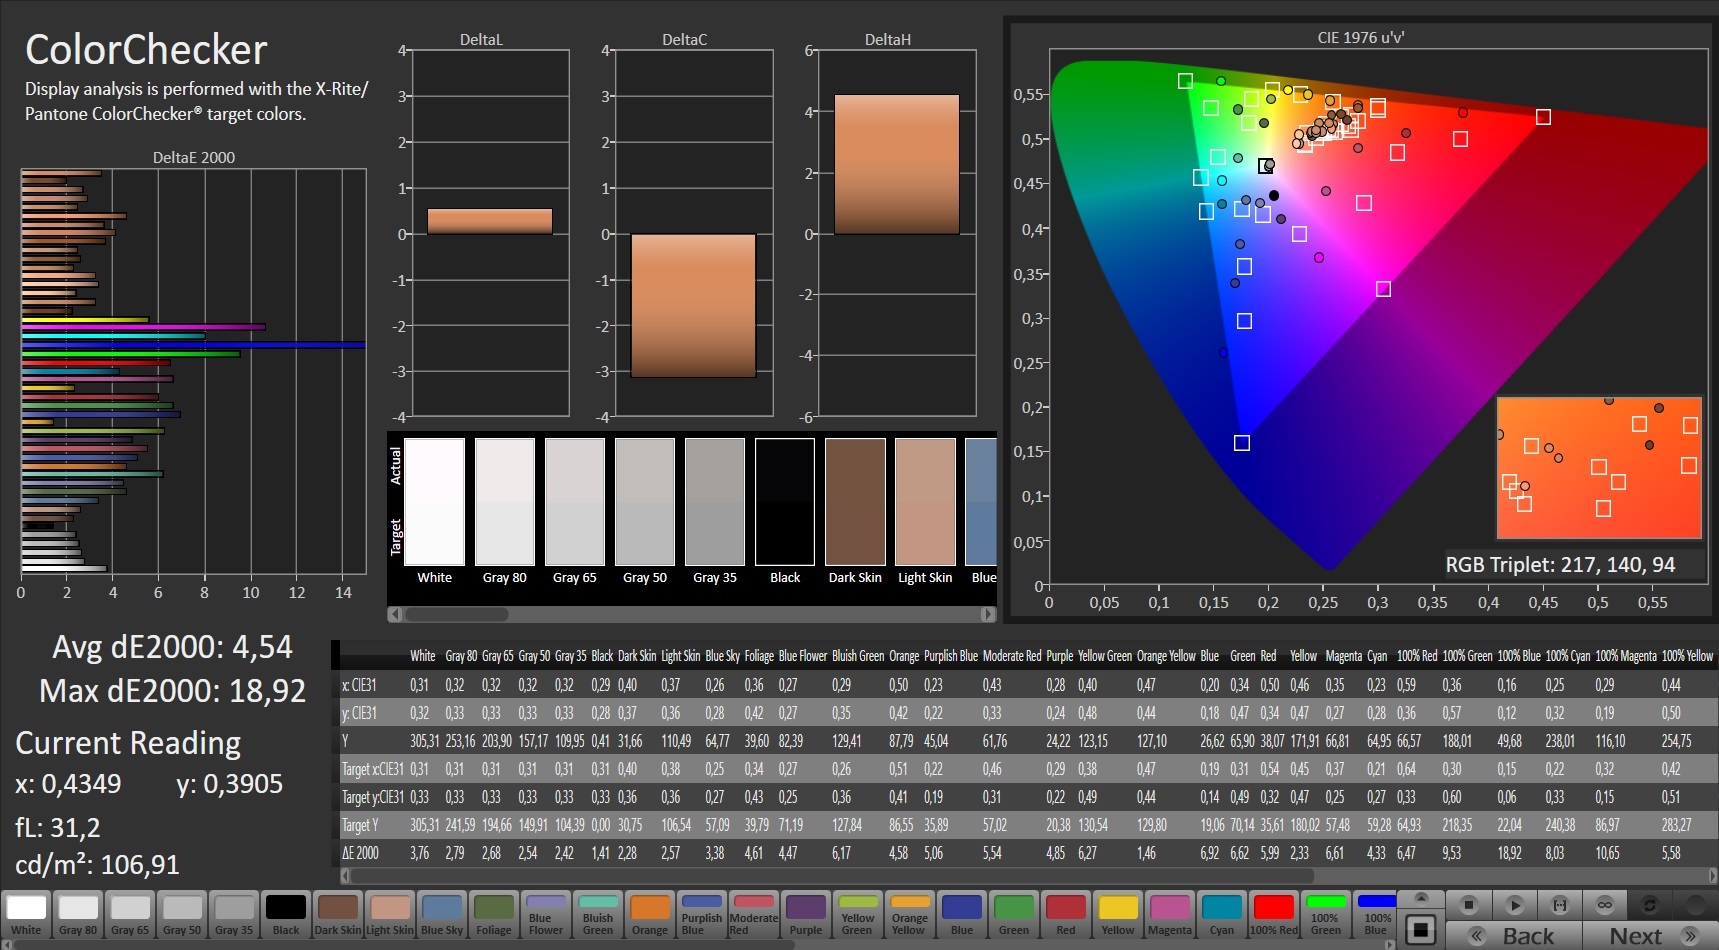
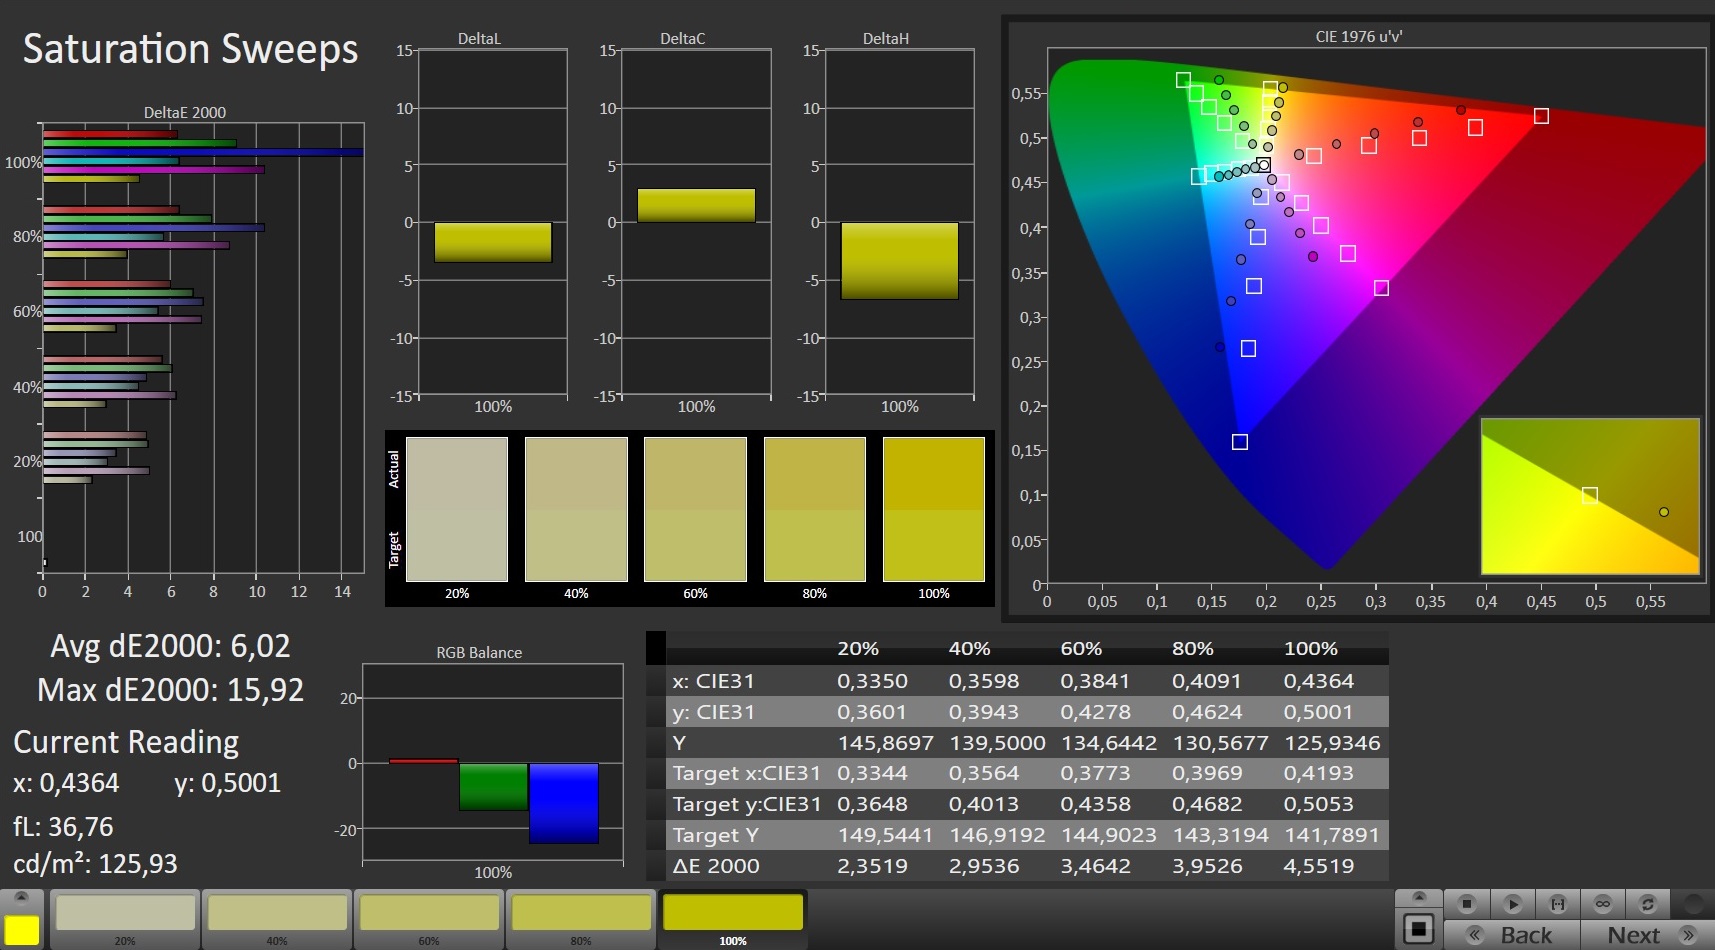
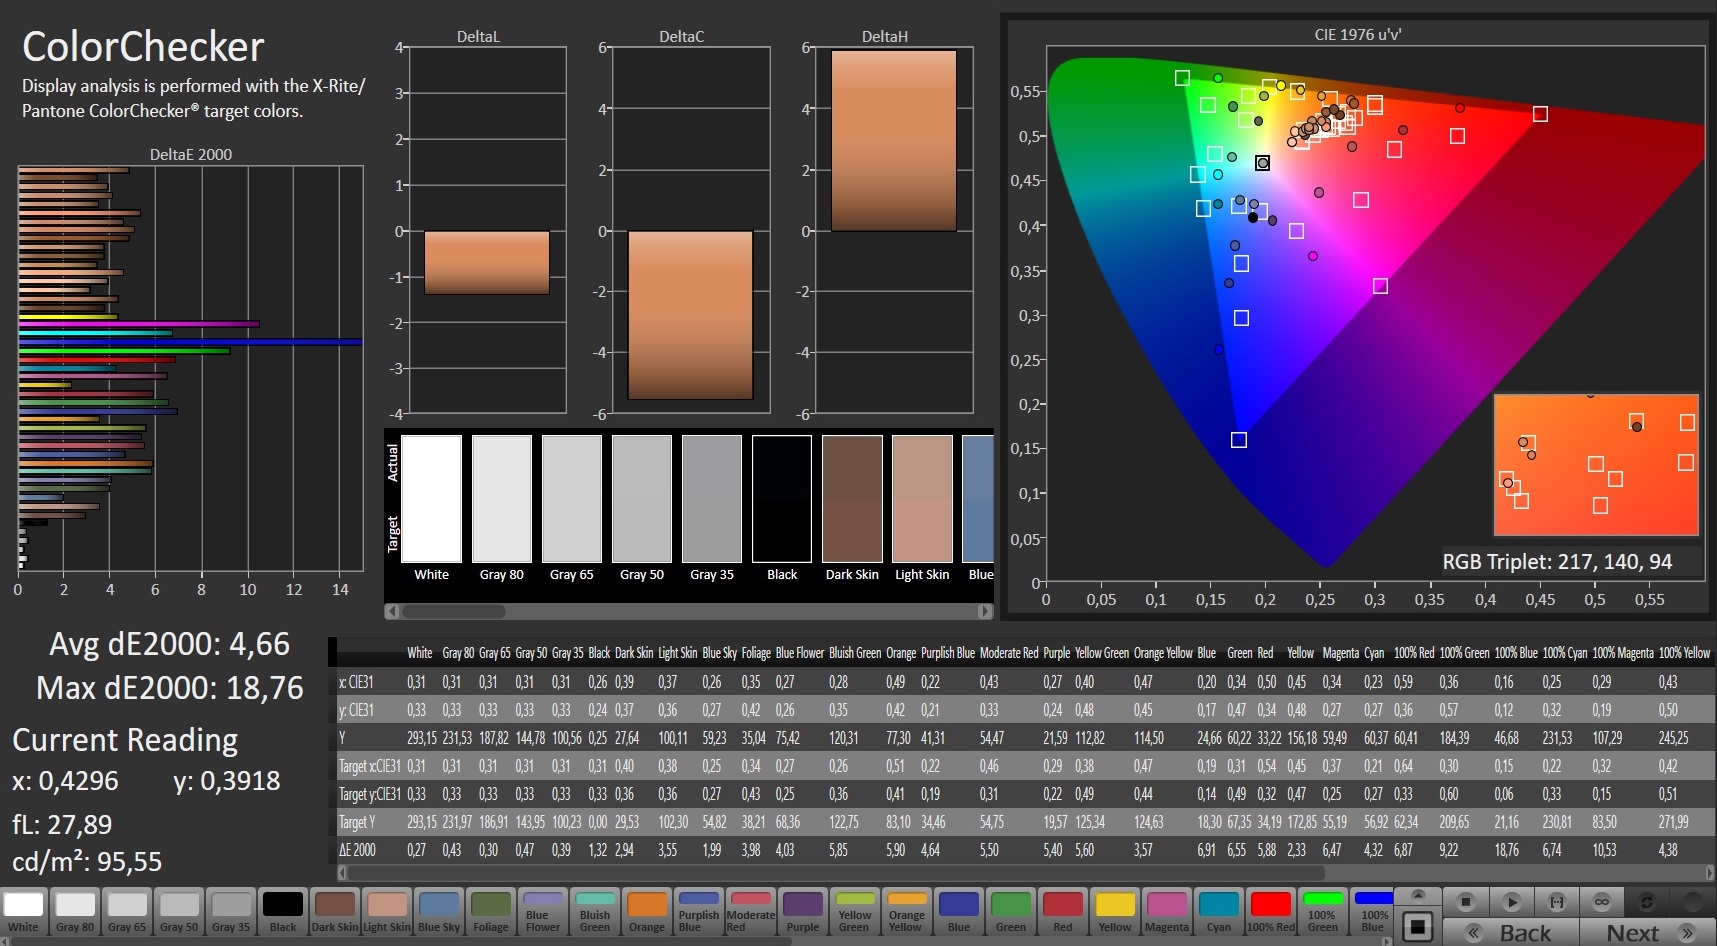
Bununla birlikte, küçük renk alanı gözümüzdeki en büyük dezavantajdır:% 58 sRGB ve% 40 AdobeRGB, oldukça soluk ve farklılaşmamış resimlerle sonuçlanır. İyi görüş açısı kararlılığı, bu eksikliği ancak bir dereceye kadar telafi edebilir. Sonuç olarak, görüntü kalitesi dizüstü bilgisayarın fiyatına adil davranmıyor. Bütçe ürünü veya lüks bir makine olup olmadığına bakılmaksızın: Oyun dizüstü bilgisayarları için en az 300 cd / m² parlaklığa, en az 1000: 1 kontrasta ve en az% 80 sRGB kapsamına sahip yüksek kaliteli bir panel bekliyoruz - ve 120 Hz üstü 1.000 Euro için (~ 1214 $).
Ancak HP, düşük performansında yalnız değil. Schenker Core 15 ve Aorus 5 KB haricinde, yarışmanın görüntüleri de arzulanan çok şey bırakıyor. Dikkat:% 100 parlaklığın altında, ekran 200 Hz ile titriyor ve bu da hassas kişiler için sorunlara neden olabilir.

Yanıt Sürelerini Görüntüle
| ↔ Tepki Süresi Siyahtan Beyaza | ||
|---|---|---|
| 20.8 ms ... yükseliş ↗ ve sonbahar↘ birleşimi | ↗ 11.6 ms yükseliş | 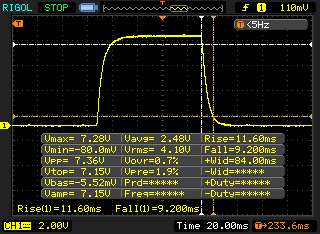 |
| ↘ 9.2 ms sonbahar | ||
| Ekran, testlerimizde iyi yanıt oranları gösteriyor ancak rekabetçi oyuncular için çok yavaş olabilir. Karşılaştırıldığında, test edilen tüm cihazlar 0.1 (minimum) ile 240 (maksimum) ms arasında değişir. » Tüm cihazların 46 %'si daha iyi. Bu, ölçülen yanıt süresinin test edilen tüm cihazların ortalamasına benzer olduğu anlamına gelir (19.9 ms). | ||
| ↔ Tepki Süresi %50 Griden %80 Griye | ||
| 30.4 ms ... yükseliş ↗ ve sonbahar↘ birleşimi | ↗ 16.4 ms yükseliş | 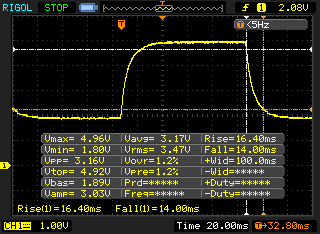 |
| ↘ 14 ms sonbahar | ||
| Ekran, testlerimizde yavaş yanıt oranları gösteriyor ve oyuncular için yetersiz olacaktır. Karşılaştırıldığında, test edilen tüm cihazlar 0.165 (minimum) ile 636 (maksimum) ms arasında değişir. » Tüm cihazların 41 %'si daha iyi. Bu, ölçülen yanıt süresinin test edilen tüm cihazların ortalamasına benzer olduğu anlamına gelir (31.1 ms). | ||
Ekran Titremesi / PWM (Darbe Genişliği Modülasyonu)
| Ekran titriyor / PWM algılandı | 200 Hz | ≤ 99 % parlaklık ayarı | 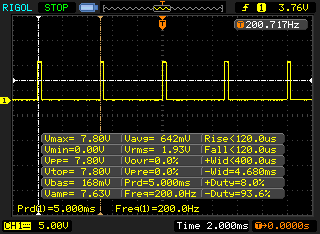 |
Ekran arka ışığı 200 Hz'de titriyor (en kötü durum, örneğin PWM kullanılması) 99 % ve altındaki parlaklık ayarında titreme algılandı. Bu parlaklık ayarının üzerinde titreme veya PWM olmamalıdır. 200 Hz frekansı nispeten düşüktür, bu nedenle hassas kullanıcılar belirtilen parlaklık ayarında ve altında muhtemelen titremeyi fark edecek ve göz yorgunluğu yaşayacaktır. Karşılaştırıldığında: Test edilen tüm cihazların %52 %'si ekranı karartmak için PWM kullanmıyor. PWM tespit edilirse, ortalama 7798 (minimum: 5 - maksimum: 343500) Hz ölçüldü. | |||
Test conditions
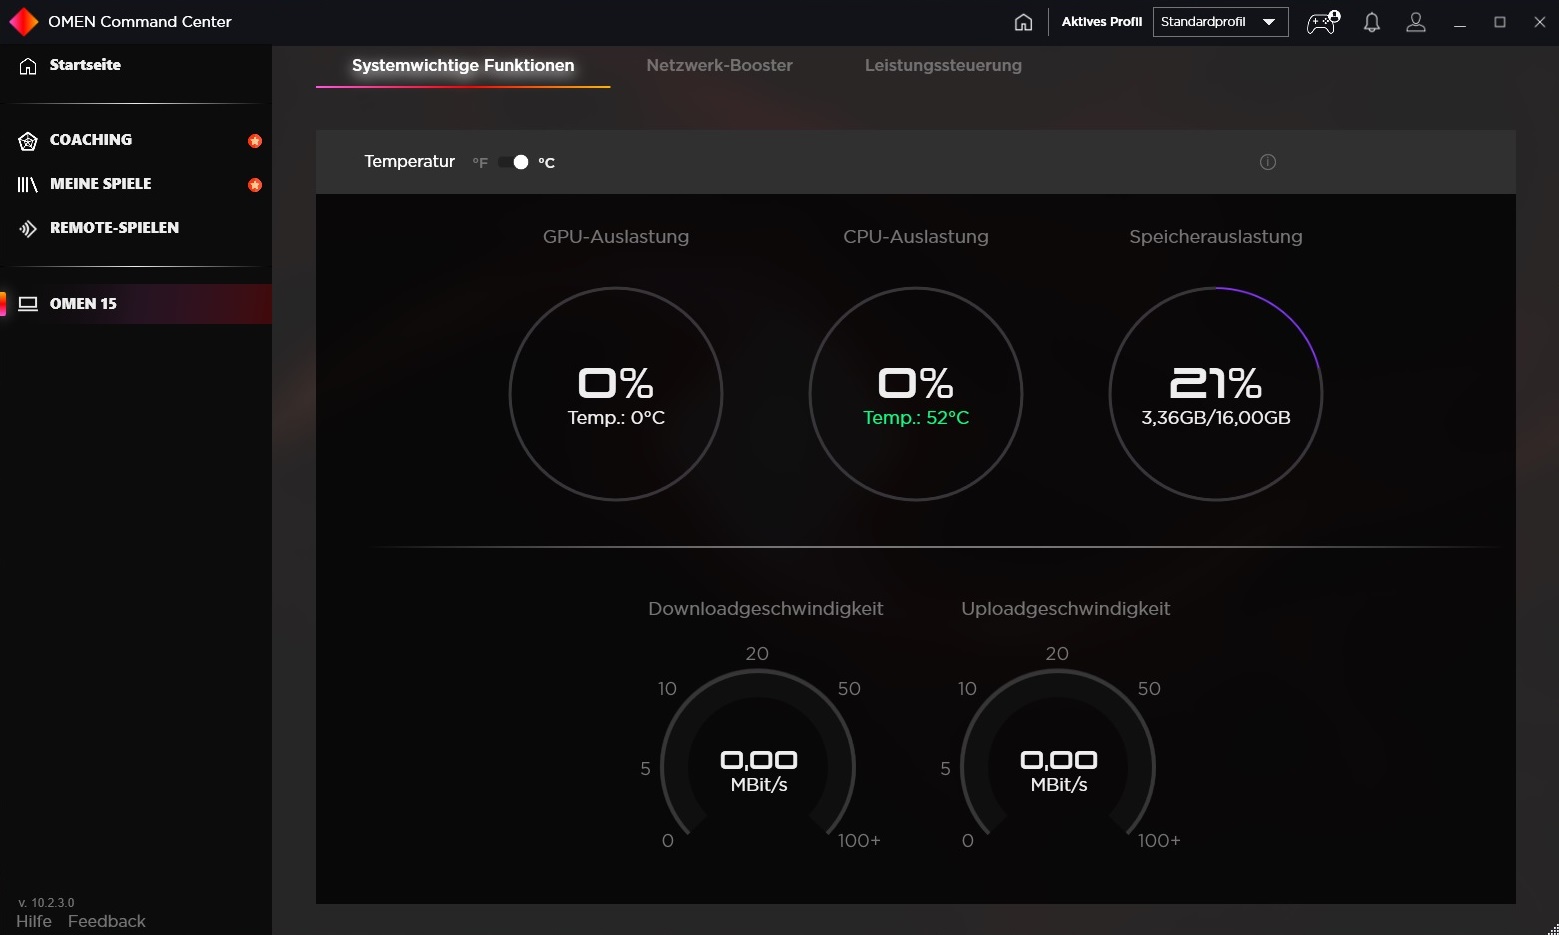
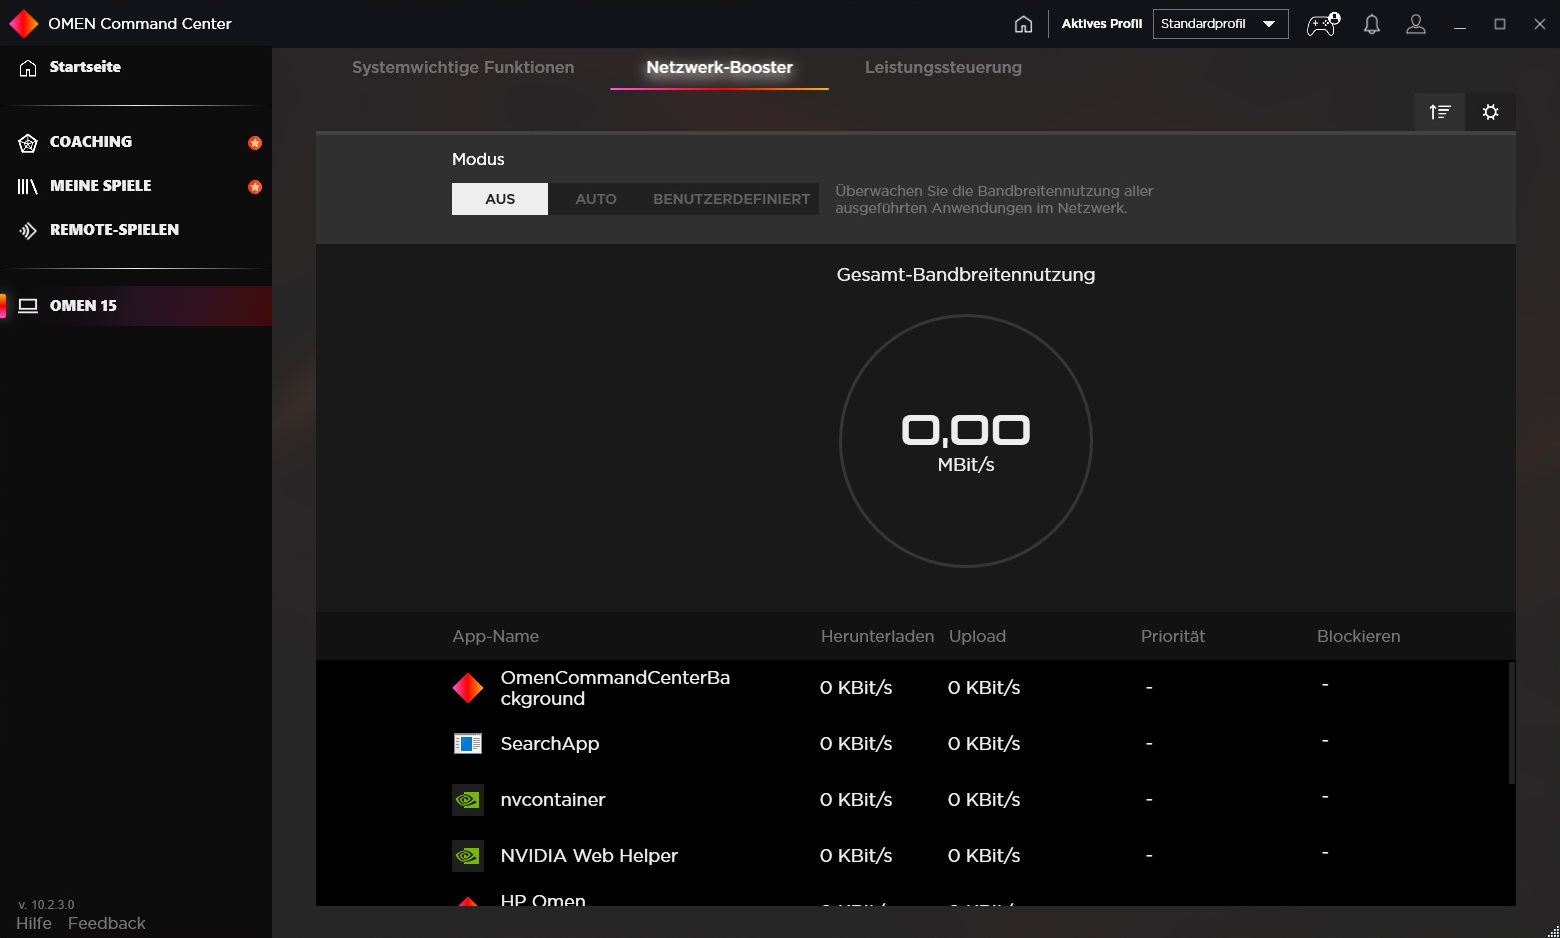
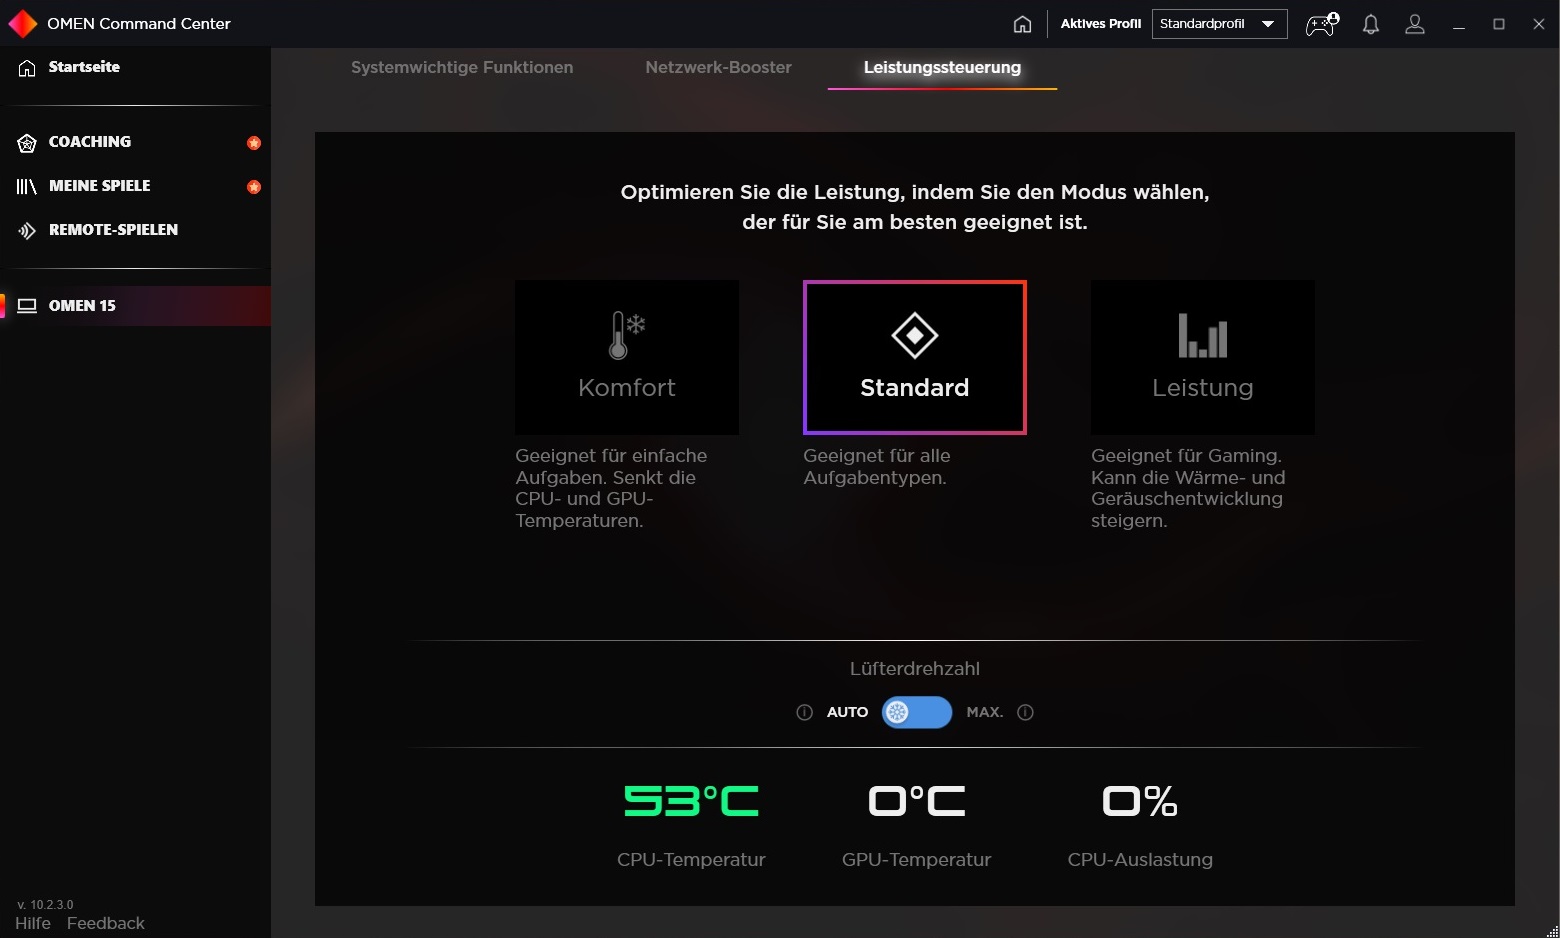
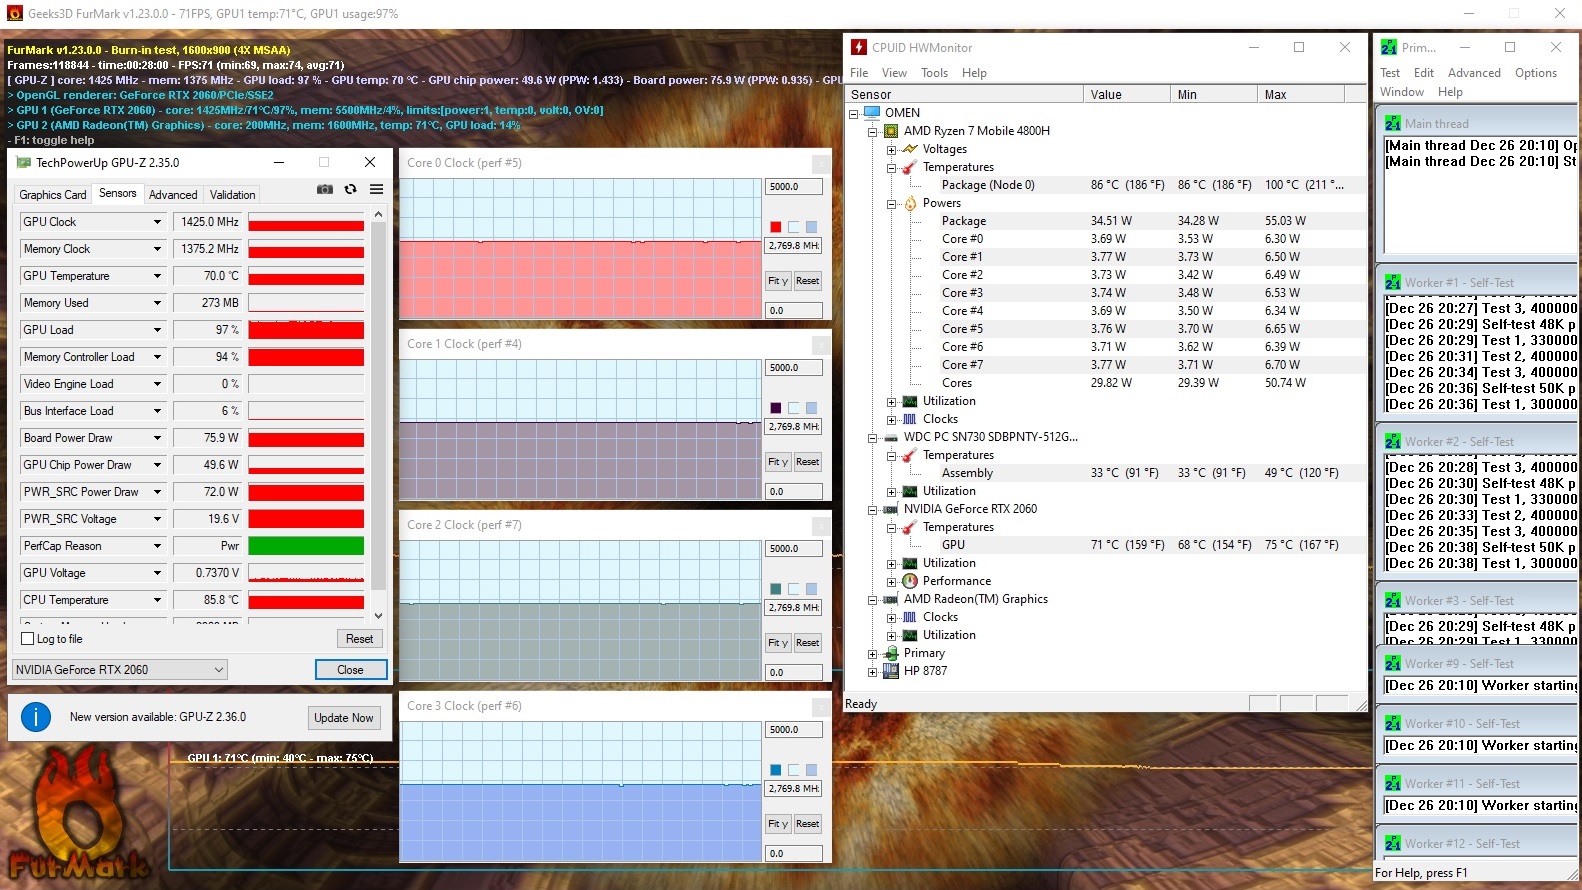
Tuning fans can let off steam in the pre-installed Command Center. Besides system monitoring, the tool also offers a network booster and performance control. The latter includes three profiles that affect the performance and the temperatures or volume. Our tests were always performed with the standard mode, which is supposed to be suitable for all task types and is active out of the box. The fans always ran in automatic mode (see screenshot #3).
Power
Although it is a budget device in terms of price, the Omen 15-en0375ng definitely belongs to the high-end segment. This is mainly due to the strong eight-core processor, which rarely has advantages over a fast four- or six-core in games so far, but shows its muscles in specialized applications and generally has more future-proofing.
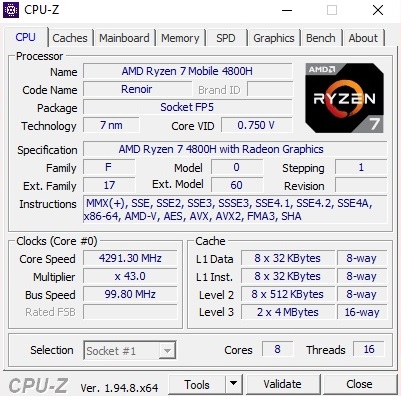
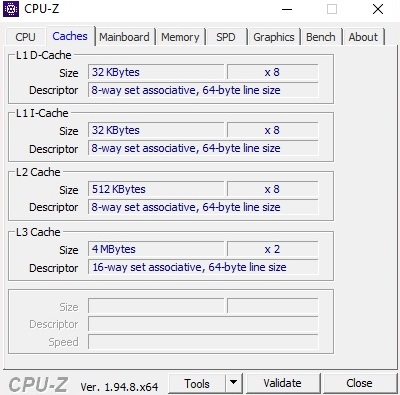
Processor
The benchmarks impressively prove that AMD is currently setting the tone in the CPU sector and has overtaken Intel. Thanks to its many cores, the Ryzen 7 4800H, which can process up to 16 threads simultaneously via SMT, sprints about 50% past the Core i7-10750H, which is very popular among gaming laptops, in multi-core applications like Cinebench R15. The lead over the Core i5-10300H, for example in the Legion 5 15IMH05H, is even around 100%.
Although the performance drops by a few percent under prolonged load, the Omen 15-en0375ng also cuts a good figure in the Cinebench loop. The clock is roughly on par with the 4800H competitor Schenker Core 15, whereas the Asus TUF A15 has to deal with a strongly fluctuating Turbo.
| Cinebench R15 | |
| CPU Single 64Bit | |
| Sınıf ortalaması Gaming (188.8 - 343, n=112, son 2 yıl) | |
| Aorus 5 KB | |
| Acer Predator Triton 300 PT315-52-79LP | |
| HP Omen 15-en0375ng | |
| Lenovo Legion 5 15IMH05H | |
| Schenker XMG Core 15 GK5NR0O | |
| Asus TUF Gaming A15 FA506IV-HN172 | |
| CPU Multi 64Bit | |
| Sınıf ortalaması Gaming (1578 - 6271, n=113, son 2 yıl) | |
| Schenker XMG Core 15 GK5NR0O | |
| HP Omen 15-en0375ng | |
| Asus TUF Gaming A15 FA506IV-HN172 | |
| Acer Predator Triton 300 PT315-52-79LP | |
| Aorus 5 KB | |
| Lenovo Legion 5 15IMH05H | |
| Blender - v2.79 BMW27 CPU | |
| Lenovo Legion 5 15IMH05H | |
| Aorus 5 KB | |
| Acer Predator Triton 300 PT315-52-79LP | |
| Asus TUF Gaming A15 FA506IV-HN172 | |
| HP Omen 15-en0375ng | |
| Schenker XMG Core 15 GK5NR0O | |
| Sınıf ortalaması Gaming (80 - 330, n=110, son 2 yıl) | |
| 7-Zip 18.03 | |
| 7z b 4 -mmt1 | |
| Sınıf ortalaması Gaming (4199 - 7436, n=111, son 2 yıl) | |
| Aorus 5 KB | |
| Acer Predator Triton 300 PT315-52-79LP | |
| Lenovo Legion 5 15IMH05H | |
| Asus TUF Gaming A15 FA506IV-HN172 | |
| Schenker XMG Core 15 GK5NR0O | |
| HP Omen 15-en0375ng | |
| 7z b 4 | |
| Sınıf ortalaması Gaming (33491 - 148086, n=111, son 2 yıl) | |
| HP Omen 15-en0375ng | |
| Schenker XMG Core 15 GK5NR0O | |
| Asus TUF Gaming A15 FA506IV-HN172 | |
| Aorus 5 KB | |
| Acer Predator Triton 300 PT315-52-79LP | |
| Lenovo Legion 5 15IMH05H | |
| Cinebench R20 | |
| CPU (Single Core) | |
| Sınıf ortalaması Gaming (442 - 895, n=112, son 2 yıl) | |
| HP Omen 15-en0375ng | |
| Asus TUF Gaming A15 FA506IV-HN172 | |
| Aorus 5 KB | |
| Schenker XMG Core 15 GK5NR0O | |
| Acer Predator Triton 300 PT315-52-79LP | |
| Lenovo Legion 5 15IMH05H | |
| CPU (Multi Core) | |
| Sınıf ortalaması Gaming (4029 - 16108, n=112, son 2 yıl) | |
| Schenker XMG Core 15 GK5NR0O | |
| HP Omen 15-en0375ng | |
| Asus TUF Gaming A15 FA506IV-HN172 | |
| Aorus 5 KB | |
| Acer Predator Triton 300 PT315-52-79LP | |
| Lenovo Legion 5 15IMH05H | |
| Geekbench 5.5 | |
| Single-Core | |
| Sınıf ortalaması Gaming (986 - 2474, n=111, son 2 yıl) | |
| Aorus 5 KB | |
| Acer Predator Triton 300 PT315-52-79LP | |
| Lenovo Legion 5 15IMH05H | |
| HP Omen 15-en0375ng | |
| Schenker XMG Core 15 GK5NR0O | |
| Asus TUF Gaming A15 FA506IV-HN172 | |
| Multi-Core | |
| Sınıf ortalaması Gaming (6460 - 27010, n=111, son 2 yıl) | |
| HP Omen 15-en0375ng | |
| Schenker XMG Core 15 GK5NR0O | |
| Aorus 5 KB | |
| Acer Predator Triton 300 PT315-52-79LP | |
| Asus TUF Gaming A15 FA506IV-HN172 | |
| Lenovo Legion 5 15IMH05H | |
| HWBOT x265 Benchmark v2.2 - 4k Preset | |
| Sınıf ortalaması Gaming (11.5 - 44.3, n=111, son 2 yıl) | |
| HP Omen 15-en0375ng | |
| Schenker XMG Core 15 GK5NR0O | |
| Asus TUF Gaming A15 FA506IV-HN172 | |
| Acer Predator Triton 300 PT315-52-79LP | |
| Aorus 5 KB | |
| Lenovo Legion 5 15IMH05H | |
| LibreOffice - 20 Documents To PDF | |
| HP Omen 15-en0375ng | |
| Schenker XMG Core 15 GK5NR0O | |
| Lenovo Legion 5 15IMH05H | |
| Sınıf ortalaması Gaming (19 - 88.8, n=111, son 2 yıl) | |
| Aorus 5 KB | |
| Acer Predator Triton 300 PT315-52-79LP | |
| Asus TUF Gaming A15 FA506IV-HN172 | |
| R Benchmark 2.5 - Overall mean | |
| Lenovo Legion 5 15IMH05H | |
| Acer Predator Triton 300 PT315-52-79LP | |
| Asus TUF Gaming A15 FA506IV-HN172 | |
| Aorus 5 KB | |
| Schenker XMG Core 15 GK5NR0O | |
| HP Omen 15-en0375ng | |
| Sınıf ortalaması Gaming (0.3439 - 0.759, n=112, son 2 yıl) | |
* ... daha küçük daha iyidir
System performance
The Omen 15 is also a frontrunner when it comes to system performance. 5,766 points in PCMark 10 catapult the 15-incher to the top position.
| PCMark 10 - Score | |
| Sınıf ortalaması Gaming (5828 - 11574, n=96, son 2 yıl) | |
| HP Omen 15-en0375ng | |
| Aorus 5 KB | |
| Schenker XMG Core 15 GK5NR0O | |
| Acer Predator Triton 300 PT315-52-79LP | |
| Asus TUF Gaming A15 FA506IV-HN172 | |
| Lenovo Legion 5 15IMH05H | |
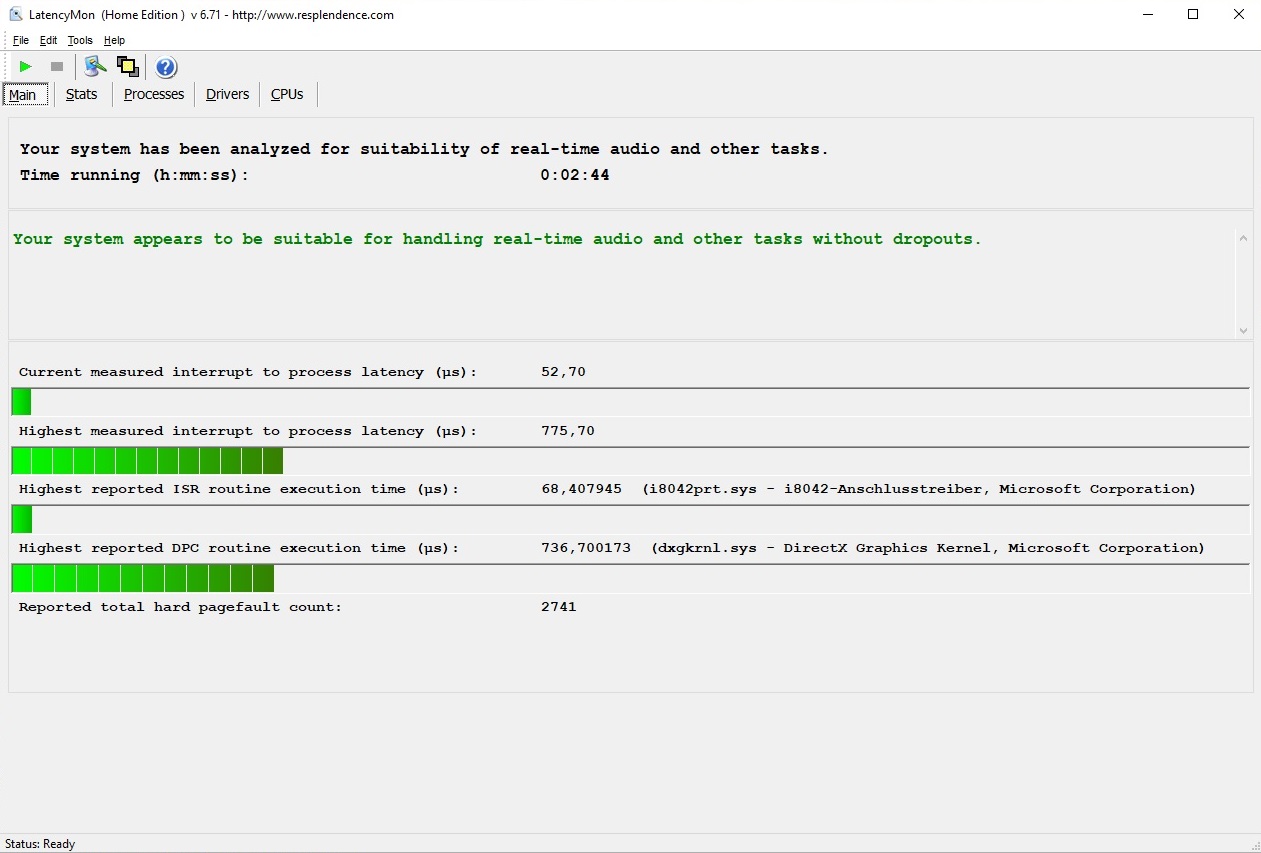
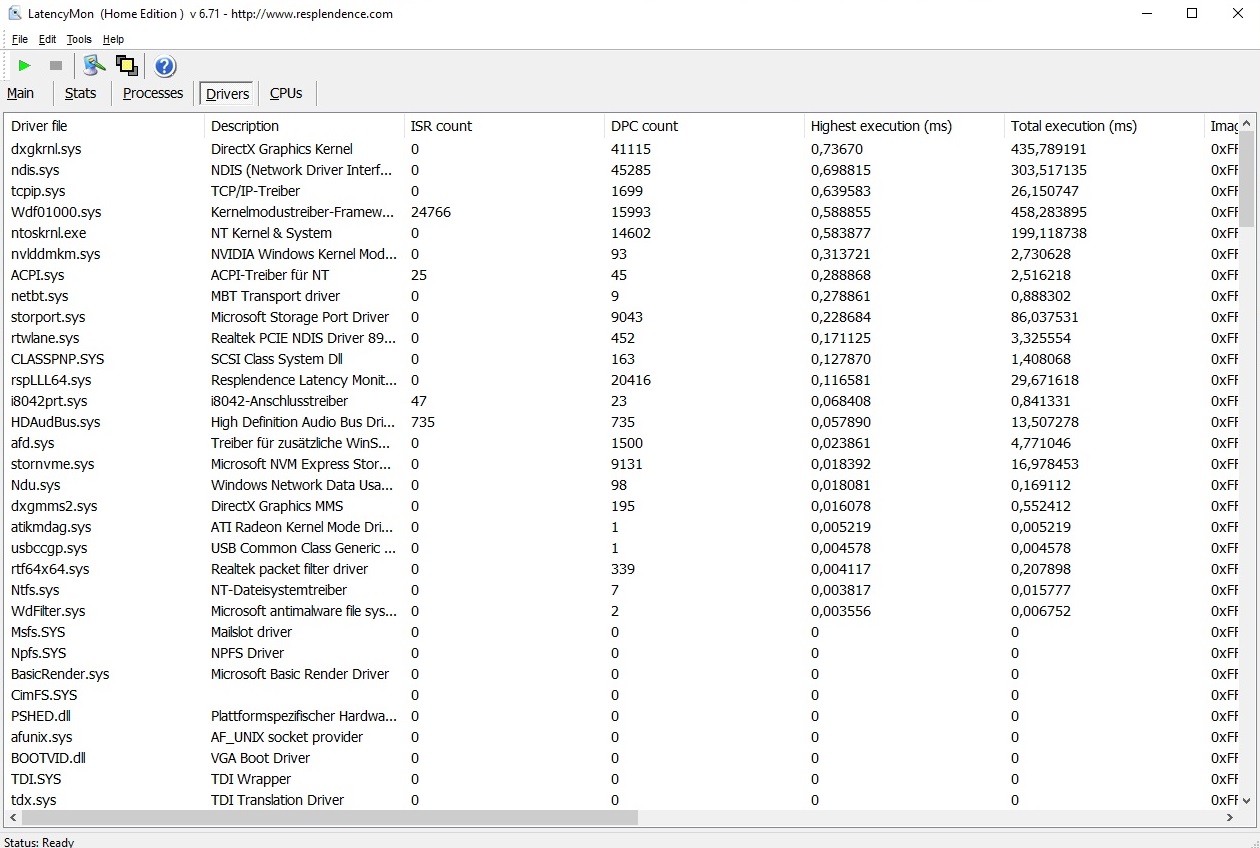
DPC latencies
In terms of latencies, the notebook also does not have to listen to any criticism. According to the LatencyMon tool, the system is well suited for real-time content and applications.
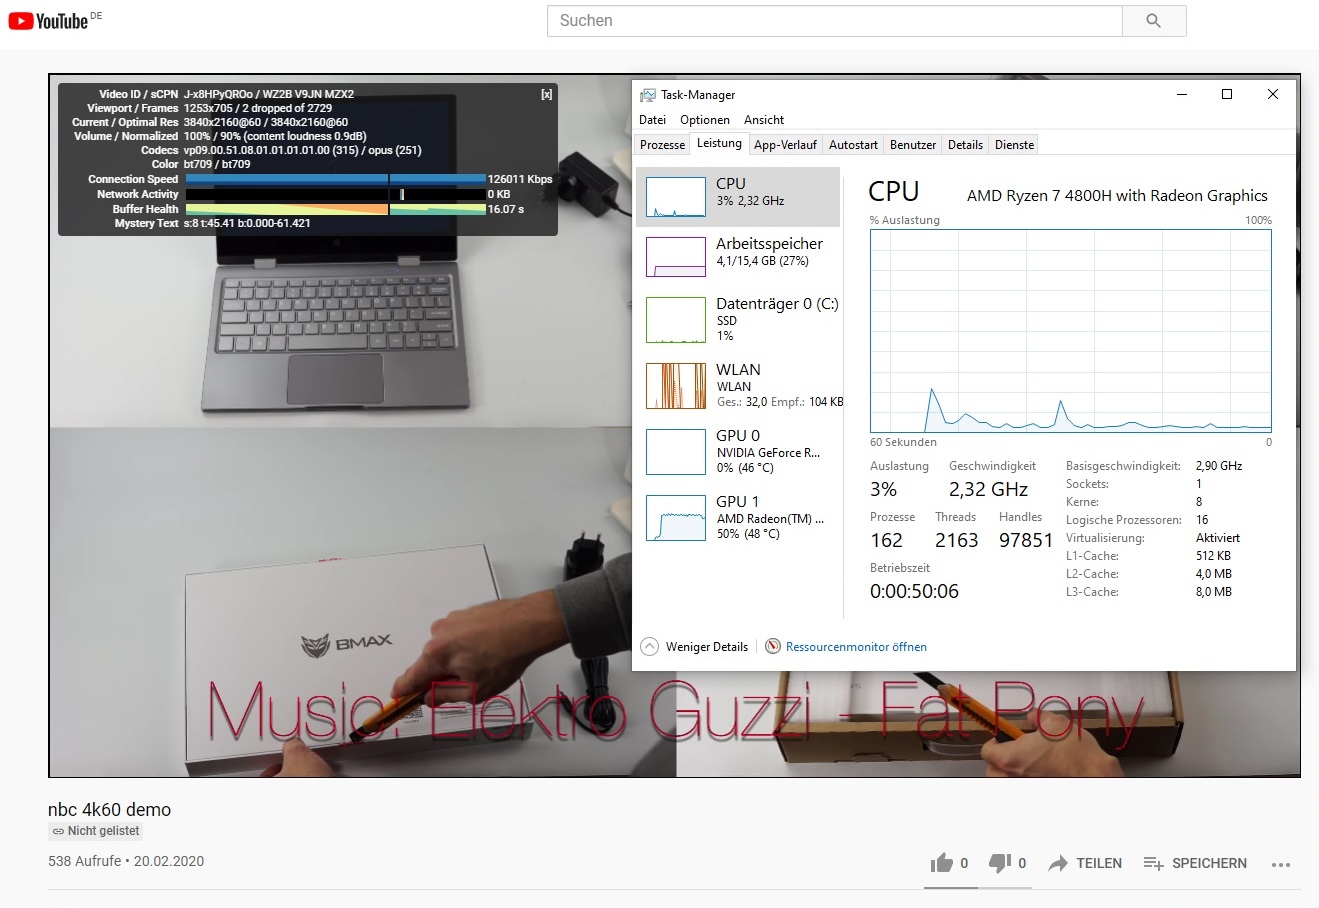
| DPC Latencies / LatencyMon - interrupt to process latency (max), Web, Youtube, Prime95 | |
| Schenker XMG Core 15 GK5NR0O | |
| Acer Predator Triton 300 PT315-52-79LP | |
| Aorus 5 KB | |
| Asus TUF Gaming A15 FA506IV-HN172 | |
| HP Omen 15-en0375ng | |
| Lenovo Legion 5 15IMH05H | |
* ... daha küçük daha iyidir
Mass storage
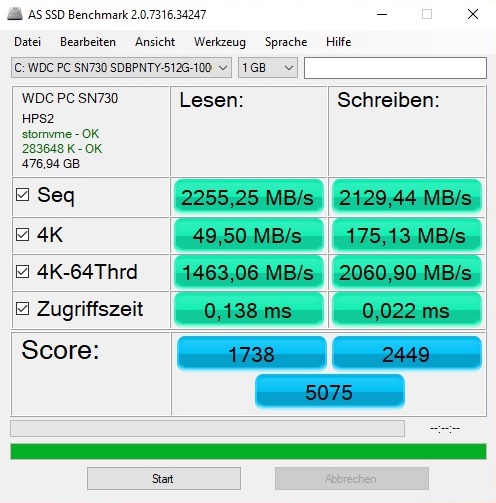
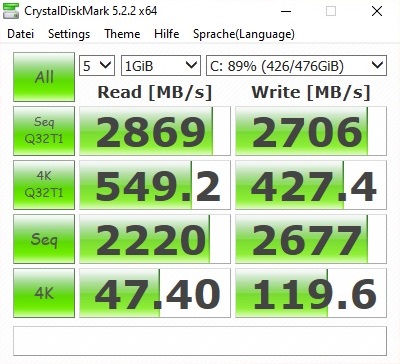
Buyers can also look forward to a fast mass storage device. The 512 GB model WDC PC SN730 installed in the review sample achieves more than 2000 MB/s in sequential read and write, which is a very good result. No wonder, since it is a modern PCIe/NVMe drive.
| HP Omen 15-en0375ng WDC PC SN730 SDBPNTY-512G | Schenker XMG Core 15 GK5NR0O Samsung SSD 970 EVO Plus 500GB | Asus TUF Gaming A15 FA506IV-HN172 Kingston OM8PCP3512F-AB | Acer Predator Triton 300 PT315-52-79LP WDC PC SN730 SDBQNTY-1T00 | Aorus 5 KB ADATA XPG SX8200 Pro (ASX8200PNP-512GT) | Lenovo Legion 5 15IMH05H Samsung PM991 MZALQ512HALU | Ortalama WDC PC SN730 SDBPNTY-512G | |
|---|---|---|---|---|---|---|---|
| CrystalDiskMark 5.2 / 6 | 28% | -13% | -0% | 10% | -18% | 3% | |
| Write 4K (MB/s) | 119.6 | 233 95% | 219.8 84% | 117.5 -2% | 162.1 36% | 145.4 22% | 164.3 ? 37% |
| Read 4K (MB/s) | 47.4 | 54.5 15% | 50.2 6% | 47.36 0% | 60.7 28% | 51.6 9% | 48.2 ? 2% |
| Write Seq (MB/s) | 2677 | 3050 14% | 979 -63% | 2748 3% | 2366 -12% | 1007 -62% | 2096 ? -22% |
| Read Seq (MB/s) | 2220 | 3042 37% | 1990 -10% | 2084 -6% | 2633 19% | 1145 -48% | 2123 ? -4% |
| Write 4K Q32T1 (MB/s) | 427.4 | 520 22% | 516 21% | 407.3 -5% | 428.2 0% | 468.4 10% | 451 ? 6% |
| Read 4K Q32T1 (MB/s) | 549 | 546 -1% | 298.3 -46% | 474.6 -14% | 582 6% | 528 -4% | 509 ? -7% |
| Write Seq Q32T1 (MB/s) | 2706 | 3241 20% | 982 -64% | 3069 13% | 2480 -8% | 1381 -49% | 2551 ? -6% |
| Read Seq Q32T1 (MB/s) | 2869 | 3538 23% | 1907 -34% | 3154 10% | 3121 9% | 2291 -20% | 3330 ? 16% |
| AS SSD | 15% | -29% | -3% | -17% | -36% | -16% | |
| Seq Read (MB/s) | 2255 | 2836 26% | 1682 -25% | 2369 5% | 2795 24% | 2012 -11% | 2605 ? 16% |
| Seq Write (MB/s) | 2129 | 2452 15% | 904 -58% | 2446 15% | 2172 2% | 1261 -41% | 1905 ? -11% |
| 4K Read (MB/s) | 49.5 | 60.4 22% | 60.2 22% | 40.61 -18% | 53.3 8% | 43.66 -12% | 45.8 ? -7% |
| 4K Write (MB/s) | 175.1 | 190.5 9% | 164.8 -6% | 103.2 -41% | 121.3 -31% | 109.3 -38% | 155.6 ? -11% |
| 4K-64 Read (MB/s) | 1463 | 1283 -12% | 472.5 -68% | 1637 12% | 714 -51% | 851 -42% | 1181 ? -19% |
| 4K-64 Write (MB/s) | 2061 | 2298 11% | 845 -59% | 1961 -5% | 1376 -33% | 780 -62% | 1372 ? -33% |
| Access Time Read * (ms) | 0.138 | 0.034 75% | 0.087 37% | 0.06 57% | 0.049 64% | 0.117 15% | 0.0801 ? 42% |
| Access Time Write * (ms) | 0.022 | 0.02 9% | 0.02 9% | 0.036 -64% | 0.036 -64% | 0.036 -64% | 0.04195 ? -91% |
| Score Read (Points) | 1738 | 1627 -6% | 701 -60% | 1915 10% | 1046 -40% | 1096 -37% | 1488 ? -14% |
| Score Write (Points) | 2449 | 2734 12% | 1101 -55% | 2309 -6% | 1714 -30% | 1016 -59% | 1718 ? -30% |
| Score Total (Points) | 5075 | 5184 2% | 2143 -58% | 5205 3% | 3279 -35% | 2643 -48% | 3938 ? -22% |
| Toplam Ortalama (Program / Ayarlar) | 22% /
20% | -21% /
-22% | -2% /
-2% | -4% /
-6% | -27% /
-28% | -7% /
-8% |
* ... daha küçük daha iyidir

Continuous reading: DiskSpd Read Loop, Queue Depth 8
Graphics card
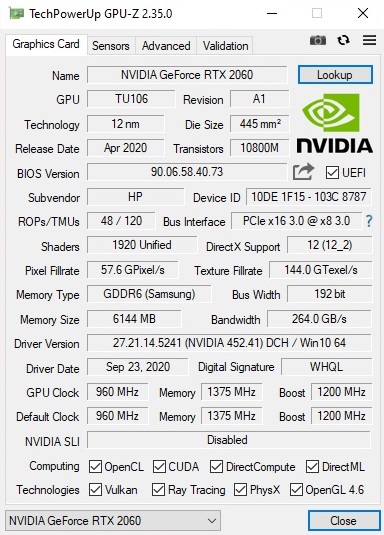
The GeForce RTX 2060 is the perfect companion for gamers who want to invest at most 1,500 Euros (~$1820) in a notebook. The DirectX 12 model is located between the mid- and upper-range in terms of performance and, in contrast to its cheaper brothers, can boast "real" ray-tracing capabilities.
| 3DMark | |
| 1920x1080 Fire Strike Graphics | |
| Sınıf ortalaması Gaming (12242 - 62849, n=121, son 2 yıl) | |
| Aorus 5 KB | |
| Acer Predator Triton 300 PT315-52-79LP | |
| Asus TUF Gaming A15 FA506IV-HN172 | |
| Schenker XMG Core 15 GK5NR0O | |
| Lenovo Legion 5 15IMH05H | |
| HP Omen 15-en0375ng | |
| 2560x1440 Time Spy Graphics | |
| Sınıf ortalaması Gaming (5012 - 26212, n=120, son 2 yıl) | |
| Lenovo Legion 5 15IMH05H | |
| Aorus 5 KB | |
| Asus TUF Gaming A15 FA506IV-HN172 | |
| Acer Predator Triton 300 PT315-52-79LP | |
| Schenker XMG Core 15 GK5NR0O | |
| HP Omen 15-en0375ng | |
| 2560x1440 Port Royal Graphics | |
| Sınıf ortalaması Gaming (4395 - 17286, n=70, son 2 yıl) | |
| Lenovo Legion 5 15IMH05H | |
| Asus TUF Gaming A15 FA506IV-HN172 | |
| HP Omen 15-en0375ng | |
| 3DMark 11 - 1280x720 Performance GPU | |
| Sınıf ortalaması Gaming (21841 - 80022, n=109, son 2 yıl) | |
| Aorus 5 KB | |
| Schenker XMG Core 15 GK5NR0O | |
| Lenovo Legion 5 15IMH05H | |
| Asus TUF Gaming A15 FA506IV-HN172 | |
| Acer Predator Triton 300 PT315-52-79LP | |
| HP Omen 15-en0375ng | |
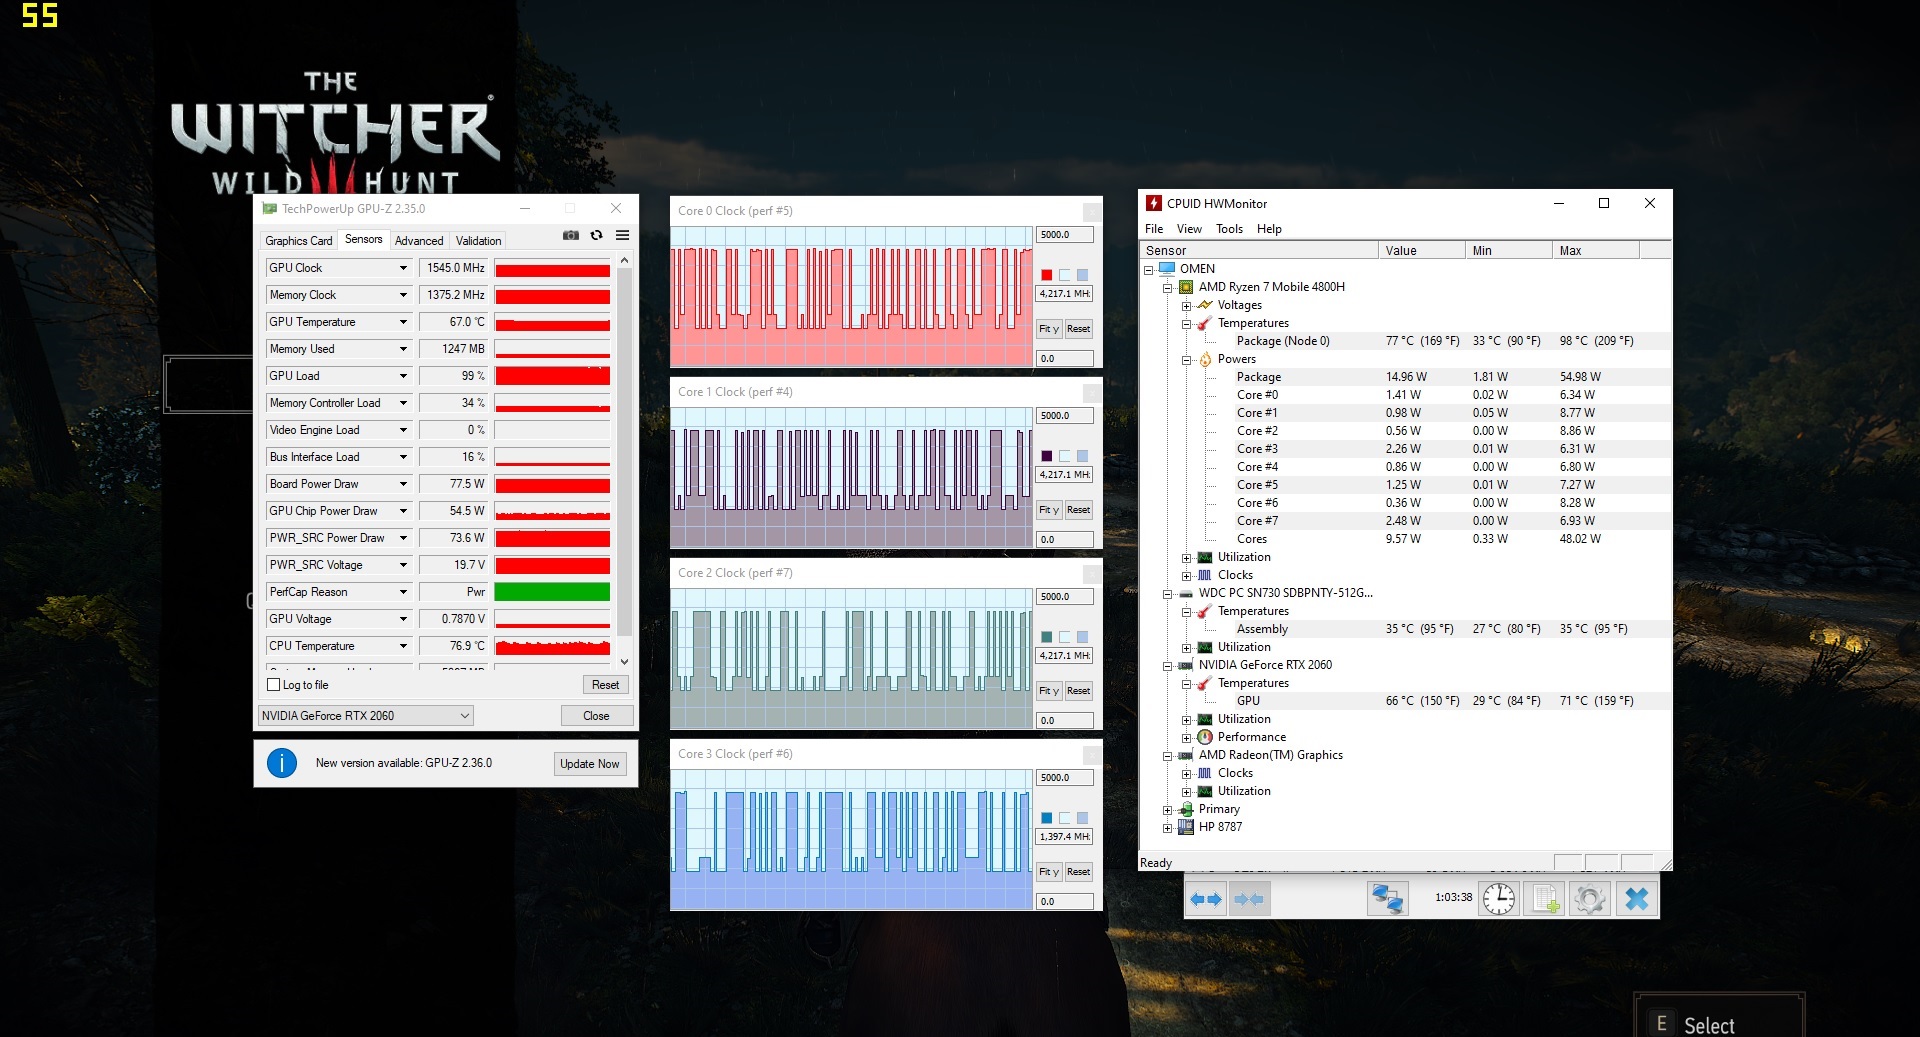
While the CPU power is - as already explained - above average, the GPU speed falls behind the competition a bit. The Omen 15-en0375ng brings up the rear in the 3DMark tests, but the difference is often marginal and subjectively hardly noticeable. The same applies to the subtle frame rate drop in the Witcher 3 test (about 1 hour @FHD/Ultra), which simulates a longer 3D load.
| 3DMark 11 Performance | 18798 puan | |
| 3DMark Cloud Gate Standard Score | 38655 puan | |
| 3DMark Fire Strike Score | 14526 puan | |
| 3DMark Time Spy Score | 6161 puan | |
Yardım | ||
Gaming performance
The combination of Ryzen 7 4800H and GeForce RTX 2060 is fast enough to play most current games smoothly with 1,920 x 1,080 pixels and maximum details. Only very demanding and/or poorly optimized games, such as Watch Dogs Legion, Dirt 5 and Cyberpunk 2077, drop the Avg FPS below the 40 mark.
| The Witcher 3 | |
| 1920x1080 High Graphics & Postprocessing (Nvidia HairWorks Off) | |
| Sınıf ortalaması Gaming (181 - 341, n=3, son 2 yıl) | |
| Lenovo Legion 5 15IMH05H | |
| HP Omen 15-en0375ng | |
| Asus TUF Gaming A15 FA506IV-HN172 | |
| Schenker XMG Core 15 GK5NR0O | |
| 1920x1080 Ultra Graphics & Postprocessing (HBAO+) | |
| Sınıf ortalaması Gaming (95 - 240, n=8, son 2 yıl) | |
| Lenovo Legion 5 15IMH05H | |
| Asus TUF Gaming A15 FA506IV-HN172 | |
| Acer Predator Triton 300 PT315-52-79LP | |
| Schenker XMG Core 15 GK5NR0O | |
| Aorus 5 KB | |
| HP Omen 15-en0375ng | |
| düşük | orta | yüksek | ultra | |
|---|---|---|---|---|
| GTA V (2015) | 165 | 159 | 127 | 70.8 |
| The Witcher 3 (2015) | 107 | 56.4 | ||
| Dota 2 Reborn (2015) | 123 | 115 | 109 | 104 |
| X-Plane 11.11 (2018) | 91.5 | 81.9 | 68.8 | |
| Shadow of the Tomb Raider (2018) | 83 | 73 | ||
| Battlefield V (2018) | 102 | 93.1 | ||
| Borderlands 3 (2019) | 61.9 | 48.1 | ||
| Valorant (2020) | 177 | |||
| Crysis Remastered (2020) | 52.9 | 40 | ||
| FIFA 21 (2020) | 163 | 161 | ||
| Watch Dogs Legion (2020) | 66 | 36 | ||
| Dirt 5 (2020) | 59.2 | 38.7 | ||
| Assassin´s Creed Valhalla (2020) | 53 | 46 | ||
| Call of Duty Black Ops Cold War (2020) | 62.2 | 57.1 | ||
| Yakuza Like a Dragon (2020) | 71.8 | 64.1 | ||
| Immortals Fenyx Rising (2020) | 54 | 51 | ||
| Cyberpunk 2077 1.0 (2020) | 45.3 | 38.8 |
Emissions
Noise emissions
The fan control leaves a decent impression when idling and during simple activities (office, web, etc.). Although there can be short upsurges every now and then, the fans usually stand still, which leads to silent operation. Under load, however, the 15-incher clearly attracts attention. 48 dB(A) in the Witcher 3 test is similar to the noise level of the competition, which reaches 47 to 51 dB(A).
Ses yüksekliği
| Boşta |
| 24 / 25 / 37 dB |
| Çalışırken |
| 45 / 51 dB |
 | ||
30 dB sessiz 40 dB(A) duyulabilirlik 50 dB(A) gürültülü |
||
min: | ||
| HP Omen 15-en0375ng R7 4800H, GeForce RTX 2060 Mobile | Schenker XMG Core 15 GK5NR0O R7 4800H, GeForce RTX 2060 Mobile | Asus TUF Gaming A15 FA506IV-HN172 R7 4800H, GeForce RTX 2060 Mobile | Acer Predator Triton 300 PT315-52-79LP i7-10750H, GeForce RTX 2060 Mobile | Aorus 5 KB i7-10750H, GeForce RTX 2060 Mobile | Lenovo Legion 5 15IMH05H i5-10300H, GeForce RTX 2060 Mobile | Sınıf ortalaması Gaming | |
|---|---|---|---|---|---|---|---|
| Noise | -2% | -6% | -2% | -8% | -6% | -0% | |
| kapalı / ortam * (dB) | 24 | 25 -4% | 30.2 -26% | 25 -4% | 25 -4% | 30.7 -28% | 24.1 ? -0% |
| Idle Minimum * (dB) | 24 | 26 -8% | 30.2 -26% | 25 -4% | 26 -8% | 30.7 -28% | 25.8 ? -8% |
| Idle Average * (dB) | 25 | 30 -20% | 30.2 -21% | 29 -16% | 30 -20% | 30.7 -23% | 27.5 ? -10% |
| Idle Maximum * (dB) | 37 | 32 14% | 30.2 18% | 34 8% | 34 8% | 30.7 17% | 30 ? 19% |
| Load Average * (dB) | 45 | 46 -2% | 40 11% | 44 2% | 53 -18% | 36.6 19% | 43.1 ? 4% |
| Witcher 3 ultra * (dB) | 48 | 48 -0% | 49 -2% | 49 -2% | 51 -6% | 47 2% | |
| Load Maximum * (dB) | 51 | 48 6% | 49 4% | 49 4% | 56 -10% | 50.9 -0% | 54 ? -6% |
* ... daha küçük daha iyidir
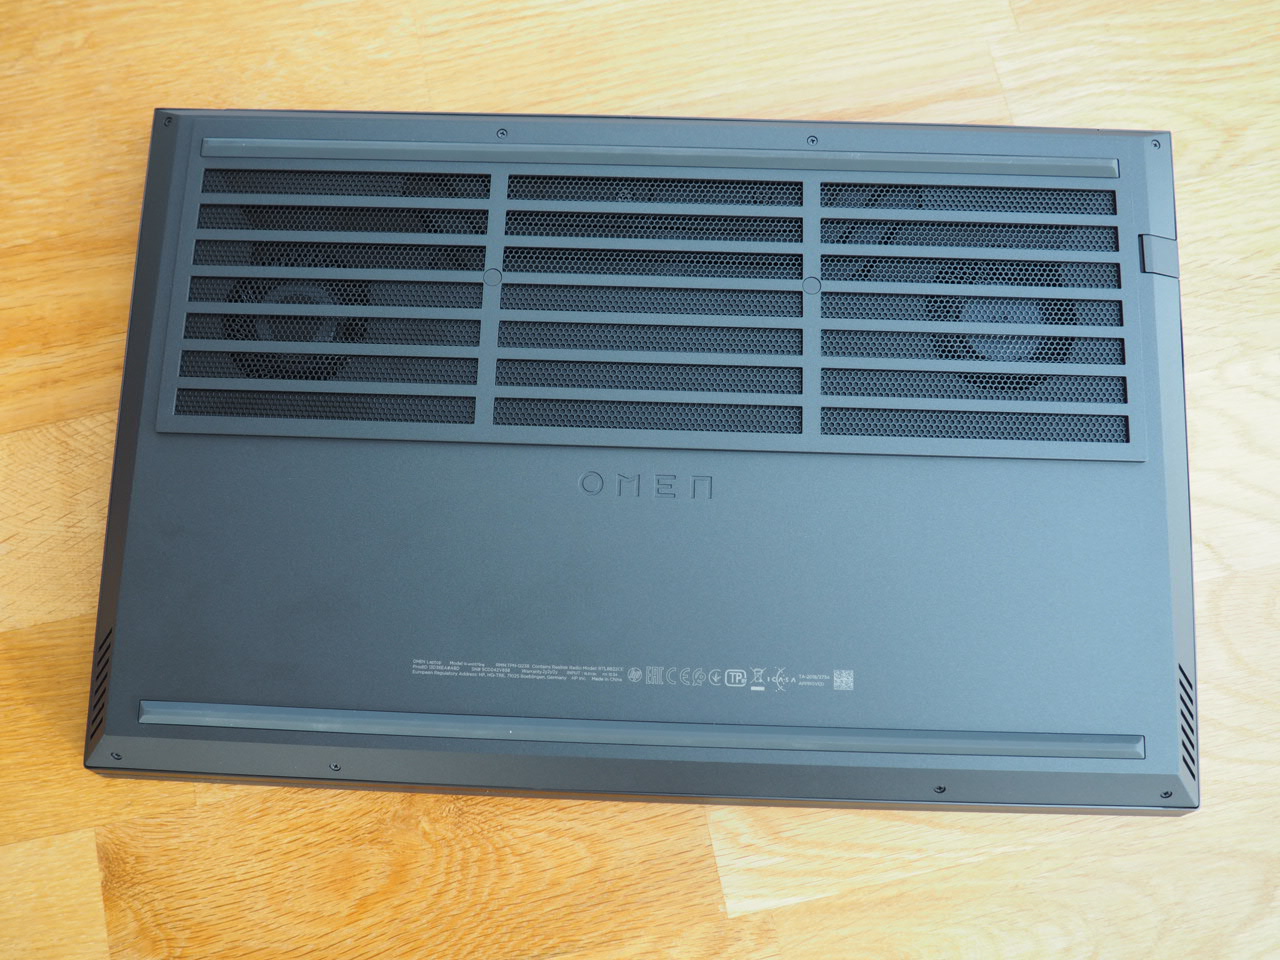
Temperature
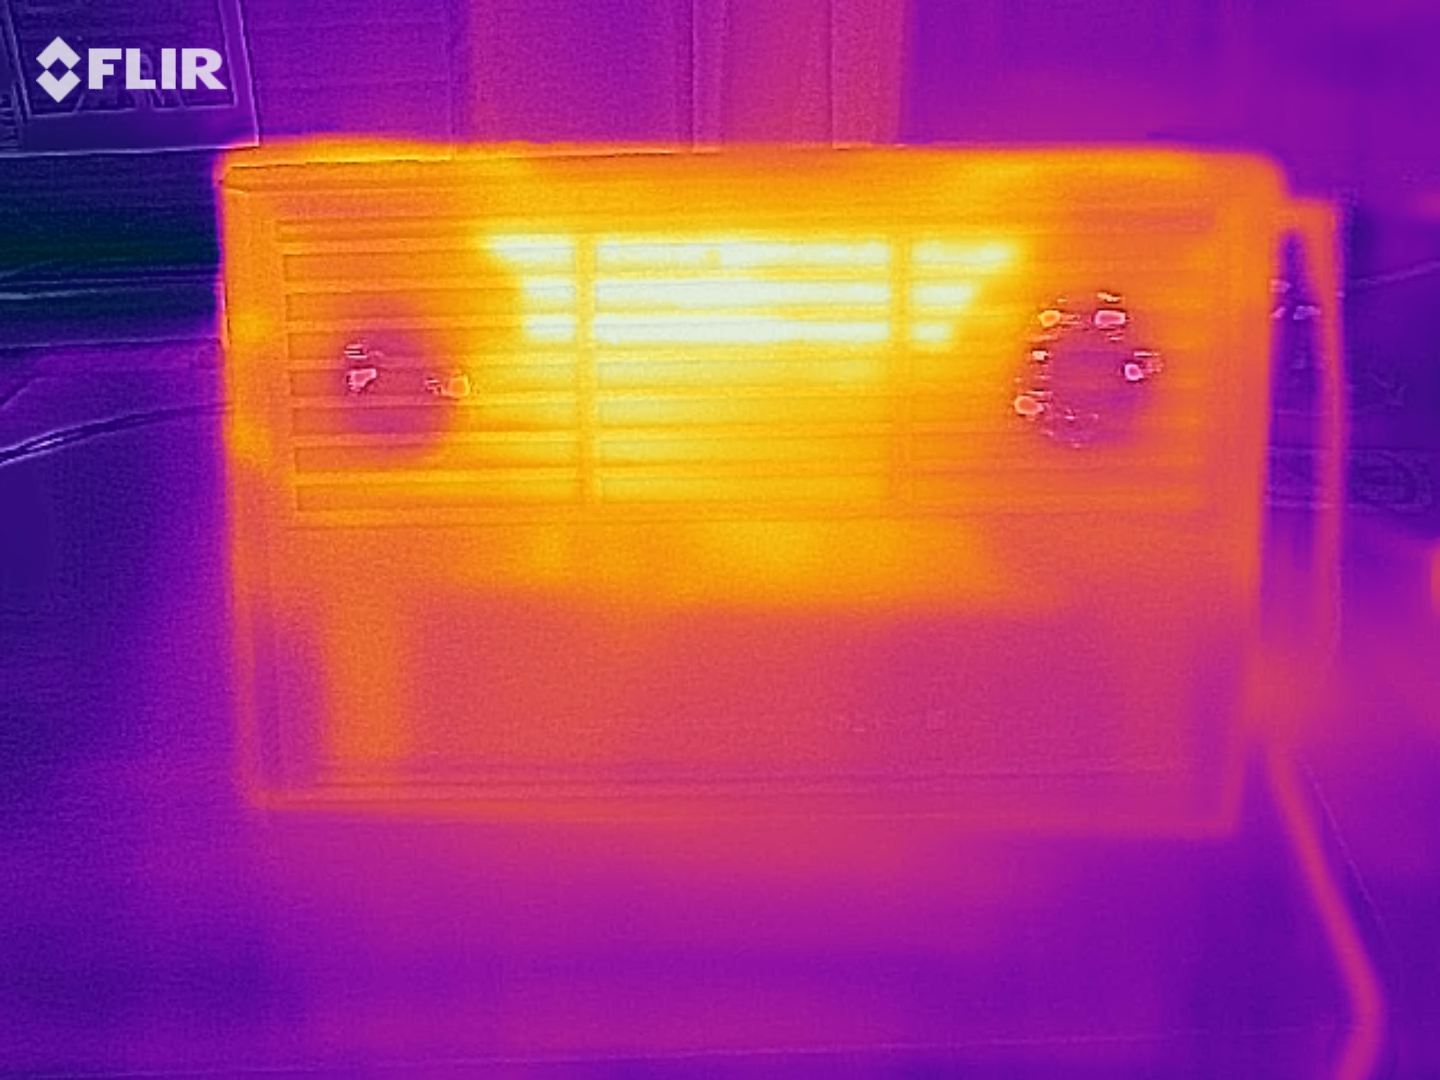
The temperature development of the chassis varies a lot. While the case's bottom heats up to over 50 °C (122 °F) in some places under full load, the top only reaches a maximum of 42 °C (107.6 °F) - a moderate rate. Under the hood, the processor in particular heats up. After 60 minutes of stress testing with the Furmark and Prime95 tools, the Ryzen 7 4800H made itself comfortable at around 86 °C (186.8 °F). The GeForce RTX 2060 stayed noticeably cooler with just under 70 °C (158 °F). The values in the Witcher 3 test can be seen in the first screenshot.
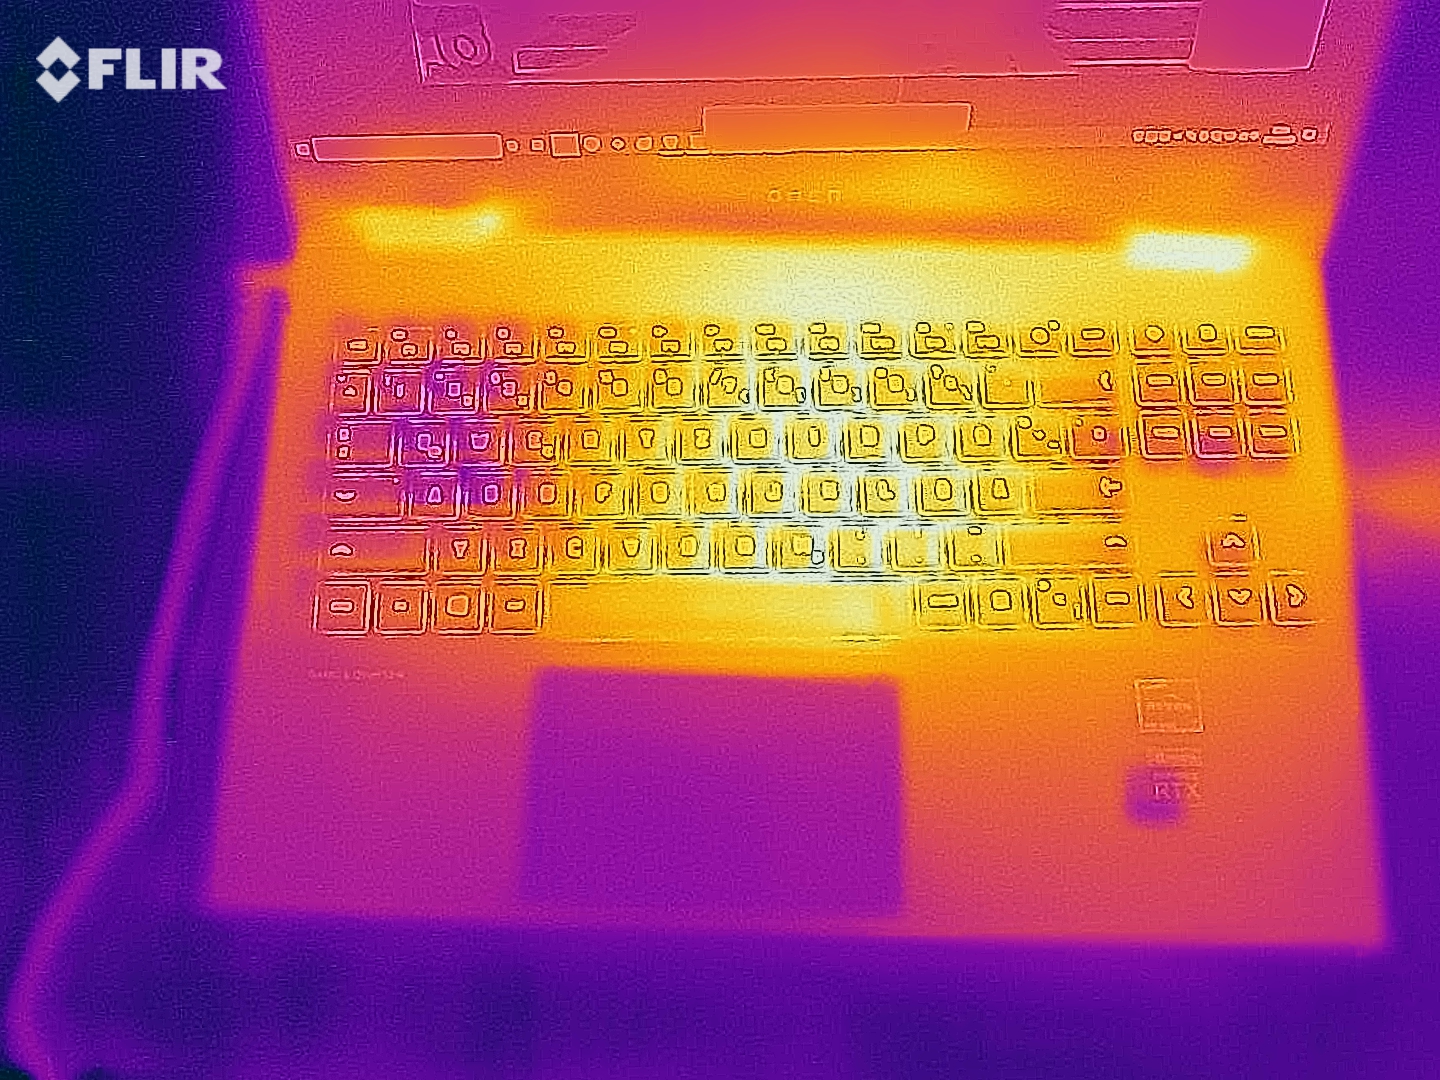
(±) Üst taraftaki maksimum sıcaklık, 40.4 °C / 105 F ortalamasına kıyasla 42 °C / 108 F'dir. , Gaming sınıfı için 21.2 ile 68.8 °C arasında değişir.
(-) Alt kısım, 43.2 °C / 110 F ortalamasına kıyasla maksimum 54 °C / 129 F'ye kadar ısınır
(+) Boşta kullanımda, üst tarafın ortalama sıcaklığı 27.1 °C / 81 F olup, cihazın 33.9 °C / 93 F.
(-) The Witcher 3 oynarken, üst tarafın ortalama sıcaklığı 38.7 °C / 102 F olup, cihazın 33.9 °C / 93 F.
(+) Avuç içi dayanakları ve dokunmatik yüzey maksimum (35 °C / 95 F) cilt sıcaklığına ulaşıyor ve bu nedenle sıcak değil.
(-) Benzer cihazların avuç içi dayanağı alanının ortalama sıcaklığı 28.8 °C / 83.8 F (-6.2 °C / -11.2 F) idi.
| HP Omen 15-en0375ng R7 4800H, GeForce RTX 2060 Mobile | Schenker XMG Core 15 GK5NR0O R7 4800H, GeForce RTX 2060 Mobile | Asus TUF Gaming A15 FA506IV-HN172 R7 4800H, GeForce RTX 2060 Mobile | Acer Predator Triton 300 PT315-52-79LP i7-10750H, GeForce RTX 2060 Mobile | Aorus 5 KB i7-10750H, GeForce RTX 2060 Mobile | Lenovo Legion 5 15IMH05H i5-10300H, GeForce RTX 2060 Mobile | Sınıf ortalaması Gaming | |
|---|---|---|---|---|---|---|---|
| Heat | -14% | 4% | -21% | -11% | 2% | -7% | |
| Maximum Upper Side * (°C) | 42 | 51 -21% | 42.9 -2% | 55 -31% | 50 -19% | 46.3 -10% | 45.2 ? -8% |
| Maximum Bottom * (°C) | 54 | 64 -19% | 49.9 8% | 65 -20% | 49 9% | 44.4 18% | 48.2 ? 11% |
| Idle Upper Side * (°C) | 28 | 29 -4% | 27.8 1% | 32 -14% | 35 -25% | 28.1 -0% | 31.1 ? -11% |
| Idle Bottom * (°C) | 29 | 32 -10% | 27 7% | 34 -17% | 31 -7% | 29.4 -1% | 34.3 ? -18% |
* ... daha küçük daha iyidir
Loudspeaker
HP Omen 15-en0375ng ses analizi
(+) | hoparlörler nispeten yüksek sesle çalabilir (82 dB)
Bas 100 - 315Hz
(-) | neredeyse hiç bas yok - ortalama olarak medyandan 21.4% daha düşük
(-) | bas doğrusal değildir (15% delta ile önceki frekans)
Ortalar 400 - 2000 Hz
(+) | dengeli ortalar - medyandan yalnızca 1.9% uzakta
(+) | orta frekanslar doğrusaldır (4.3% deltadan önceki frekansa)
Yüksekler 2 - 16 kHz
(+) | dengeli yüksekler - medyandan yalnızca 3.3% uzakta
(+) | yüksekler doğrusaldır (6.6% deltadan önceki frekansa)
Toplam 100 - 16.000 Hz
(+) | genel ses doğrusaldır (14.7% ortancaya göre fark)
Aynı sınıfla karşılaştırıldığında
» Bu sınıftaki tüm test edilen cihazların %28%'si daha iyi, 7% benzer, 64% daha kötüydü
» En iyisinin deltası 6% idi, ortalama 18% idi, en kötüsü 132% idi
Test edilen tüm cihazlarla karşılaştırıldığında
» Test edilen tüm cihazların %19'si daha iyi, 4 benzer, % 77 daha kötüydü
» En iyisinin deltası 4% idi, ortalama 24% idi, en kötüsü 134% idi
Schenker XMG Core 15 GK5NR0O ses analizi
(+) | hoparlörler nispeten yüksek sesle çalabilir (85 dB)
Bas 100 - 315Hz
(-) | neredeyse hiç bas yok - ortalama olarak medyandan 24.2% daha düşük
(±) | Bas doğrusallığı ortalamadır (14.8% delta - önceki frekans)
Ortalar 400 - 2000 Hz
(+) | dengeli ortalar - medyandan yalnızca 2% uzakta
(+) | orta frekanslar doğrusaldır (3.8% deltadan önceki frekansa)
Yüksekler 2 - 16 kHz
(±) | daha yüksek en yüksekler - ortalama olarak medyandan 7.1% daha yüksek
(±) | Yükseklerin doğrusallığı ortalamadır (9% delta - önceki frekans)
Toplam 100 - 16.000 Hz
(±) | Genel sesin doğrusallığı ortalamadır (18.8% ortancaya göre fark)
Aynı sınıfla karşılaştırıldığında
» Bu sınıftaki tüm test edilen cihazların %62%'si daha iyi, 8% benzer, 30% daha kötüydü
» En iyisinin deltası 6% idi, ortalama 18% idi, en kötüsü 132% idi
Test edilen tüm cihazlarla karşılaştırıldığında
» Test edilen tüm cihazların %43'si daha iyi, 8 benzer, % 49 daha kötüydü
» En iyisinin deltası 4% idi, ortalama 24% idi, en kötüsü 134% idi
Power management
Energy absorption
For a gaming notebook, the power consumption is within limits. The Omen 15-en0375ng is relatively frugal with 4 to 22 watts in idle mode, which promises good battery runtimes. Even under load, the consumption rates are usually better than those of the competition. There are many indications that the Ryzen 7 4800H is more energy-efficient than its Intel counterparts - thanks to the modern manufacturing process (7 vs 14 nm).
| Kapalı / Bekleme modu | |
| Boşta | |
| Çalışırken |
|
Key:
min: | |
| HP Omen 15-en0375ng R7 4800H, GeForce RTX 2060 Mobile | Schenker XMG Core 15 GK5NR0O R7 4800H, GeForce RTX 2060 Mobile | Asus TUF Gaming A15 FA506IV-HN172 R7 4800H, GeForce RTX 2060 Mobile | Acer Predator Triton 300 PT315-52-79LP i7-10750H, GeForce RTX 2060 Mobile | Aorus 5 KB i7-10750H, GeForce RTX 2060 Mobile | Lenovo Legion 5 15IMH05H i5-10300H, GeForce RTX 2060 Mobile | Sınıf ortalaması Gaming | |
|---|---|---|---|---|---|---|---|
| Power Consumption | -43% | -5% | -4% | -31% | 12% | -80% | |
| Idle Minimum * (Watt) | 4 | 12 -200% | 5.4 -35% | 4 -0% | 8 -100% | 3.2 20% | 13.3 ? -233% |
| Idle Average * (Watt) | 9 | 14 -56% | 10 -11% | 10 -11% | 12 -33% | 8.3 8% | 19 ? -111% |
| Idle Maximum * (Watt) | 22 | 20 9% | 10.5 52% | 19 14% | 21 5% | 8.7 60% | 24.5 ? -11% |
| Load Average * (Watt) | 102 | 103 -1% | 135 -32% | 96 6% | 128 -25% | 82 20% | 108.1 ? -6% |
| Witcher 3 ultra * (Watt) | 119 | 125 -5% | 144 -21% | 136 -14% | 138 -16% | 151 -27% | |
| Load Maximum * (Watt) | 182 | 193 -6% | 147 19% | 214 -18% | 217 -19% | 195 -7% | 254 ? -40% |
* ... daha küçük daha iyidir
Battery life
One of the biggest strengths of the Omen 15-en0375ng is its battery life. Up to 20 hours in the ideal case (minimum load & display brightness) and about 10.5 hours of Internet surfing via WLAN (brightness reduced to about 150 d/m²) are outstanding in the gaming segment. Only Lenovo's Legion 5 can come close to these rates. However, the performance also drops significantly in battery mode. The frame rate dropped by almost 90(!)% in the Witcher 3 test without a power supply. However, performance or not: 70.9 Wh battery capacity should be a model for the competition (48 to 62 Wh).
| HP Omen 15-en0375ng R7 4800H, GeForce RTX 2060 Mobile, 70.9 Wh | Schenker XMG Core 15 GK5NR0O R7 4800H, GeForce RTX 2060 Mobile, 62 Wh | Asus TUF Gaming A15 FA506IV-HN172 R7 4800H, GeForce RTX 2060 Mobile, 48 Wh | Acer Predator Triton 300 PT315-52-79LP i7-10750H, GeForce RTX 2060 Mobile, 58.7 Wh | Aorus 5 KB i7-10750H, GeForce RTX 2060 Mobile, 48.96 Wh | Lenovo Legion 5 15IMH05H i5-10300H, GeForce RTX 2060 Mobile, 60 Wh | Sınıf ortalaması Gaming | |
|---|---|---|---|---|---|---|---|
| Pil Çalışma Süresi | -41% | -29% | -39% | -51% | -27% | -36% | |
| Reader / Idle (h) | 20 | 7.8 -61% | 9.8 -51% | 9.6 -52% | 9 -55% | 14.1 -29% | 8.71 ? -56% |
| WiFi v1.3 (h) | 10.5 | 5.9 -44% | 6.2 -41% | 5.5 -48% | 4.8 -54% | 7.2 -31% | 7.01 ? -33% |
| Load (h) | 1.8 | 1.5 -17% | 1.9 6% | 1.5 -17% | 1 -44% | 1.4 -22% | 1.47 ? -18% |
| H.264 (h) | 6.2 | 5.4 | 9.2 | 8.26 ? |
Artılar
Eksiler
Conclusion
If you can put up with a color-poor 60 Hz display and a high noise level in 3D mode, the Omen 15-en0375ng is a powerful and not too expensive gaming notebook.
We consider around 1,260 Euros (~$1530) for a Ryzen 7 4800H, a GeForce RTX 2060, a 512 GB SSD and 16 GB dual-channel RAM to be a good offer that appeals to price-conscious gamers. Very high details are rarely a problem in the native resolution of 1,920 x 1,080. Buyers will also be spoiled with a top-notch battery life that even beats most other notebook classes.
If HP now improves the speed of the WLAN module, the stability of the case and the repeatedly criticized picture quality, the competition will have to dress extra warmly.
Note: Other AMD models of the Omen 15 offer a (probably better) 144 Hz panel.
Availability
The tested model with the suffix en0375ng is only listed by very few online stores (e.g. Mediamarkt & Saturn) and is unfortunately not available there at the moment.
HP Omen 15-en0375ng
- 12/29/2020 v7 (old)
Florian Glaser
Price comparison

