Lenovo Legion 5 15IMH05H İnceleme: Mükemmel güç ve iyi pil ömrü

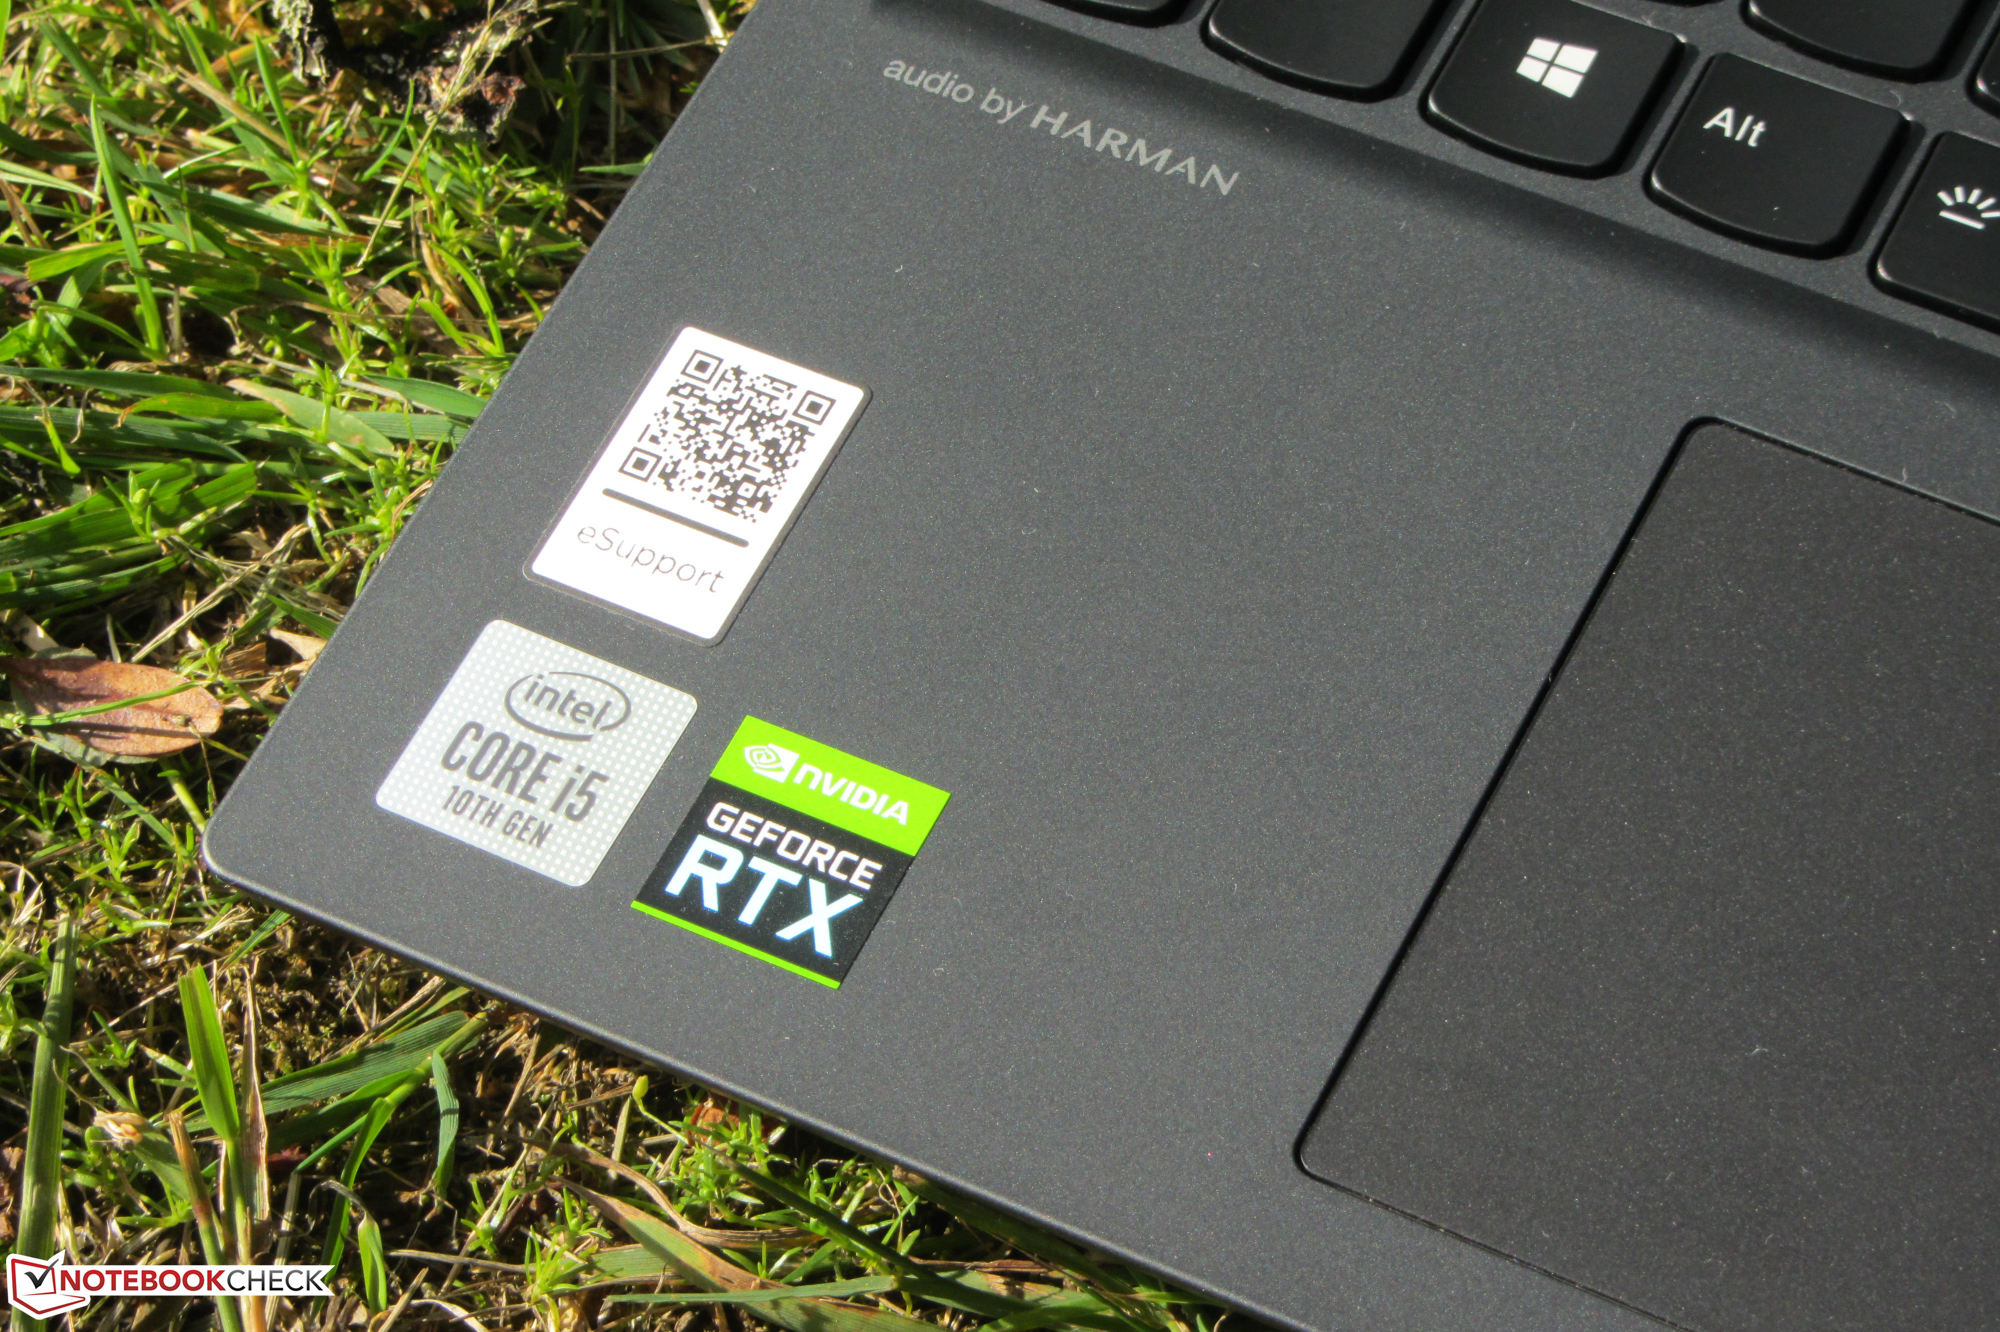
Lenovo Legion 5 15IMH05H, üst orta sınıf 15.6 inç oyun dizüstü bilgisayarıdır. Legion Y540-15IRH'nin halefi ve yapı tam olarak aynı olmasa da bu cihaza benziyor. Test yapılandırmamız bir Core-i5-10300H ve bir GeForce-RTX-2060 ile donatılmıştır. Rakipleri arasında Dell G5 15 SE, Asus TUF A15 FA506IV ve MSI Alpha 15 A3DDK-034 gibi cihazlar var.
Derecelendirme | Tarih | Modeli | Ağırlık | Yükseklik | Boyut | Çözünürlük | Fiyat |
|---|---|---|---|---|---|---|---|
| 83.3 % v7 (old) | 07/2020 | Lenovo Legion 5 15IMH05H i5-10300H, GeForce RTX 2060 Mobile | 2.5 kg | 26.1 mm | 15.60" | 1920x1080 | |
| 82.7 % v7 (old) | Asus TUF Gaming A15 FA506IV-HN172 R7 4800H, GeForce RTX 2060 Mobile | 2.2 kg | 24.9 mm | 15.60" | 1920x1080 | ||
| 83.7 % v7 (old) | 06/2020 | Dell G5 15 SE 5505 P89F R7 4800H, Radeon RX 5600M | 2.4 kg | 21.6 mm | 15.60" | 1920x1080 | |
| 78.8 % v7 (old) | 02/2020 | MSI Alpha 15 A3DDK-034 R7 3750H, Radeon RX 5500M | 2.3 kg | 27.5 mm | 15.60" | 1920x1080 |
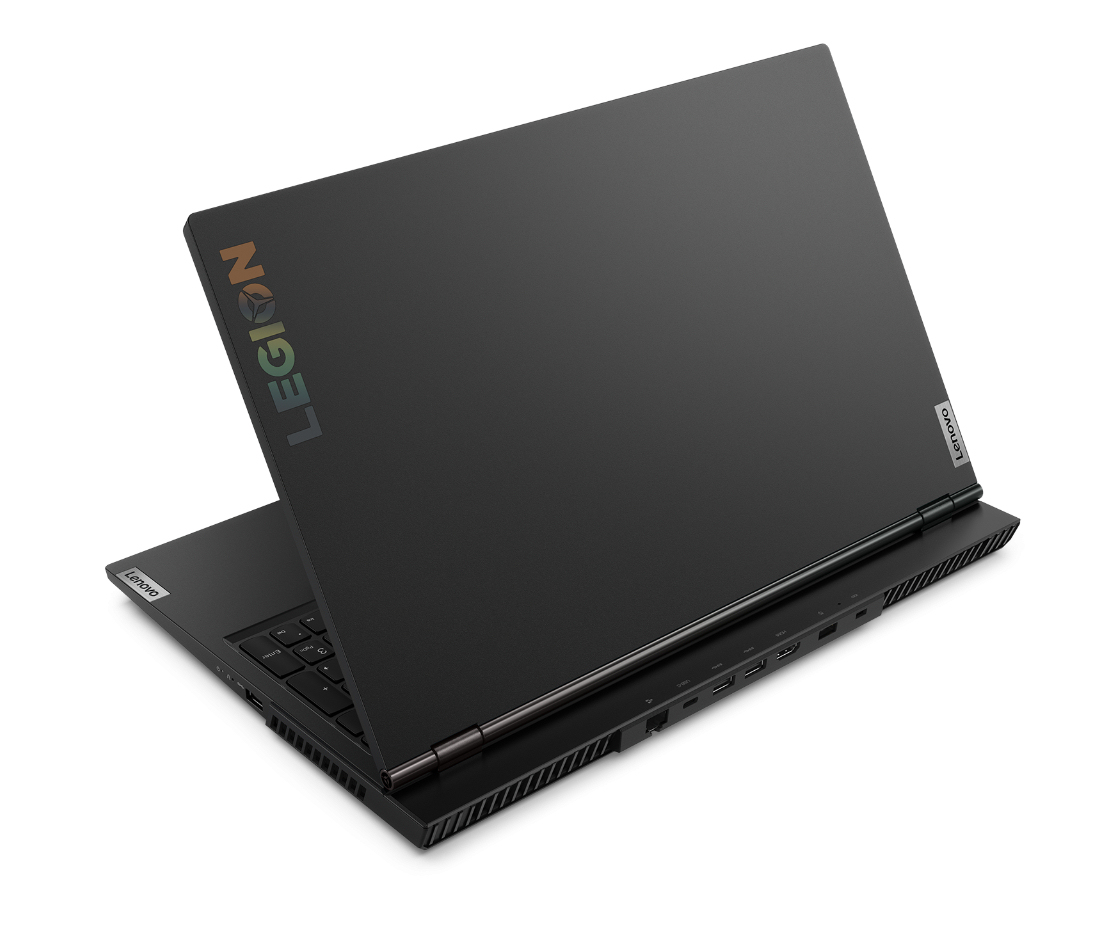
Çanta - Lenovo siyah plastik kullanıyor
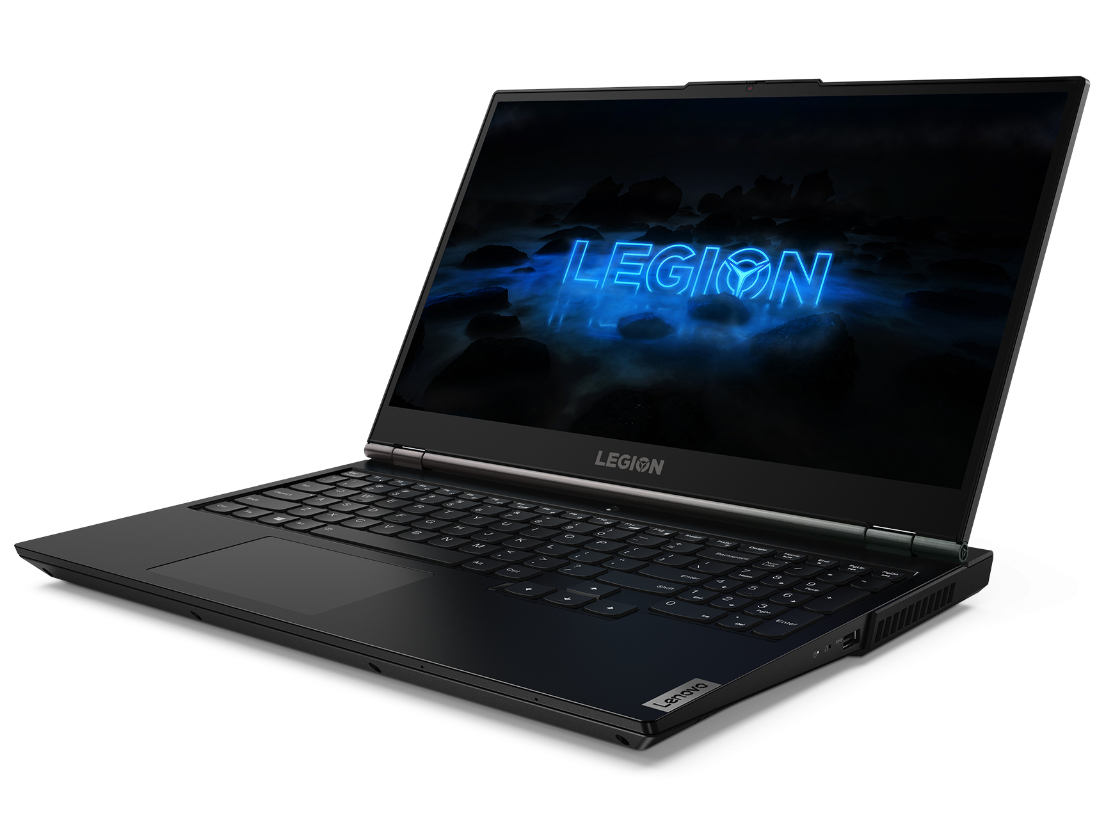
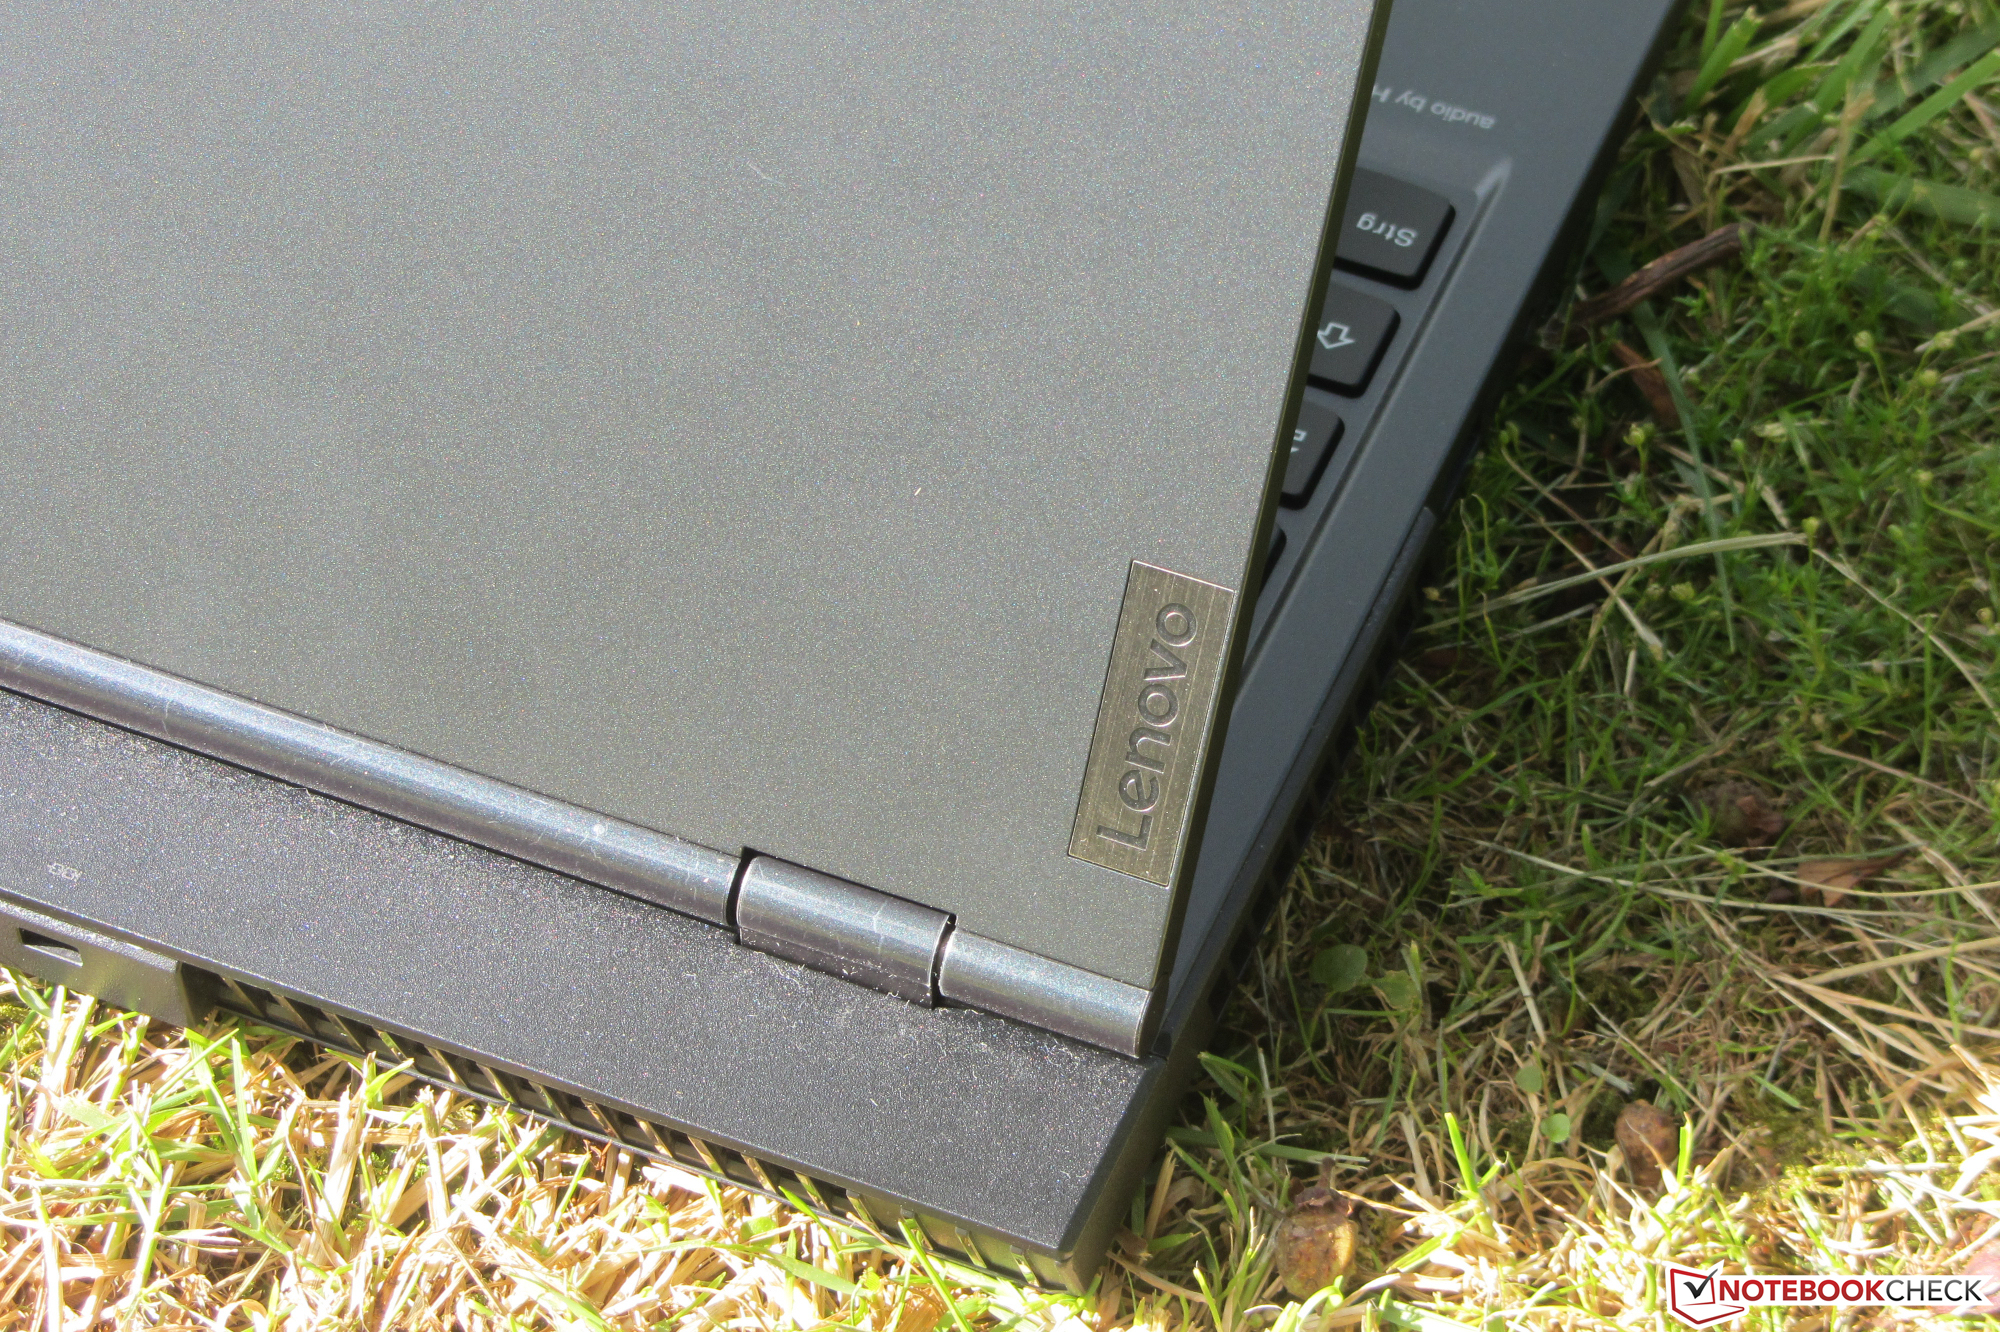
Lejyonun kasası tamamen siyah plastikten (Phantom Black) yapılmıştır, taban ünitesinin üstünde kauçuk bir yüzeye sahiptir. Cihazın en dikkat çeken yönü, menteşelerin öne doğru 25 mm (~ 0,98 inç) kaydırıldığından kapağın ana birime bağlanma şeklidir. Akü sıkıca yerleştirilmiştir ve bakım kapağı yoktur. Dizüstü bilgisayar, önceki oyun Lejion Y540-15IRH'de bazı farklılıklar olsa da, Lenovo oyun serisini bilen kullanıcılara tanıdık gelecek. Dizüstü bilgisayarın işçiliği iyi. Boşluk boyutları düzenli ve herhangi bir taşan malzeme fark etmedik. Ne yazık ki, cihaz umduğumuz kadar sağlam değil. Ana birim yalnızca hafifçe bükülebilir, ancak çok fazla baskı yapmadan klavyenin sağ ve sol tarafına sıkıştırılabilir. Kapak, oldukça hayal kırıklığına uğradığımız önemli ölçüde bükülebilir. Ekranın arkasındaki basınç görüntünün birkaç alanda değişmesine neden olur. Menteşeler sıkıdır ve kullanıcıların cihazı tek elle açmasına izin verirken kapağı yerinde tutar.
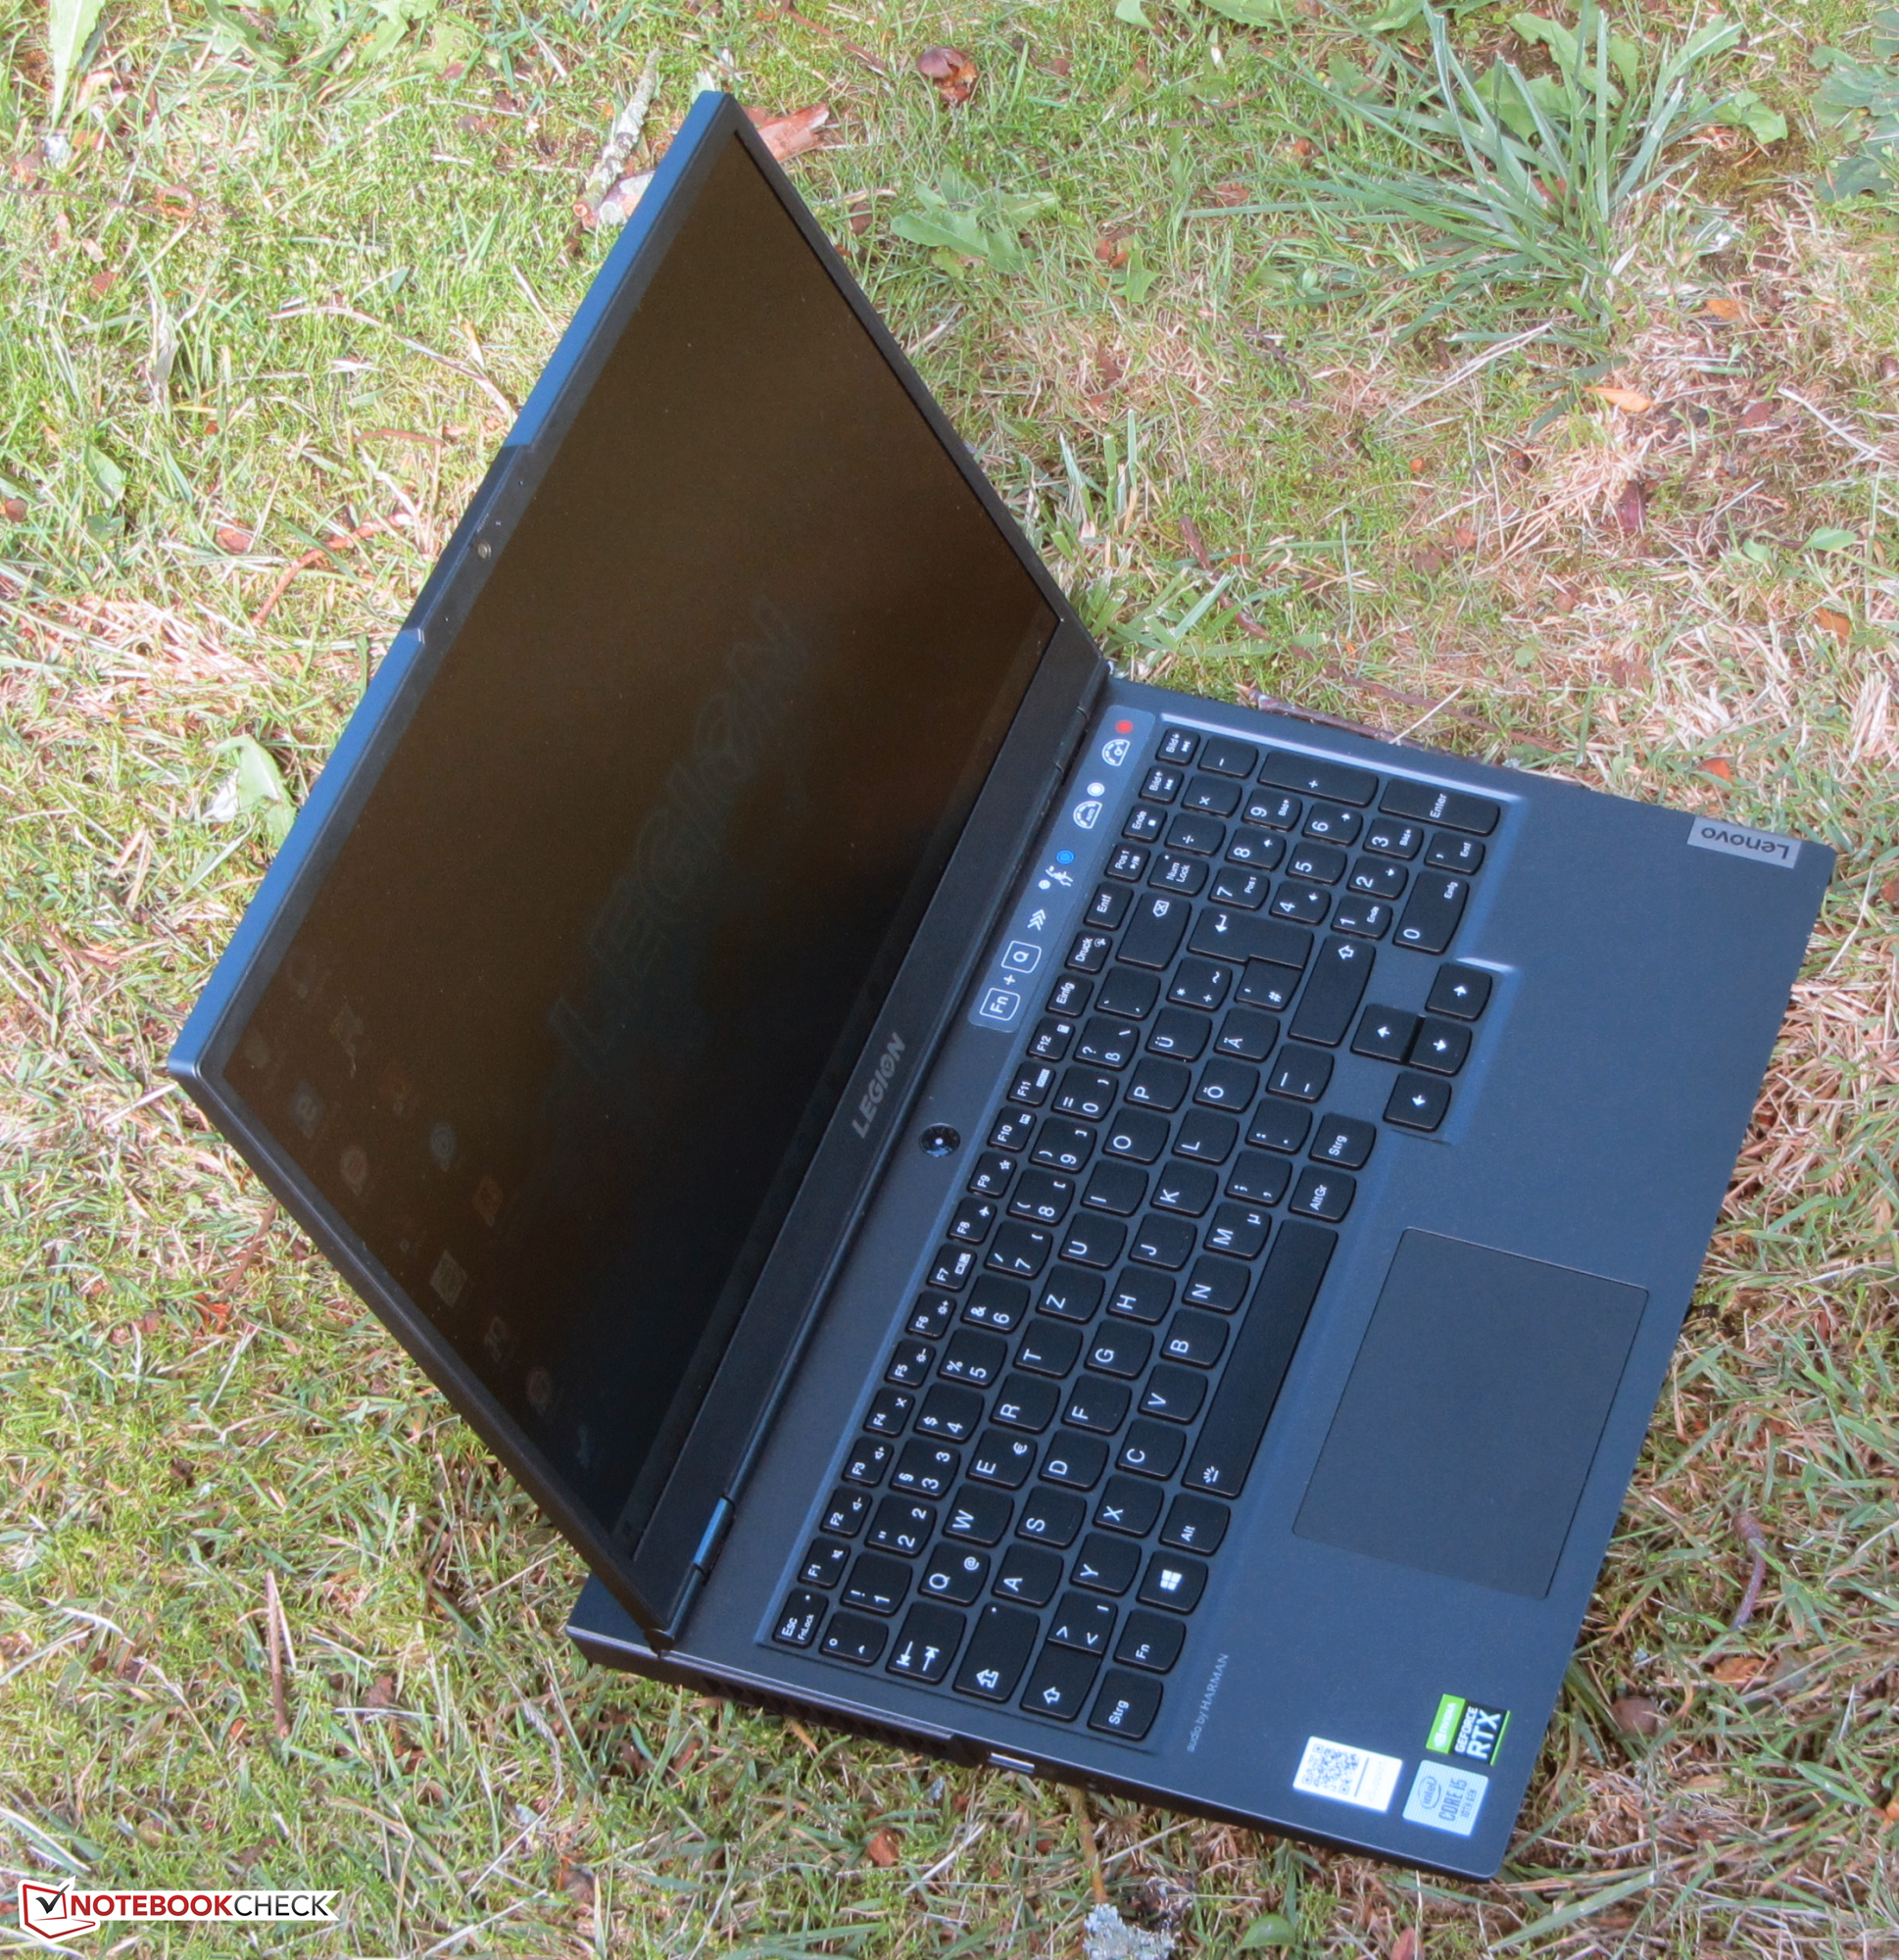

Çeşitli cihazların boyutları arasında büyük bir fark yoktur, ancak Legion 2.5 kg (~ 5.5 lb) ağırlığa sahip en ağır dizüstü bilgisayardır.
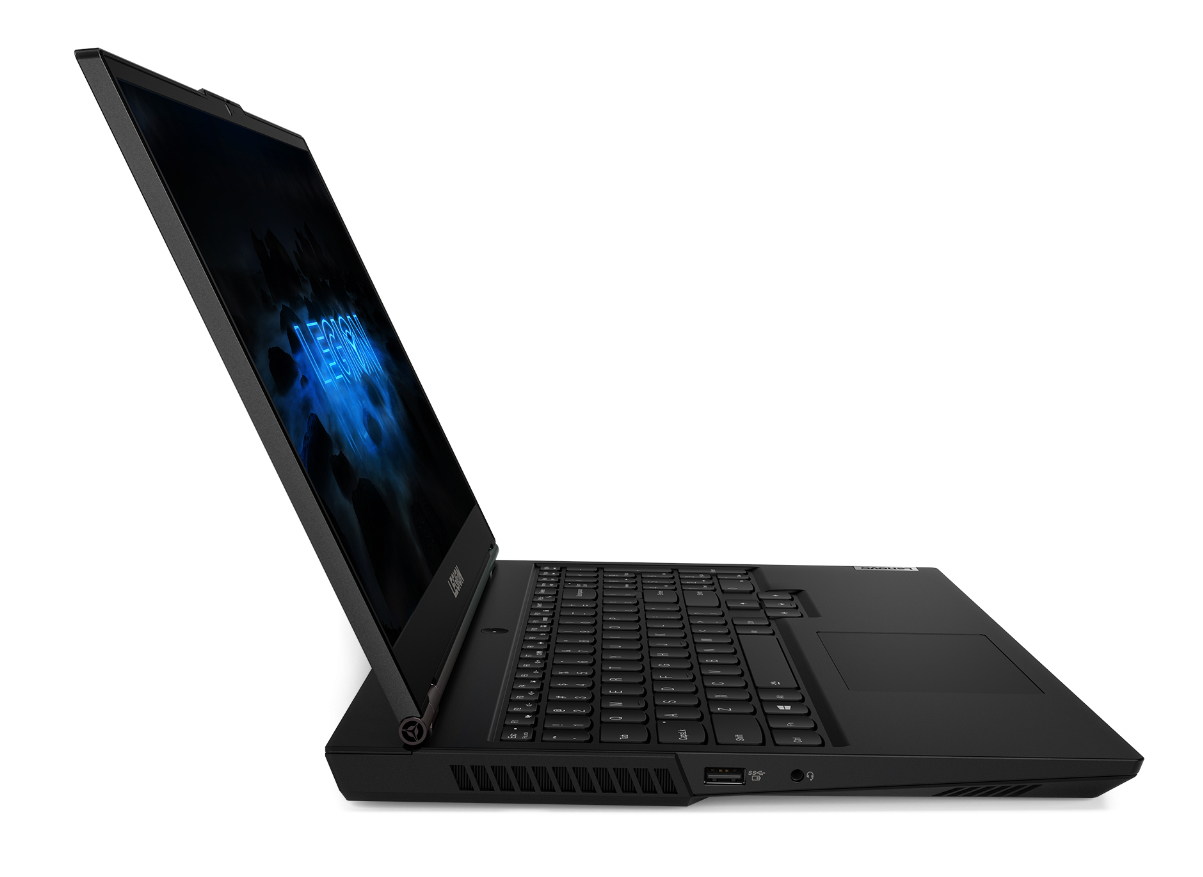
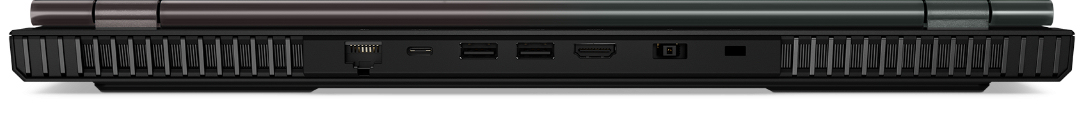
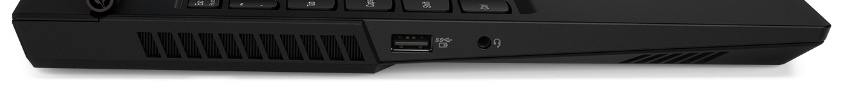
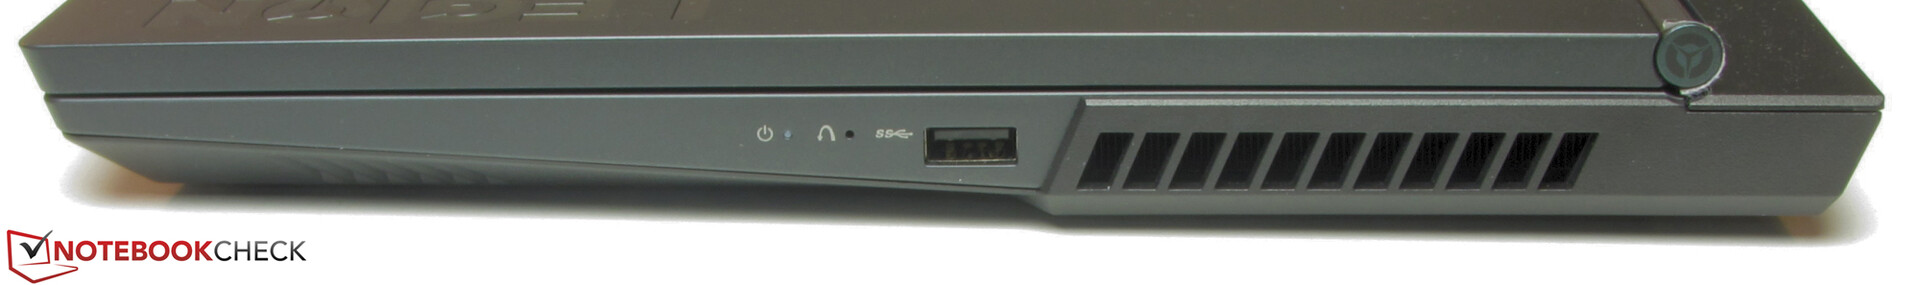
Bağlantı - Bu Lenovo için Thunderbolt 3 yok
Lenovo, liman seçimi konusunda sürprizler sunmuyor. Aygıtın tümü USB 3.2 Gen 1 standardını destekleyen dört USB bağlantı noktasına (3x Tip A, 1x Tip C) sahiptir. Buna ek olarak, C Tipi bağlantı noktası USB-C üzerinden DisplayPort işlevini destekler (ancak kullanıcıların bunu kullanmak için ayrı bir adaptör satın alması gerekir). Bir Thunderbolt 3 portunu takdir ederdik ve Legion'un bir SD kart okuyucu sunmadığını da fark ederdik. Portlar üç tarafa yayılmıştır. Sol ve sağdaki portlar ortada konumlandırılmıştır, bu da bilek dayanaklarının etrafında yeterli boş alan bırakır.
İletişim
Birlikte verilen Wi-Fi modülü (Intel Wi-Fi 6 AX201) hızlı balta standardını destekler. İdeal koşullar altında test ettik (yakınlarda başka hiçbir Wi-Fi cihazı yok, dizüstü bilgisayar ve sunucu PC arasındaki kısa mesafe) ve aktarım hızları çok iyiydi. Legion ayrıca, Realtek'in RTL 8168/8111 serisinden güvenilir bir şekilde çalışan bir Gigabit Ethernet denetleyicisine de sahiptir.
| Networking | |
| iperf3 transmit AX12 | |
| Dell G5 15 SE 5505 P89F | |
| Ortalama Intel Wi-Fi 6 AX201 (49.8 - 1775, n=324) | |
| Asus TUF Gaming A15 FA506IV-HN172 | |
| MSI Alpha 15 A3DDK-034 | |
| Lenovo Legion 5 15IMH05H | |
| iperf3 receive AX12 | |
| Dell G5 15 SE 5505 P89F | |
| Ortalama Intel Wi-Fi 6 AX201 (136 - 1743, n=324) | |
| Lenovo Legion 5 15IMH05H | |
| MSI Alpha 15 A3DDK-034 | |
| Asus TUF Gaming A15 FA506IV-HN172 | |
Web kamerası
Legion 5'in web kamerası (0.9 MP), maksimum 1280x720 piksel çözünürlüğe sahip soluk görüntüler oluşturur. Renkler de özellikle doğru bir şekilde gösterilmiyor - 25'in altında bir Delta E sapması ölçtük, bu da 3'ün altında olan idealden çok uzak.


Aksesuarlar
Dizüstü bilgisayar her zamanki evraklarla birlikte verilir: hızlı başlangıç kılavuzu ve garanti bilgileri.
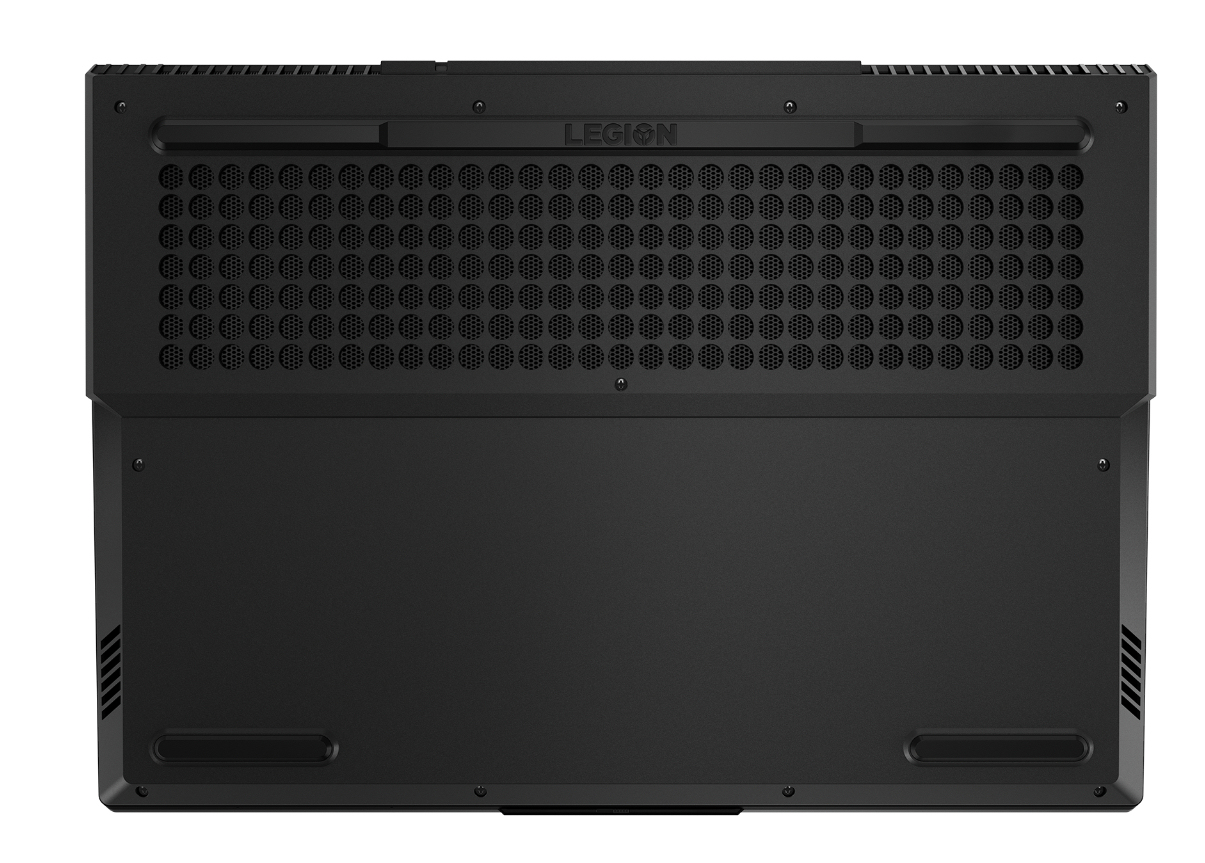
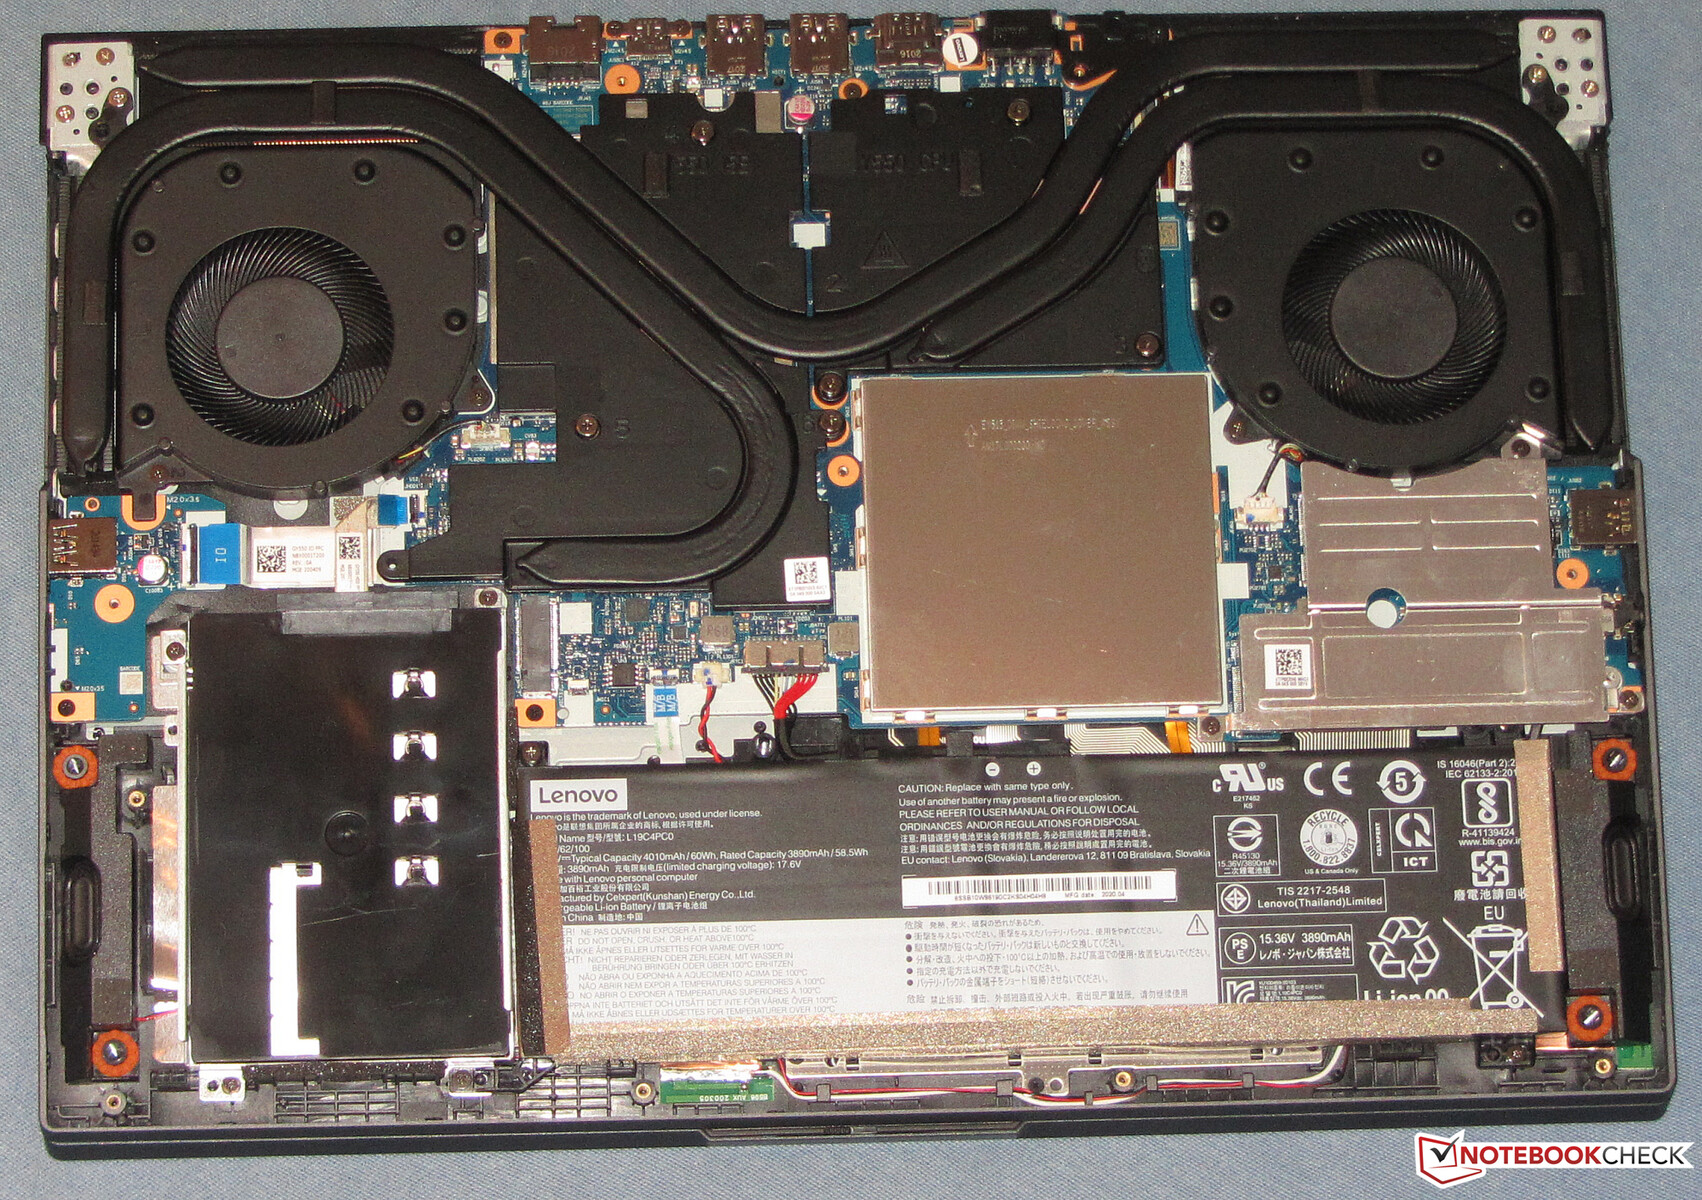
Bakım
Lenovo dizüstü bilgisayarın bakım kapağı yoktur. Kullanıcılar, tüm vidaları çıkararak ve bir spatula veya benzer bir düz alet yardımıyla kapağı kaldırarak iç kısımlara ulaşmak için taban kapağını çıkarmak zorunda kalacaklar. Bu, ana birimin arkasında daha zordur - dikkatli çalışmanız gerekecektir.
Garanti
Lenovo, 15.6 inçlik cihazını iki yıl garantilidir. Çeşitli garanti uzatmaları mevcuttur. Örneğin, dört yıllık yerinde garanti maliyeti 101 ABD dolarıdır.

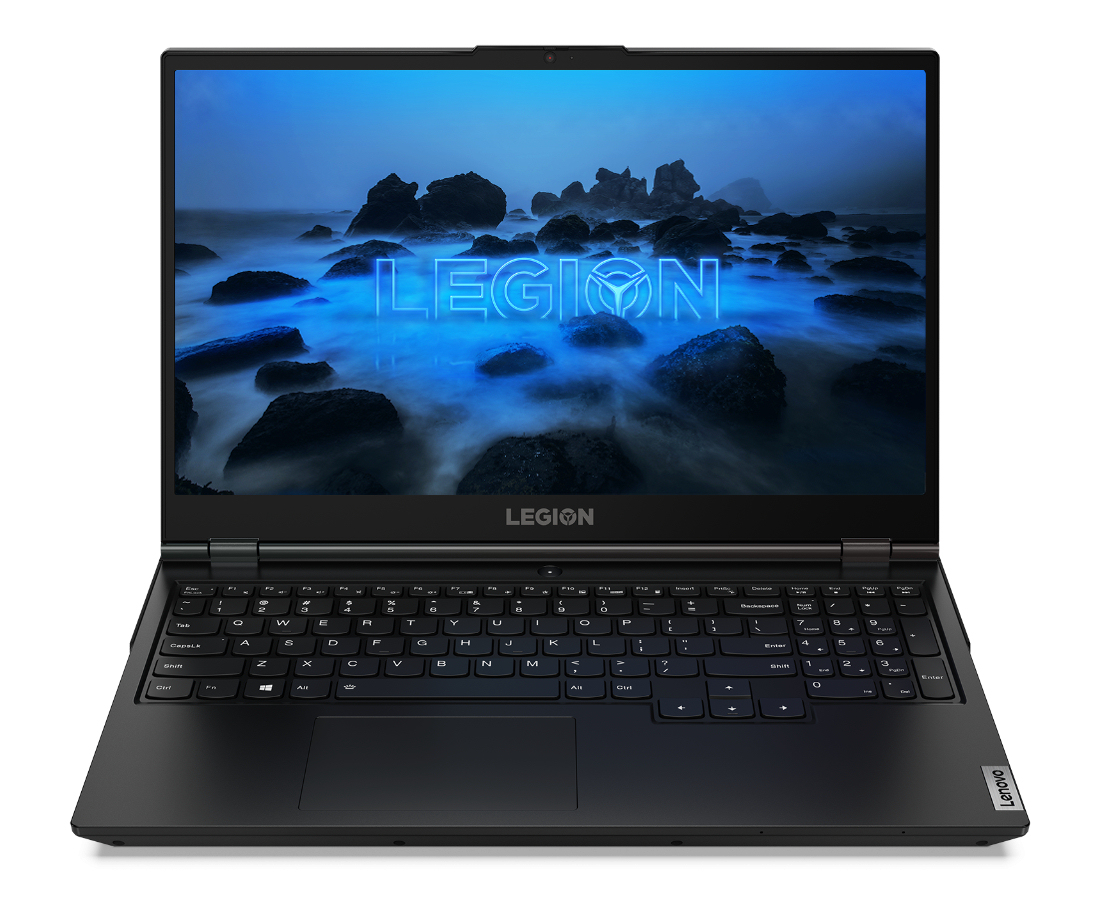
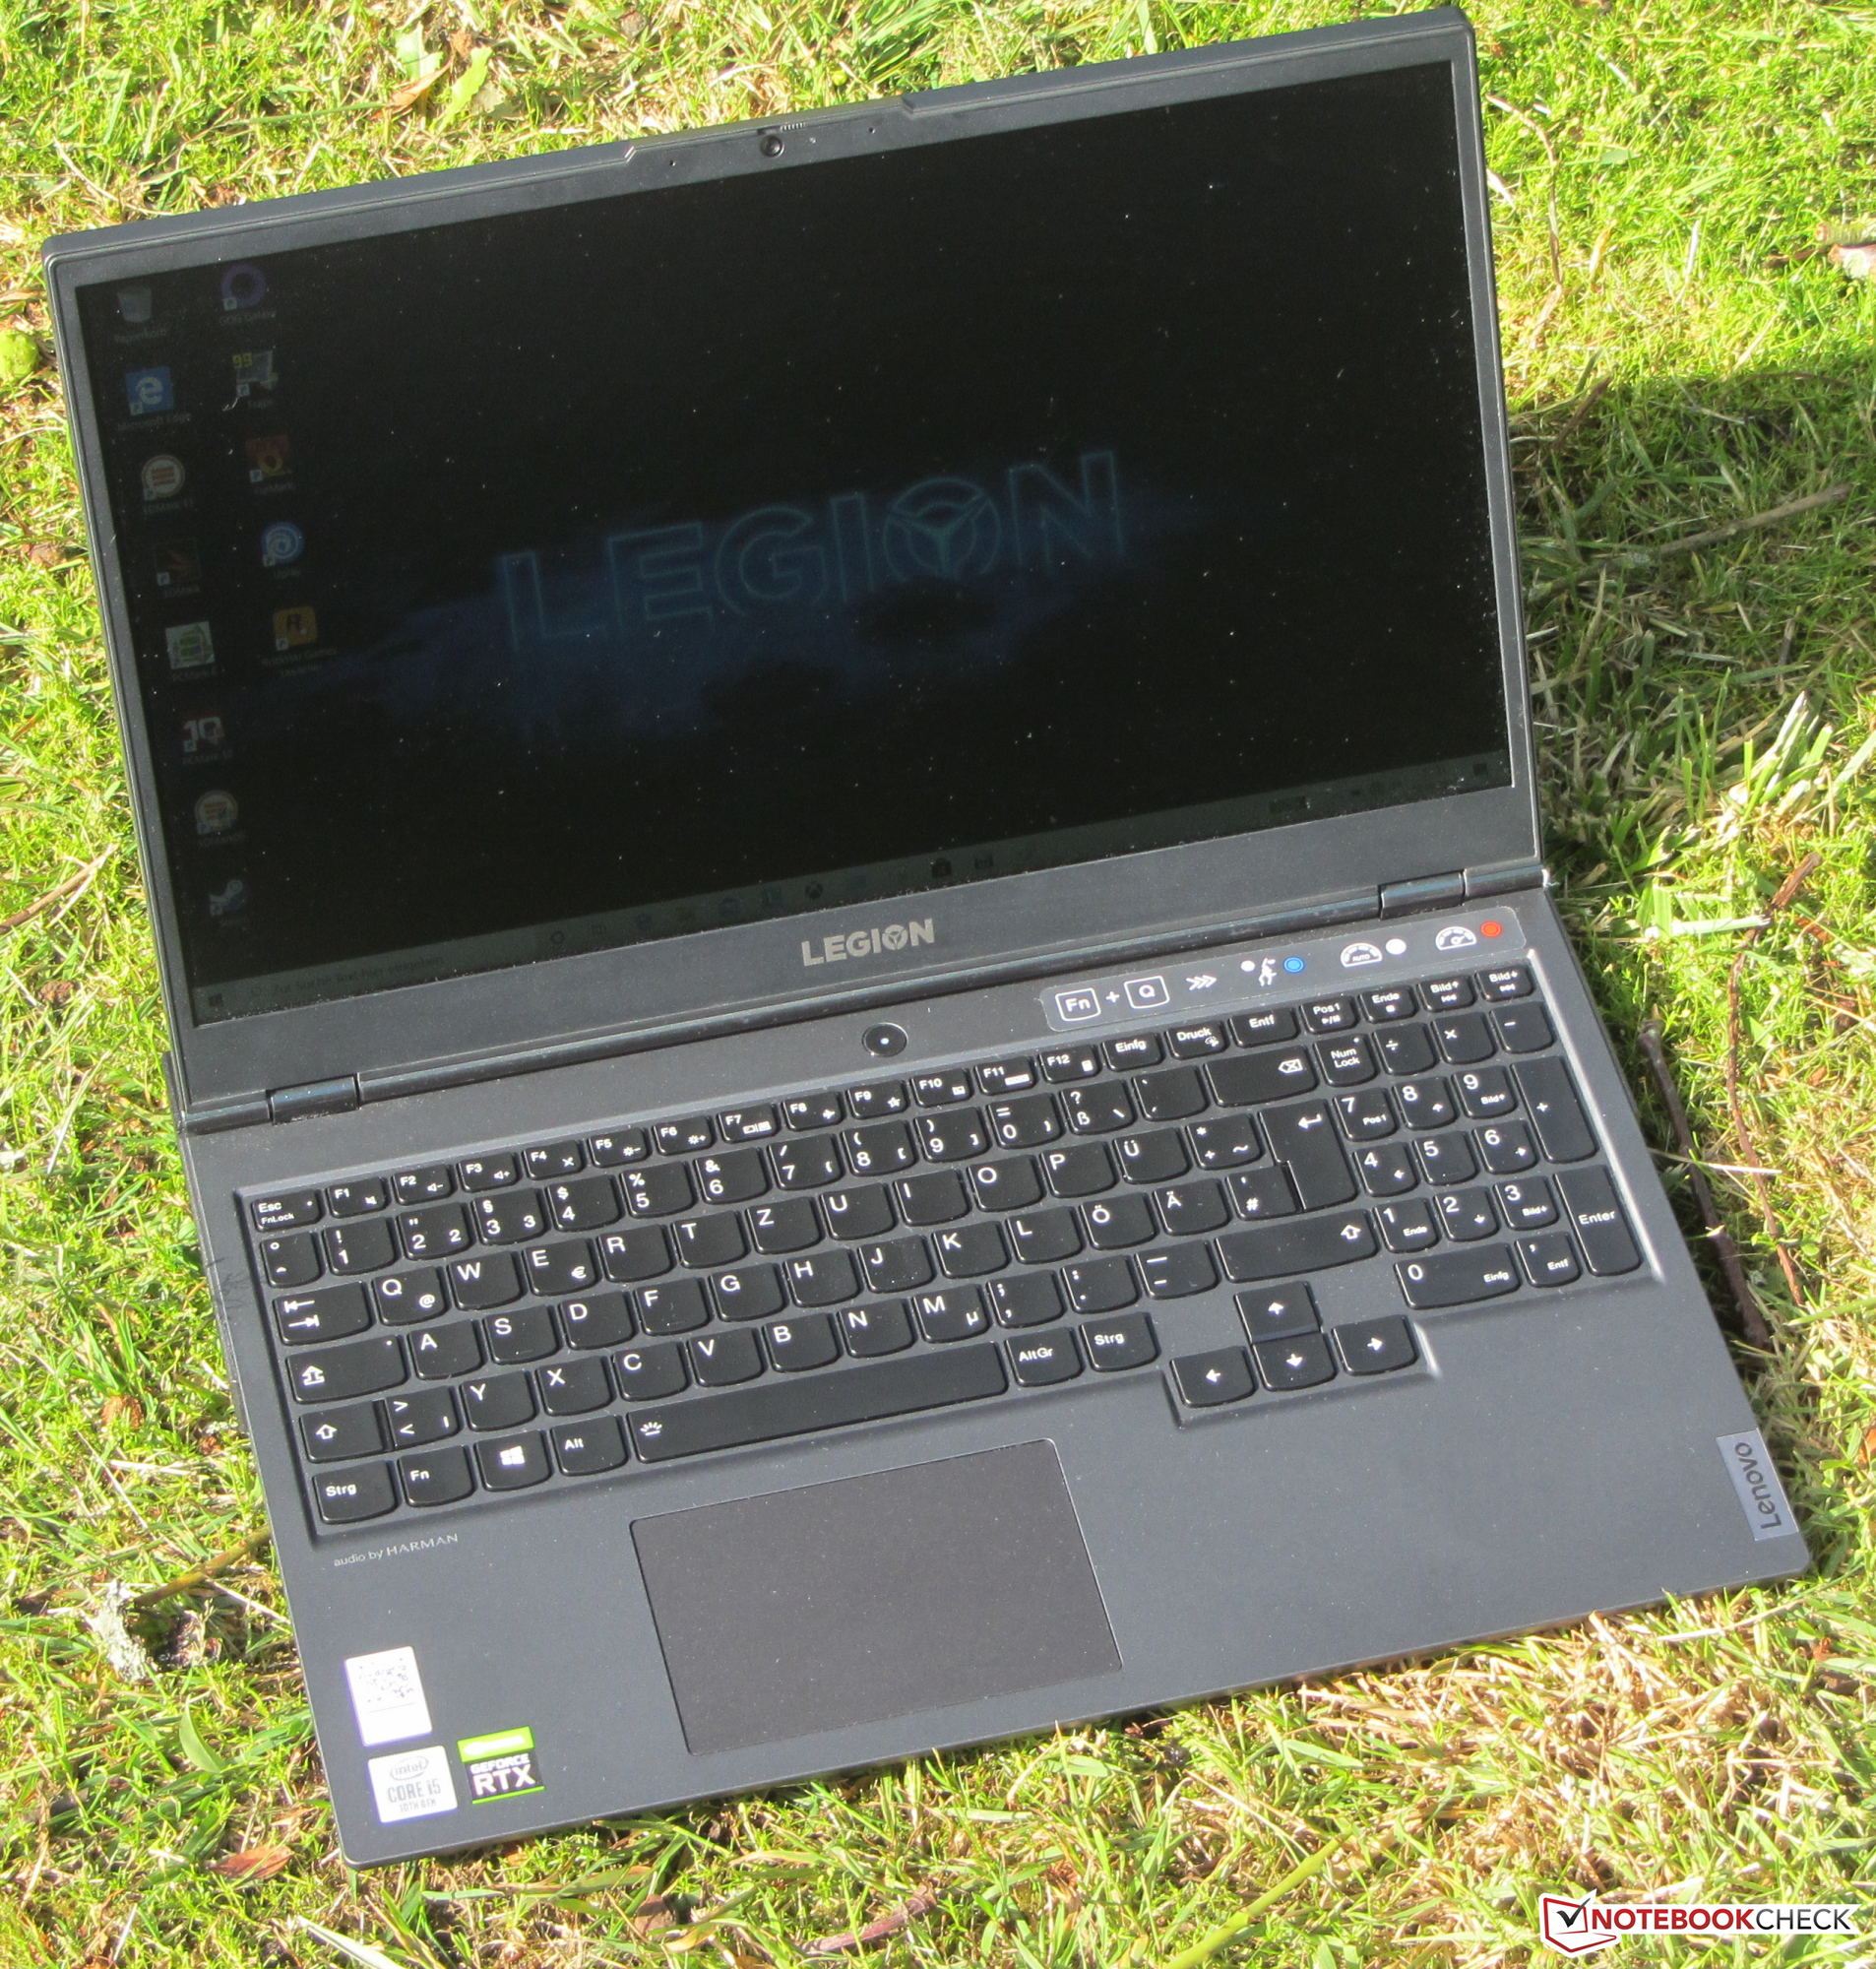
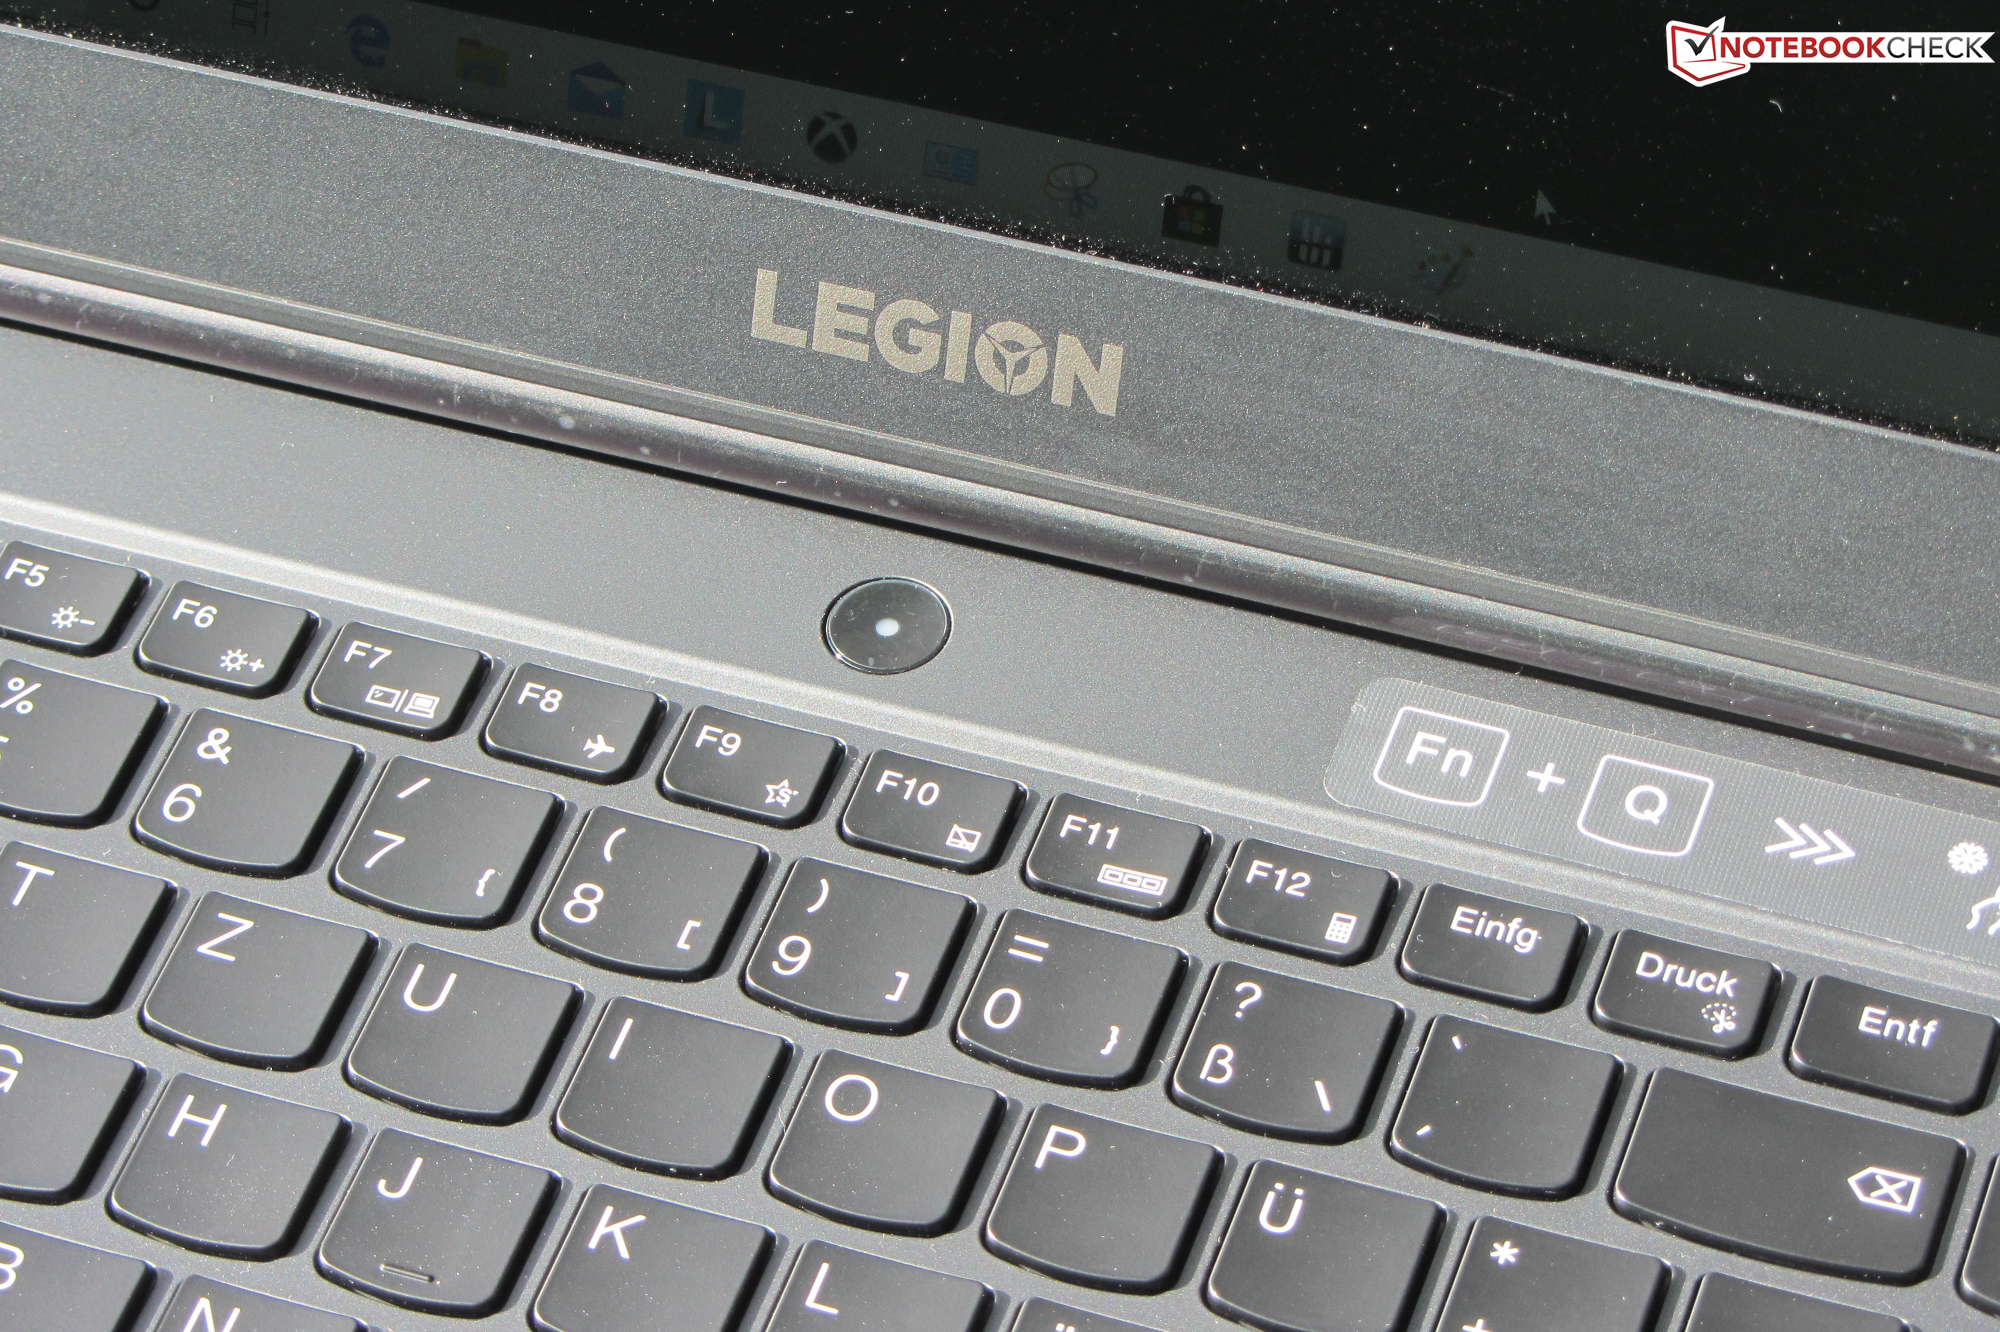
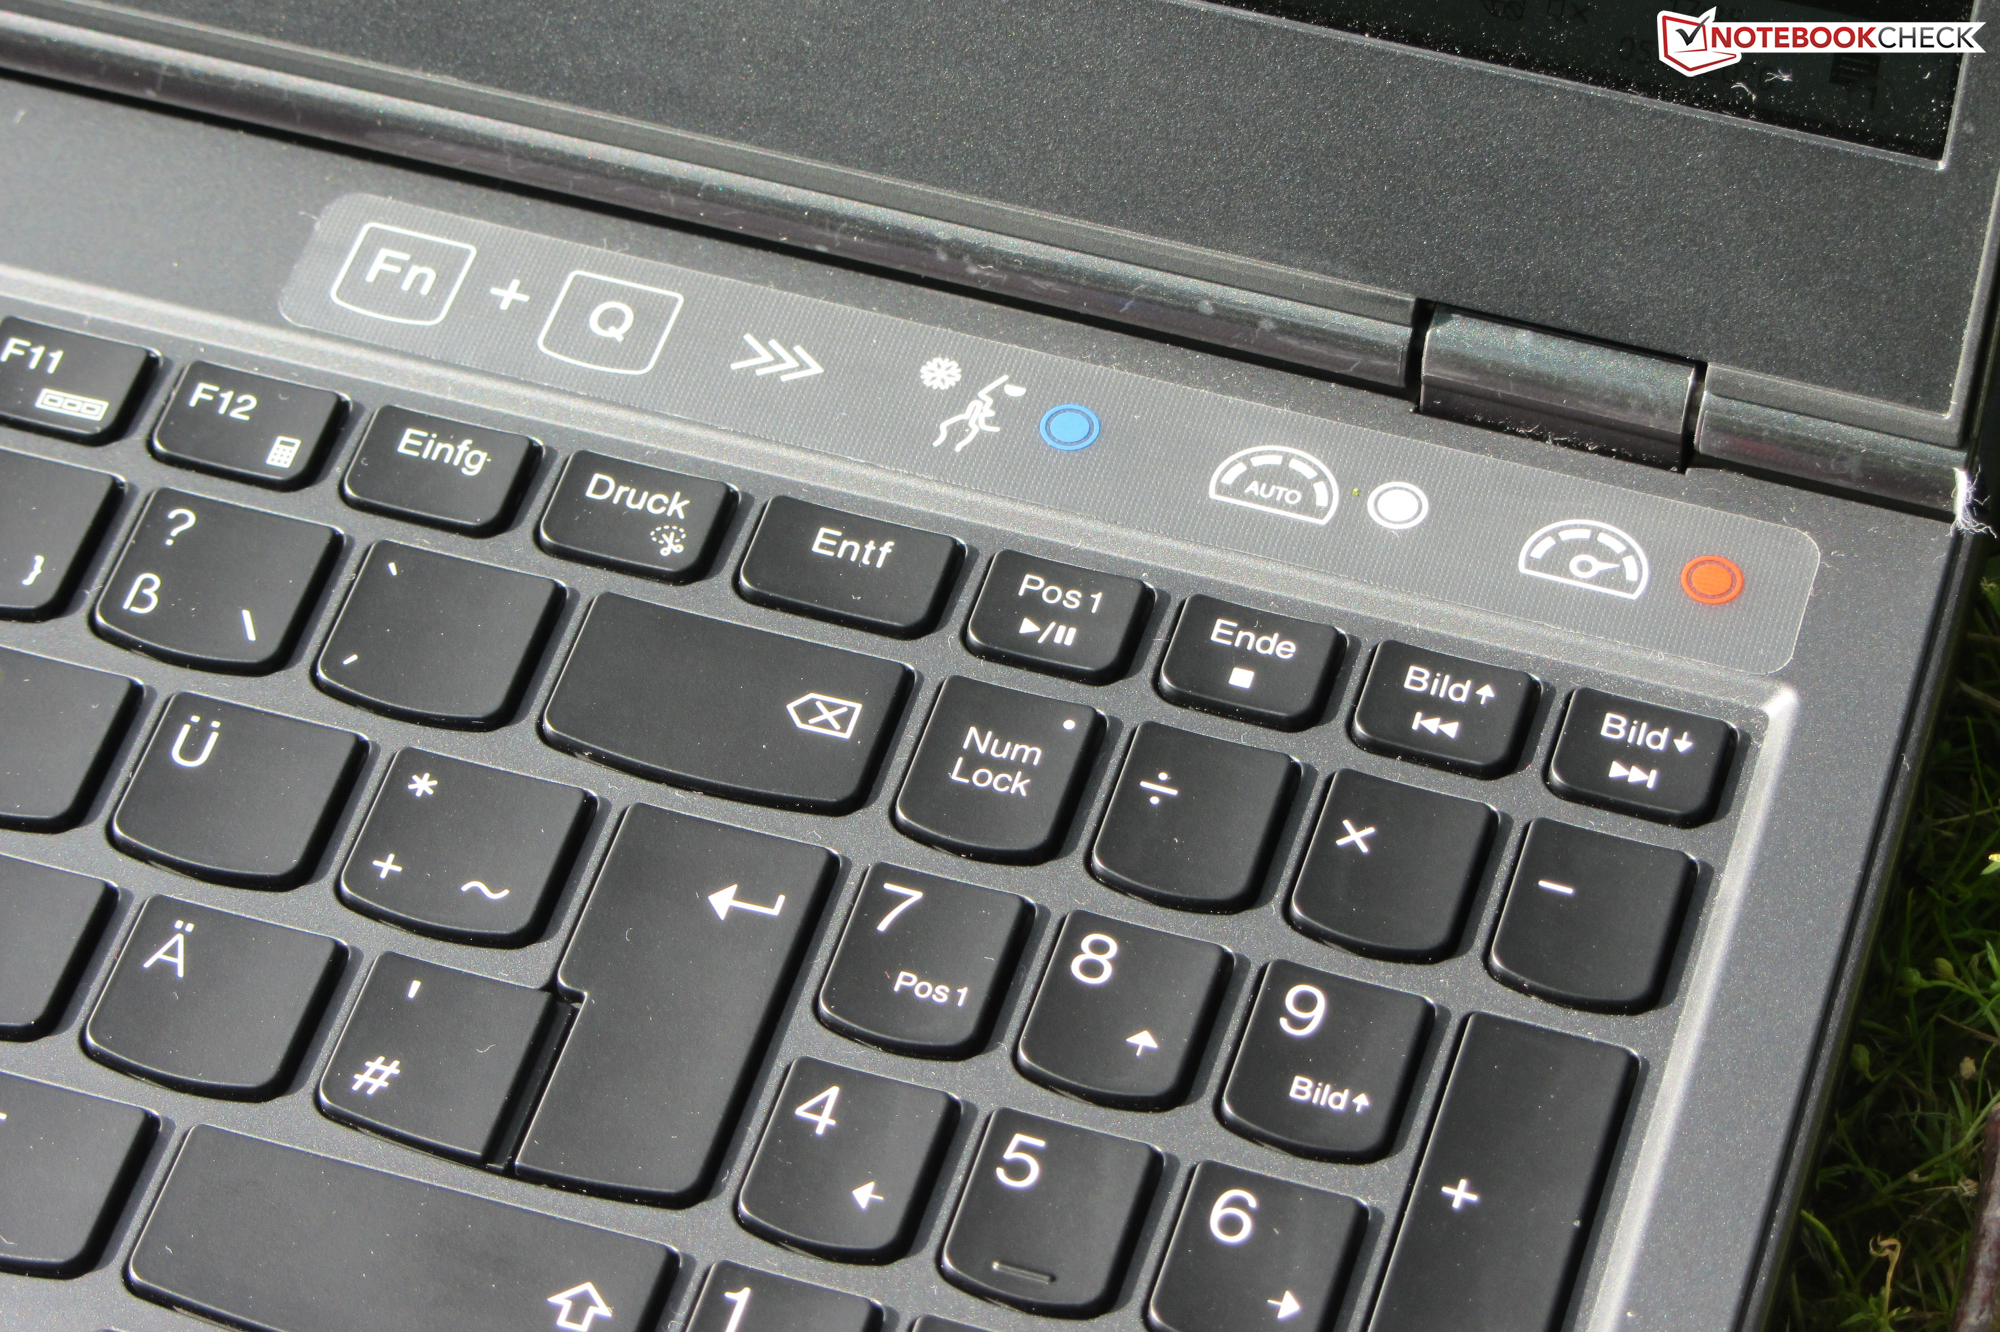
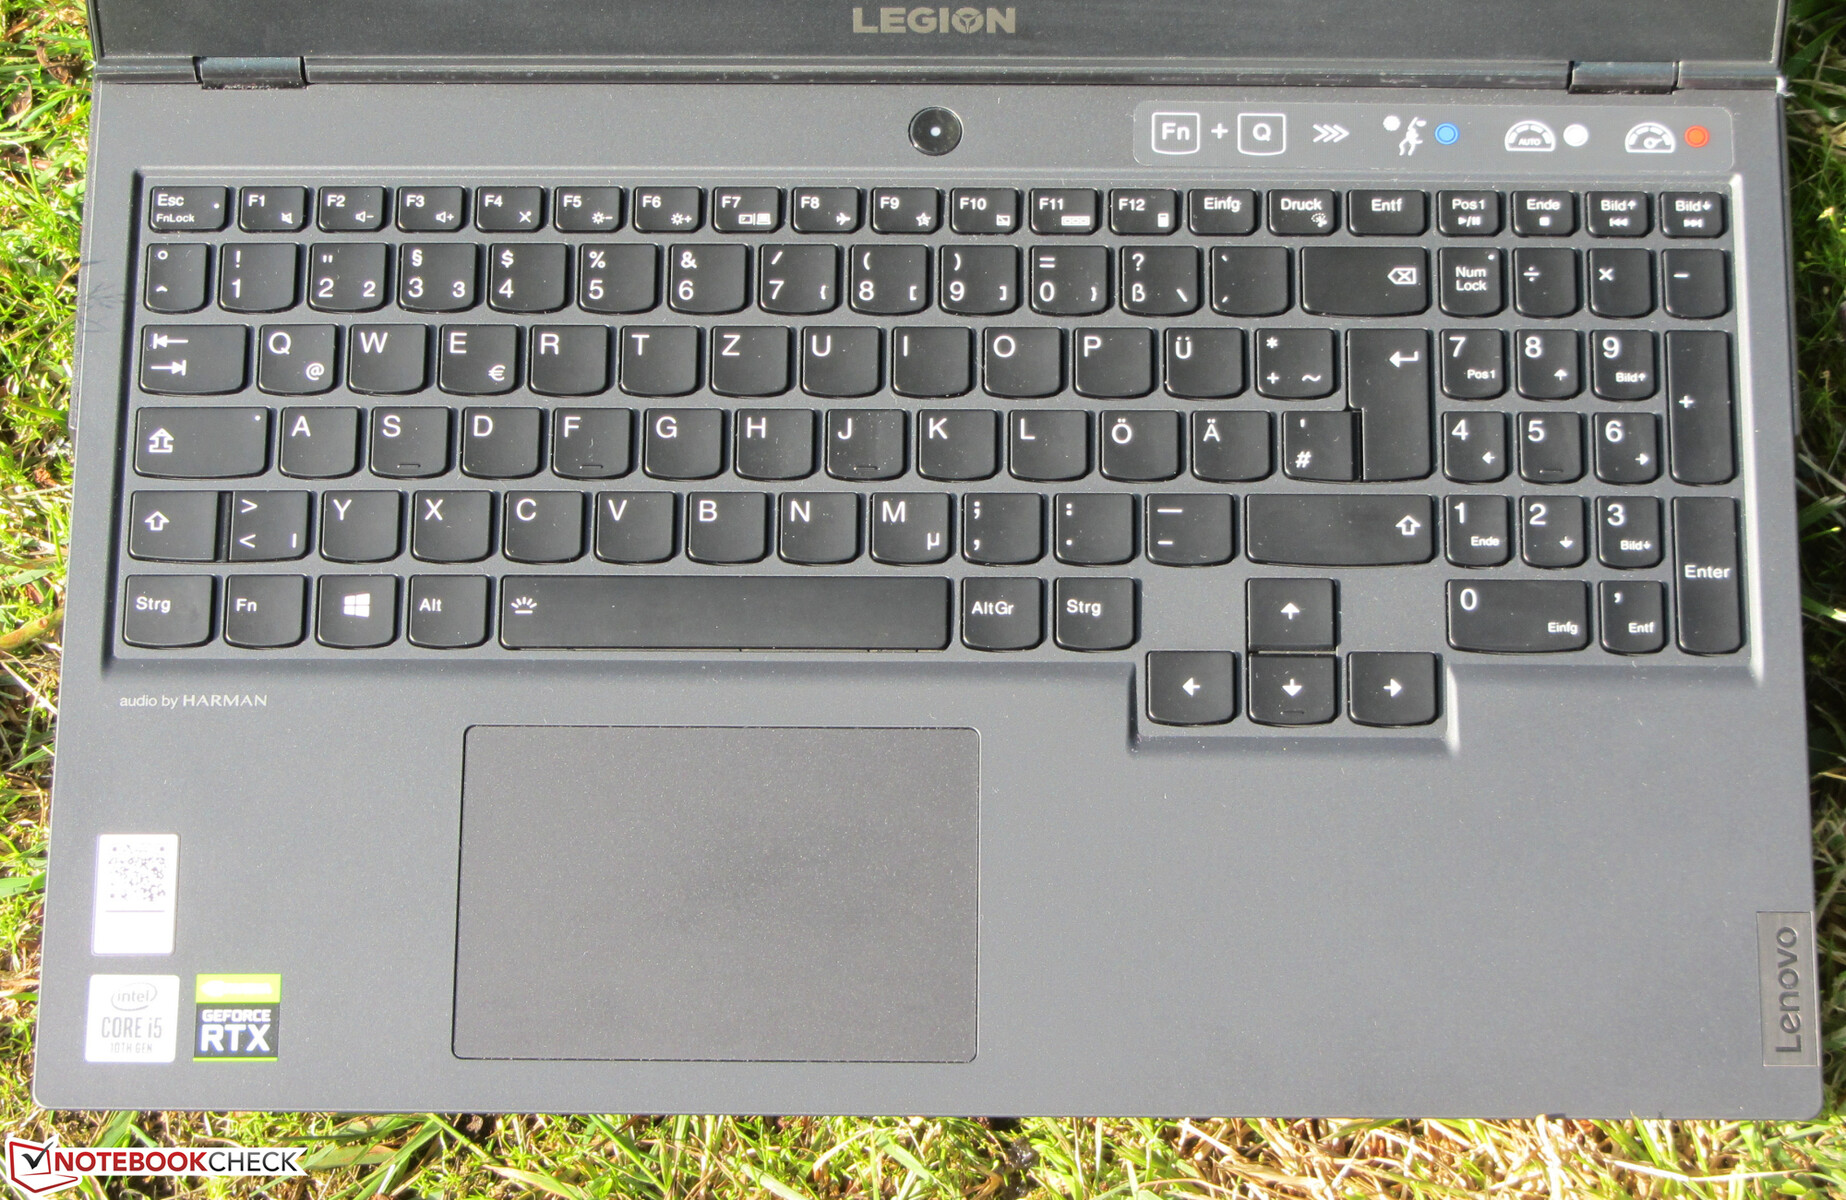
Giriş Aygıtları - arkadan aydınlatmalı net klavye
Legion arkadan aydınlatmalı bir civciv klavyesi ile donatılmıştır. İçbükey anahtarları kısa hareket mesafesine ve açık bir basınç noktasına sahiptir. Keskin hareketten de memnun kaldık. Klavye yazarken neredeyse hiç yol açmıyor ve bu kesinlikle bir sorun değildi. Arka aydınlatma (iki parlaklık seviyesi) bir fonksiyon tuşu ile kontrol edilebilir. Genel olarak, bu günlük kullanım için uygun iyi bir klavyedir.
Dokunmatik
Çoklu dokunuşlu ClickPad yaklaşık 10,6 x 7 cm (~ 4,17 x 2,75 inç) yer kaplar. Bu nedenle hareket kontrolü için yeterli alan sunar. Pedin pürüzsüz yüzeyi, parmakların kaymasını kolaylaştırır. Köşelerde bile girişlere güzel tepki verir, kısa hareket ve net (ve duyulabilir) basınç noktasına sahiptir.
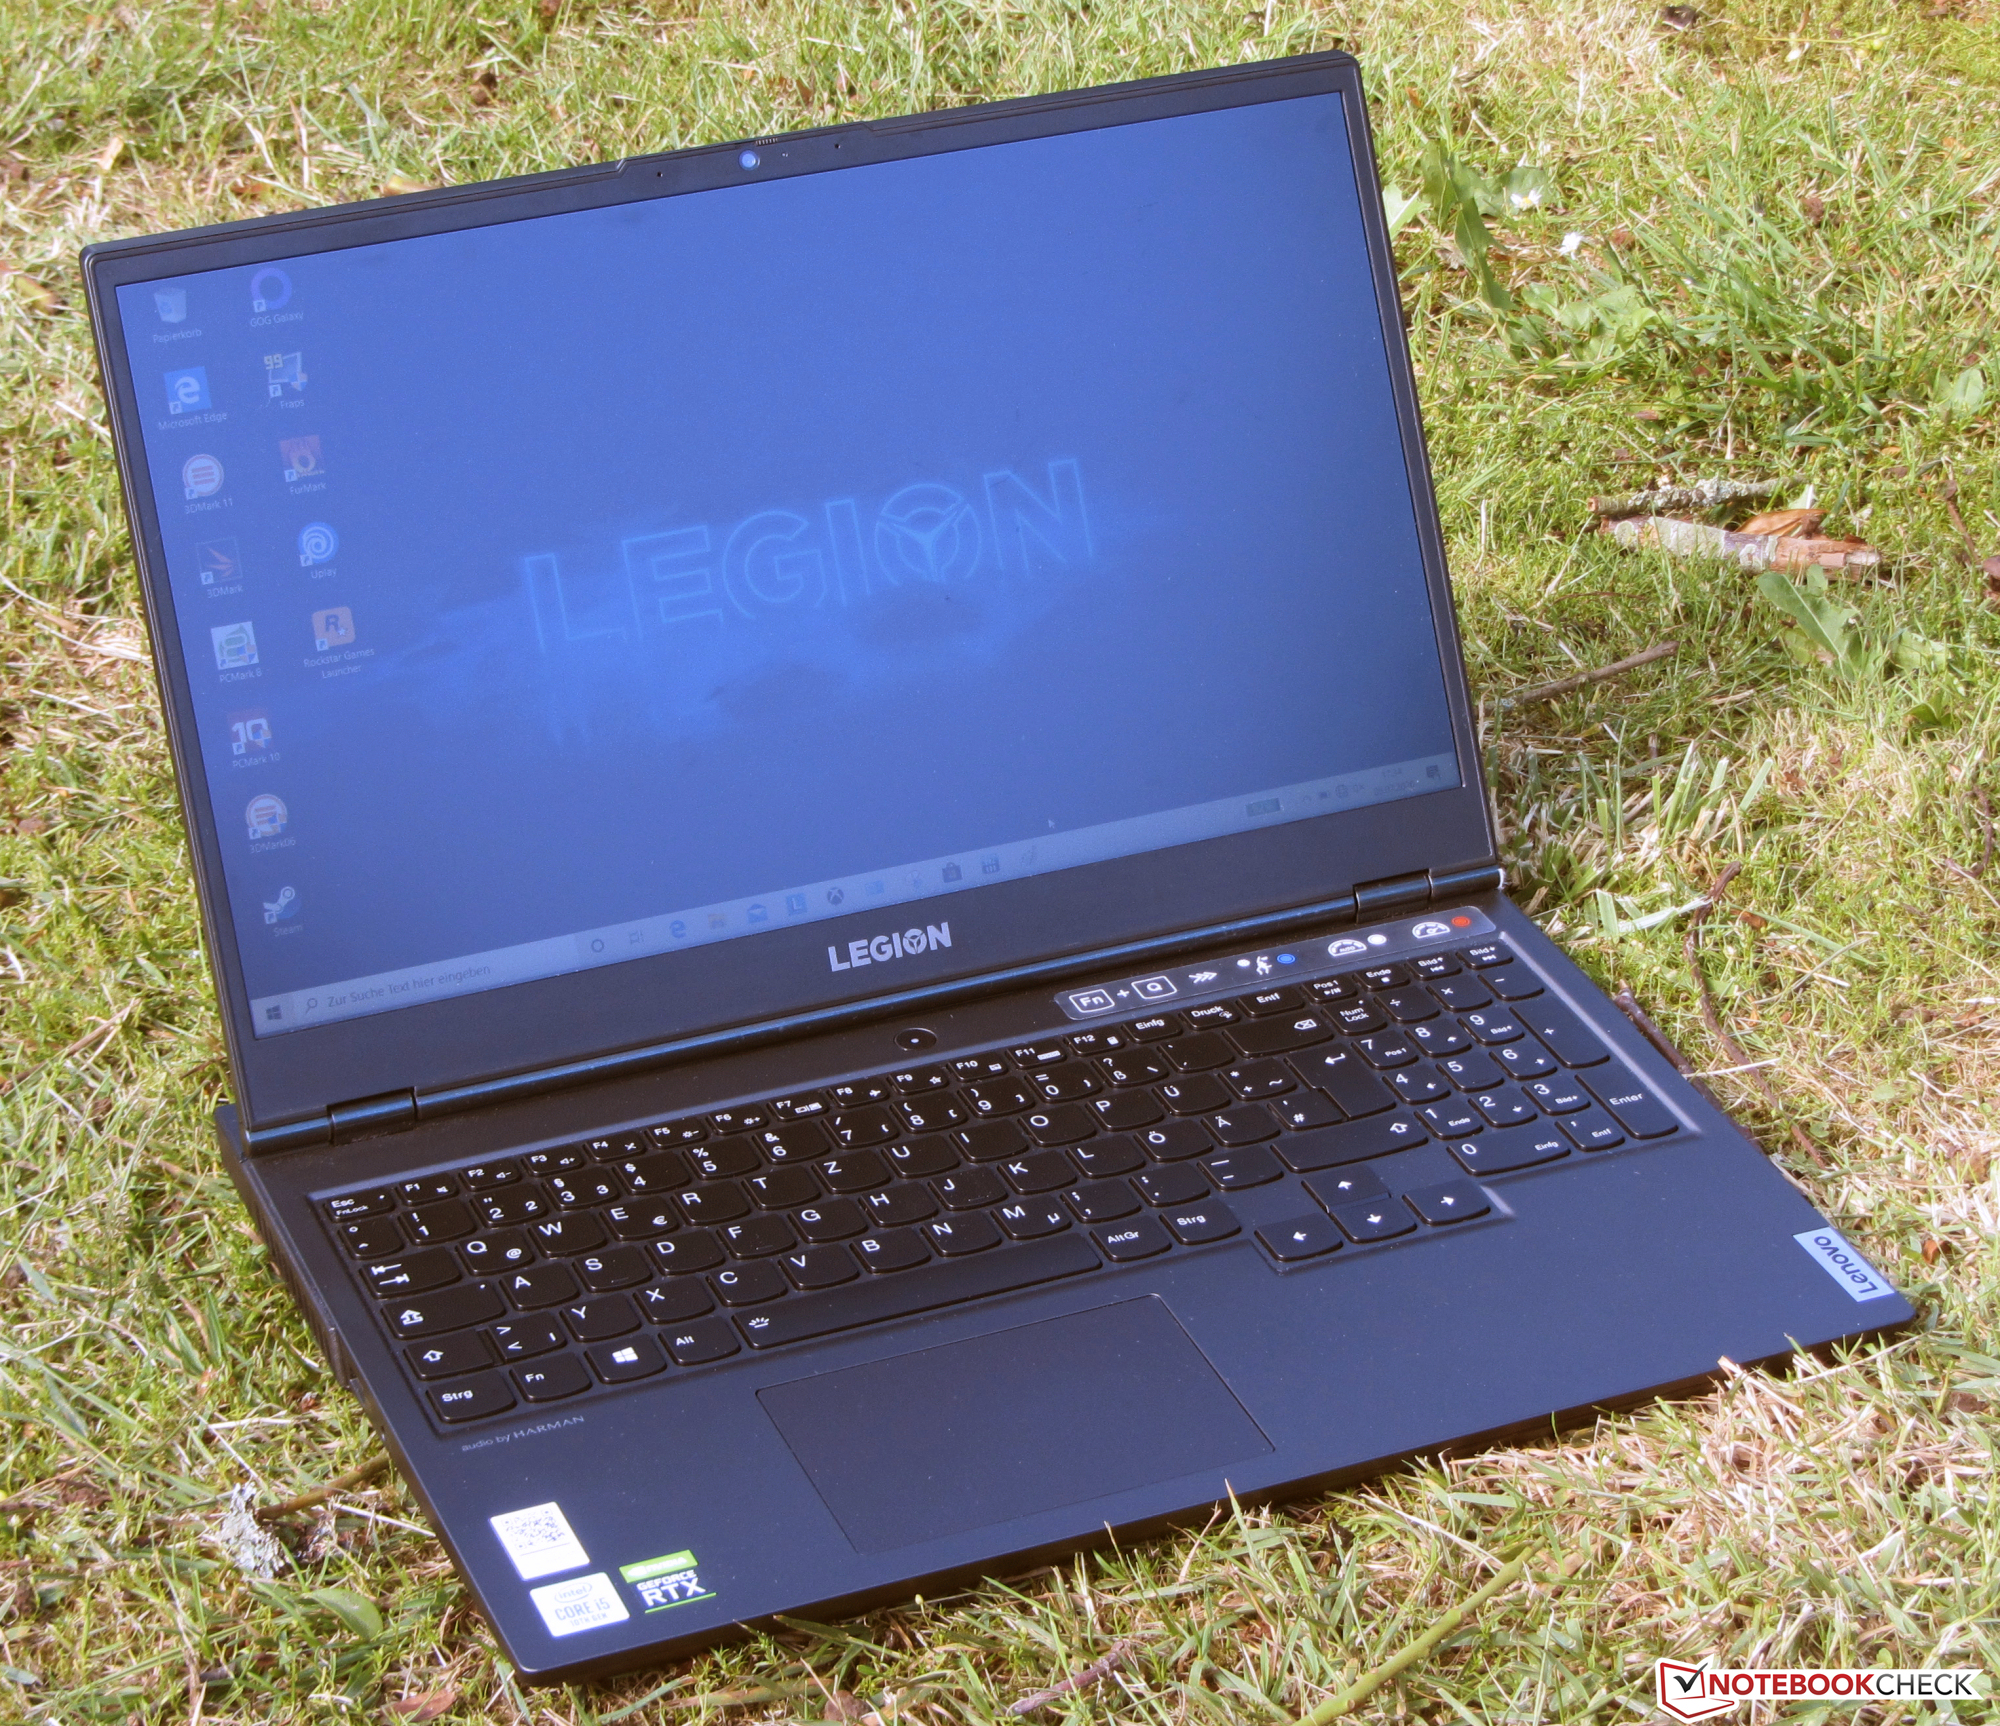
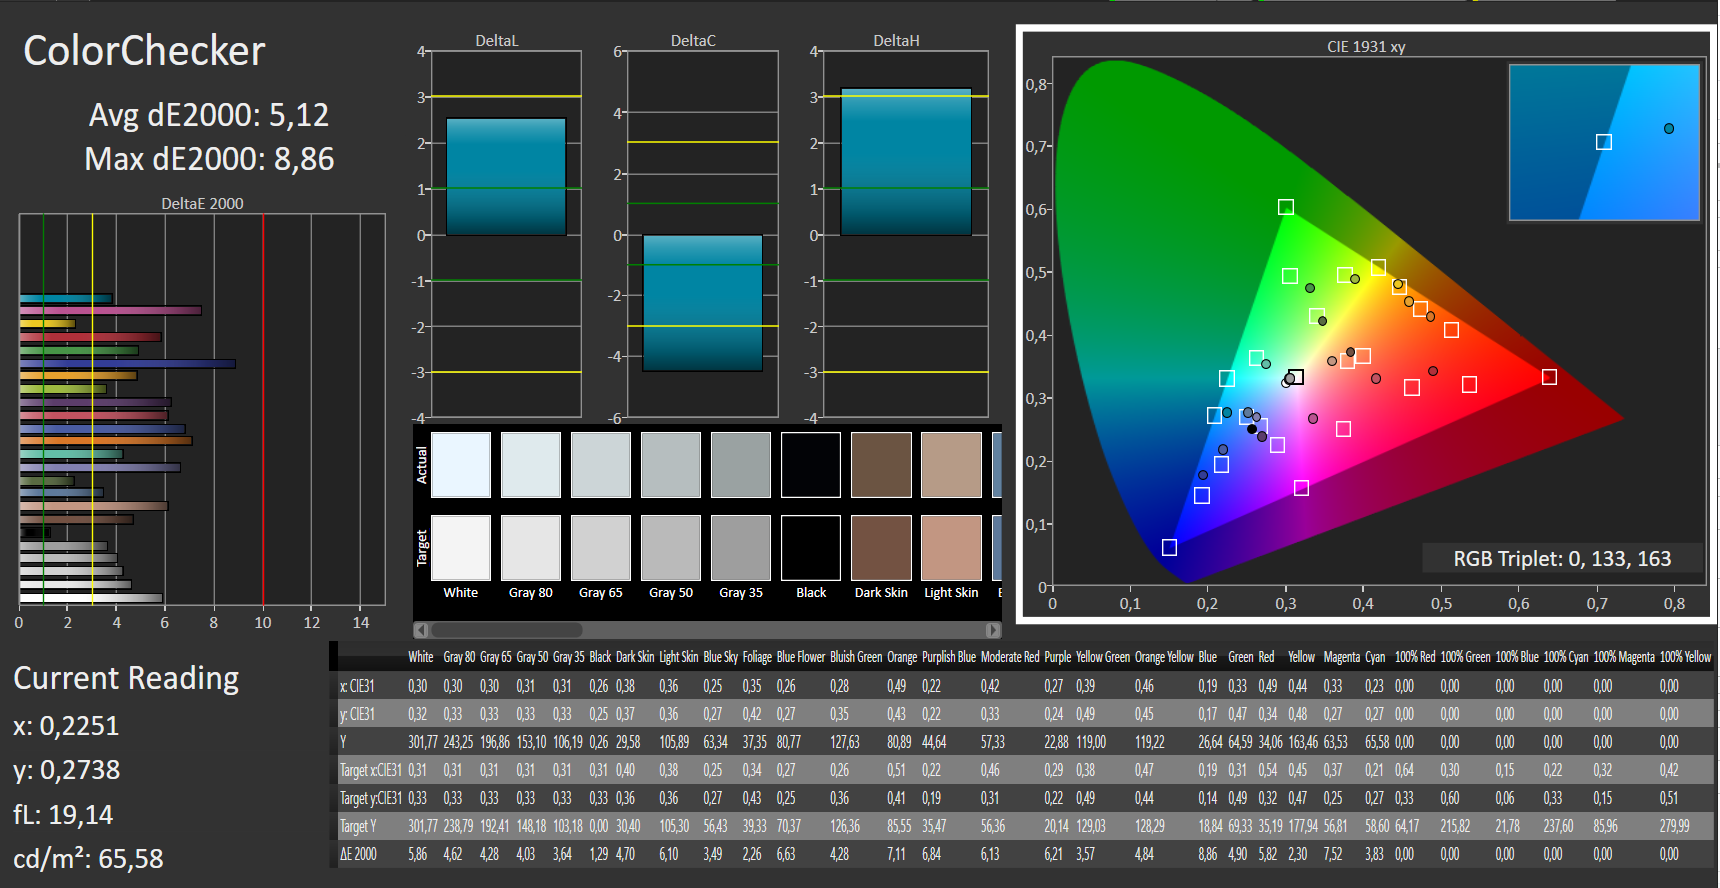
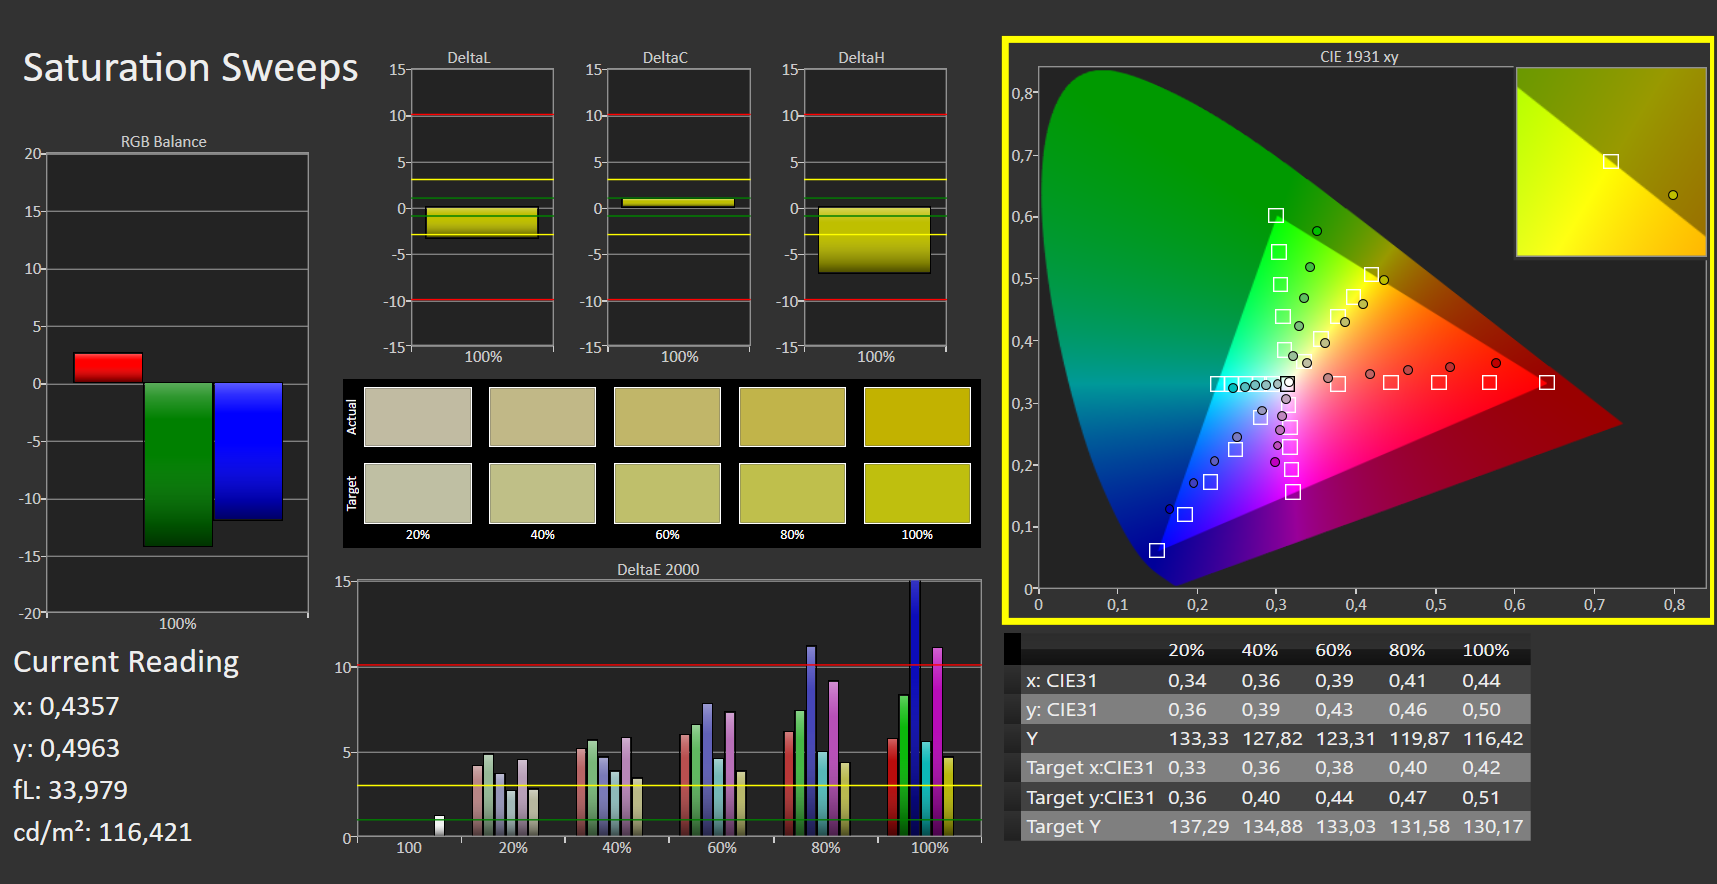
Ekran - 120 Hz IPS
Lejyondaki 15,6 inç panelin doğal çözünürlüğü 1920x1080 piksel. İyi bir kontrast oranına (1158: 1) sahip olsa da, maksimum parlaklığı 277.3 cd / m²'de çok düşük. Genellikle 300 cd / m² ve 1000: 1 üzerindeki değerleri iyi olarak kabul ederiz. Tepki oranı 120 Hz'lik bir panel için uygundur. Bu ekranda PWM görmekten memnuniyet duyduk.


| |||||||||||||||||||||||||
Aydınlatma: 77 %
Batarya modunda parlaklık: 299 cd/m²
Kontrast: 1158:1 (Siyah: 0.26 cd/m²)
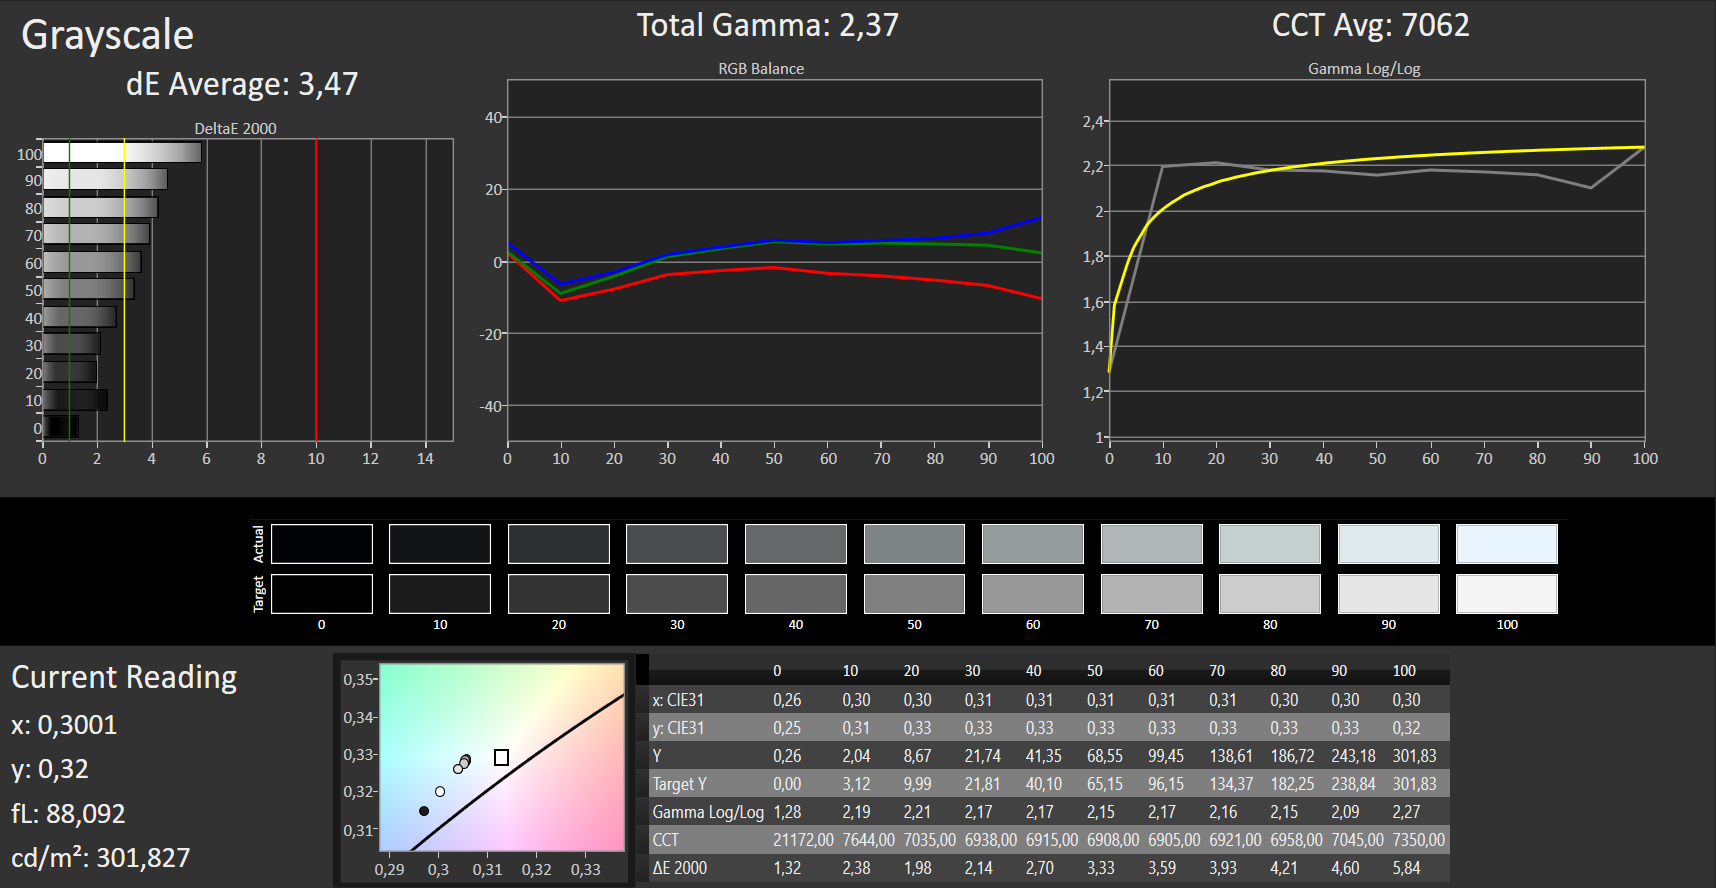
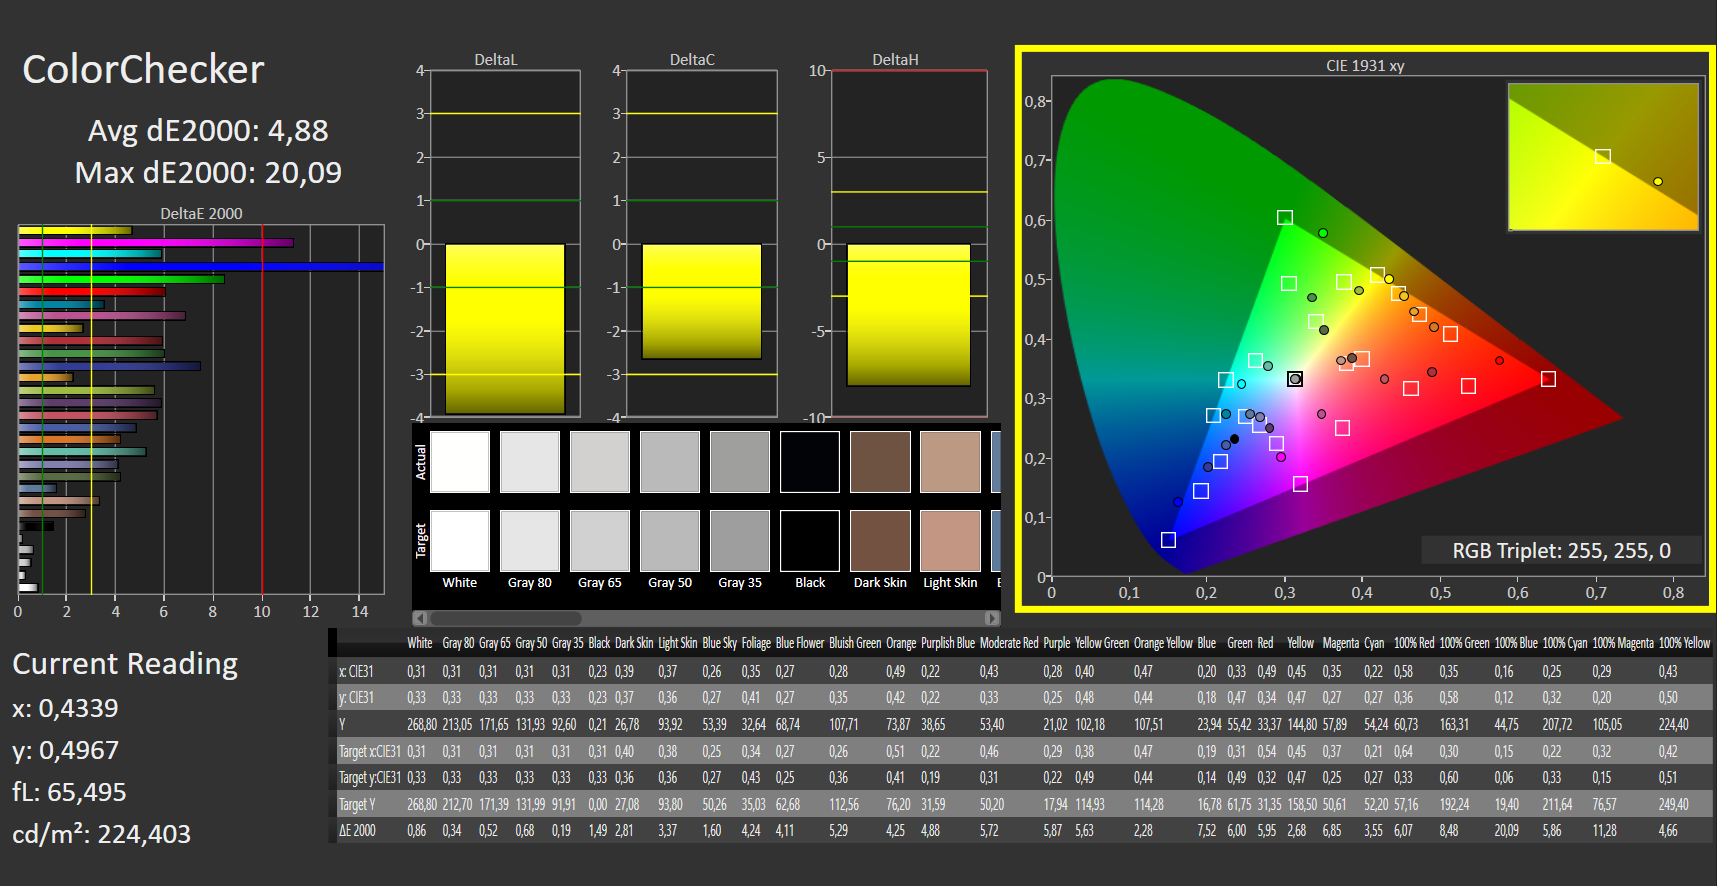
ΔE ColorChecker Calman: 5.12 | ∀{0.5-29.43 Ø4.72}
calibrated: 4.88
ΔE Greyscale Calman: 3.47 | ∀{0.09-98 Ø4.97}
57% sRGB (Argyll 1.6.3 3D)
37% AdobeRGB 1998 (Argyll 1.6.3 3D)
40.09% AdobeRGB 1998 (Argyll 3D)
57.8% sRGB (Argyll 3D)
38.8% Display P3 (Argyll 3D)
Gamma: 2.37
CCT: 7062 K
| Lenovo Legion 5 15IMH05H BOE CQ NV156FHM-NX1, IPS, 1920x1080, 15.6" | Asus TUF Gaming A15 FA506IV-HN172 LM156LF-2F01, IPS, 1920x1080, 15.6" | Dell G5 15 SE 5505 P89F BOE NV156FH, WVA, 1920x1080, 15.6" | MSI Alpha 15 A3DDK-034 AU Optronics B156HAN08.0 (AUO80ED), IPS, 1920x1080, 15.6" | Lenovo Legion Y540-15IRH BOE NV156FHM-N4G (BOE084D), IPS, 1920x1080, 15.6" | |
|---|---|---|---|---|---|
| Display | 0% | 59% | 65% | 63% | |
| Display P3 Coverage (%) | 38.8 | 38.92 0% | 63 62% | 66.4 71% | 64.5 66% |
| sRGB Coverage (%) | 57.8 | 58.5 1% | 90.1 56% | 91 57% | 91.6 58% |
| AdobeRGB 1998 Coverage (%) | 40.09 | 40.22 0% | 64.1 60% | 66.6 66% | 65.9 64% |
| Response Times | -36% | 29% | 56% | 54% | |
| Response Time Grey 50% / Grey 80% * (ms) | 26 ? | 34 ? -31% | 20.4 ? 22% | 7 ? 73% | 8.8 ? 66% |
| Response Time Black / White * (ms) | 17 ? | 24 ? -41% | 10.8 ? 36% | 10.4 ? 39% | 10 ? 41% |
| PWM Frequency (Hz) | 198.4 ? | ||||
| Screen | -4% | 18% | 14% | 20% | |
| Brightness middle (cd/m²) | 301 | 280 -7% | 292 -3% | 310 3% | 284 -6% |
| Brightness (cd/m²) | 277 | 254 -8% | 290 5% | 310 12% | 277 0% |
| Brightness Distribution (%) | 77 | 88 14% | 77 0% | 86 12% | 87 13% |
| Black Level * (cd/m²) | 0.26 | 0.15 42% | 0.27 -4% | 0.29 -12% | 0.3 -15% |
| Contrast (:1) | 1158 | 1867 61% | 1081 -7% | 1069 -8% | 947 -18% |
| Colorchecker dE 2000 * | 5.12 | 5.89 -15% | 3.99 22% | 4.78 7% | 3.53 31% |
| Colorchecker dE 2000 max. * | 8.86 | 19 -114% | 6.11 31% | 8.1 9% | 6.11 31% |
| Colorchecker dE 2000 calibrated * | 4.88 | 4.79 2% | 3.02 38% | 2.36 52% | 1.81 63% |
| Greyscale dE 2000 * | 3.47 | 4.08 -18% | 3.3 5% | 4.78 -38% | 3.56 -3% |
| Gamma | 2.37 93% | 2.33 94% | 2.25 98% | 2.43 91% | 2.47 89% |
| CCT | 7062 92% | 7303 89% | 7047 92% | 7739 84% | 7257 90% |
| Color Space (Percent of AdobeRGB 1998) (%) | 37 | 37 0% | 58.1 57% | 59 59% | 59 59% |
| Color Space (Percent of sRGB) (%) | 57 | 58 2% | 89.7 57% | 91 60% | 91 60% |
| Toplam Ortalama (Program / Ayarlar) | -13% /
-7% | 35% /
27% | 45% /
29% | 46% /
32% |
* ... daha küçük daha iyidir
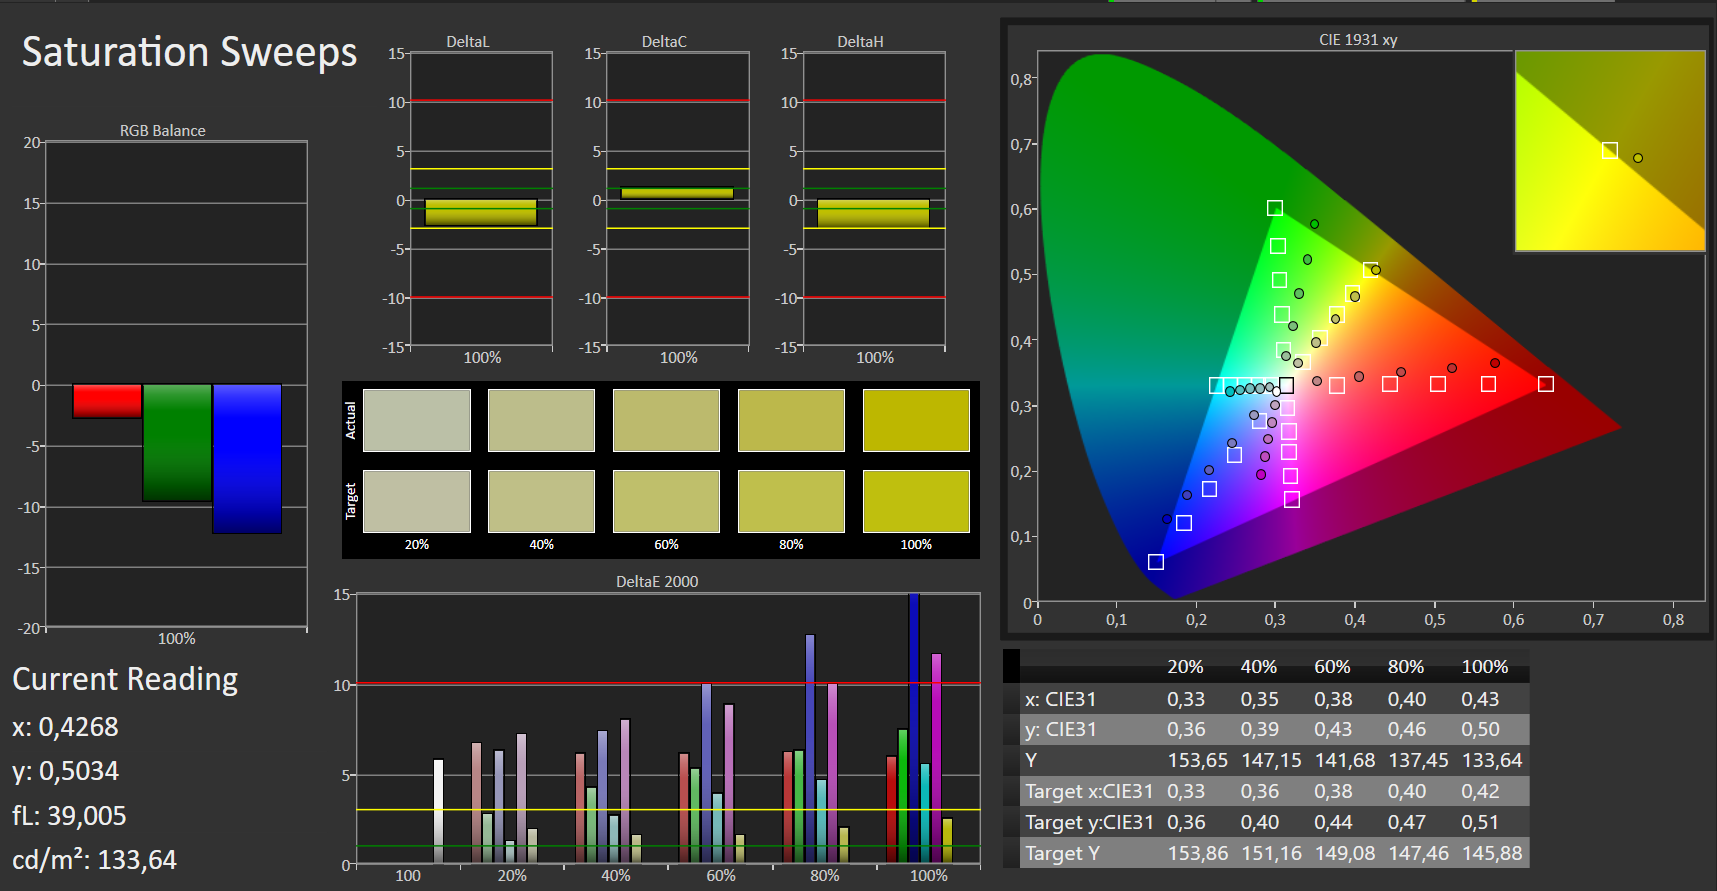
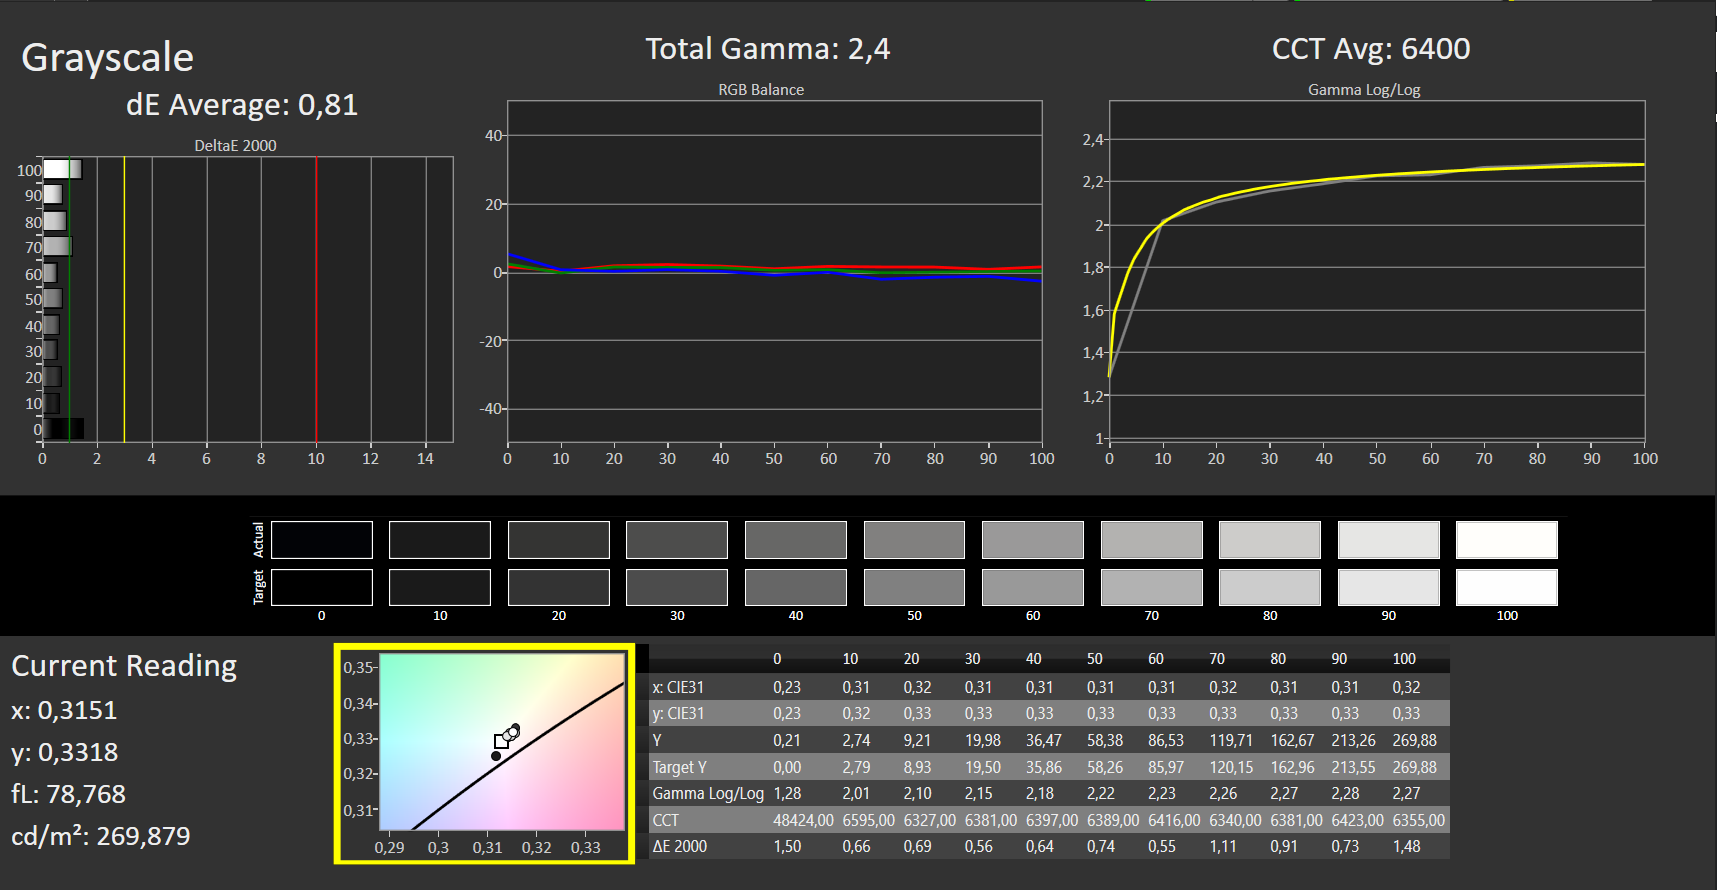
Ekranın iyi renkleri var, ancak 5 civarında DeltaE 2000 sapması ideal aralıkta değil (DeltaE 3'ün altında). Ekranda mavi renk almıyor. Kalibrasyonumuz renkli ekranı biraz iyileştirir, ancak AdobeRGB ve sRGB renk uzayları tamamen kapsanmaz (sırasıyla yüzde 37 ve 57).
Yanıt Sürelerini Görüntüle
| ↔ Tepki Süresi Siyahtan Beyaza | ||
|---|---|---|
| 17 ms ... yükseliş ↗ ve sonbahar↘ birleşimi | ↗ 8 ms yükseliş | 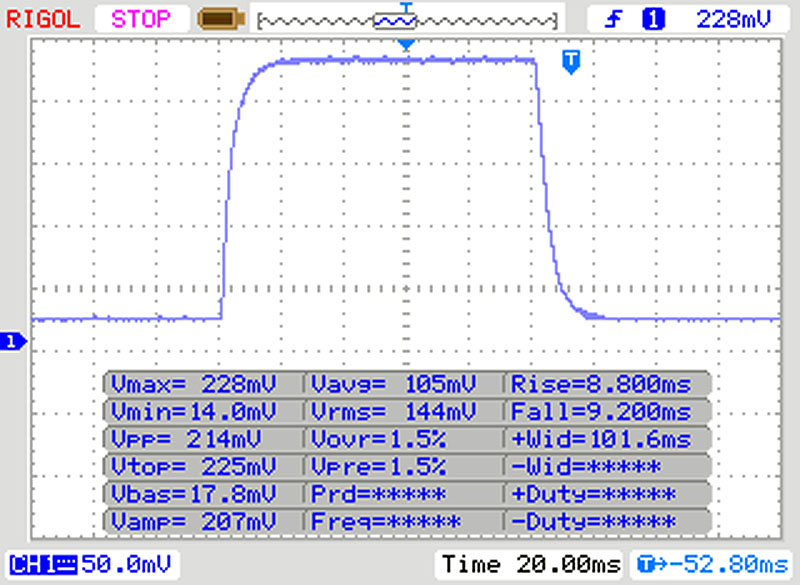 |
| ↘ 9 ms sonbahar | ||
| Ekran, testlerimizde iyi yanıt oranları gösteriyor ancak rekabetçi oyuncular için çok yavaş olabilir. Karşılaştırıldığında, test edilen tüm cihazlar 0.1 (minimum) ile 240 (maksimum) ms arasında değişir. » Tüm cihazların 39 %'si daha iyi. Bu, ölçülen yanıt süresinin test edilen tüm cihazların ortalamasından (19.8 ms) daha iyi olduğu anlamına gelir. | ||
| ↔ Tepki Süresi %50 Griden %80 Griye | ||
| 26 ms ... yükseliş ↗ ve sonbahar↘ birleşimi | ↗ 12 ms yükseliş | 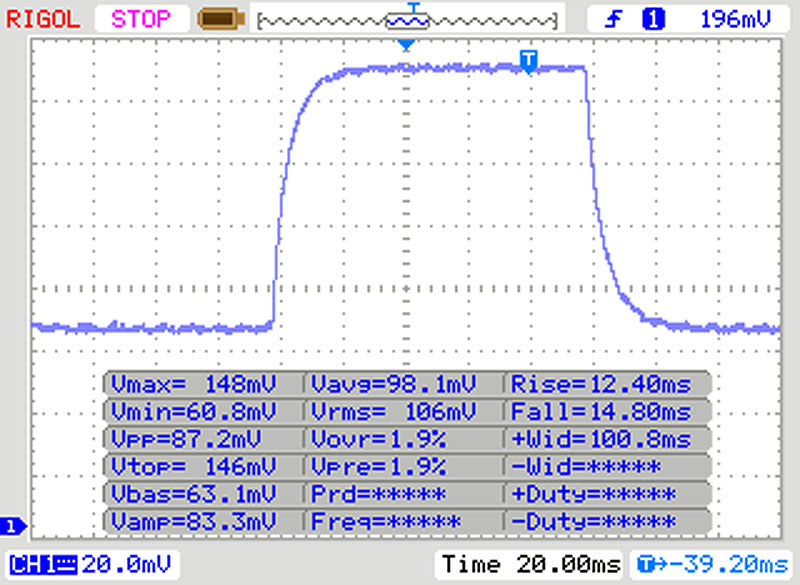 |
| ↘ 14 ms sonbahar | ||
| Ekran, testlerimizde nispeten yavaş yanıt oranları gösteriyor ve oyuncular için çok yavaş olabilir. Karşılaştırıldığında, test edilen tüm cihazlar 0.165 (minimum) ile 636 (maksimum) ms arasında değişir. » Tüm cihazların 36 %'si daha iyi. Bu, ölçülen yanıt süresinin test edilen tüm cihazların ortalamasından (31 ms) daha iyi olduğu anlamına gelir. | ||
Ekran Titremesi / PWM (Darbe Genişliği Modülasyonu)
| Ekran titriyor / PWM algılanmadı | 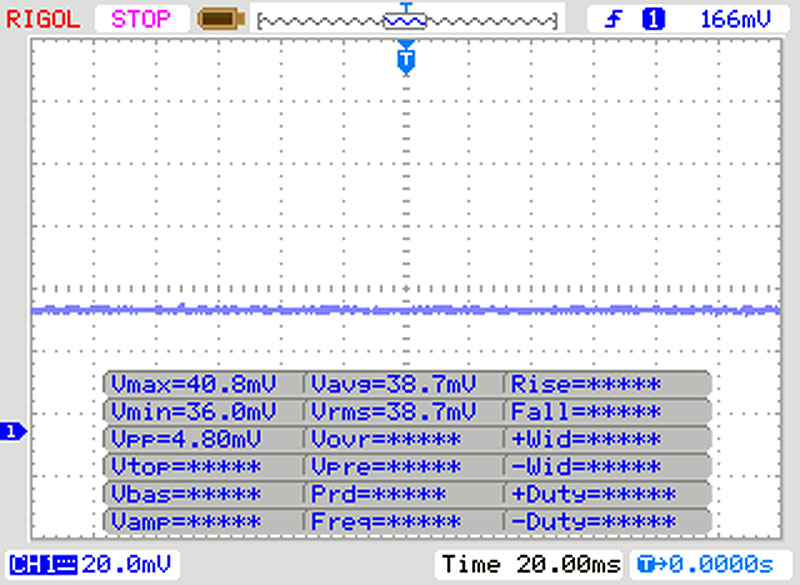 | ||
Karşılaştırıldığında: Test edilen tüm cihazların %52 %'si ekranı karartmak için PWM kullanmıyor. PWM tespit edilirse, ortalama 7775 (minimum: 5 - maksimum: 343500) Hz ölçüldü. | |||
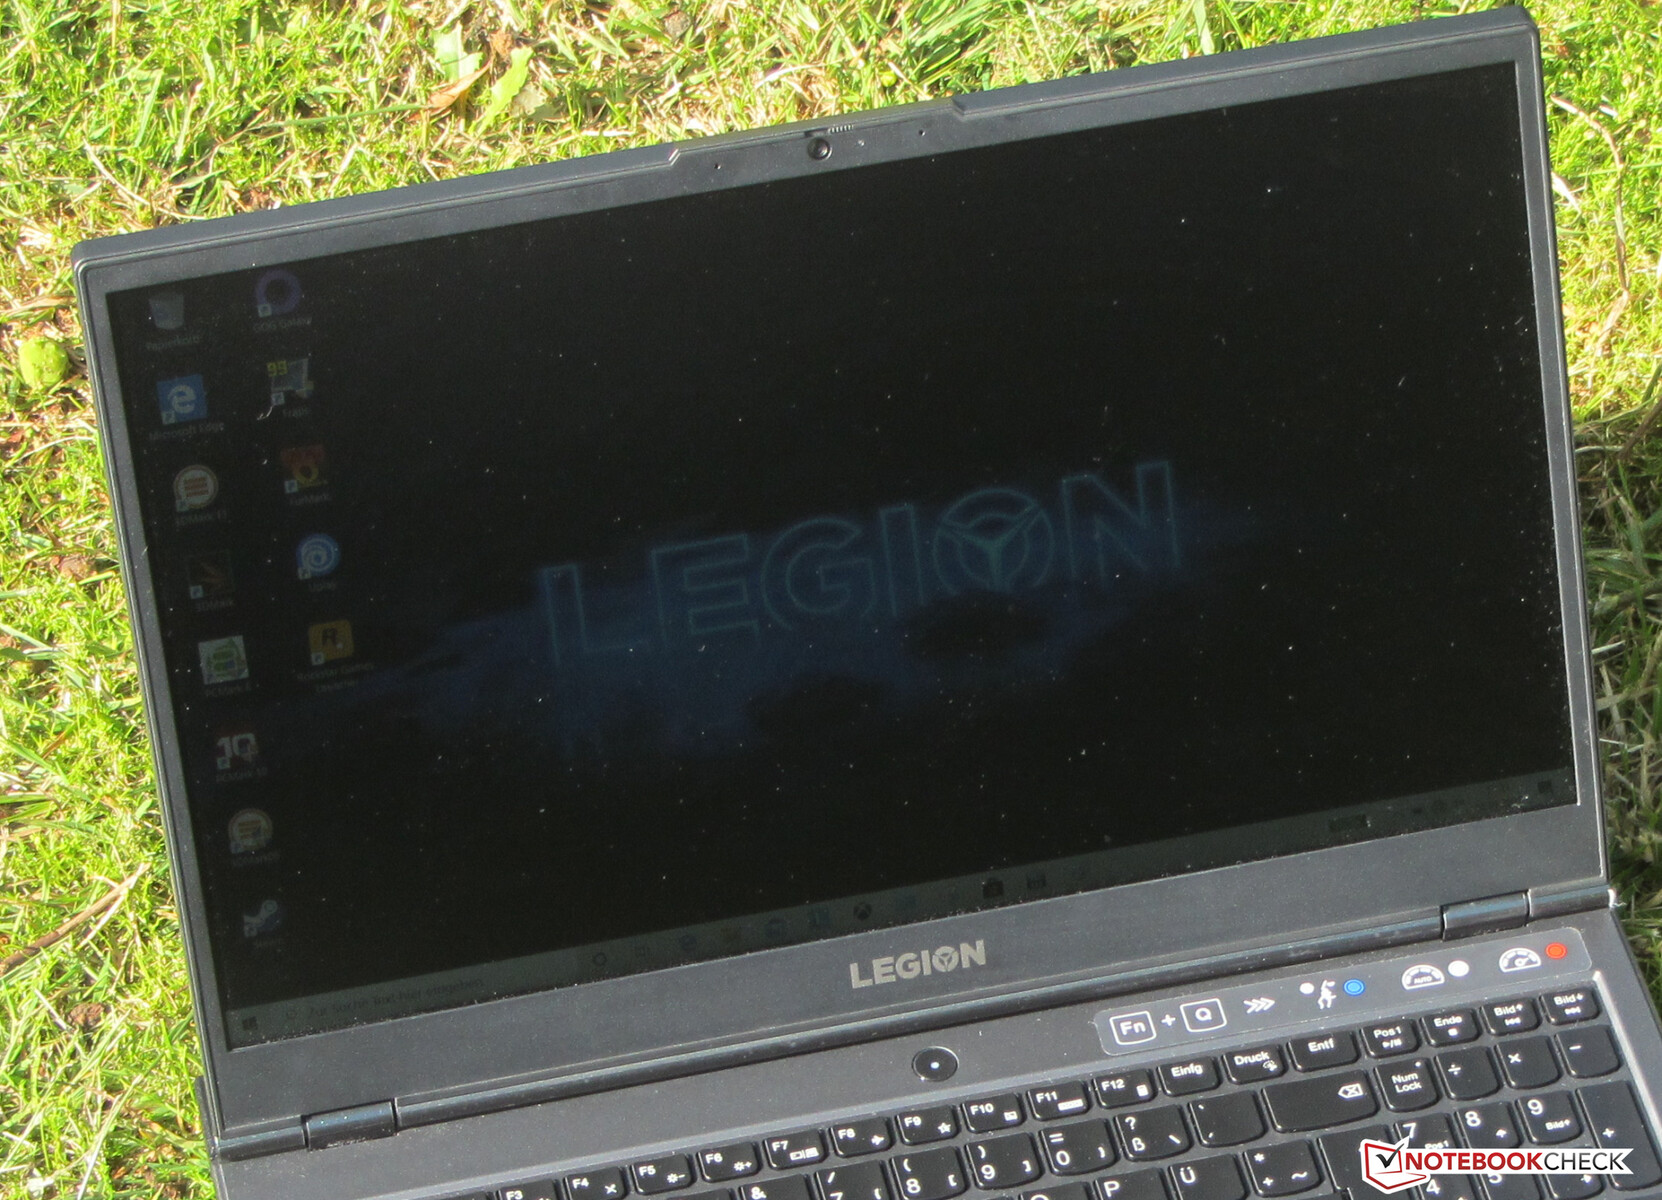
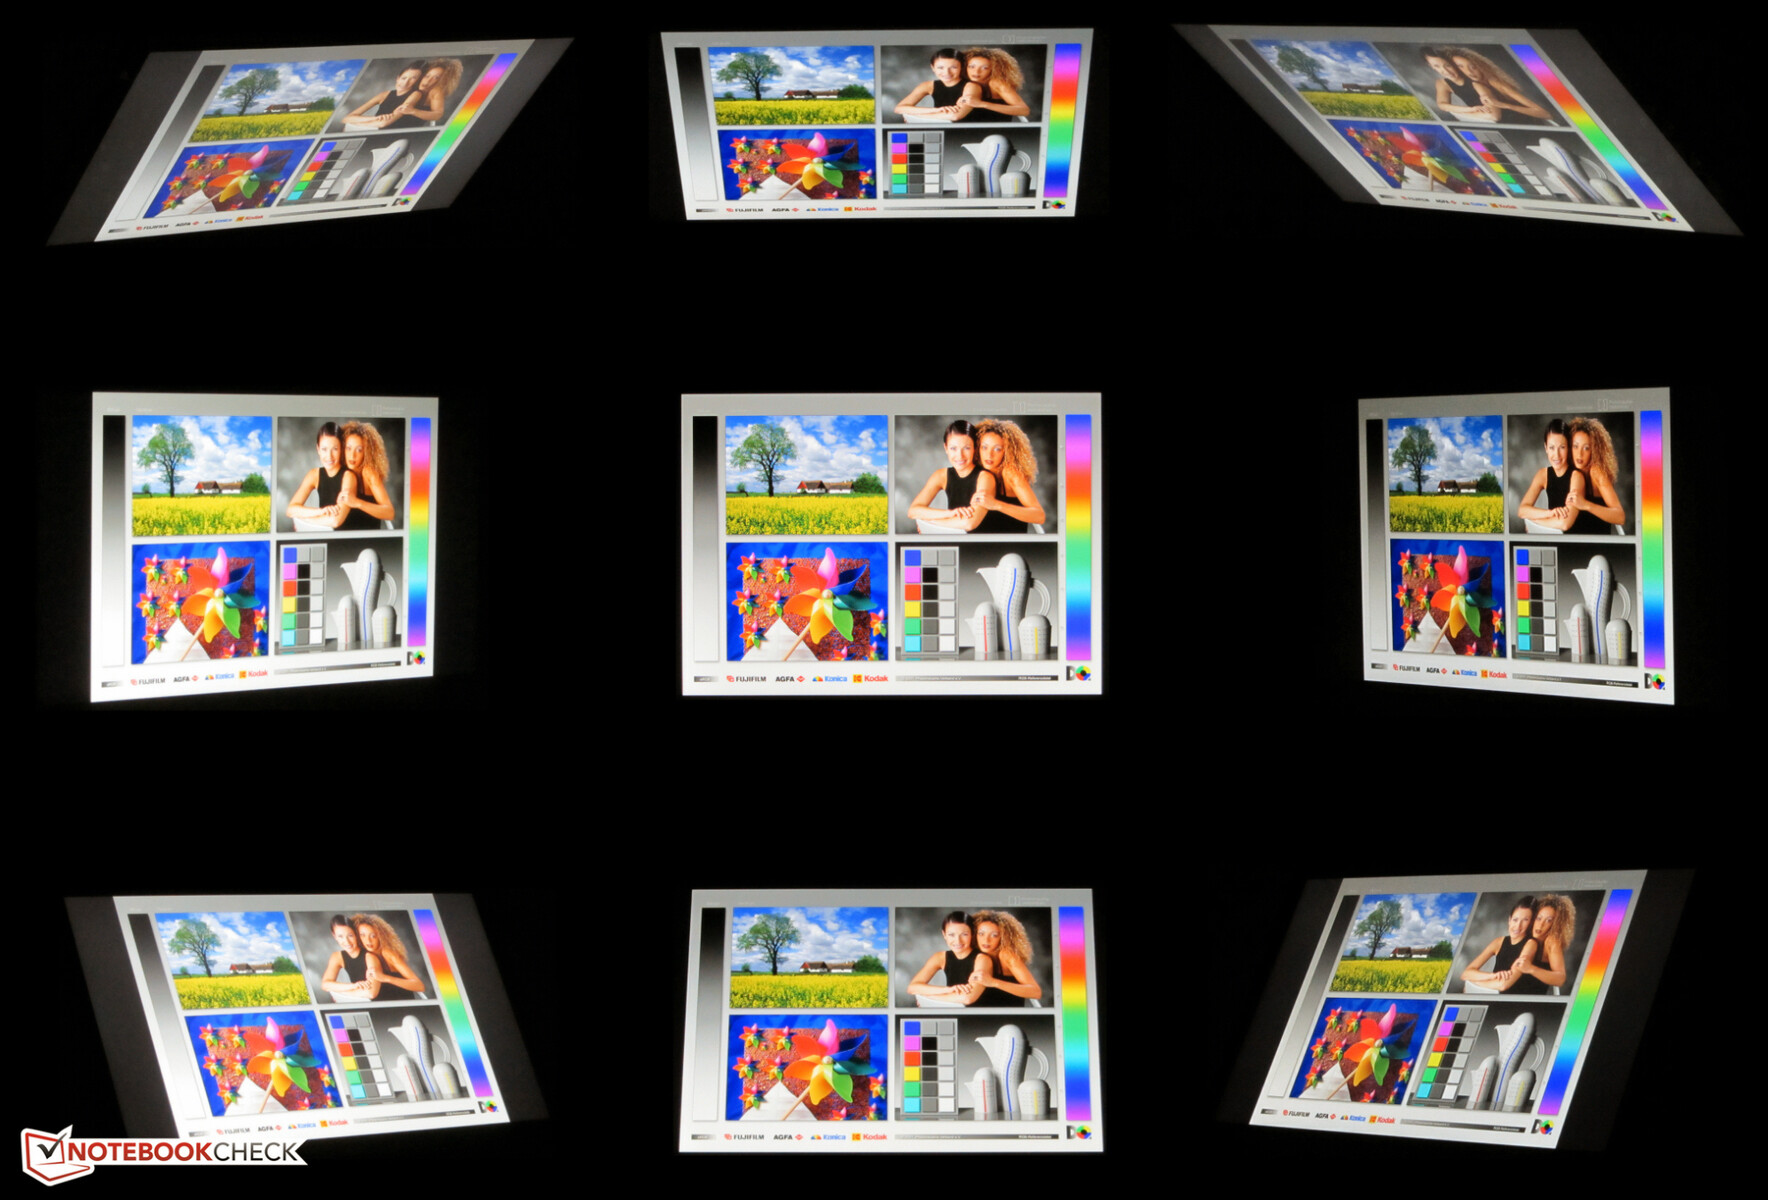
Dizüstü bilgisayar, sabit görüş açılarına sahip bir IPS panel ile donatılmıştır. Bu, ekranın her açıdan okunabileceği anlamına gelir. Cihazı dışarıda kullanmak sadece güneş çok parlak parlamıyorsa mümkündür.
Performans - Legion 5 donanımından tam olarak yararlanıyor
Lenovo, diğer tüm uygulama alanlarında iyi bir iş çıkarırken, mevcut her oyunu sorunsuz bir şekilde görüntüleyebilen 15,6 inç oyun dizüstü bilgisayarı yarattı. Test birimimiz yaklaşık 1250 $ fiyatla satılmaktadır. Başka yapılandırmalar da mevcuttur.
Test Koşulları
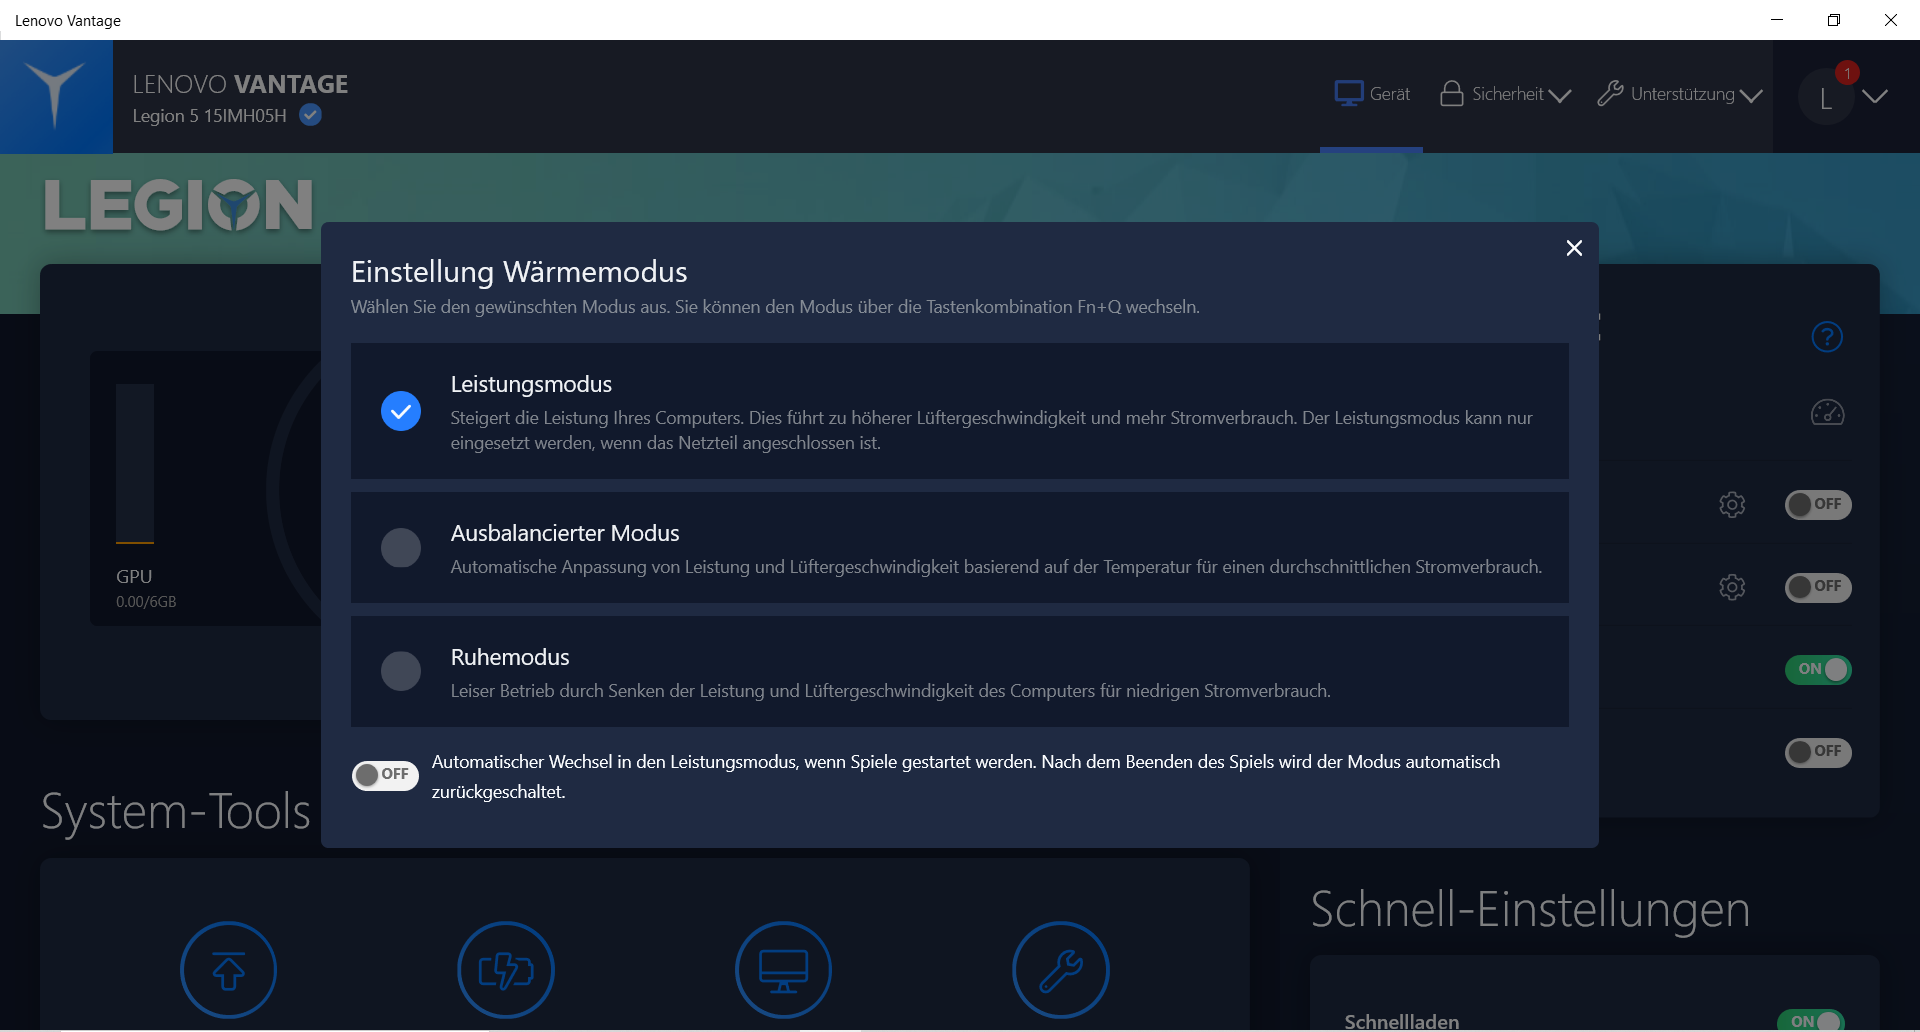
Önceden yüklenmiş Lenovo Vantage yazılımı, kullanıcıların bir sıcaklık modu ayarlamasına olanak tanır. Üç mod mevcuttur: performans modu, dengeli mod ve sakin mod. Tüm karşılaştırmaları performans modunda çalıştırdık.Bu ayarların performansı nasıl etkilediğine dair bir fikir edinmek için her üç modda da bazı karşılaştırmalar yaptık, bu durumda bu sonuçlardan açıkça bahsediyoruz.
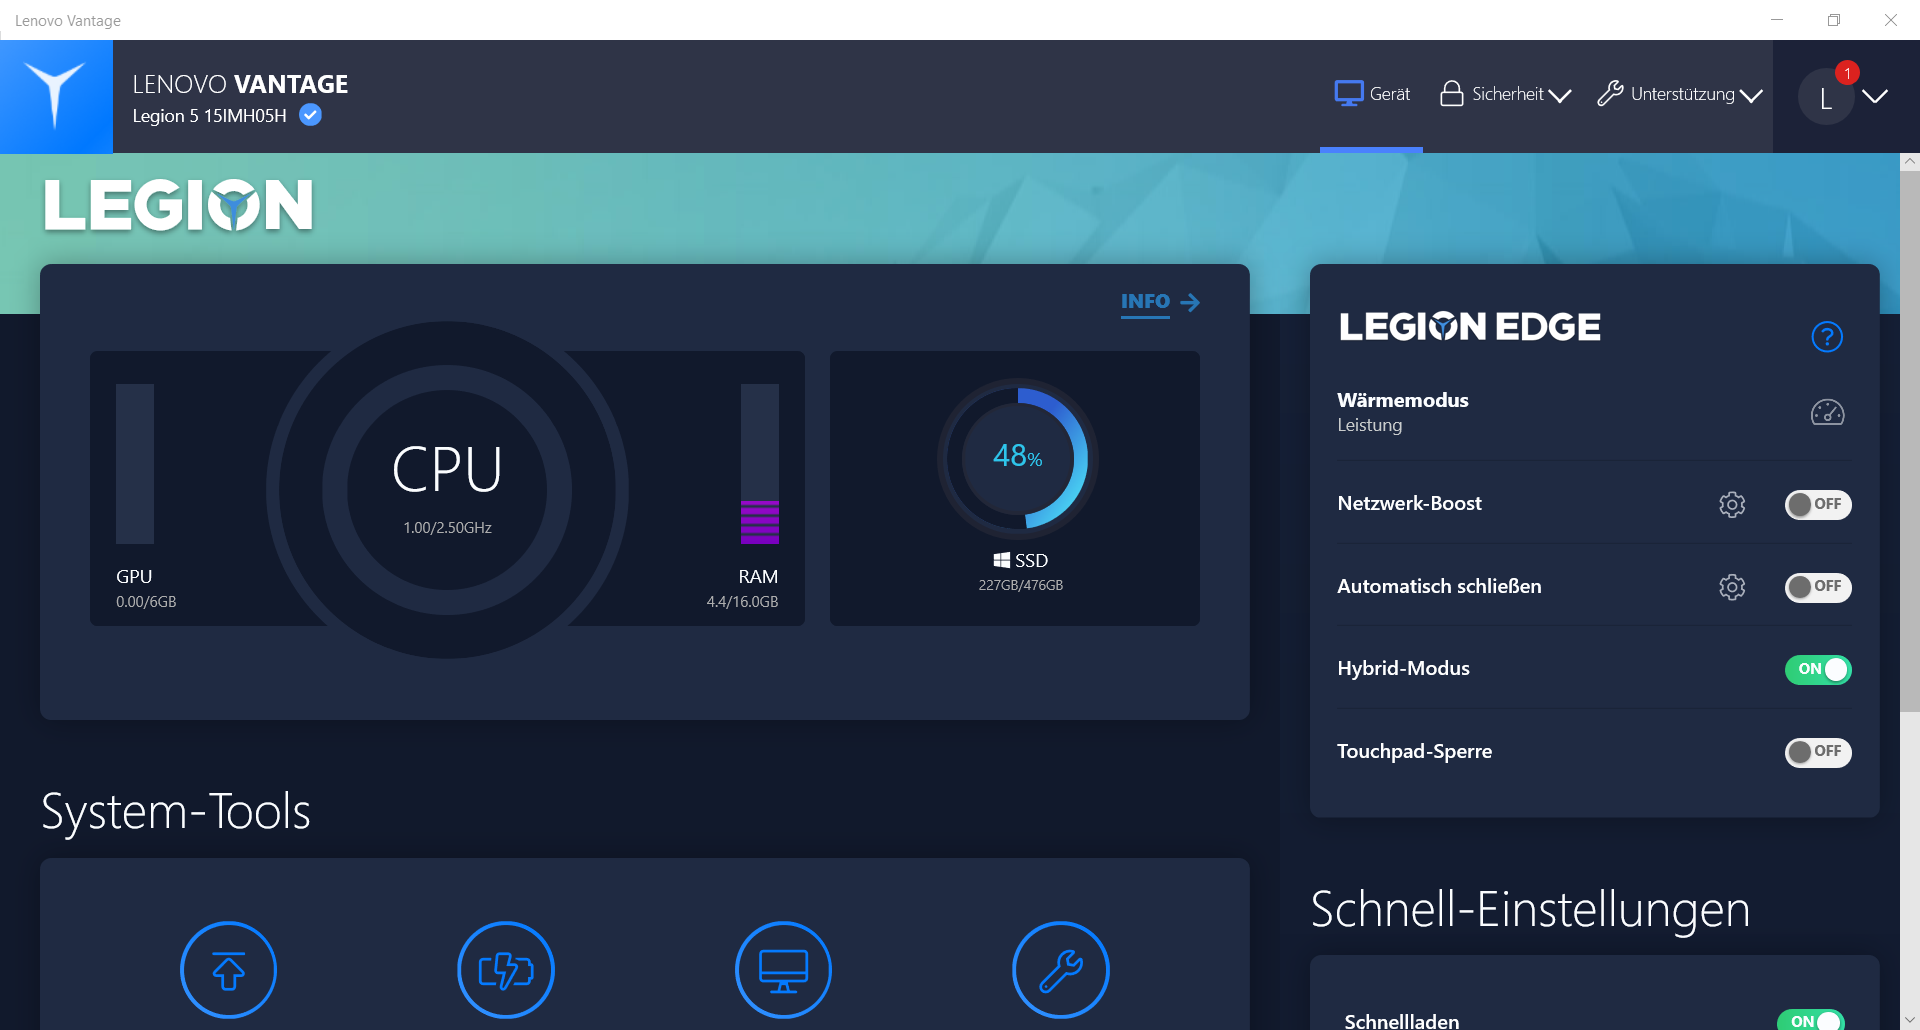
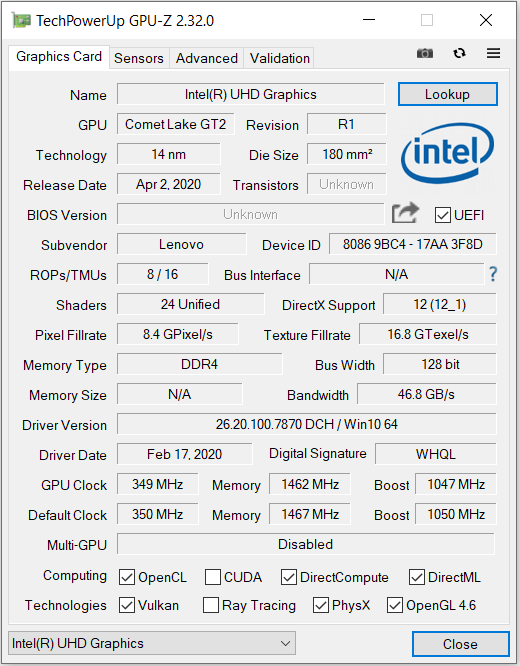
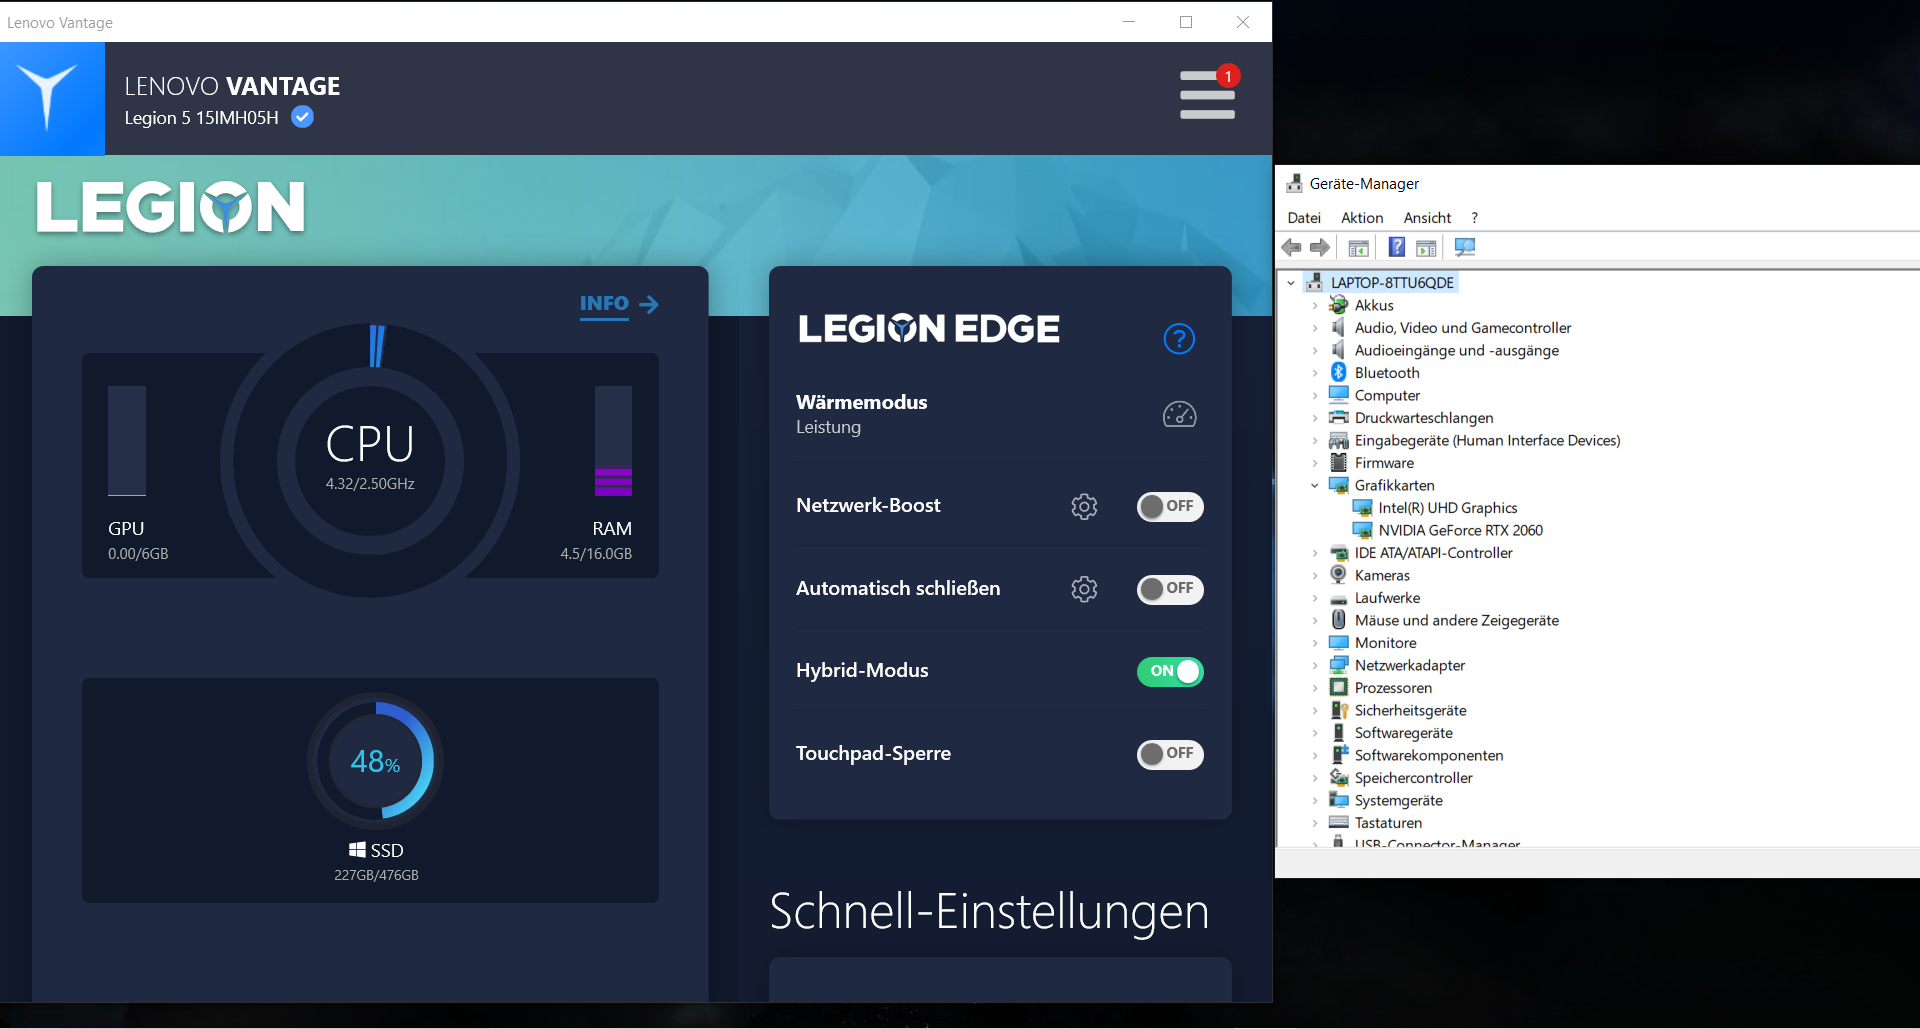
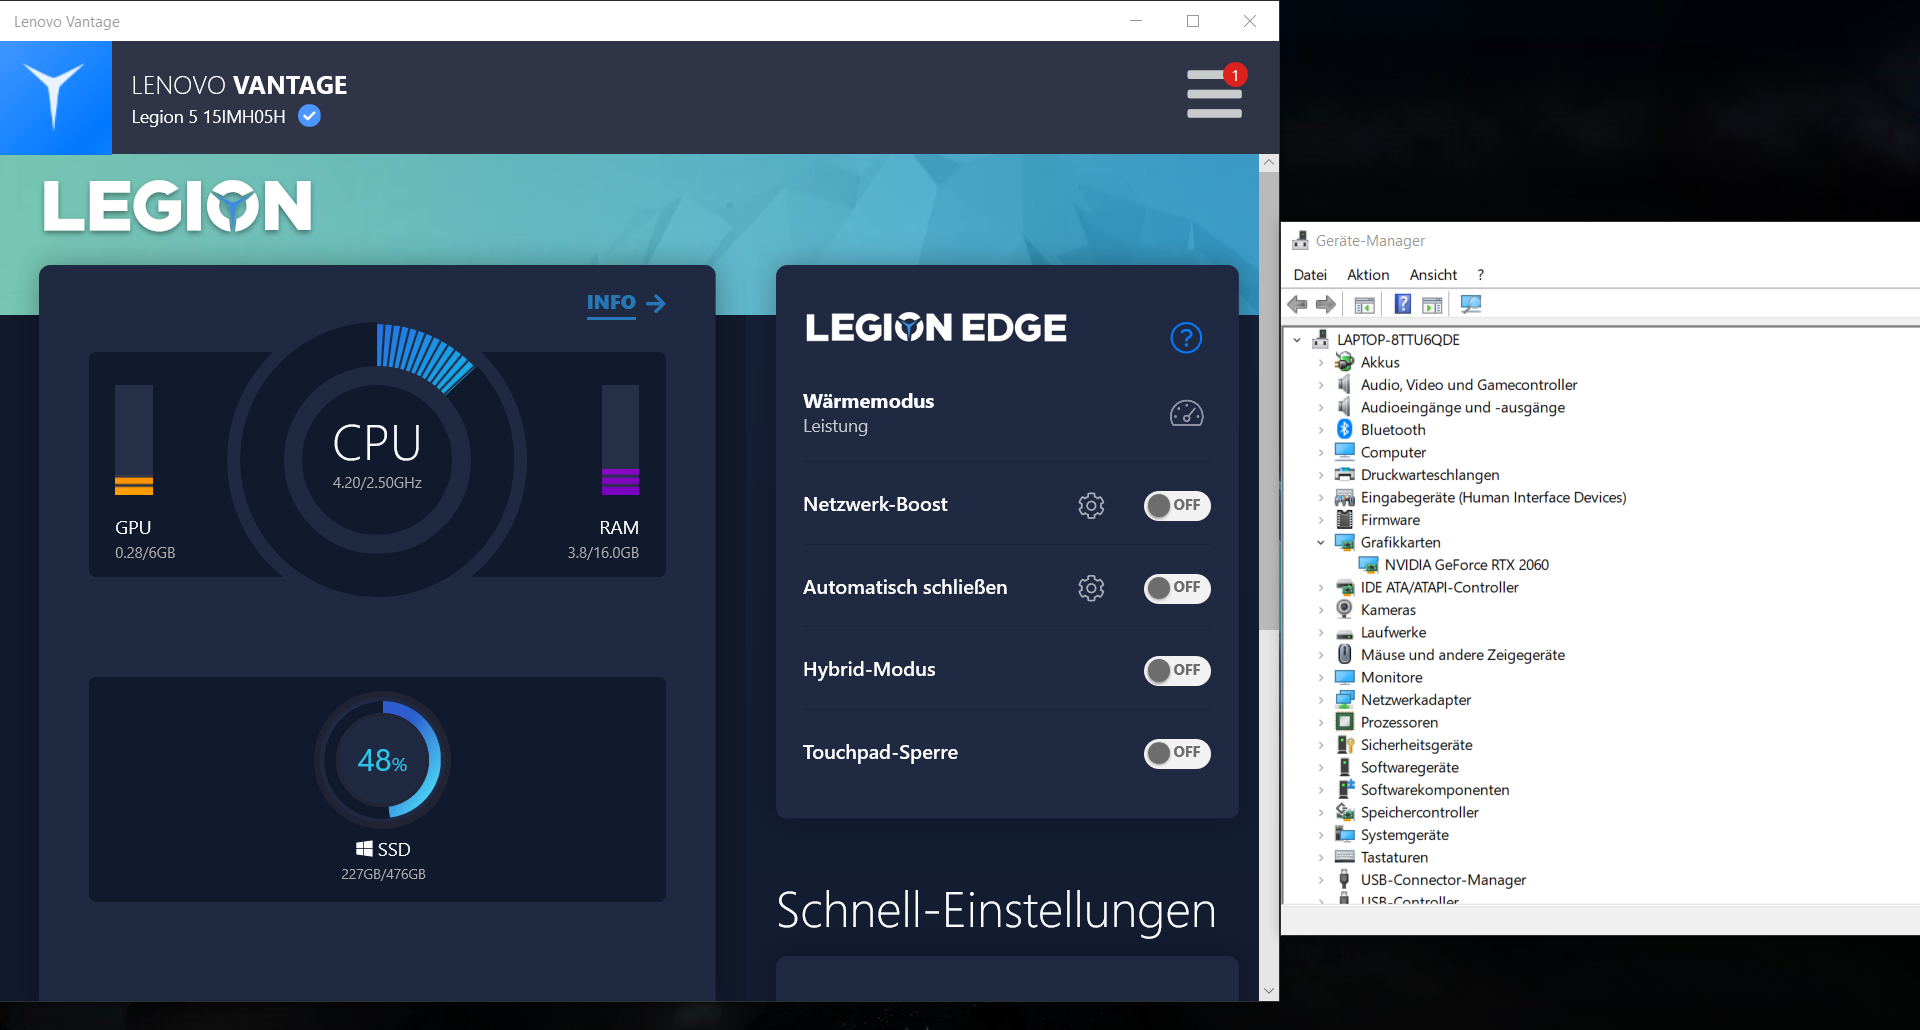
Kullanıcılar BIOS'ta veya Lenovo Vantage yazılımını (Hibrit mod) kullanarak tümleşik UHD Graphics 630'u açabilir ve kapatabilir. GPU fabrikada etkinleştirildikçe, testlerimizi iGPU (ve dolayısıyla grafik değiştirme fonksiyonu Optimus) etkinken yürüttük.
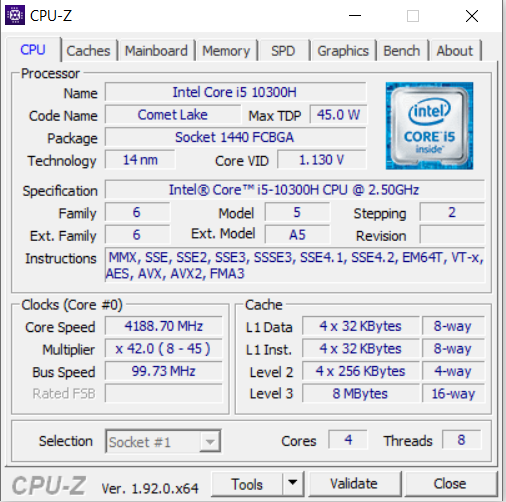
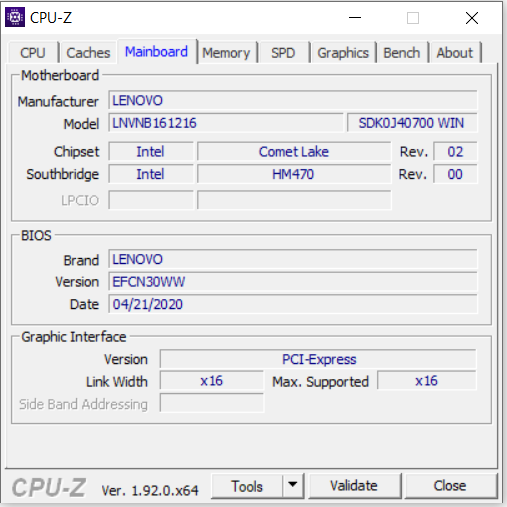
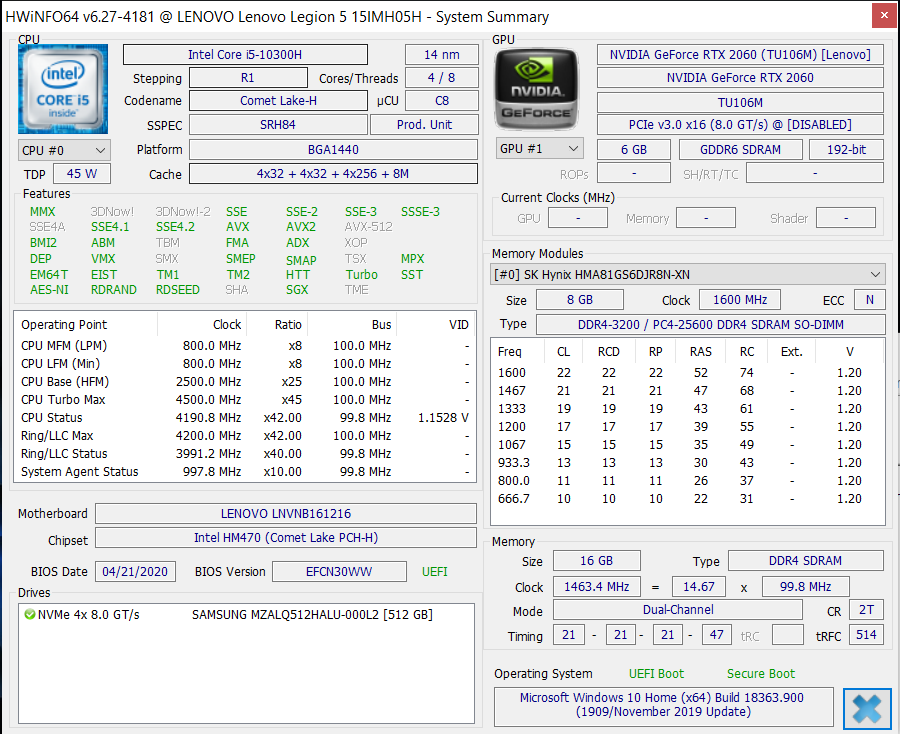
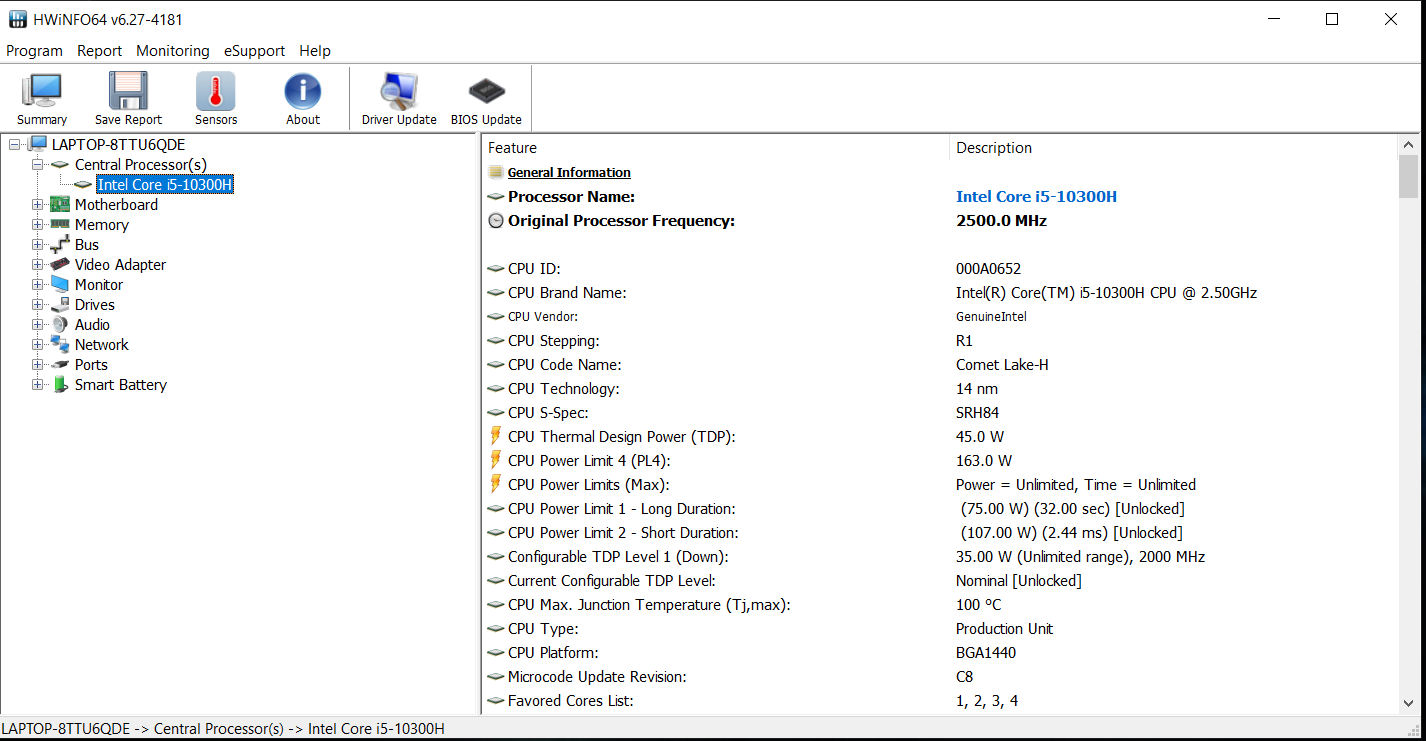
İşlemci
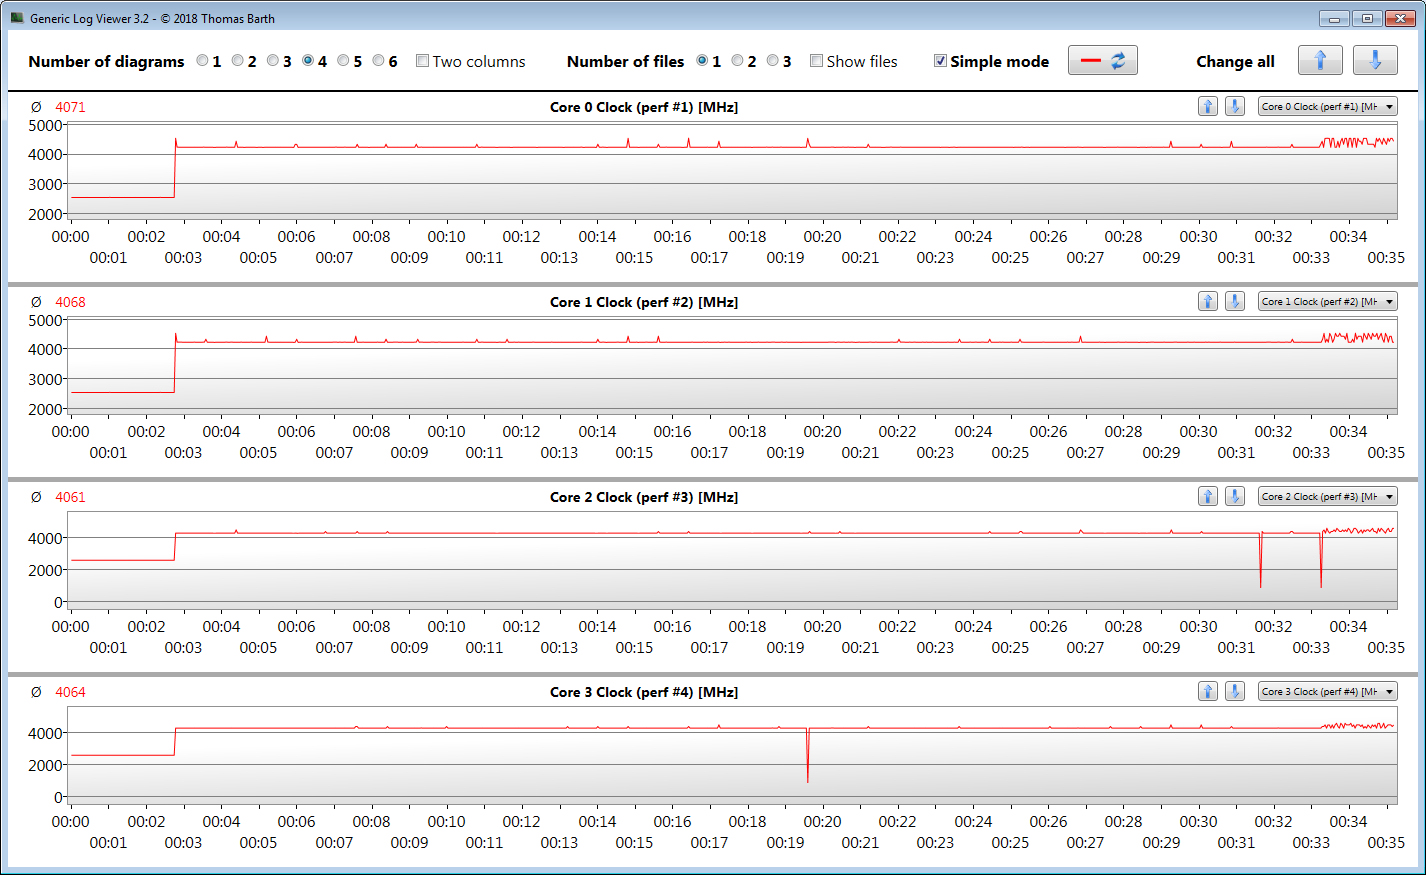
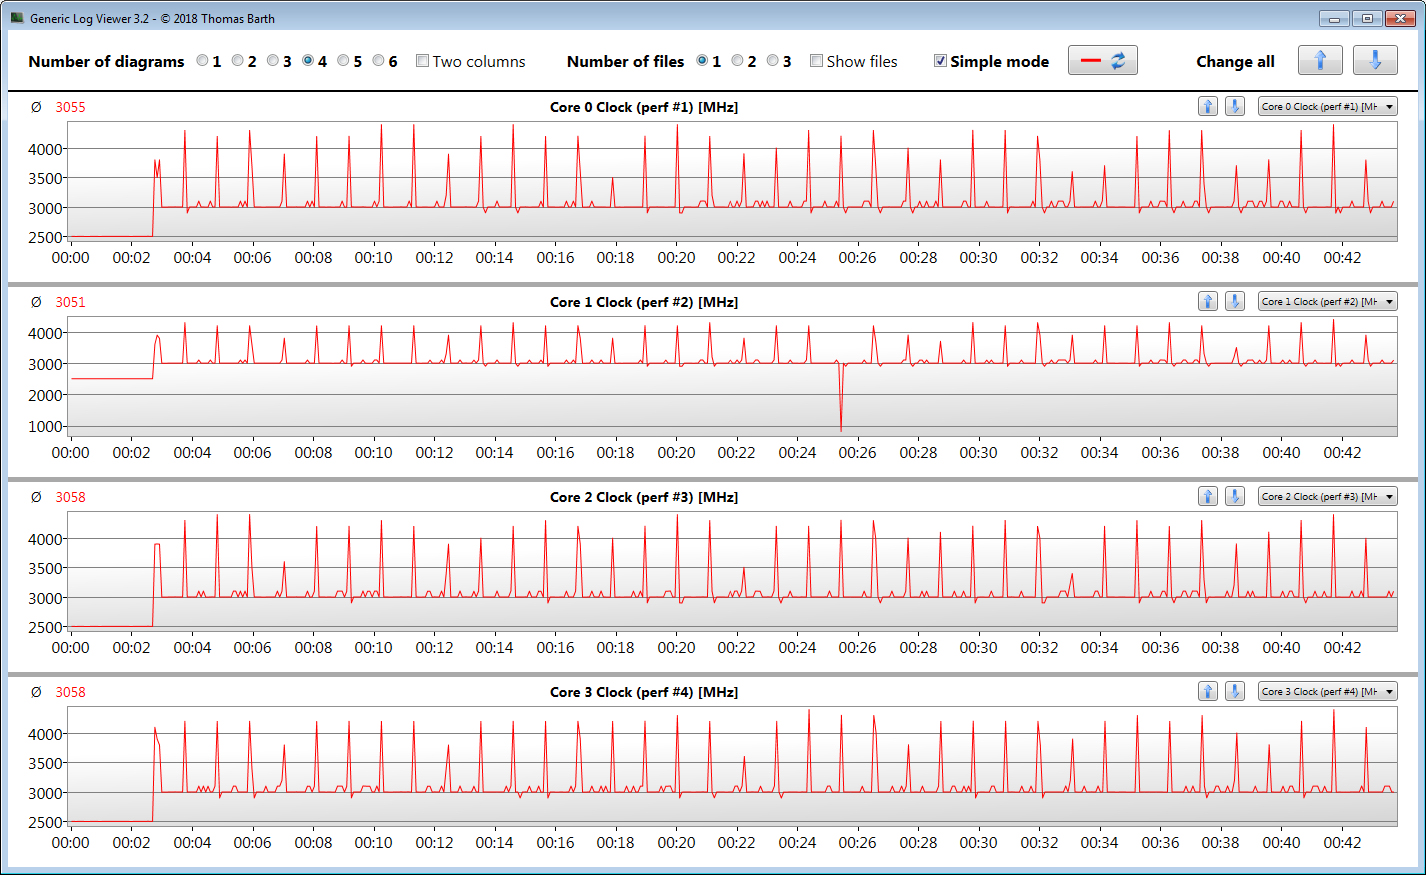
Lenovo, Legion'a dört çekirdekli Core-i5-10300H işlemci (Comet Lake) taktı. CPU 2,5 GHz taban hızında saatler. Saat hızı 4,2 GHz'e (dört çekirdek) ve 4,5 GHz'e (bir çekirdek) kadar yükseltilebilir. Hiper iş parçacığı (çekirdek başına iki iş parçacığı çalışıyor) desteklenir. Tek diş testleri 4.2 - 4.5 GHz (ana şebeke) ve 3.5 - 4.2 GHz (pil) ile yapılır.
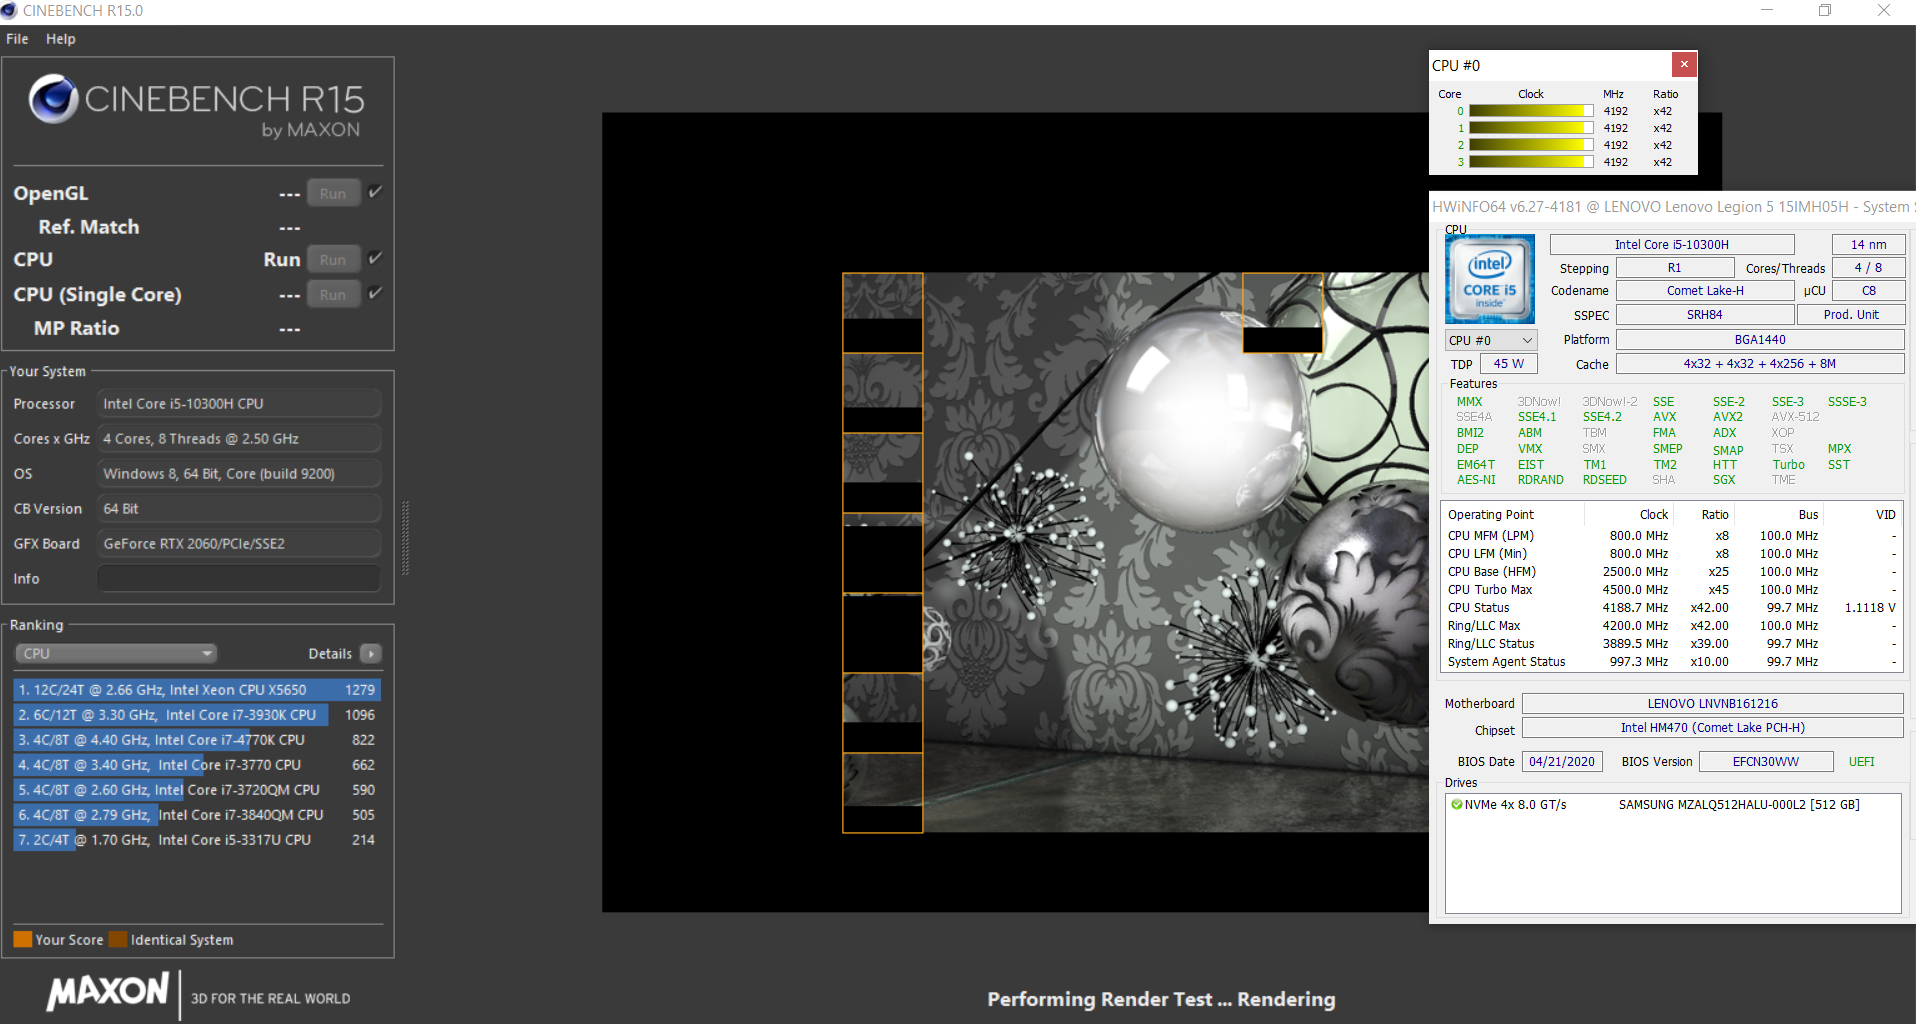
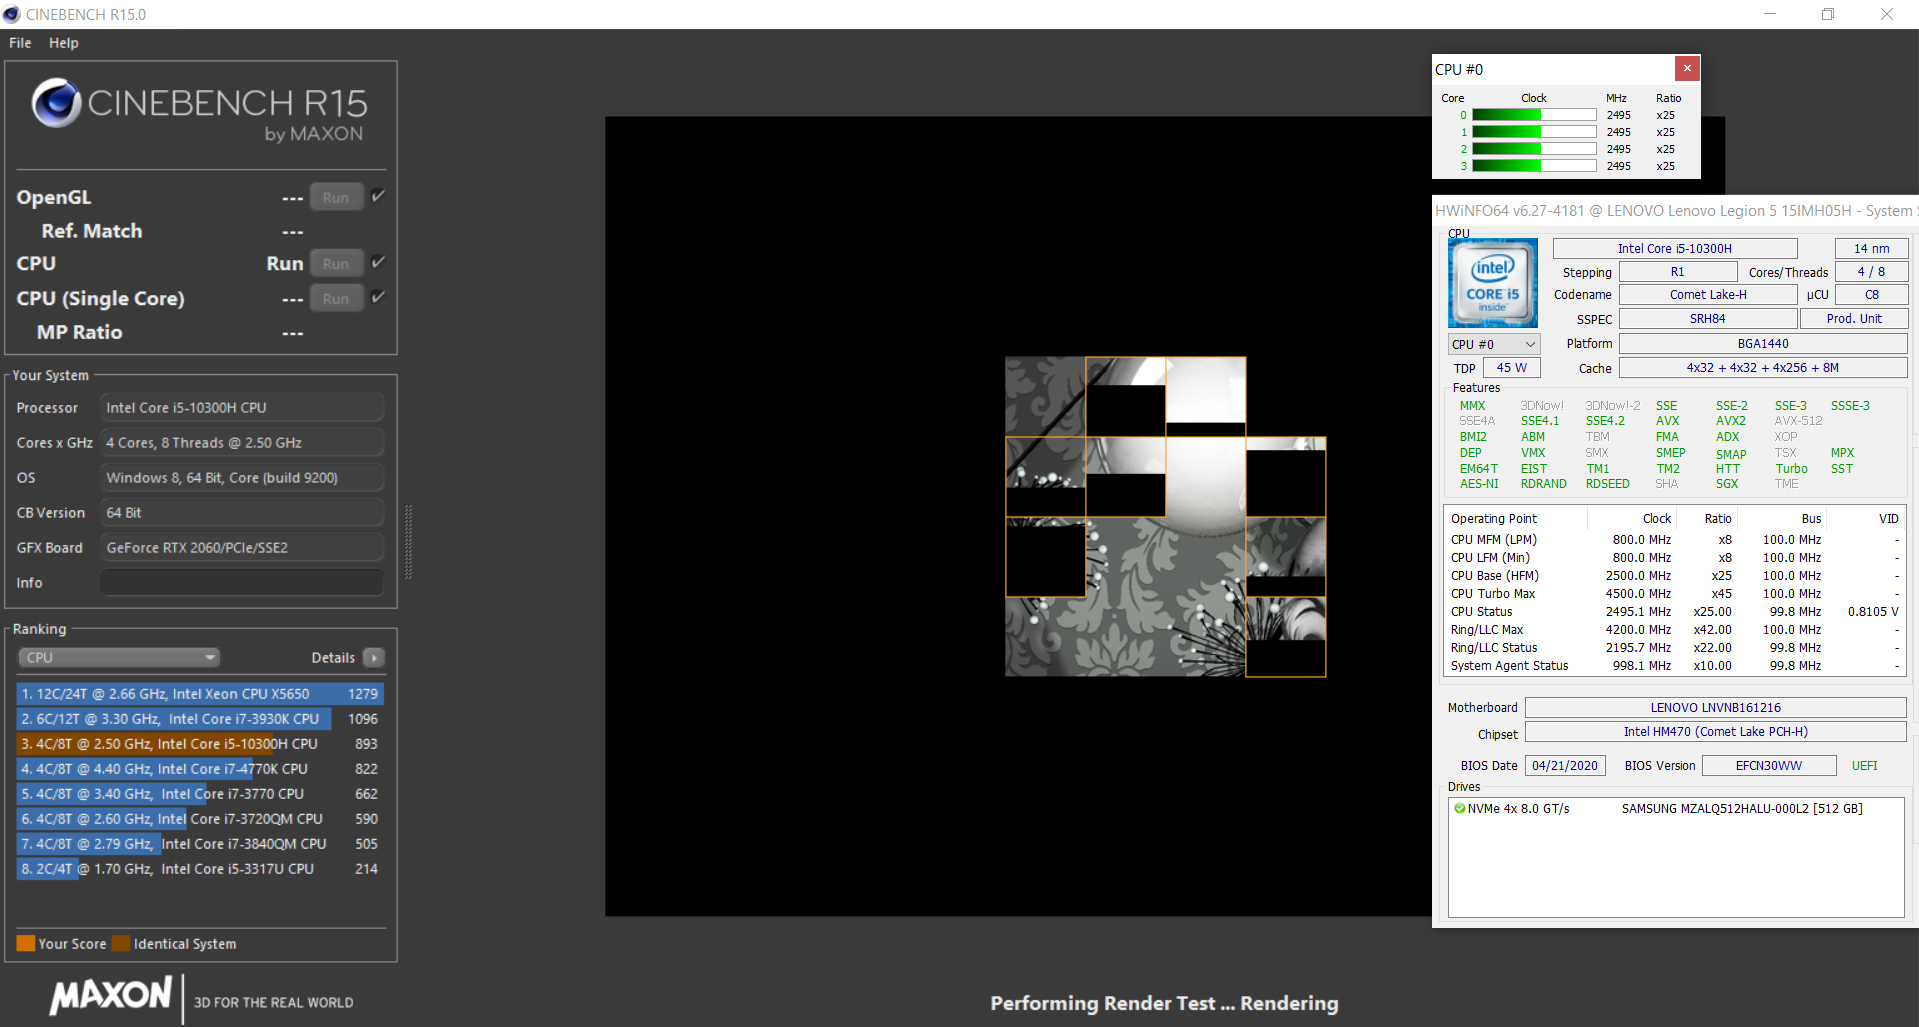
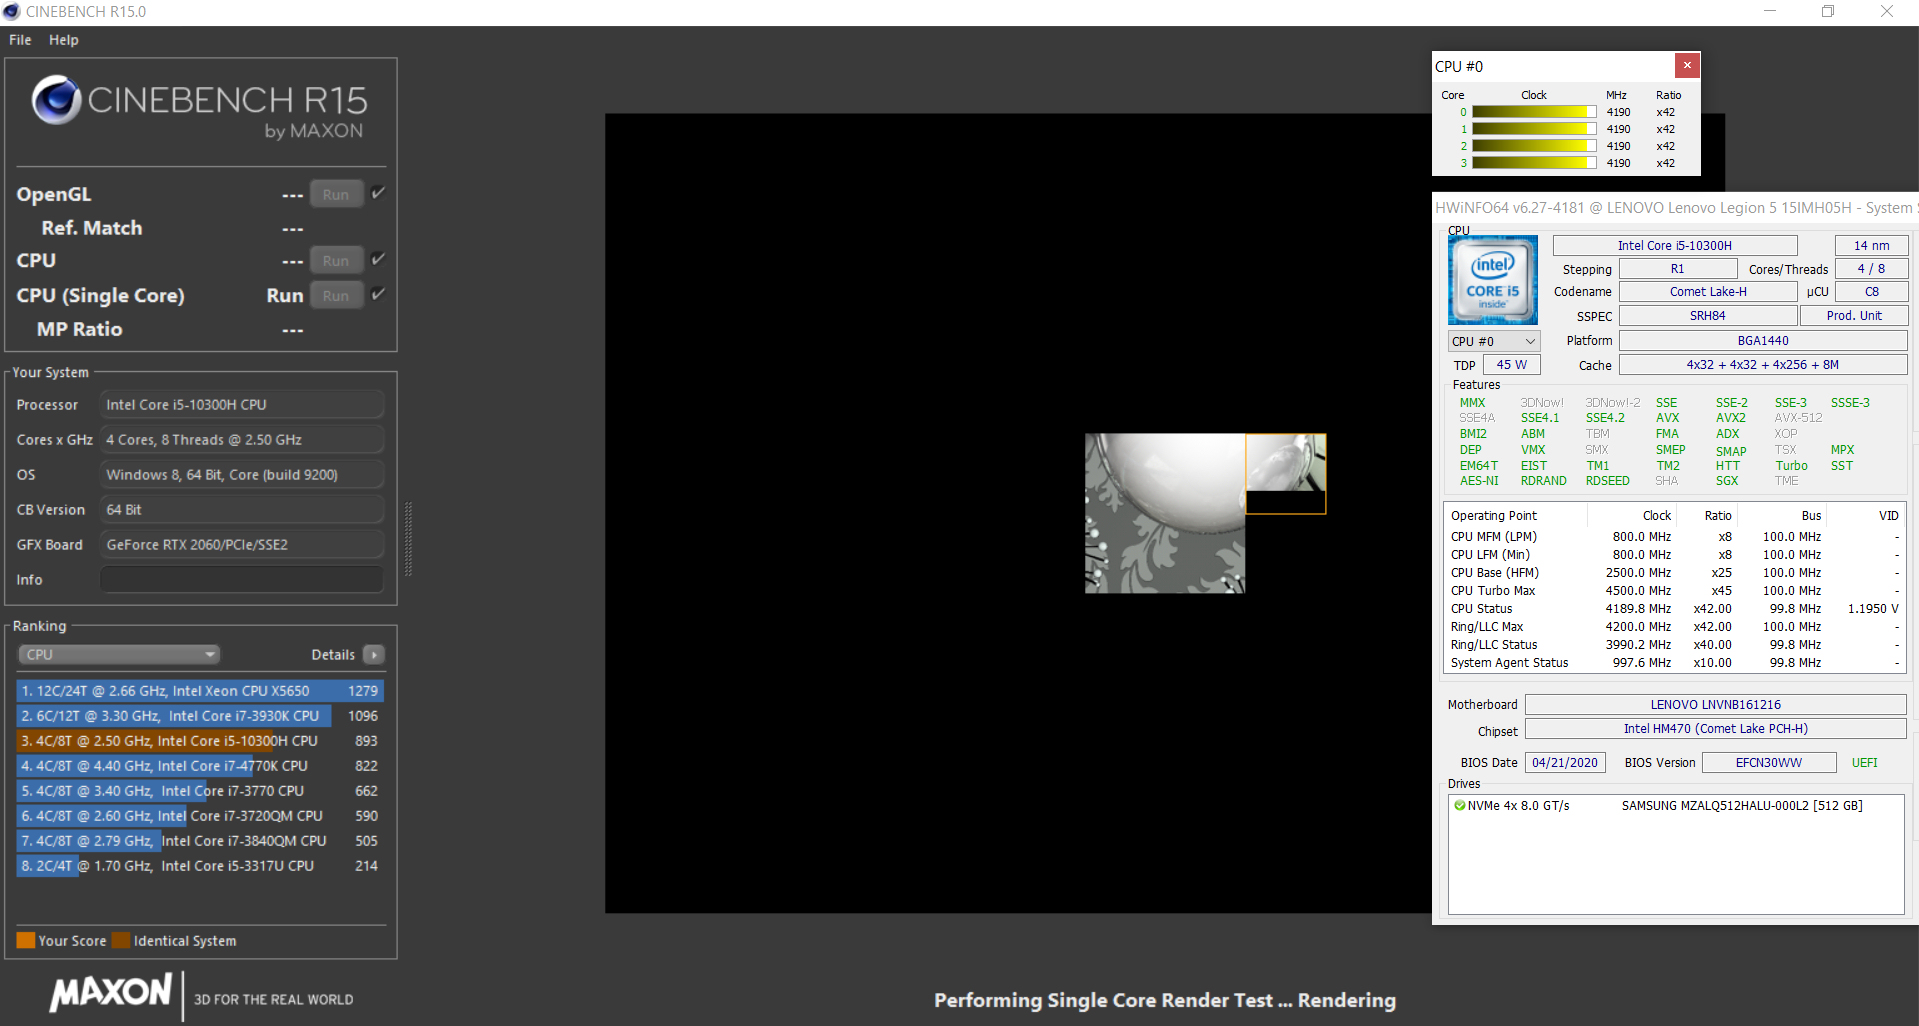
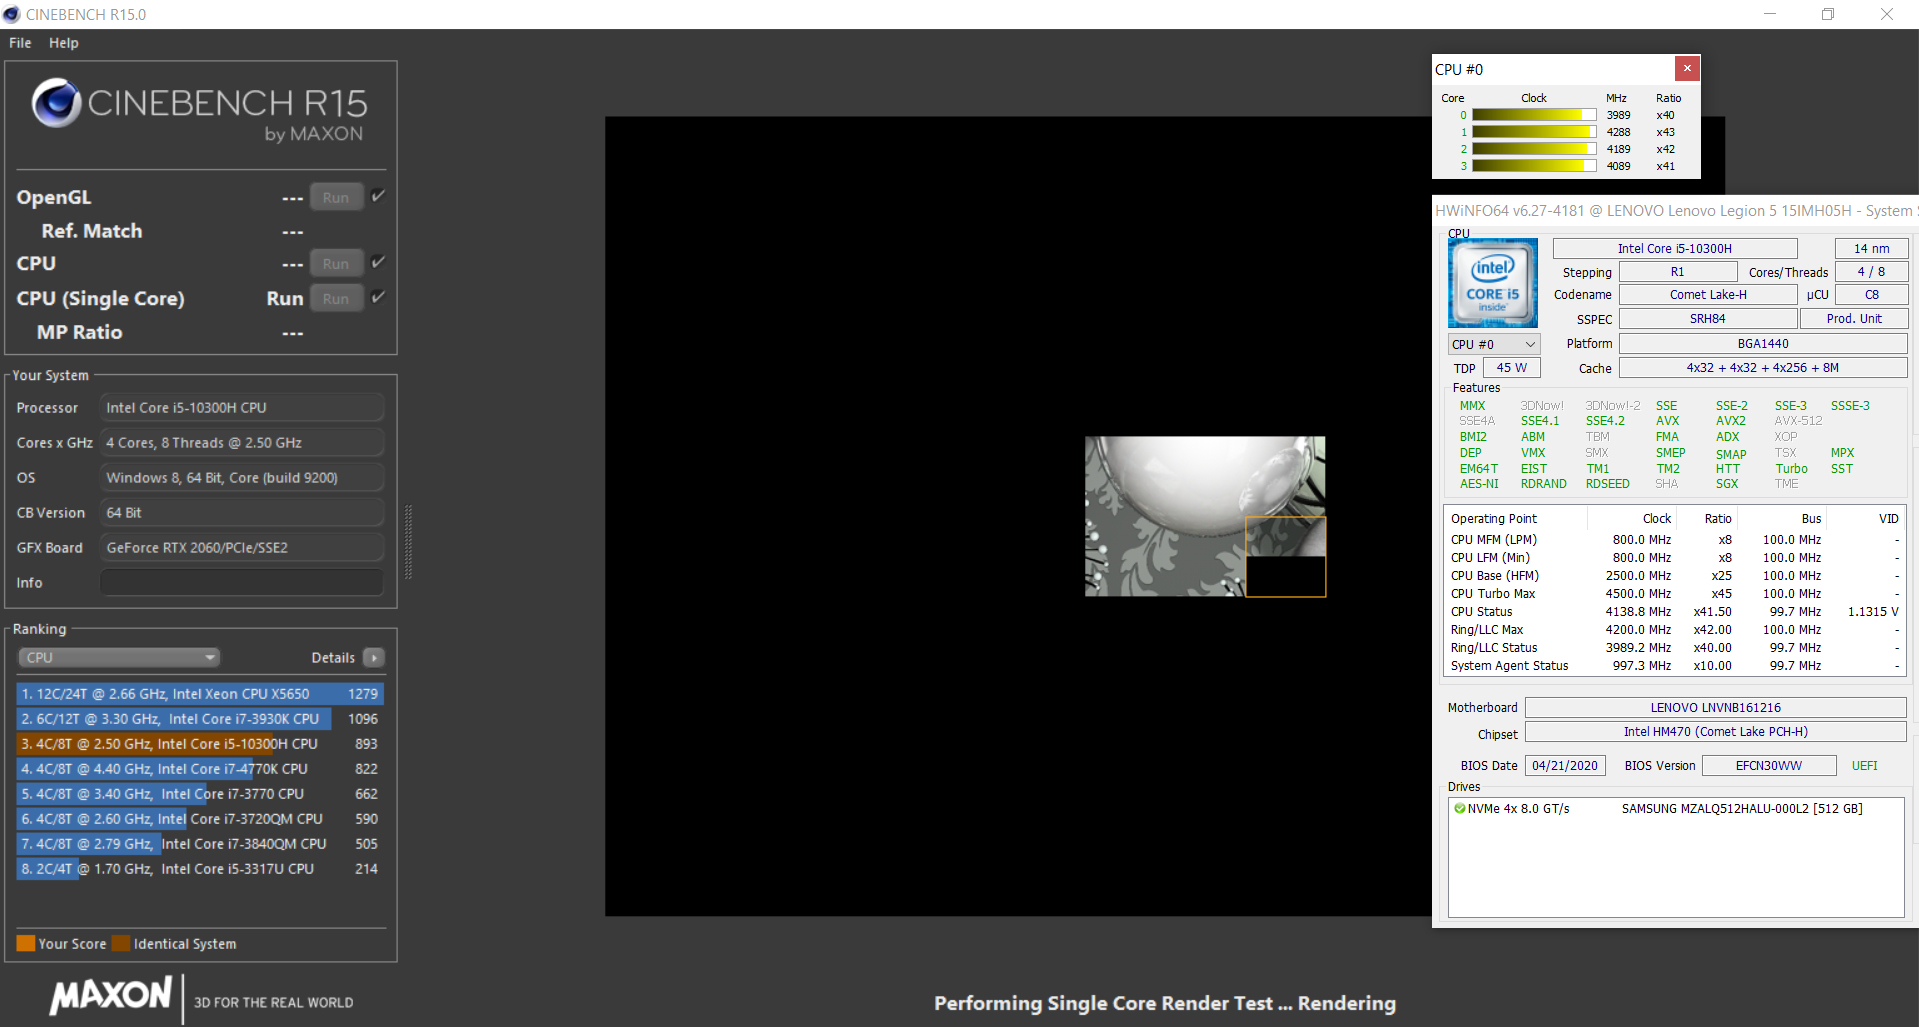
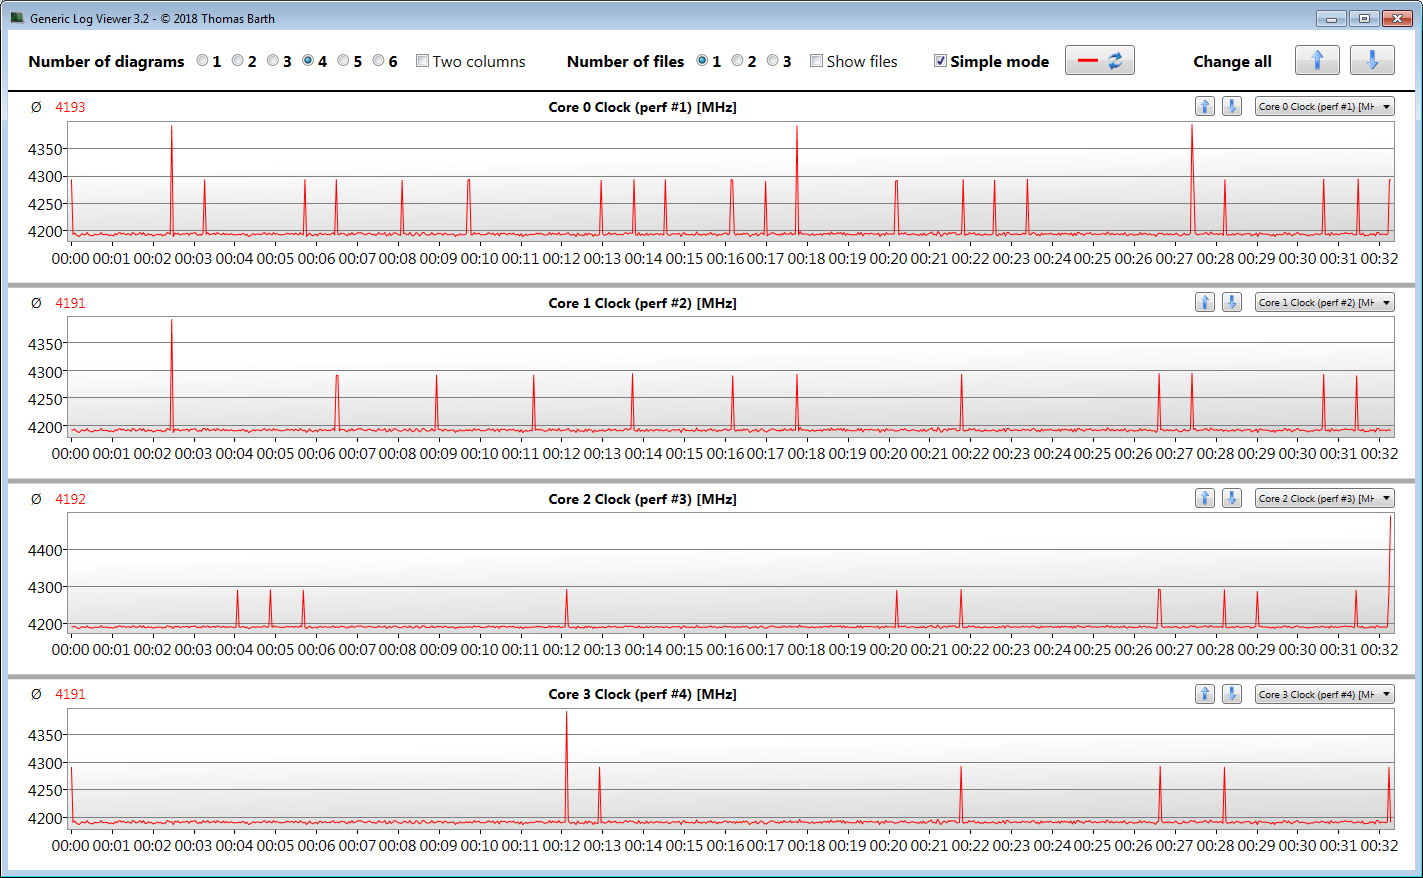
CPU turbunun şebekede uzun süre kullanılabilir olup olmadığını öğrenmek için, çok iş parçacıklı Cinebench R15 testini en az 30 dakika boyunca bir döngüde çalıştırıyoruz. Sonuçlar test boyunca sabit kalır, yani turbo maksimumda kullanılmaya devam eder. Lenovo Vantage içinde ayarlanabilen sıcaklık modlarının performans üzerinde güçlü bir etkisi vardır. Dengeli veya sakin modda CB15 döngüsü, ilk iki turda 530 ve 540 puan ile sonuçlanır, ancak sonuçlar daha sonra sakin modda önemli ölçüde düşer. Dengeli sonuçlar, performans modunda kaydedilenlerle aynı veya azdır. Modlar, tek iplik performansını ve CB15 karşılaştırmasının tek iplik testini etkiler ve 131 nokta (dengeli mod) ve 108 nokta (sakin mod) ile sonuçlanır.
| Cinebench R15 | |
| CPU Single 64Bit | |
| Sınıf ortalaması Gaming (188.8 - 343, n=110, son 2 yıl) | |
| Acer Nitro 5 AN517-52-77DS | |
| Lenovo Legion Y540-15IRH | |
| Dell G5 15 SE 5505 P89F | |
| Lenovo Legion 5 15IMH05H | |
| Asus TUF Gaming A15 FA506IV-HN172 | |
| Ortalama Intel Core i5-10300H (108 - 194, n=17) | |
| MSI Alpha 15 A3DDK-034 | |
| CPU Multi 64Bit | |
| Sınıf ortalaması Gaming (1578 - 6271, n=109, son 2 yıl) | |
| Dell G5 15 SE 5505 P89F | |
| Asus TUF Gaming A15 FA506IV-HN172 | |
| Acer Nitro 5 AN517-52-77DS | |
| Lenovo Legion Y540-15IRH | |
| Lenovo Legion 5 15IMH05H | |
| Ortalama Intel Core i5-10300H (536 - 921, n=17) | |
| MSI Alpha 15 A3DDK-034 | |
| Blender - v2.79 BMW27 CPU | |
| Ortalama Intel Core i5-10300H (479 - 555, n=14) | |
| Lenovo Legion 5 15IMH05H | |
| Acer Nitro 5 AN517-52-77DS | |
| Dell G5 15 SE 5505 P89F | |
| Asus TUF Gaming A15 FA506IV-HN172 | |
| Sınıf ortalaması Gaming (80 - 330, n=108, son 2 yıl) | |
| 7-Zip 18.03 | |
| 7z b 4 -mmt1 | |
| Sınıf ortalaması Gaming (4199 - 7436, n=109, son 2 yıl) | |
| Acer Nitro 5 AN517-52-77DS | |
| Lenovo Legion 5 15IMH05H | |
| Ortalama Intel Core i5-10300H (2945 - 4956, n=14) | |
| Asus TUF Gaming A15 FA506IV-HN172 | |
| Dell G5 15 SE 5505 P89F | |
| 7z b 4 | |
| Sınıf ortalaması Gaming (33491 - 148086, n=109, son 2 yıl) | |
| Dell G5 15 SE 5505 P89F | |
| Asus TUF Gaming A15 FA506IV-HN172 | |
| Acer Nitro 5 AN517-52-77DS | |
| Lenovo Legion 5 15IMH05H | |
| Ortalama Intel Core i5-10300H (15146 - 24841, n=14) | |
| Cinebench R20 | |
| CPU (Single Core) | |
| Sınıf ortalaması Gaming (442 - 895, n=110, son 2 yıl) | |
| Asus TUF Gaming A15 FA506IV-HN172 | |
| Dell G5 15 SE 5505 P89F | |
| Acer Nitro 5 AN517-52-77DS | |
| Lenovo Legion 5 15IMH05H | |
| Ortalama Intel Core i5-10300H (312 - 470, n=15) | |
| MSI Alpha 15 A3DDK-034 | |
| CPU (Multi Core) | |
| Sınıf ortalaması Gaming (4029 - 16108, n=110, son 2 yıl) | |
| Dell G5 15 SE 5505 P89F | |
| Asus TUF Gaming A15 FA506IV-HN172 | |
| Acer Nitro 5 AN517-52-77DS | |
| Lenovo Legion 5 15IMH05H | |
| Ortalama Intel Core i5-10300H (1397 - 2240, n=15) | |
| MSI Alpha 15 A3DDK-034 | |
| Geekbench 5.5 | |
| Single-Core | |
| Sınıf ortalaması Gaming (986 - 2474, n=109, son 2 yıl) | |
| Acer Nitro 5 AN517-52-77DS | |
| Lenovo Legion 5 15IMH05H | |
| Asus TUF Gaming A15 FA506IV-HN172 | |
| Ortalama Intel Core i5-10300H (703 - 1241, n=16) | |
| Dell G5 15 SE 5505 P89F | |
| MSI Alpha 15 A3DDK-034 | |
| Multi-Core | |
| Sınıf ortalaması Gaming (6460 - 27010, n=109, son 2 yıl) | |
| Dell G5 15 SE 5505 P89F | |
| Acer Nitro 5 AN517-52-77DS | |
| Asus TUF Gaming A15 FA506IV-HN172 | |
| Lenovo Legion 5 15IMH05H | |
| Ortalama Intel Core i5-10300H (2783 - 4728, n=16) | |
| MSI Alpha 15 A3DDK-034 | |
| HWBOT x265 Benchmark v2.2 - 4k Preset | |
| Sınıf ortalaması Gaming (11.5 - 44.3, n=109, son 2 yıl) | |
| Dell G5 15 SE 5505 P89F | |
| Asus TUF Gaming A15 FA506IV-HN172 | |
| Acer Nitro 5 AN517-52-77DS | |
| Lenovo Legion 5 15IMH05H | |
| Ortalama Intel Core i5-10300H (6.13 - 7.78, n=14) | |
| LibreOffice - 20 Documents To PDF | |
| Dell G5 15 SE 5505 P89F | |
| Ortalama Intel Core i5-10300H (23.9 - 94, n=14) | |
| Lenovo Legion 5 15IMH05H | |
| Acer Nitro 5 AN517-52-77DS | |
| Sınıf ortalaması Gaming (19 - 88.8, n=109, son 2 yıl) | |
| Asus TUF Gaming A15 FA506IV-HN172 | |
| R Benchmark 2.5 - Overall mean | |
| Ortalama Intel Core i5-10300H (0.625 - 1.088, n=14) | |
| Lenovo Legion 5 15IMH05H | |
| Acer Nitro 5 AN517-52-77DS | |
| Asus TUF Gaming A15 FA506IV-HN172 | |
| Dell G5 15 SE 5505 P89F | |
| Sınıf ortalaması Gaming (0.3439 - 0.759, n=110, son 2 yıl) | |
* ... daha küçük daha iyidir
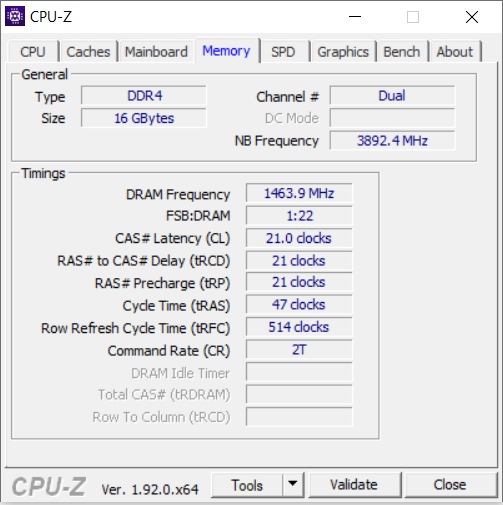
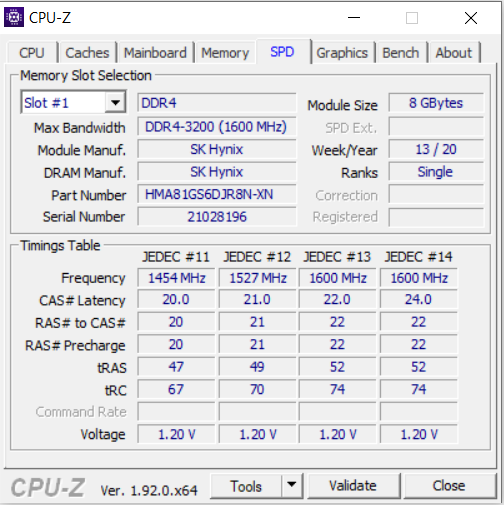
Sistem performansı
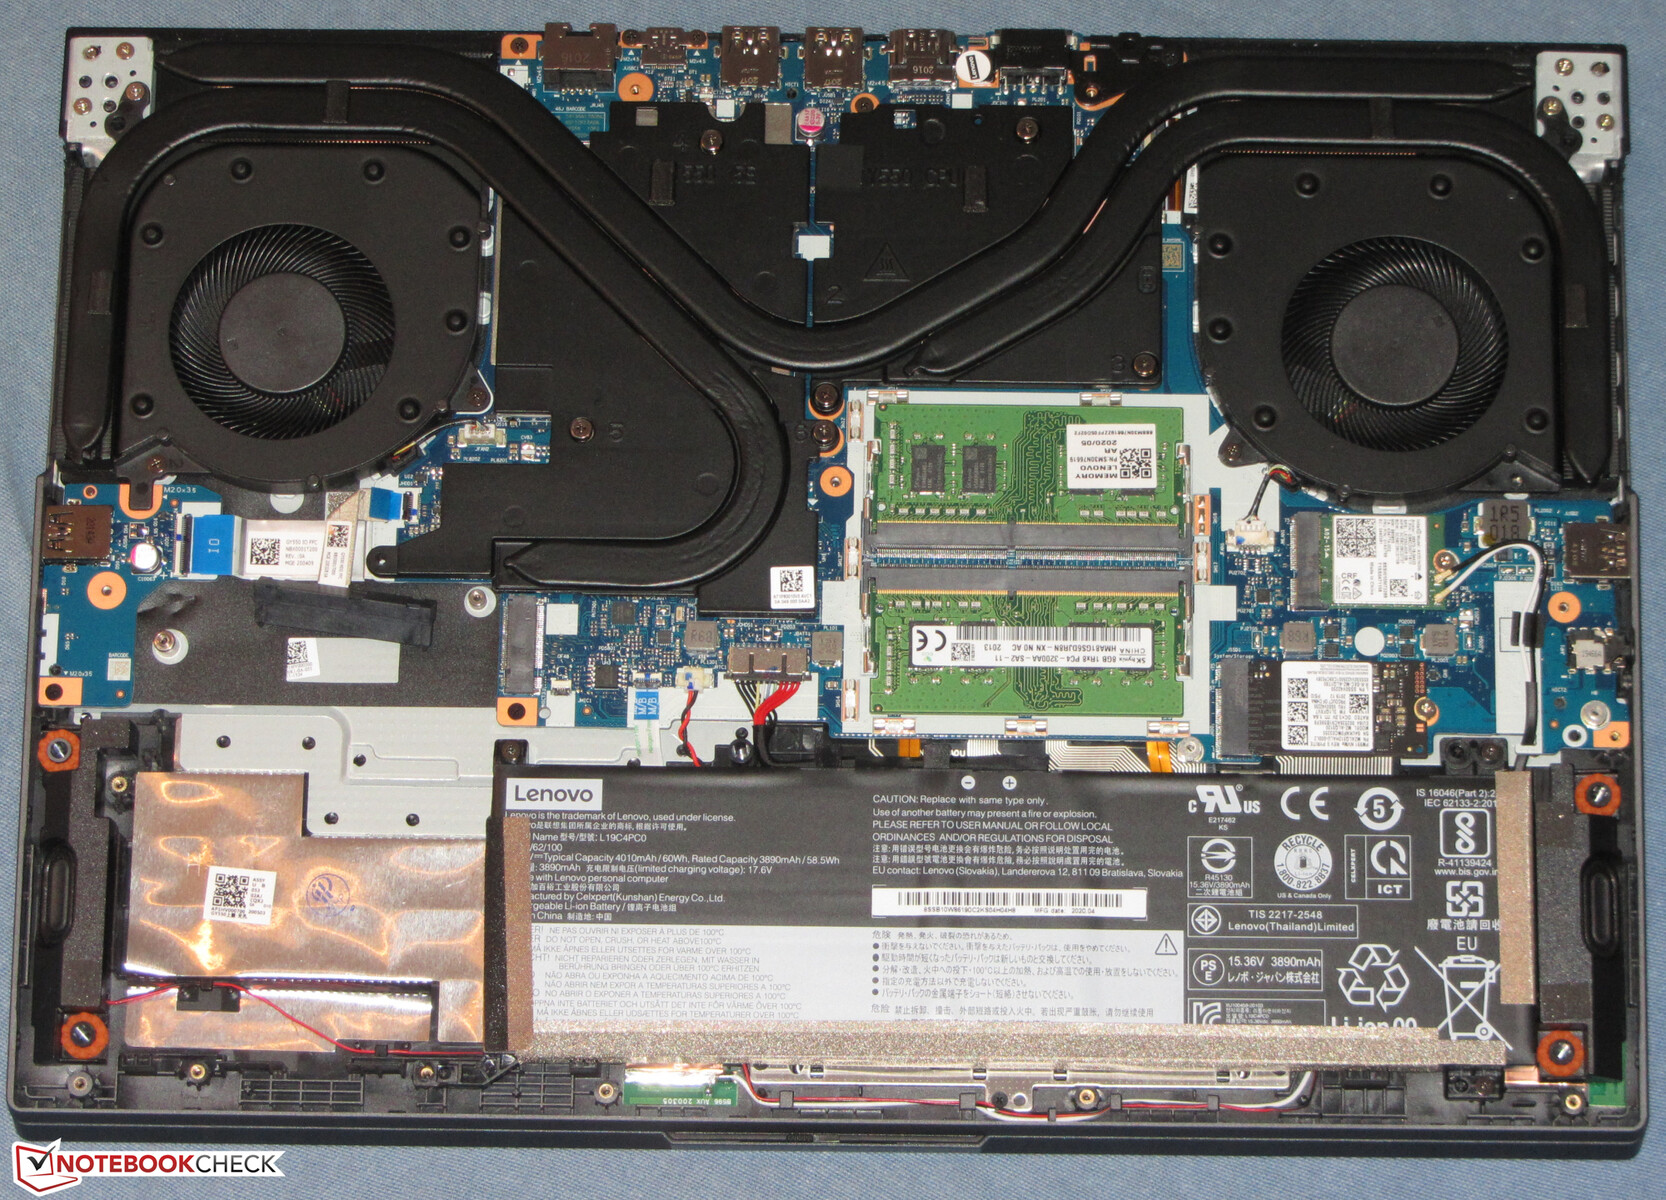
Dört çekirdekli işlemci, çift kanal modunda çalışan RAM ve bir NVMe SSD kombinasyonu hızlı ve sorunsuz çalışan bir sistem sağlar. Çok iyi PCMark sonuçları, Lenovo dizüstü bilgisayarın oyun dışındaki uygulamalar için de uygun olduğunu doğrulamaktadır.
| PCMark 8 Home Score Accelerated v2 | 3984 puan | |
| PCMark 8 Creative Score Accelerated v2 | 3770 puan | |
| PCMark 8 Work Score Accelerated v2 | 5319 puan | |
| PCMark 10 Score | 4887 puan | |
Yardım | ||
| PCMark 8 | |
| Home Score Accelerated v2 | |
| Sınıf ortalaması Gaming (n=1son 2 yıl) | |
| Lenovo Legion Y540-15IRH | |
| Dell G5 15 SE 5505 P89F | |
| Asus TUF Gaming A15 FA506IV-HN172 | |
| MSI Alpha 15 A3DDK-034 | |
| Lenovo Legion 5 15IMH05H | |
| Ortalama Intel Core i5-10300H, NVIDIA GeForce RTX 2060 Mobile (3702 - 3984, n=2) | |
| Acer Nitro 5 AN517-52-77DS | |
| Work Score Accelerated v2 | |
| Lenovo Legion Y540-15IRH | |
| Asus TUF Gaming A15 FA506IV-HN172 | |
| Acer Nitro 5 AN517-52-77DS | |
| Dell G5 15 SE 5505 P89F | |
| Lenovo Legion 5 15IMH05H | |
| Ortalama Intel Core i5-10300H, NVIDIA GeForce RTX 2060 Mobile (4986 - 5319, n=2) | |
| MSI Alpha 15 A3DDK-034 | |
| Sınıf ortalaması Gaming (n=1son 2 yıl) | |
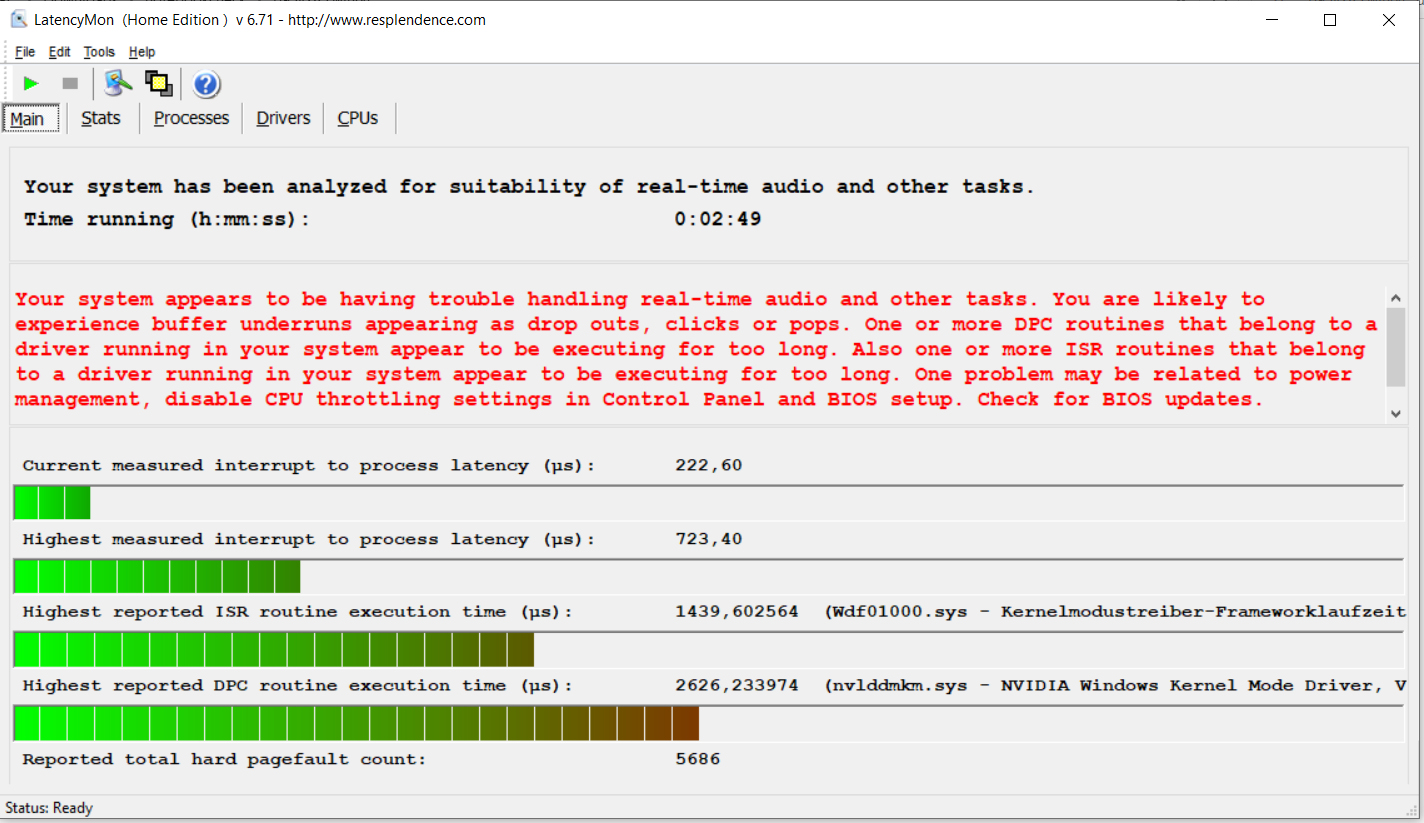
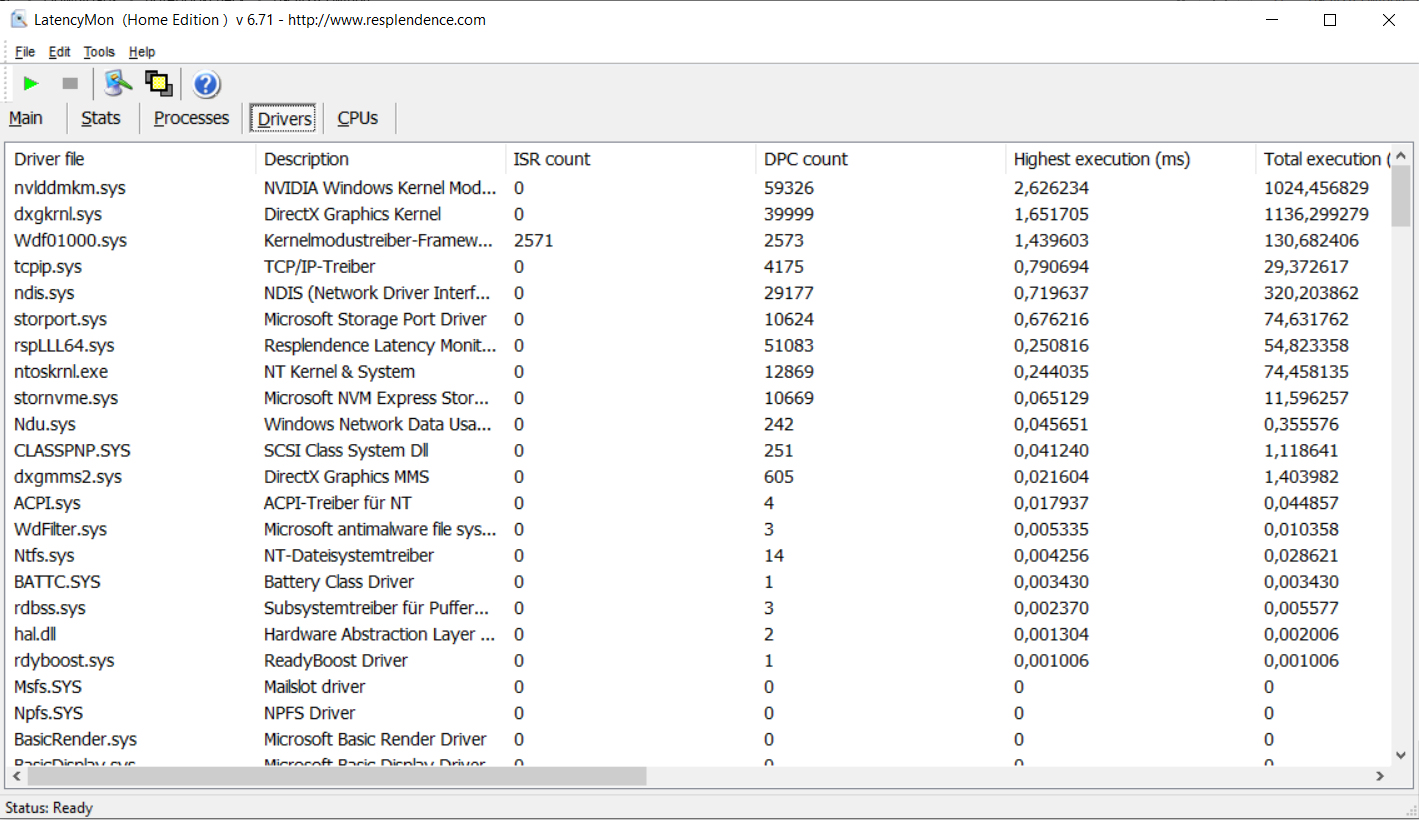
DPC latencies
Our standardized Latency Monitor test (browsing, watching 4K videos, Prime95 high load) showed that the device has high DPC latencies. This means that the system is not suitable for real-time video and audio processing.
| DPC Latencies / LatencyMon - interrupt to process latency (max), Web, Youtube, Prime95 | |
| Dell G5 15 SE 5505 P89F | |
| Asus TUF Gaming A15 FA506IV-HN172 | |
| Lenovo Legion 5 15IMH05H | |
| Acer Nitro 5 AN517-52-77DS | |
* ... daha küçük daha iyidir
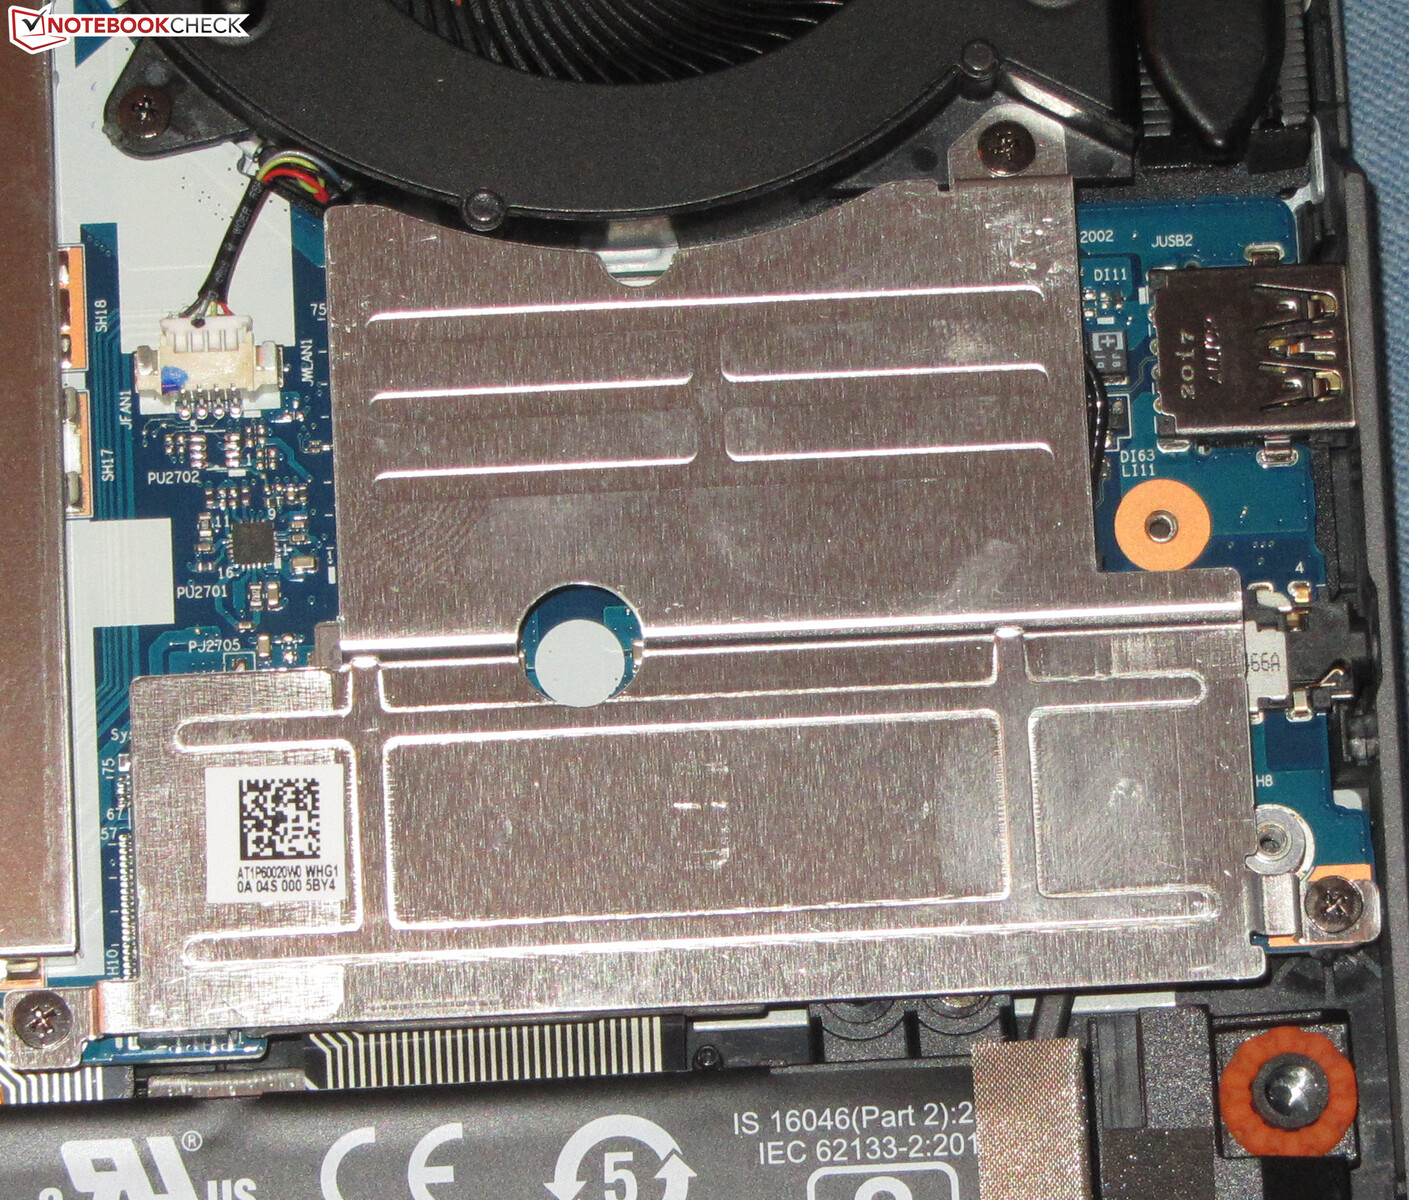
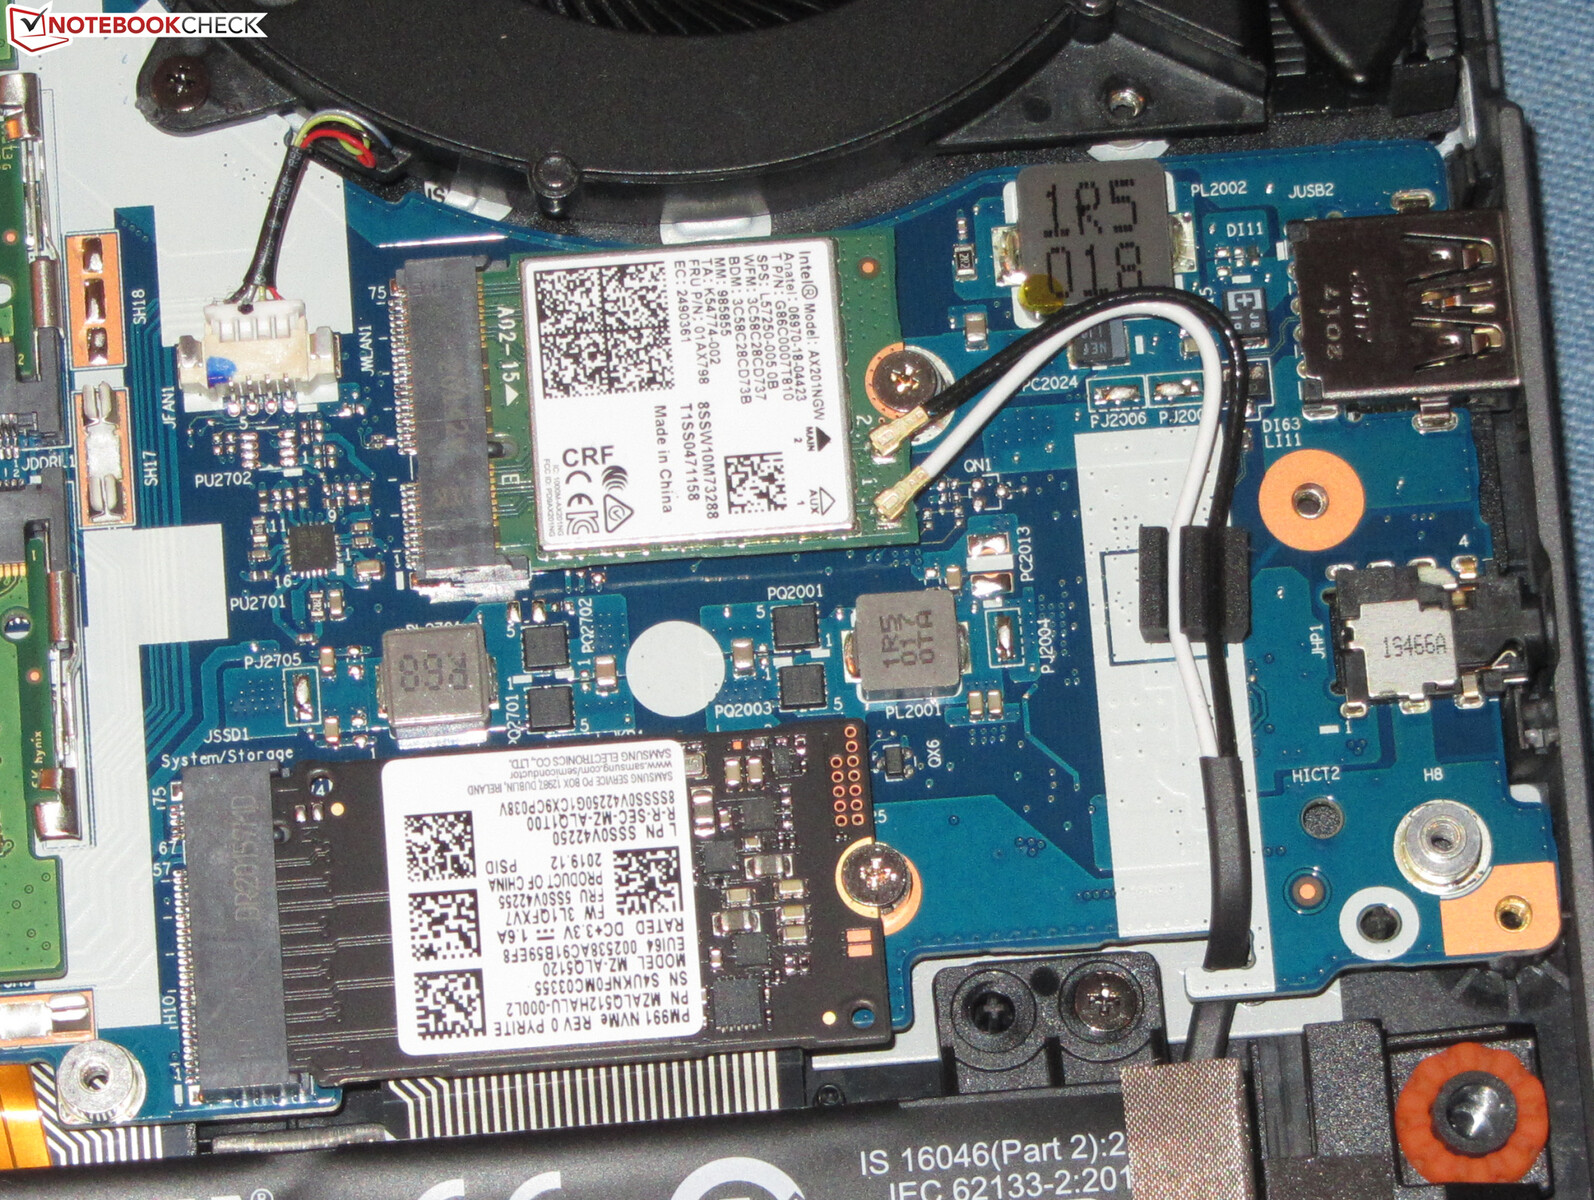
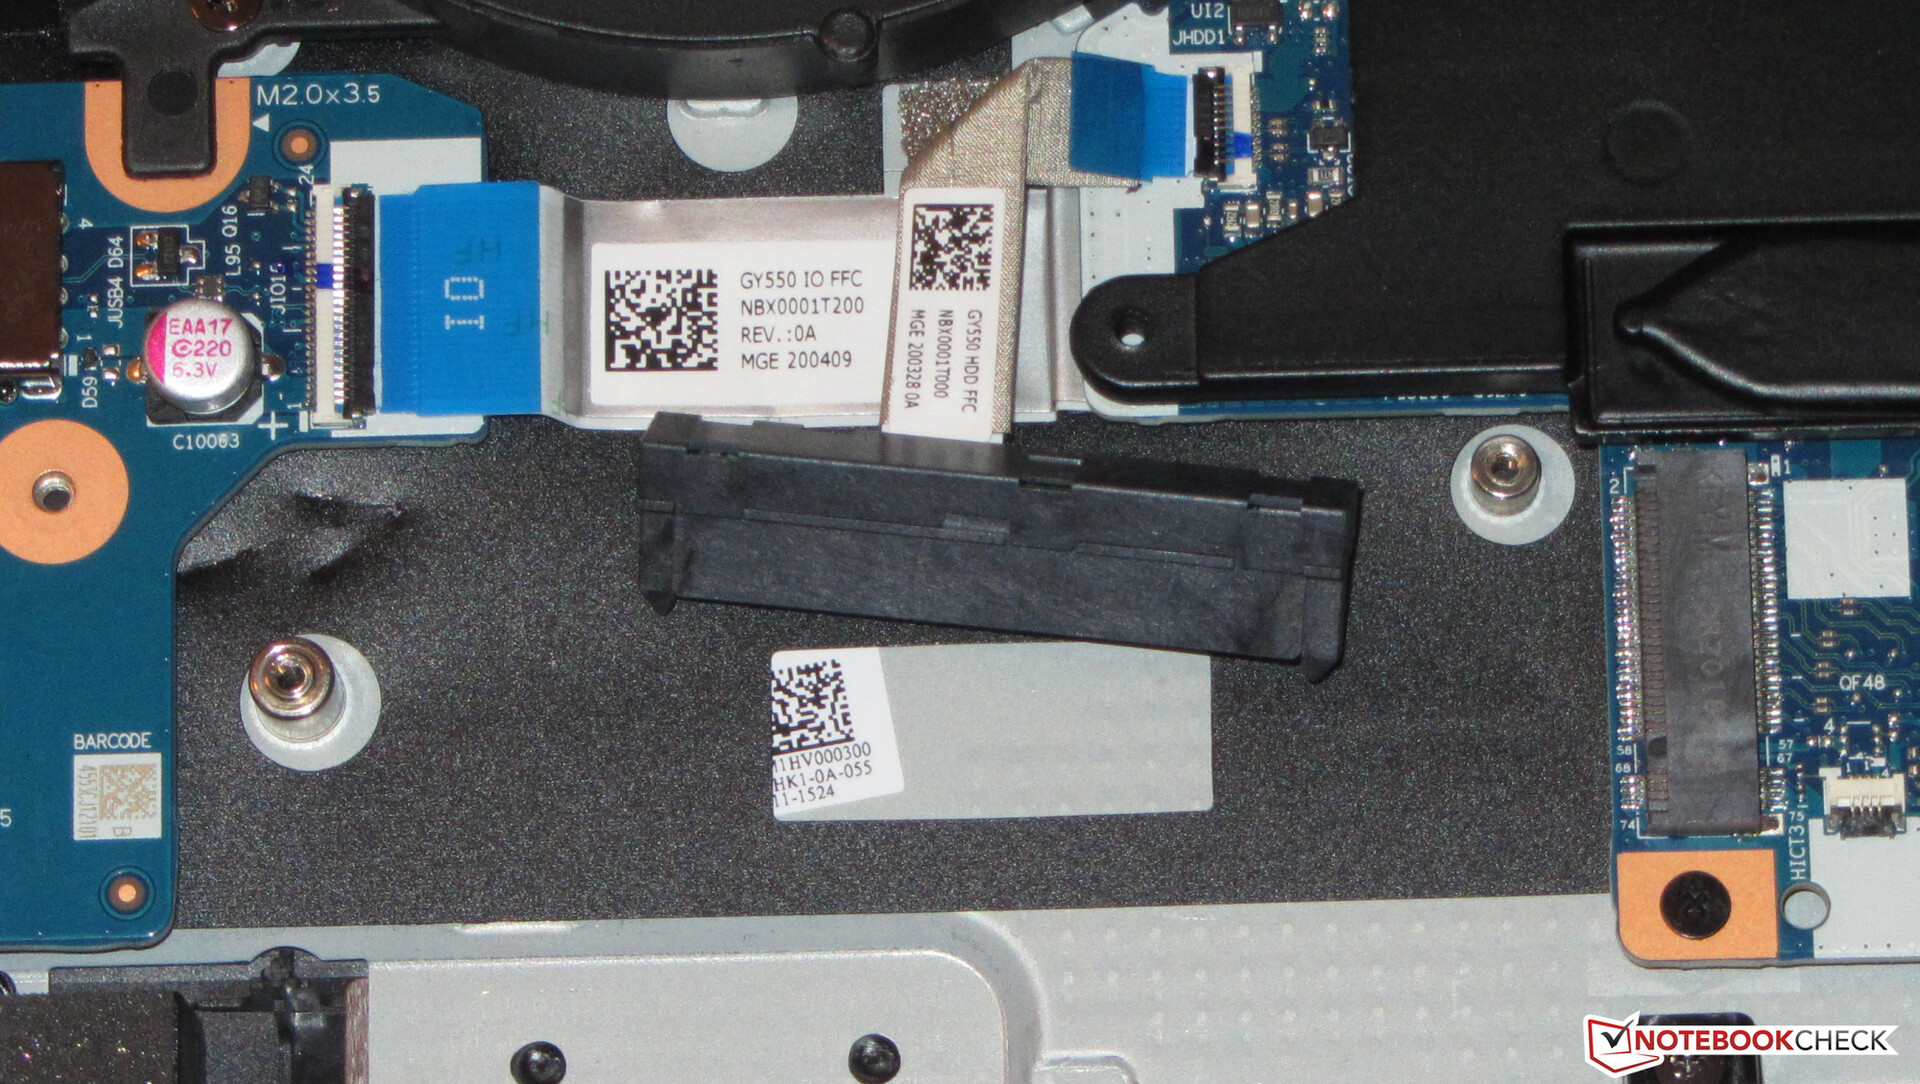
Storage Devices
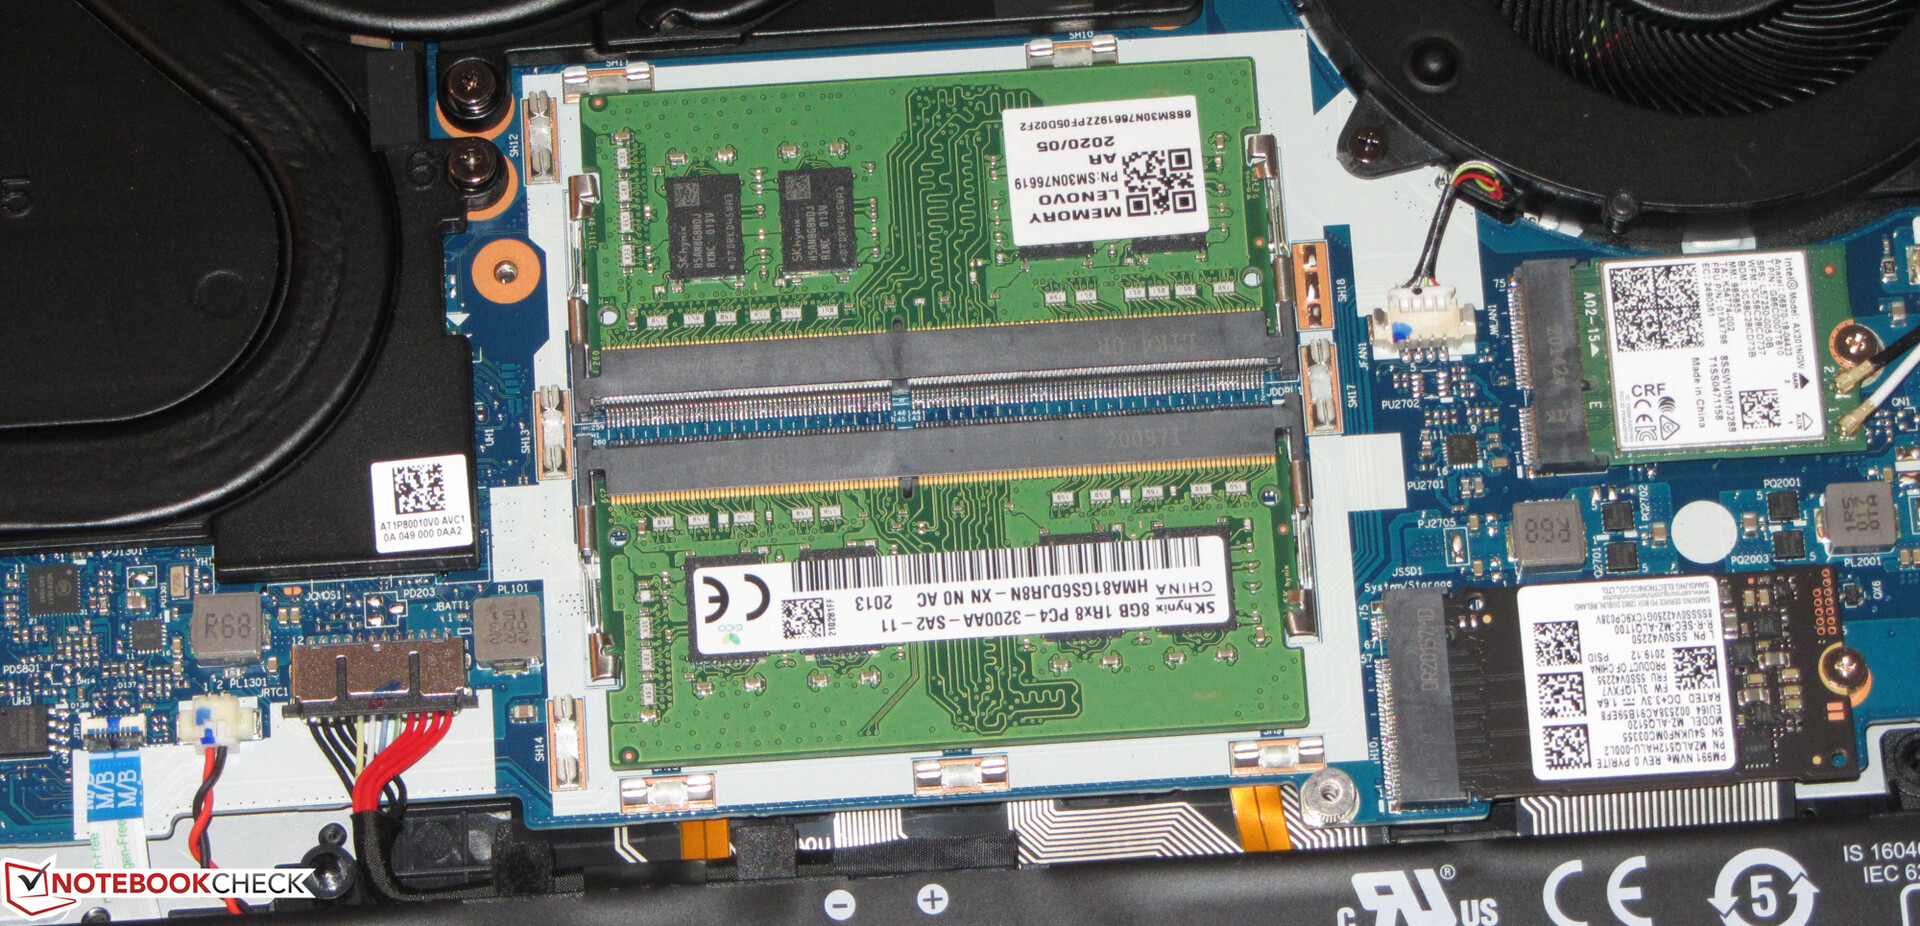
Our test unit is equipped with an NVMe SSD (M.2 2242) from Samsung, with a capacity of 512 GB. The transfer rates are very good.
The notebook also has a slot available for a 2.5-inch storage device (SATA slot plus caddy included) or a second NVMe SSD (M.2-2280). Both devices cannot be operated simultaneously as you will need to remove the 2.5-inch caddy to insert the second NVMe SSD.

| Lenovo Legion 5 15IMH05H Samsung PM991 MZALQ512HALU | Asus TUF Gaming A15 FA506IV-HN172 Kingston OM8PCP3512F-AB | Dell G5 15 SE 5505 P89F Samsung PM991 MZ9LQ512HALU | MSI Alpha 15 A3DDK-034 Kingston RBUSNS8154P3512GJ | Ortalama Samsung PM991 MZALQ512HALU | |
|---|---|---|---|---|---|
| CrystalDiskMark 5.2 / 6 | 5% | 3% | -23% | 0% | |
| Write 4K (MB/s) | 145.4 | 219.8 51% | 142.1 -2% | 105.4 -28% | 129.5 ? -11% |
| Read 4K (MB/s) | 51.6 | 50.2 -3% | 46.43 -10% | 33.24 -36% | 45.1 ? -13% |
| Write Seq (MB/s) | 1007 | 979 -3% | 1108 10% | 1029 2% | 1172 ? 16% |
| Read Seq (MB/s) | 1145 | 1990 74% | 1622 42% | 1098 -4% | 1496 ? 31% |
| Write 4K Q32T1 (MB/s) | 468.4 | 516 10% | 467 0% | 322.1 -31% | 448 ? -4% |
| Read 4K Q32T1 (MB/s) | 528 | 298.3 -44% | 525 -1% | 352 -33% | 415 ? -21% |
| Write Seq Q32T1 (MB/s) | 1381 | 982 -29% | 1203 -13% | 1036 -25% | 1397 ? 1% |
| Read Seq Q32T1 (MB/s) | 2291 | 1907 -17% | 2288 0% | 1606 -30% | 2307 ? 1% |
| Write 4K Q8T8 (MB/s) | 981 | ||||
| Read 4K Q8T8 (MB/s) | 300.9 | ||||
| AS SSD | -7% | -13% | -20% | 3% | |
| Seq Read (MB/s) | 2012 | 1682 -16% | 1386 -31% | 1423 -29% | 1917 ? -5% |
| Seq Write (MB/s) | 1261 | 904 -28% | 1234 -2% | 958 -24% | 1061 ? -16% |
| 4K Read (MB/s) | 43.66 | 60.2 38% | 41.32 -5% | 33.2 -24% | 45.7 ? 5% |
| 4K Write (MB/s) | 109.3 | 164.8 51% | 128 17% | 80.7 -26% | 140.1 ? 28% |
| 4K-64 Read (MB/s) | 851 | 472.5 -44% | 854 0% | 816 -4% | 854 ? 0% |
| 4K-64 Write (MB/s) | 780 | 845 8% | 721 -8% | 708 -9% | 780 ? 0% |
| Access Time Read * (ms) | 0.117 | 0.087 26% | 0.098 16% | 0.1 15% | 0.1031 ? 12% |
| Access Time Write * (ms) | 0.036 | 0.02 44% | 0.095 -164% | 0.047 -31% | 0.03488 ? 3% |
| Score Read (Points) | 1096 | 701 -36% | 1034 -6% | 991 -10% | 1091 ? 0% |
| Score Write (Points) | 1016 | 1101 8% | 973 -4% | 885 -13% | 1027 ? 1% |
| Score Total (Points) | 2643 | 2143 -19% | 2536 -4% | 2365 -11% | 2643 ? 0% |
| Copy ISO MB/s (MB/s) | 1481 | 675 -54% | 1284 -13% | 1043 -30% | 1310 ? -12% |
| Copy Program MB/s (MB/s) | 467.5 | 248.4 -47% | 401.9 -14% | 252.7 -46% | 453 ? -3% |
| Copy Game MB/s (MB/s) | 734 | 535 -27% | 1013 38% | 483.6 -34% | 924 ? 26% |
| Toplam Ortalama (Program / Ayarlar) | -1% /
-3% | -5% /
-7% | -22% /
-21% | 2% /
2% |
* ... daha küçük daha iyidir
Dauerleistung Lesen: DiskSpd Read Loop, Queue Depth 8
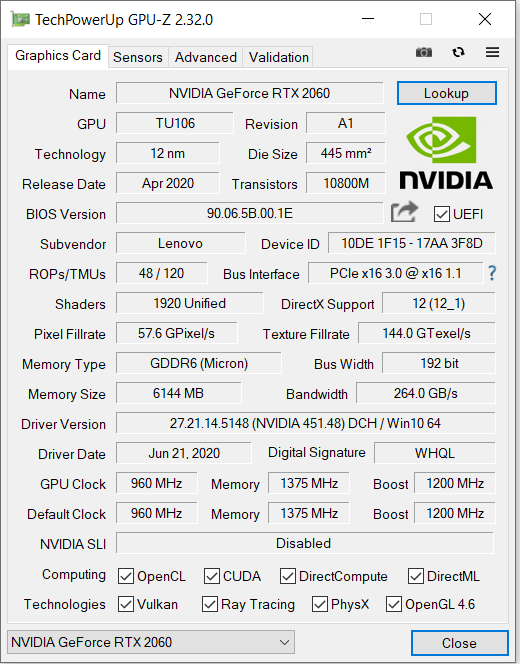
GPU Performance
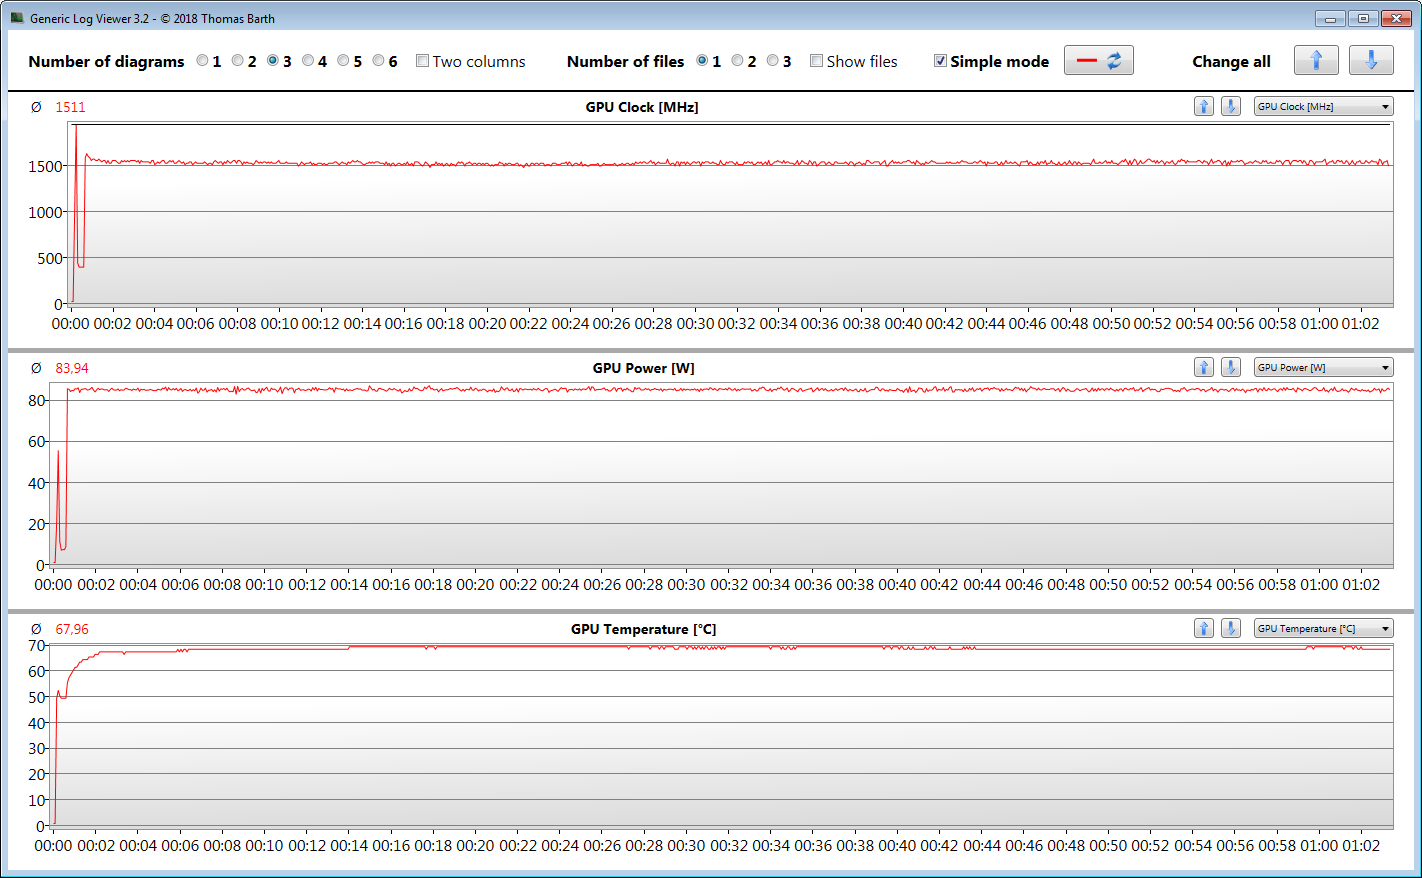
The GeForce RTX-2060 (Turing) is a top-range GPU that supports DirectX 12 and clocks at a base rate of 960 MHz, which can be increased to up to 1200 MHz via the turbo boost. Provided the GPU does not reach a certain temperature or energy limit, it can reach even higher speeds. We actually measured a maximum clock rate of 1931 MHz. The Witcher 3 test was completed with an average speed of 1511 MHz. The GPU can make use of fast GDDR6 storage (6144 MB).
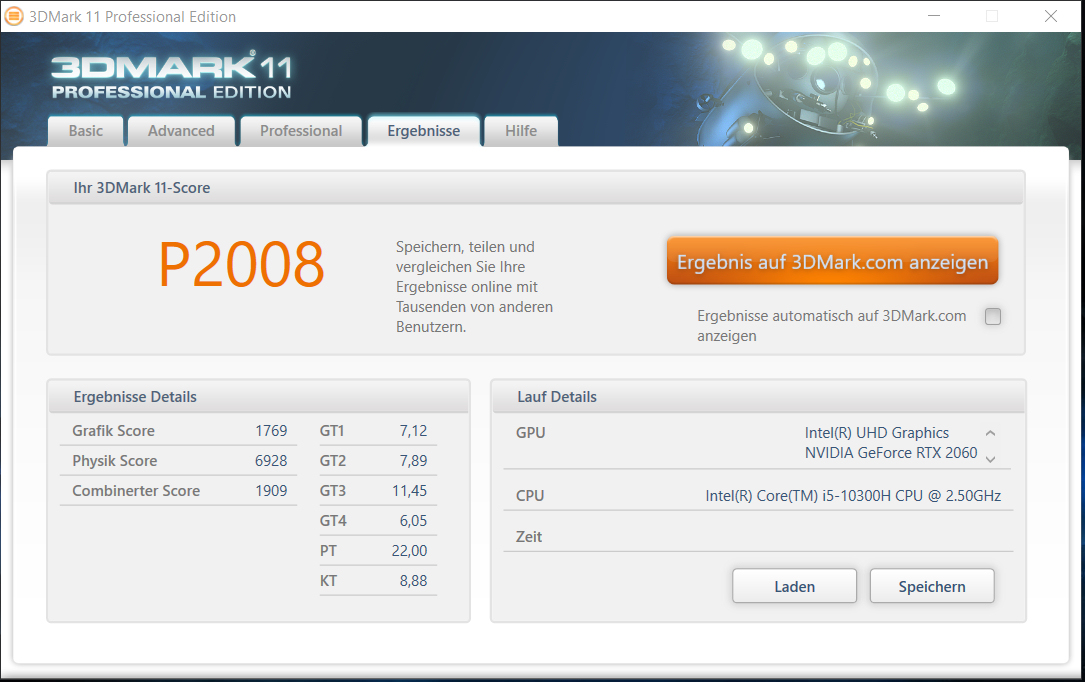
The results of the various 3DMark benchmarks are as expected for this GPU. The integrated Intel GPU UHD-Graphics-G1 is active and the notebook uses Nvidia Optimus to switch between the two. As mentioned earlier, the iGPU can be deactivated in the BIOS or using Lenovo Vantage.
The temperature modes of the Lenovo Vantage software have an influence on the graphics performance. While the 3DMark results in performance and balanced mode are very similar, the graphics performance drops significantly when calm mode is active.
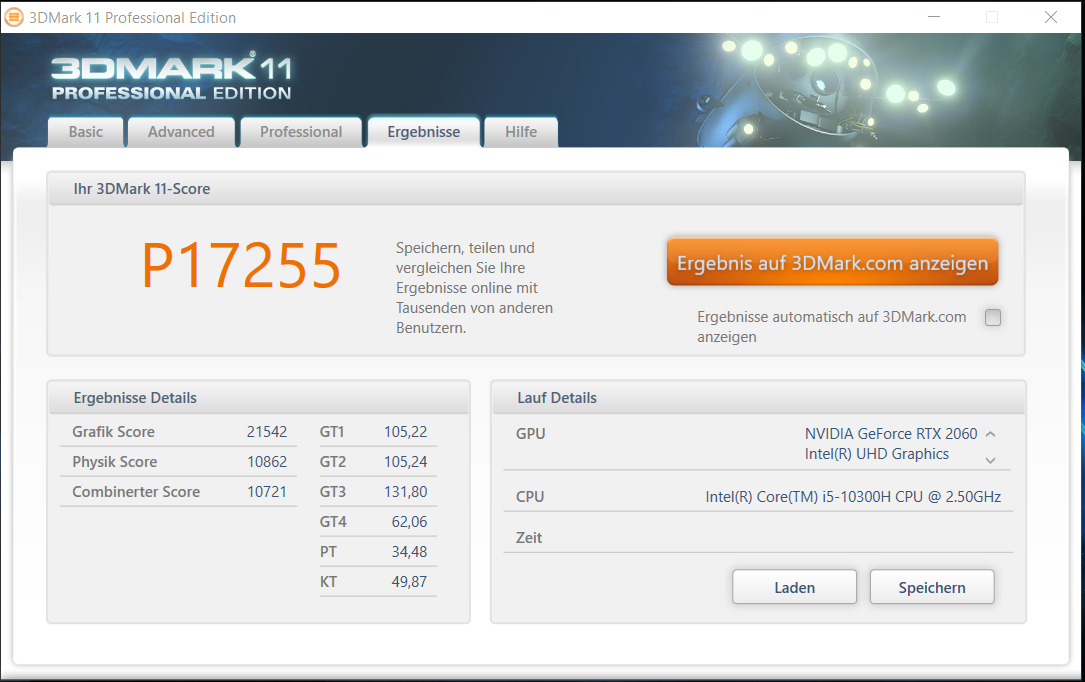
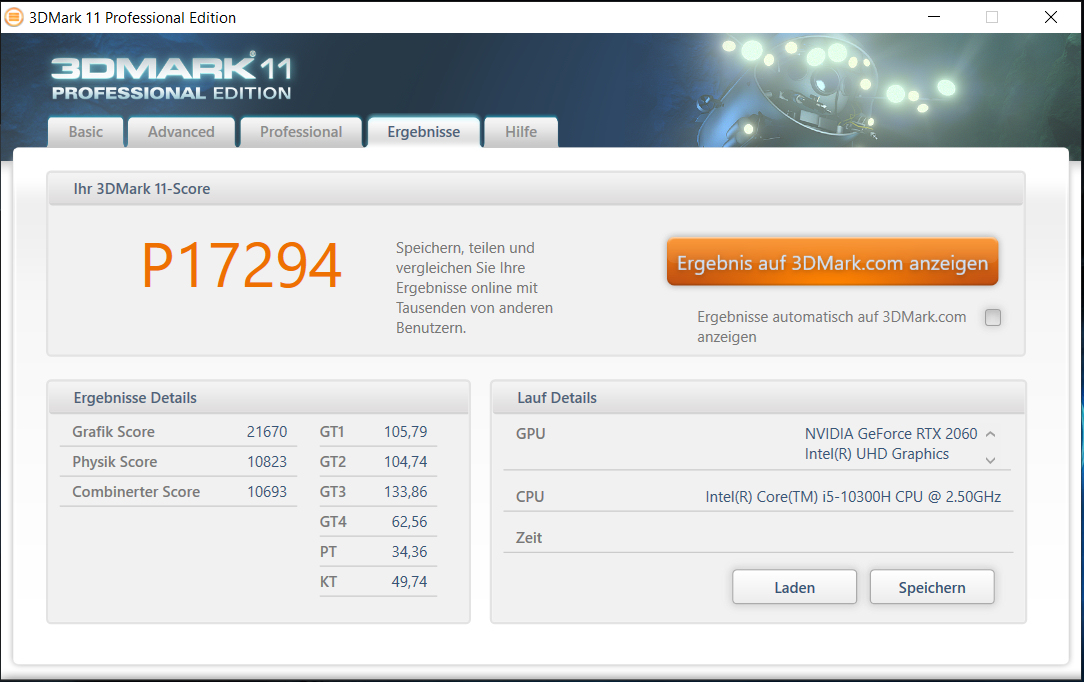
| 3DMark 11 Performance | 17255 puan | |
| 3DMark Ice Storm Standard Score | 178912 puan | |
| 3DMark Cloud Gate Standard Score | 30548 puan | |
| 3DMark Fire Strike Score | 13745 puan | |
| 3DMark Time Spy Score | 5980 puan | |
Yardım | ||
| 3DMark 11 - 1280x720 Performance GPU | |
| Sınıf ortalaması Gaming (21841 - 80022, n=107, son 2 yıl) | |
| Dell G5 15 SE 5505 P89F | |
| Lenovo Legion 5 15IMH05H | |
| Asus TUF Gaming A15 FA506IV-HN172 | |
| Ortalama NVIDIA GeForce RTX 2060 Mobile (19143 - 24662, n=40) | |
| Acer Nitro 5 AN517-52-77DS | |
| Lenovo Legion Y540-15IRH | |
| MSI Alpha 15 A3DDK-034 | |
| 3DMark | |
| 1280x720 Cloud Gate Standard Graphics | |
| Sınıf ortalaması Gaming (86886 - 223650, n=63, son 2 yıl) | |
| Acer Nitro 5 AN517-52-77DS | |
| Lenovo Legion 5 15IMH05H | |
| Lenovo Legion Y540-15IRH | |
| Ortalama NVIDIA GeForce RTX 2060 Mobile (55324 - 116593, n=36) | |
| Dell G5 15 SE 5505 P89F | |
| Asus TUF Gaming A15 FA506IV-HN172 | |
| MSI Alpha 15 A3DDK-034 | |
| 1920x1080 Fire Strike Graphics | |
| Sınıf ortalaması Gaming (12242 - 62849, n=119, son 2 yıl) | |
| Dell G5 15 SE 5505 P89F | |
| Ortalama NVIDIA GeForce RTX 2060 Mobile (14768 - 18358, n=43) | |
| Asus TUF Gaming A15 FA506IV-HN172 | |
| Acer Nitro 5 AN517-52-77DS | |
| Lenovo Legion 5 15IMH05H | |
| Lenovo Legion Y540-15IRH | |
| MSI Alpha 15 A3DDK-034 | |
| 2560x1440 Time Spy Graphics | |
| Sınıf ortalaması Gaming (5012 - 26212, n=118, son 2 yıl) | |
| Dell G5 15 SE 5505 P89F | |
| Ortalama NVIDIA GeForce RTX 2060 Mobile (5660 - 6910, n=41) | |
| Lenovo Legion 5 15IMH05H | |
| Asus TUF Gaming A15 FA506IV-HN172 | |
| Acer Nitro 5 AN517-52-77DS | |
| MSI Alpha 15 A3DDK-034 | |
Gaming Performance
The CPU/GPU combination of the Legion 5 displays all games smoothly at Full-HD resolution and high to maximum quality settings. The GPU even manages some resolutions above Full-HD (this would require a suitable external monitor), although you would have to lower the quality settings slightly to get there.
| The Witcher 3 - 1920x1080 Ultra Graphics & Postprocessing (HBAO+) | |
| Sınıf ortalaması Gaming (95 - 240, n=8, son 2 yıl) | |
| Lenovo Legion 5 15IMH05H | |
| Dell G5 15 SE 5505 P89F | |
| Acer Nitro 5 AN517-52-77DS | |
| Ortalama NVIDIA GeForce RTX 2060 Mobile (50.6 - 74, n=40) | |
| Asus TUF Gaming A15 FA506IV-HN172 | |
| Lenovo Legion Y540-15IRH | |
| MSI Alpha 15 A3DDK-034 | |
| BioShock Infinite - 1920x1080 Ultra Preset, DX11 (DDOF) | |
| Lenovo Legion 5 15IMH05H | |
| Ortalama NVIDIA GeForce RTX 2060 Mobile (119 - 156, n=17) | |
| Acer Nitro 5 AN517-52-77DS | |
| Asus TUF Gaming A15 FA506IV-HN172 | |
| MSI Alpha 15 A3DDK-034 | |
| Shadow of the Tomb Raider - 1920x1080 Highest Preset AA:T | |
| Sınıf ortalaması Gaming (96 - 116, n=2, son 2 yıl) | |
| Lenovo Legion 5 15IMH05H | |
| Ortalama NVIDIA GeForce RTX 2060 Mobile (54 - 86, n=22) | |
| Acer Nitro 5 AN517-52-77DS | |
| Dell G5 15 SE 5505 P89F | |
| Red Dead Redemption 2 - 1920x1080 High Settings | |
| Lenovo Legion 5 15IMH05H | |
| Ortalama NVIDIA GeForce RTX 2060 Mobile (50.7 - 56.2, n=5) | |
| Acer Nitro 5 AN517-52-77DS | |
| Far Cry 5 - 1920x1080 Ultra Preset AA:T | |
| Sınıf ortalaması Gaming (70 - 151, n=10, son 2 yıl) | |
| Lenovo Legion 5 15IMH05H | |
| Ortalama NVIDIA GeForce RTX 2060 Mobile (76 - 90, n=9) | |
| Gears Tactics - 1920x1080 Ultra Preset | |
| Dell G5 15 SE 5505 P89F | |
| Lenovo Legion 5 15IMH05H | |
| Ortalama NVIDIA GeForce RTX 2060 Mobile (60.7 - 71.3, n=7) | |
| Acer Nitro 5 AN517-52-77DS | |
To find out whether the refresh rates remain the same over a long period, we ran the game "The Witcher 3" for around 60 minutes in Full-HD resolution and maximum quality settings. The character played by the player did not move throughout the test. We did not observe a drop in frame rates.
| düşük | orta | yüksek | ultra | |
|---|---|---|---|---|
| BioShock Infinite (2013) | 349.9 | 315.9 | 288.8 | 144.4 |
| The Witcher 3 (2015) | 275.4 | 204.8 | 124.8 | 68.3 |
| Dota 2 Reborn (2015) | 140.9 | 128.9 | 118.8 | 113.1 |
| X-Plane 11.11 (2018) | 85.6 | 78.5 | 68.1 | |
| Far Cry 5 (2018) | 114 | 97 | 91 | 85 |
| Shadow of the Tomb Raider (2018) | 125 | 97 | 90 | 81 |
| Total War: Three Kingdoms (2019) | 215.3 | 108.3 | 71.7 | 50.6 |
| F1 2019 (2019) | 185 | 166 | 137 | 127 |
| Red Dead Redemption 2 (2019) | 117.9 | 81.6 | 55.1 | 35.1 |
| Doom Eternal (2020) | 204.9 | 140 | 126.9 | 126.1 |
| Gears Tactics (2020) | 228.8 | 151.8 | 99.3 | 68.1 |
Emissions - The Lenovo Legion only heats up moderately
System Noise
The fact that gaming notebooks produce a lot of noise should not be surprising. After all, powerful hardware needs to be cooled down. In this case, we measured a noise level of 50.9 dB(A) (stress test) and 47 dB(A) (Witcher 3). The cooling fans are a lot less noticeable while idling and often don't turn on at all, in which case the device is silent.
If users want their device to remain quiet, they will have to turn on calm mode within Lenovo Vantage. This has an effect on computing power.
Ses yüksekliği
| Boşta |
| 30.7 / 30.7 / 30.7 dB |
| Çalışırken |
| 36.6 / 50.9 dB |
 | ||
30 dB sessiz 40 dB(A) duyulabilirlik 50 dB(A) gürültülü |
||
min: | ||
| Lenovo Legion 5 15IMH05H i5-10300H, GeForce RTX 2060 Mobile | Asus TUF Gaming A15 FA506IV-HN172 R7 4800H, GeForce RTX 2060 Mobile | Dell G5 15 SE 5505 P89F R7 4800H, Radeon RX 5600M | MSI Alpha 15 A3DDK-034 R7 3750H, Radeon RX 5500M | Lenovo Legion Y540-15IRH i7-9750H, GeForce RTX 2060 Mobile | Ortalama NVIDIA GeForce RTX 2060 Mobile | Sınıf ortalaması Gaming | |
|---|---|---|---|---|---|---|---|
| Noise | -0% | 7% | -20% | -5% | -2% | 5% | |
| kapalı / ortam * (dB) | 30.7 | 30.2 2% | 28 9% | 29 6% | 30 2% | 27.9 ? 9% | 24.1 ? 21% |
| Idle Minimum * (dB) | 30.7 | 30.2 2% | 28 9% | 36 -17% | 30 2% | 29 ? 6% | 25.9 ? 16% |
| Idle Average * (dB) | 30.7 | 30.2 2% | 28 9% | 37 -21% | 32 -4% | 30 ? 2% | 27.4 ? 11% |
| Idle Maximum * (dB) | 30.7 | 30.2 2% | 28 9% | 46 -50% | 34 -11% | 33 ? -7% | 29.9 ? 3% |
| Load Average * (dB) | 36.6 | 40 -9% | 28 23% | 50 -37% | 44 -20% | 44 ? -20% | 43 ? -17% |
| Witcher 3 ultra * (dB) | 47 | 49 -4% | 50.6 -8% | 51 -9% | 48 -2% | ||
| Load Maximum * (dB) | 50.9 | 49 4% | 50.6 1% | 57 -12% | 52 -2% | 51.6 ? -1% | 54.1 ? -6% |
* ... daha küçük daha iyidir
Temperature
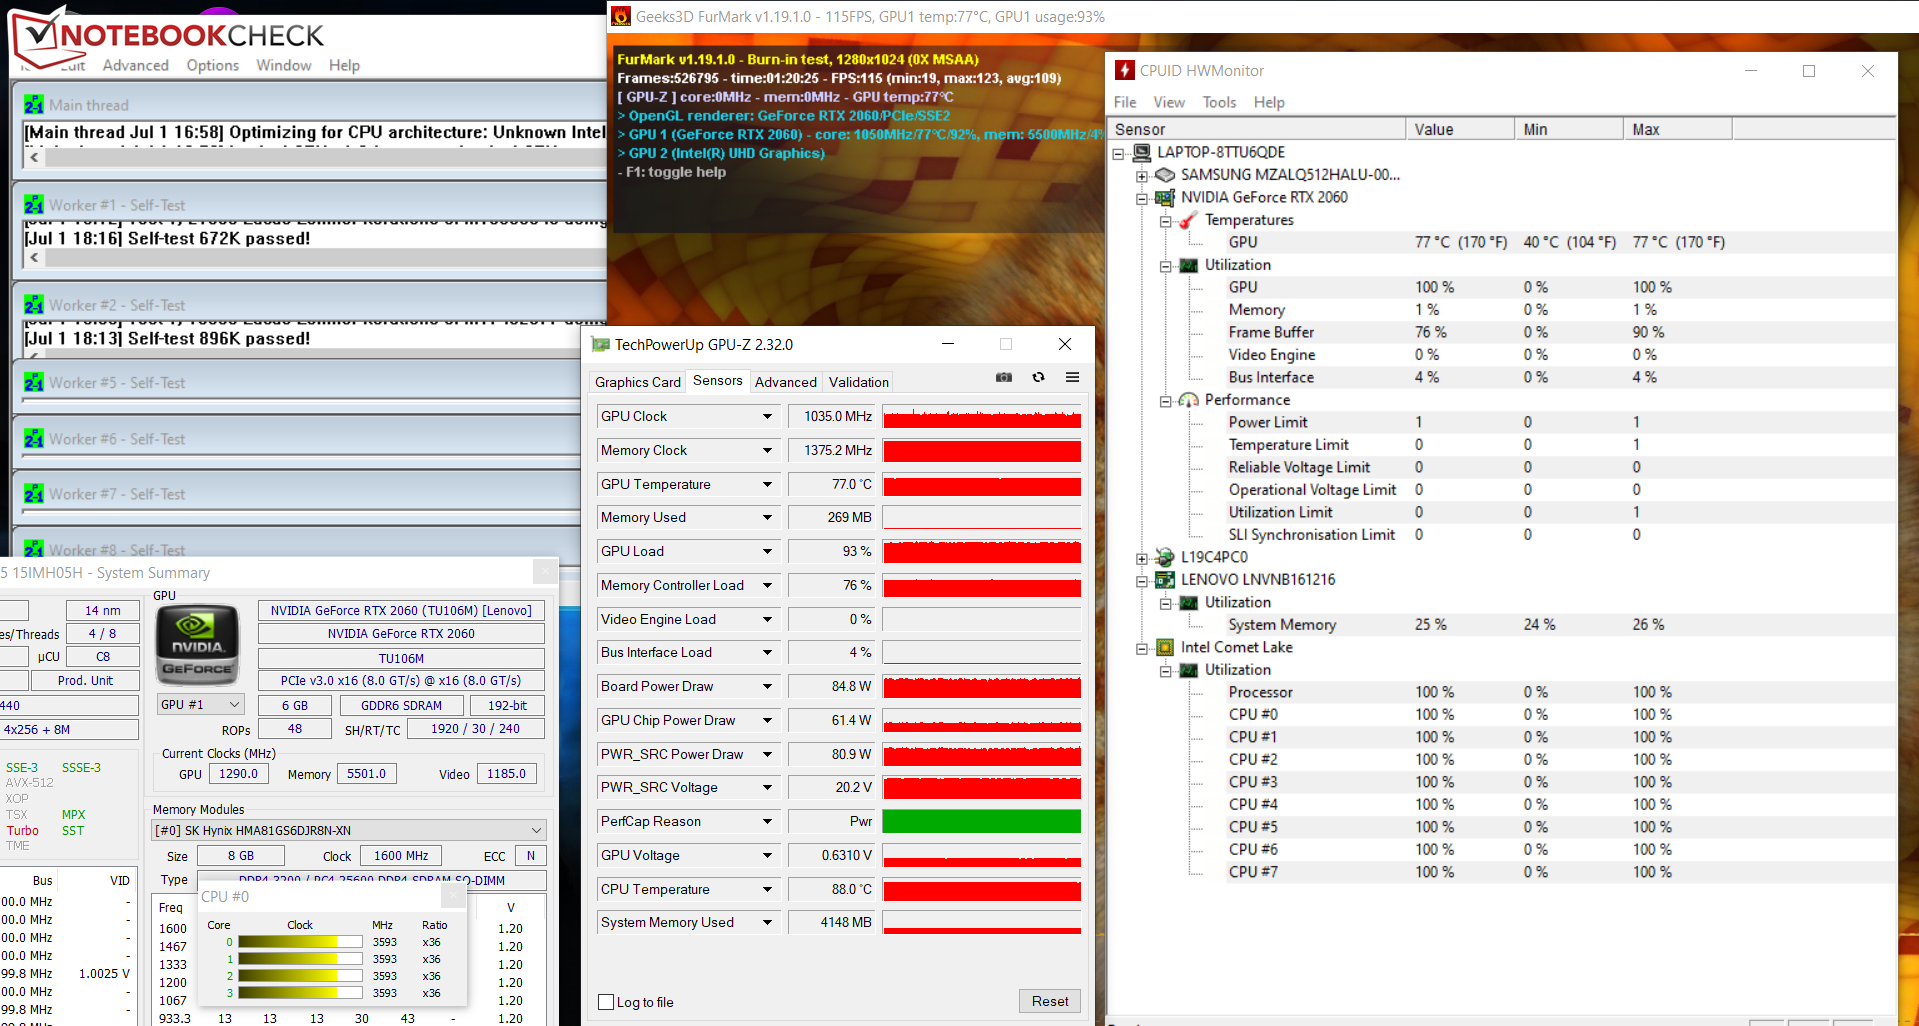
Our stress test (Prime95 and FurMark running for one hour) has different results depending on whether the device is running on mains or on battery. The clock rate of the processor drops from 4 - 4.1 GHz at first to around 3.3 - 3.6 GHz, where it remains. The GPU clock rate, on the other hand, drops from around 1200 MHz to 1050 MHz. The clock rates on battery are 2.5 GHz (CPU) and 1500 MHz (GPU). The stress test is an extreme scenario that does not occur as such during everyday use. We use it to find our whether the system remains stable even under maximum load.
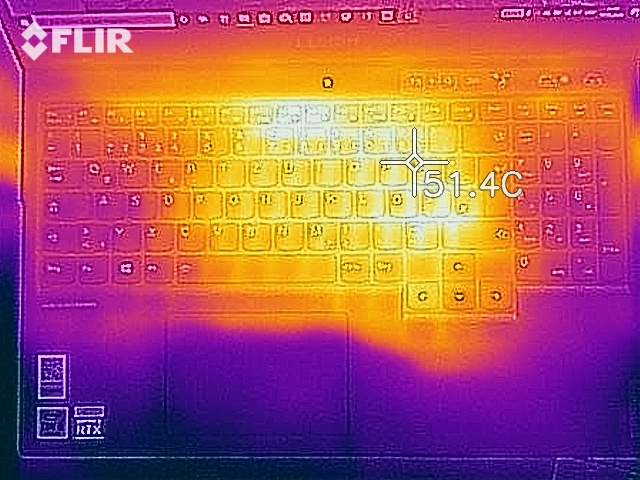
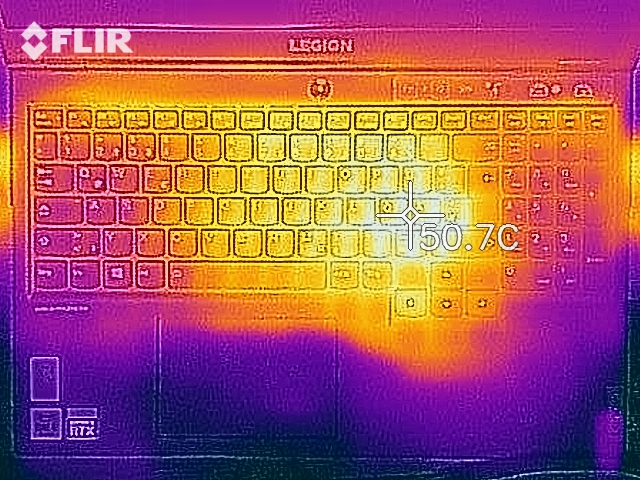
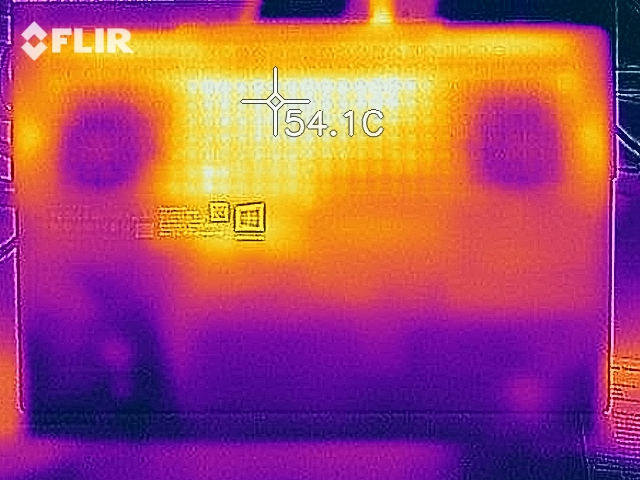
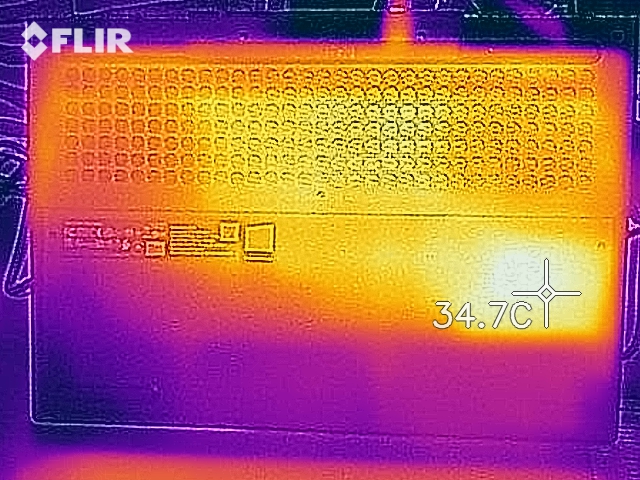
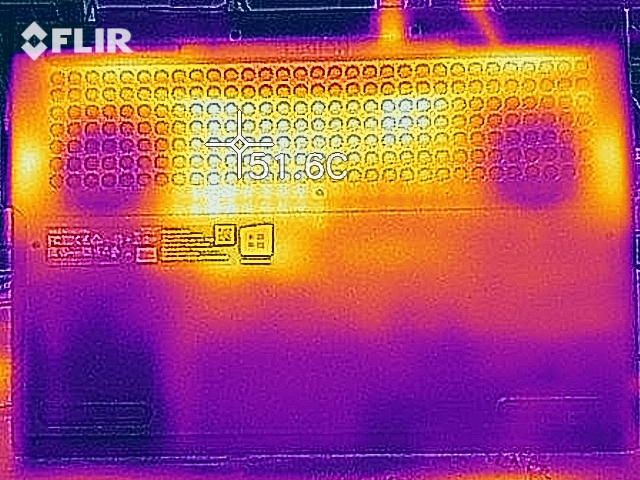
The Lenovo Legion does not heat up particularly. While we did measure temperatures above 40 °C (104 °F) in some areas during our stress test, the temperatures were a little lower during our Witcher 3 test and perfectly normal during everyday use.
(-) Üst taraftaki maksimum sıcaklık, 40.4 °C / 105 F ortalamasına kıyasla 46.3 °C / 115 F'dir. , Gaming sınıfı için 21.2 ile 68.8 °C arasında değişir.
(±) Alt kısım, 43.2 °C / 110 F ortalamasına kıyasla maksimum 44.4 °C / 112 F'ye kadar ısınır
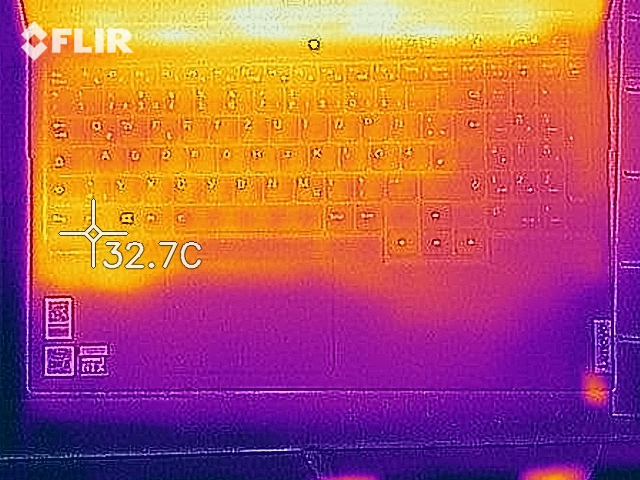
(+) Boşta kullanımda, üst tarafın ortalama sıcaklığı 26.6 °C / 80 F olup, cihazın 33.9 °C / 93 F.
(±) The Witcher 3 oynarken, üst tarafın ortalama sıcaklığı 34.6 °C / 94 F olup, cihazın 33.9 °C / 93 F.
(+) Avuç içi dayanakları ve dokunmatik yüzey, maksimum 27 °C / 80.6 F ile cilt sıcaklığından daha soğuktur ve bu nedenle dokunulduğunda soğuktur.
(±) Benzer cihazların avuç içi dayanağı alanının ortalama sıcaklığı 28.8 °C / 83.8 F (+1.8 °C / 3.2 F) idi.
| Lenovo Legion 5 15IMH05H i5-10300H, GeForce RTX 2060 Mobile | Asus TUF Gaming A15 FA506IV-HN172 R7 4800H, GeForce RTX 2060 Mobile | Dell G5 15 SE 5505 P89F R7 4800H, Radeon RX 5600M | MSI Alpha 15 A3DDK-034 R7 3750H, Radeon RX 5500M | Lenovo Legion Y540-15IRH i7-9750H, GeForce RTX 2060 Mobile | Ortalama NVIDIA GeForce RTX 2060 Mobile | Sınıf ortalaması Gaming | |
|---|---|---|---|---|---|---|---|
| Heat | 1% | -12% | 2% | -27% | -11% | -8% | |
| Maximum Upper Side * (°C) | 46.3 | 42.9 7% | 53 -14% | 44 5% | 47 -2% | 47.2 ? -2% | 45.1 ? 3% |
| Maximum Bottom * (°C) | 44.4 | 49.9 -12% | 57.6 -30% | 49 -10% | 60 -35% | 52.7 ? -19% | 48 ? -8% |
| Idle Upper Side * (°C) | 28.1 | 27.8 1% | 27.4 2% | 26 7% | 37 -32% | 31 ? -10% | 31.1 ? -11% |
| Idle Bottom * (°C) | 29.4 | 27 8% | 31 -5% | 28 5% | 41 -39% | 32.9 ? -12% | 34.2 ? -16% |
* ... daha küçük daha iyidir
Speakers
The stereo speakers are positioned towards the front at the bottom of the base unit. They produce a decent sound, although there is hardly any bass. The speakers don't reach a very high volume either.
Lenovo Legion 5 15IMH05H ses analizi
(-) | hoparlörler çok yüksek ses çıkarmıyor (65.2 dB)
Bas 100 - 315Hz
(-) | neredeyse hiç bas yok - ortalama olarak medyandan 15.8% daha düşük
(±) | Bas doğrusallığı ortalamadır (13.4% delta - önceki frekans)
Ortalar 400 - 2000 Hz
(+) | dengeli ortalar - medyandan yalnızca 3.9% uzakta
(+) | orta frekanslar doğrusaldır (3.4% deltadan önceki frekansa)
Yüksekler 2 - 16 kHz
(+) | dengeli yüksekler - medyandan yalnızca 2.2% uzakta
(+) | yüksekler doğrusaldır (6.5% deltadan önceki frekansa)
Toplam 100 - 16.000 Hz
(±) | Genel sesin doğrusallığı ortalamadır (19.1% ortancaya göre fark)
Aynı sınıfla karşılaştırıldığında
» Bu sınıftaki tüm test edilen cihazların %64%'si daha iyi, 7% benzer, 28% daha kötüydü
» En iyisinin deltası 6% idi, ortalama 18% idi, en kötüsü 132% idi
Test edilen tüm cihazlarla karşılaştırıldığında
» Test edilen tüm cihazların %46'si daha iyi, 7 benzer, % 47 daha kötüydü
» En iyisinin deltası 4% idi, ortalama 24% idi, en kötüsü 134% idi
Energy Management - The gaming notebook is very enduring
Power Consumption
We did not notice any particularly surprising consumption rates on the Lenovo notebook. We measured a maximum consumption of 8.7 Watt while idling and up to 195 Watt during our stress test. The power consumption was an average of 151 Watt (147 - 156 Watt) during our Witcher 3 test. The rated output of the power supply is 230 Watt.
| Kapalı / Bekleme modu | |
| Boşta | |
| Çalışırken |
|
Key:
min: | |
| Lenovo Legion 5 15IMH05H i5-10300H, GeForce RTX 2060 Mobile | Asus TUF Gaming A15 FA506IV-HN172 R7 4800H, GeForce RTX 2060 Mobile | Dell G5 15 SE 5505 P89F R7 4800H, Radeon RX 5600M | MSI Alpha 15 A3DDK-034 R7 3750H, Radeon RX 5500M | Lenovo Legion Y540-15IRH i7-9750H, GeForce RTX 2060 Mobile | Ortalama NVIDIA GeForce RTX 2060 Mobile | Sınıf ortalaması Gaming | |
|---|---|---|---|---|---|---|---|
| Power Consumption | -24% | -26% | -114% | -132% | -113% | -136% | |
| Idle Minimum * (Watt) | 3.2 | 5.4 -69% | 6.5 -103% | 14 -338% | 15 -369% | 11.5 ? -259% | 13.1 ? -309% |
| Idle Average * (Watt) | 8.3 | 10 -20% | 10.6 -28% | 18 -117% | 20 -141% | 16.5 ? -99% | 18.8 ? -127% |
| Idle Maximum * (Watt) | 8.7 | 10.5 -21% | 11 -26% | 32 -268% | 33 -279% | 23.7 ? -172% | 24.4 ? -180% |
| Load Average * (Watt) | 82 | 135 -65% | 84.1 -3% | 64 22% | 88 -7% | 107.5 ? -31% | 108.5 ? -32% |
| Witcher 3 ultra * (Watt) | 151 | 144 5% | 152.9 -1% | 123 19% | 128 15% | ||
| Load Maximum * (Watt) | 195 | 147 25% | 180.4 7% | 193 1% | 213 -9% | 199.7 ? -2% | 254 ? -30% |
* ... daha küçük daha iyidir
Battery Life
The gaming notebook manages a battery life of 7:12 h during our practical Wi-Fi test (browsing the web via a script, energy profile set to balanced). It lasts even longer during our video test (energy profile set to balanced), which it displays for 9:14 h before turning off. This test involves running the short film Big Buck Bunny (H.264 encoding, 1920x1080 pixels) in a loop. Power saving was deactivated and display brightness set to around 150 cd/m² for both of these tests. We also turned off the wireless modules for the video test.
| Lenovo Legion 5 15IMH05H i5-10300H, GeForce RTX 2060 Mobile, 60 Wh | Asus TUF Gaming A15 FA506IV-HN172 R7 4800H, GeForce RTX 2060 Mobile, 48 Wh | Dell G5 15 SE 5505 P89F R7 4800H, Radeon RX 5600M, 51 Wh | MSI Alpha 15 A3DDK-034 R7 3750H, Radeon RX 5500M, 51 Wh | Lenovo Legion Y540-15IRH i7-9750H, GeForce RTX 2060 Mobile, 57 Wh | Acer Nitro 5 AN517-52-77DS i7-10750H, GeForce RTX 2060 Mobile, 57.48 Wh | Sınıf ortalaması Gaming | |
|---|---|---|---|---|---|---|---|
| Pil Çalışma Süresi | -12% | -9% | -51% | -50% | -2% | -12% | |
| Reader / Idle (h) | 14.1 | 9.8 -30% | 11.2 -21% | 5.8 -59% | 3.9 -72% | 11 -22% | 8.71 ? -38% |
| H.264 (h) | 9.2 | 5.4 -41% | 3.9 -58% | 7.3 -21% | 8.26 ? -10% | ||
| WiFi v1.3 (h) | 7.2 | 6.2 -14% | 6.2 -14% | 4.1 -43% | 3.2 -56% | 6.6 -8% | 6.98 ? -3% |
| Load (h) | 1.4 | 1.9 36% | 1.5 7% | 0.8 -43% | 1.1 -21% | 2 43% | 1.47 ? 5% |
Artılar
Eksiler
Verdict
The Lenovo Legion 5 with its combination of a Core-i5-10300H processor with a GeForce-RTX-2060 graphics chip display all current computer games smoothly onto its 120-Hz display. Most games can be played in Full-HD resolution and high to maximum quality settings. The CPU and GPU also manage to keep up their high clock rates over a long time.
The Legion 5 allows users to activate and deactivate the integrated GPU.
The integrated UHD Graphics 630 can be activated and deactivated with the click of a button. Battery life is very good when the iGPU is activated, but doesn't last quite as long if the demanding GeForce RTX 2060 is at work.
Should the storage in the 512-GB SSD run out, users can expand the device either with a 2.5-inch drive or a second NVMe SSD (M.2 2280). Inserting the storage device requires opening the device, which doesn't have a maintenance hatch.
The Full-HD IPS display offers stable viewing angles, a matte surface, acceptable response times, a good contrast ratio and decent colors. The maximum brightness and color space coverage are too low, however. We expect more from a $1250 notebook.
The port selection is good for the most part, although we do miss a Thunderbolt 3 port. This would enable users to connect external GPUs, for example. The Legion only has one Type C USB 3.2 Gen 1 port which supports DisplayPort via USB C.
Lenovo Legion 5 15IMH05H
- 07/08/2020 v7 (old)
Sascha Mölck
Price comparison

