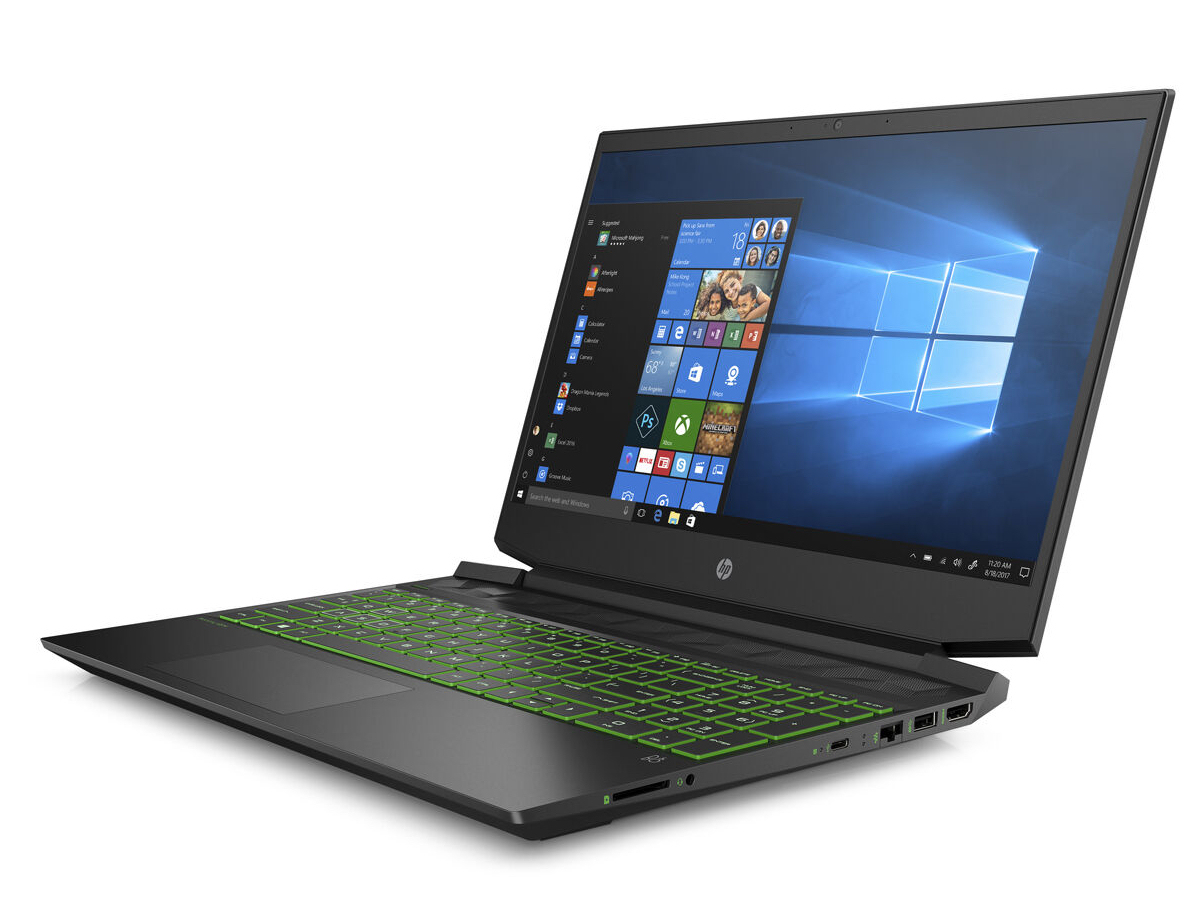
HP Pavilion Gaming 15 incelemede: Kaputun altında çok fazla güce sahip ucuz oyun dizüstü bilgisayarı

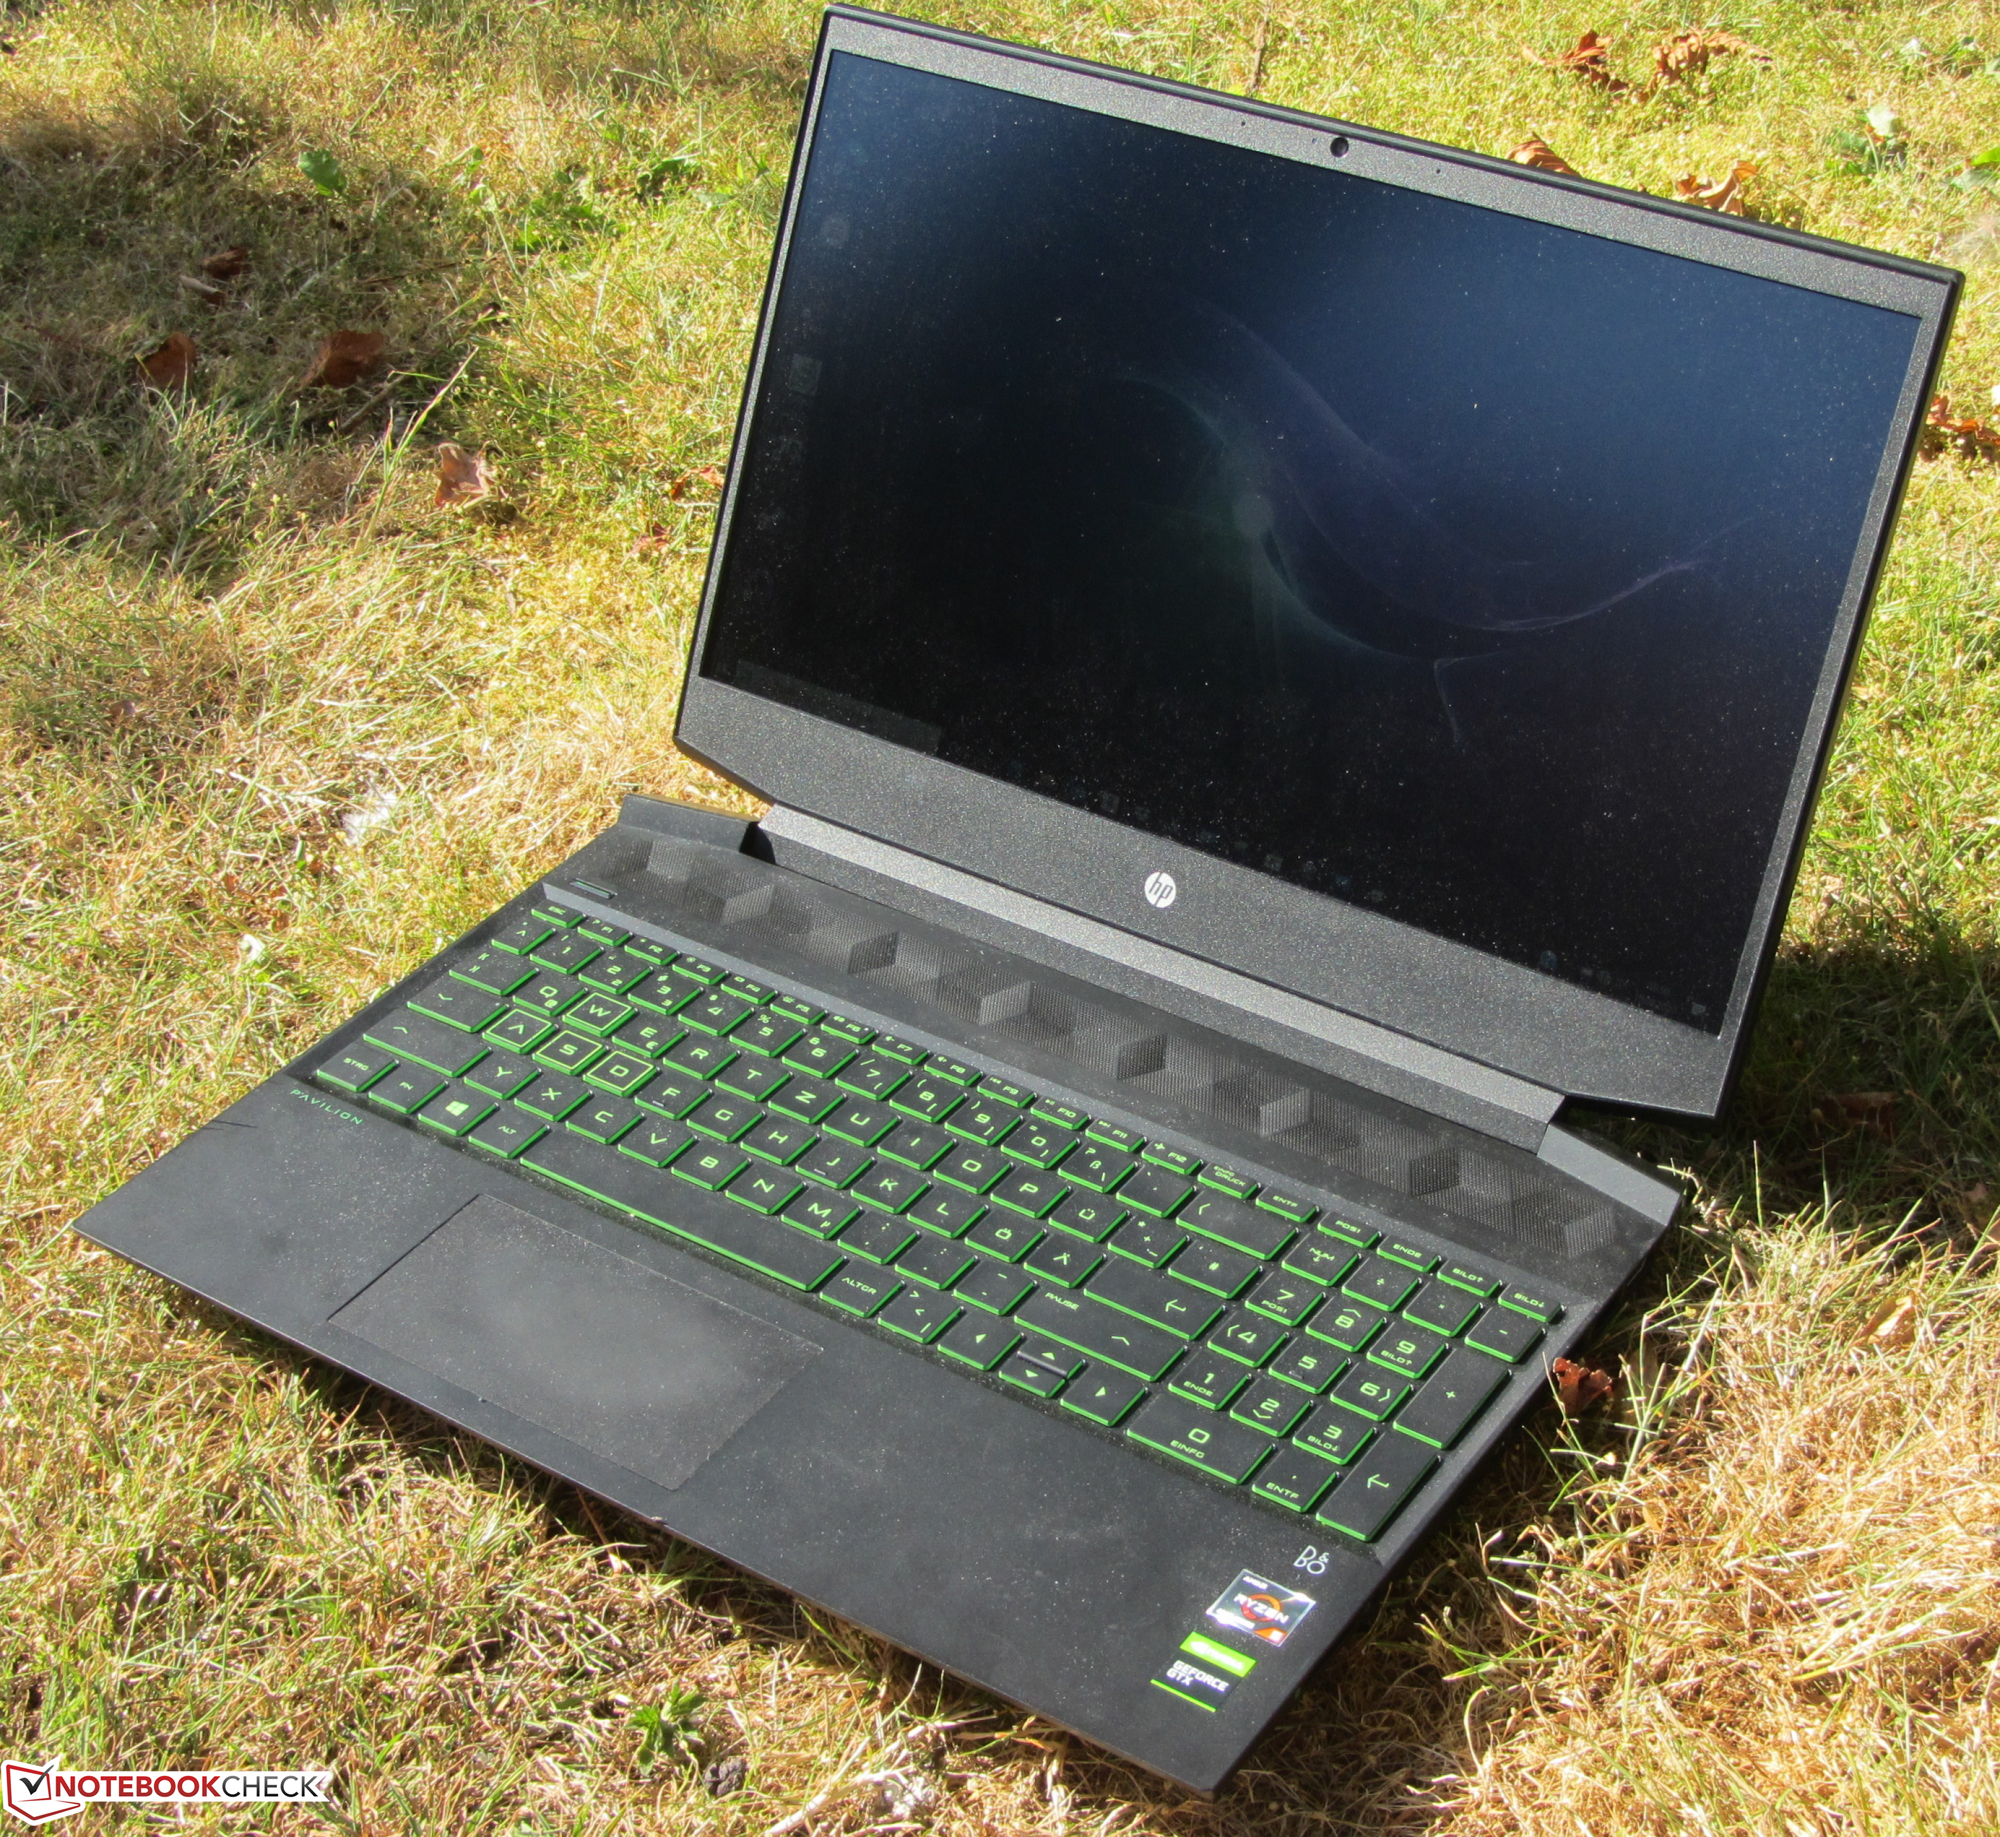
Pavilion Gaming 15 serisi, iyi bir fiyat-performans oranı sunan 15,6 inç oyun dizüstü bilgisayarlarını temsil ediyor. Serideki üç güncel EC modelini daha önce inceledik. Serinin en güçlü ve pahalı (yaklaşık 1.200 Euro (~ 1.407 $)) temsilcilerinden biri olan Pavilion Gaming 15-ec1177ng şimdi elimizde. Yerleşik bir Ryzen 7 4800H APU ve bir GeForce GTX 1660 Ti Max-Q grafik çekirdeği var. Rakipler arasında Dell G3 15 3500, Acer Nitro 5 AN515-44, Asus TUF A15 FA506I ve Lenovo IdeaPad Gaming 3i 15IMH05 gibi cihazlar yer alıyor. durum, bağlantı, giriş cihazları ve hoparlörler. İlgili bilgiler, HP Pavilion Gaming 15-ec0002ng incelemesinde bulunabilir.
Derecelendirme | Tarih | Modeli | Ağırlık | Yükseklik | Boyut | Çözünürlük | Fiyat |
|---|---|---|---|---|---|---|---|
| 81.1 % v7 (old) | 11/2020 | HP Pavilion Gaming 15-ec1177ng R7 4800H, GeForce GTX 1660 Ti Max-Q | 2 kg | 23.5 mm | 15.60" | 1920x1080 | |
| 81.6 % v7 (old) | 05/2023 | Dell G3 15 3500-G4DG2 i7-10750H, GeForce RTX 2060 Mobile | 2.3 kg | 22 mm | 15.60" | 1920x1080 | |
| 79.8 % v7 (old) | 07/2020 | Acer Nitro 5 AN515-44-R5FT R5 4600H, GeForce GTX 1650 Ti Mobile | 2.2 kg | 24 mm | 15.60" | 1920x1080 | |
| 82.7 % v7 (old) | Asus TUF Gaming A15 FA506IV-HN172 R7 4800H, GeForce RTX 2060 Mobile | 2.2 kg | 24.9 mm | 15.60" | 1920x1080 | ||
| 78.4 % v7 (old) | 08/2020 | Lenovo IdeaPad Gaming 3i 15IMH05 i5-10300H, GeForce GTX 1650 Mobile | 2.2 kg | 24.9 mm | 15.60" | 1920x1080 |
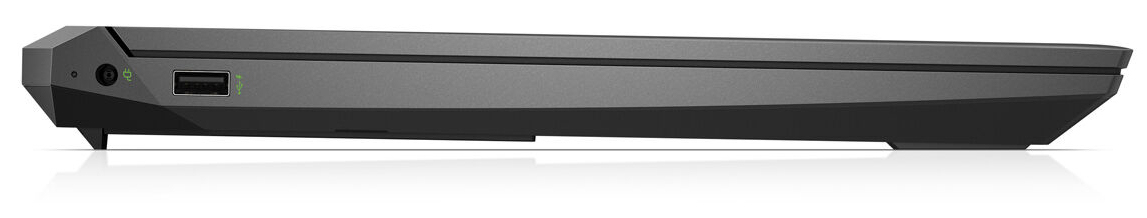
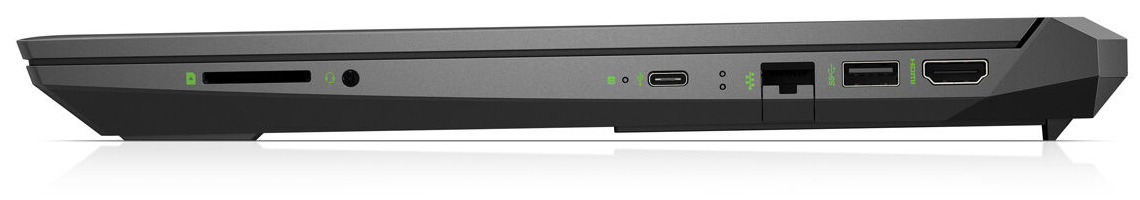
Bağlantı noktası yapılandırması
| SD Card Reader | |
| average JPG Copy Test (av. of 3 runs) | |
| Sınıf ortalaması Gaming (20.9 - 210, n=55, son 2 yıl) | |
| HP Pavilion Gaming 15-ec1206ng (Toshiba Exceria Pro SDXC 64 GB UHS-II) | |
| HP Pavilion Gaming 15-ec1177ng (Toshiba Exceria Pro SDXC 64 GB UHS-II) | |
| HP Pavilion Gaming 15-ec0017ng (Toshiba Exceria Pro SDXC 64 GB UHS-II) | |
| HP Pavilion Gaming 15-ec0002ng (Toshiba Exceria Pro SDXC 64 GB UHS-II) | |
| Dell G3 15 3500-G4DG2 (Toshiba Exceria Pro SDXC 64 GB UHS-II) | |
| maximum AS SSD Seq Read Test (1GB) | |
| Sınıf ortalaması Gaming (25.5 - 261, n=52, son 2 yıl) | |
| HP Pavilion Gaming 15-ec0017ng (Toshiba Exceria Pro SDXC 64 GB UHS-II) | |
| HP Pavilion Gaming 15-ec0002ng (Toshiba Exceria Pro SDXC 64 GB UHS-II) | |
| HP Pavilion Gaming 15-ec1177ng (Toshiba Exceria Pro SDXC 64 GB UHS-II) | |
| HP Pavilion Gaming 15-ec1206ng (Toshiba Exceria Pro SDXC 64 GB UHS-II) | |
| Dell G3 15 3500-G4DG2 (Toshiba Exceria Pro SDXC 64 GB UHS-II) | |
| Networking | |
| iperf3 transmit AX12 | |
| Asus ROG Strix G15 G512LI | |
| Acer Nitro 5 AN515-44-R5FT | |
| Dell G3 15 3500-G4DG2 | |
| Asus TUF Gaming A15 FA506IV-HN172 | |
| HP Pavilion Gaming 15-ec1177ng | |
| HP Pavilion Gaming 15-ec0017ng | |
| HP Pavilion Gaming 15-ec0002ng | |
| HP Pavilion Gaming 15-ec1206ng | |
| Lenovo IdeaPad Gaming 3i 15IMH05 | |
| Ortalama Realtek 8822CE Wireless LAN 802.11ac PCI-E NIC (87 - 690, n=29) | |
| iperf3 receive AX12 | |
| Dell G3 15 3500-G4DG2 | |
| Acer Nitro 5 AN515-44-R5FT | |
| Asus ROG Strix G15 G512LI | |
| HP Pavilion Gaming 15-ec1206ng | |
| Lenovo IdeaPad Gaming 3i 15IMH05 | |
| HP Pavilion Gaming 15-ec1177ng | |
| HP Pavilion Gaming 15-ec0002ng | |
| Asus TUF Gaming A15 FA506IV-HN172 | |
| Ortalama Realtek 8822CE Wireless LAN 802.11ac PCI-E NIC (486 - 685, n=29) | |
| HP Pavilion Gaming 15-ec0017ng | |


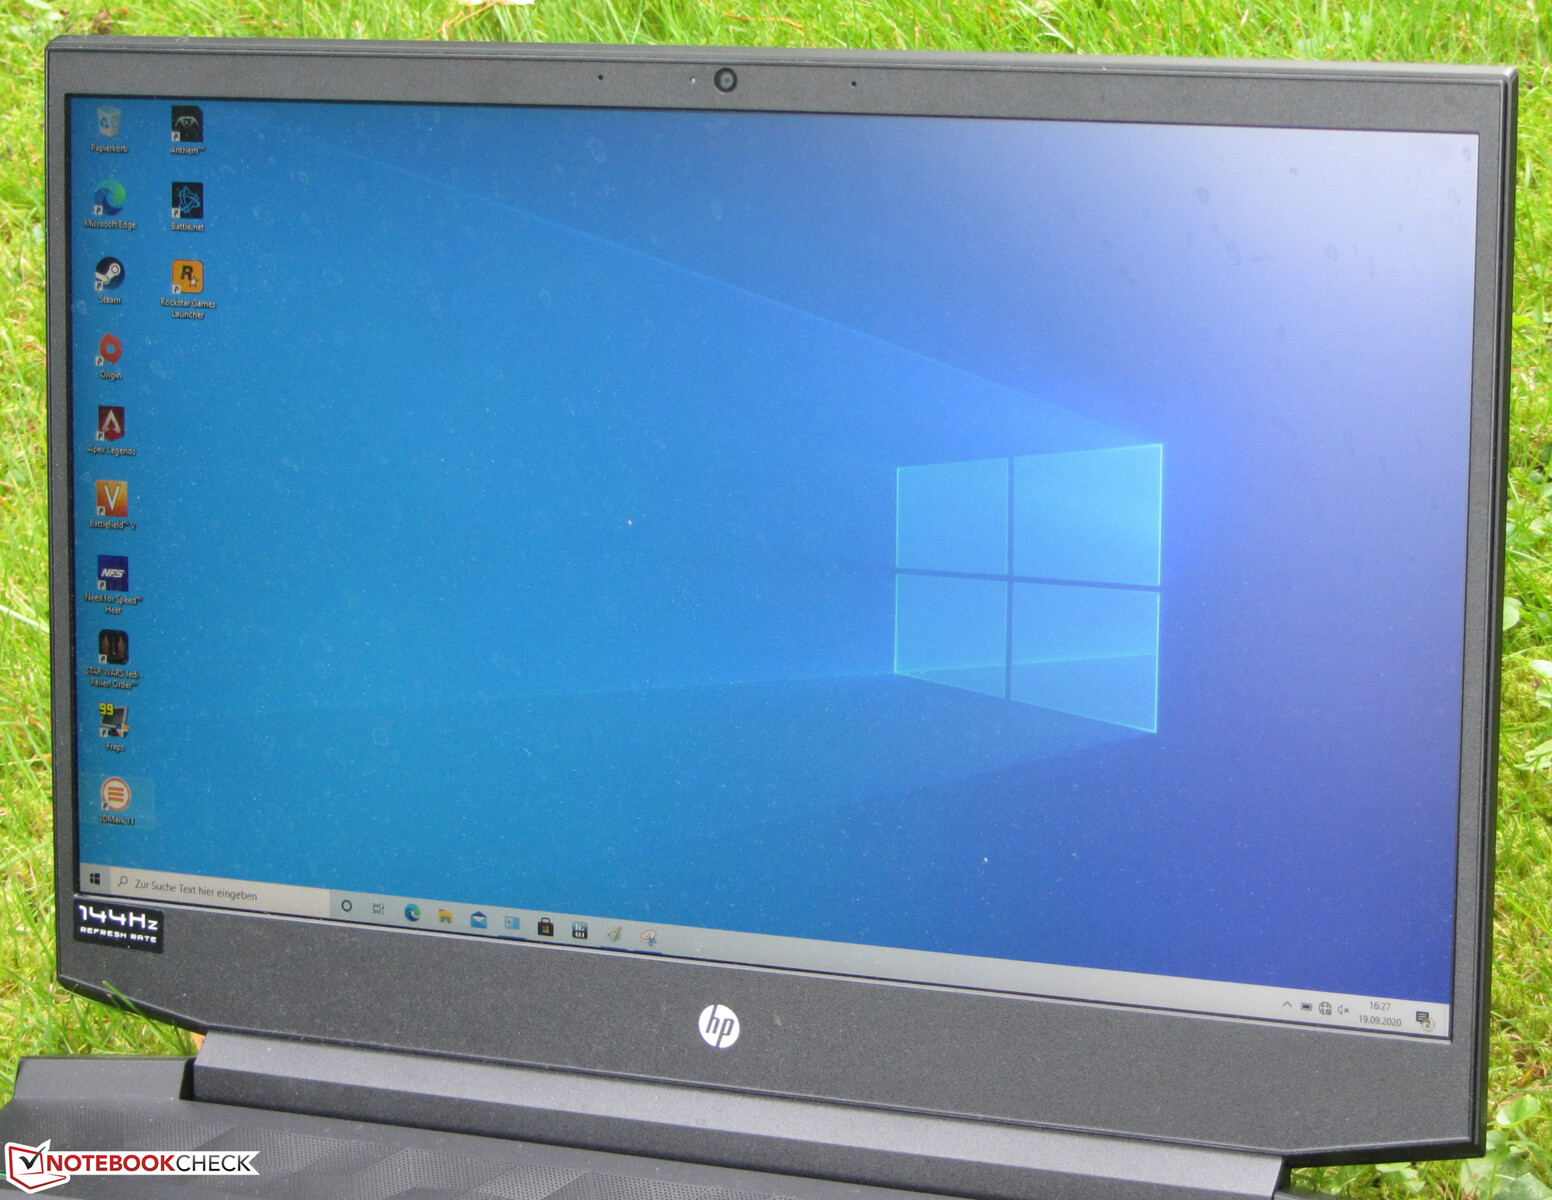
Ekran - Parlak, yüksek kontrastlı, duyarlı

15,6 inç mat ekranın (1920x1080 piksel) parlaklığı (327,1 cd / m²) ve kontrastı (1,962: 1) sevindiricidir. Ayrıca 144 Hz panel, hızlı yanıt süreleri sağlar. Olumlu: Herhangi bir PWM titremesini tespit edemedik.
| |||||||||||||||||||||||||
Aydınlatma: 84 %
Batarya modunda parlaklık: 365 cd/m²
Kontrast: 1962:1 (Siyah: 0.185 cd/m²)
ΔE ColorChecker Calman: 2.69 | ∀{0.5-29.43 Ø4.73}
calibrated: 1.7
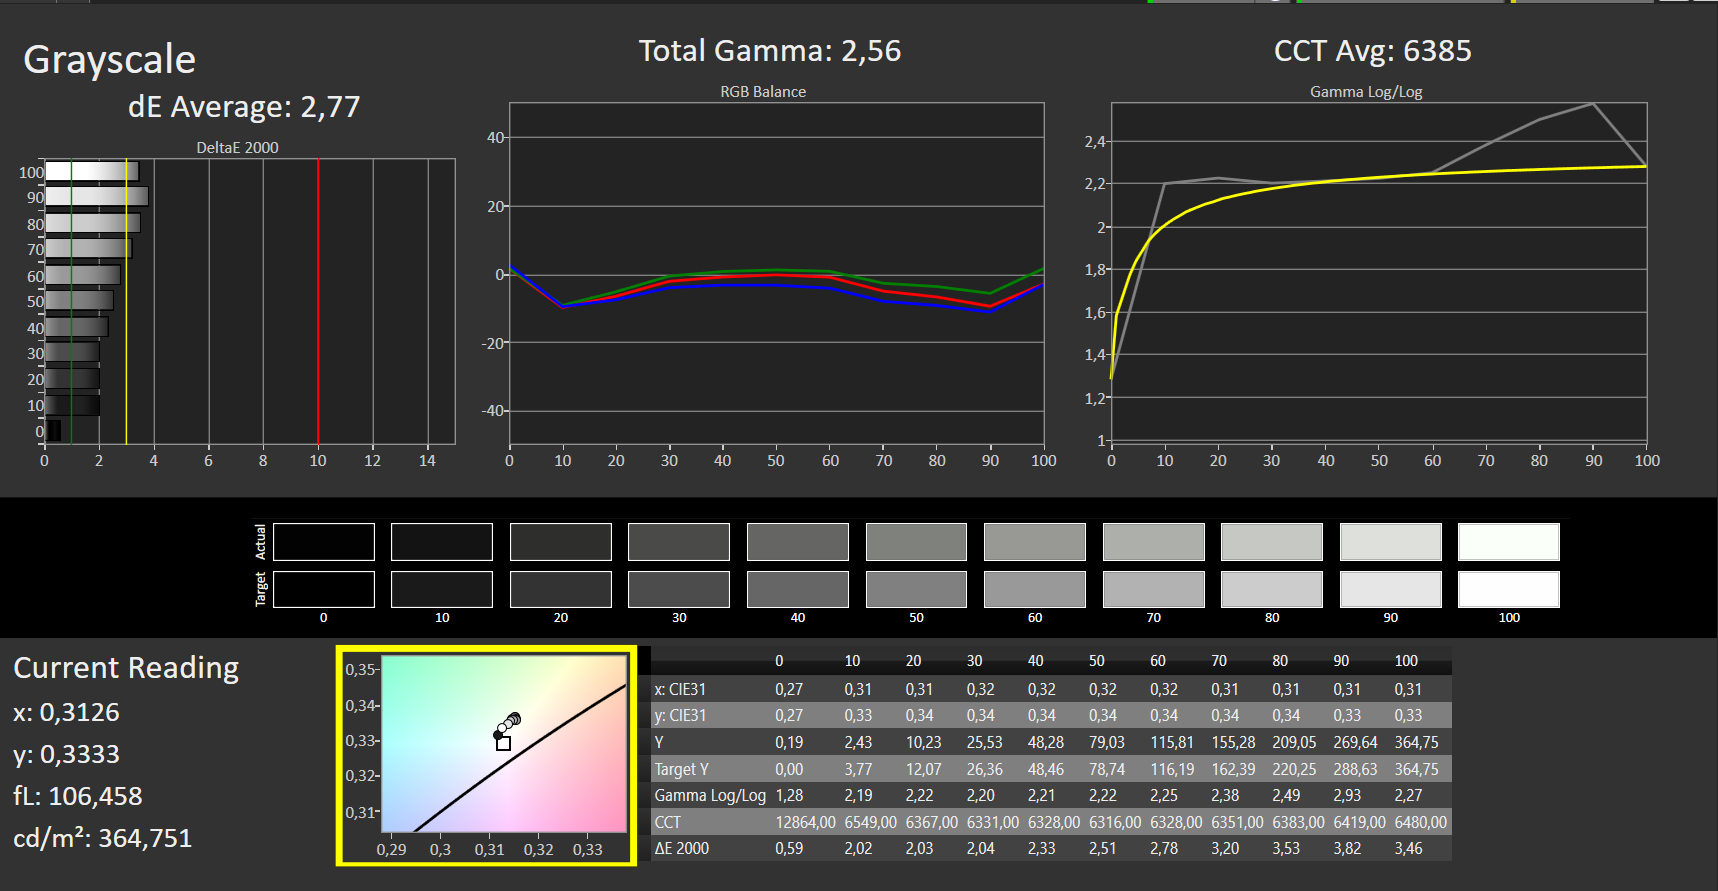
ΔE Greyscale Calman: 2.77 | ∀{0.09-98 Ø4.97}
92.8% sRGB (Argyll 1.6.3 3D)
60.3% AdobeRGB 1998 (Argyll 1.6.3 3D)
65.9% AdobeRGB 1998 (Argyll 3D)
93.1% sRGB (Argyll 3D)
64.9% Display P3 (Argyll 3D)
Gamma: 2.56
CCT: 6385 K
| HP Pavilion Gaming 15-ec1177ng LG Philips LP156WFG-SPK1, IPS, 1920x1080, 15.6" | Dell G3 15 3500-G4DG2 AU Optronics AUO80ED, IPS, 1920x1080, 15.6" | Acer Nitro 5 AN515-44-R5FT Panda LM156LF-2F01 (NCP004D), IPS, 1920x1080, 15.6" | Asus TUF Gaming A15 FA506IV-HN172 LM156LF-2F01, IPS, 1920x1080, 15.6" | Lenovo IdeaPad Gaming 3i 15IMH05 BOE CQ NV156FHM-NX1, IPS, 1920x1080, 15.6" | Asus ROG Strix G15 G512LI Panda LM156LF-2F01, IPS, 1920x1080, 15.6" | HP Pavilion Gaming 15-ec1206ng Chi Mei CMN150D, IPS, 1920x1080, 15.6" | HP Pavilion Gaming 15-ec0002ng Chi Mei N156HGA-EA3, TN LED, 1920x1080, 15.6" | HP Pavilion Gaming 15-ec0017ng AU Optronics B156HAK02.0, IPS, 1920x1080, 15.6" | |
|---|---|---|---|---|---|---|---|---|---|
| Display | 1% | -35% | -39% | -40% | -38% | -35% | -35% | -3% | |
| Display P3 Coverage (%) | 64.9 | 64.6 0% | 41.16 -37% | 38.92 -40% | 38.04 -41% | 39.73 -39% | 41.36 -36% | 41.22 -36% | 62.8 -3% |
| sRGB Coverage (%) | 93.1 | 93.9 1% | 61.8 -34% | 58.5 -37% | 56.6 -39% | 59.8 -36% | 62 -33% | 61.8 -34% | 89.2 -4% |
| AdobeRGB 1998 Coverage (%) | 65.9 | 66.4 1% | 42.56 -35% | 40.22 -39% | 39.3 -40% | 41.06 -38% | 42.76 -35% | 42.62 -35% | 63.8 -3% |
| Response Times | 20% | -164% | -116% | -56% | -131% | -107% | -106% | -157% | |
| Response Time Grey 50% / Grey 80% * (ms) | 16 ? | 14 ? 12% | 40.8 ? -155% | 34 ? -113% | 25 ? -56% | 33.6 ? -110% | 33.6 ? -110% | 44 ? -175% | 40 ? -150% |
| Response Time Black / White * (ms) | 11 ? | 8 ? 27% | 30 ? -173% | 24 ? -118% | 17 ? -55% | 27.6 ? -151% | 22.4 ? -104% | 15 ? -36% | 29 ? -164% |
| PWM Frequency (Hz) | 24750 ? | 250 ? | |||||||
| Screen | -28% | -55% | -66% | -89% | -79% | -23% | -107% | -33% | |
| Brightness middle (cd/m²) | 363 | 301 -17% | 287 -21% | 280 -23% | 305 -16% | 271.2 -25% | 277 -24% | 233 -36% | 302 -17% |
| Brightness (cd/m²) | 327 | 298 -9% | 271 -17% | 254 -22% | 294 -10% | 252 -23% | 248 -24% | 211 -35% | 291 -11% |
| Brightness Distribution (%) | 84 | 81 -4% | 88 5% | 88 5% | 70 -17% | 79 -6% | 83 -1% | 82 -2% | 84 0% |
| Black Level * (cd/m²) | 0.185 | 0.23 -24% | 0.25 -35% | 0.15 19% | 0.405 -119% | 0.53 -186% | 0.16 14% | 0.405 -119% | 0.25 -35% |
| Contrast (:1) | 1962 | 1309 -33% | 1148 -41% | 1867 -5% | 753 -62% | 512 -74% | 1731 -12% | 575 -71% | 1208 -38% |
| Colorchecker dE 2000 * | 2.69 | 4.68 -74% | 4.77 -77% | 5.89 -119% | 6.01 -123% | 5.04 -87% | 3.6 -34% | 8.22 -206% | 4.84 -80% |
| Colorchecker dE 2000 max. * | 5.06 | 17.15 -239% | 19 -275% | 21.9 -333% | 16.07 -218% | 8.53 -69% | 18.6 -268% | 8.18 -62% | |
| Colorchecker dE 2000 calibrated * | 1.7 | 1.87 -10% | 3.73 -119% | 4.79 -182% | 5.12 -201% | 4.26 -151% | 2.88 -69% | 2.63 -55% | |
| Greyscale dE 2000 * | 2.77 | 5.79 -109% | 2.7 3% | 4.08 -47% | 3.23 -17% | 3.4 -23% | 1.75 37% | 10.13 -266% | 4.31 -56% |
| Gamma | 2.56 86% | 2.46 89% | 2.115 104% | 2.33 94% | 2.43 91% | 2.09 105% | 2.23 99% | 2.27 97% | 2.56 86% |
| CCT | 6385 102% | 7706 84% | 7187 90% | 7303 89% | 6818 95% | 7079 92% | 6695 97% | 11323 57% | 7318 89% |
| Color Space (Percent of AdobeRGB 1998) (%) | 60.3 | 61 1% | 43 -29% | 37 -39% | 36 -40% | 37.8 -37% | 39 -35% | 39 -35% | 58 -4% |
| Color Space (Percent of sRGB) (%) | 92.8 | 94 1% | 61 -34% | 58 -37% | 56 -40% | 59.5 -36% | 62 -33% | 62 -33% | 89 -4% |
| Toplam Ortalama (Program / Ayarlar) | -2% /
-16% | -85% /
-65% | -74% /
-67% | -62% /
-76% | -83% /
-78% | -55% /
-36% | -83% /
-92% | -64% /
-43% |
* ... daha küçük daha iyidir
Yanıt Sürelerini Görüntüle
| ↔ Tepki Süresi Siyahtan Beyaza | ||
|---|---|---|
| 11 ms ... yükseliş ↗ ve sonbahar↘ birleşimi | ↗ 7 ms yükseliş | 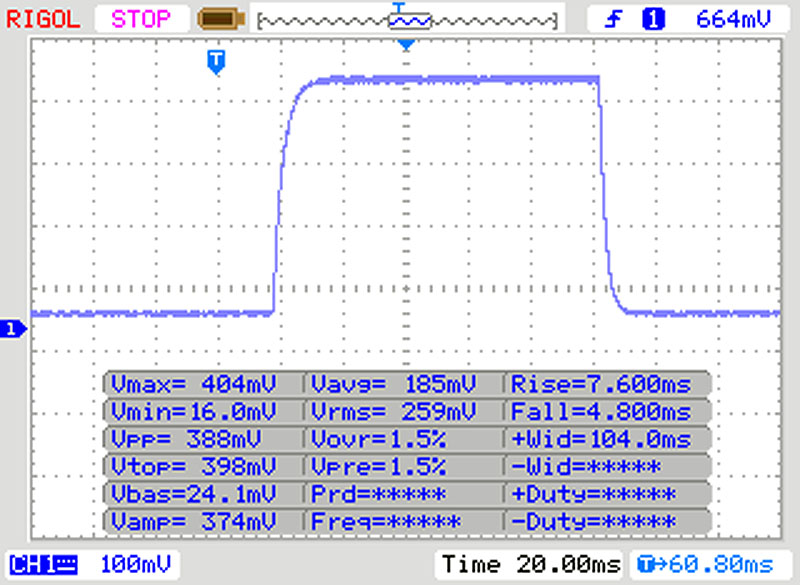 |
| ↘ 4 ms sonbahar | ||
| Ekran, testlerimizde iyi yanıt oranları gösteriyor ancak rekabetçi oyuncular için çok yavaş olabilir. Karşılaştırıldığında, test edilen tüm cihazlar 0.1 (minimum) ile 240 (maksimum) ms arasında değişir. » Tüm cihazların 29 %'si daha iyi. Bu, ölçülen yanıt süresinin test edilen tüm cihazların ortalamasından (19.9 ms) daha iyi olduğu anlamına gelir. | ||
| ↔ Tepki Süresi %50 Griden %80 Griye | ||
| 16 ms ... yükseliş ↗ ve sonbahar↘ birleşimi | ↗ 9 ms yükseliş | 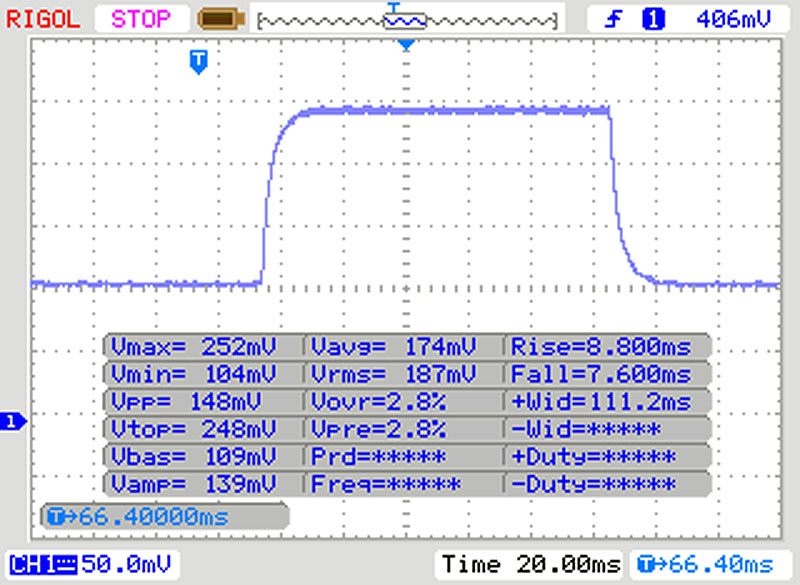 |
| ↘ 7 ms sonbahar | ||
| Ekran, testlerimizde iyi yanıt oranları gösteriyor ancak rekabetçi oyuncular için çok yavaş olabilir. Karşılaştırıldığında, test edilen tüm cihazlar 0.165 (minimum) ile 636 (maksimum) ms arasında değişir. » Tüm cihazların 30 %'si daha iyi. Bu, ölçülen yanıt süresinin test edilen tüm cihazların ortalamasından (31.1 ms) daha iyi olduğu anlamına gelir. | ||
Ekran Titremesi / PWM (Darbe Genişliği Modülasyonu)
| Ekran titriyor / PWM algılanmadı | 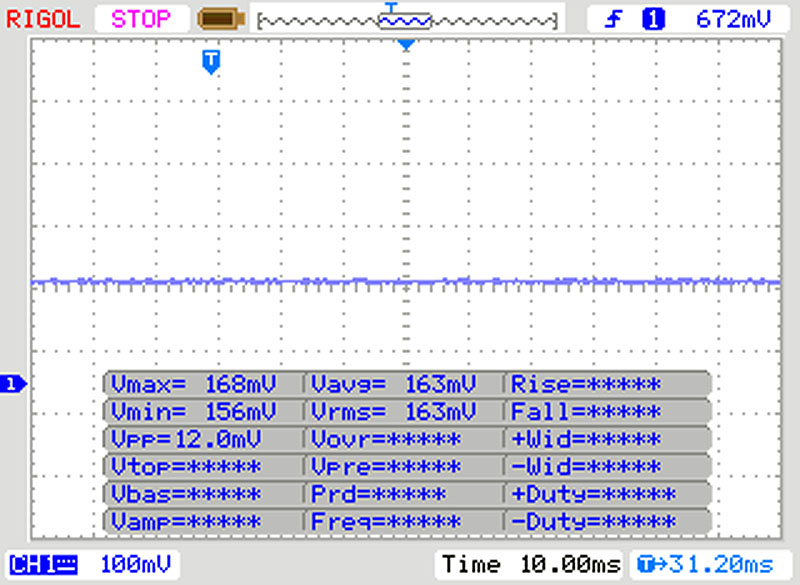 | ||
Karşılaştırıldığında: Test edilen tüm cihazların %52 %'si ekranı karartmak için PWM kullanmıyor. PWM tespit edilirse, ortalama 7798 (minimum: 5 - maksimum: 343500) Hz ölçüldü. | |||
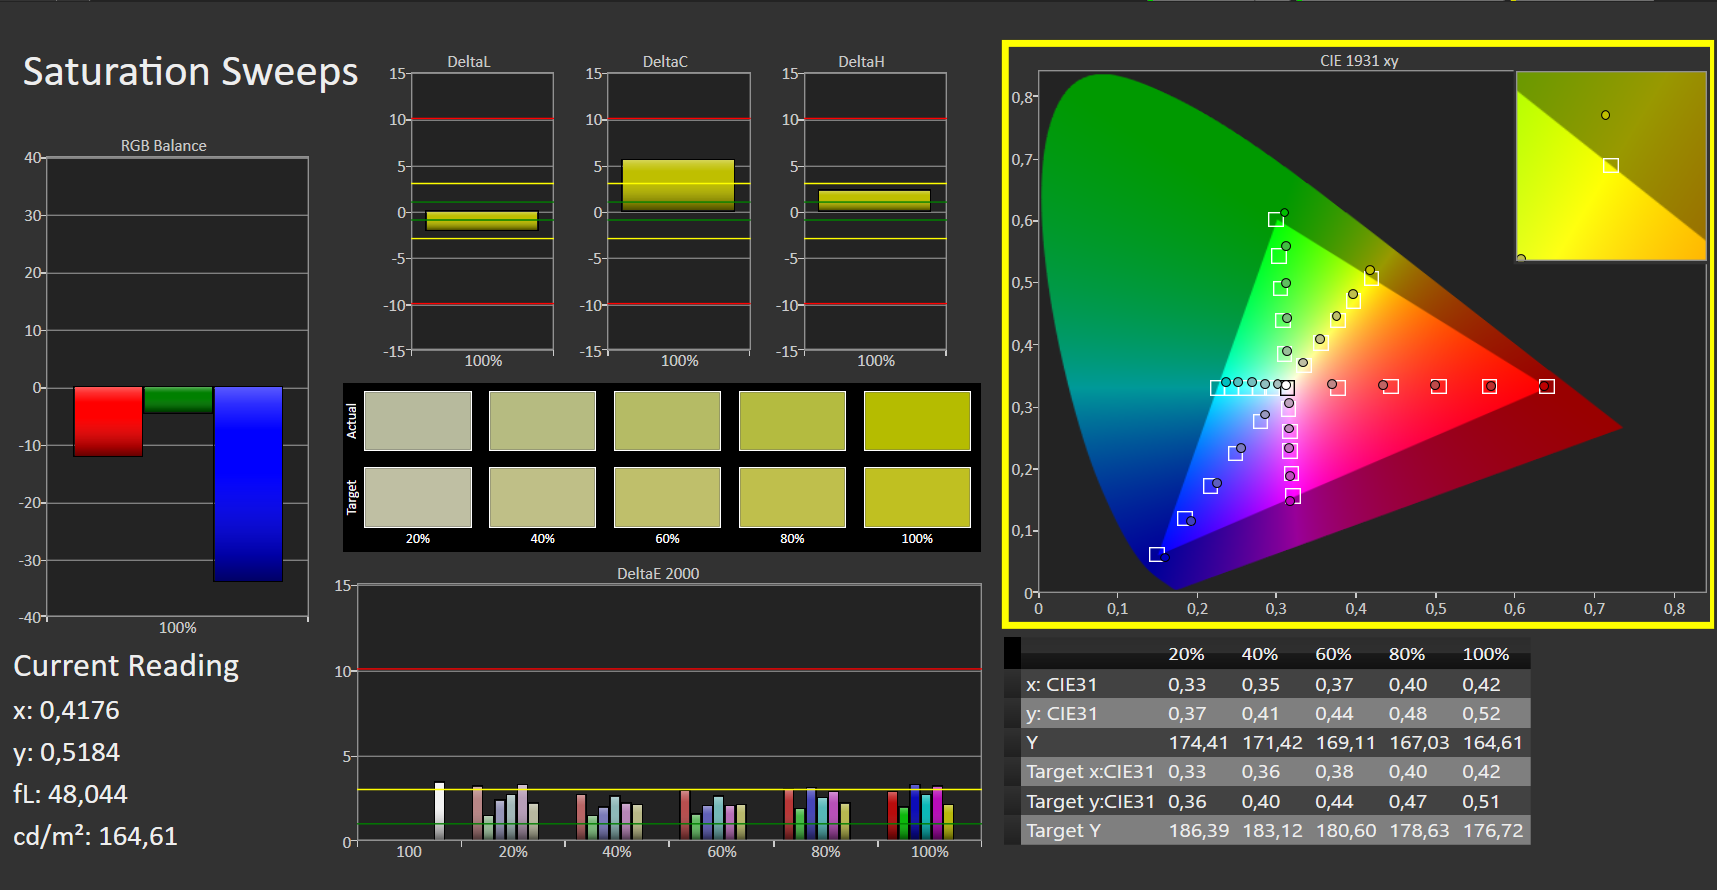
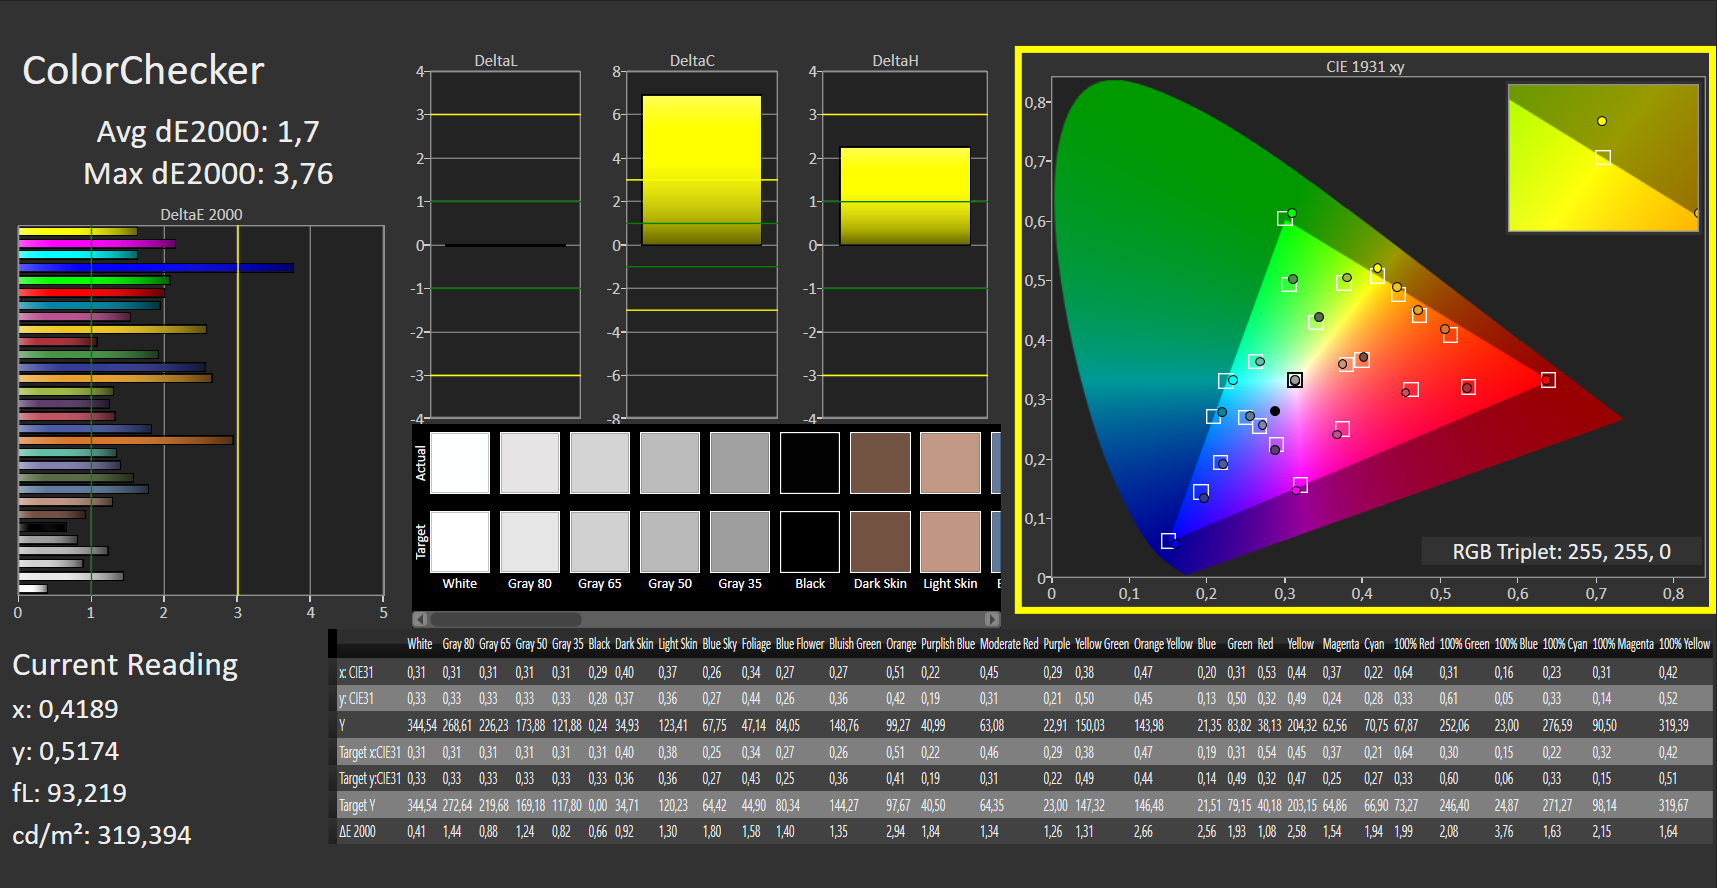
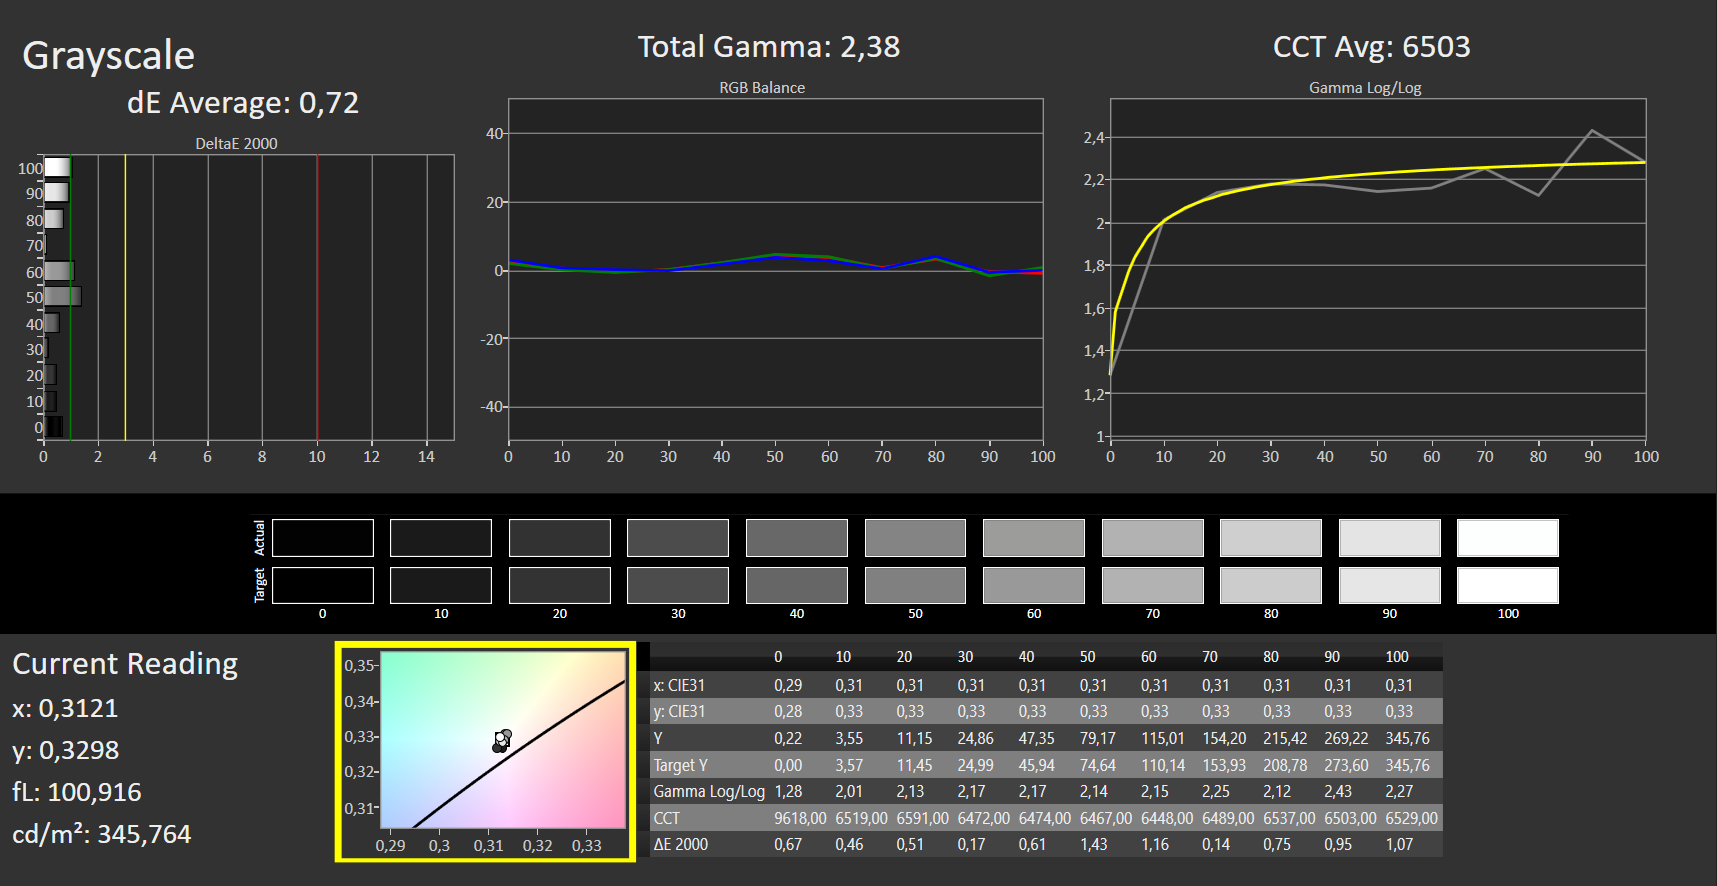
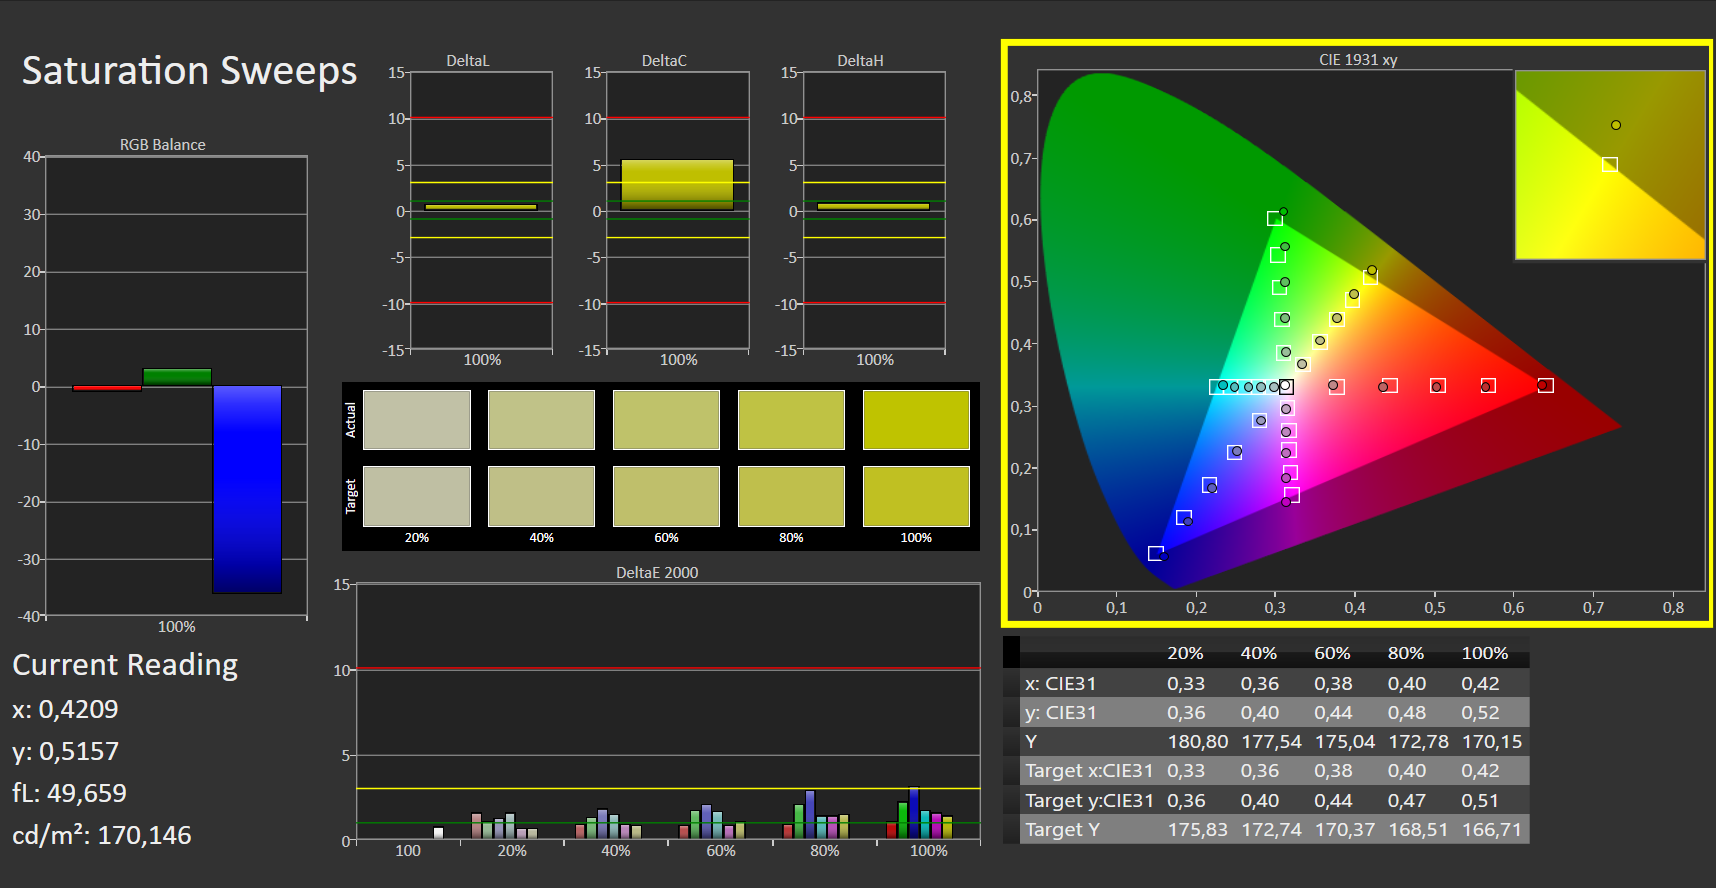
Ekran zaten kutudan çıkar çıkmaz iyi bir renk üretimi gösteriyor. 2,7'nin hemen altındaki Delta E 2000 renk sapması ile hedef (Delta E 3'ten küçük) karşılanır. Ekranda mavi renk yok. Ayrıca, kalibrasyon iyileştirmeler sağlar. Bu sayede renk sapması 1.7'ye düşürülür ve gri tonlamalar daha dengeli bir şekilde görüntülenir. AdobeRGB (% 60,3) ve sRGB (% 92,8) renk uzayları tam olarak yeniden üretilmiyor.
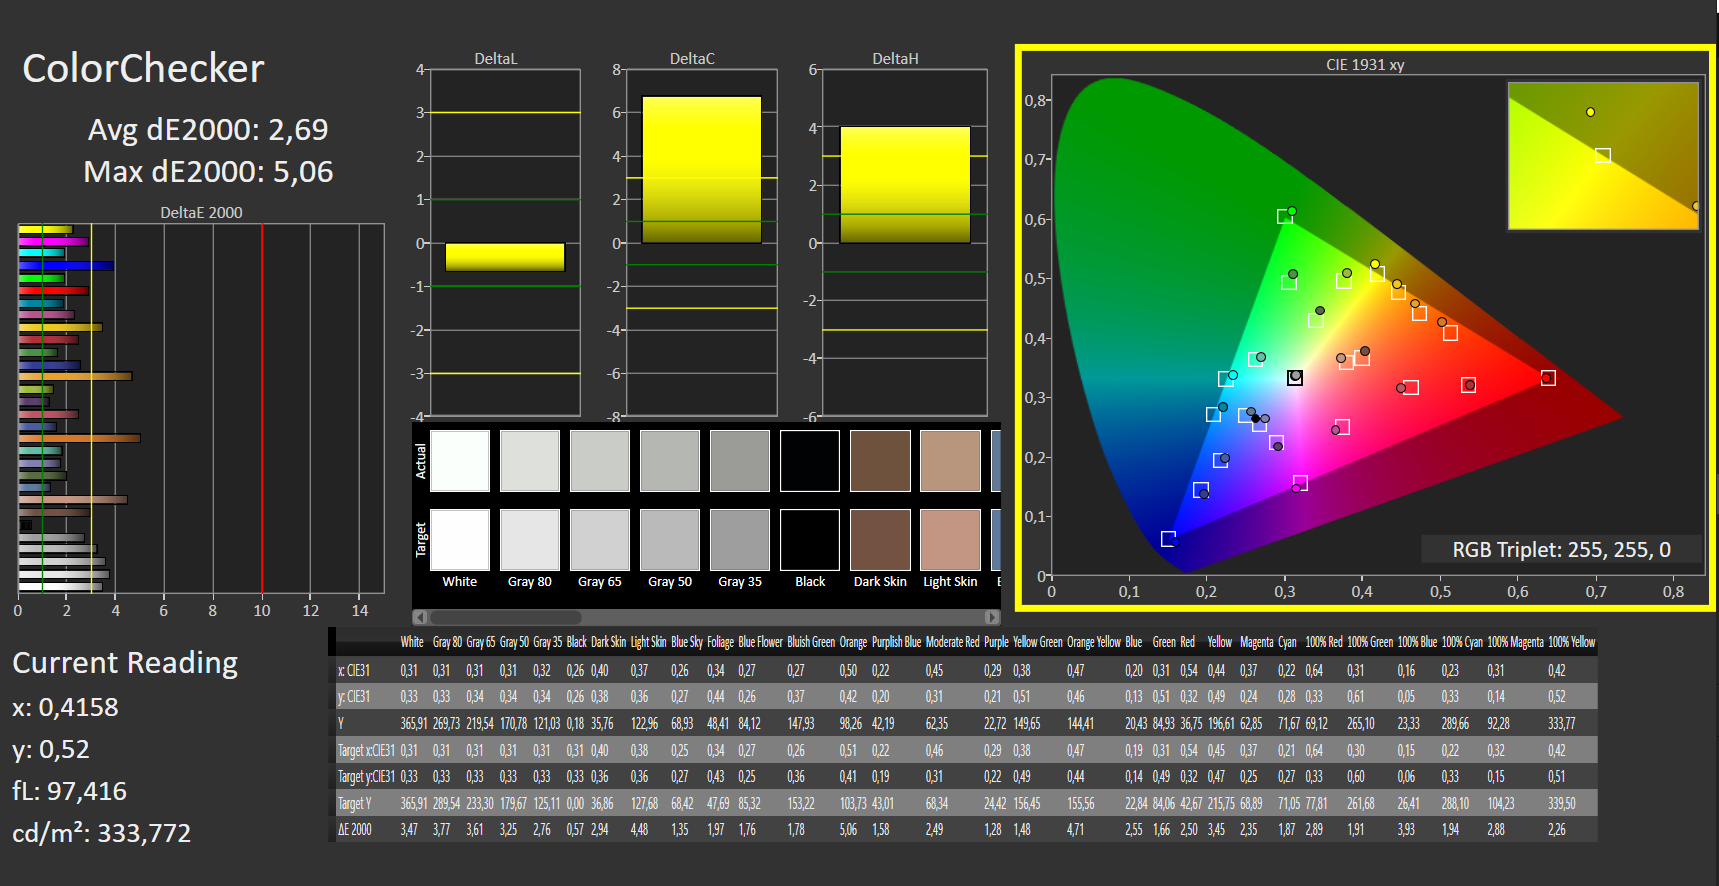
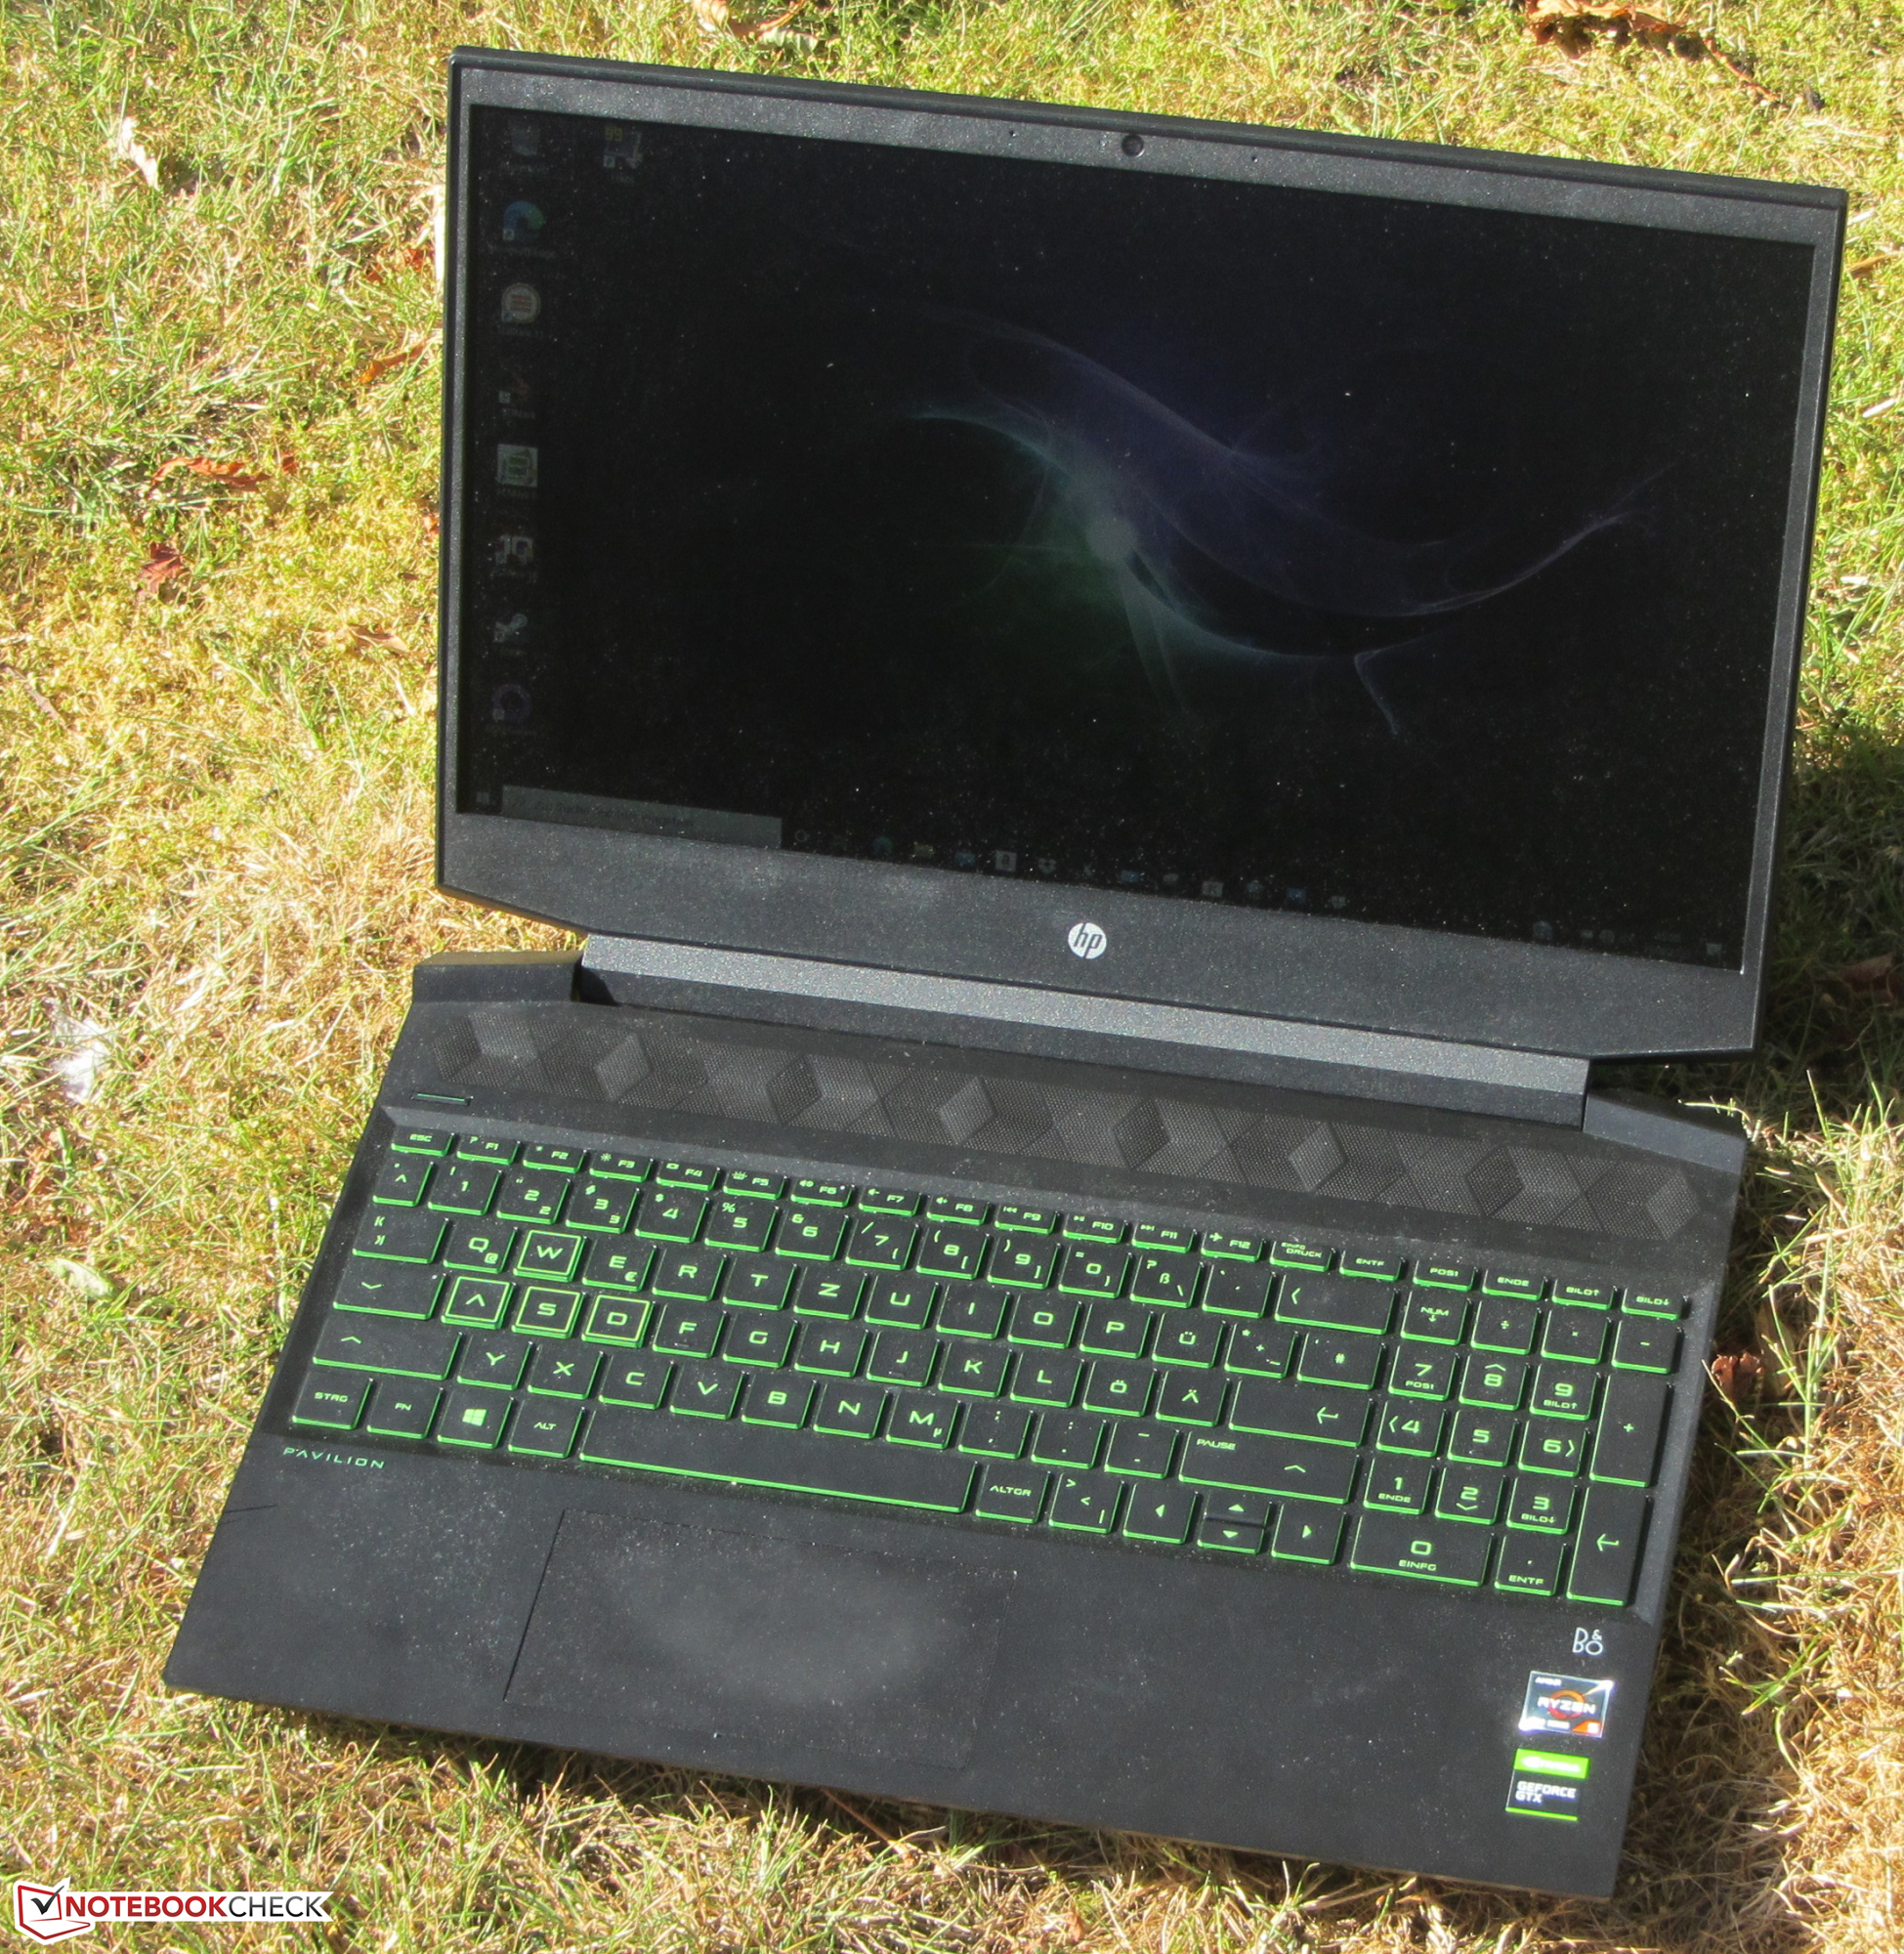
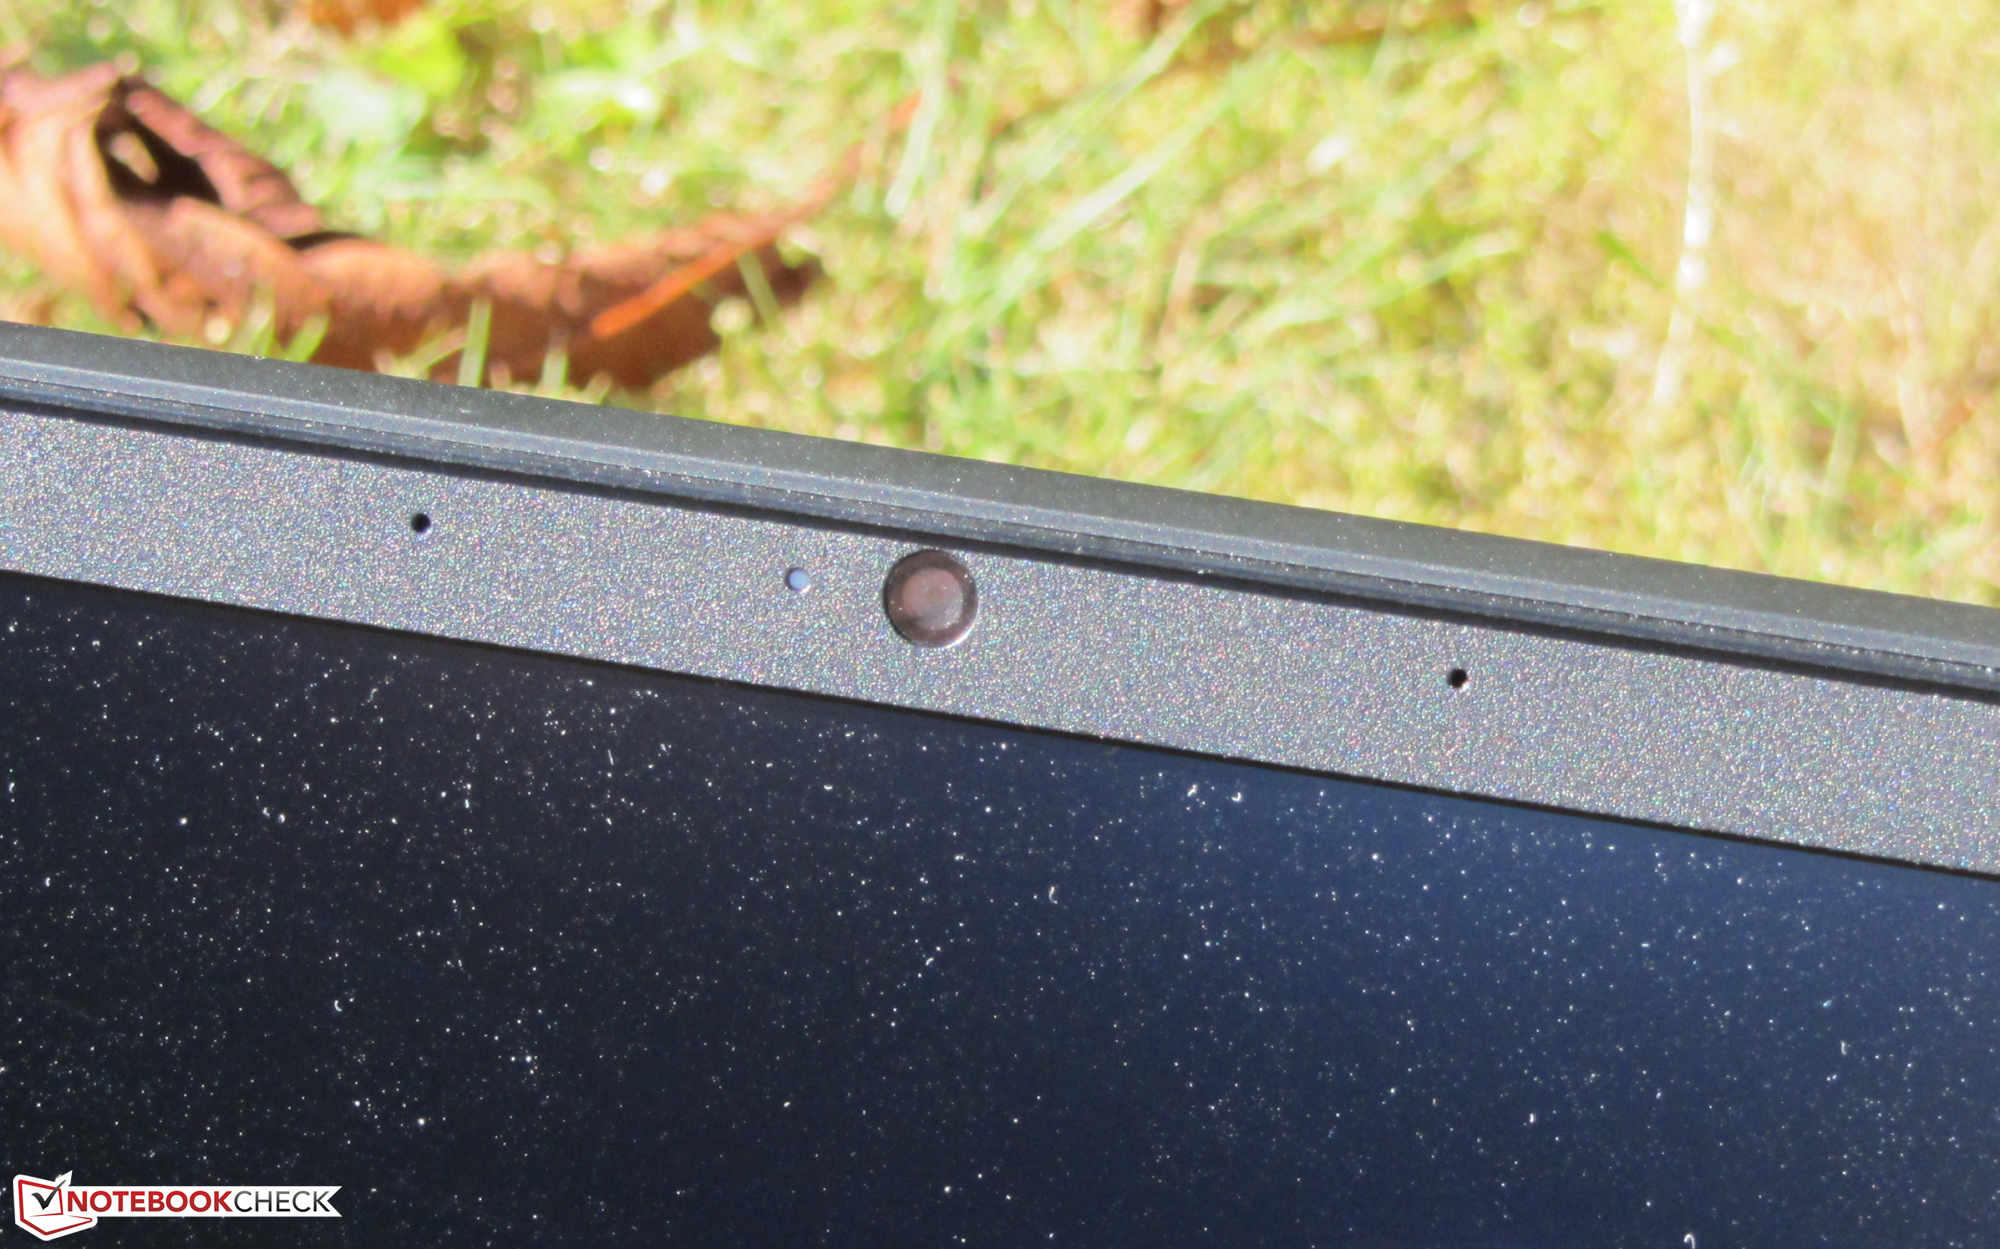
HP, oyun dizüstü bilgisayarını görüntüleme açısına sabit bir IPS paneli ile donatır. Böylece ekran herhangi bir konumdan okunabilir. Dış mekanlarda, güneş çok parlak olmadığında ekran okunabilir.
Performans - Ultra güçlü APU'lu Pavilion
Pavilion Gaming 15 ile HP, 15,6 inç formatında bir oyun dizüstü bilgisayarı sunar. Tüm modern bilgisayar oyunlarını sorunsuz bir şekilde ekrana getirir ve çok güçlü bir CPU sayesinde, oyun oynamanın ötesinde iyi bir rakam çıkarır. Test cihazımızın maliyeti 1.200 Euro'nun (~ 1.407 $) biraz altında. Ek olarak, diğer konfigürasyon varyantları da mevcuttur. Fiyatlar 700 Euro'nun (~ 821 $) hemen altında başlıyor.
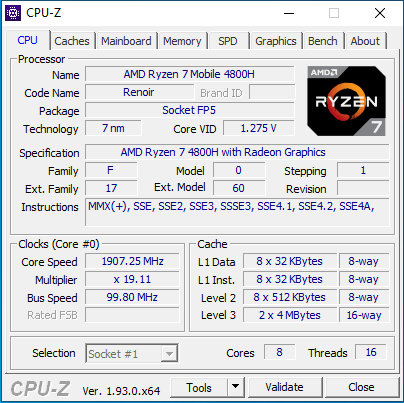
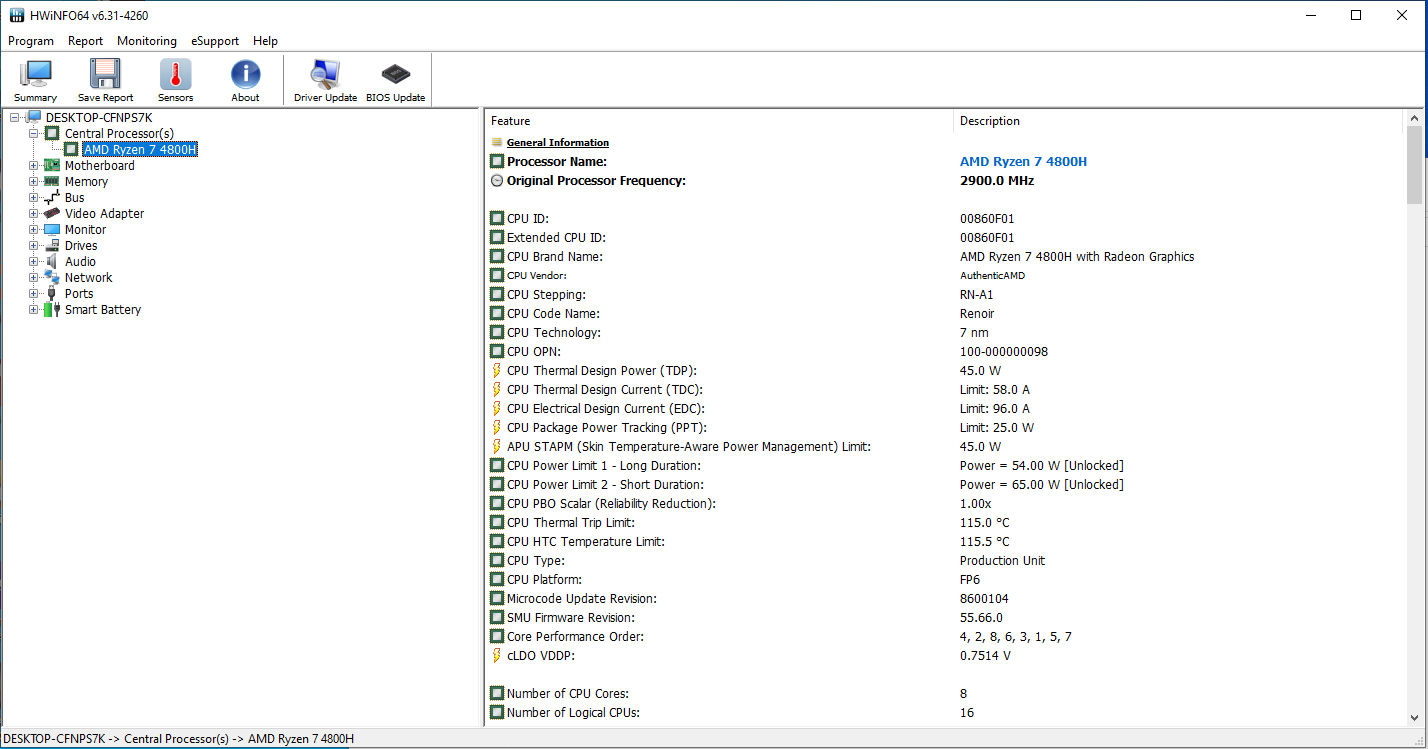
İşlemci
HP dizüstü bilgisayarda bir Ryzen 7 4800H (Renoir) APU bulunur. APU’nun CPU kısmı, 2,9 GHz temel hızda çalışan sekiz çekirdekli bir işlemciden oluşur. Turbo ile 4,2 GHz'e kadar bir artış mümkündür. Eşzamanlı çoklu okuma (çekirdek başına iki iş parçacığı işlenebilir) desteklenir. Cinebench kıyaslamalarının çoklu iş parçacığı testleri 3,7 ila 4,1 GHz (takılı) ve 3 ila 3,1 GHz (pil gücü) arasında çalıştırılır. Tek iş parçacığı testleri 1,4 - 4,2 GHz'de (takılı ve pil gücüyle) işlenir.
Cinebench R15 benchmark'ın multithread testini en az 30 dakika sürekli bir döngüde çalıştırarak, CPU Turbo'nun da takılıyken tutarlı bir şekilde kullanılıp kullanılmadığını doğrularız. Turbo büyük ölçüde kullanılmaktadır.
| Cinebench R15 | |
| CPU Single 64Bit | |
| Sınıf ortalaması Gaming (188.8 - 343, n=112, son 2 yıl) | |
| Dell G3 15 3500-G4DG2 | |
| Asus ROG Strix G15 G512LI | |
| Lenovo IdeaPad Gaming 3i 15IMH05 | |
| Ortalama AMD Ryzen 7 4800H (186 - 191, n=15) | |
| HP Pavilion Gaming 15-ec1177ng | |
| Asus TUF Gaming A15 FA506IV-HN172 | |
| Acer Nitro 5 AN515-44-R5FT | |
| HP Pavilion Gaming 15-ec1206ng | |
| HP Pavilion Gaming 15-ec0002ng | |
| HP Pavilion Gaming 15-ec0017ng | |
| CPU Multi 64Bit | |
| Sınıf ortalaması Gaming (1578 - 6271, n=113, son 2 yıl) | |
| HP Pavilion Gaming 15-ec1177ng | |
| Ortalama AMD Ryzen 7 4800H (1652 - 1995, n=21) | |
| Asus TUF Gaming A15 FA506IV-HN172 | |
| HP Pavilion Gaming 15-ec1206ng | |
| Acer Nitro 5 AN515-44-R5FT | |
| Asus ROG Strix G15 G512LI | |
| Dell G3 15 3500-G4DG2 | |
| Lenovo IdeaPad Gaming 3i 15IMH05 | |
| HP Pavilion Gaming 15-ec0017ng | |
| HP Pavilion Gaming 15-ec0002ng | |
| Blender - v2.79 BMW27 CPU | |
| Lenovo IdeaPad Gaming 3i 15IMH05 | |
| Dell G3 15 3500-G4DG2 | |
| Asus ROG Strix G15 G512LI | |
| Acer Nitro 5 AN515-44-R5FT | |
| HP Pavilion Gaming 15-ec1206ng | |
| Ortalama AMD Ryzen 7 4800H (248 - 299, n=15) | |
| Asus TUF Gaming A15 FA506IV-HN172 | |
| HP Pavilion Gaming 15-ec1177ng | |
| Sınıf ortalaması Gaming (80 - 330, n=110, son 2 yıl) | |
| 7-Zip 18.03 | |
| 7z b 4 -mmt1 | |
| Sınıf ortalaması Gaming (4199 - 7436, n=111, son 2 yıl) | |
| Asus ROG Strix G15 G512LI | |
| Lenovo IdeaPad Gaming 3i 15IMH05 | |
| Dell G3 15 3500-G4DG2 | |
| HP Pavilion Gaming 15-ec1177ng | |
| Ortalama AMD Ryzen 7 4800H (4575 - 4743, n=15) | |
| Asus TUF Gaming A15 FA506IV-HN172 | |
| Acer Nitro 5 AN515-44-R5FT | |
| HP Pavilion Gaming 15-ec1206ng | |
| 7z b 4 | |
| Sınıf ortalaması Gaming (33491 - 148086, n=111, son 2 yıl) | |
| HP Pavilion Gaming 15-ec1177ng | |
| Ortalama AMD Ryzen 7 4800H (44827 - 53883, n=15) | |
| Asus TUF Gaming A15 FA506IV-HN172 | |
| HP Pavilion Gaming 15-ec1206ng | |
| Acer Nitro 5 AN515-44-R5FT | |
| Asus ROG Strix G15 G512LI | |
| Dell G3 15 3500-G4DG2 | |
| Lenovo IdeaPad Gaming 3i 15IMH05 | |
| Cinebench R20 | |
| CPU (Single Core) | |
| Sınıf ortalaması Gaming (442 - 895, n=112, son 2 yıl) | |
| HP Pavilion Gaming 15-ec1177ng | |
| Asus TUF Gaming A15 FA506IV-HN172 | |
| Ortalama AMD Ryzen 7 4800H (462 - 491, n=17) | |
| Dell G3 15 3500-G4DG2 | |
| Lenovo IdeaPad Gaming 3i 15IMH05 | |
| Asus ROG Strix G15 G512LI | |
| HP Pavilion Gaming 15-ec1206ng | |
| Acer Nitro 5 AN515-44-R5FT | |
| HP Pavilion Gaming 15-ec0002ng | |
| CPU (Multi Core) | |
| Sınıf ortalaması Gaming (4029 - 16108, n=112, son 2 yıl) | |
| HP Pavilion Gaming 15-ec1177ng | |
| Ortalama AMD Ryzen 7 4800H (3692 - 4663, n=18) | |
| Asus TUF Gaming A15 FA506IV-HN172 | |
| HP Pavilion Gaming 15-ec1206ng | |
| Acer Nitro 5 AN515-44-R5FT | |
| Asus ROG Strix G15 G512LI | |
| Dell G3 15 3500-G4DG2 | |
| Lenovo IdeaPad Gaming 3i 15IMH05 | |
| HP Pavilion Gaming 15-ec0002ng | |
| Geekbench 5.5 | |
| Single-Core | |
| Sınıf ortalaması Gaming (986 - 2474, n=111, son 2 yıl) | |
| Dell G3 15 3500-G4DG2 | |
| Lenovo IdeaPad Gaming 3i 15IMH05 | |
| HP Pavilion Gaming 15-ec1177ng | |
| Ortalama AMD Ryzen 7 4800H (1154 - 1207, n=17) | |
| Asus TUF Gaming A15 FA506IV-HN172 | |
| Asus ROG Strix G15 G512LI | |
| HP Pavilion Gaming 15-ec1206ng | |
| Acer Nitro 5 AN515-44-R5FT | |
| HP Pavilion Gaming 15-ec0002ng | |
| Multi-Core | |
| Sınıf ortalaması Gaming (6460 - 27010, n=111, son 2 yıl) | |
| HP Pavilion Gaming 15-ec1177ng | |
| Ortalama AMD Ryzen 7 4800H (5920 - 8672, n=17) | |
| Asus ROG Strix G15 G512LI | |
| Dell G3 15 3500-G4DG2 | |
| Asus TUF Gaming A15 FA506IV-HN172 | |
| HP Pavilion Gaming 15-ec1206ng | |
| Acer Nitro 5 AN515-44-R5FT | |
| Lenovo IdeaPad Gaming 3i 15IMH05 | |
| HP Pavilion Gaming 15-ec0002ng | |
| HWBOT x265 Benchmark v2.2 - 4k Preset | |
| Sınıf ortalaması Gaming (11.5 - 44.3, n=111, son 2 yıl) | |
| HP Pavilion Gaming 15-ec1177ng | |
| Ortalama AMD Ryzen 7 4800H (10.8 - 14.1, n=16) | |
| Asus TUF Gaming A15 FA506IV-HN172 | |
| HP Pavilion Gaming 15-ec1206ng | |
| Asus ROG Strix G15 G512LI | |
| Acer Nitro 5 AN515-44-R5FT | |
| Dell G3 15 3500-G4DG2 | |
| Lenovo IdeaPad Gaming 3i 15IMH05 | |
| LibreOffice - 20 Documents To PDF | |
| HP Pavilion Gaming 15-ec1206ng | |
| HP Pavilion Gaming 15-ec1177ng | |
| Acer Nitro 5 AN515-44-R5FT | |
| Ortalama AMD Ryzen 7 4800H (28.6 - 95.8, n=14) | |
| Dell G3 15 3500-G4DG2 | |
| Lenovo IdeaPad Gaming 3i 15IMH05 | |
| Asus ROG Strix G15 G512LI | |
| Sınıf ortalaması Gaming (19 - 88.8, n=111, son 2 yıl) | |
| Asus TUF Gaming A15 FA506IV-HN172 | |
| R Benchmark 2.5 - Overall mean | |
| Dell G3 15 3500-G4DG2 | |
| Lenovo IdeaPad Gaming 3i 15IMH05 | |
| Acer Nitro 5 AN515-44-R5FT | |
| Asus ROG Strix G15 G512LI | |
| HP Pavilion Gaming 15-ec1206ng | |
| Asus TUF Gaming A15 FA506IV-HN172 | |
| Ortalama AMD Ryzen 7 4800H (0.562 - 0.603, n=15) | |
| HP Pavilion Gaming 15-ec1177ng | |
| Sınıf ortalaması Gaming (0.3439 - 0.759, n=112, son 2 yıl) | |
* ... daha küçük daha iyidir
Sistem performansı
Sistem hızlı ve sorunsuzdur. Yerleşik donanım, oyun, video düzenleme, görüntü işleme, ofis uygulamaları ve İnternet kullanımı gibi tüm yaygın uygulama alanları için gereğinden fazla bilgi işlem gücü sağlar. Buna çok iyi PCMark sonuçları eşlik ediyor.
| PCMark 8 Home Score Accelerated v2 | 4805 puan | |
| PCMark 8 Creative Score Accelerated v2 | 5920 puan | |
| PCMark 8 Work Score Accelerated v2 | 5580 puan | |
| PCMark 10 Score | 5602 puan | |
Yardım | ||
| PCMark 8 - Home Score Accelerated v2 | |
| Sınıf ortalaması Gaming (n=1son 2 yıl) | |
| HP Pavilion Gaming 15-ec1177ng | |
| Ortalama AMD Ryzen 7 4800H, NVIDIA GeForce GTX 1660 Ti Max-Q (n=1) | |
| Asus TUF Gaming A15 FA506IV-HN172 | |
| Asus ROG Strix G15 G512LI | |
| HP Pavilion Gaming 15-ec1206ng | |
| HP Pavilion Gaming 15-ec0017ng | |
| Lenovo IdeaPad Gaming 3i 15IMH05 | |
| HP Pavilion Gaming 15-ec0002ng | |
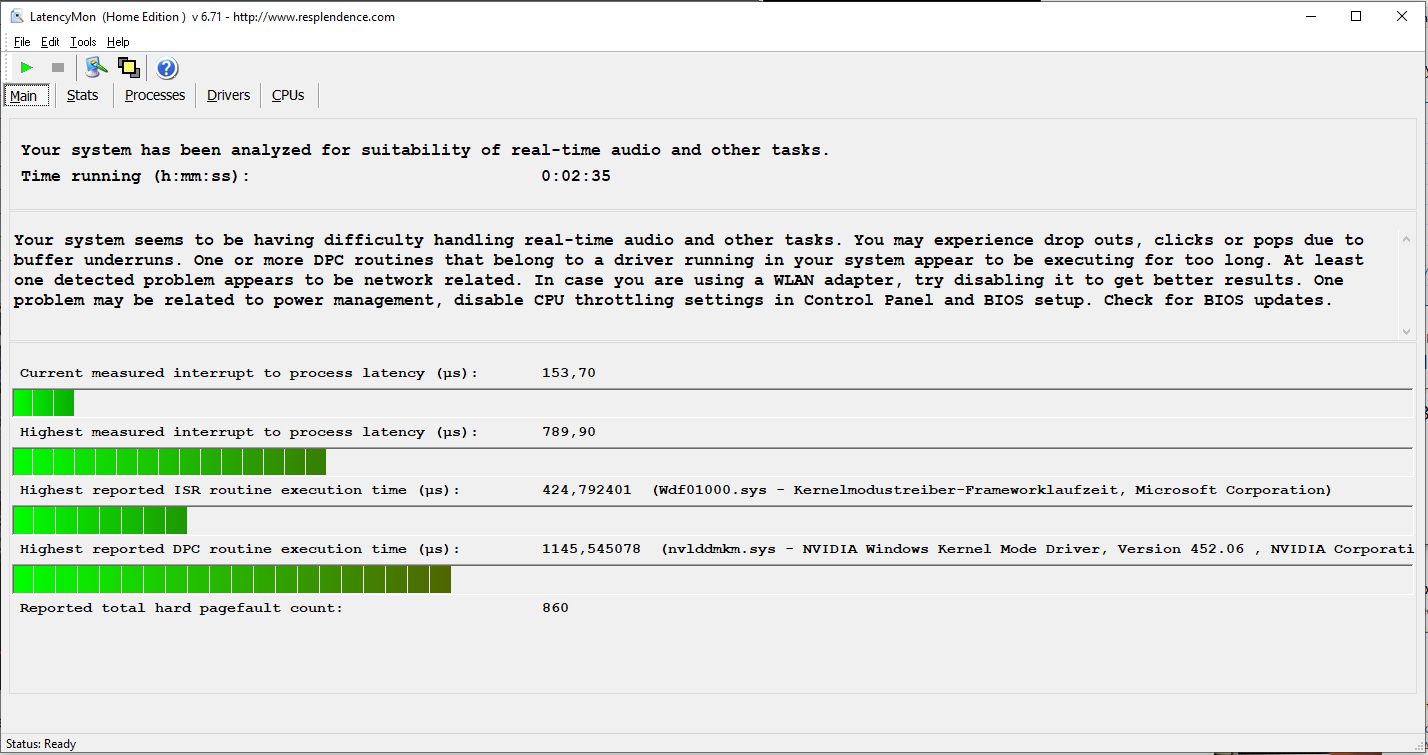
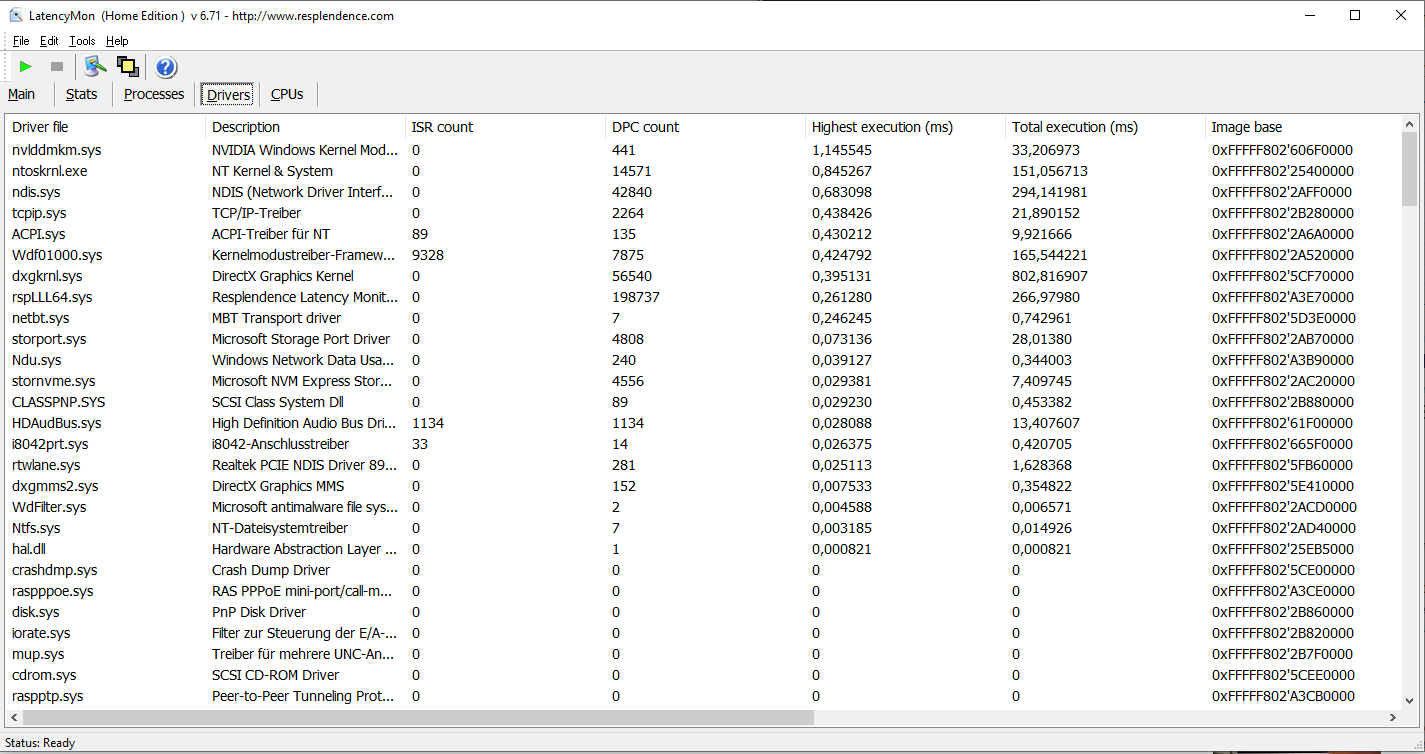
DPC gecikmeleri
Standartlaştırılmış gecikmeli monitör testimizde (web sörfü, 4K video oynatma, yüksek yüklü Prime95), DPC gecikmeleriyle ilgili sorunları gözlemleyebildik. Sistem, gerçek zamanlı video ve ses düzenleme için uygun görünmüyor.
| DPC Latencies / LatencyMon - interrupt to process latency (max), Web, Youtube, Prime95 | |
| Dell G3 15 3500-G4DG2 | |
| Asus ROG Strix G15 G512LI | |
| Acer Nitro 5 AN515-44-R5FT | |
| Asus TUF Gaming A15 FA506IV-HN172 | |
| HP Pavilion Gaming 15-ec1177ng | |
| Lenovo IdeaPad Gaming 3i 15IMH05 | |
| HP Pavilion Gaming 15-ec1206ng | |
* ... daha küçük daha iyidir
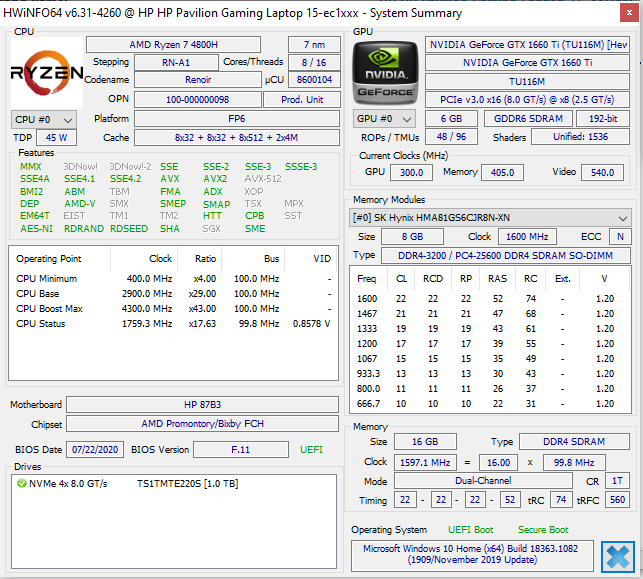
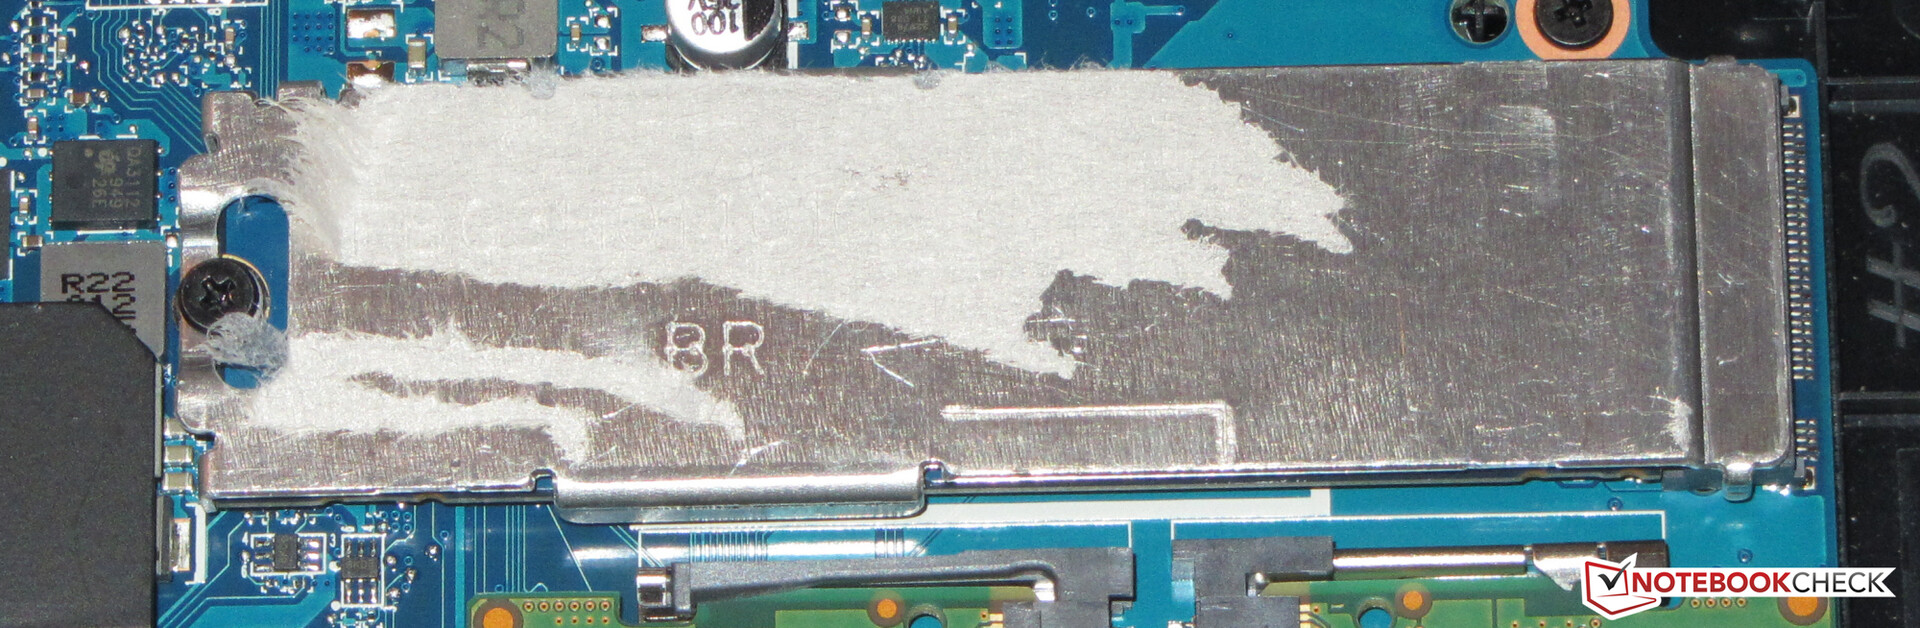
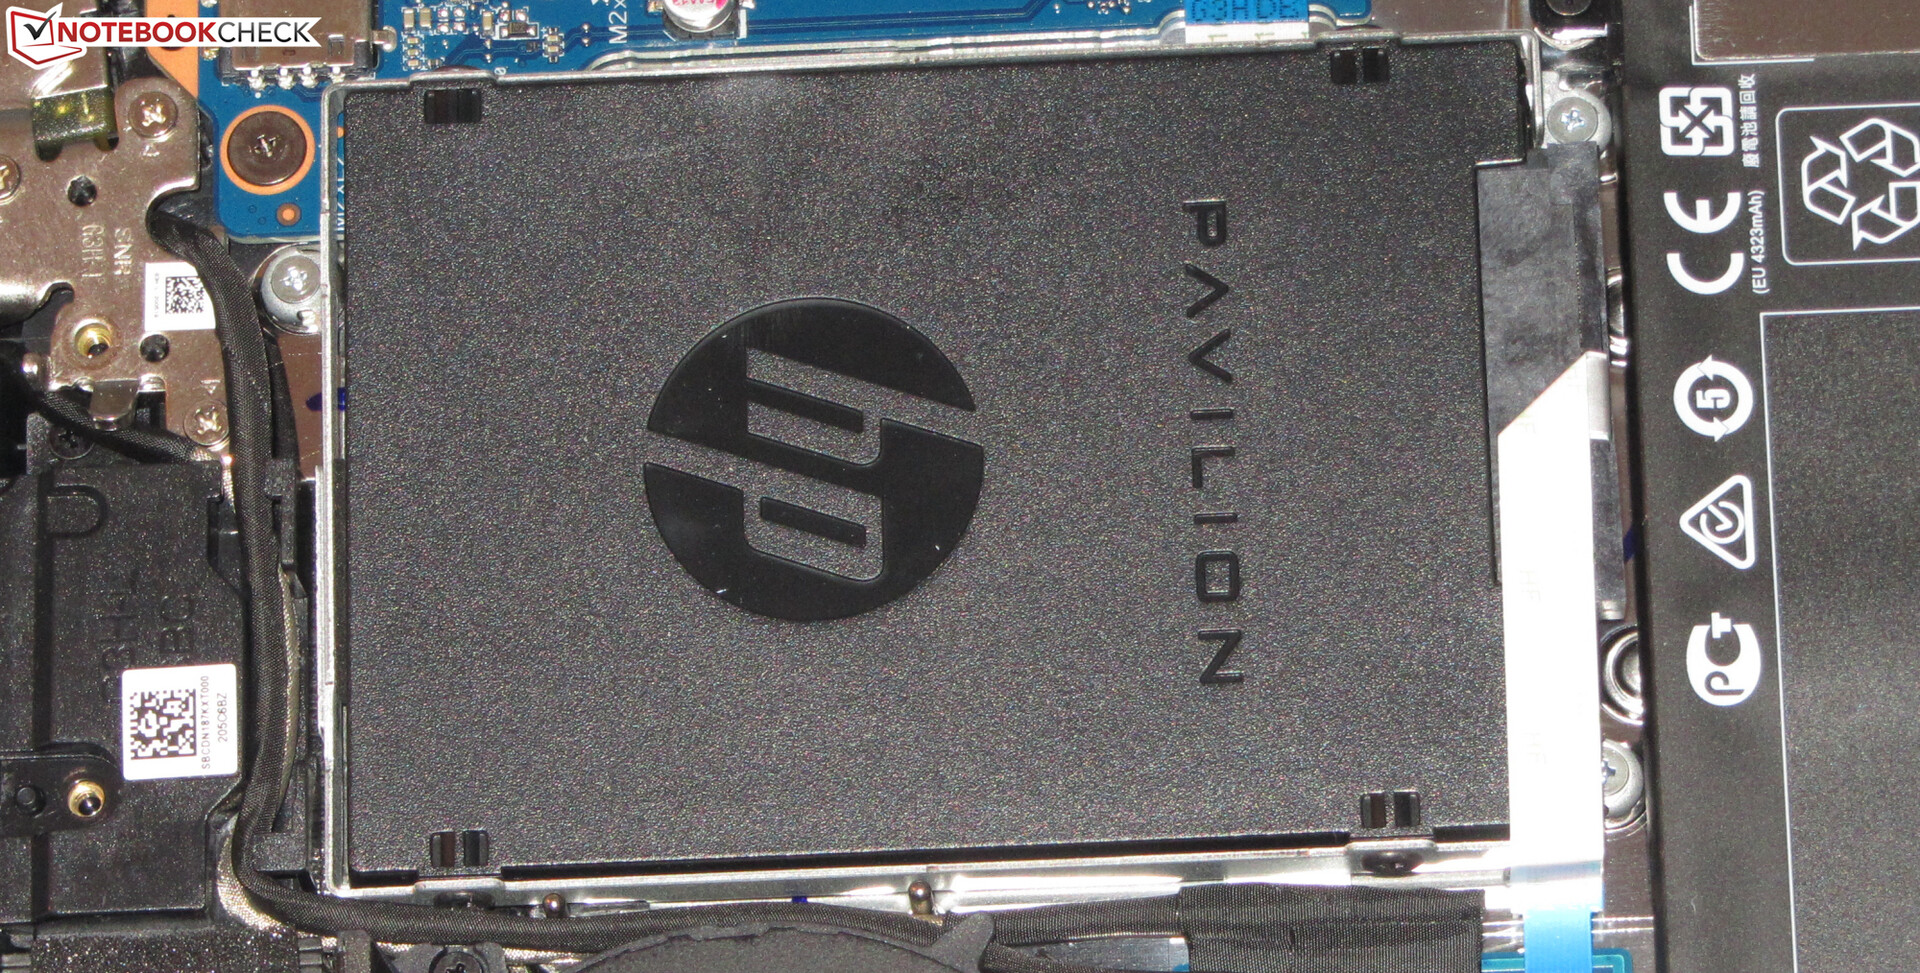
Depolama
Sistem sürücüsü, Intel'den iyi aktarım hızları sağlayan 512 GB NVMe SSD'dir (M.2 2280). Yine de en hızlı SSD'lerden biri değil. Dizüstü bilgisayarda ayrıca 2,5 inçlik bir depolama aygıtı için yer vardır. SATA yuvası ve montaj çerçevesi mevcuttur.

| HP Pavilion Gaming 15-ec1177ng Intel SSD 660p SSDPEKNW512G8 | Dell G3 15 3500-G4DG2 SK Hynix BC511 HFM512GDJTNI | Acer Nitro 5 AN515-44-R5FT SK Hynix BC511 HFM512GDJTNI | Asus TUF Gaming A15 FA506IV-HN172 Kingston OM8PCP3512F-AB | Lenovo IdeaPad Gaming 3i 15IMH05 SK hynix BC511 HFM512GDHTNI-87A0B | Asus ROG Strix G15 G512LI Intel SSD 660p SSDPEKNW512G8 | HP Pavilion Gaming 15-ec1206ng Toshiba KBG40ZNV512G | HP Pavilion Gaming 15-ec0002ng Intel SSD 660p SSDPEKNW512G8 | HP Pavilion Gaming 15-ec0017ng WDC PC SN720 SDAPNTW-256G | Ortalama Intel SSD 660p SSDPEKNW512G8 | Sınıf ortalaması Gaming | |
|---|---|---|---|---|---|---|---|---|---|---|---|
| CrystalDiskMark 5.2 / 6 | -4% | 0% | 15% | 1% | -4% | 16% | -3% | 23% | -1% | 174% | |
| Write 4K (MB/s) | 110 | 99.6 -9% | 94.7 -14% | 219.8 100% | 130 18% | 125.4 14% | 111.5 1% | 136.9 24% | 148 35% | 136 ? 24% | 203 ? 85% |
| Read 4K (MB/s) | 52.8 | 38.8 -27% | 38.91 -26% | 50.2 -5% | 44.44 -16% | 52.7 0% | 38.17 -28% | 57 8% | 43.73 -17% | 55.2 ? 5% | 78.2 ? 48% |
| Write Seq (MB/s) | 983 | 1117 14% | 1056 7% | 979 0% | 1059 8% | 943 -4% | 1515 54% | 968 -2% | 1617 64% | 926 ? -6% | 3724 ? 279% |
| Read Seq (MB/s) | 1608 | 1030 -36% | 1183 -26% | 1990 24% | 1105 -31% | 1383 -14% | 1576 -2% | 1631 1% | 1753 9% | 1523 ? -5% | 3596 ? 124% |
| Write 4K Q32T1 (MB/s) | 461.3 | 445.2 -3% | 445.3 -3% | 516 12% | 490.3 6% | 437.9 -5% | 365.4 -21% | 237 -49% | 246.3 -47% | 380 ? -18% | 610 ? 32% |
| Read 4K Q32T1 (MB/s) | 345.4 | 331.8 -4% | 477.7 38% | 298.3 -14% | 309.2 -10% | 334.9 -3% | 504 46% | 337.1 -2% | 368 7% | 334 ? -3% | 714 ? 107% |
| Write Seq Q32T1 (MB/s) | 982 | 1102 12% | 1063 8% | 982 0% | 1053 7% | 960 -2% | 1493 52% | 963 -2% | 1618 65% | 987 ? 1% | 5210 ? 431% |
| Read Seq Q32T1 (MB/s) | 1820 | 2227 22% | 2154 18% | 1907 5% | 2261 24% | 1530 -16% | 2340 29% | 1863 2% | 3027 66% | 1744 ? -4% | 6960 ? 282% |
| Write 4K Q8T8 (MB/s) | 981 | 810 ? | 1306 ? | ||||||||
| Read 4K Q8T8 (MB/s) | 300.9 | 344 ? | 1633 ? | ||||||||
| AS SSD | 10% | 22% | 7% | 13% | -17% | 7% | -40% | 12% | -7% | 200% | |
| Seq Read (MB/s) | 1553 | 1305 -16% | 1504 -3% | 1682 8% | 1348 -13% | 1157 -25% | 2048 32% | 1623 5% | 2607 68% | 1423 ? -8% | 5487 ? 253% |
| Seq Write (MB/s) | 868 | 767 -12% | 1064 23% | 904 4% | 1000 15% | 675 -22% | 1039 20% | 891 3% | 1518 75% | 828 ? -5% | 3926 ? 352% |
| 4K Read (MB/s) | 56.6 | 41.84 -26% | 51.5 -9% | 60.2 6% | 48.04 -15% | 49.99 -12% | 52.8 -7% | 48.06 -15% | 39.16 -31% | 51.3 ? -9% | 70.1 ? 24% |
| 4K Write (MB/s) | 153.6 | 90.1 -41% | 123.2 -20% | 164.8 7% | 103.3 -33% | 114 -26% | 146 -5% | 102.1 -34% | 104.9 -32% | 128.9 ? -16% | 215 ? 40% |
| 4K-64 Read (MB/s) | 325.3 | 773 138% | 703 116% | 472.5 45% | 755 132% | 322.2 -1% | 1285 295% | 325.6 0% | 513 58% | 326 ? 0% | 1647 ? 406% |
| 4K-64 Write (MB/s) | 762 | 711 -7% | 730 -4% | 845 11% | 749 -2% | 759 0% | 758 -1% | 94.1 -88% | 416.7 -45% | 721 ? -5% | 2876 ? 277% |
| Access Time Read * (ms) | 0.07 | 0.09 -29% | 0.064 9% | 0.087 -24% | 0.061 13% | 0.07 -0% | 0.155 -121% | 0.171 -144% | 0.076 -9% | 0.09003 ? -29% | 0.06383 ? 9% |
| Access Time Write * (ms) | 0.046 | 0.04 13% | 0.031 33% | 0.02 57% | 0.036 22% | 0.137 -198% | 0.202 -339% | 0.048 -4% | 0.037 20% | 0.07378 ? -60% | 0.03932 ? 15% |
| Score Read (Points) | 537 | 945 76% | 905 69% | 701 31% | 938 75% | 488 -9% | 1543 187% | 536 0% | 813 51% | 519 ? -3% | 2266 ? 322% |
| Score Write (Points) | 1002 | 878 -12% | 960 -4% | 1101 10% | 952 -5% | 940 -6% | 1008 1% | 285 -72% | 673 -33% | 932 ? -7% | 3483 ? 248% |
| Score Total (Points) | 1802 | 2290 27% | 2321 29% | 2143 19% | 2365 31% | 1673 -7% | 3298 83% | 1077 -40% | 1858 3% | 1708 ? -5% | 6838 ? 279% |
| Copy ISO MB/s (MB/s) | 1301 | 675 -48% | 749 -42% | 939 -28% | 691 -47% | 566 -56% | 1639 26% | 1109 ? -15% | 3083 ? 137% | ||
| Copy Program MB/s (MB/s) | 313.7 | 248.4 -21% | 342.5 9% | 489.9 56% | 345.8 10% | 223.8 -29% | 284.2 -9% | 468 ? 49% | 956 ? 205% | ||
| Copy Game MB/s (MB/s) | 621 | 535 -14% | 571 -8% | 895 44% | 517 -17% | 104.3 -83% | 767 24% | 760 ? 22% | 2043 ? 229% | ||
| Toplam Ortalama (Program / Ayarlar) | 3% /
4% | 11% /
13% | 11% /
10% | 7% /
8% | -11% /
-12% | 12% /
10% | -22% /
-26% | 18% /
16% | -4% /
-4% | 187% /
190% |
* ... daha küçük daha iyidir
Continuous load read: DiskSpd Read Loop, Queue Depth 8
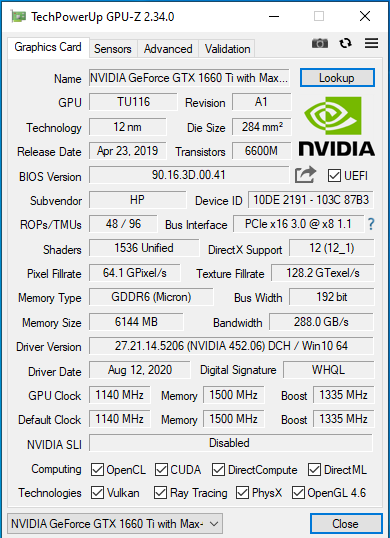
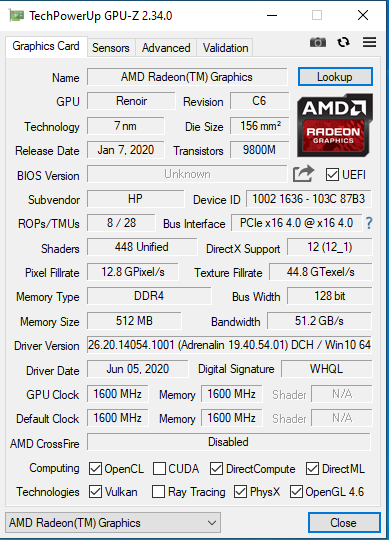
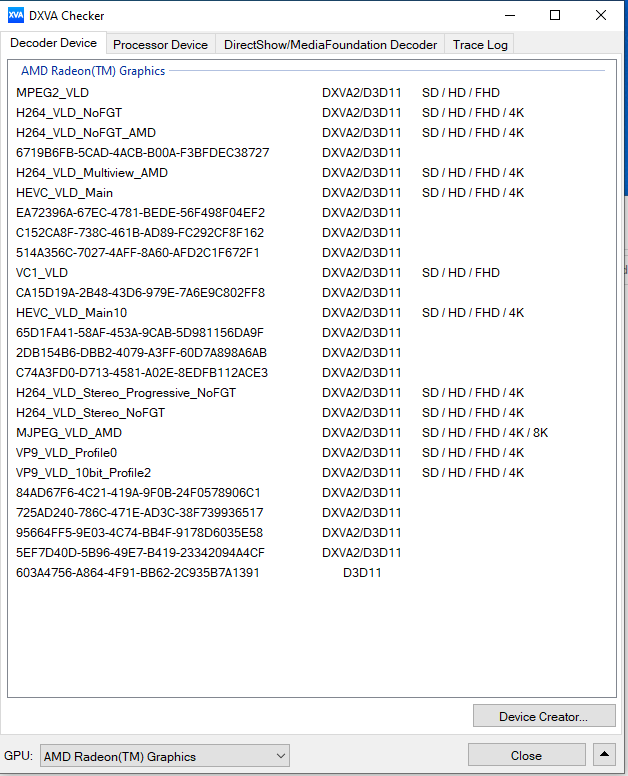
Grafik kartı
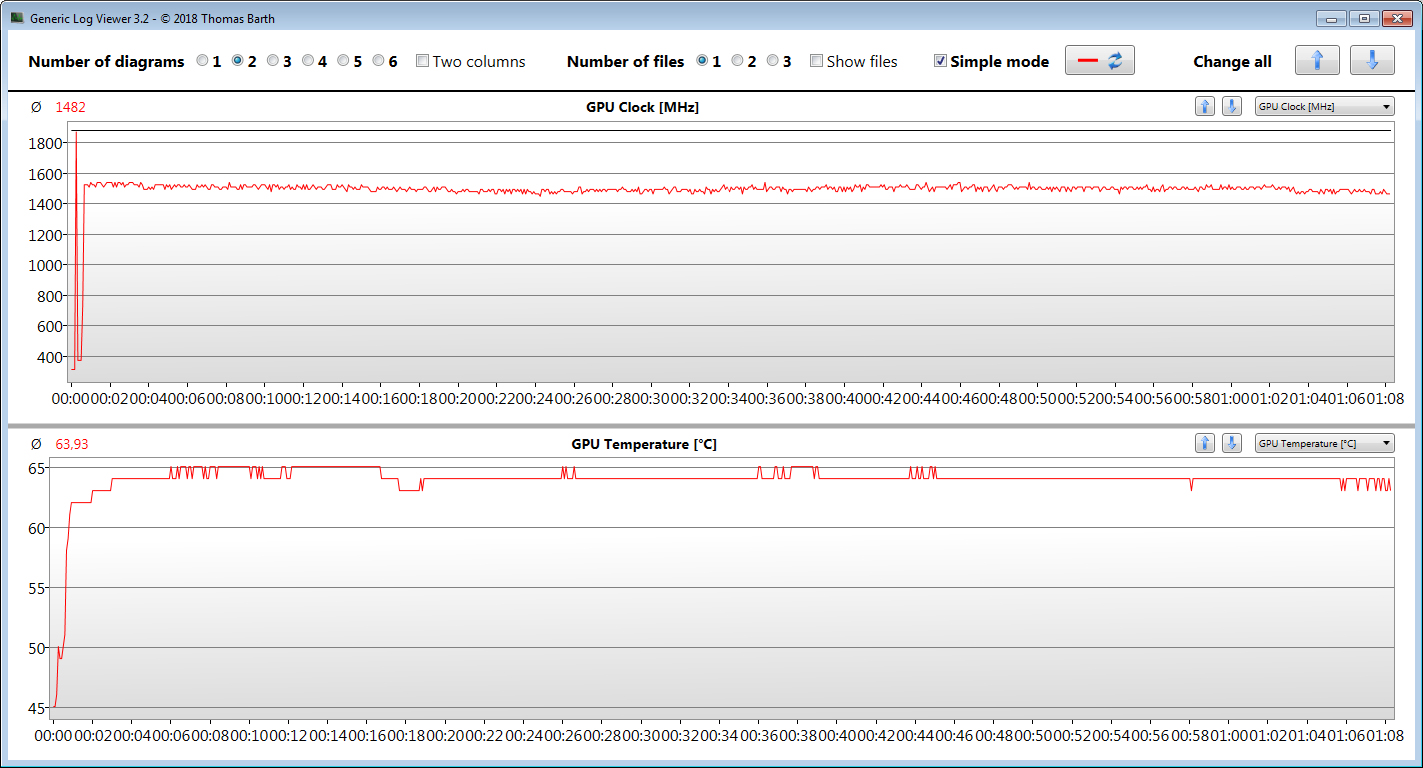
GeForce GTX 1660 Ti Max-Q grafik çekirdeği (Turing) üst orta sınıfa aittir. Nvidia, bu DirectX 12 GPU için 1.140 MHz (temel) ve 1.335 MHz (yükseltme) arasında bir hız seviyesi belirler. GPU belirli bir sıcaklığa ve / veya enerji eşiğine ulaşmazsa daha yüksek saat hızları uygulanabilir. Bu şekilde, maksimum 1,869 MHz kaydederiz. Dahası, The Witcher 3 testimiz ortalama 1.482 MHz hızında yürütülüyor. GPU, hızlı GDDR6 grafik belleğinden (6,144 MB) faydalanabilir. 3DMark benchmarklarındaki sonuçlar bu GPU için normal seviyededir. İşlemciye entegre olan Vega 7 GPU etkindir ve dizüstü bilgisayar, Nvidia'nın Optimus grafik değiştirme çözümü ile çalışır.
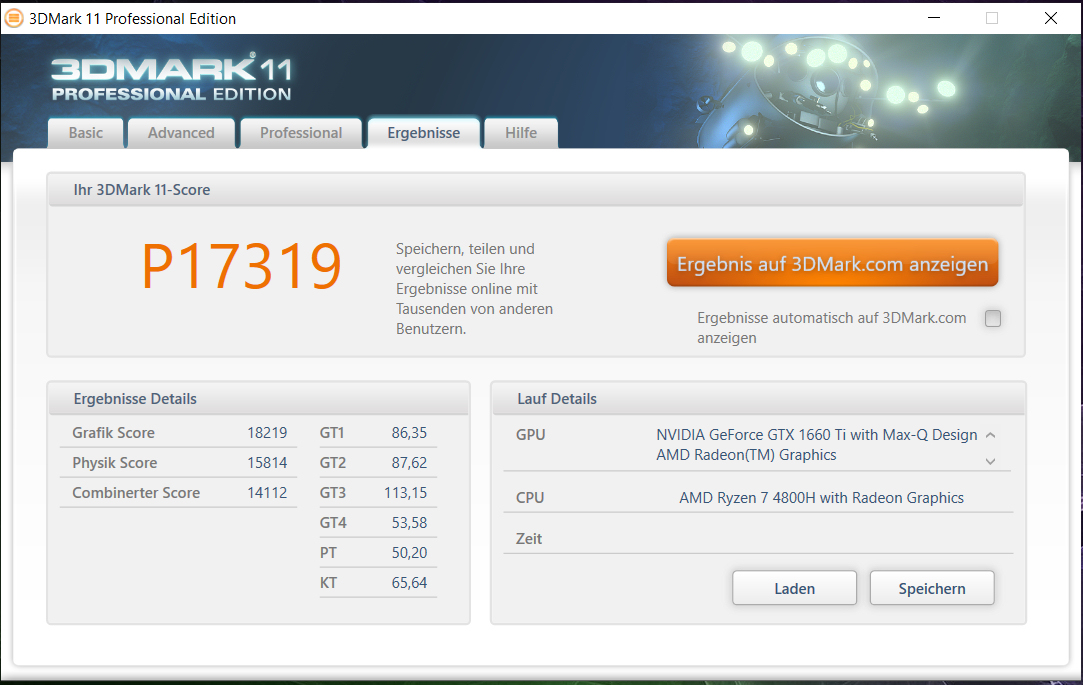
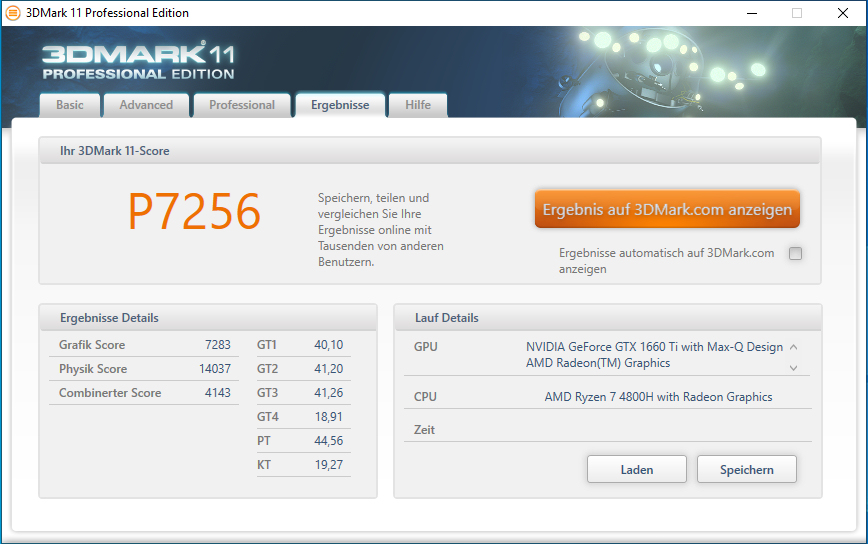
| 3DMark 11 Performance | 17319 puan | |
| 3DMark Cloud Gate Standard Score | 39942 puan | |
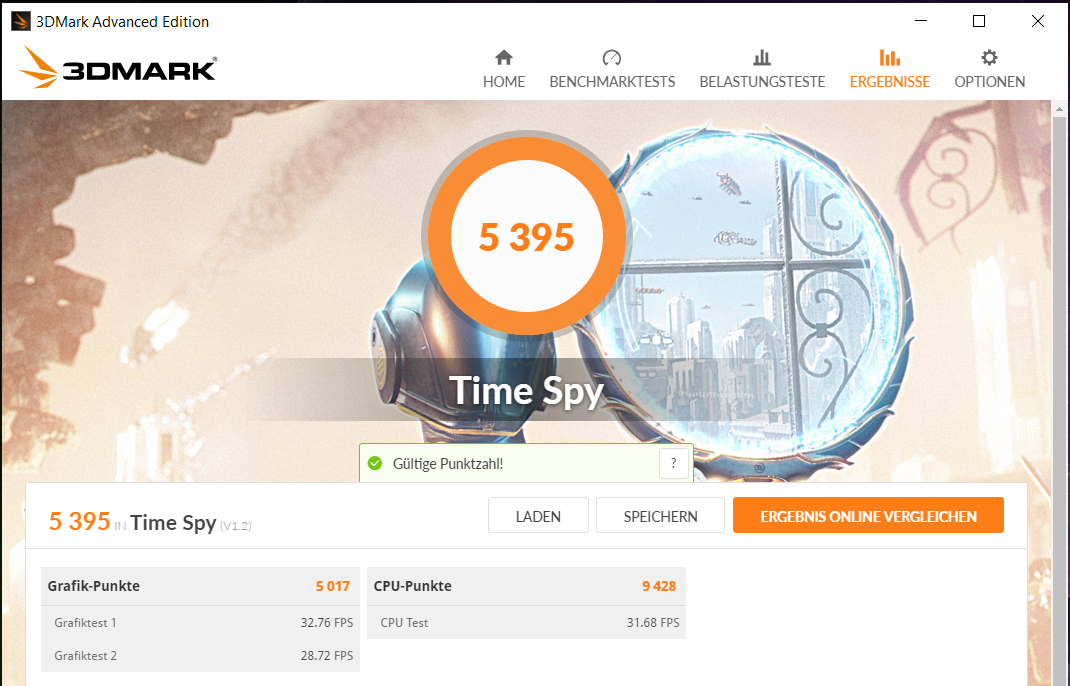
| 3DMark Fire Strike Score | 12487 puan | |
| 3DMark Time Spy Score | 6395 puan | |
Yardım | ||
| 3DMark 11 - 1280x720 Performance GPU | |
| Sınıf ortalaması Gaming (21841 - 80022, n=109, son 2 yıl) | |
| Asus TUF Gaming A15 FA506IV-HN172 | |
| Dell G3 15 3500-G4DG2 | |
| HP Pavilion Gaming 15-ec0017ng | |
| HP Pavilion Gaming 15-ec1177ng | |
| Ortalama NVIDIA GeForce GTX 1660 Ti Max-Q (17010 - 18653, n=8) | |
| Asus ROG Strix G15 G512LI | |
| Acer Nitro 5 AN515-44-R5FT | |
| HP Pavilion Gaming 15-ec1206ng | |
| Lenovo IdeaPad Gaming 3i 15IMH05 | |
| HP Pavilion Gaming 15-ec0002ng | |
Oyun performansı
Yerleşik donanım, veritabanımızdaki tüm oyunları sorunsuz bir şekilde ekrana getirir. Full HD çözünürlük ve yüksek ila bazen maksimum kalite ayarları seçilebilir. Full HD'nin ötesinde çözünürlükler (bunun için uygun bir monitörün takılması gerekir) bazı durumlarda düşük kalite seviyesinde mümkündür.
| The Witcher 3 - 1920x1080 Ultra Graphics & Postprocessing (HBAO+) | |
| Sınıf ortalaması Gaming (95 - 240, n=8, son 2 yıl) | |
| Asus TUF Gaming A15 FA506IV-HN172 | |
| HP Pavilion Gaming 15-ec1177ng | |
| HP Pavilion Gaming 15-ec0017ng | |
| Dell G3 15 3500-G4DG2 | |
| Ortalama NVIDIA GeForce GTX 1660 Ti Max-Q (44.8 - 53.2, n=7) | |
| Asus ROG Strix G15 G512LI | |
| HP Pavilion Gaming 15-ec1206ng | |
| Acer Nitro 5 AN515-44-R5FT | |
| Lenovo IdeaPad Gaming 3i 15IMH05 | |
| HP Pavilion Gaming 15-ec0002ng | |
| BioShock Infinite - 1920x1080 Ultra Preset, DX11 (DDOF) | |
| HP Pavilion Gaming 15-ec1177ng | |
| Asus TUF Gaming A15 FA506IV-HN172 | |
| Ortalama NVIDIA GeForce GTX 1660 Ti Max-Q (102.3 - 130, n=5) | |
| HP Pavilion Gaming 15-ec0017ng | |
| Lenovo IdeaPad Gaming 3i 15IMH05 | |
| HP Pavilion Gaming 15-ec1206ng | |
| HP Pavilion Gaming 15-ec0002ng | |
| Red Dead Redemption 2 - 1920x1080 High Settings | |
| HP Pavilion Gaming 15-ec1177ng | |
| Ortalama NVIDIA GeForce GTX 1660 Ti Max-Q (n=1) | |
| Acer Nitro 5 AN515-44-R5FT | |
| Lenovo IdeaPad Gaming 3i 15IMH05 | |
| HP Pavilion Gaming 15-ec0002ng | |
| Escape from Tarkov - 1920x1080 Ultra Preset | |
| HP Pavilion Gaming 15-ec1177ng | |
| Ortalama NVIDIA GeForce GTX 1660 Ti Max-Q (n=1) | |
| Lenovo IdeaPad Gaming 3i 15IMH05 | |
| Star Wars Jedi Fallen Order - 1920x1080 Epic Preset | |
| HP Pavilion Gaming 15-ec1177ng | |
| Ortalama NVIDIA GeForce GTX 1660 Ti Max-Q (n=1) | |
| Lenovo IdeaPad Gaming 3i 15IMH05 | |
| HP Pavilion Gaming 15-ec0002ng | |
| Call of Duty Modern Warfare 2019 - 1920x1080 Maximum Settings AA:T2X Filmic SM | |
| HP Pavilion Gaming 15-ec1177ng | |
| Ortalama NVIDIA GeForce GTX 1660 Ti Max-Q (n=1) | |
| Acer Nitro 5 AN515-44-R5FT | |
| Lenovo IdeaPad Gaming 3i 15IMH05 | |
| HP Pavilion Gaming 15-ec1206ng | |
| HP Pavilion Gaming 15-ec0002ng | |
| Doom Eternal - 1920x1080 Ultra Preset | |
| Dell G3 15 3500-G4DG2 | |
| HP Pavilion Gaming 15-ec1177ng | |
| Ortalama NVIDIA GeForce GTX 1660 Ti Max-Q (n=1) | |
| F1 2020 - 1920x1080 Ultra High Preset AA:T AF:16x | |
| HP Pavilion Gaming 15-ec1177ng | |
| Ortalama NVIDIA GeForce GTX 1660 Ti Max-Q (n=1) | |
| HP Pavilion Gaming 15-ec1206ng | |
| Death Stranding - 1920x1080 Very High Preset | |
| HP Pavilion Gaming 15-ec1177ng | |
| Ortalama NVIDIA GeForce GTX 1660 Ti Max-Q (n=1) | |
| HP Pavilion Gaming 15-ec1206ng | |
Kare hızlarının uzun bir süre boyunca bile büyük ölçüde sabit kalıp kalmadığını doğrulamak için The Witcher 3 oyununun Full HD çözünürlükte ve maksimum kalite ayarlarında yaklaşık 60 dakika çalışmasına izin verdik. Karakter taşınmaz. Kare hızlarında bir düşüş bulunamadı.
| düşük | orta | yüksek | ultra | |
|---|---|---|---|---|
| BioShock Infinite (2013) | 263.2 | 249.5 | 226.9 | 119.2 |
| The Witcher 3 (2015) | 258.3 | 166.4 | 95.3 | 53.2 |
| Battlefield V (2018) | 152 | 102.6 | 92.2 | 85 |
| Apex Legends (2019) | 144 | 133.9 | 99.6 | 99.6 |
| Ghost Recon Breakpoint (2019) | 114 | 72 | 66 | 51 |
| Call of Duty Modern Warfare 2019 (2019) | 135.2 | 88 | 72.6 | 62.6 |
| Need for Speed Heat (2019) | 95.8 | 83 | 73.9 | 66.9 |
| Star Wars Jedi Fallen Order (2019) | 91.5 | 78.1 | 72.4 | |
| Red Dead Redemption 2 (2019) | 115.1 | 71.7 | 47.2 | 29.4 |
| Escape from Tarkov (2020) | 121.2 | 98.3 | 90.5 | 87.7 |
| Hunt Showdown (2020) | 176.8 | 81.2 | 63.3 | |
| Doom Eternal (2020) | 168.9 | 101.7 | 95.4 | 93.4 |
| Gears Tactics (2020) | 214.7 | 130.2 | 79.9 | 56.1 |
| F1 2020 (2020) | 219 | 130 | 112 | 79 |
| Death Stranding (2020) | 136.1 | 87.7 | 81.3 | 78.4 |
| Horizon Zero Dawn (2020) | 119 | 78 | 65 | 51 |
| Flight Simulator 2020 (2020) | 55.1 | 49.4 | 37.1 | 25.3 |
Emisyonlar ve enerji - HP dizüstü bilgisayar çok ısınmaz
Gürültü emisyonları
İki fan genellikle boşta kullanımda sessizdir ve sessizlik vardır. Ama yük altında ortaya çıkıyorlar. Bu şekilde, stres testi sırasında 47 dB (A) maksimum ses basınç seviyesi kaydederiz. 42,2 dB (A) seviyesinde, The Witcher 3 testimiz sırasında daha az gürültü var.
Ses yüksekliği
| Boşta |
| 27 / 27 / 27 dB |
| Çalışırken |
| 42.4 / 47 dB |
 | ||
30 dB sessiz 40 dB(A) duyulabilirlik 50 dB(A) gürültülü |
||
min: | ||
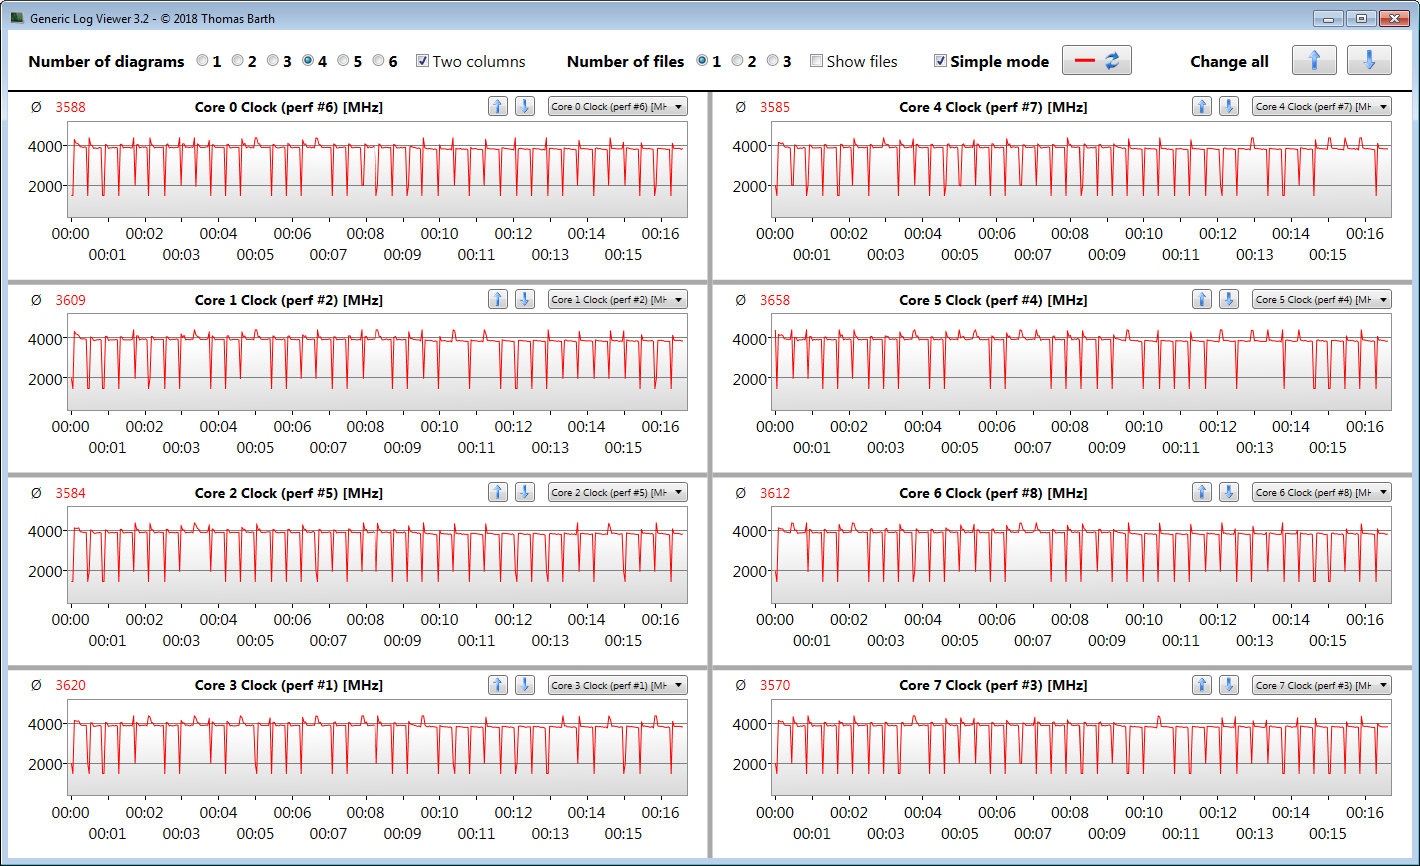
Sıcaklık
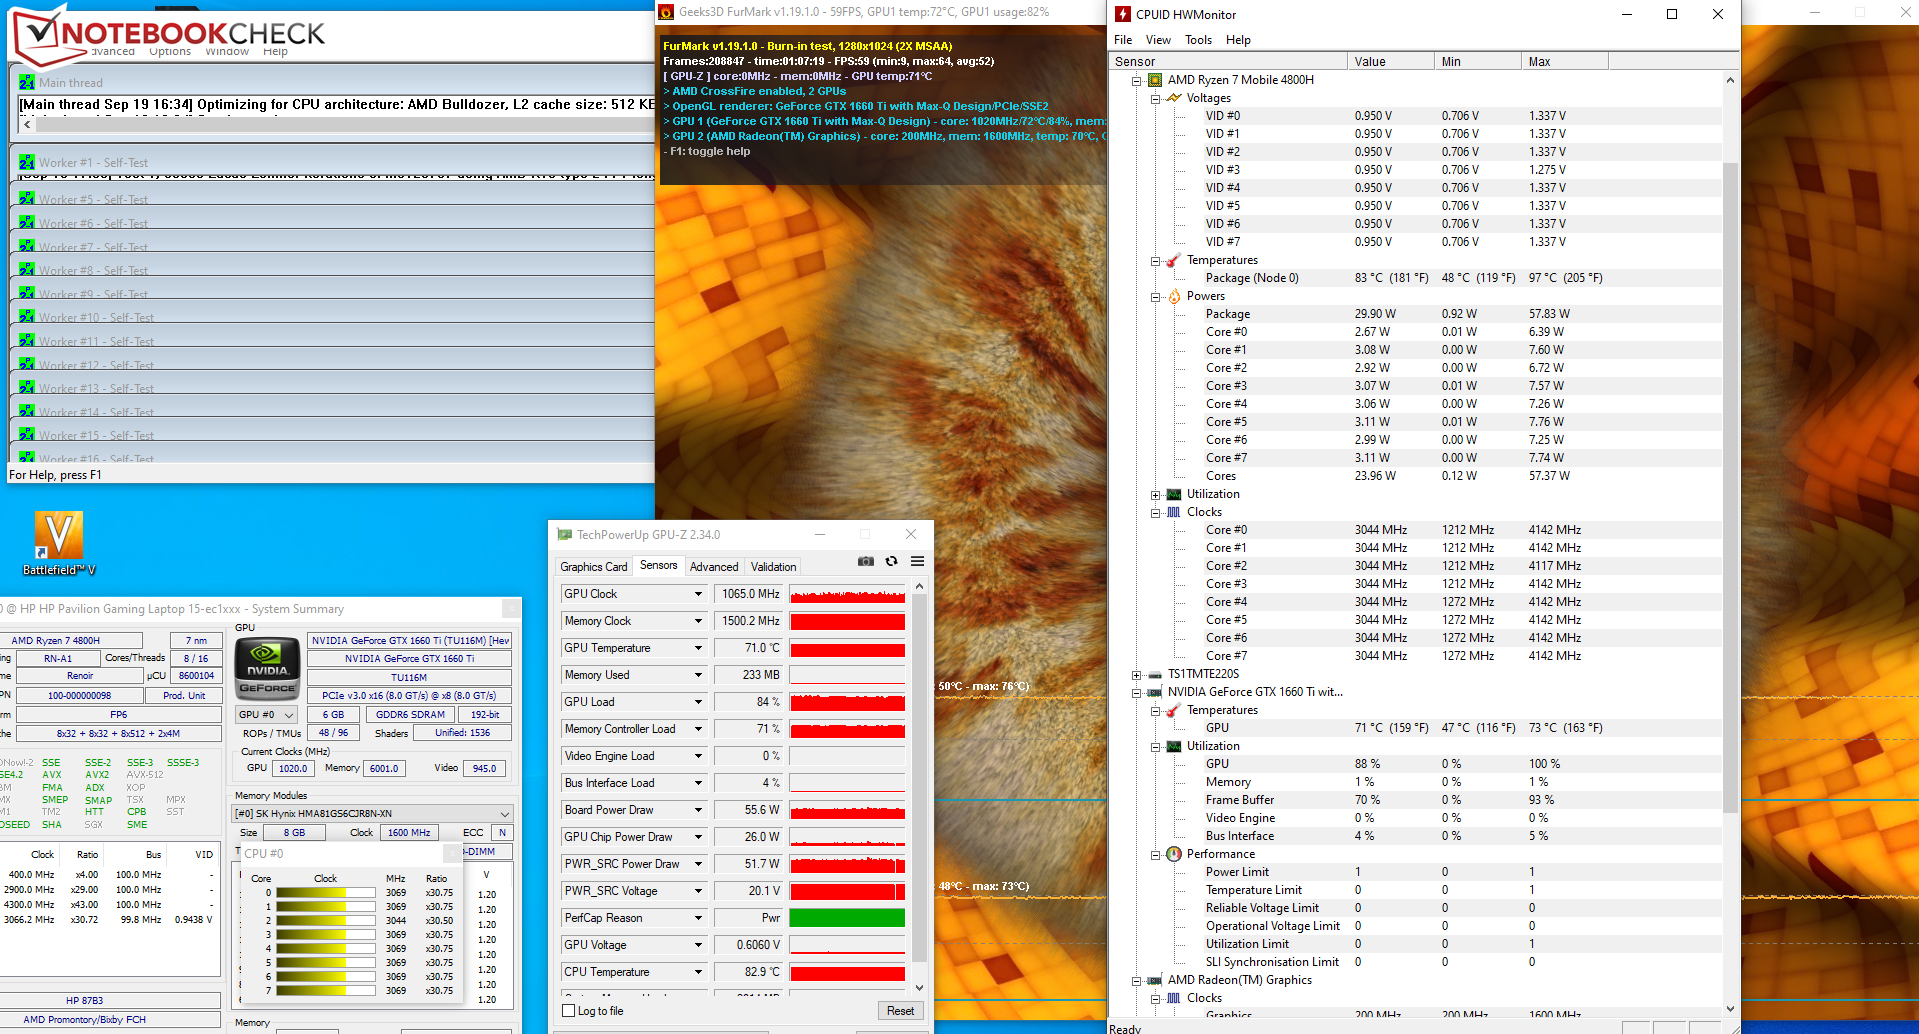
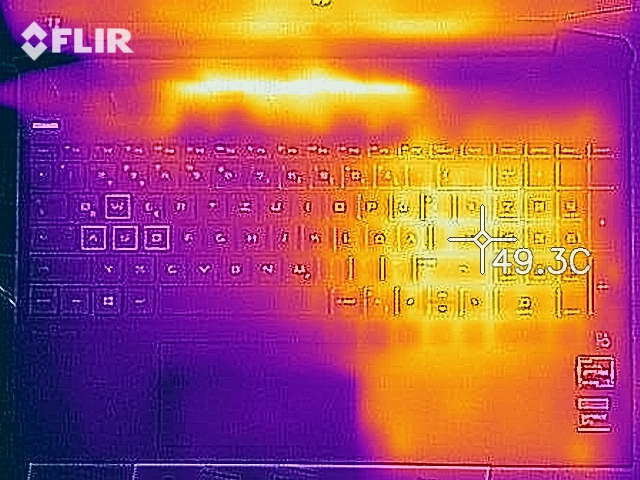
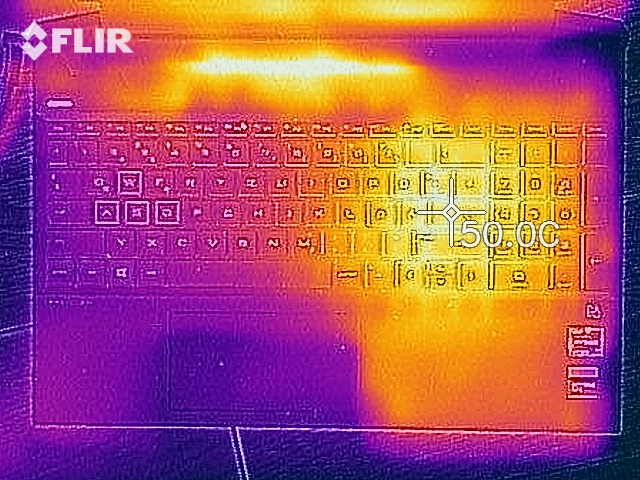
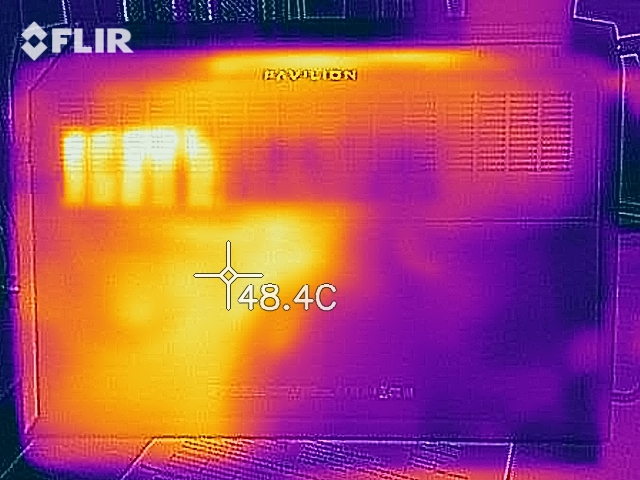
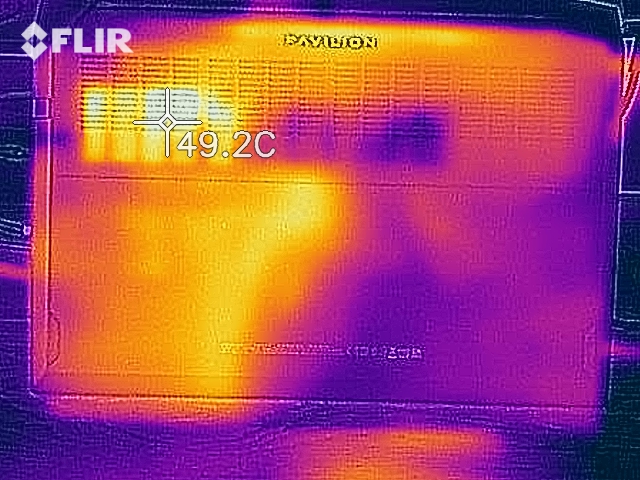
Stres testimiz (Prime95 ve FurMark en az bir saat çalışıyor) işlemci tarafından kısa bir süre 4 GHz'de çalıştırılıyor. Saat hızı daha sonra 3 ile 3.1 GHz arasına düşer ve bu seviyede kalır. Grafik çekirdeği 900 ila 1.200 MHz'de çalışır. Pil gücünde, saat hızları sırasıyla 1,7 ila 1,9 GHz (CPU) ve 1.000 ila 1.700 MHz'dir (GPU). Stres testi, günlük yaşamda görülmeyen aşırı bir senaryoyu temsil eder. Bu test ile sistemin tam yük altında bile kararlı kalıp kalmadığını kontrol ediyoruz. Laptop özellikle güçlü bir şekilde ısınmıyor. Stres testi sırasında, üç ölçüm noktasında daha düşük 40- ° C aralığındaki (~ 104 ° F) sıcaklıkları kaydederiz. Ayrıca, The Witcher 3 testimizi gerçekleştirirken ısı gelişimi önemli ölçüde daha düşüktür. Günlük kullanımda, sıcaklıklar yeşil aralıktadır.
(±) Üst taraftaki maksimum sıcaklık, 40.4 °C / 105 F ortalamasına kıyasla 42.9 °C / 109 F'dir. , Gaming sınıfı için 21.2 ile 68.8 °C arasında değişir.
(+) Alt kısım, 43.2 °C / 110 F ortalamasına kıyasla maksimum 39.5 °C / 103 F'ye kadar ısınır
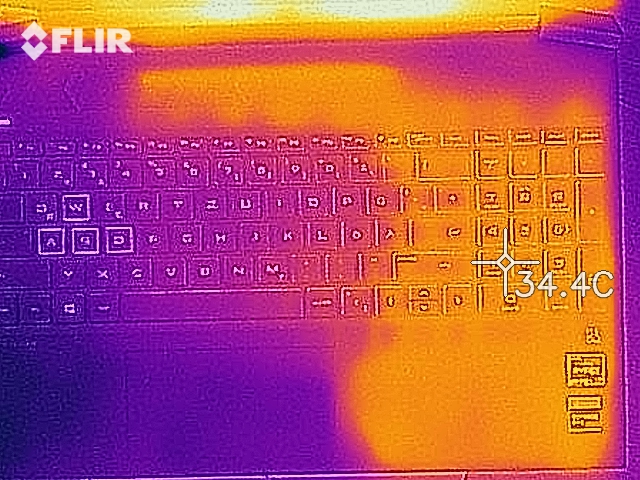
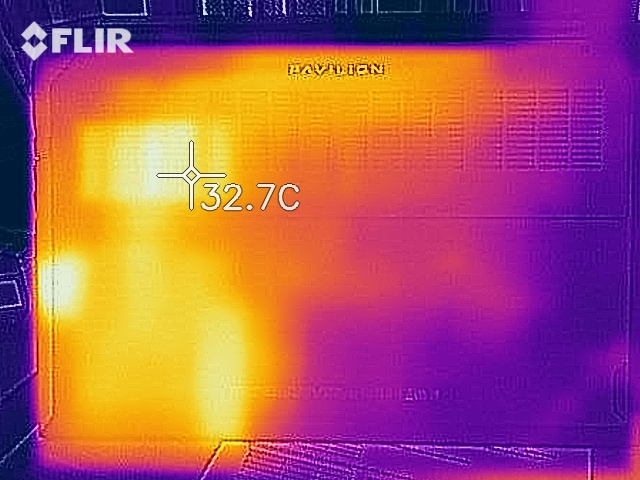
(+) Boşta kullanımda, üst tarafın ortalama sıcaklığı 25.6 °C / 78 F olup, cihazın 33.9 °C / 93 F.
(±) The Witcher 3 oynarken, üst tarafın ortalama sıcaklığı 32.5 °C / 91 F olup, cihazın 33.9 °C / 93 F.
(±) Avuç içi dayanakları ve dokunmatik yüzey maksimum 36.5 °C / 97.7 F ile dokunulamayacak kadar ısınabilir.
(-) Benzer cihazların avuç içi dayanağı alanının ortalama sıcaklığı 28.8 °C / 83.8 F (-7.7 °C / -13.9 F) idi.
Hoparlörler
HP Pavilion Gaming 15-ec1177ng ses analizi
(-) | hoparlörler çok yüksek ses çıkarmıyor (60.8 dB)
Bas 100 - 315Hz
(-) | neredeyse hiç bas yok - ortalama olarak medyandan 22% daha düşük
(±) | Bas doğrusallığı ortalamadır (11.9% delta - önceki frekans)
Ortalar 400 - 2000 Hz
(+) | dengeli ortalar - medyandan yalnızca 2.7% uzakta
(±) | Ortaların doğrusallığı ortalamadır (10.9% delta - önceki frekans)
Yüksekler 2 - 16 kHz
(+) | dengeli yüksekler - medyandan yalnızca 2.3% uzakta
(±) | Yükseklerin doğrusallığı ortalamadır (7.3% delta - önceki frekans)
Toplam 100 - 16.000 Hz
(±) | Genel sesin doğrusallığı ortalamadır (23.2% ortancaya göre fark)
Aynı sınıfla karşılaştırıldığında
» Bu sınıftaki tüm test edilen cihazların %84%'si daha iyi, 4% benzer, 11% daha kötüydü
» En iyisinin deltası 6% idi, ortalama 18% idi, en kötüsü 132% idi
Test edilen tüm cihazlarla karşılaştırıldığında
» Test edilen tüm cihazların %69'si daha iyi, 5 benzer, % 25 daha kötüydü
» En iyisinin deltası 4% idi, ortalama 24% idi, en kötüsü 134% idi
Enerji tüketimi
Enerji tüketimi açısından herhangi bir anormallik yok. Boşta kullanımda maksimum 9,5 watt güç tüketimi kaydediyoruz. Stres testimiz sırasında değer 156 watt'a kadar çıkıyor. Oyun modunda (The Witcher 3 testi), talep ortalama 99 watt (96 ila 106 watt) arasında daha düşüktür. 200 watt'lık güç adaptörü hala çok fazla hareket alanı sunuyor.
| Kapalı / Bekleme modu | |
| Boşta | |
| Çalışırken |
|
Key:
min: | |
Pil ömrü
Pratik WLAN testimizde (web sitelerine erişimin neden olduğu yükü yeniden oluşturmak için bir komut dosyası kullanılır), HP dizüstü bilgisayar 6:07 saatlik bir çalışma süresine ulaşır. Bu değer, bir dizüstü oyun bilgisayarı için mükemmeldir, ancak kardeş modellerinin değerlerinden önemli ölçüde daha düşüktür. Pil ömrünü araştırmak için çok zaman ayırdık. WLAN işletiminde kurulu donanımın kardeş modellerin donanımından genel olarak daha fazla enerji gerektirip gerektirmediğini ya da test cihazımızdaki bir problemin veya yanlış yapılandırmanın artan talebe yol açıp açmadığını bulmaya çalıştık. burada yanıtlayın, ancak en azından bazı açıklamaları hariç tutabiliriz: Ne SSD'lerimizden birine yeni bir Windows 10 kurulumu ne de önceki BIOS sürümünün kullanılması iyileştirmelere yol açmadı.
| Battery Runtime - WiFi Websurfing | |
| HP Pavilion Gaming 15-ec1206ng | |
| Acer Nitro 5 AN515-44-R5FT | |
| HP Pavilion Gaming 15-ec0002ng | |
| HP Pavilion Gaming 15-ec0017ng | |
| Sınıf ortalaması Gaming (1.967 - 14.6, n=104, son 2 yıl) | |
| Lenovo IdeaPad Gaming 3i 15IMH05 | |
| Asus TUF Gaming A15 FA506IV-HN172 | |
| HP Pavilion Gaming 15-ec1177ng | |
| Dell G3 15 3500-G4DG2 | |
| Asus ROG Strix G15 G512LI | |
Artılar
Eksiler
Verdict

Thanks to the Ryzen 7 4800H APU and the GeForce GTX 1660 Ti Max-Q graphics core, the Pavilion Gaming can bring all the latest computer games smoothly onto the screen. Full HD resolution and high to maximum quality settings can normally be used.
The top model of the Pavilion Gaming 15 series offers a lot of performance at an attractive price.
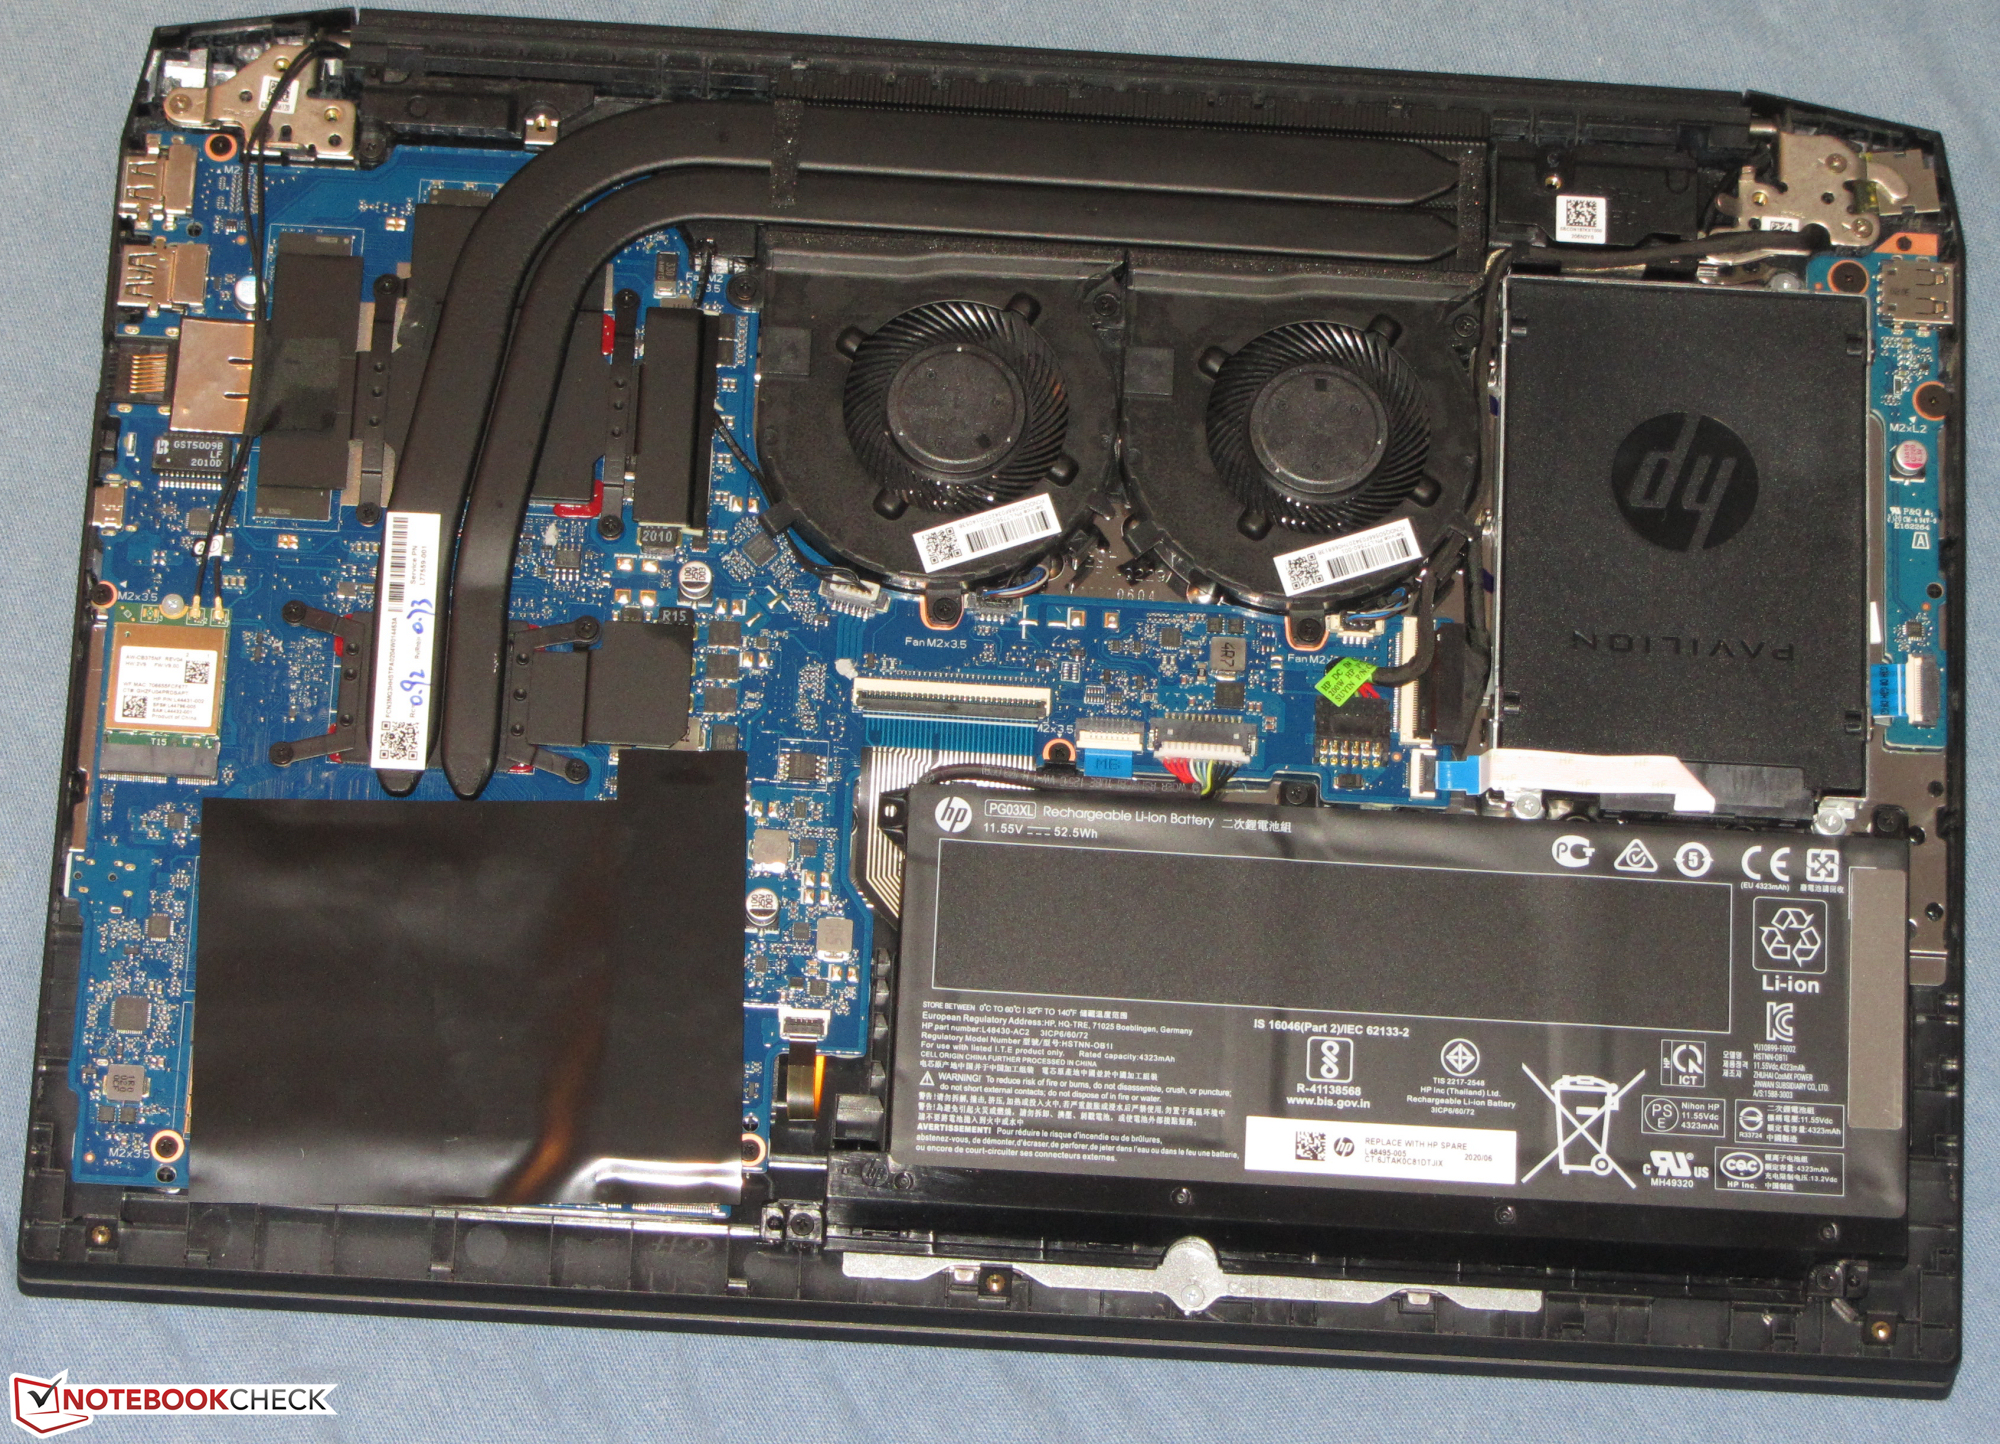
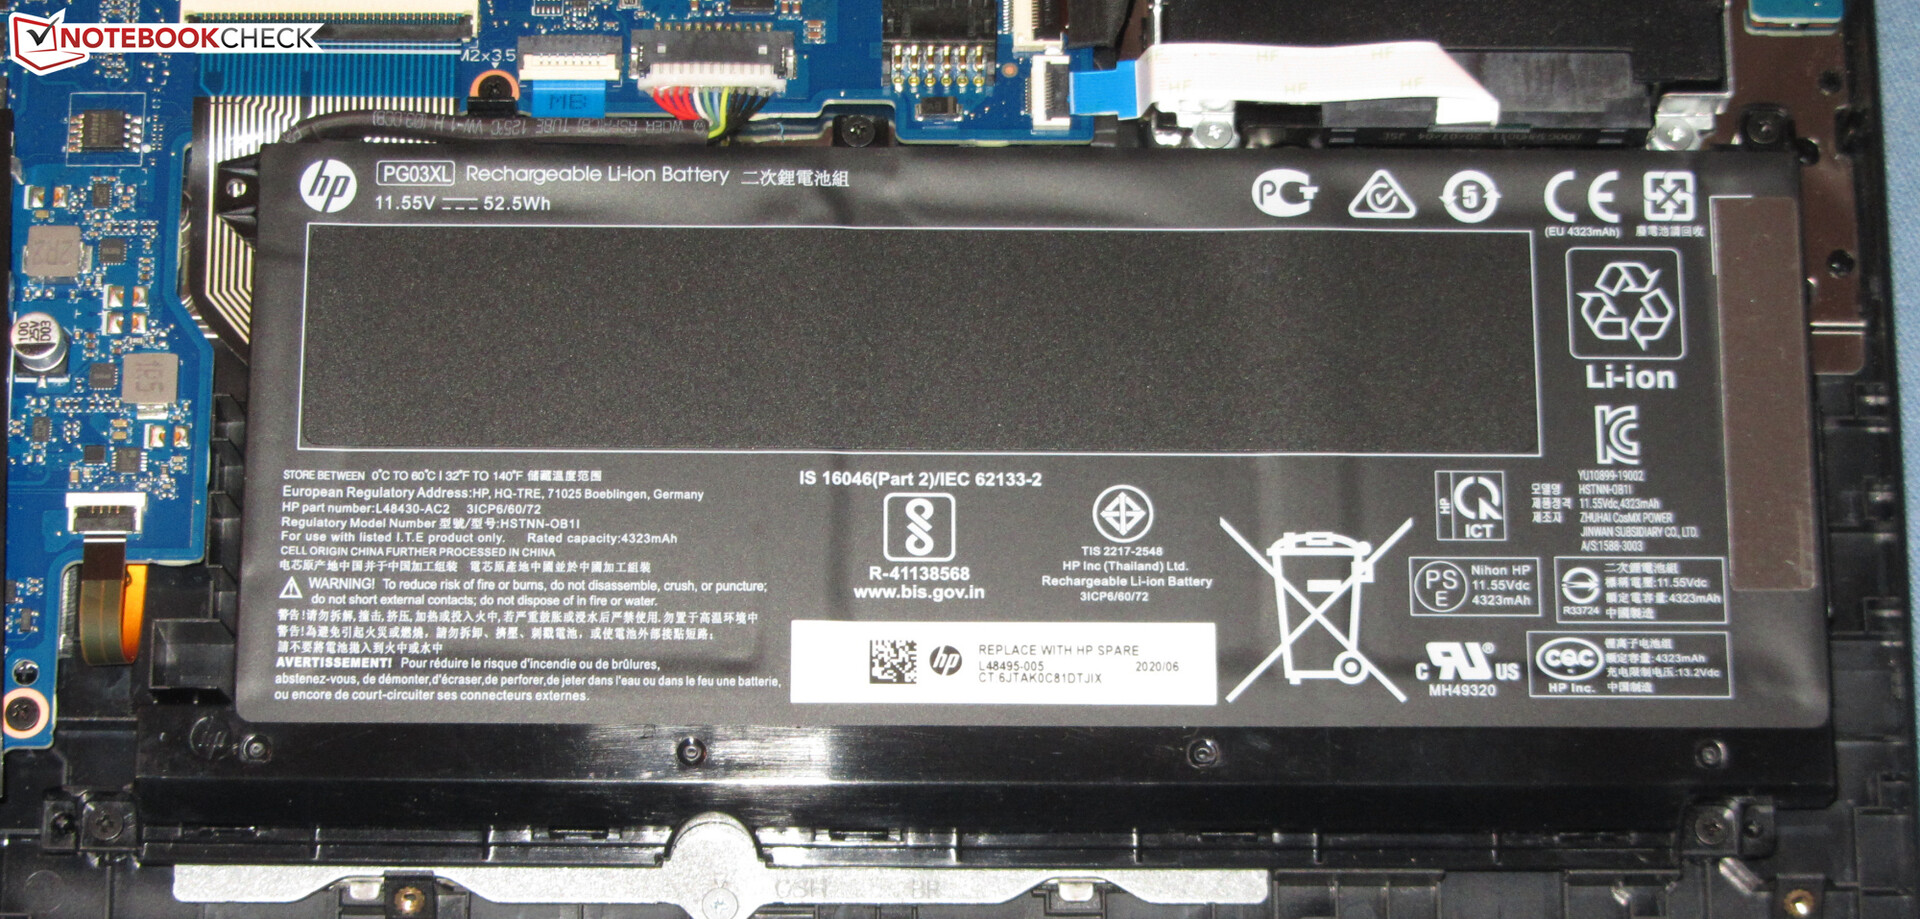
The hardware is equipped with 16 GB of RAM (2x 8 GB, dual-channel mode; 32 GB max.). At 512 GB, the storage space is a bit tight for a gaming laptop. Replacing the fast NVMe SSD would be possible. Alternatively, a 2.5-inch storage drive can be additionally installed. All maintenance and upgrade procedures require removing the bottom cover.
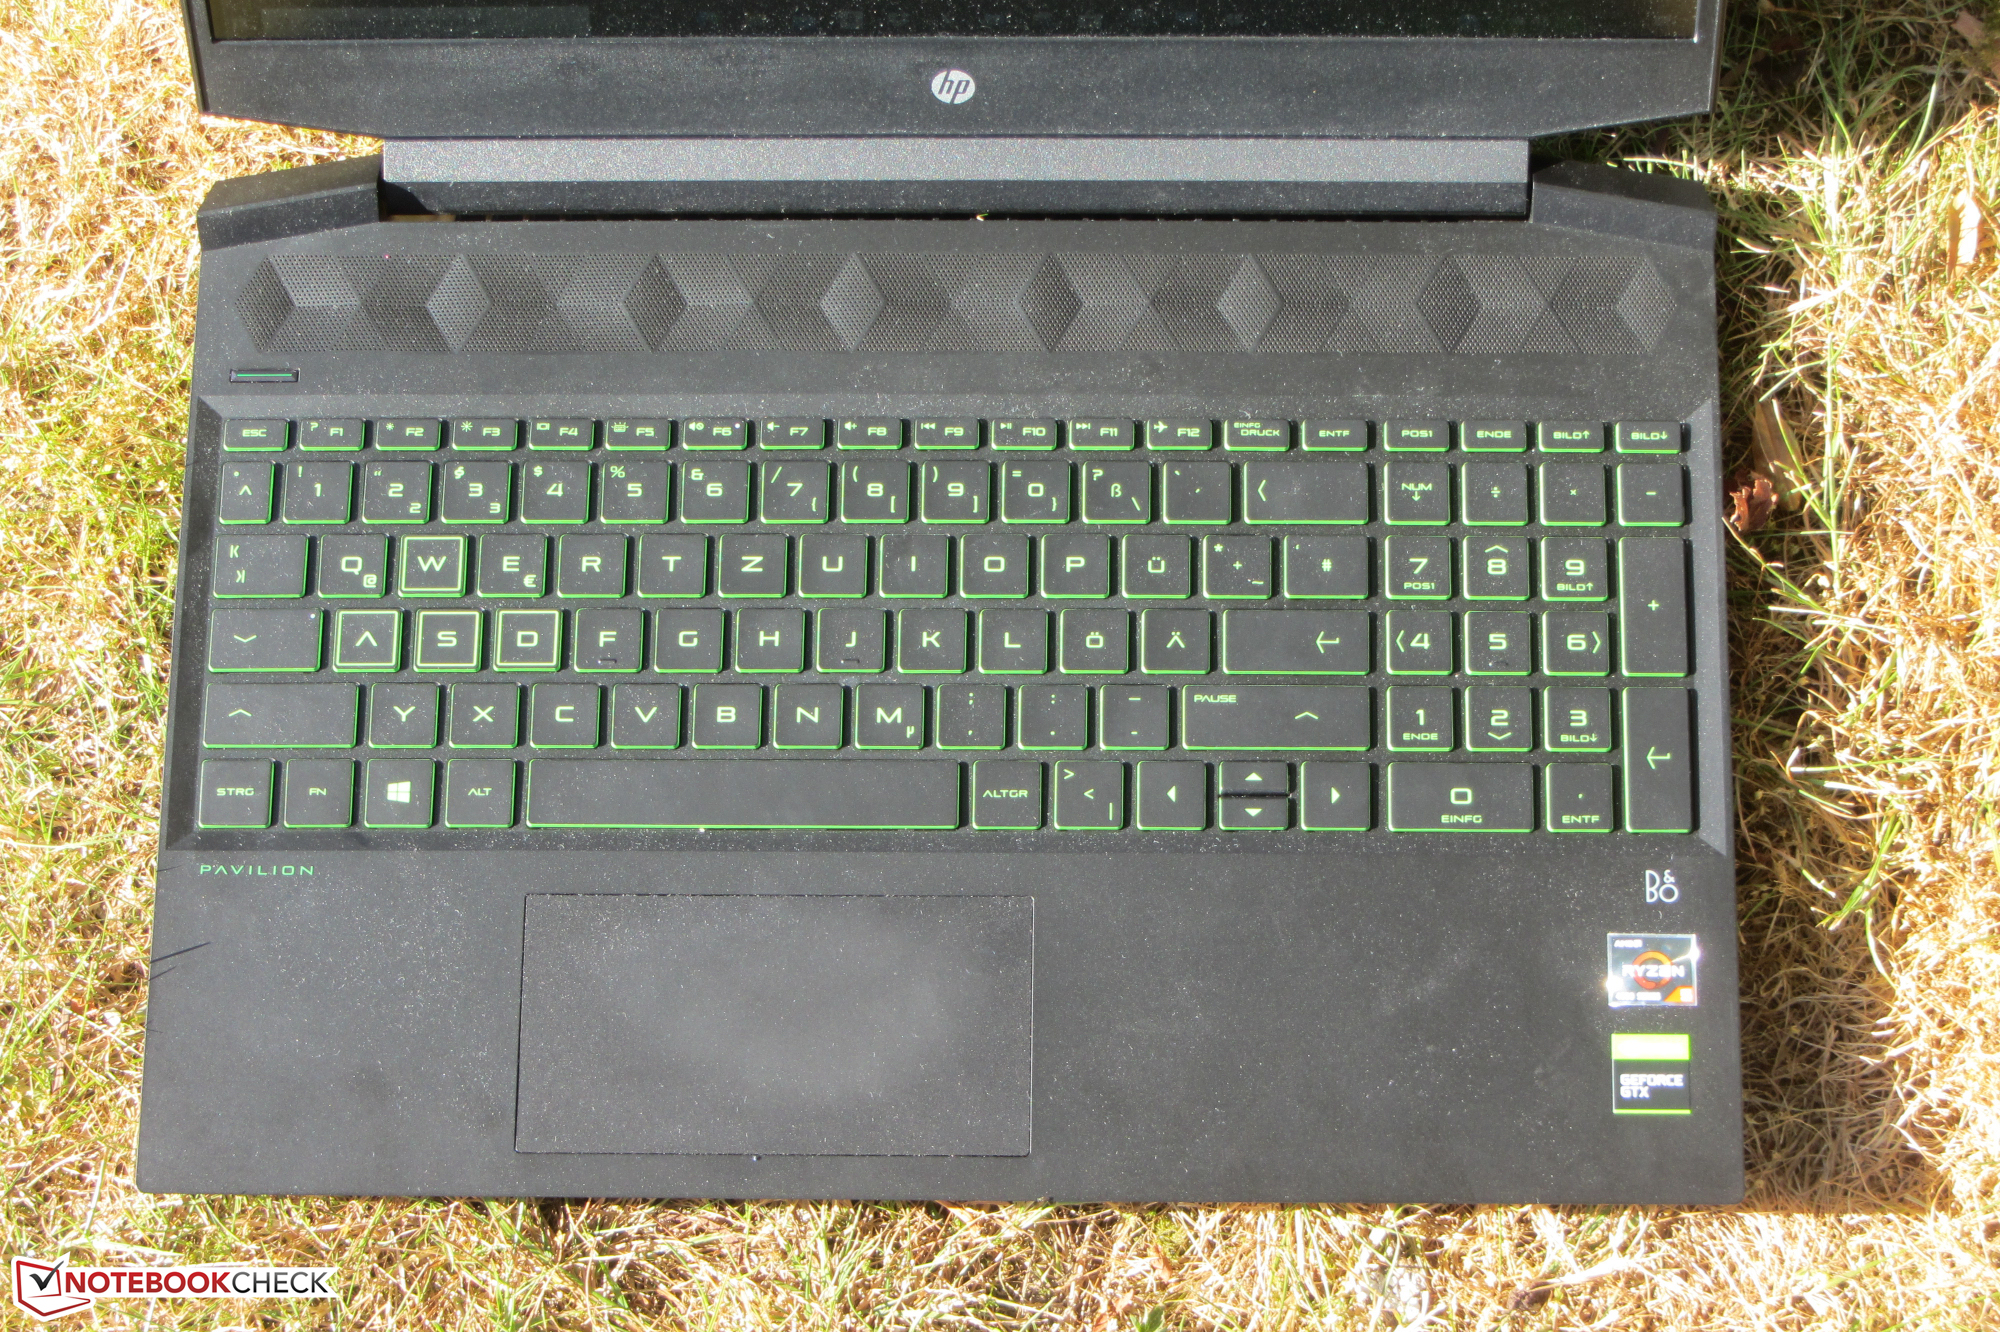
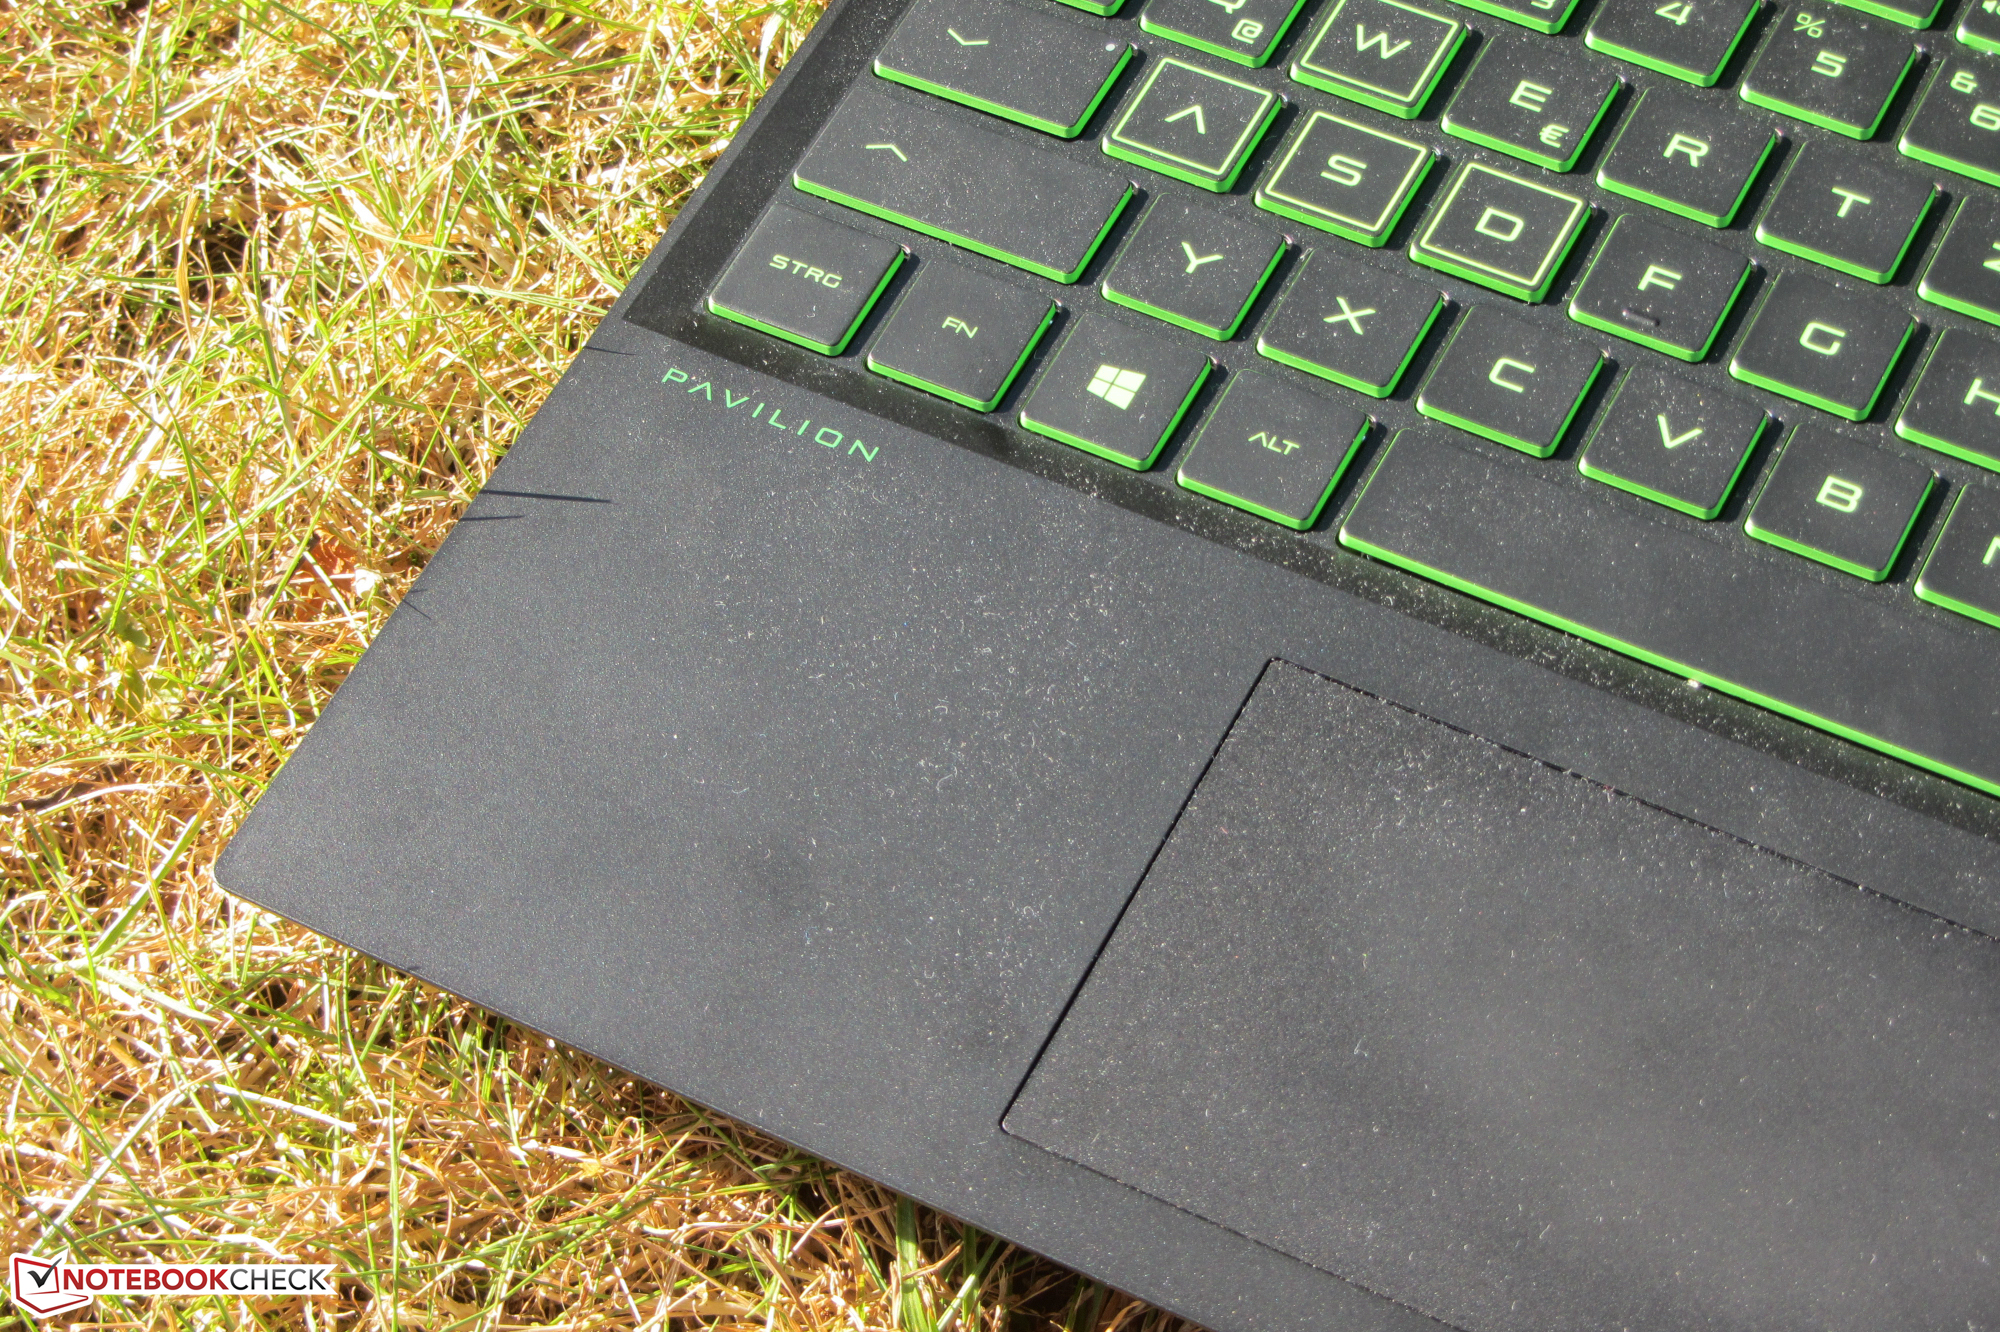
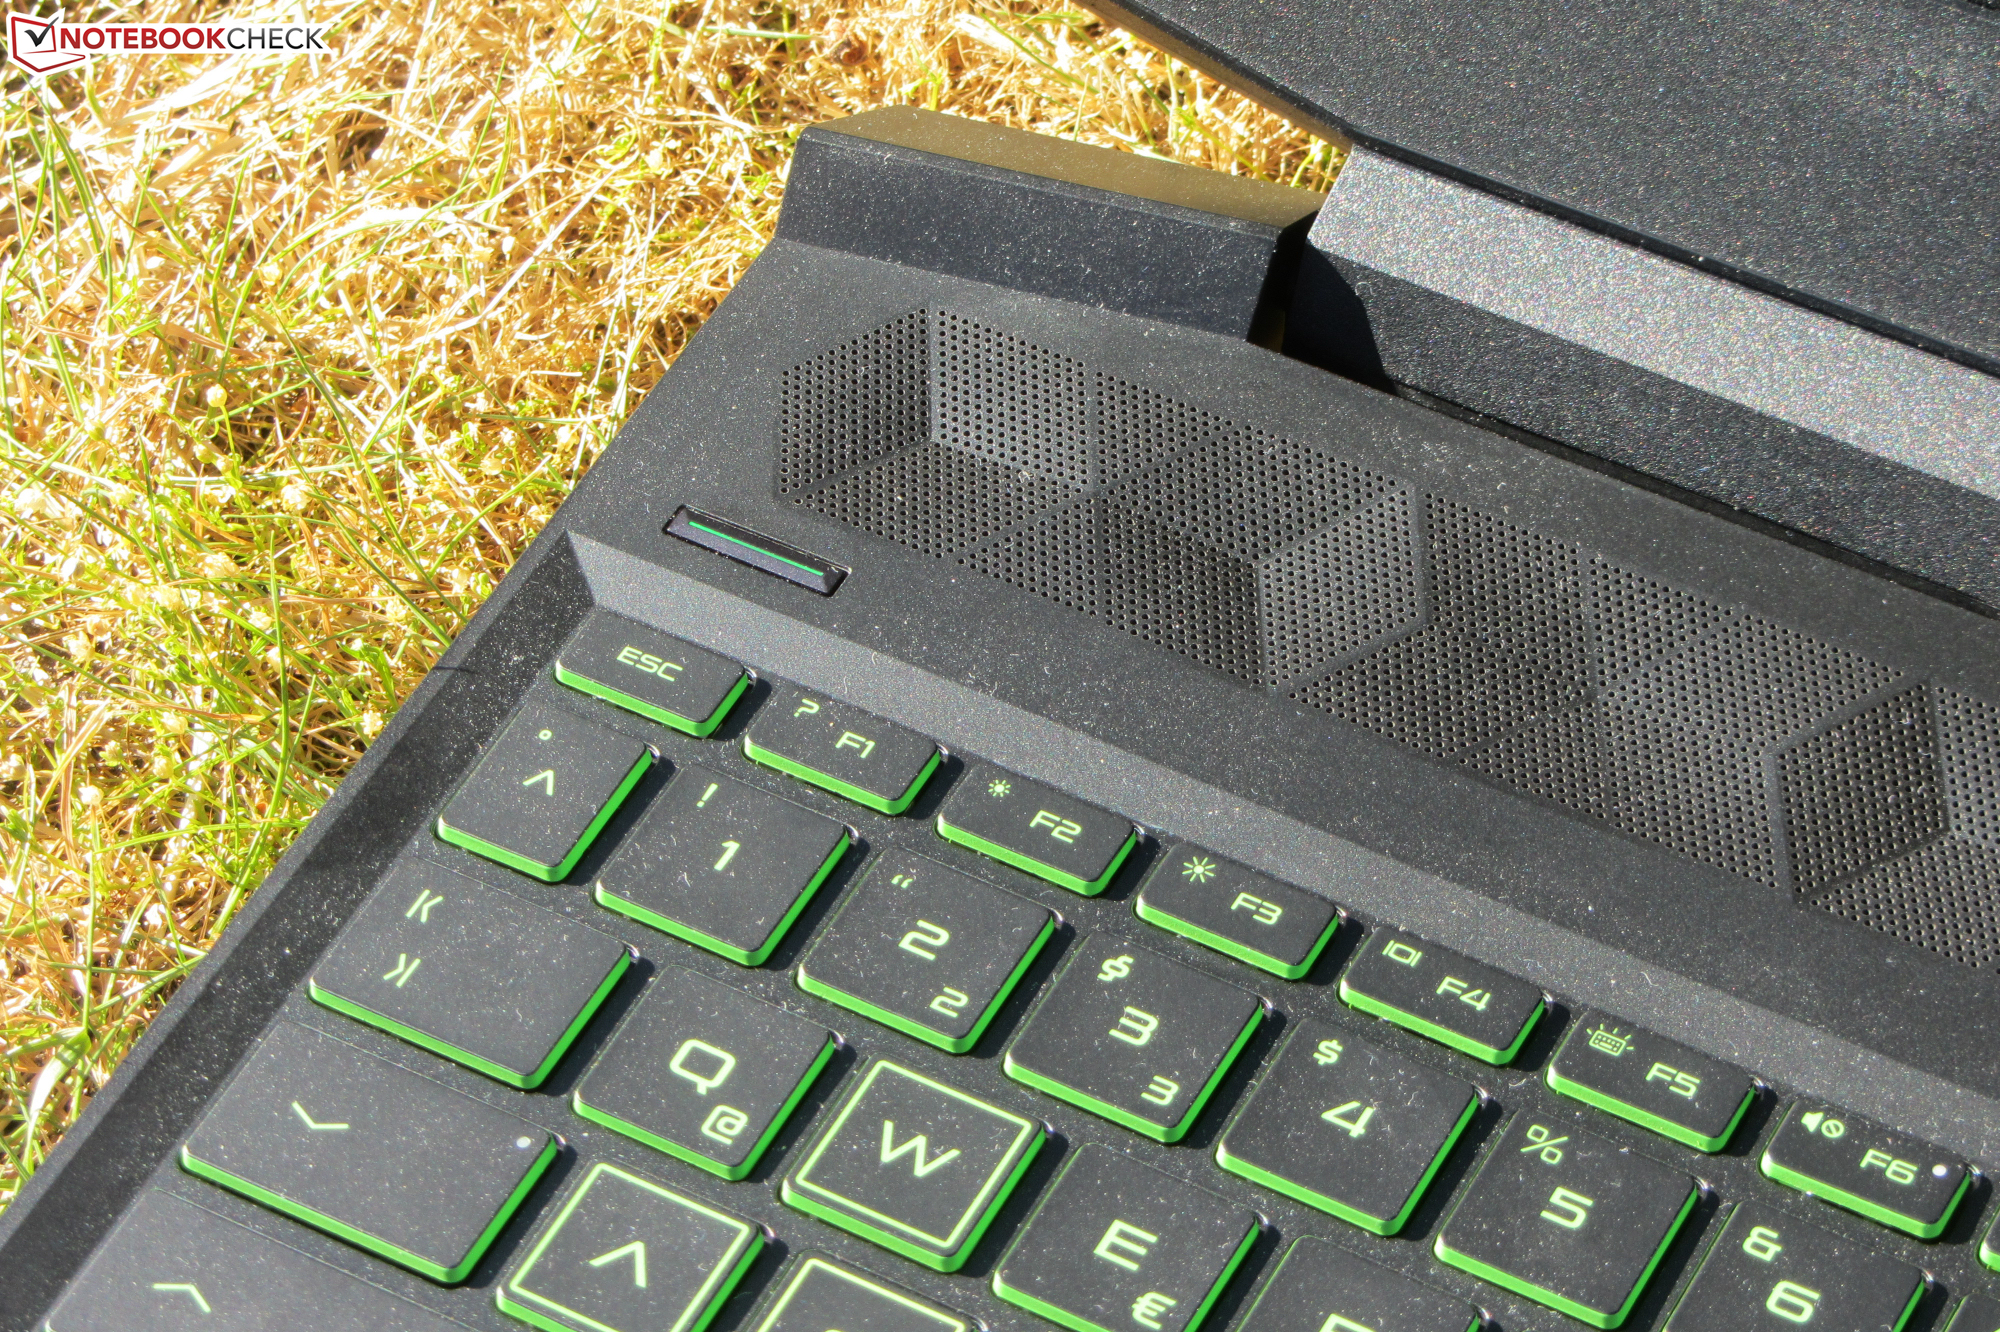
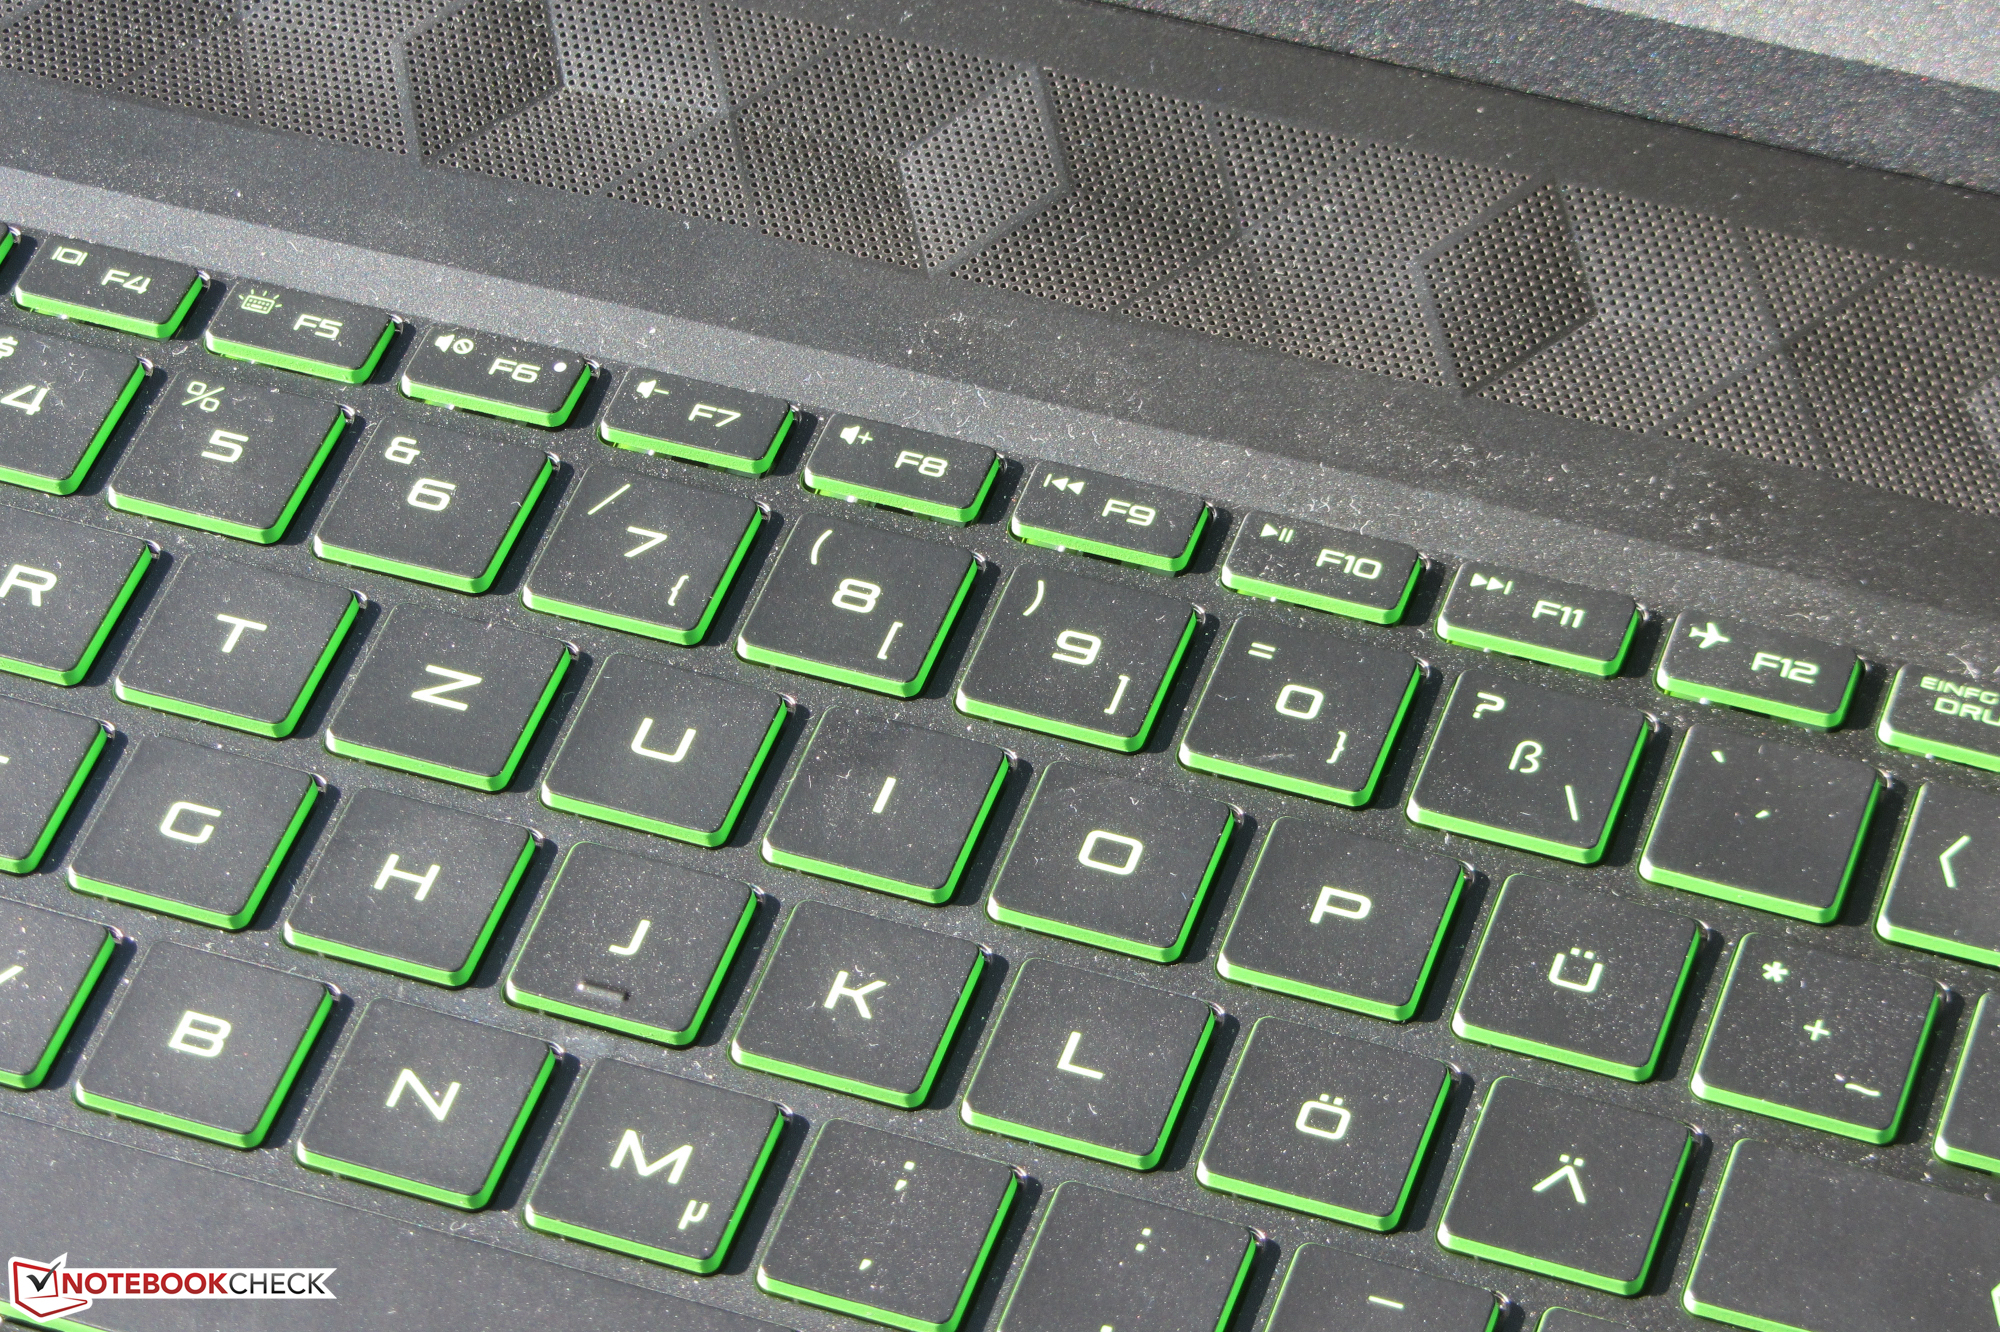
The battery life is perfectly acceptable, but it doesn't reach the very good values of the identically built sibling models. The chiclet keyboard (green backlight, two brightness levels) has proven to be suitable for everyday use. On the other hand, the laptop doesn't have a generous port configuration, but the most necessary connections are available.
The IPS display (Full HD, 144 Hz) scores points with a matte surface, stable viewing angles, high contrast, good brightness, fast response times, and great color reproduction. The color-space coverage is also pleasing.
HP Pavilion Gaming 15-ec1177ng
- 09/29/2020 v7 (old)
Sascha Mölck
Price comparison

