Asus ROG Strix G15 G512LI Laptop İnceleme: GeForce GTX 1650 Ti Graphics için 1000 $ USD Çok Fazla
Asus, bu yıl oyun dizüstü bilgisayarlarının çoğuna G14, G15 ve G17 son eklerini ekliyor, böylece alıcılar sırasıyla 14 inç, 15,6 inç ve 17,3 inç ekran boyutlarını daha kolay tanımlayabiliyor. Yeni ROG Strix G15 G512 serisi, 2019'dan beri mevcut olan ROG Strix GL531 / G531 serisinin daha ucuz versiyonudur. SKU'lar GeForce GTX 1650 Ti grafikli Core i5-10300H CPU ve Core'a kadar 144 Hz 1080p ekran RTX 2070 Süper grafik kartı ve 240 Hz 1080p ekran ile i7-10875H. İncelenen birimimiz, yaklaşık 1000 ila 1100 ABD Doları perakende satış için Core i7-10750H, GTX 1650 Ti ve 144 Hz paneliyle daha düşük bir yapılandırmadır. 15.6 inç G512 serisi ve 17.3 inç G712 serisi için resmi özellikler burada bulunabilir. 15,6 inç bütçe orta kademe segmenti Gigabyte Aorus 15G, MSI GP65 veya GF65, HP Pavilion gibi seçeneklerle dolu olduğu için rakipler çoktur. Gaming 15, Lenovo Legion Y540-15 ve Dell G5 15 serisi.Daha fazla Asus yorumu: ROG Strix Scar 17 G732LXSVivoBook 17 S712FATUF A15ZenBook Flip 14ProArt StudioBook Pro 17
Derecelendirme | Tarih | Modeli | Ağırlık | Yükseklik | Boyut | Çözünürlük | Fiyat |
|---|---|---|---|---|---|---|---|
| 80.8 % v7 (old) | 07/2020 | Asus ROG Strix G15 G512LI i7-10750H, GeForce GTX 1650 Ti Mobile | 2.3 kg | 25.8 mm | 15.60" | 1920x1080 | |
| 82.7 % v7 (old) | Asus TUF Gaming A15 FA506IV-HN172 R7 4800H, GeForce RTX 2060 Mobile | 2.2 kg | 24.9 mm | 15.60" | 1920x1080 | ||
| 82.1 % v7 (old) | Asus Strix Scar III G531GW-AZ062T i7-9750H, GeForce RTX 2070 Mobile | 2.4 kg | 25 mm | 15.60" | 1920x1080 | ||
| 83.2 % v7 (old) | 05/2020 | MSI GP65 10SFK-047US i7-10750H, GeForce RTX 2070 Mobile | 2.3 kg | 27.5 mm | 15.60" | 1920x1080 | |
| 83.7 % v7 (old) | 06/2020 | Dell G5 15 SE 5505 P89F R7 4800H, Radeon RX 5600M | 2.4 kg | 21.6 mm | 15.60" | 1920x1080 | |
| 81.5 % v7 (old) | HP Omen 15-dc1020ng i5-9300H, GeForce GTX 1650 Mobile | 2.3 kg | 25 mm | 15.60" | 1920x1080 |
Durum
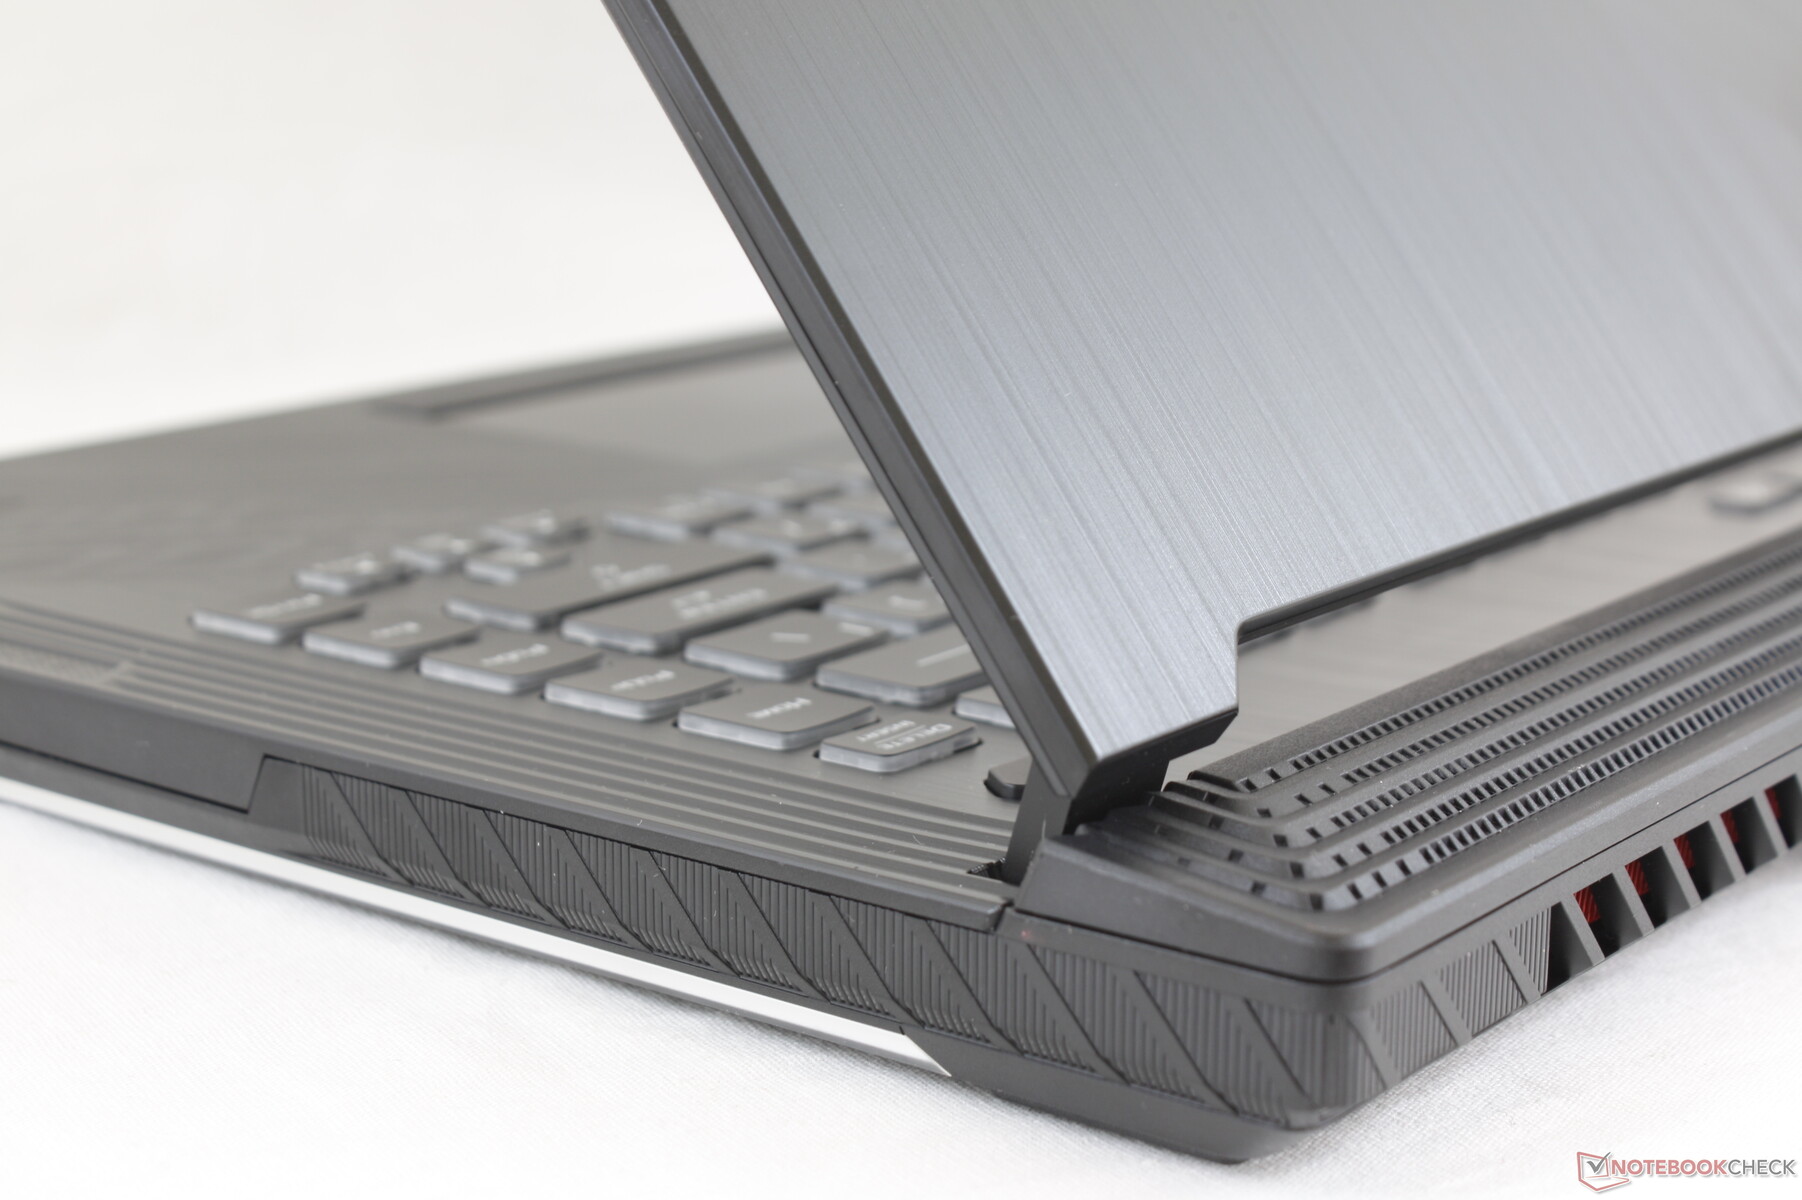
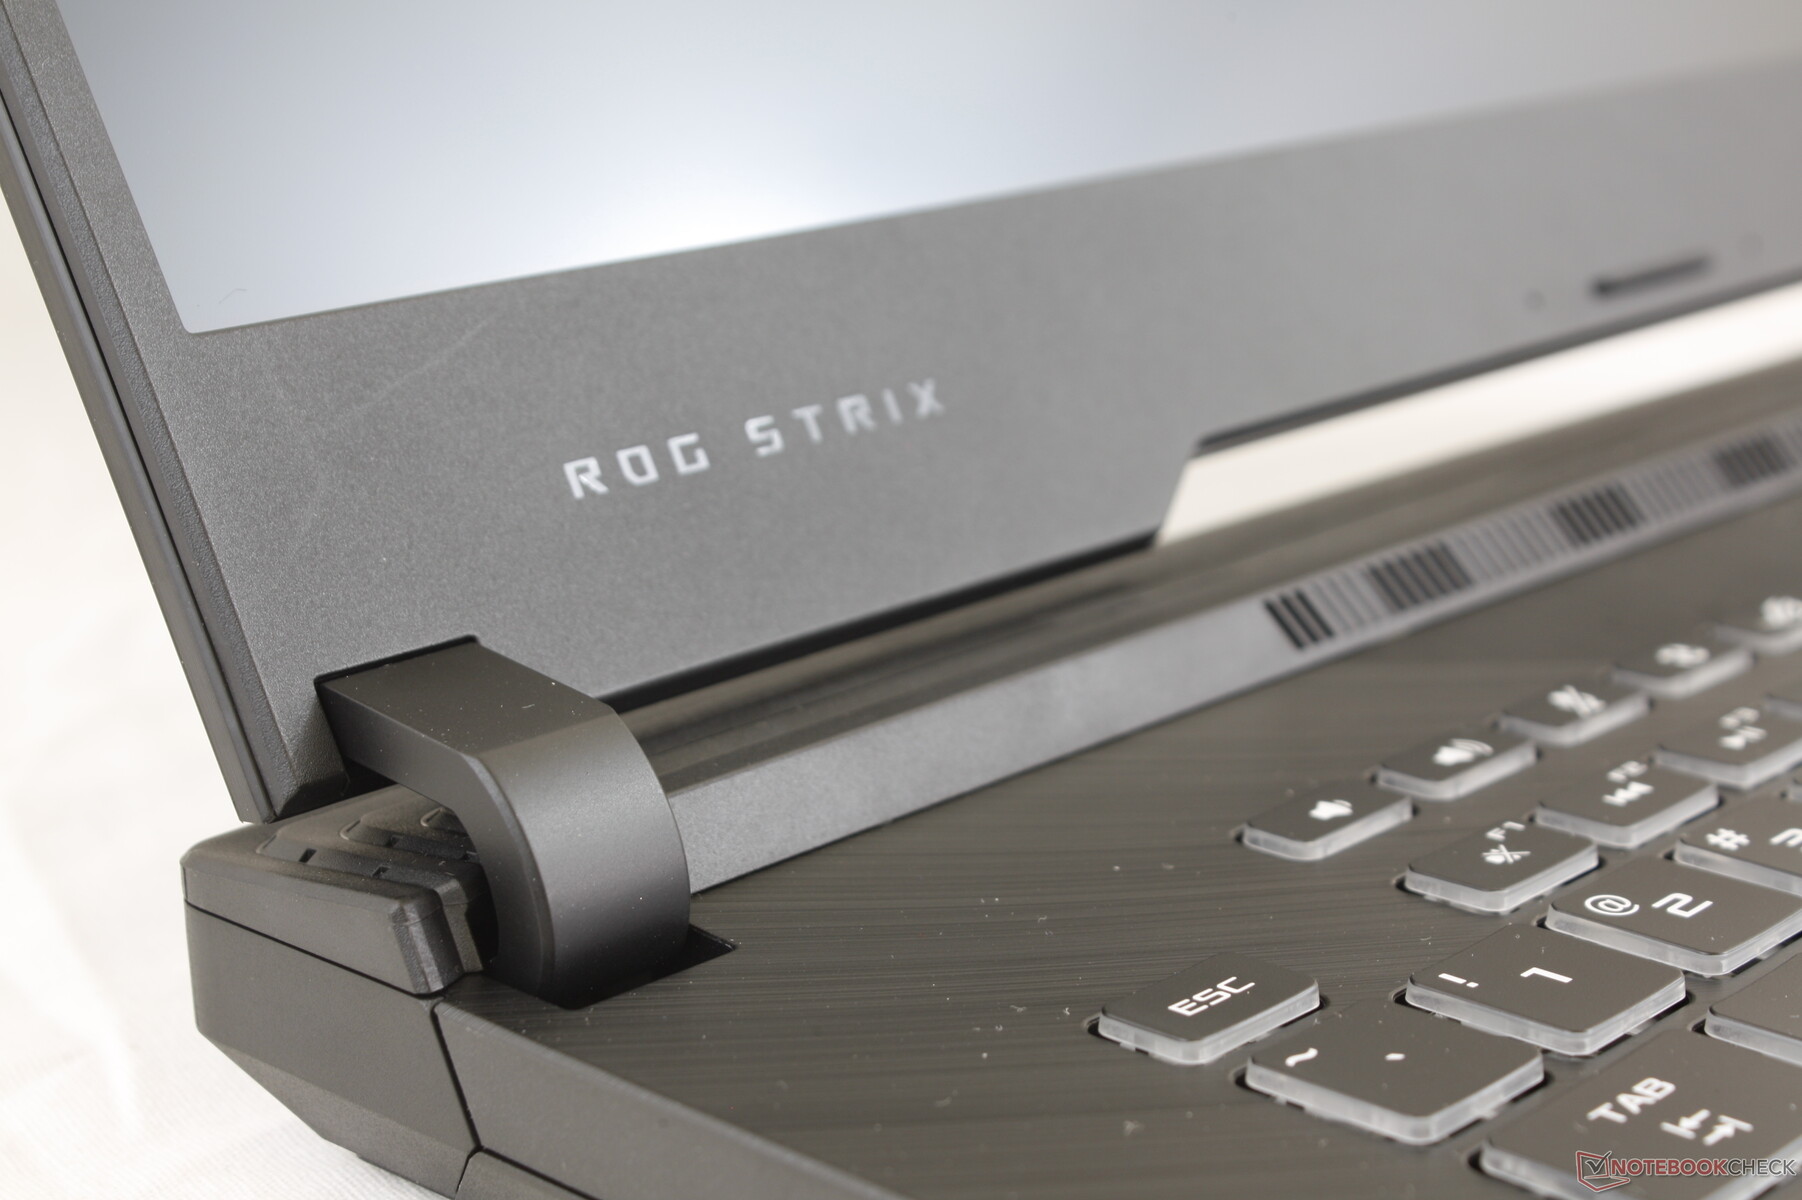
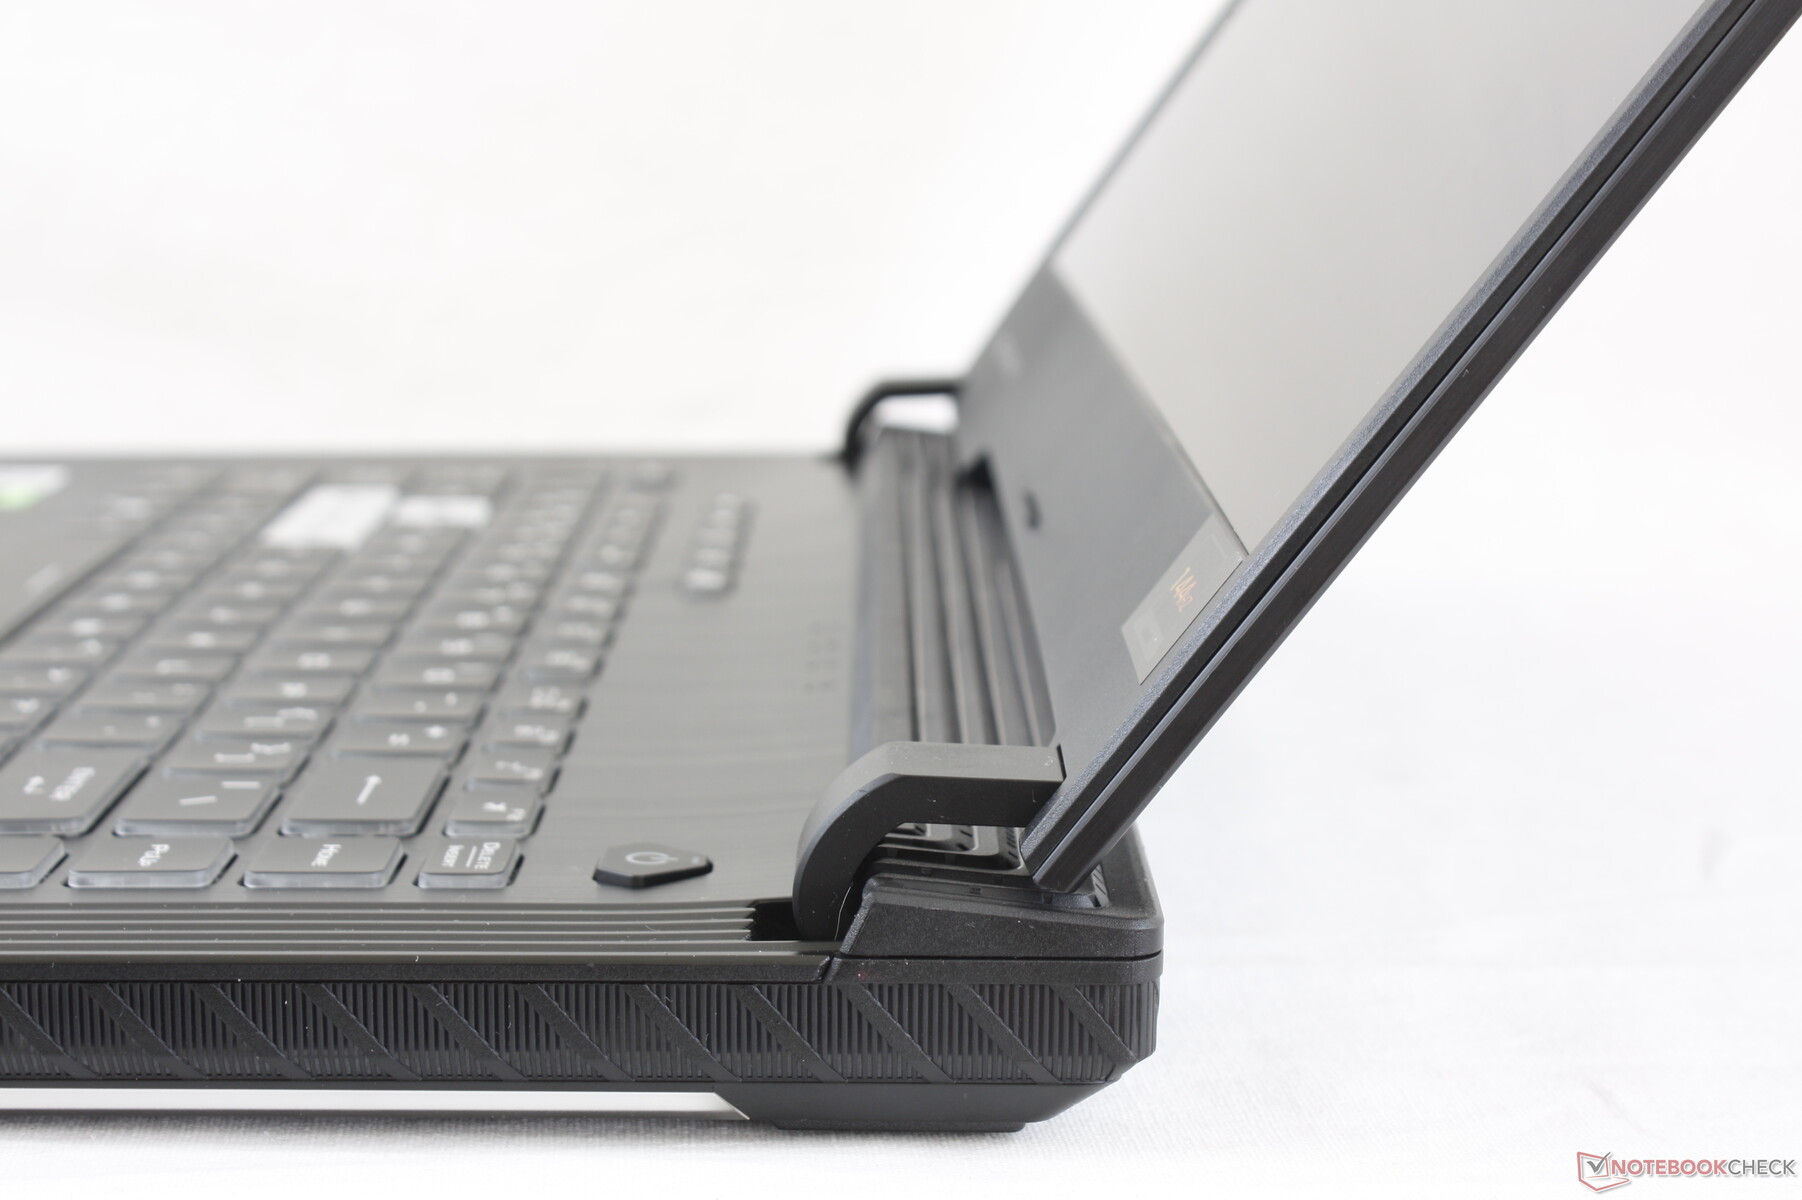
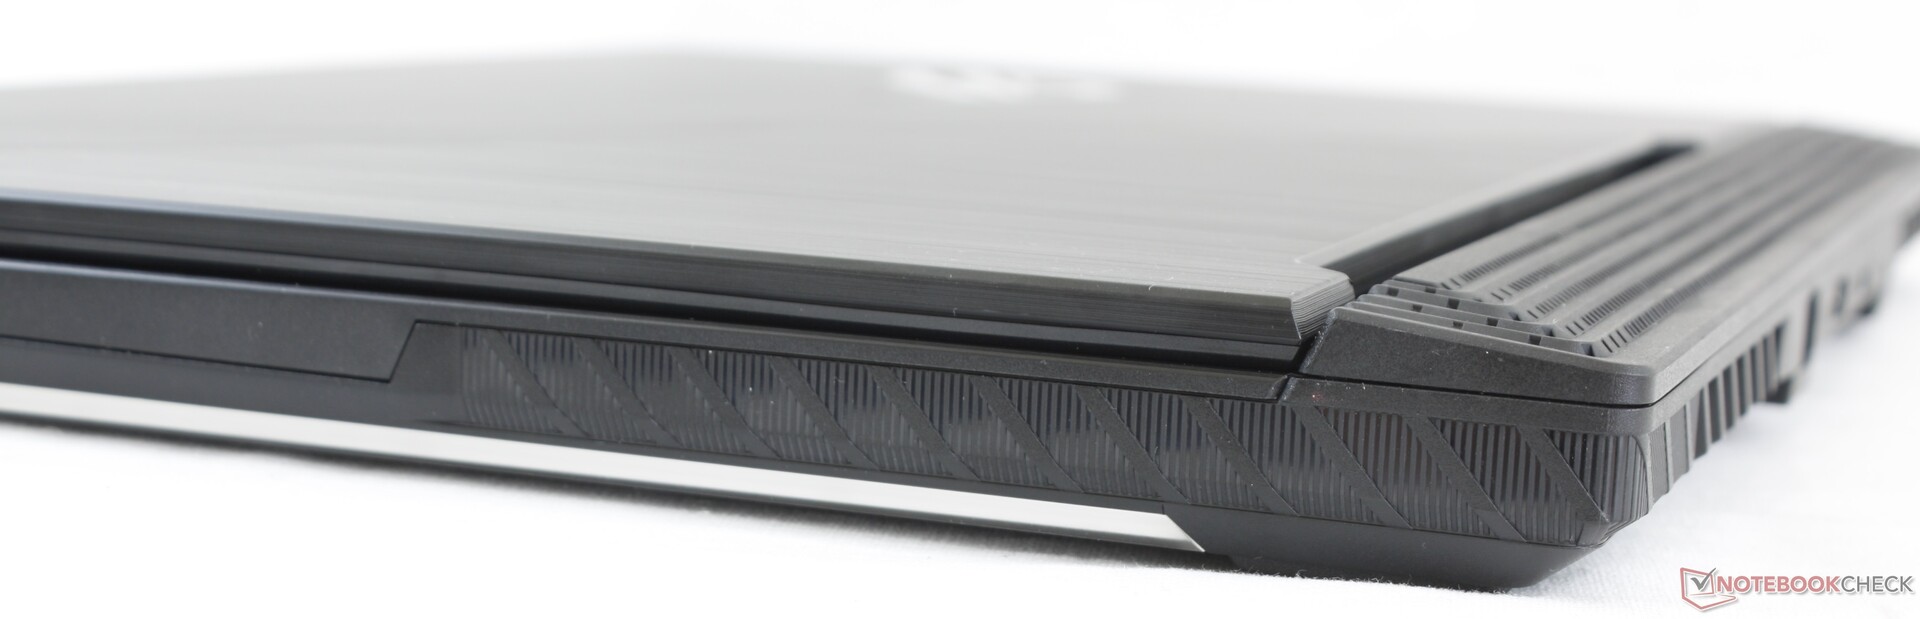
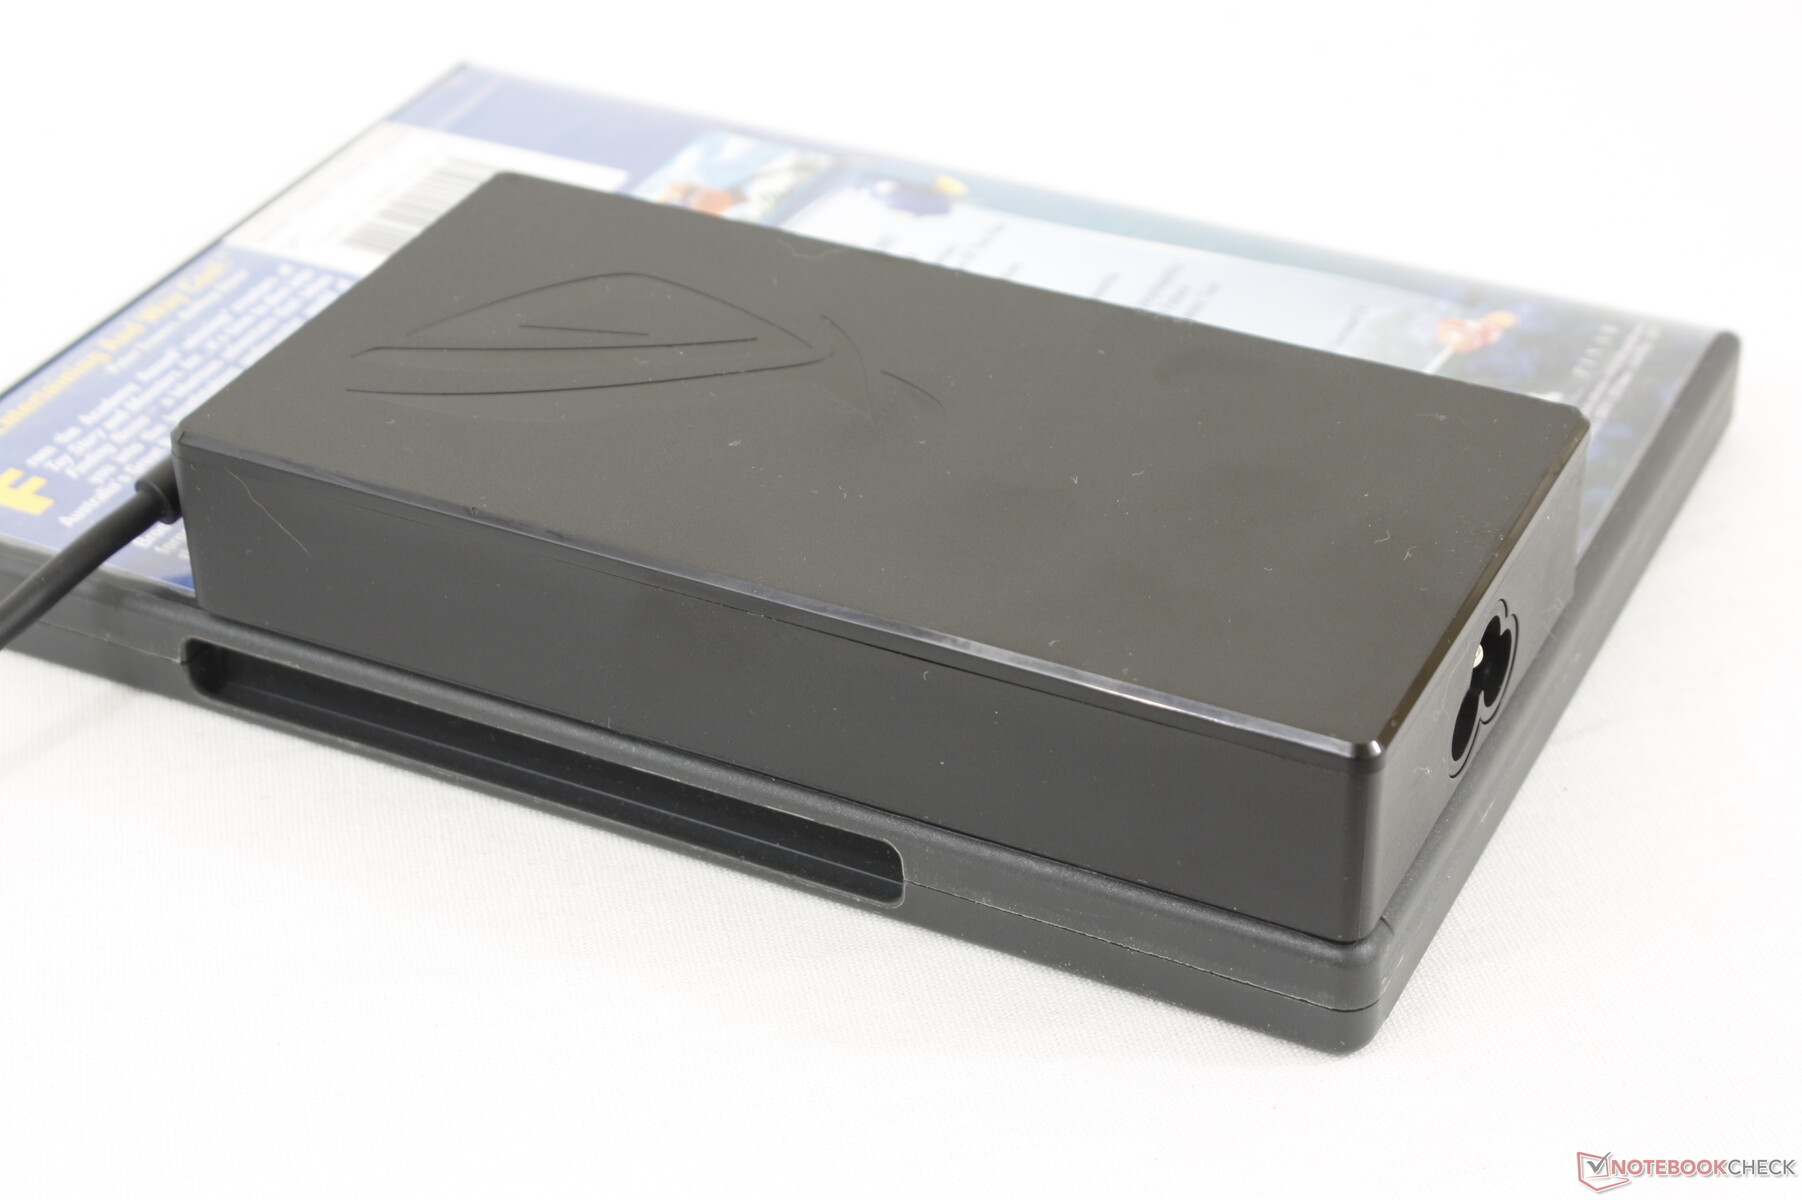
ROG G531'i alın, metal malzemelerini plastikle değiştirin ve kendinizi ROG G15 G512'ye sahip olacaksınız. G512, neredeyse aynı görsel tasarımı taşımasına rağmen, G531'e kıyasla dokunuşa daha ucuz görünüyor ve hissediyor. Ancak şasi sertliği, G531'den çok daha kötü görünmüyor. Asus, kapak hala istediğimizden daha esnekken nispeten güçlü kalıyor.Asus Keystone bu makineyle uyumlu değil, çünkü Asus sadece daha üst düzey ROG dizüstü bilgisayarlarda görünen bu daha az bilinen özellik hakkında kararlı.
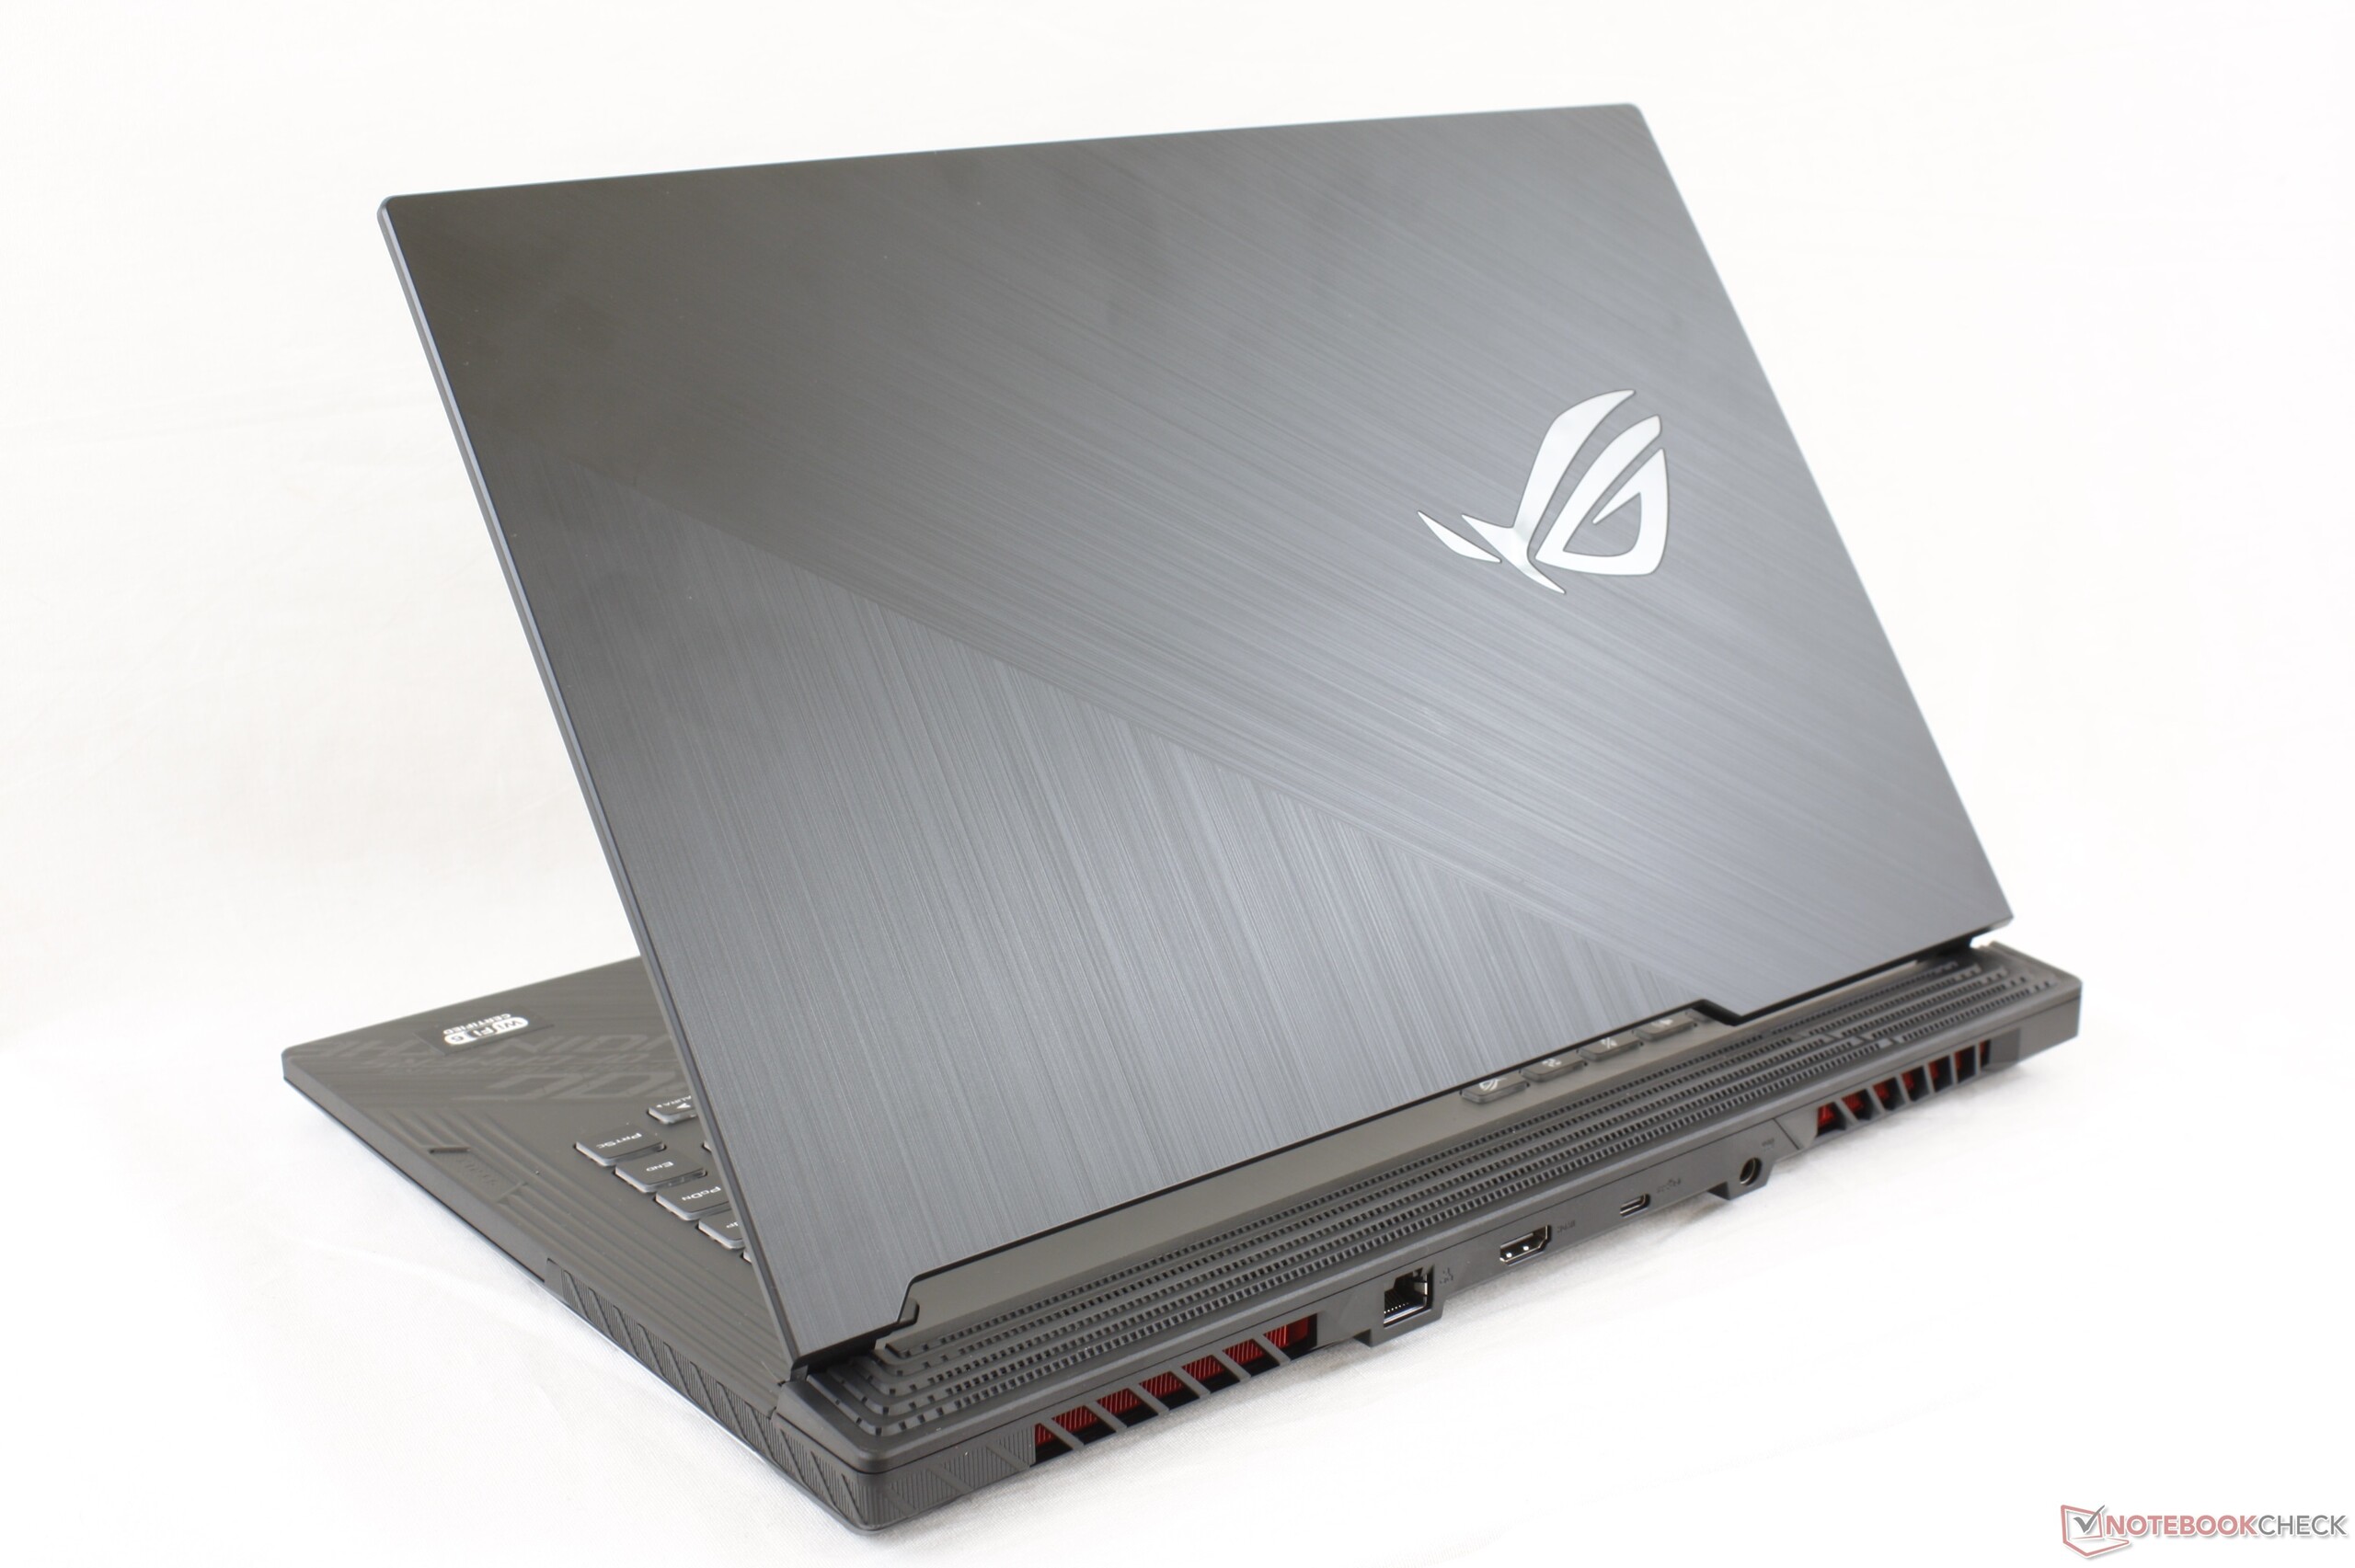
Genişletilmiş arka kısmı nedeniyle, Strix G15 G512, Dell G5 15 SE, MSI GP65 ve hatta Asus'un kendi TUF A15'i de dahil olmak üzere diğer birçok oyun dizüstü bilgisayarından daha büyük. Neyse ki, sistem fiyat aralığı ve kategorisi için ortalama olarak yaklaşık 2,3 kg ağırlığında değildir.
Bağlantı
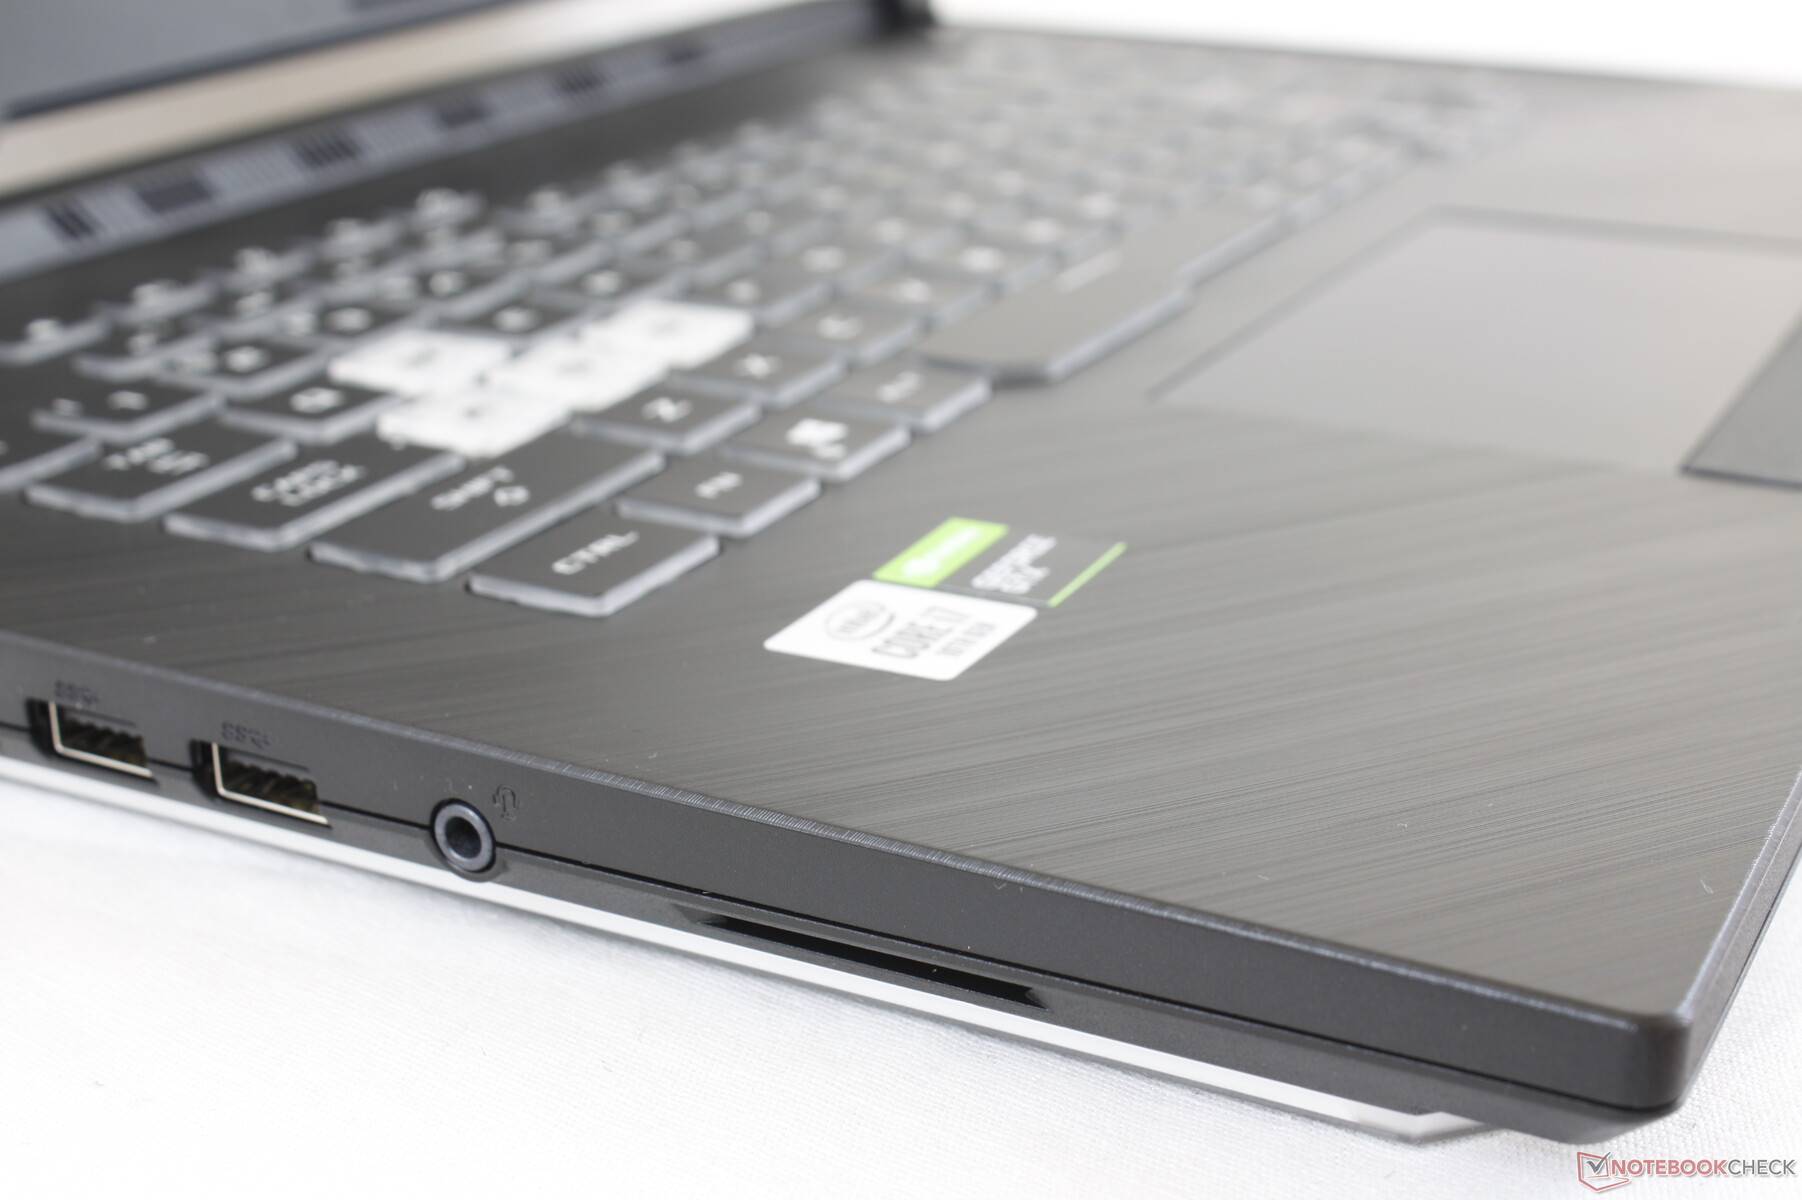
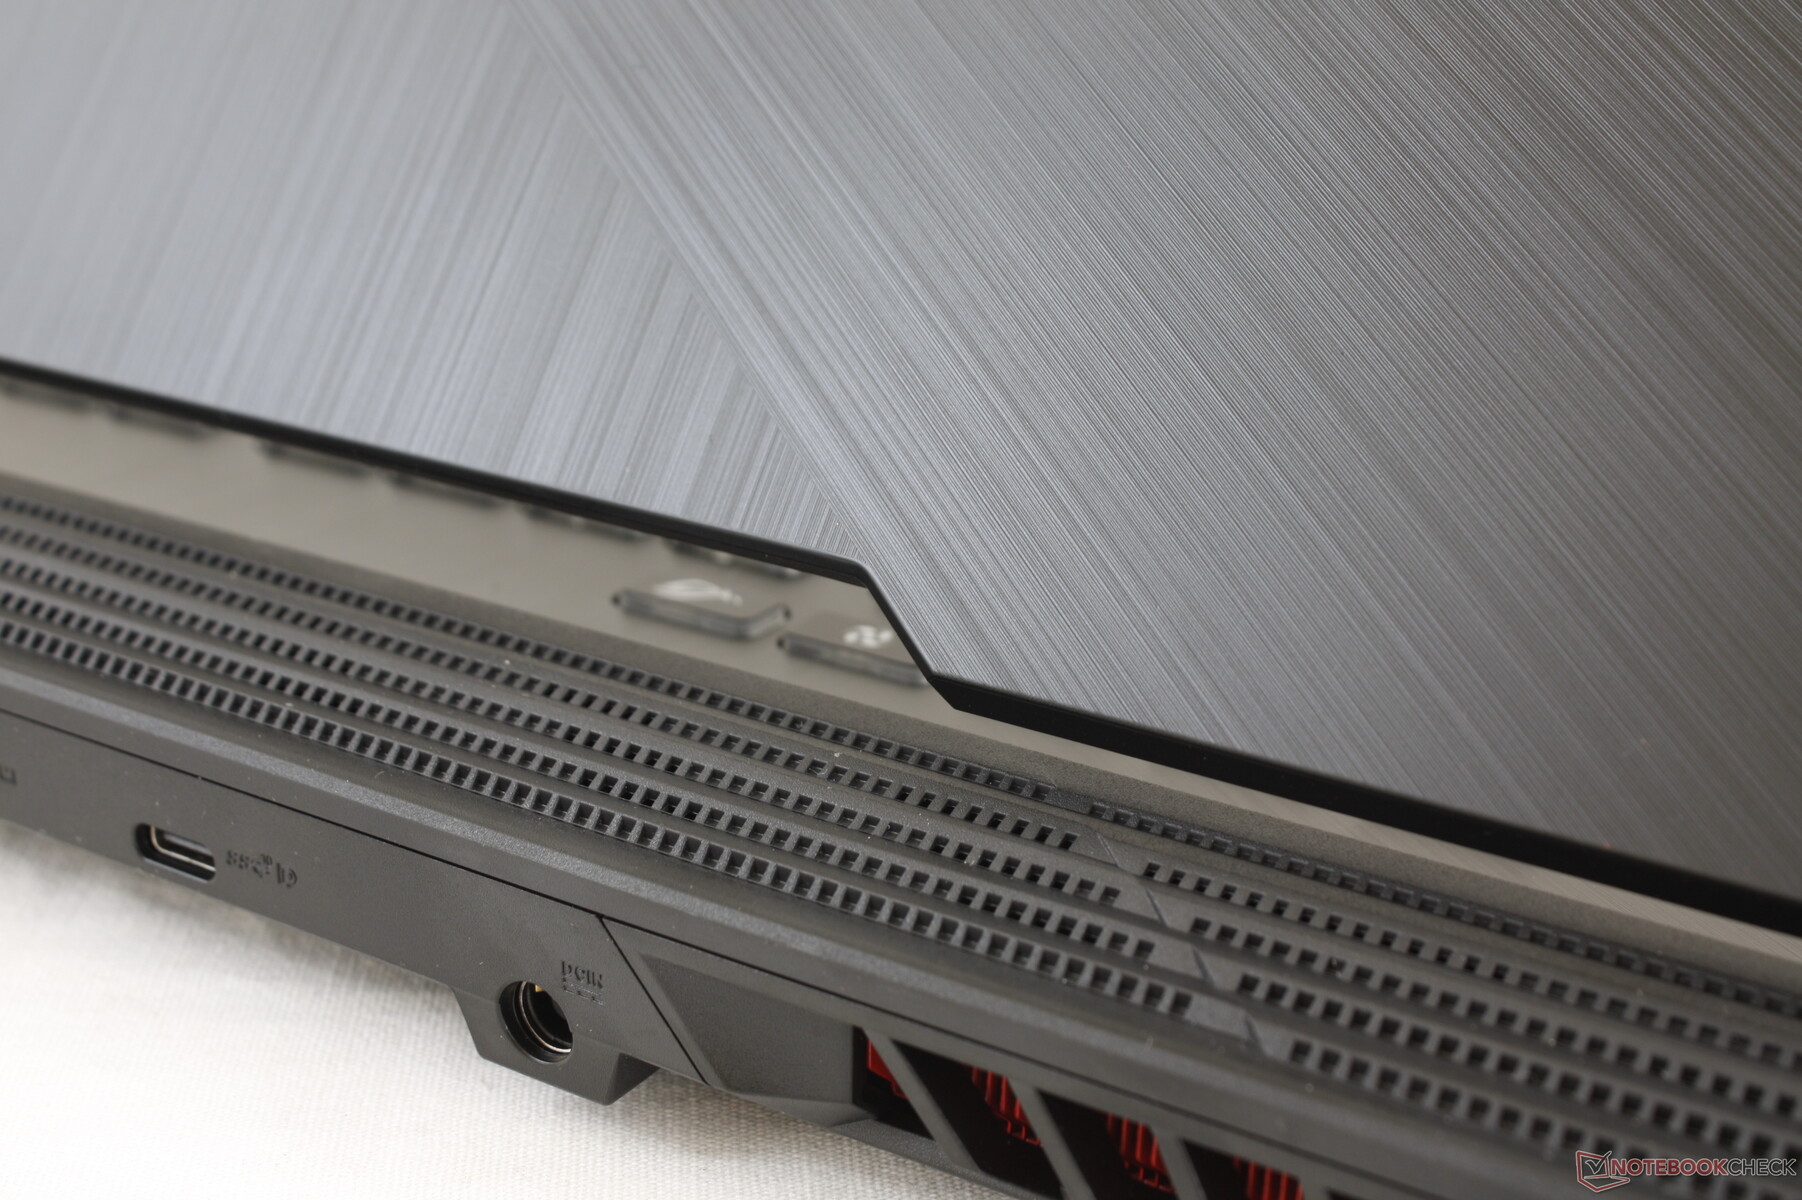
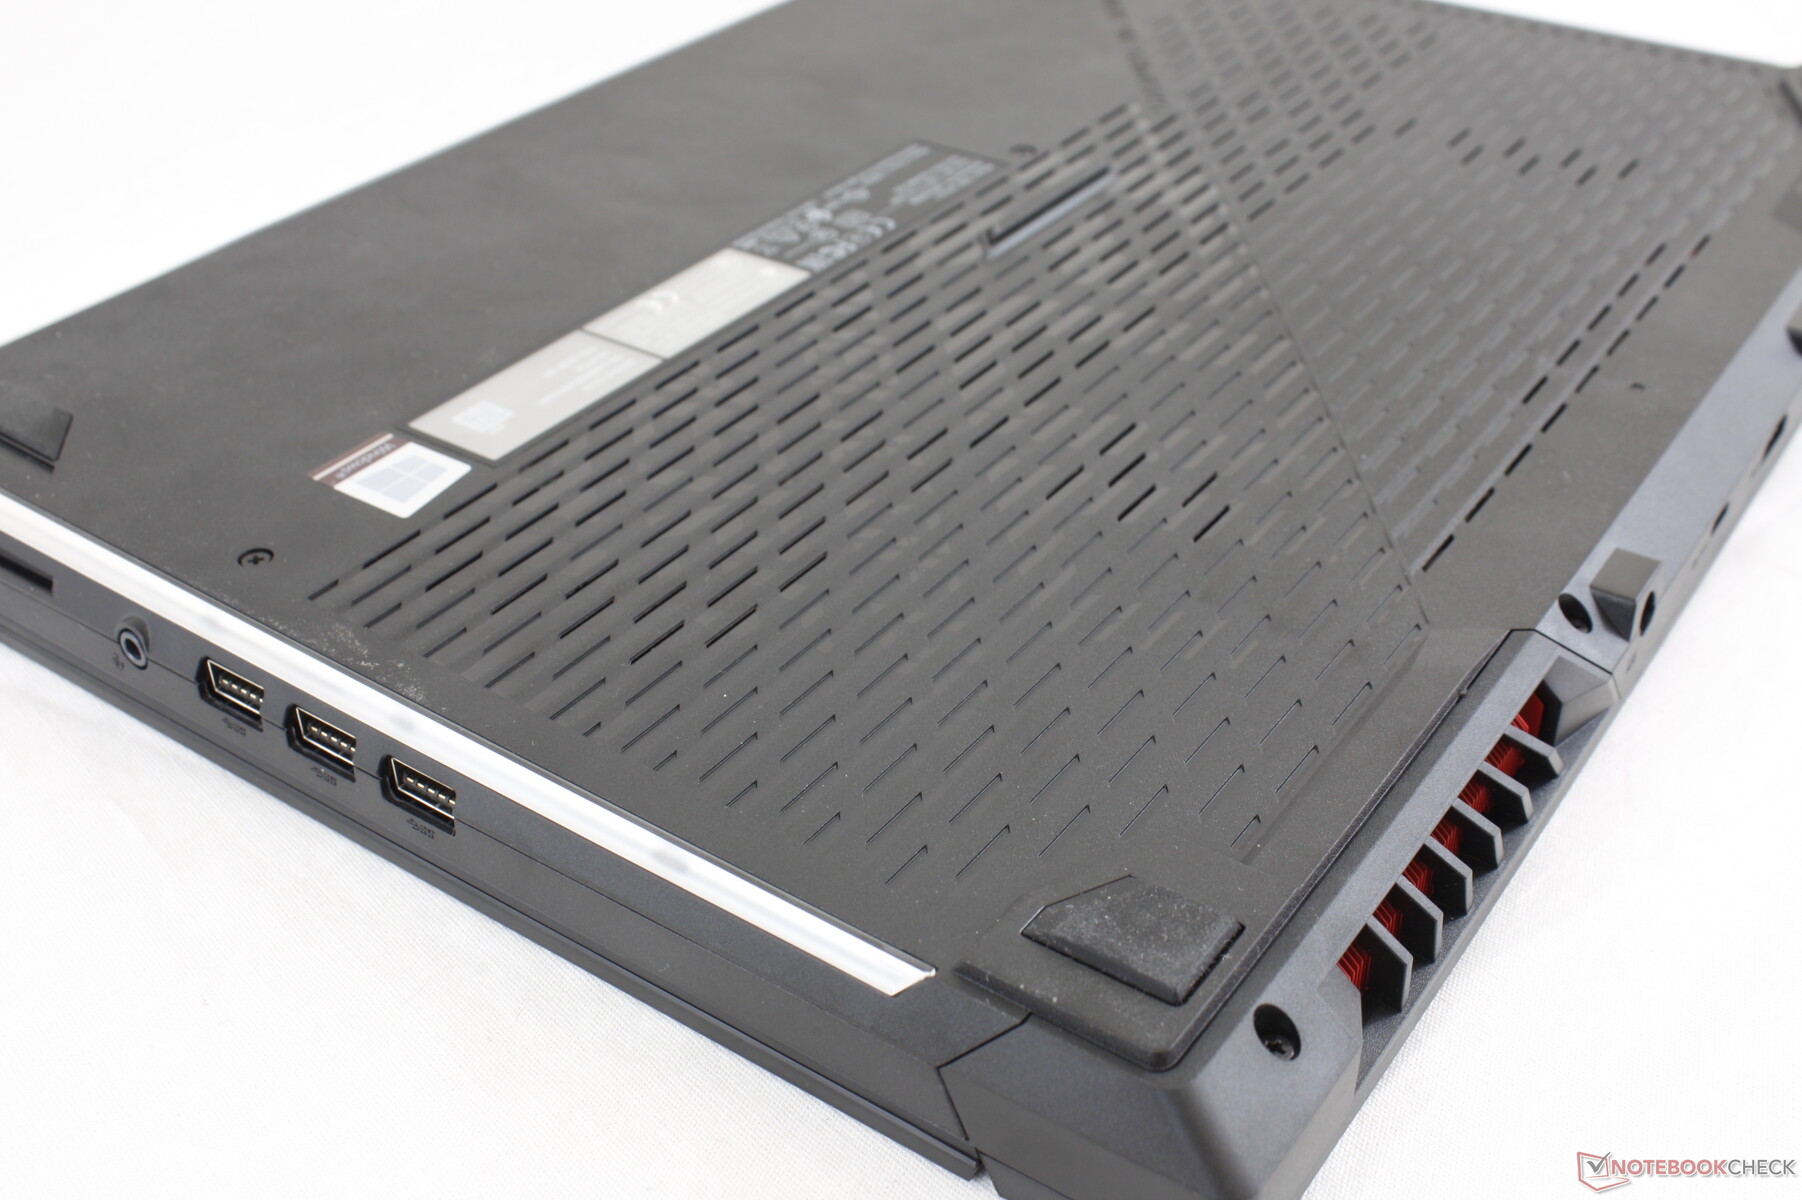
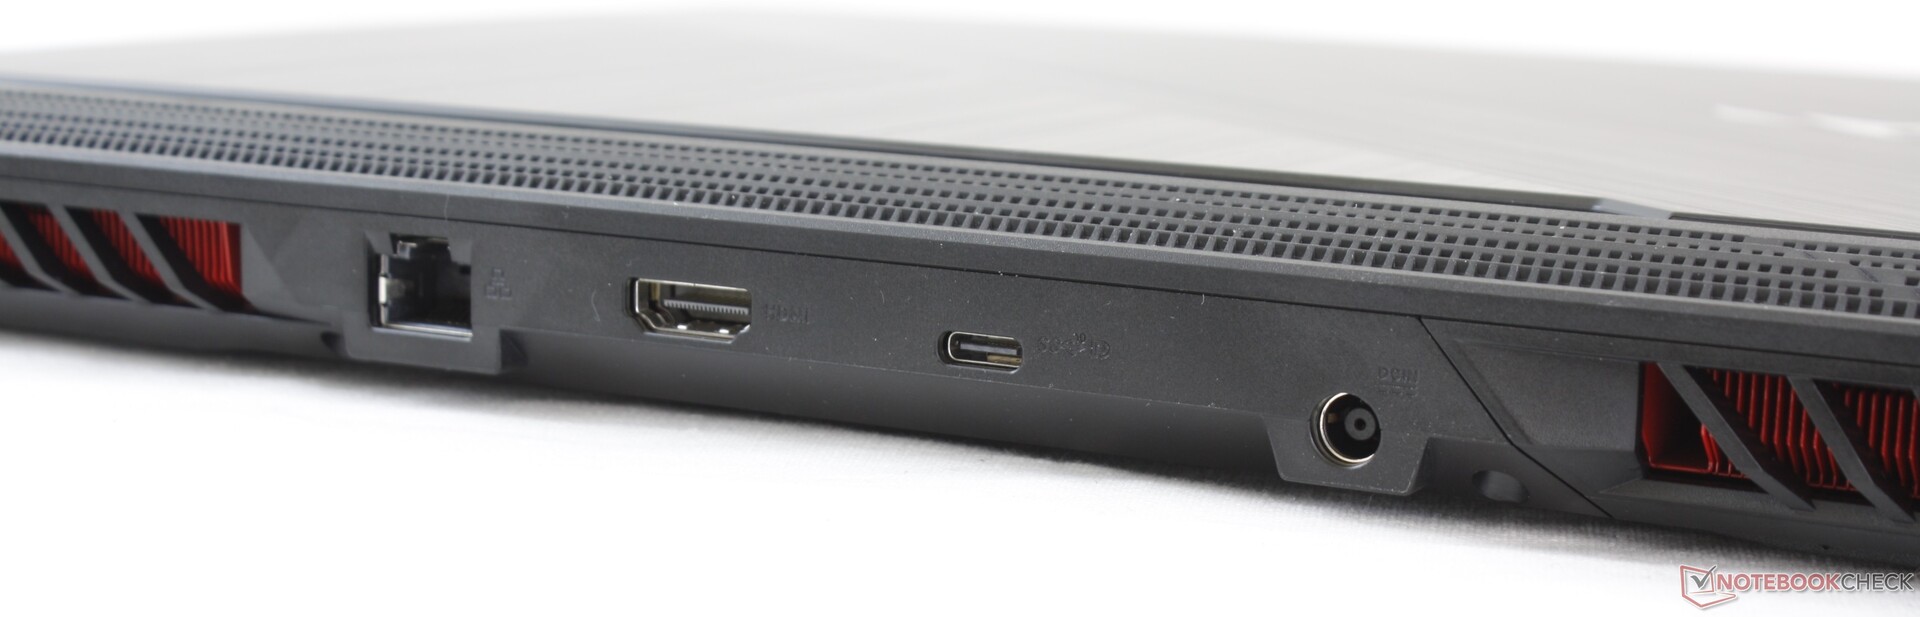
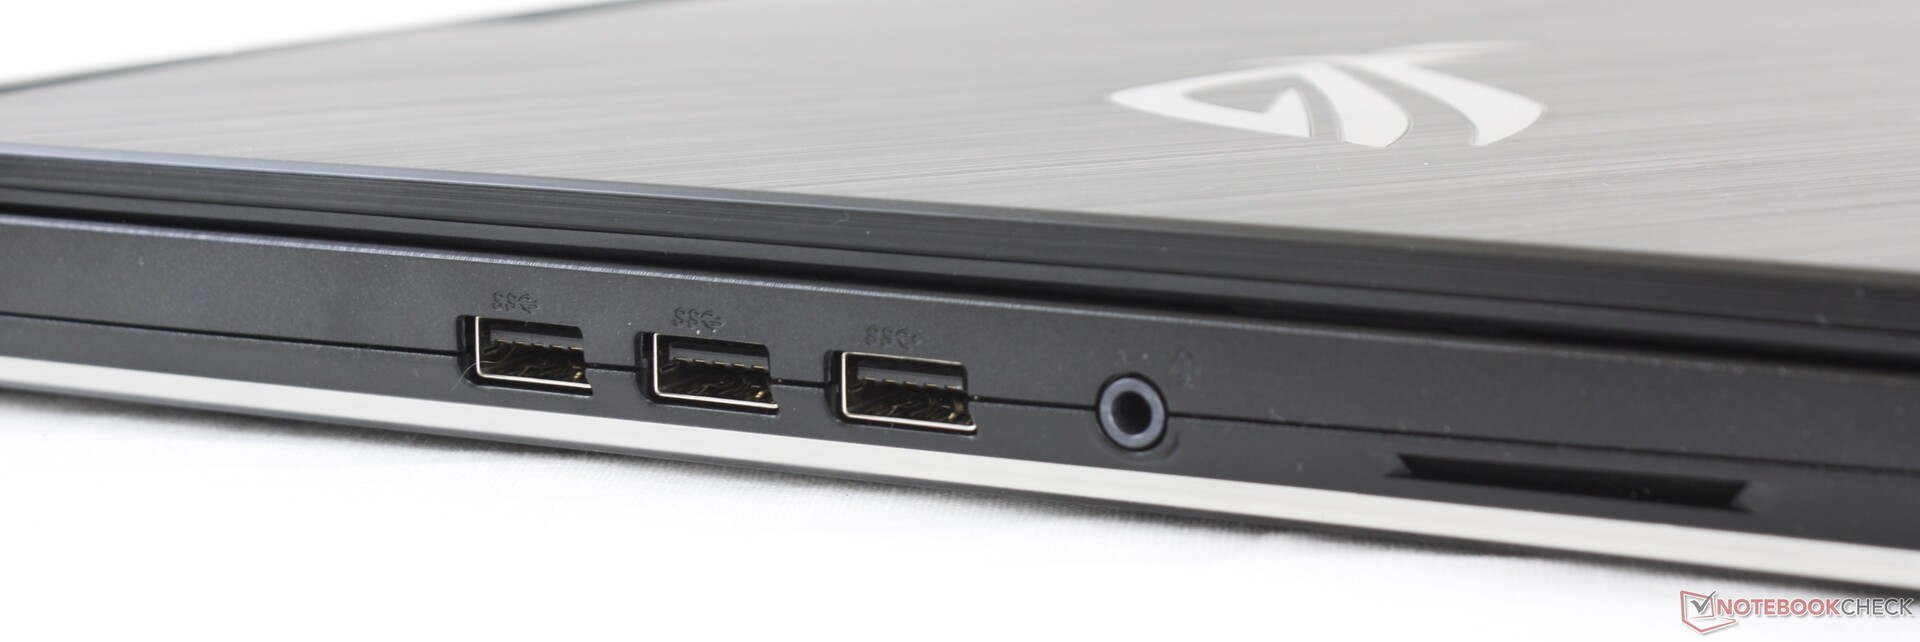
Tüm USB-A bağlantı noktaları yalnızca sol kenardayken, bağlantı noktası konumlandırma bir dizüstü bilgisayar için gariptir. Bu muhtemelen, dizüstü bilgisayarın sağ tarafında bir fare ve fare altlığı için masa alanı istemesi daha muhtemel olan oyuncuları yatıştırmak için yapıldı. Thunderbolt 3 desteklenmez.
İletişim
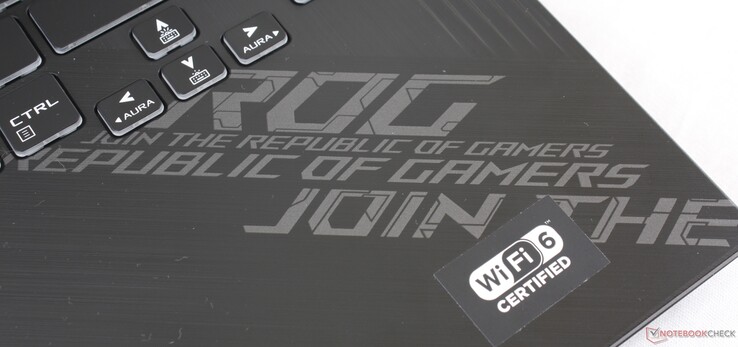
Intel AX201, Wi-Fi 6 uyumluluğu için tüm SKU'larda standart olarak gelir. Netgear RAX200 test yönlendiricimizle eşleştirildiğinde hiçbir bağlantı sorunu yaşamadık.
| Networking | |
| iperf3 transmit AX12 | |
| Asus ROG Strix G15 G512LI | |
| MSI GP65 10SFK-047US | |
| Dell G5 15 SE 5505 P89F | |
| Asus TUF Gaming A15 FA506IV-HN172 | |
| iperf3 receive AX12 | |
| Dell G5 15 SE 5505 P89F | |
| MSI GP65 10SFK-047US | |
| Asus ROG Strix G15 G512LI | |
| Asus TUF Gaming A15 FA506IV-HN172 | |
Bakım
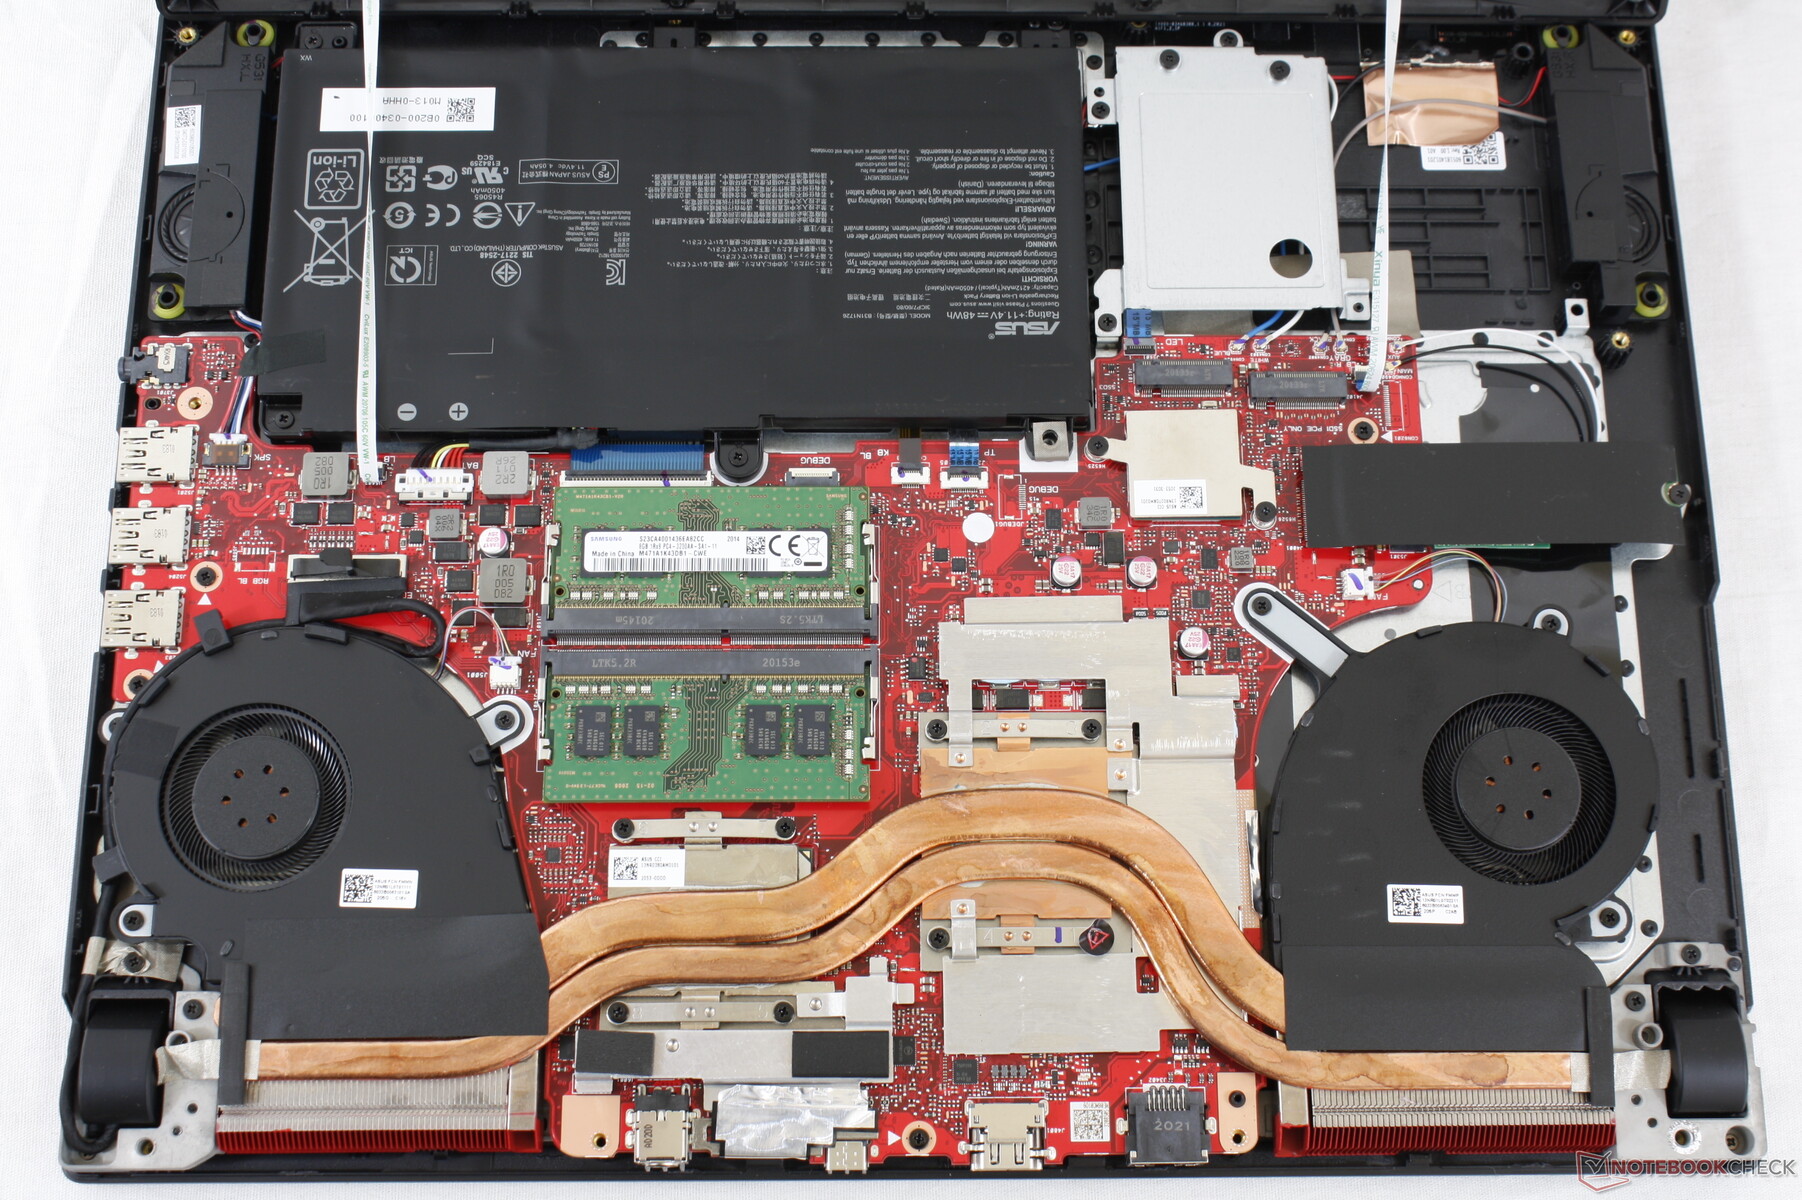
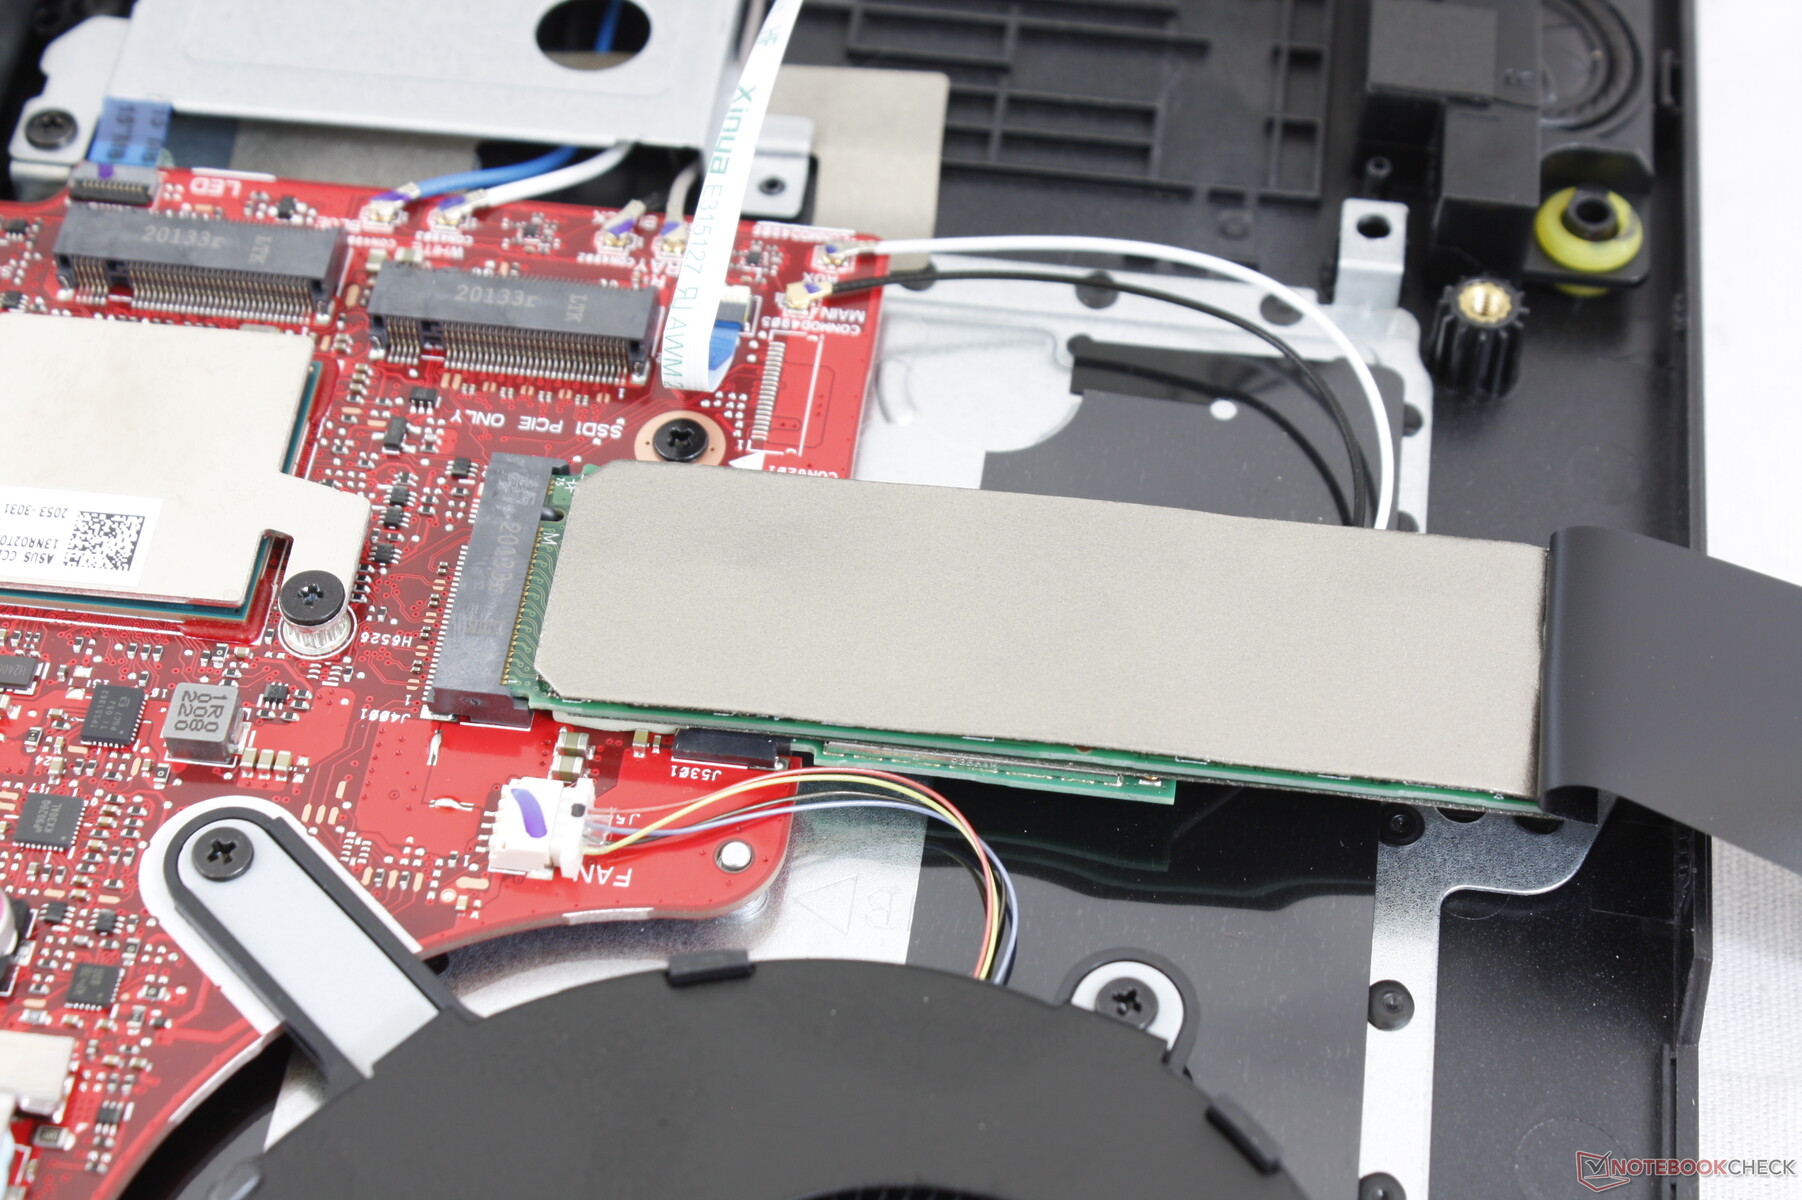
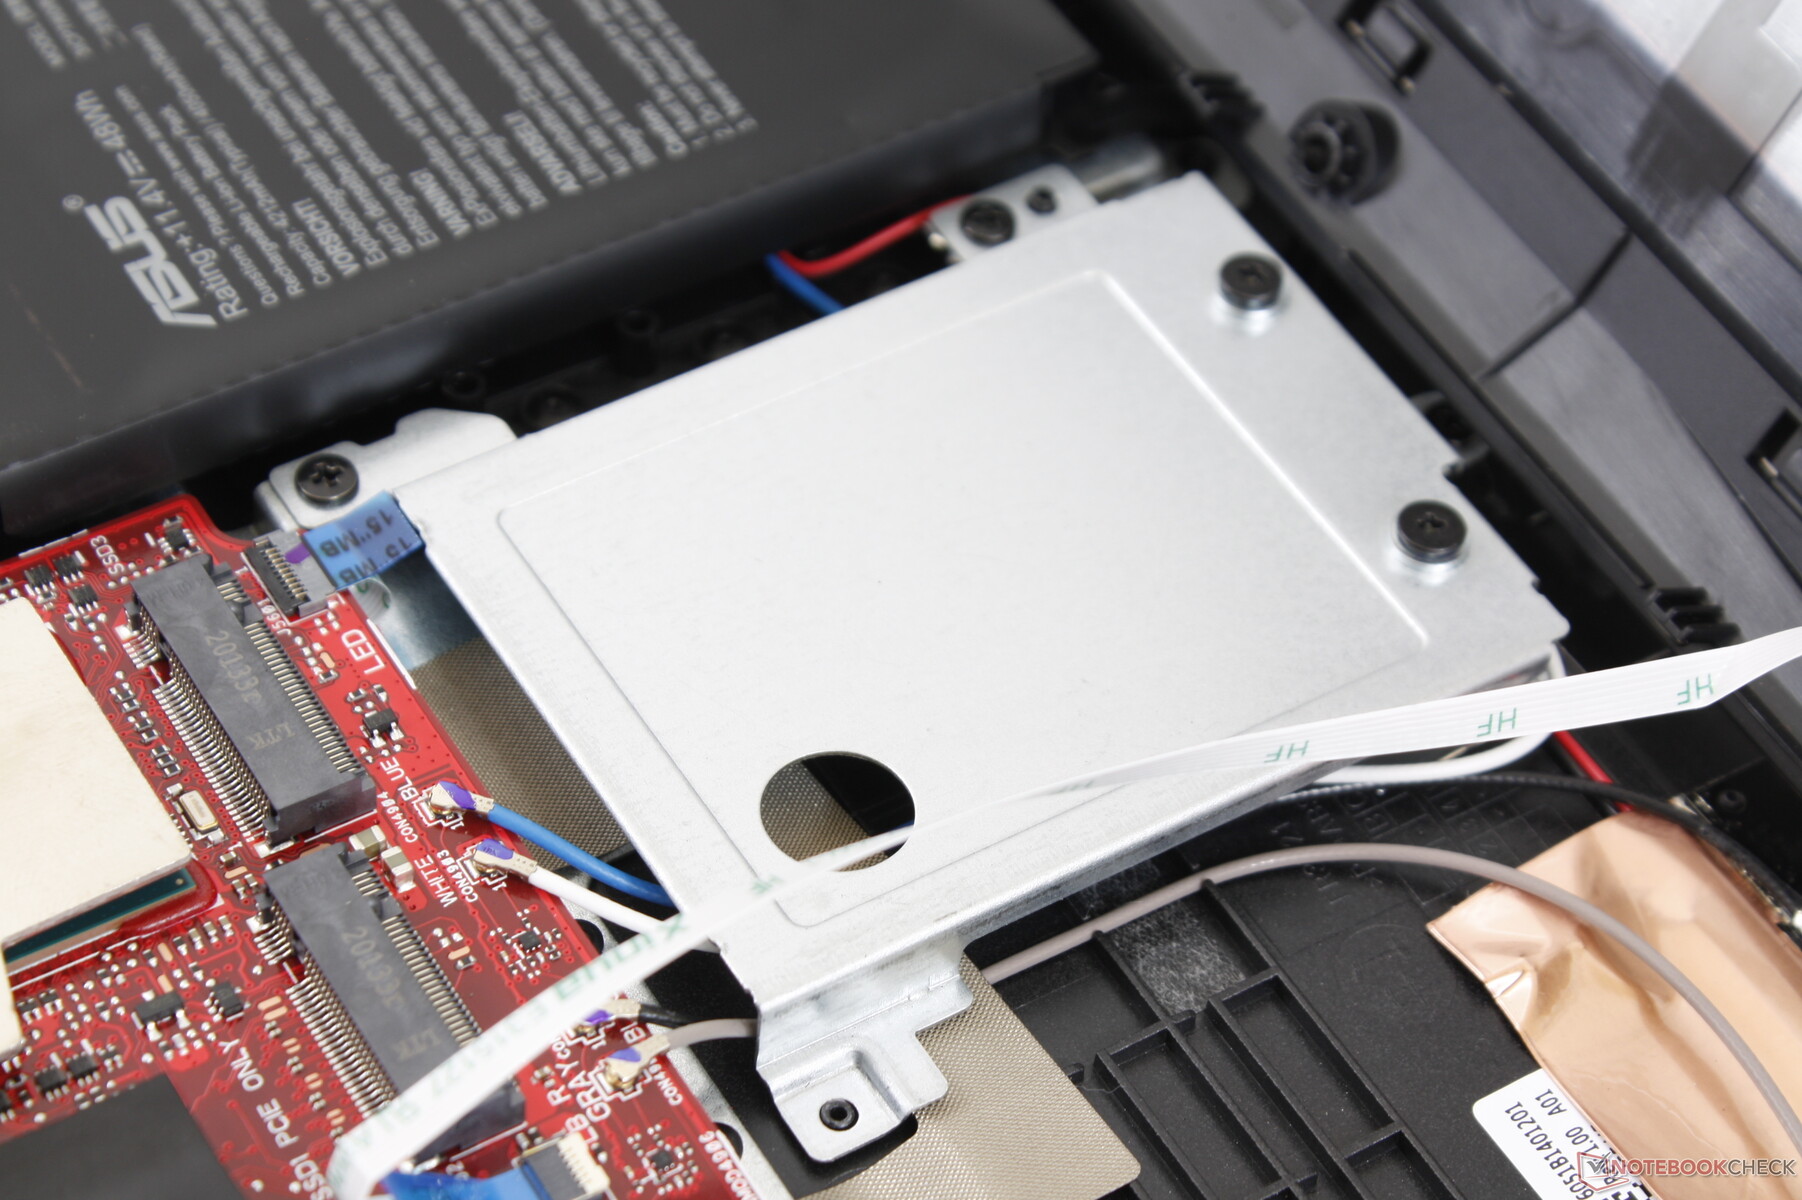
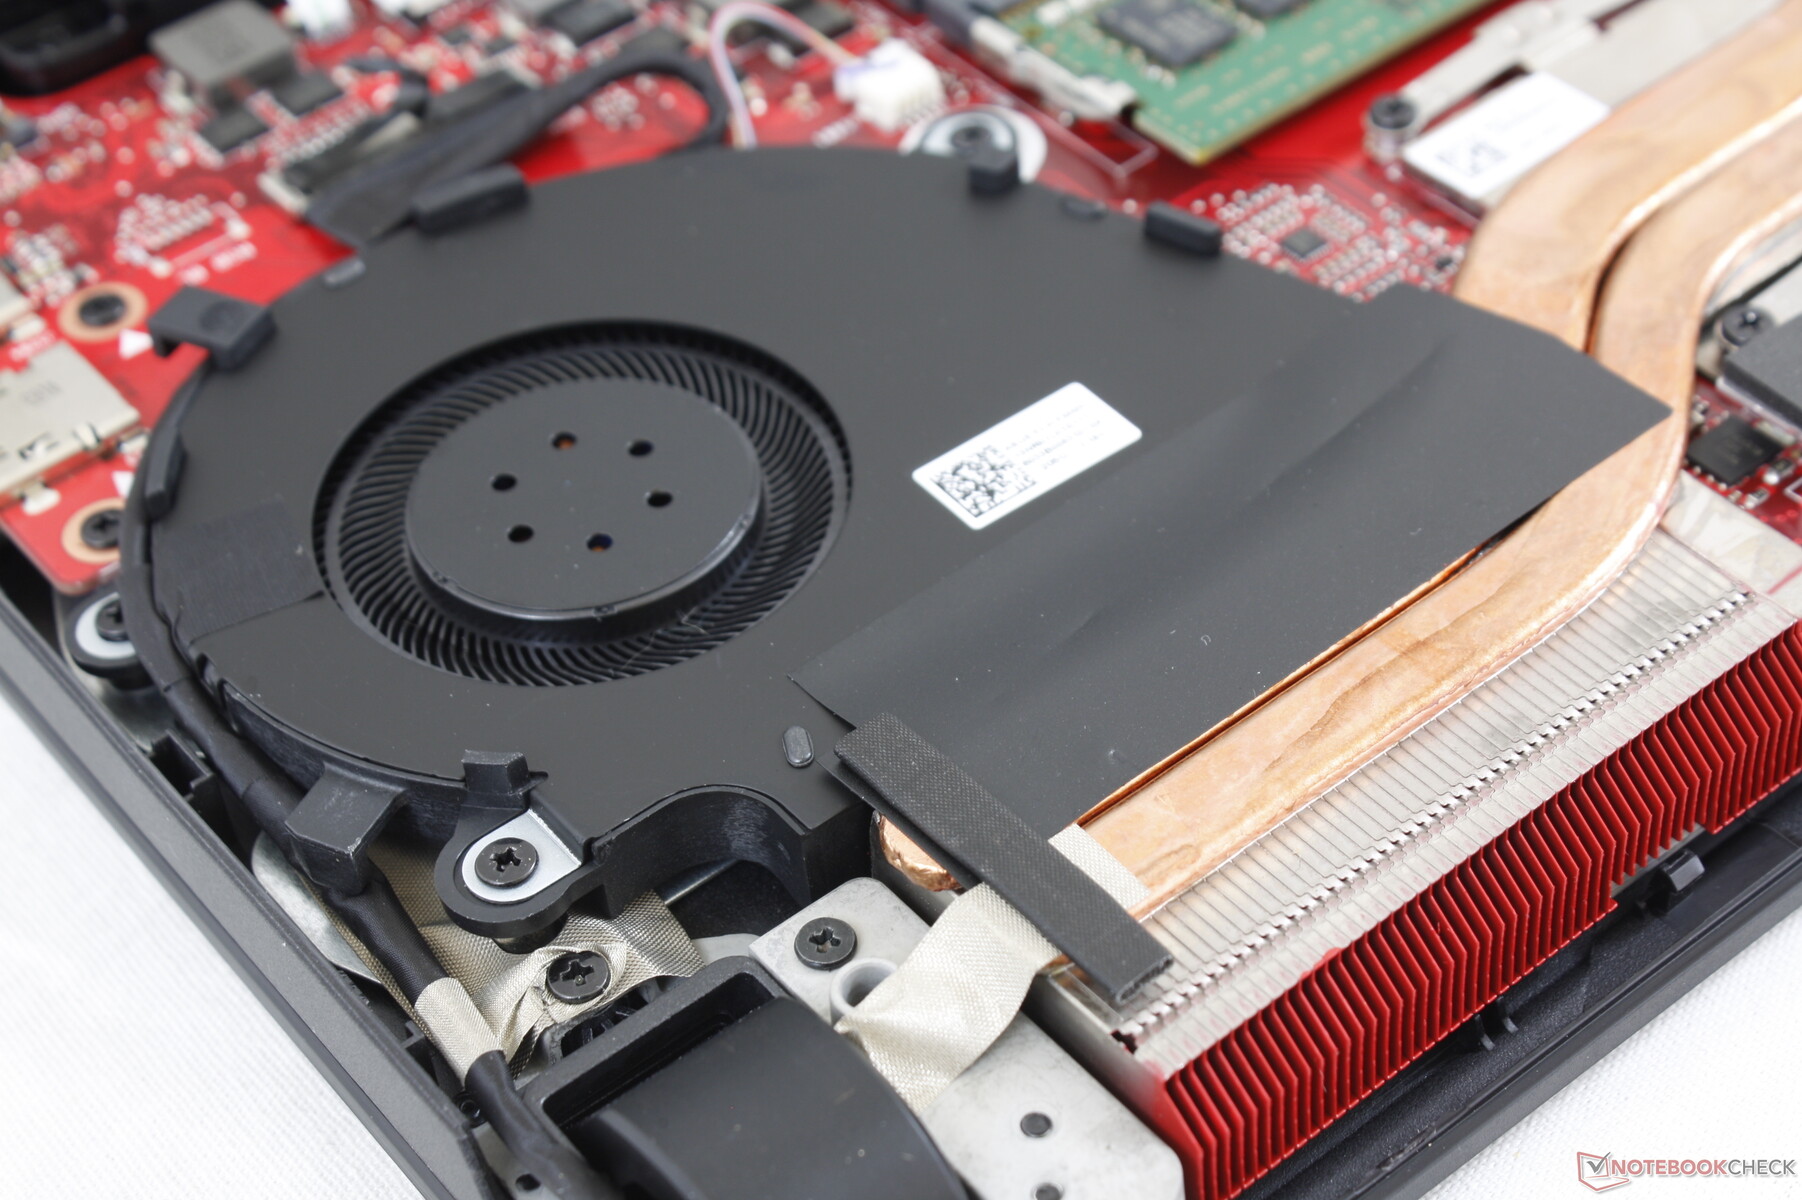
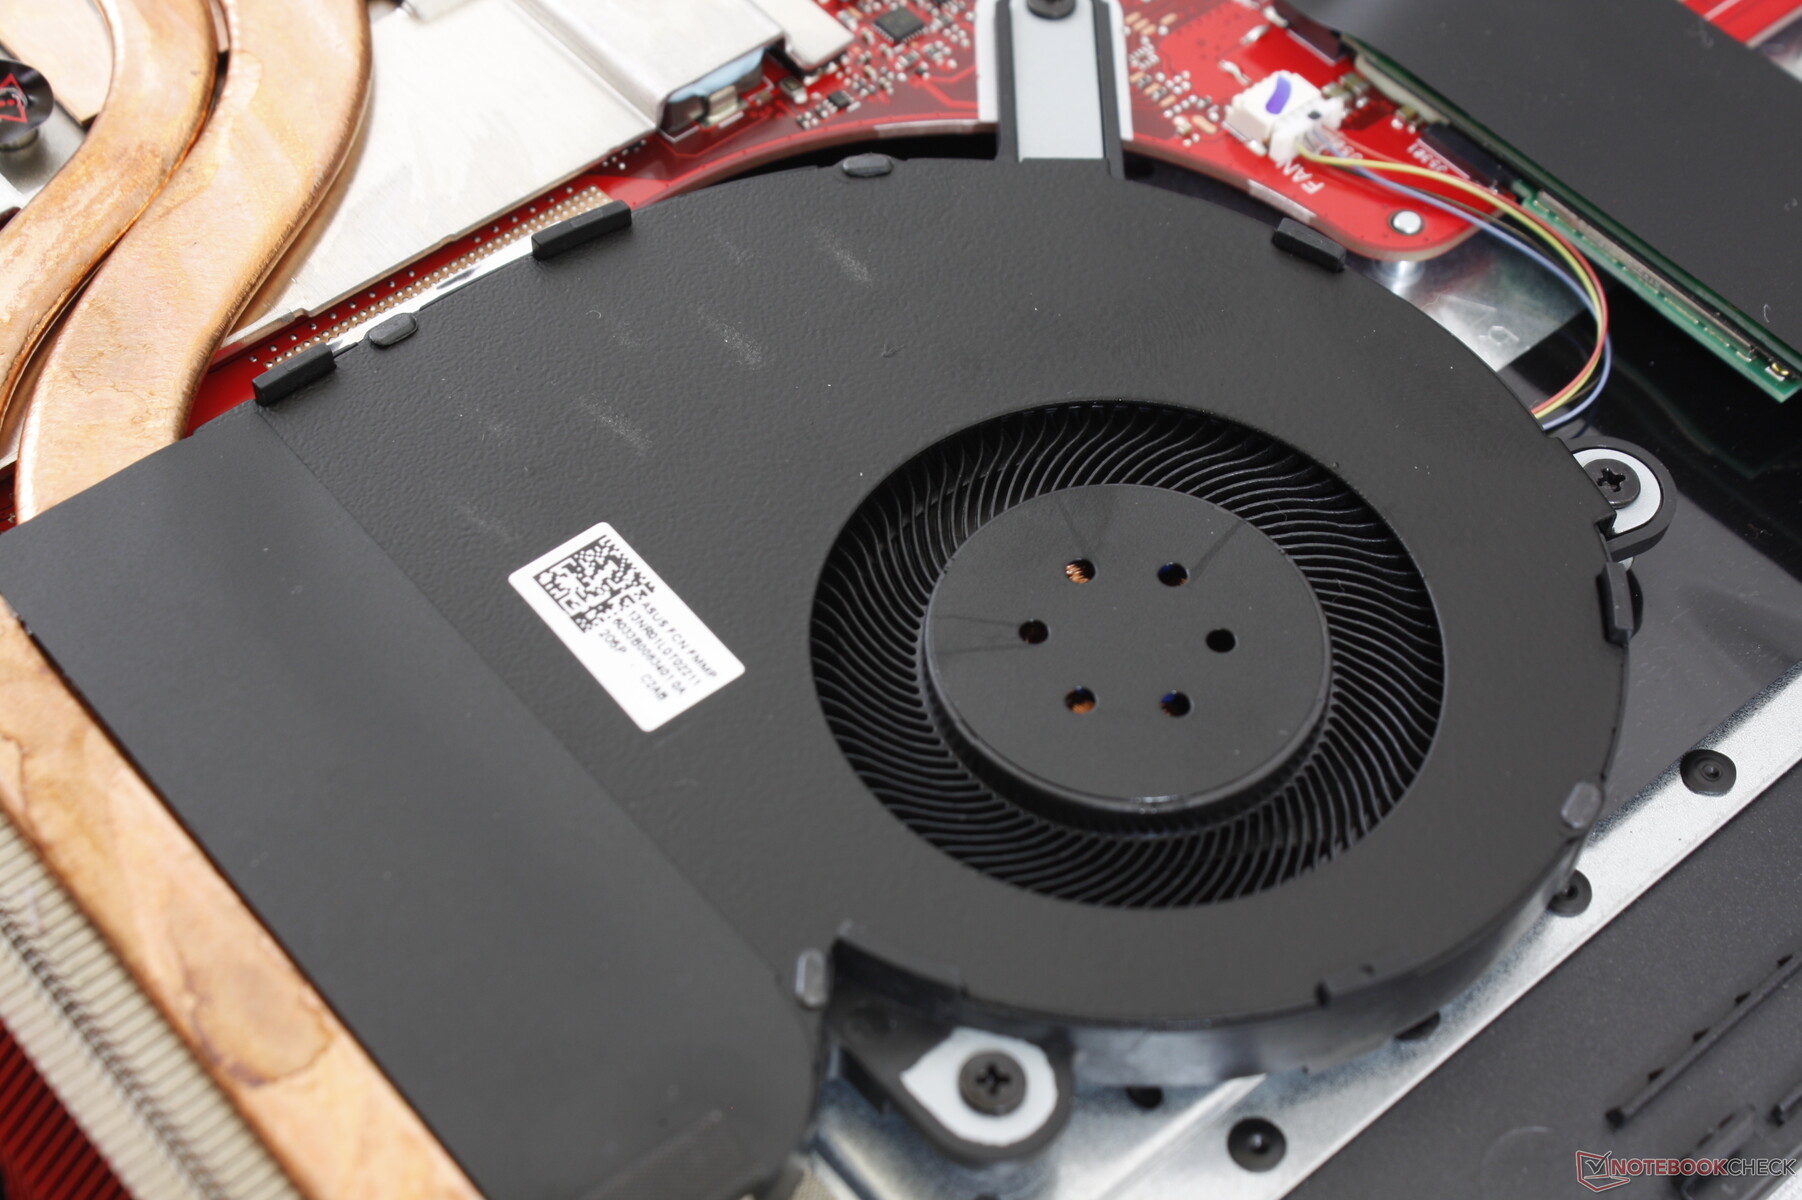
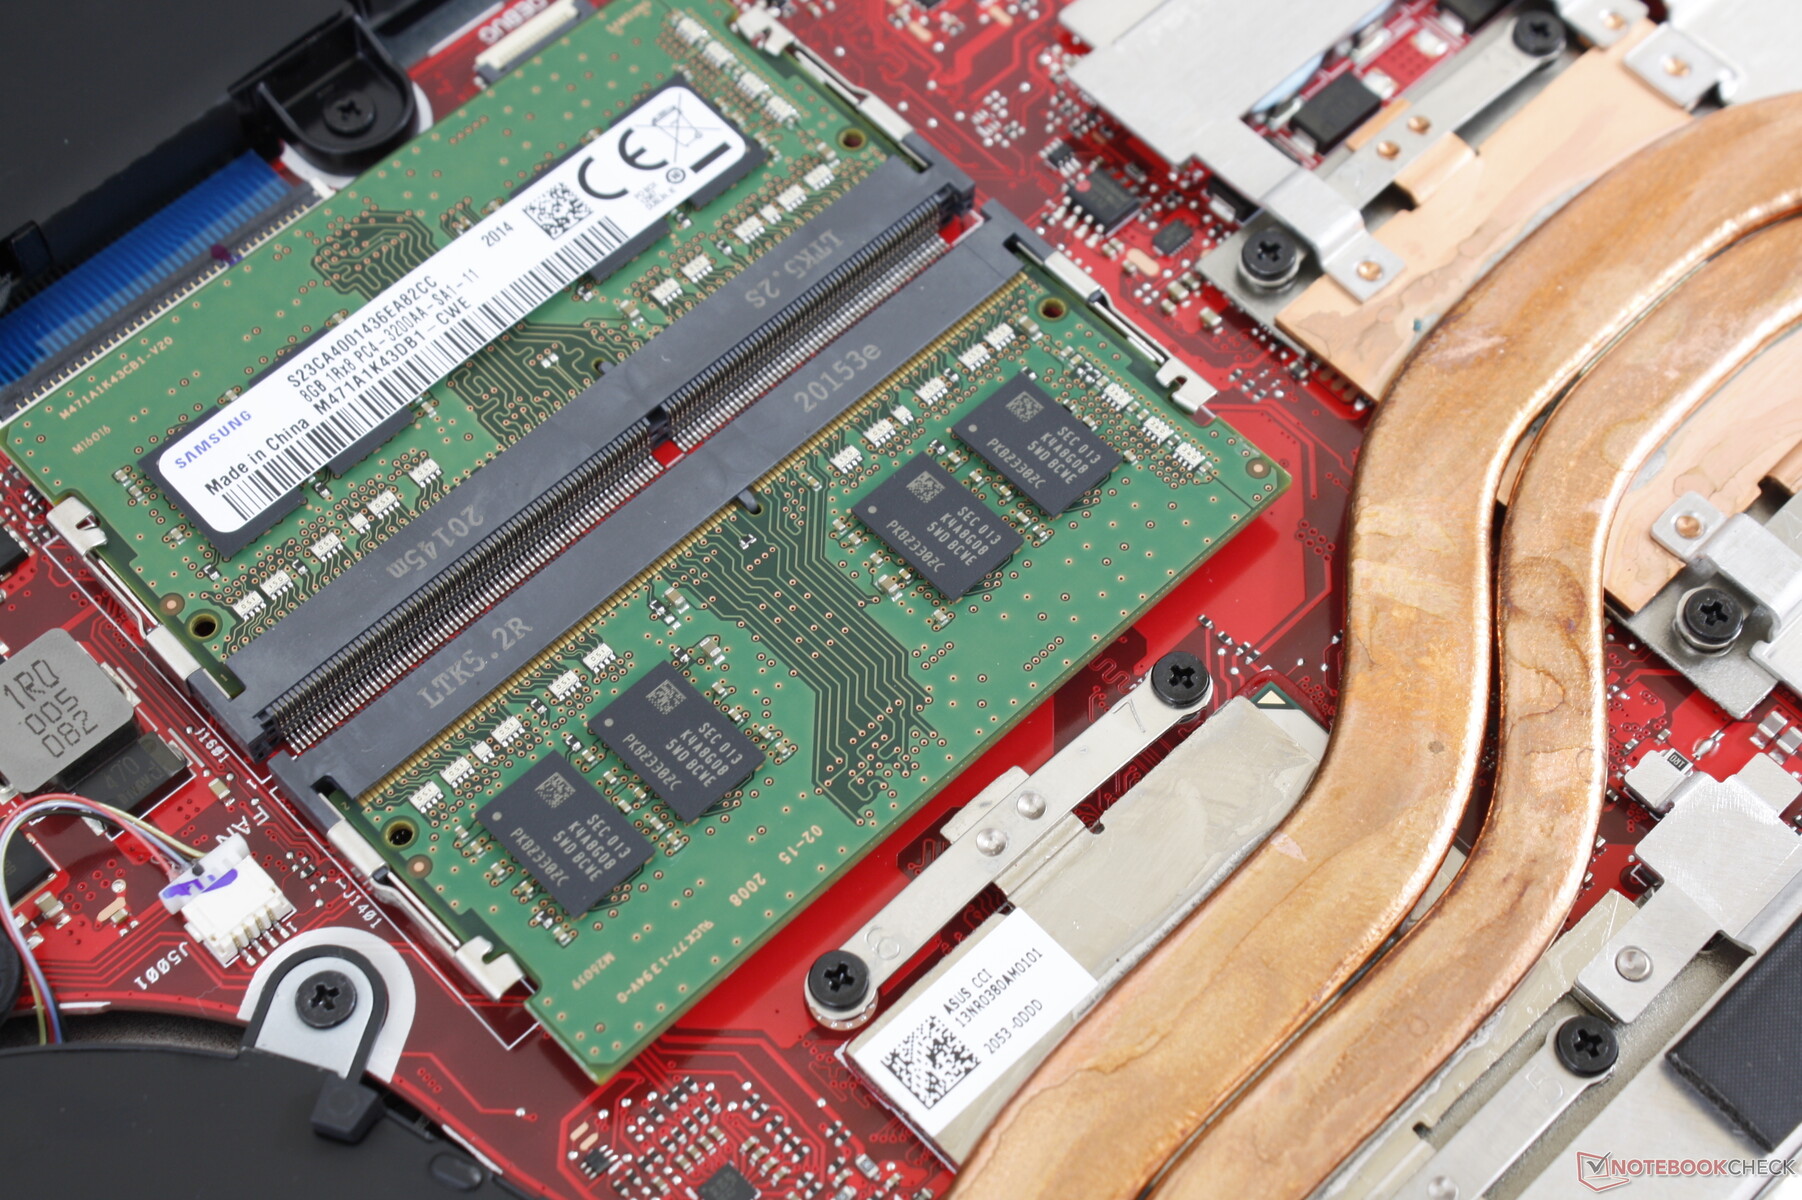
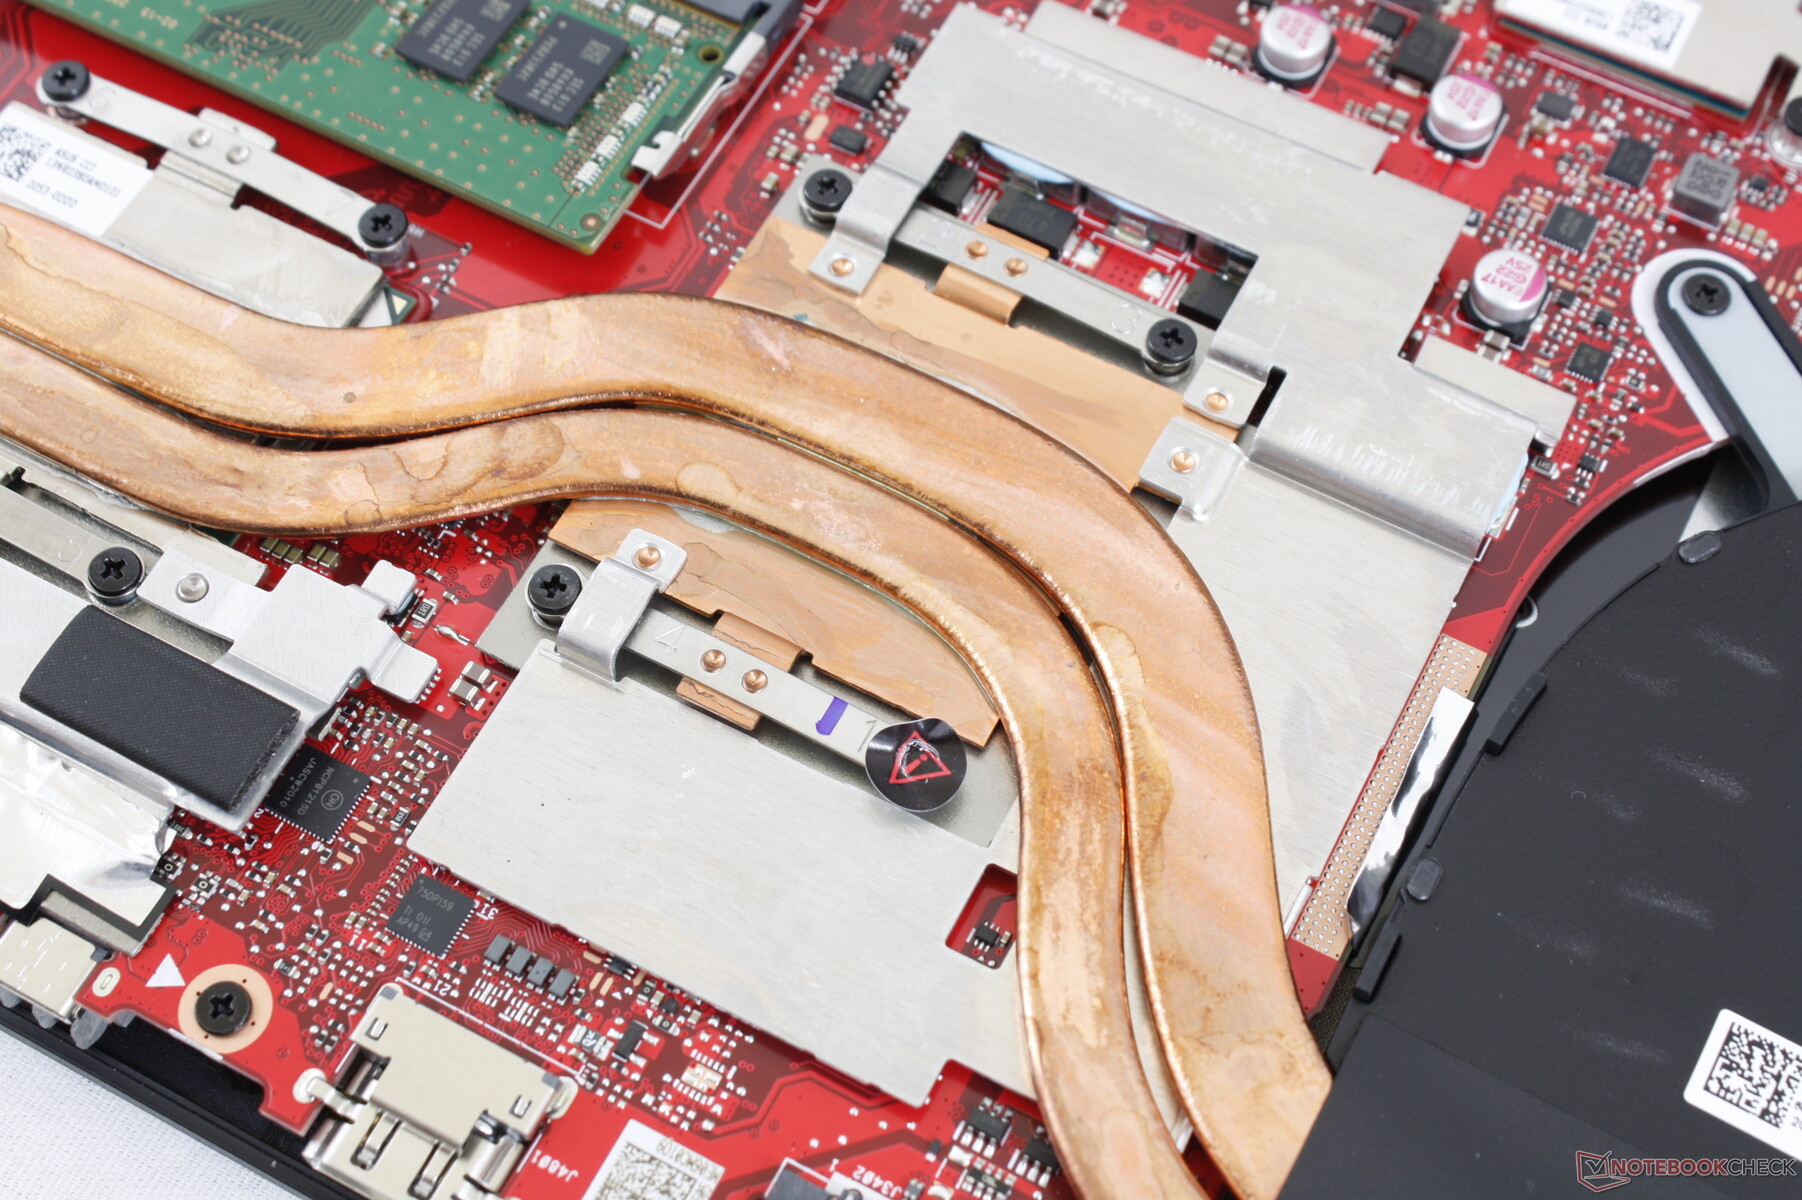
Alt panel, basit bir yıldız tornavida ile kolayca çıkarılabilir. Ancak, panel anakarta dikkatle kullanılması gereken iki hassas şerit kablo ile bağlanır. RAM, depolama veya WLAN'ı yükseltme basit bir işlemdir.
Aksesuarlar ve Garanti
Kutuda, AC adaptörü ve normal evrak işleri dışında hiçbir ekstra yoktur. Standart bir yıllık sınırlı garanti geçerlidir.
Giriş cihazları
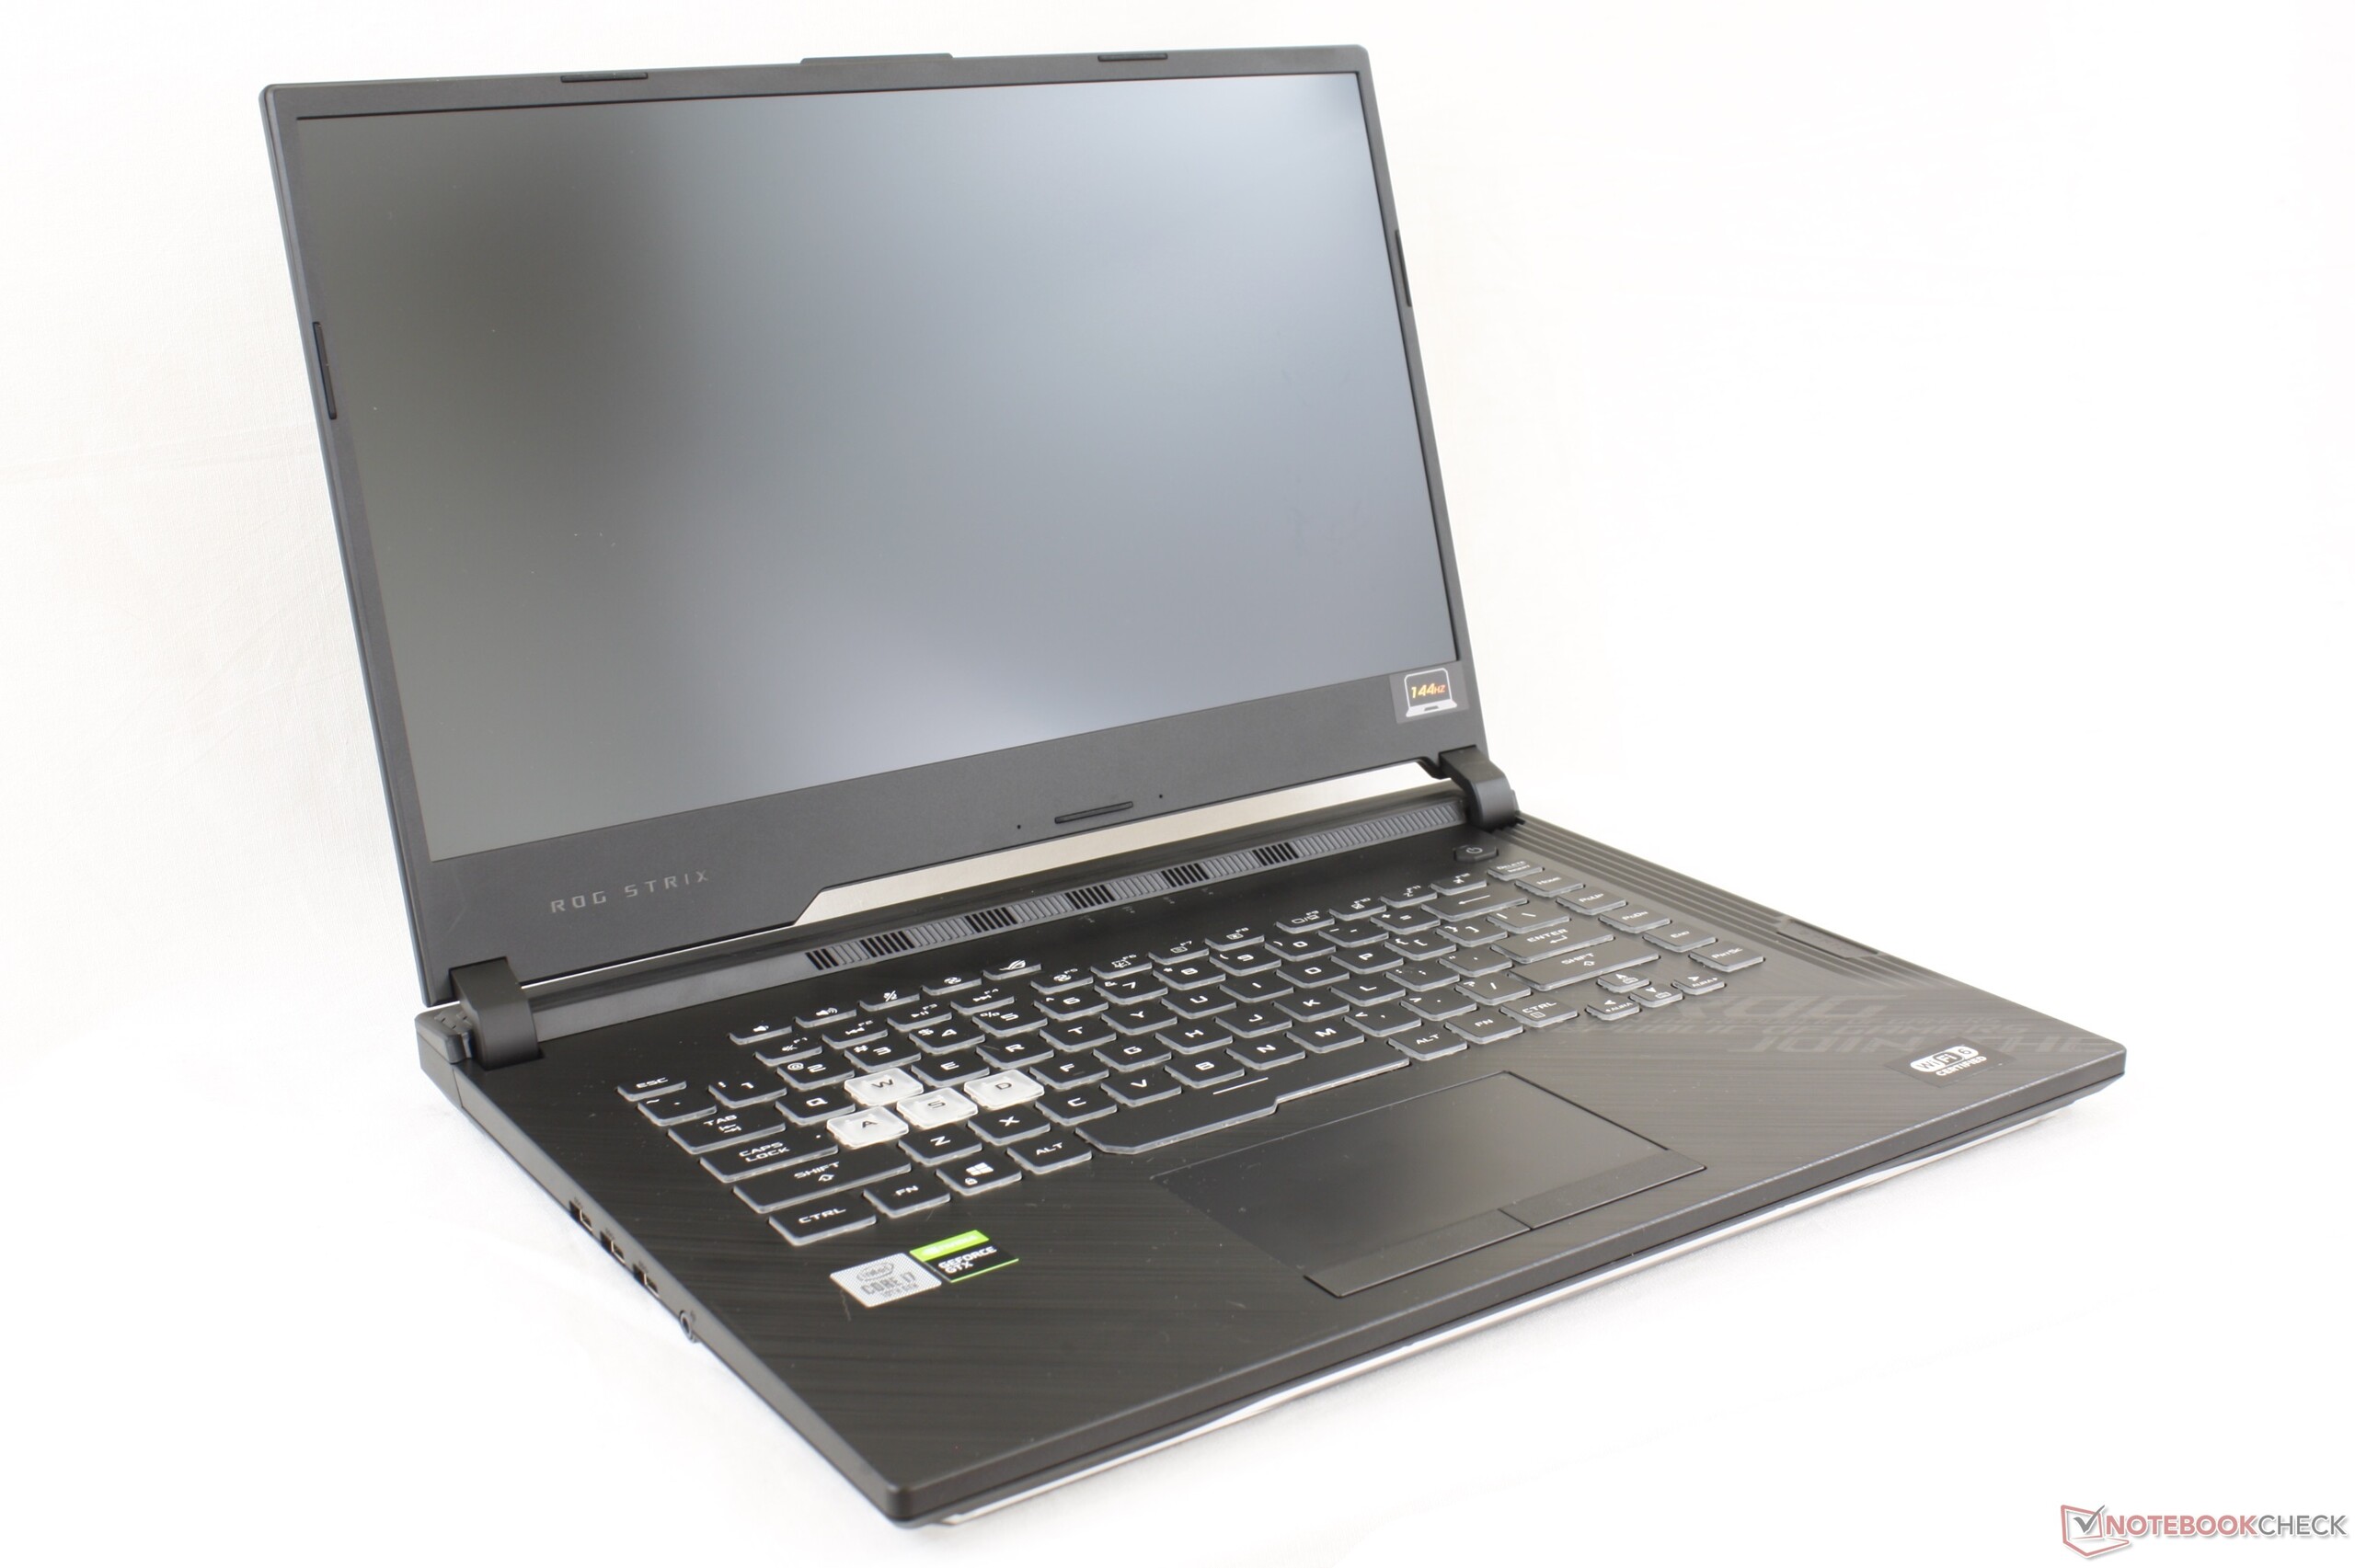
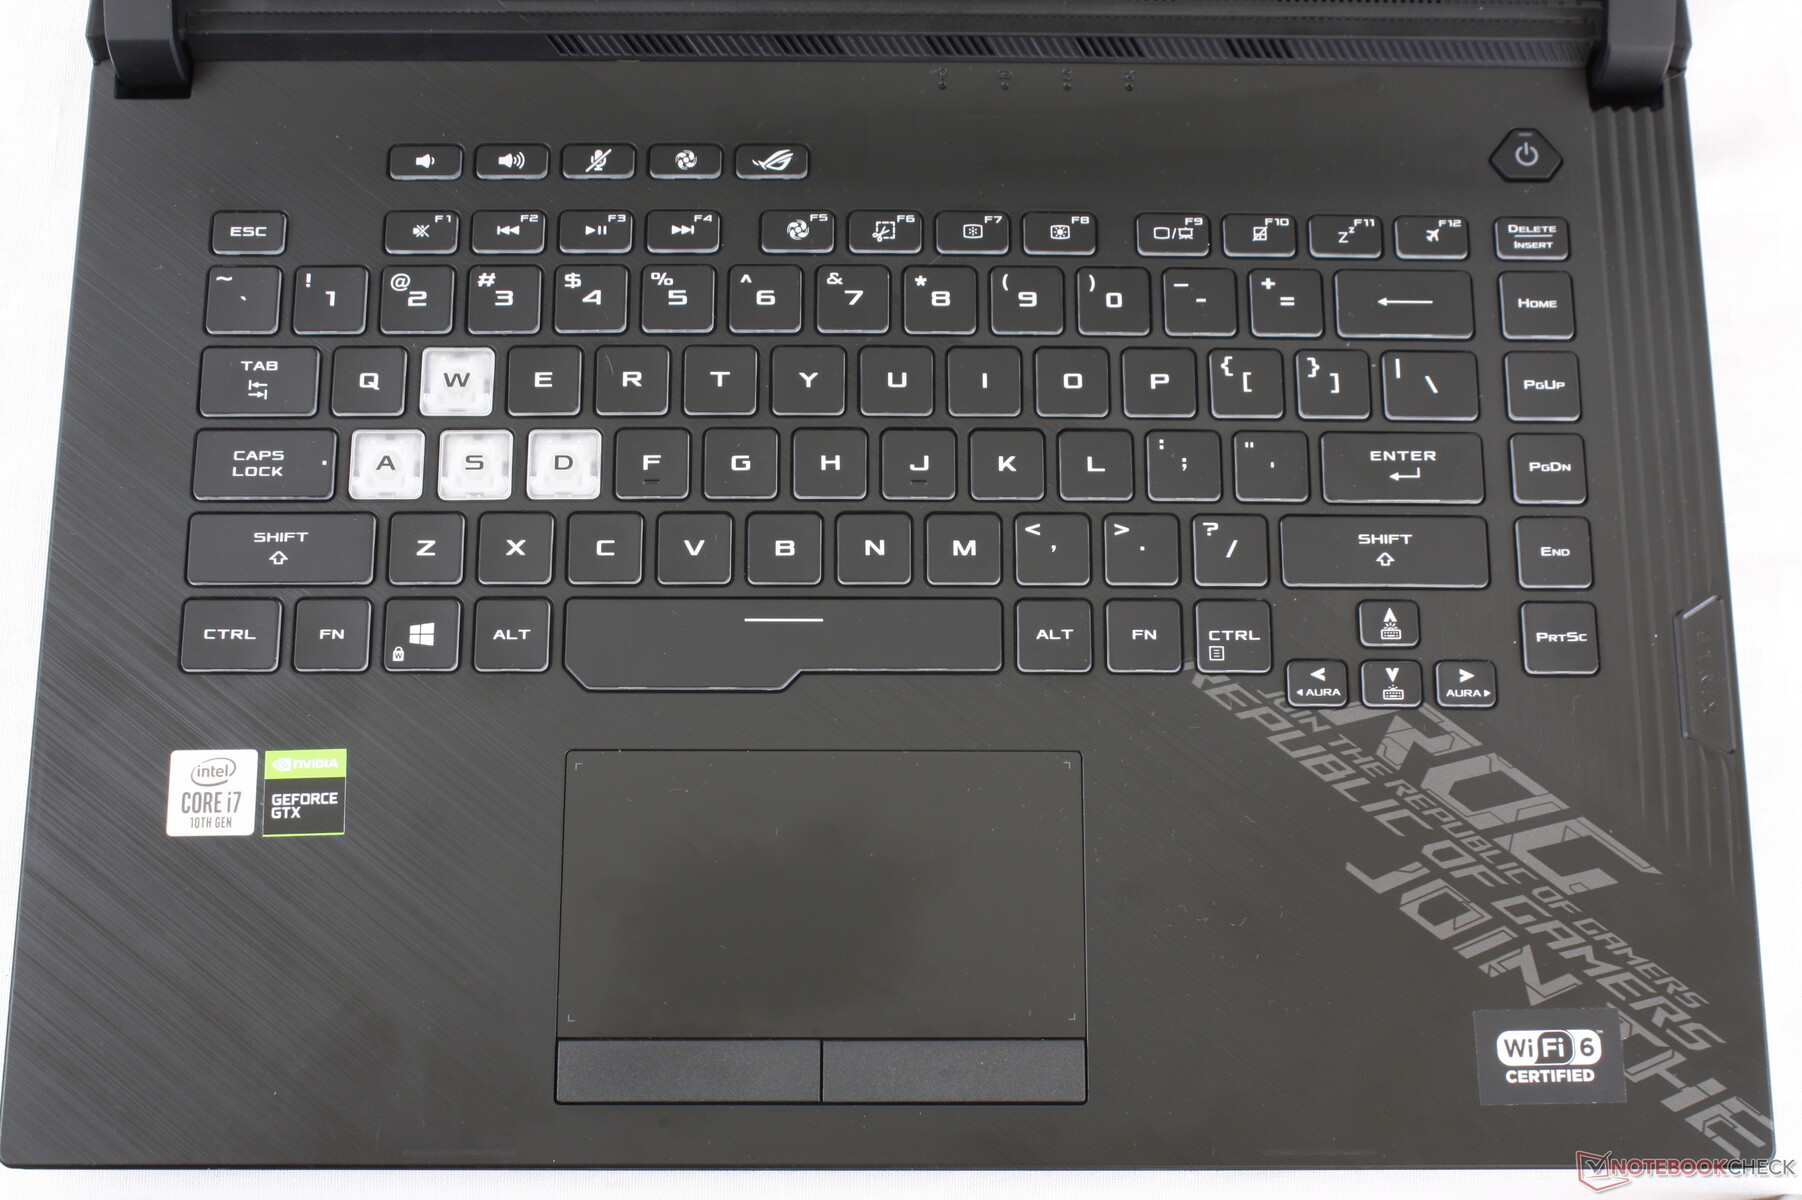
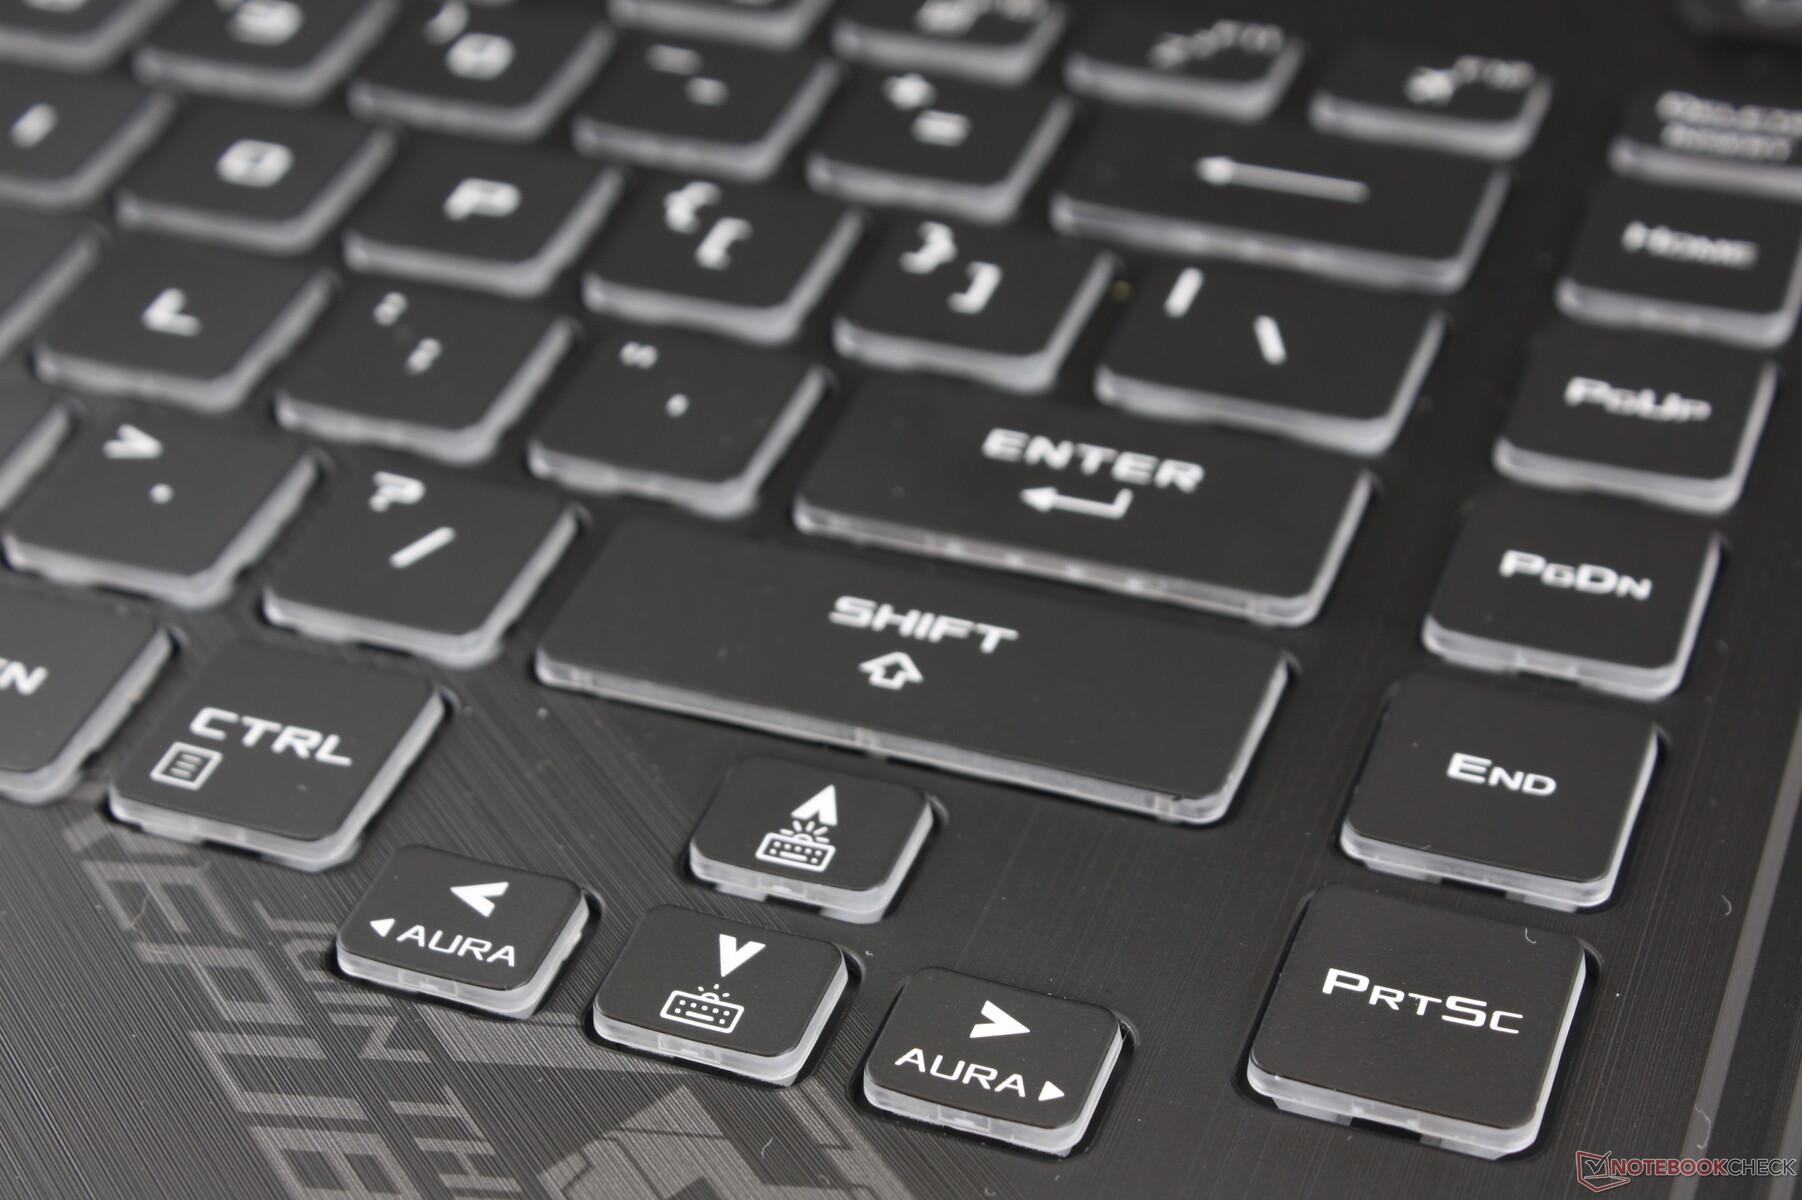
Klavye Düzeni ve geri bildirim, GL531'deki klavyeyle aynıdır ve bu nedenle mevcut yorumlarımız burada geçerlidir. Özellikle, diğer birçok dizüstü bilgisayar bu tuşları görmezden gelme eğiliminde olduğu için, sistemin üst kısmında bir dizi özel multimedya anahtarı ve sağ kenarında özel bir PgUp ve PgDn tuşları sütunu olmasını seviyoruz.
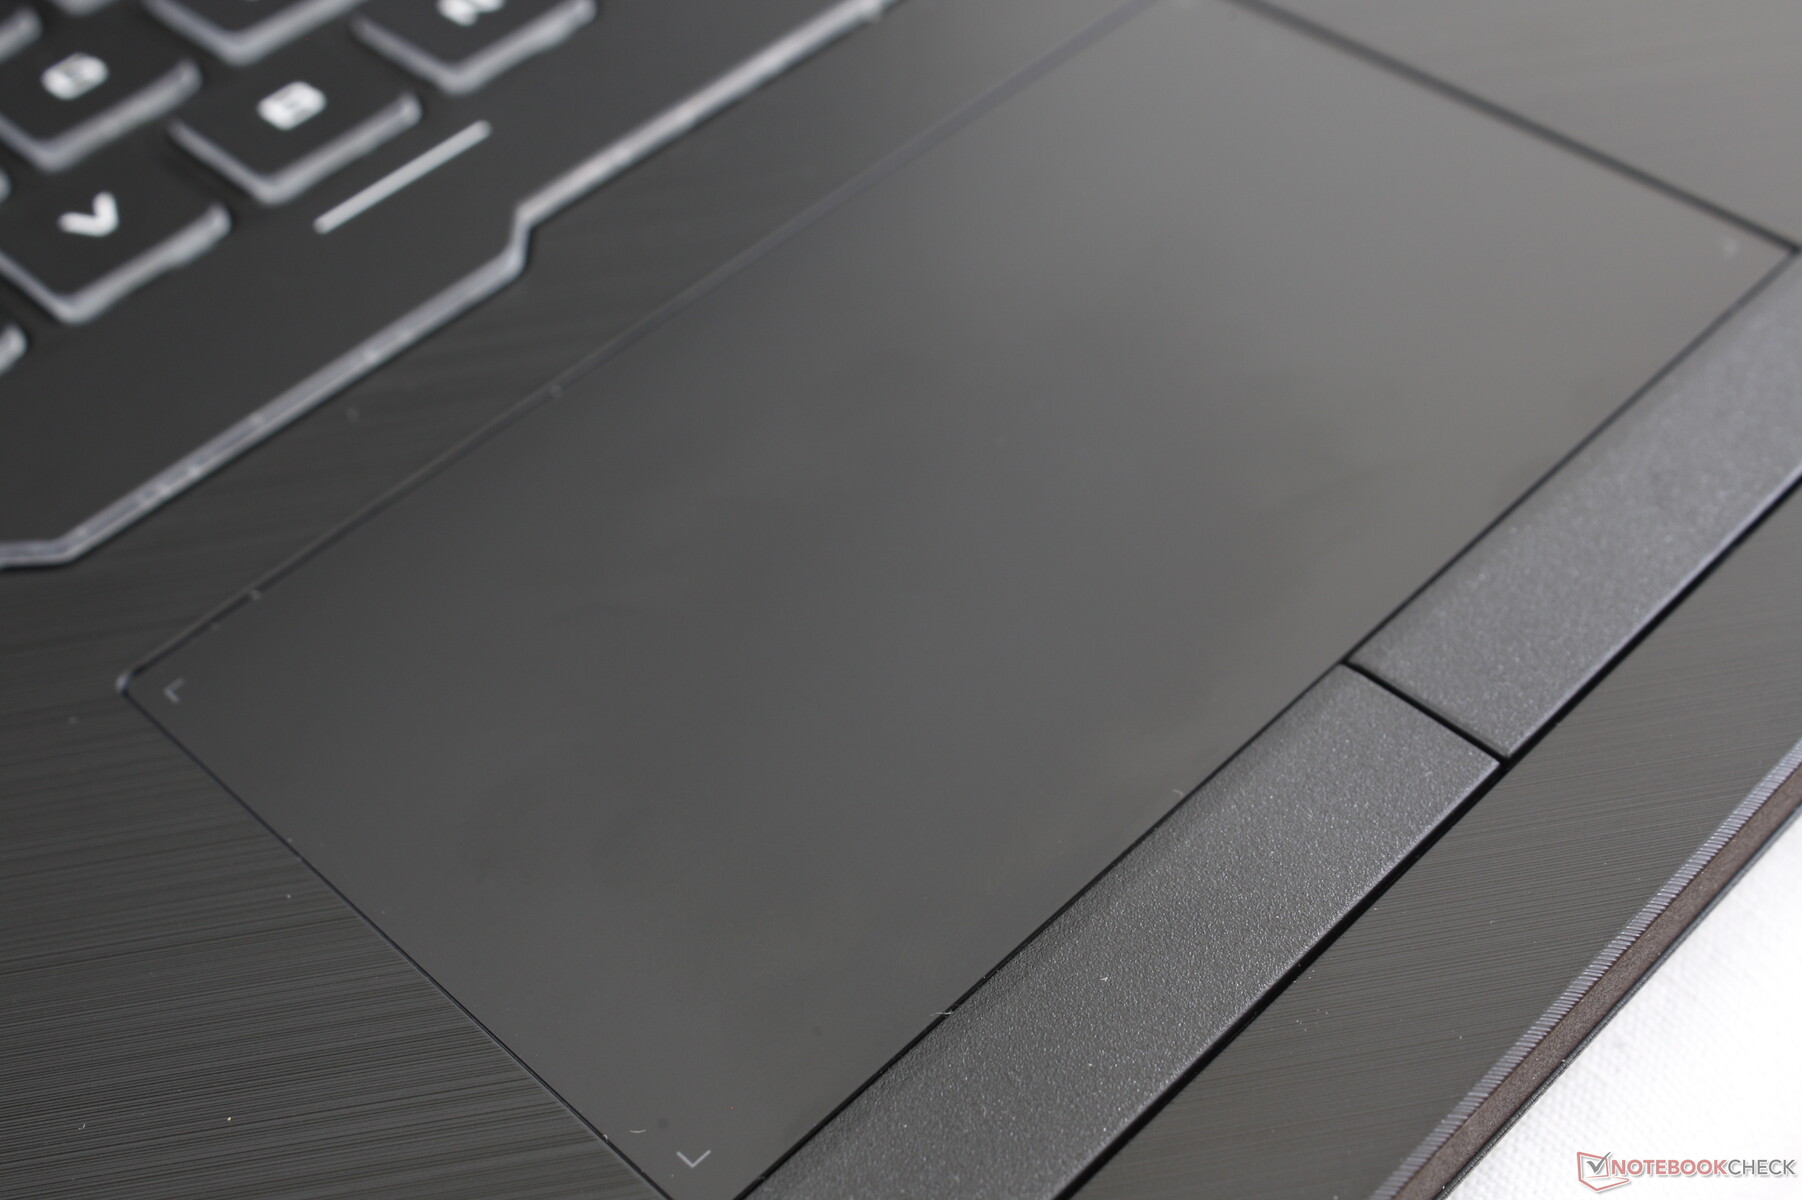
Dokunmatik
Dokunmatik yüzey, MSI GE65'inkinden biraz daha küçük (11 x 6.3 cm ve 10.9 x 6 cm). İmleç kontrolü hiçbir sorun olmadan güvenilirdir, ancak kayma özellikle düşük-orta hızlarda istediğimizden daha yapışkandır. Bu arada, özel fare düğmeleri, MSI GE65'teki daha yüksek ve "clickier" tuşlarının aksine, herhangi bir oyun dizüstü bilgisayarında gördüğümüz en sessizlerden bazıları.

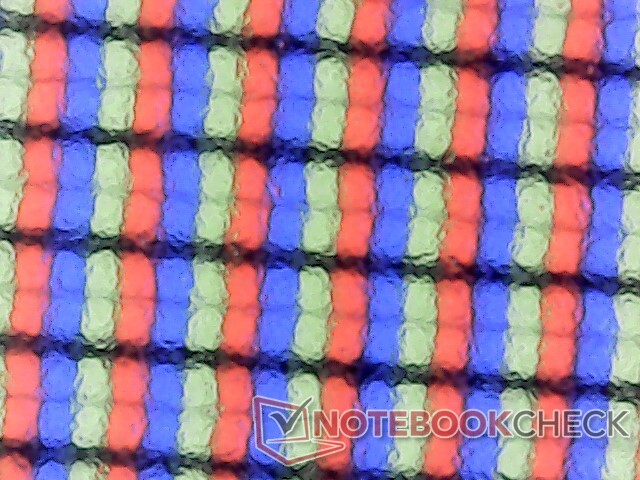
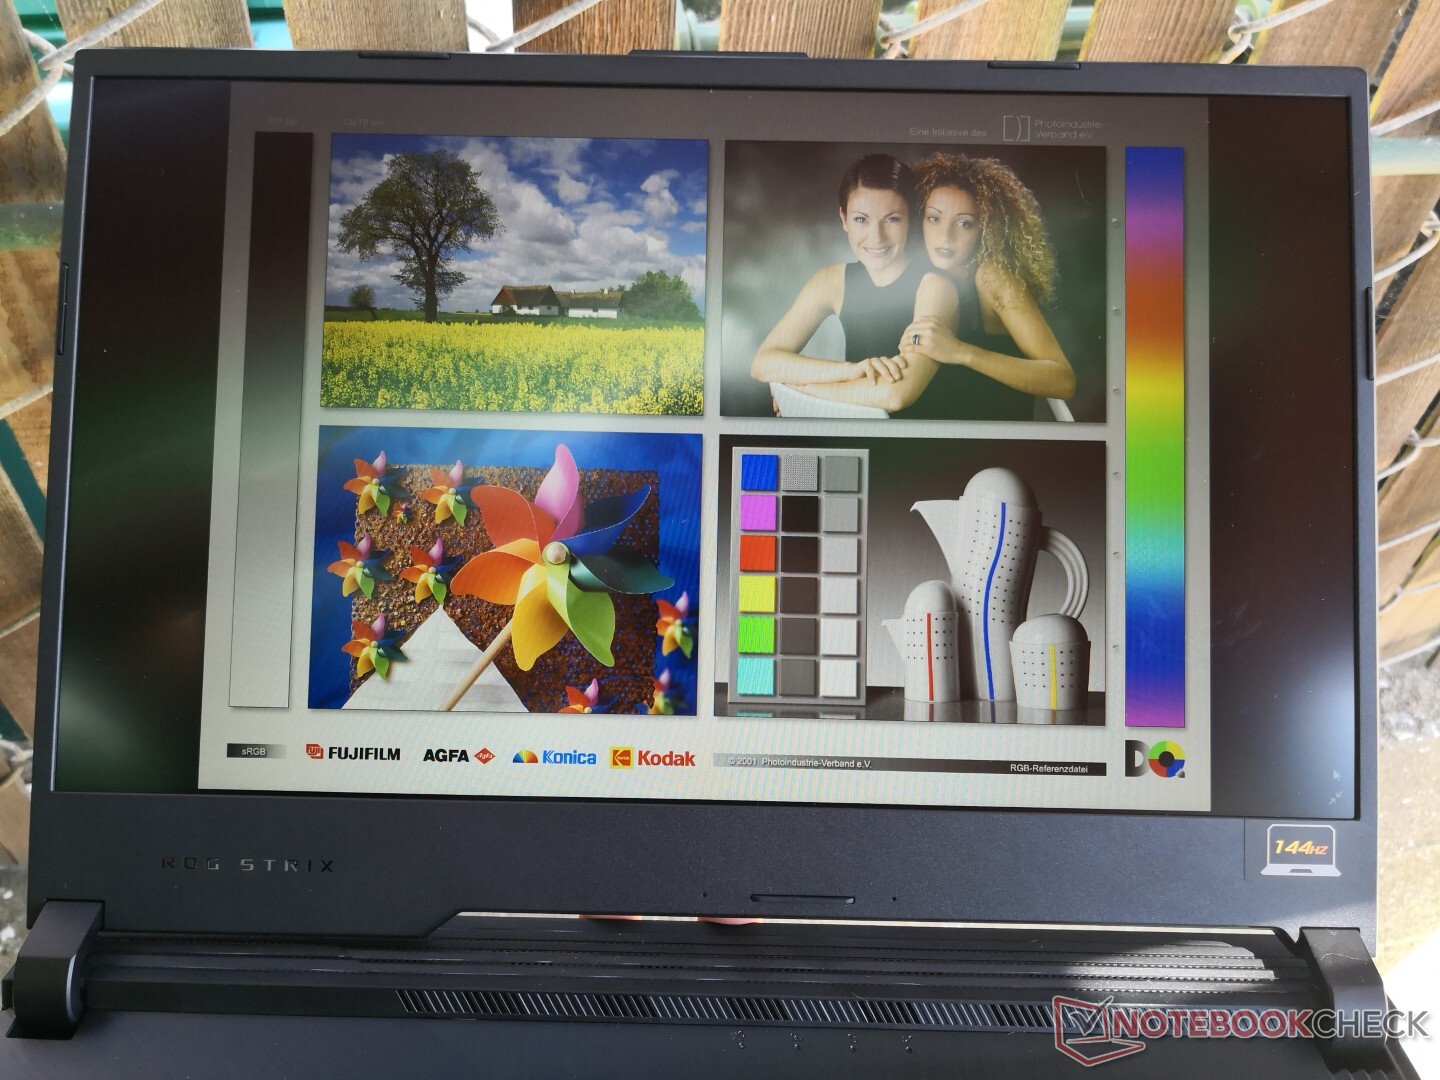
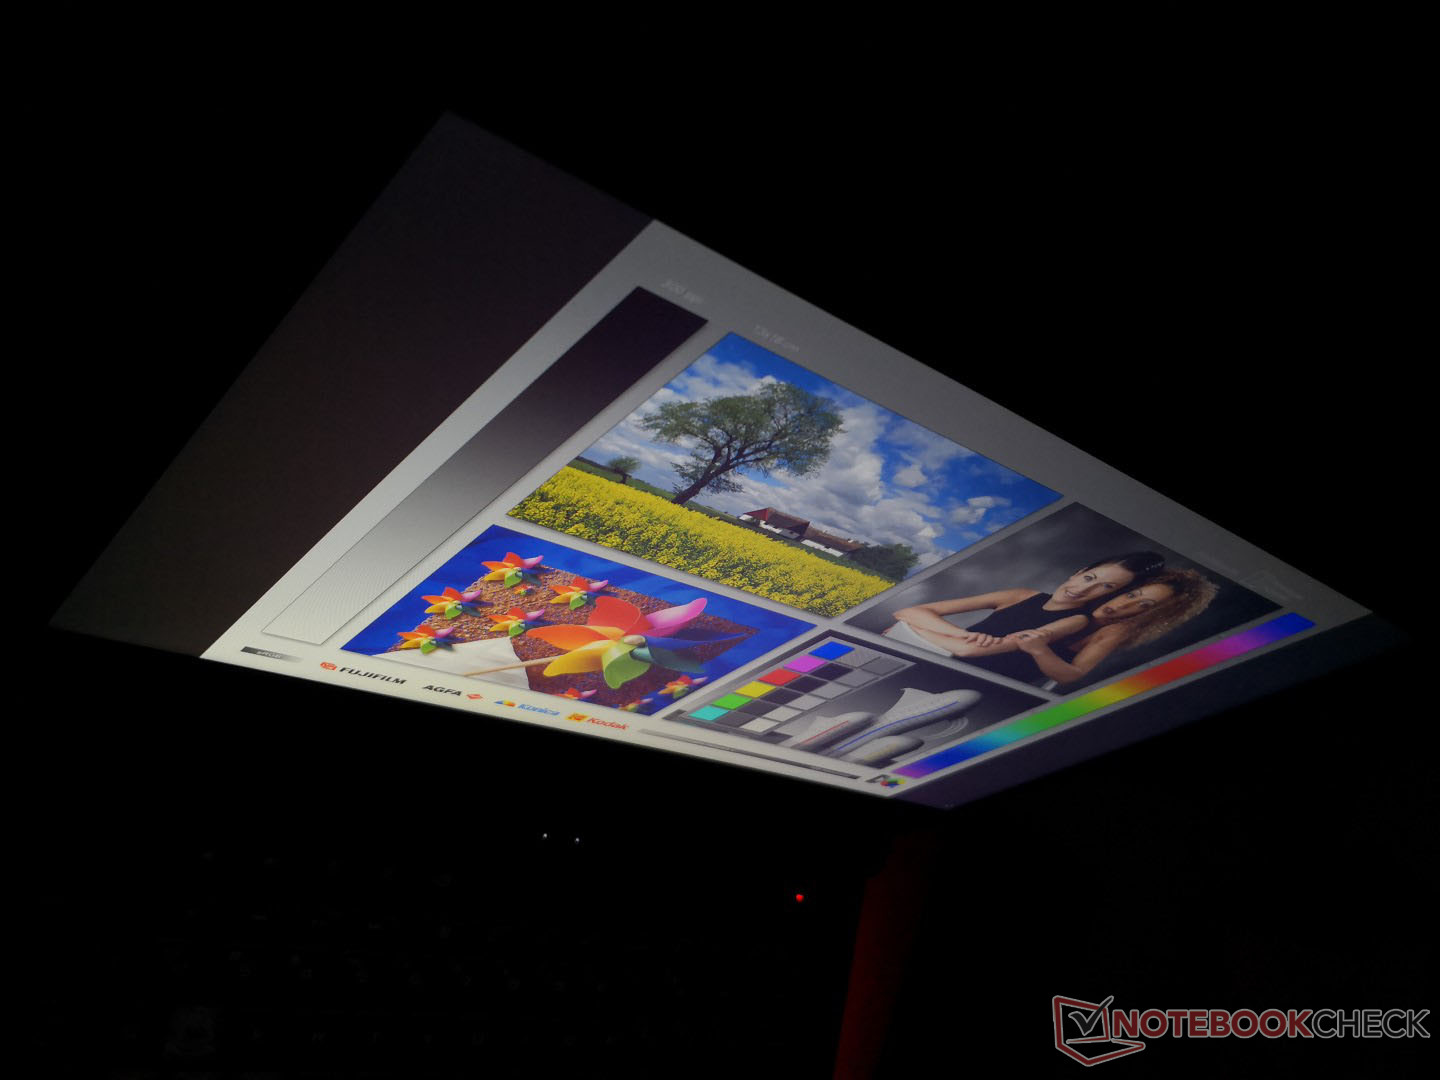
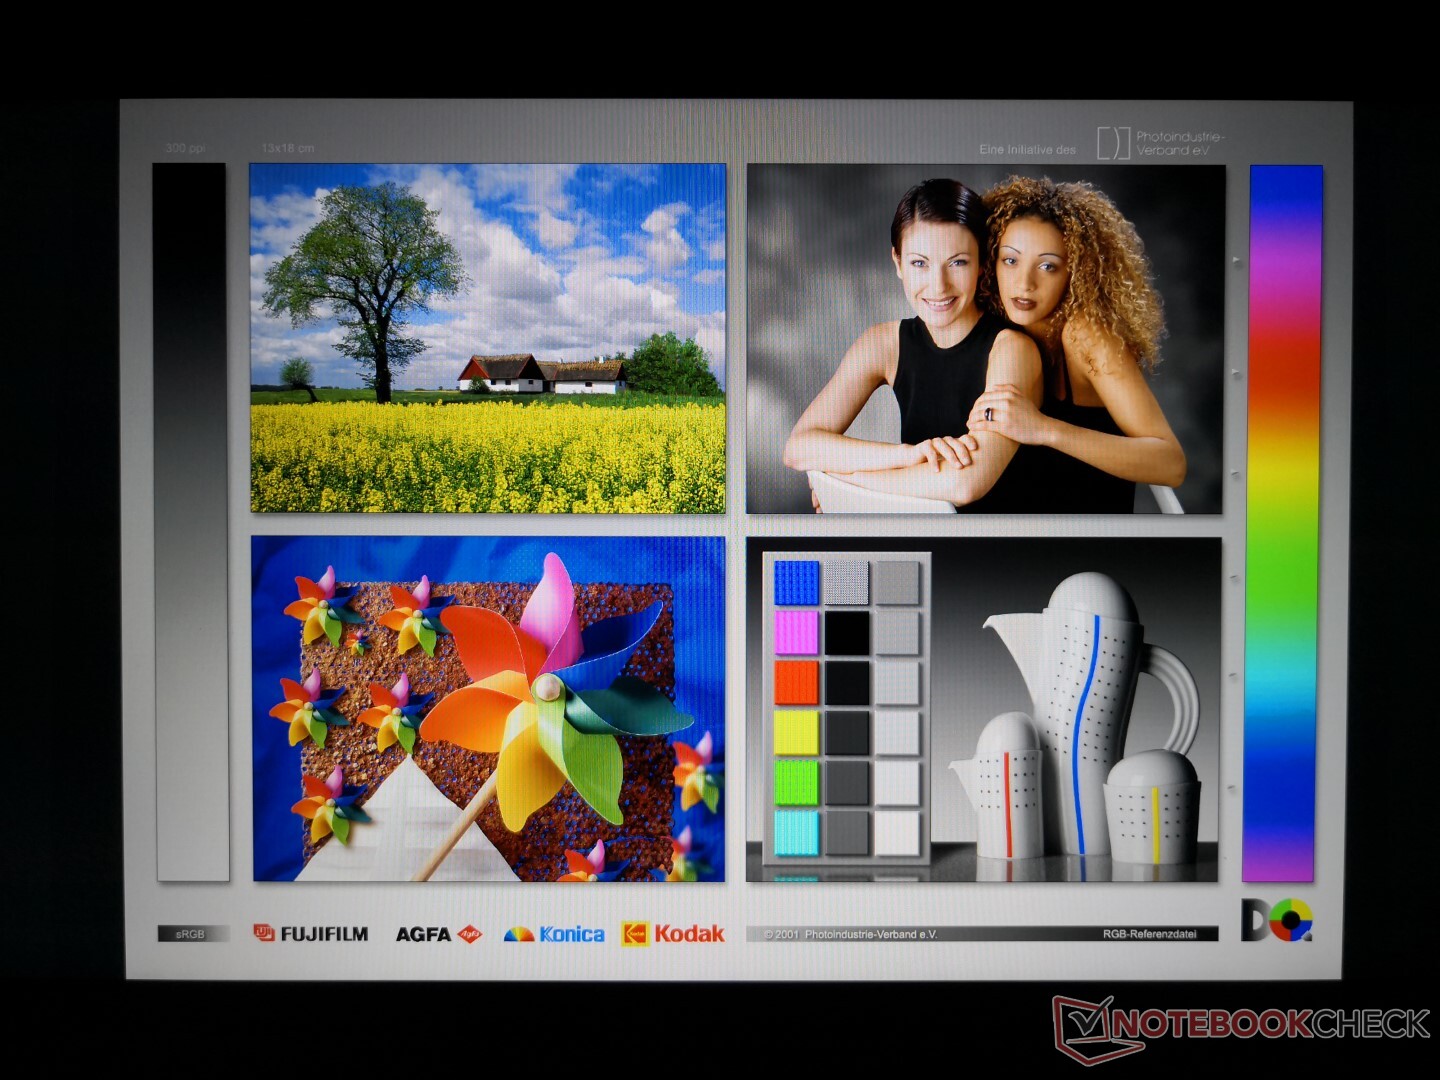
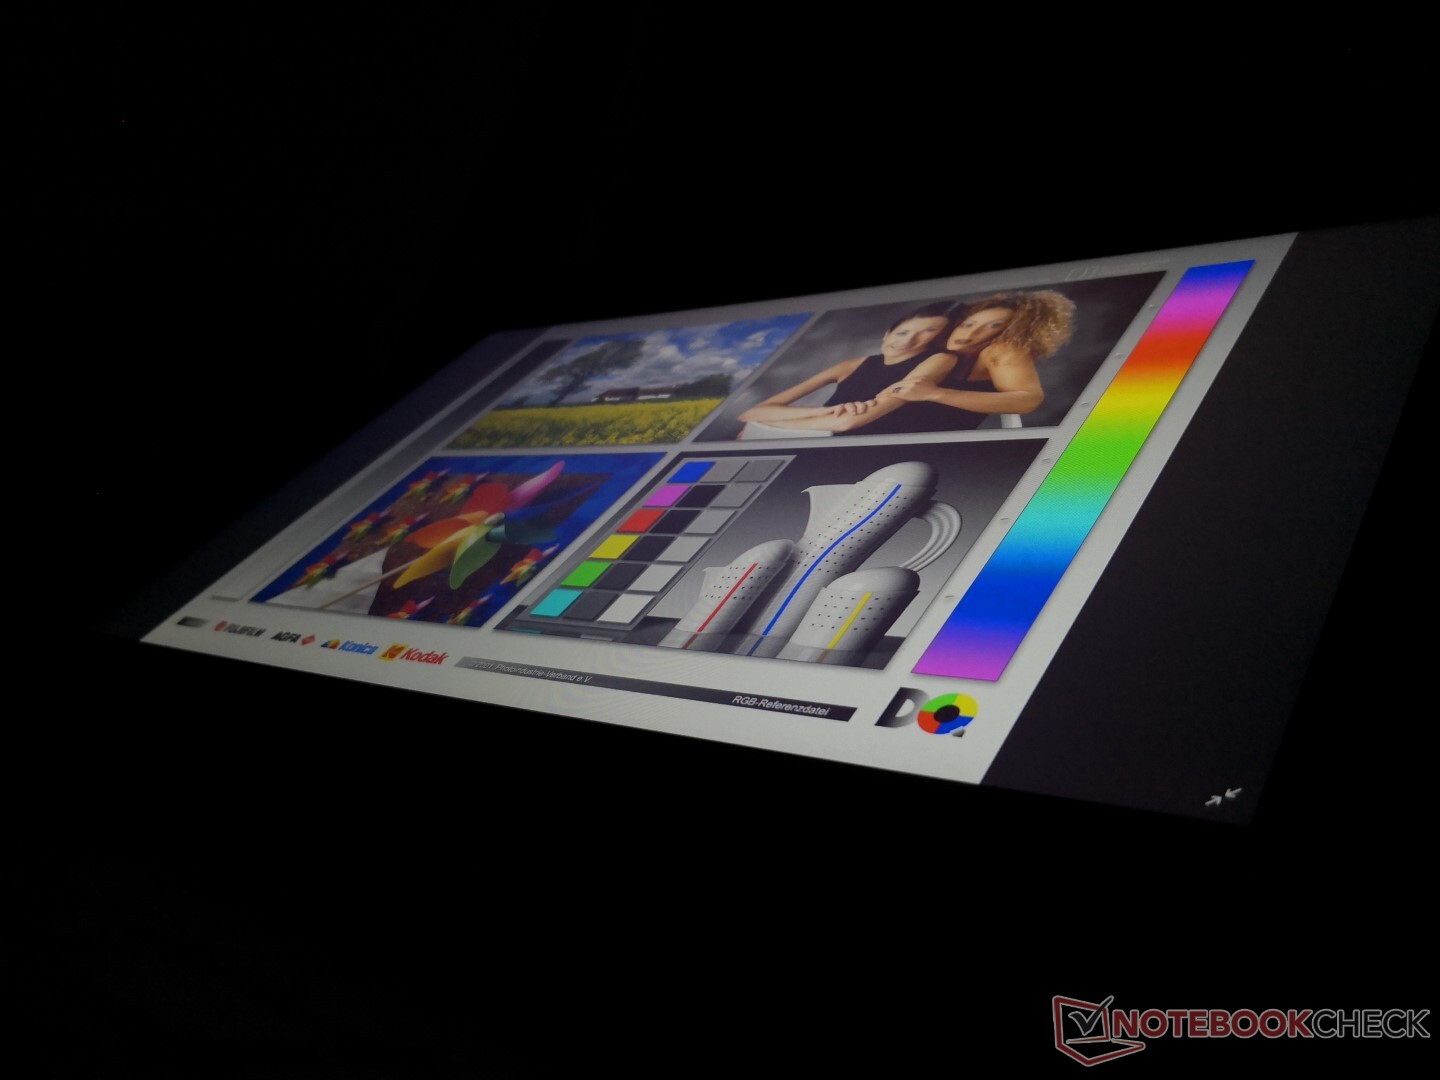
Görüntüle
Asus, hem TUF A15 FA506IV hem de ROG Strix G15 G512LI için aynı Panda LM156LF-2F01 IPS panelini kullanıyor. Doğal 144 Hz yenileme hızı dikkate değer olsa da, tepki süreleri ortalamadır ve kontrast yalnızca yaklaşık 500: 1 oranında ortalıkta ve genel olarak sığ renkler için ortalamanın altında renk üretimi sağlar. Bu, Strix Scar III G531GW'de kullanılan Sharp panellerle karşılaştırıldığında ekonomik bir oyun paneli. Neyse ki, Asus bu şasi için daha yüksek 240 Hz / 3 ms'lik bir seçenek sunuyor.
| |||||||||||||||||||||||||
Aydınlatma: 79 %
Batarya modunda parlaklık: 271.2 cd/m²
Kontrast: 512:1 (Siyah: 0.53 cd/m²)
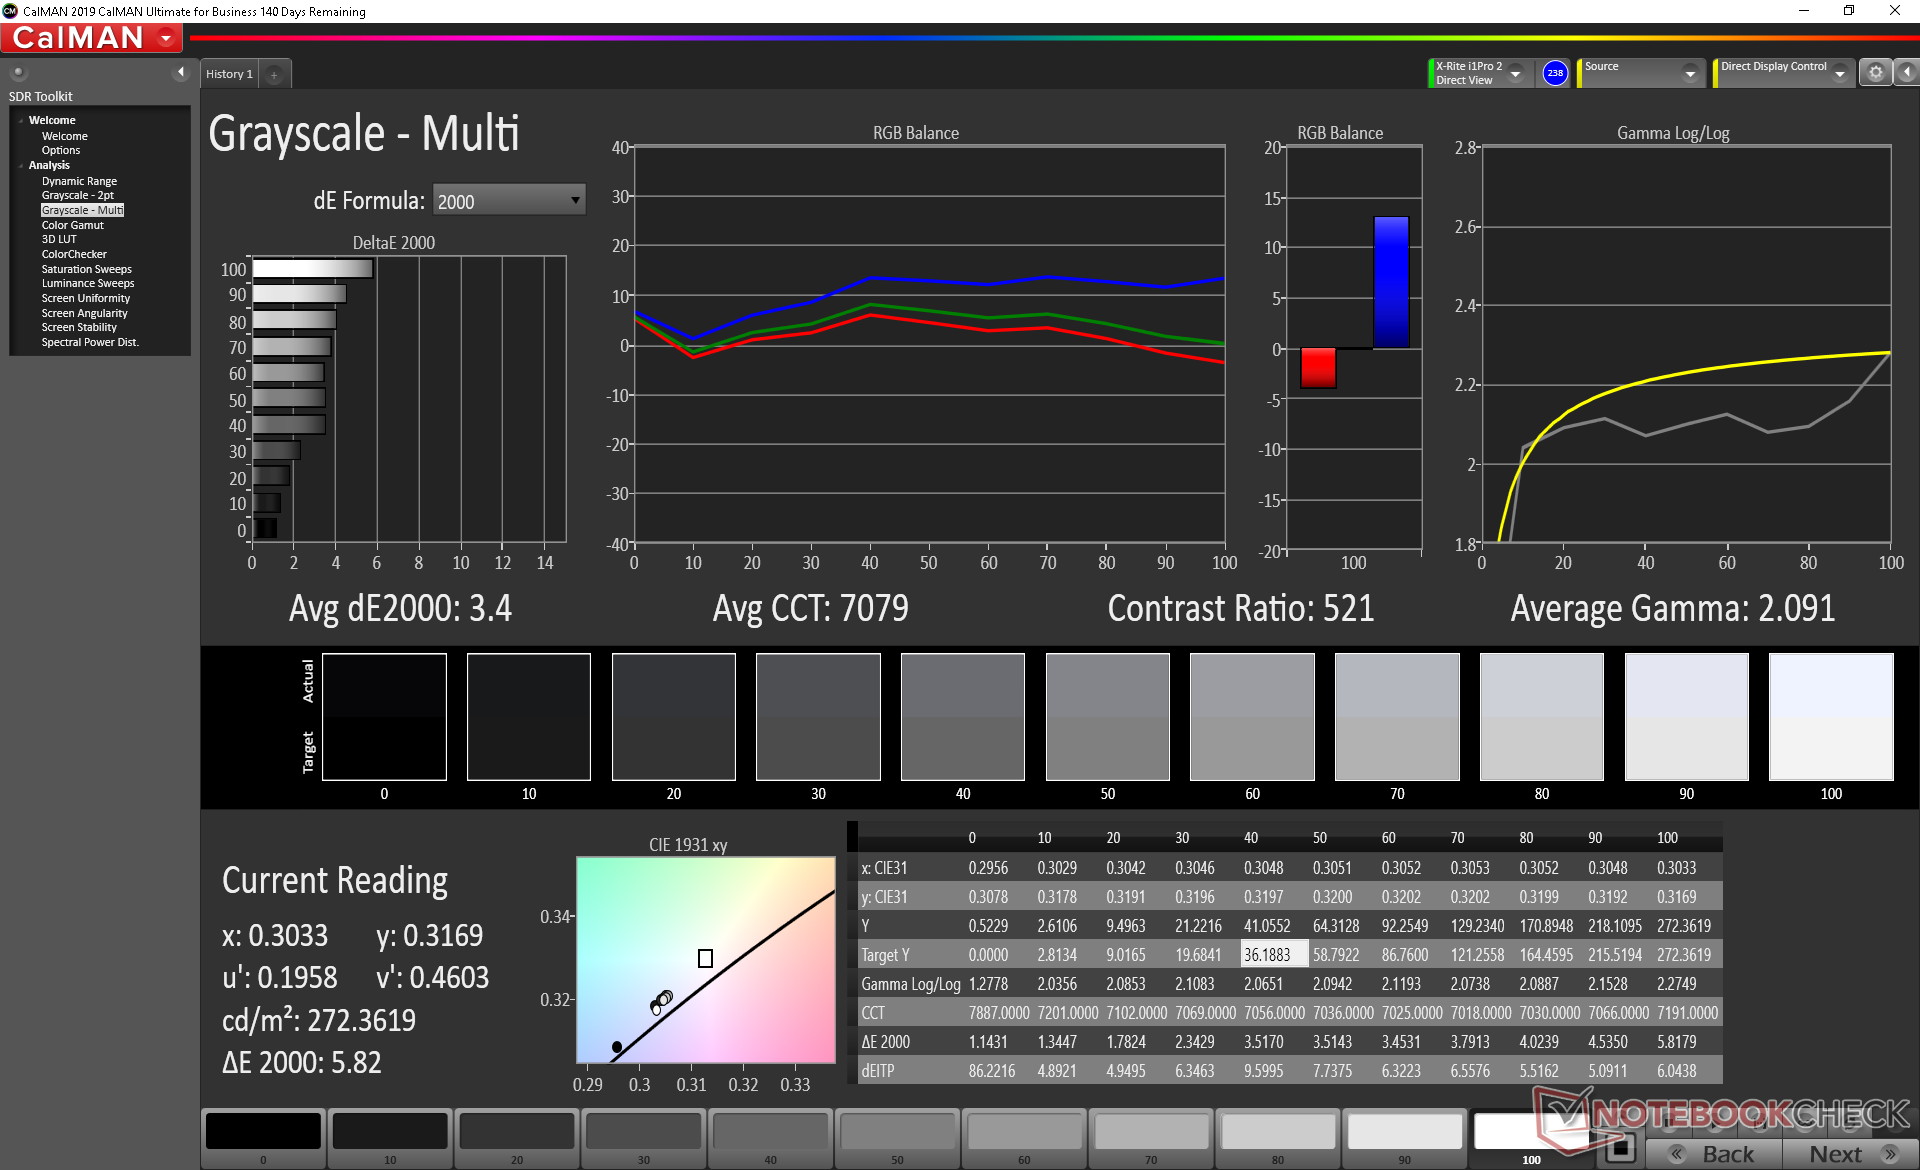
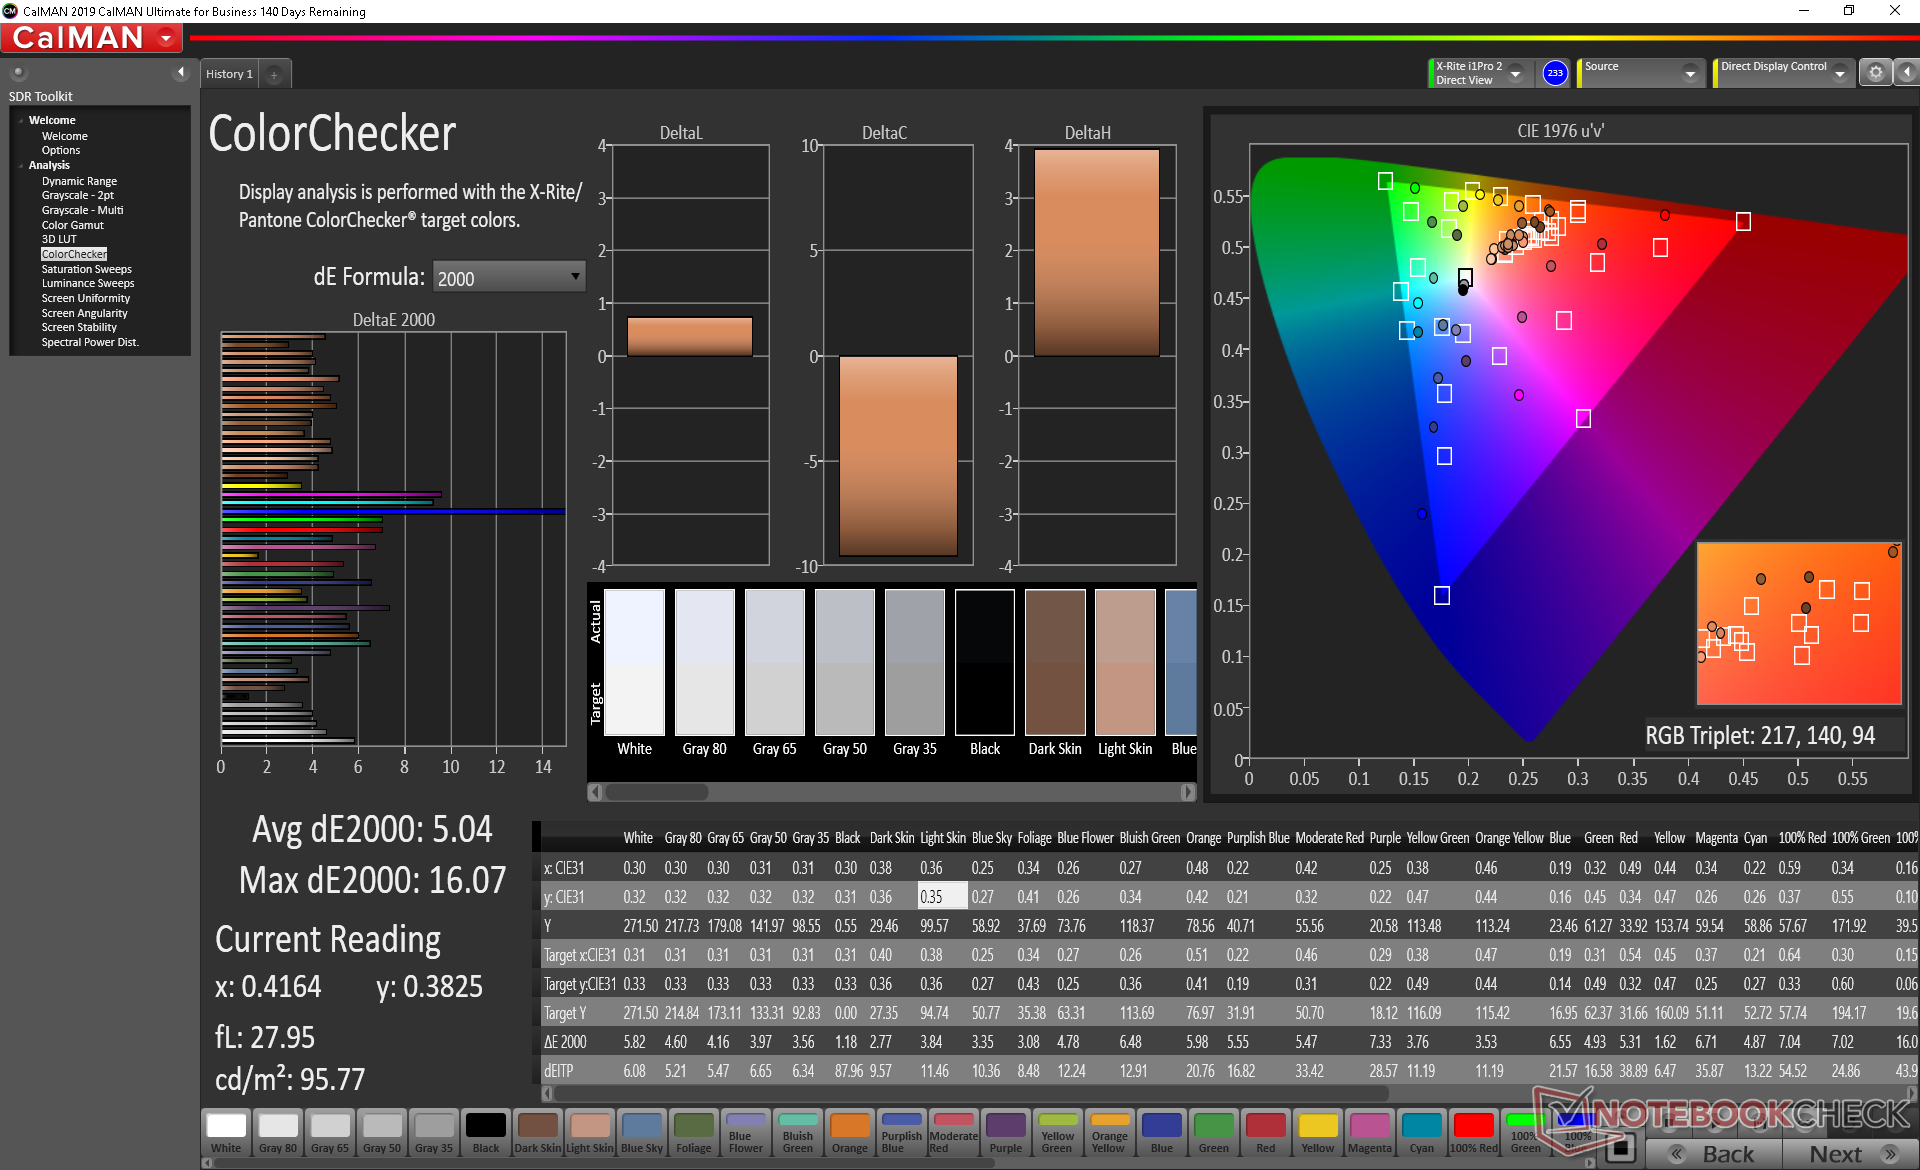
ΔE ColorChecker Calman: 5.04 | ∀{0.5-29.43 Ø4.73}
calibrated: 4.26
ΔE Greyscale Calman: 3.4 | ∀{0.09-98 Ø4.97}
59.5% sRGB (Argyll 1.6.3 3D)
37.8% AdobeRGB 1998 (Argyll 1.6.3 3D)
41.06% AdobeRGB 1998 (Argyll 3D)
59.8% sRGB (Argyll 3D)
39.73% Display P3 (Argyll 3D)
Gamma: 2.09
CCT: 7079 K
| Asus ROG Strix G15 G512LI Panda LM156LF-2F01, IPS, 15.6", 1920x1080 | Asus TUF Gaming A15 FA506IV-HN172 LM156LF-2F01, IPS, 15.6", 1920x1080 | Asus Strix Scar III G531GW-AZ062T Sharp LQ156M1JW09 (SHP14D3), IPS, 15.6", 1920x1080 | MSI GP65 10SFK-047US LG Philips LP156WFG-SPB3, IPS, 15.6", 1920x1080 | Dell G5 15 SE 5505 P89F BOE NV156FH, WVA, 15.6", 1920x1080 | HP Omen 15-dc1020ng LGD05CE, IPS, 15.6", 1920x1080 | |
|---|---|---|---|---|---|---|
| Display | -2% | 65% | 59% | 55% | -3% | |
| Display P3 Coverage (%) | 39.73 | 38.92 -2% | 66.2 67% | 63.5 60% | 63 59% | 38.37 -3% |
| sRGB Coverage (%) | 59.8 | 58.5 -2% | 97.1 62% | 94.4 58% | 90.1 51% | 57.6 -4% |
| AdobeRGB 1998 Coverage (%) | 41.06 | 40.22 -2% | 67.6 65% | 65.1 59% | 64.1 56% | 39.69 -3% |
| Response Times | 6% | 61% | 63% | 50% | -13% | |
| Response Time Grey 50% / Grey 80% * (ms) | 33.6 ? | 34 ? -1% | 15 ? 55% | 10.4 ? 69% | 20.4 ? 39% | 40 ? -19% |
| Response Time Black / White * (ms) | 27.6 ? | 24 ? 13% | 9 ? 67% | 12 ? 57% | 10.8 ? 61% | 29.6 ? -7% |
| PWM Frequency (Hz) | 250 ? | 198.4 ? | ||||
| Screen | 25% | 29% | 36% | 36% | 14% | |
| Brightness middle (cd/m²) | 271.2 | 280 3% | 309 14% | 384.9 42% | 292 8% | 251 -7% |
| Brightness (cd/m²) | 252 | 254 1% | 284 13% | 358 42% | 290 15% | 232 -8% |
| Brightness Distribution (%) | 79 | 88 11% | 88 11% | 87 10% | 77 -3% | 76 -4% |
| Black Level * (cd/m²) | 0.53 | 0.15 72% | 0.42 21% | 0.67 -26% | 0.27 49% | 0.17 68% |
| Contrast (:1) | 512 | 1867 265% | 736 44% | 574 12% | 1081 111% | 1476 188% |
| Colorchecker dE 2000 * | 5.04 | 5.89 -17% | 3.99 21% | 2.43 52% | 3.99 21% | 6.2 -23% |
| Colorchecker dE 2000 max. * | 16.07 | 19 -18% | 8.3 48% | 4.58 71% | 6.11 62% | 18.6 -16% |
| Colorchecker dE 2000 calibrated * | 4.26 | 4.79 -12% | 1.12 74% | 2.03 52% | 3.02 29% | 4.8 -13% |
| Greyscale dE 2000 * | 3.4 | 4.08 -20% | 5.43 -60% | 2.6 24% | 3.3 3% | 4.2 -24% |
| Gamma | 2.09 105% | 2.33 94% | 2.57 86% | 2.2 100% | 2.25 98% | 2.32 95% |
| CCT | 7079 92% | 7303 89% | 7767 84% | 6981 93% | 7047 92% | 7454 87% |
| Color Space (Percent of AdobeRGB 1998) (%) | 37.8 | 37 -2% | 63 67% | 59.7 58% | 58.1 54% | 36.5 -3% |
| Color Space (Percent of sRGB) (%) | 59.5 | 58 -3% | 97 63% | 93.9 58% | 89.7 51% | 57.4 -4% |
| Toplam Ortalama (Program / Ayarlar) | 10% /
18% | 52% /
40% | 53% /
44% | 47% /
42% | -1% /
7% |
* ... daha küçük daha iyidir
Bütçe görüntüsünü göstermek için renk alanı sRGB'nin sadece yüzde 60'ında dar. Bu sonuçlar Asus TUF A15 FA506IV'de kaydettiklerimizle uyumluyken, ROG G531 gibi daha pahalı oyun modelleri daha derin ve daha doğru renkler için sRGB'yi neredeyse tamamen kaplıyor.
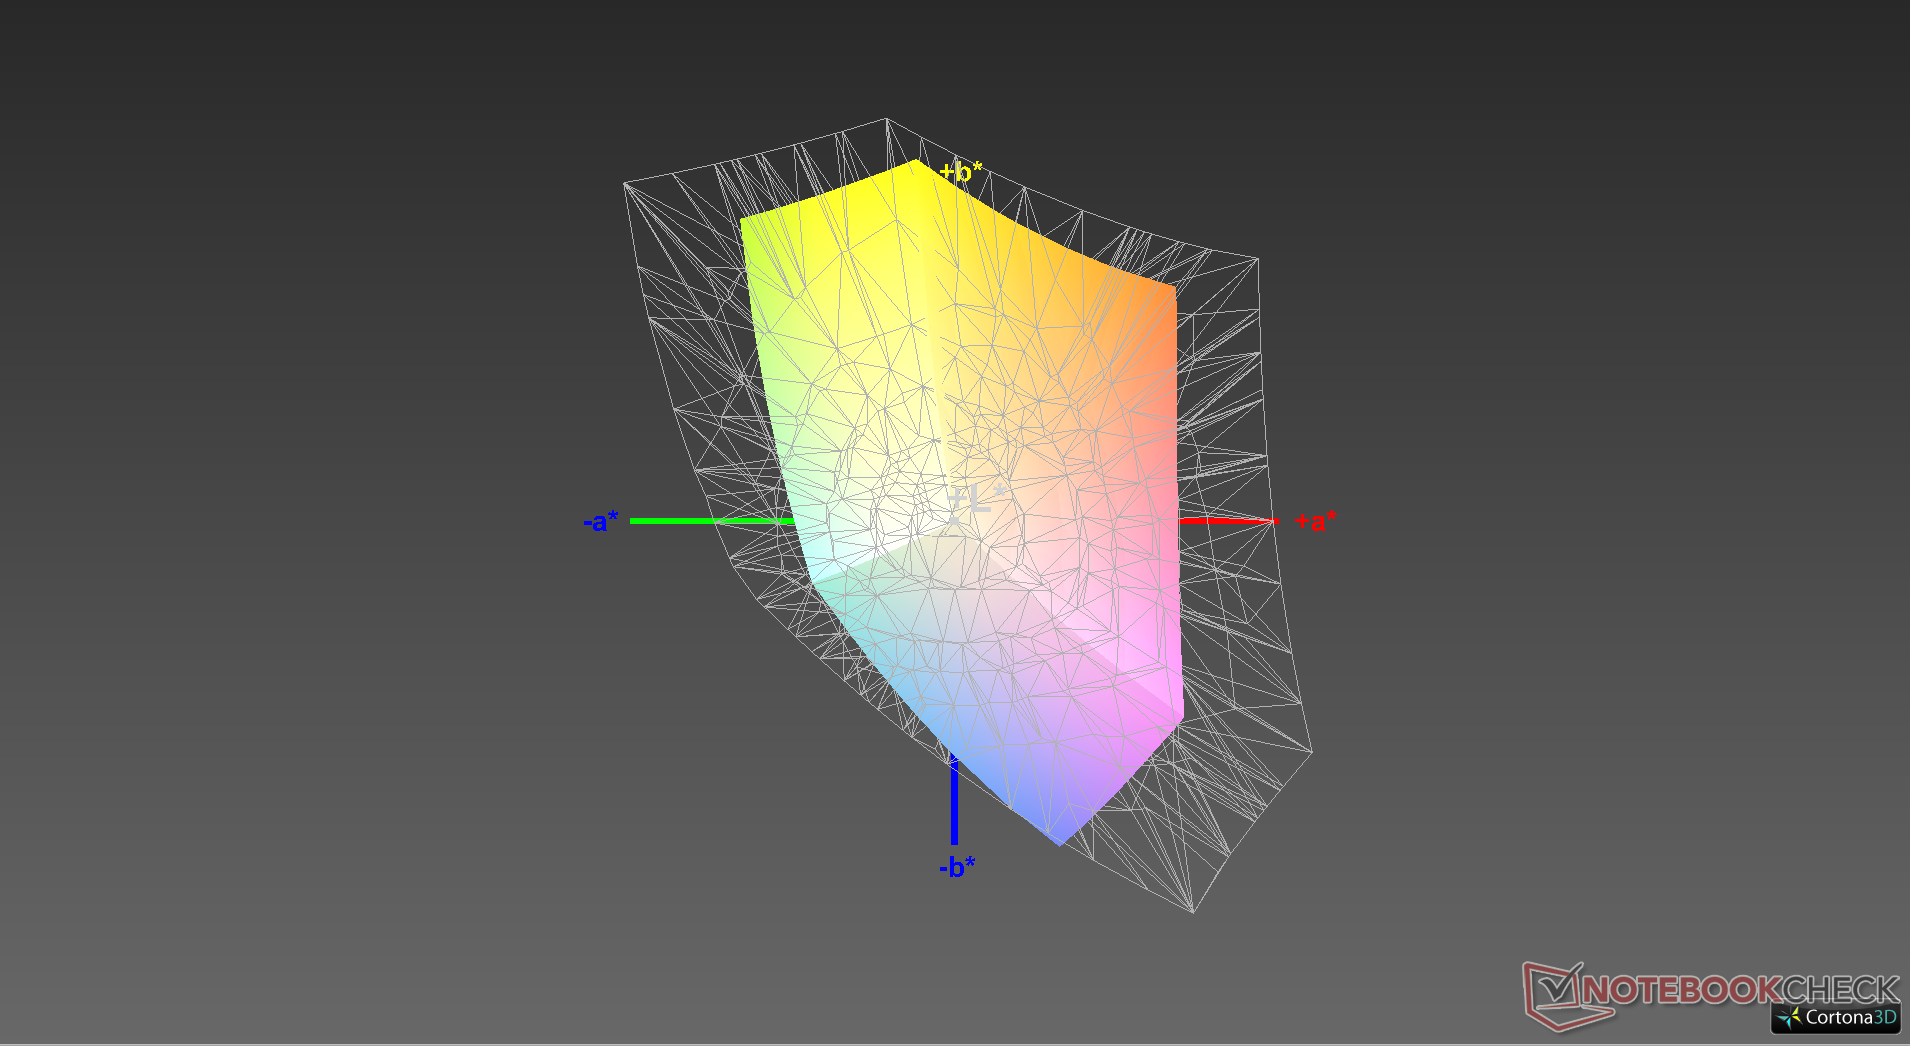
Bir kolorimetre ile yapılan diğer ölçümler kutudan aşırı soğuk bir renk sıcaklığı ortaya çıkarır. Ekranı kendimiz kalibre etmek sorunu ele alır, ancak yukarıda belirtilen sınırlı renk alanı nedeniyle renk doğruluğu neredeyse aynı kalır.
Yanıt Sürelerini Görüntüle
| ↔ Tepki Süresi Siyahtan Beyaza | ||
|---|---|---|
| 27.6 ms ... yükseliş ↗ ve sonbahar↘ birleşimi | ↗ 15.6 ms yükseliş |  |
| ↘ 12 ms sonbahar | ||
| Ekran, testlerimizde nispeten yavaş yanıt oranları gösteriyor ve oyuncular için çok yavaş olabilir. Karşılaştırıldığında, test edilen tüm cihazlar 0.1 (minimum) ile 240 (maksimum) ms arasında değişir. » Tüm cihazların 70 %'si daha iyi. Bu, ölçülen yanıt süresinin test edilen tüm cihazların ortalamasından (19.9 ms) daha kötü olduğu anlamına gelir. | ||
| ↔ Tepki Süresi %50 Griden %80 Griye | ||
| 33.6 ms ... yükseliş ↗ ve sonbahar↘ birleşimi | ↗ 18.4 ms yükseliş |  |
| ↘ 15.2 ms sonbahar | ||
| Ekran, testlerimizde yavaş yanıt oranları gösteriyor ve oyuncular için yetersiz olacaktır. Karşılaştırıldığında, test edilen tüm cihazlar 0.165 (minimum) ile 636 (maksimum) ms arasında değişir. » Tüm cihazların 46 %'si daha iyi. Bu, ölçülen yanıt süresinin test edilen tüm cihazların ortalamasına benzer olduğu anlamına gelir (31.1 ms). | ||
Ekran Titremesi / PWM (Darbe Genişliği Modülasyonu)
| Ekran titriyor / PWM algılanmadı | 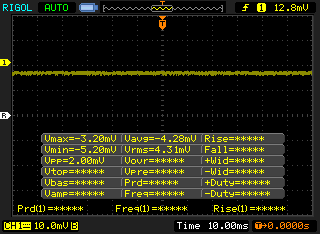 | ||
Karşılaştırıldığında: Test edilen tüm cihazların %52 %'si ekranı karartmak için PWM kullanmıyor. PWM tespit edilirse, ortalama 7784 (minimum: 5 - maksimum: 343500) Hz ölçüldü. | |||
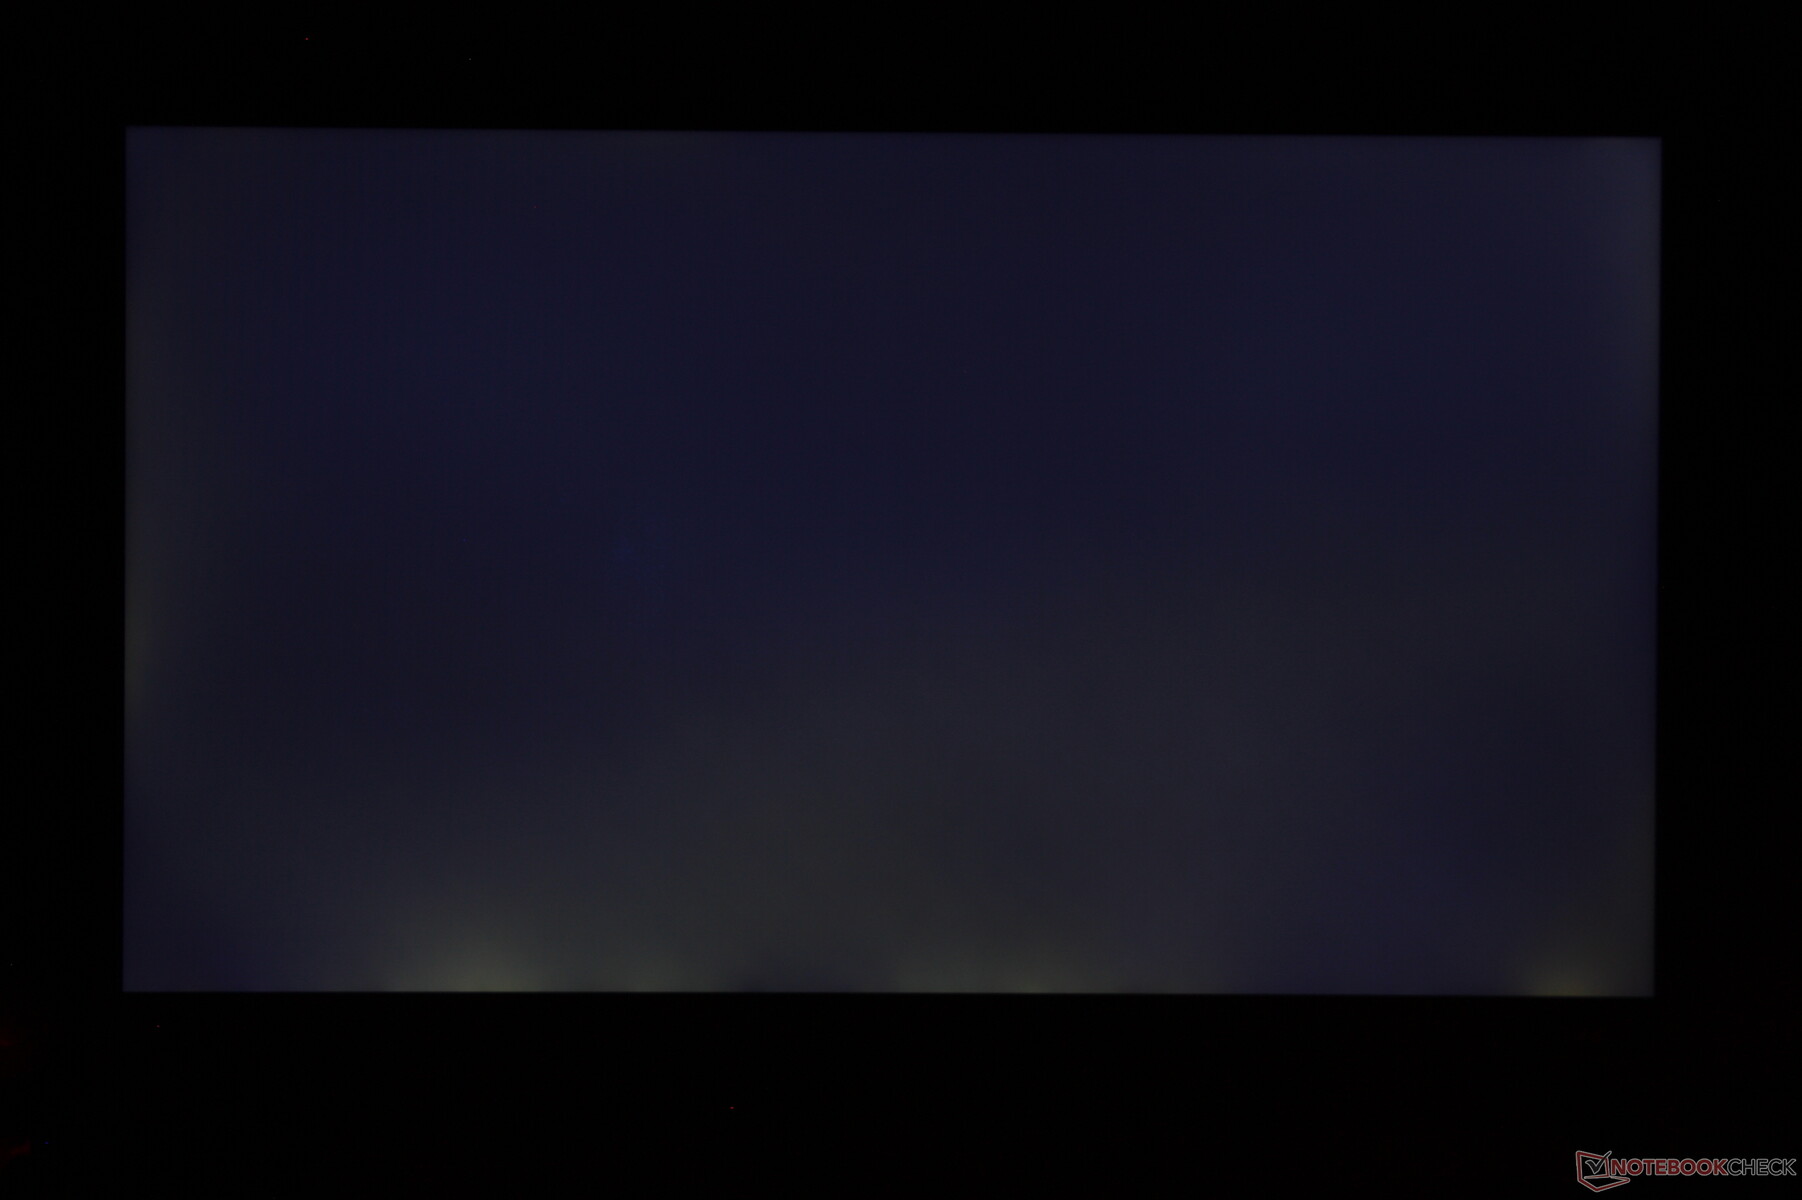
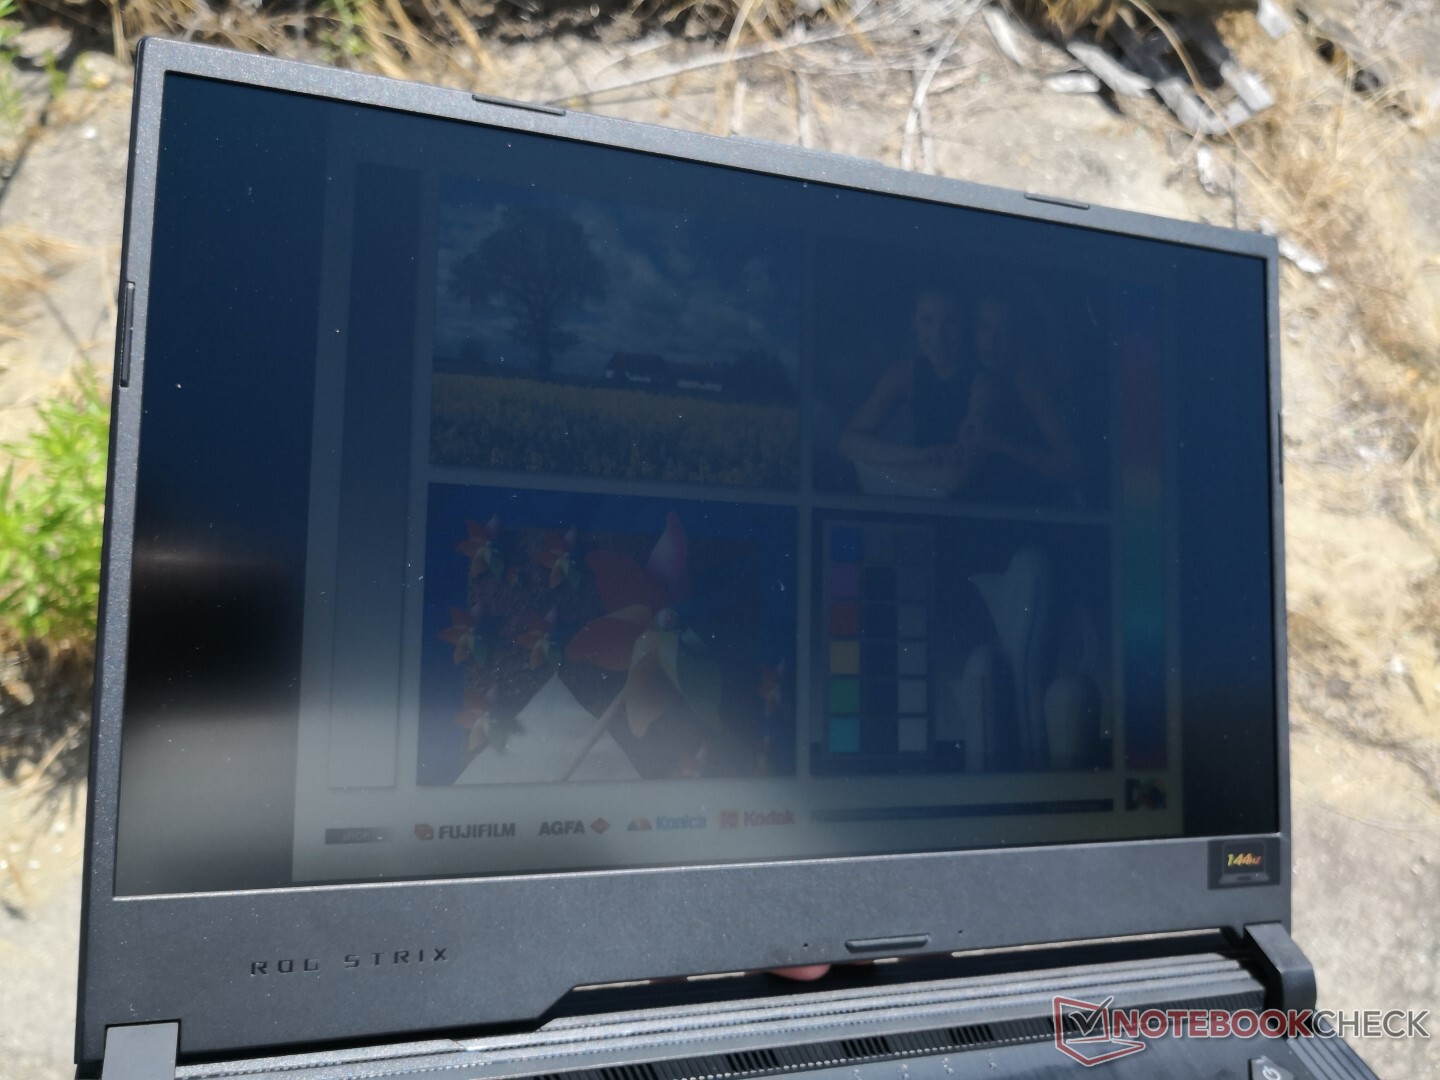
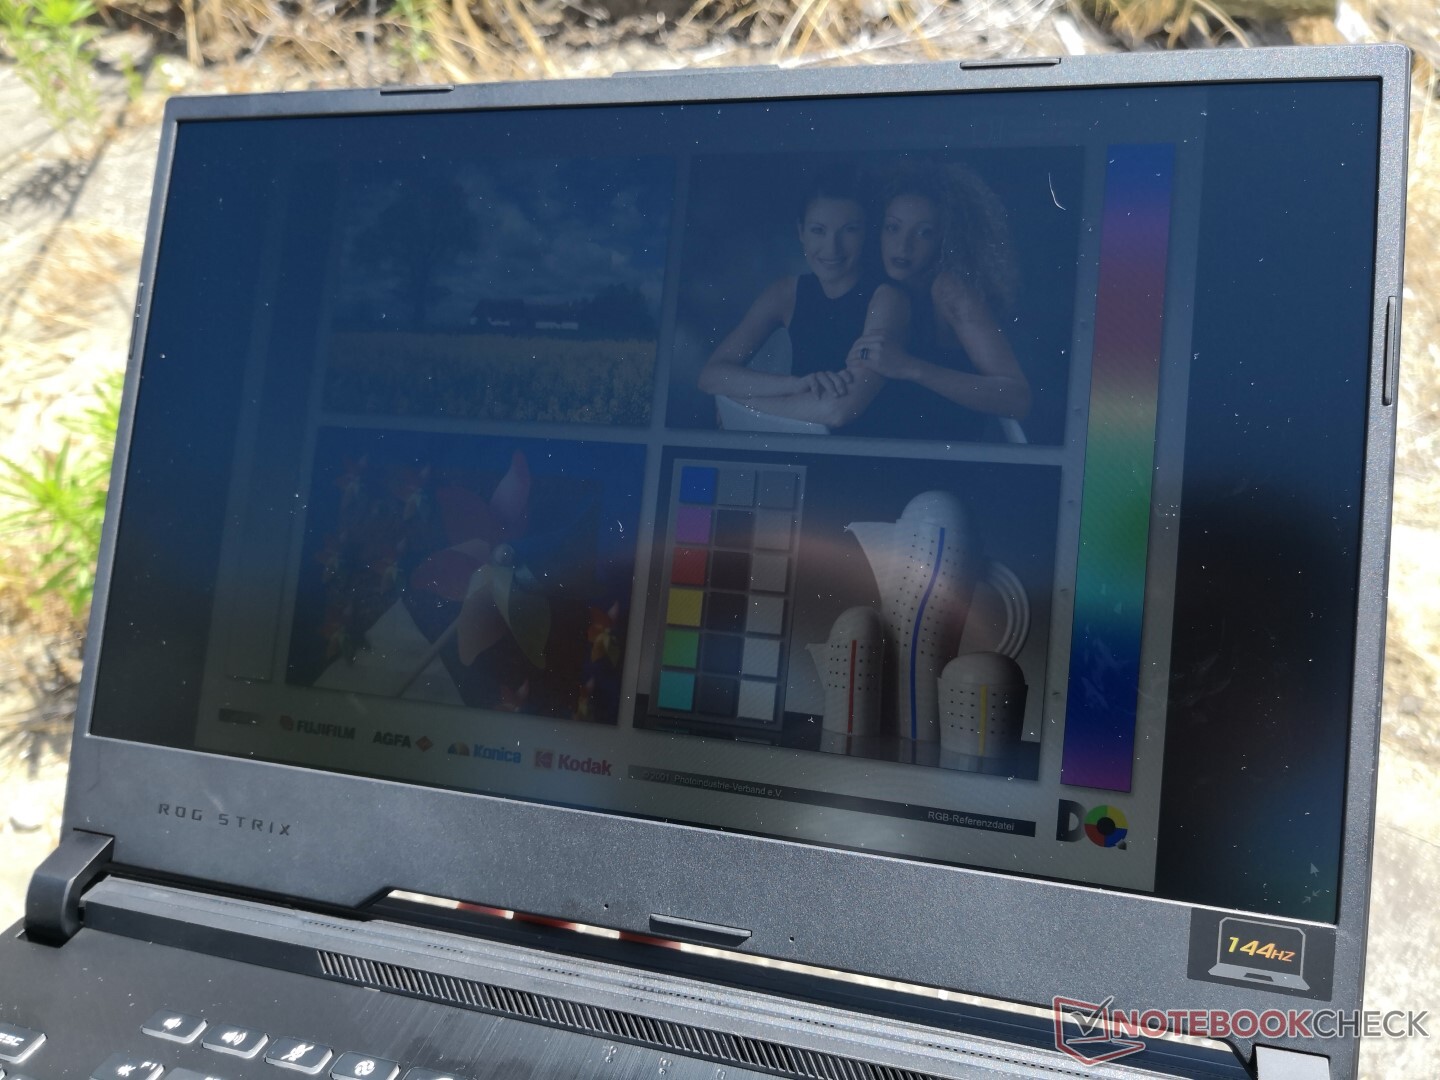
Bu dizüstü bilgisayar dışarıda sık sık kullanılmak üzere tasarlanmadığından, dış mekan görünürlüğü gölgede iken ortalama olarak en iyisidir. Dar menteşe açısı dış mekan kullanımını da caydırır.
Verim
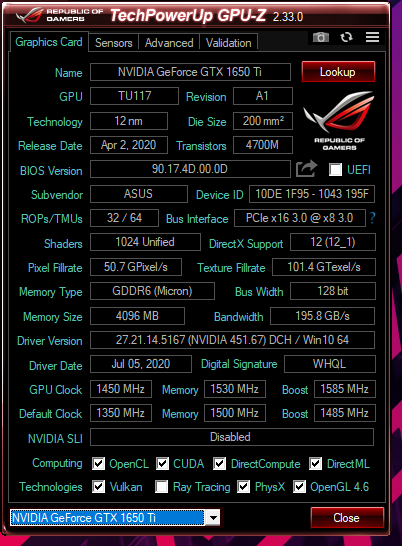
Asus, en iyi ihtimalle orta menzilli bir şasi için RTX 2070 Super'e kadar şaşırtıcı derecede yüksek GPU seçenekleri sunuyor. Core i9, AMD Ryzen veya RTX 2080 seçeneklerini arayan kullanıcıların G512 serisinin dışına ve TUF serisine veya ana ROG serisine bakması gerekecek.Aşağıdaki ölçümlerimizin ve numaralarımızın yalnızca incelemedeki yapılandırmamızı yansıttığını unutmayın. Daha güçlü RTX 2060 veya RTX 2070 Super'e sahip daha üst düzey SKU'lar, burada kaydettiğimizden daha yüksek ve / veya daha sıcak çalışacaktır.Nvidia Optimus, G-Sync seçenekleri olmadan standart olarak gelir.
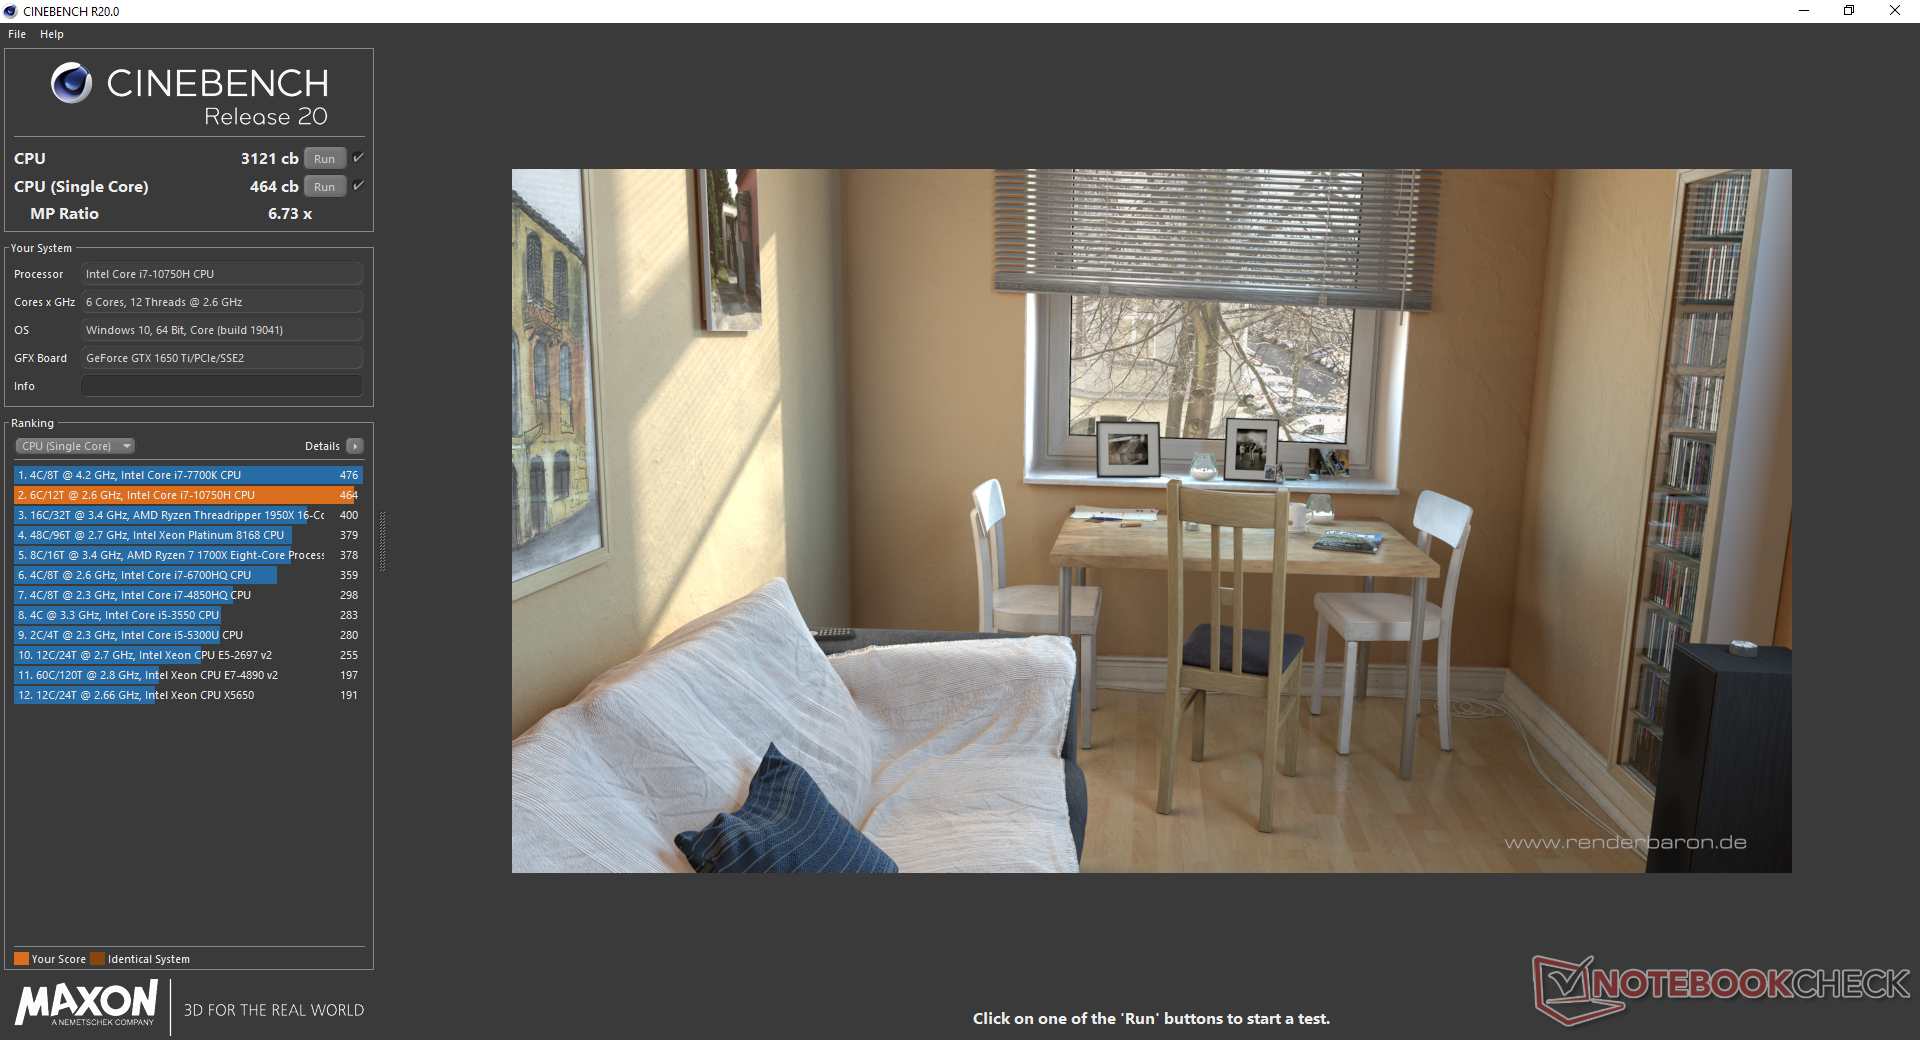
İşlemci
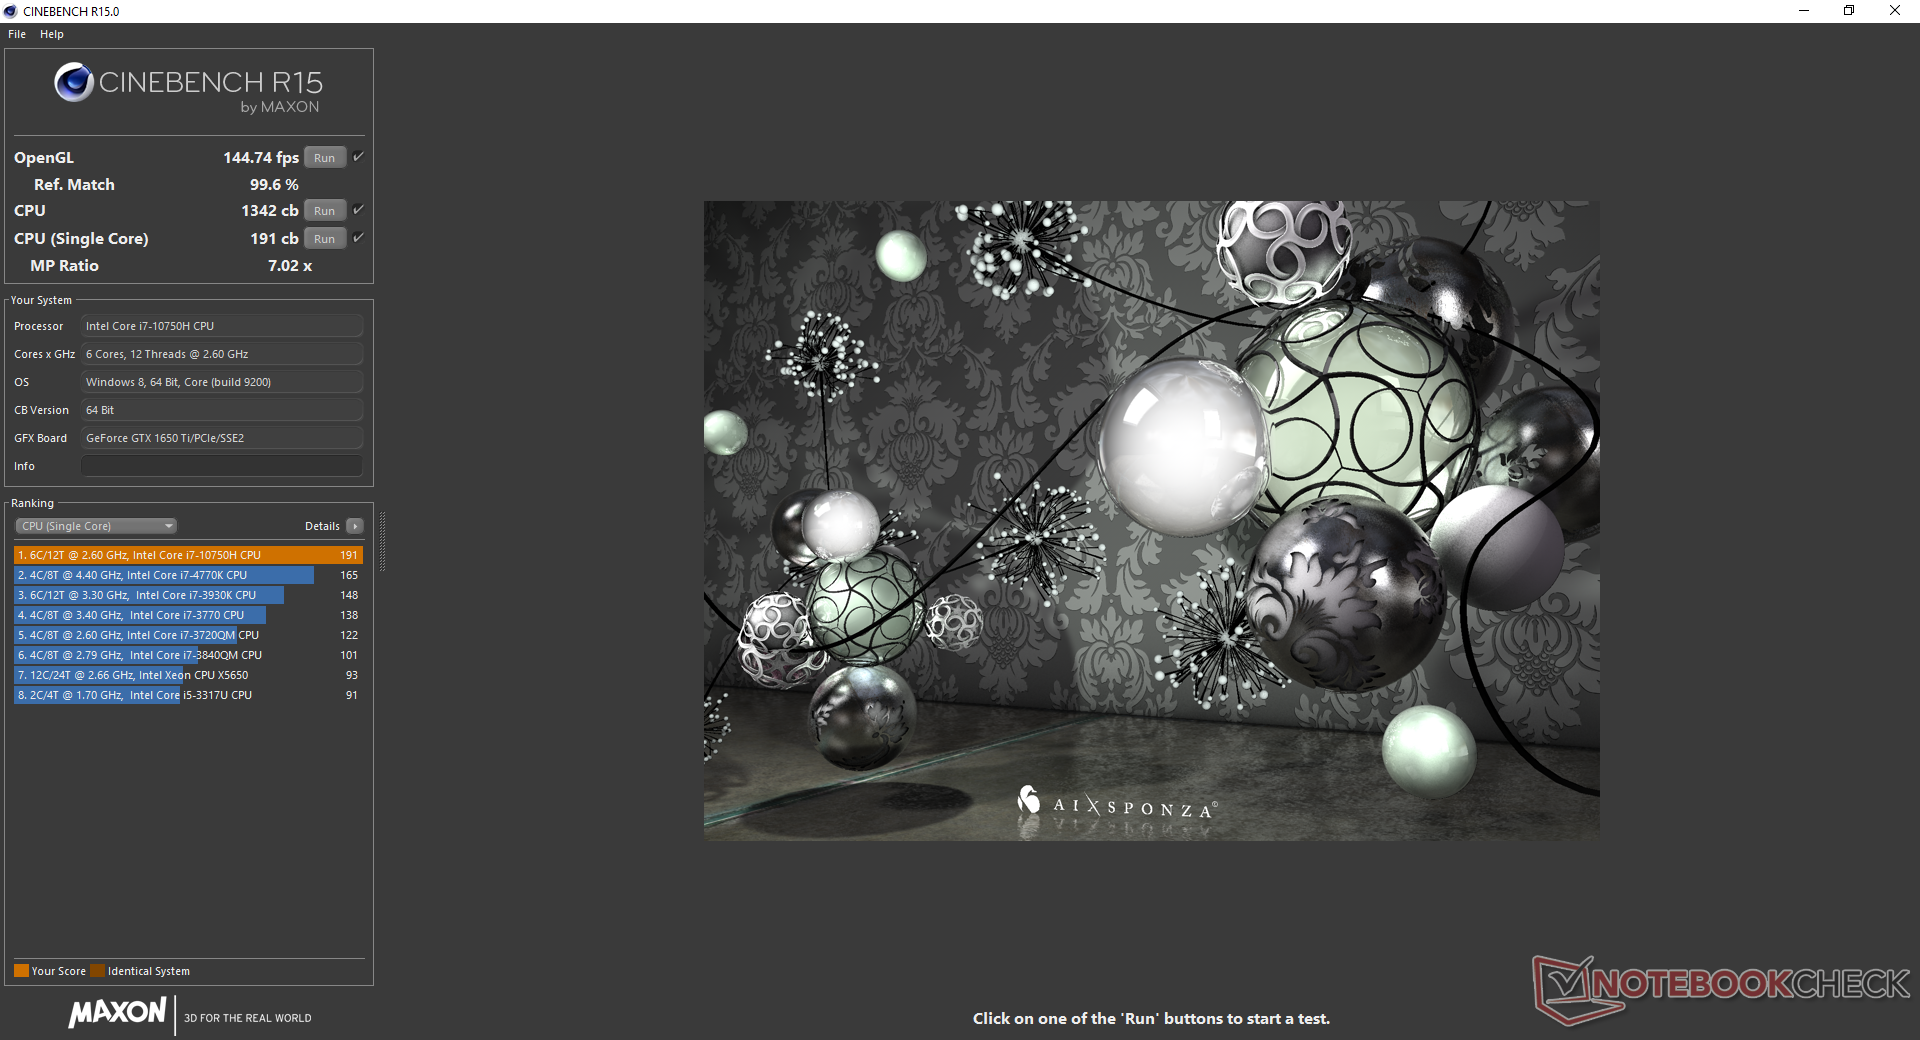
Core i7-10750H, aynı işlemciyle veritabanımızdaki diğer dizüstü bilgisayarlara göre olmasını beklediğimiz yerde performans sergiliyor. Çok iş parçacıklı performans, rakip Ryzen 5 4600H'den biraz daha yavaşken, söz konusu dizüstü bilgisayara bağlı olarak son nesil Core i7-9750H'den yaklaşık yüzde 10 ila 30 daha hızlı olacaktır. Sekiz çekirdekli Core i7-10875H'ye yükseltme, yaklaşık yüzde 25 daha hızlı performans sağlayacaktır. Daha fazla teknik bilgi ve karşılaştırma karşılaştırmaları için Core i7-10750H'deki özel sayfamıza bakın.
Cinebench R15: CPU Multi 64Bit | CPU Single 64Bit
Blender: v2.79 BMW27 CPU
7-Zip 18.03: 7z b 4 -mmt1 | 7z b 4
Geekbench 5.5: Single-Core | Multi-Core
HWBOT x265 Benchmark v2.2: 4k Preset
LibreOffice : 20 Documents To PDF
R Benchmark 2.5: Overall mean
| Cinebench R20 / CPU (Multi Core) | |
| Dell G5 15 SE 5505 P89F | |
| Asus Zephyrus G14 GA401IV | |
| MSI GE66 Raider 10SFS | |
| Gigabyte Aero 15 OLED XB-8DE51B0SP | |
| MSI GE65 Raider 9SF-049US | |
| Acer Nitro 5 AN515-44-R5FT | |
| Asus ROG Strix G15 G512LI | |
| Ortalama Intel Core i7-10750H (1749 - 3325, n=43) | |
| Schenker XMG Pro 15 | |
| Lenovo Legion 5 15IMH05H | |
| Asus ROG Zephyrus G15 GA502DU | |
| MSI GF63 Thin 9SC | |
| Cinebench R20 / CPU (Single Core) | |
| Gigabyte Aero 15 OLED XB-8DE51B0SP | |
| Asus Zephyrus G14 GA401IV | |
| Dell G5 15 SE 5505 P89F | |
| MSI GE66 Raider 10SFS | |
| MSI GE65 Raider 9SF-049US | |
| Ortalama Intel Core i7-10750H (431 - 504, n=43) | |
| Lenovo Legion 5 15IMH05H | |
| Asus ROG Strix G15 G512LI | |
| Acer Nitro 5 AN515-44-R5FT | |
| Schenker XMG Pro 15 | |
| MSI GF63 Thin 9SC | |
| Asus ROG Zephyrus G15 GA502DU | |
| Cinebench R15 / CPU Multi 64Bit | |
| Dell G5 15 SE 5505 P89F | |
| Asus Zephyrus G14 GA401IV | |
| Gigabyte Aero 15 OLED XB-8DE51B0SP | |
| MSI GE66 Raider 10SFS | |
| MSI GE65 Raider 9SF-049US | |
| Acer Nitro 5 AN515-44-R5FT | |
| Asus ROG Strix G15 G512LI | |
| Ortalama Intel Core i7-10750H (804 - 1418, n=50) | |
| Schenker XMG Pro 15 | |
| Lenovo Legion 5 15IMH05H | |
| Asus ROG Zephyrus G15 GA502DU | |
| MSI GF63 Thin 9SC | |
| Cinebench R15 / CPU Single 64Bit | |
| Gigabyte Aero 15 OLED XB-8DE51B0SP | |
| MSI GE66 Raider 10SFS | |
| MSI GE65 Raider 9SF-049US | |
| Ortalama Intel Core i7-10750H (184 - 213, n=45) | |
| Asus Zephyrus G14 GA401IV | |
| Asus ROG Strix G15 G512LI | |
| Dell G5 15 SE 5505 P89F | |
| Lenovo Legion 5 15IMH05H | |
| Acer Nitro 5 AN515-44-R5FT | |
| Schenker XMG Pro 15 | |
| MSI GF63 Thin 9SC | |
| Asus ROG Zephyrus G15 GA502DU | |
| Blender / v2.79 BMW27 CPU | |
| Asus ROG Zephyrus G15 GA502DU | |
| Lenovo Legion 5 15IMH05H | |
| Schenker XMG Pro 15 | |
| Ortalama Intel Core i7-10750H (322 - 587, n=43) | |
| Asus ROG Strix G15 G512LI | |
| Acer Nitro 5 AN515-44-R5FT | |
| Asus Zephyrus G14 GA401IV | |
| Gigabyte Aero 15 OLED XB-8DE51B0SP | |
| MSI GE66 Raider 10SFS | |
| Dell G5 15 SE 5505 P89F | |
| 7-Zip 18.03 / 7z b 4 -mmt1 | |
| MSI GE66 Raider 10SFS | |
| Gigabyte Aero 15 OLED XB-8DE51B0SP | |
| Ortalama Intel Core i7-10750H (4504 - 5470, n=43) | |
| Asus ROG Strix G15 G512LI | |
| Lenovo Legion 5 15IMH05H | |
| Dell G5 15 SE 5505 P89F | |
| Asus Zephyrus G14 GA401IV | |
| Schenker XMG Pro 15 | |
| Acer Nitro 5 AN515-44-R5FT | |
| Asus ROG Zephyrus G15 GA502DU | |
| 7-Zip 18.03 / 7z b 4 | |
| Dell G5 15 SE 5505 P89F | |
| Asus Zephyrus G14 GA401IV | |
| Gigabyte Aero 15 OLED XB-8DE51B0SP | |
| MSI GE66 Raider 10SFS | |
| Acer Nitro 5 AN515-44-R5FT | |
| Asus ROG Strix G15 G512LI | |
| Ortalama Intel Core i7-10750H (26040 - 37345, n=43) | |
| Schenker XMG Pro 15 | |
| Lenovo Legion 5 15IMH05H | |
| Asus ROG Zephyrus G15 GA502DU | |
| Geekbench 5.5 / Single-Core | |
| MSI GE66 Raider 10SFS | |
| Gigabyte Aero 15 OLED XB-8DE51B0SP | |
| Ortalama Intel Core i7-10750H (1114 - 1333, n=43) | |
| Lenovo Legion 5 15IMH05H | |
| Asus Zephyrus G14 GA401IV | |
| Dell G5 15 SE 5505 P89F | |
| Schenker XMG Pro 15 | |
| Asus ROG Strix G15 G512LI | |
| Acer Nitro 5 AN515-44-R5FT | |
| Geekbench 5.5 / Multi-Core | |
| MSI GE66 Raider 10SFS | |
| Gigabyte Aero 15 OLED XB-8DE51B0SP | |
| Dell G5 15 SE 5505 P89F | |
| Asus Zephyrus G14 GA401IV | |
| Asus ROG Strix G15 G512LI | |
| Ortalama Intel Core i7-10750H (4443 - 6674, n=43) | |
| Schenker XMG Pro 15 | |
| Acer Nitro 5 AN515-44-R5FT | |
| Lenovo Legion 5 15IMH05H | |
| HWBOT x265 Benchmark v2.2 / 4k Preset | |
| Gigabyte Aero 15 OLED XB-8DE51B0SP | |
| MSI GE66 Raider 10SFS | |
| Dell G5 15 SE 5505 P89F | |
| Asus Zephyrus G14 GA401IV | |
| Asus ROG Strix G15 G512LI | |
| Ortalama Intel Core i7-10750H (5.54 - 11.6, n=43) | |
| Acer Nitro 5 AN515-44-R5FT | |
| Schenker XMG Pro 15 | |
| Lenovo Legion 5 15IMH05H | |
| Asus ROG Zephyrus G15 GA502DU | |
| LibreOffice / 20 Documents To PDF | |
| Dell G5 15 SE 5505 P89F | |
| Acer Nitro 5 AN515-44-R5FT | |
| MSI GE66 Raider 10SFS | |
| Ortalama Intel Core i7-10750H (43.1 - 99.2, n=43) | |
| Lenovo Legion 5 15IMH05H | |
| Gigabyte Aero 15 OLED XB-8DE51B0SP | |
| Asus ROG Strix G15 G512LI | |
| R Benchmark 2.5 / Overall mean | |
| Schenker XMG Pro 15 | |
| Lenovo Legion 5 15IMH05H | |
| Acer Nitro 5 AN515-44-R5FT | |
| Asus ROG Strix G15 G512LI | |
| Ortalama Intel Core i7-10750H (0.578 - 0.708, n=42) | |
| Dell G5 15 SE 5505 P89F | |
| MSI GE66 Raider 10SFS | |
| Gigabyte Aero 15 OLED XB-8DE51B0SP | |
* ... daha küçük daha iyidir
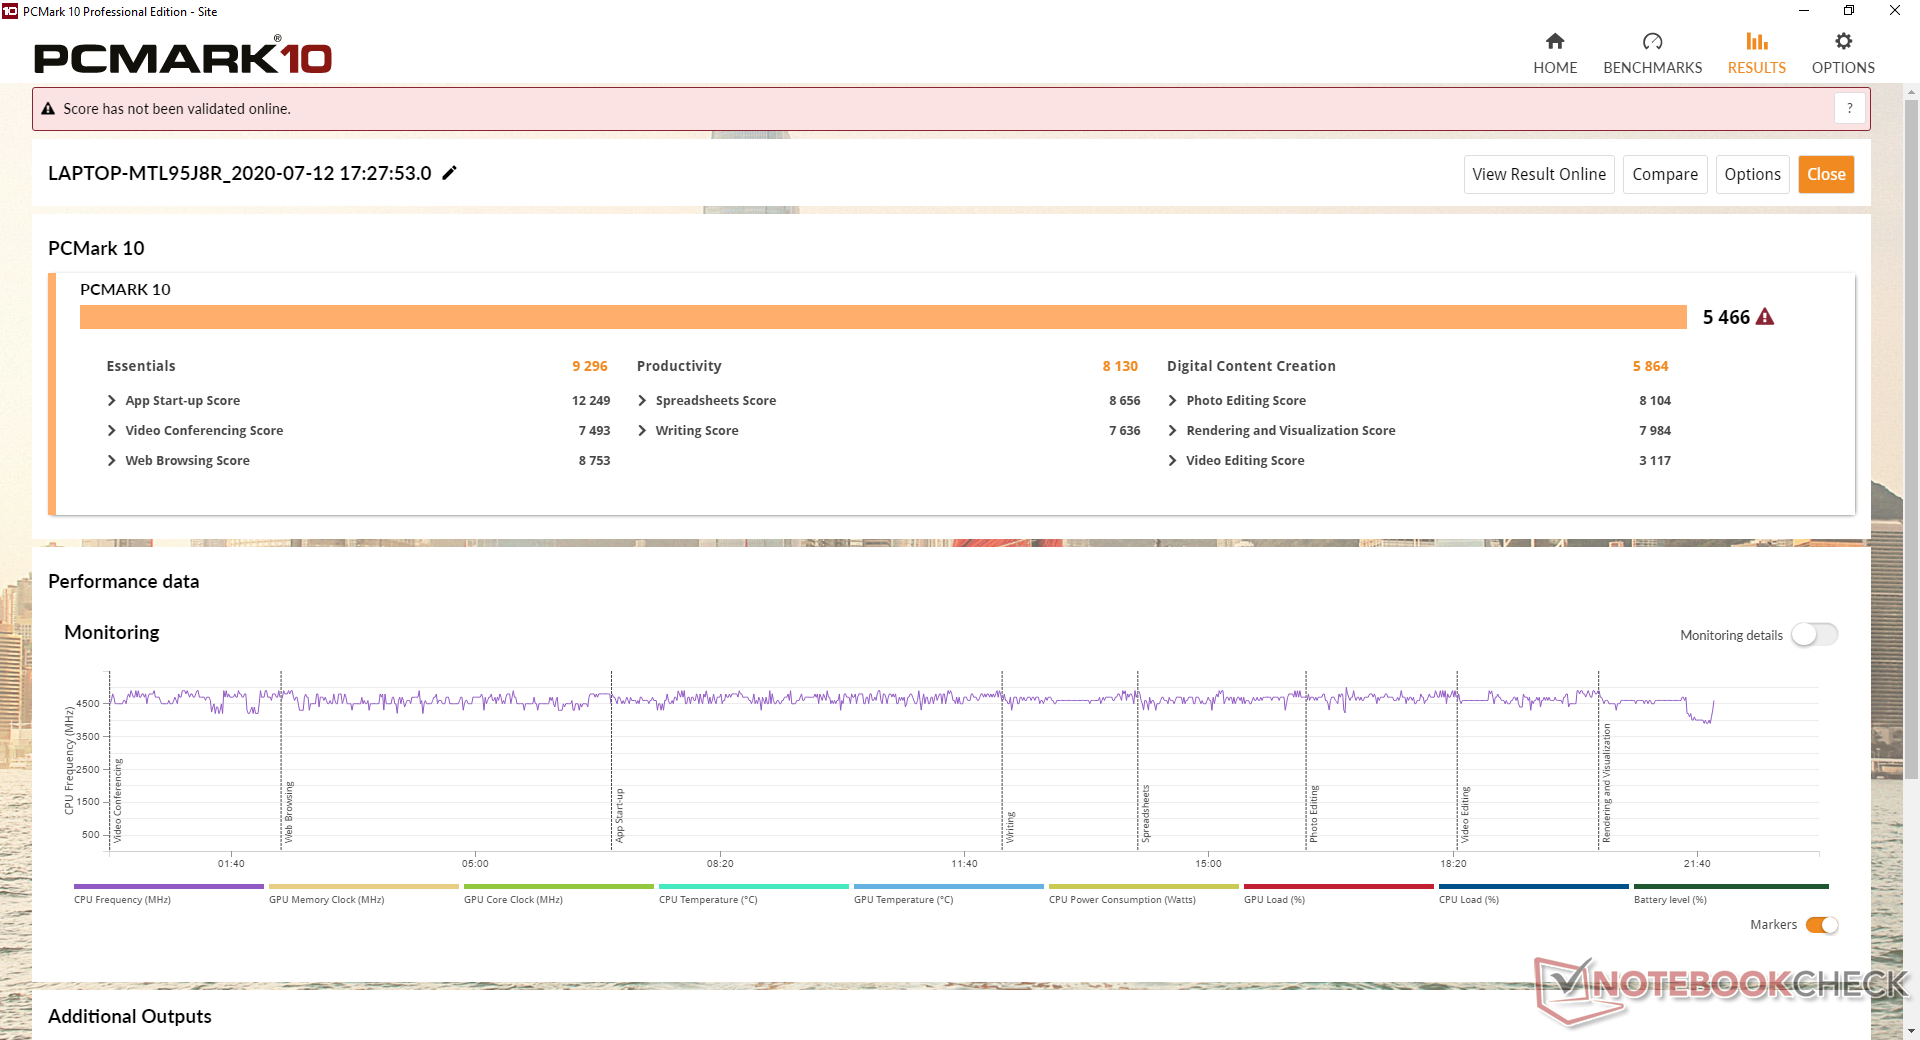
Sistem performansı
| PCMark 10 | |
| Score | |
| MSI GP65 10SFK-047US | |
| Dell G5 15 SE 5505 P89F | |
| Asus Strix Scar III G531GW-AZ062T | |
| Asus ROG Strix G15 G512LI | |
| Asus TUF Gaming A15 FA506IV-HN172 | |
| HP Omen 15-dc1020ng | |
| Essentials | |
| MSI GP65 10SFK-047US | |
| Dell G5 15 SE 5505 P89F | |
| Asus ROG Strix G15 G512LI | |
| Asus Strix Scar III G531GW-AZ062T | |
| Asus TUF Gaming A15 FA506IV-HN172 | |
| HP Omen 15-dc1020ng | |
| Productivity | |
| MSI GP65 10SFK-047US | |
| Asus ROG Strix G15 G512LI | |
| Asus Strix Scar III G531GW-AZ062T | |
| Dell G5 15 SE 5505 P89F | |
| HP Omen 15-dc1020ng | |
| Asus TUF Gaming A15 FA506IV-HN172 | |
| Digital Content Creation | |
| Dell G5 15 SE 5505 P89F | |
| MSI GP65 10SFK-047US | |
| Asus Strix Scar III G531GW-AZ062T | |
| Asus ROG Strix G15 G512LI | |
| Asus TUF Gaming A15 FA506IV-HN172 | |
| HP Omen 15-dc1020ng | |
| PCMark 8 | |
| Home Score Accelerated v2 | |
| Dell G5 15 SE 5505 P89F | |
| Asus Strix Scar III G531GW-AZ062T | |
| Asus TUF Gaming A15 FA506IV-HN172 | |
| MSI GP65 10SFK-047US | |
| Asus ROG Strix G15 G512LI | |
| HP Omen 15-dc1020ng | |
| Work Score Accelerated v2 | |
| MSI GP65 10SFK-047US | |
| Asus TUF Gaming A15 FA506IV-HN172 | |
| Asus Strix Scar III G531GW-AZ062T | |
| Asus ROG Strix G15 G512LI | |
| Dell G5 15 SE 5505 P89F | |
| HP Omen 15-dc1020ng | |
| PCMark 8 Home Score Accelerated v2 | 4420 puan | |
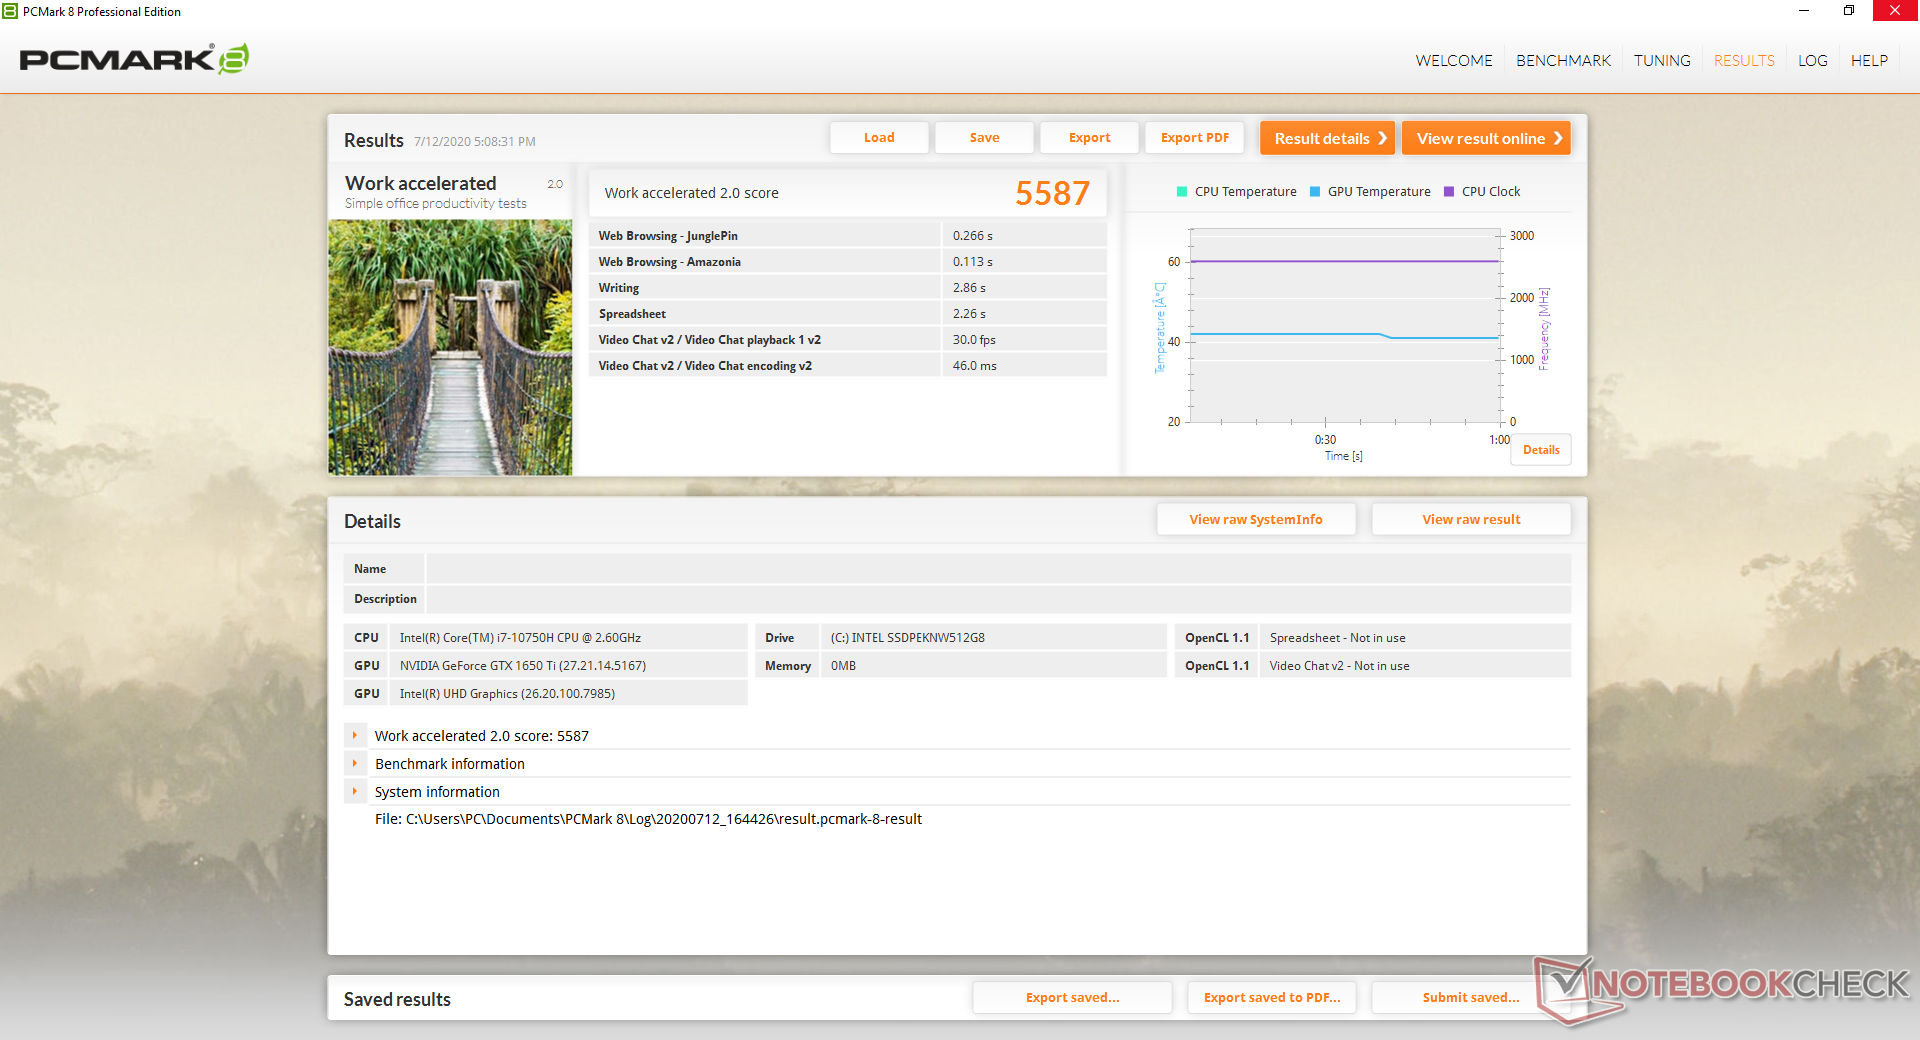
| PCMark 8 Work Score Accelerated v2 | 5587 puan | |
| PCMark 10 Score | 5466 puan | |
Yardım | ||
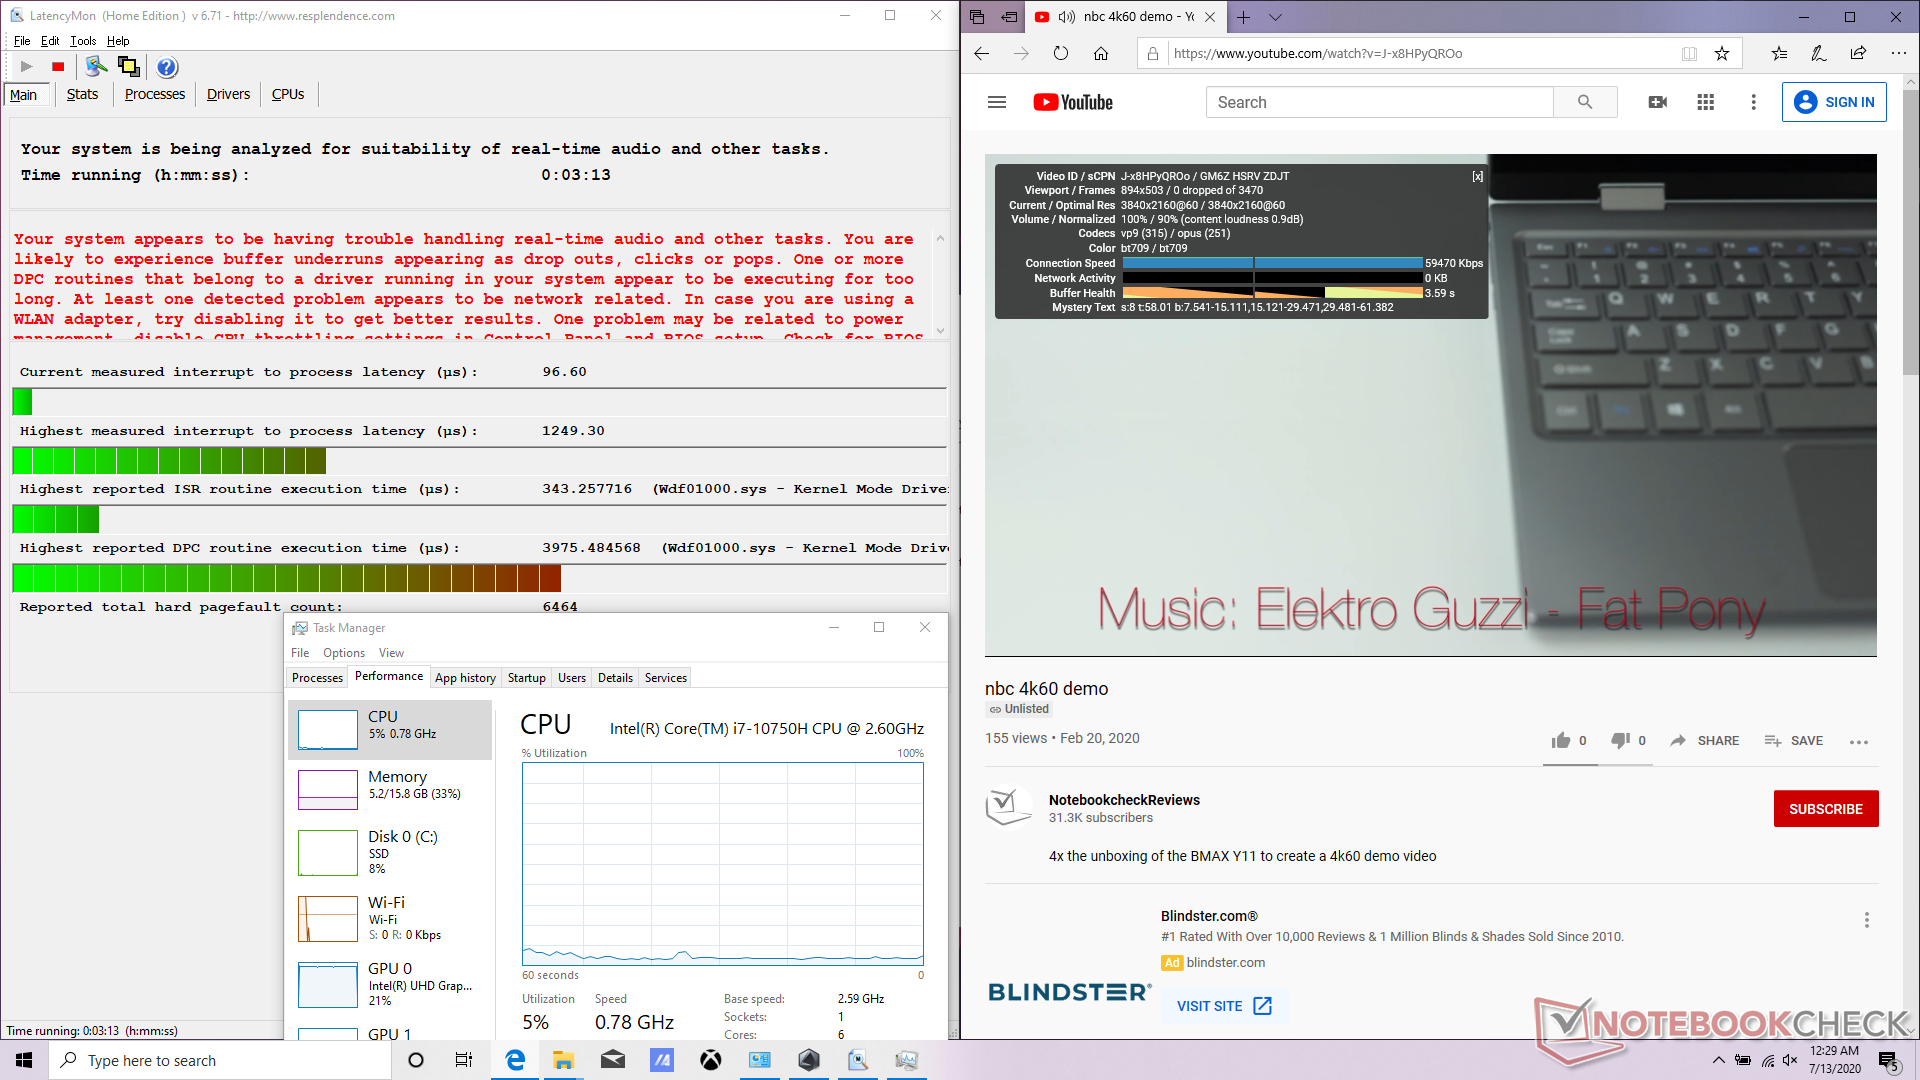
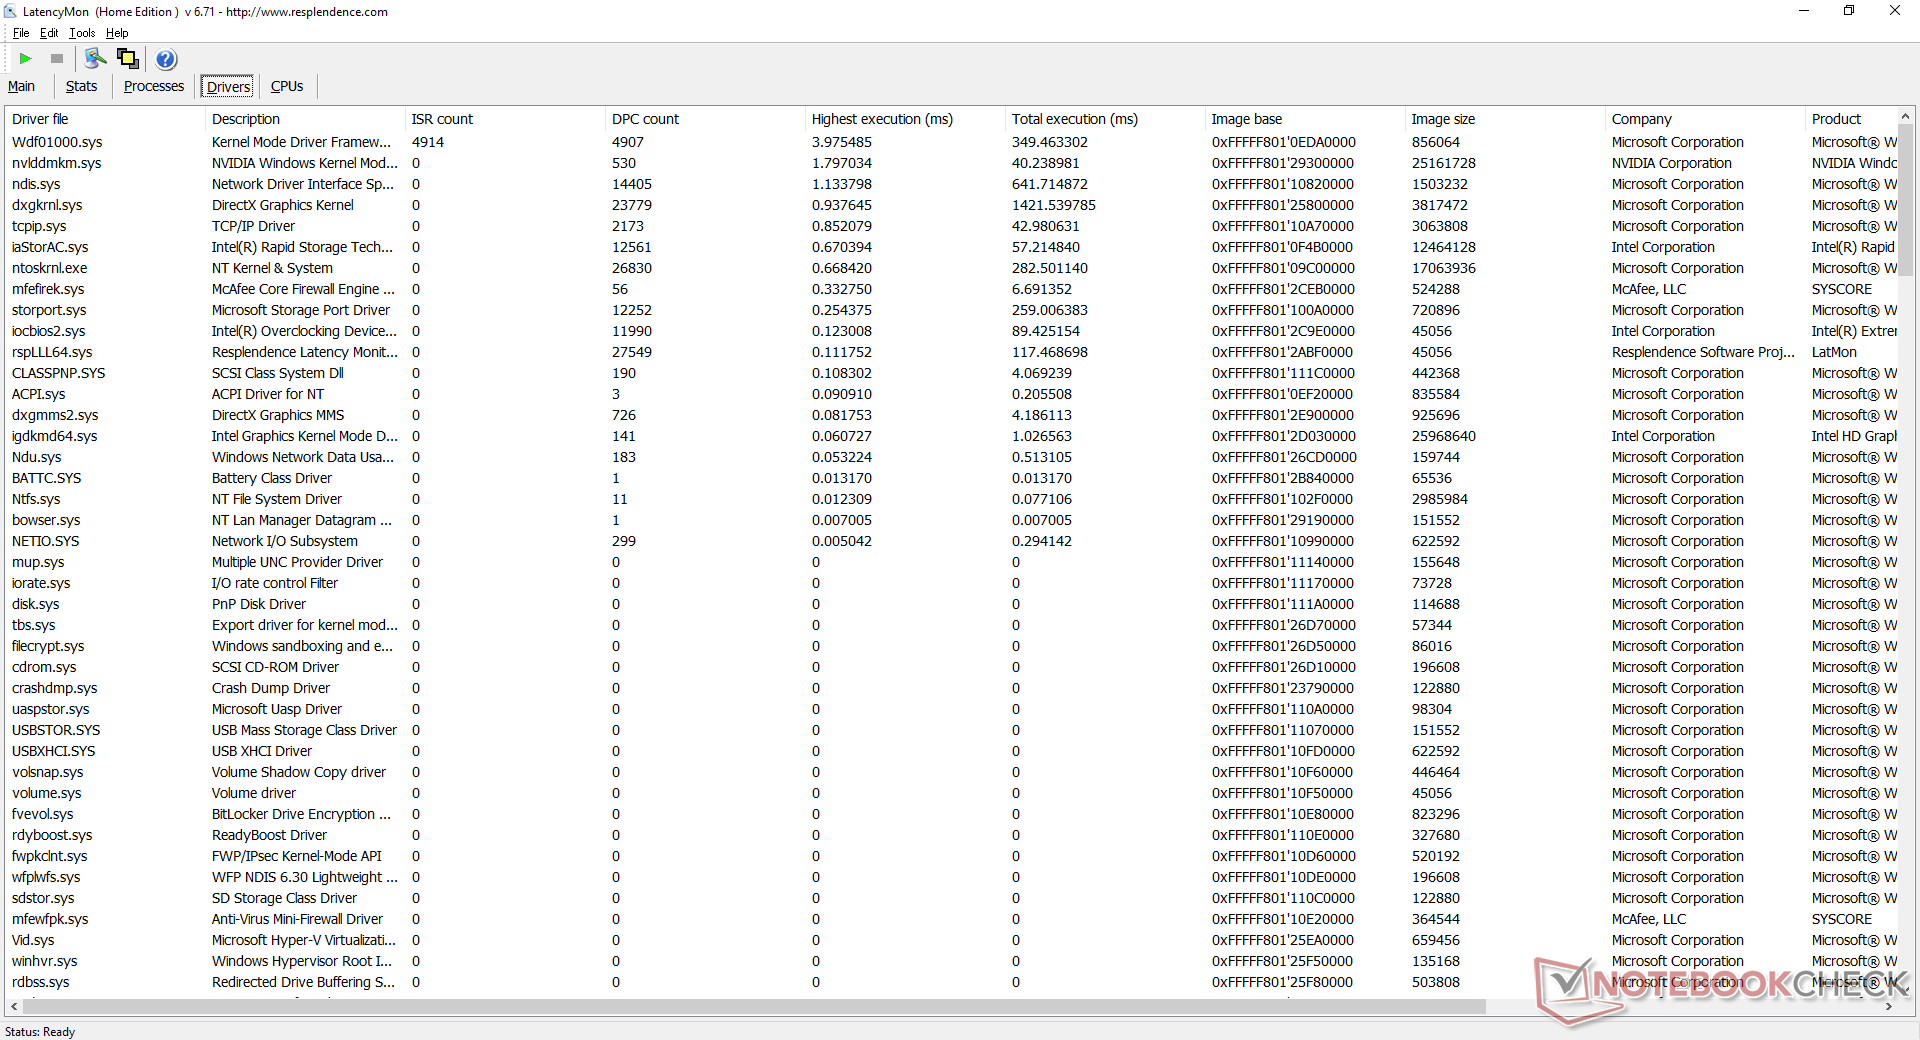
DPC Gecikmesi
Bizim birim Wdf01000.sys yüksek yürütme süreleri ile DPC gecikme sorunları gösterir. YouTube'da 4K video oynatımı, aksi takdirde pürüzsüzdür ve atlanan kareleri yoktur.
| DPC Latencies / LatencyMon - interrupt to process latency (max), Web, Youtube, Prime95 | |
| Dell G5 15 SE 5505 P89F | |
| Gigabyte Aero 15 OLED XB-8DE51B0SP | |
| MSI Bravo 15 A4DCR | |
| Asus ROG Strix G15 G512LI | |
| Acer Nitro 5 AN515-44-R5FT | |
| MSI GE66 Raider 10SFS | |
| Razer Blade 15 RZ09-0328 | |
| Asus TUF Gaming A15 FA506IV-HN172 | |
| Lenovo Legion 5 15IMH05H | |
| Eluktronics RP-15 | |
* ... daha küçük daha iyidir
Depolama aygıtları
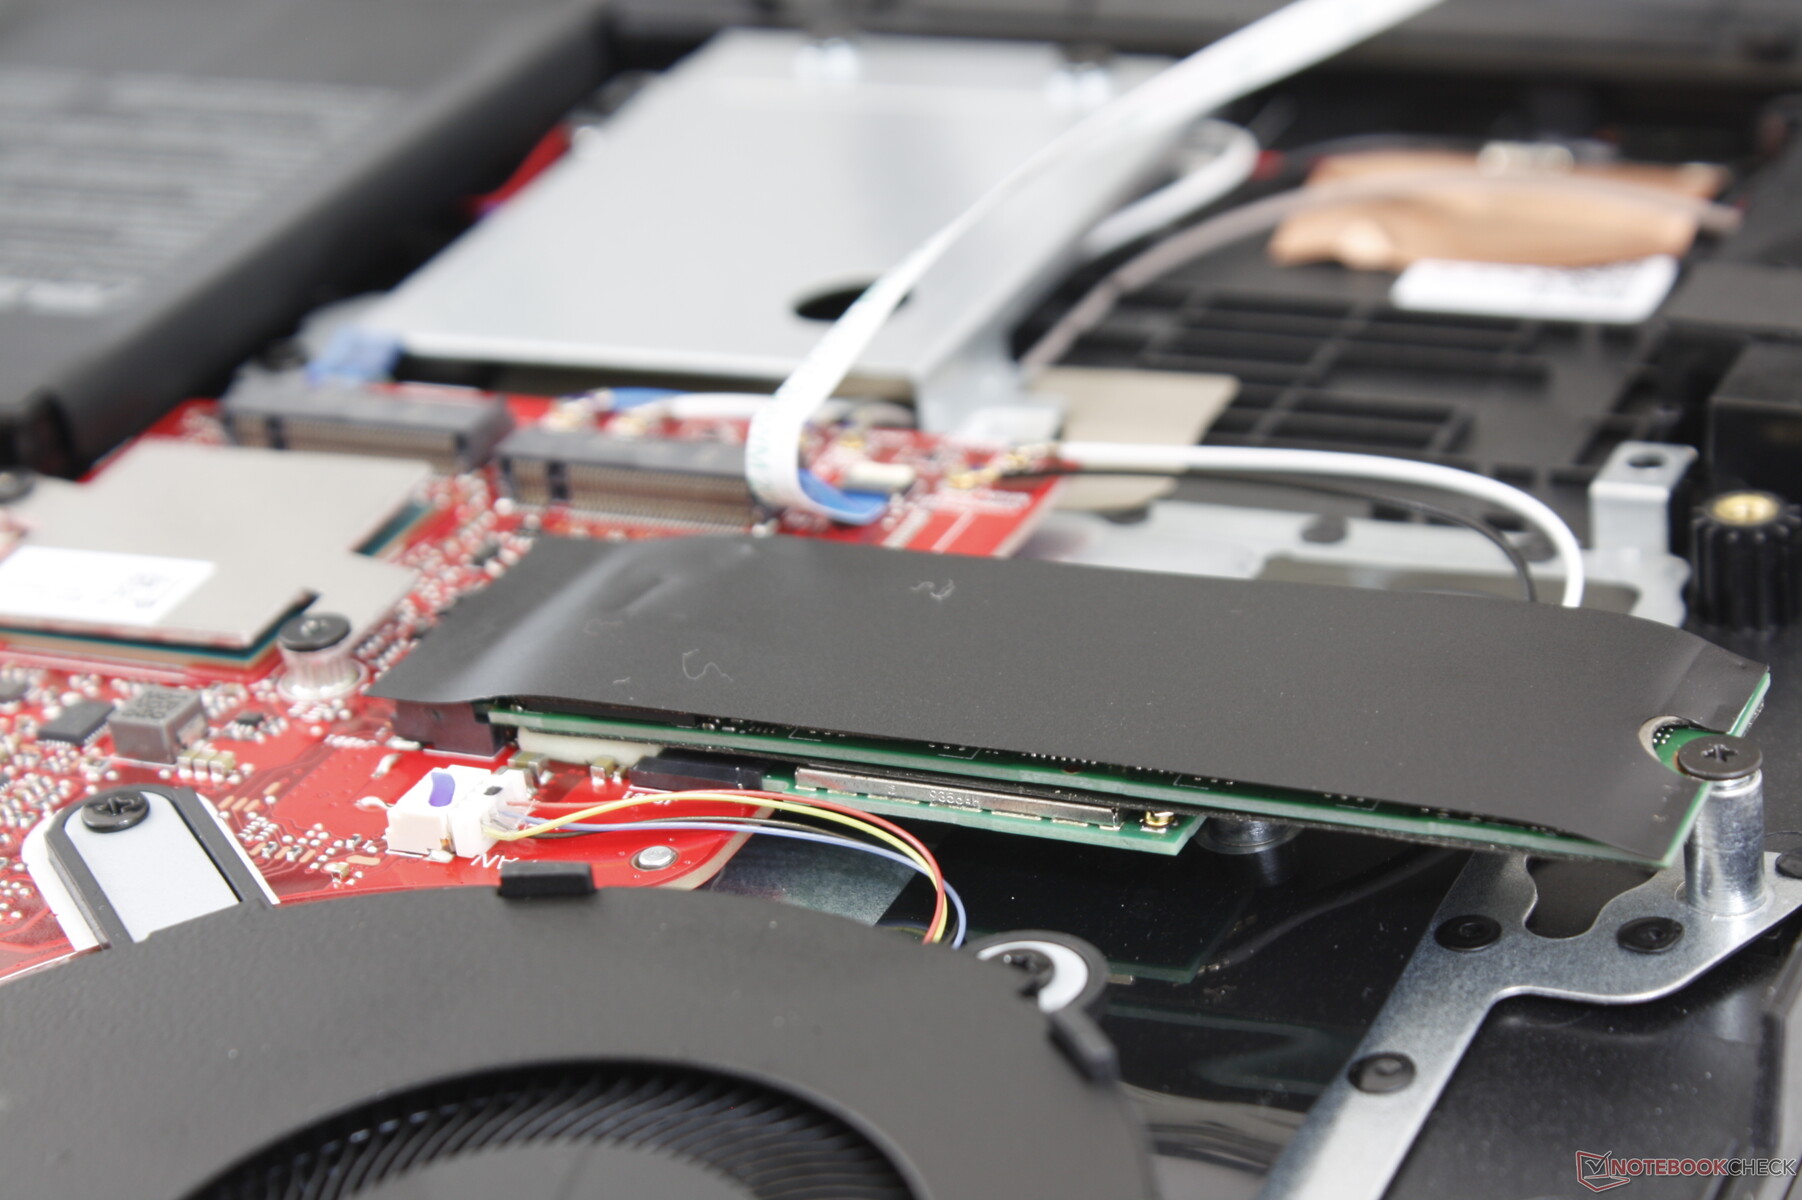
Strix G15, diğer Bütçe oyun dizüstü bilgisayarlarının sunduklarından daha fazla olan üç adede kadar M.2 SSD'yi destekler. Ünitemizdeki Intel 660p, daha pahalı Samsung PM981 serisine kıyasla vasat aktarım hızlarına sahip ekonomik bir NVMe sürücüsüdür. Yine de, hala tüm SATA III alternatiflerinden daha hızlı ligler. Daha fazla karşılaştırma karşılaştırması için HDD ve SSD tablolarımıza bakın.
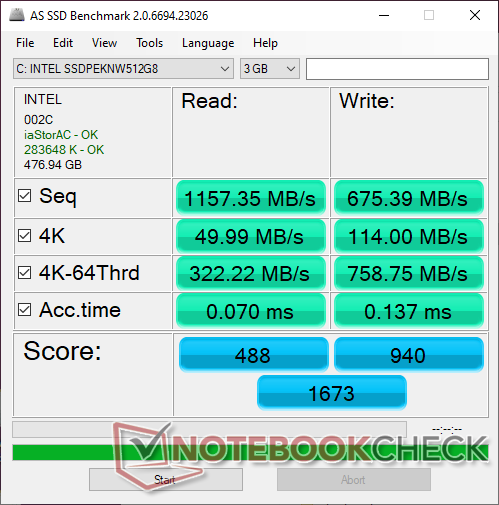
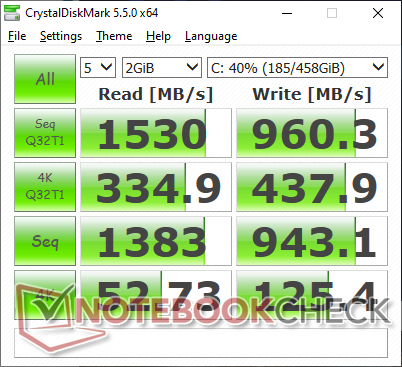
| Asus ROG Strix G15 G512LI Intel SSD 660p SSDPEKNW512G8 | Asus TUF Gaming A15 FA506IV-HN172 Kingston OM8PCP3512F-AB | Asus Strix Scar III G531GW-AZ062T Intel SSD 660p SSDPEKNW512G8 | MSI GP65 10SFK-047US Samsung SSD PM981 MZVLB1T0HALR | Dell G5 15 SE 5505 P89F Samsung PM991 MZ9LQ512HALU | HP Omen 15-dc1020ng WDC PC SN720 SDAQNTW-512G | |
|---|---|---|---|---|---|---|
| AS SSD | 17% | -18% | 150% | 32% | 99% | |
| Seq Read (MB/s) | 1157 | 1682 45% | 1163 1% | 2066 79% | 1386 20% | 2955 155% |
| Seq Write (MB/s) | 675 | 904 34% | 919 36% | 2418 258% | 1234 83% | 2440 261% |
| 4K Read (MB/s) | 49.99 | 60.2 20% | 48.88 -2% | 54.2 8% | 41.32 -17% | 40.56 -19% |
| 4K Write (MB/s) | 114 | 164.8 45% | 90.1 -21% | 129 13% | 128 12% | 118.6 4% |
| 4K-64 Read (MB/s) | 322.2 | 472.5 47% | 323.8 0% | 1865 479% | 854 165% | 1283 298% |
| 4K-64 Write (MB/s) | 759 | 845 11% | 403.8 -47% | 1878 147% | 721 -5% | 1538 103% |
| Access Time Read * (ms) | 0.07 | 0.087 -24% | 0.24 -243% | 0.042 40% | 0.098 -40% | 0.084 -20% |
| Access Time Write * (ms) | 0.137 | 0.02 85% | 0.046 66% | 0.091 34% | 0.095 31% | 0.032 77% |
| Score Read (Points) | 488 | 701 44% | 489 0% | 2126 336% | 1034 112% | 1619 232% |
| Score Write (Points) | 940 | 1101 17% | 586 -38% | 2249 139% | 973 4% | 1901 102% |
| Score Total (Points) | 1673 | 2143 28% | 1332 -20% | 5482 228% | 2536 52% | 4323 158% |
| Copy ISO MB/s (MB/s) | 939 | 675 -28% | 1269 35% | 2927 212% | 1284 37% | 1418 51% |
| Copy Program MB/s (MB/s) | 489.9 | 248.4 -49% | 452.8 -8% | 728 49% | 401.9 -18% | 392.5 -20% |
| Copy Game MB/s (MB/s) | 895 | 535 -40% | 755 -16% | 1614 80% | 1013 13% | 907 1% |
| CrystalDiskMark 5.2 / 6 | 19% | -2% | 69% | 22% | 51% | |
| Write 4K (MB/s) | 125.4 | 219.8 75% | 133.3 6% | 145 16% | 142.1 13% | 112.1 -11% |
| Read 4K (MB/s) | 52.7 | 50.2 -5% | 55.3 5% | 46.84 -11% | 46.43 -12% | 42.01 -20% |
| Write Seq (MB/s) | 943 | 979 4% | 980 4% | 2377 152% | 1108 17% | 1964 108% |
| Read Seq (MB/s) | 1383 | 1990 44% | 1406 2% | 2185 58% | 1622 17% | 2065 49% |
| Write 4K Q32T1 (MB/s) | 437.9 | 516 18% | 286.3 -35% | 463.5 6% | 467 7% | 318.2 -27% |
| Read 4K Q32T1 (MB/s) | 334.9 | 298.3 -11% | 331.5 -1% | 527 57% | 525 57% | 406.7 21% |
| Write Seq Q32T1 (MB/s) | 960 | 982 2% | 976 2% | 2395 149% | 1203 25% | 2534 164% |
| Read Seq Q32T1 (MB/s) | 1530 | 1907 25% | 1520 -1% | 3470 127% | 2288 50% | 3438 125% |
| Write 4K Q8T8 (MB/s) | 981 | 748 | ||||
| Read 4K Q8T8 (MB/s) | 300.9 | 344.6 | ||||
| Toplam Ortalama (Program / Ayarlar) | 18% /
18% | -10% /
-13% | 110% /
121% | 27% /
28% | 75% /
81% |
* ... daha küçük daha iyidir

Disk Throttling: DiskSpd Read Loop, Queue Depth 8
GPU Performansı
GeForce GTX 1650 Ti en son nesil mobil GTX 1060 ile karşılaştırılabilir. GTX 1660 Ti, RTX 2060 veya RTX 2070 Süper SKU'lara yükseltme, kullanıcıları yaklaşık olarak yüzde 45, yüzde 60 ve yüzde 110 daha hızlı grafik performansı ile netleştirecek. Daha fazla teknik bilgi ve kıyaslama karşılaştırması için GTX 1650 Ti'deki özel sayfamıza bakın. GTX 1650 Ti genellikle çoğu oyunu 144 FPS'de çalıştırmak için yeterince hızlı değildir, ancak 144 Hz monitörün avantajlarından yararlanmak için 144 FPS'de oyun çalıştırmanıza gerek yoktur.
| 3DMark | |
| 1920x1080 Fire Strike Graphics | |
| MSI GE66 Raider 10SFS | |
| MSI RTX 2060 Gaming Z 6G | |
| Dell G5 15 SE 5505 P89F | |
| Razer Blade 15 RZ09-0328 | |
| Eluktronics RP-15 | |
| Maingear Vector 15 | |
| MSI GS63VR 7RG-005 | |
| Asus Zephyrus S GX531GM | |
| Asus ROG Strix G15 G512LI | |
| MSI Bravo 15 A4DCR | |
| Ortalama NVIDIA GeForce GTX 1650 Ti Mobile (9691 - 10733, n=9) | |
| HP Pavilion Gaming 15-cx0003ng | |
| 2560x1440 Time Spy Graphics | |
| MSI GE66 Raider 10SFS | |
| MSI RTX 2060 Gaming Z 6G | |
| Razer Blade 15 RZ09-0328 | |
| Dell G5 15 SE 5505 P89F | |
| Eluktronics RP-15 | |
| Maingear Vector 15 | |
| MSI GS63VR 7RG-005 | |
| Asus ROG Strix G15 G512LI | |
| Ortalama NVIDIA GeForce GTX 1650 Ti Mobile (3554 - 3904, n=9) | |
| Asus Zephyrus S GX531GM | |
| MSI Bravo 15 A4DCR | |
| HP Pavilion Gaming 15-cx0003ng | |
| 2560x1440 Time Spy Score | |
| MSI GE66 Raider 10SFS | |
| MSI RTX 2060 Gaming Z 6G | |
| Dell G5 15 SE 5505 P89F | |
| Eluktronics RP-15 | |
| Razer Blade 15 RZ09-0328 | |
| Maingear Vector 15 | |
| MSI GS63VR 7RG-005 | |
| Asus ROG Strix G15 G512LI | |
| Ortalama NVIDIA GeForce GTX 1650 Ti Mobile (3738 - 4201, n=9) | |
| MSI Bravo 15 A4DCR | |
| Asus Zephyrus S GX531GM | |
| HP Pavilion Gaming 15-cx0003ng | |
| 3DMark 11 | |
| 1280x720 Performance GPU | |
| MSI GE66 Raider 10SFS | |
| MSI RTX 2060 Gaming Z 6G | |
| Dell G5 15 SE 5505 P89F | |
| Razer Blade 15 RZ09-0328 | |
| Eluktronics RP-15 | |
| Maingear Vector 15 | |
| MSI GS63VR 7RG-005 | |
| MSI Bravo 15 A4DCR | |
| Asus ROG Strix G15 G512LI | |
| Ortalama NVIDIA GeForce GTX 1650 Ti Mobile (12865 - 14415, n=8) | |
| Asus Zephyrus S GX531GM | |
| HP Pavilion Gaming 15-cx0003ng | |
| 1280x720 Performance Combined | |
| MSI GE66 Raider 10SFS | |
| Eluktronics RP-15 | |
| MSI RTX 2060 Gaming Z 6G | |
| Dell G5 15 SE 5505 P89F | |
| Asus ROG Strix G15 G512LI | |
| Maingear Vector 15 | |
| Razer Blade 15 RZ09-0328 | |
| MSI Bravo 15 A4DCR | |
| Ortalama NVIDIA GeForce GTX 1650 Ti Mobile (9749 - 13027, n=8) | |
| HP Pavilion Gaming 15-cx0003ng | |
| MSI GS63VR 7RG-005 | |
| Asus Zephyrus S GX531GM | |
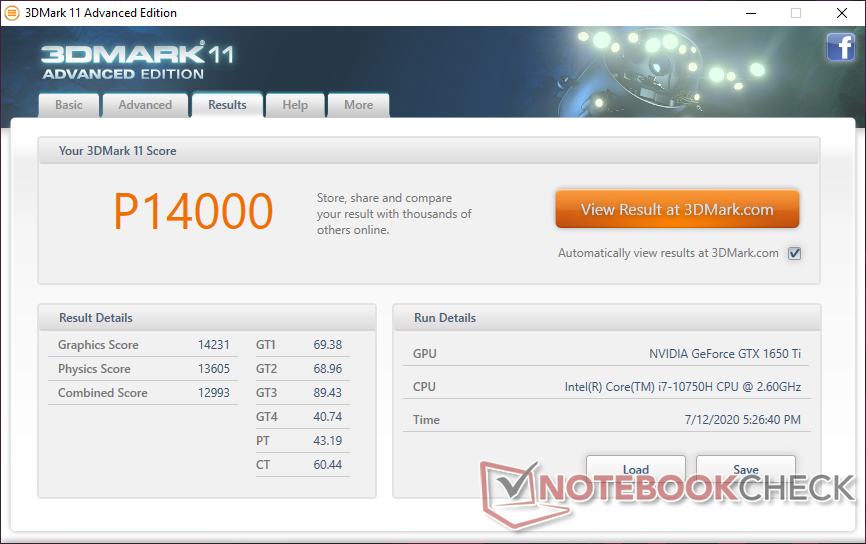
| 3DMark 11 Performance | 14000 puan | |
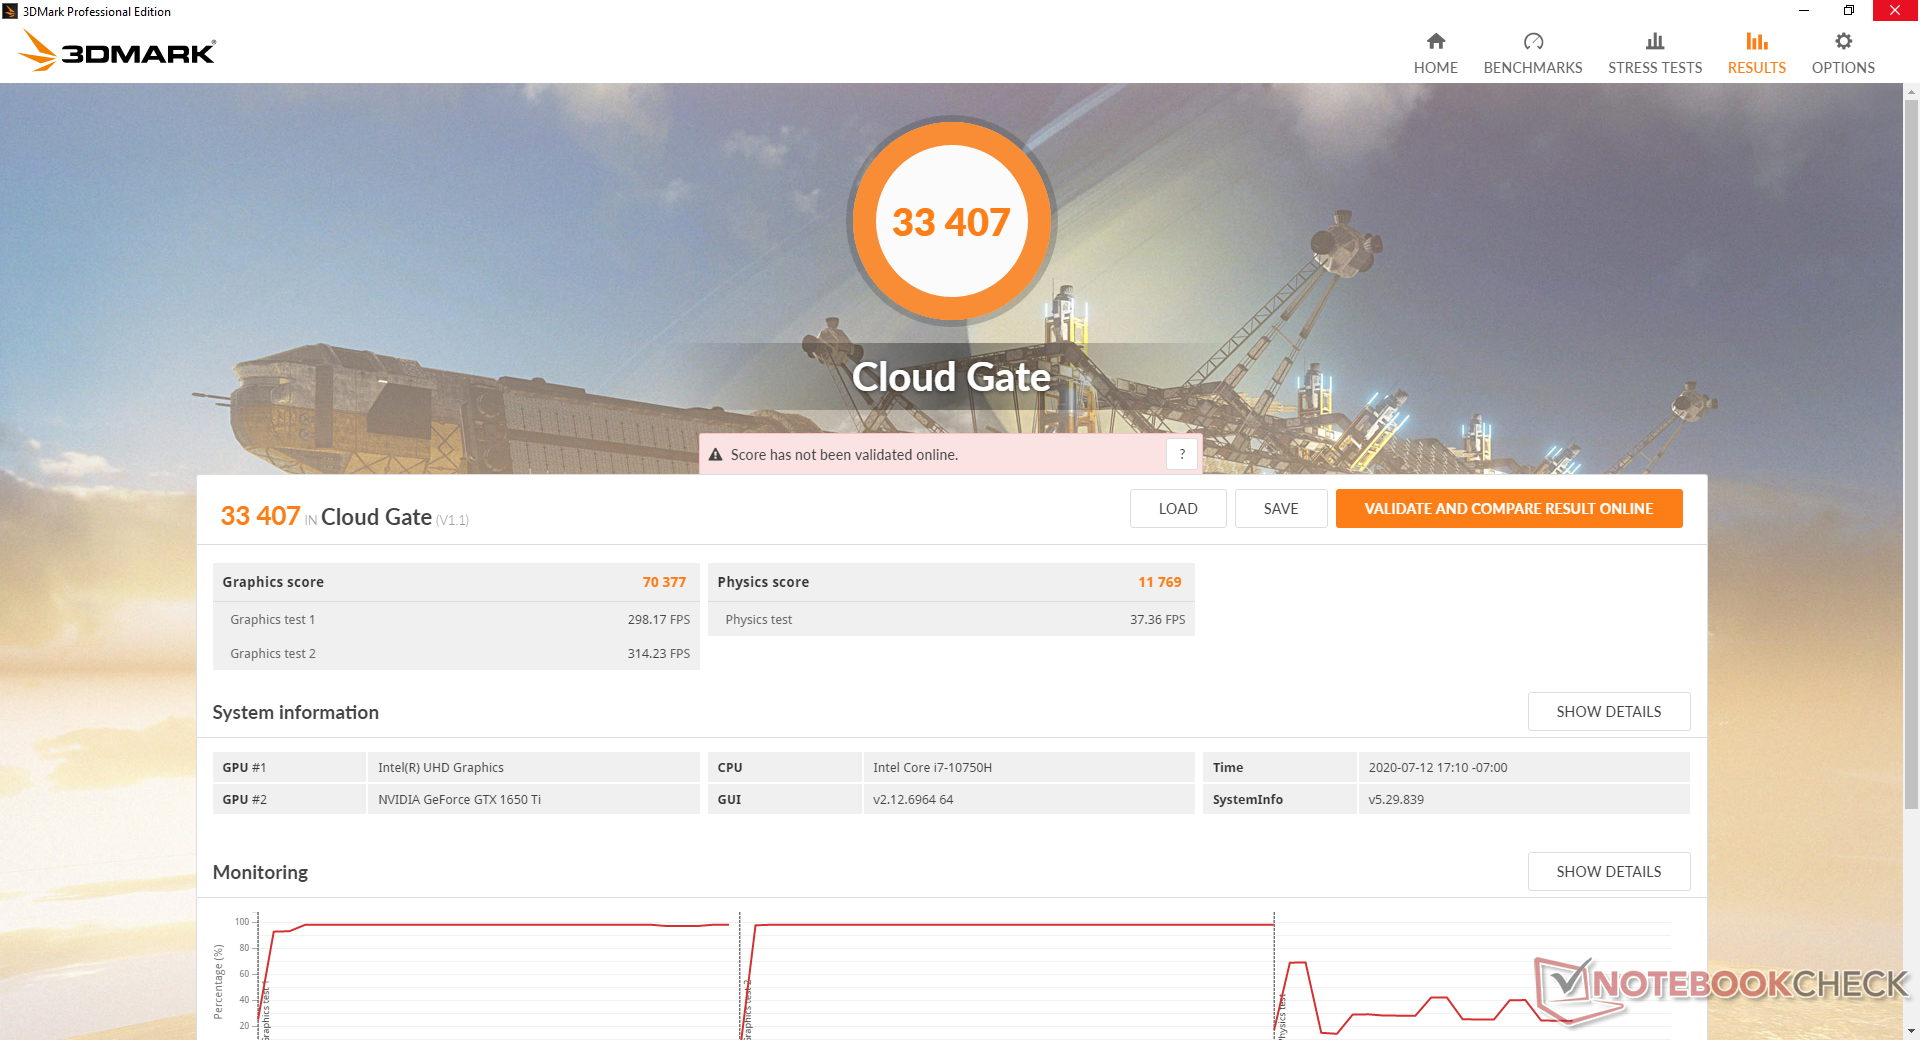
| 3DMark Cloud Gate Standard Score | 33407 puan | |
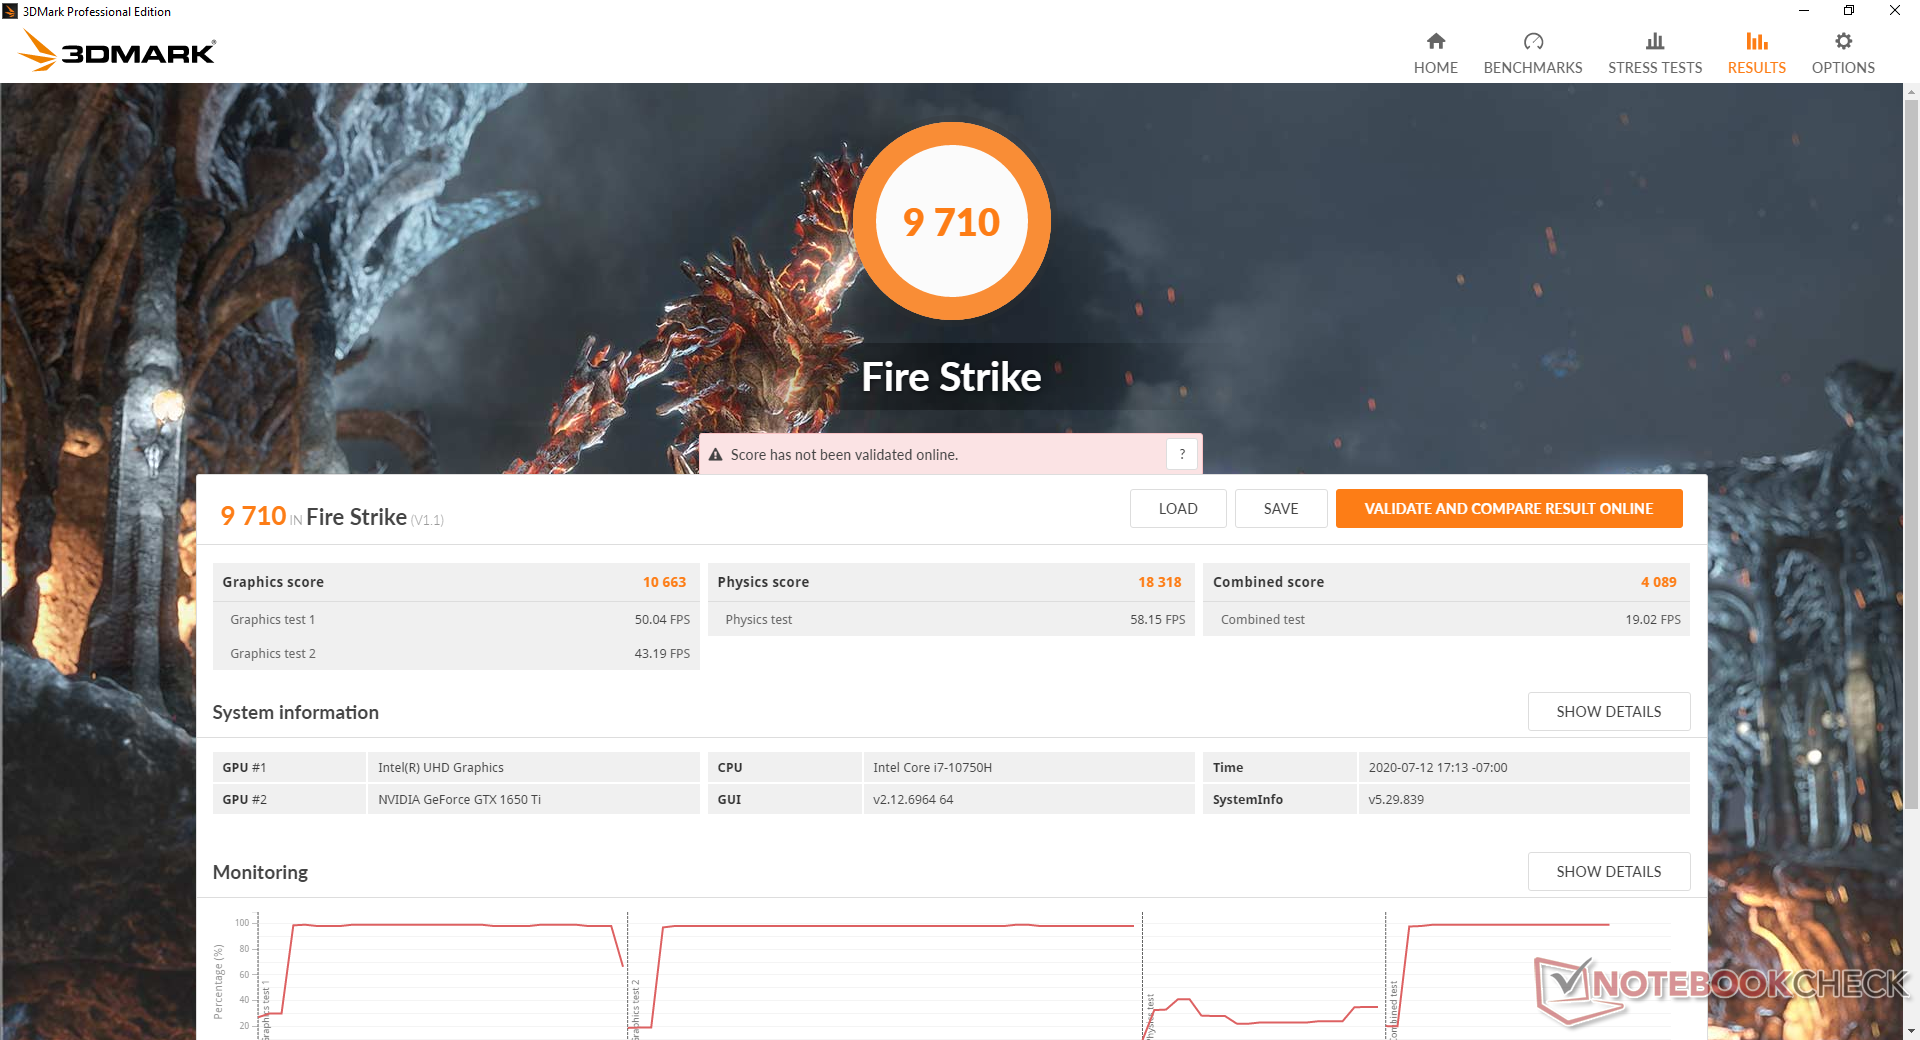
| 3DMark Fire Strike Score | 9710 puan | |
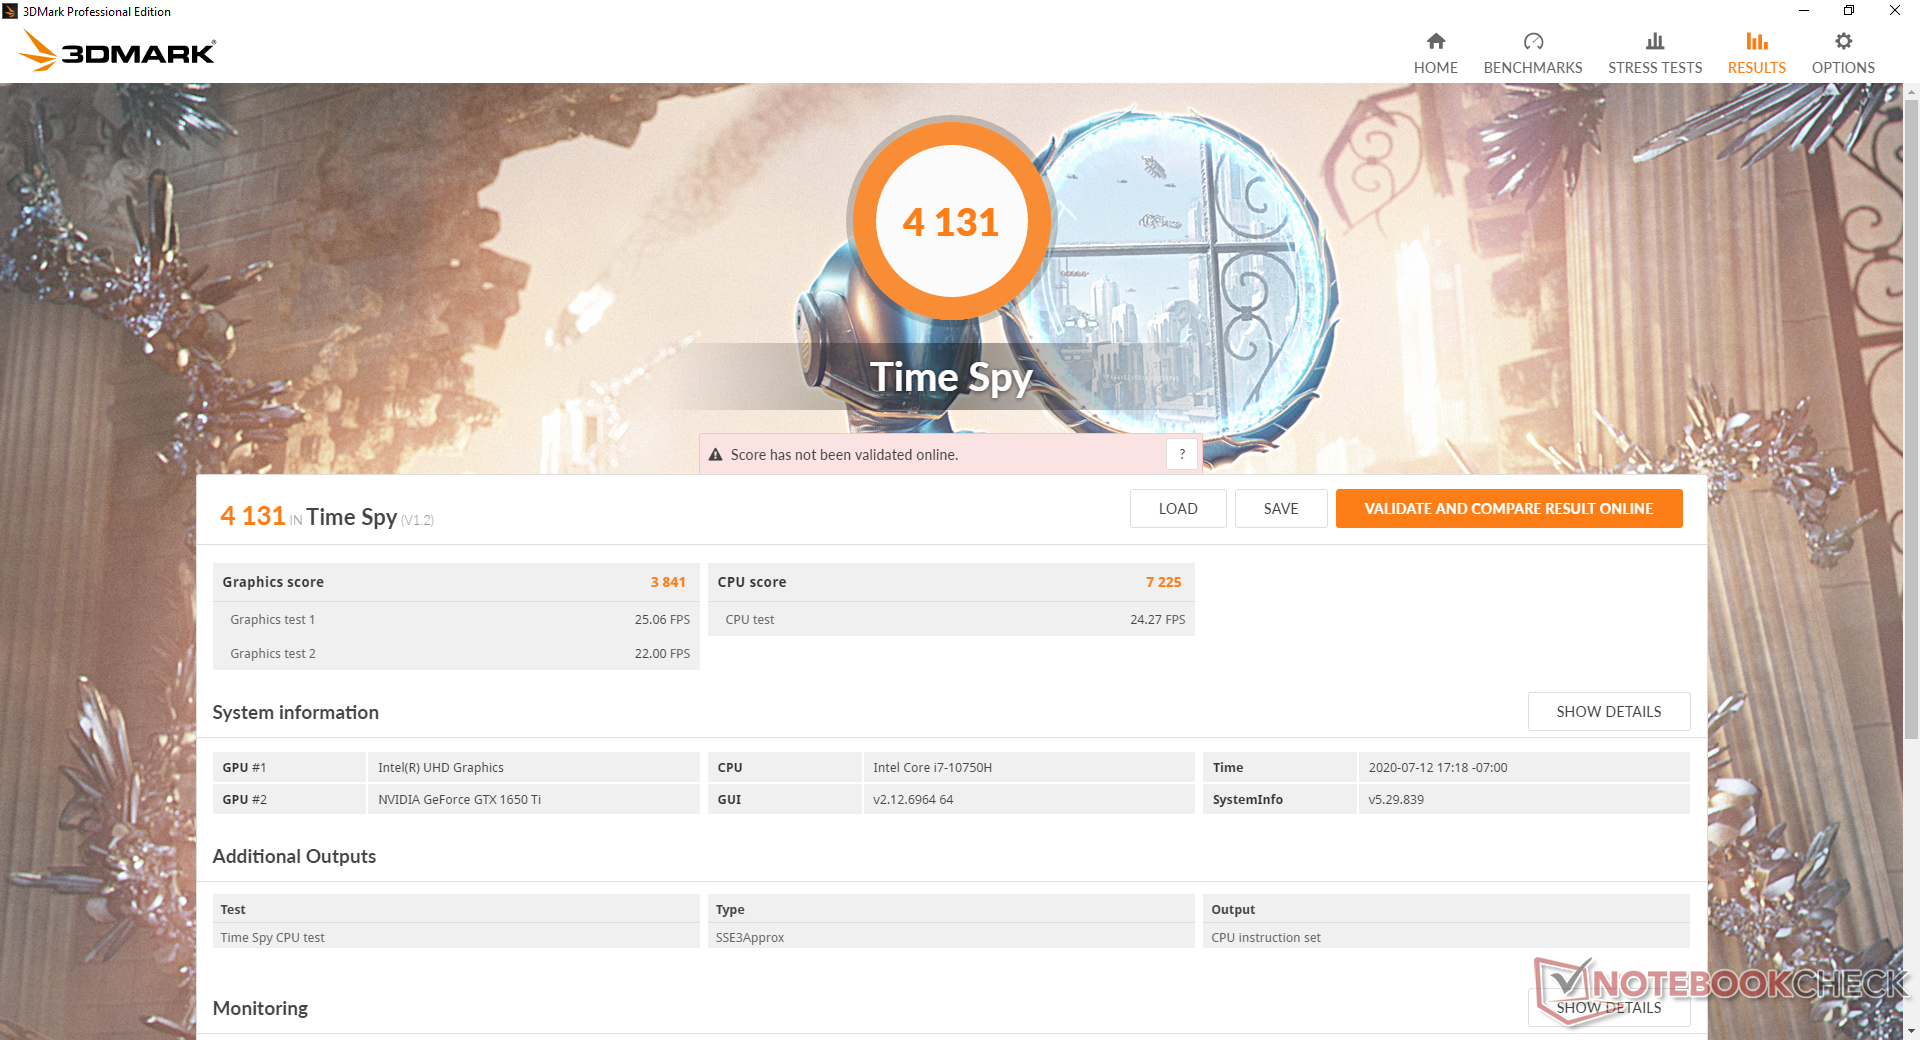
| 3DMark Time Spy Score | 4131 puan | |
Yardım | ||
| The Witcher 3 - 1920x1080 Ultra Graphics & Postprocessing (HBAO+) | |
| Gigabyte Aero 15 OLED XB-8DE51B0SP | |
| MSI GE65 Raider 9SF-049US | |
| MSI RTX 2060 Gaming Z 6G | |
| Asus Strix Scar III G531GW-AZ062T | |
| Lenovo Legion 5 15IMH05H | |
| Dell G5 15 SE 5505 P89F | |
| Eluktronics RP-15 | |
| Razer Blade 15 RZ09-0328 | |
| Maingear Vector 15 | |
| Asus TUF Gaming A15 FA506IV-HN172 | |
| Asus Zephyrus G14 GA401IV | |
| MSI GS63VR 7RG-005 | |
| Asus ROG Zephyrus G15 GA502DU | |
| Asus ROG Strix G15 G512LI | |
| Asus Zephyrus S GX531GM | |
| Ortalama NVIDIA GeForce GTX 1650 Ti Mobile (34.7 - 42.3, n=8) | |
| Acer Nitro 5 AN515-44-R5FT | |
| MSI Bravo 15 A4DCR | |
| HP Omen 15-dc1020ng | |
| MSI GF63 Thin 9SC | |
| HP Pavilion Gaming 15-cx0003ng | |
| düşük | orta | yüksek | ultra | |
|---|---|---|---|---|
| The Witcher 3 (2015) | 223.5 | 135.5 | 76.1 | 40.1 |
| Dota 2 Reborn (2015) | 148 | 132 | 122 | 115 |
| X-Plane 11.11 (2018) | 98.9 | 82.7 | 71.8 |
Emissions
System Noise
Much like what we discovered on some other Asus gaming laptops, fan noise is never actually silent even when set to "silent" mode. We're able to record a fan noise of 34 dB(A) against a background of 27.7 dB(A) despite having no applications running. Most other gaming laptops are able able to remain quieter for longer than our Asus as shown by the comparison table below.
Fan noise tops out at 48 to 49 dB(A) when running high loads like gaming on Turbo mode. If on Performance mode, fan noise becomes just slightly quieter at 46.2 dB(A). These results are about normal for a gaming laptop of this size.
| Asus ROG Strix G15 G512LI GeForce GTX 1650 Ti Mobile, i7-10750H, Intel SSD 660p SSDPEKNW512G8 | Asus TUF Gaming A15 FA506IV-HN172 GeForce RTX 2060 Mobile, R7 4800H, Kingston OM8PCP3512F-AB | Asus Strix Scar III G531GW-AZ062T GeForce RTX 2070 Mobile, i7-9750H, Intel SSD 660p SSDPEKNW512G8 | MSI GP65 10SFK-047US GeForce RTX 2070 Mobile, i7-10750H, Samsung SSD PM981 MZVLB1T0HALR | Dell G5 15 SE 5505 P89F Radeon RX 5600M, R7 4800H, Samsung PM991 MZ9LQ512HALU | HP Omen 15-dc1020ng GeForce GTX 1650 Mobile, i5-9300H, WDC PC SN720 SDAQNTW-512G | |
|---|---|---|---|---|---|---|
| Noise | 6% | 4% | -2% | 13% | 16% | |
| kapalı / ortam * (dB) | 27.7 | 30.2 -9% | 30 -8% | 29.3 -6% | 28 -1% | 28.8 -4% |
| Idle Minimum * (dB) | 34.2 | 30.2 12% | 30.6 11% | 31.9 7% | 28 18% | 28.8 16% |
| Idle Average * (dB) | 36 | 30.2 16% | 30.6 15% | 31.9 11% | 28 22% | 29.5 18% |
| Idle Maximum * (dB) | 36.6 | 30.2 17% | 37.7 -3% | 33.5 8% | 28 23% | 31.1 15% |
| Load Average * (dB) | 44.3 | 40 10% | 36.5 18% | 47 -6% | 28 37% | 35.2 21% |
| Witcher 3 ultra * (dB) | 47.9 | 49 -2% | 52.1 -9% | 53.8 -12% | 50.6 -6% | 35.2 27% |
| Load Maximum * (dB) | 49.3 | 49 1% | 48.1 2% | 56.7 -15% | 50.6 -3% | 41 17% |
* ... daha küçük daha iyidir
Ses yüksekliği
| Boşta |
| 34.2 / 36 / 36.6 dB |
| Çalışırken |
| 44.3 / 49.3 dB |
 | ||
30 dB sessiz 40 dB(A) duyulabilirlik 50 dB(A) gürültülü |
||
min: | ||
Temperature
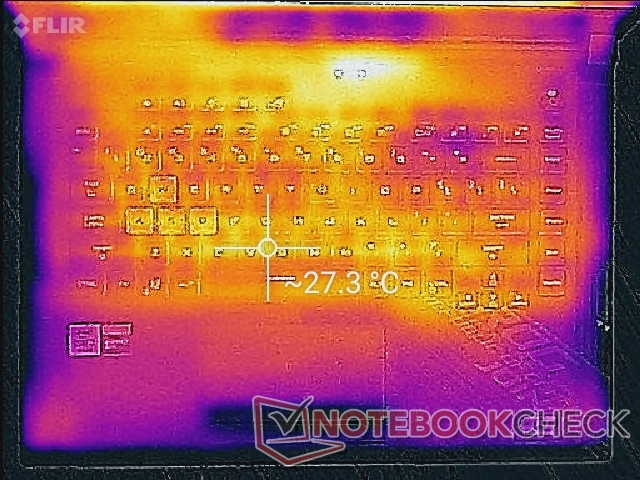
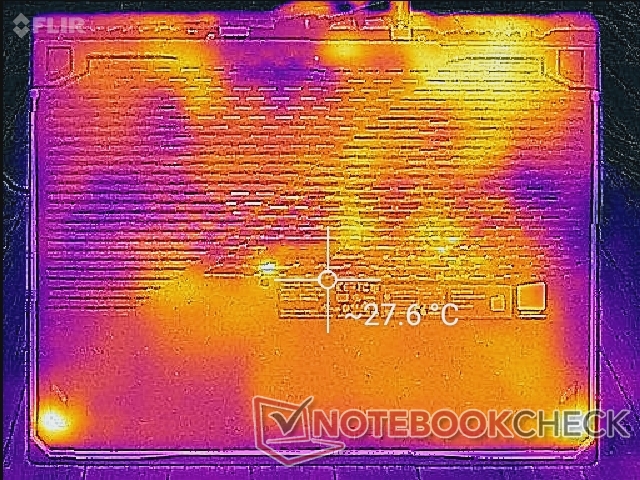
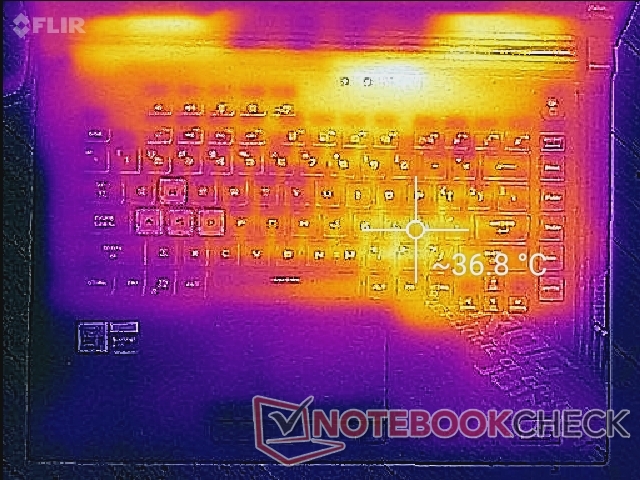
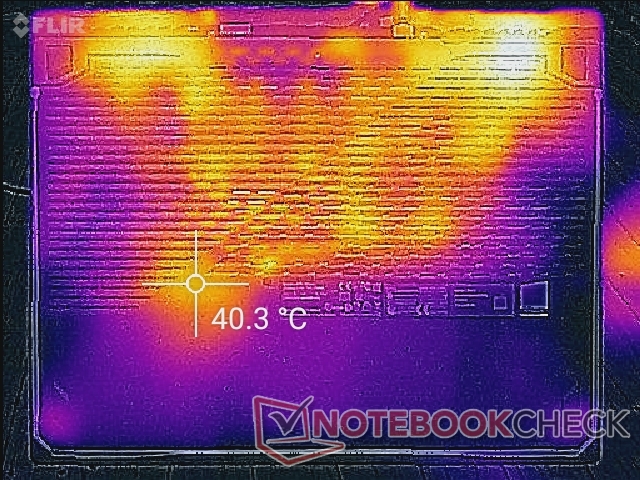
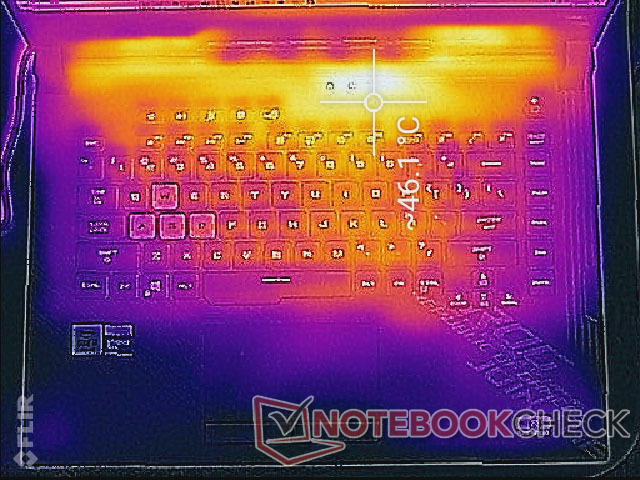
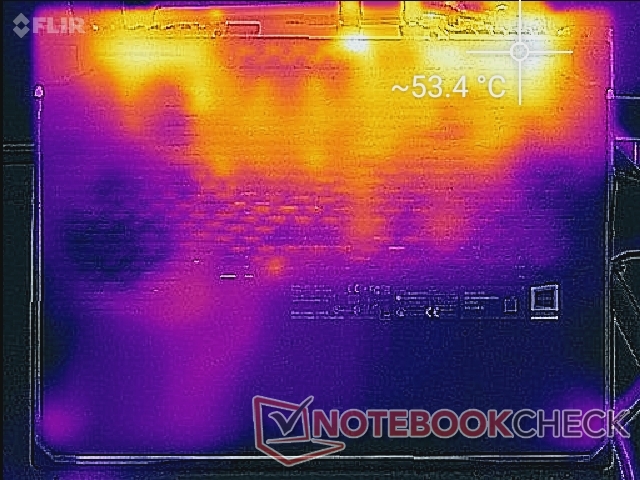
Surface temperatures never become uncomfortably warm no matter the onscreen load. Though hot spots can be as warm as 46 C to 53 C when gaming, these areas are towards the rear away from the keyboard keys and palm rests.
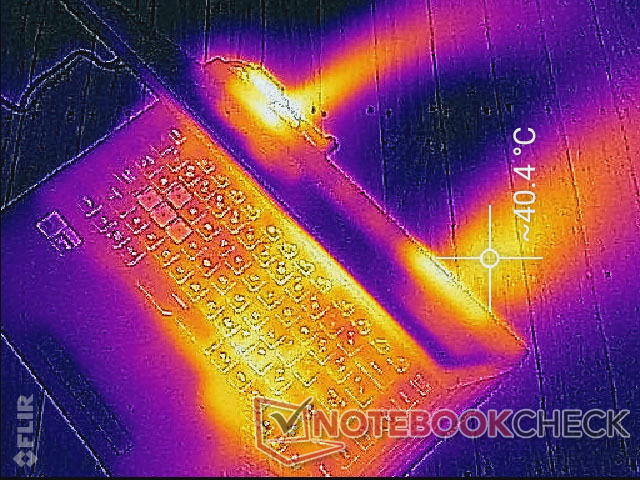
(-) Üst taraftaki maksimum sıcaklık, 40.4 °C / 105 F ortalamasına kıyasla 46.2 °C / 115 F'dir. , Gaming sınıfı için 21.2 ile 68.8 °C arasında değişir.
(-) Alt kısım, 43.2 °C / 110 F ortalamasına kıyasla maksimum 53.6 °C / 128 F'ye kadar ısınır
(+) Boşta kullanımda, üst tarafın ortalama sıcaklığı 26 °C / 79 F olup, cihazın 33.9 °C / 93 F.
(+) The Witcher 3 oynarken, üst tarafın ortalama sıcaklığı 31.8 °C / 89 F olup, cihazın 33.9 °C / 93 F.
(+) Avuç içi dayanakları ve dokunmatik yüzey, maksimum 25.8 °C / 78.4 F ile cilt sıcaklığından daha soğuktur ve bu nedenle dokunulduğunda soğuktur.
(+) Benzer cihazların avuç içi dayanağı alanının ortalama sıcaklığı 28.8 °C / 83.8 F (+3 °C / 5.4 F) idi.
Stress Test
When running Prime95, the CPU can be observed boosting up to 4.2 GHz for about 90 seconds until hitting a core temperature of 91 C. After reaching this temperature ceiling, clock rates would drop to 3.8 GHz in order to maintain a cooler core temperature of 83 C.
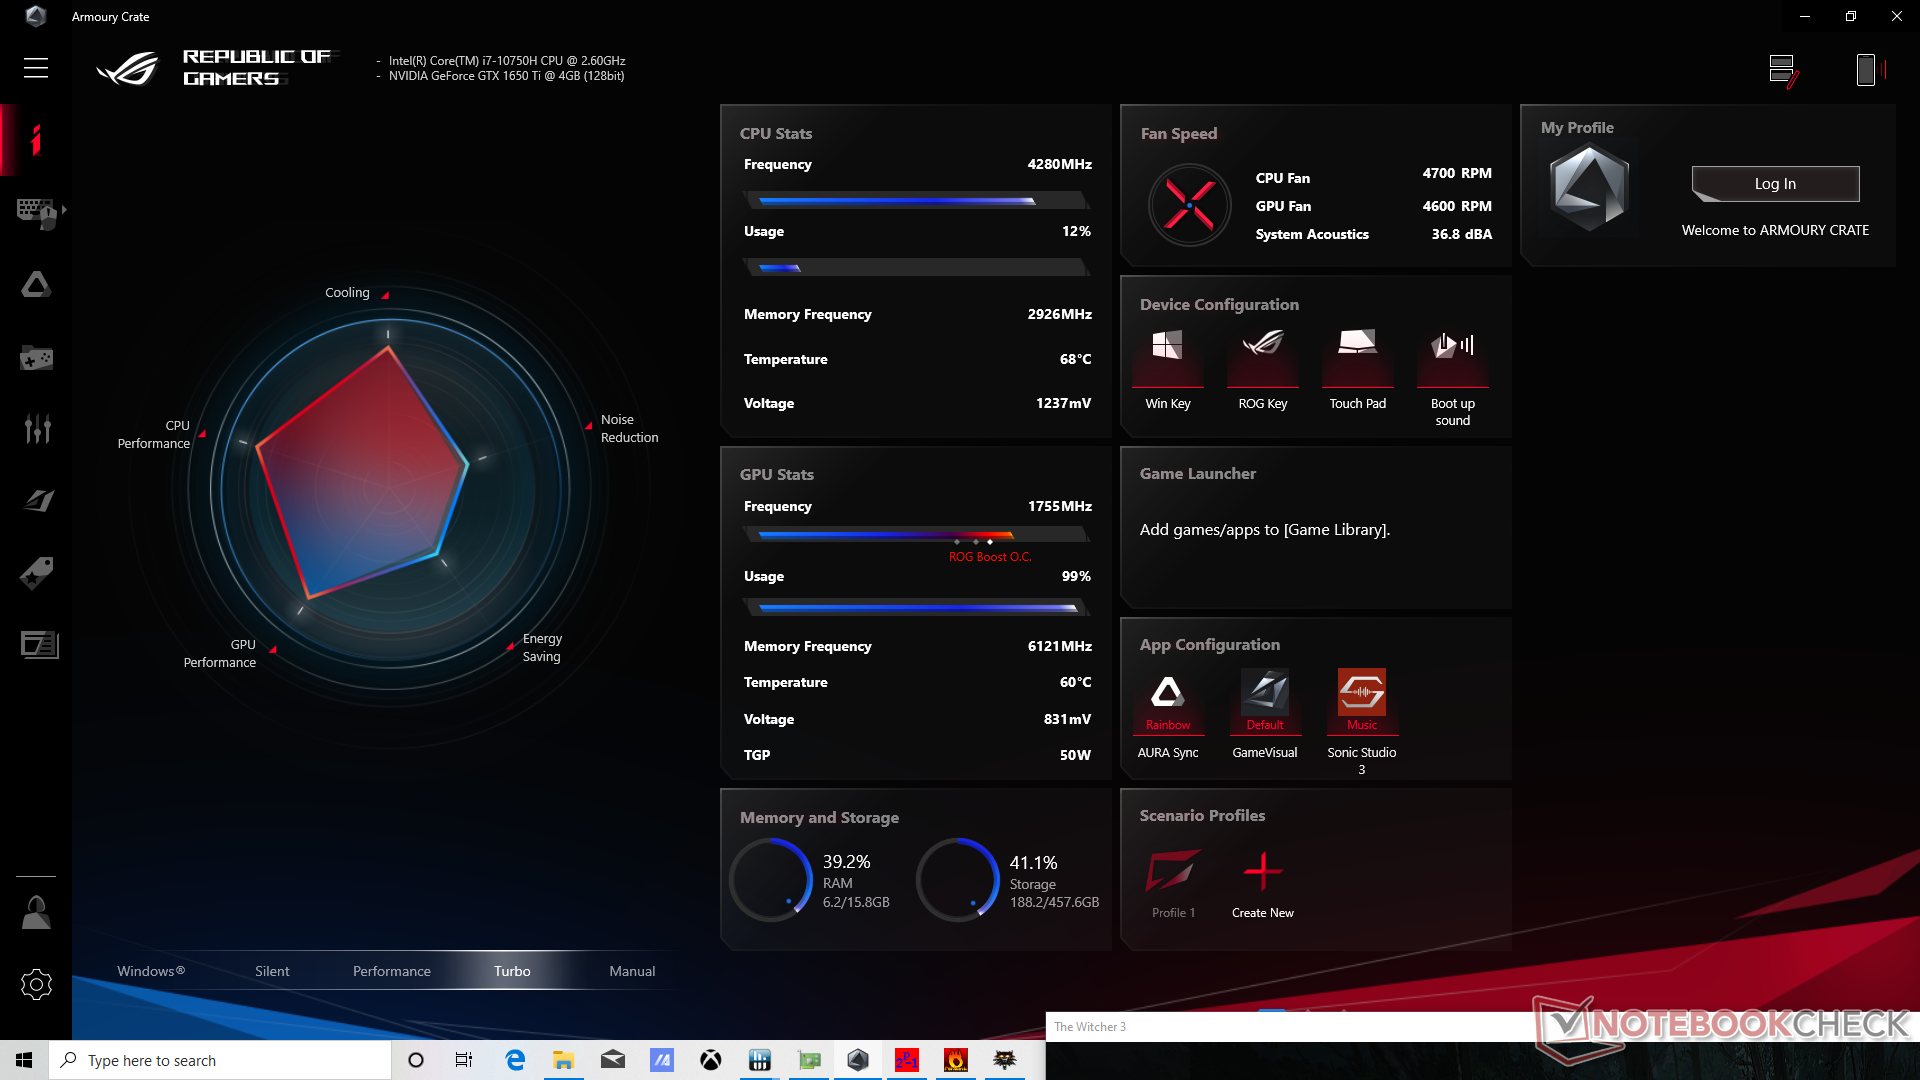
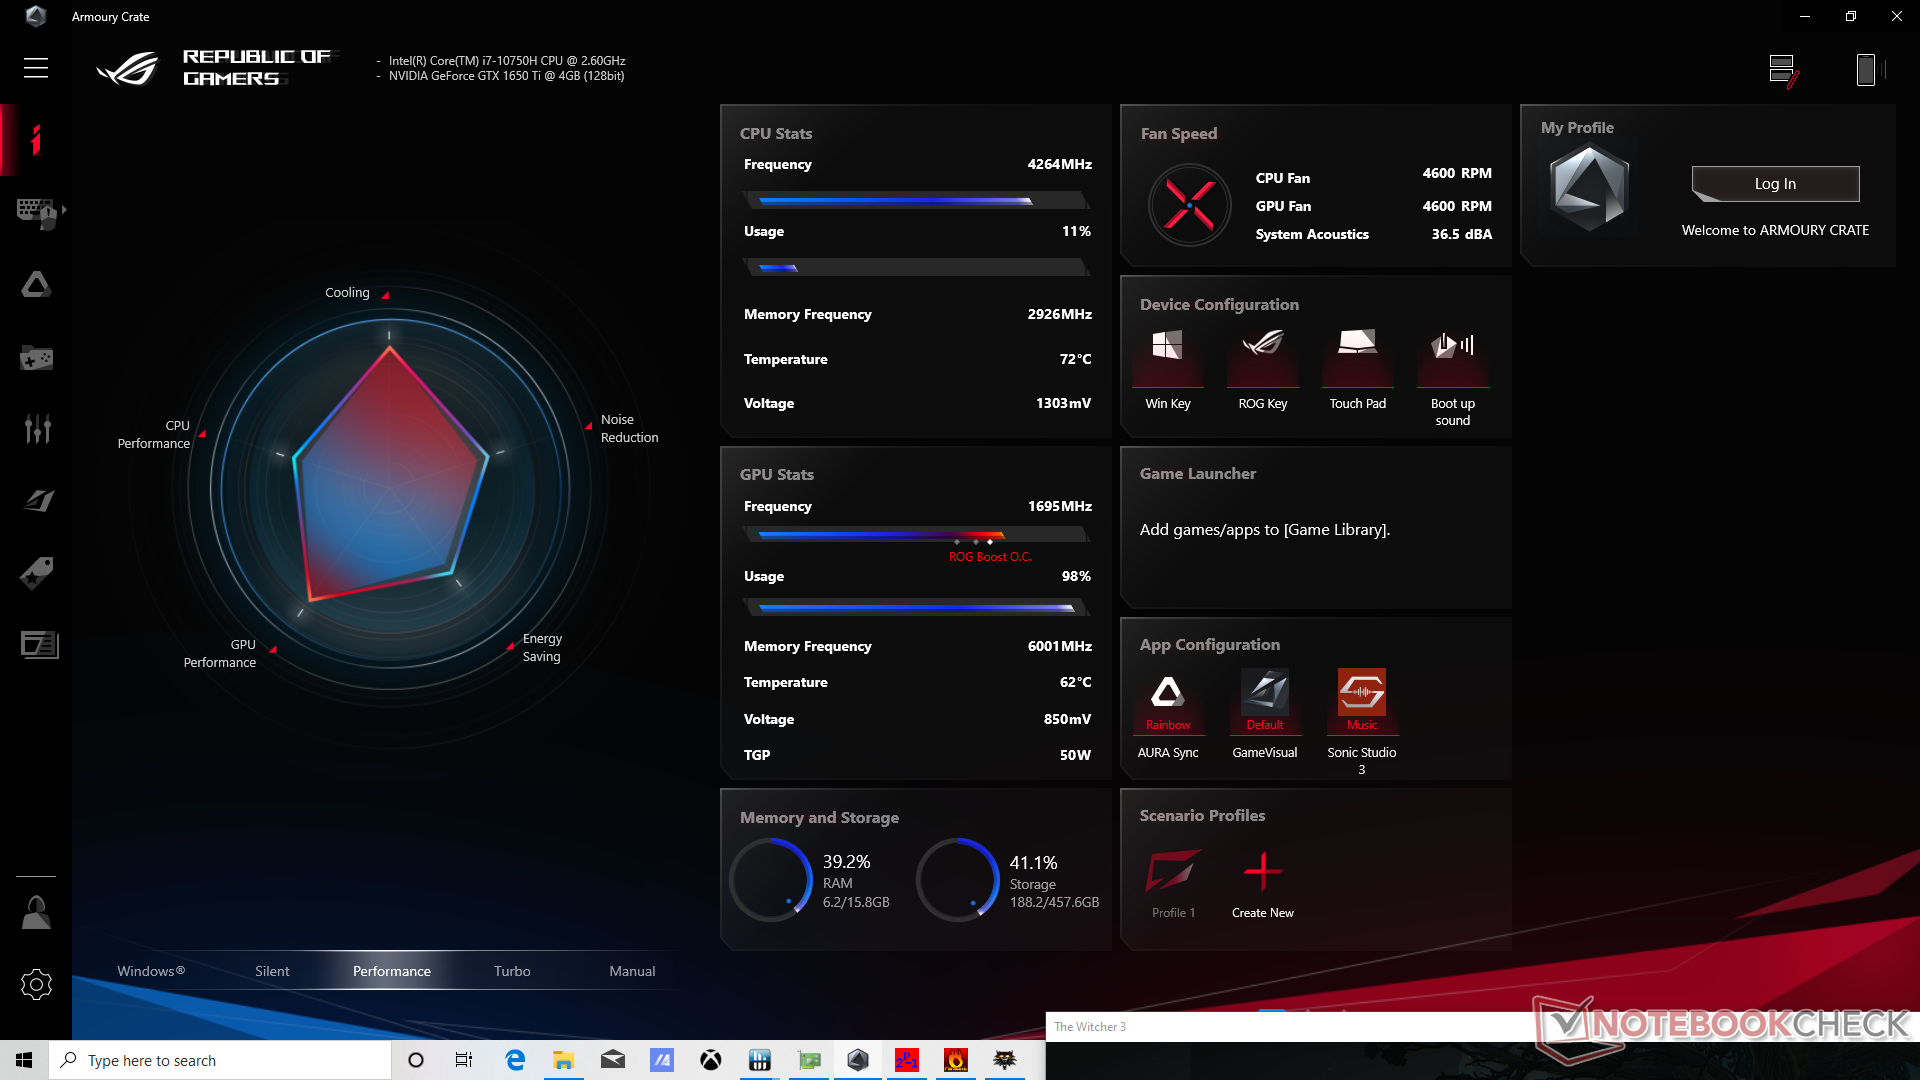
Running Witcher 3 on Asus' Turbo mode results in the CPU and GPU stabilizing at 61 C and 60 C, respectively, with a GPU clock rate of 1755 MHz. GPU clock rate drops just slightly to 1695 MHz when running in performance mode without much of a change in fan noise so users may as well game on Turbo mode whenever possible. These running temperatures are relatively low since this particular chassis was built to handle faster GPU options up to the RTX 2070 Super.
Running on battery power will limit performance. A Fire Strike run on batteries would return Physics and Graphics scores of 12489 and 7647 points, respectively, compared to 18318 and 10663 points when on mains.
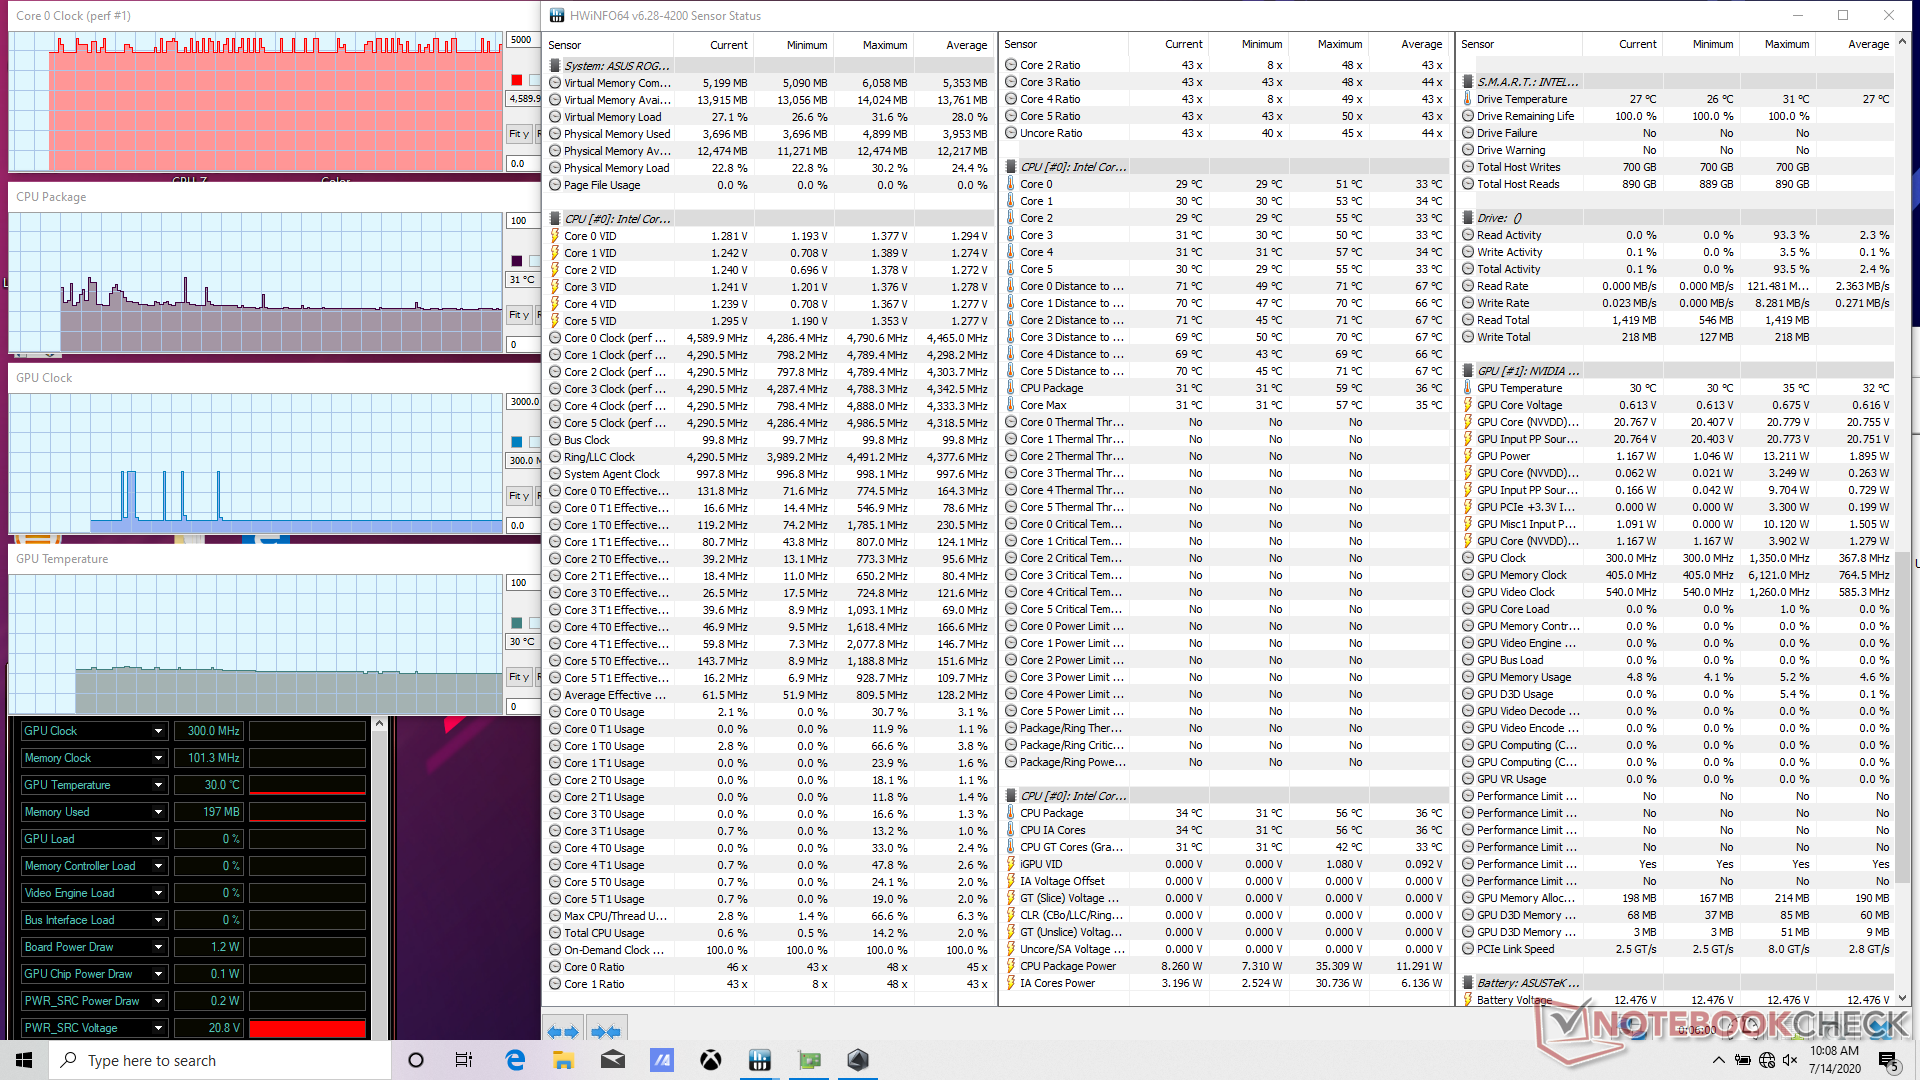
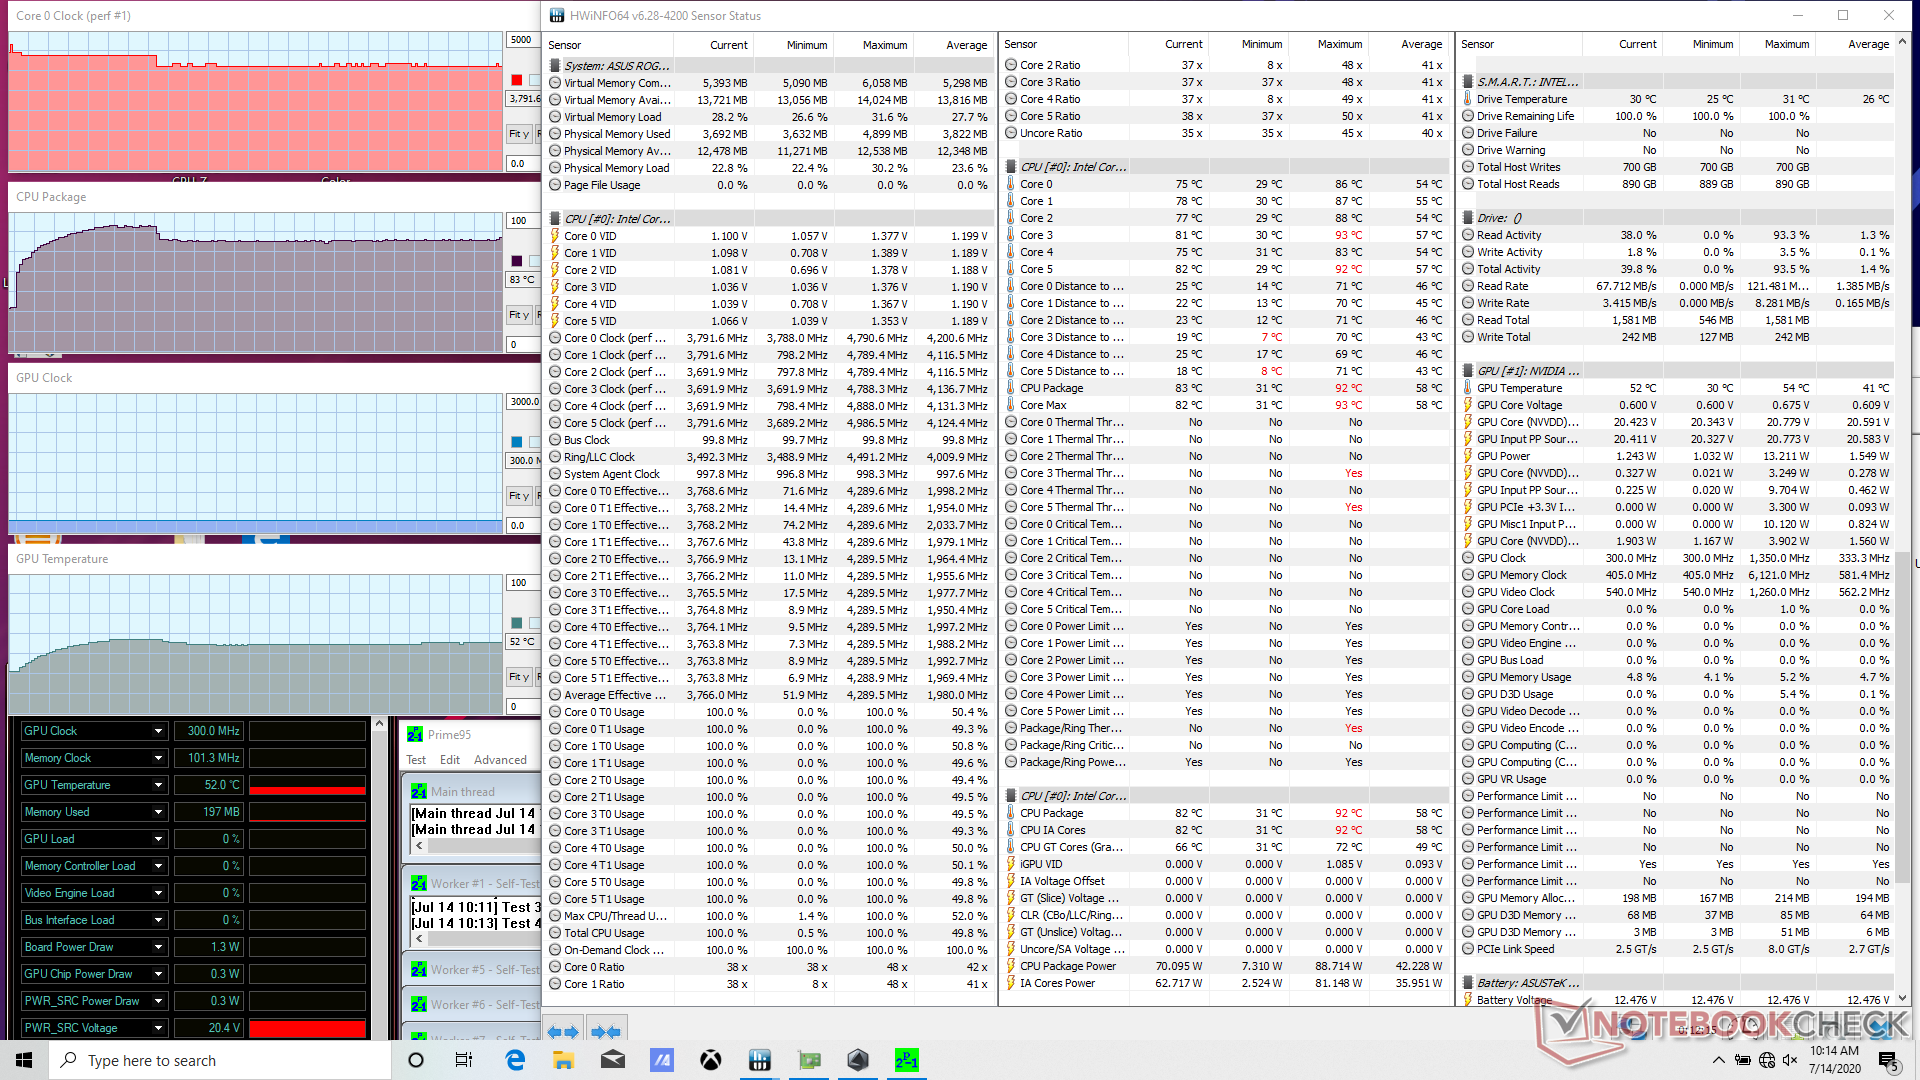
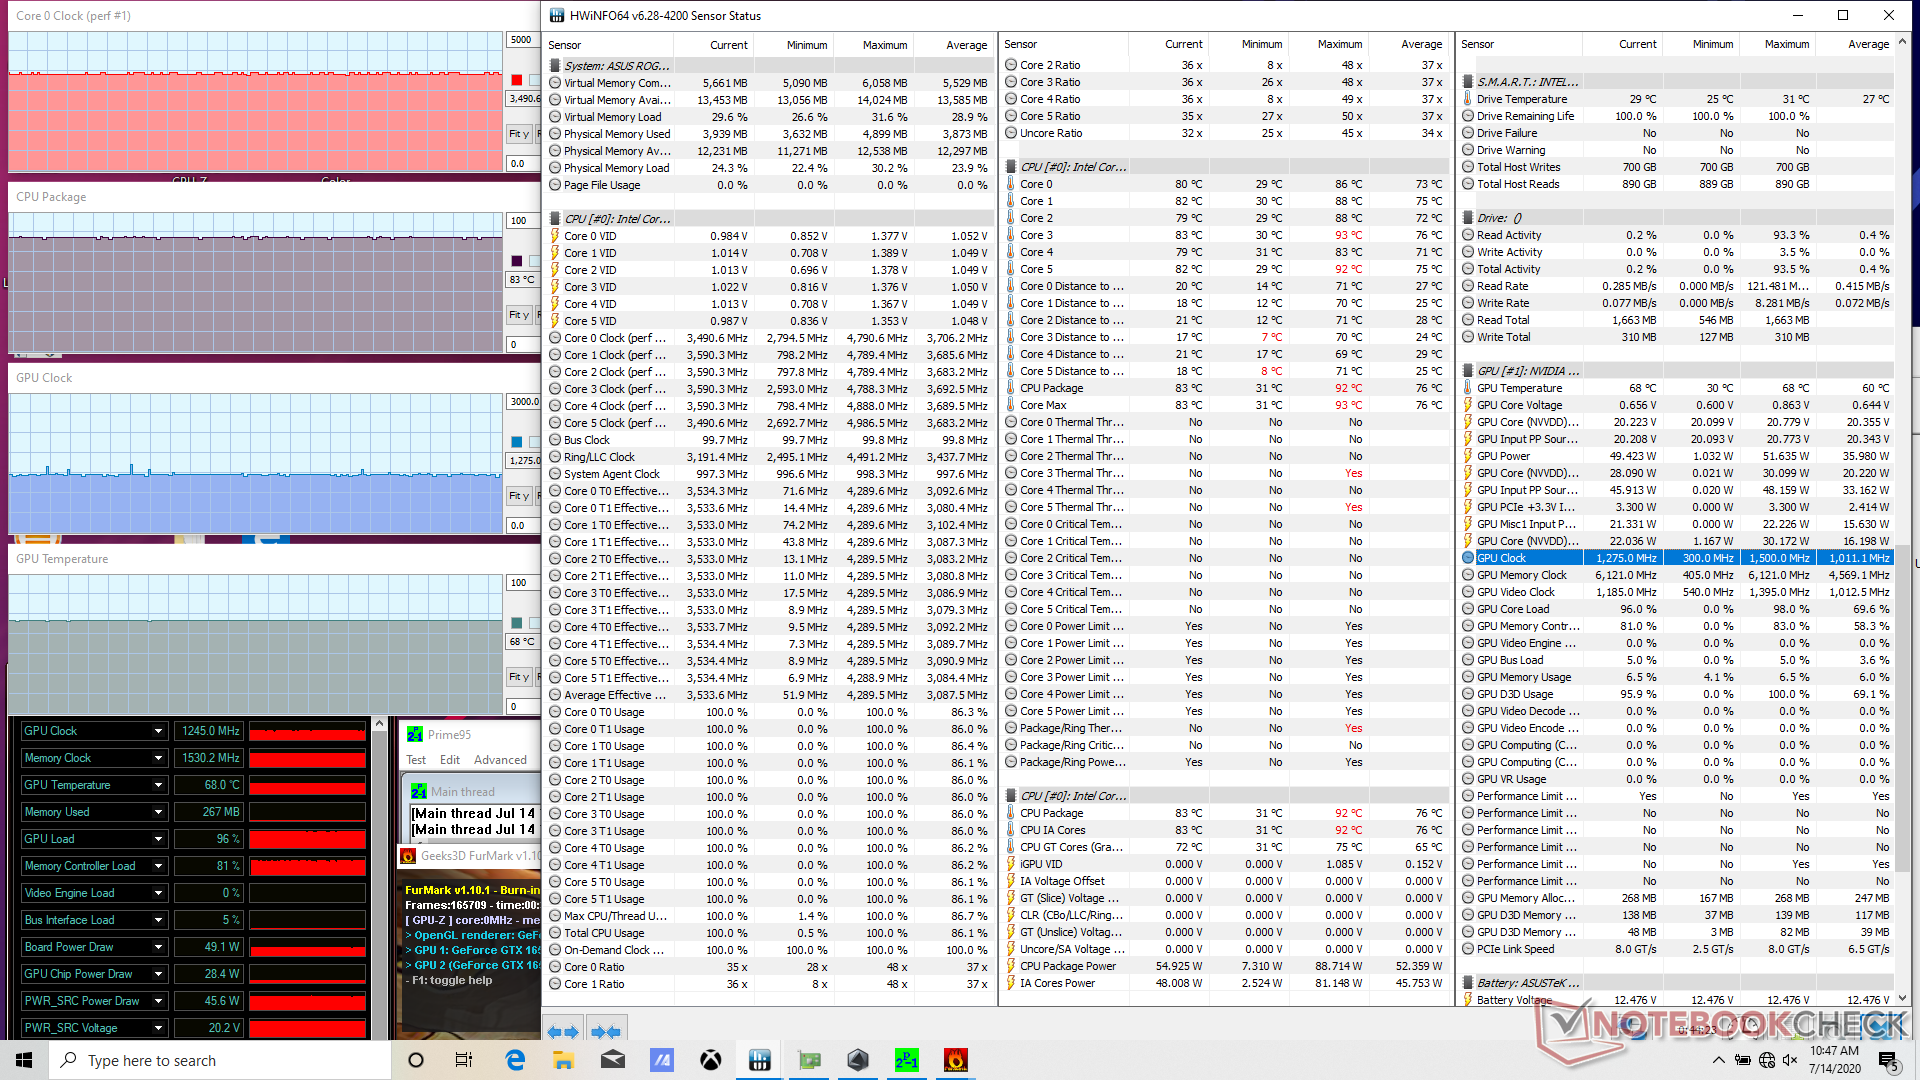
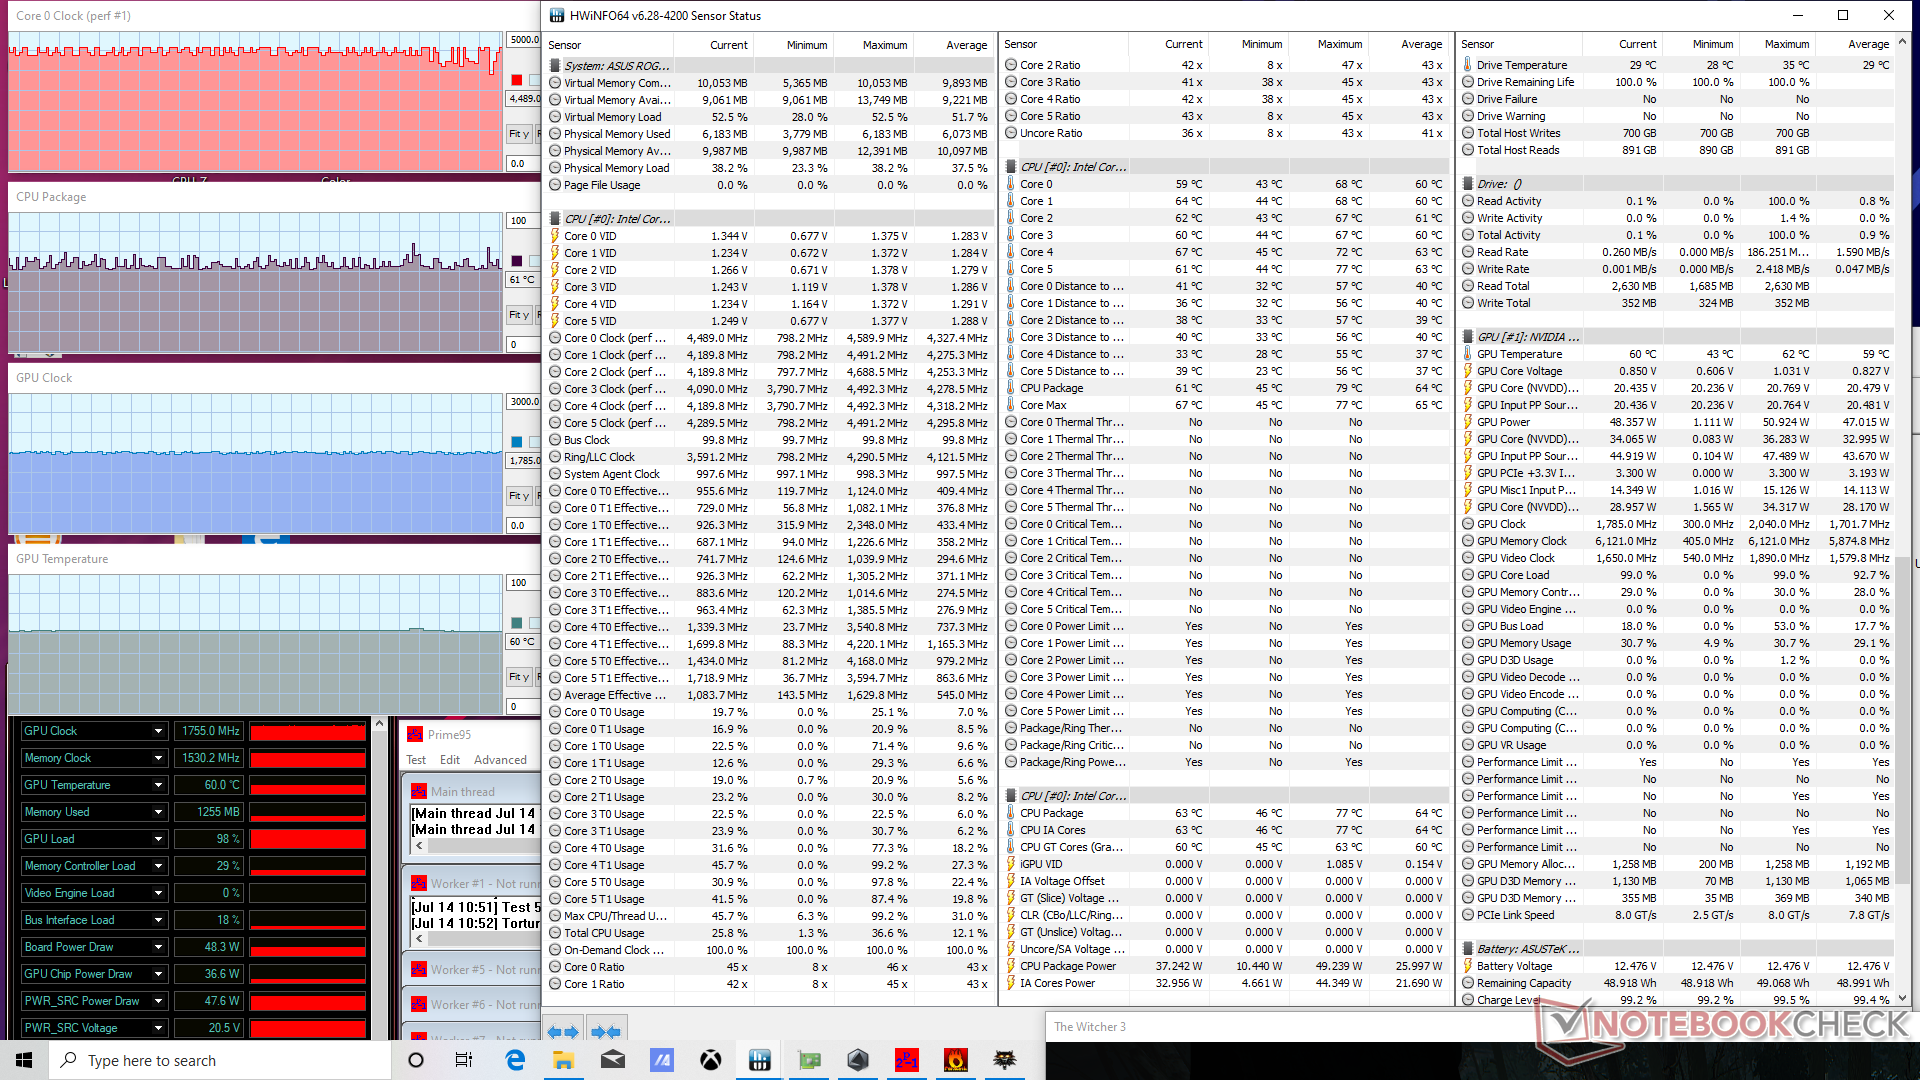
| CPU Clock (GHz) | GPU Clock (MHz) | Average CPU Temperature (°C) | Average GPU Temperature (°C) | |
| System Idle | -- | -- | 31 | 30 |
| Prime95 Stress | 3.8 | -- | 83 | 52 |
| Prime95 + FurMark Stress | 3.5 | 1245 | 83 | 68 |
| Witcher 3 Stress (Turbo Mode) | ~4.4 | 1755 | 61 | 60 |
Speakers


Asus ROG Strix G15 G512LI ses analizi
(+) | hoparlörler nispeten yüksek sesle çalabilir (85.8 dB)
Bas 100 - 315Hz
(±) | azaltılmış bas - ortalama olarak medyandan 14.3% daha düşük
(±) | Bas doğrusallığı ortalamadır (12.3% delta - önceki frekans)
Ortalar 400 - 2000 Hz
(±) | daha yüksek ortalar - ortalama olarak medyandan 8.2% daha yüksek
(+) | orta frekanslar doğrusaldır (5.1% deltadan önceki frekansa)
Yüksekler 2 - 16 kHz
(+) | dengeli yüksekler - medyandan yalnızca 3.4% uzakta
(±) | Yükseklerin doğrusallığı ortalamadır (9.5% delta - önceki frekans)
Toplam 100 - 16.000 Hz
(±) | Genel sesin doğrusallığı ortalamadır (18.9% ortancaya göre fark)
Aynı sınıfla karşılaştırıldığında
» Bu sınıftaki tüm test edilen cihazların %63%'si daha iyi, 8% benzer, 29% daha kötüydü
» En iyisinin deltası 6% idi, ortalama 18% idi, en kötüsü 132% idi
Test edilen tüm cihazlarla karşılaştırıldığında
» Test edilen tüm cihazların %44'si daha iyi, 8 benzer, % 48 daha kötüydü
» En iyisinin deltası 4% idi, ortalama 24% idi, en kötüsü 134% idi
Apple MacBook 12 (Early 2016) 1.1 GHz ses analizi
(+) | hoparlörler nispeten yüksek sesle çalabilir (83.6 dB)
Bas 100 - 315Hz
(±) | azaltılmış bas - ortalama olarak medyandan 11.3% daha düşük
(±) | Bas doğrusallığı ortalamadır (14.2% delta - önceki frekans)
Ortalar 400 - 2000 Hz
(+) | dengeli ortalar - medyandan yalnızca 2.4% uzakta
(+) | orta frekanslar doğrusaldır (5.5% deltadan önceki frekansa)
Yüksekler 2 - 16 kHz
(+) | dengeli yüksekler - medyandan yalnızca 2% uzakta
(+) | yüksekler doğrusaldır (4.5% deltadan önceki frekansa)
Toplam 100 - 16.000 Hz
(+) | genel ses doğrusaldır (10.2% ortancaya göre fark)
Aynı sınıfla karşılaştırıldığında
» Bu sınıftaki tüm test edilen cihazların %7%'si daha iyi, 2% benzer, 91% daha kötüydü
» En iyisinin deltası 5% idi, ortalama 18% idi, en kötüsü 53% idi
Test edilen tüm cihazlarla karşılaştırıldığında
» Test edilen tüm cihazların %5'si daha iyi, 1 benzer, % 94 daha kötüydü
» En iyisinin deltası 4% idi, ortalama 24% idi, en kötüsü 134% idi
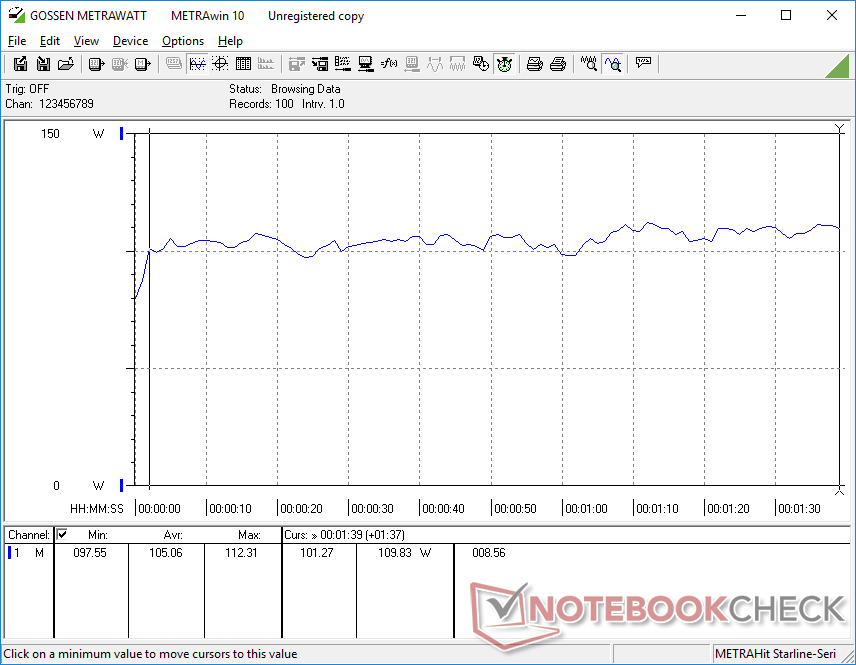
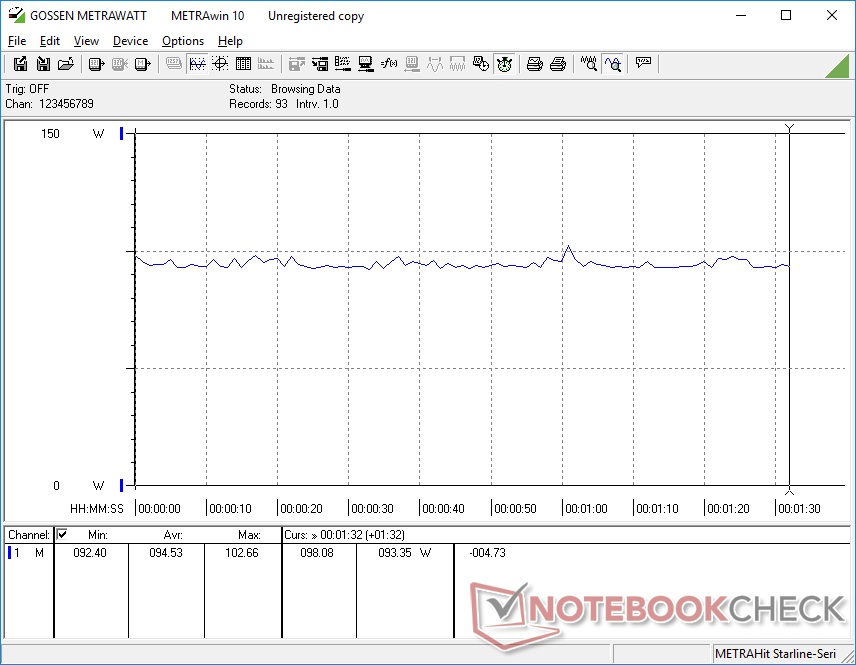
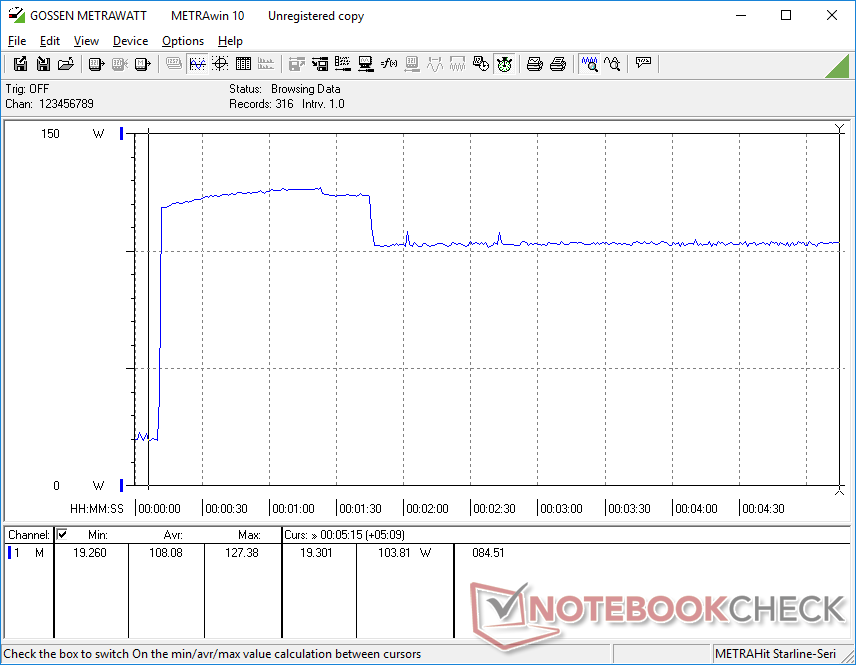
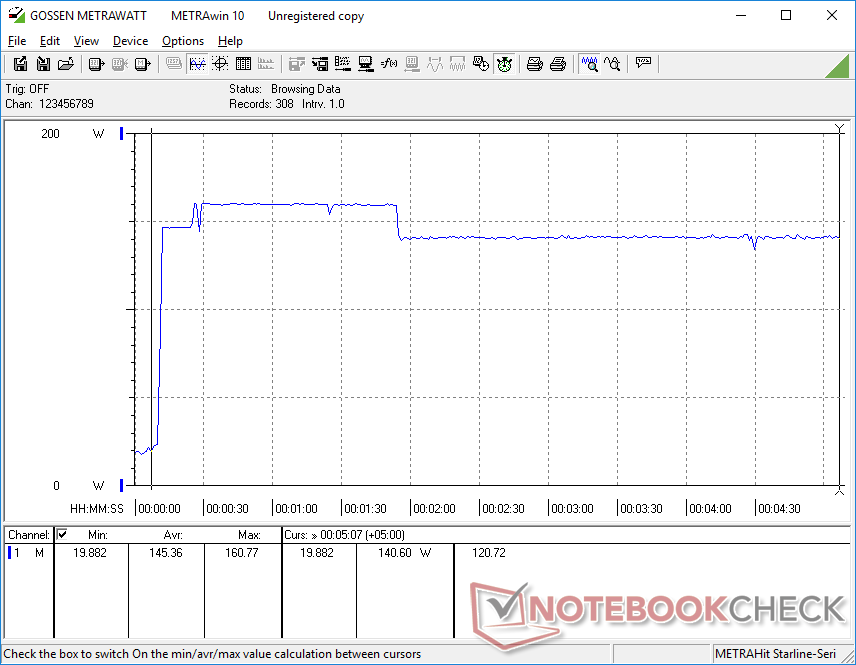
Energy Management
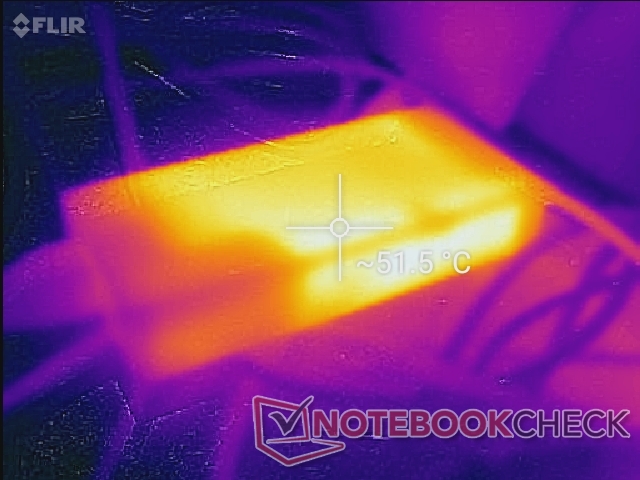
Power Consumption
Idling on desktop demands between 5 W and 21 W depending on the brightness level and power profile. Running Witcher 3 consumes about 95 W compared to 125 W to 130 W on most GTX 1060-powered laptops. Thus, the GTX 1650 Ti is able to offer similar graphics performance at a much higher performance-per-watt than the last generation Pascal GPU.
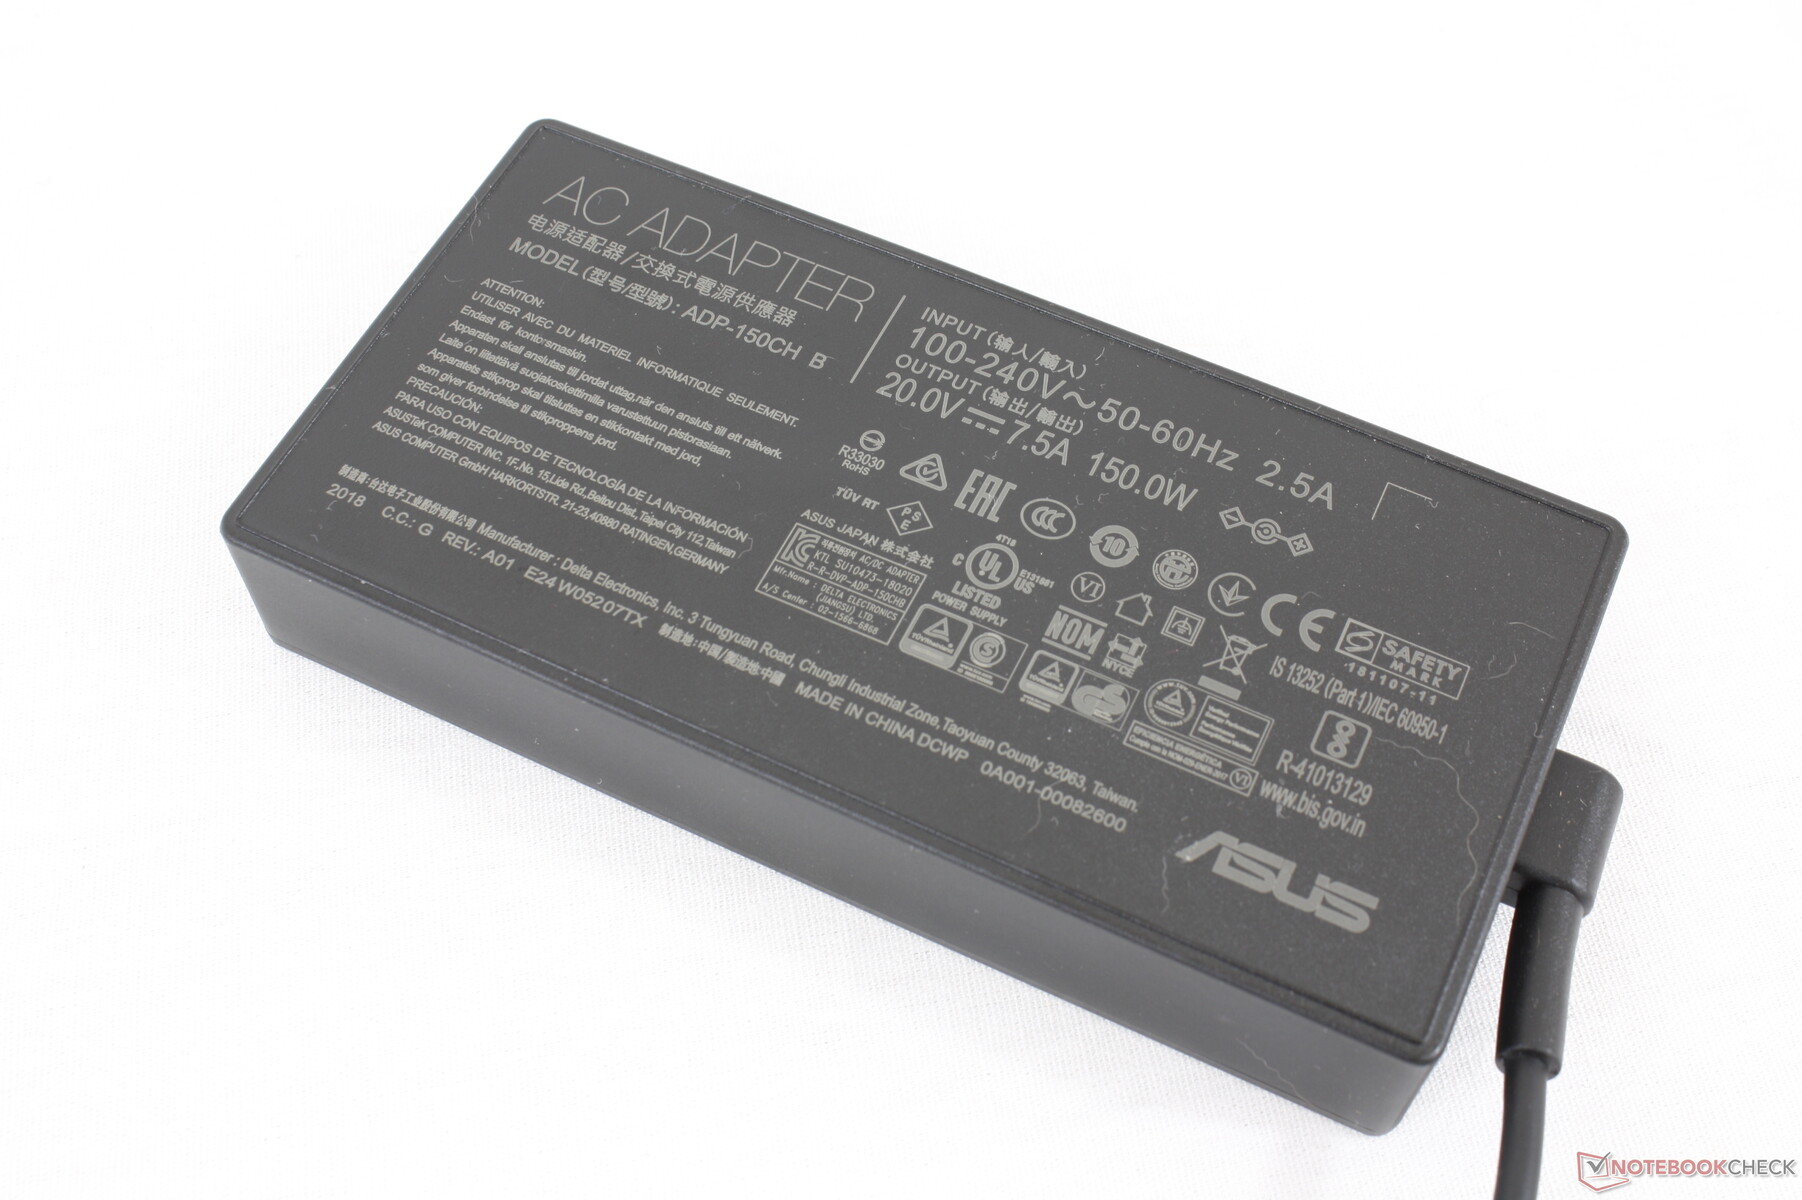
We're able to record a maximum draw of 161 W from the medium-sized 150 W AC adapter. This maximum is only temporary as shown by our graphs below. Configurations with the GTX 1660 Ti GPU or higher will ship with a larger 230 W AC adapter instead.
| Kapalı / Bekleme modu | |
| Boşta | |
| Çalışırken |
|
Key:
min: | |
| Asus ROG Strix G15 G512LI i7-10750H, GeForce GTX 1650 Ti Mobile, Intel SSD 660p SSDPEKNW512G8, IPS, 1920x1080, 15.6" | Asus TUF Gaming A15 FA506IV-HN172 R7 4800H, GeForce RTX 2060 Mobile, Kingston OM8PCP3512F-AB, IPS, 1920x1080, 15.6" | MSI GP65 10SFK-047US i7-10750H, GeForce RTX 2070 Mobile, Samsung SSD PM981 MZVLB1T0HALR, IPS, 1920x1080, 15.6" | Dell G5 15 SE 5505 P89F R7 4800H, Radeon RX 5600M, Samsung PM991 MZ9LQ512HALU, WVA, 1920x1080, 15.6" | HP Omen 15-dc1020ng i5-9300H, GeForce GTX 1650 Mobile, WDC PC SN720 SDAQNTW-512G, IPS, 1920x1080, 15.6" | HP Pavilion Gaming 15-cx0003ng i7-8750H, GeForce GTX 1050 Ti Mobile, Intel Optane 16 GB MEMPEK1J016GAH + HGST HTS721010A9E630 1 TB HDD, IPS, 1920x1080, 15.6" | |
|---|---|---|---|---|---|---|
| Power Consumption | -4% | -66% | -6% | 22% | 14% | |
| Idle Minimum * (Watt) | 5.7 | 5.4 5% | 14.2 -149% | 6.5 -14% | 4.04 29% | 5.5 4% |
| Idle Average * (Watt) | 9.3 | 10 -8% | 18.8 -102% | 10.6 -14% | 7.2 23% | 8.5 9% |
| Idle Maximum * (Watt) | 20.9 | 10.5 50% | 23.9 -14% | 11 47% | 11.4 45% | 11.9 43% |
| Load Average * (Watt) | 105.1 | 135 -28% | 96.9 8% | 84.1 20% | 80.8 23% | 94 11% |
| Witcher 3 ultra * (Watt) | 94.5 | 144 -52% | 185 -96% | 152.9 -62% | 93.6 1% | 86 9% |
| Load Maximum * (Watt) | 160.8 | 147 9% | 233.4 -45% | 180.4 -12% | 144.5 10% | 144 10% |
* ... daha küçük daha iyidir
Battery Life
At 4.5 hours of real-world WLAN use, battery life is about average for its category and size class. Battery capacity is quite small at just 48 Wh compared to 99 Wh on something like the MSI GS66.
Recharging from empty to full capacity takes about 1.5 hours. The system cannot be recharged via USB-C unlike on the Asus Zephyrus M GU502.
| Asus ROG Strix G15 G512LI i7-10750H, GeForce GTX 1650 Ti Mobile, 48 Wh | Asus TUF Gaming A15 FA506IV-HN172 R7 4800H, GeForce RTX 2060 Mobile, 48 Wh | Asus Strix Scar III G531GW-AZ062T i7-9750H, GeForce RTX 2070 Mobile, 66 Wh | MSI GP65 10SFK-047US i7-10750H, GeForce RTX 2070 Mobile, 51 Wh | Dell G5 15 SE 5505 P89F R7 4800H, Radeon RX 5600M, 51 Wh | HP Omen 15-dc1020ng i5-9300H, GeForce GTX 1650 Mobile, 52.5 Wh | |
|---|---|---|---|---|---|---|
| Pil Çalışma Süresi | 16% | 24% | -18% | 10% | 16% | |
| Reader / Idle (h) | 13.3 | 9.8 -26% | 11.2 -16% | 15.9 20% | ||
| WiFi v1.3 (h) | 4.5 | 6.2 38% | 5.6 24% | 3.7 -18% | 6.2 38% | 6.4 42% |
| Load (h) | 1.4 | 1.9 36% | 1.5 7% | 1.2 -14% | ||
| Witcher 3 ultra (h) | 1 |
Artılar
Eksiler
Verdict
The features that stick out the most are the support for 3x M.2 2280 SSDs, baseline 144 Hz display option, and the LED bar around the bottom edges of the chassis for visual flair. Most other laptops in this size class can house just two storage drives only. Otherwise, performance is somewhat disappointing for a $1000 gaming machine because users can get pretty much the same graphics performance out of an older and cheaper GTX 1060 laptop or even almost 50 percent faster performance from systems running on the GTX 1660 Ti by spending just $100 to $200 more.
Additionally, the 144 Hz display here sounds good on paper, but this particular Panda panel has major trade-offs including its more limited color space, more noticeable ghosting, and low contrast ratio. The gaming experience is therefore not as smooth or colorful as it could have been unless if users are willing to spend more on the 144 Hz option.
For $1000 USD, the Asus ROG Strix G15 G512LI doesn't offer a compelling enough GPU to make it worthwhile especially now that gaming laptops with AMD Ryzen are taking off. Users are going to be happier with the performance of an Asus TUF model or GTX 1660 Ti alternative for around this same price.
Asus ROG Strix G15 G512LI
- 11/04/2020 v7 (old)
Allen Ngo
Price comparison

