İnceleme: Asus ROG Zephyrus S GX701GXR - 300 Hz ekran mı dediniz?
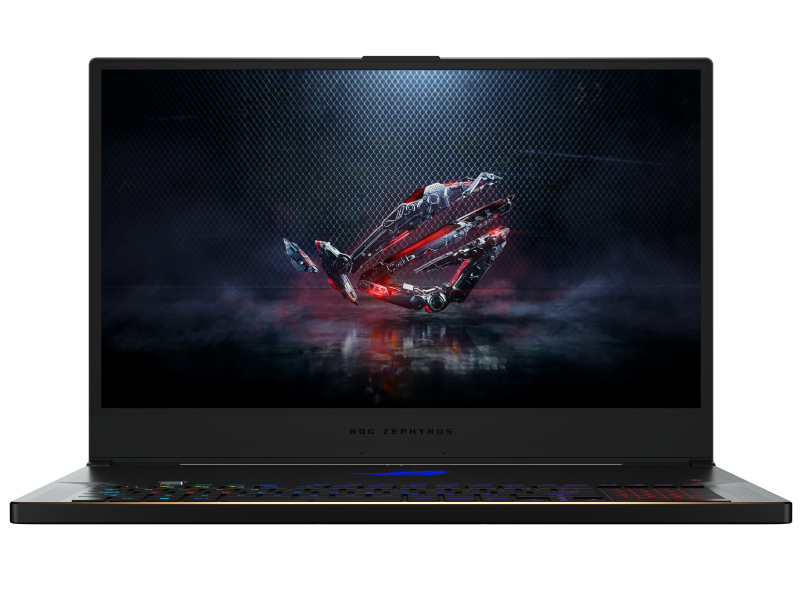
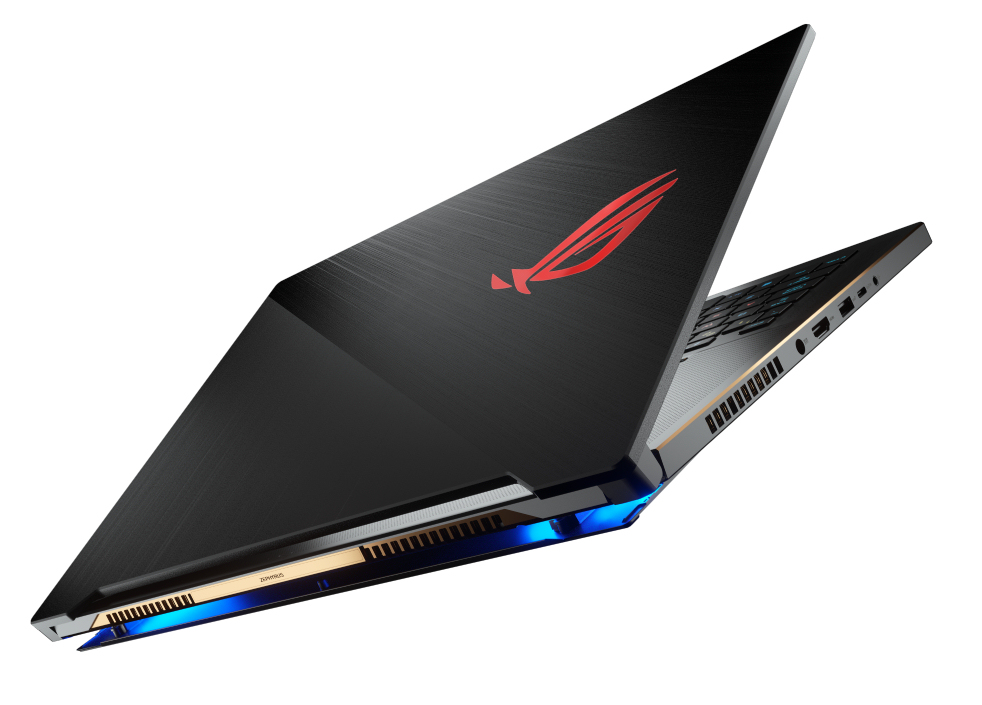
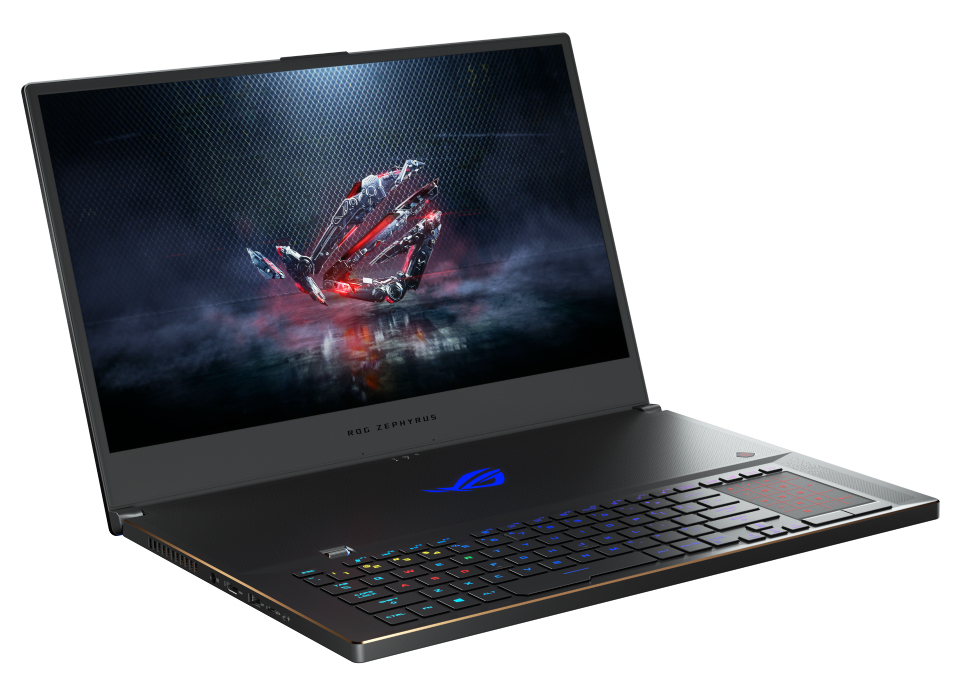
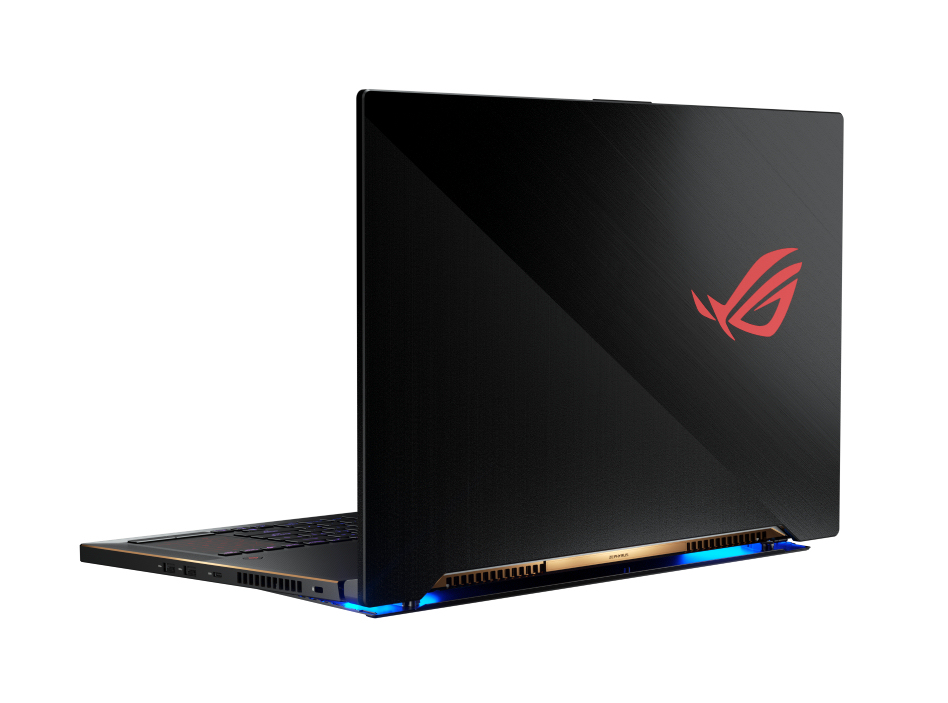
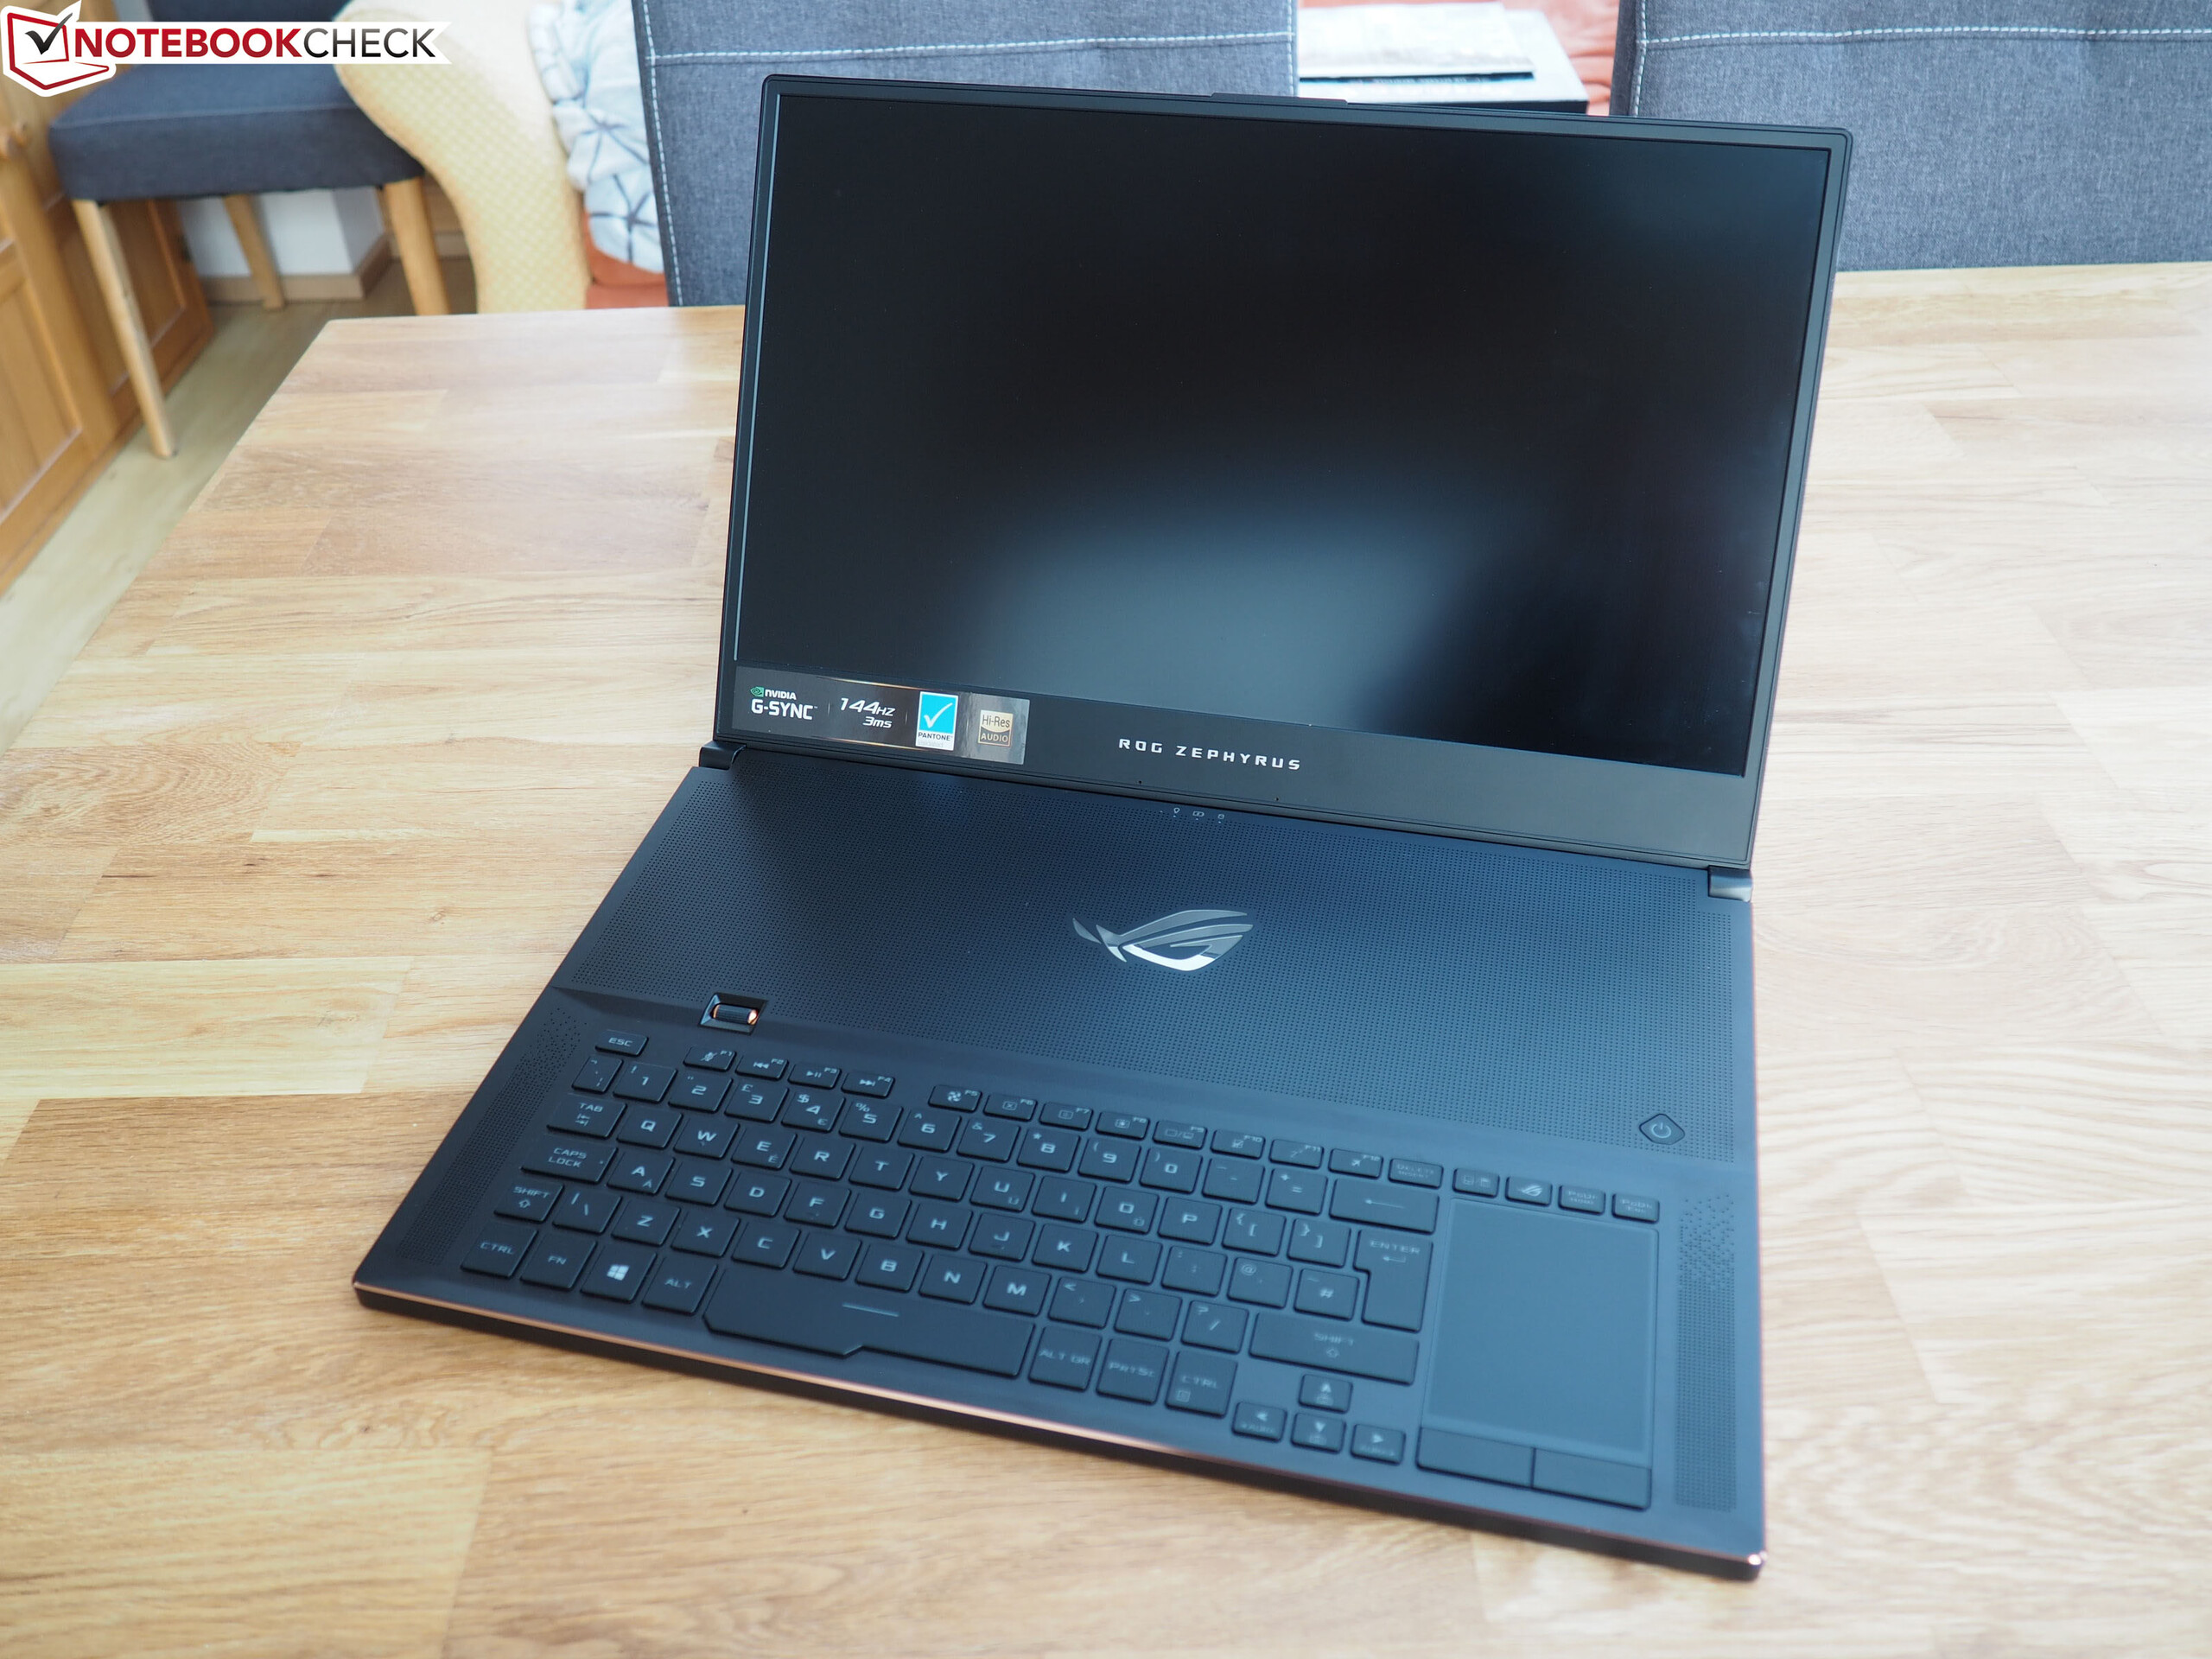
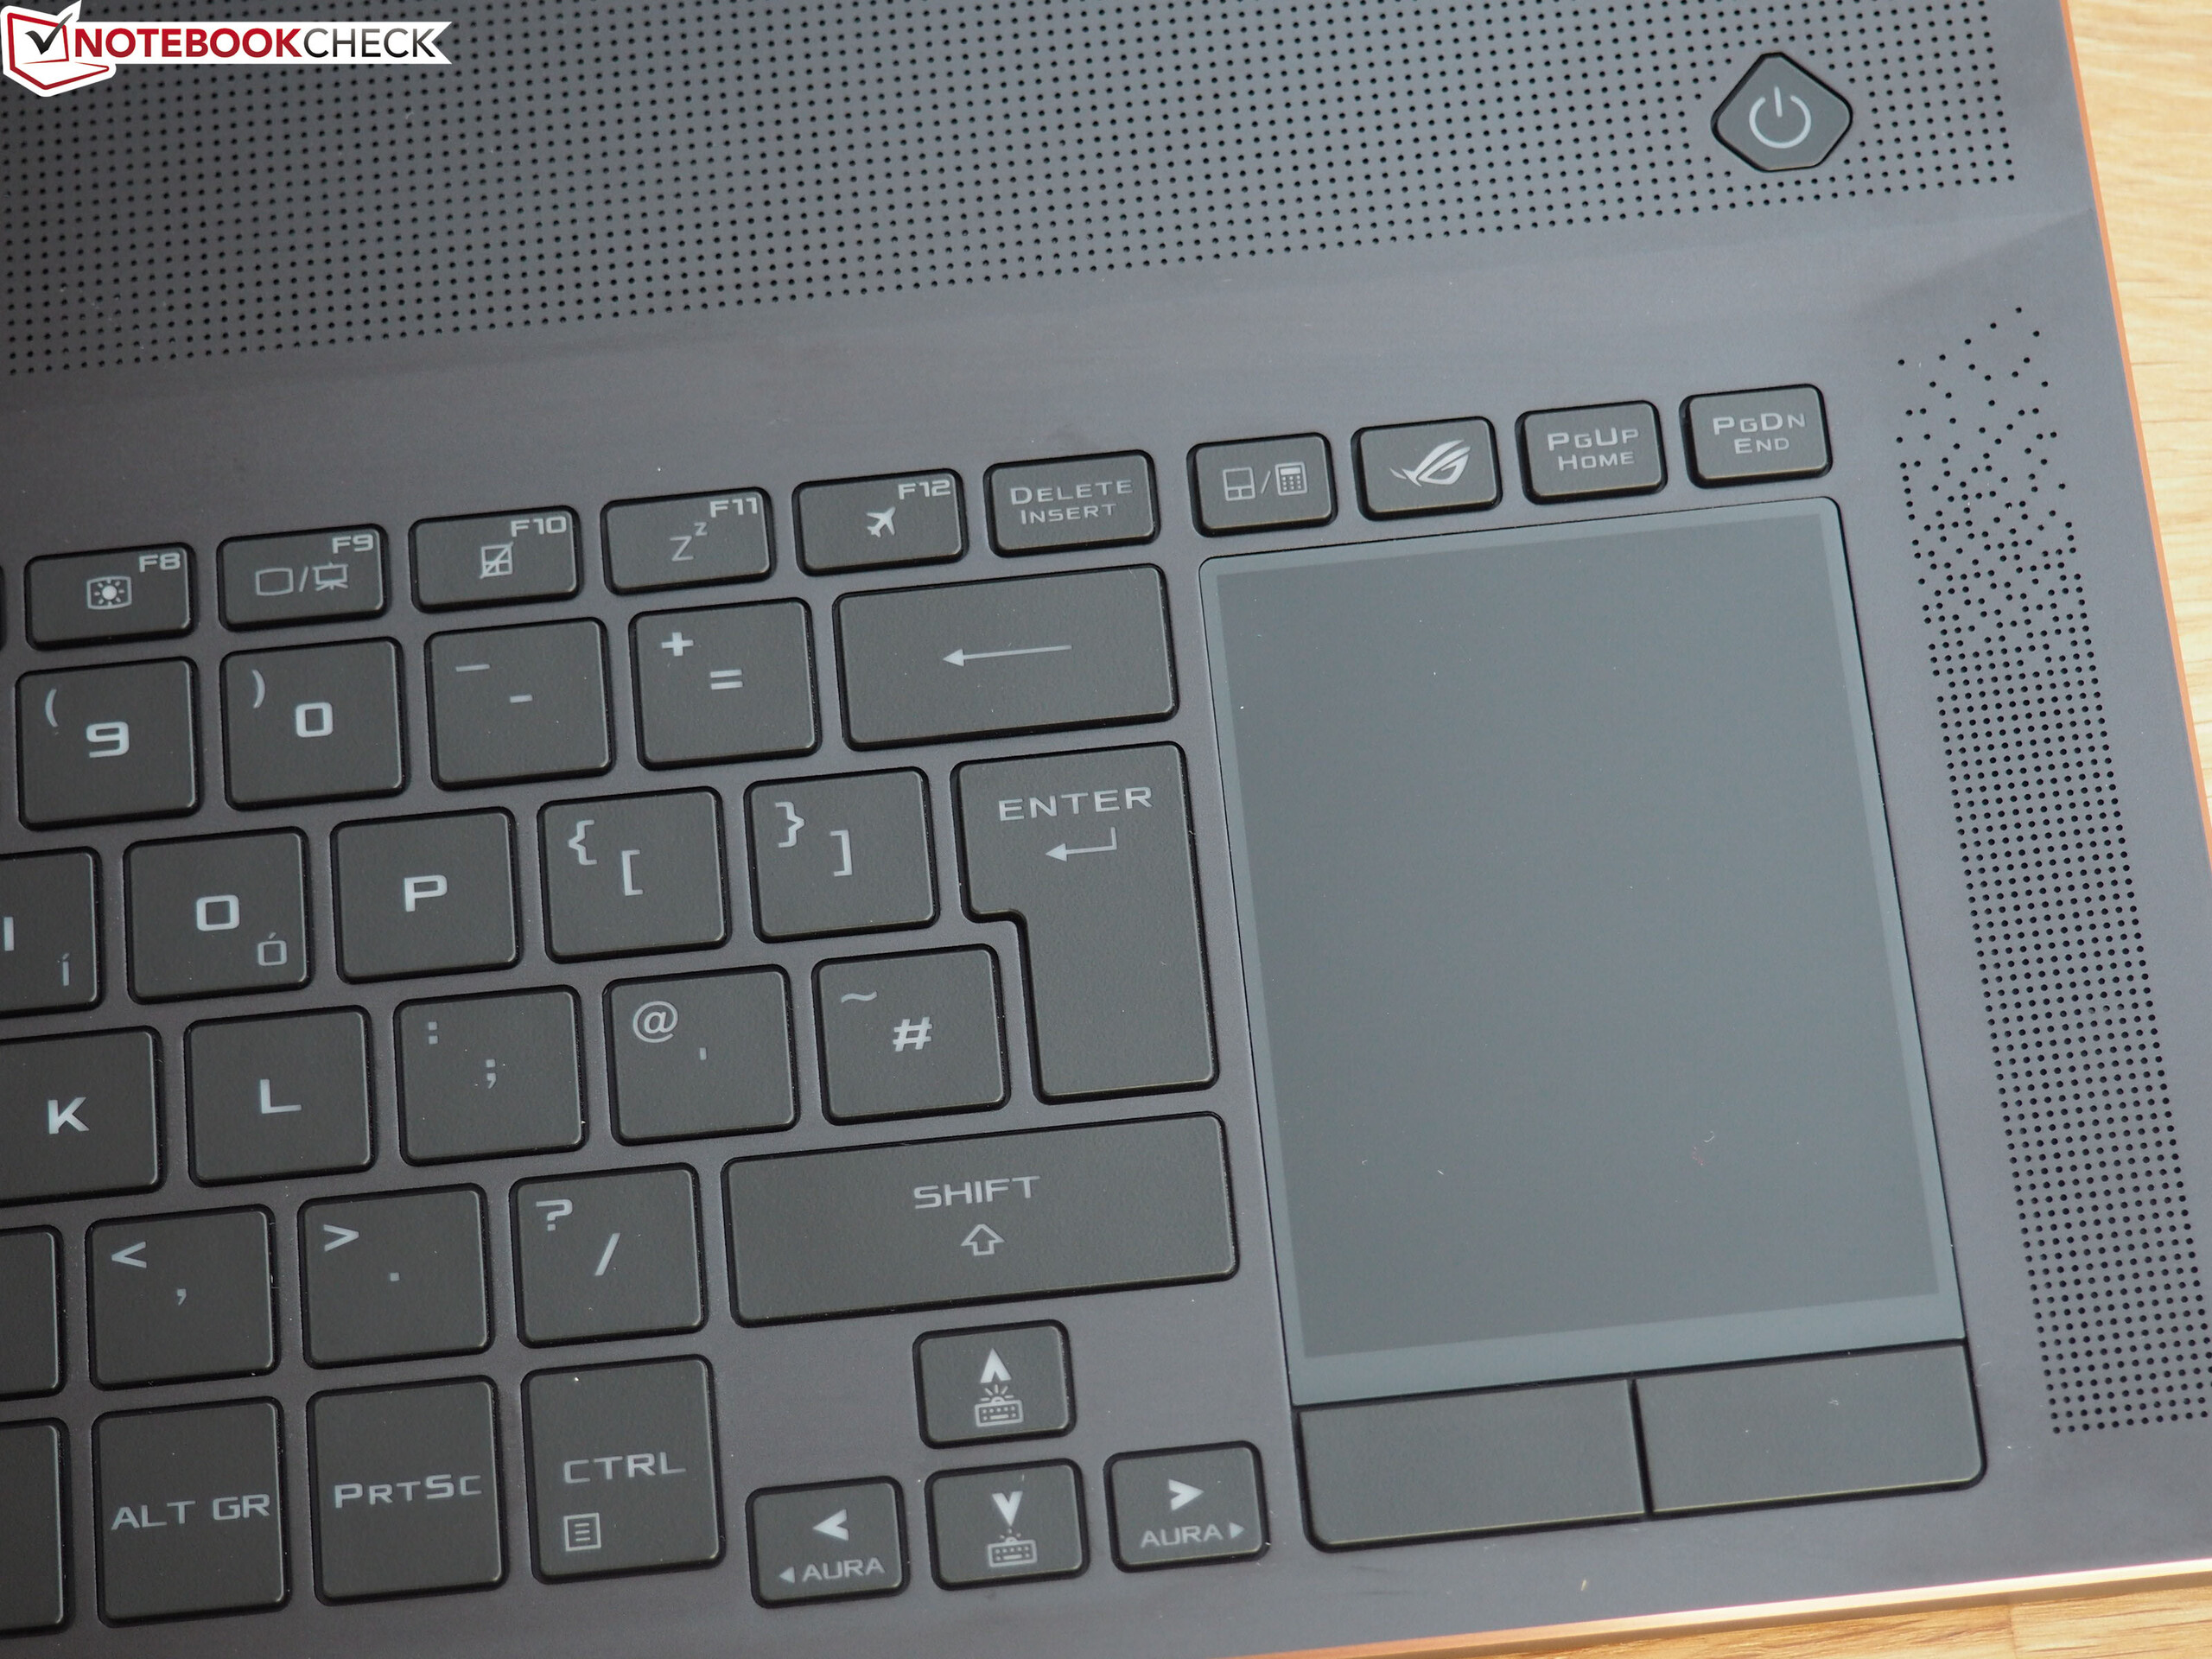
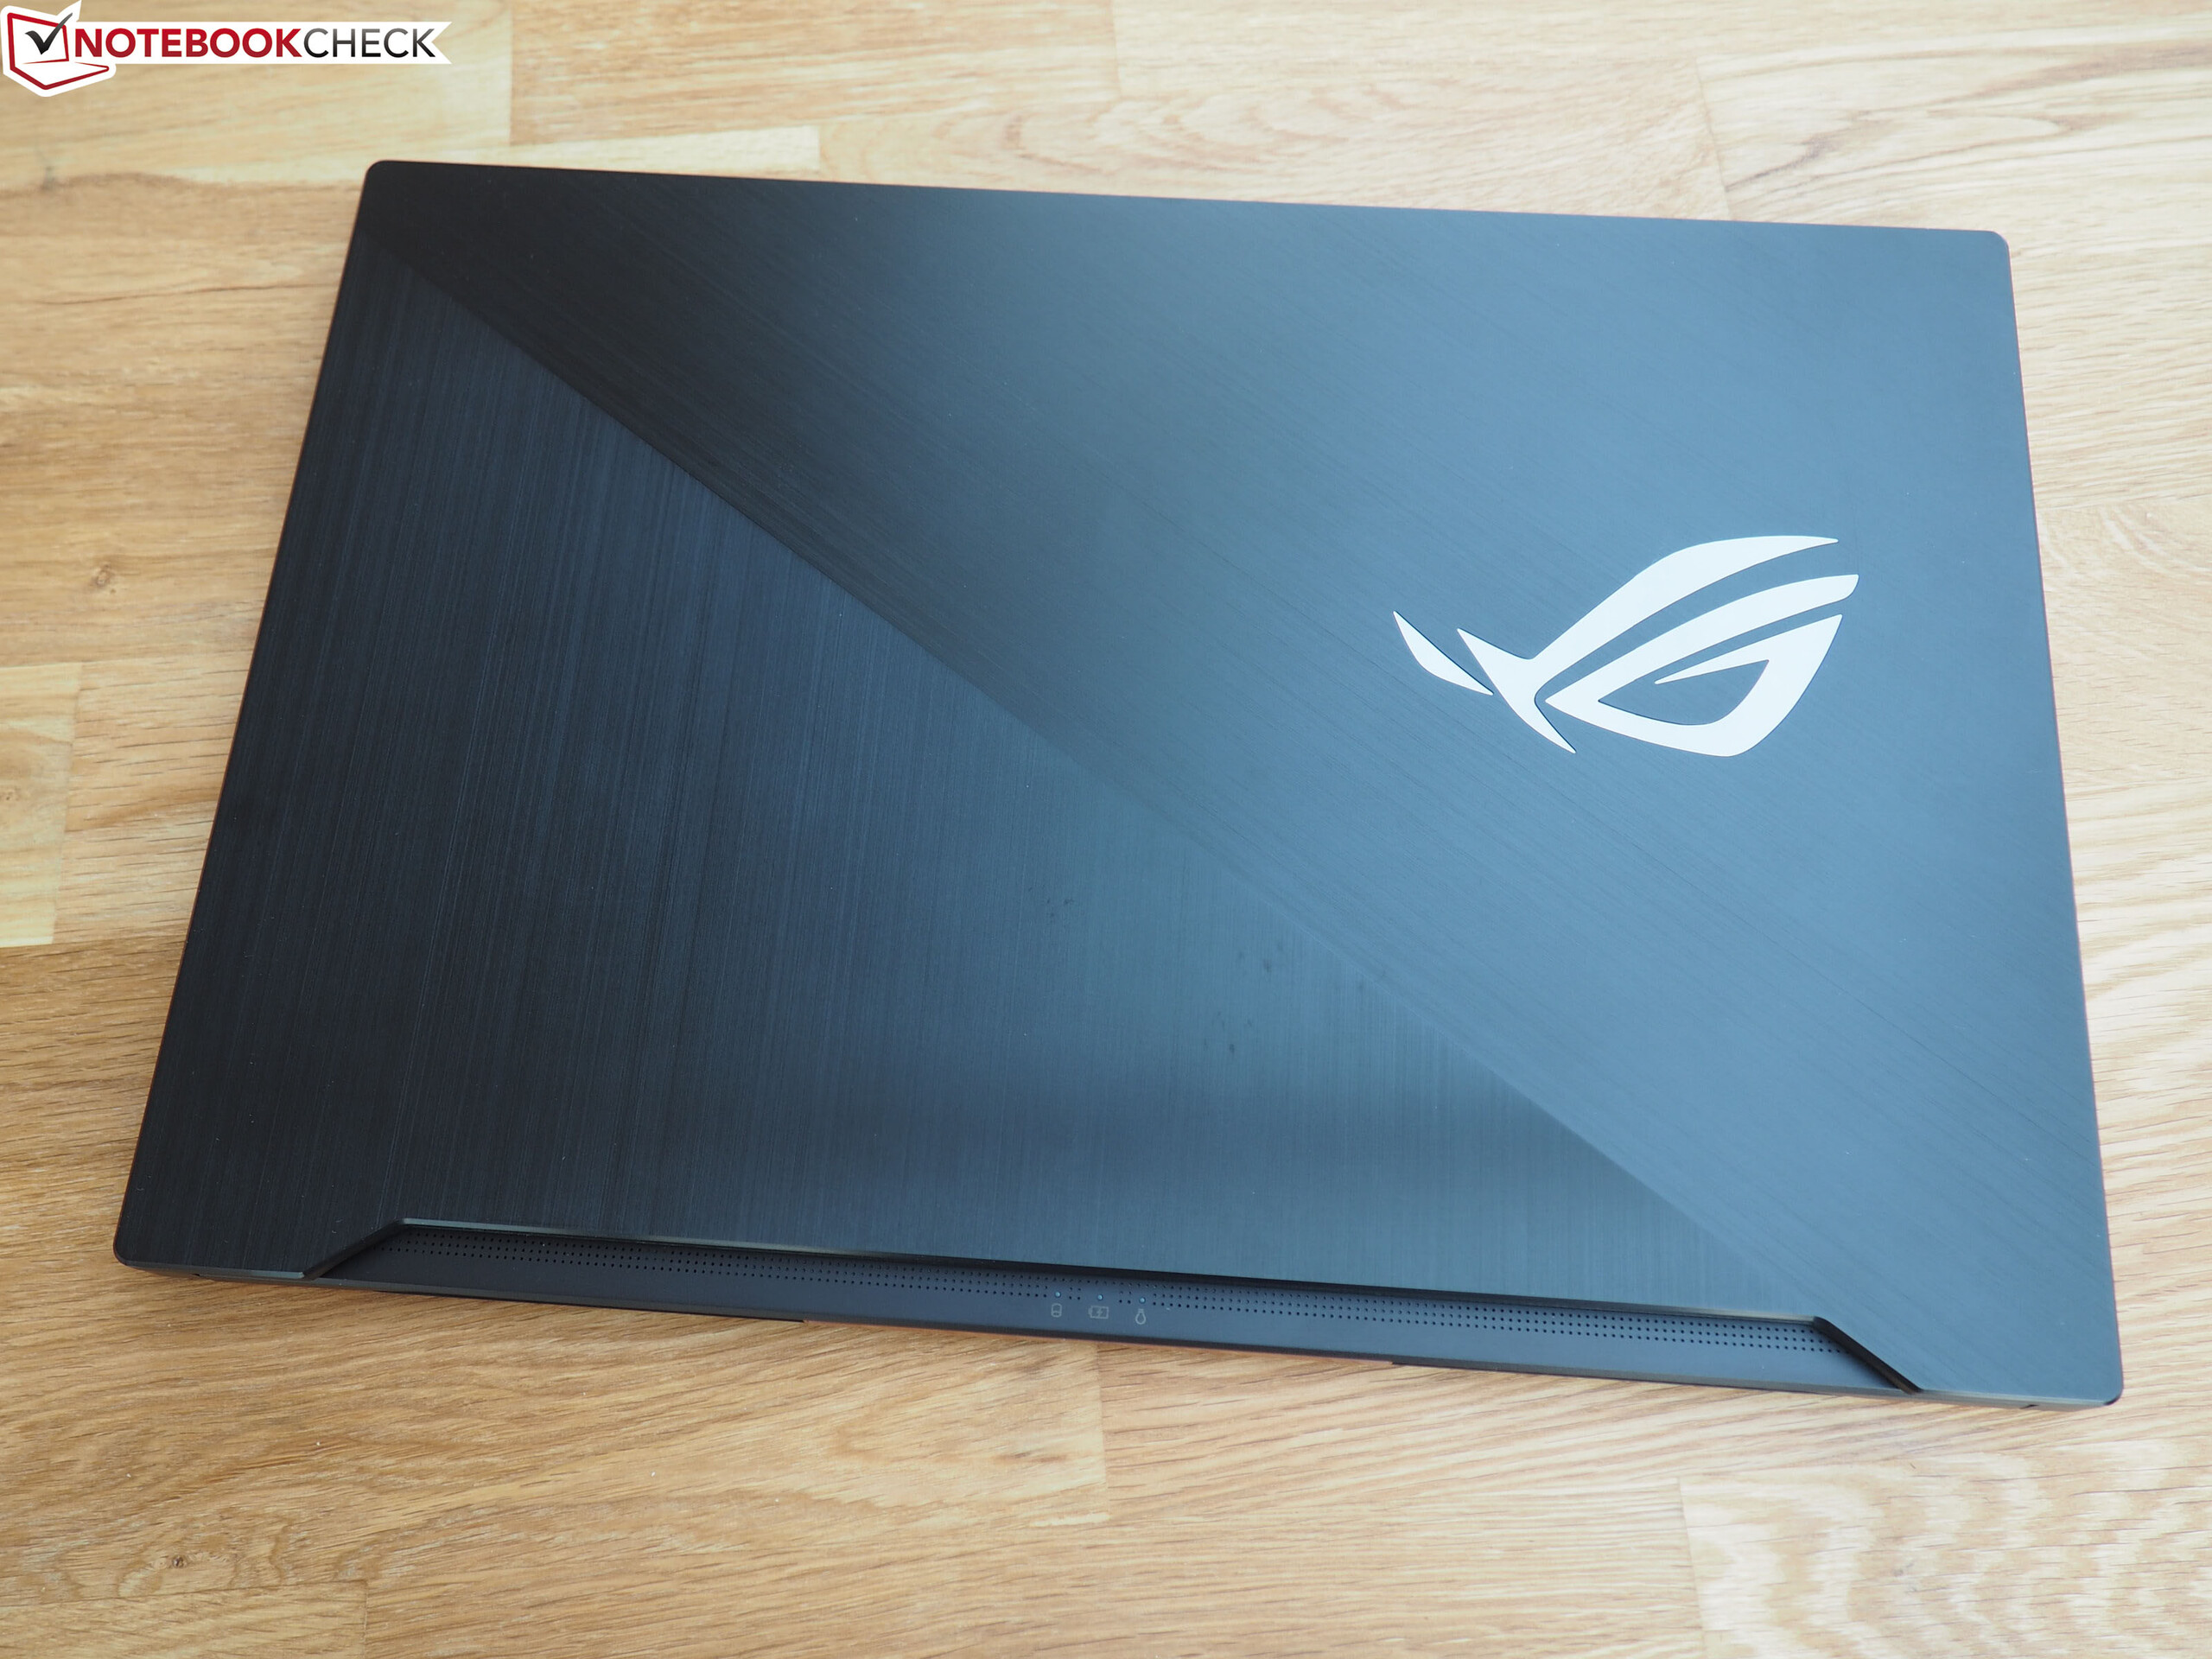
Zephyrus S GX701GXR, 17.3 inç formatındaki ince, kompakt oyun dizüstü bilgisayarlarından biridir. Bu, daha önce gözden geçirdiğimiz Asus ROG Zephyrus S GX701GX'in aynı inşa edilmiş kardeş modelidir. Önümüzdeki test cihazı bir Core i7-9750H işlemci ve bir GeForce RTX 2080 Max-Q GPU ile çalışıyor. Rakipler arasında Razer Blade Pro 17, Gigabyte Aero 17 XA, Alienware m17 ve Lenovo Legion Y740-17ICH gibi cihazlar yer alıyor. İki Zephyrus modeli inşaatta aynı olduğundan, duruma, bağlantıya, giriş aygıtları ve hoparlörler. İlgili bilgiler Zephyrus S GX701GX incelememizde bulunabilir.
Derecelendirme | Tarih | Modeli | Ağırlık | Yükseklik | Boyut | Çözünürlük | Fiyat |
|---|---|---|---|---|---|---|---|
| 81.2 % v7 (old) | 12/2019 | Asus ROG Zephyrus S GX701GXR i7-9750H, GeForce RTX 2080 Max-Q | 2.7 kg | 18.7 mm | 17.30" | 1920x1080 | |
| 87.7 % v7 (old) | 06/2019 | Razer Blade Pro 17 RTX 2080 Max-Q i7-9750H, GeForce RTX 2080 Max-Q | 2.8 kg | 19.9 mm | 17.30" | 1920x1080 | |
| 86.1 % v7 (old) | 10/2019 | Gigabyte Aero 17 XA RP77 i9-9980HK, GeForce RTX 2070 Max-Q | 2.5 kg | 21.4 mm | 17.30" | 3840x2160 | |
| 87.4 % v6 (old) | 04/2019 | Alienware m17 P37E i9-8950HK, GeForce RTX 2080 Max-Q | 2.6 kg | 23 mm | 17.30" | 3840x2160 | |
| 85.6 % v6 (old) | 03/2019 | Lenovo Legion Y740-17ICH i7-8750H, GeForce RTX 2080 Max-Q | 2.8 kg | 23 mm | 17.30" | 1920x1080 |

| Networking | |
| iperf3 transmit AX12 | |
| Asus ROG Zephyrus S GX701GXR | |
| iperf3 receive AX12 | |
| Asus ROG Zephyrus S GX701GXR | |
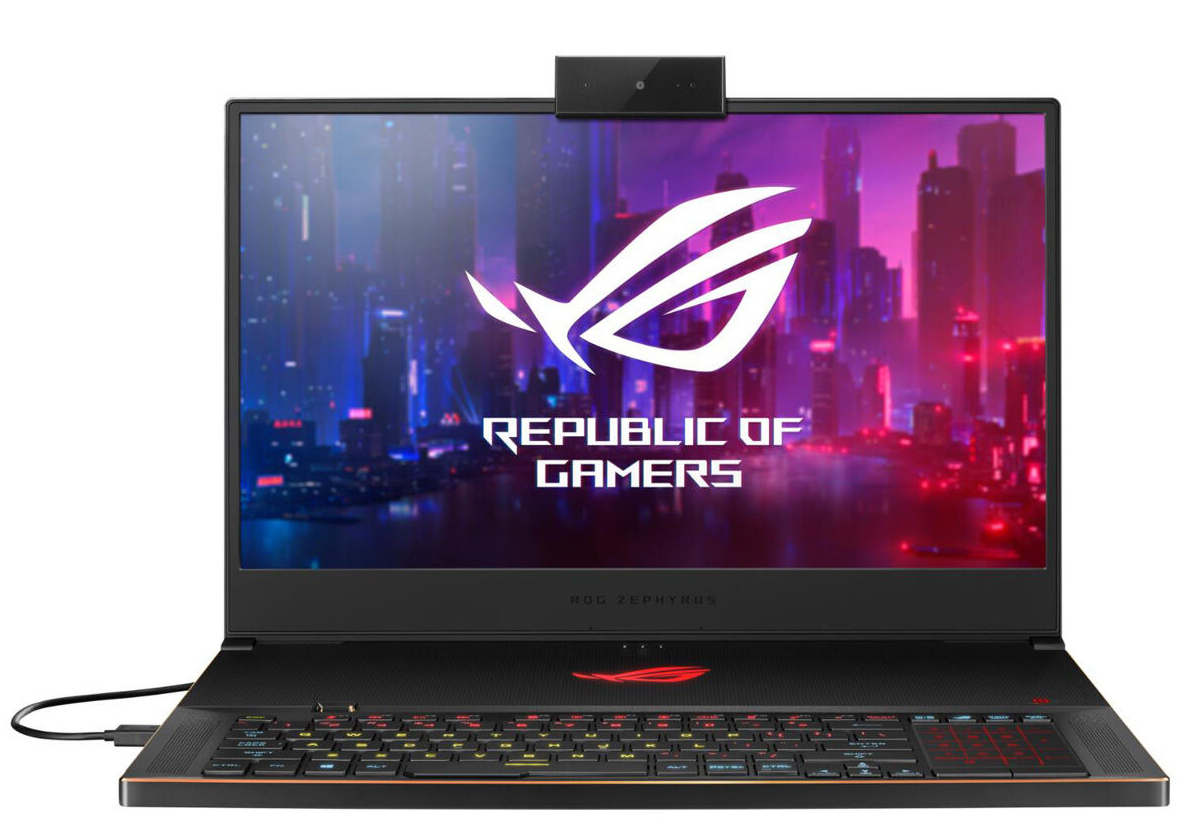
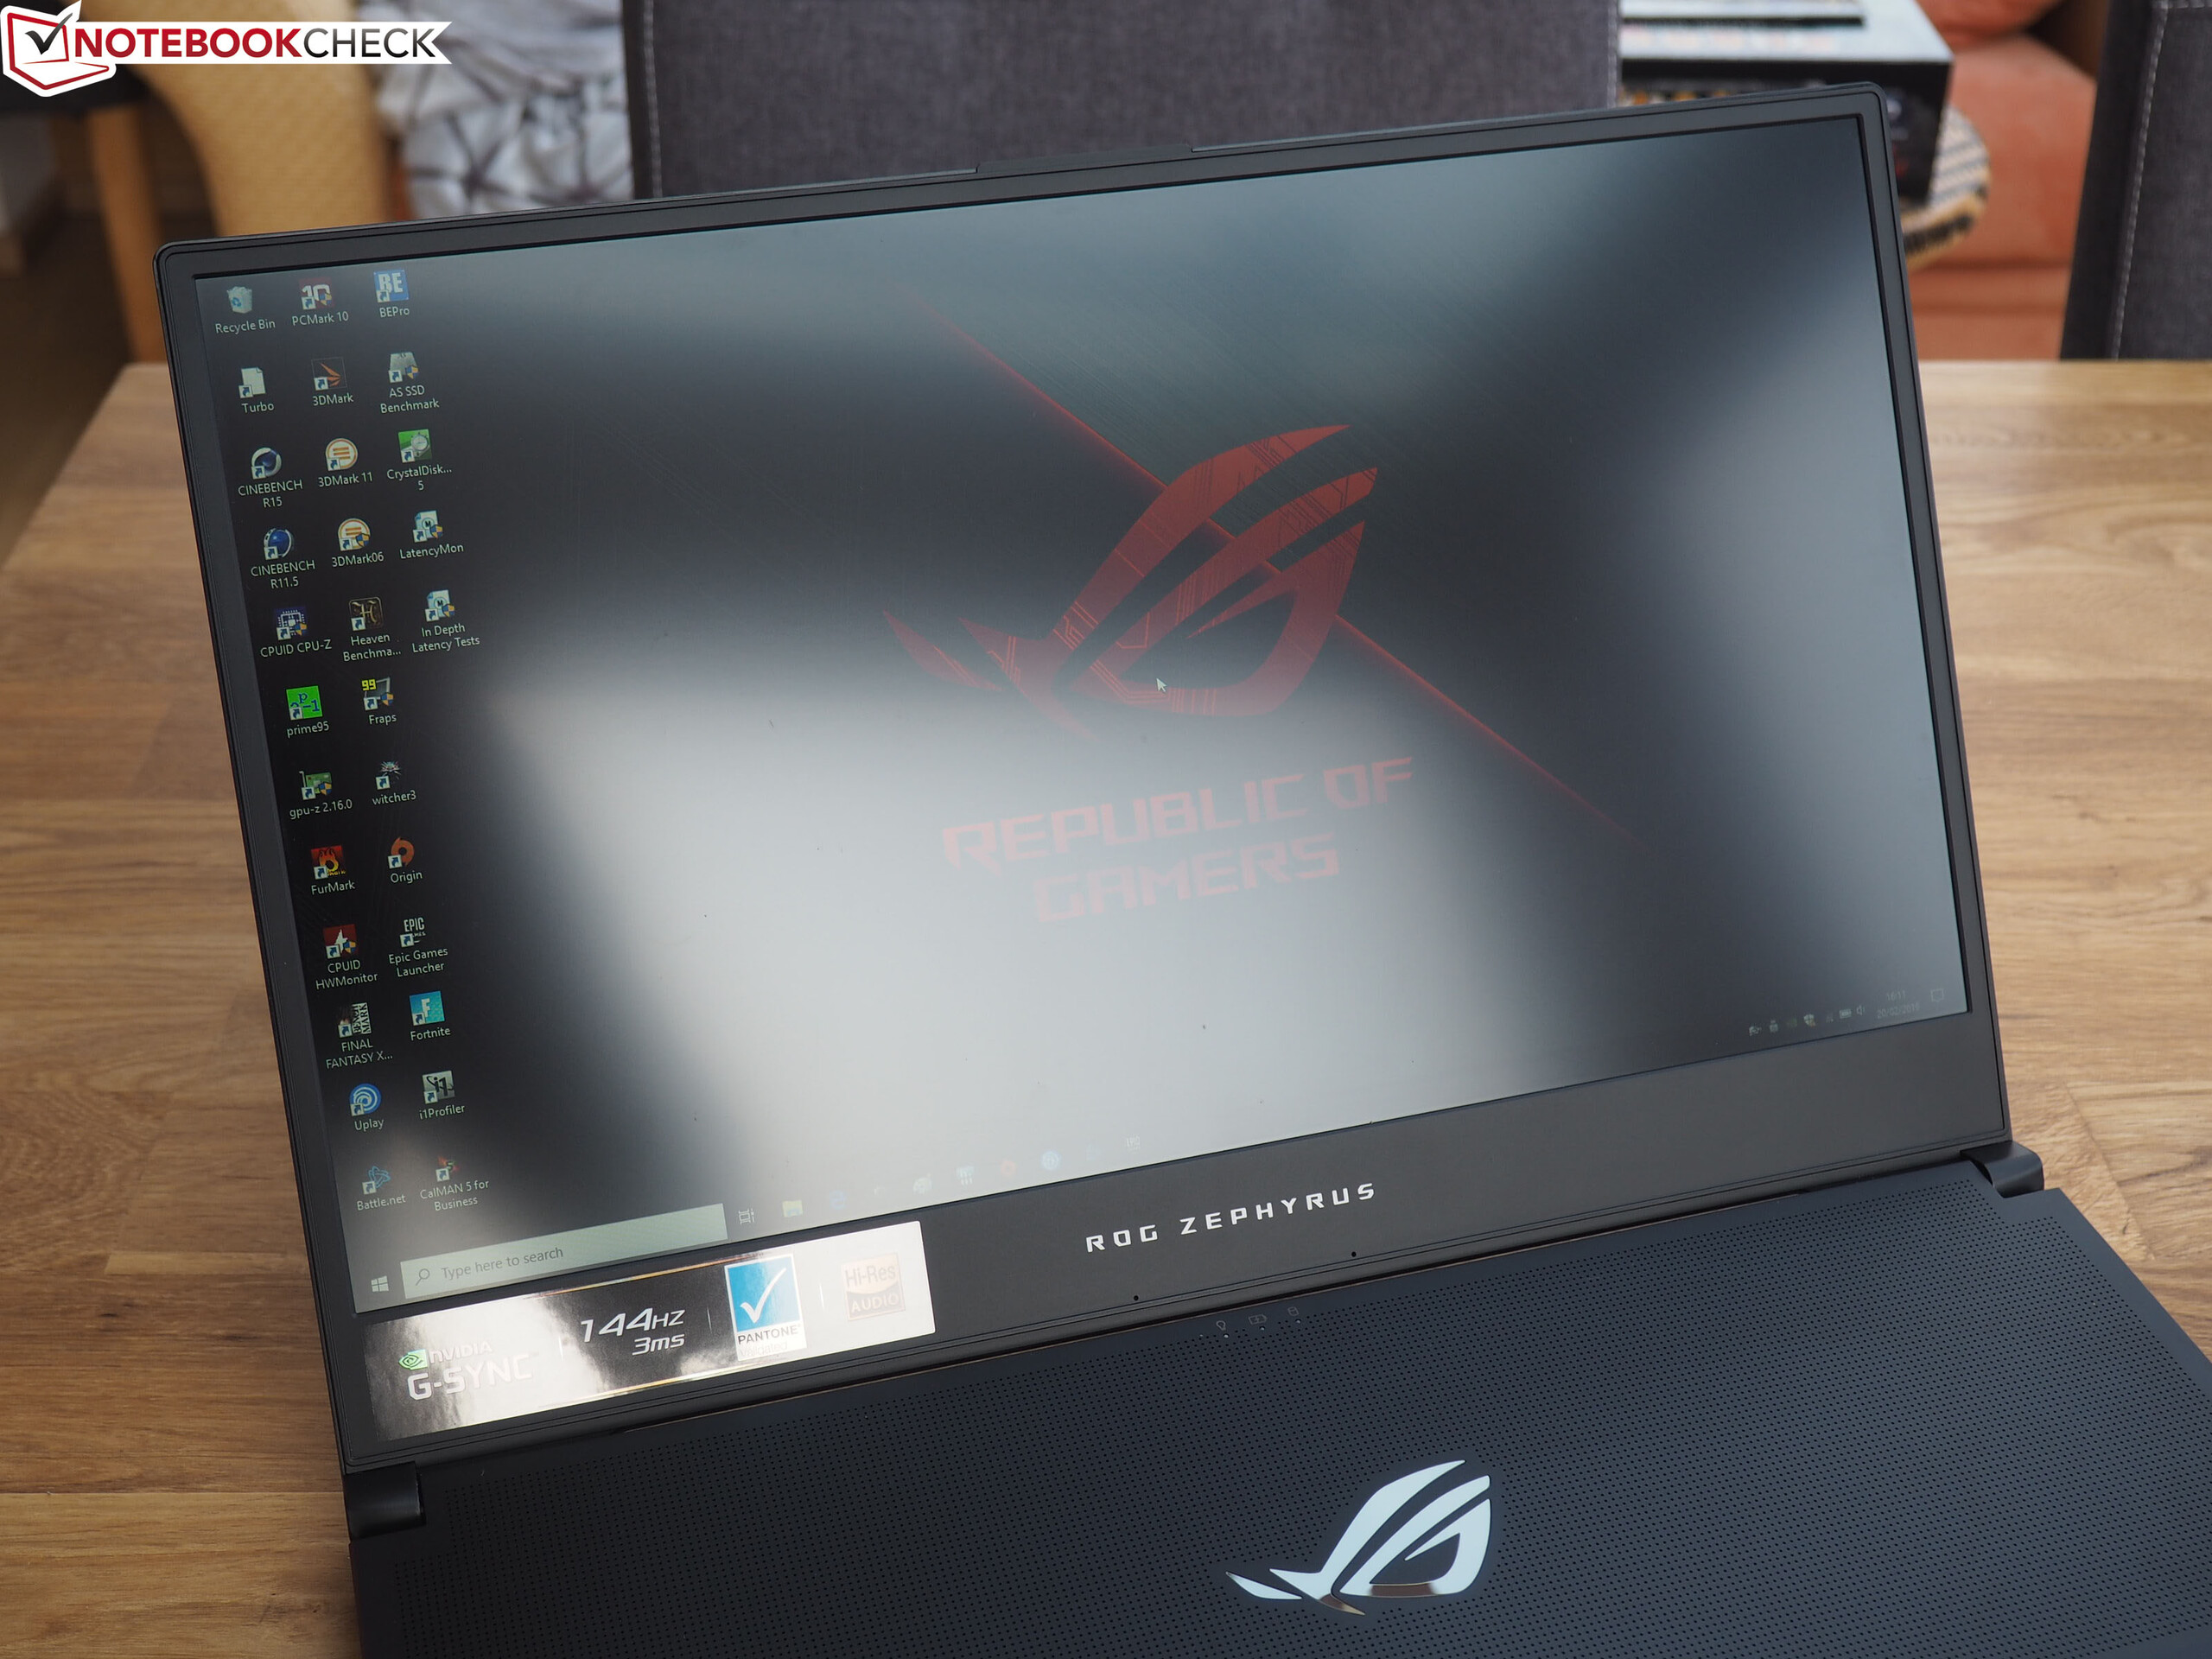
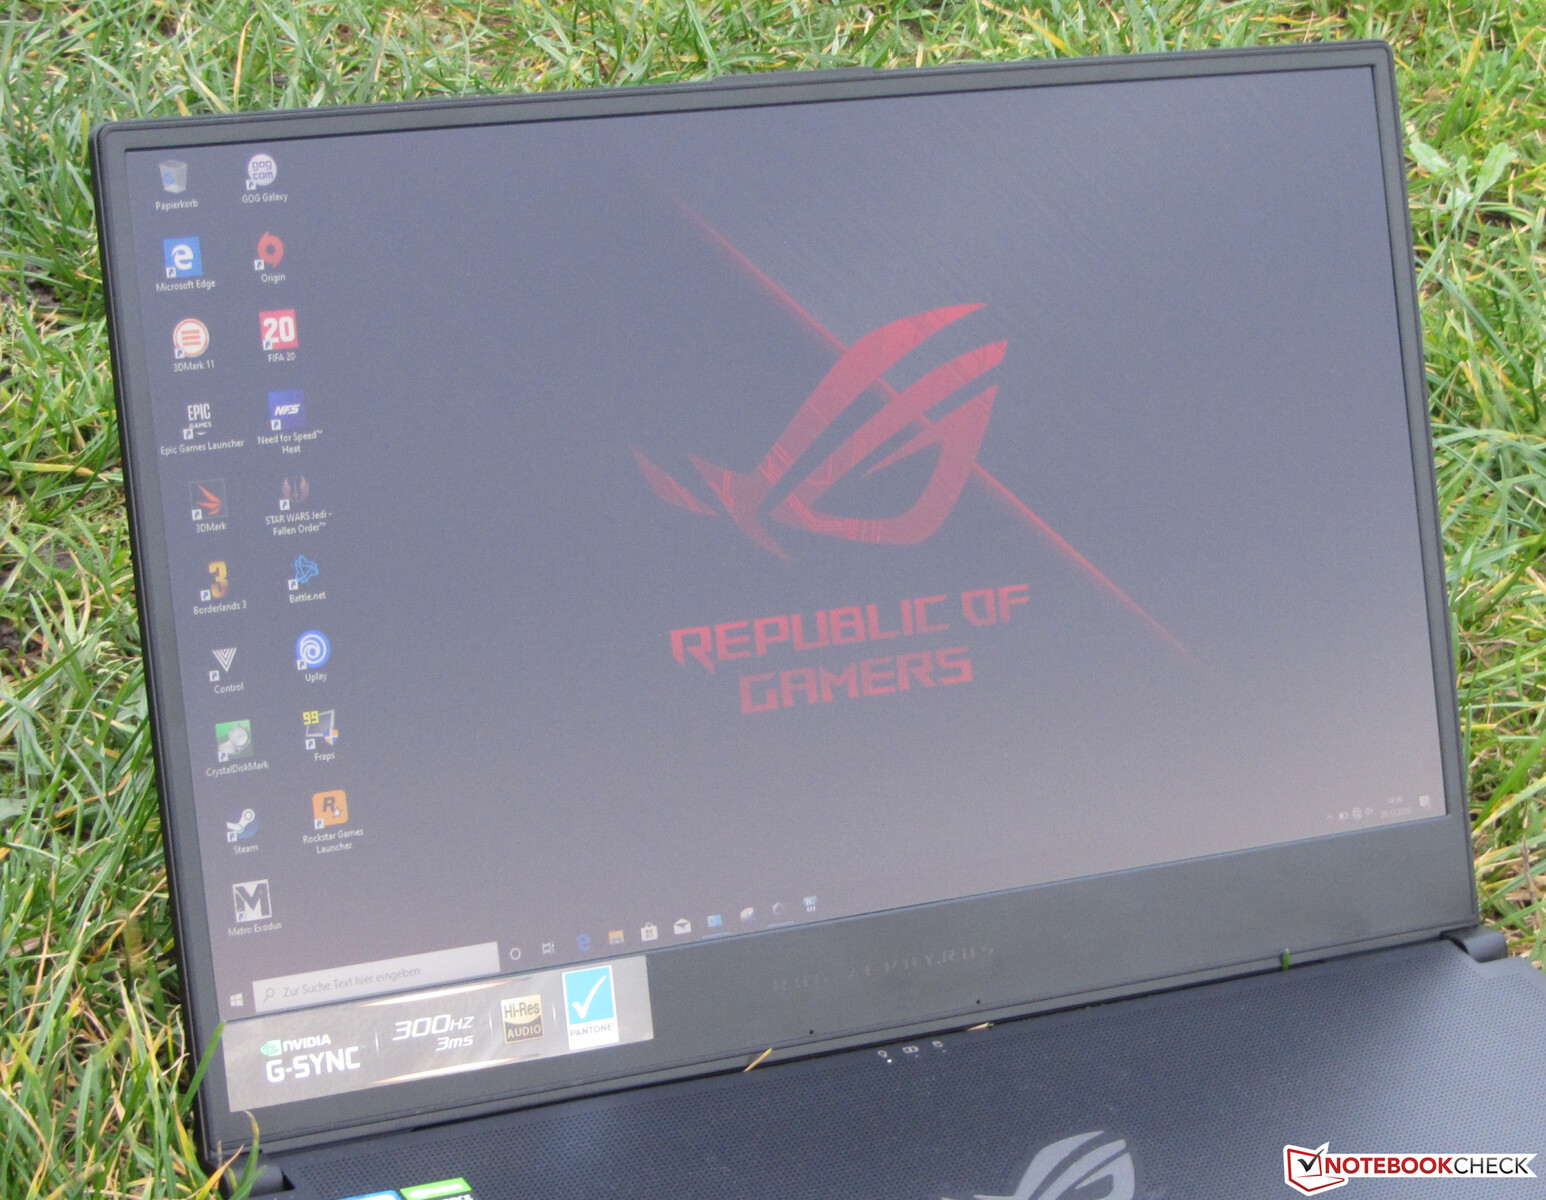
Ekran - 300 Hz IPS
Zephyrus'un 17.3 inçlik ekranı 1920x1080 piksel doğal çözünürlüğe sahiptir. Ekran iyi bir kontrast sağlarken (1.200: 1), parlaklık (276 cd / m²) fiyat için biraz fazla düşük. 300 cd / m²'nin üzerindeki bir değerin iyi olduğunu düşünüyoruz. Artıları: Ekranda PWM titriyor. Dahili 300 Hz panel kısa tepki sürelerinden memnun. Ayrıca Nvidia'nın G-Sync teknolojisini de destekler.
| |||||||||||||||||||||||||
Aydınlatma: 93 %
Batarya modunda parlaklık: 288 cd/m²
Kontrast: 1200:1 (Siyah: 0.24 cd/m²)
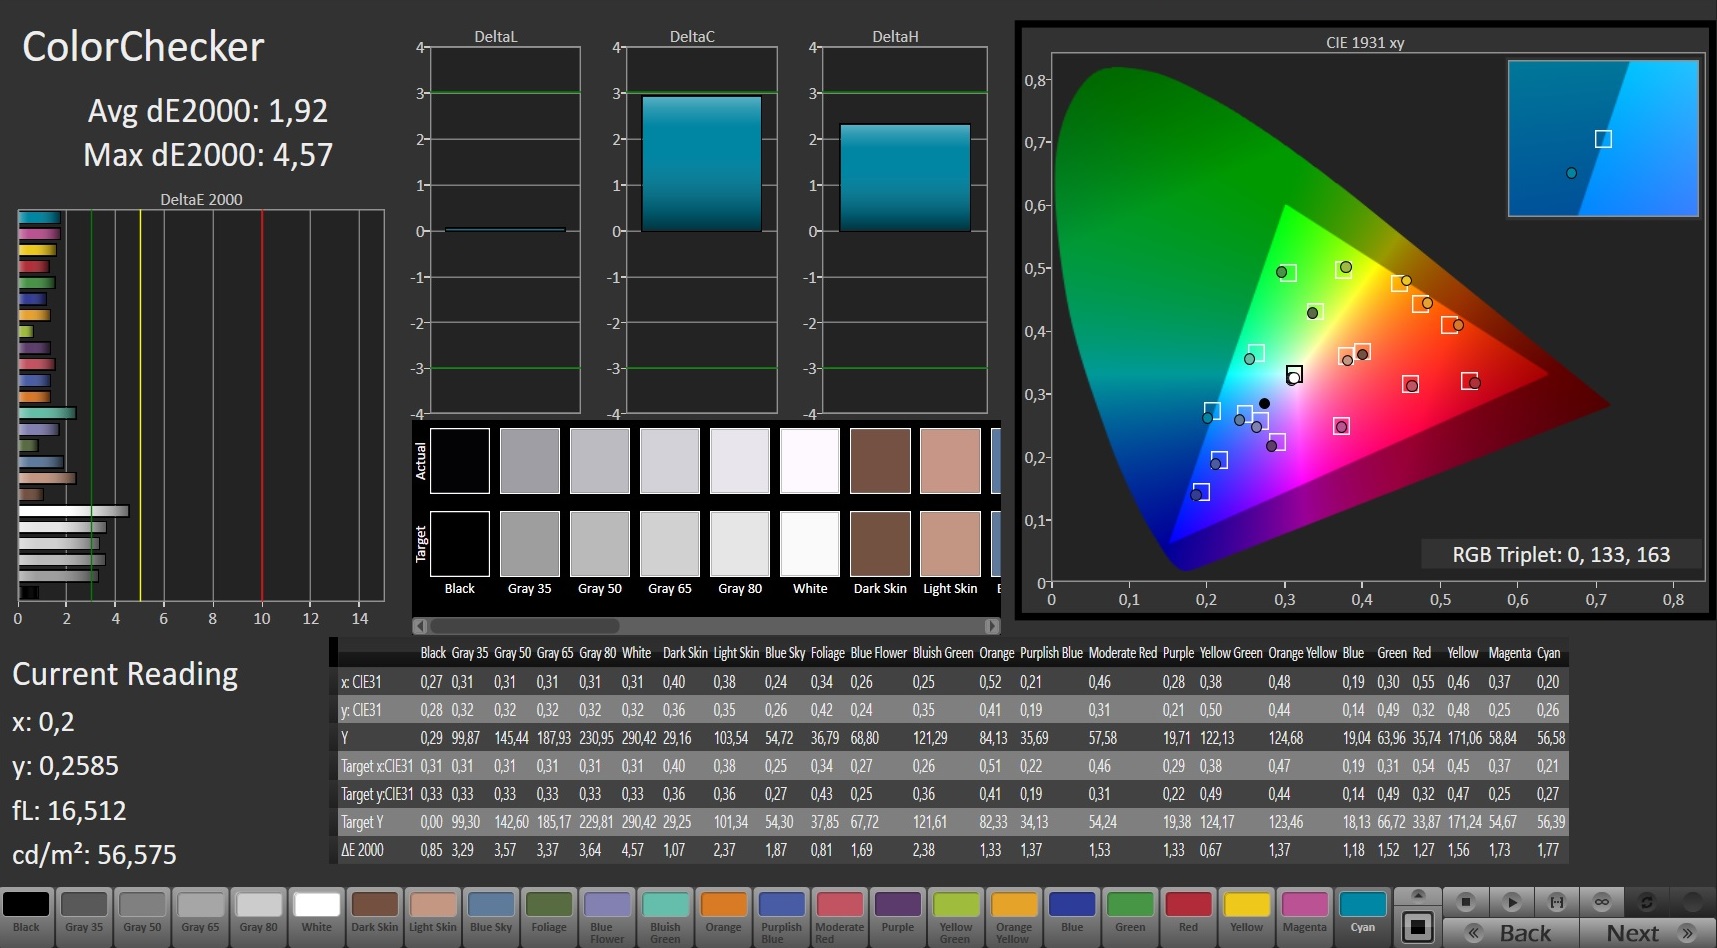
ΔE ColorChecker Calman: 1.92 | ∀{0.5-29.43 Ø4.72}
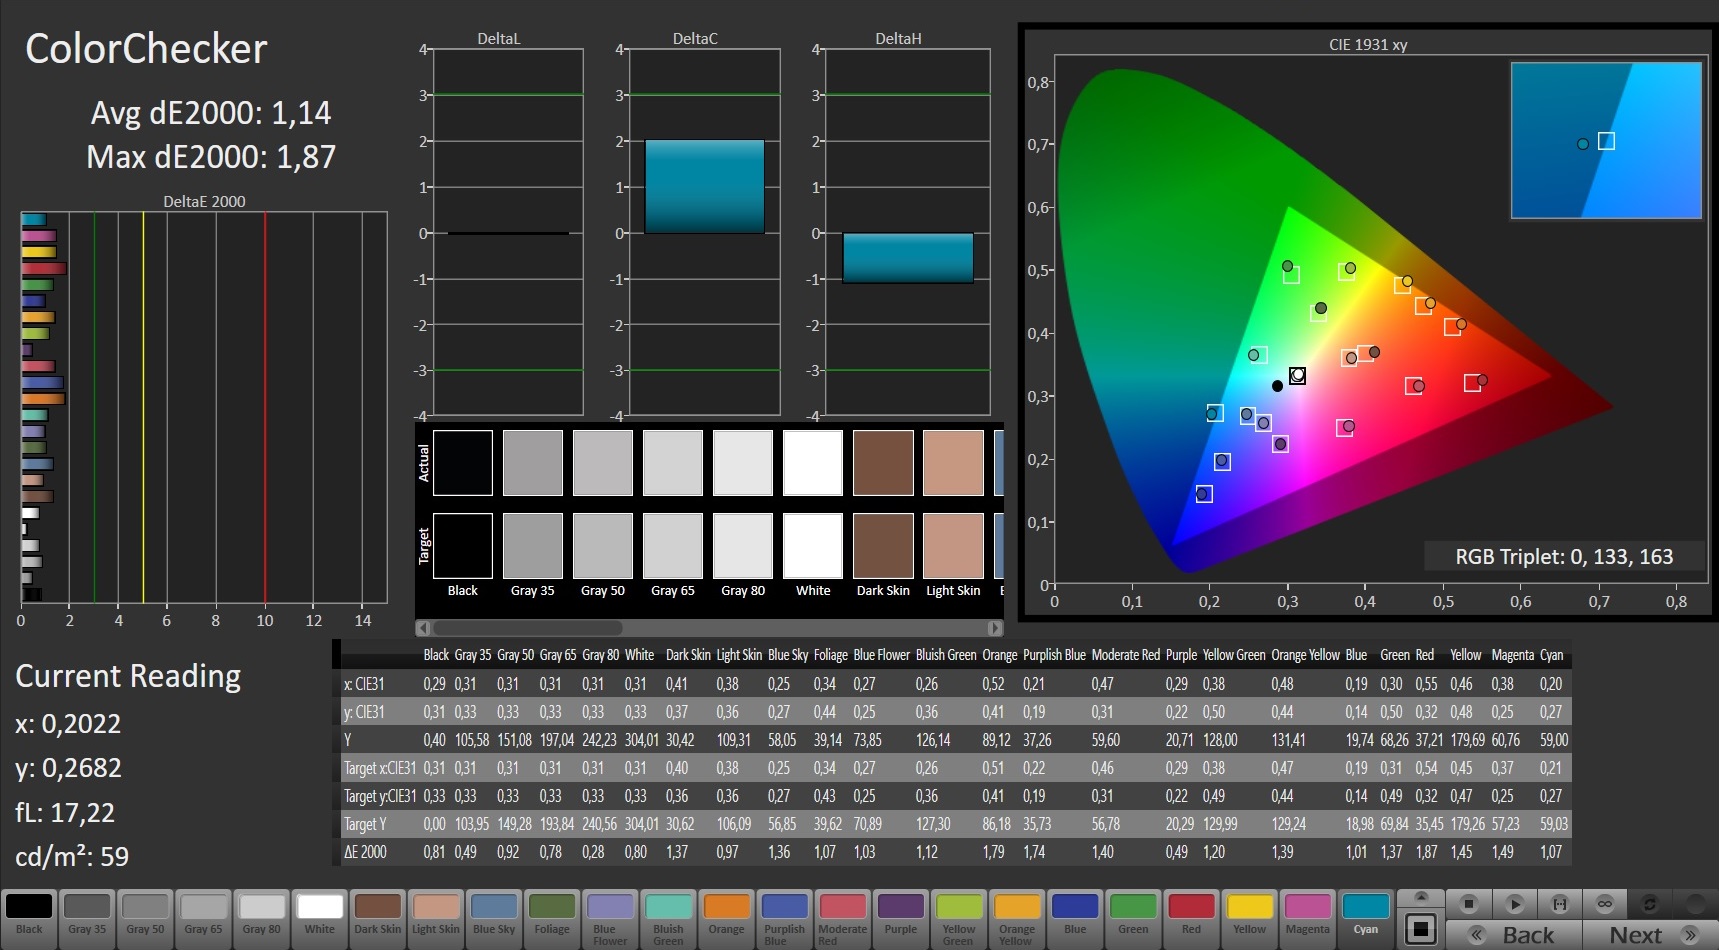
calibrated: 1.14
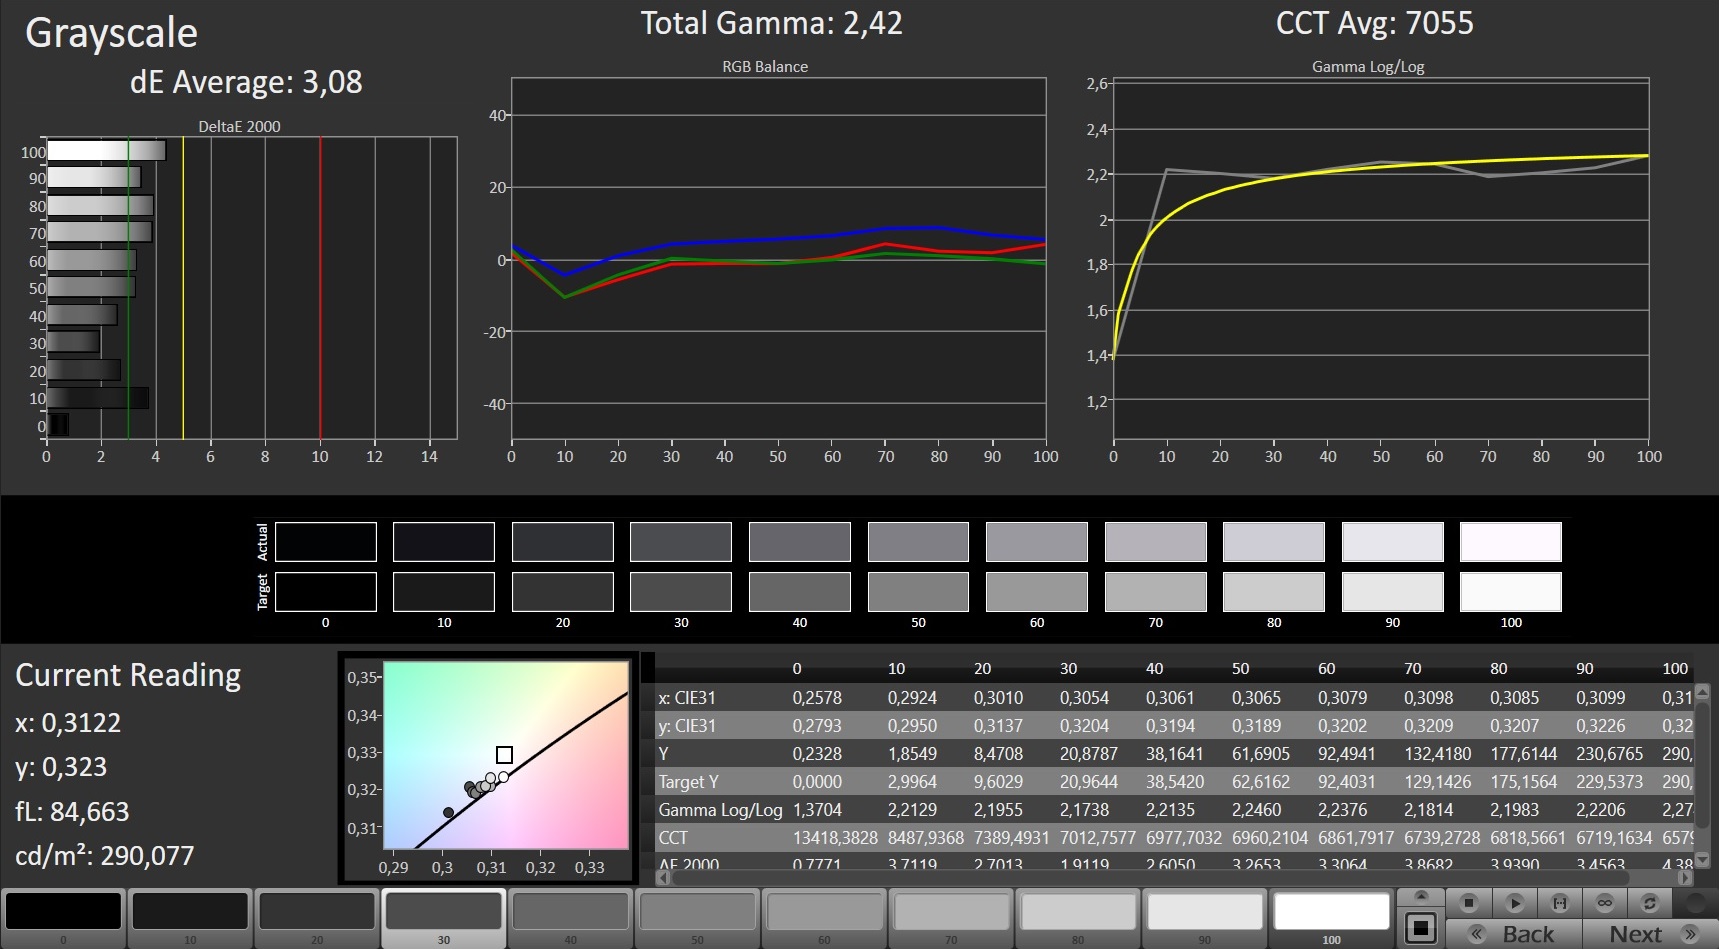
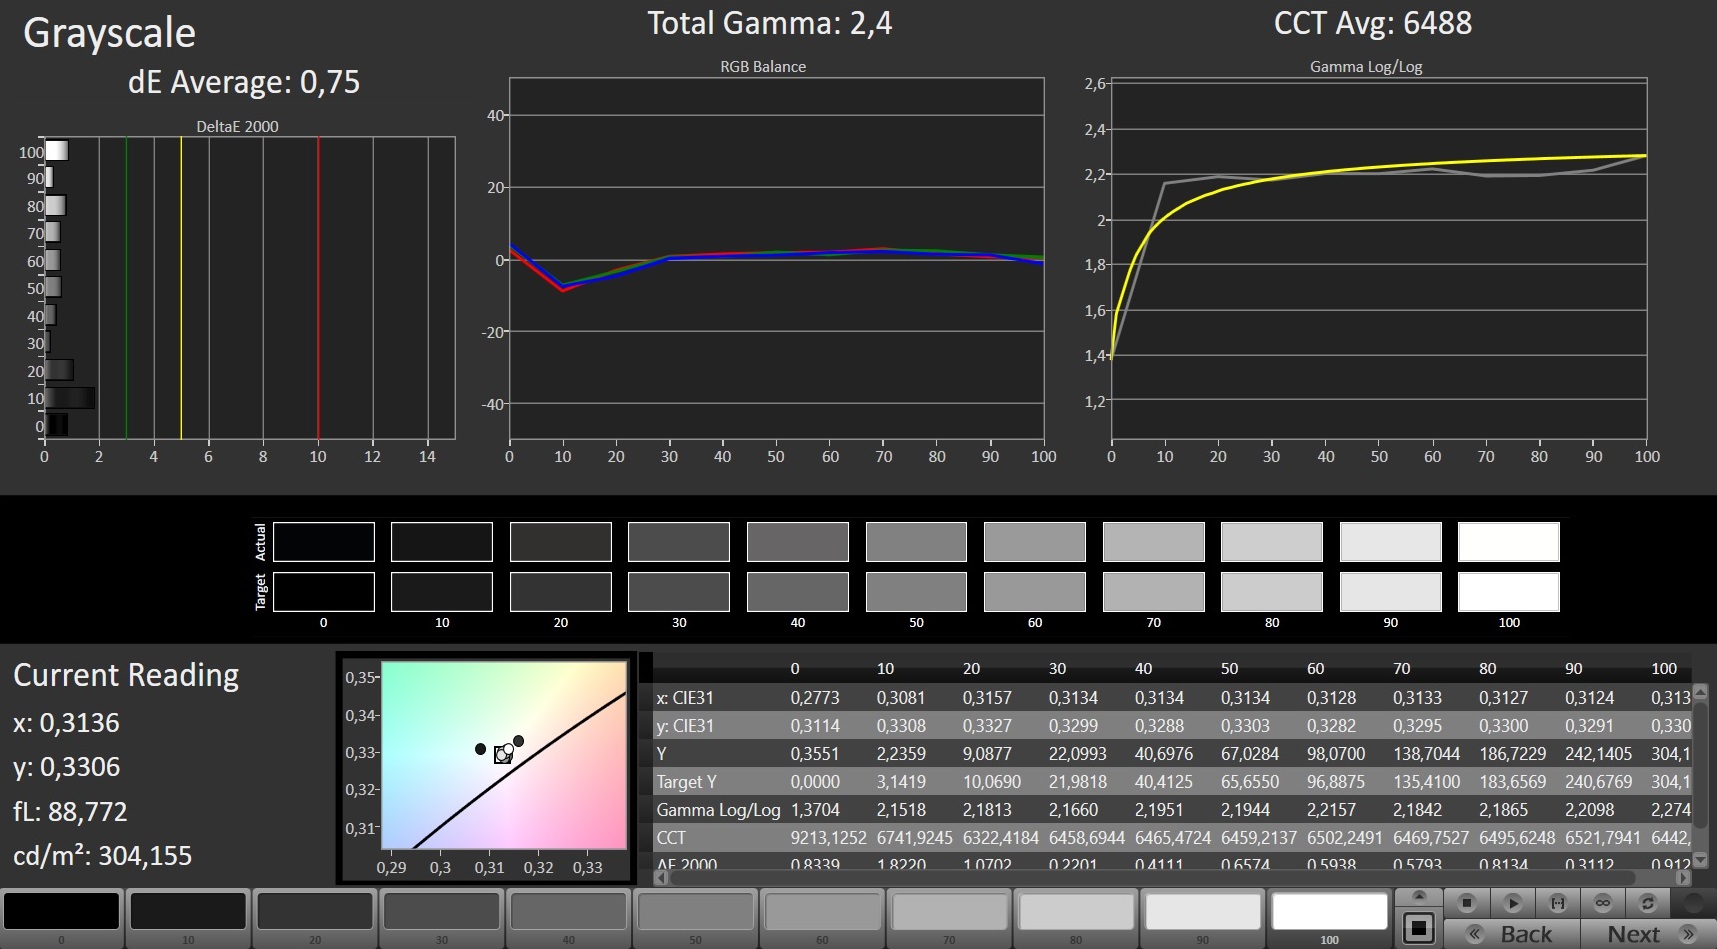
ΔE Greyscale Calman: 3.08 | ∀{0.09-98 Ø4.97}
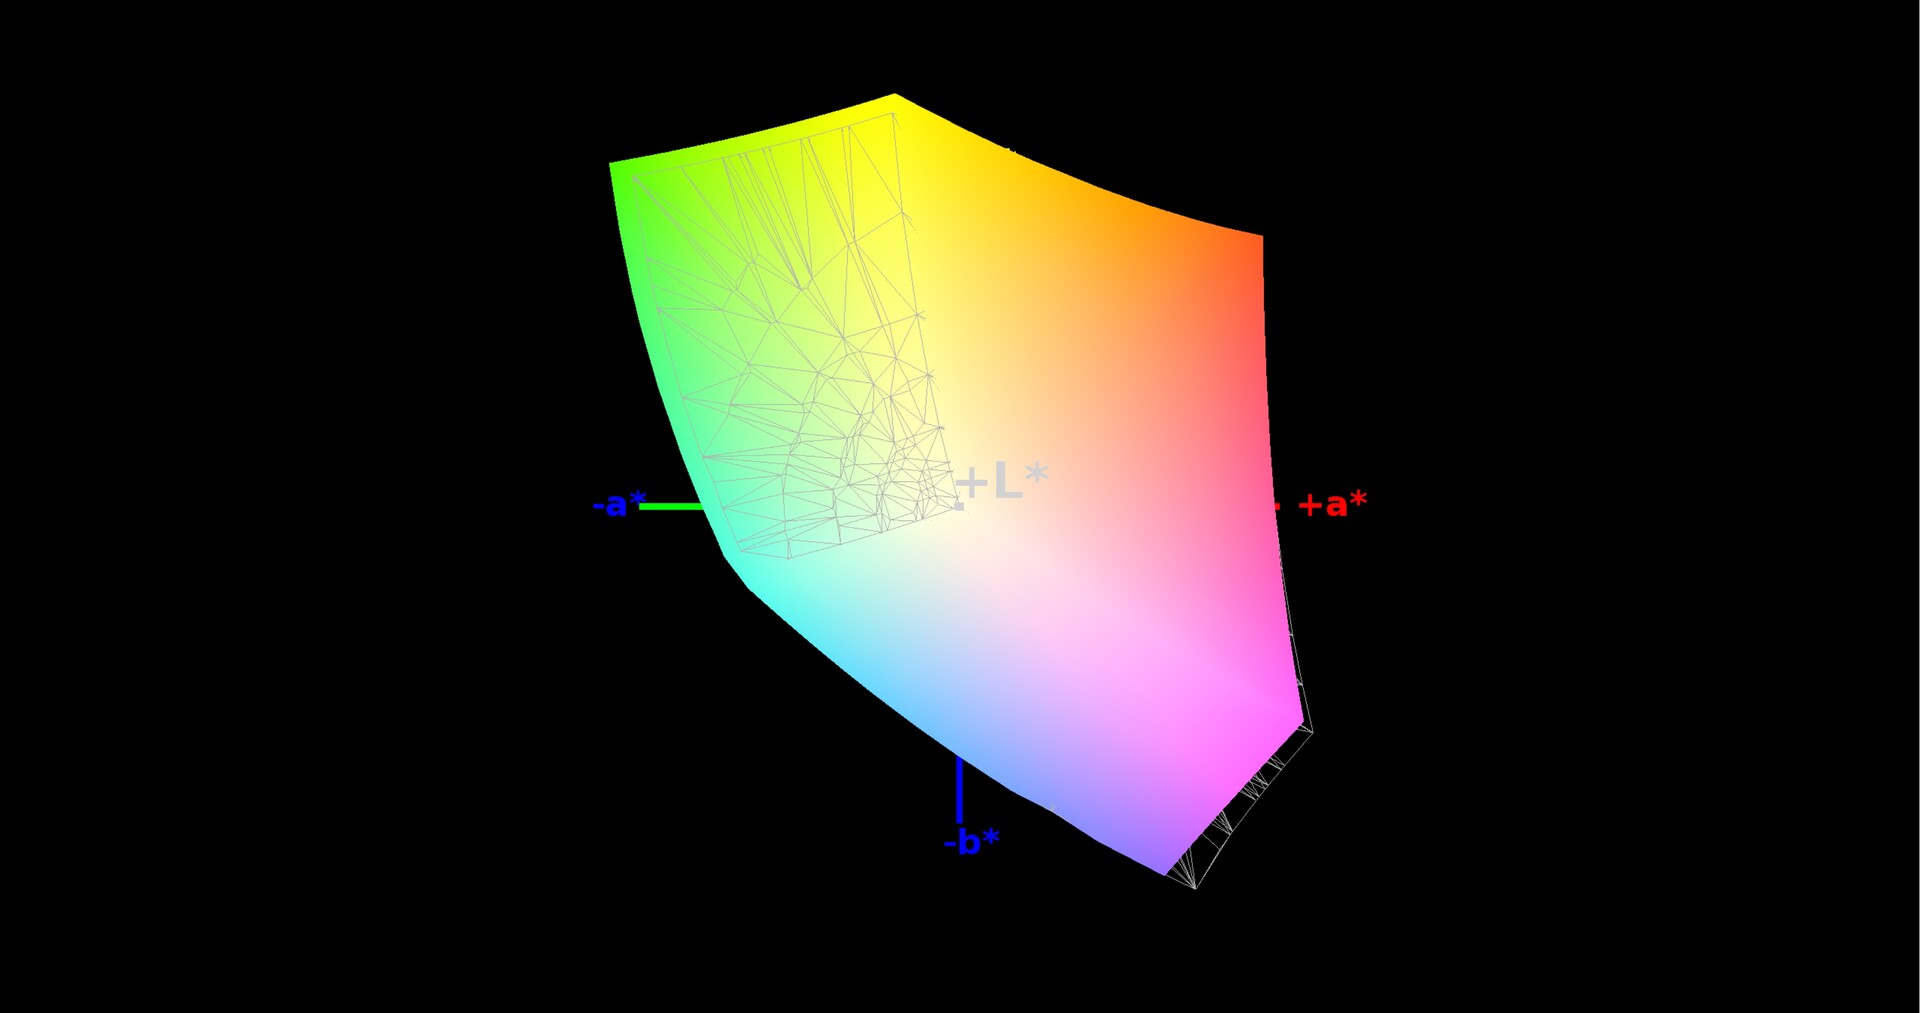
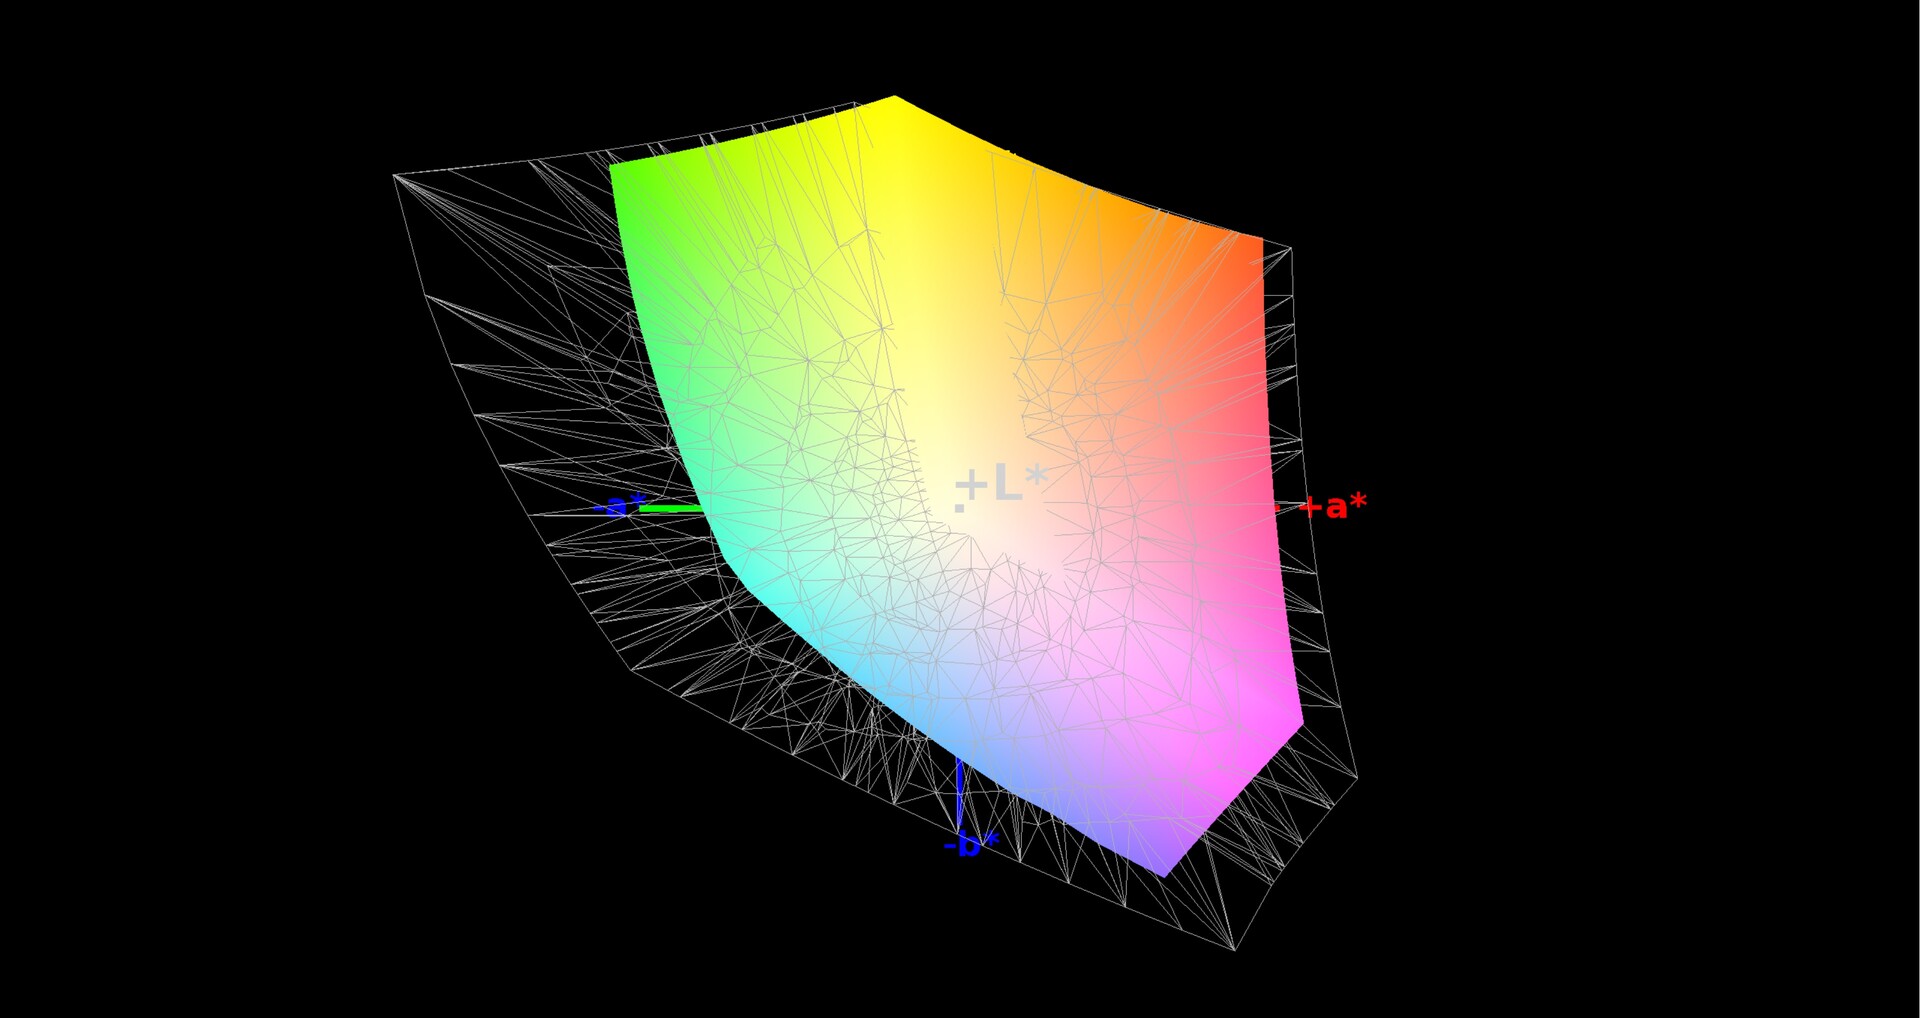
96% sRGB (Argyll 1.6.3 3D)
65% AdobeRGB 1998 (Argyll 1.6.3 3D)
72.3% AdobeRGB 1998 (Argyll 3D)
96.6% sRGB (Argyll 3D)
70% Display P3 (Argyll 3D)
Gamma: 2.42
CCT: 7055 K
| Asus ROG Zephyrus S GX701GXR AU Optronics B173HAN05.1, IPS, 1920x1080 | Asus Zephyrus S GX701GX B173HAN04.0 (AUO409D), IPS, 1920x1080 | Razer Blade Pro 17 RTX 2080 Max-Q AU Optronics B173HAN04.0, IPS, 1920x1080 | Gigabyte Aero 17 XA RP77 AU Optronics B173ZAN03.2, IPS, 3840x2160 | Alienware m17 P37E AU Optronics B173ZAN01.0, IPS, 3840x2160 | Lenovo Legion Y740-17ICH AU Optronics B173HAN03.2, IPS, 1920x1080 | |
|---|---|---|---|---|---|---|
| Display | -10% | -12% | 22% | 21% | -8% | |
| Display P3 Coverage (%) | 70 | 62.9 -10% | 60.6 -13% | 86.8 24% | 86.4 23% | 64 -9% |
| sRGB Coverage (%) | 96.6 | 87.8 -9% | 89 -8% | 100 4% | 99.9 3% | 90.4 -6% |
| AdobeRGB 1998 Coverage (%) | 72.3 | 63.9 -12% | 62.1 -14% | 99.5 38% | 99.1 37% | 64.8 -10% |
| Response Times | -28% | -24% | -507% | -402% | -124% | |
| Response Time Grey 50% / Grey 80% * (ms) | 5.6 ? | 7.2 ? -29% | 6.8 ? -21% | 45.6 ? -714% | 35.6 ? -536% | 15.6 ? -179% |
| Response Time Black / White * (ms) | 7.6 ? | 9.6 ? -26% | 9.6 ? -26% | 30.4 ? -300% | 28 ? -268% | 12.8 ? -68% |
| PWM Frequency (Hz) | ||||||
| Screen | -7% | -23% | -6% | -77% | -59% | |
| Brightness middle (cd/m²) | 288 | 288 0% | 299.3 4% | 667.3 132% | 357.9 24% | 299.1 4% |
| Brightness (cd/m²) | 276 | 287 4% | 294 7% | 633 129% | 347 26% | 273 -1% |
| Brightness Distribution (%) | 93 | 91 -2% | 94 1% | 90 -3% | 94 1% | 81 -13% |
| Black Level * (cd/m²) | 0.24 | 0.2 17% | 0.29 -21% | 0.46 -92% | 0.33 -38% | 0.27 -13% |
| Contrast (:1) | 1200 | 1440 20% | 1032 -14% | 1451 21% | 1085 -10% | 1108 -8% |
| Colorchecker dE 2000 * | 1.92 | 2.33 -21% | 2.55 -33% | 3.53 -84% | 6.57 -242% | 5.07 -164% |
| Colorchecker dE 2000 max. * | 4.57 | 5.34 -17% | 4.73 -4% | 6.88 -51% | 9.86 -116% | 10.55 -131% |
| Colorchecker dE 2000 calibrated * | 1.14 | 2.47 -117% | 2.9 -154% | 3.79 -232% | 6.74 -491% | 3.31 -190% |
| Greyscale dE 2000 * | 3.08 | 1.19 61% | 3.5 -14% | 0.9 71% | 4.3 -40% | 6.8 -121% |
| Gamma | 2.42 91% | 2.41 91% | 2.28 96% | 2.17 101% | 2.6 85% | 2.46 89% |
| CCT | 7055 92% | 6710 97% | 7101 92% | 6533 99% | 6403 102% | 7805 83% |
| Color Space (Percent of AdobeRGB 1998) (%) | 65 | 57 -12% | 57 -12% | 87.1 34% | 88.4 36% | 58.5 -10% |
| Color Space (Percent of sRGB) (%) | 96 | 88 -8% | 88.7 -8% | 100 4% | 100 4% | 89.9 -6% |
| Toplam Ortalama (Program / Ayarlar) | -15% /
-10% | -20% /
-21% | -164% /
-64% | -153% /
-99% | -64% /
-58% |
* ... daha küçük daha iyidir
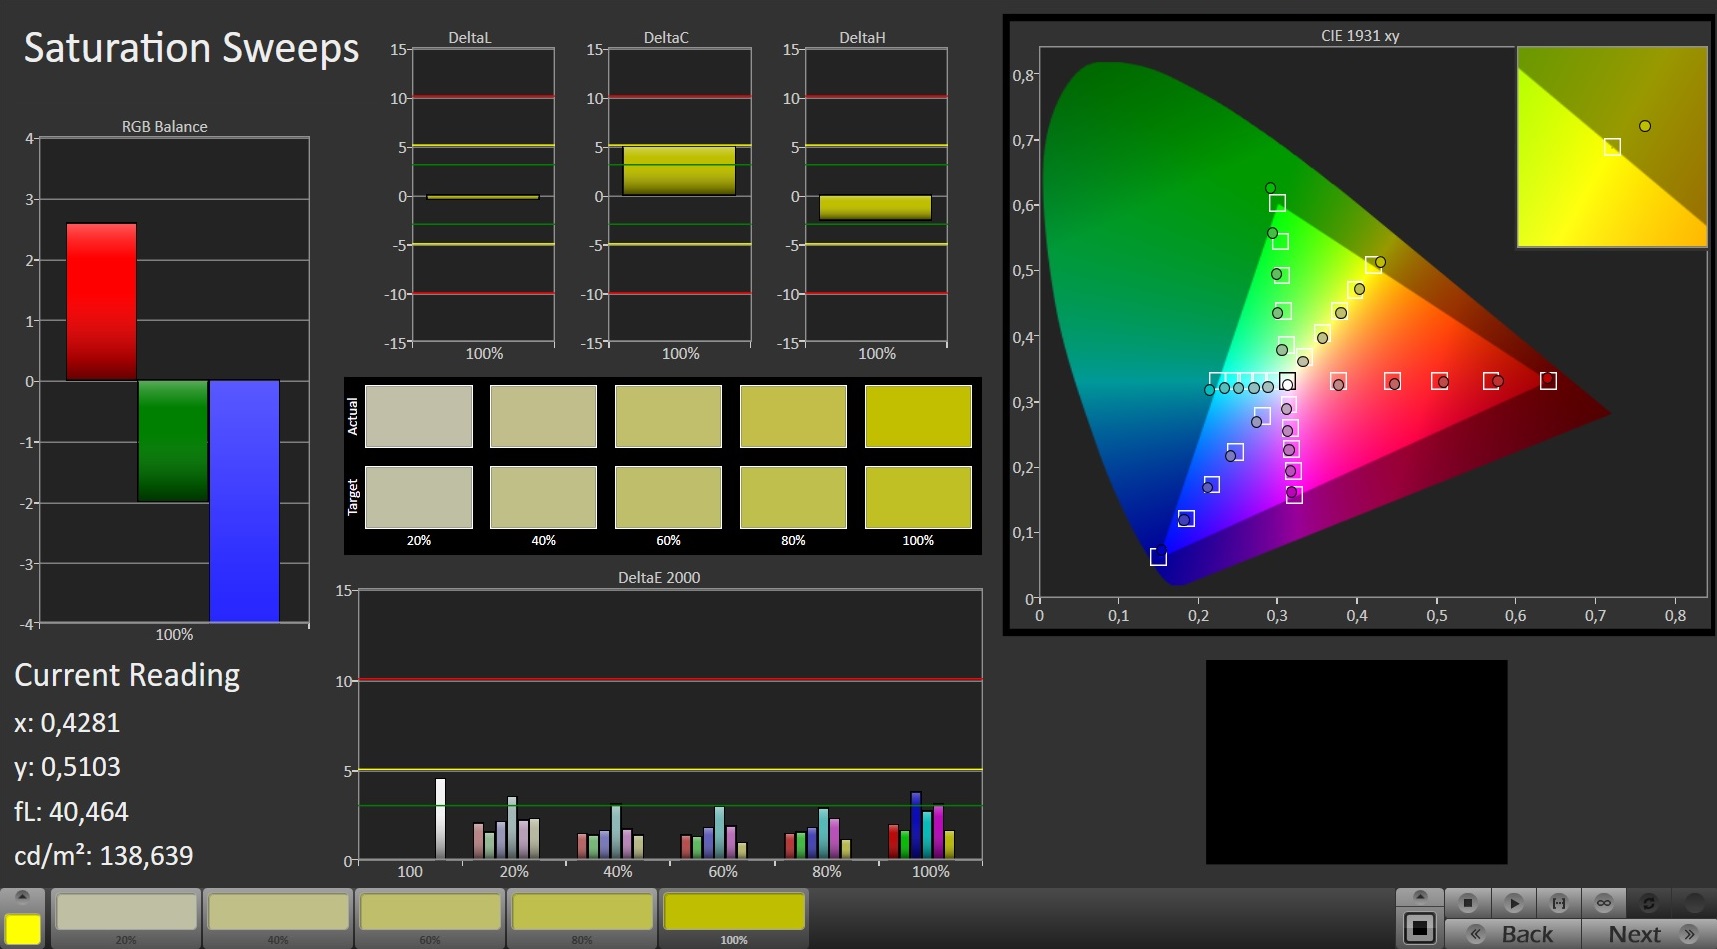
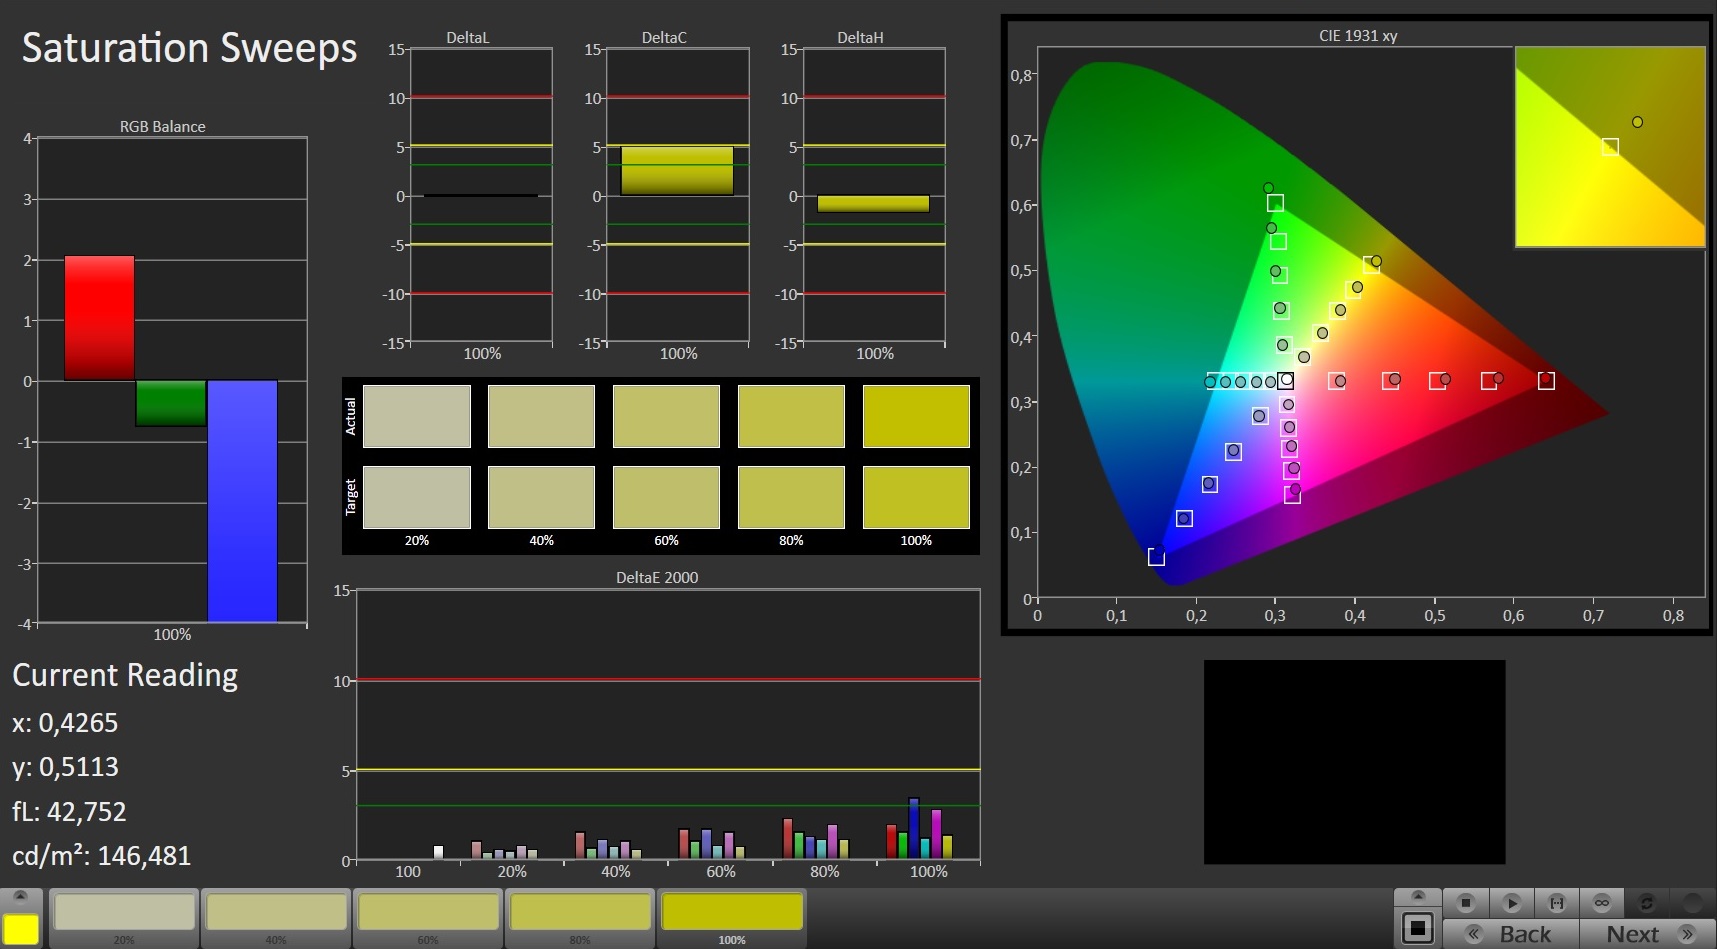
Ekran, çok doğal renkler sağlayan bir X-Rite Pantone sertifikasına sahiptir. Bu nedenle, zaten kutudan iyi bir renk üretimi gösterir. 1.92 DeltaE 2000 renk sapması ile hedef (3'ten küçük DeltaE) karşılanır. Kalibrasyon, renk üretimini daha da geliştirmek için kullanılabilir. Bu şekilde, renk sapması 1,14 değerine düşer ve gri tonlar da çok daha dengeli bir şekilde gösterilir. AdobeRGB (% 65) ve sRGB (% 96) renk uzayları tam olarak eşlenmemiştir.
Yanıt Sürelerini Görüntüle
| ↔ Tepki Süresi Siyahtan Beyaza | ||
|---|---|---|
| 7.6 ms ... yükseliş ↗ ve sonbahar↘ birleşimi | ↗ 3.4 ms yükseliş | 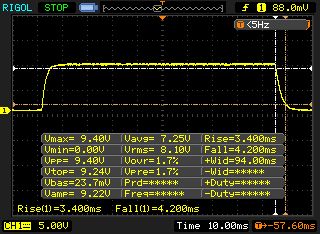 |
| ↘ 4.2 ms sonbahar | ||
| Ekran, testlerimizde çok hızlı yanıt oranları gösteriyor ve hızlı oyun oynamaya çok uygun olmalı. Karşılaştırıldığında, test edilen tüm cihazlar 0.1 (minimum) ile 240 (maksimum) ms arasında değişir. » Tüm cihazların 22 %'si daha iyi. Bu, ölçülen yanıt süresinin test edilen tüm cihazların ortalamasından (19.8 ms) daha iyi olduğu anlamına gelir. | ||
| ↔ Tepki Süresi %50 Griden %80 Griye | ||
| 5.6 ms ... yükseliş ↗ ve sonbahar↘ birleşimi | ↗ 2.4 ms yükseliş | 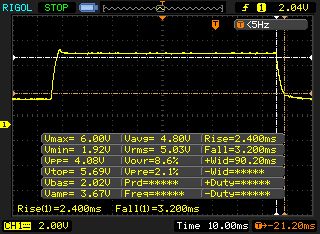 |
| ↘ 3.2 ms sonbahar | ||
| Ekran, testlerimizde çok hızlı yanıt oranları gösteriyor ve hızlı oyun oynamaya çok uygun olmalı. Karşılaştırıldığında, test edilen tüm cihazlar 0.165 (minimum) ile 636 (maksimum) ms arasında değişir. » Tüm cihazların 18 %'si daha iyi. Bu, ölçülen yanıt süresinin test edilen tüm cihazların ortalamasından (31 ms) daha iyi olduğu anlamına gelir. | ||
Ekran Titremesi / PWM (Darbe Genişliği Modülasyonu)
| Ekran titriyor / PWM algılanmadı | 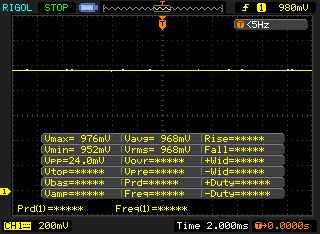 | ||
Karşılaştırıldığında: Test edilen tüm cihazların %52 %'si ekranı karartmak için PWM kullanmıyor. PWM tespit edilirse, ortalama 7753 (minimum: 5 - maksimum: 343500) Hz ölçüldü. | |||
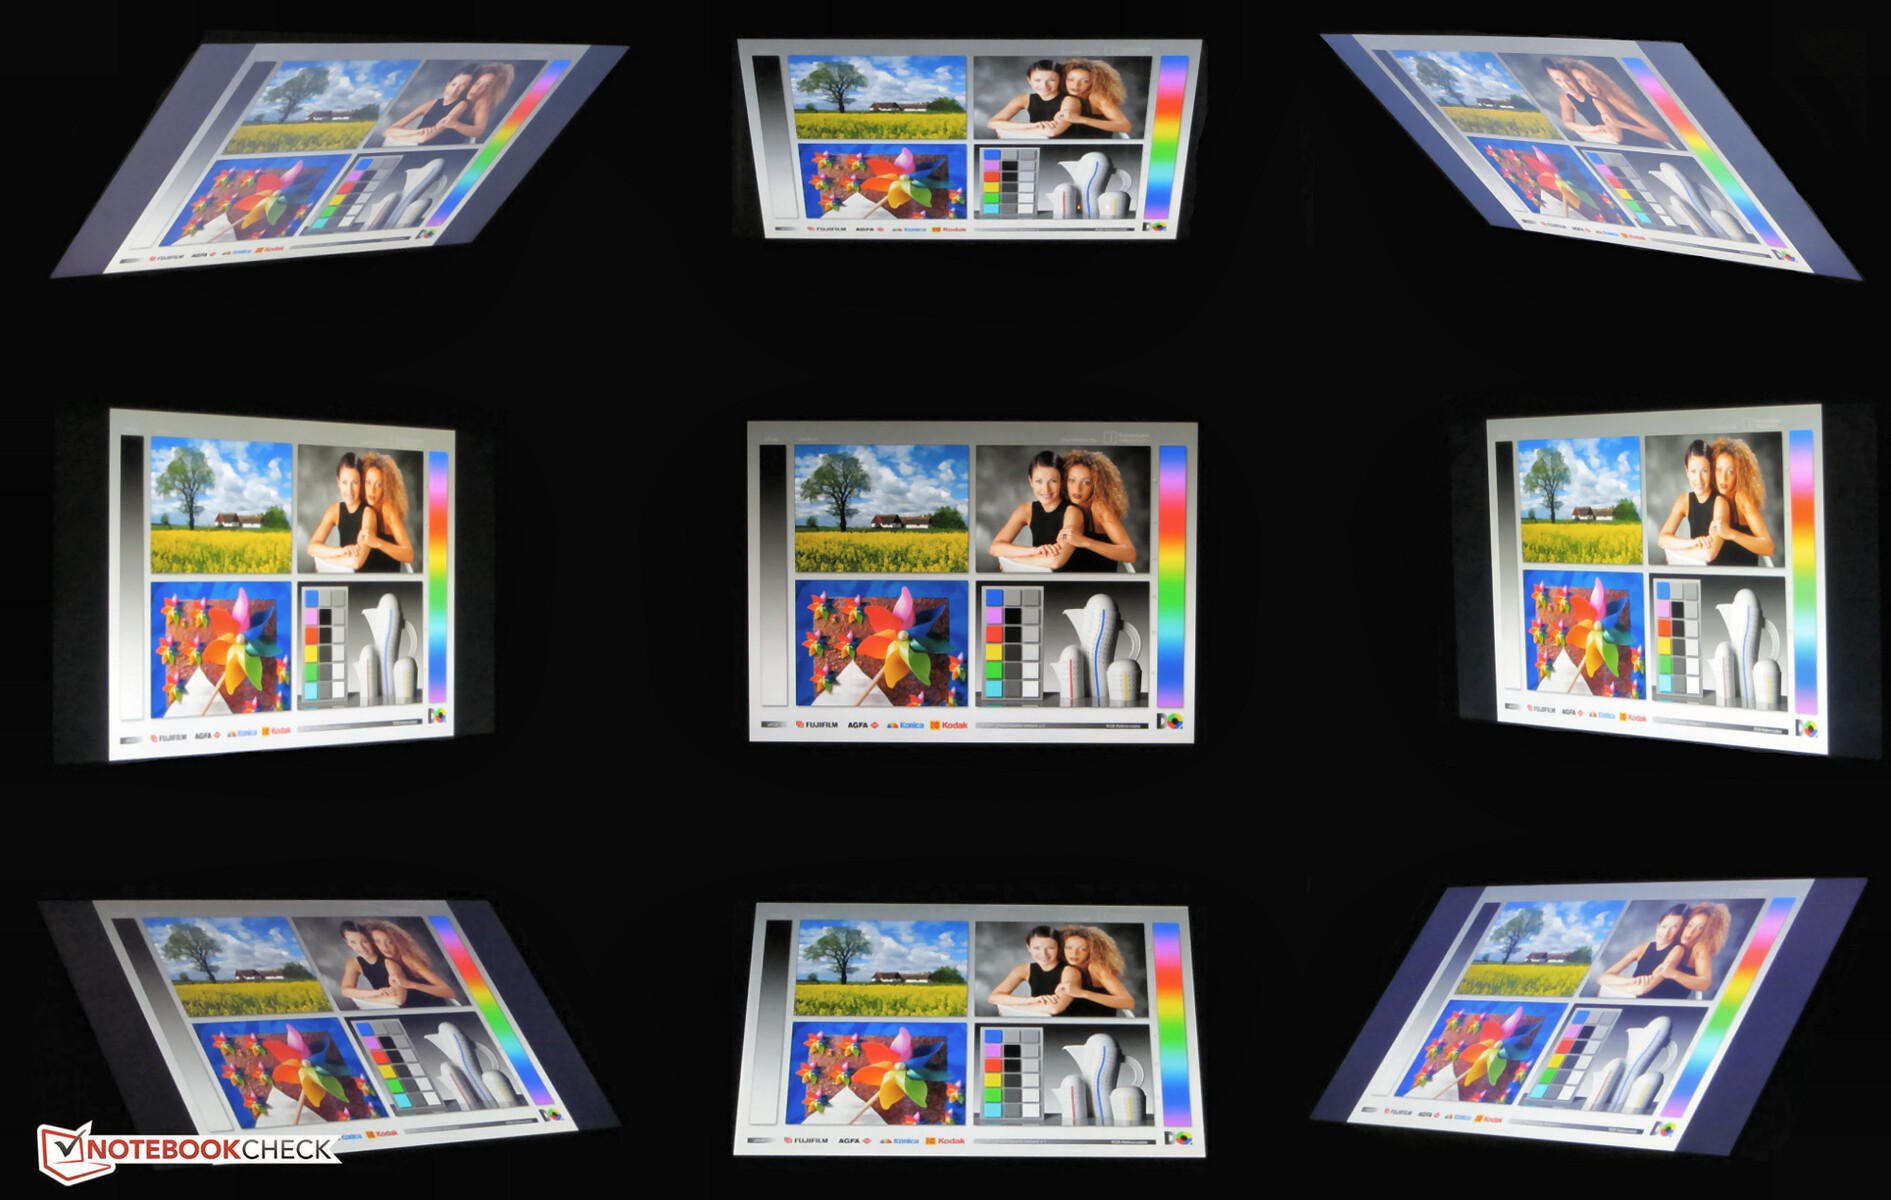
Asus dizüstü bilgisayar, görüş açısı açısından kararlı bir IPS panel ile donatılmıştır. Bu nedenle, ekran herhangi bir konumdan okunabilir. Dışarıda, güneş çok parlak parlamadığında ekran okunabilir.

Performans - Zephyrus S üst sınıf donanımla birlikte gelir
Zephyrus S ile Asus, en yeni bilgisayar oyunlarını sorunsuz bir şekilde çalıştırabilen 17,3 inçlik ince bir oyun dizüstü bilgisayarı sunuyor. Test cihazımız için şu anda yaklaşık 3.500 Euro (~ 3.882 $) öksürmeniz gerekecek. Diğer yapılandırma çeşitleri de mevcuttur ve fiyatlar 3.080 Euro'dan başlar (~ 3.416 $).
Test koşulları
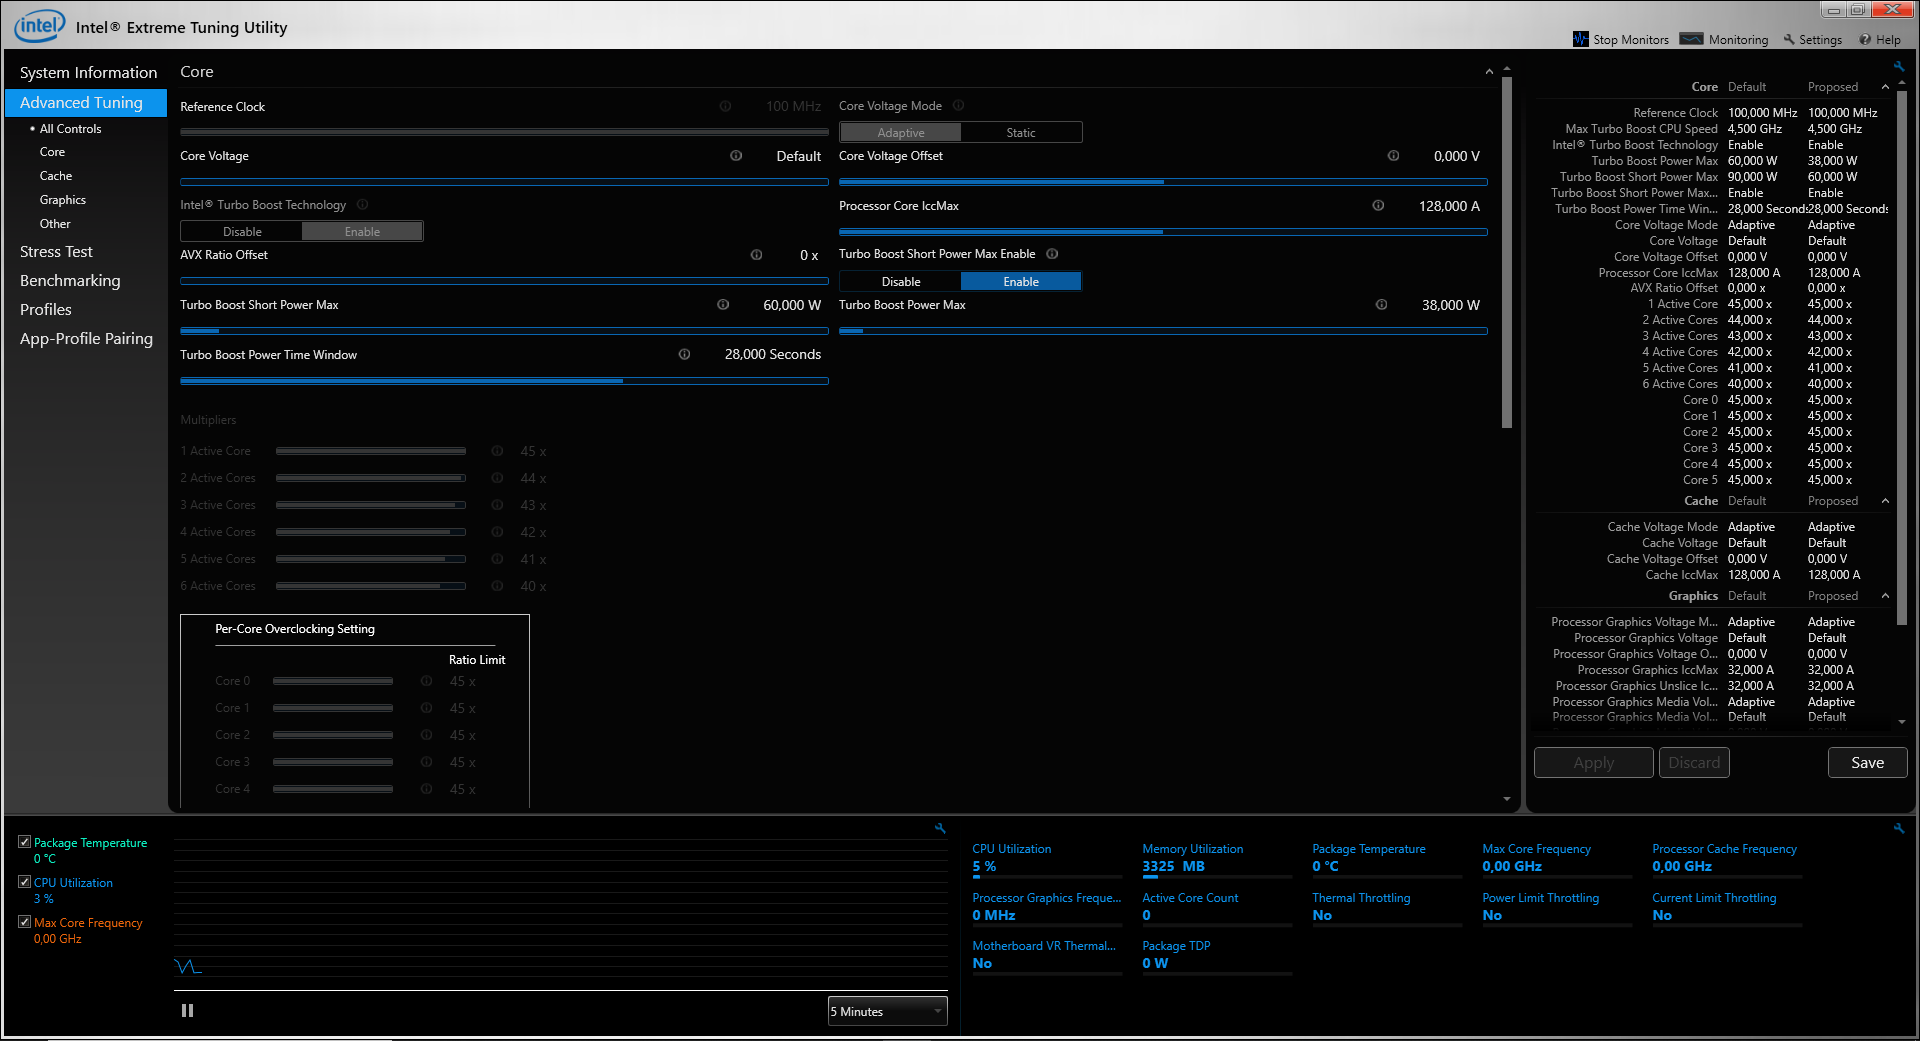
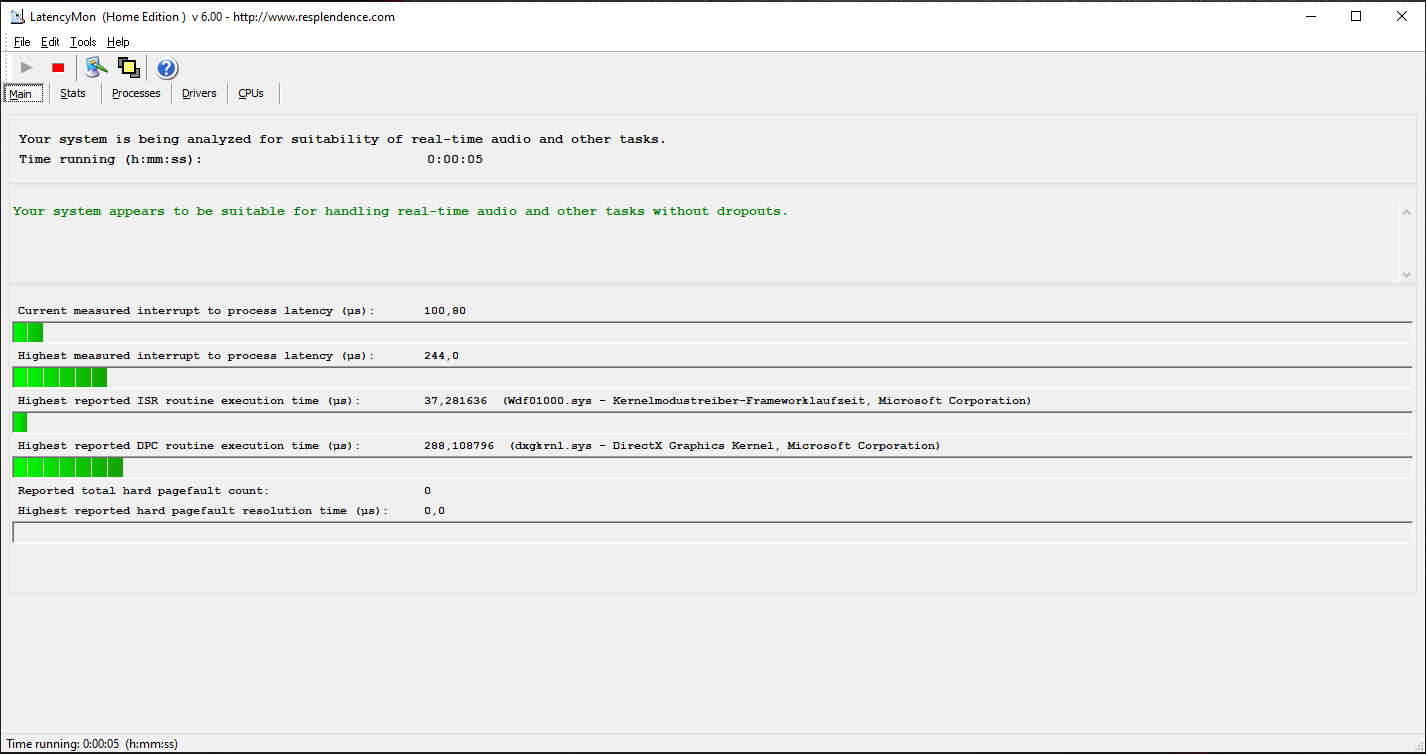
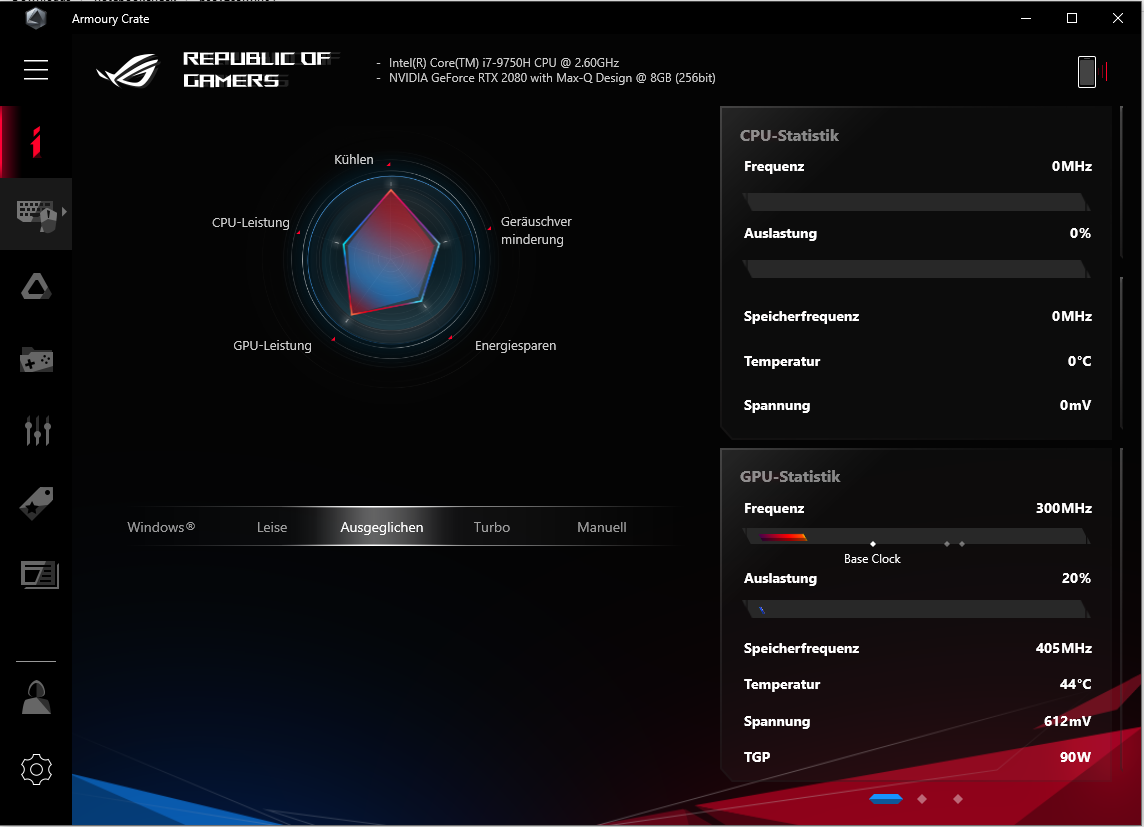
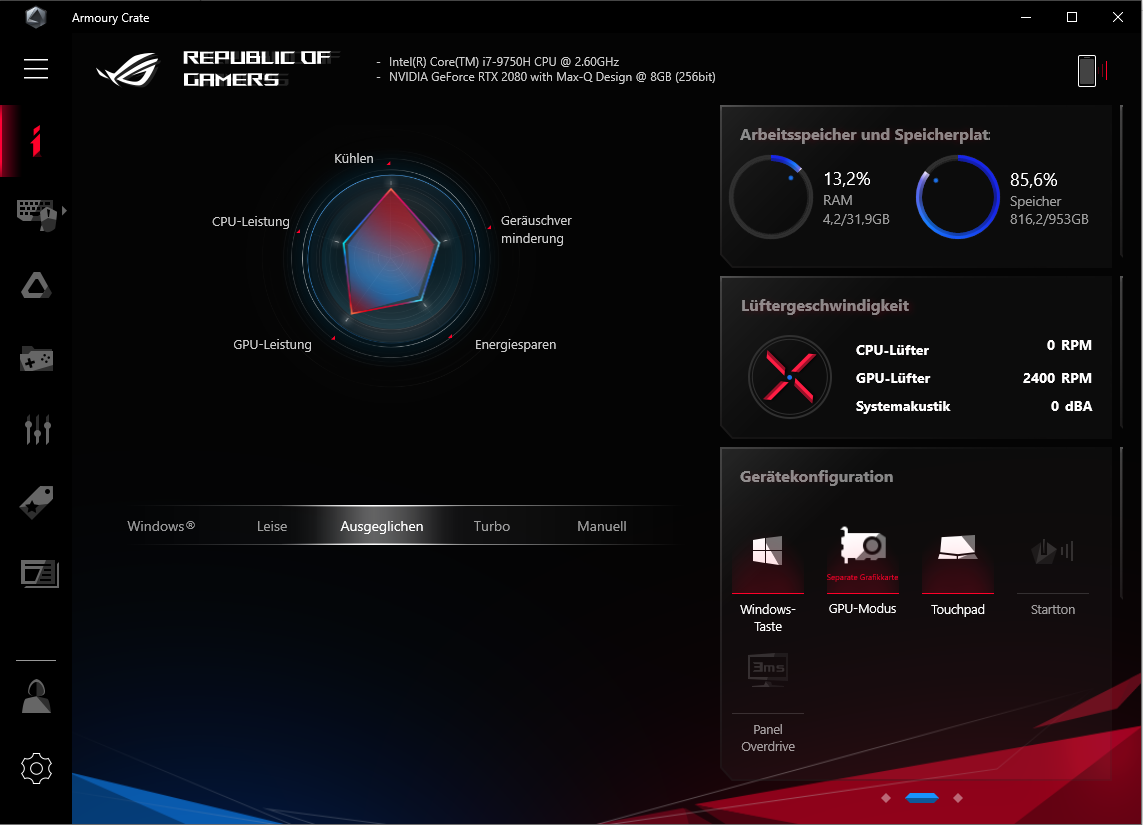
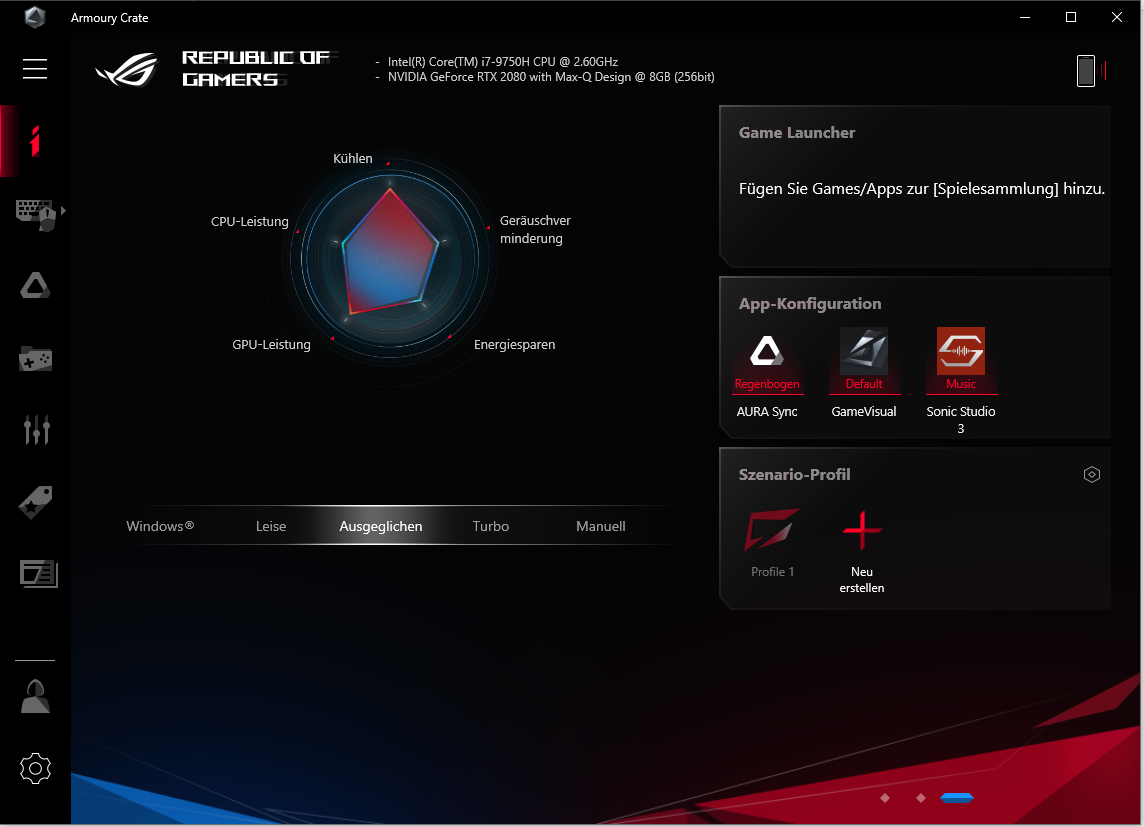
Önceden kurulu Armory Crate yazılımı içinde "Dengeli" enerji profilini seçtik (istisna: Pil testleri için Windows güç şemasını kullandık). Ayrıca, aktif bir "Turbo" moduyla bazı testler yaptık. Sonuçlar karşılaştırma tablolarında bulunabilir. Ayrıca, entegre GPU devre dışı bırakıldı. İkincisi, bir fare tıklaması ve daha sonra sistem yeniden başlatılmasıyla açılıp kapatılabilir.
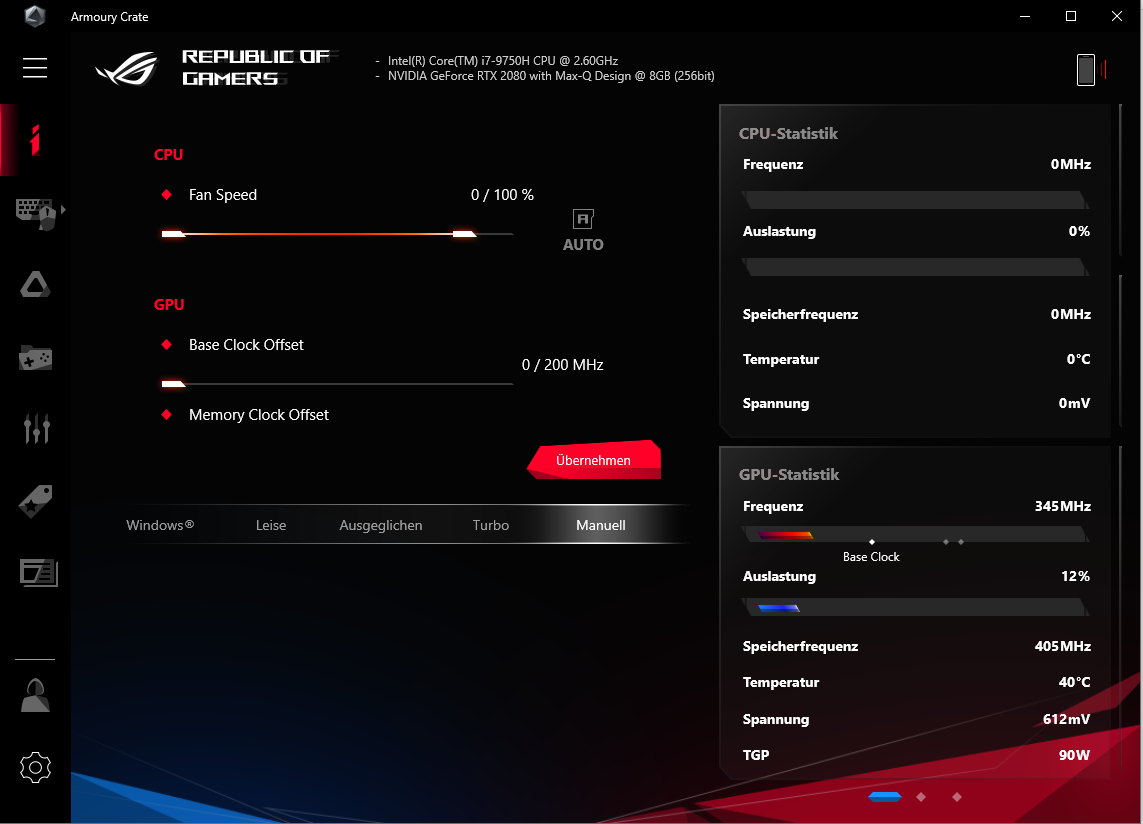
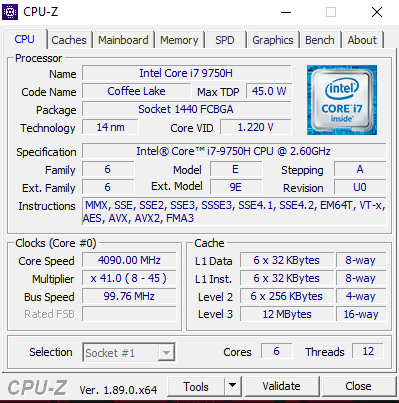
İşlemci
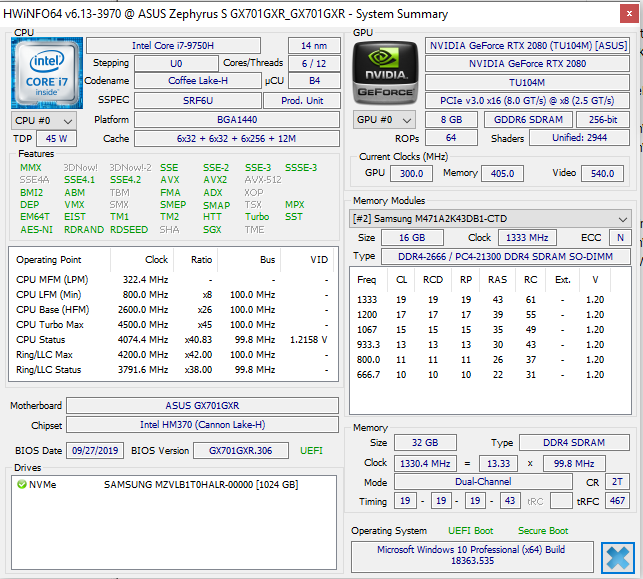
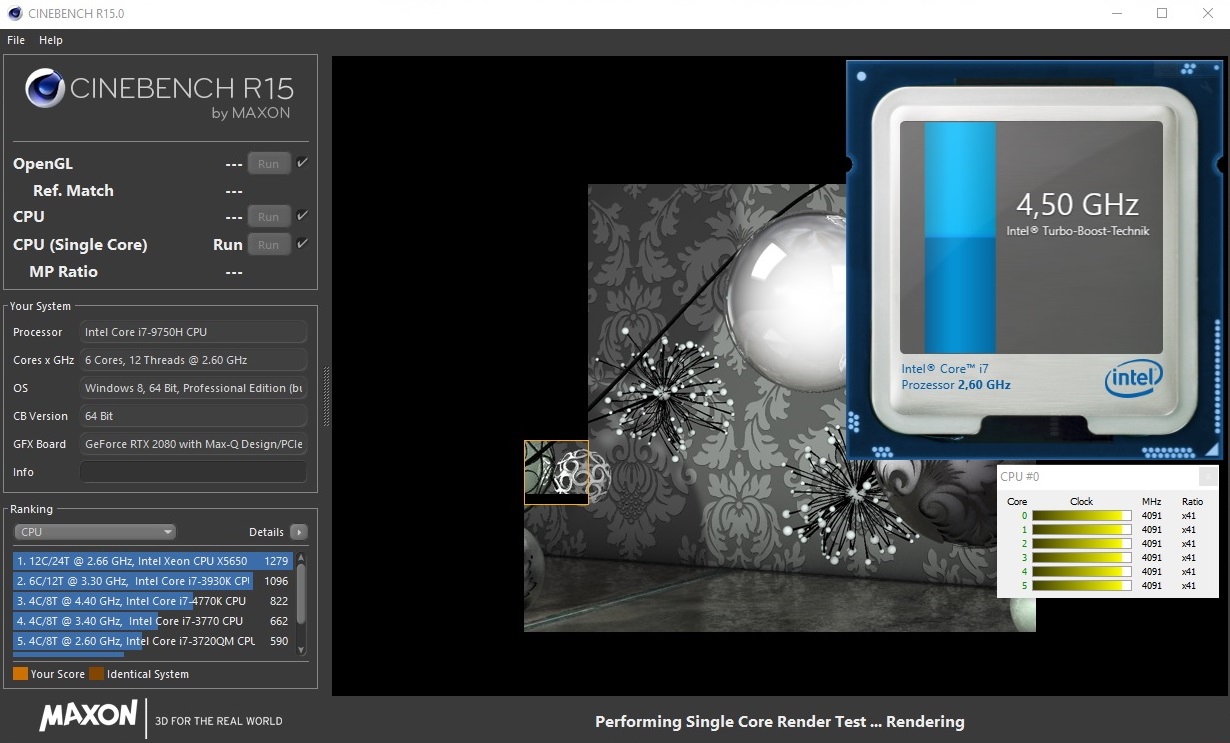
Dizüstü bilgisayarda yerleşik bir Core i7-9750H altı çekirdekli işlemci (Coffee Lake Refresh) var. CPU 2,6 GHz temel hızında çalışır. Turbo Boost, saat hızını 4 GHz (altı çekirdek), 4.1 GHz (beş çekirdek), 4.2 GHz (dört çekirdek), 4.3 GHz (üç çekirdek), 4.4 GHz (iki çekirdek) ve 4.5 GHz'e (bir çekirdek) yükseltebilir, sırasıyla. İşlemci, Cinebench R15 benchmark testinin çok yönlü testini 2.6 ila 4 GHz'de çalıştırır (Turbo modu: 3.7 ila 4 GHz). Tek iplik testi 4 ila 4,5 GHz'de gerçekleştirilir (Turbo modunda aynı saat hızlarına ulaşılır). Pil gücünde, çalışma hızı sabit bir 2.3 GHz'de oturur.
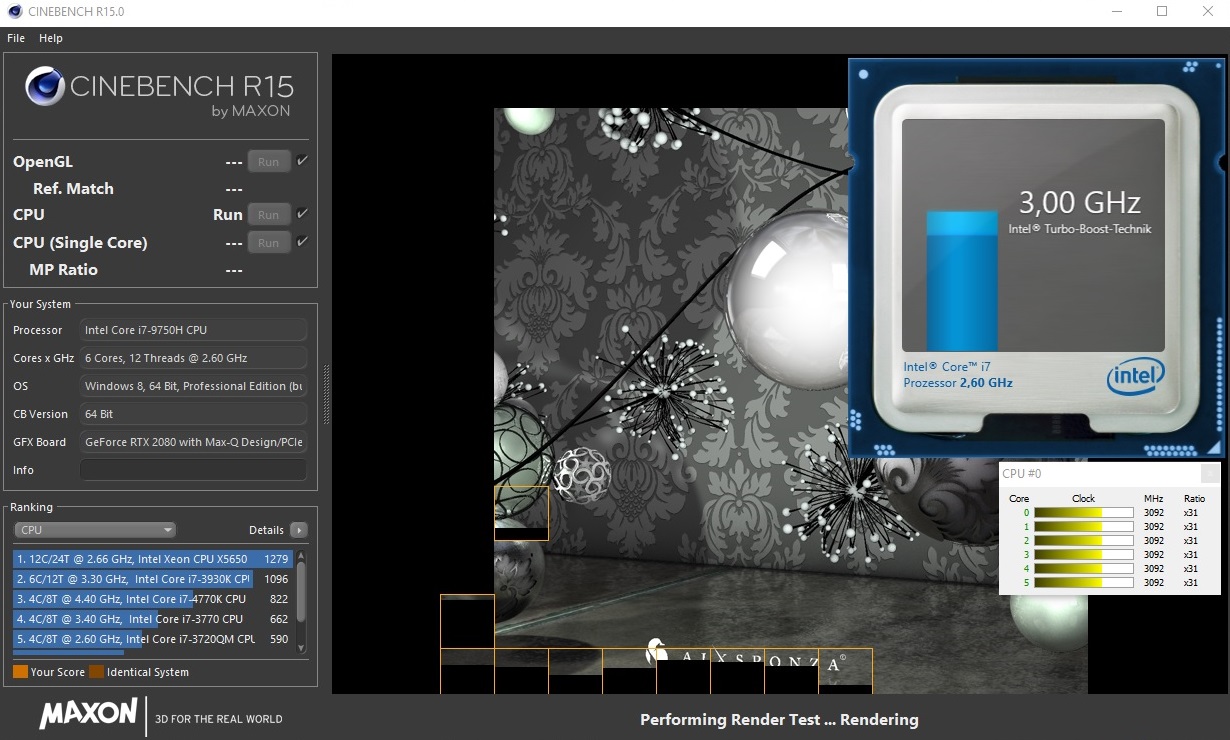
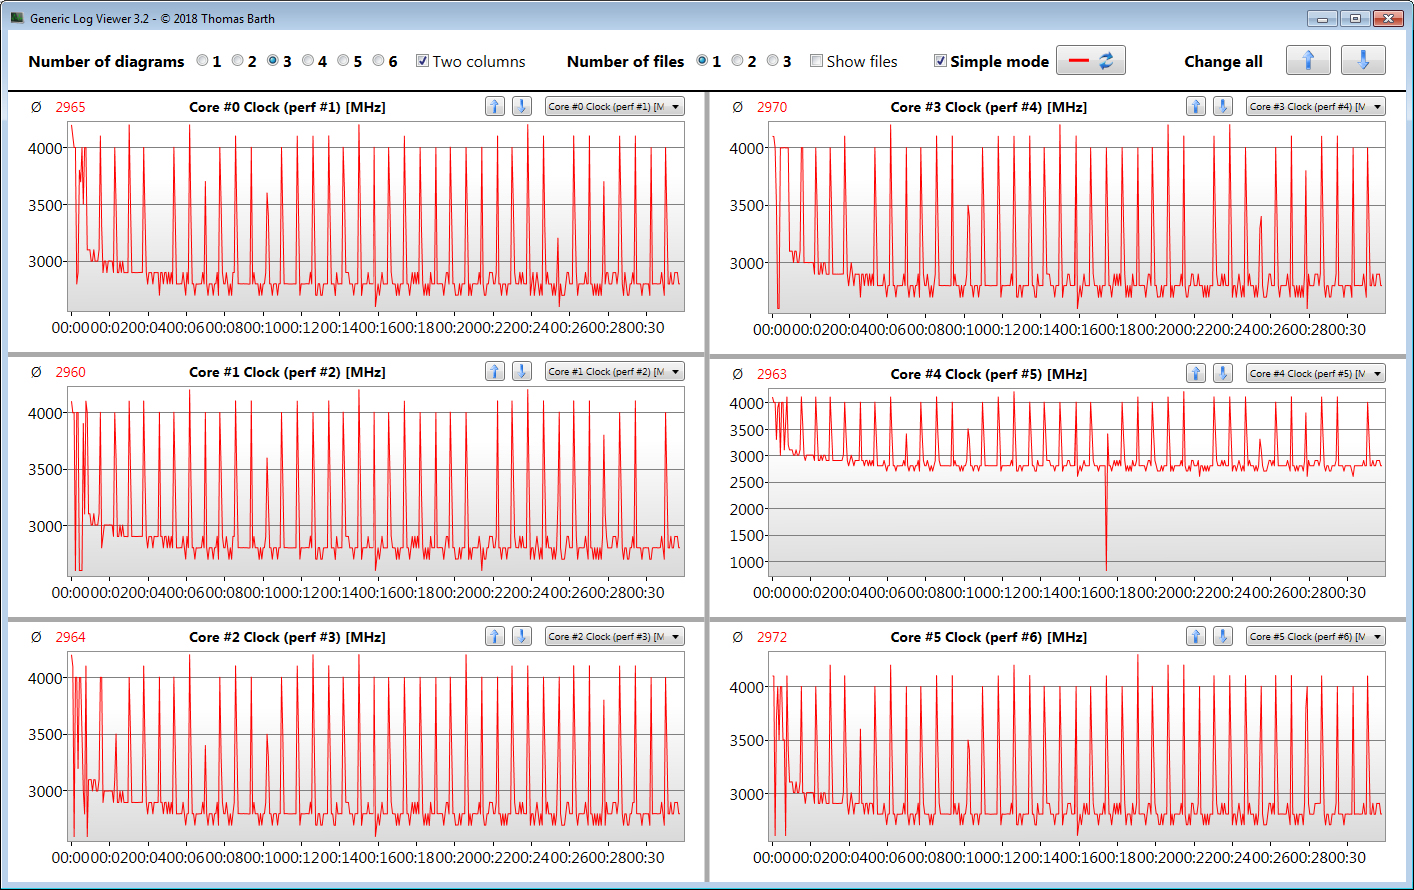
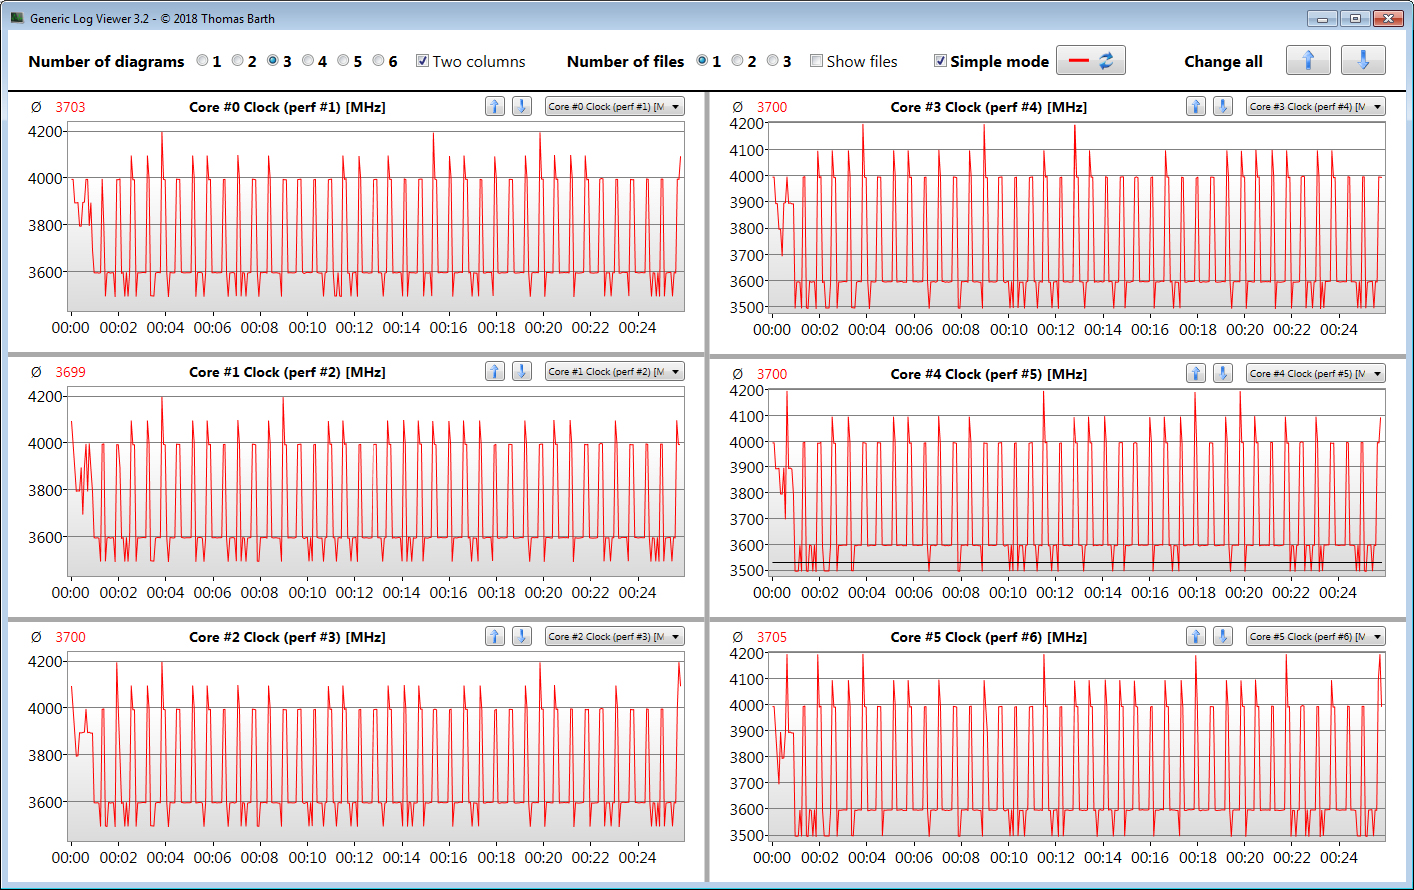
Cinebench'in R15 çok iş parçacıklı testini sürekli bir döngüde en az 30 dakika çalıştırarak takıldığında CPU güçlendirmesinin de sürekli kullanılıp kullanılmadığını kontrol ediyoruz. Sonuç: Sonuçlar ilk sekizinci sekizinci sıraya önemli ölçüde düşer ve daha sonra oldukça sabit bir seviyede stabilize olur. Boost sadece küçük bir ölçüde kullanılır. Core i7 açıkça yeteneklerinin gerisinde kalıyor. Armory Crate yazılımı içinde Turbo mod etkinleştirildiğinde önemli ölçüde daha iyi sonuçlar elde edilir. Bununla birlikte, fanlar da daha fazla gürültü üretir.
| Cinebench R15 | |
| CPU Single 64Bit | |
| Sınıf ortalaması Gaming (188.8 - 343, n=106, son 2 yıl) | |
| Gigabyte Aero 17 XA RP77 | |
| Alienware m17 P37E | |
| Razer Blade Pro 17 RTX 2080 Max-Q | |
| Asus ROG Zephyrus S GX701GXR (Turbo) | |
| Asus ROG Zephyrus S GX701GXR | |
| Asus Zephyrus S GX701GX | |
| Lenovo Legion Y740-17ICH | |
| CPU Multi 64Bit | |
| Sınıf ortalaması Gaming (1578 - 6271, n=105, son 2 yıl) | |
| Gigabyte Aero 17 XA RP77 | |
| Alienware m17 P37E | |
| Lenovo Legion Y740-17ICH | |
| Asus Zephyrus S GX701GX | |
| Asus ROG Zephyrus S GX701GXR (Turbo) | |
| Razer Blade Pro 17 RTX 2080 Max-Q | |
| Asus ROG Zephyrus S GX701GXR | |
| Cinebench R10 | |
| Rendering Multiple CPUs 32Bit | |
| Sınıf ortalaması Gaming (42932 - 81339, n=8, son 2 yıl) | |
| Asus ROG Zephyrus S GX701GXR | |
| Shading 32Bit | |
| Sınıf ortalaması Gaming (14418 - 24952, n=5, son 2 yıl) | |
| Asus ROG Zephyrus S GX701GXR | |
| Cinebench R20 | |
| CPU (Single Core) | |
| Sınıf ortalaması Gaming (442 - 895, n=106, son 2 yıl) | |
| Gigabyte Aero 17 XA RP77 | |
| Asus ROG Zephyrus S GX701GXR | |
| CPU (Multi Core) | |
| Sınıf ortalaması Gaming (4029 - 16108, n=106, son 2 yıl) | |
| Gigabyte Aero 17 XA RP77 | |
| Asus ROG Zephyrus S GX701GXR | |
| Geekbench 3 | |
| 32 Bit Multi-Core Score | |
| Asus ROG Zephyrus S GX701GXR | |
| 32 Bit Single-Core Score | |
| Asus ROG Zephyrus S GX701GXR | |
| Geekbench 4.4 | |
| 64 Bit Multi-Core Score | |
| Sınıf ortalaması Gaming (89200 - 97490, n=2, son 2 yıl) | |
| Asus ROG Zephyrus S GX701GXR | |
| 64 Bit Single-Core Score | |
| Sınıf ortalaması Gaming (9335 - 9492, n=2, son 2 yıl) | |
| Asus ROG Zephyrus S GX701GXR | |
| Geekbench 5.0 | |
| 5.0 Multi-Core | |
| Sınıf ortalaması Gaming (21768 - 23588, n=2, son 2 yıl) | |
| Asus ROG Zephyrus S GX701GXR | |
| 5.0 Single-Core | |
| Sınıf ortalaması Gaming (2237 - 2270, n=2, son 2 yıl) | |
| Asus ROG Zephyrus S GX701GXR | |
| Mozilla Kraken 1.1 - Total | |
| Asus ROG Zephyrus S GX701GXR (Edge 44) | |
| Lenovo Legion Y740-17ICH (Edge 44.17763.1.0) | |
| Razer Blade Pro 17 RTX 2080 Max-Q (Edge 44.18362.1.0) | |
| Gigabyte Aero 17 XA RP77 (Edge 44.18362.267.0) | |
| Sınıf ortalaması Gaming (391 - 590, n=101, son 2 yıl) | |
| Octane V2 - Total Score | |
| Sınıf ortalaması Gaming (93292 - 139447, n=26, son 2 yıl) | |
| Gigabyte Aero 17 XA RP77 (Edge 44.18362.267.0) | |
| Razer Blade Pro 17 RTX 2080 Max-Q (Edge 44.18362.1.0) | |
| Lenovo Legion Y740-17ICH (Edge 44.17763.1.0) | |
| Asus ROG Zephyrus S GX701GXR (Edge 44) | |
| JetStream 1.1 - 1.1 Total | |
| Sınıf ortalaması Gaming (549 - 647, n=3, son 2 yıl) | |
| Gigabyte Aero 17 XA RP77 (Edge 44.18362.267.0) | |
| Razer Blade Pro 17 RTX 2080 Max-Q (Edge 44.18362.1.0) | |
| Lenovo Legion Y740-17ICH (Edge 44.17763.1.0) | |
| Asus ROG Zephyrus S GX701GXR (Edge 44) | |
* ... daha küçük daha iyidir
Sistem performansı
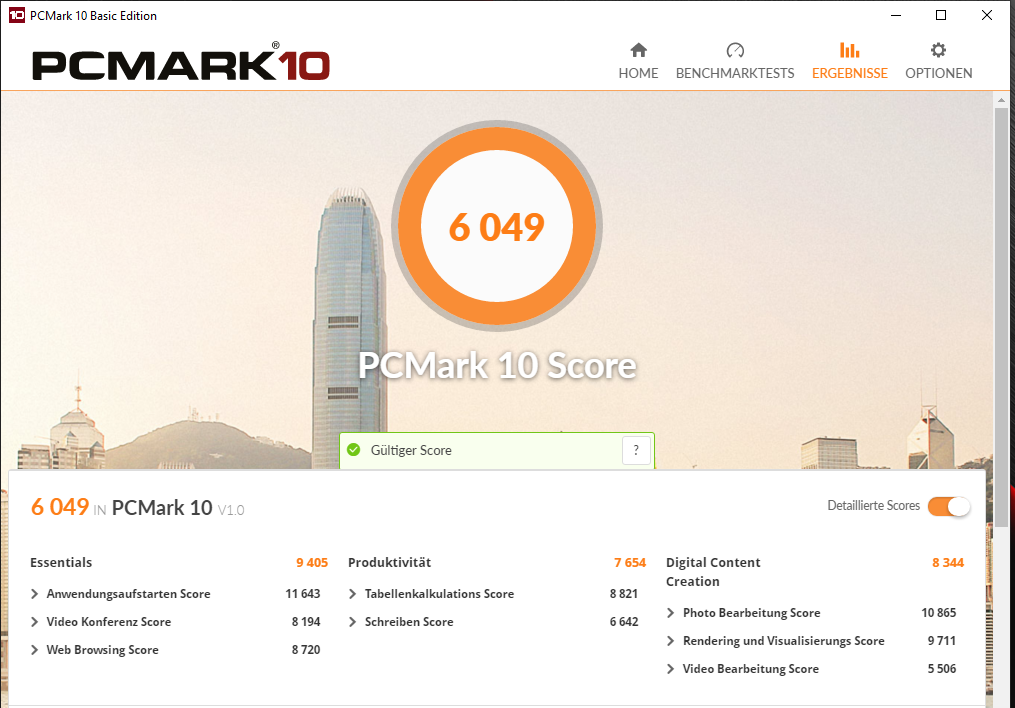
GX701GXR sistem performansından yoksundur. Güçlü bir hexa-core işlemci, çift kanal modunda çalışan bellek ve hızlı NVMe SSD, hızlı ve sorunsuz bir sistem sağlar. Bu, üst sınıf bir GPU ile tamamlanmaktadır. PCMark kriterlerindeki sonuçlar çok iyi.
| PCMark 8 Home Score Accelerated v2 | 5319 puan | |
| PCMark 8 Creative Score Accelerated v2 | 6716 puan | |
| PCMark 8 Work Score Accelerated v2 | 6593 puan | |
| PCMark 10 Score | 6049 puan | |
Yardım | ||
Depolama
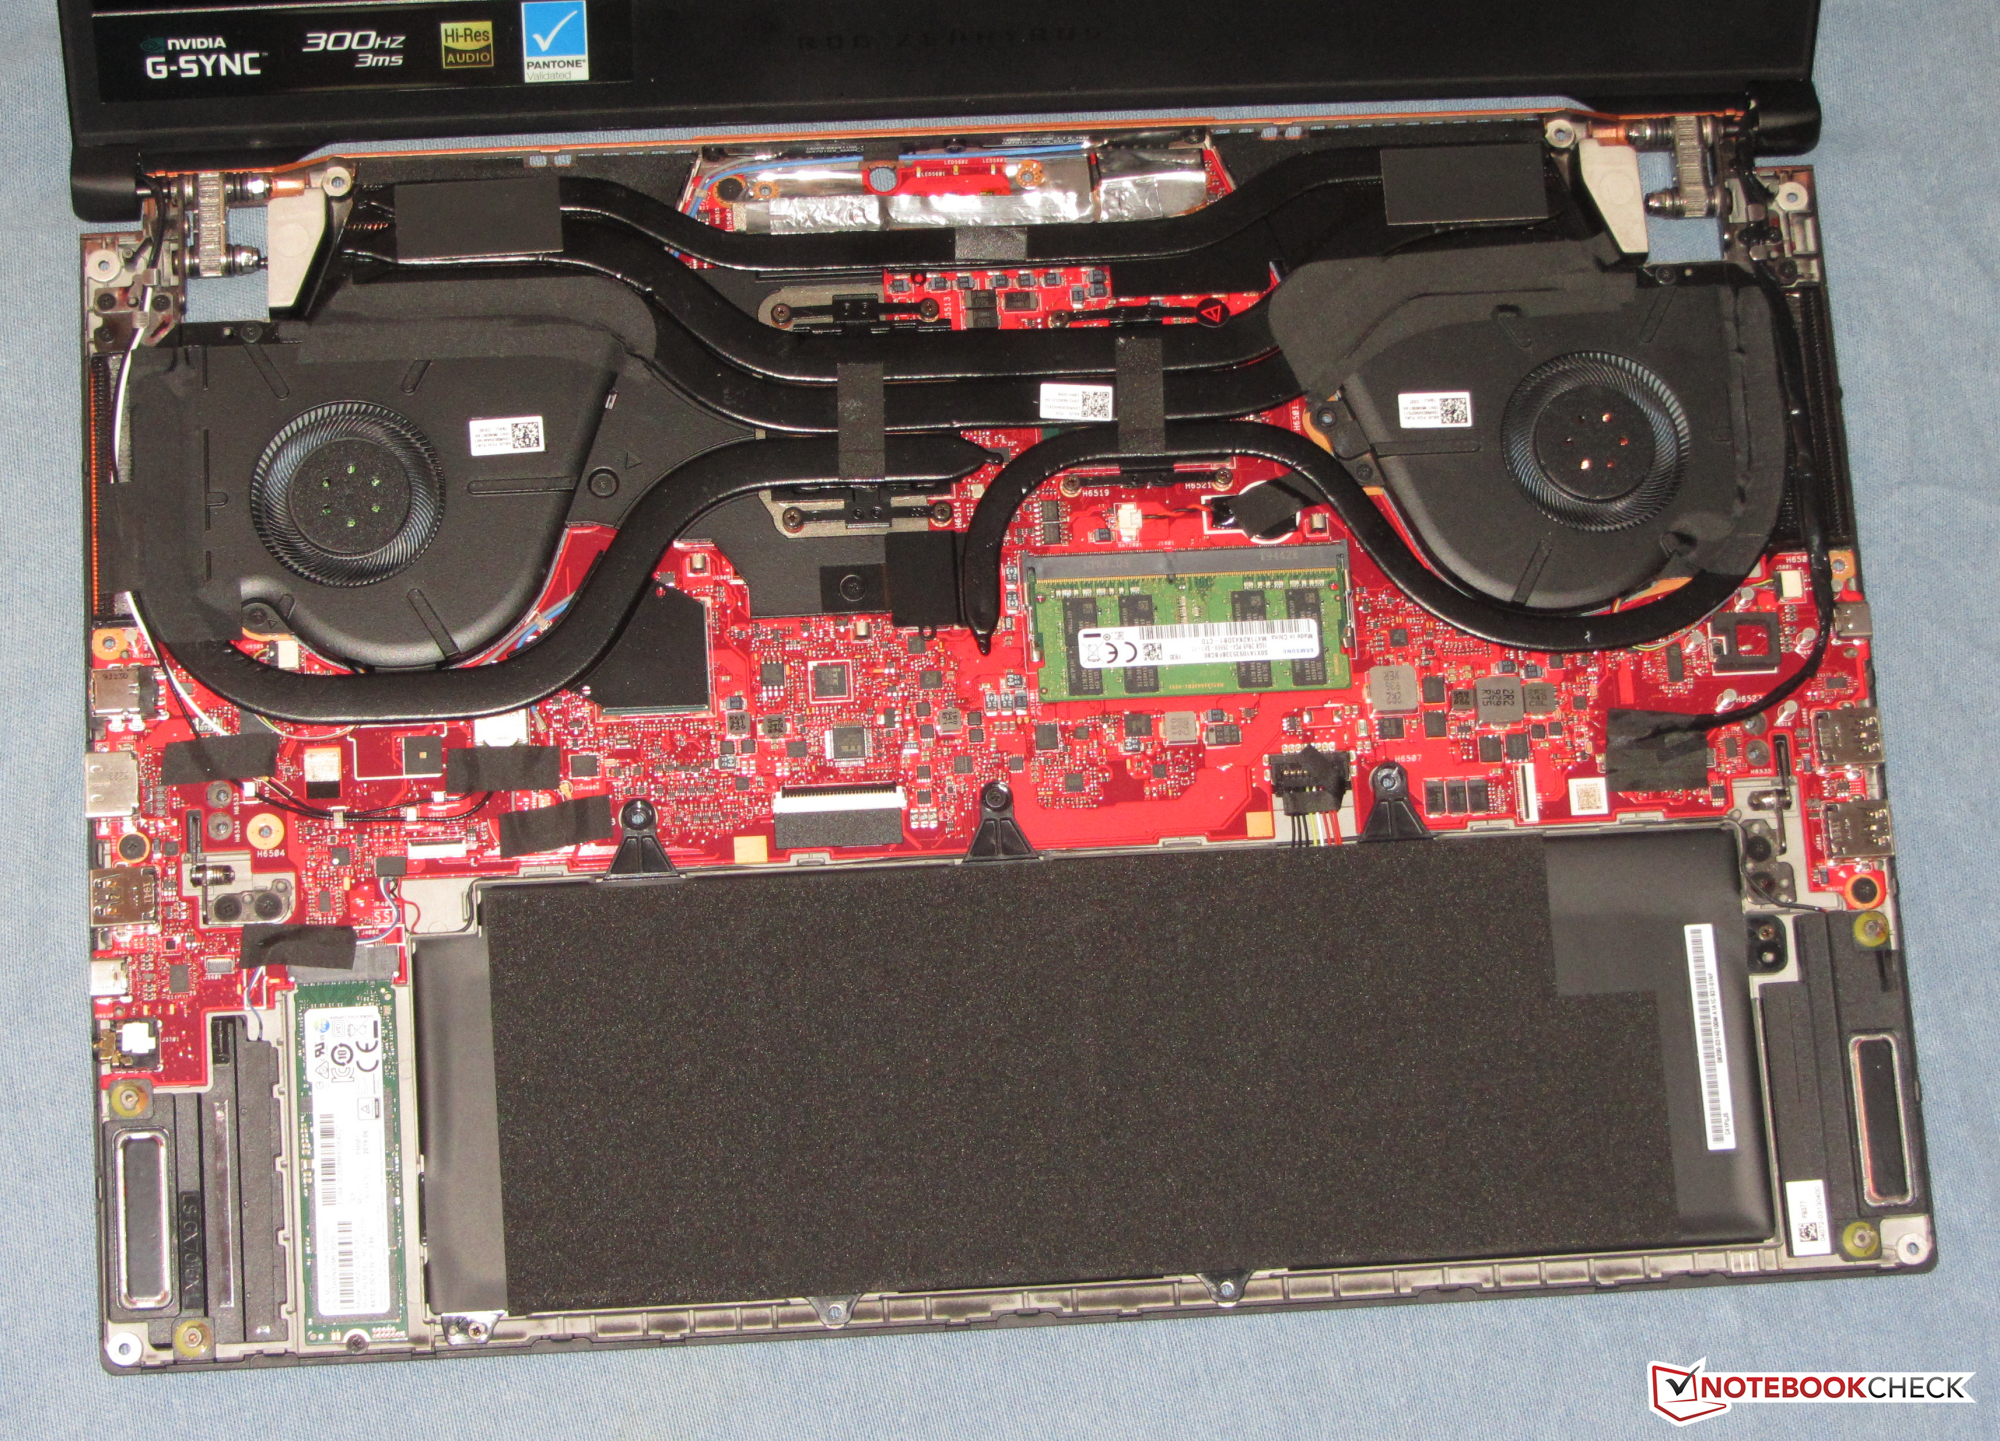
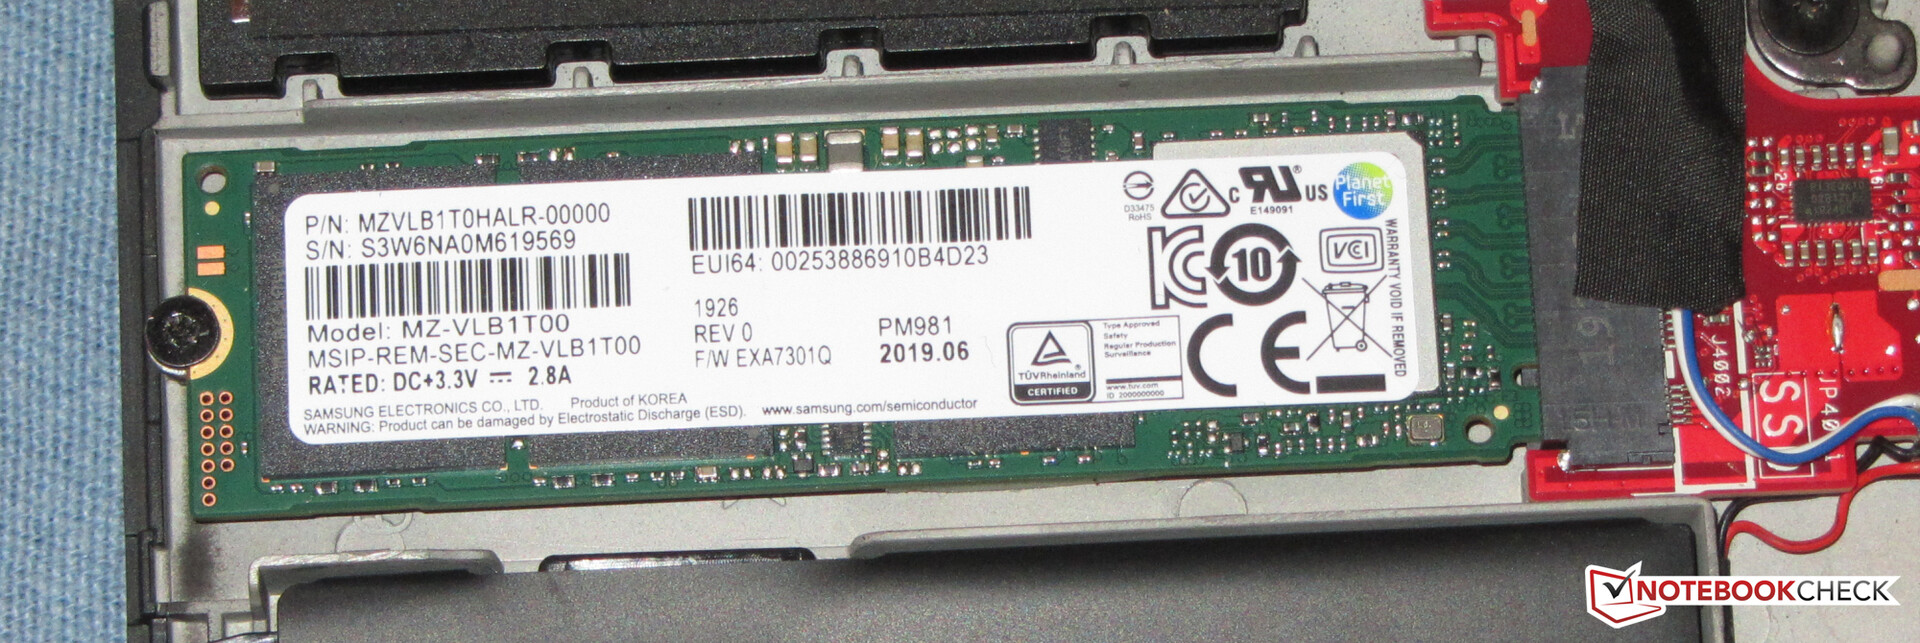
Sistem sürücüsü, Samsung'dan 1 TB depolama alanı sağlayan bir NVMe SSD'dir (M.2 2280 biçimi). SSD çok iyi aktarım hızları sağlar. Dizüstü bilgisayarda ek depolama aygıtları için yer yoktur.

| Asus ROG Zephyrus S GX701GXR Samsung SSD PM981 MZVLB1T0HALR | Razer Blade Pro 17 RTX 2080 Max-Q Samsung SSD PM981 MZVLB512HAJQ | Gigabyte Aero 17 XA RP77 Intel SSD 760p SSDPEKKW512G8 | Alienware m17 P37E SK Hynix PC401 512GB M.2 (HFS512GD9TNG) | Lenovo Legion Y740-17ICH Samsung SSD PM981 MZVLB256HAHQ | Asus Zephyrus S GX701GX Samsung SSD PM981 MZVLB1T0HALR | |
|---|---|---|---|---|---|---|
| CrystalDiskMark 5.2 / 6 | -1% | 34% | 6% | 12% | -6% | |
| Write 4K (MB/s) | 96.1 | 100.7 5% | 169.6 76% | 120.2 25% | 99.8 4% | 92.4 -4% |
| Read 4K (MB/s) | 40.86 | 41.03 0% | 58 42% | 44.3 8% | 40.81 0% | 39.59 -3% |
| Write Seq (MB/s) | 1317 | 1146 -13% | 1516 15% | 1278 -3% | 1385 5% | 1221 -7% |
| Read Seq (MB/s) | 1030 | 1115 8% | 2362 129% | 1389 35% | 2089 103% | 1005 -2% |
| Write 4K Q32T1 (MB/s) | 350.4 | 384.6 10% | 481.8 38% | 436.2 24% | 380 8% | 292.5 -17% |
| Read 4K Q32T1 (MB/s) | 404.1 | 429.5 6% | 506 25% | 515 27% | 445.5 10% | 330.8 -18% |
| Write Seq Q32T1 (MB/s) | 2396 | 1859 -22% | 1530 -36% | 1157 -52% | 1380 -42% | 2385 0% |
| Read Seq Q32T1 (MB/s) | 3194 | 3179 0% | 2645 -17% | 2671 -16% | 3471 9% | 3339 5% |
Grafik kartı
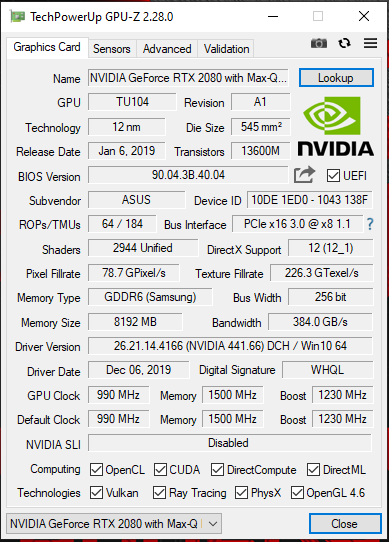
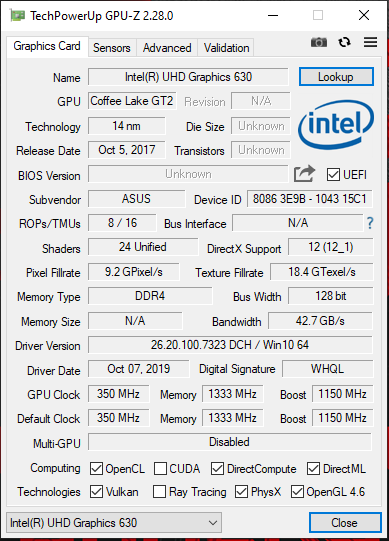
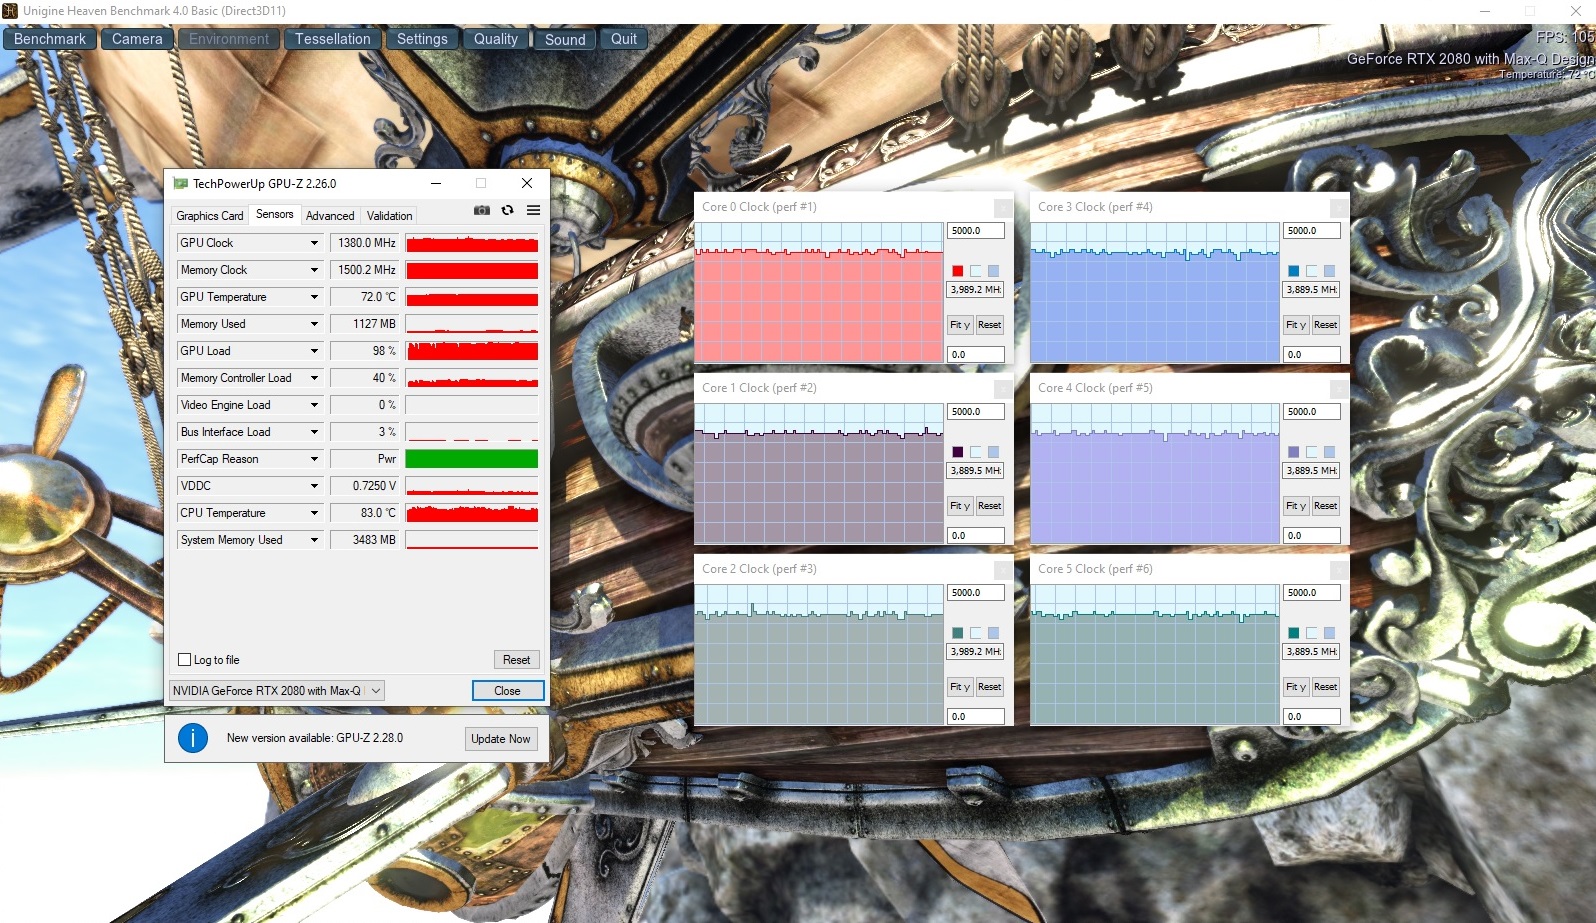
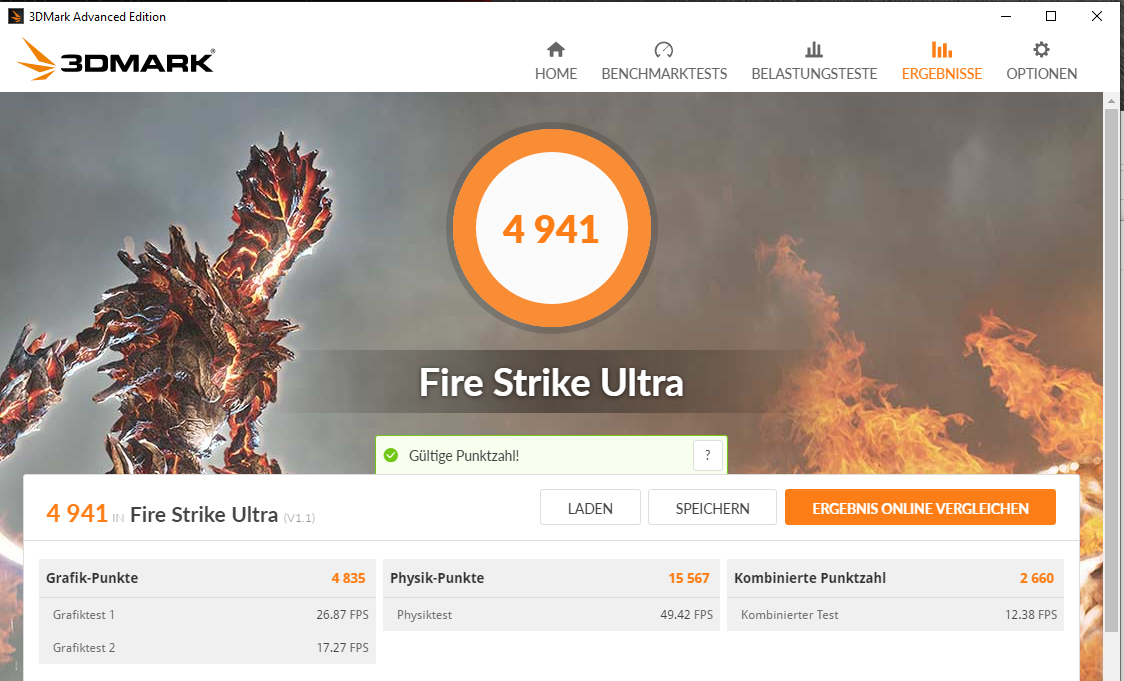
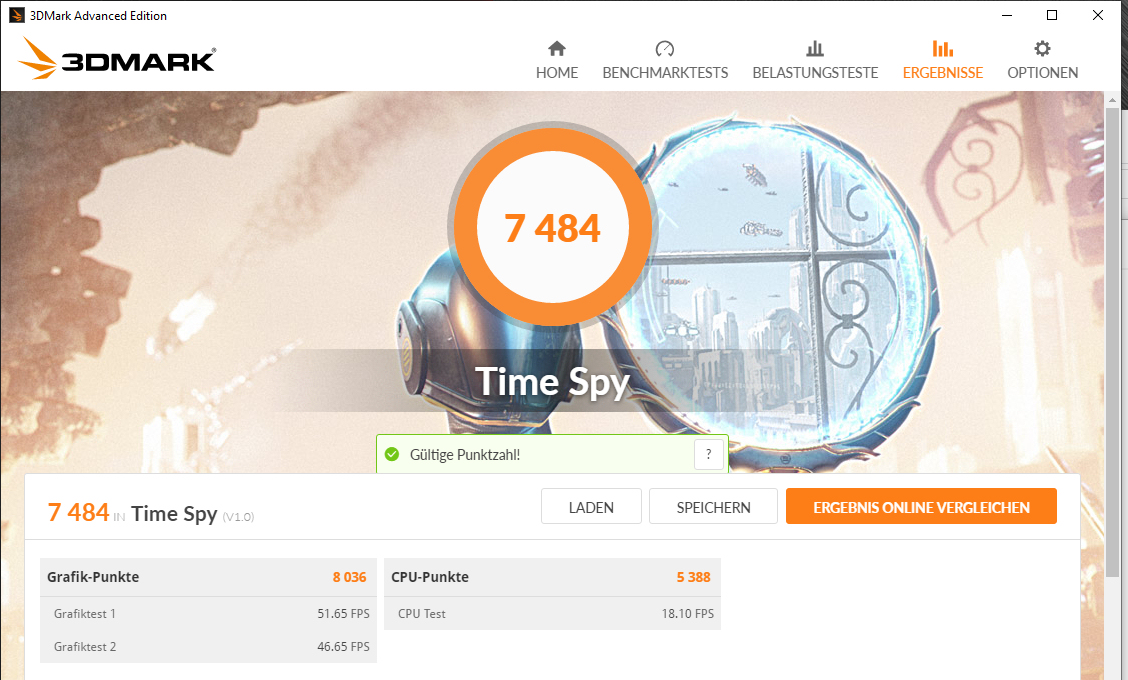
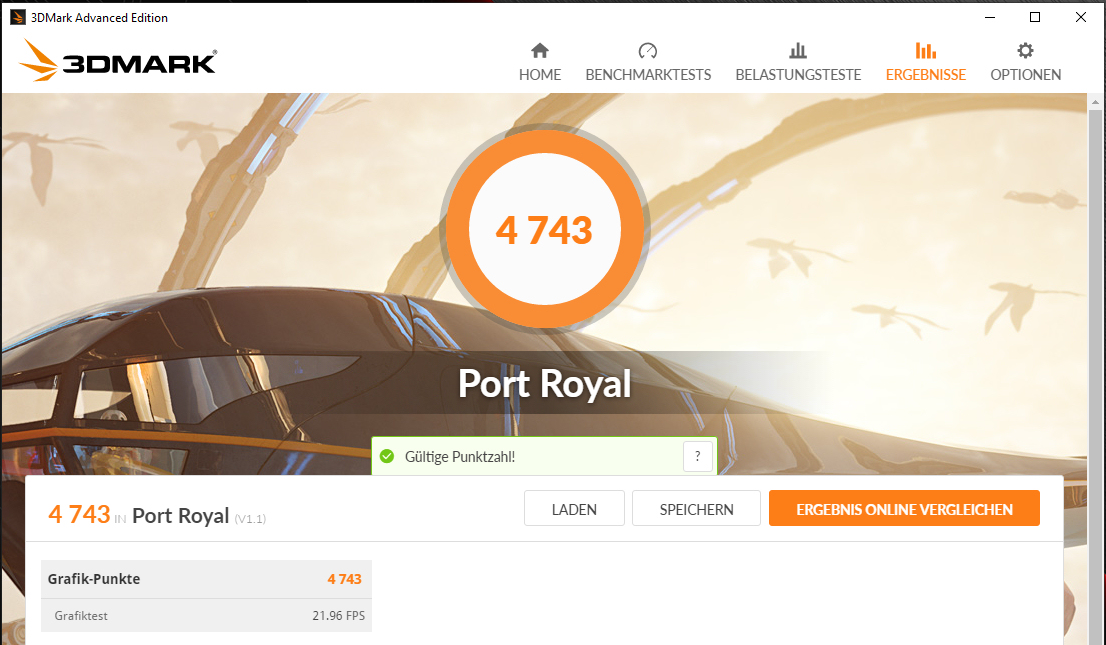
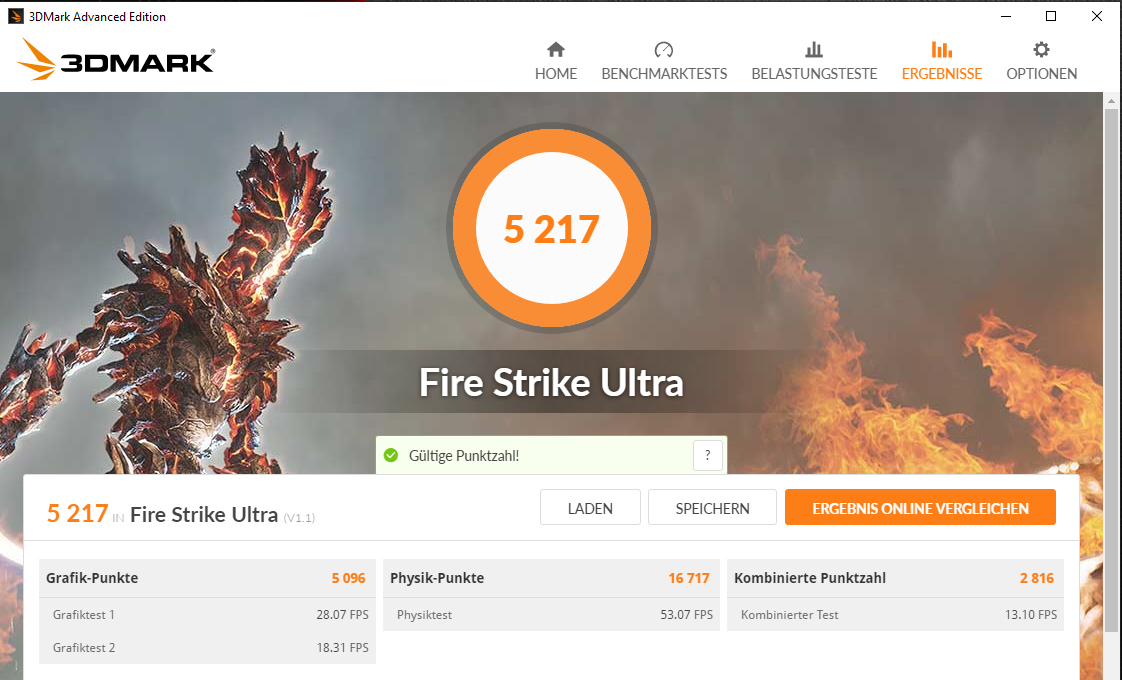
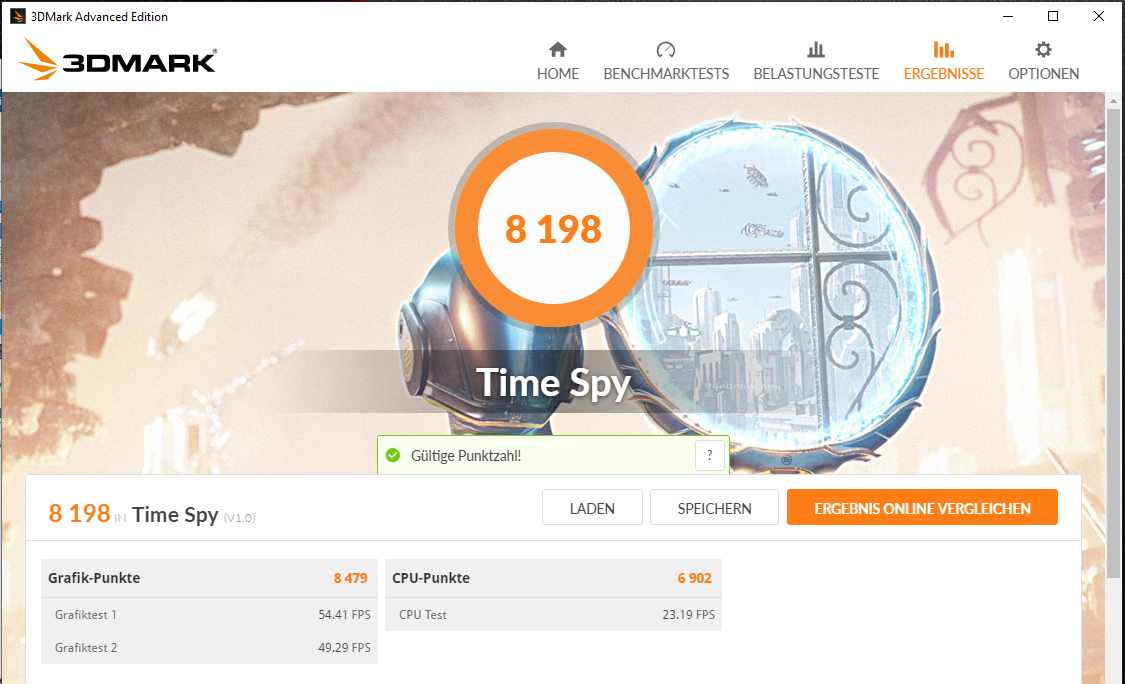
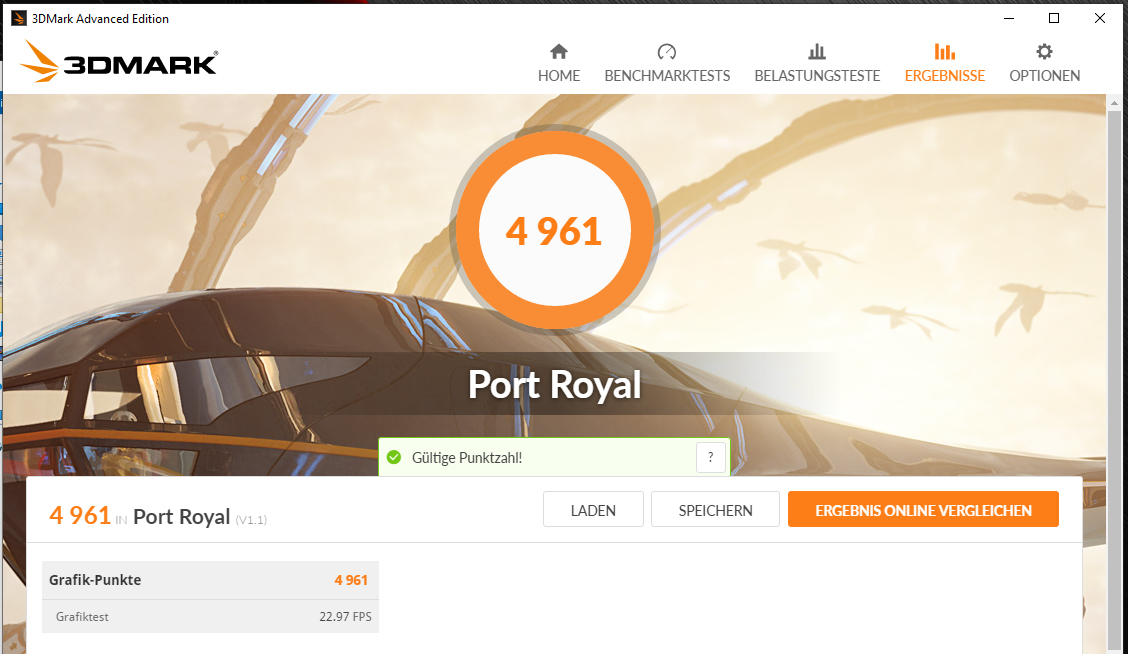
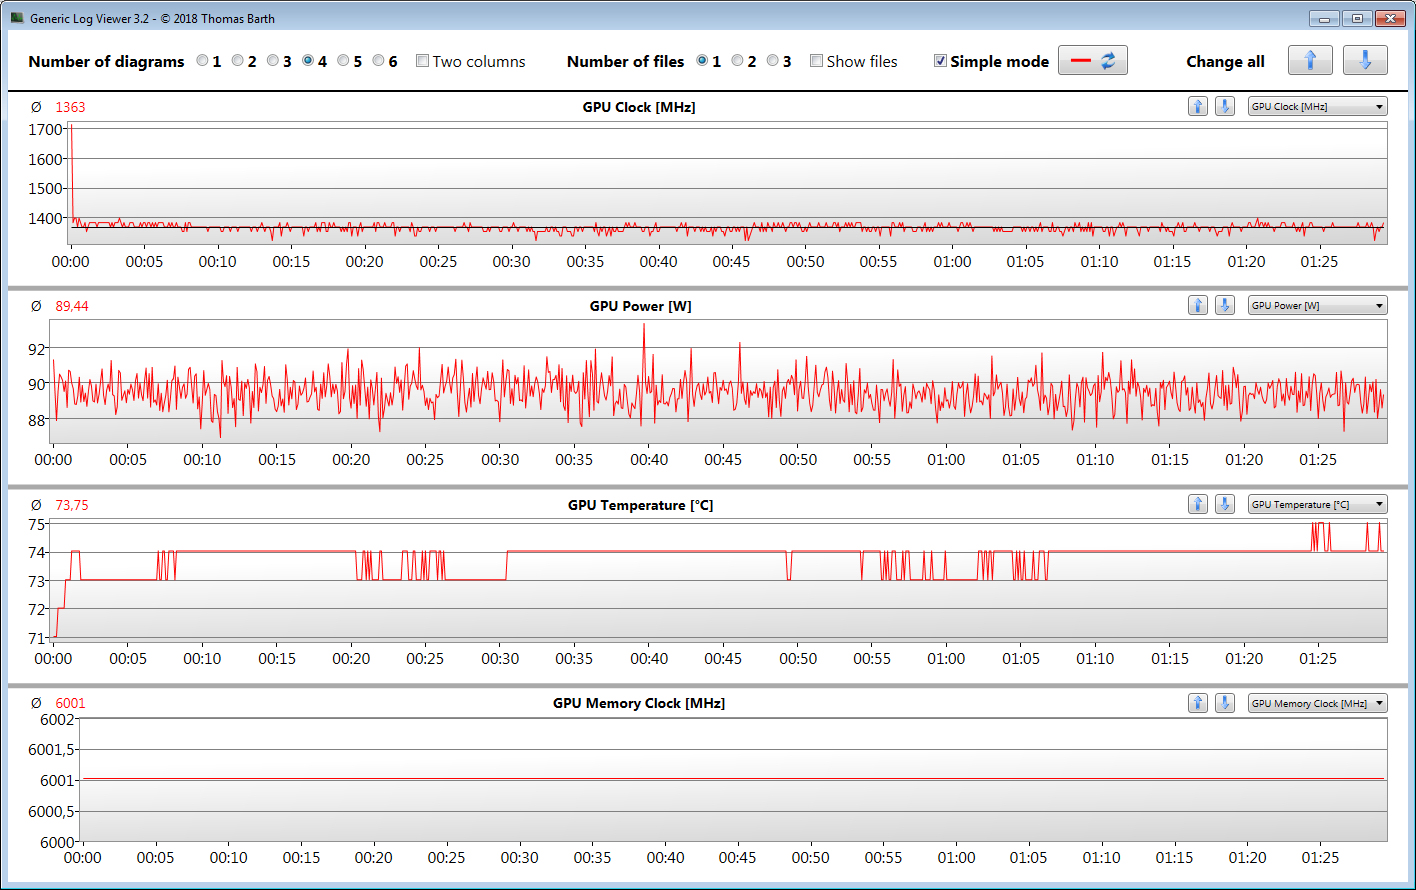
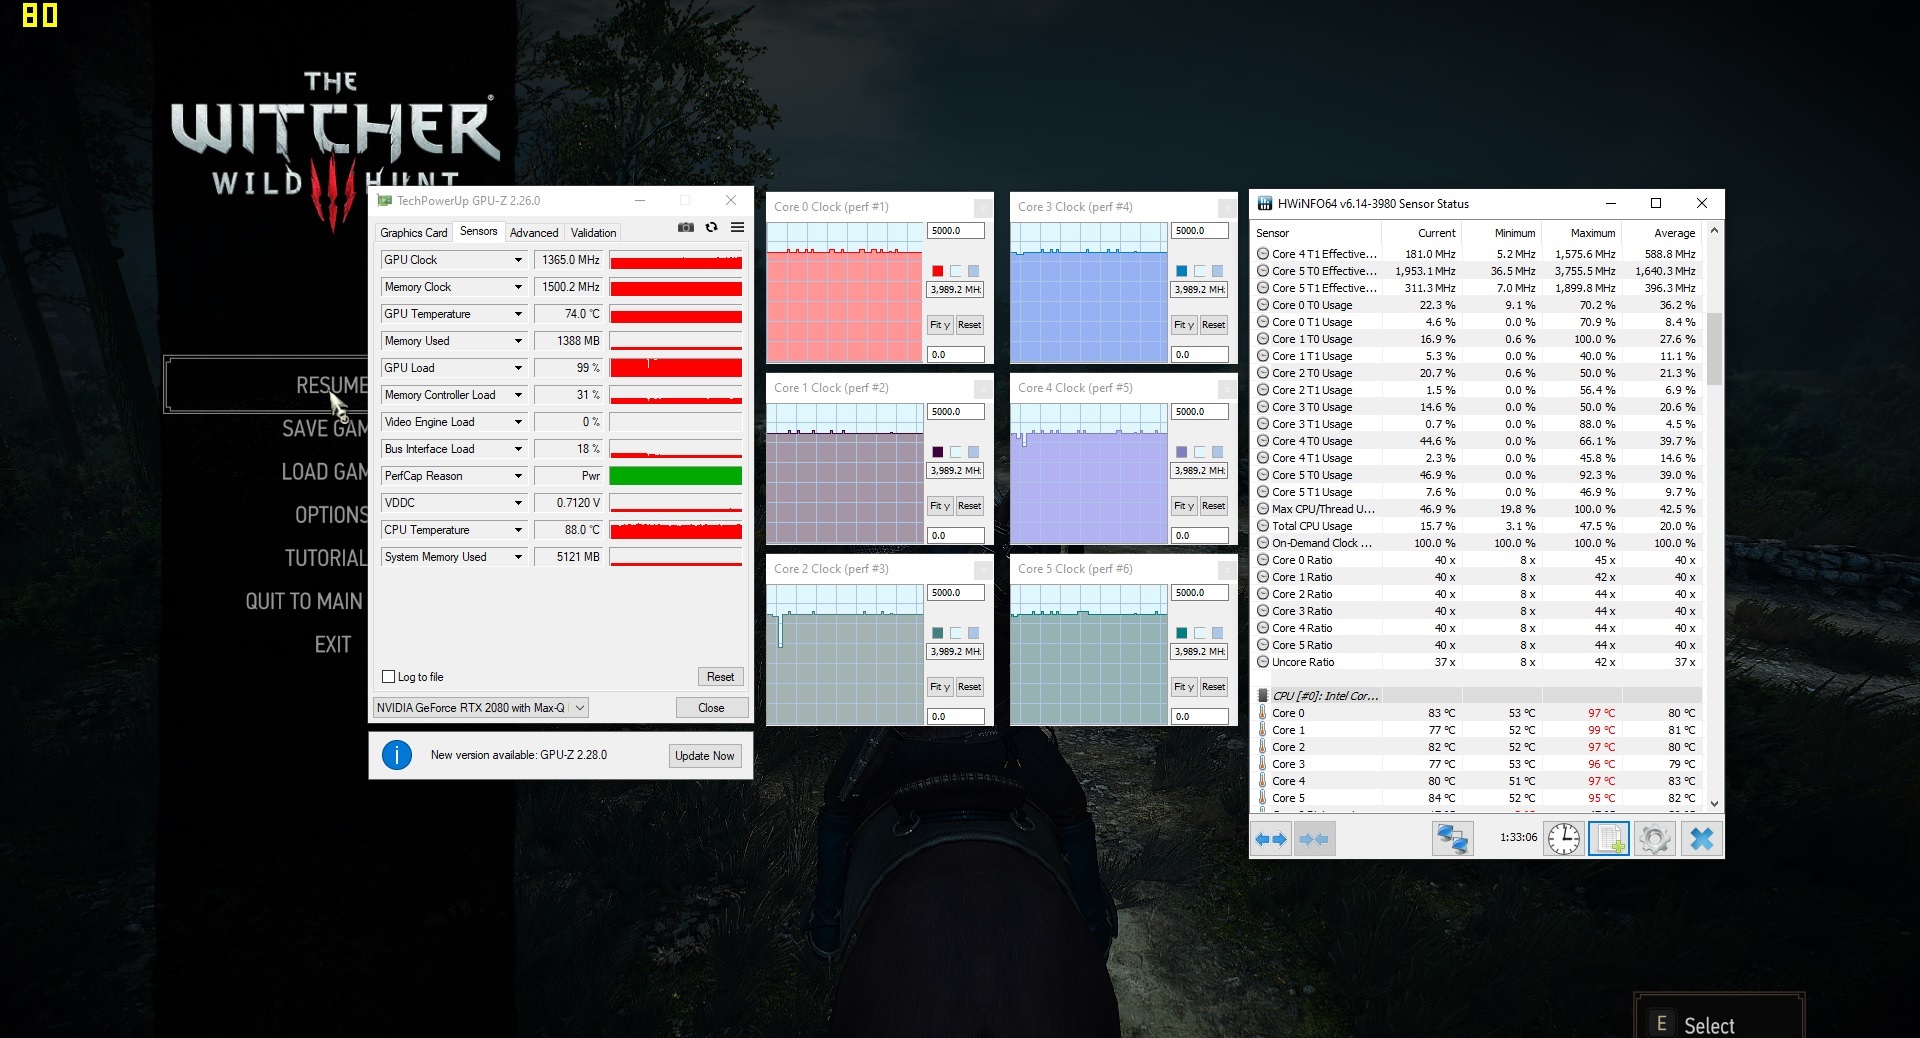
Dahili GeForce RTX 2080 Max Q grafik çekirdeği DirectX 12'yi destekler ve 990 MHz temel hızda çalışır. Boost ile 1.230 MHz'e kadar bir artış mümkündür. GPU ayarlanmış bir sıcaklık ve / veya enerji eşiğine ulaşmazsa daha yüksek hızlar mümkündür. Bu şekilde maksimum 1.815 MHz kaydediyoruz. Witcher 3 testi ortalama 1,365 MHz hızında gerçekleştirilir. GPU, hızlı GDDR6 grafik belleğine (8.192 MB) erişebilir. 3DMark karşılaştırma ölçütlerindeki sonuçlar GPU için normal düzeydedir. İşlemciye yerleştirilen UHD Graphics 630 yongası G-Sync modunda kapatılır, ancak gerekirse etkinleştirilebilir.
| 3DMark 06 Standard Score | 36228 puan | |
| 3DMark 11 Performance | 20578 puan | |
| 3DMark Ice Storm Standard Score | 171155 puan | |
| 3DMark Cloud Gate Standard Score | 32628 puan | |
| 3DMark Fire Strike Score | 17374 puan | |
| 3DMark Time Spy Score | 7484 puan | |
Yardım | ||
| 3DMark | |
| 1920x1080 Fire Strike Graphics | |
| Sınıf ortalaması Gaming (12242 - 62849, n=115, son 2 yıl) | |
| Razer Blade Pro 17 RTX 2080 Max-Q | |
| Asus ROG Zephyrus S GX701GXR (Turbo) | |
| Asus Zephyrus S GX701GX | |
| Asus ROG Zephyrus S GX701GXR | |
| Alienware m17 P37E | |
| Lenovo Legion Y740-17ICH | |
| Gigabyte Aero 17 XA RP77 | |
| 2560x1440 Time Spy Graphics | |
| Sınıf ortalaması Gaming (5012 - 26212, n=115, son 2 yıl) | |
| Razer Blade Pro 17 RTX 2080 Max-Q | |
| Asus Zephyrus S GX701GX | |
| Asus ROG Zephyrus S GX701GXR (Turbo) | |
| Asus ROG Zephyrus S GX701GXR | |
| Alienware m17 P37E | |
| Lenovo Legion Y740-17ICH | |
| Gigabyte Aero 17 XA RP77 | |
| 3DMark 11 - 1280x720 Performance GPU | |
| Sınıf ortalaması Gaming (21841 - 80022, n=104, son 2 yıl) | |
| Razer Blade Pro 17 RTX 2080 Max-Q | |
| Asus ROG Zephyrus S GX701GXR (Turbo) | |
| Asus Zephyrus S GX701GX | |
| Asus ROG Zephyrus S GX701GXR | |
| Alienware m17 P37E | |
| Lenovo Legion Y740-17ICH | |
| Gigabyte Aero 17 XA RP77 | |
Oyun performansı
17.3 inçlik, veritabanımızda bulunan tüm oyunları sorunsuz bir şekilde çalıştırır. Normalde Full HD çözünürlük ve yüksek ile maksimum kalite ayarları seçilebilir. RTX 2080 Max Q GPU, Full HD'nin ötesinde çözünürlükleri de işleyebilir (bu harici bir monitör gerektirir). Ancak, kalite ayarları daha bilinçli bir şekilde seçilmelidir - özellikle 4K düzeyinde.
| The Witcher 3 - 1920x1080 Ultra Graphics & Postprocessing (HBAO+) | |
| Sınıf ortalaması Gaming (104.7 - 240, n=6, son 2 yıl) | |
| Razer Blade Pro 17 RTX 2080 Max-Q | |
| Asus Zephyrus S GX701GX | |
| Asus ROG Zephyrus S GX701GXR | |
| Alienware m17 P37E | |
| Lenovo Legion Y740-17ICH | |
| Gigabyte Aero 17 XA RP77 | |
| BioShock Infinite - 1920x1080 Ultra Preset, DX11 (DDOF) | |
| Razer Blade Pro 17 RTX 2080 Max-Q | |
| Asus ROG Zephyrus S GX701GXR | |
| Alienware m17 P37E | |
| Lenovo Legion Y740-17ICH | |
| Gigabyte Aero 17 XA RP77 | |
Kare hızlarının uzun bir süre boyunca büyük ölçüde sabit kalıp kalmadığını kontrol etmek için, The Witcher 3 oyununu yaklaşık 60 dakika Full HD çözünürlük ve maksimum kalite ayarlarında çalıştırıyoruz. Oyuncunun oluşturduğu karakter bu süre boyunca taşınmaz.
| düşük | orta | yüksek | ultra | |
|---|---|---|---|---|
| BioShock Infinite (2013) | 350.6 | 306 | 285.9 | 176.5 |
| The Witcher 3 (2015) | 295.5 | 230.3 | 153.2 | 80.7 |
| Metro Exodus (2019) | 121.7 | 94.6 | 72.1 | 59 |
| Control (2019) | 231.9 | 92.8 | 71.9 | |
| Borderlands 3 (2019) | 128.8 | 110.8 | 84.7 | 67.1 |
| FIFA 20 (2019) | 214.6 | 208.1 | 197.7 | 197.1 |
| Ghost Recon Breakpoint (2019) | 105 | 95 | 92 | 71 |
| GRID 2019 (2019) | 213.5 | 187.6 | 120.7 | 81.3 |
| Call of Duty Modern Warfare 2019 (2019) | 171.5 | 126.7 | 104.9 | 90.6 |
| Need for Speed Heat (2019) | 85.6 | 66 | 63.6 | 57.2 |
| Star Wars Jedi Fallen Order (2019) | 94.5 | 84.2 | 82.3 | |
| Red Dead Redemption 2 (2019) | 121 | 102.6 | 72.8 | 45.6 |
| Escape from Tarkov (2020) | 121 | 121 | 120 | 117 |
| Hunt Showdown (2020) | 184 | 134 | 121 | |
| Doom Eternal (2020) | 156 | 140 | 138 | 134 |
Emisyonlar - Isı ve gürültü gelişimi kabul edilebilir
Gürültü emisyonları
Boşta kaldığında, fanlar sürekli düşük hızlarda çalışır. Her şey ince bir gürültüye yansır. Stres testi sırasında 50 dB (A) ses basıncı seviyesini ölçeriz. Oyun oynarken benzer şekilde yüksek oluyor: The Witcher 3 testimizi yaparken GX701GXR 49 dB (A) seviyesine ulaşıyor. Birlikte verilen kulaklığın kullanımı neredeyse vazgeçilmezdir. Dizüstü bilgisayarın içinden, yüksek devir hızlarında fanların gürültüsü ile boğulan bazı durumlarda nispeten yüksek bir elektronik çatırtı duyulabilir.
Ses yüksekliği
| Boşta |
| 32 / 33 / 34 dB |
| Çalışırken |
| 40 / 50 dB |
 | ||
30 dB sessiz 40 dB(A) duyulabilirlik 50 dB(A) gürültülü |
||
min: | ||
| Asus ROG Zephyrus S GX701GXR i7-9750H, GeForce RTX 2080 Max-Q | Razer Blade Pro 17 RTX 2080 Max-Q i7-9750H, GeForce RTX 2080 Max-Q | Gigabyte Aero 17 XA RP77 i9-9980HK, GeForce RTX 2070 Max-Q | Alienware m17 P37E i9-8950HK, GeForce RTX 2080 Max-Q | Lenovo Legion Y740-17ICH i7-8750H, GeForce RTX 2080 Max-Q | Asus Zephyrus S GX701GX i7-8750H, GeForce RTX 2080 Max-Q | Sınıf ortalaması Gaming | |
|---|---|---|---|---|---|---|---|
| Noise | 4% | -1% | 1% | 8% | -0% | 9% | |
| kapalı / ortam * (dB) | 30 | 28.2 6% | 29.3 2% | 28.2 6% | 28.3 6% | 29 3% | 24.1 ? 20% |
| Idle Minimum * (dB) | 32 | 28.2 12% | 33 -3% | 28.2 12% | 31.5 2% | 29 9% | 25.9 ? 19% |
| Idle Average * (dB) | 33 | 28.2 15% | 33 -0% | 28.2 15% | 31.6 4% | 32 3% | 27.4 ? 17% |
| Idle Maximum * (dB) | 34 | 30.8 9% | 33 3% | 31 9% | 31.6 7% | 33 3% | 30 ? 12% |
| Load Average * (dB) | 40 | 42 -5% | 42.5 -6% | 50.8 -27% | 32.3 19% | 47 -18% | 43.3 ? -8% |
| Witcher 3 ultra * (dB) | 49 | 51 -4% | 42 14% | 50.8 -4% | 43 12% | 49 -0% | |
| Load Maximum * (dB) | 50 | 53 -6% | 59.6 -19% | 50.8 -2% | 45.5 9% | 51 -2% | 54.2 ? -8% |
* ... daha küçük daha iyidir
Sıcaklık
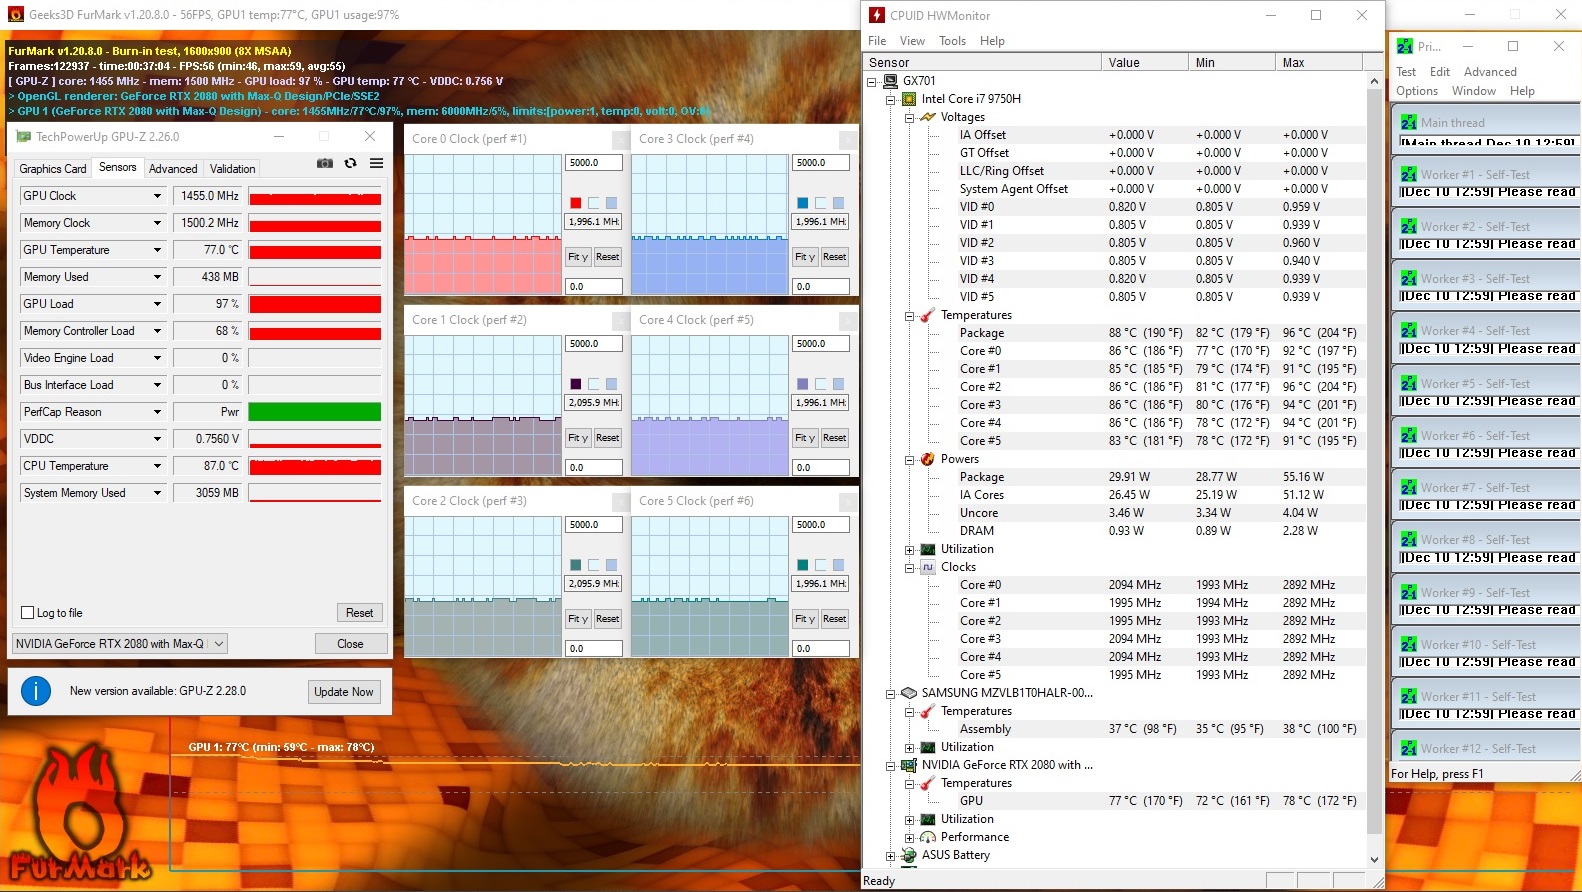
Stres testimiz (Prime95 ve FurMark en az bir saat boyunca çalışır), Zephyrus tarafından pil gücüne takıldığında ve takıldığında farklı şekillerde gerçekleştirilir. Takıldığında işlemci 2 ila 2,1 GHz hızında çalışır. Grafik çekirdeği 1.455 MHz'de çalışıyor. Pil gücünde, CPU saat hızı 800 MHz ile 2,3 GHz arasında ileri geri sıçrar. GPU, 300 ve 1,100 MHz arasındaki hızlarda çalışır. Stres testi, günlük hayatta meydana gelmeyen aşırı bir senaryoyu temsil eder. Bu testle, sistemin tam yük altında bile stabil olup olmadığını kontrol ediyoruz.
Dizüstü bilgisayardaki hesaplama gücü açısından, ısı gelişimi kabul edilebilir bir düzeydedir. Çoğu ölçüm noktasında 40 ° C (~ 104 ° F) ile 50 ° C (~ 122 ° F) arasındaki sıcaklıklara ulaşılır. The Witcher 3 testimizi yaparken ısı gelişimi çok daha güçlüdür. Bu nedenle, cihaz kucağa yerleştirilmemelidir. Günlük kullanımda, değerler yeşil aralıktadır.
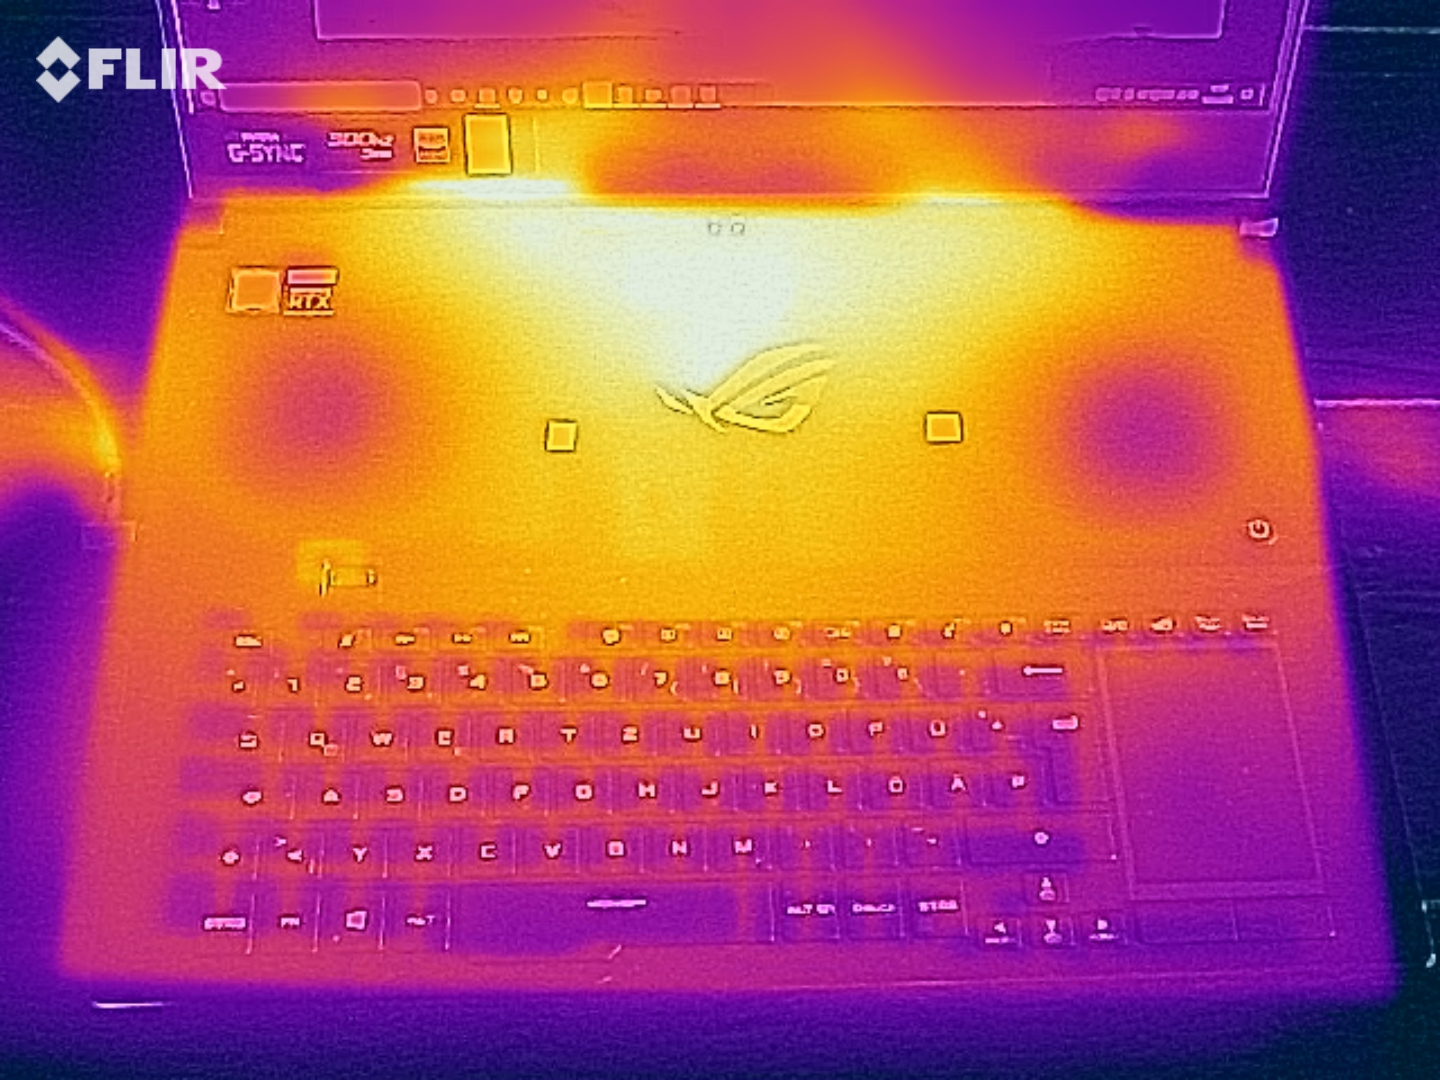
(-) Üst taraftaki maksimum sıcaklık, 40.4 °C / 105 F ortalamasına kıyasla 50 °C / 122 F'dir. , Gaming sınıfı için 21.2 ile 68.8 °C arasında değişir.
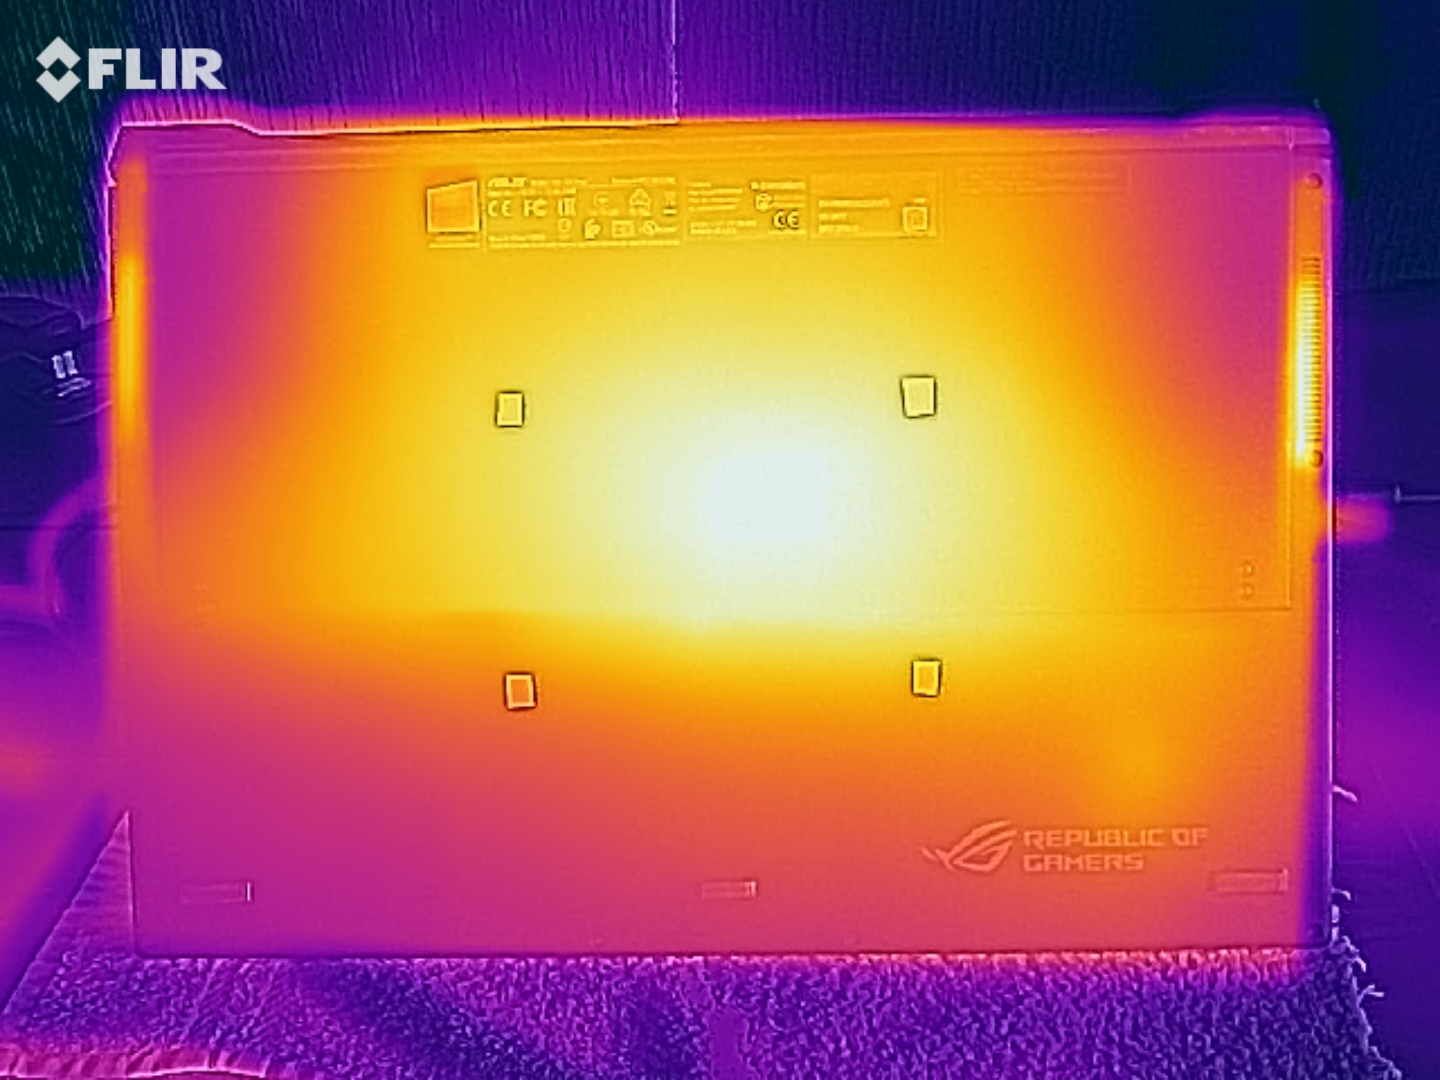
(-) Alt kısım, 43.2 °C / 110 F ortalamasına kıyasla maksimum 47 °C / 117 F'ye kadar ısınır
(+) Boşta kullanımda, üst tarafın ortalama sıcaklığı 31.2 °C / 88 F olup, cihazın 33.9 °C / 93 F.
(-) The Witcher 3 oynarken, üst tarafın ortalama sıcaklığı 44.1 °C / 111 F olup, cihazın 33.9 °C / 93 F.
(±) Avuç içi dayanakları ve dokunmatik yüzey maksimum 38 °C / 100.4 F ile dokunulamayacak kadar ısınabilir.
(-) Benzer cihazların avuç içi dayanağı alanının ortalama sıcaklığı 28.8 °C / 83.8 F (-9.2 °C / -16.6 F) idi.
| Asus ROG Zephyrus S GX701GXR i7-9750H, GeForce RTX 2080 Max-Q | Razer Blade Pro 17 RTX 2080 Max-Q i7-9750H, GeForce RTX 2080 Max-Q | Gigabyte Aero 17 XA RP77 i9-9980HK, GeForce RTX 2070 Max-Q | Alienware m17 P37E i9-8950HK, GeForce RTX 2080 Max-Q | Lenovo Legion Y740-17ICH i7-8750H, GeForce RTX 2080 Max-Q | Asus Zephyrus S GX701GX i7-8750H, GeForce RTX 2080 Max-Q | Sınıf ortalaması Gaming | |
|---|---|---|---|---|---|---|---|
| Heat | 11% | -4% | -6% | 9% | 5% | 3% | |
| Maximum Upper Side * (°C) | 50 | 43 14% | 46.8 6% | 55 -10% | 38.6 23% | 53 -6% | 45.2 ? 10% |
| Maximum Bottom * (°C) | 47 | 47.2 -0% | 62.2 -32% | 60 -28% | 43.6 7% | 50 -6% | 48.2 ? -3% |
| Idle Upper Side * (°C) | 33 | 27.2 18% | 29 12% | 30.4 8% | 30.2 8% | 27 18% | 31.1 ? 6% |
| Idle Bottom * (°C) | 34 | 30 12% | 34 -0% | 31.8 6% | 35 -3% | 30 12% | 34.3 ? -1% |
* ... daha küçük daha iyidir
Hoparlörler
Asus ROG Zephyrus S GX701GXR ses analizi
(+) | hoparlörler nispeten yüksek sesle çalabilir (83 dB)
Bas 100 - 315Hz
(±) | azaltılmış bas - ortalama olarak medyandan 10.3% daha düşük
(±) | Bas doğrusallığı ortalamadır (11.1% delta - önceki frekans)
Ortalar 400 - 2000 Hz
(+) | dengeli ortalar - medyandan yalnızca 2.6% uzakta
(+) | orta frekanslar doğrusaldır (4.3% deltadan önceki frekansa)
Yüksekler 2 - 16 kHz
(+) | dengeli yüksekler - medyandan yalnızca 3.3% uzakta
(+) | yüksekler doğrusaldır (4.1% deltadan önceki frekansa)
Toplam 100 - 16.000 Hz
(+) | genel ses doğrusaldır (12.5% ortancaya göre fark)
Aynı sınıfla karşılaştırıldığında
» Bu sınıftaki tüm test edilen cihazların %15%'si daha iyi, 3% benzer, 81% daha kötüydü
» En iyisinin deltası 6% idi, ortalama 18% idi, en kötüsü 132% idi
Test edilen tüm cihazlarla karşılaştırıldığında
» Test edilen tüm cihazların %11'si daha iyi, 2 benzer, % 87 daha kötüydü
» En iyisinin deltası 4% idi, ortalama 23% idi, en kötüsü 134% idi
Razer Blade Pro 17 RTX 2080 Max-Q ses analizi
(+) | hoparlörler nispeten yüksek sesle çalabilir (83.6 dB)
Bas 100 - 315Hz
(±) | azaltılmış bas - ortalama olarak medyandan 10.5% daha düşük
(±) | Bas doğrusallığı ortalamadır (14.4% delta - önceki frekans)
Ortalar 400 - 2000 Hz
(±) | daha yüksek ortalar - ortalama olarak medyandan 5.3% daha yüksek
(+) | orta frekanslar doğrusaldır (4.6% deltadan önceki frekansa)
Yüksekler 2 - 16 kHz
(+) | dengeli yüksekler - medyandan yalnızca 3.5% uzakta
(±) | Yükseklerin doğrusallığı ortalamadır (10% delta - önceki frekans)
Toplam 100 - 16.000 Hz
(±) | Genel sesin doğrusallığı ortalamadır (17.9% ortancaya göre fark)
Aynı sınıfla karşılaştırıldığında
» Bu sınıftaki tüm test edilen cihazların %54%'si daha iyi, 9% benzer, 37% daha kötüydü
» En iyisinin deltası 6% idi, ortalama 18% idi, en kötüsü 132% idi
Test edilen tüm cihazlarla karşılaştırıldığında
» Test edilen tüm cihazların %37'si daha iyi, 8 benzer, % 55 daha kötüydü
» En iyisinin deltası 4% idi, ortalama 23% idi, en kötüsü 134% idi
Enerji yönetimi - Asus dizüstü bilgisayarın dayanıklılığı pek yok
Enerji tüketimi
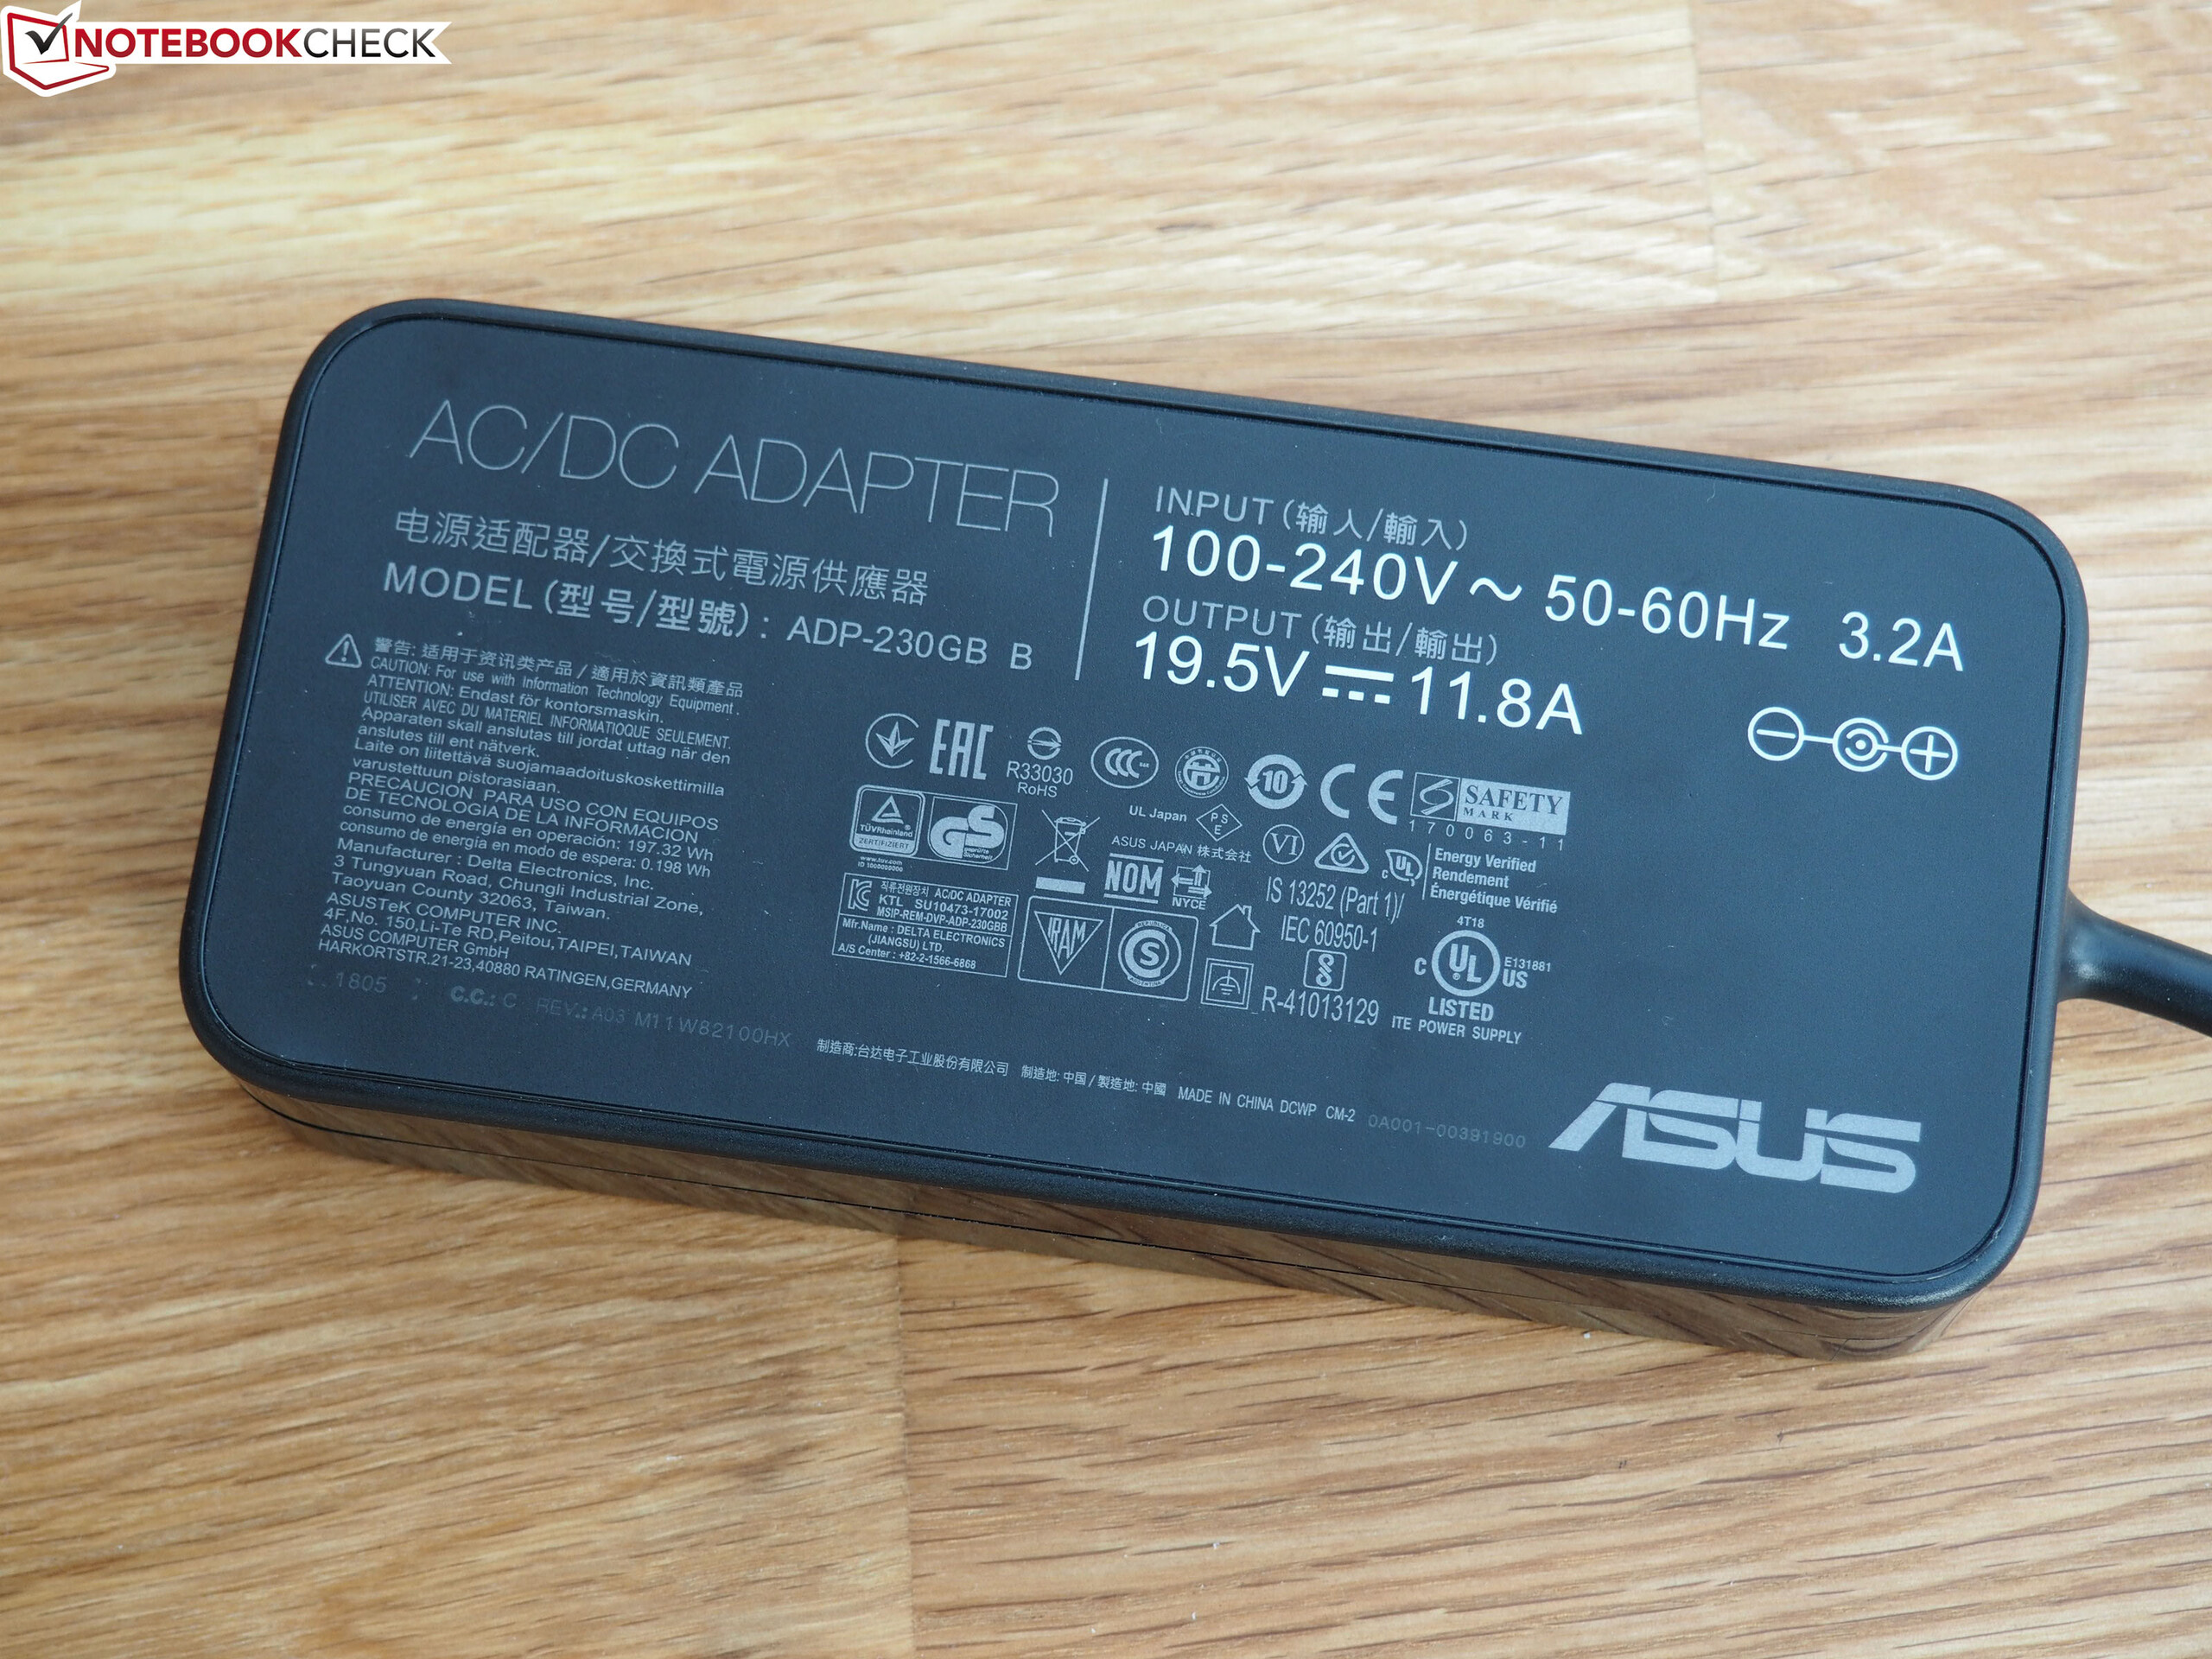
Boşta kaldığında, 36 watt'lık maksimum güç tüketimini kaydederiz - oldukça yüksek bir değer. Yerleşik GPU etkin olsaydı, değer önemli ölçüde daha düşük olurdu. Stres testi talebi 187 watt'a kadar artırır. The Witcher 3 testimizin yürütülmesi sırasında yaklaşık 155 watt'lık bir güç tüketimini ölçüyoruz. Güç adaptörünün çıkışı 230 watt'tır.
| Kapalı / Bekleme modu | |
| Boşta | |
| Çalışırken |
|
Key:
min: | |
| Asus ROG Zephyrus S GX701GXR i7-9750H, GeForce RTX 2080 Max-Q | Razer Blade Pro 17 RTX 2080 Max-Q i7-9750H, GeForce RTX 2080 Max-Q | Gigabyte Aero 17 XA RP77 i9-9980HK, GeForce RTX 2070 Max-Q | Alienware m17 P37E i9-8950HK, GeForce RTX 2080 Max-Q | Lenovo Legion Y740-17ICH i7-8750H, GeForce RTX 2080 Max-Q | Asus Zephyrus S GX701GX i7-8750H, GeForce RTX 2080 Max-Q | Sınıf ortalaması Gaming | |
|---|---|---|---|---|---|---|---|
| Power Consumption | 14% | 4% | -3% | 16% | 11% | 17% | |
| Idle Minimum * (Watt) | 32 | 16.2 49% | 13.9 57% | 21.2 34% | 20.2 37% | 19 41% | 13 ? 59% |
| Idle Average * (Watt) | 34 | 20.4 40% | 24.3 29% | 29.6 13% | 27.2 20% | 22 35% | 18.6 ? 45% |
| Idle Maximum * (Watt) | 36 | 26.1 27% | 35.5 1% | 34 6% | 28.7 20% | 30 17% | 24.2 ? 33% |
| Load Average * (Watt) | 95 | 96.5 -2% | 127.6 -34% | 130.9 -38% | 90.8 4% | 104 -9% | 108.7 ? -14% |
| Witcher 3 ultra * (Watt) | 155 | 182.9 -18% | 158 -2% | 177.5 -15% | 152.1 2% | 167 -8% | |
| Load Maximum * (Watt) | 187 | 214.3 -15% | 237.5 -27% | 219.7 -17% | 165.4 12% | 203 -9% | 255 ? -36% |
* ... daha küçük daha iyidir
Pil ömrü
Pratik Wi-Fi testimizde, GX701GXR sırasıyla 3:02 saat (iGPU devre dışı) ve 5:13 saat (iGPU açık) çalışma süresine ulaşır. Web sitelerine erişmenin neden olduğu yükü simüle etmek için bir komut dosyası kullanıyoruz. "Dengeli" profil etkindir ve ekran parlaklığı yaklaşık 150 cd / m²'ye ayarlanır. 17.3 inçlik video testimizi 2:48 saat sonra tamamlar. Big Buck Bunny (H.264 kodlama, 1920x1080 piksel) kısa filmini burada sürekli bir döngüde yönetiyoruz. "Güç Tasarruf Modu" profili etkindir, radyo modülü devre dışı bırakılır ve ekran parlaklığı 150 cd / m²'ye düşürülür.
| Asus ROG Zephyrus S GX701GXR i7-9750H, GeForce RTX 2080 Max-Q, 76 Wh | Razer Blade Pro 17 RTX 2080 Max-Q i7-9750H, GeForce RTX 2080 Max-Q, 70 Wh | Gigabyte Aero 17 XA RP77 i9-9980HK, GeForce RTX 2070 Max-Q, 94.24 Wh | Alienware m17 P37E i9-8950HK, GeForce RTX 2080 Max-Q, 90 Wh | Lenovo Legion Y740-17ICH i7-8750H, GeForce RTX 2080 Max-Q, 76 Wh | Asus Zephyrus S GX701GX i7-8750H, GeForce RTX 2080 Max-Q, 76 Wh | Sınıf ortalaması Gaming | |
|---|---|---|---|---|---|---|---|
| Pil Çalışma Süresi | 31% | 121% | 51% | 7% | 8% | 121% | |
| Reader / Idle (h) | 4.1 | 4.9 20% | 11.9 190% | 9.1 122% | 5 22% | 8.71 ? 112% | |
| H.264 (h) | 2.8 | 8.64 ? 209% | |||||
| WiFi v1.3 (h) | 3 | 4.7 57% | 7.2 140% | 4.9 63% | 3.2 7% | 3.8 27% | 7.07 ? 136% |
| Load (h) | 1.2 | 1.4 17% | 1.6 33% | 0.8 -33% | 0.9 -25% | 1.502 ? 25% |
Artılar
Eksiler
Karar
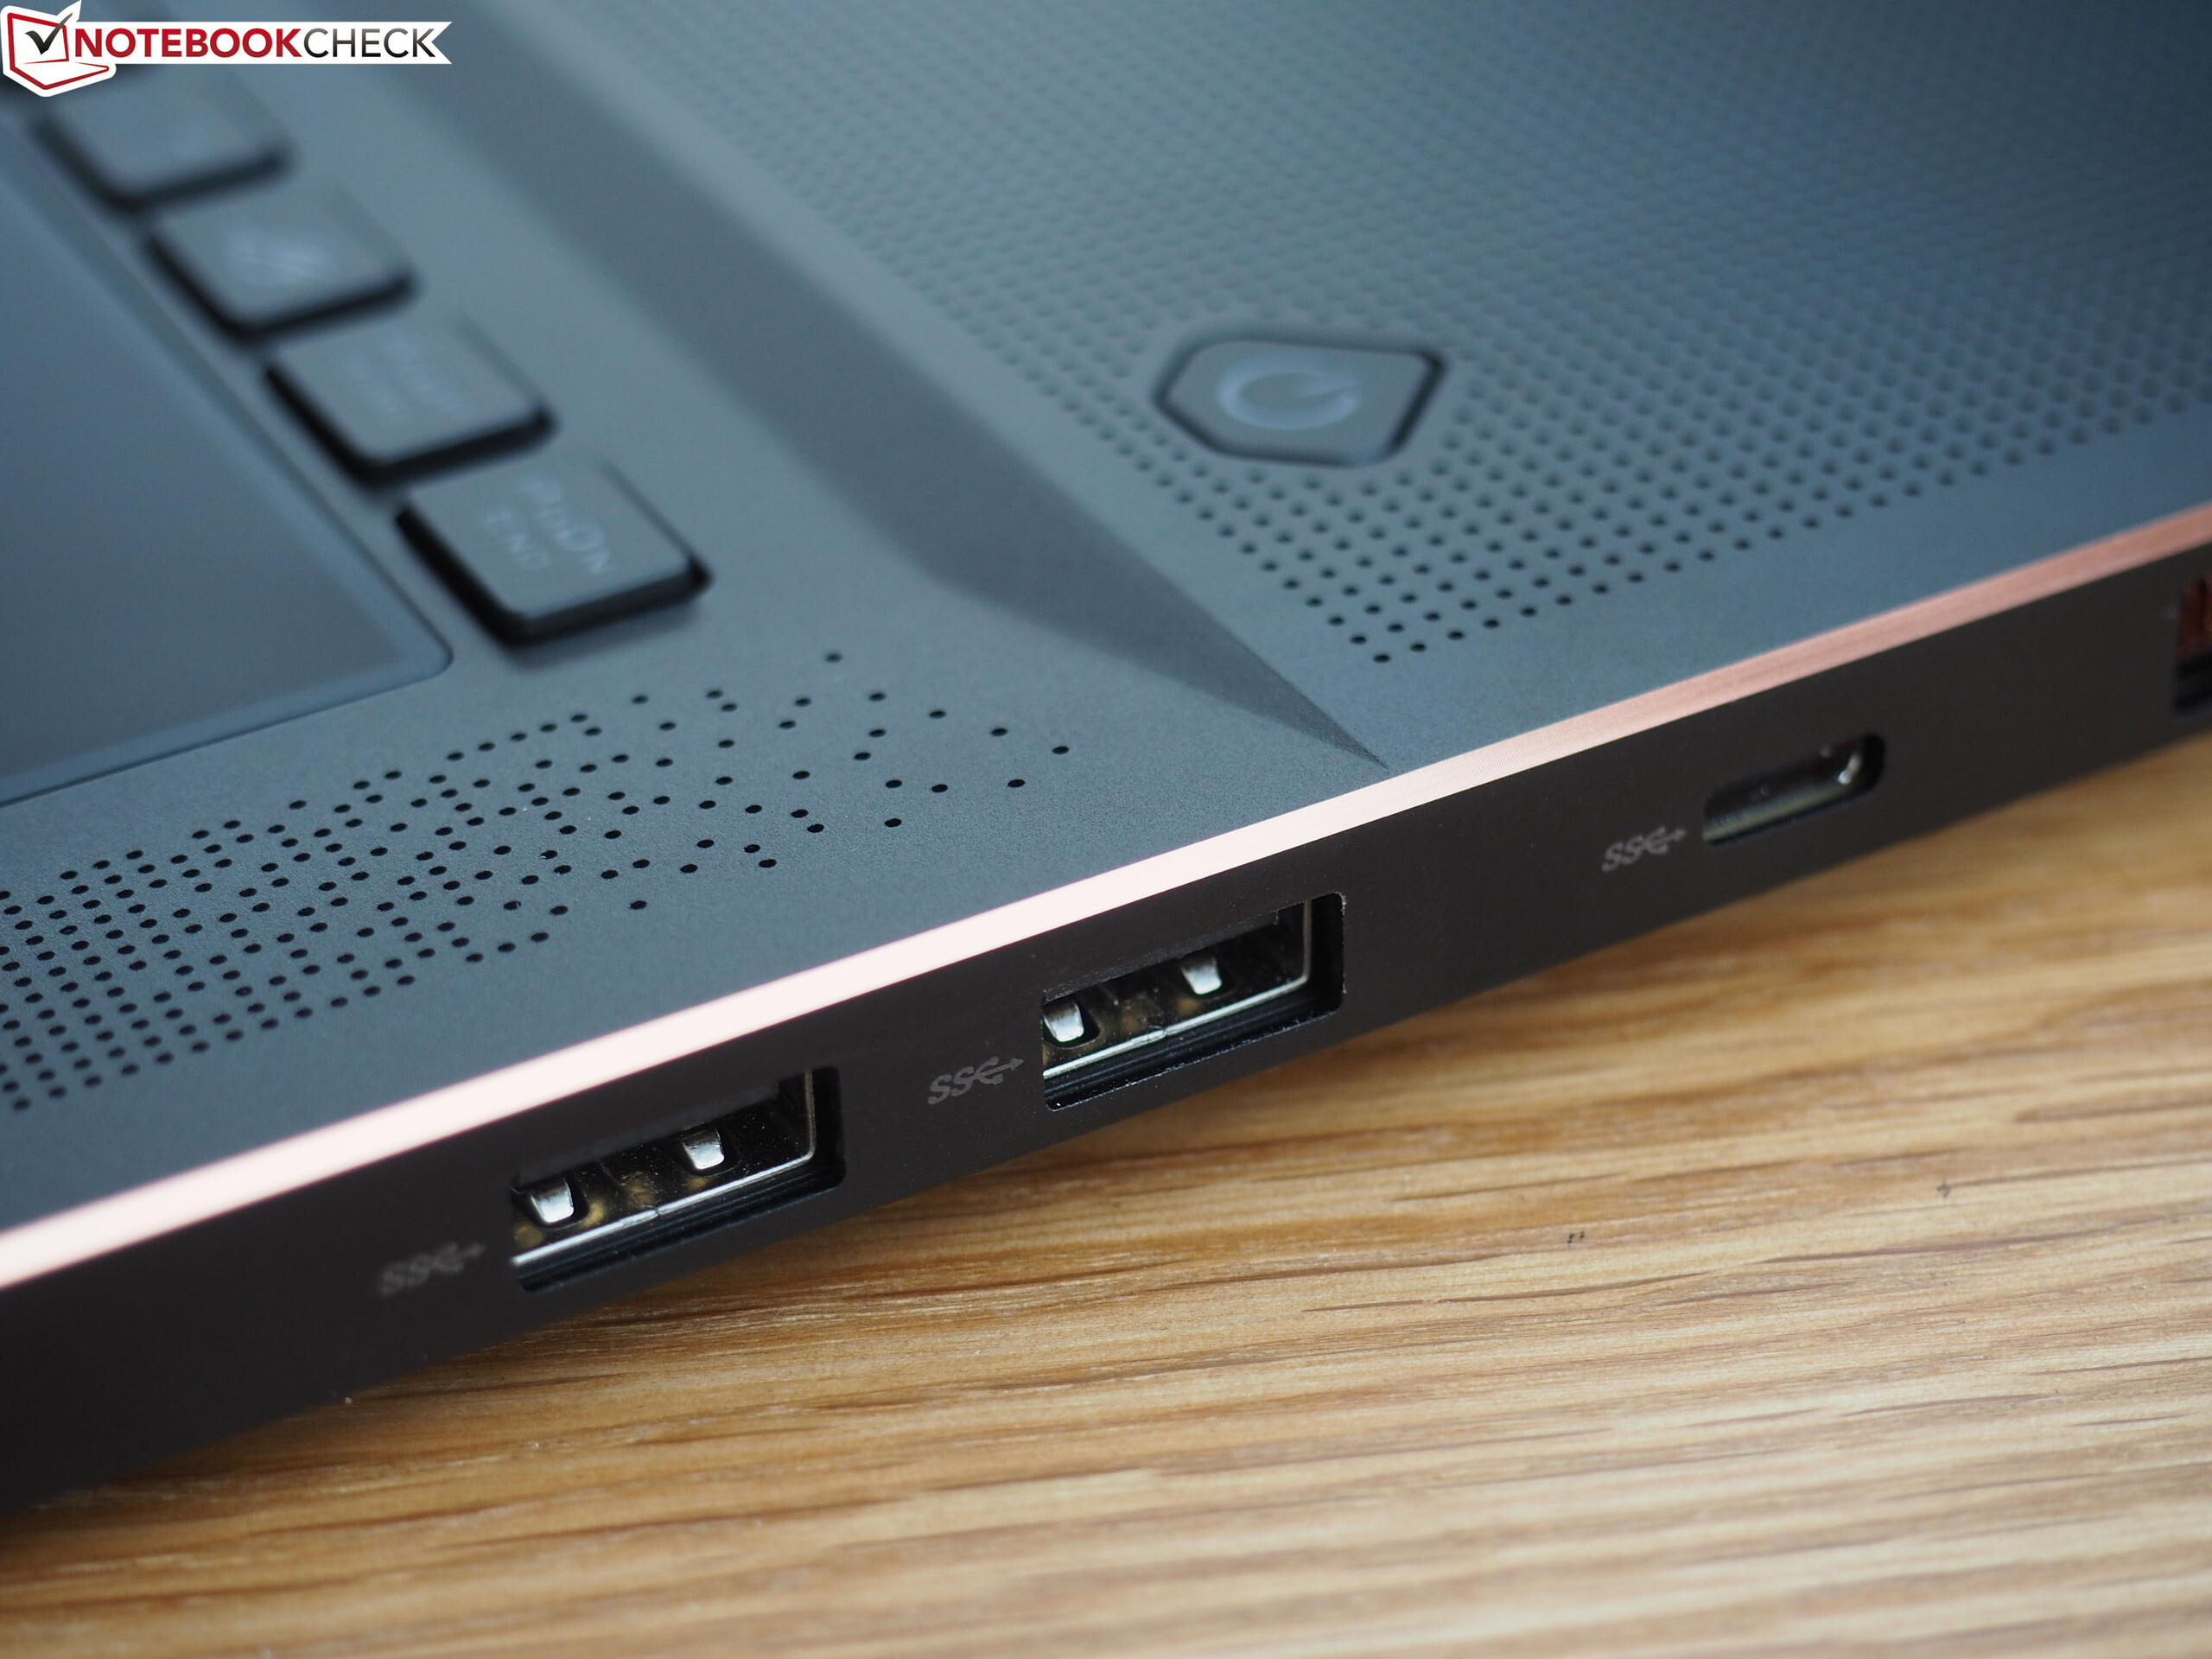
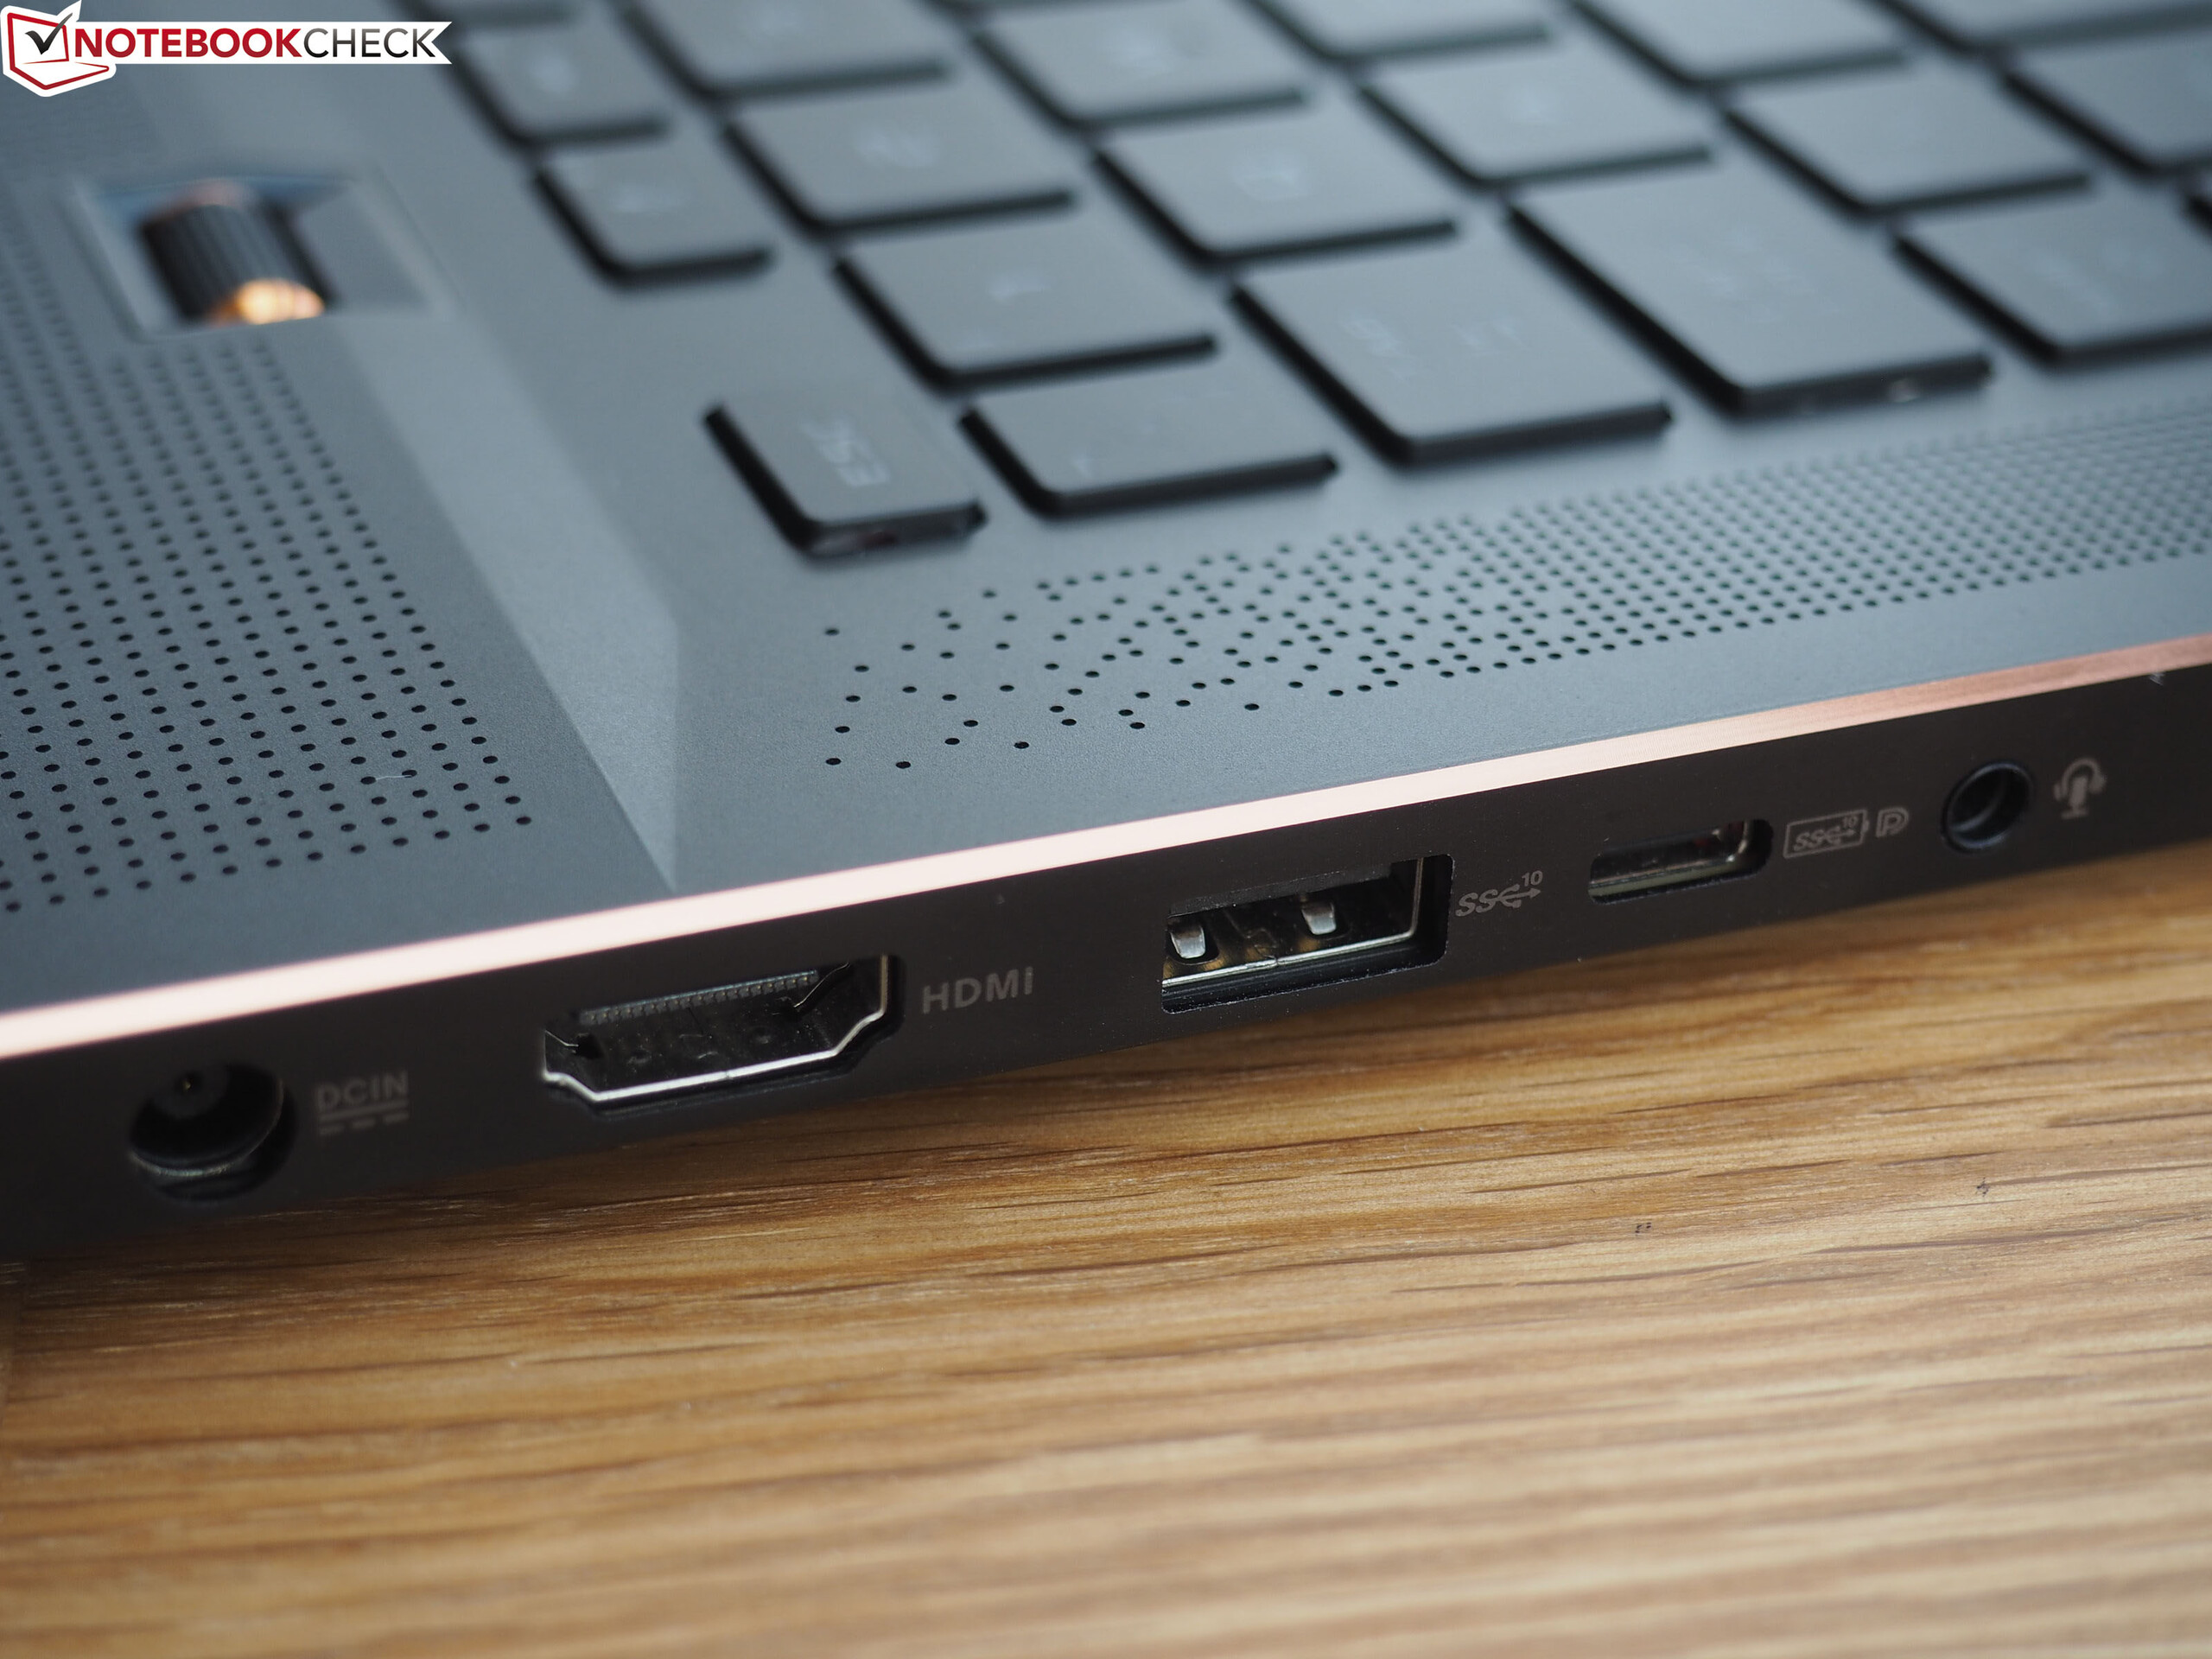
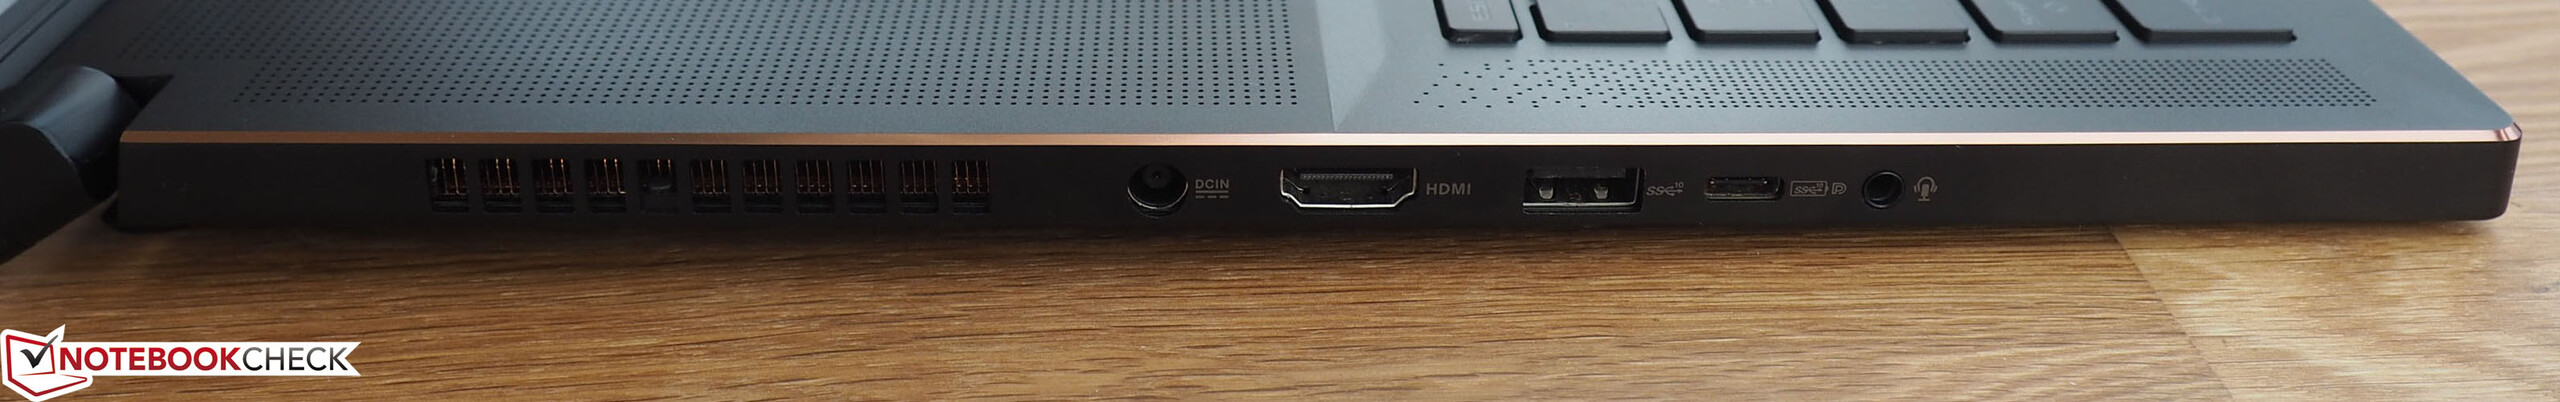
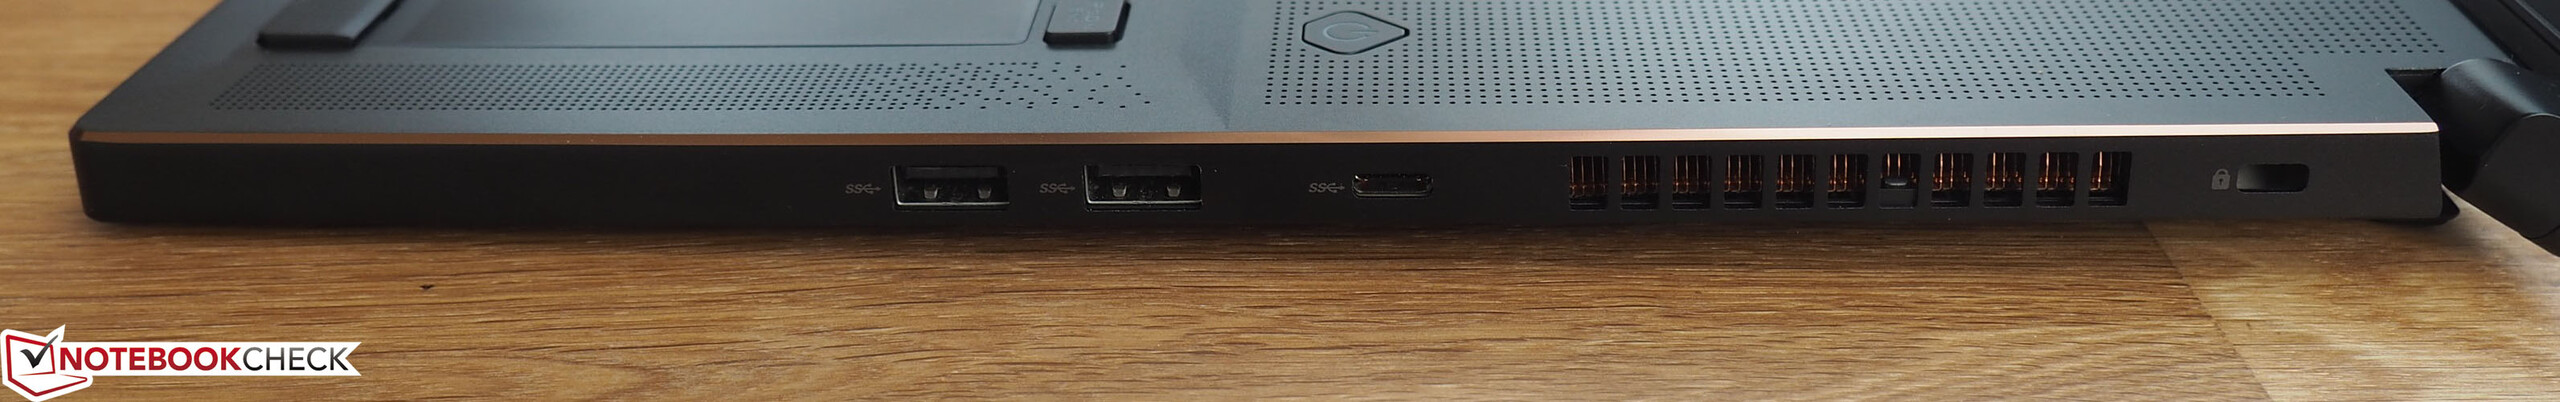
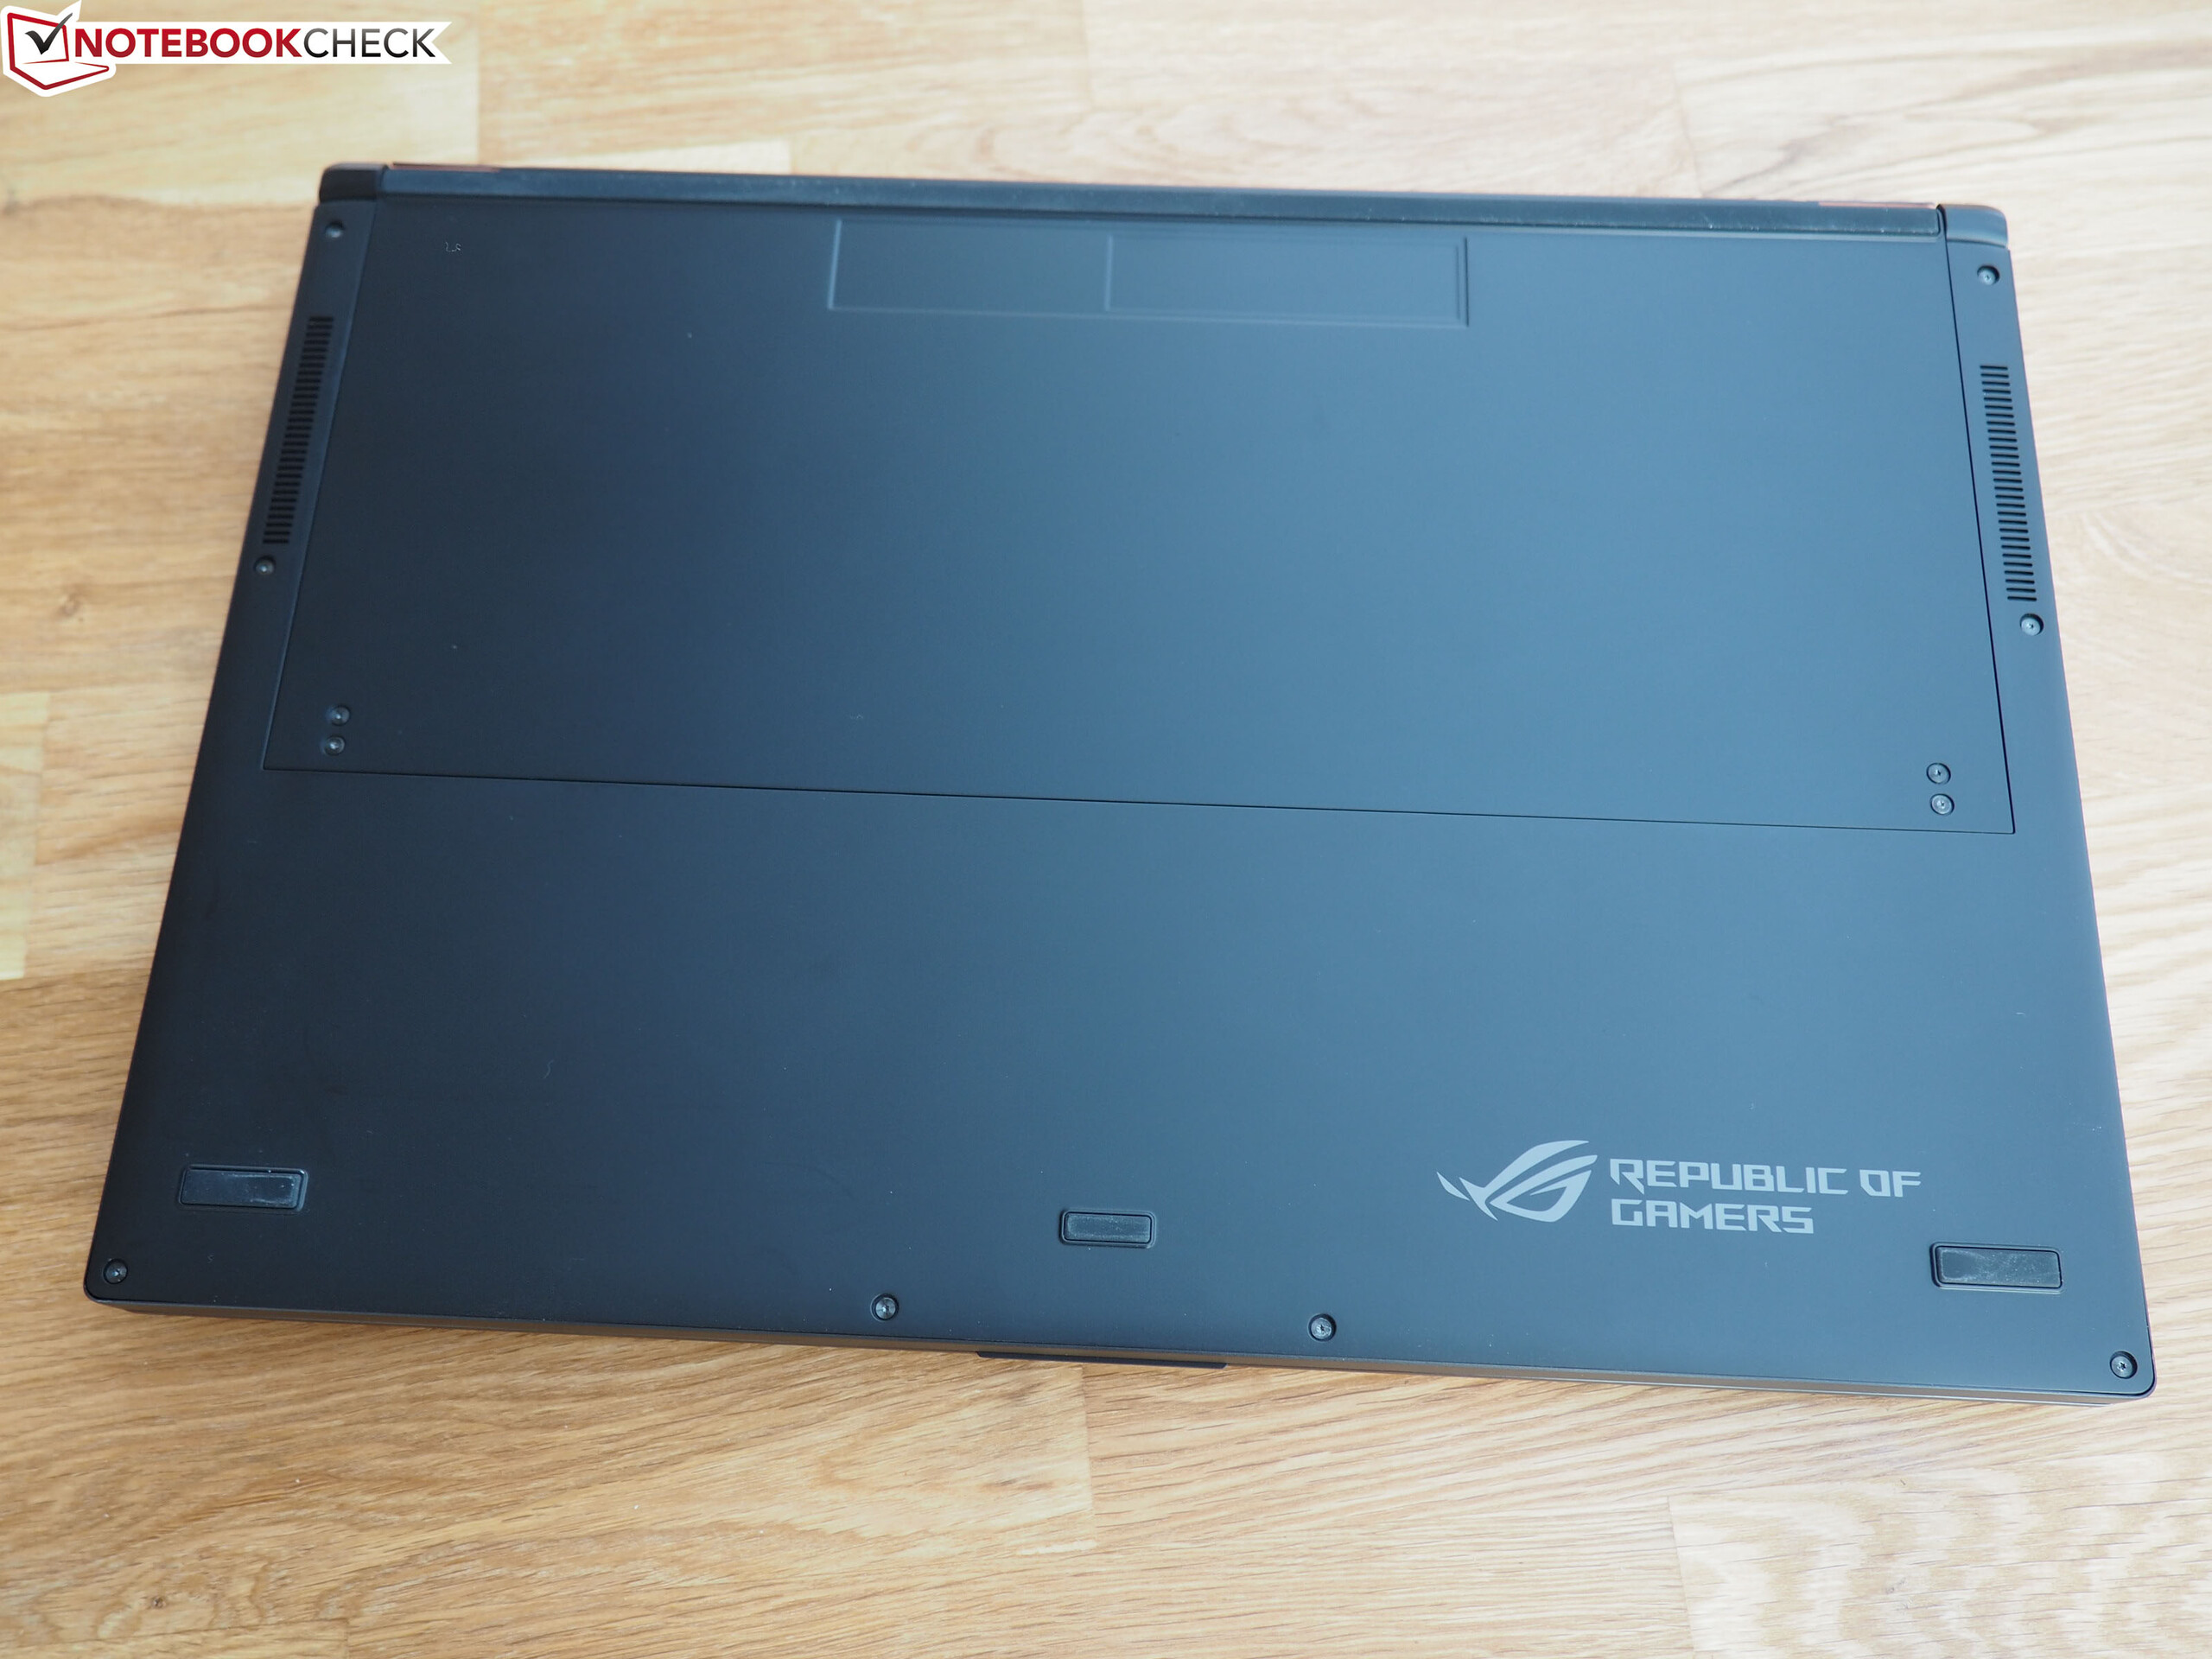
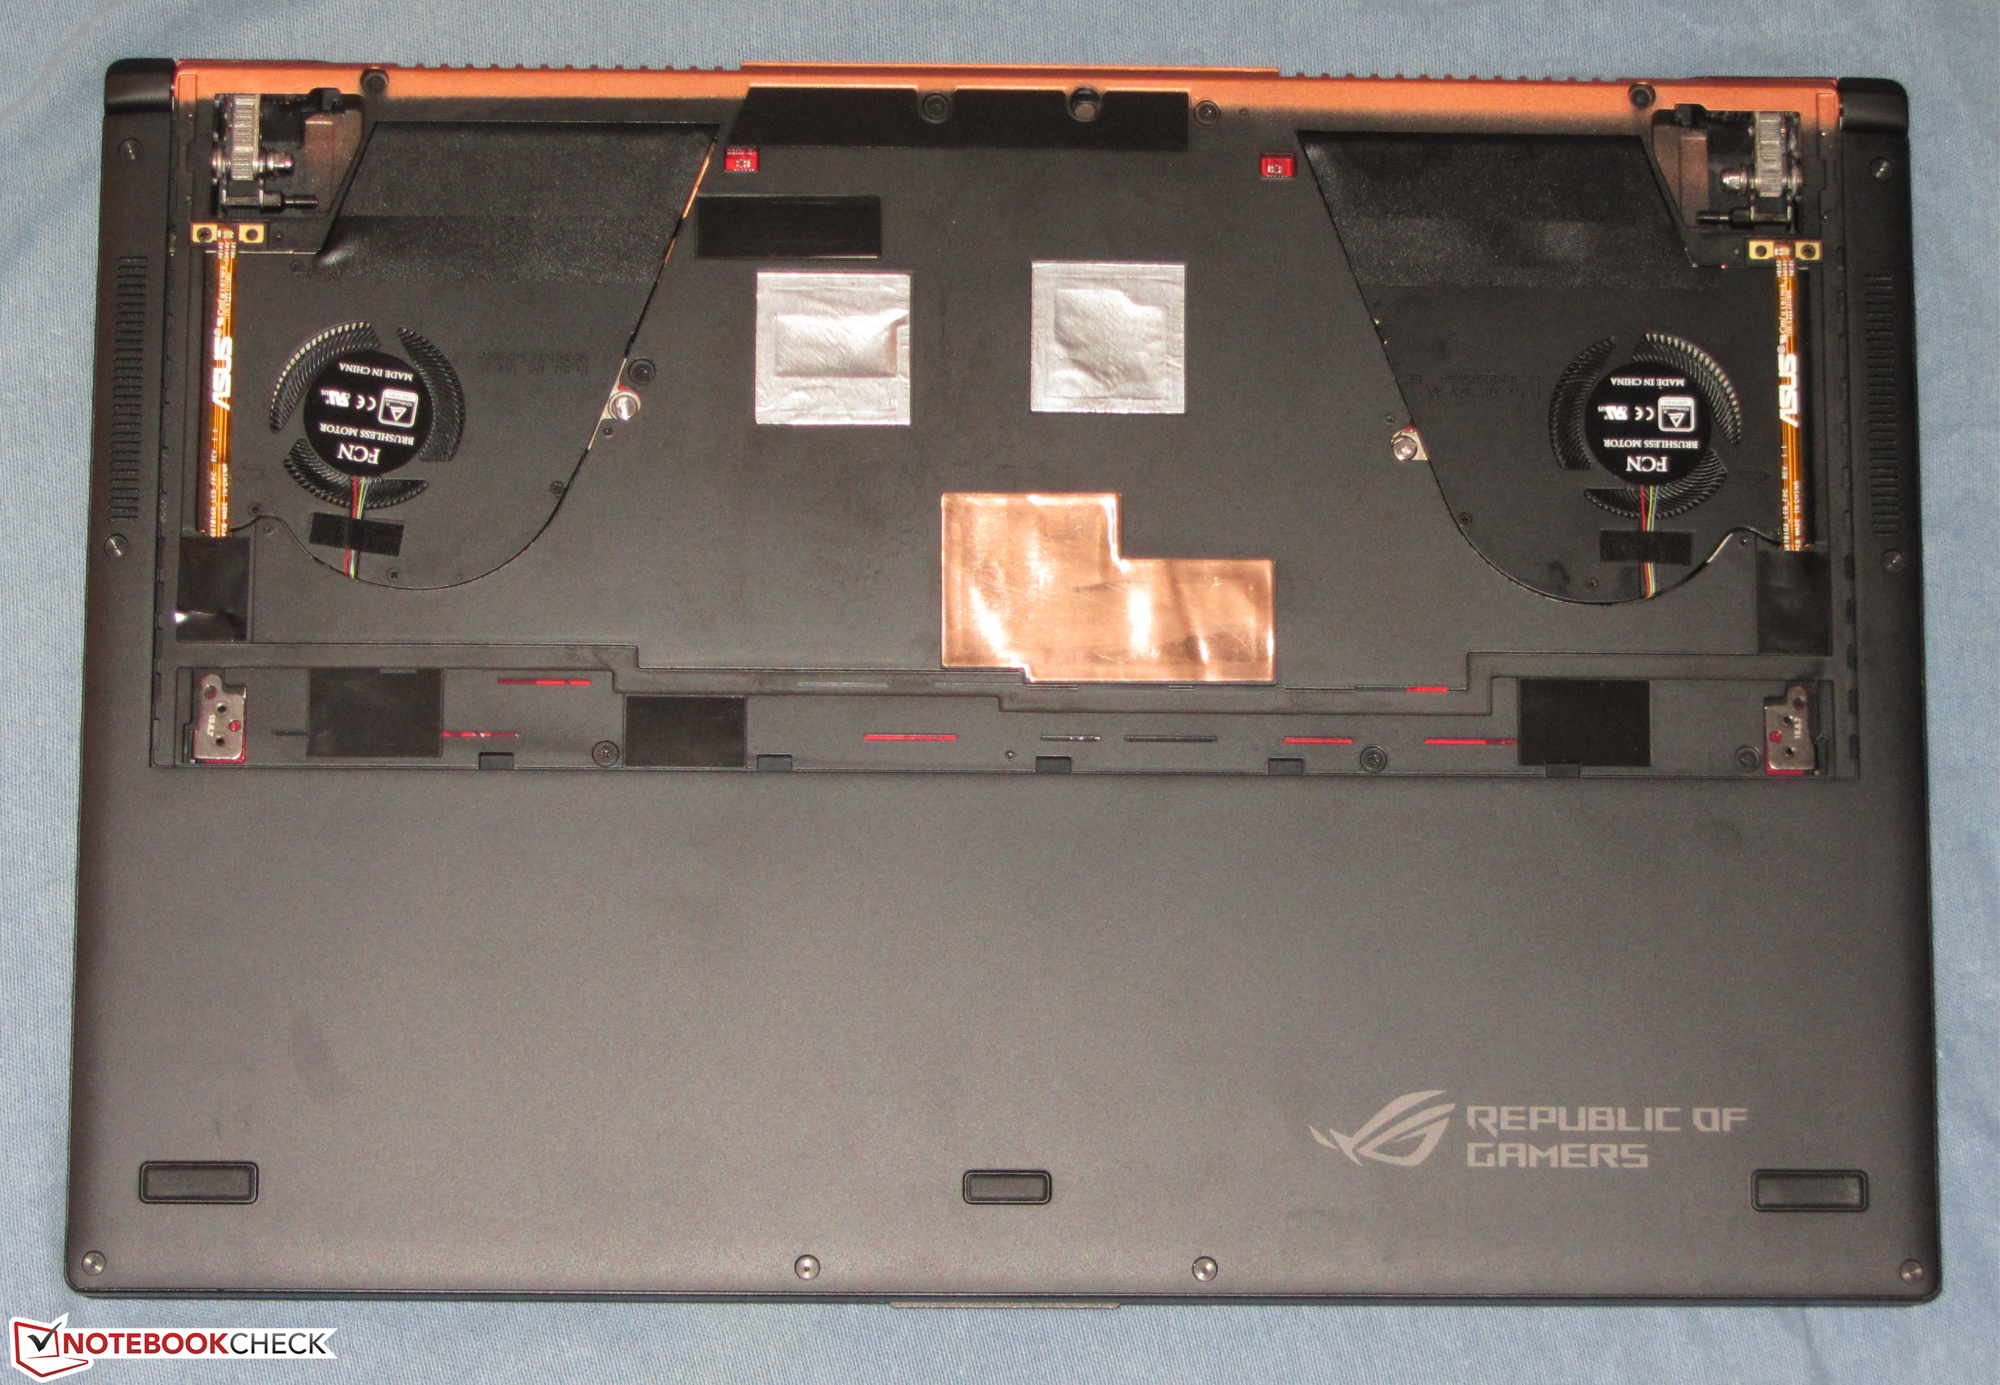
Zephyrus S GX701GXR ile Asus, Core i7-9750H işlemci ve GeForce RTX 2080 Max Q GPU sayesinde mevcut tüm oyunları mat Full HD ekrana sorunsuz bir şekilde getiren 17,3 inçlik kompakt bir oyun dizüstü bilgisayarı sunuyor. Isı ve gürültü gelişimi kabul edilebilir düzeydedir. Pil ömrü kayda değer değildir, ancak entegre GPU'yu etkinleştirerek artırılabilir. 300 Hz IPS ekran, kısa tepki süreleri, sabit görüntüleme açıları, iyi kontrast, X-Rite Pantone sertifikası ve mükemmel renk üretimi ile puan kazanır. maksimum parlaklık biraz fazla düşük. Bu fiyat aralığındaki bir dizüstü bilgisayar bu açıdan daha fazlasını sunmalıdır.Üsteme seçenekleri çok sınırlıdır. Yalnızca bir depolama ortamı (M.2 SSD) takılabilir; 2,5 inç sabit sürücü için yer yoktur. Ayrıca, bilgisayarın yalnızca bir bellek yuvası vardır (16 GB RAM lehimlenmiştir). Takılı 32 GB'den fazla bellek desteklenmiyor. Dahası, davanın açılması birçok rakipten daha karmaşık olduğu ortaya çıkıyor ve limanlar açısından iyileştirme için de yer var. Asus, dizüstü bilgisayarı Thunderbolt 3 bağlantı noktasıyla donatmaz ve yalnızca iki USB Type-C 3.1 bağlantı noktasıyla (1x Gen 1, 1x Gen 2) donatır. Aygıt ayrıca bir bellek kartı okuyucu veya bir Ethernet bağlantı noktası sağlamaz. Yükseltme / bakım veya bağlantı noktası seçimi açısından daha fazlasını bekleyen kullanıcılar bir rakip cihaza başvurmalıdır - örneğin, Razer Blade Pro 17 veya Gigabyte Aero 17 XA.
Asus ROG Zephyrus S GX701GXR
- 05/14/2020 v7 (old)
Sascha Mölck