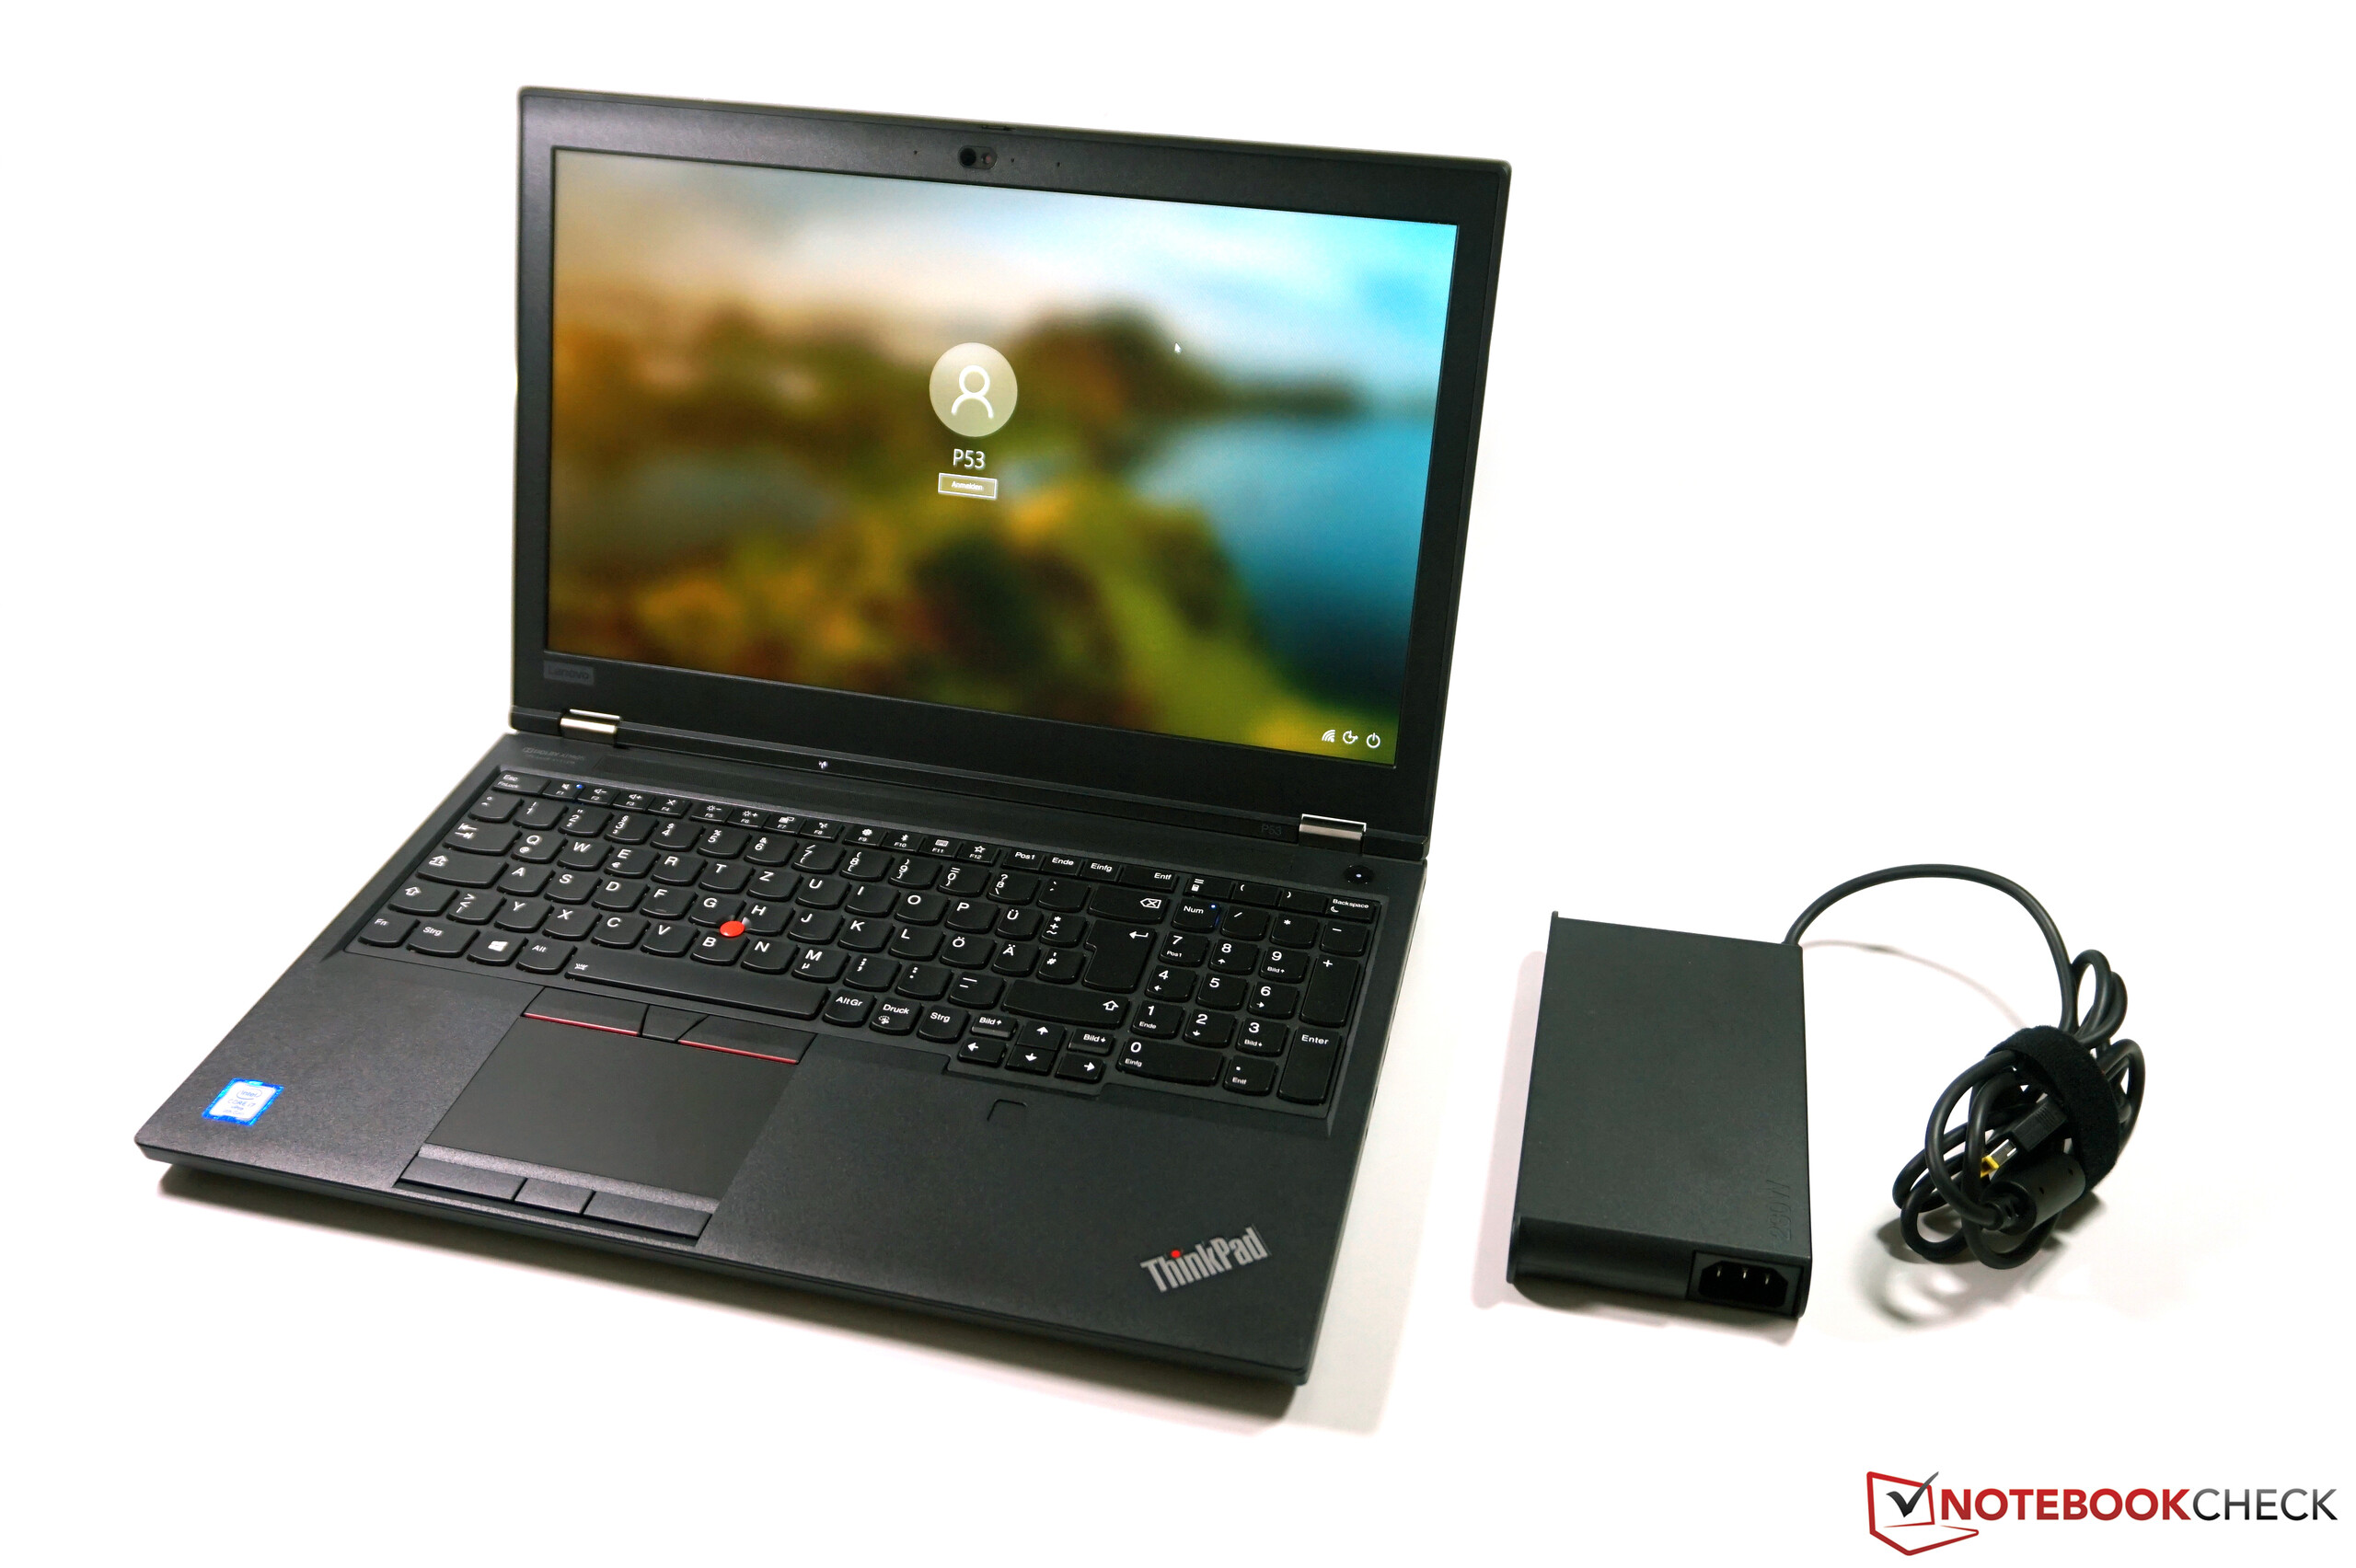
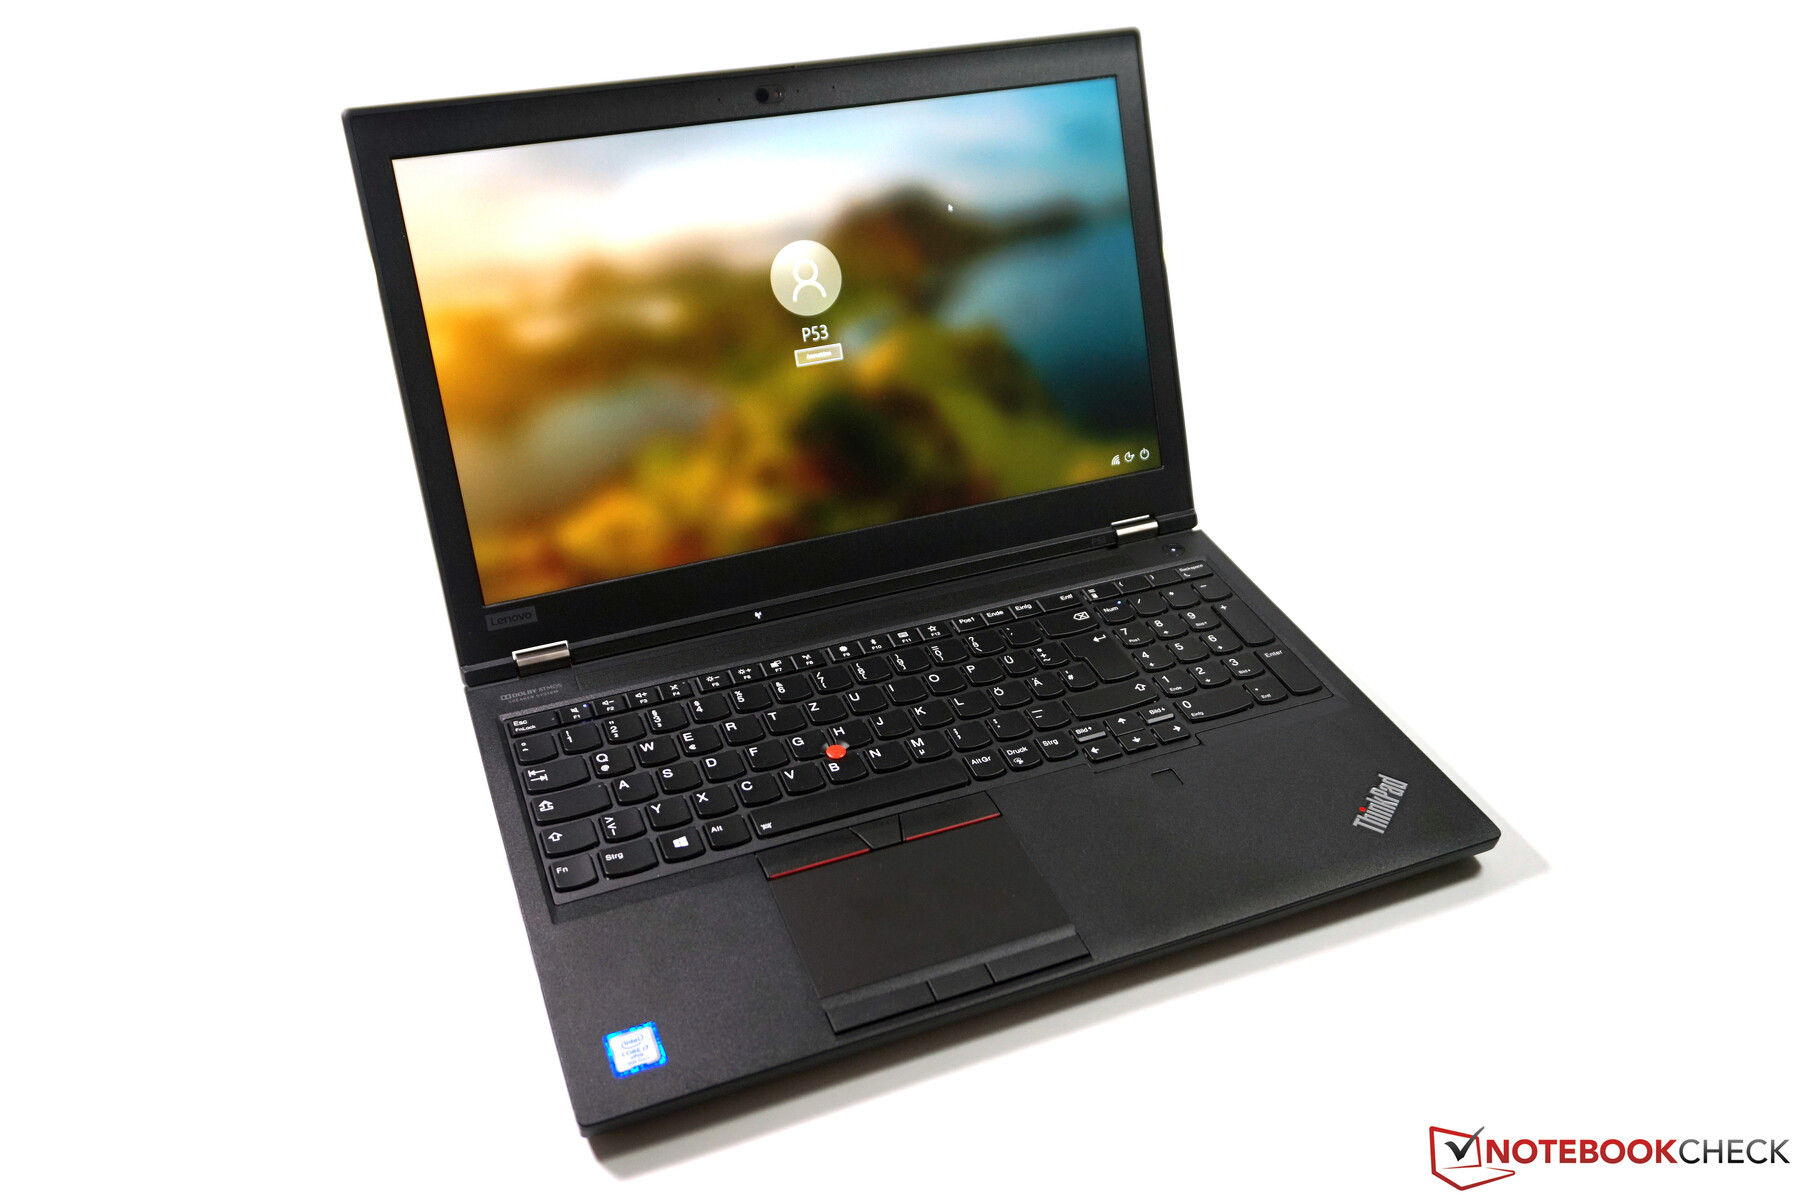
İnceleme: Lenovo ThinkPad P53, GPUsu kuvvetli klasik iş istasyonu
ThinkPad P53 ile Lenovo, sunulan geleneksel 15,6 inçlik mobil iş istasyonuna sahiptir. Bu durumda, geleneksel, örneğin ThinkPad P1 2019'dan farklı olarak, çok ince veya hafif bir cihaz olmadığı gerçeğine işaret ediyor. Buna karşılık, kullanıcılar daha hızlı donanımın avantajlarından (özellikle GPU açısından), daha fazla porttan ve daha fazla genişletilebilirlikten yararlanıyor. ThinkPad P53, neredeyse hiç üst sınır olmadan 1.800 Euro'dan (~ 1.984) başlıyor. En yüksek seviye yapılandırma (Xeon, RTX 5000, OLED, 3x SSD, 128 GB RAM) yaklaşık 8.000 Euro'ya (~ 8,816 $) mal olur. Çekirdek i7, RTX 5000, Full HD panel, 32 GB RAM ve 1 TB SSD ile birlikte gelen test modelimiz yaklaşık 4.500 Euro (~ 4.959 $) civarında olmasına rağmen maliyetin bir kısmı.
Derecelendirme | Tarih | Modeli | Ağırlık | Yükseklik | Boyut | Çözünürlük | Fiyat |
|---|---|---|---|---|---|---|---|
| 89.8 % v7 (old) | 12/2019 | Lenovo ThinkPad P53-20QN000YGE i7-9850H, Quadro RTX 5000 Max-Q | 2.7 kg | 29.4 mm | 15.60" | 1920x1080 | |
| 87.8 % v7 (old) | 09/2019 | Lenovo ThinkPad P1 2019-20QT000RGE i7-9850H, Quadro T1000 (Laptop) | 1.7 kg | 18.4 mm | 15.60" | 1920x1080 | |
| 86.9 % v7 (old) | Dell Precision 7530 i9-8950HK, Quadro P3200 | 2.6 kg | 29.95 mm | 15.60" | 3840x2160 | ||
| 85.6 % v6 (old) | Fujitsu Celsius H780 i7-8850H, Quadro P2000 | 2.8 kg | 31.9 mm | 15.60" | 1920x1080 | ||
| 85 % v7 (old) | 08/2019 | MSI P65 Creator 9SF-657 i9-9880H, GeForce RTX 2070 Max-Q | 1.9 kg | 18 mm | 15.60" | 3840x2160 |
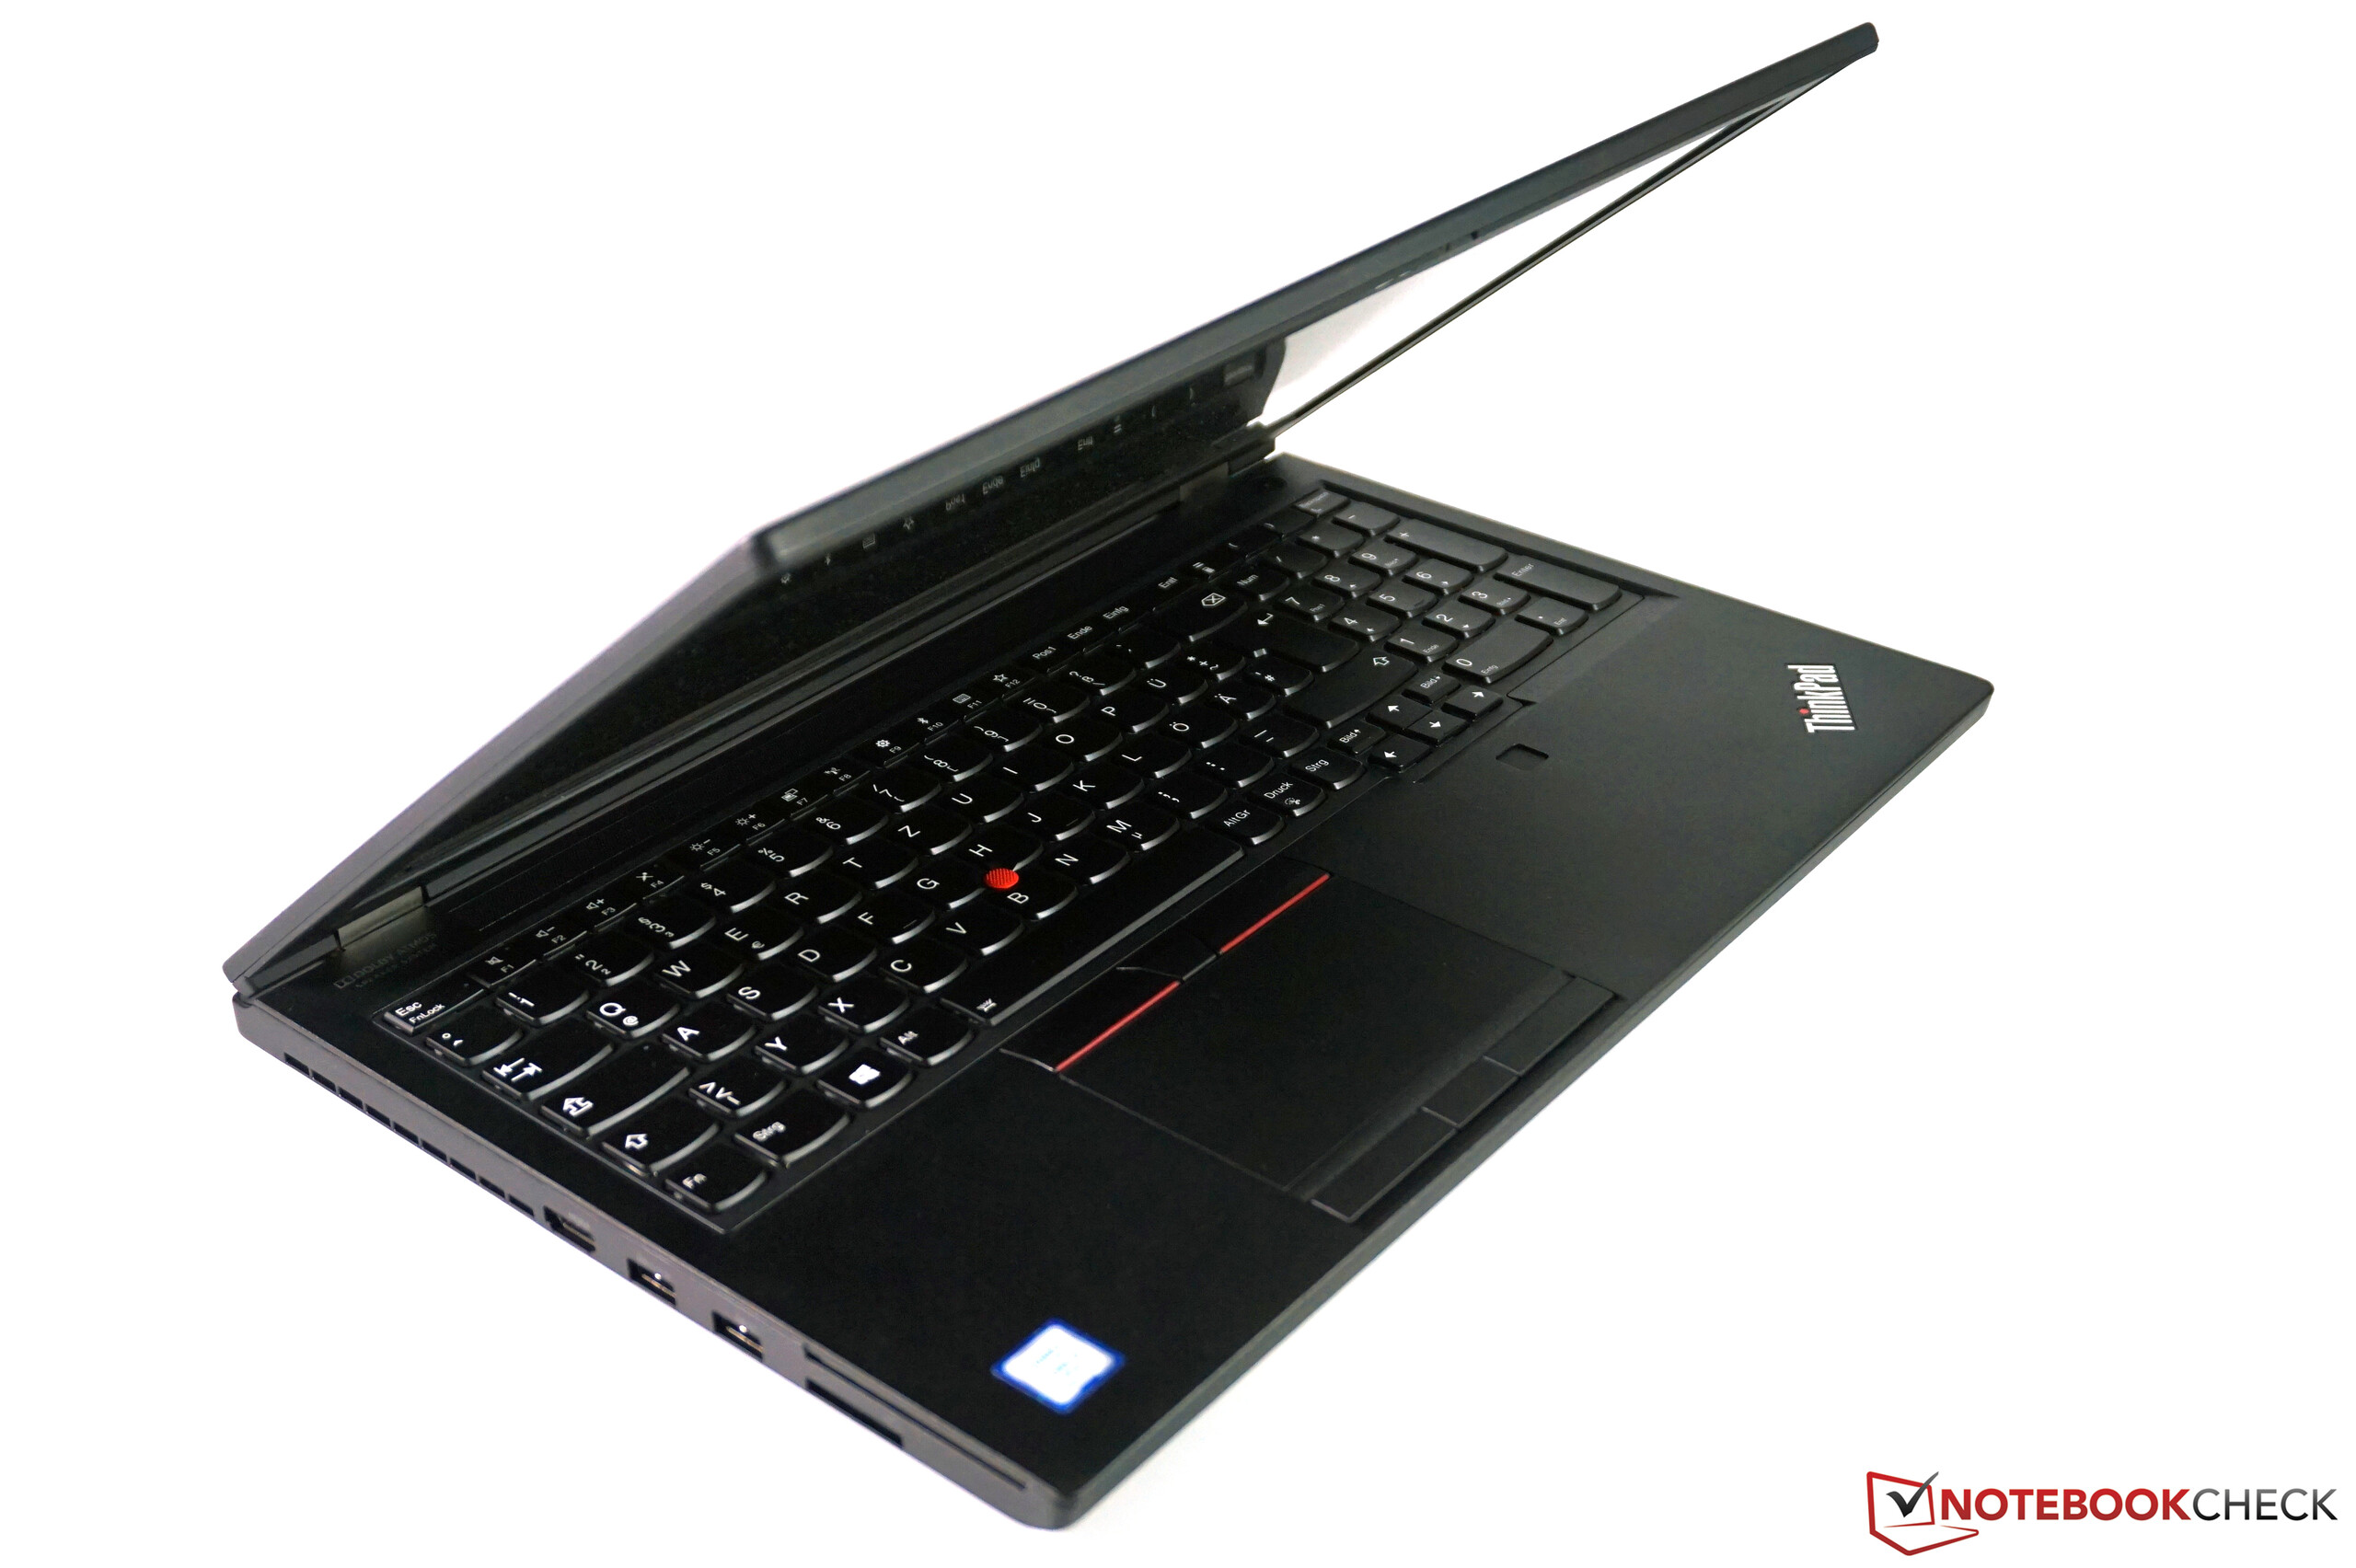
şasi
Profesyonel modellere yönelik kasa güncellemeleri genellikle iki yıllık bir süreyi takip eder. Lenovo ThinkPad P-5x serisine gelince, durum böyle değil ve geçen yılın P52'si kapsamlı bir güncellemeden daha facelift. ThinkPad P53, en azından dışarıdan aynı eğilimi izler. Limanlar açısından farklılıkların yanı sıra, siyah plastik yüzeyler dahil olmak üzere P53'ün görselleri değişmeden kalmaktadır. Buna karşılık, iç kısımda çok şey değişti. Teşekkürler, bu sertliği veya yapı kalitesini olumsuz yönde etkilemez ve ThinkPad, inşaat açısından herhangi bir kusur olmadan hala çok katı bir cihazdır. Baz ünite bükülmez, belirgin şekilde verim vermez ve sinir bozucu bir creaking de yoktur. Her iki menteşe çok sert ve sağlam bir şekilde sallanmayı önleyebilse de, kapağı yerine oturduğu yerde küçük açılarla destekleyemezler. Kapaktan bahsetmişken, P53'ün kapağı ince çerçeve eğiliminden haberdar görünmüyor. Kapağın kendisi ana ünite kadar sert olmasa da, burada stabilite açısından da bir problem yoktur. Şasi konusundaki izlenimimiz genel olarak iyidir, ancak rakip HP ve özellikle Dell alternatifleri (büyük miktarda metal ve lastik yüzeylere sahip) rekabet ederken daha da kaliteli görüntüler elde etmenizi sağlar.
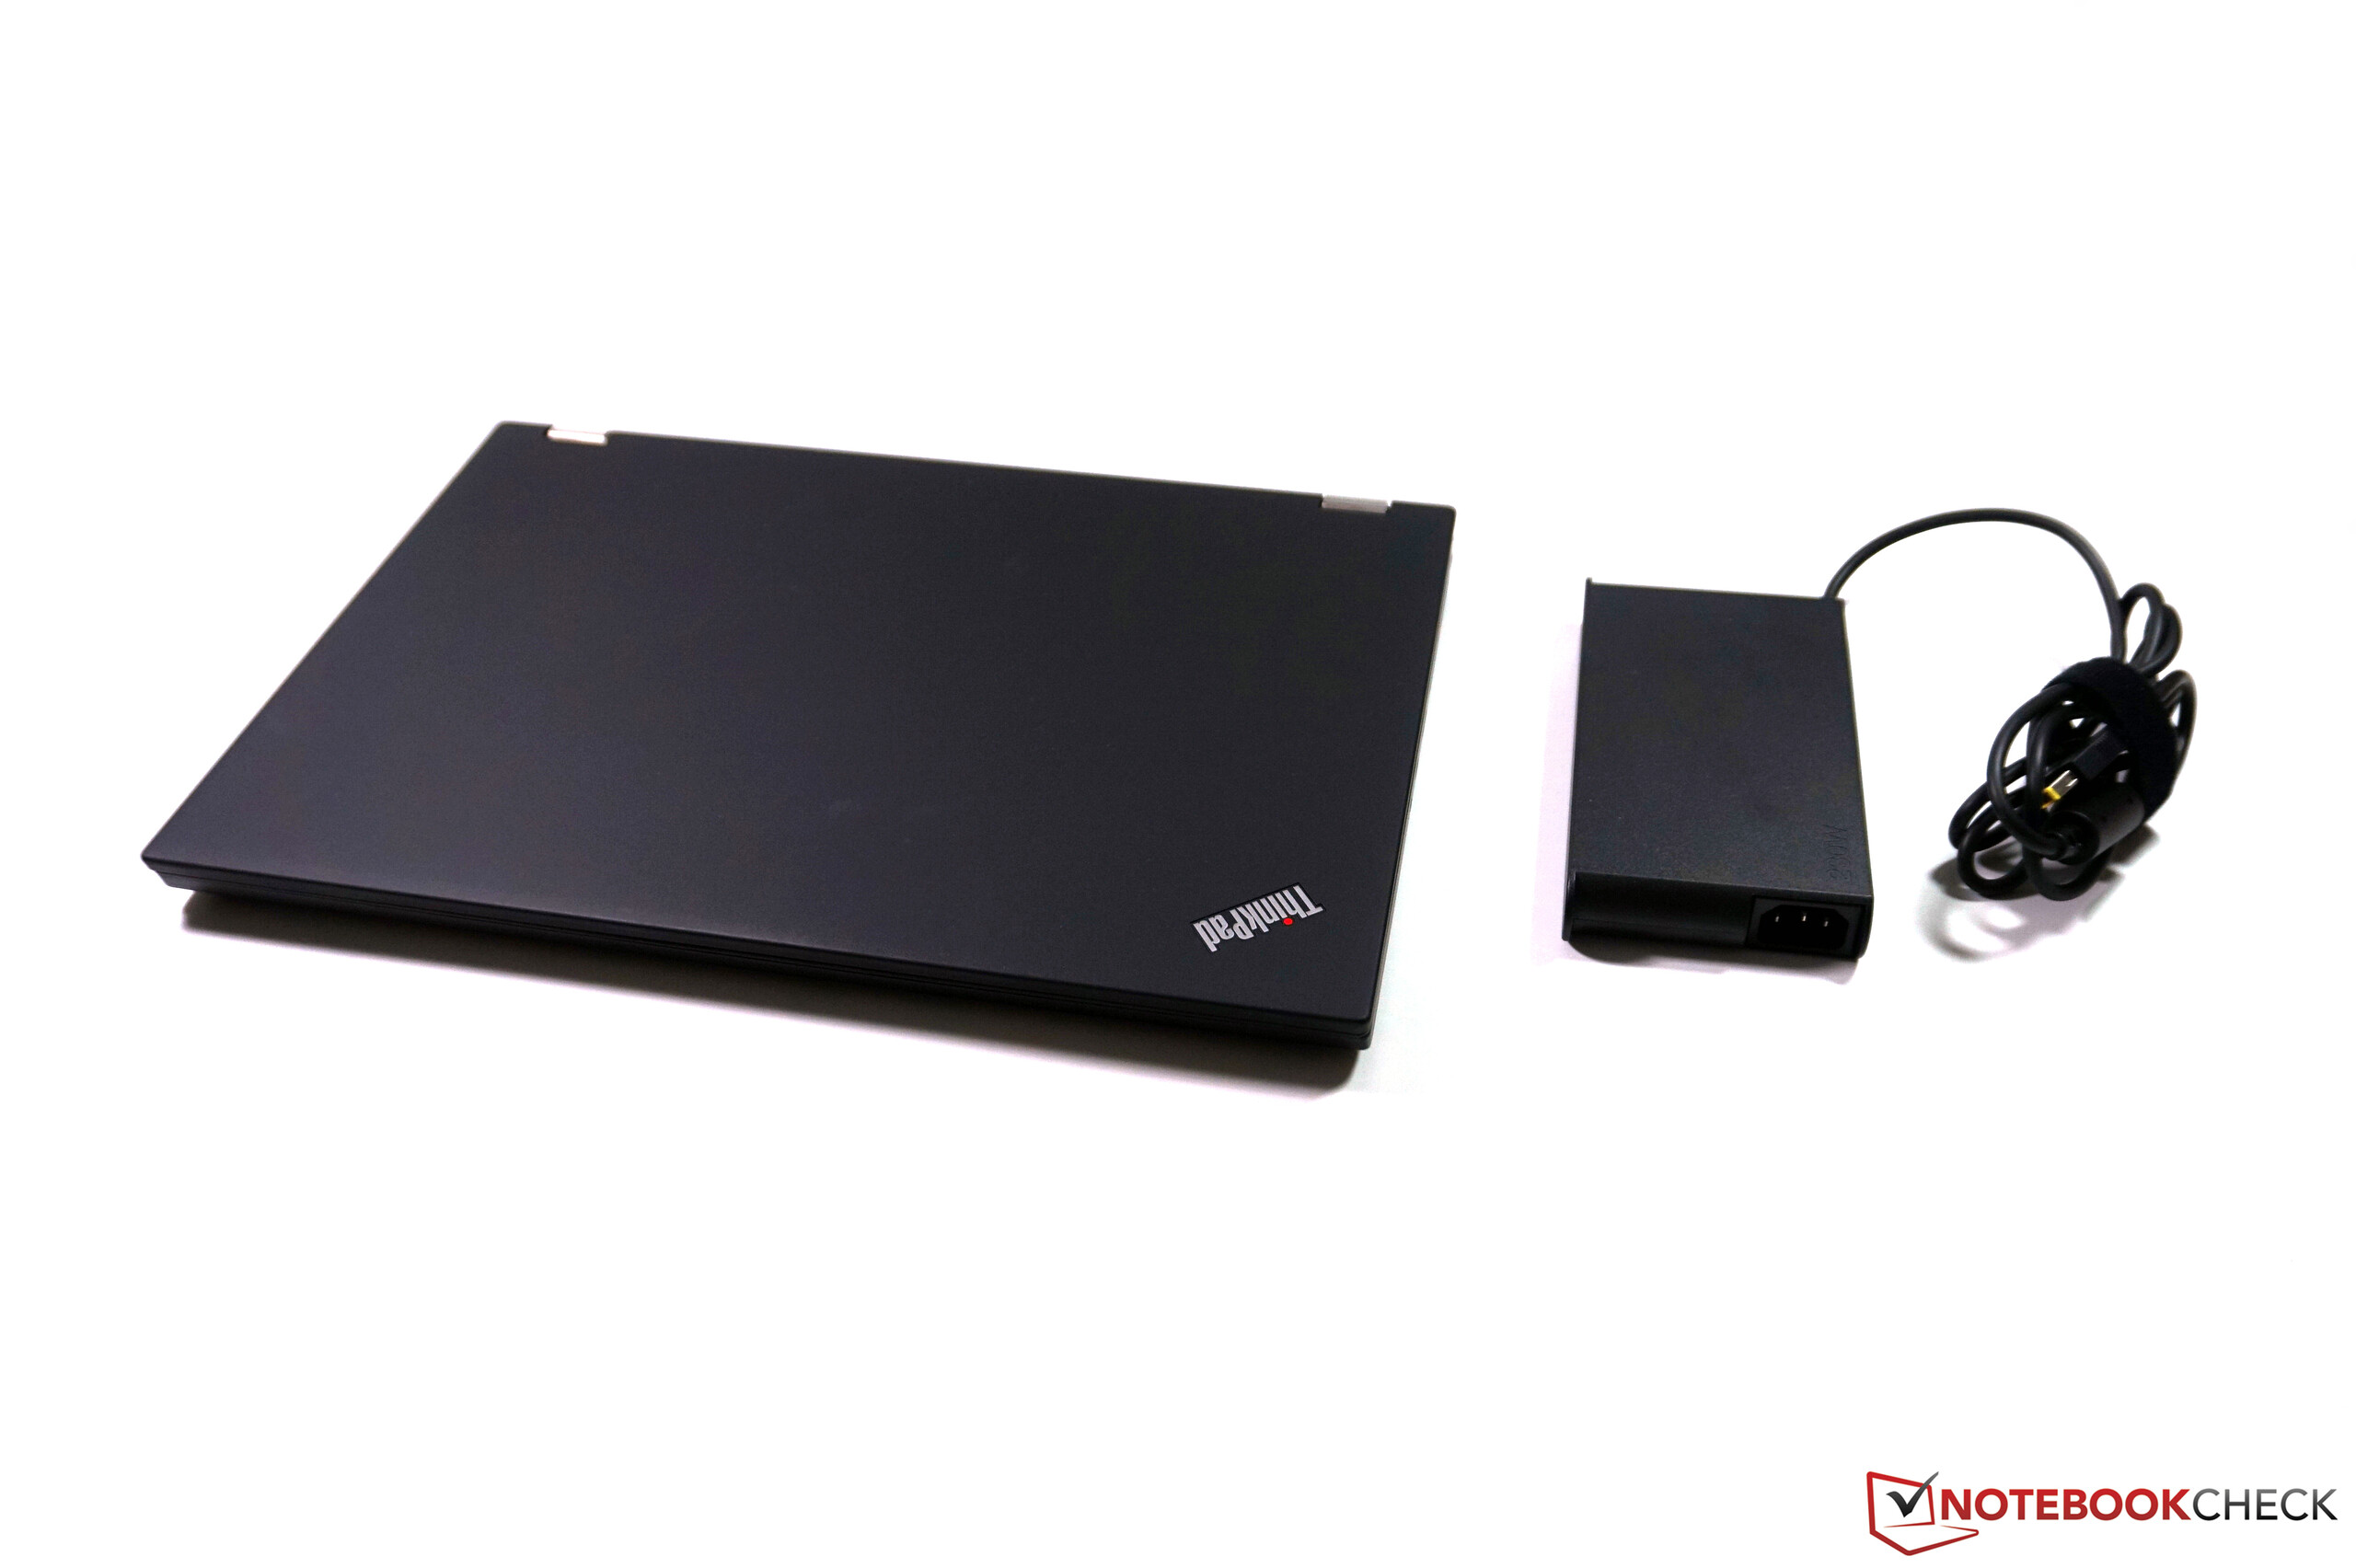
Boyutlar öncekine göre değişmeden kalır ve ağırlık bakımından sadece küçük farklılıklar vardır (bu, yapılandırmaya bağlı olarak değişebilir). Ekran seçimi önemli bir özellik olmaya devam ediyor, çünkü mat ekranlı versiyonlar yansıtıcı panelli modellerden yaklaşık 400 gram (~ 14 oz) daha az. Bununla birlikte, ikincisi, ThinkPad P53'ün yalnızca 4K OLED ekran değişkeni için geçerlidir.
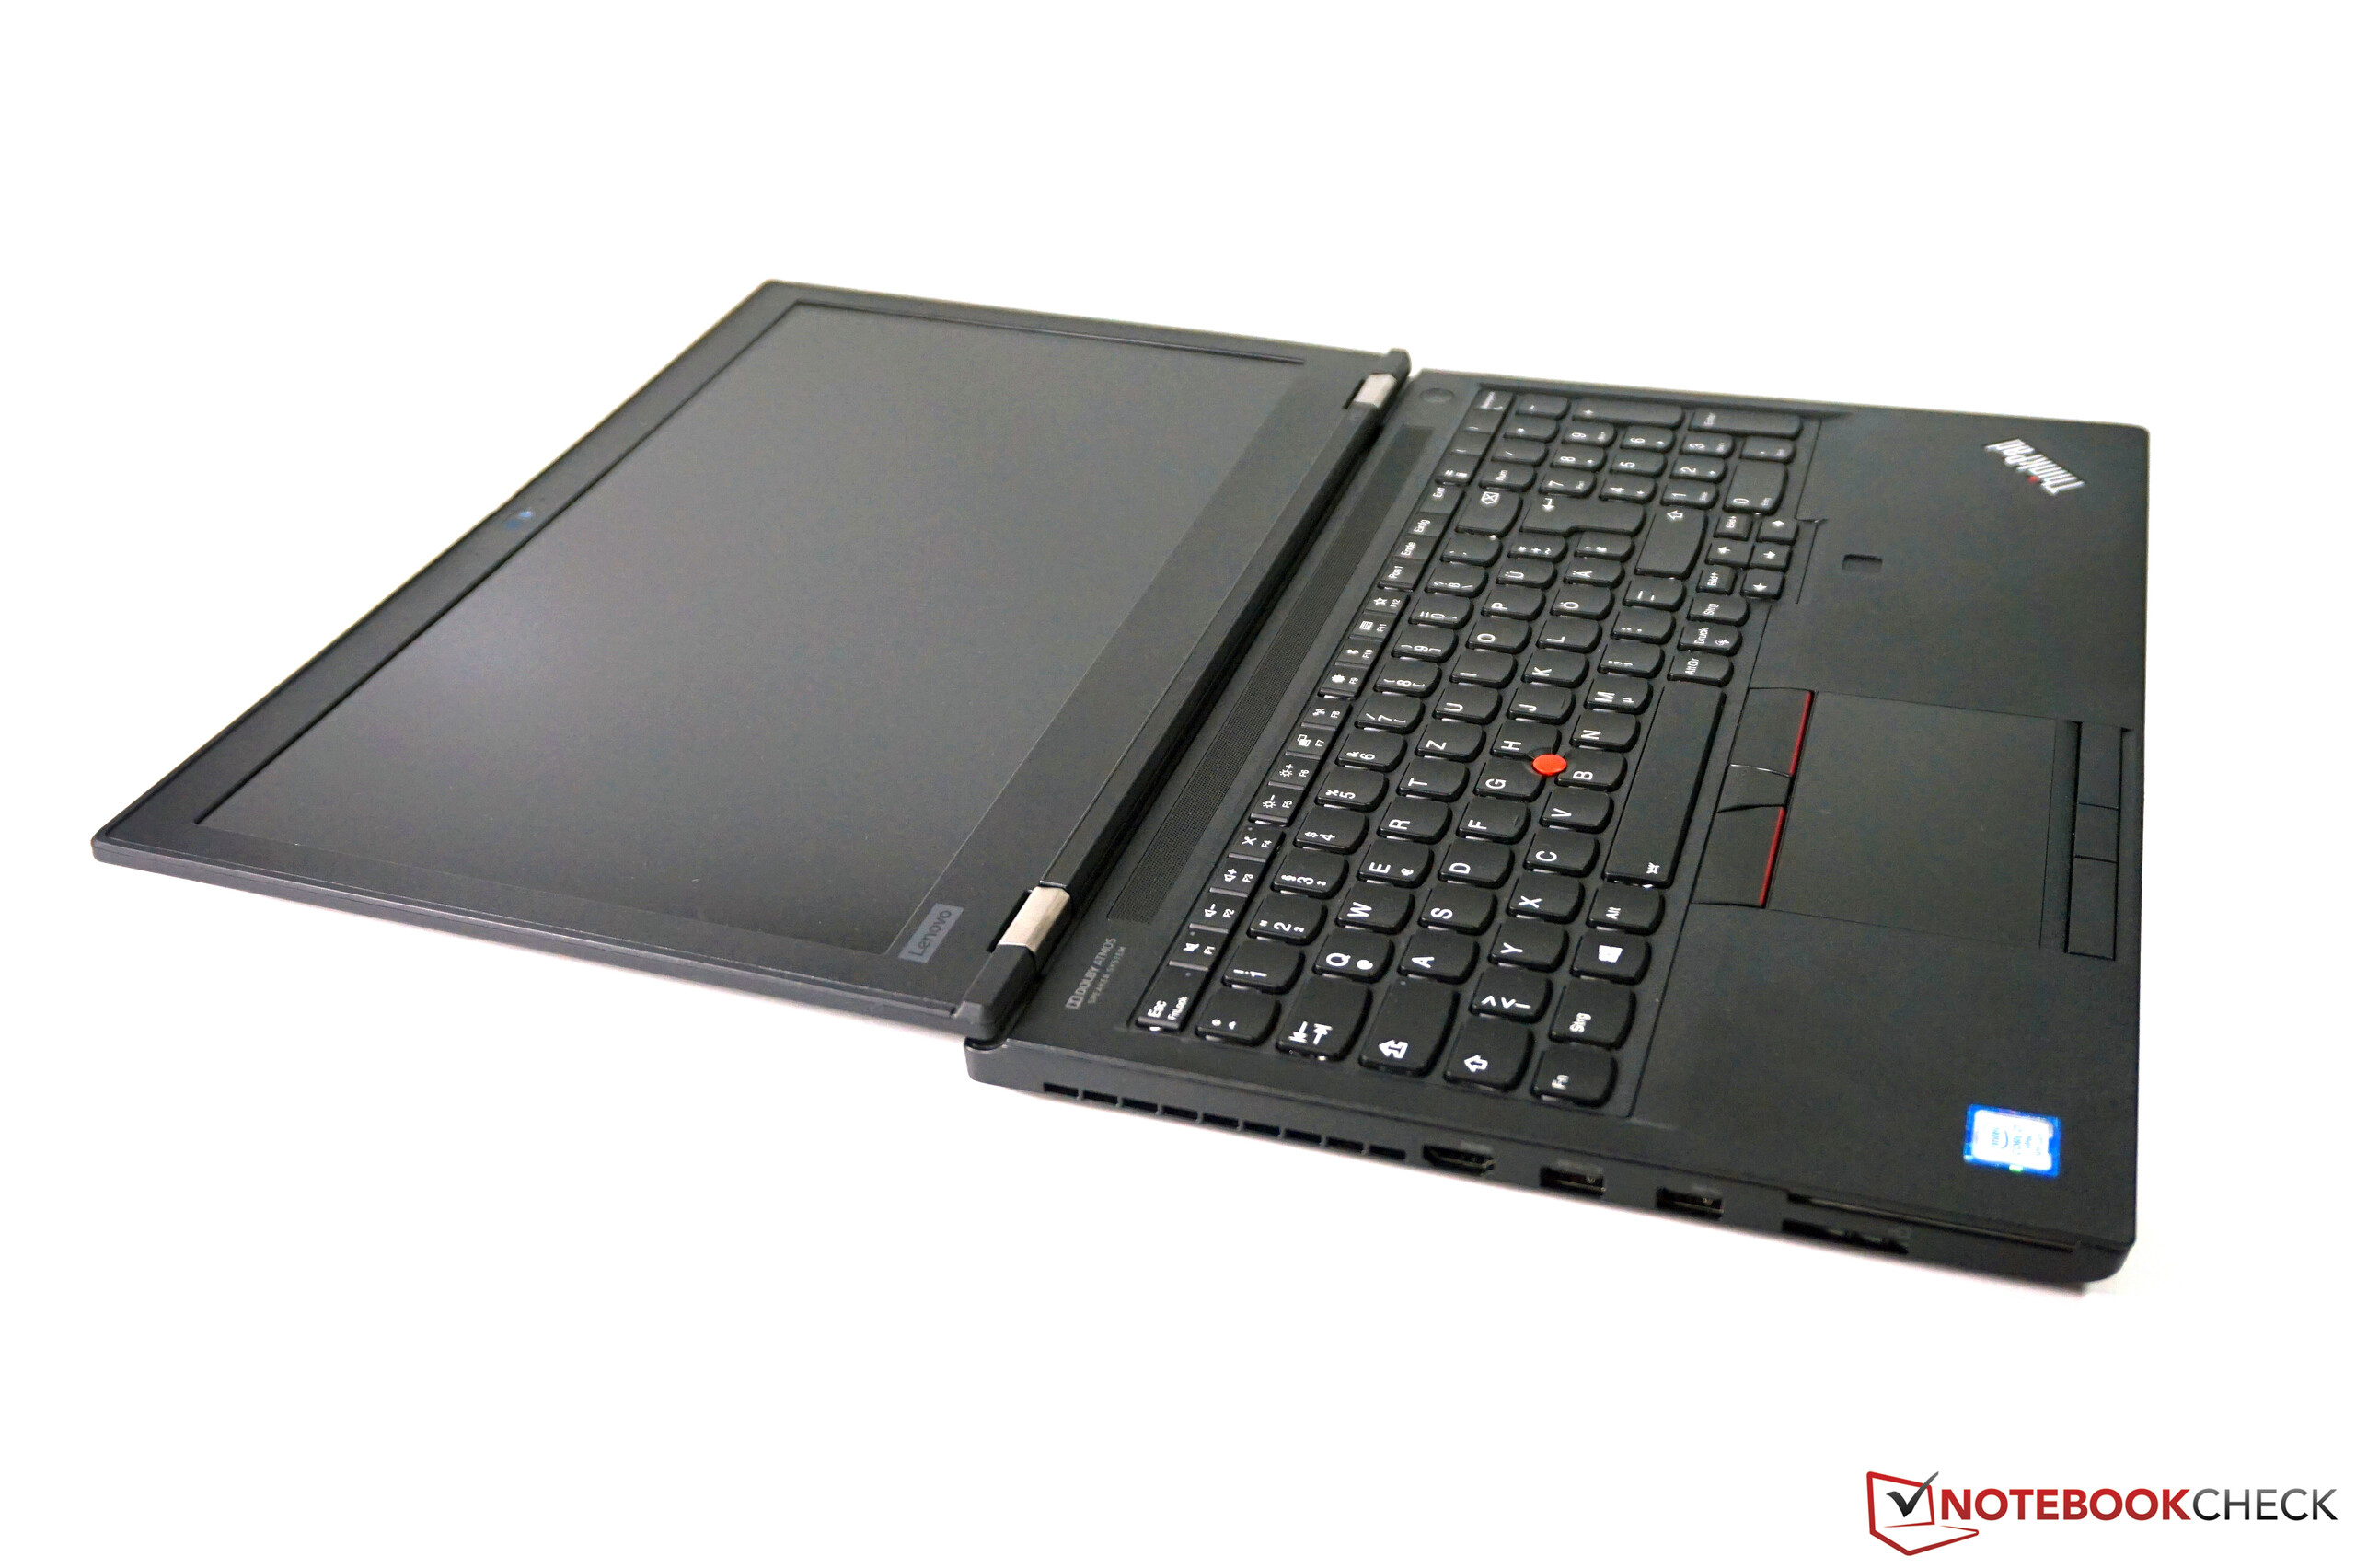
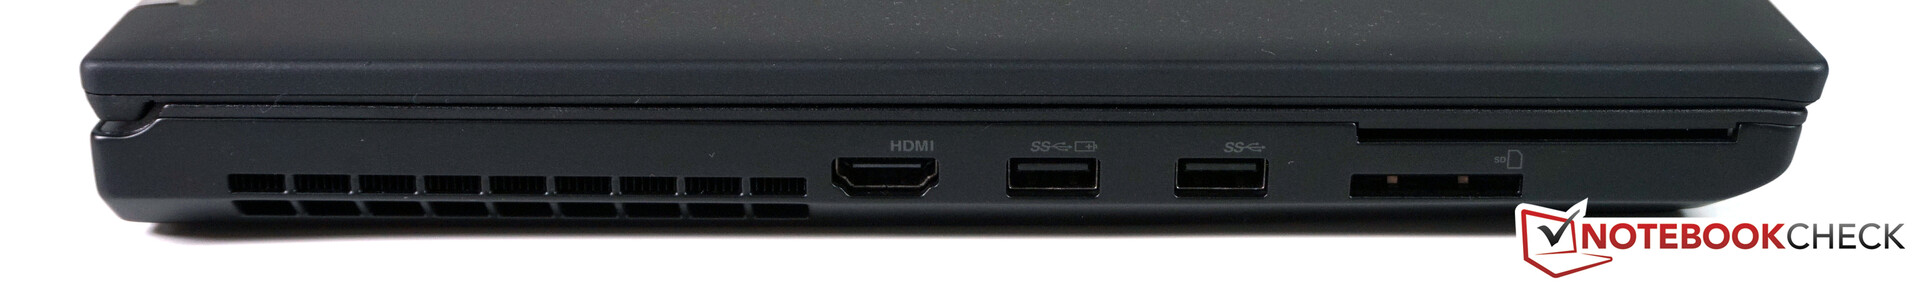
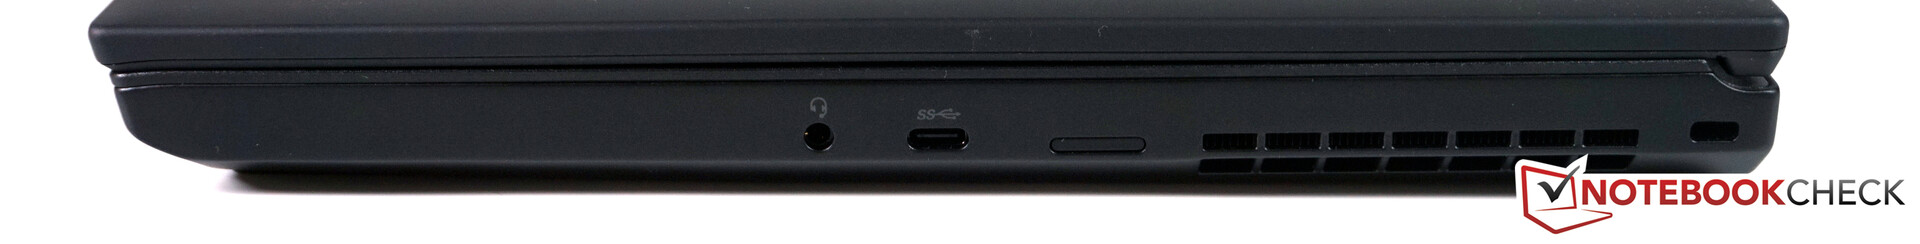
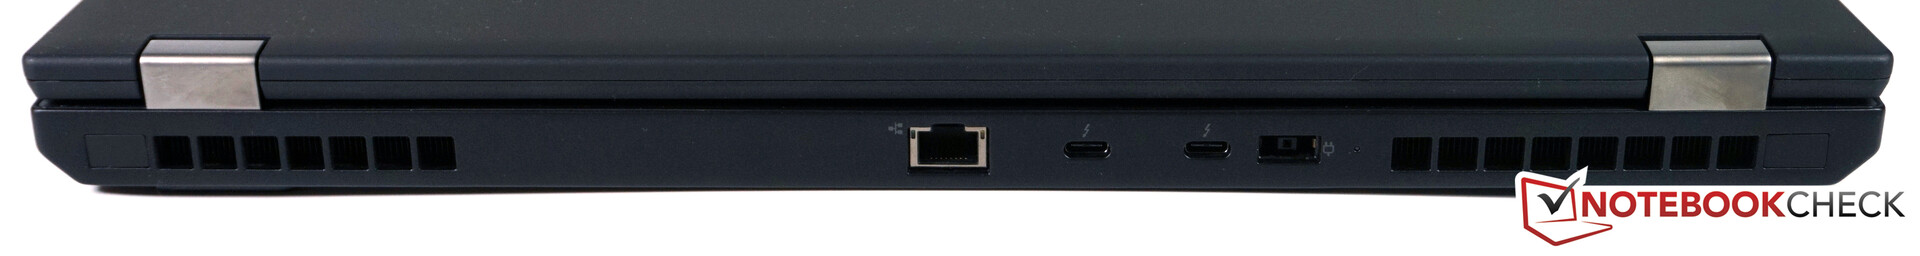
Bağlantı - Thunderbolt 3 ve Wi-Fi 6 ile P53
Eski ThinkPad P52 ile karşılaştırıldığında port seçimi ve yerleşim düzeni açısından birkaç farklılık var. Solda (arkada kullanılan) bir HDMI 2.0 çıkışı, iki adet geleneksel USB A tipi bağlantı noktası ve iki kart okuyucu var. Nano SIM kart yuvası, eskiden bulunduğu yerde, pil bölmesinin iç kısmından daha erişilebilir olacak şekilde sol tarafta bulunabilir. Ek olarak, bir USB C tipi bağlantı noktası vardır (Gen 1). Thunderbolt 3 bağlantı noktalarının her ikisi de cihazın arkasında hala bulunabilir. Bağlantı noktası düzeni genel olarak iyi, ancak sağda bir USB A tipi bağlantı noktasının olmaması bazı durumlarda kullanıcı deneyimini olumsuz etkileyebilir. En azından, daha büyük konektörler için uygun olan portlar arasında daha fazla alan var.
| SD Card Reader | |
| average JPG Copy Test (av. of 3 runs) | |
| Dell Precision 7530 (Toshiba Exceria Pro SDXC 64 GB UHS-II) | |
| Lenovo ThinkPad P53-20QN000YGE (Toshiba Exceria Pro SDXC 64 GB UHS-II) | |
| Lenovo ThinkPad P1 2019-20QT000RGE (Toshiba Exceria Pro SDXC 64 GB UHS-II) | |
| Lenovo ThinkPad P52 20MAS03N00 (Toshiba Exceria Pro SDXC 64 GB UHS-II) | |
| Fujitsu Celsius H780 (Toshiba Exceria Pro SDXC 64 GB UHS-II) | |
| Sınıf ortalaması Workstation (49.6 - 681, n=14, son 2 yıl) | |
| maximum AS SSD Seq Read Test (1GB) | |
| Sınıf ortalaması Workstation (87.6 - 1455, n=14, son 2 yıl) | |
| Lenovo ThinkPad P53-20QN000YGE (Toshiba Exceria Pro SDXC 64 GB UHS-II) | |
| Lenovo ThinkPad P1 2019-20QT000RGE (Toshiba Exceria Pro SDXC 64 GB UHS-II) | |
| Dell Precision 7530 (Toshiba Exceria Pro SDXC 64 GB UHS-II) | |
| Lenovo ThinkPad P52 20MAS03N00 (Toshiba Exceria Pro SDXC 64 GB UHS-II) | |
| Fujitsu Celsius H780 (Toshiba Exceria Pro SDXC 64 GB UHS-II) | |
| Networking | |
| iperf3 transmit AX12 | |
| Lenovo ThinkPad P53-20QN000YGE | |
| Lenovo ThinkPad P53-20QN000YGE | |
| Lenovo ThinkPad P1 2019-20QT000RGE | |
| Dell Precision 7530 | |
| Lenovo ThinkPad P52 20MAS03N00 | |
| Fujitsu Celsius H780 | |
| MSI P65 Creator 9SF-657 | |
| iperf3 receive AX12 | |
| Lenovo ThinkPad P53-20QN000YGE | |
| Lenovo ThinkPad P53-20QN000YGE | |
| Dell Precision 7530 | |
| Fujitsu Celsius H780 | |
| Lenovo ThinkPad P52 20MAS03N00 | |
| Lenovo ThinkPad P1 2019-20QT000RGE | |
| MSI P65 Creator 9SF-657 | |
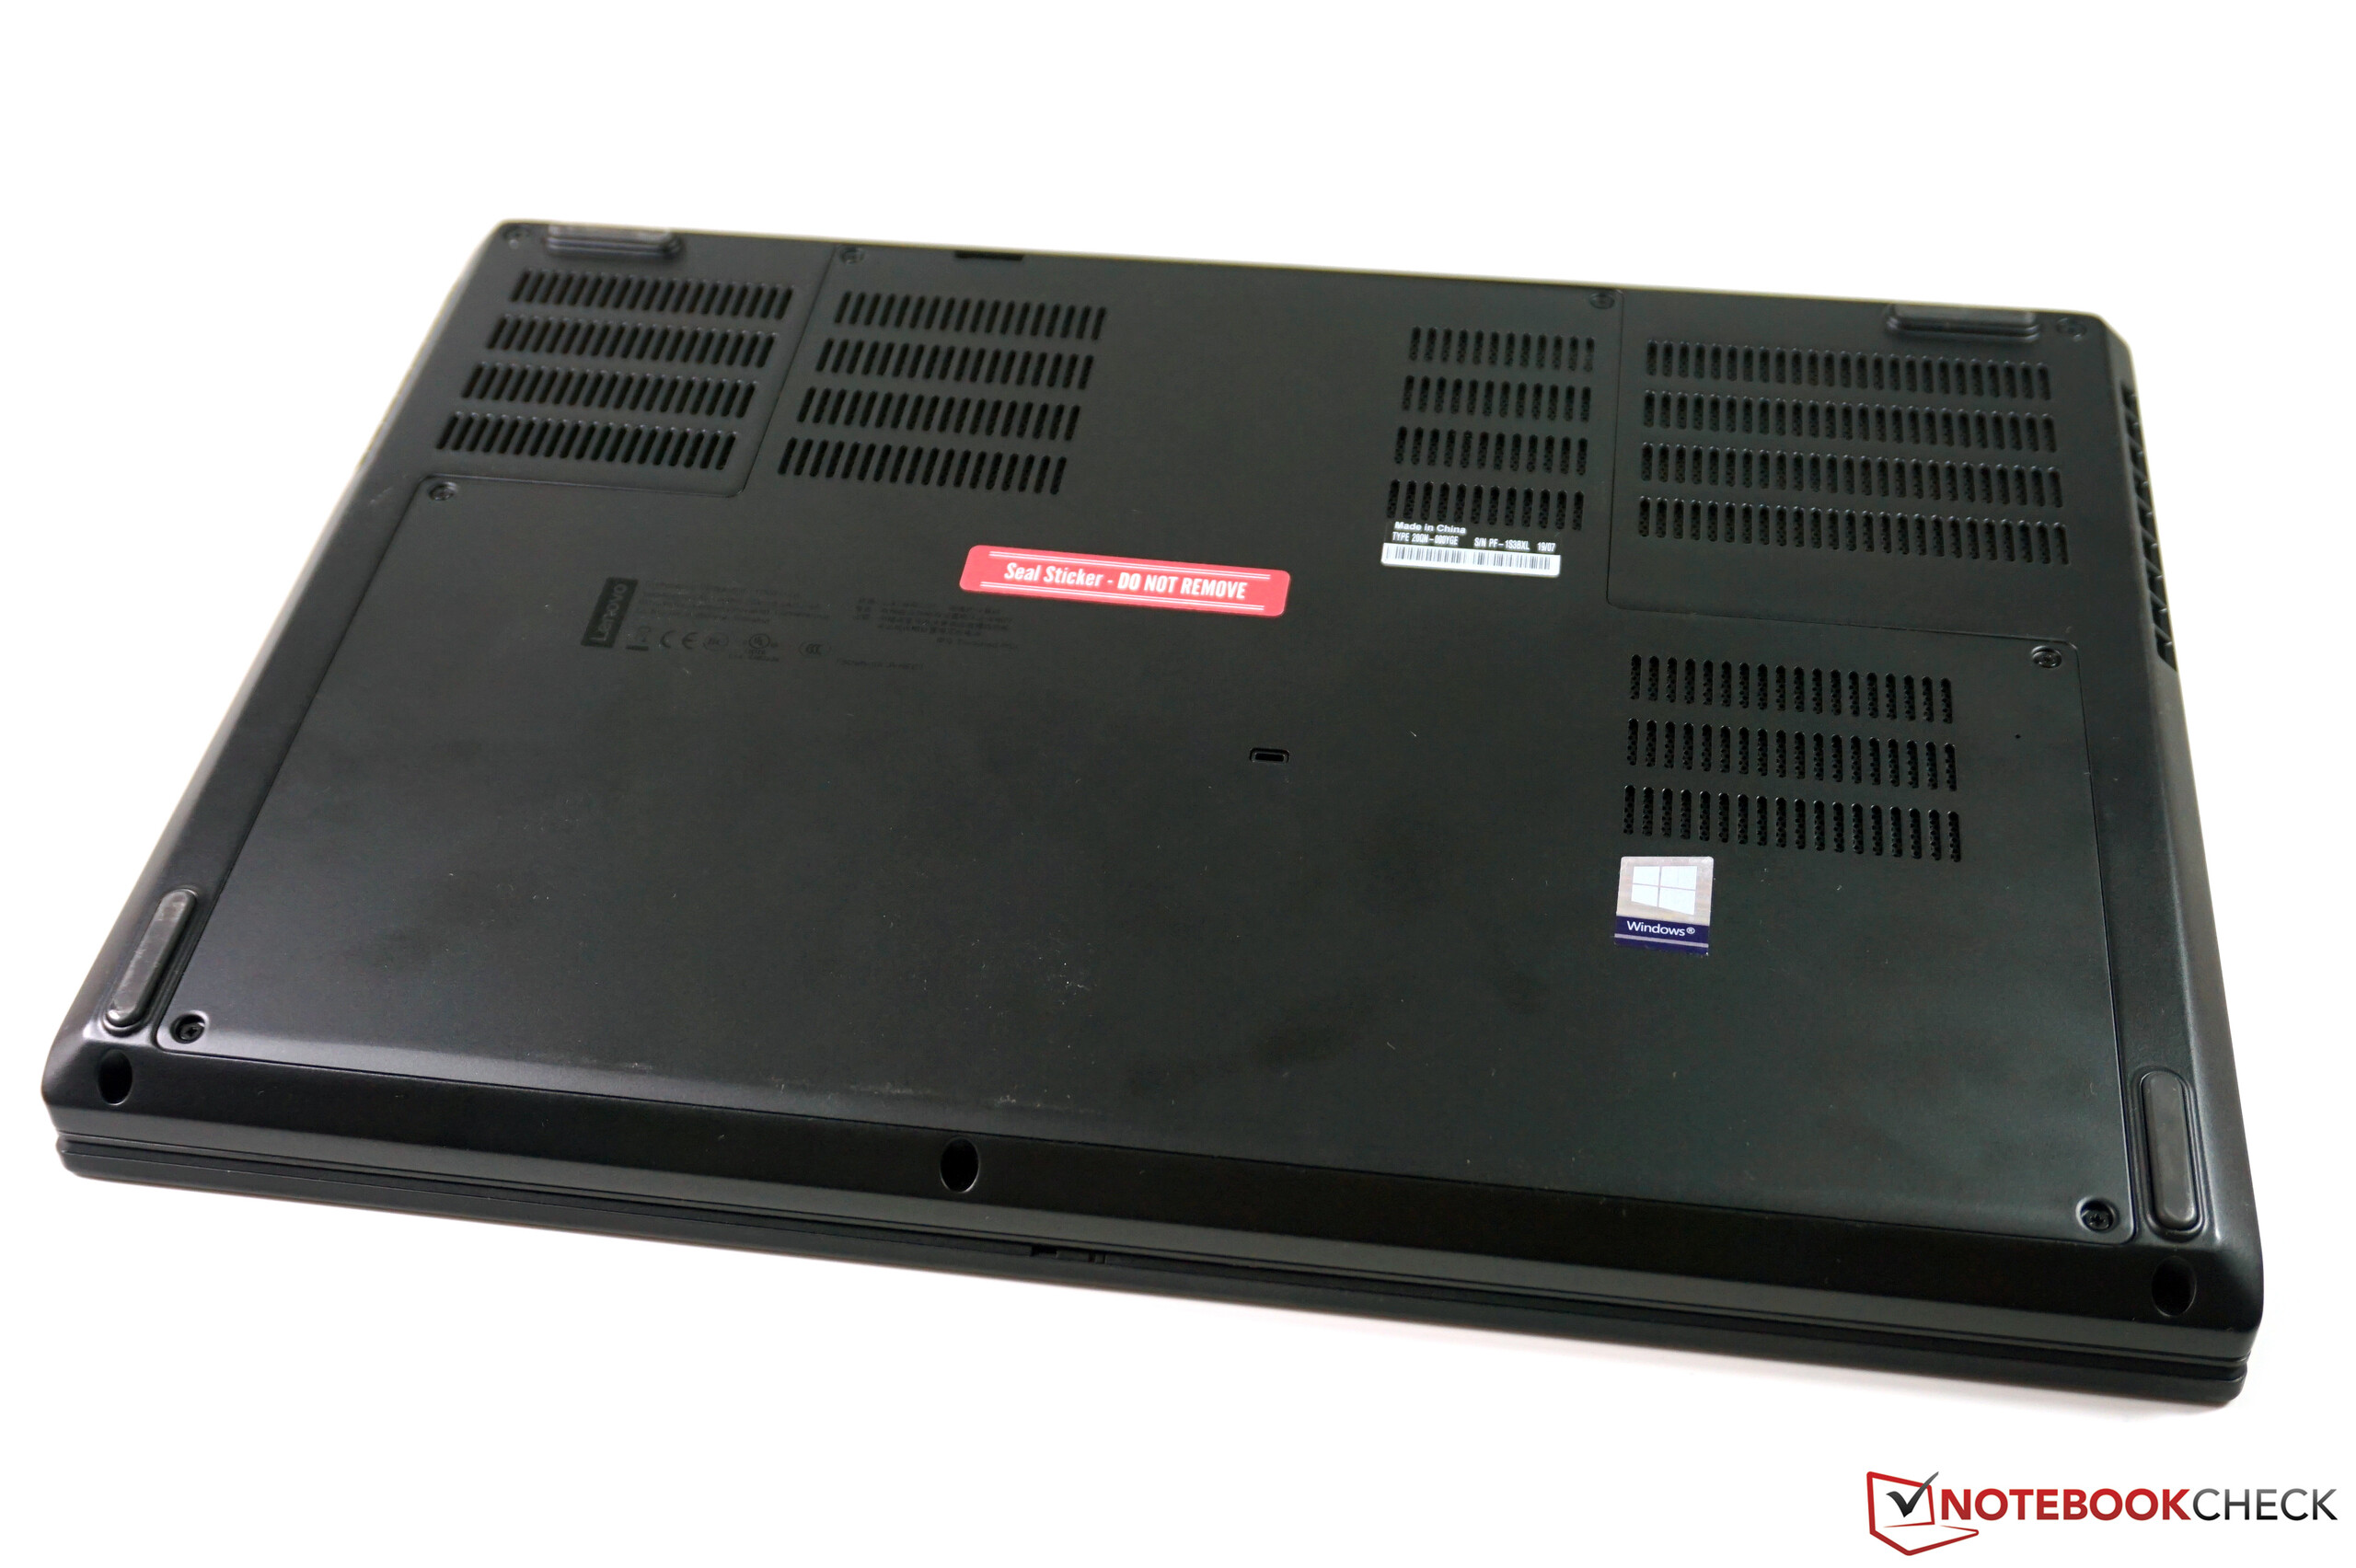
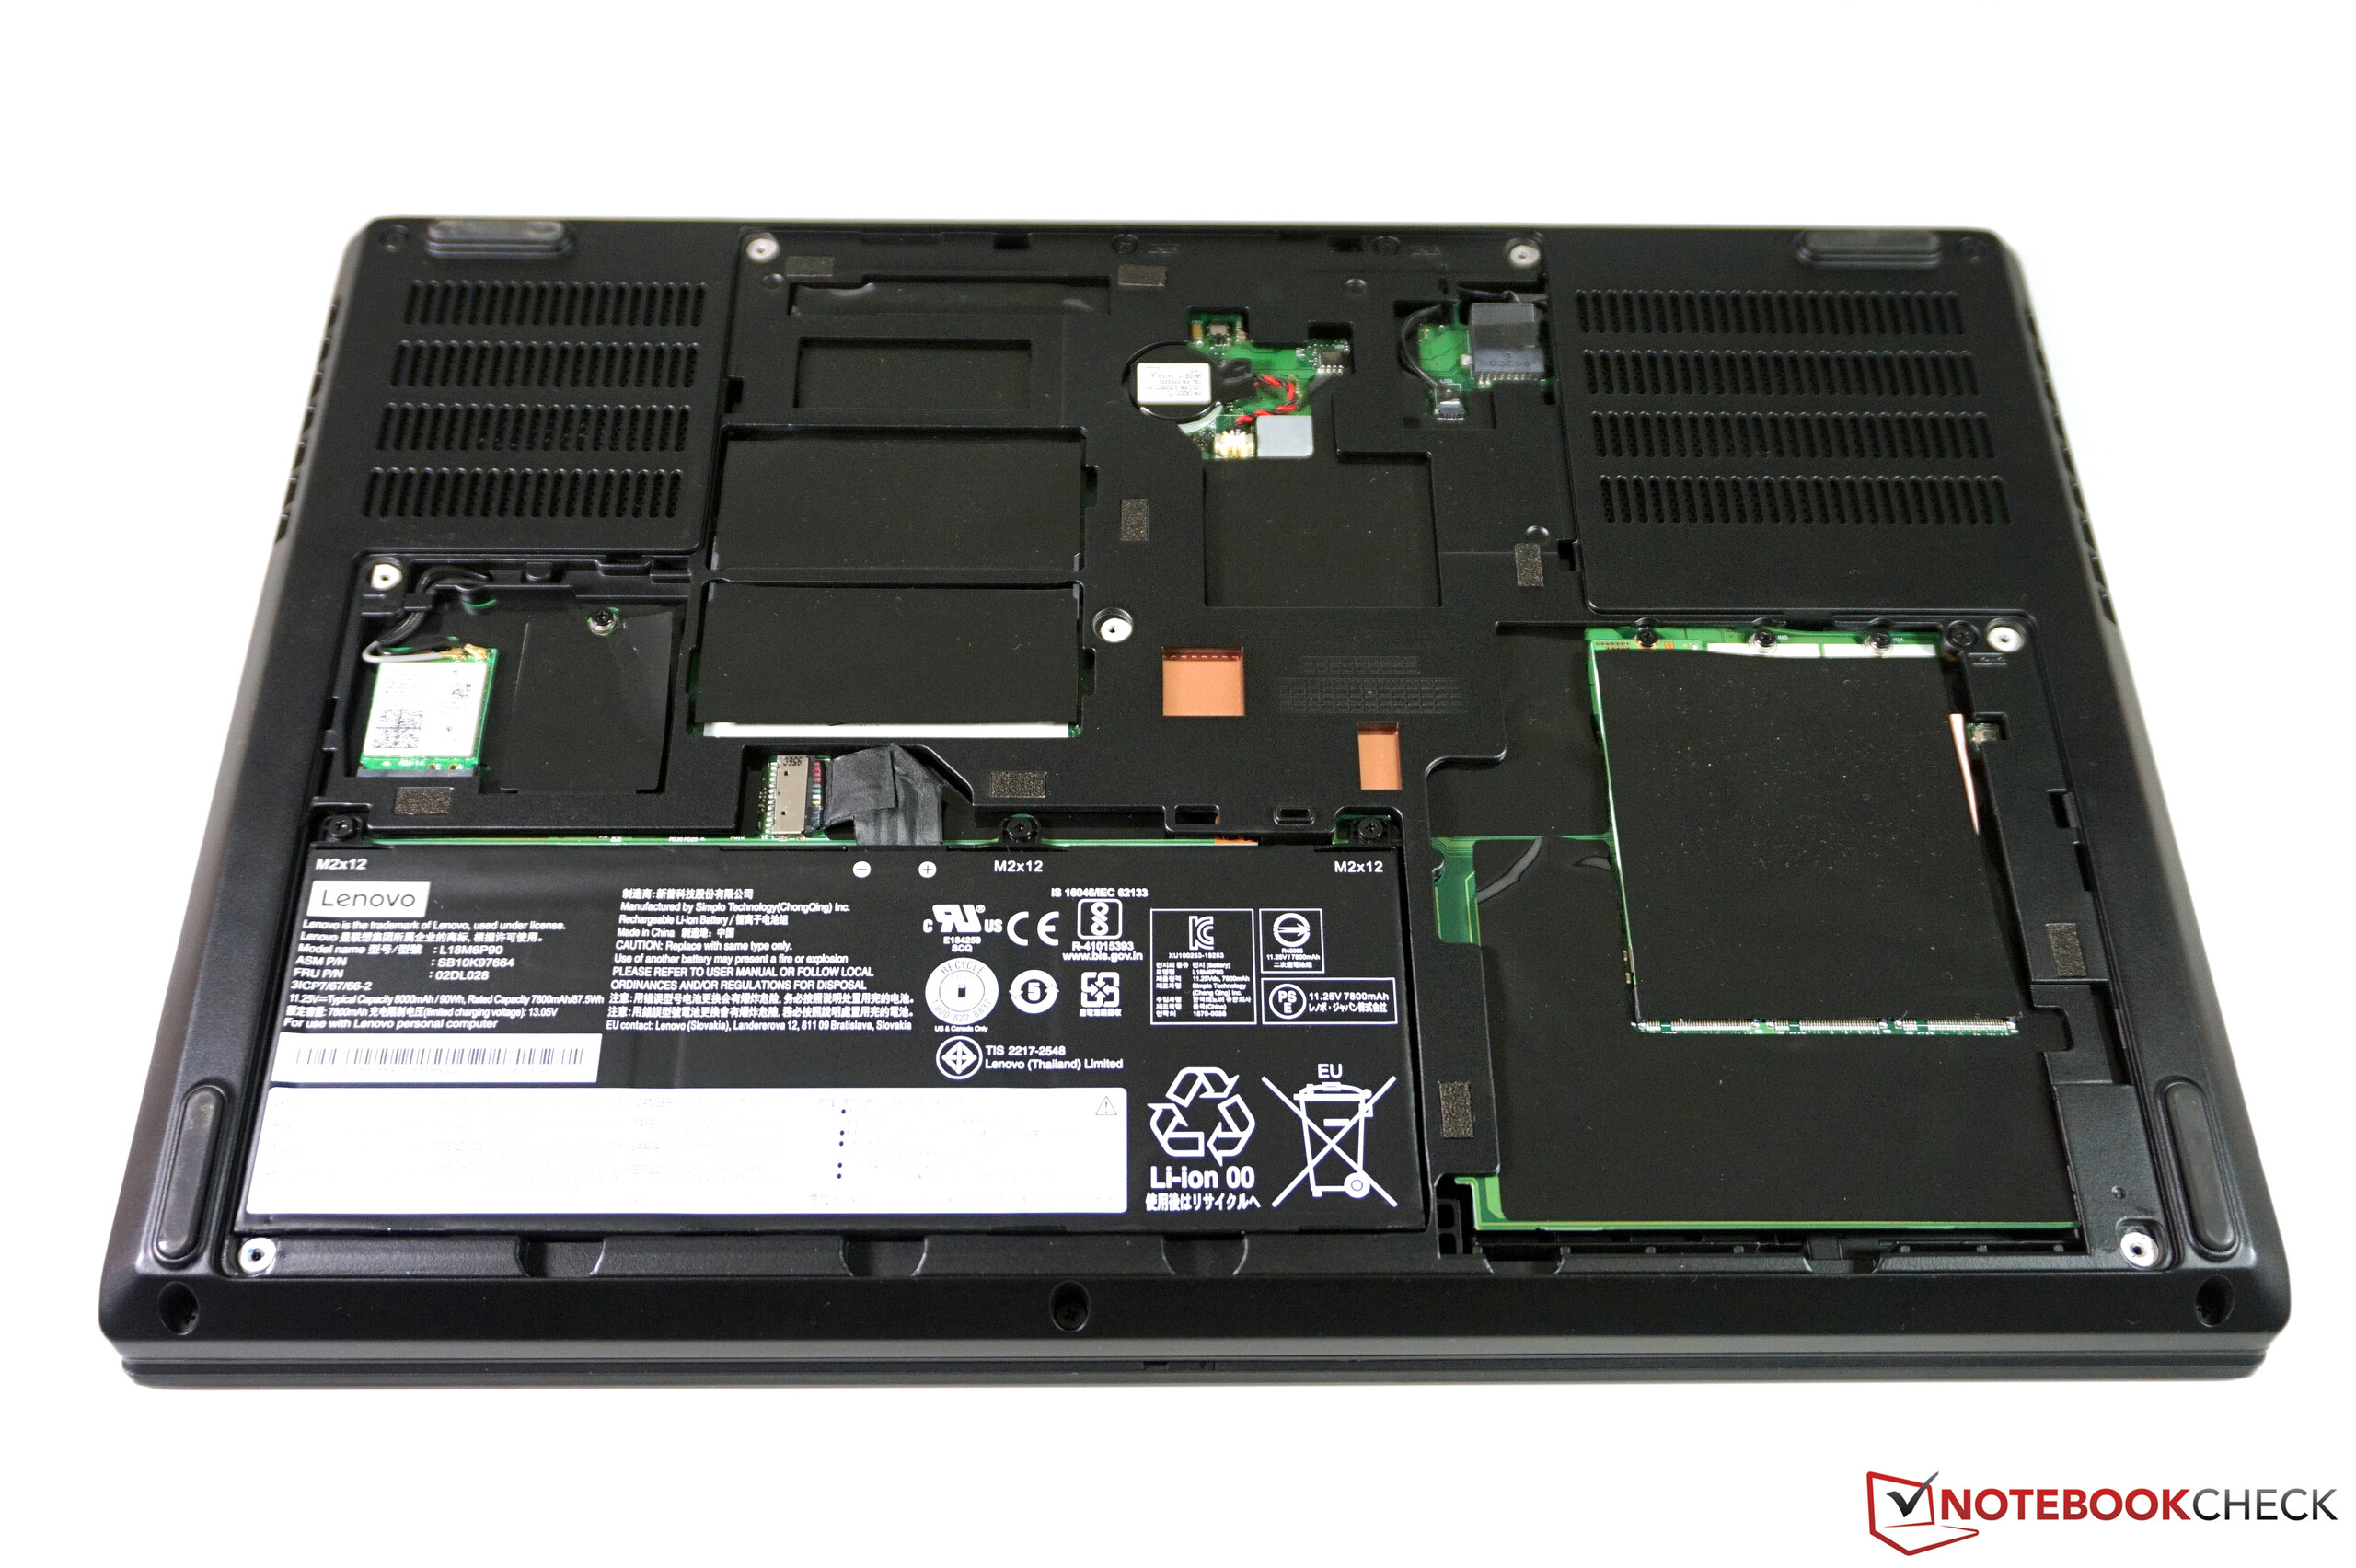
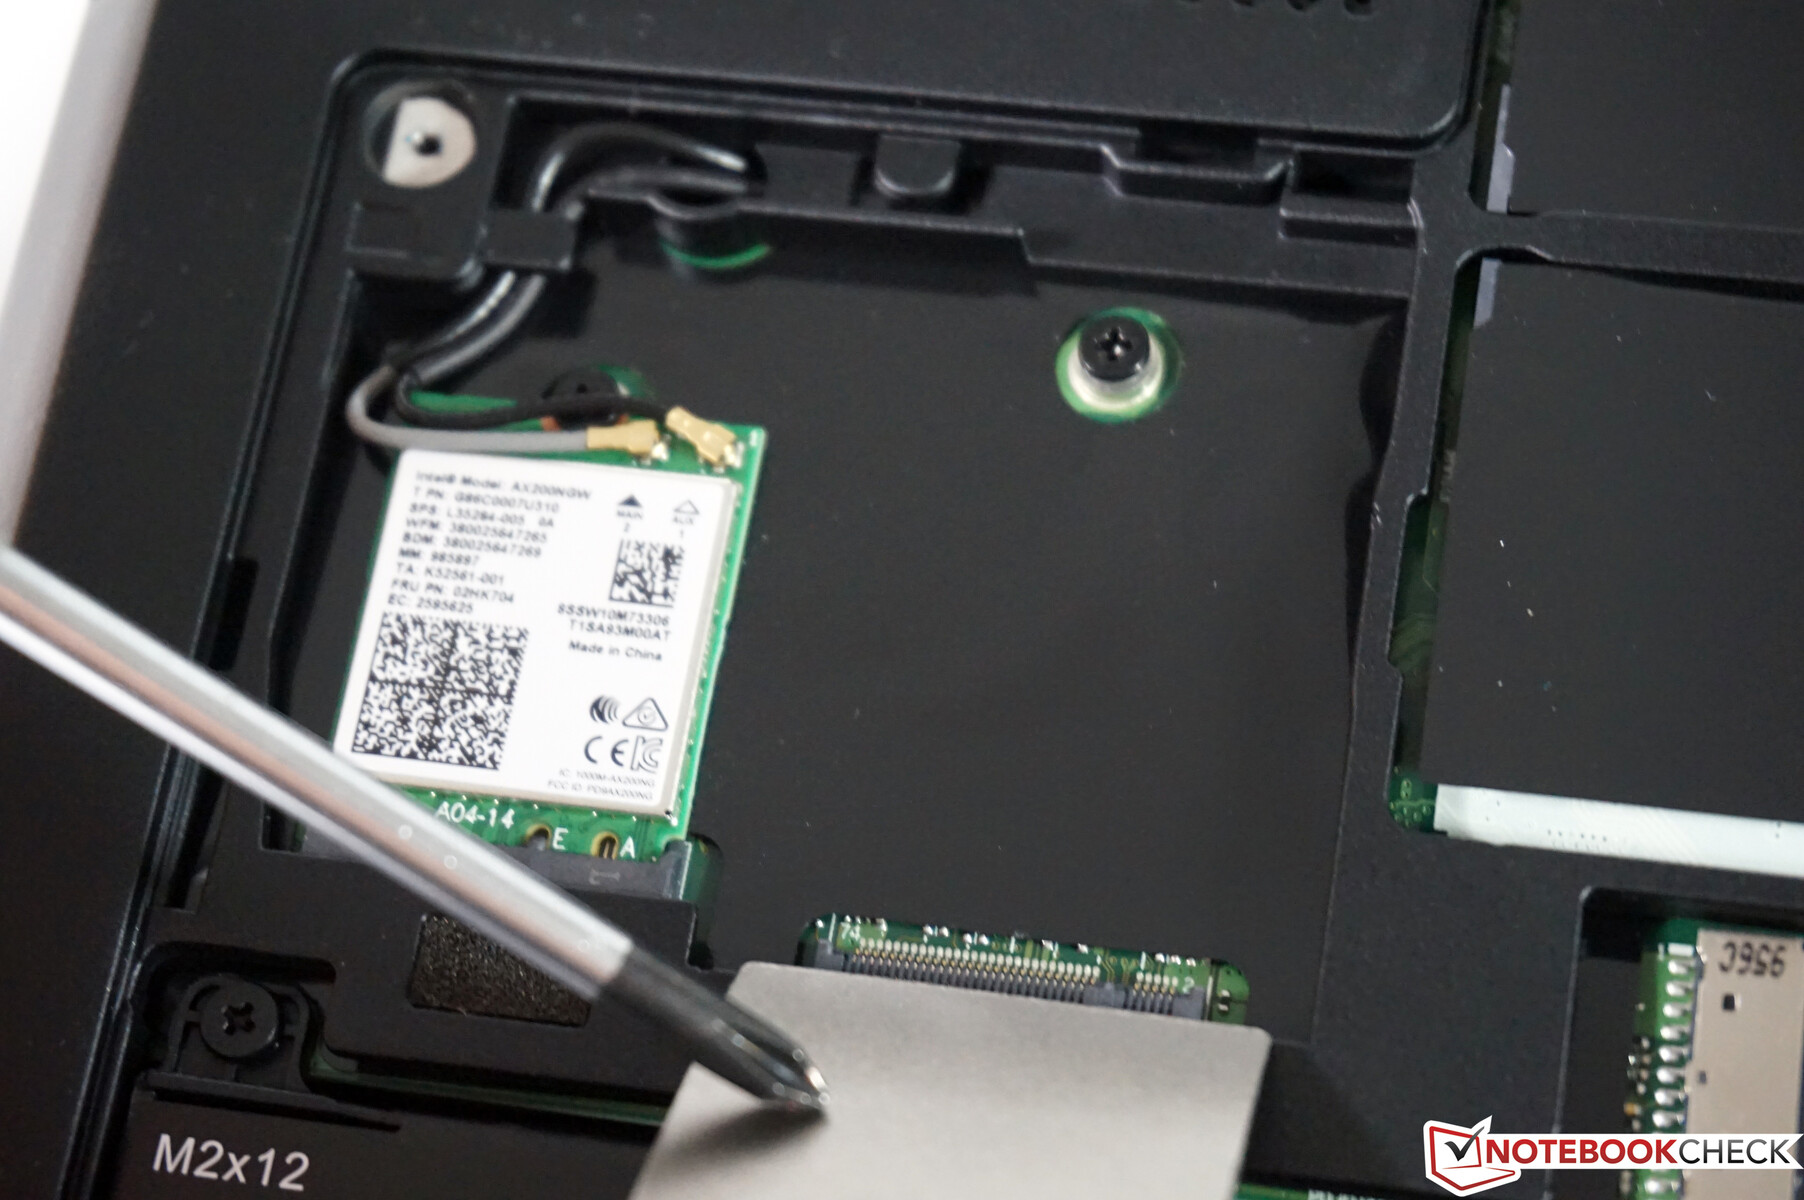
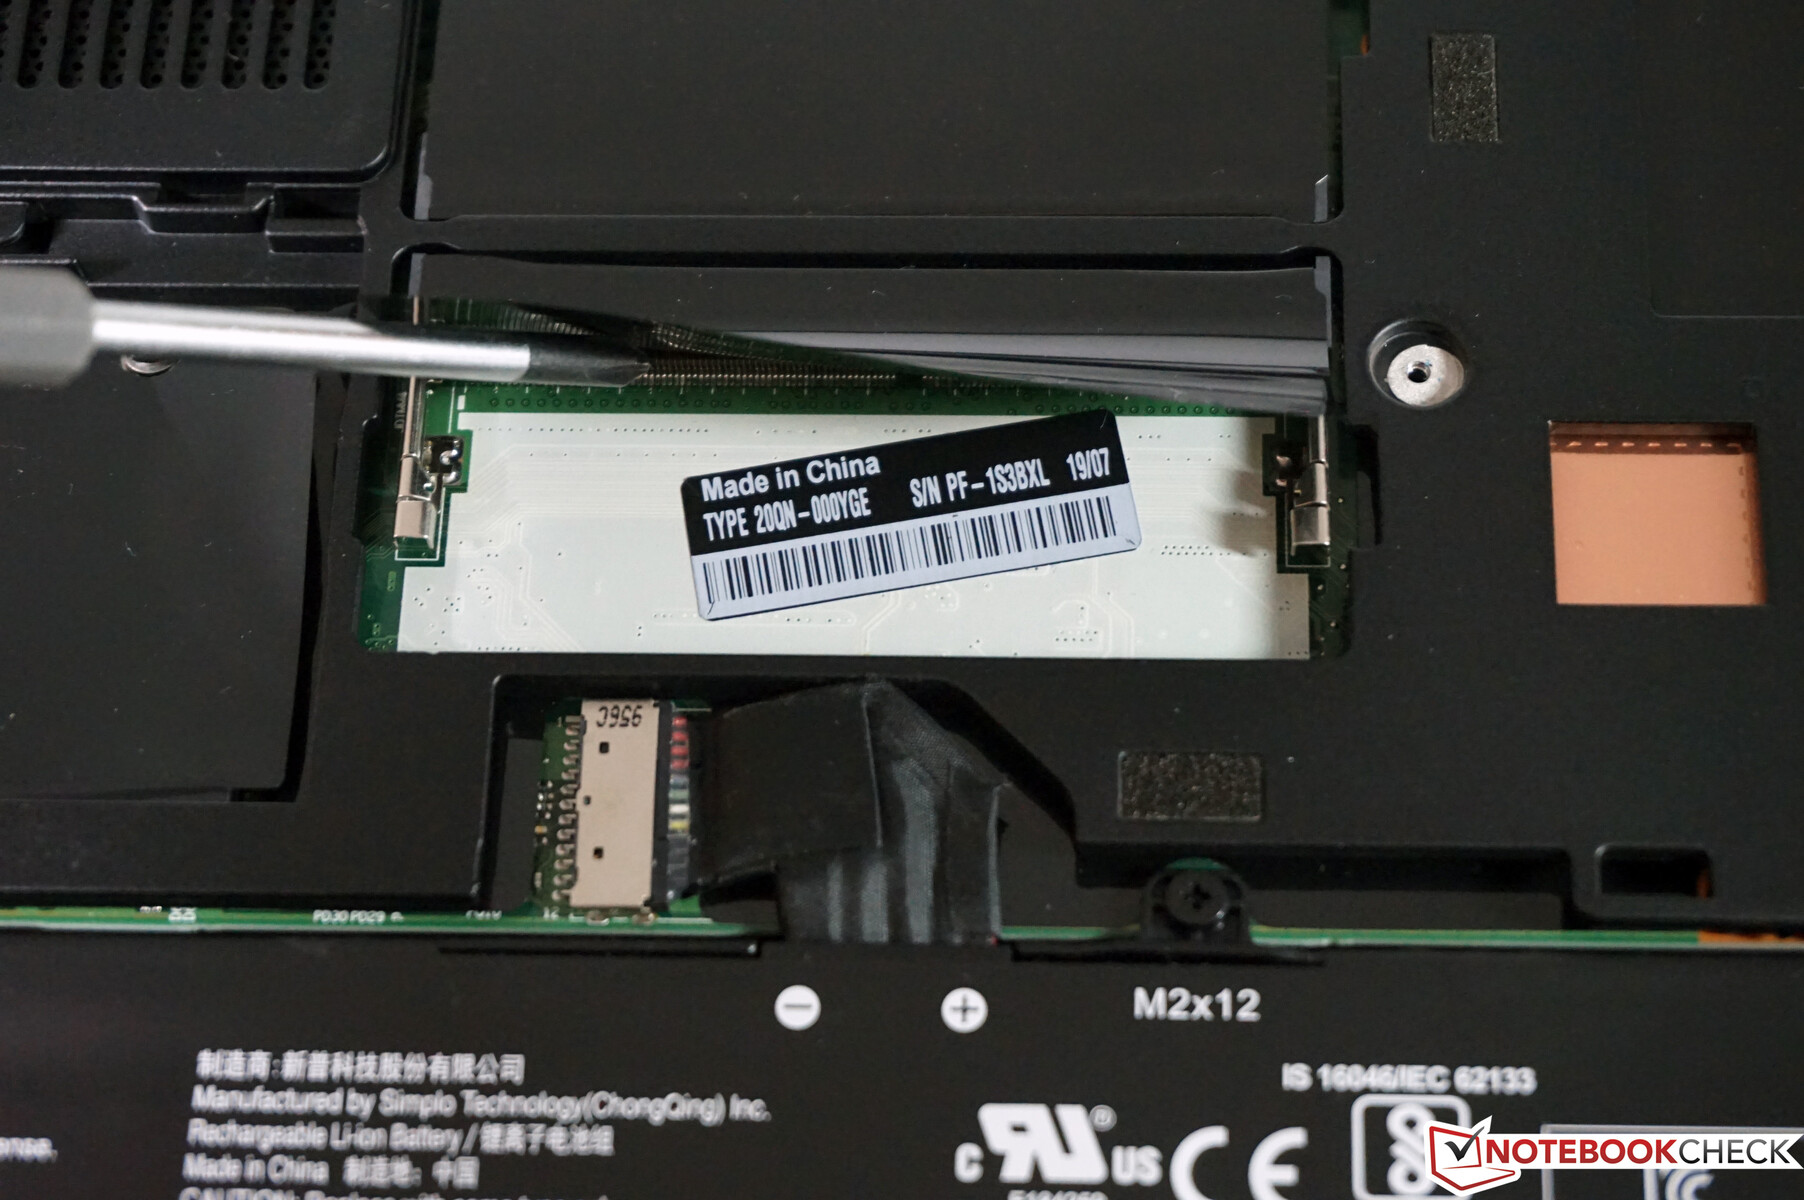
Bakım
Sadece birkaç philips vida ile sabitlenmiş büyük bir bakım kapağı, tabana yerleştirilmiş ve kolayca çıkarılabilir. Dört RAM yuvasının ikisi, M.2-2280 slotlarının üçü, batarya ve iletişim modüllerinin ikisi gibi en önemli bileşenlere içeriden erişilebilir. Bununla birlikte, gerekli antenler eksik olduğundan modelimiz WWAN'a hazır değil - neden olduğundan emin değiliz. Diğer bileşenlere erişmek ve üreticinin donanım bakım el kitabına veya üreticinin destek sayfasında bulunan servis videolarına göz atmak için ek sökme işlemi yapılması önerilir.
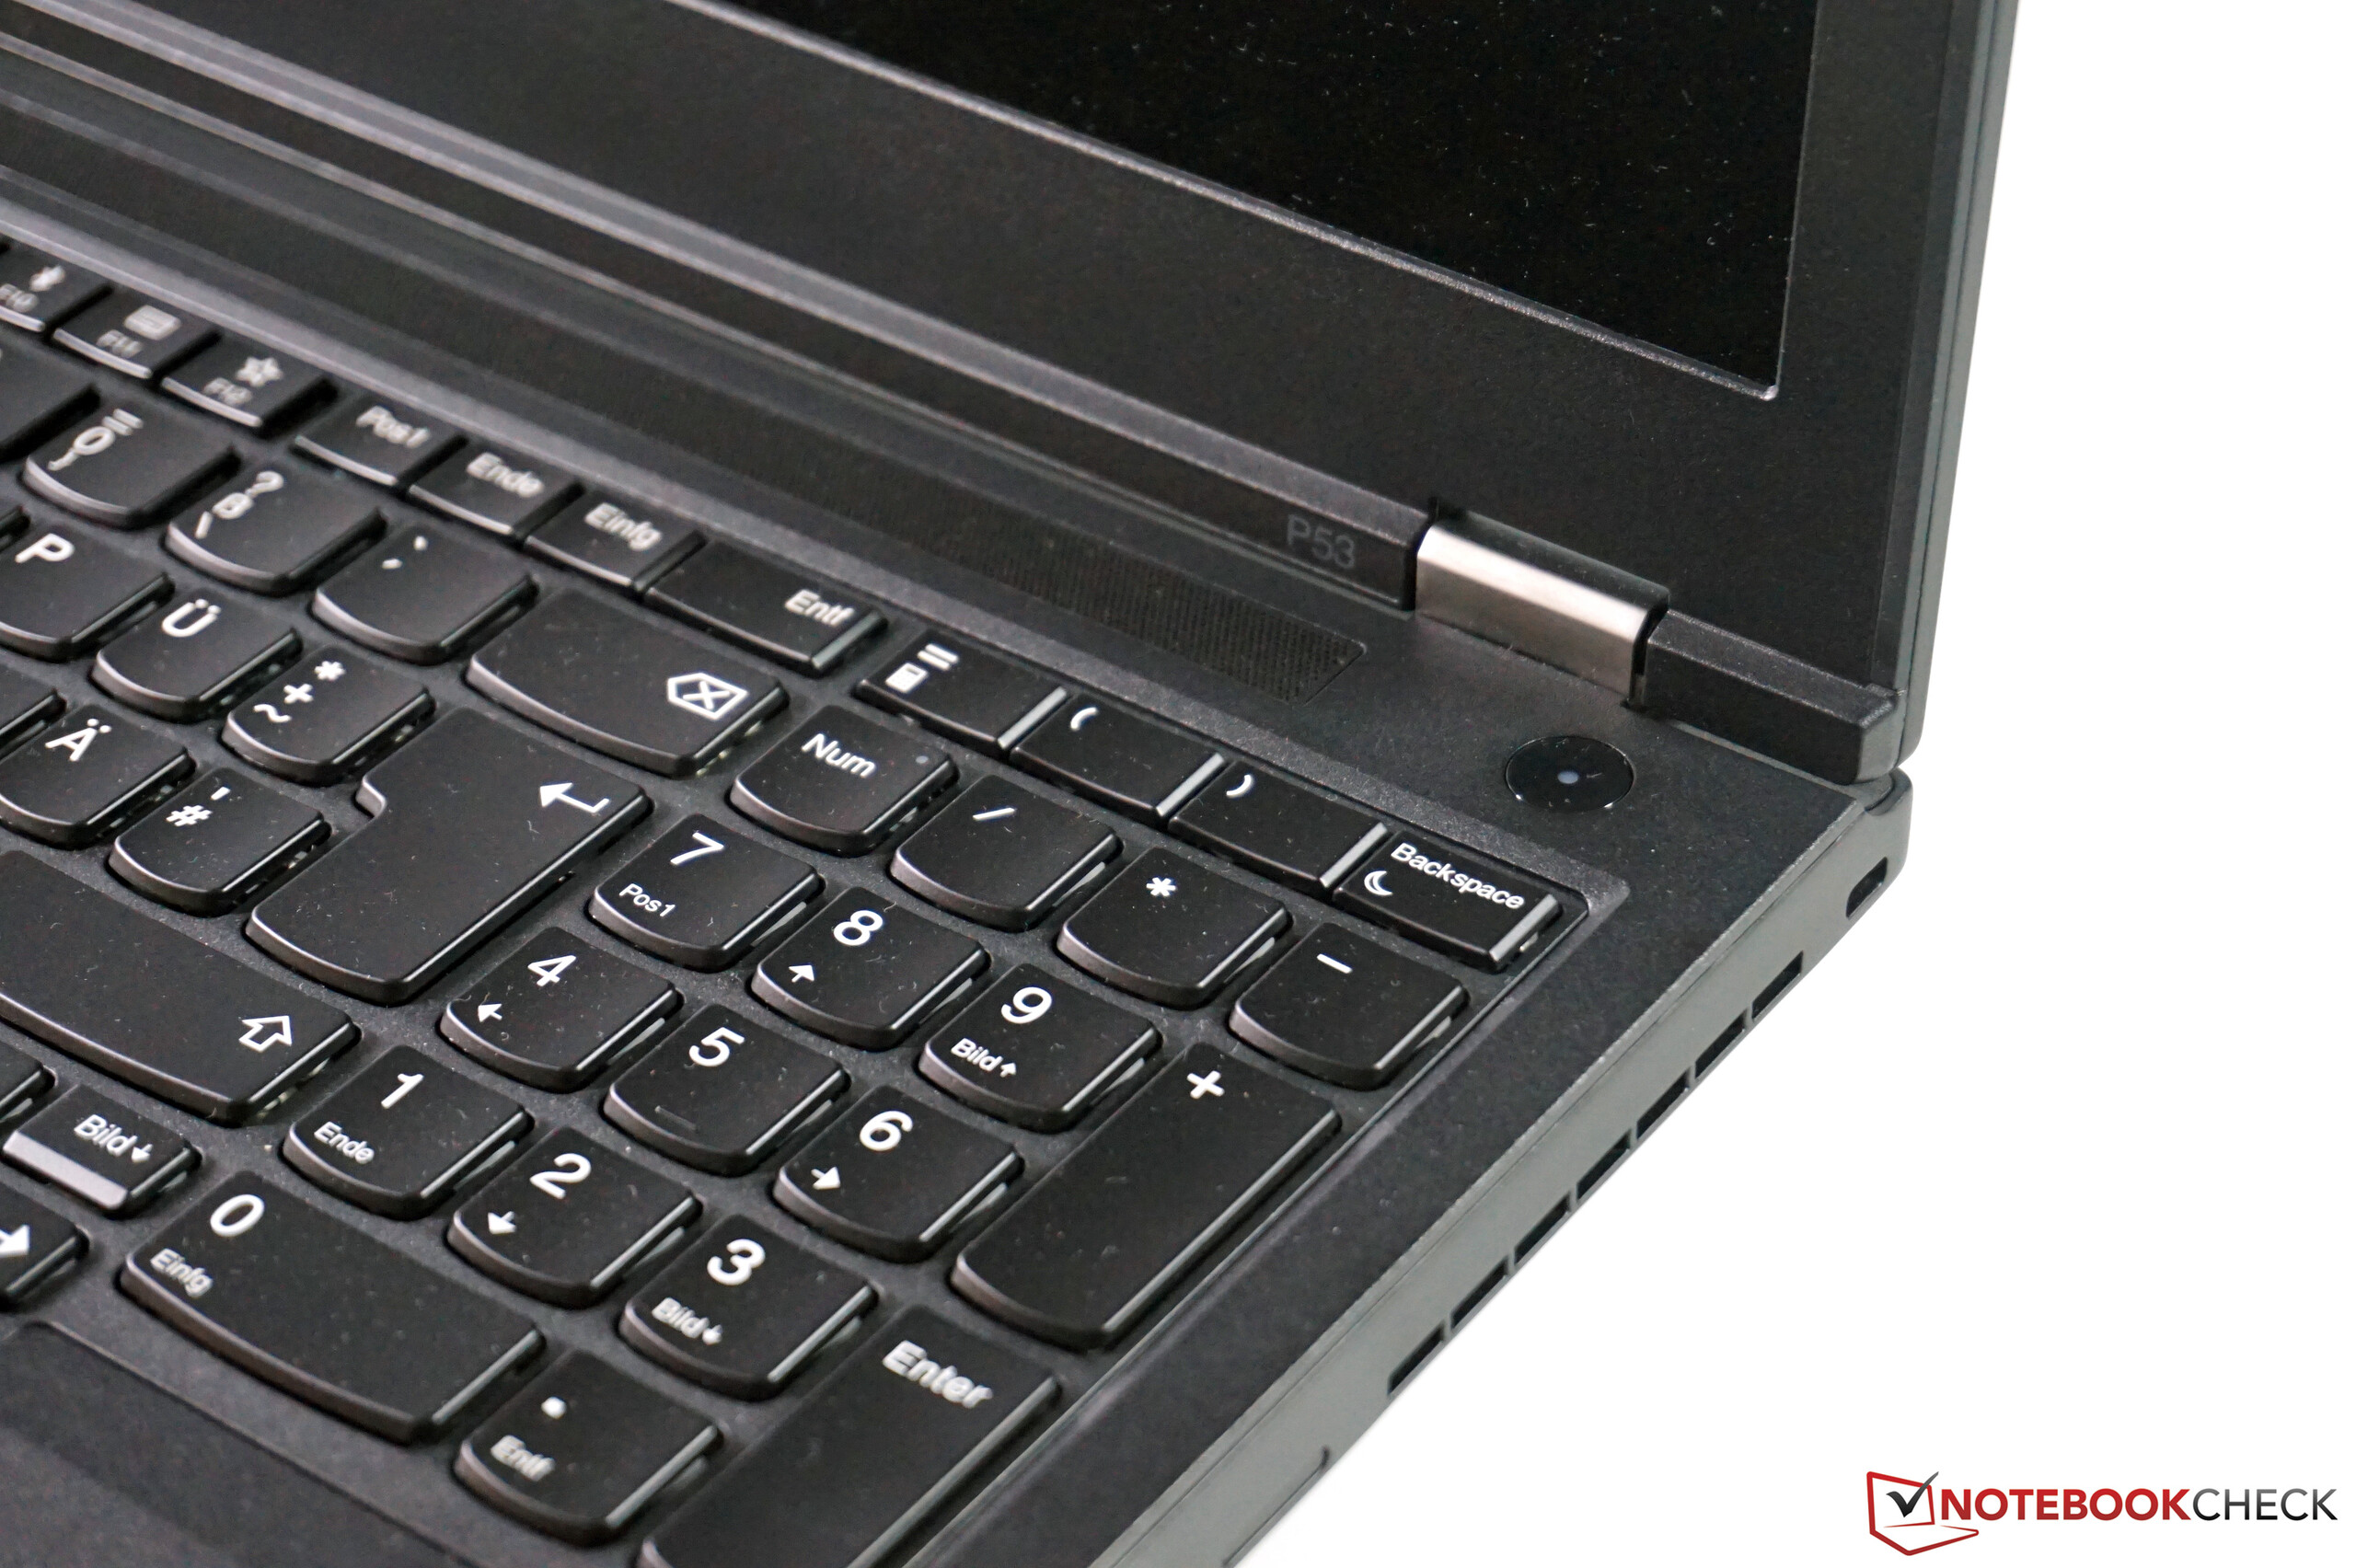
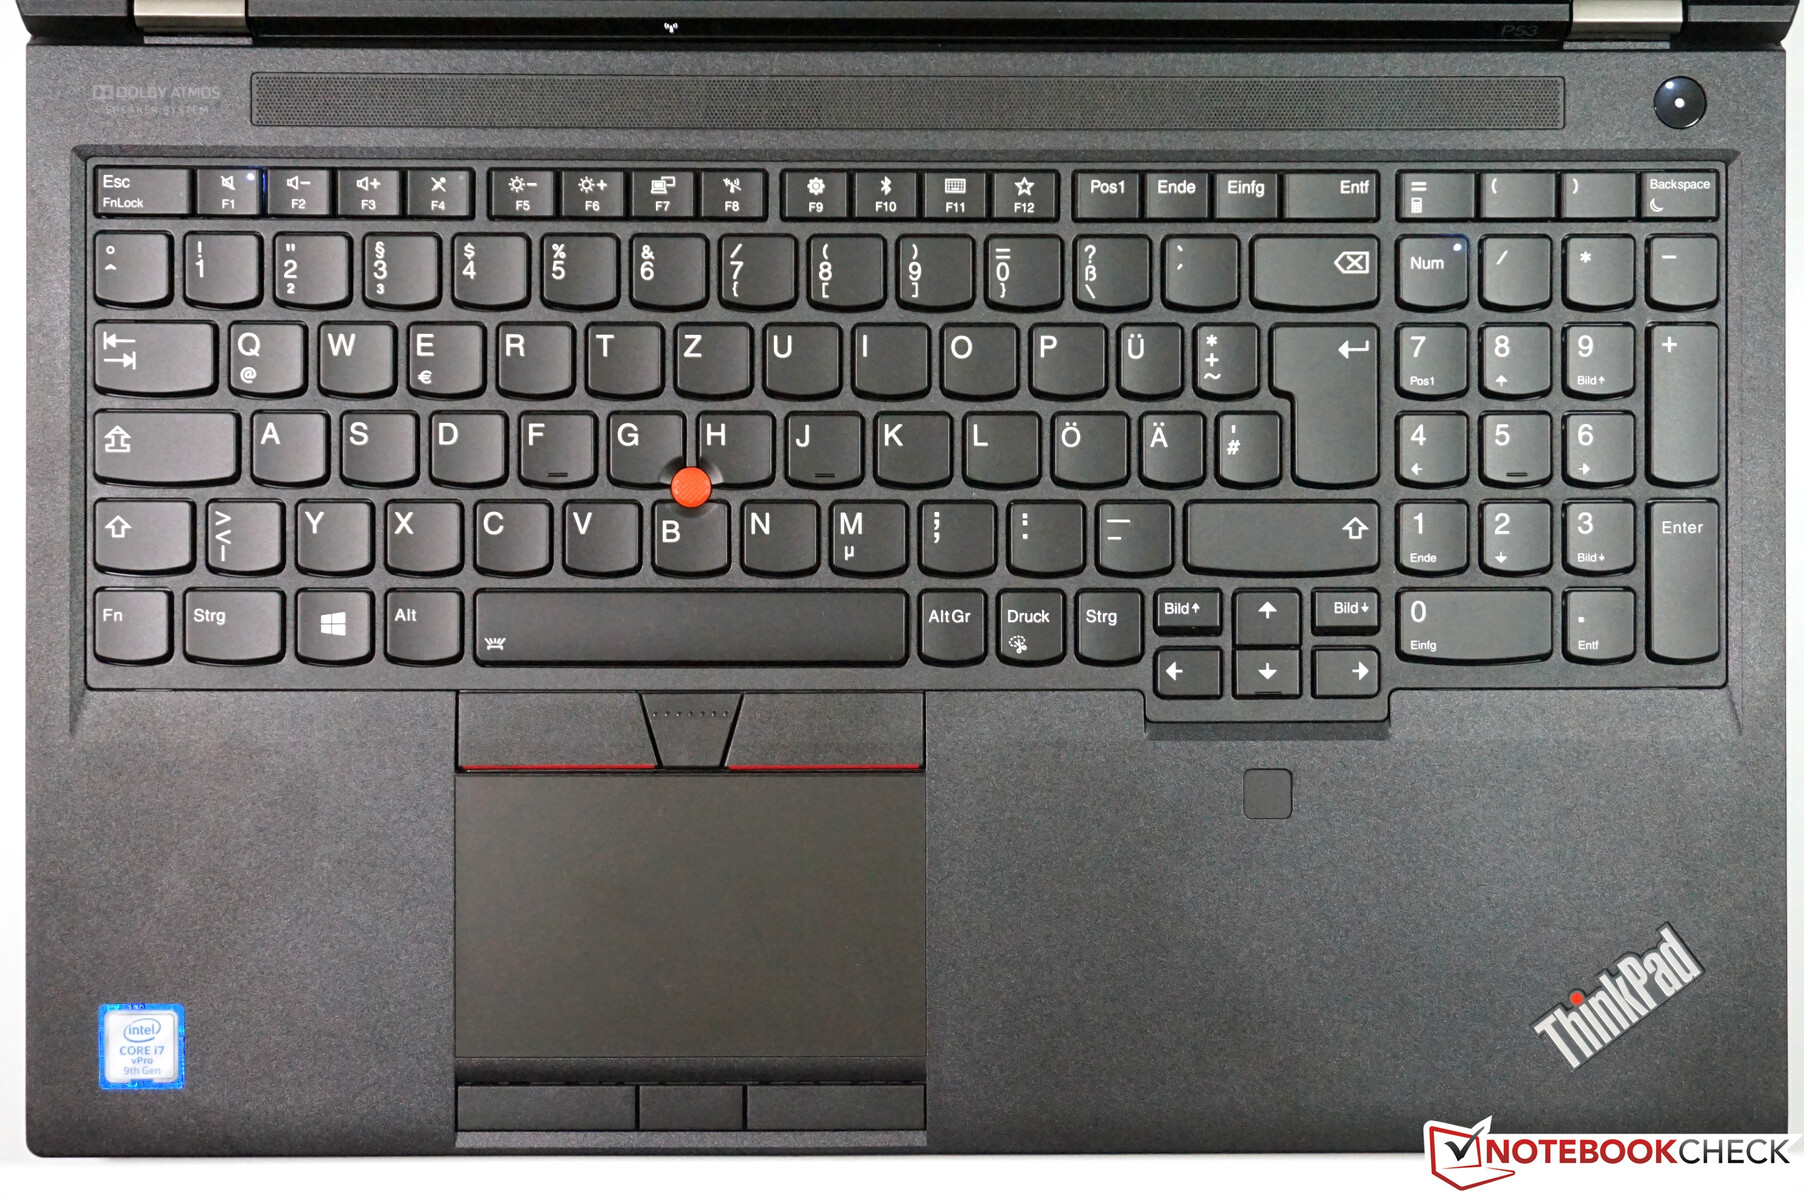
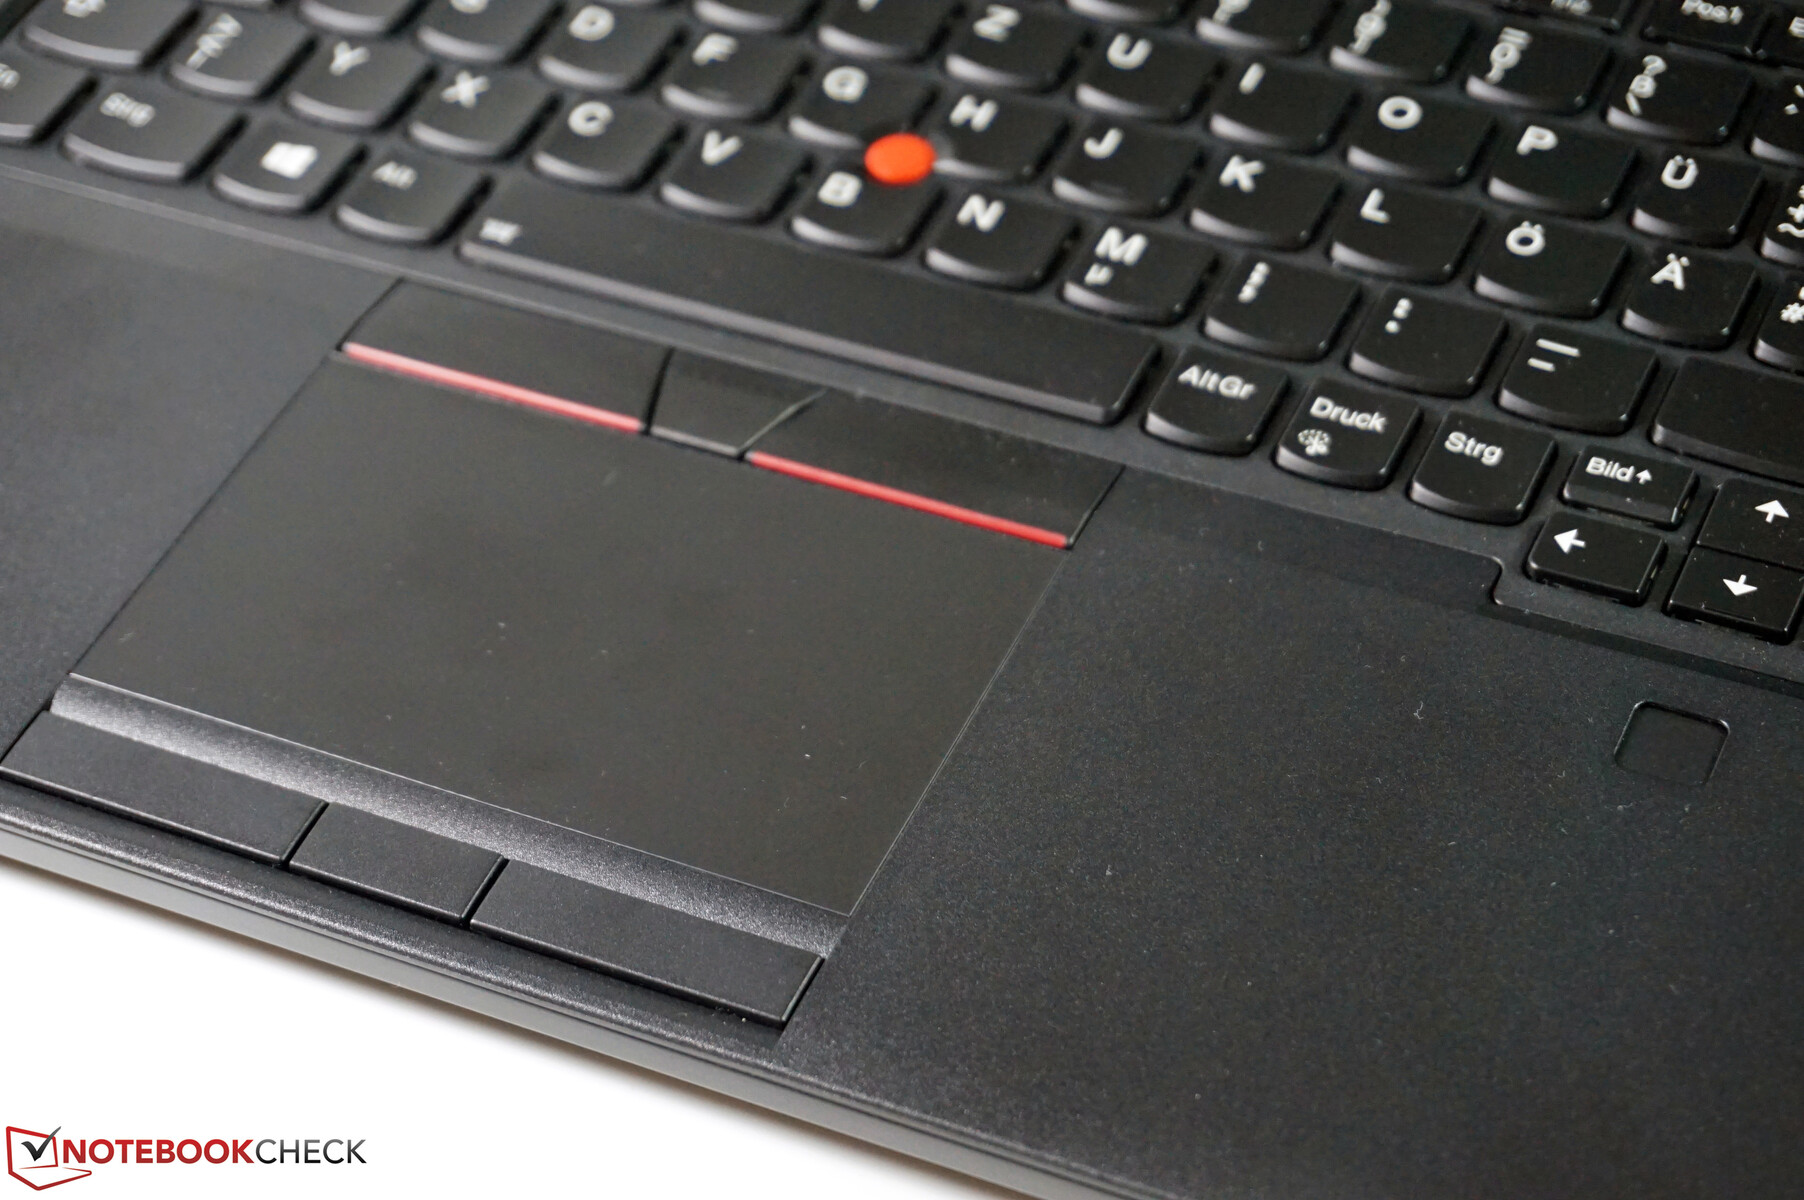
Giriş Aygıtları - Mükemmel Klavyeli ThinkPad
Giriş cihazlarında herhangi bir güncelleme olmamasına rağmen, hiçbir şikayetimiz yok. Arkadan aydınlatmalı klavye, uzun seyahat ve net geri bildirimler sayesinde piyasadaki en iyilerden biridir. İmleci, özel fare tuşları ve bir (Synaptics) TrackPoint ile touchpad kullanarak hareket ettirmek de güvenilir bir şekilde çalışır. Daha fazla bilgi için lütfen önceki ThinkPad P52 ile ilgili mevcut incelememize bakın.
Ekran - Full HD HDR özellikli P53
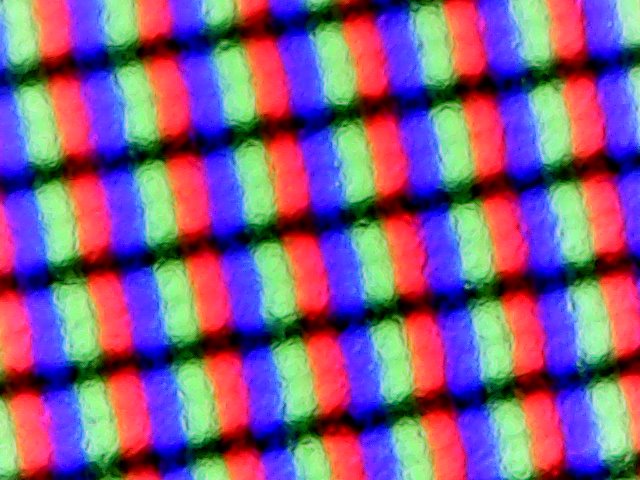
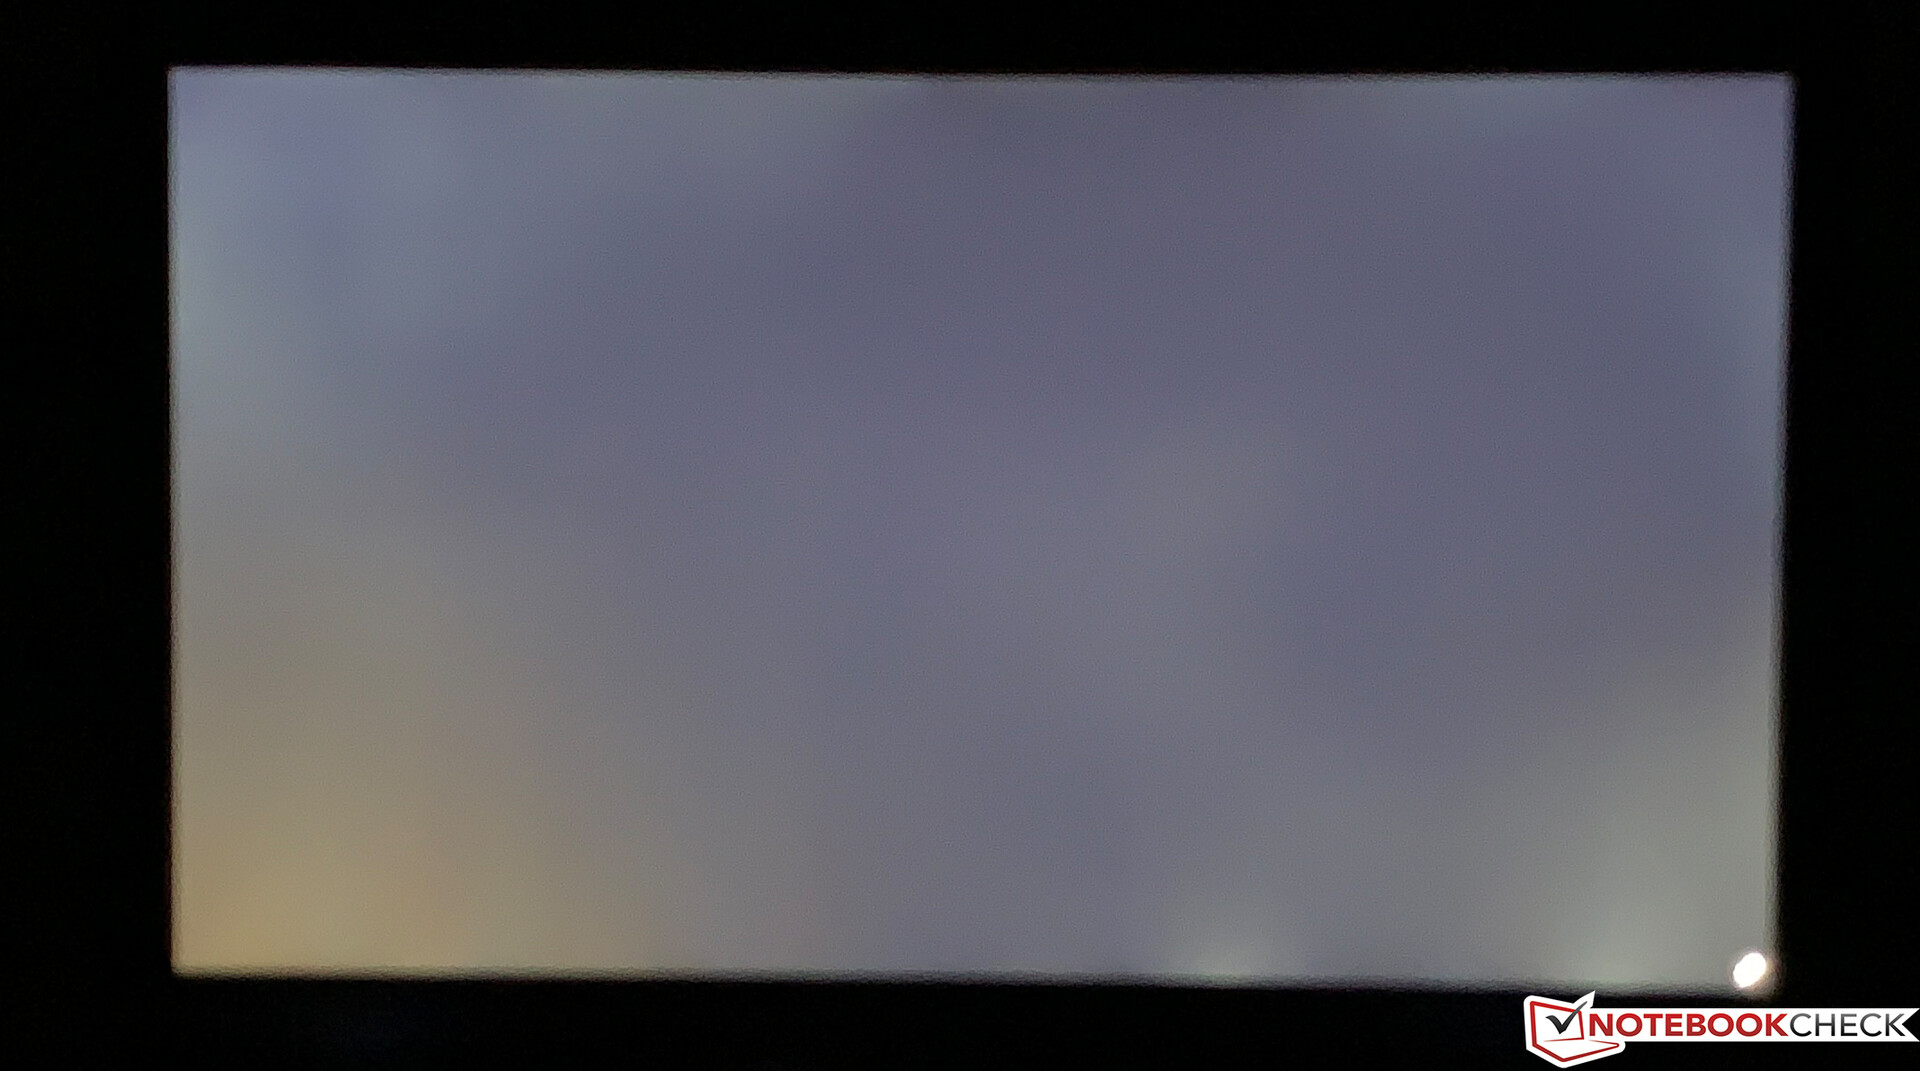
Ekran açısından birkaç değişiklik oldu ve kalite bir önceki yıla göre genel olarak arttı. Temel yapılandırma yine de ThinkPad P52'de bulunabilen 300 cd / m² parlaklık seviyesine sahip aynı Full-HD panelini içerir. Ek olarak, bu yıldan başlayarak diğer üç panel daha mevcut: Full HD HDR 400 (mat, IPS, 500 cd / m²,% 72 NTSC) 4K UHD HDR 400 (mat, IPS, 500 cd / m²,% 100 NTSC) 4K UHD HDR 500 (parlak, OLED, 350-400 cd / m²,% 100 DCI-P3) Şimdi, daha iyi Full-HD varyantı nihayet kullanılabilir ve test cihazımızda yüklü. Mat 4K ekran şimdi daha parlak ve tamamen yeni bir OLED panel seçeneği var. Öznel, Full-HD ekran harika görünüyor. Mat kaplamaya rağmen, parlak ekran içeriği bile gözle görülür derecede grenli görünmüyor. Ölçümler, yalnızca ekranın ortasında reklamı yapılan parlaklığı onaylayabilmemize rağmen, iyi öznel izlenimleri desteklemektedir. 1.400: 1'in üzerindeki kontrast oranı canlı bir görüntü oluşturur. Bununla birlikte, iki olumsuz yönü vardır: Özellikle maksimum parlaklıkta, karanlık resimlere bakarken fark edilebilir arka ışık kanaması görülebilir ve parlaklık seviyeleri doğrusal olarak aralıklı değildir. % 90'da, parlaklık 510'dan sadece 236 cd / m²'ye ve% 80'de 149 cd / m²'ye düşer. Ölçümlerimiz aynı zamanda% 77 veya daha az parlaklık seviyelerinde arka ışık titreşimini onaylayabildi. Son derece yüksek 26 kHz frekansı nedeniyle, bunun tipik PWM olmadığını unutmayın.
| |||||||||||||||||||||||||
Aydınlatma: 89 %
Batarya modunda parlaklık: 490 cd/m²
Kontrast: 1417:1 (Siyah: 0.36 cd/m²)
ΔE ColorChecker Calman: 2.3 | ∀{0.5-29.43 Ø4.71}
calibrated: 1.2
ΔE Greyscale Calman: 3.2 | ∀{0.09-98 Ø4.96}
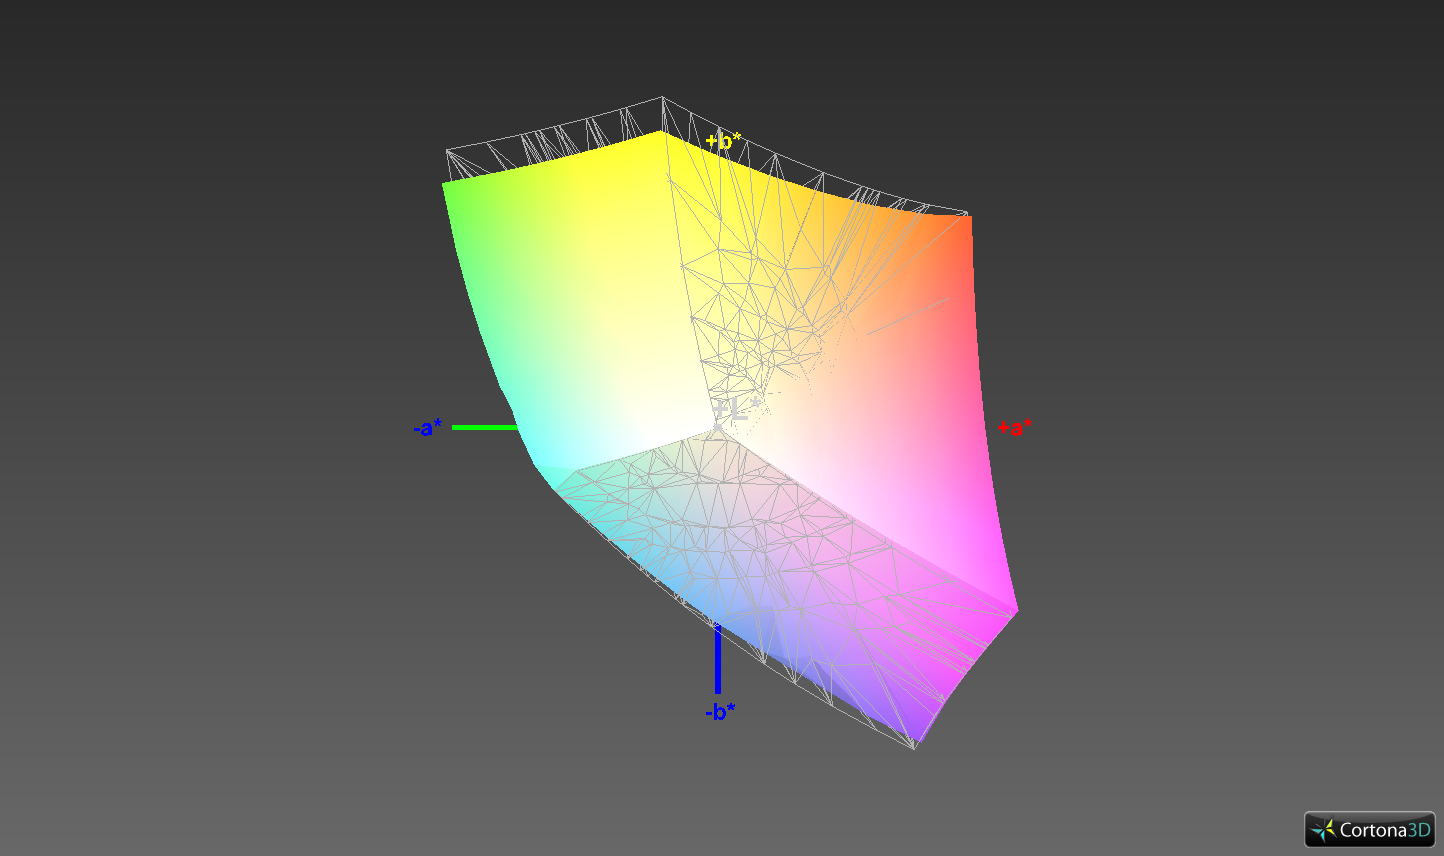
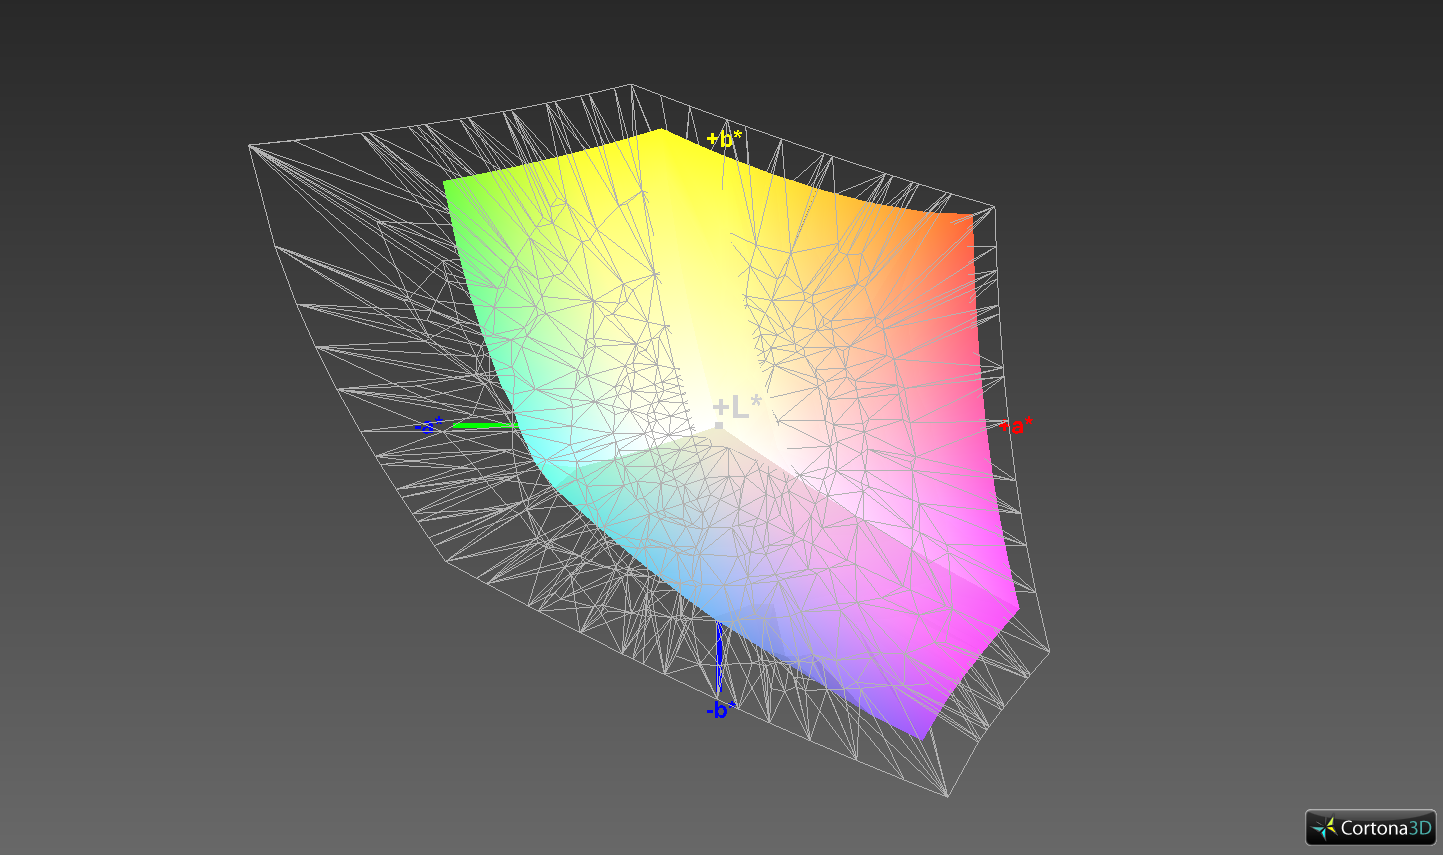
93.1% sRGB (Argyll 1.6.3 3D)
59.4% AdobeRGB 1998 (Argyll 1.6.3 3D)
64.3% AdobeRGB 1998 (Argyll 3D)
92.9% sRGB (Argyll 3D)
63.2% Display P3 (Argyll 3D)
Gamma: 2.34
CCT: 7036 K
| Lenovo ThinkPad P53-20QN000YGE N156HCE-GN1, IPS, 1920x1080, 15.6" | Lenovo ThinkPad P52 20MAS03N00 N156HCE-EN1, IPS LED, 1920x1080, 15.6" | Lenovo ThinkPad P1 2019-20QT000RGE N156HCE-GN1, IPS LED, 1920x1080, 15.6" | Dell Precision 7530 Sharp LQ156D1, IPS, 3840x2160, 15.6" | Fujitsu Celsius H780 LP156WF6-SPP1, IPS LED, 1920x1080, 15.6" | MSI P65 Creator 9SF-657 AU Optronics AUO41EB, IPS, 3840x2160, 15.6" | |
|---|---|---|---|---|---|---|
| Display | 1% | -1% | 29% | -2% | 32% | |
| Display P3 Coverage (%) | 63.2 | 65.6 4% | 62.4 -1% | 82.5 31% | 66.3 5% | 84.4 34% |
| sRGB Coverage (%) | 92.9 | 90.3 -3% | 91.5 -2% | 99.4 7% | 85.9 -8% | 100 8% |
| AdobeRGB 1998 Coverage (%) | 64.3 | 65.9 2% | 63.4 -1% | 96.2 50% | 62.8 -2% | 98.5 53% |
| Response Times | -3% | 27% | 2% | -3% | -28% | |
| Response Time Grey 50% / Grey 80% * (ms) | 38.4 ? | 39.2 ? -2% | 34.4 ? 10% | 35.2 ? 8% | 38 ? 1% | 51 ? -33% |
| Response Time Black / White * (ms) | 25.2 ? | 26 ? -3% | 14 ? 44% | 26.4 ? -5% | 26.8 ? -6% | 31 ? -23% |
| PWM Frequency (Hz) | 26040 ? | 25250 ? | 26040 ? | 198.4 ? | 20830 ? | |
| Screen | -34% | -15% | -31% | -36% | -23% | |
| Brightness middle (cd/m²) | 510 | 304 -40% | 542 6% | 292.8 -43% | 271 -47% | 445 -13% |
| Brightness (cd/m²) | 468 | 293 -37% | 528 13% | 295 -37% | 260 -44% | 462 -1% |
| Brightness Distribution (%) | 89 | 88 -1% | 84 -6% | 85 -4% | 86 -3% | 83 -7% |
| Black Level * (cd/m²) | 0.36 | 0.26 28% | 0.41 -14% | 0.36 -0% | 0.29 19% | 0.5 -39% |
| Contrast (:1) | 1417 | 1169 -18% | 1322 -7% | 813 -43% | 934 -34% | 890 -37% |
| Colorchecker dE 2000 * | 2.3 | 4.5 -96% | 3.5 -52% | 3.48 -51% | 3.9 -70% | 4.75 -107% |
| Colorchecker dE 2000 max. * | 5.5 | 7.7 -40% | 7.8 -42% | 6.81 -24% | 10.2 -85% | 7.79 -42% |
| Colorchecker dE 2000 calibrated * | 1.2 | 2.4 -100% | 1.3 -8% | 3.13 -161% | 2.9 -142% | |
| Greyscale dE 2000 * | 3.2 | 5.2 -63% | 4.8 -50% | 4.1 -28% | 2.6 19% | 4.49 -40% |
| Gamma | 2.34 94% | 2.26 97% | 2.33 94% | 2.2 100% | 2.29 96% | 2.49 88% |
| CCT | 7036 92% | 6789 96% | 7690 85% | 6740 96% | 6517 100% | 7374 88% |
| Color Space (Percent of AdobeRGB 1998) (%) | 59.4 | 53.8 -9% | 58.8 -1% | 84.4 42% | 56.1 -6% | 87 46% |
| Color Space (Percent of sRGB) (%) | 93.1 | 90.1 -3% | 91.1 -2% | 99.6 7% | 85.8 -8% | 100 7% |
| Toplam Ortalama (Program / Ayarlar) | -12% /
-24% | 4% /
-7% | 0% /
-16% | -14% /
-26% | -6% /
-13% |
* ... daha küçük daha iyidir
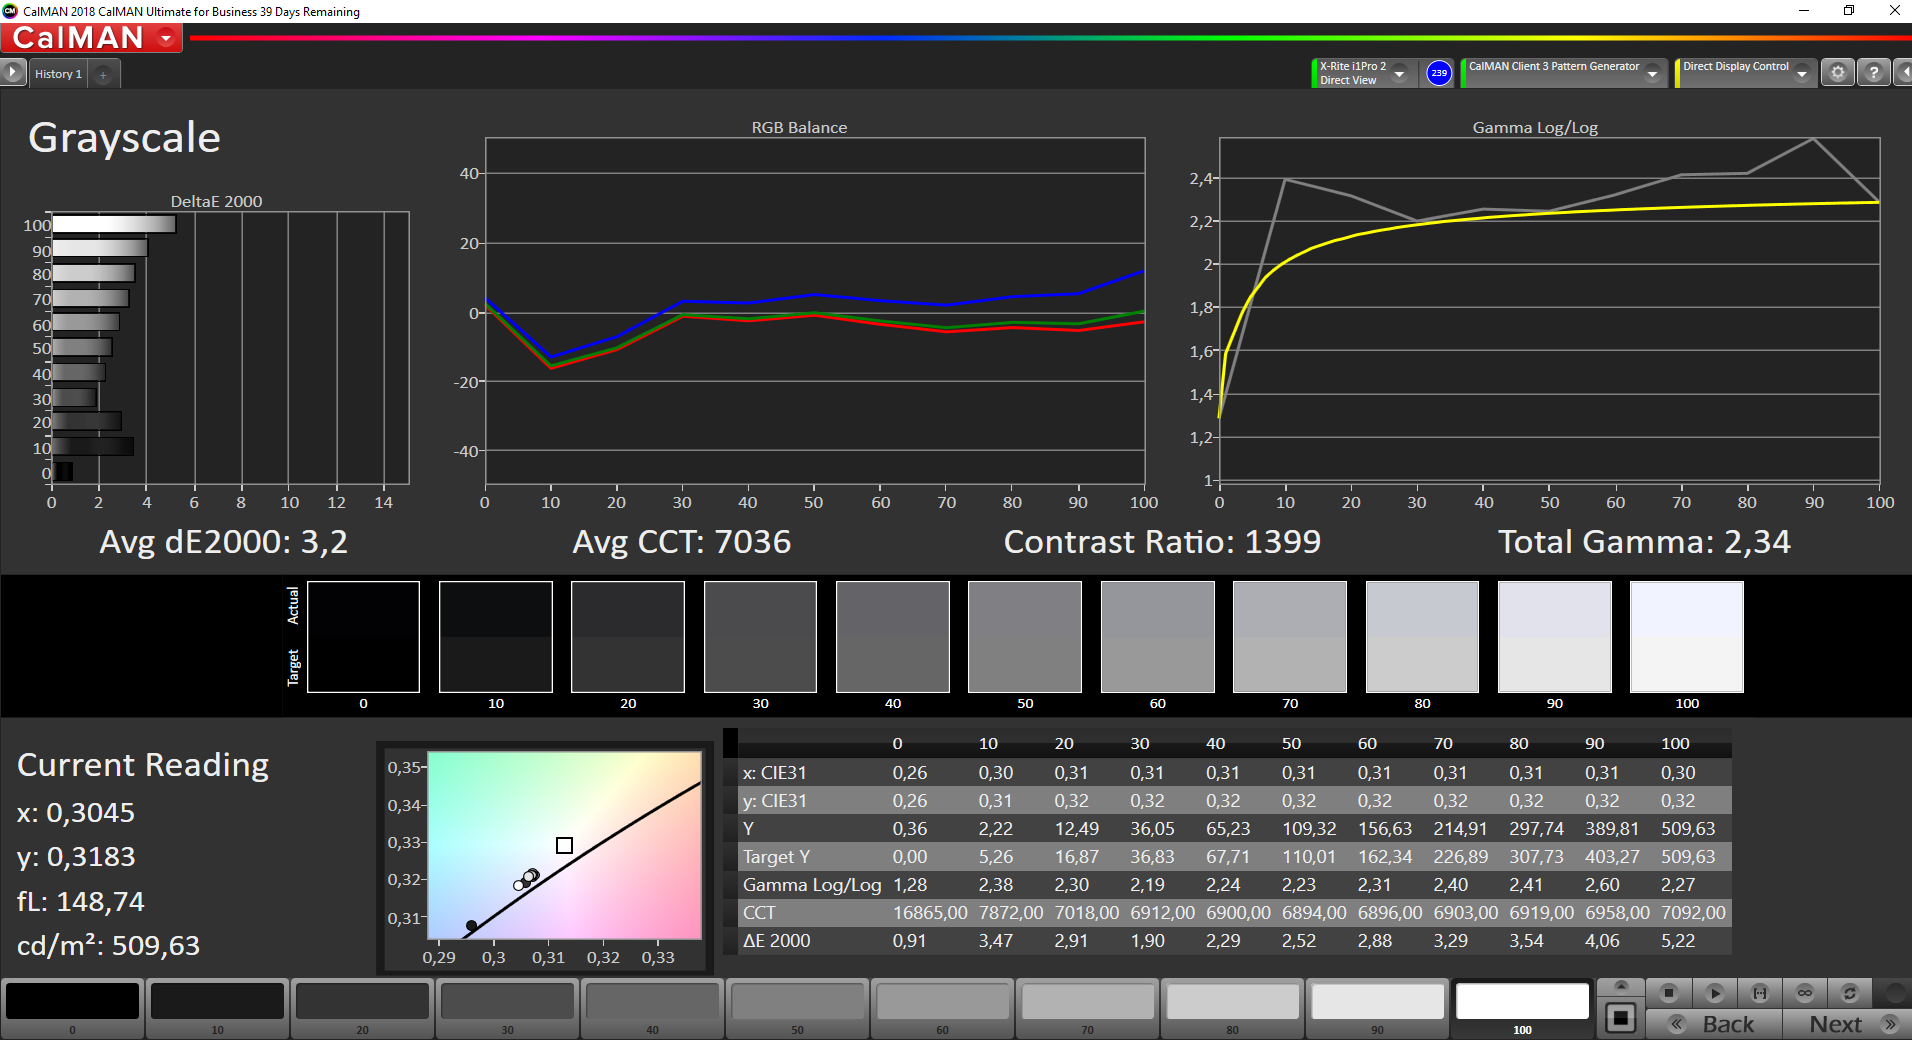
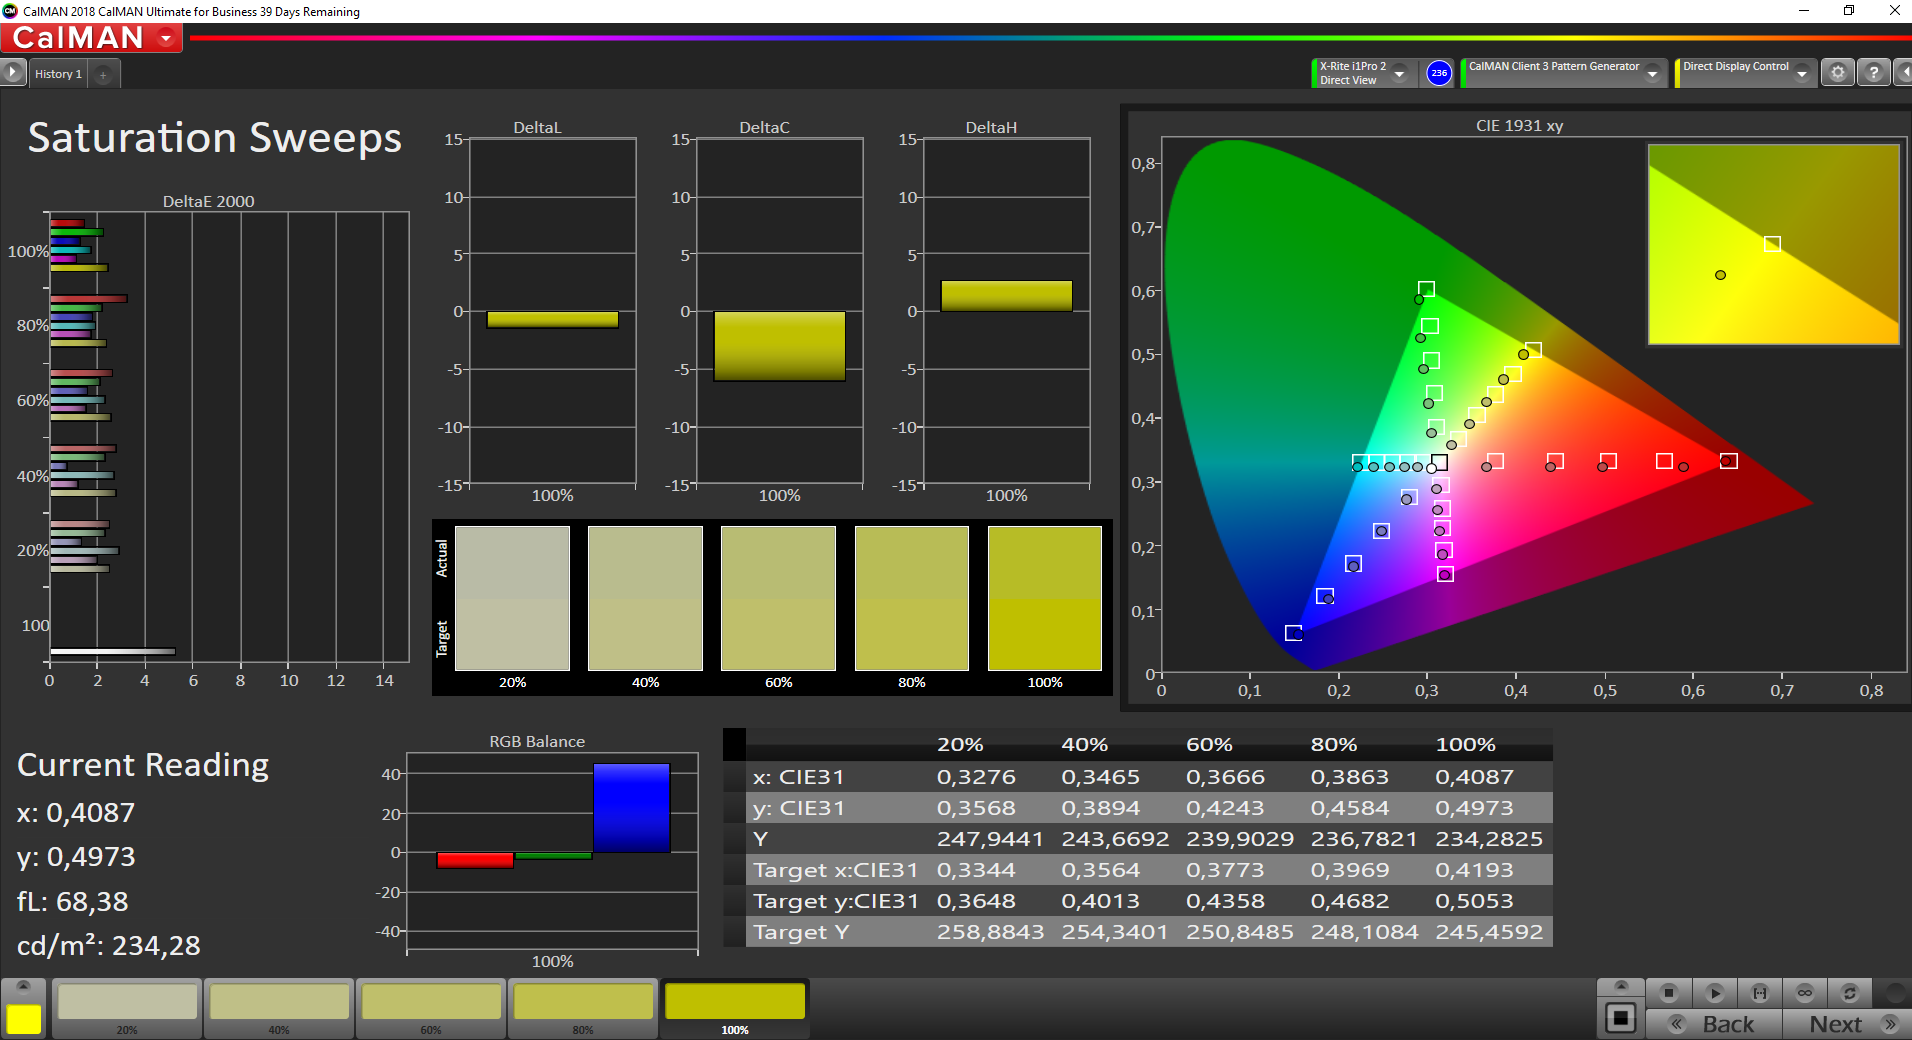
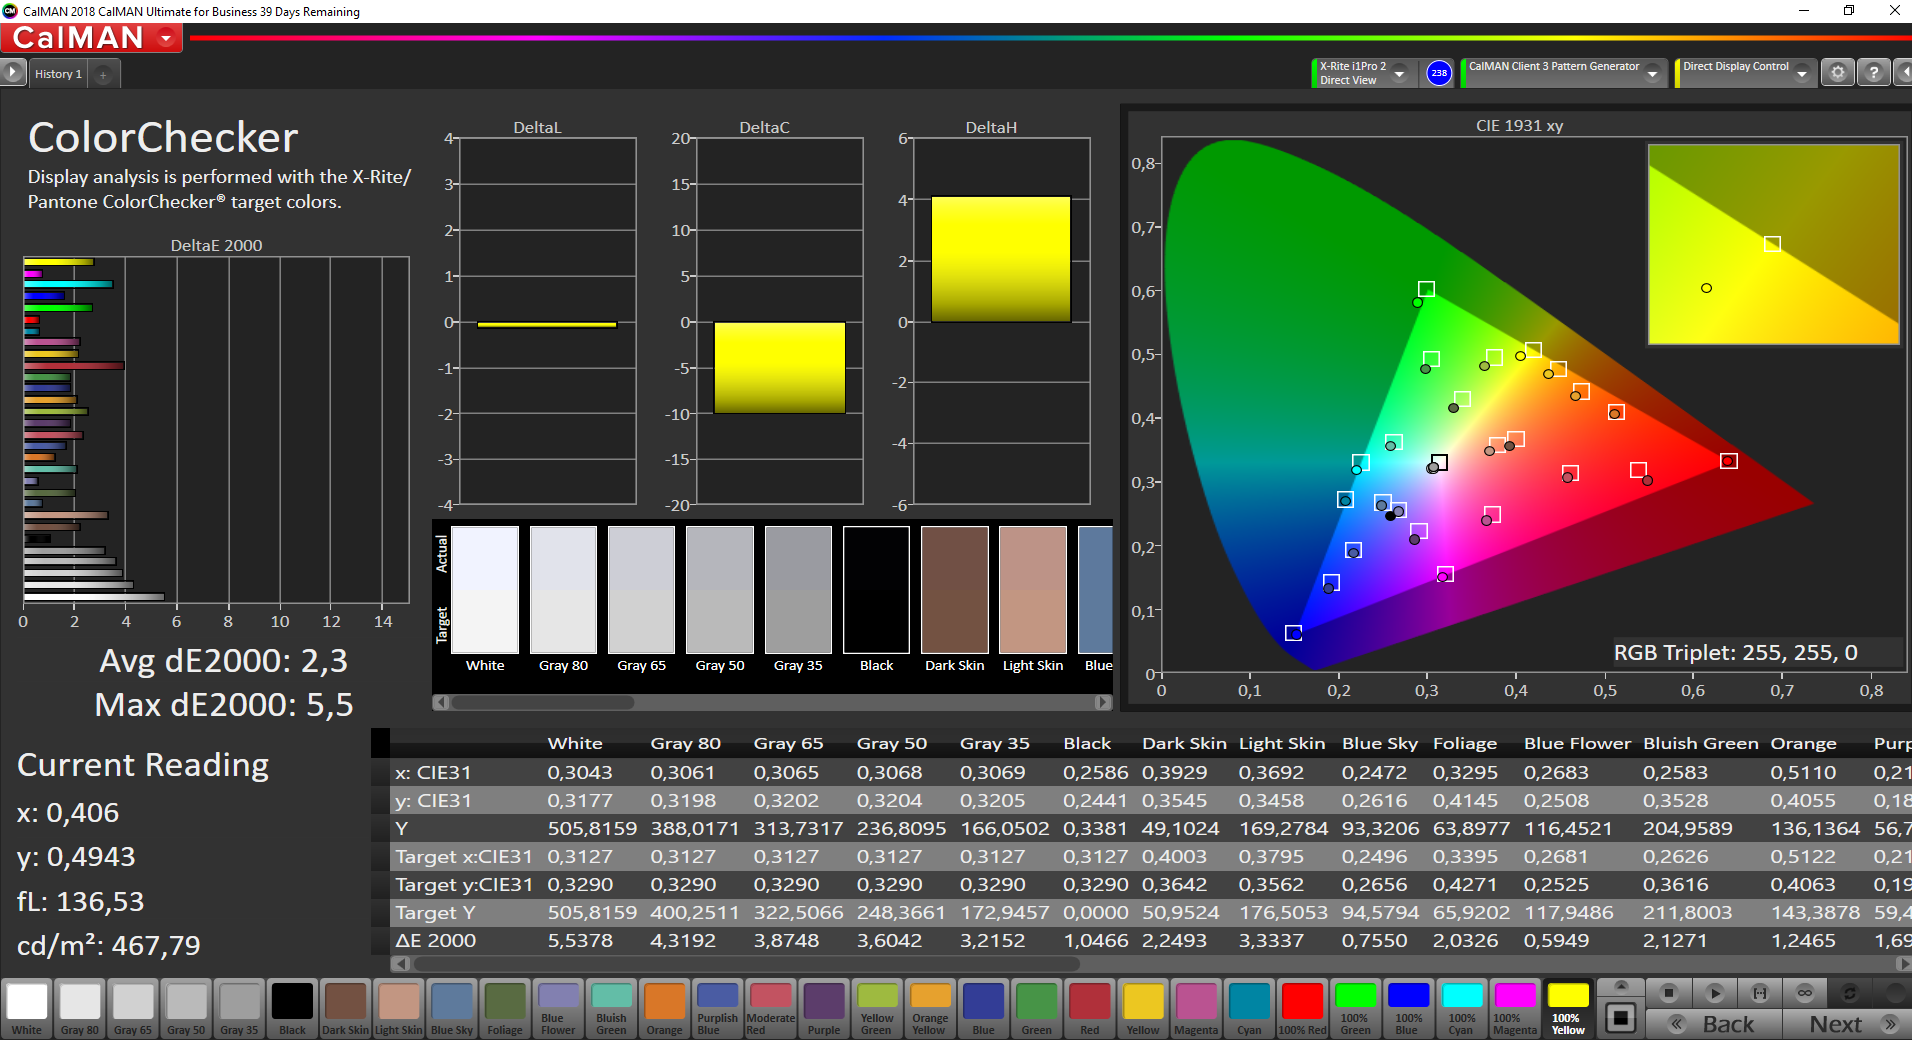
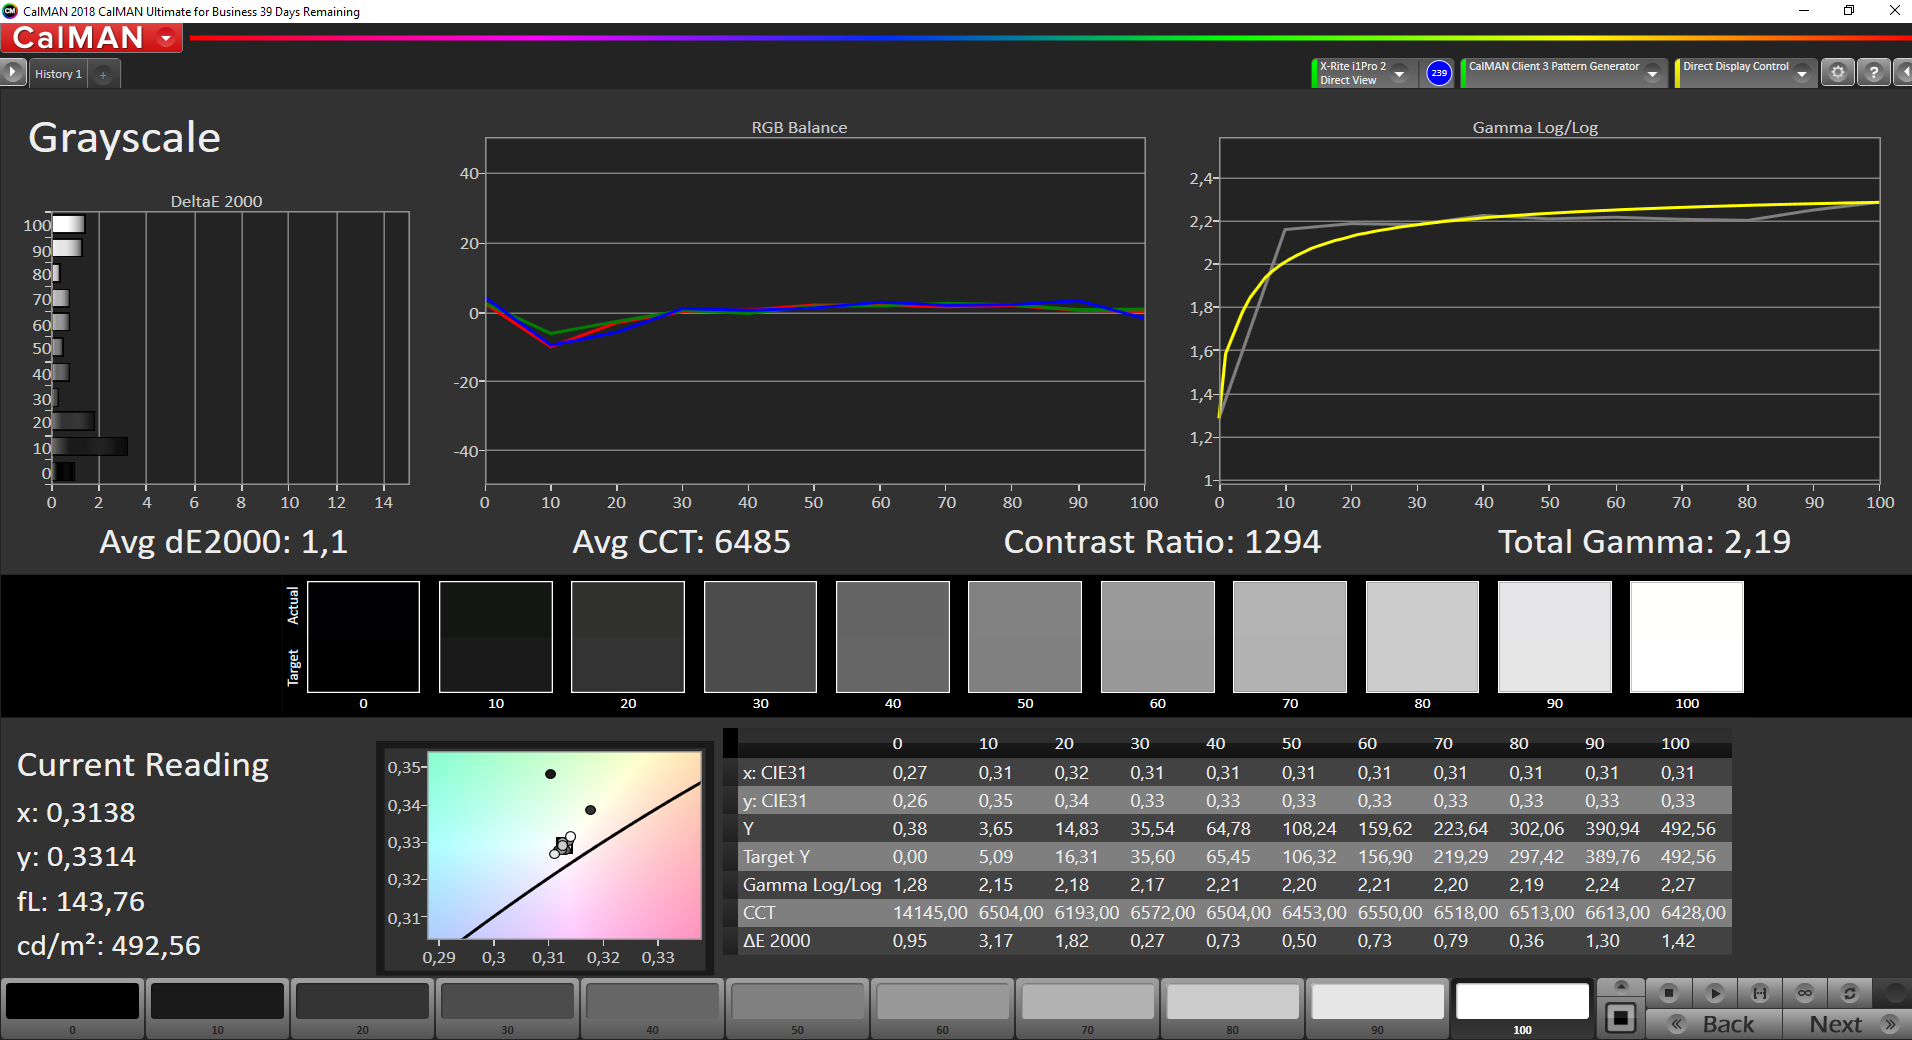
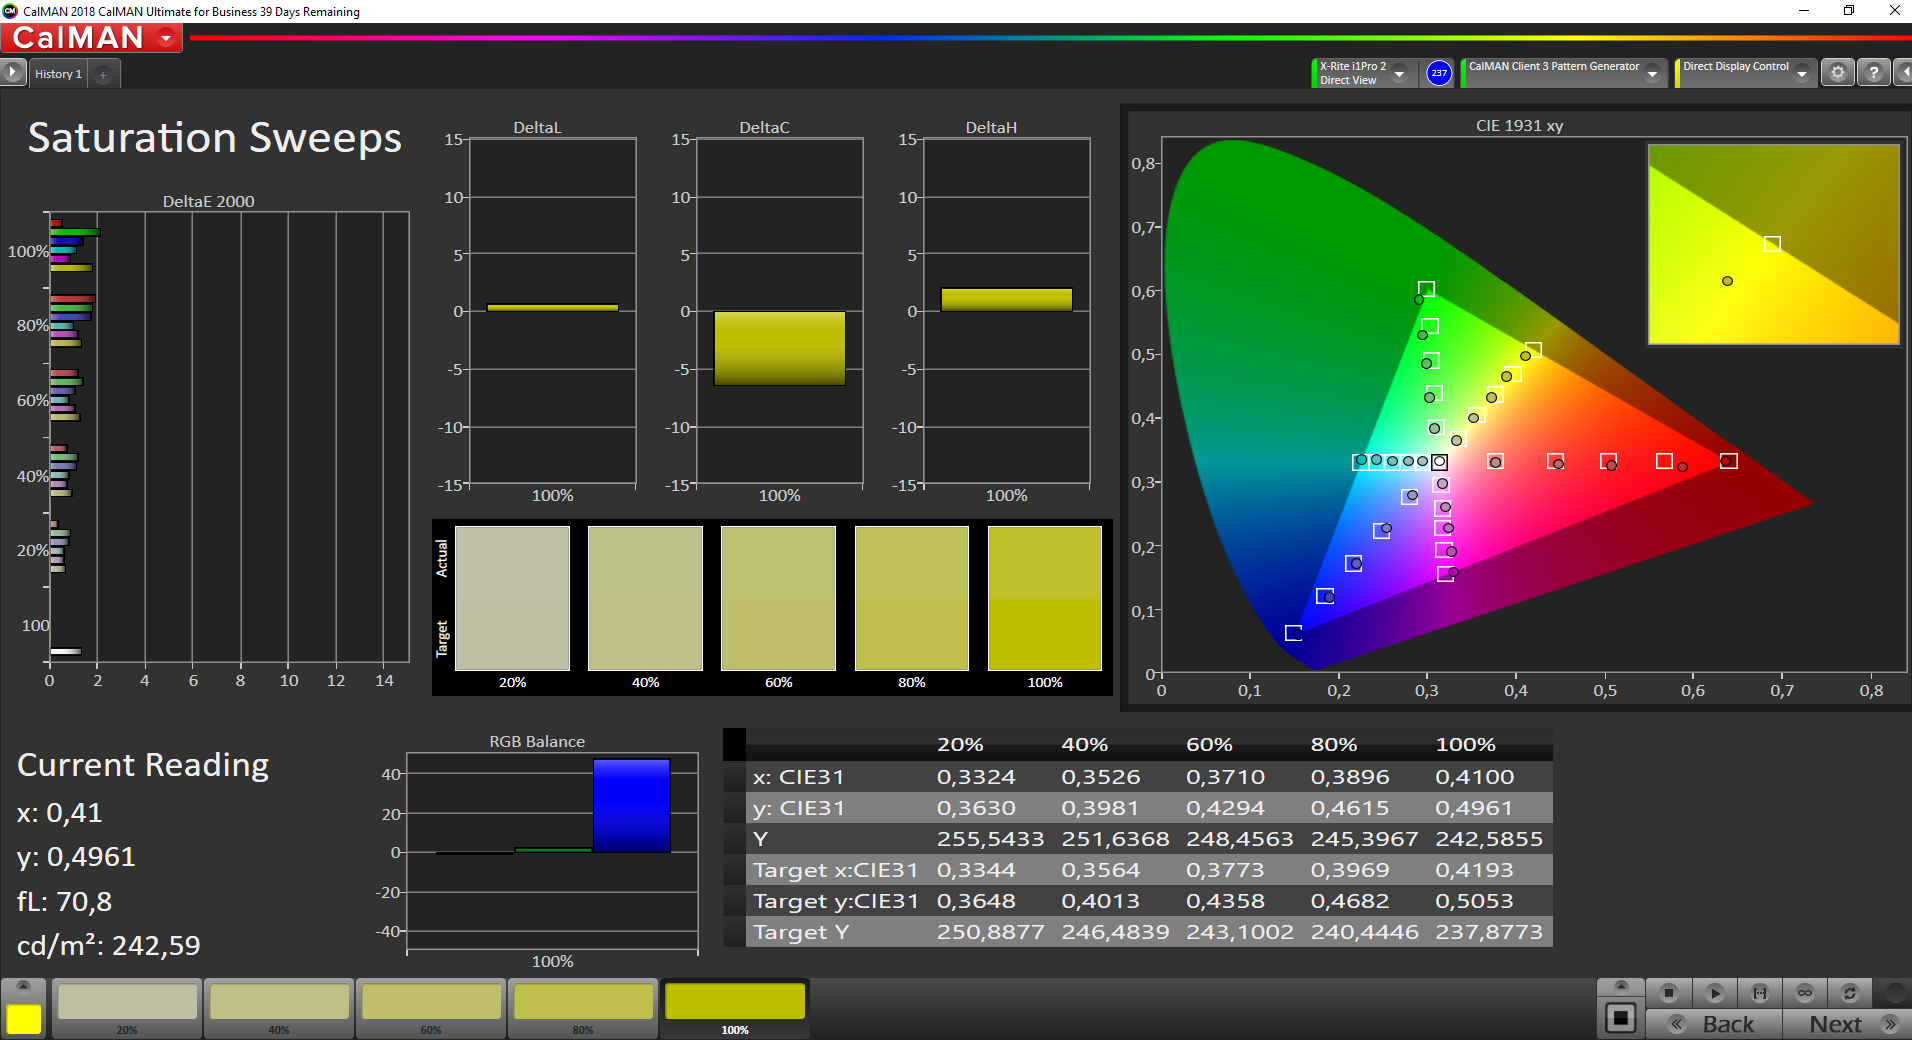
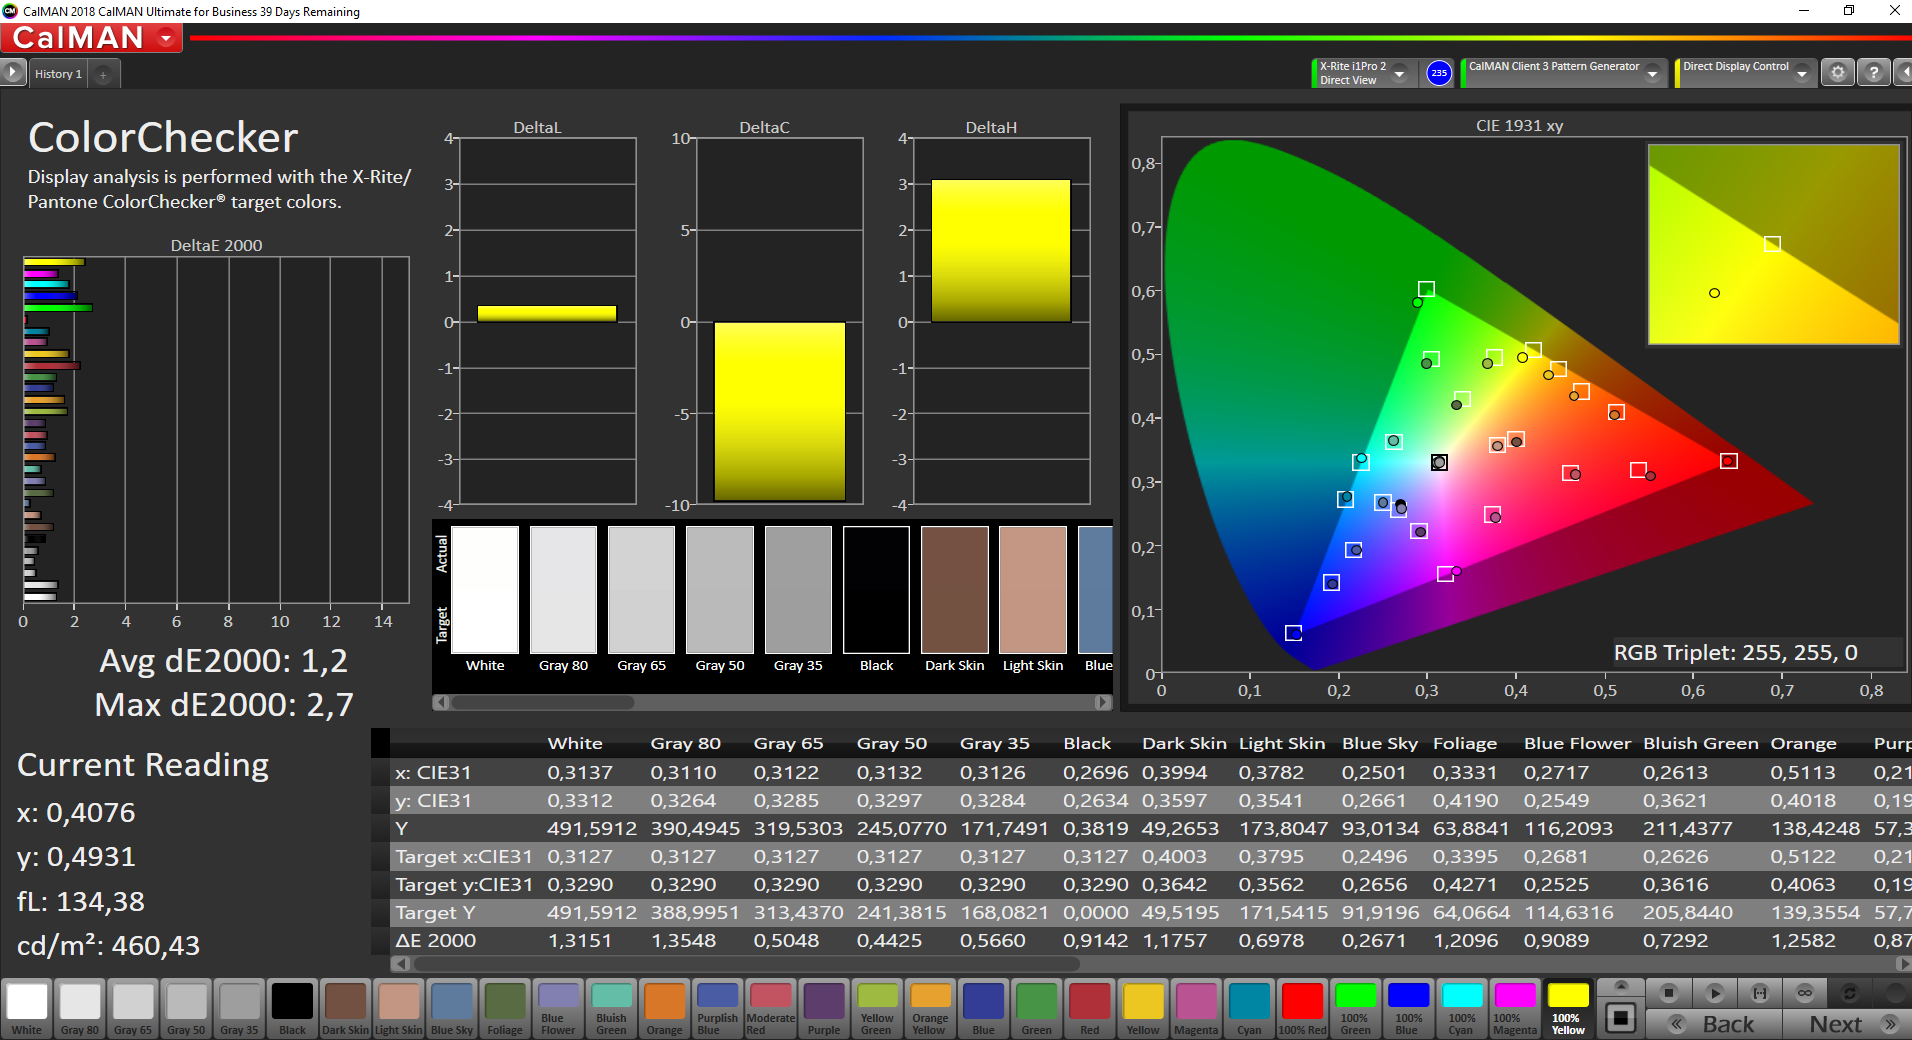
Renk sıcaklığı fabrikadan biraz fazla soğuktu ve kalibrasyon ile düzeltilebilecek mavi renkte bir ton oluşmasına neden oldu (biz bir i1 Pro 2 kullandık). Bununla birlikte, renkler ve gri tonlama kalibrasyon olmadan bile iyi. Ancak, maksimum renk doğruluğunu elde etmek için kullanıcılar hala paneli kalibre etmelidir. Fotoğraf düzenleme mümkün olsa da, eksik sRGB kapsamı nedeniyle daha iyi seçenekler var.
Yanıt Sürelerini Görüntüle
| ↔ Tepki Süresi Siyahtan Beyaza | ||
|---|---|---|
| 25.2 ms ... yükseliş ↗ ve sonbahar↘ birleşimi | ↗ 15.2 ms yükseliş | 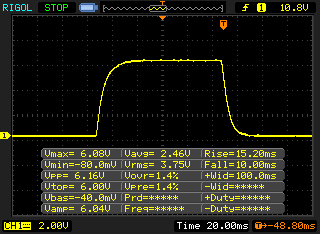 |
| ↘ 10 ms sonbahar | ||
| Ekran, testlerimizde nispeten yavaş yanıt oranları gösteriyor ve oyuncular için çok yavaş olabilir. Karşılaştırıldığında, test edilen tüm cihazlar 0.1 (minimum) ile 240 (maksimum) ms arasında değişir. » Tüm cihazların 61 %'si daha iyi. Bu, ölçülen yanıt süresinin test edilen tüm cihazların ortalamasından (19.8 ms) daha kötü olduğu anlamına gelir. | ||
| ↔ Tepki Süresi %50 Griden %80 Griye | ||
| 38.4 ms ... yükseliş ↗ ve sonbahar↘ birleşimi | ↗ 18.8 ms yükseliş | 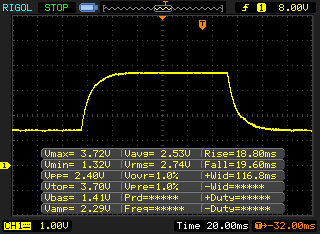 |
| ↘ 19.6 ms sonbahar | ||
| Ekran, testlerimizde yavaş yanıt oranları gösteriyor ve oyuncular için yetersiz olacaktır. Karşılaştırıldığında, test edilen tüm cihazlar 0.165 (minimum) ile 636 (maksimum) ms arasında değişir. » Tüm cihazların 58 %'si daha iyi. Bu, ölçülen yanıt süresinin test edilen tüm cihazların ortalamasından (30.9 ms) daha kötü olduğu anlamına gelir. | ||
Ekran Titremesi / PWM (Darbe Genişliği Modülasyonu)
| Ekran titriyor / PWM algılandı | 26040 Hz | ≤ 77 % parlaklık ayarı | 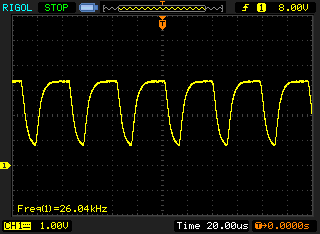 |
Ekran arka ışığı 26040 Hz'de titriyor (en kötü durum, örneğin PWM kullanılması) 77 % ve altındaki parlaklık ayarında titreme algılandı. Bu parlaklık ayarının üzerinde titreme veya PWM olmamalıdır. 26040 Hz frekansı oldukça yüksektir, bu nedenle PWM'ye duyarlı çoğu kullanıcı herhangi bir titremeyi fark etmemelidir. Karşılaştırıldığında: Test edilen tüm cihazların %52 %'si ekranı karartmak için PWM kullanmıyor. PWM tespit edilirse, ortalama 7741 (minimum: 5 - maksimum: 343500) Hz ölçüldü. | |||
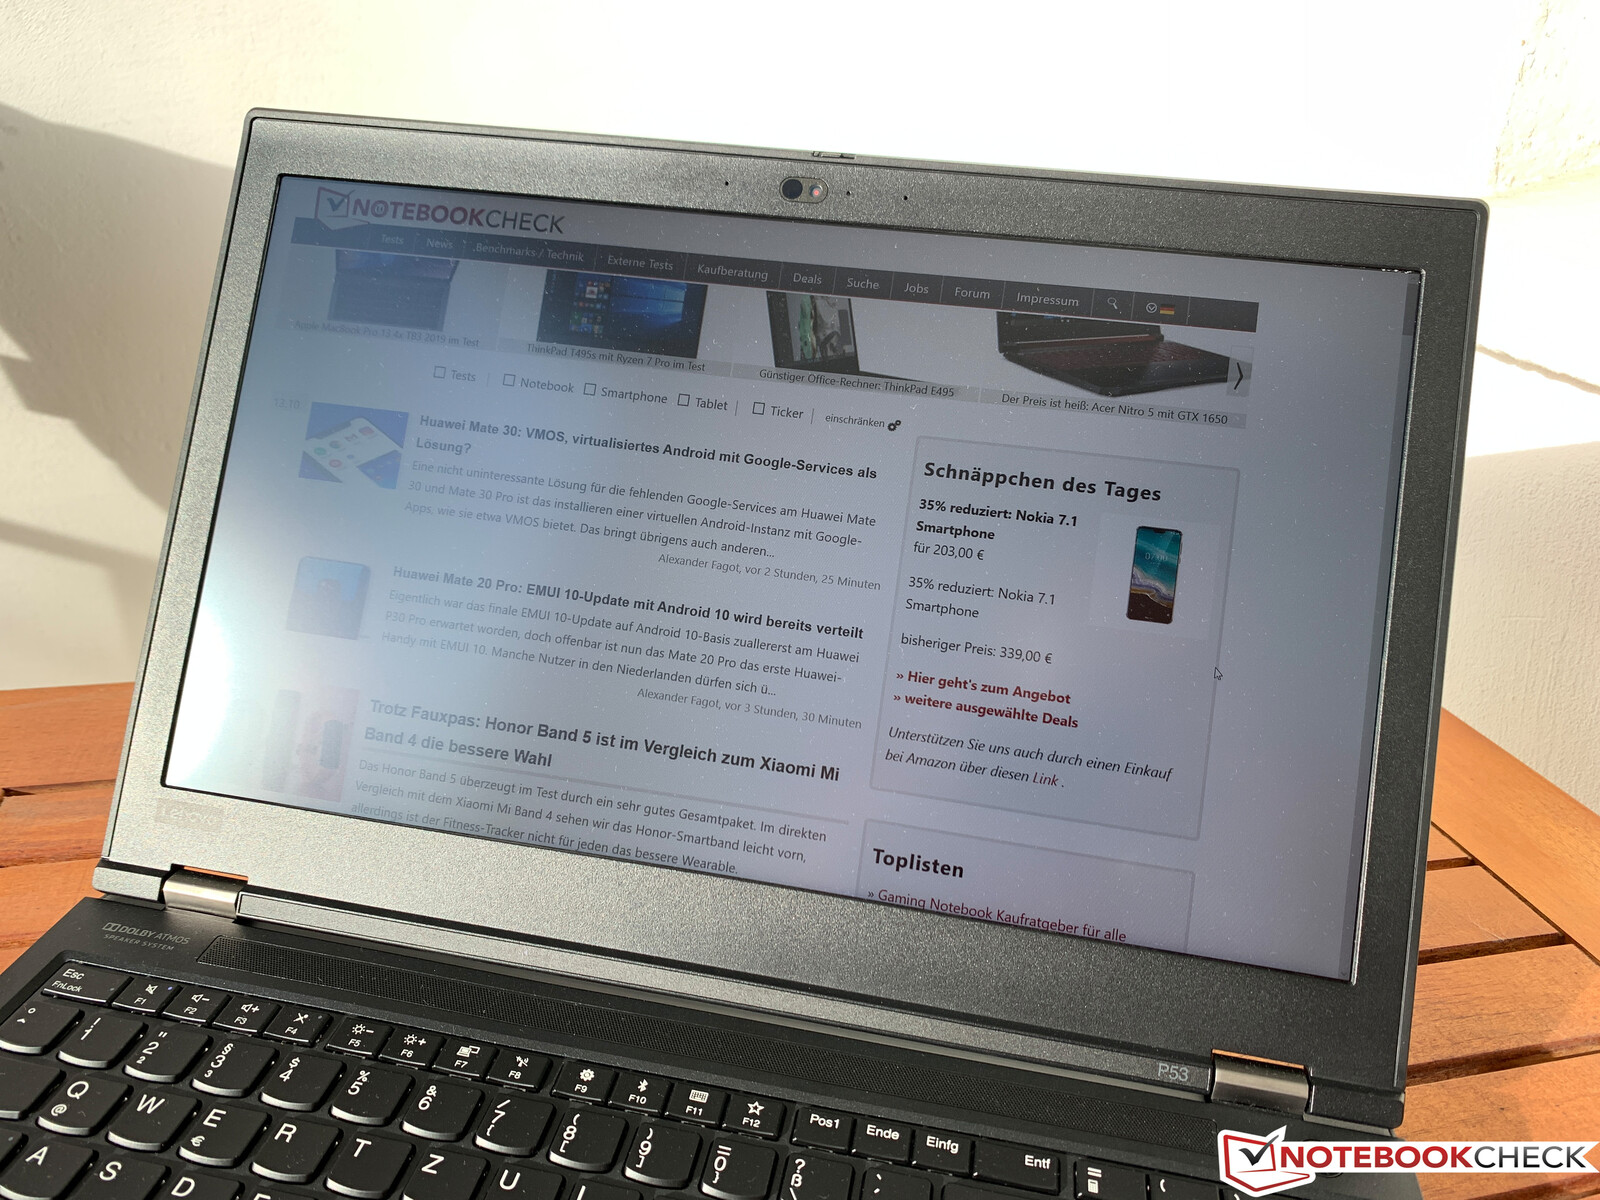
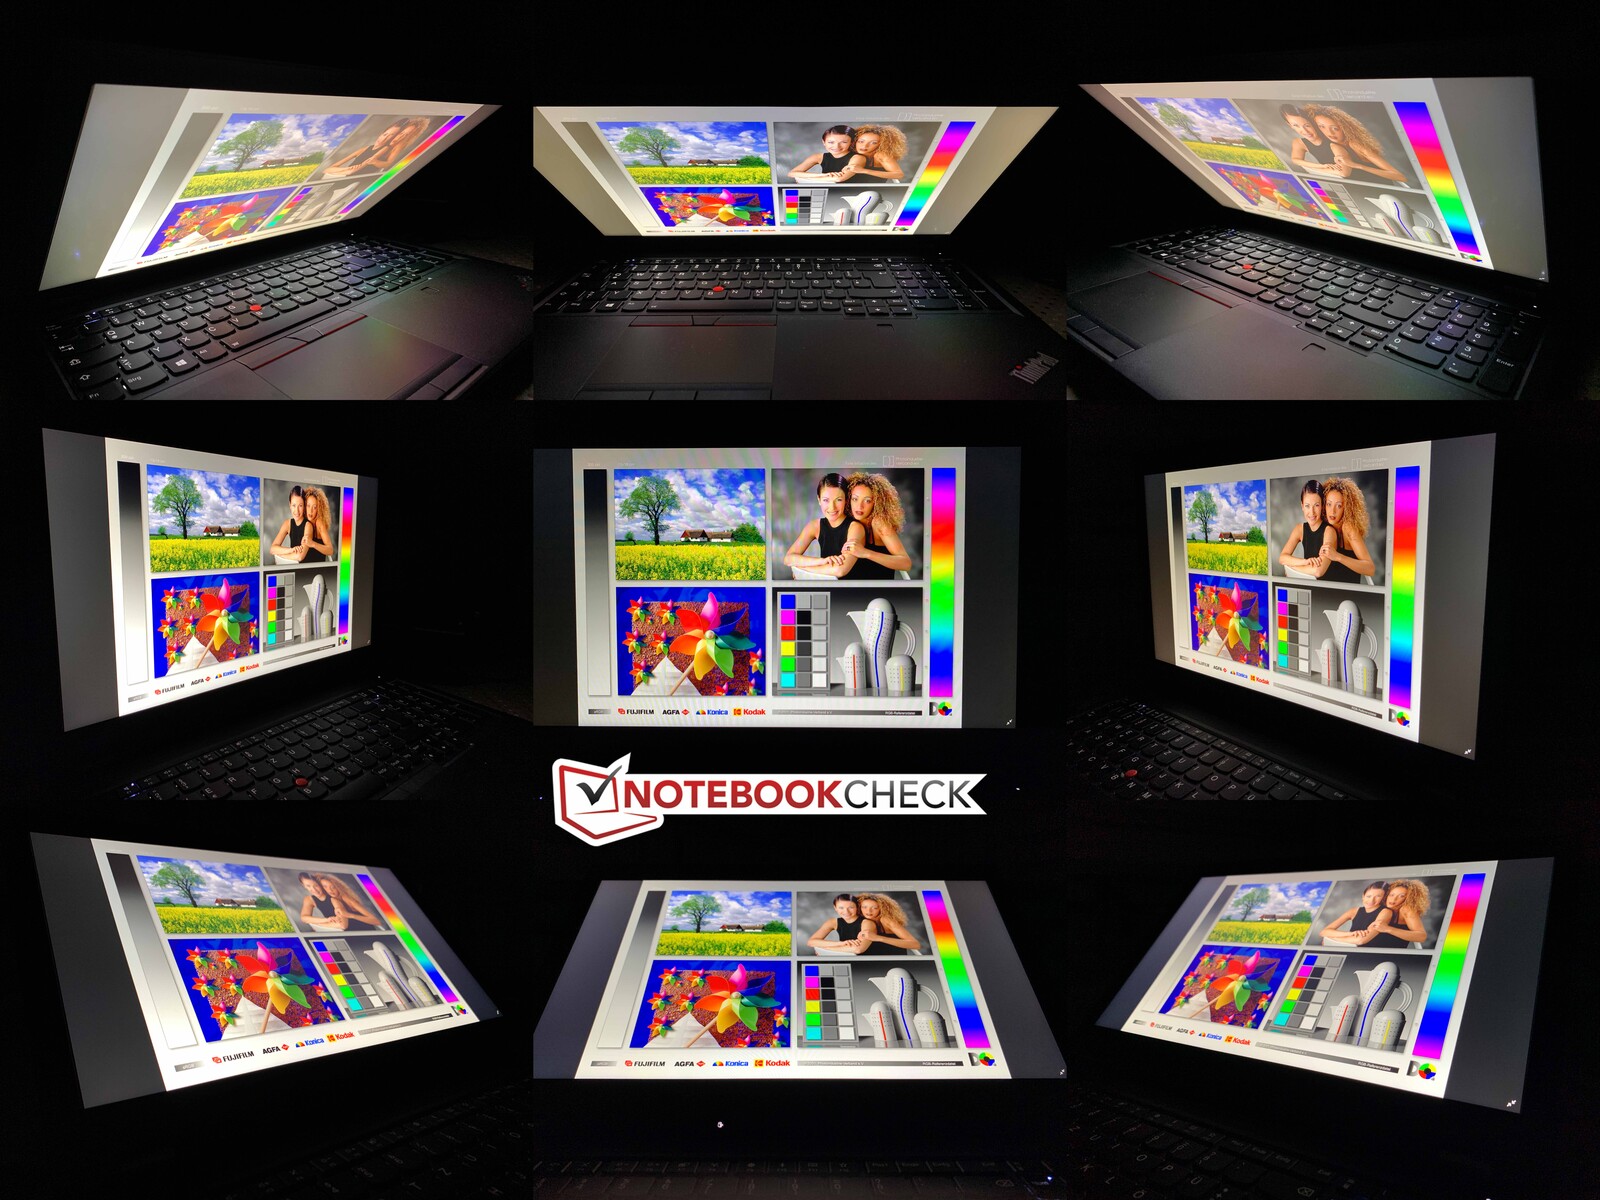
Tabi ki mat panel dış mekanda yüksek maksimum parlaklığından yararlanır ve çok parlak ortamlar için uygundur. Ekranın açısı düzgün şekilde ayarlandığı sürece, aşağıdaki resimlerde gösterildiği gibi, güneş ışığı bile sorun olmaz. IPS paneli her açıdan iyi görünüyor.

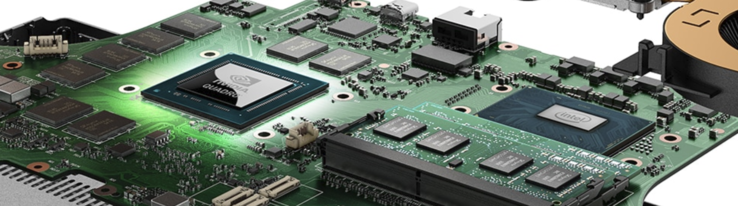
Performans - Birçok Donanım Seçeneği Olan ThinkPad
Lenovo, ThinkPad P53 serisinde çok çeşitli bileşenler sunar; bu, seçilen yapılandırmaya bağlı olarak performans ve emisyonların geniş ölçüde değişebileceği anlamına gelir. En son modellerde, Lenovo'nun "akıllı soğutma" özelliği artık Vantage uygulamasıyla değil, standart Windows güç profiliyle (görev çubuğundaki pil sembolünden seçilebilir) kontrol ediliyor.
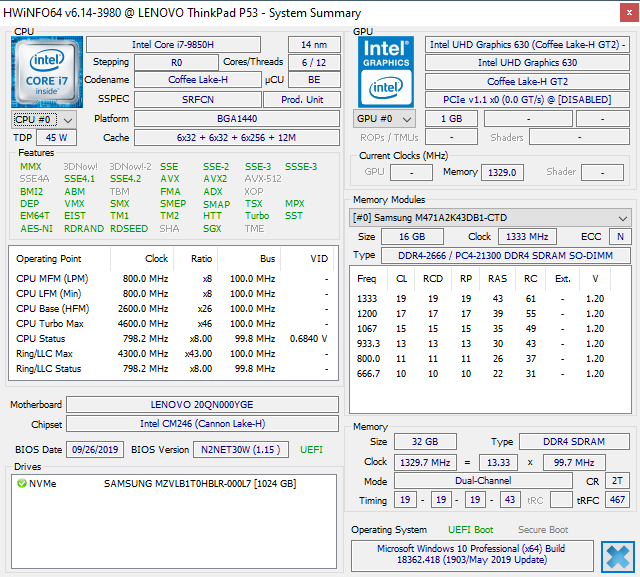
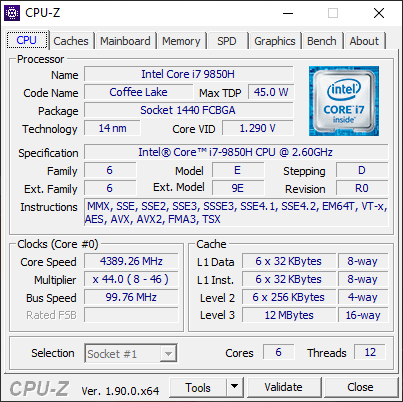
İşlemci - Core i7-9850H ile P53
Lenovo, kullanıcılarına 4 çekirdekli Core i5-9400H, farklı i7 modelleri (6 veya 8 çekirdekli) ve ECC-RAM'i destekleyen bir mobil Xeon işlemci (6 çekirdekli) içeren 45 watt'lık işlemciler arasında bir seçenek sunuyor. Test cihazımızda, temel hızı 2.6 GHz olan ve 4.6 GHz Turbo Boost frekansına sahip güçlü bir 6 çekirdekli CPU olan Core i7-9850H kullanılır. Daha fazla teknik bilgi için CPU'daki özel sayfamıza bakın. Son nesil mobil işlemciye kıyasla performans farkı, soğutma bölümünde çok fazla değişiklik olmadığından genel olarak oldukça küçüktür. P53 gibi kalın iş istasyonları, örneğin ThinkPad P1'i içeren daha ince meslektaşlarına göre, özellikle de uzun süre strese geldiğinde, özellikle de uzun süreli strese geldiğinde, avantajlı olma eğilimindedir. Aynı işlemciye, test cihazımızdan yaklaşık% 14 daha yavaş olacak şekilde donatılmış P1, bunu açıkça göstermektedir. ThinkPad P53'teki Core i7-9850H ilk başta çok iyi bir sonuç çıkarsa da, ilk döngüde 1.230 sayı attı, daha sonra skoru 1.100 puanda düştü ve sabitlendi. Bu sonuç eski ThinkPad P52'nin önüne geçerken, Precision 7530 hala biraz daha hızlı.
90 watt (geçici) ve 60 watt (sürekli) ile Lenovo iki çok cömert CPU güç limiti belirlemiştir. Cihaz tamamen soğuduğunda, 6x 3.7-4.1 GHz'de 89 watt'a kadar tüketim görüyoruz, sadece birkaç saniye sürse bile. Daha sonra bu değer yaklaşık 54 watt'a ve 6x 3.3-3.4 GHz'e düşer. Cinebench döngüsü sırasındaki ortalama değerler aşağıdaki gibidir: 53 watt tüketim, 95.3 ° C (~ 204 ° F) CPU sıcaklığı, 3.4 GHz saat hızı. Burada CPU, gerçek CPU potansiyeline ulaşmıyor, çünkü soğutma çözümü ham CPU stresi sırasında oldukça pasif kalıyor (sadece yaklaşık 7 dakika sonra gerçekten duyulabilir). Bu gözlemlerin gösterdiği gibi, i7-9850H, Ortak i7-9750H, çünkü performans uygulamada esasen aynı olacaktır. İsteğe bağlı Core i9-9880H, 16 iş parçacığının hepsinden de faydalanabilecek iş yükleri için iyi bir seçimdir, ancak kullanıcılar da yeteneklerini tam olarak kullanamayacaklardır. Yukarıda belirtilen CPU seçeneği nedeniyle, Xeon E-2276M (6 çekirdekli) artık kağıt üzerindeki en hızlı işlemci değildir (yalnızca tek çekirdekli kullanım sırasında) ve yalnızca ECC-RAM kullanmayı planlıyorsanız buna değer. pil modunda pratik olarak aynıdır, sonuçta da kısa süreli ve kısa ömürlü performans düşüşleri yaşanır. CB R15 single'da, final skoru 196'dan 183'e düşer ve Cinebench'in çoklu testinde test cihazımız, 1.230 puan yerine sadece 969 puan alır.
| Cinebench R15 | |
| CPU Single 64Bit | |
| Sınıf ortalaması Workstation (191.4 - 328, n=23, son 2 yıl) | |
| Lenovo ThinkPad P53-20QN000YGE | |
| MSI P65 Creator 9SF-657 | |
| Ortalama Intel Core i7-9850H (192 - 196.5, n=3) | |
| Lenovo ThinkPad P1 2019-20QT000RGE | |
| Dell Precision 7530 | |
| Fujitsu Celsius H780 | |
| Lenovo ThinkPad P52 20MAS03N00 | |
| CPU Multi 64Bit | |
| Sınıf ortalaması Workstation (2489 - 5810, n=23, son 2 yıl) | |
| MSI P65 Creator 9SF-657 | |
| Lenovo ThinkPad P53-20QN000YGE | |
| Lenovo ThinkPad P52 20MAS03N00 | |
| Ortalama Intel Core i7-9850H (1114 - 1272, n=3) | |
| Dell Precision 7530 | |
| Fujitsu Celsius H780 | |
| Lenovo ThinkPad P1 2019-20QT000RGE | |
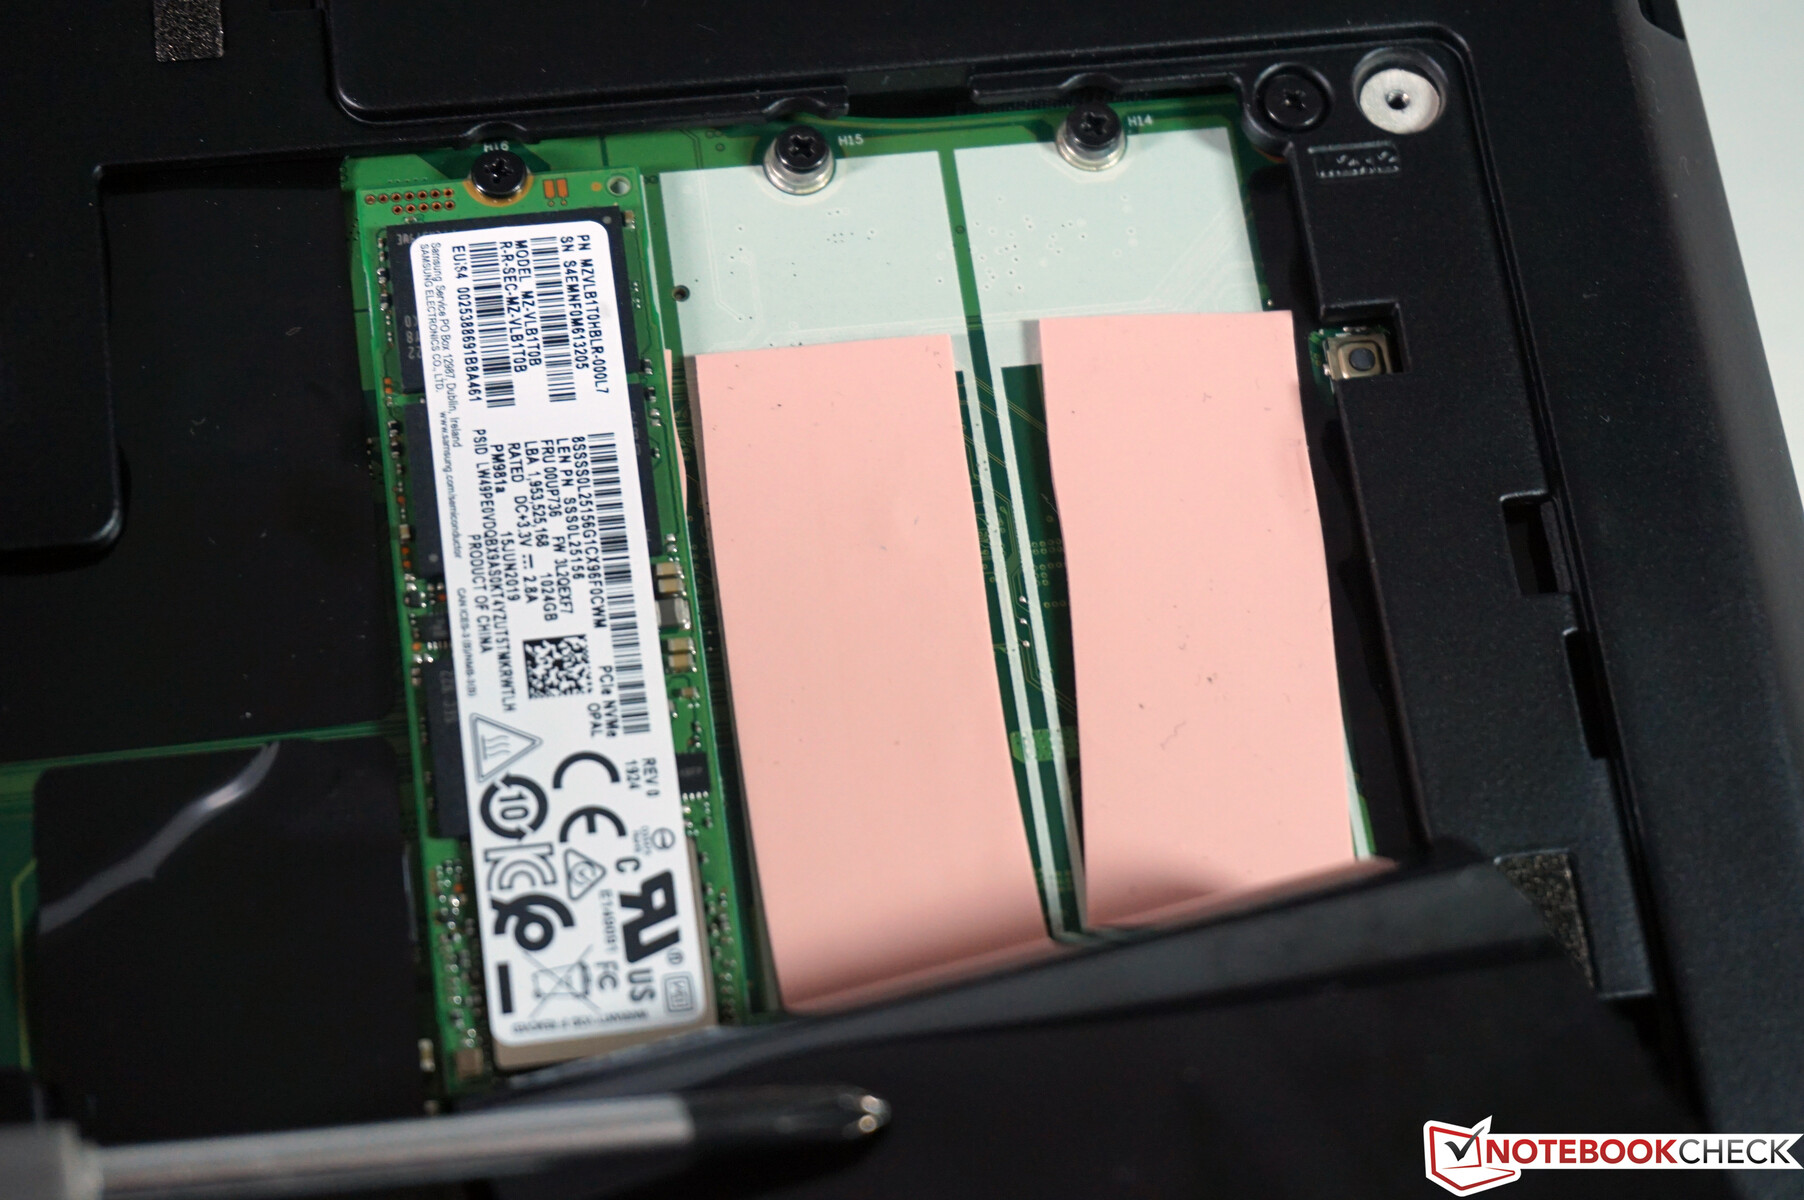
Sistem Performansı - 1 TB PCIe SSD ile İş İstasyonu
Beklendiği gibi, ThinkPad P53'ümüz sentetik benchmark PCMark 10'da ve SSD testlerimizde çok iyi performans gösteriyor. Takılan Samsung M.2 PCIe SSD P981a, 1 TB depolama alanı (dizüstü bilgisayarı ilk kez başlattıktan sonra kullanıcılar için 903 GB kullanılabilir) ve piyasadaki en hızlı okuma ve yazma hızlarından bazılarını sunar. Uygulamada, mobil iş istasyonu Hızlı tepki süreleri ve gözle görülür gecikmeler olmadan sorunsuz sistem çalışması için. Ayrıca testlerimiz sırasında herhangi bir sorunla karşılaşmadık (donma veya mavi ekranlar gibi).
| PCMark 10 | |
| Score | |
| Lenovo ThinkPad P53-20QN000YGE | |
| Dell Precision 7530 | |
| MSI P65 Creator 9SF-657 | |
| Fujitsu Celsius H780 | |
| Lenovo ThinkPad P1 2019-20QT000RGE | |
| Lenovo ThinkPad P52 20MAS03N00 | |
| Essentials | |
| Lenovo ThinkPad P53-20QN000YGE | |
| Lenovo ThinkPad P1 2019-20QT000RGE | |
| Dell Precision 7530 | |
| MSI P65 Creator 9SF-657 | |
| Fujitsu Celsius H780 | |
| Lenovo ThinkPad P52 20MAS03N00 | |
| Productivity | |
| Dell Precision 7530 | |
| Lenovo ThinkPad P53-20QN000YGE | |
| Fujitsu Celsius H780 | |
| Lenovo ThinkPad P1 2019-20QT000RGE | |
| Lenovo ThinkPad P52 20MAS03N00 | |
| MSI P65 Creator 9SF-657 | |
| Digital Content Creation | |
| MSI P65 Creator 9SF-657 | |
| Lenovo ThinkPad P53-20QN000YGE | |
| Dell Precision 7530 | |
| Fujitsu Celsius H780 | |
| Lenovo ThinkPad P1 2019-20QT000RGE | |
| Lenovo ThinkPad P52 20MAS03N00 | |

GPU Performansı - RTX 5000 Max-Q Buna Değer Mi?
Nvidia, Quadro RTX 5000'in farklı modellerini sunuyor ve hangisinin Lenovo'nun ThinkPad P53 için seçtiğini belirlemekte zorlanıyorduk. Bize verilen bilgilere göre, normal RTX 5000'in (Max-Q olmayan) en yavaş, 80-watt modeli kurulur. Farklı versiyonlara genel bir bakış RTX 5000 GPU sayfamızda bulunabilir. Özetle: Sadece çekirdek saat farklıdır ve bizim durumumuzda 600 MHz (baz) ile 1.350 MHz (yükseltme) arasındadır. Bununla birlikte, kullanıcıların teorik değerler hakkında çok fazla endişelenmeleri için bir nedenleri yoktur, çünkü GPU saf GPU testlerinde neredeyse her zaman en az 1.350 MHz ve birleşik GPU testlerinde en az 1.450 MHz; 1.770 MHz bir tepe bile vardı. Böylece, RTX 5000 yeterli soğutma olduğu sürece daha hızlı çalışabilir. Bu, genel performans için ne anlama geliyor? Performans, yalnızca daha büyük 17 inç cihazlarda kullanılabilen "büyük" Quadro RTX 5000 ile aynı olmasa da, 80-watt versiyonu bile, normal bir Quadro RTX 4000'den biraz daha hızlı. Bu, inanılmaz bir performans seviyesi. 15 inçlik bir iş istasyonu ve selefi ThinkPad P52'nin içindeki Quadro P3200 ürününün sunabileceğinden çok daha fazla güç için. ThinkPad P53,% 97'lik bir puanla 3DMark Time Spy'ı geçiyor, bu da GPU performansının uzun süreli stres sırasında bile tutarlı kalması anlamına geliyor. Bununla birlikte, pil modunda yaklaşık% 70'lik bir performans açığı vardır (6,999'a karşı 2,051 puan @ Time Spy Graphics).
| 3DMark 11 - 1280x720 Performance GPU | |
| Sınıf ortalaması Workstation (12535 - 69594, n=23, son 2 yıl) | |
| Ortalama NVIDIA Quadro RTX 5000 Max-Q (24156 - 28524, n=9) | |
| Lenovo ThinkPad P53-20QN000YGE | |
| MSI WS75 9TL-636 | |
| MSI P65 Creator 9SF-657 | |
| Dell Precision 7530 | |
| Lenovo ThinkPad P1 2019-20QT000RGE | |
| Fujitsu Celsius H780 | |
| Lenovo ThinkPad P52 20MAS03N00 | |
| 3DMark | |
| 1920x1080 Fire Strike Graphics | |
| Sınıf ortalaması Workstation (8293 - 52560, n=23, son 2 yıl) | |
| Ortalama NVIDIA Quadro RTX 5000 Max-Q (18247 - 21115, n=10) | |
| Lenovo ThinkPad P53-20QN000YGE | |
| MSI WS75 9TL-636 | |
| MSI P65 Creator 9SF-657 | |
| Dell Precision 7530 | |
| Lenovo ThinkPad P1 2019-20QT000RGE | |
| Fujitsu Celsius H780 | |
| Lenovo ThinkPad P52 20MAS03N00 | |
| 2560x1440 Time Spy Graphics | |
| Sınıf ortalaması Workstation (2725 - 24806, n=23, son 2 yıl) | |
| Ortalama NVIDIA Quadro RTX 5000 Max-Q (6999 - 7977, n=10) | |
| Lenovo ThinkPad P53-20QN000YGE | |
| MSI WS75 9TL-636 | |
| Dell Precision 7530 | |
| Lenovo ThinkPad P1 2019-20QT000RGE | |
| LuxMark v2.0 64Bit | |
| Room GPUs-only | |
| Sınıf ortalaması Workstation (2952 - 6990, n=3, son 2 yıl) | |
| MSI WS75 9TL-636 | |
| Dell Precision 7530 | |
| Ortalama NVIDIA Quadro RTX 5000 Max-Q (1972 - 2008, n=2) | |
| Lenovo ThinkPad P53-20QN000YGE | |
| Lenovo ThinkPad P1 2019-20QT000RGE | |
| Fujitsu Celsius H780 | |
| Lenovo ThinkPad P52 20MAS03N00 | |
| Sala GPUs-only | |
| Sınıf ortalaması Workstation (6574 - 13967, n=3, son 2 yıl) | |
| MSI WS75 9TL-636 | |
| Ortalama NVIDIA Quadro RTX 5000 Max-Q (4913 - 5053, n=2) | |
| Lenovo ThinkPad P53-20QN000YGE | |
| Dell Precision 7530 | |
| Lenovo ThinkPad P1 2019-20QT000RGE | |
| Fujitsu Celsius H780 | |
| Lenovo ThinkPad P52 20MAS03N00 | |
| 3DMark 06 Standard Score | 38739 puan | |
| 3DMark Vantage P Result | 54153 puan | |
| 3DMark 11 Performance | 19250 puan | |
| 3DMark Ice Storm Standard Score | 98630 puan | |
| 3DMark Cloud Gate Standard Score | 38066 puan | |
| 3DMark Fire Strike Score | 16547 puan | |
| 3DMark Time Spy Score | 6879 puan | |
Yardım | ||
Oyun Performansı
Quadro RTX 5000 oyunları çok iyi kullanıyor. Oyun kriterlerimiz sırasında, yalnızca oyunun art arda çökmesine neden olan "Anno 1800's" 4K ön ayarı ile ilgili bir sorunla karşılaştık. Ancak Nvidia'nın Quadro sürücüsü aksi halde iyi çalıştı. Yerel ekran çözünürlüğü için RTX 5000 neredeyse gereksiz yere güçlüdür ve en yeni oyunlar bile maksimum ayrıntı ayarında sorunsuz çalışır. Uzun süreli "The Witcher 3" testimizin gösterdiği gibi, oyun oynarken performans tutarlı kalır.
| düşük | orta | yüksek | ultra | QHD | 4K | |
|---|---|---|---|---|---|---|
| GTA V (2015) | 177 | 170 | 150.4 | 77.6 | 68.4 | |
| The Witcher 3 (2015) | 320 | 235 | 141 | 71 | 46.4 | |
| Dota 2 Reborn (2015) | 148 | 137 | 132 | 126 | 102 | |
| Rise of the Tomb Raider (2016) | 281.4 | 198.6 | 134.5 | 110.1 | 45.4 | |
| X-Plane 11.11 (2018) | 117 | 99 | 85 | |||
| Shadow of the Tomb Raider (2018) | 127 | 102 | 98 | 87 | 59 | 29 |
| Hitman 2 (2018) | 87.7 | 85.3 | 78.4 | 75.3 | 73.3 | 46.6 |
| Battlefield V (2018) | 153.6 | 105.4 | 88.2 | 81.2 | 68.3 | 42.5 |
| Far Cry New Dawn (2019) | 107 | 98 | 90 | 86 | 72 | 43 |
| Dirt Rally 2.0 (2019) | 275 | 188.9 | 160.3 | 89.3 | 66.8 | |
| Anno 1800 (2019) | 94.5 | 97.8 | 73.9 | 38.9 | 31.5 | |
| F1 2019 (2019) | 113 | 101 | 93 | 88 | 83 | 52 |
| Ghost Recon Breakpoint (2019) | 127 | 105 | 93 | 65 | 47 | 26 |
| GRID 2019 (2019) | 178.8 | 155.6 | 118.5 | 79.2 | 61.4 | 36.8 |
Emisyonları
Sistem Gürültüsü
En son Lenovo iş istasyonlarının, yük altında fan hızlarını arttırmak için biraz zaman alan oldukça uyuşuk fan kontrolleri ile donatıldığını fark ettik. Mevcut P53 de bu trendi takip ediyor ve güçlü Quadro RTX 5000'e rağmen sadece birkaç dakika sonra gerçekten duyulabilir hale geliyor. Dizüstü bilgisayar neredeyse her zaman düşük yükler altında sessiz. Oyun sırasında ve stres testimizde sadece 38.3 dB (A) maksimum gürültü seviyesi kaydettik. Bu iyi bir sonuç olsa da, daha iyi bir CPU kullanımı ve daha yüksek performans için hala potansiyel olduğunu göstermektedir. Farklı bir güç profili seçmek (Windows ayarlarından), gürültü seviyesini 38,3 dB (A) (en iyi performans), 33,3 dB (A) (daha iyi performans) ve 32,2 dB (A) (daha uzun pil) kadar düşük olacak şekilde azaltır hayat) sırasıyla stres testimizde.
Ses yüksekliği
| Boşta |
| 28.3 / 28.3 / 28.3 dB |
| Çalışırken |
| 29.8 / 38.3 dB |
 | ||
30 dB sessiz 40 dB(A) duyulabilirlik 50 dB(A) gürültülü |
||
min: | ||
| Lenovo ThinkPad P53-20QN000YGE Quadro RTX 5000 Max-Q, i7-9850H, Samsung PM981a MZVLB1T0HBLR | Lenovo ThinkPad P1 2019-20QT000RGE Quadro T1000 (Laptop), i7-9850H, WDC PC SN720 SDAQNTW-512G | Dell Precision 7530 Quadro P3200, i9-8950HK, Samsung PM961 NVMe MZVLW512HMJP | Fujitsu Celsius H780 Quadro P2000, i7-8850H, Samsung SSD PM981 MZVLB512HAJQ | MSI P65 Creator 9SF-657 GeForce RTX 2070 Max-Q, i9-9880H, 2x Samsung SSD PM981 MZVLB512HAJQ (RAID 0) | Lenovo ThinkPad P52 20MAS03N00 Quadro P1000, i7-8750H, Samsung SSD PM981 MZVLB512HAJQ | |
|---|---|---|---|---|---|---|
| Noise | -4% | -12% | -20% | -18% | -3% | |
| kapalı / ortam * (dB) | 28.3 | 28.8 -2% | 28.3 -0% | 29.6 -5% | 30.2 -7% | 29.5 -4% |
| Idle Minimum * (dB) | 28.3 | 28.8 -2% | 28.3 -0% | 29.6 -5% | 32.8 -16% | 29.5 -4% |
| Idle Average * (dB) | 28.3 | 28.8 -2% | 28.3 -0% | 32.2 -14% | 32.8 -16% | 29.5 -4% |
| Idle Maximum * (dB) | 28.3 | 28.8 -2% | 30.5 -8% | 37 -31% | 33.6 -19% | 29.5 -4% |
| Load Average * (dB) | 29.8 | 36.1 -21% | 34.5 -16% | 40.3 -35% | 40.9 -37% | 34.7 -16% |
| Witcher 3 ultra * (dB) | 38.3 | 49.5 -29% | 33.1 14% | |||
| Load Maximum * (dB) | 38.3 | 36.7 4% | 49.5 -29% | 49.4 -29% | 42.7 -11% | 39.4 -3% |
* ... daha küçük daha iyidir
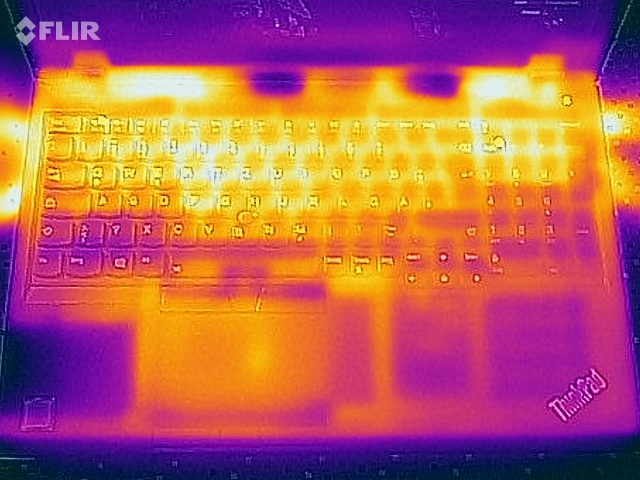
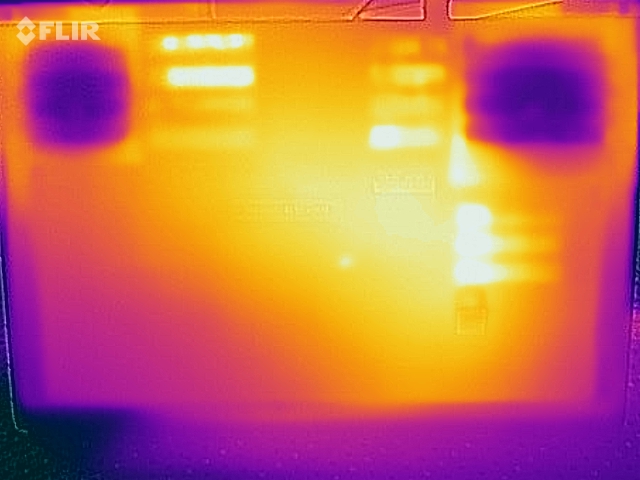
Sıcaklık
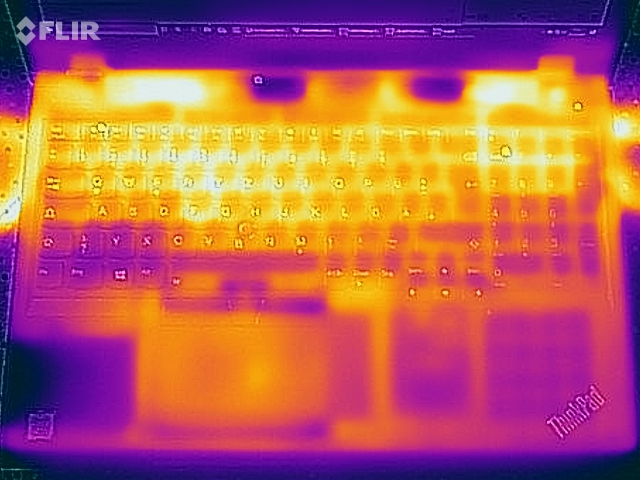
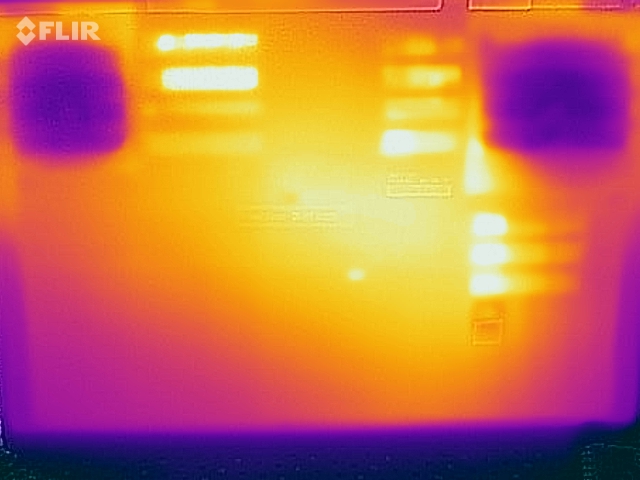
Mobil iş istasyonunun yüzey sıcaklıkları yük altında bile problemsiz kaldı, ancak cihaz mümkünse kucağınıza değil düz bir masaya kurulmalıdır. Klavye de ısınırken, bu gerçekten yazmayı etkilemez. Performans seviyesi göz önüne alındığında, bu iyi bir sonuçtur.
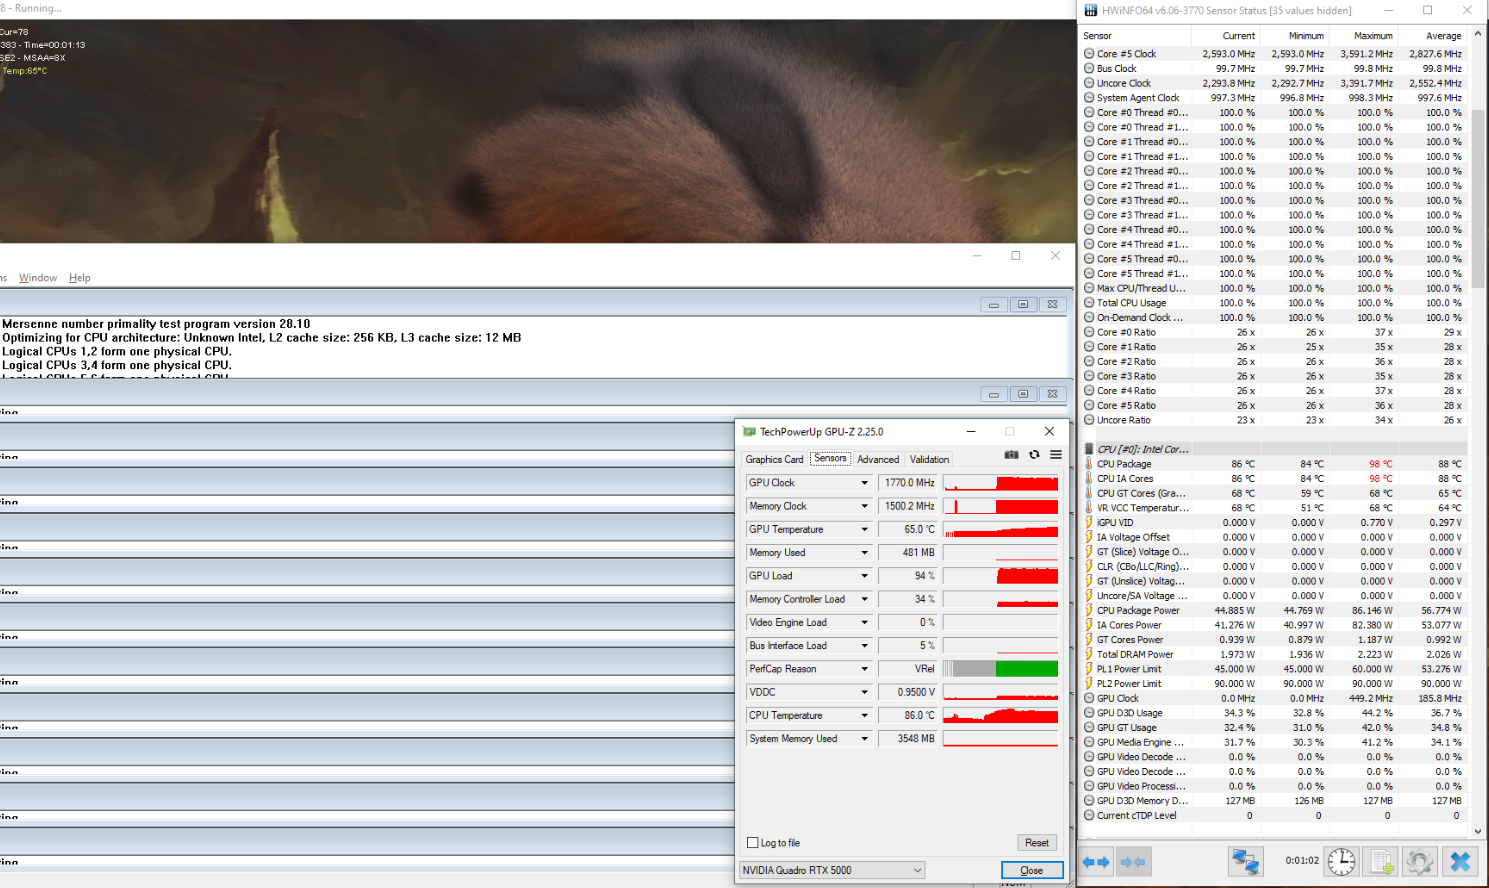
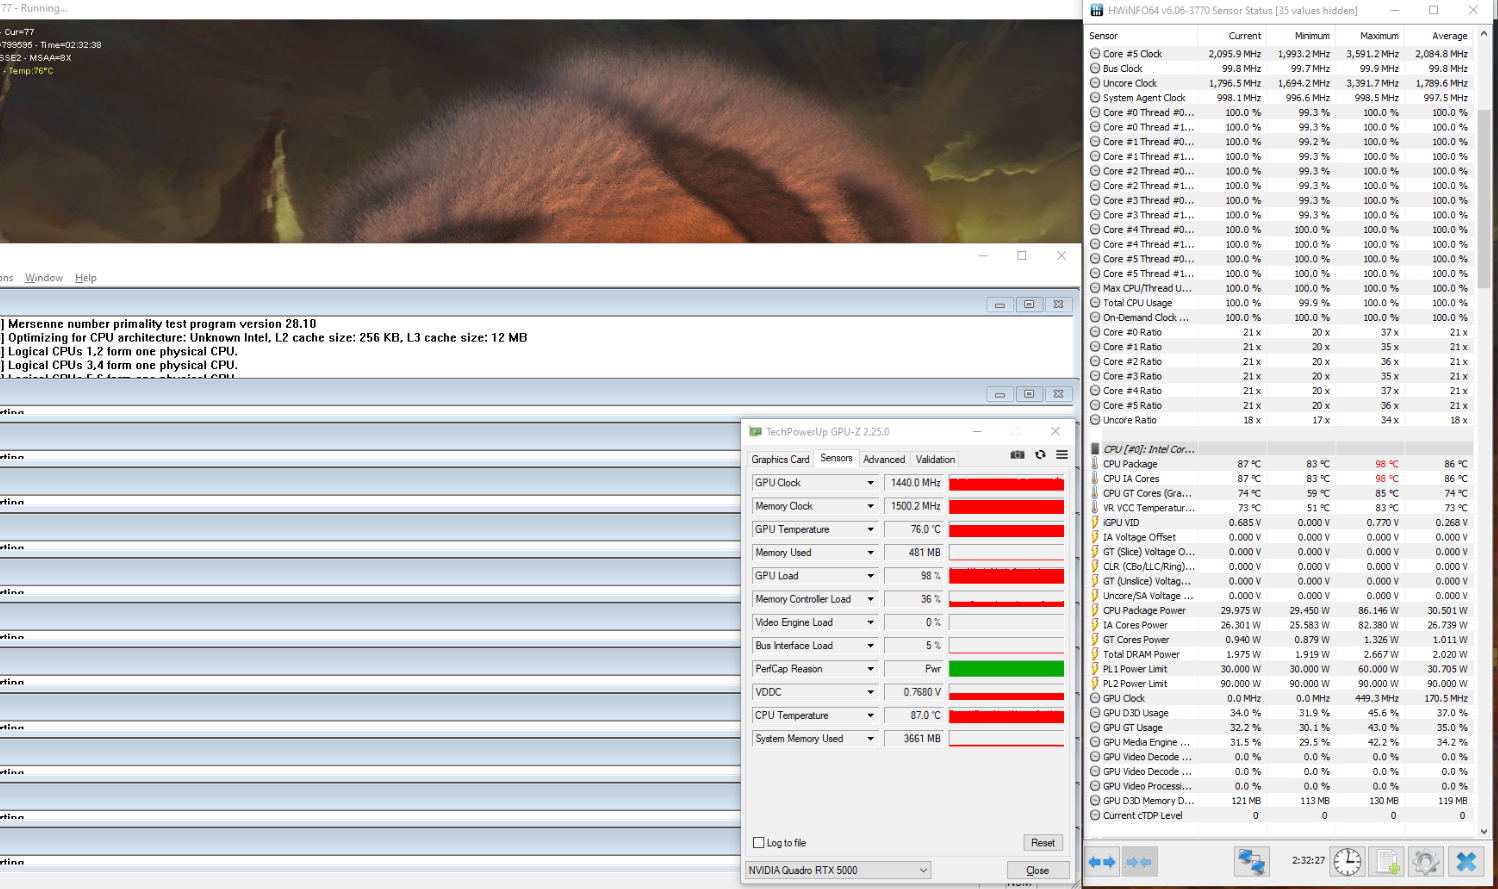
Stres testimiz, Quadro RTX 5000'in saat hızının normal yükseltme frekansına (~ 1,350-1,440 MHz) ulaşabileceği için Lenovo'nun GPU performansına öncelik verdiğini gösteriyor. Bu açık bir şekilde 15 inçlik bir iş istasyonunun içinde böylesine güçlü bir GPU için iyi bir sonuç olsa da, CPU gücü pahasına geliyor. Sonuncusu sadece 6 dakika 2.1 GHz hızında çalışmasına izin veren birkaç dakika sonra 30 watt'lık bir güç bütçesiyle mücadele etmek zorunda. Burada, minimum sürekli 45 watt tüketim ile daha dengeli bir güç dağılımı görmek isterdik. Daha düşük kaliteli bir grafik kartı seçerken, soğutma çözümü işlemciye daha fazla soğutma gücü verebilmeli, ancak bunu doğrulayamıyoruz. Bu noktada durum budur.
(±) Üst taraftaki maksimum sıcaklık, 38.2 °C / 101 F ortalamasına kıyasla 41.8 °C / 107 F'dir. , Workstation sınıfı için 22.2 ile 69.8 °C arasında değişir.
(-) Alt kısım, 41.1 °C / 106 F ortalamasına kıyasla maksimum 46.1 °C / 115 F'ye kadar ısınır
(+) Boşta kullanımda, üst tarafın ortalama sıcaklığı 21.9 °C / 71 F olup, cihazın 32 °C / 90 F.
(±) The Witcher 3 oynarken, üst tarafın ortalama sıcaklığı 38 °C / 100 F olup, cihazın 32 °C / 90 F.
(±) Avuç içi dayanakları ve dokunmatik yüzey maksimum 37.1 °C / 98.8 F ile dokunulamayacak kadar ısınabilir.
(-) Benzer cihazların avuç içi dayanağı alanının ortalama sıcaklığı 27.8 °C / 82 F (-9.3 °C / -16.8 F) idi.
Hoparlörler
Konuşmacılar açısından pek bir şey değişmedi. Her biri 2 watt'lık iki stereo modül hala ne çok yüksek ne de çok iyi. Ses kalitesi konuşma için yeterli olsa da, müzik ve videolar için kulaklık veya harici hoparlör kullanmanızı öneririz. Lenovo'nun X1 Extreme'i, üreticinin yüksek kaliteli hoparlörleri nasıl kullanacağını bildiğini göstermesine rağmen, bu özellik iş istasyonu kullanıcıları için bir öncelik olarak görünmüyor.
Lenovo ThinkPad P53-20QN000YGE ses analizi
(±) | hoparlör ses yüksekliği ortalama ama iyi (72.8 dB)
Bas 100 - 315Hz
(±) | azaltılmış bas - ortalama olarak medyandan 11.6% daha düşük
(±) | Bas doğrusallığı ortalamadır (13.6% delta - önceki frekans)
Ortalar 400 - 2000 Hz
(±) | daha yüksek ortalar - ortalama olarak medyandan 7.8% daha yüksek
(±) | Ortaların doğrusallığı ortalamadır (7.5% delta - önceki frekans)
Yüksekler 2 - 16 kHz
(+) | dengeli yüksekler - medyandan yalnızca 1.9% uzakta
(+) | yüksekler doğrusaldır (4.8% deltadan önceki frekansa)
Toplam 100 - 16.000 Hz
(±) | Genel sesin doğrusallığı ortalamadır (23.1% ortancaya göre fark)
Aynı sınıfla karşılaştırıldığında
» Bu sınıftaki tüm test edilen cihazların %83%'si daha iyi, 3% benzer, 14% daha kötüydü
» En iyisinin deltası 7% idi, ortalama 17% idi, en kötüsü 35% idi
Test edilen tüm cihazlarla karşılaştırıldığında
» Test edilen tüm cihazların %69'si daha iyi, 5 benzer, % 26 daha kötüydü
» En iyisinin deltası 4% idi, ortalama 23% idi, en kötüsü 134% idi
Dell Precision 7530 ses analizi
(±) | hoparlör ses yüksekliği ortalama ama iyi (74.4 dB)
Bas 100 - 315Hz
(±) | azaltılmış bas - ortalama olarak medyandan 8% daha düşük
(±) | Bas doğrusallığı ortalamadır (12.3% delta - önceki frekans)
Ortalar 400 - 2000 Hz
(+) | dengeli ortalar - medyandan yalnızca 3.3% uzakta
(±) | Ortaların doğrusallığı ortalamadır (7.8% delta - önceki frekans)
Yüksekler 2 - 16 kHz
(+) | dengeli yüksekler - medyandan yalnızca 2.3% uzakta
(+) | yüksekler doğrusaldır (5% deltadan önceki frekansa)
Toplam 100 - 16.000 Hz
(+) | genel ses doğrusaldır (11.4% ortancaya göre fark)
Aynı sınıfla karşılaştırıldığında
» Bu sınıftaki tüm test edilen cihazların %13%'si daha iyi, 4% benzer, 83% daha kötüydü
» En iyisinin deltası 7% idi, ortalama 17% idi, en kötüsü 35% idi
Test edilen tüm cihazlarla karşılaştırıldığında
» Test edilen tüm cihazların %7'si daha iyi, 2 benzer, % 90 daha kötüydü
» En iyisinin deltası 4% idi, ortalama 23% idi, en kötüsü 134% idi
Enerji yönetimi
Enerji tüketimi
Rölantideki tüketim, önceki ThinkPad P52 ile karşılaştırıldığında artmış olsa da, sonuçlar hala mükemmel. Yaklaşık 208 watt'lık geçici pik tüketimi, yalnızca stres testinin ilk birkaç saniyesi için tutuldu. CPU performansına benzer şekilde, tüketim 137 watt'ta (CPU @ 30 watt) dengelemeden önce durmadan düşer.
| Kapalı / Bekleme modu | |
| Boşta | |
| Çalışırken |
|
Key:
min: | |
| Lenovo ThinkPad P53-20QN000YGE i7-9850H, Quadro RTX 5000 Max-Q, Samsung PM981a MZVLB1T0HBLR, IPS, 1920x1080, 15.6" | Lenovo ThinkPad P1 2019-20QT000RGE i7-9850H, Quadro T1000 (Laptop), WDC PC SN720 SDAQNTW-512G, IPS LED, 1920x1080, 15.6" | Dell Precision 7530 i9-8950HK, Quadro P3200, Samsung PM961 NVMe MZVLW512HMJP, IPS, 3840x2160, 15.6" | Fujitsu Celsius H780 i7-8850H, Quadro P2000, Samsung SSD PM981 MZVLB512HAJQ, IPS LED, 1920x1080, 15.6" | MSI P65 Creator 9SF-657 i9-9880H, GeForce RTX 2070 Max-Q, 2x Samsung SSD PM981 MZVLB512HAJQ (RAID 0), IPS, 3840x2160, 15.6" | Lenovo ThinkPad P52 20MAS03N00 i7-8750H, Quadro P1000, Samsung SSD PM981 MZVLB512HAJQ, IPS LED, 1920x1080, 15.6" | |
|---|---|---|---|---|---|---|
| Power Consumption | -20% | -40% | 3% | -22% | 35% | |
| Idle Minimum * (Watt) | 7.9 | 13.7 -73% | 15.7 -99% | 9.1 -15% | 9.4 -19% | 4.02 49% |
| Idle Average * (Watt) | 11.8 | 17.5 -48% | 20.3 -72% | 13.2 -12% | 17.4 -47% | 7.2 39% |
| Idle Maximum * (Watt) | 14.9 | 20.9 -40% | 25.7 -72% | 14.04 6% | 19.6 -32% | 11.46 23% |
| Load Average * (Watt) | 96 | 77.2 20% | 118.9 -24% | 78.8 18% | 103 -7% | 76.3 21% |
| Witcher 3 ultra * (Watt) | 149 | 131.2 12% | 74 50% | |||
| Load Maximum * (Watt) | 207.8 | 123.7 40% | 174 16% | 172.5 17% | 216 -4% | 154 26% |
* ... daha küçük daha iyidir
Pil ömrü
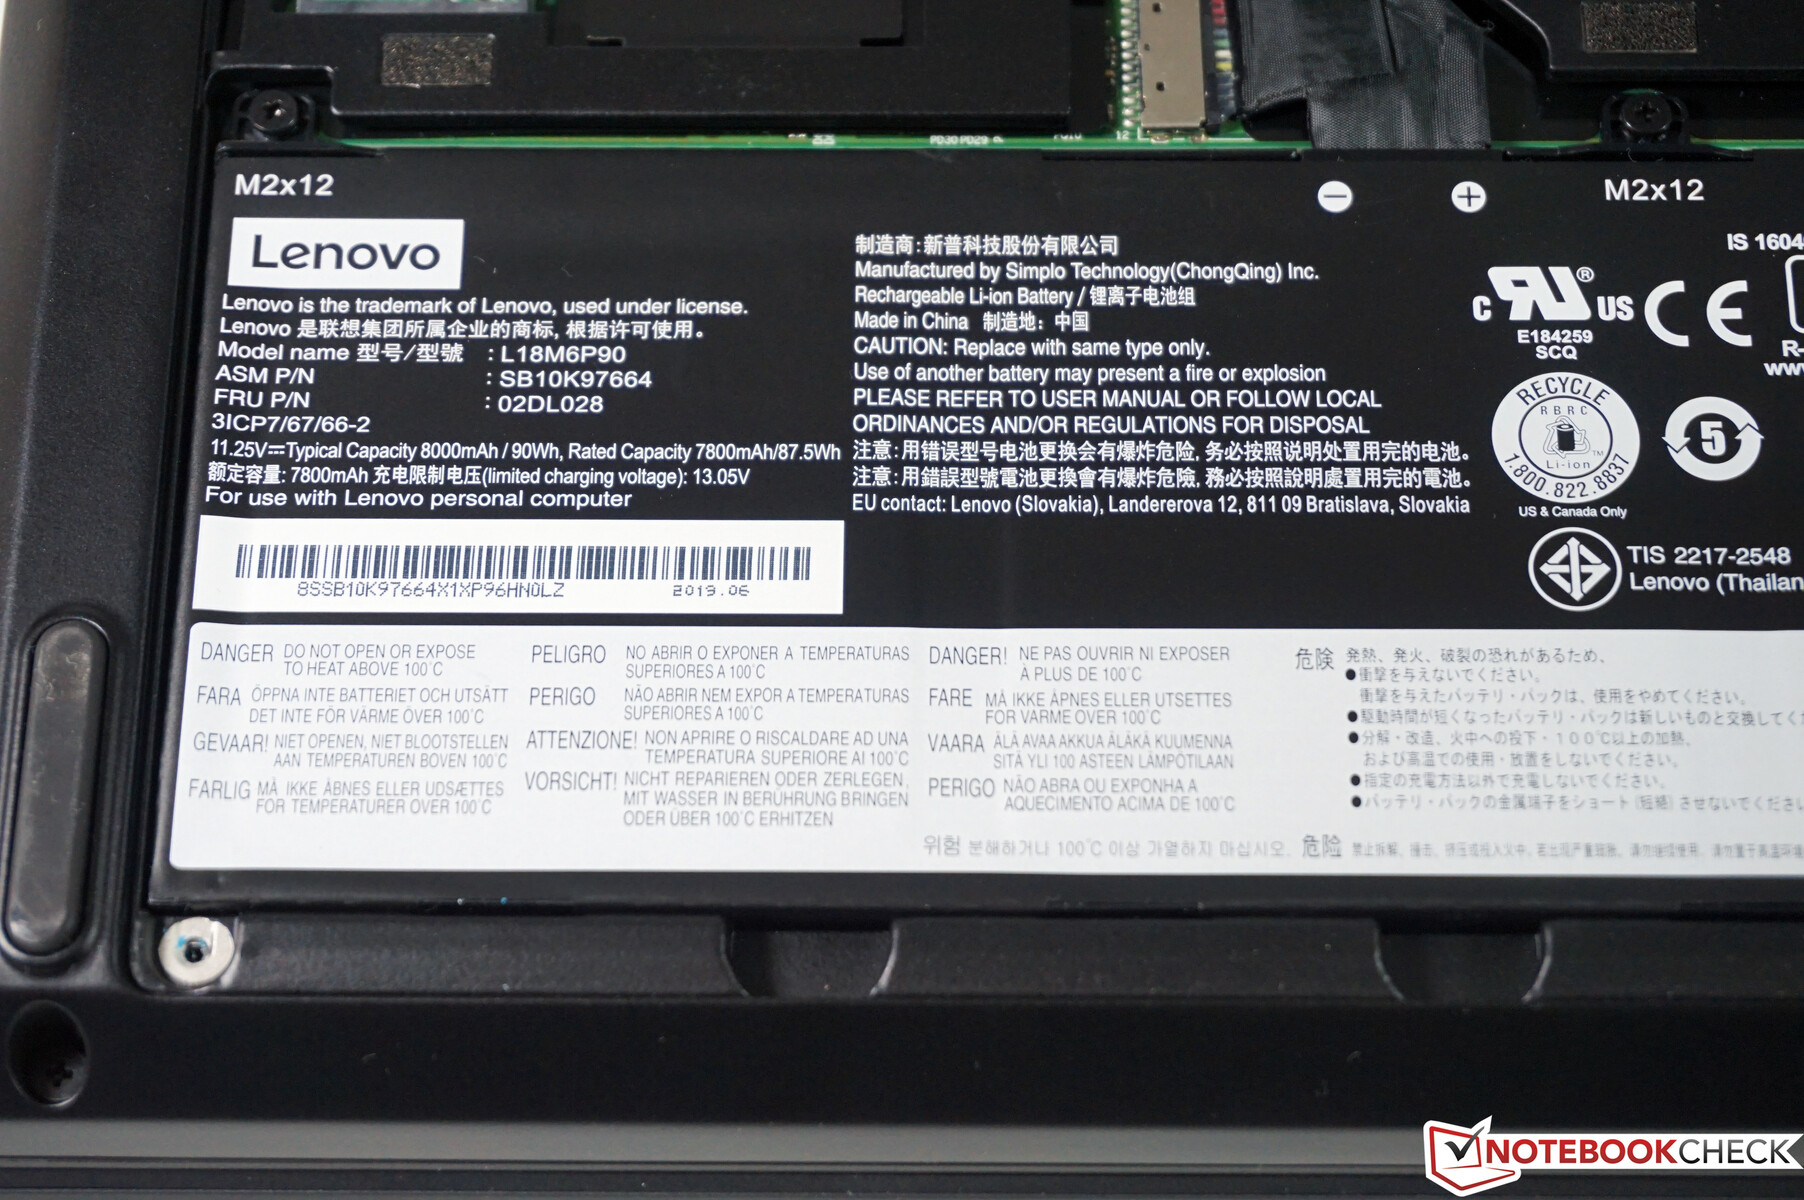
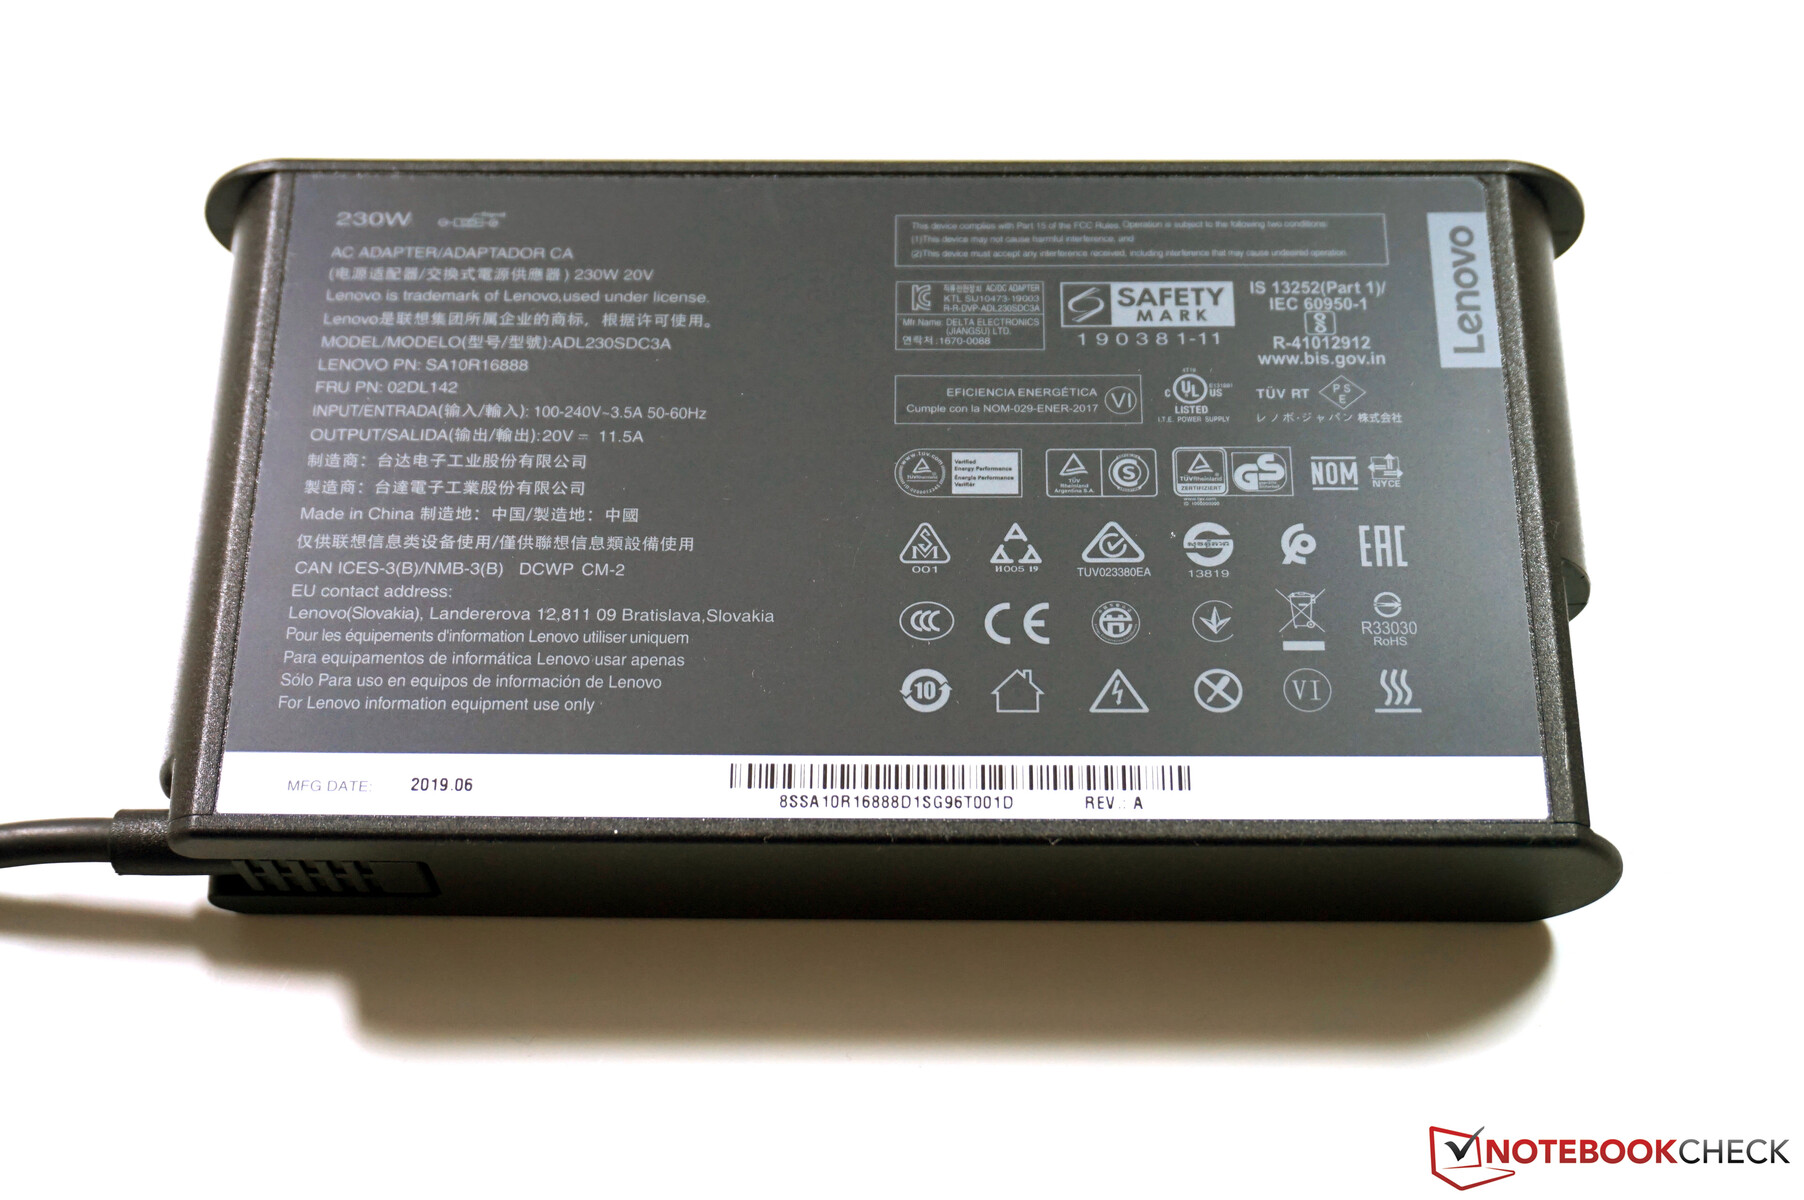
90-Wh büyüklüğündeki batarya, Wi-Fi ve video testimizde sırasıyla 10-11 saatlik çok iyi çalışma sürelerine izin veriyor. Maksimum parlaklıkta dizüstü bilgisayar hala 8 ila 9 saat arasında sürer. Bu sonuçlar genel olarak çok iyi olsa da, 15 inçlik büyük bir iş istasyonunun kullanıcıları için büyük bir faktör olma ihtimalleri çok düşük. Yük altında, batarya modundaki performans sınırlı olsa da, kullanıcılar hala yaklaşık 2 saatlik çalışma süresi bekleyebilirler. Bu sonuçlar 4K'yı ve hatta OLED ekranını seçerken çok daha kötü olabilir. Ürünle birlikte verilen 230 watt AC adaptörle 2 saatin altında bir süre içinde tam olarak şarj edilebilir (% 80 pil ömrü ve% 80 pil ömrü mevcuttur).
| Lenovo ThinkPad P53-20QN000YGE i7-9850H, Quadro RTX 5000 Max-Q, 90 Wh | Lenovo ThinkPad P1 2019-20QT000RGE i7-9850H, Quadro T1000 (Laptop), 80 Wh | Dell Precision 7530 i9-8950HK, Quadro P3200, 97 Wh | Fujitsu Celsius H780 i7-8850H, Quadro P2000, 96 Wh | MSI P65 Creator 9SF-657 i9-9880H, GeForce RTX 2070 Max-Q, 82 Wh | Lenovo ThinkPad P52 20MAS03N00 i7-8750H, Quadro P1000, 96 Wh | Sınıf ortalaması Workstation | |
|---|---|---|---|---|---|---|---|
| Pil Çalışma Süresi | -20% | -40% | -32% | -46% | -5% | -16% | |
| H.264 (h) | 9.8 | 9.3 -5% | 12.2 24% | 10.1 ? 3% | |||
| WiFi v1.3 (h) | 11.1 | 8.9 -20% | 4.6 -59% | 7.5 -32% | 6 -46% | 10.6 -5% | 8.55 ? -23% |
| Load (h) | 2 | 1.3 -35% | 1.6 -20% | 1.1 -45% | 1.3 -35% | 1.441 ? -28% | |
| Reader / Idle (h) | 6.4 | 9.6 | 25.3 | 26.1 ? |
Artılar
Eksiler
Karar
ThinkPad P53 hala daha ince ve daha ince kasa ve çerçevelerin mevcut trendlerine çok fazla dikkat etmeyen geleneksel bir mobil iş istasyonudur. Sonuç olarak, durum oldukça sağlam, birçok bağlantı noktası var, yükseltme işlemi özellikle grafik departmanında kolayca yapılabilir ve donanım çok güçlüdür. Dış kısımda, ThinkPad P52 ile karşılaştırıldığında çok fazla değişiklik olmadı. önceki yıl, ancak kaputun altında bazı değişiklikler oldu. Ana satış noktaları daha güçlü grafik kartlarıdır (Quadro RTX 4000
Lenovo ThinkPad P53-20QN000YGE
- 11/14/2019 v7 (old)
Andreas Osthoff
Price comparison
