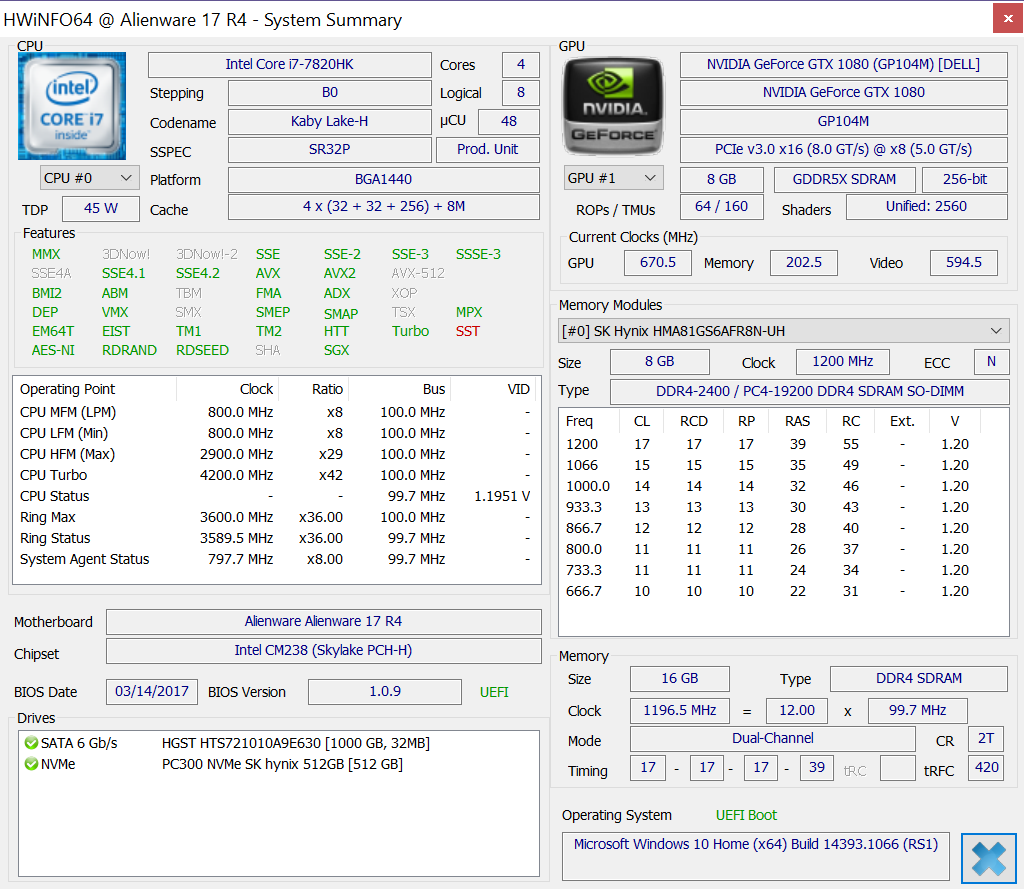
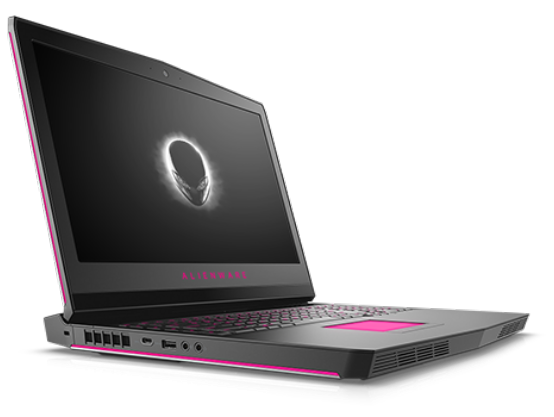
Kısa inceleme: Alienware 17 R4 (7820HK, QHD, GTX 1080) Laptop
| Networking | |
| iperf3 transmit AX12 | |
| Alienware 17 R4 | |
| MSI GT62VR 7RE-223 | |
| Dell XPS 15 9560 (i7-7700HQ, UHD) | |
| iperf3 receive AX12 | |
| MSI GT62VR 7RE-223 | |
| Dell XPS 15 9560 (i7-7700HQ, UHD) | |
| Alienware 17 R4 | |
| |||||||||||||||||||||||||
Aydınlatma: 86 %
Batarya modunda parlaklık: 402.3 cd/m²
Kontrast: 649:1 (Siyah: 0.62 cd/m²)
ΔE ColorChecker Calman: 5.6 | ∀{0.5-29.43 Ø4.71}
ΔE Greyscale Calman: 4.7 | ∀{0.09-98 Ø4.96}
82.2% sRGB (Argyll 1.6.3 3D)
53.7% AdobeRGB 1998 (Argyll 1.6.3 3D)
60.5% AdobeRGB 1998 (Argyll 3D)
82.9% sRGB (Argyll 3D)
61.2% Display P3 (Argyll 3D)
Gamma: 2.14
CCT: 7519 K
| Alienware 17 R4 TN LED, 17.3", 2560x1440 | Alienware 17 R3 (A17-9935) CV69H_173WF4 (LGD0459), IPS, 17.3", 1920x1080 | MSI GT73VR 7RF-296 N173HHE-G32 (CMN1747), TN LED, 17.3", 1920x1080 | Acer Predator 17 X GX-792-76DL LP173WF4-SPF5 (LGD056D), IPS, 17.3", 1920x1080 | Aorus X7 DT v6 AUO1096, TN LED, 17.3", 2560x1440 | |
|---|---|---|---|---|---|
| Display | 4% | 36% | 3% | -1% | |
| Display P3 Coverage (%) | 61.2 | 66.9 9% | 90.6 48% | 66 8% | 59.6 -3% |
| sRGB Coverage (%) | 82.9 | 83.9 1% | 99.9 21% | 83.7 1% | 82.8 0% |
| AdobeRGB 1998 Coverage (%) | 60.5 | 61.4 1% | 84.7 40% | 61.2 1% | 60.1 -1% |
| Response Times | -45% | 29% | -85% | 13% | |
| Response Time Grey 50% / Grey 80% * (ms) | 30 ? | 33 ? -10% | 26 ? 13% | 45 ? -50% | 21.6 ? 28% |
| Response Time Black / White * (ms) | 12.8 ? | 23 ? -80% | 7 ? 45% | 28 ? -119% | 13.2 ? -3% |
| PWM Frequency (Hz) | 59.5 | ||||
| Screen | 7% | -9% | 16% | -6% | |
| Brightness middle (cd/m²) | 402.3 | 360 -11% | 307 -24% | 380 -6% | 339.5 -16% |
| Brightness (cd/m²) | 372 | 336 -10% | 284 -24% | 362 -3% | 309 -17% |
| Brightness Distribution (%) | 86 | 90 5% | 85 -1% | 91 6% | 80 -7% |
| Black Level * (cd/m²) | 0.62 | 0.44 29% | 0.25 60% | 0.37 40% | 0.45 27% |
| Contrast (:1) | 649 | 818 26% | 1228 89% | 1027 58% | 754 16% |
| Colorchecker dE 2000 * | 5.6 | 4.76 15% | 9.65 -72% | 4.12 26% | 6.88 -23% |
| Colorchecker dE 2000 max. * | 9.8 | 10.8 -10% | 16.36 -67% | 8.19 16% | 9.99 -2% |
| Greyscale dE 2000 * | 4.7 | 3.69 21% | 10.07 -114% | 3.95 16% | 6.57 -40% |
| Gamma | 2.14 103% | 2.24 98% | 2.12 104% | 2.47 89% | 2.04 108% |
| CCT | 7519 86% | 6091 107% | 12145 54% | 6539 99% | 8608 76% |
| Color Space (Percent of AdobeRGB 1998) (%) | 53.7 | 55 2% | 75 40% | 55 2% | 54 1% |
| Color Space (Percent of sRGB) (%) | 82.2 | 84 2% | 100 22% | 84 2% | 82 0% |
| Toplam Ortalama (Program / Ayarlar) | -11% /
-1% | 19% /
5% | -22% /
-0% | 2% /
-3% |
* ... daha küçük daha iyidir
Yanıt Sürelerini Görüntüle
| ↔ Tepki Süresi Siyahtan Beyaza | ||
|---|---|---|
| 12.8 ms ... yükseliş ↗ ve sonbahar↘ birleşimi | ↗ 10.8 ms yükseliş | 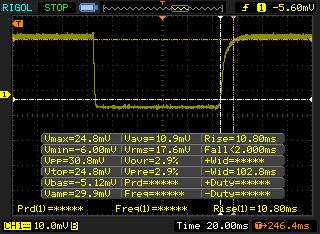 |
| ↘ 2 ms sonbahar | ||
| Ekran, testlerimizde iyi yanıt oranları gösteriyor ancak rekabetçi oyuncular için çok yavaş olabilir. Karşılaştırıldığında, test edilen tüm cihazlar 0.1 (minimum) ile 240 (maksimum) ms arasında değişir. » Tüm cihazların 33 %'si daha iyi. Bu, ölçülen yanıt süresinin test edilen tüm cihazların ortalamasından (19.8 ms) daha iyi olduğu anlamına gelir. | ||
| ↔ Tepki Süresi %50 Griden %80 Griye | ||
| 30 ms ... yükseliş ↗ ve sonbahar↘ birleşimi | ↗ 18.8 ms yükseliş | 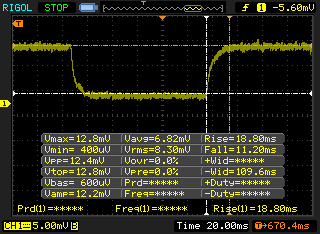 |
| ↘ 11.2 ms sonbahar | ||
| Ekran, testlerimizde yavaş yanıt oranları gösteriyor ve oyuncular için yetersiz olacaktır. Karşılaştırıldığında, test edilen tüm cihazlar 0.165 (minimum) ile 636 (maksimum) ms arasında değişir. » Tüm cihazların 40 %'si daha iyi. Bu, ölçülen yanıt süresinin test edilen tüm cihazların ortalamasına benzer olduğu anlamına gelir (31 ms). | ||
Ekran Titremesi / PWM (Darbe Genişliği Modülasyonu)
| Ekran titriyor / PWM algılanmadı |  | ||
Karşılaştırıldığında: Test edilen tüm cihazların %52 %'si ekranı karartmak için PWM kullanmıyor. PWM tespit edilirse, ortalama 7757 (minimum: 5 - maksimum: 343500) Hz ölçüldü. | |||
| Cinebench R11.5 | |
| CPU Single 64Bit | |
| Eurocom Tornado F5 | |
| Asus G701VIK-BA049T | |
| Samsung Odyssey NP800G5M-X01US | |
| Eurocom Sky X7E2 | |
| Alienware 17 R4 | |
| EVGA SC17 GTX 1070 | |
| MSI GT80 Titan SLI | |
| MSI GE72VR-6RF16H21 | |
| CPU Multi 64Bit | |
| Asus G701VIK-BA049T | |
| Eurocom Tornado F5 | |
| Alienware 17 R4 | |
| Eurocom Sky X7E2 | |
| Samsung Odyssey NP800G5M-X01US | |
| MSI GT80 Titan SLI | |
| EVGA SC17 GTX 1070 | |
| MSI GE72VR-6RF16H21 | |
| Cinebench R10 | |
| Rendering Multiple CPUs 32Bit | |
| Eurocom Tornado F5 | |
| Alienware 17 R4 | |
| Eurocom Sky X7E2 | |
| Samsung Odyssey NP800G5M-X01US | |
| MSI GT80 Titan SLI | |
| EVGA SC17 GTX 1070 | |
| Apple MacBook Pro 15 2016 (2.7 GHz, 455) | |
| MSI GE72VR-6RF16H21 | |
| Rendering Single 32Bit | |
| Eurocom Tornado F5 | |
| Alienware 17 R4 | |
| Eurocom Sky X7E2 | |
| Samsung Odyssey NP800G5M-X01US | |
| EVGA SC17 GTX 1070 | |
| Apple MacBook Pro 15 2016 (2.7 GHz, 455) | |
| MSI GT80 Titan SLI | |
| MSI GE72VR-6RF16H21 | |
| wPrime 2.10 - 1024m | |
| Apple MacBook Pro 15 2016 (2.7 GHz, 455) | |
| EVGA SC17 GTX 1070 | |
| Samsung Odyssey NP800G5M-X01US | |
| Eurocom Sky X7E2 | |
| Alienware 17 R4 | |
| Eurocom Tornado F5 | |
* ... daha küçük daha iyidir
| PCMark 8 | |
| Home Score Accelerated v2 | |
| Aorus X7 DT v6 | |
| Alienware 17 R4 | |
| Eurocom Tornado F5 Killer Edition | |
| Work Score Accelerated v2 | |
| Aorus X7 DT v6 | |
| Alienware 17 R4 | |
| Eurocom Tornado F5 Killer Edition | |
| Creative Score Accelerated v2 | |
| Aorus X7 DT v6 | |
| Eurocom Tornado F5 Killer Edition | |
| Alienware 17 R4 | |
| PCMark 8 Home Score Accelerated v2 | 5064 puan | |
| PCMark 8 Creative Score Accelerated v2 | 8272 puan | |
| PCMark 8 Work Score Accelerated v2 | 5088 puan | |
Yardım | ||
| Alienware 17 R4 SK Hynix PC300 NVMe 512 GB | Alienware 17 R3 (A17-9935) Samsung PM951 NVMe 512 GB | MSI GT73VR 7RF-296 2x Samsung SM951 MZVPV256HDGL (RAID 0) | Acer Predator 17 X GX-792-76DL Toshiba NVMe THNSN5512GPU7 | Aorus X7 DT v6 Samsung SM951 MZVPV512HDGL m.2 PCI-e | |
|---|---|---|---|---|---|
| CrystalDiskMark 3.0 | -20% | 100% | 30% | 43% | |
| Read Seq (MB/s) | 1277 | 1263 -1% | 3219 152% | 1494 17% | 1829 43% |
| Write Seq (MB/s) | 786 | 587 -25% | 2572 227% | 1371 74% | 1588 102% |
| Read 512 (MB/s) | 894 | 569 -36% | 1776 99% | 898 0% | 1064 19% |
| Write 512 (MB/s) | 659 | 265.2 -60% | 2445 271% | 1273 93% | 1507 129% |
| Read 4k (MB/s) | 38.11 | 42.59 12% | 51.1 34% | 43.82 15% | 52.9 39% |
| Write 4k (MB/s) | 128.5 | 140.6 9% | 141.3 10% | 161.6 26% | 161.1 25% |
| Read 4k QD32 (MB/s) | 628 | 610 -3% | 658 5% | 669 7% | 676 8% |
| Write 4k QD32 (MB/s) | 531 | 232.8 -56% | 554 4% | 552 4% | 419.1 -21% |

| 3DMark | |
| 1920x1080 Fire Strike Graphics | |
| Nvidia GeForce GTX 1080 Ti Founders Edition | |
| MSI Gaming X GeForce GTX 1080 Desktop PC | |
| Alienware 17 R4 | |
| Eurocom Tornado F5 Killer Edition | |
| Asus Strix GL702VSK | |
| Asus Strix GTX 980 Ti Desktop PC | |
| Asus G701VO-CS74K | |
| MSI GS63VR 7RF-228US | |
| Fire Strike Extreme Graphics | |
| Alienware 17 R4 | |
| Eurocom Tornado F5 Killer Edition | |
| Asus Strix GL702VSK | |
| Asus Strix GTX 980 Ti Desktop PC | |
| Asus G701VO-CS74K | |
| MSI GS63VR 7RF-228US | |
| 3840x2160 Fire Strike Ultra Graphics | |
| Nvidia GeForce GTX 1080 Ti Founders Edition | |
| Alienware 17 R4 | |
| Eurocom Tornado F5 Killer Edition | |
| Asus Strix GTX 980 Ti Desktop PC | |
| Asus G701VO-CS74K | |
| MSI GS63VR 7RF-228US | |
| 3DMark 11 | |
| 1280x720 Performance GPU | |
| Nvidia GeForce GTX 1080 Ti Founders Edition | |
| MSI Gaming X GeForce GTX 1080 Desktop PC | |
| Eurocom Tornado F5 Killer Edition | |
| Alienware 17 R4 | |
| Asus Strix GTX 980 Ti Desktop PC | |
| Asus Strix GL702VSK | |
| Asus G701VO-CS74K | |
| MSI GS63VR 7RF-228US | |
| 1280x720 Performance Combined | |
| Nvidia GeForce GTX 1080 Ti Founders Edition | |
| Asus Strix GTX 980 Ti Desktop PC | |
| MSI Gaming X GeForce GTX 1080 Desktop PC | |
| Alienware 17 R4 | |
| Asus G701VO-CS74K | |
| MSI GS63VR 7RF-228US | |
| Eurocom Tornado F5 Killer Edition | |
| Asus Strix GL702VSK | |
| Rise of the Tomb Raider - 1920x1080 Very High Preset AA:FX AF:16x | |
| Nvidia GeForce GTX 1080 Ti Founders Edition | |
| Alienware 17 R4 | |
| Eurocom Tornado F5 Killer Edition | |
| Nvidia GeForce GTX 1080 Founders Edition | |
| Nvidia GeForce GTX 1080 Founders Edition | |
| Nvidia GeForce GTX 1080 Founders Edition | |
| Asus Strix GL702VSK | |
| Asus Strix GTX 980 Ti Desktop PC | |
| MSI GS63VR 7RF-228US | |
| Asus G701VO-CS74K | |
| BioShock Infinite - 1920x1080 Ultra Preset, DX11 (DDOF) | |
| Nvidia GeForce GTX 1080 Ti Founders Edition | |
| Nvidia GeForce GTX 1080 Founders Edition | |
| Alienware 17 R4 | |
| Asus Strix GTX 980 Ti Desktop PC | |
| Eurocom Tornado F5 Killer Edition | |
| Asus Strix GL702VSK | |
| Asus G701VO-CS74K | |
| MSI GS63VR 7RF-228US | |
| Metro: Last Light - 1920x1080 Very High (DX11) AF:16x | |
| Nvidia GeForce GTX 1080 Ti Founders Edition | |
| Nvidia GeForce GTX 1080 Founders Edition | |
| Alienware 17 R4 | |
| Asus Strix GTX 980 Ti Desktop PC | |
| Eurocom Tornado F5 Killer Edition | |
| Asus Strix GL702VSK | |
| Asus G701VO-CS74K | |
| MSI GS63VR 7RF-228US | |
| Thief - 1920x1080 Very High Preset AA:FXAA & High SS AF:8x | |
| Eurocom Tornado F5 Killer Edition | |
| Alienware 17 R4 | |
| Asus Strix GL702VSK | |
| MSI GS63VR 7RF-228US | |
| Asus G701VO-CS74K | |
| The Witcher 3 - 1920x1080 Ultra Graphics & Postprocessing (HBAO+) | |
| Nvidia GeForce GTX 1080 Ti Founders Edition | |
| Alienware 17 R4 | |
| Nvidia GeForce GTX 1080 Founders Edition | |
| Eurocom Tornado F5 Killer Edition | |
| Asus Strix GTX 980 Ti Desktop PC | |
| Asus Strix GL702VSK | |
| MSI GS63VR 7RF-228US | |
| Batman: Arkham Knight - 1920x1080 High / On AA:SM AF:16x | |
| Alienware 17 R4 | |
| Eurocom Tornado F5 Killer Edition | |
| Asus G701VO-CS74K | |
| MSI GS63VR 7RF-228US | |
| Fallout 4 - 1920x1080 Ultra Preset AA:T AF:16x | |
| Nvidia GeForce GTX 1080 Ti Founders Edition | |
| Nvidia GeForce GTX 1080 Founders Edition | |
| Alienware 17 R4 | |
| Asus Strix GTX 980 Ti Desktop PC | |
| Asus Strix GL702VSK | |
| Asus G701VO-CS74K | |
| MSI GS63VR 7RF-228US | |
| Ashes of the Singularity - 1920x1080 high | |
| Nvidia GeForce GTX 1080 Ti Founders Edition | |
| Asus Strix GTX 980 Ti Desktop PC | |
| Alienware 17 R4 | |
| Eurocom Tornado F5 Killer Edition | |
| Asus Strix GL702VSK | |
| Doom - 1920x1080 Ultra Preset AA:SM | |
| Nvidia GeForce GTX 1080 Ti Founders Edition | |
| Nvidia GeForce GTX 1080 Ti Founders Edition | |
| Alienware 17 R4 | |
| Nvidia GeForce GTX 1080 Founders Edition | |
| Asus Strix GTX 980 Ti Desktop PC | |
| Asus Strix GL702VSK | |
| MSI GS63VR 7RF-228US | |
| Asus G701VO-CS74K | |
| Overwatch - 1920x1080 Epic (Render Scale 100 %) AA:SM AF:16x | |
| Nvidia GeForce GTX 1080 Ti Founders Edition | |
| Nvidia GeForce GTX 1080 Founders Edition | |
| Alienware 17 R4 | |
| Asus Strix GTX 980 Ti Desktop PC | |
| Asus G701VO-CS74K | |
| MSI GS63VR 7RF-228US | |
| Mafia 3 - 1920x1080 High Preset | |
| Eurocom Tornado F5 Killer Edition | |
| Nvidia GeForce GTX 1080 Ti Founders Edition | |
| Alienware 17 R4 | |
| Nvidia GeForce GTX 1080 Founders Edition | |
| Asus Strix GL702VSK | |
| Asus Strix GTX 980 Ti Desktop PC | |
| MSI GS63VR 7RF-228US | |
| 3DMark 11 Performance | 19125 puan | |
| 3DMark Ice Storm Standard Score | 171837 puan | |
| 3DMark Cloud Gate Standard Score | 32871 puan | |
| 3DMark Fire Strike Score | 16931 puan | |
| 3DMark Fire Strike Extreme Score | 9422 puan | |
Yardım | ||
| düşük | orta | yüksek | ultra | |
|---|---|---|---|---|
| BioShock Infinite (2013) | 162.9 | |||
| Metro: Last Light (2013) | 132.2 | |||
| Thief (2014) | 107.2 | |||
| The Witcher 3 (2015) | 78.1 | |||
| Batman: Arkham Knight (2015) | 93 | |||
| Metal Gear Solid V (2015) | 60 | |||
| Dota 2 Reborn (2015) | 119.9 | |||
| Fallout 4 (2015) | 120.7 | |||
| Rise of the Tomb Raider (2016) | 118.3 | |||
| Ashes of the Singularity (2016) | 66.5 | |||
| Doom (2016) | 140.1 | |||
| Overwatch (2016) | 188 | |||
| Mafia 3 (2016) | 72.5 |
Ses yüksekliği
| Boşta |
| 35.6 / 35.6 / 35.7 dB |
| HDD |
| 35.7 dB |
| Çalışırken |
| 50.2 / 50.2 dB |
 | ||
30 dB sessiz 40 dB(A) duyulabilirlik 50 dB(A) gürültülü |
||
min: | ||
| Alienware 17 R4 GeForce GTX 1080 Mobile, i7-7820HK, SK Hynix PC300 NVMe 512 GB | Alienware 17 R3 (A17-9935) GeForce GTX 980M, 6700HQ, Samsung PM951 NVMe 512 GB | MSI GT72VR 7RE-433 GeForce GTX 1070 Mobile, i7-7700HQ, Kingston RBU-SNS8152S3256GG5 | MSI GT73VR 7RF-296 GeForce GTX 1080 Mobile, i7-7820HK, 2x Samsung SM951 MZVPV256HDGL (RAID 0) | Acer Predator 17 X GX-792-76DL GeForce GTX 1080 Mobile, i7-7820HK, Toshiba NVMe THNSN5512GPU7 | Aorus X7 DT v6 GeForce GTX 1080 Mobile, 6820HK, Samsung SM951 MZVPV512HDGL m.2 PCI-e | |
|---|---|---|---|---|---|---|
| Noise | 8% | 5% | 1% | 3% | -1% | |
| kapalı / ortam * (dB) | 28.2 | 30 -6% | 31 -10% | 30 -6% | 30 -6% | 28.6 -1% |
| Idle Minimum * (dB) | 35.6 | 31 13% | 34 4% | 34 4% | 33 7% | 32.2 10% |
| Idle Average * (dB) | 35.6 | 32 10% | 35 2% | 35 2% | 35 2% | 35.2 1% |
| Idle Maximum * (dB) | 35.7 | 33 8% | 37 -4% | 37 -4% | 37 -4% | 35.2 1% |
| Load Average * (dB) | 50.2 | 38 24% | 37 26% | 39 22% | 40 20% | 51.7 -3% |
| Witcher 3 ultra * (dB) | 50.2 | |||||
| Load Maximum * (dB) | 50.2 | 50 -0% | 44 12% | 56 -12% | 50 -0% | 55.7 -11% |
* ... daha küçük daha iyidir
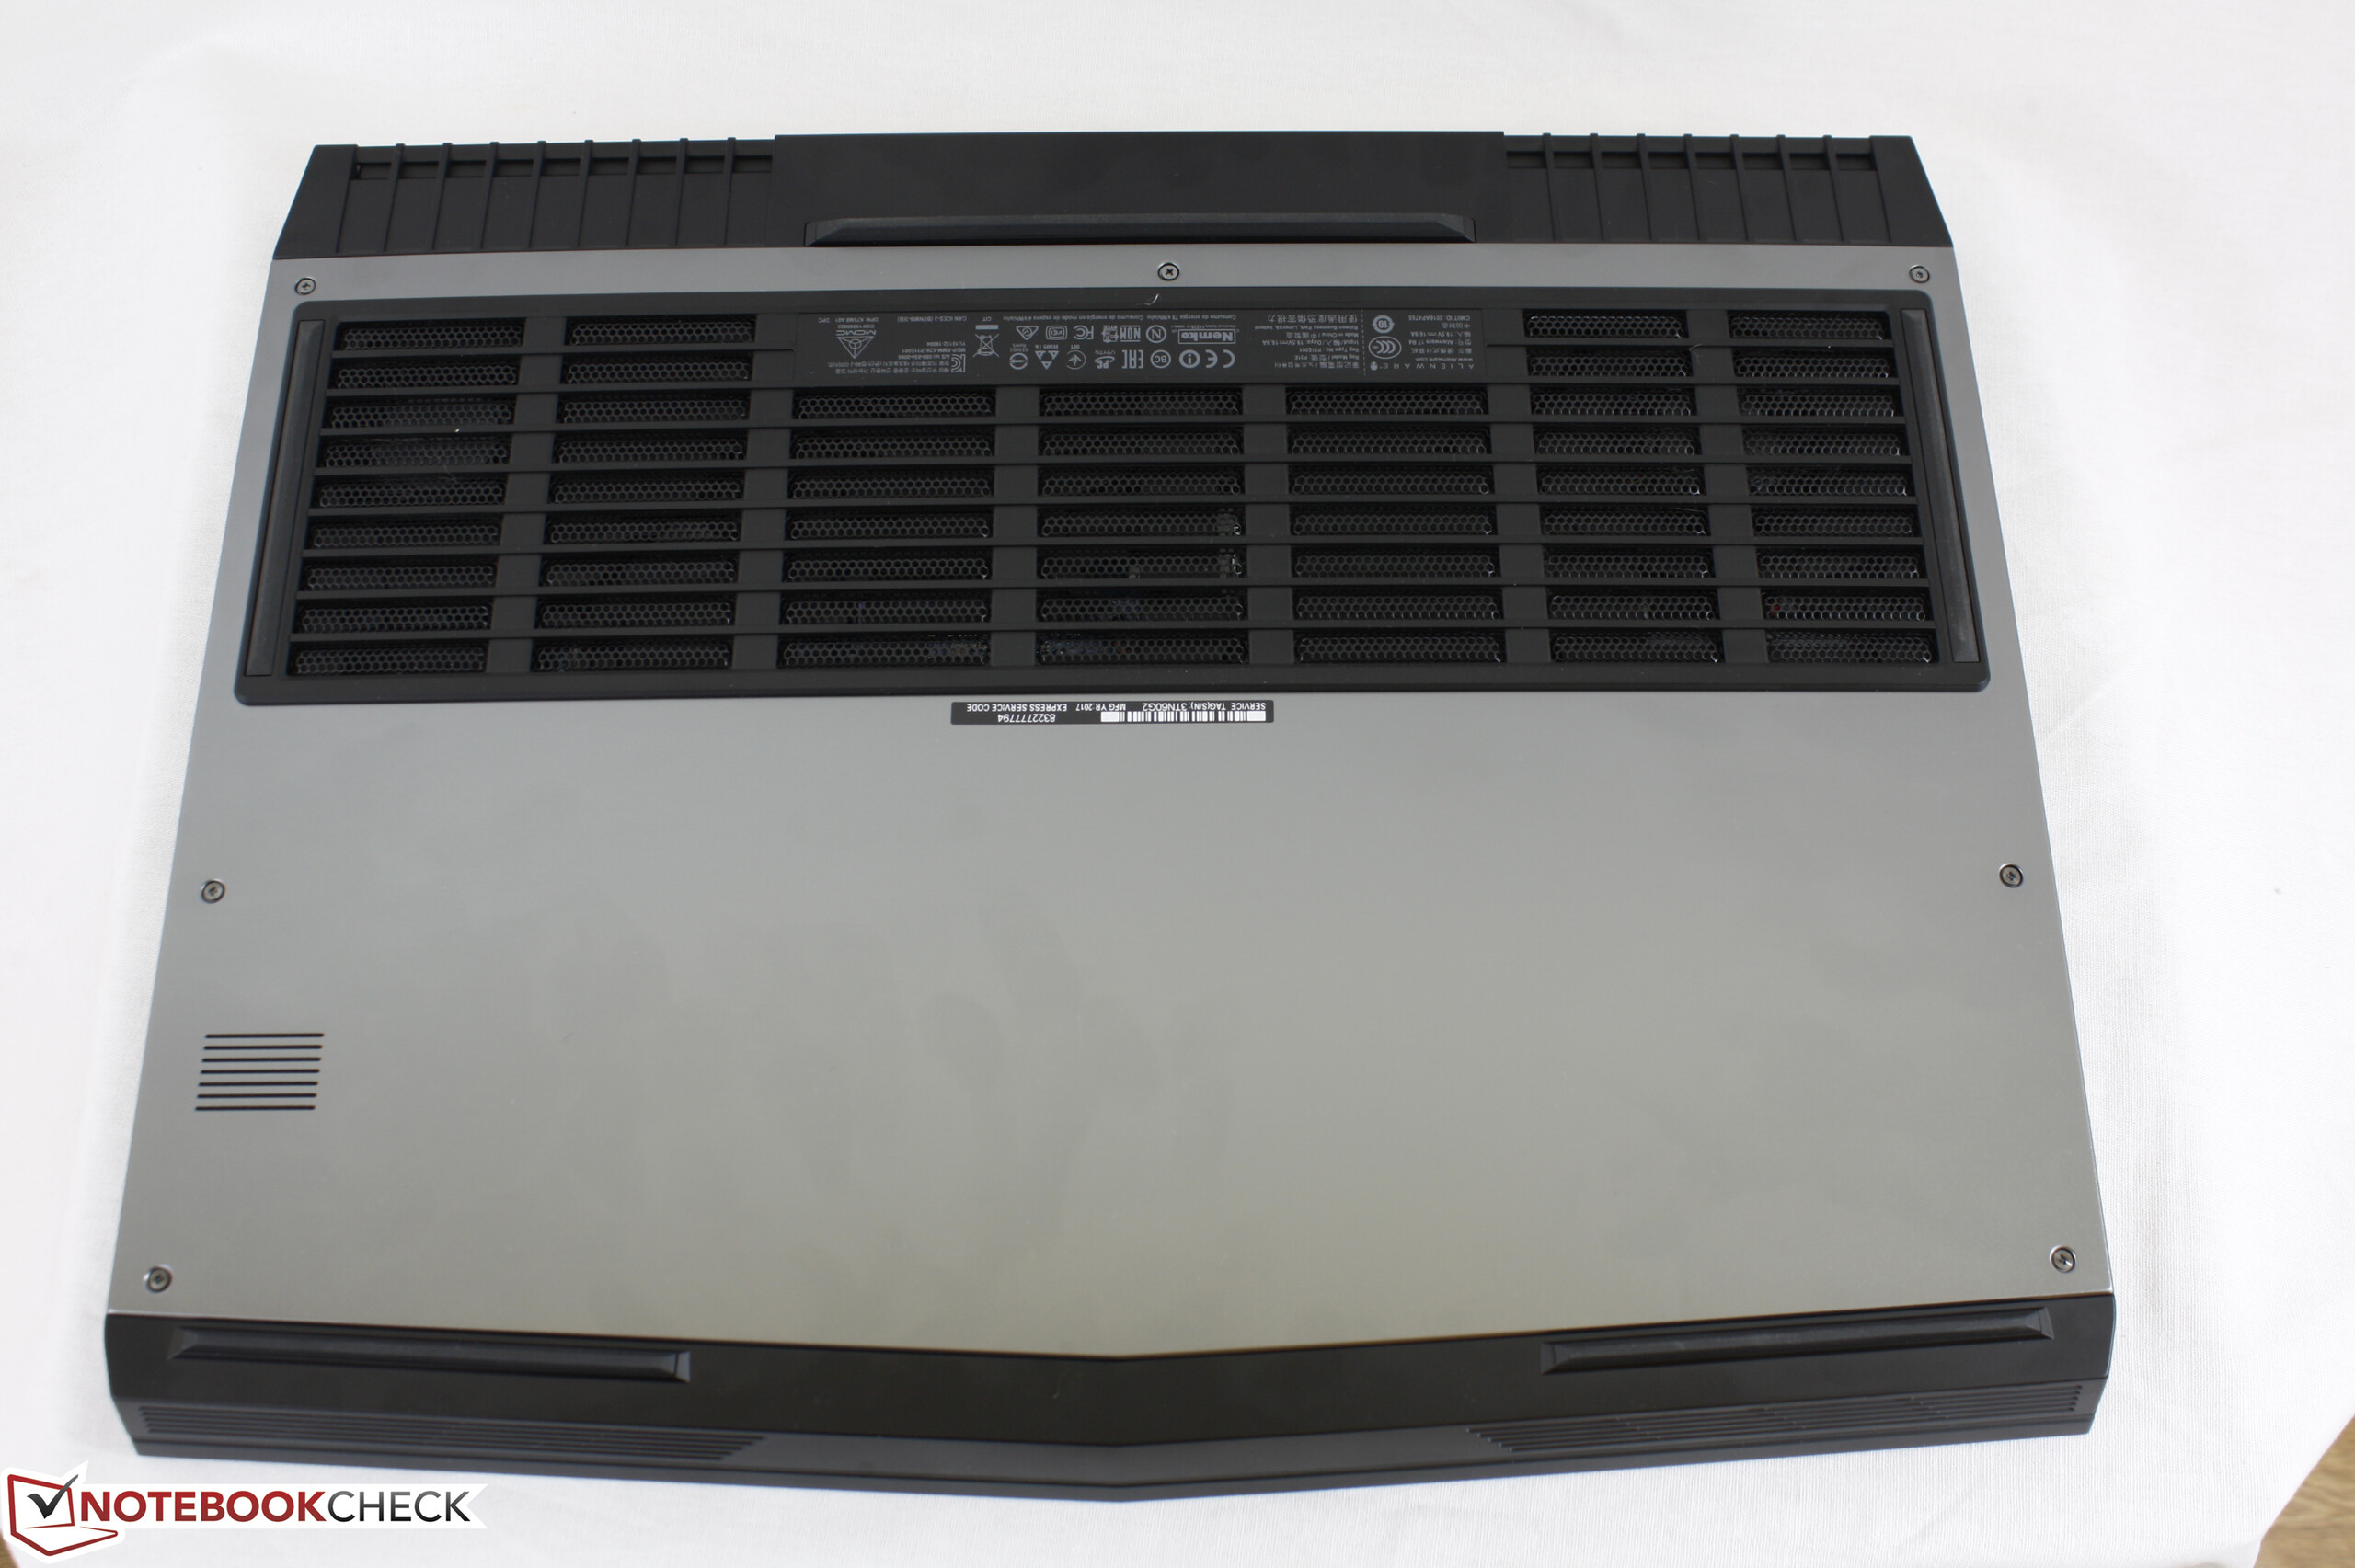
(-) Üst taraftaki maksimum sıcaklık, 40.4 °C / 105 F ortalamasına kıyasla 49.6 °C / 121 F'dir. , Gaming sınıfı için 21.2 ile 68.8 °C arasında değişir.
(-) Alt kısım, 43.2 °C / 110 F ortalamasına kıyasla maksimum 56 °C / 133 F'ye kadar ısınır
(+) Boşta kullanımda, üst tarafın ortalama sıcaklığı 27.5 °C / 82 F olup, cihazın 33.9 °C / 93 F.
(±) The Witcher 3 oynarken, üst tarafın ortalama sıcaklığı 37.2 °C / 99 F olup, cihazın 33.9 °C / 93 F.
(+) Avuç içi dayanakları ve dokunmatik yüzey, maksimum 27.4 °C / 81.3 F ile cilt sıcaklığından daha soğuktur ve bu nedenle dokunulduğunda soğuktur.
(±) Benzer cihazların avuç içi dayanağı alanının ortalama sıcaklığı 28.8 °C / 83.8 F (+1.4 °C / 2.5 F) idi.
Alienware 17 R4 ses analizi
(±) | hoparlör ses yüksekliği ortalama ama iyi (75 dB)
Bas 100 - 315Hz
(-) | neredeyse hiç bas yok - ortalama olarak medyandan 15.3% daha düşük
(±) | Bas doğrusallığı ortalamadır (9.6% delta - önceki frekans)
Ortalar 400 - 2000 Hz
(±) | daha yüksek ortalar - ortalama olarak medyandan 5.5% daha yüksek
(±) | Ortaların doğrusallığı ortalamadır (8.9% delta - önceki frekans)
Yüksekler 2 - 16 kHz
(±) | daha yüksek en yüksekler - ortalama olarak medyandan 5.1% daha yüksek
(±) | Yükseklerin doğrusallığı ortalamadır (9.7% delta - önceki frekans)
Toplam 100 - 16.000 Hz
(±) | Genel sesin doğrusallığı ortalamadır (22.4% ortancaya göre fark)
Aynı sınıfla karşılaştırıldığında
» Bu sınıftaki tüm test edilen cihazların %80%'si daha iyi, 6% benzer, 14% daha kötüydü
» En iyisinin deltası 6% idi, ortalama 18% idi, en kötüsü 132% idi
Test edilen tüm cihazlarla karşılaştırıldığında
» Test edilen tüm cihazların %66'si daha iyi, 6 benzer, % 29 daha kötüydü
» En iyisinin deltası 4% idi, ortalama 23% idi, en kötüsü 134% idi
Apple MacBook 12 (Early 2016) 1.1 GHz ses analizi
(+) | hoparlörler nispeten yüksek sesle çalabilir (83.6 dB)
Bas 100 - 315Hz
(±) | azaltılmış bas - ortalama olarak medyandan 11.3% daha düşük
(±) | Bas doğrusallığı ortalamadır (14.2% delta - önceki frekans)
Ortalar 400 - 2000 Hz
(+) | dengeli ortalar - medyandan yalnızca 2.4% uzakta
(+) | orta frekanslar doğrusaldır (5.5% deltadan önceki frekansa)
Yüksekler 2 - 16 kHz
(+) | dengeli yüksekler - medyandan yalnızca 2% uzakta
(+) | yüksekler doğrusaldır (4.5% deltadan önceki frekansa)
Toplam 100 - 16.000 Hz
(+) | genel ses doğrusaldır (10.2% ortancaya göre fark)
Aynı sınıfla karşılaştırıldığında
» Bu sınıftaki tüm test edilen cihazların %7%'si daha iyi, 2% benzer, 90% daha kötüydü
» En iyisinin deltası 5% idi, ortalama 18% idi, en kötüsü 53% idi
Test edilen tüm cihazlarla karşılaştırıldığında
» Test edilen tüm cihazların %5'si daha iyi, 1 benzer, % 94 daha kötüydü
» En iyisinin deltası 4% idi, ortalama 23% idi, en kötüsü 134% idi
| Kapalı / Bekleme modu | |
| Boşta | |
| Çalışırken |
|
Key:
min: | |
| Alienware 17 R4 i7-7820HK, GeForce GTX 1080 Mobile, SK Hynix PC300 NVMe 512 GB, TN LED, 2560x1440, 17.3" | Alienware 17 R3 (A17-9935) 6700HQ, GeForce GTX 980M, Samsung PM951 NVMe 512 GB, IPS, 1920x1080, 17.3" | MSI GT73VR 7RF-296 i7-7820HK, GeForce GTX 1080 Mobile, 2x Samsung SM951 MZVPV256HDGL (RAID 0), TN LED, 1920x1080, 17.3" | Acer Predator 17 X GX-792-76DL i7-7820HK, GeForce GTX 1080 Mobile, Toshiba NVMe THNSN5512GPU7, IPS, 1920x1080, 17.3" | Aorus X7 DT v6 6820HK, GeForce GTX 1080 Mobile, Samsung SM951 MZVPV512HDGL m.2 PCI-e, TN LED, 2560x1440, 17.3" | |
|---|---|---|---|---|---|
| Power Consumption | 41% | 7% | 12% | -5% | |
| Idle Minimum * (Watt) | 37.5 | 12 68% | 29 23% | 27 28% | 31.5 16% |
| Idle Average * (Watt) | 37.6 | 18 52% | 35 7% | 32 15% | 33.9 10% |
| Idle Maximum * (Watt) | 37.6 | 26 31% | 40 -6% | 41 -9% | 34.6 8% |
| Load Average * (Watt) | 122.4 | 95 22% | 94 23% | 102 17% | 205.6 -68% |
| Witcher 3 ultra * (Watt) | 180.3 | ||||
| Load Maximum * (Watt) | 277.4 | 188 32% | 315 -14% | 248 11% | 250.8 10% |
* ... daha küçük daha iyidir
| Alienware 17 R4 i7-7820HK, GeForce GTX 1080 Mobile, 99 Wh | Alienware 17 R3 (A17-9935) 6700HQ, GeForce GTX 980M, 92 Wh | MSI GT73VR 7RF-296 i7-7820HK, GeForce GTX 1080 Mobile, 75.2 Wh | Acer Predator 17 X GX-792-76DL i7-7820HK, GeForce GTX 1080 Mobile, 88.8 Wh | Aorus X7 DT v6 6820HK, GeForce GTX 1080 Mobile, 94 Wh | |
|---|---|---|---|---|---|
| Pil Çalışma Süresi | 124% | -10% | 26% | -7% | |
| Reader / Idle (h) | 4.6 | 12.6 174% | 5.2 13% | 3 -35% | |
| WiFi v1.3 (h) | 3 | 7.4 147% | 2.7 -10% | 4.2 40% | 2.4 -20% |
| Load (h) | 1.2 | 1.8 50% | 1.5 25% | 1.6 33% |
Artılar
Eksiler
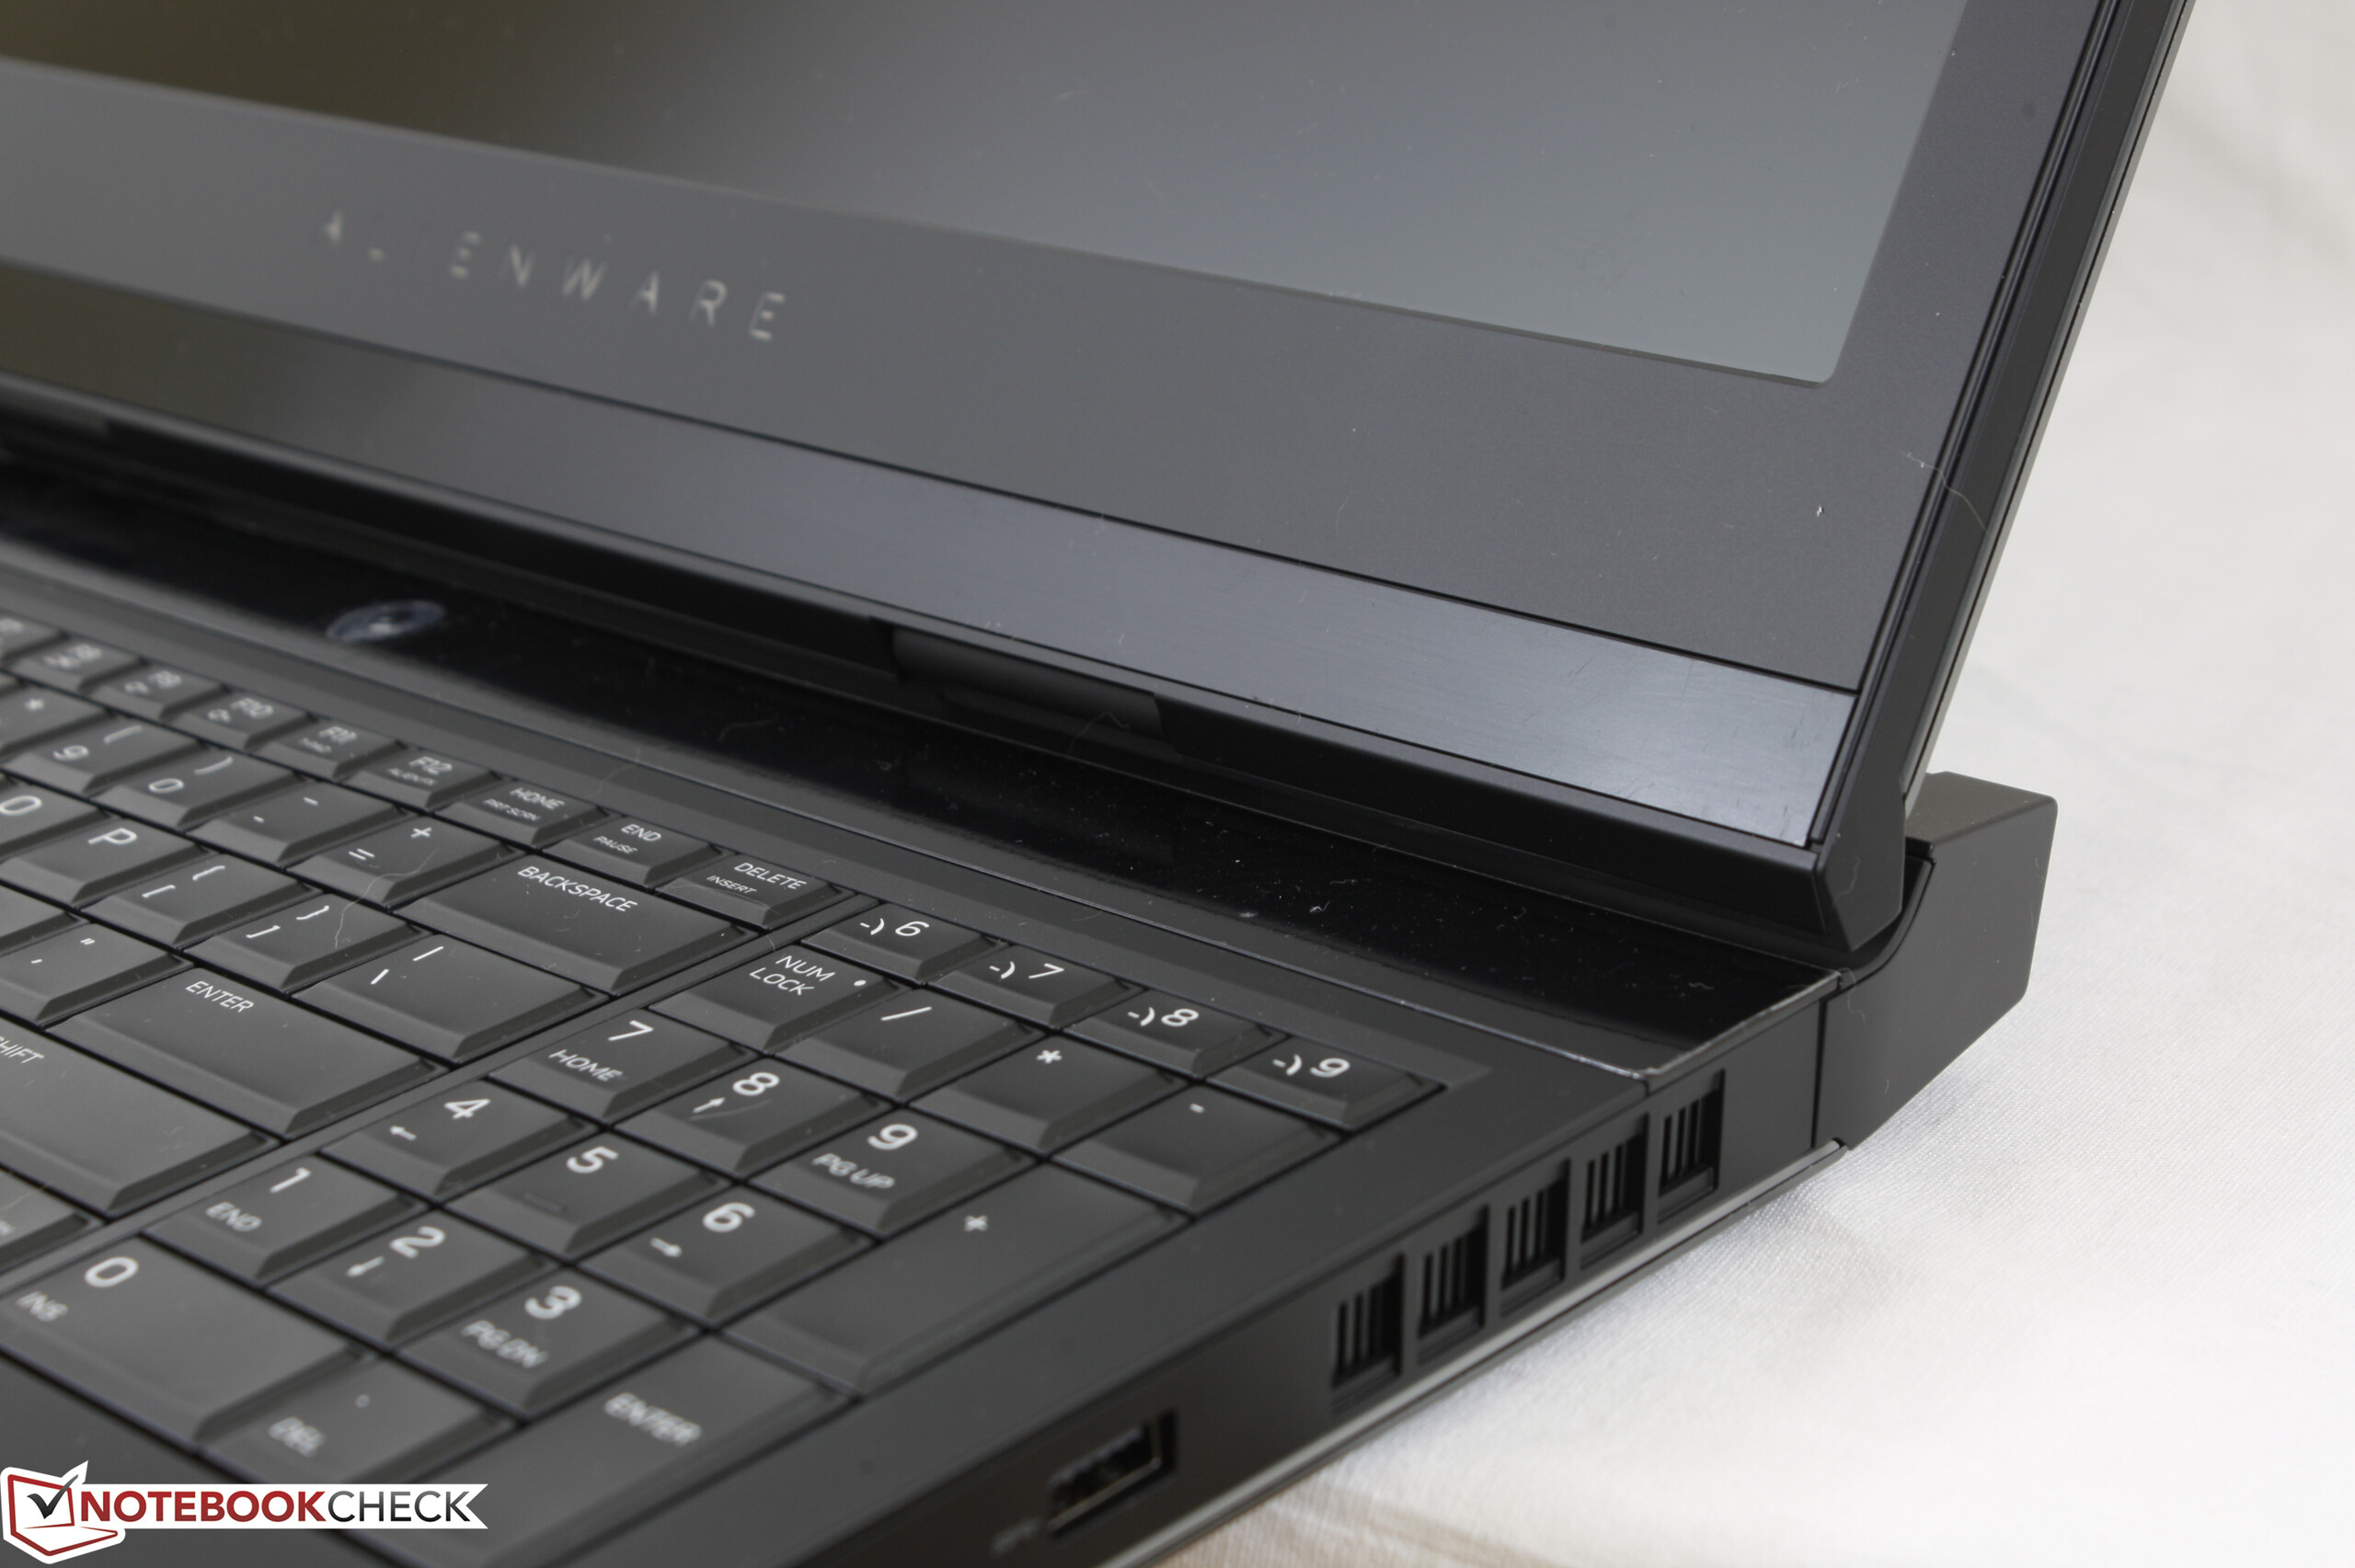
We revere the Alienware 17 series for its high standards in quality that thankfully remain unfazed in this latest iteration. A notebook is about much more than just the CPU and GPU configuration, but also the skeleton and design that fortify the core hardware. At this level, it becomes easier to recommend the latest Alienware over a 17-inch Aorus or older MSI GT72.
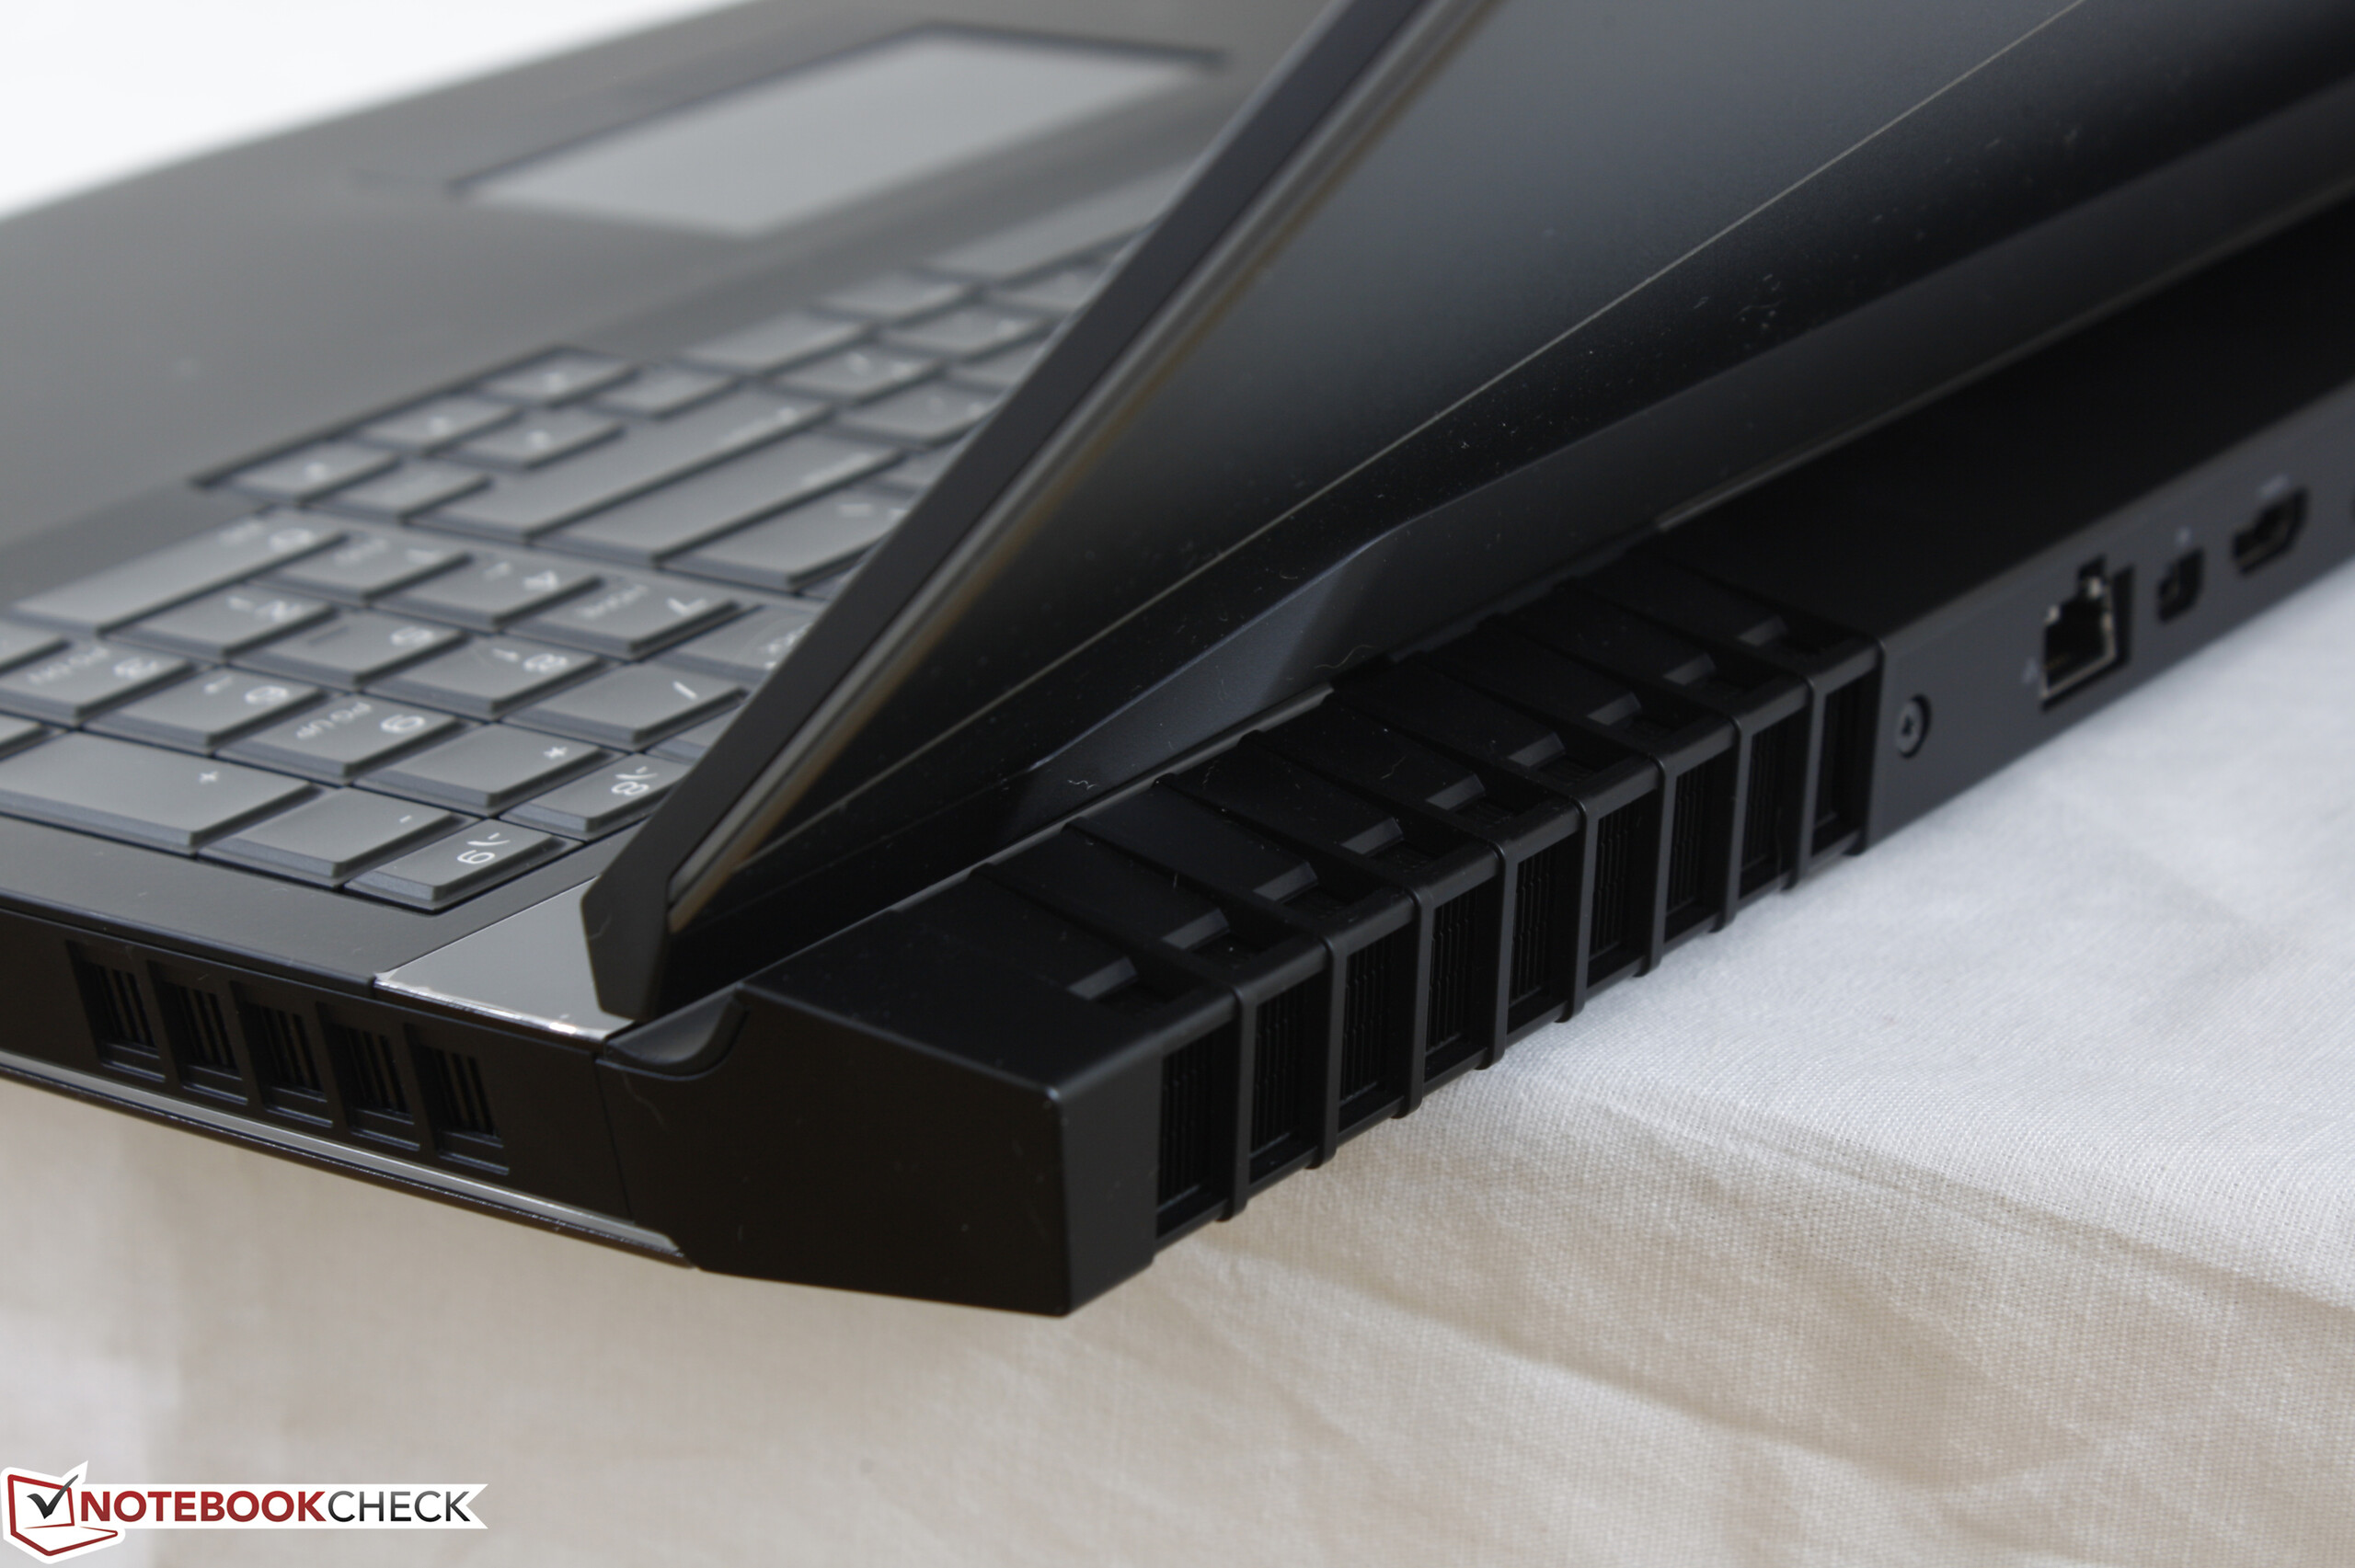
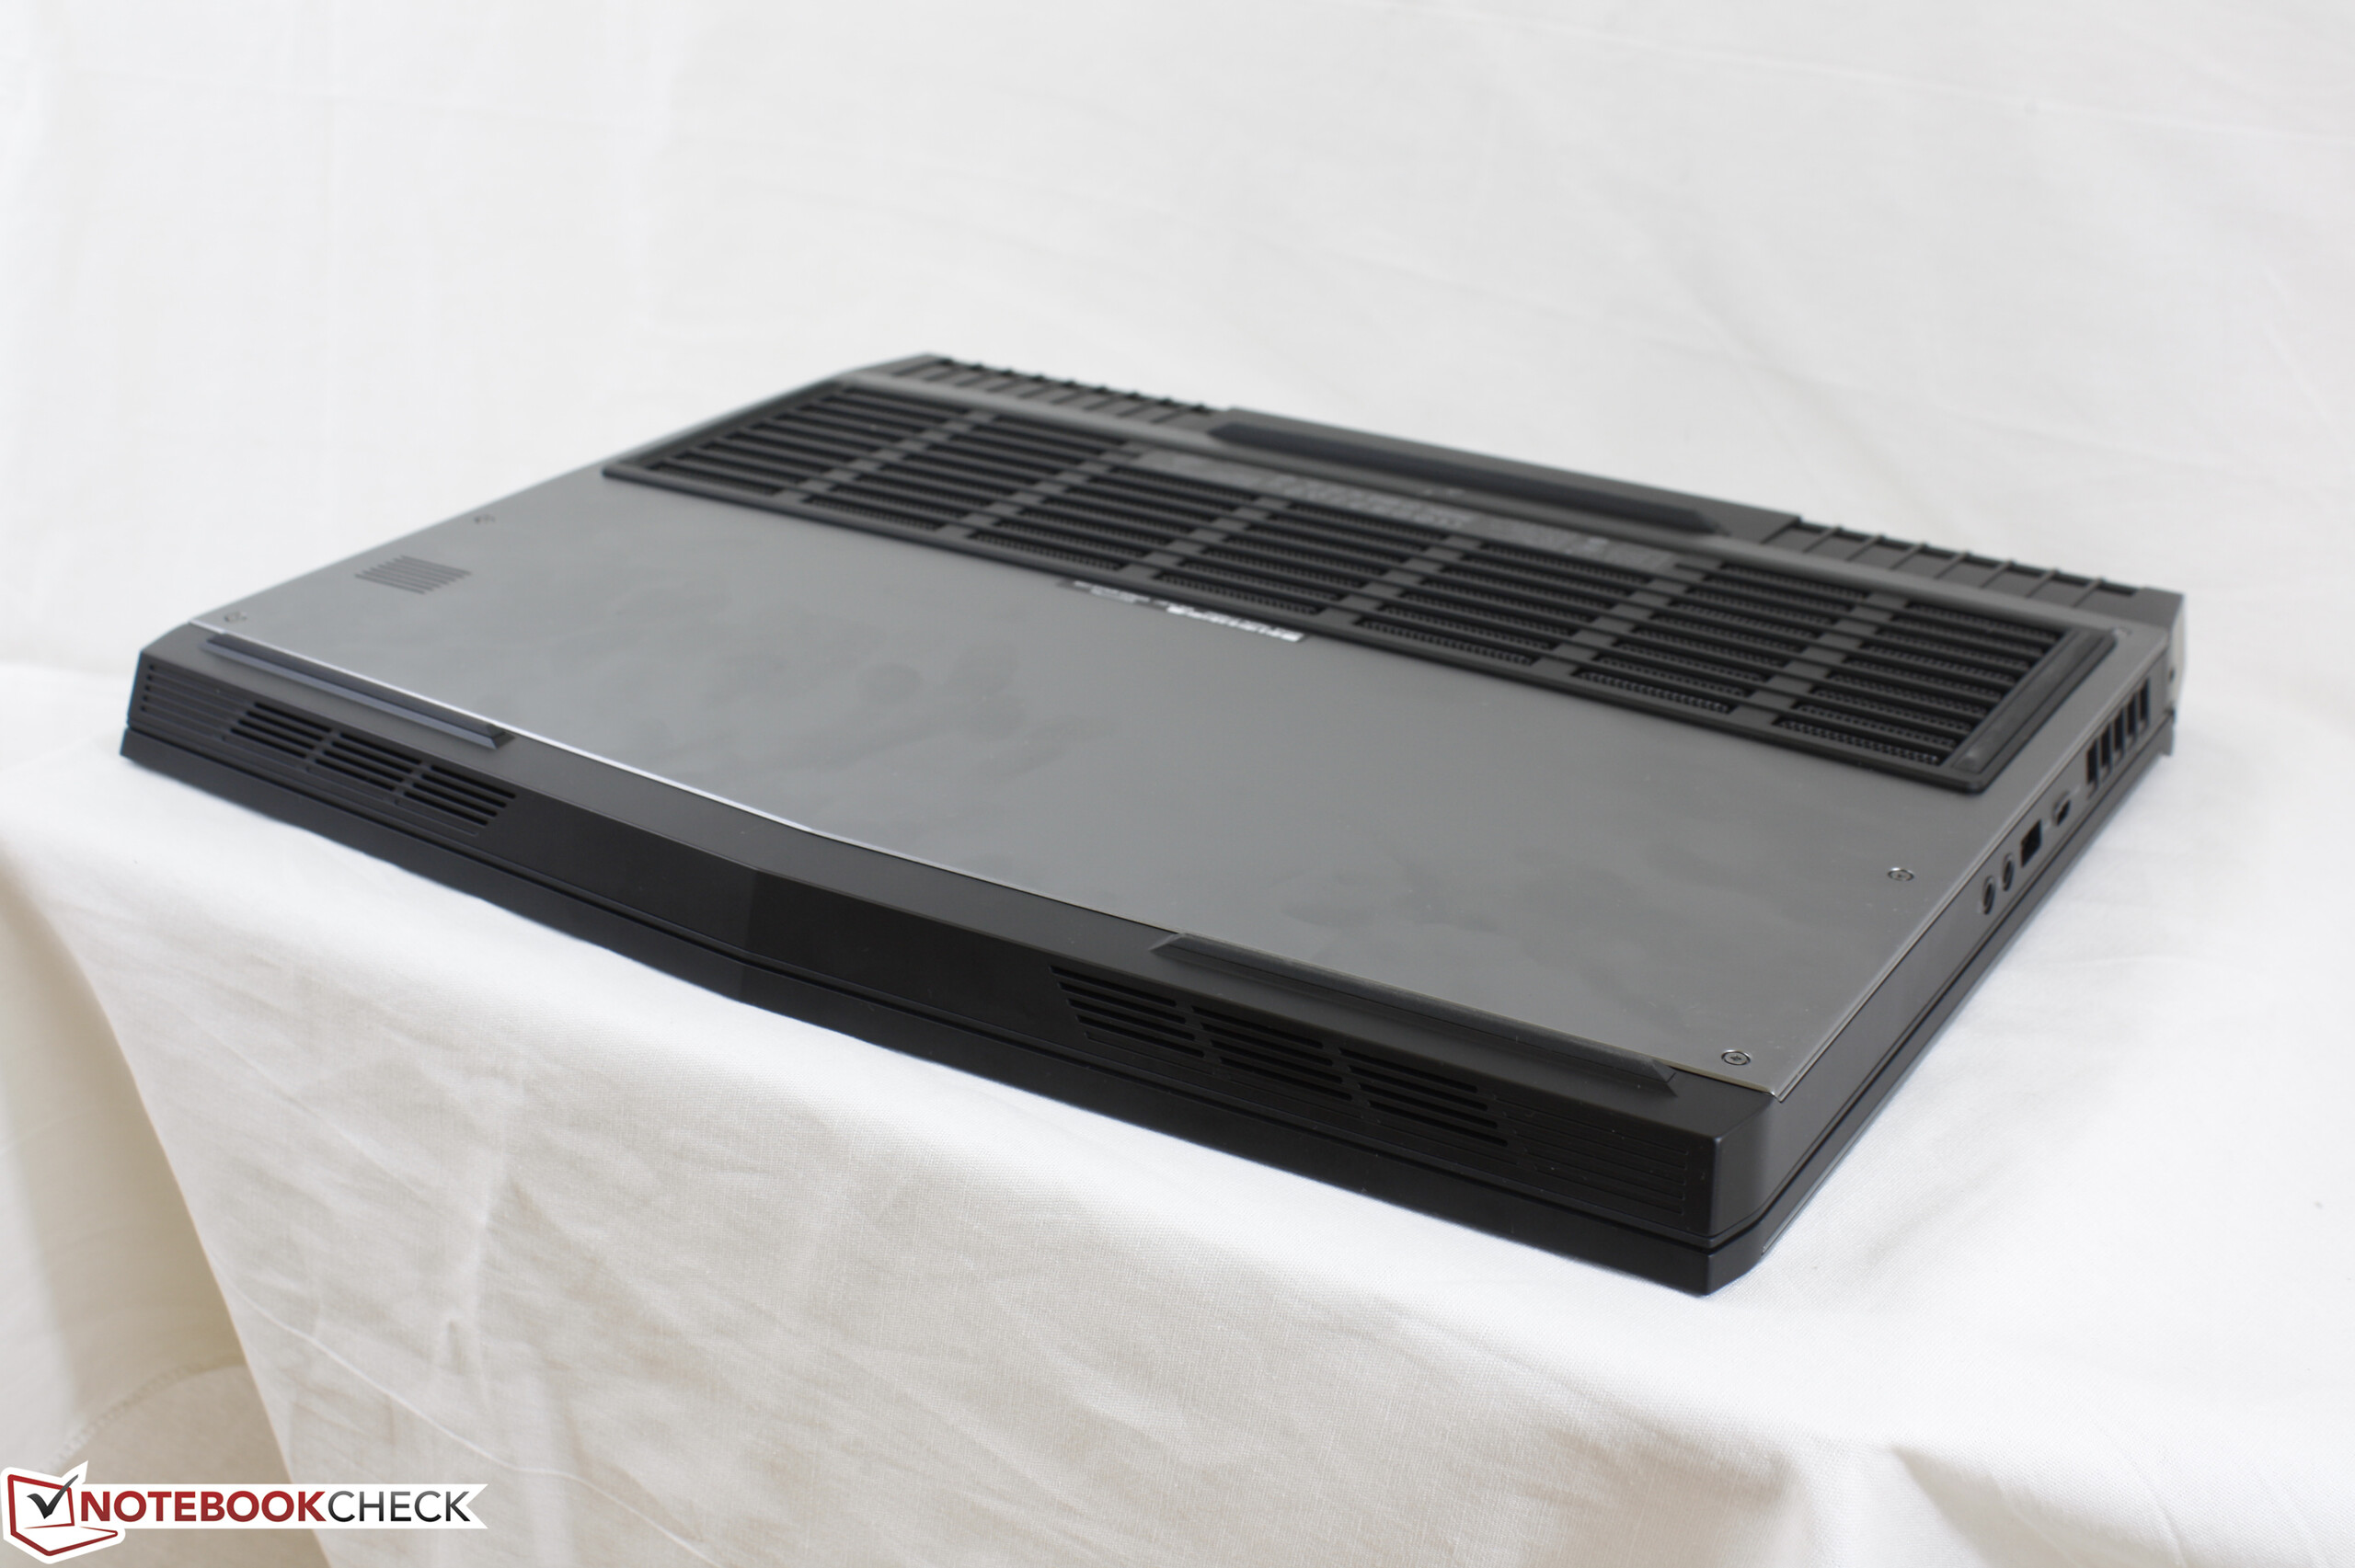
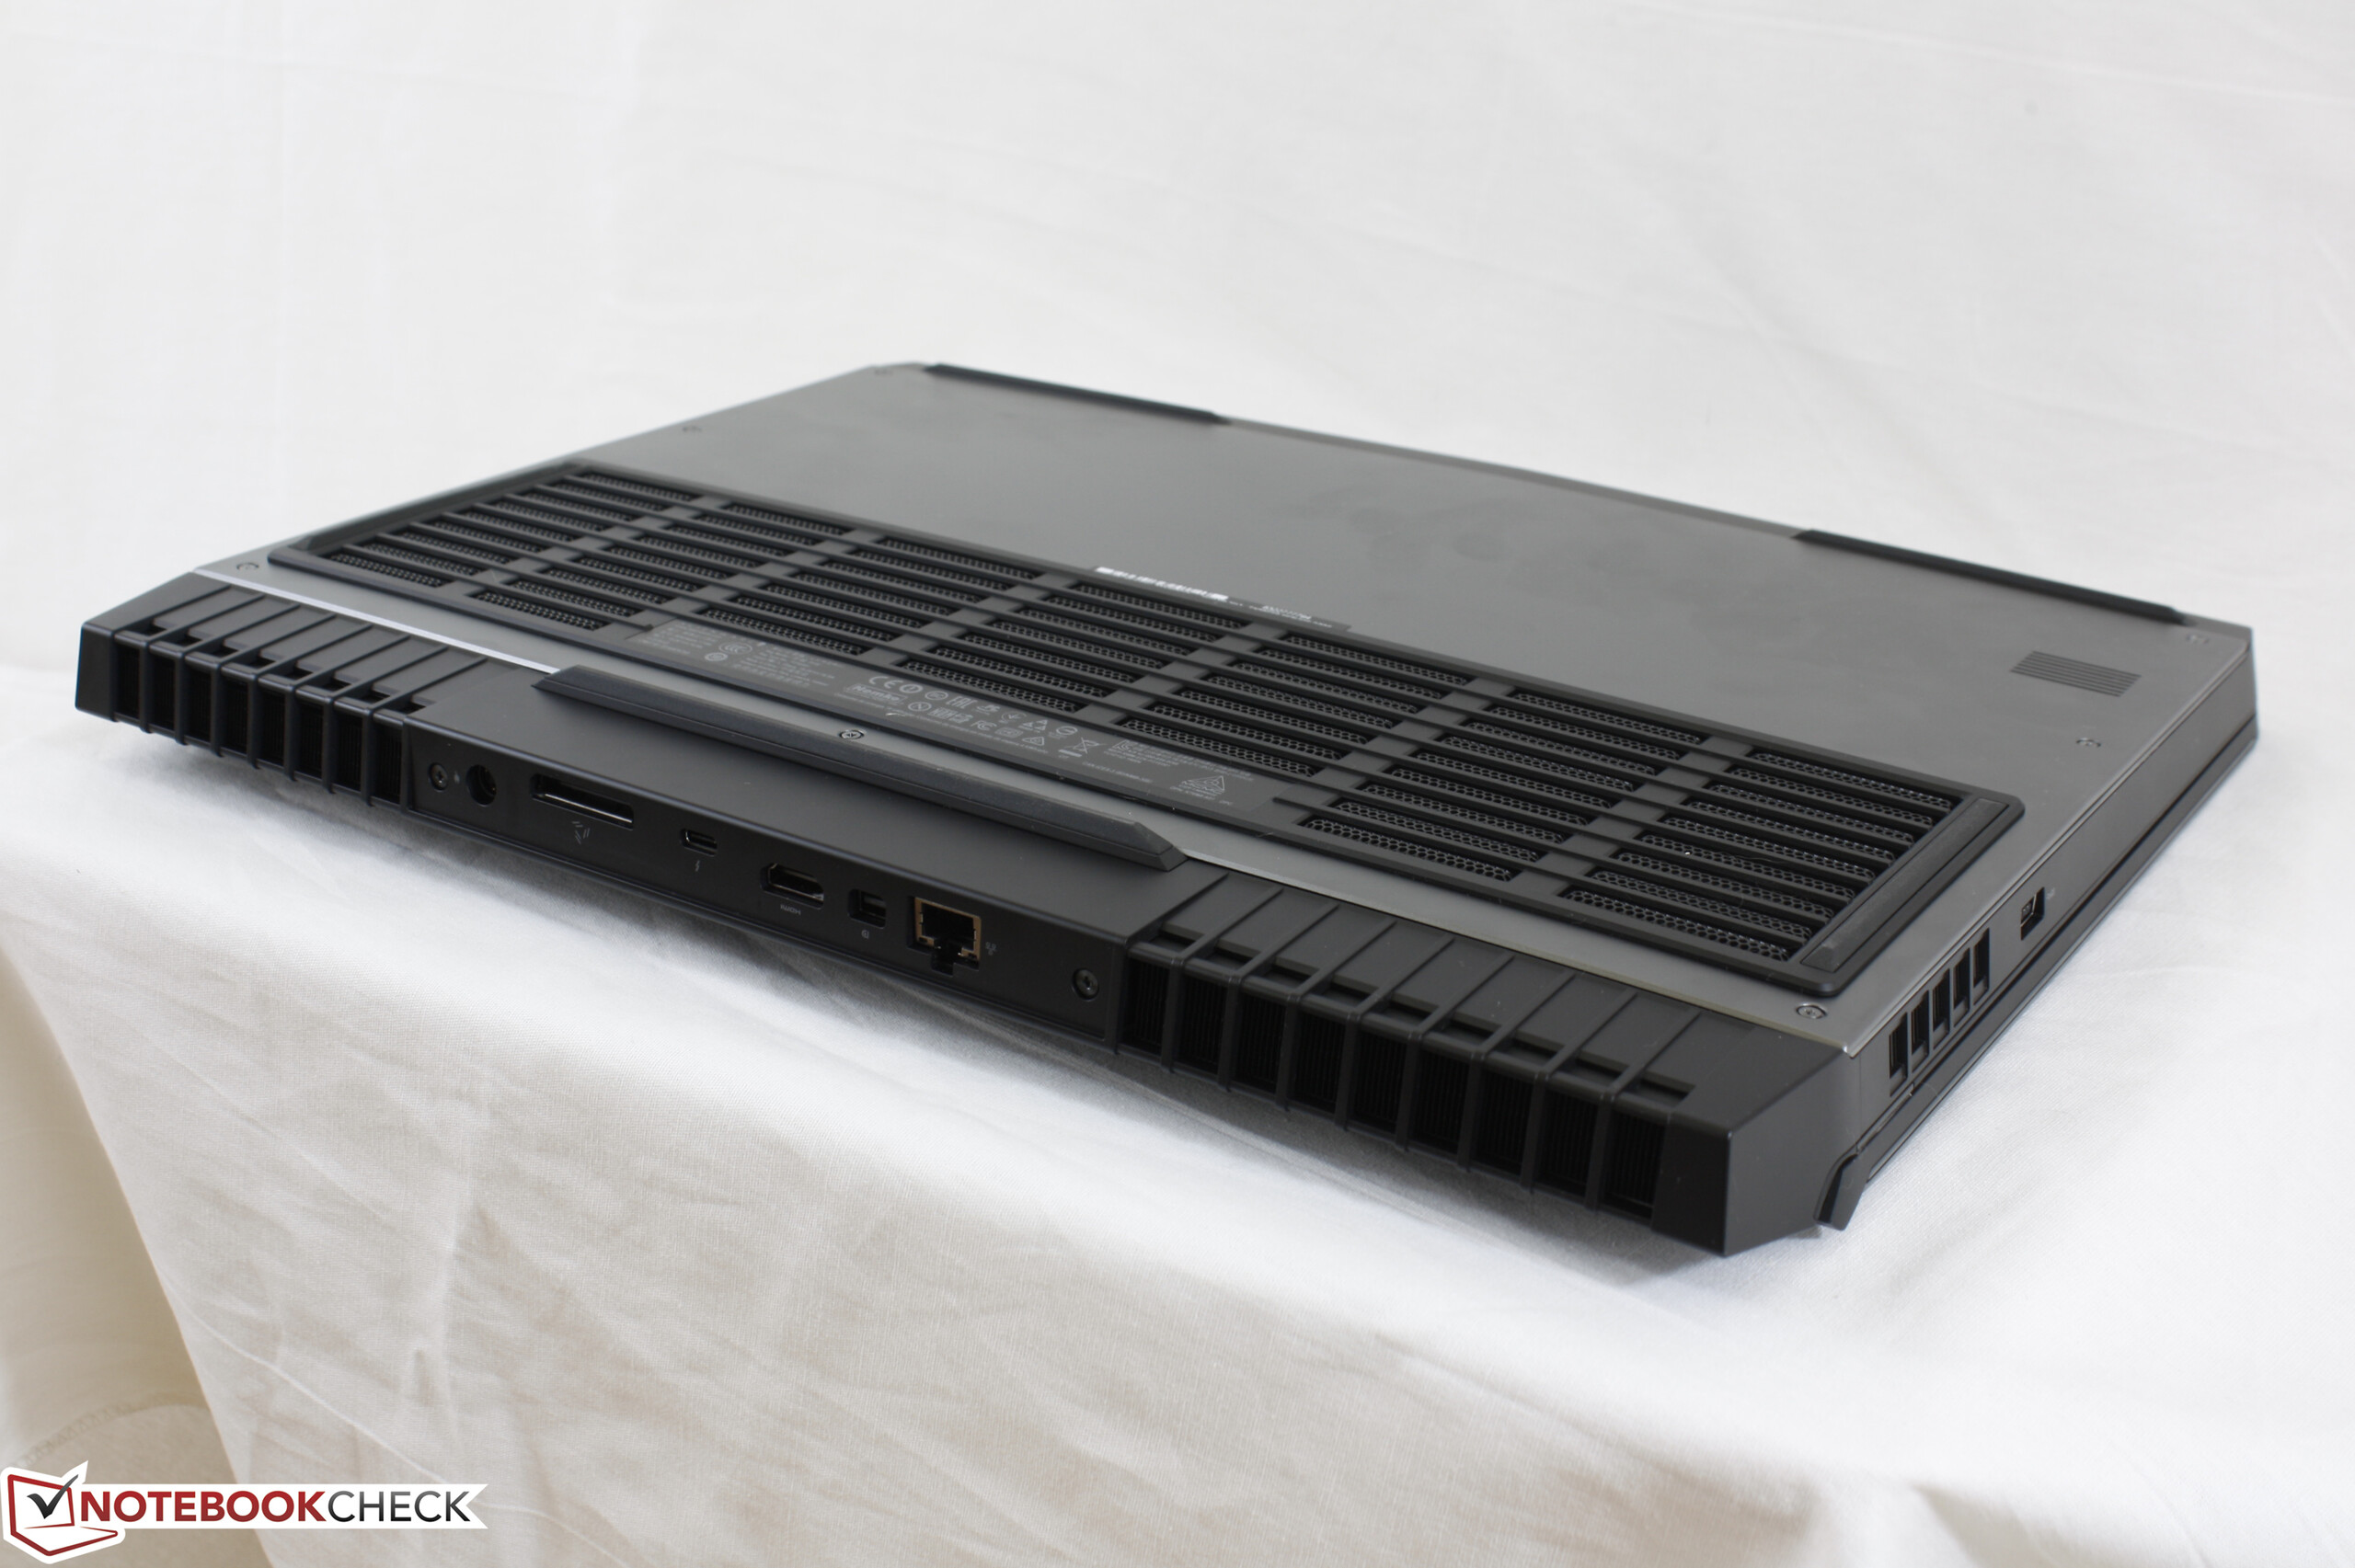
We begin to see some issues when at the very high-end configuration level. Our particular test unit is equipped with the fastest CPU and GPU available on the current 17 R4 and the chassis can just barely run these processors reliably at Boost clock rates. Yes, the CPU and GPU will not throttle even when under extreme loads, but core temperatures can reach 90 C or higher when gaming in spite of the fans working overtime at up to 50 dB(A). This is where thicker gaming systems with more developed cooling solutions like the MSI GT73VR or Acer Predator 17 X have the upper hand in temperatures and/or noise.
The findings above and the fact that a Graphics Amplifier port is present actually make for a more compelling reason to purchase a lower-end 17 R4 SKU with GTX 1050 Ti or GTX 1060 graphics. There is a good chance that the significantly lower TDP requirements of these GPUs will lead to quieter fans, lower temperatures, longer runtimes, or possibly all three. Then, users who may demand faster graphics power down the line can simply use the Graphics Amplifier port for future titles. This is the one trick that the Alienware series has up its sleeve against most competitors and these lower-end SKUs are definitely deserving of our full performance rundown to get a bigger picture of the 17 R4 series.
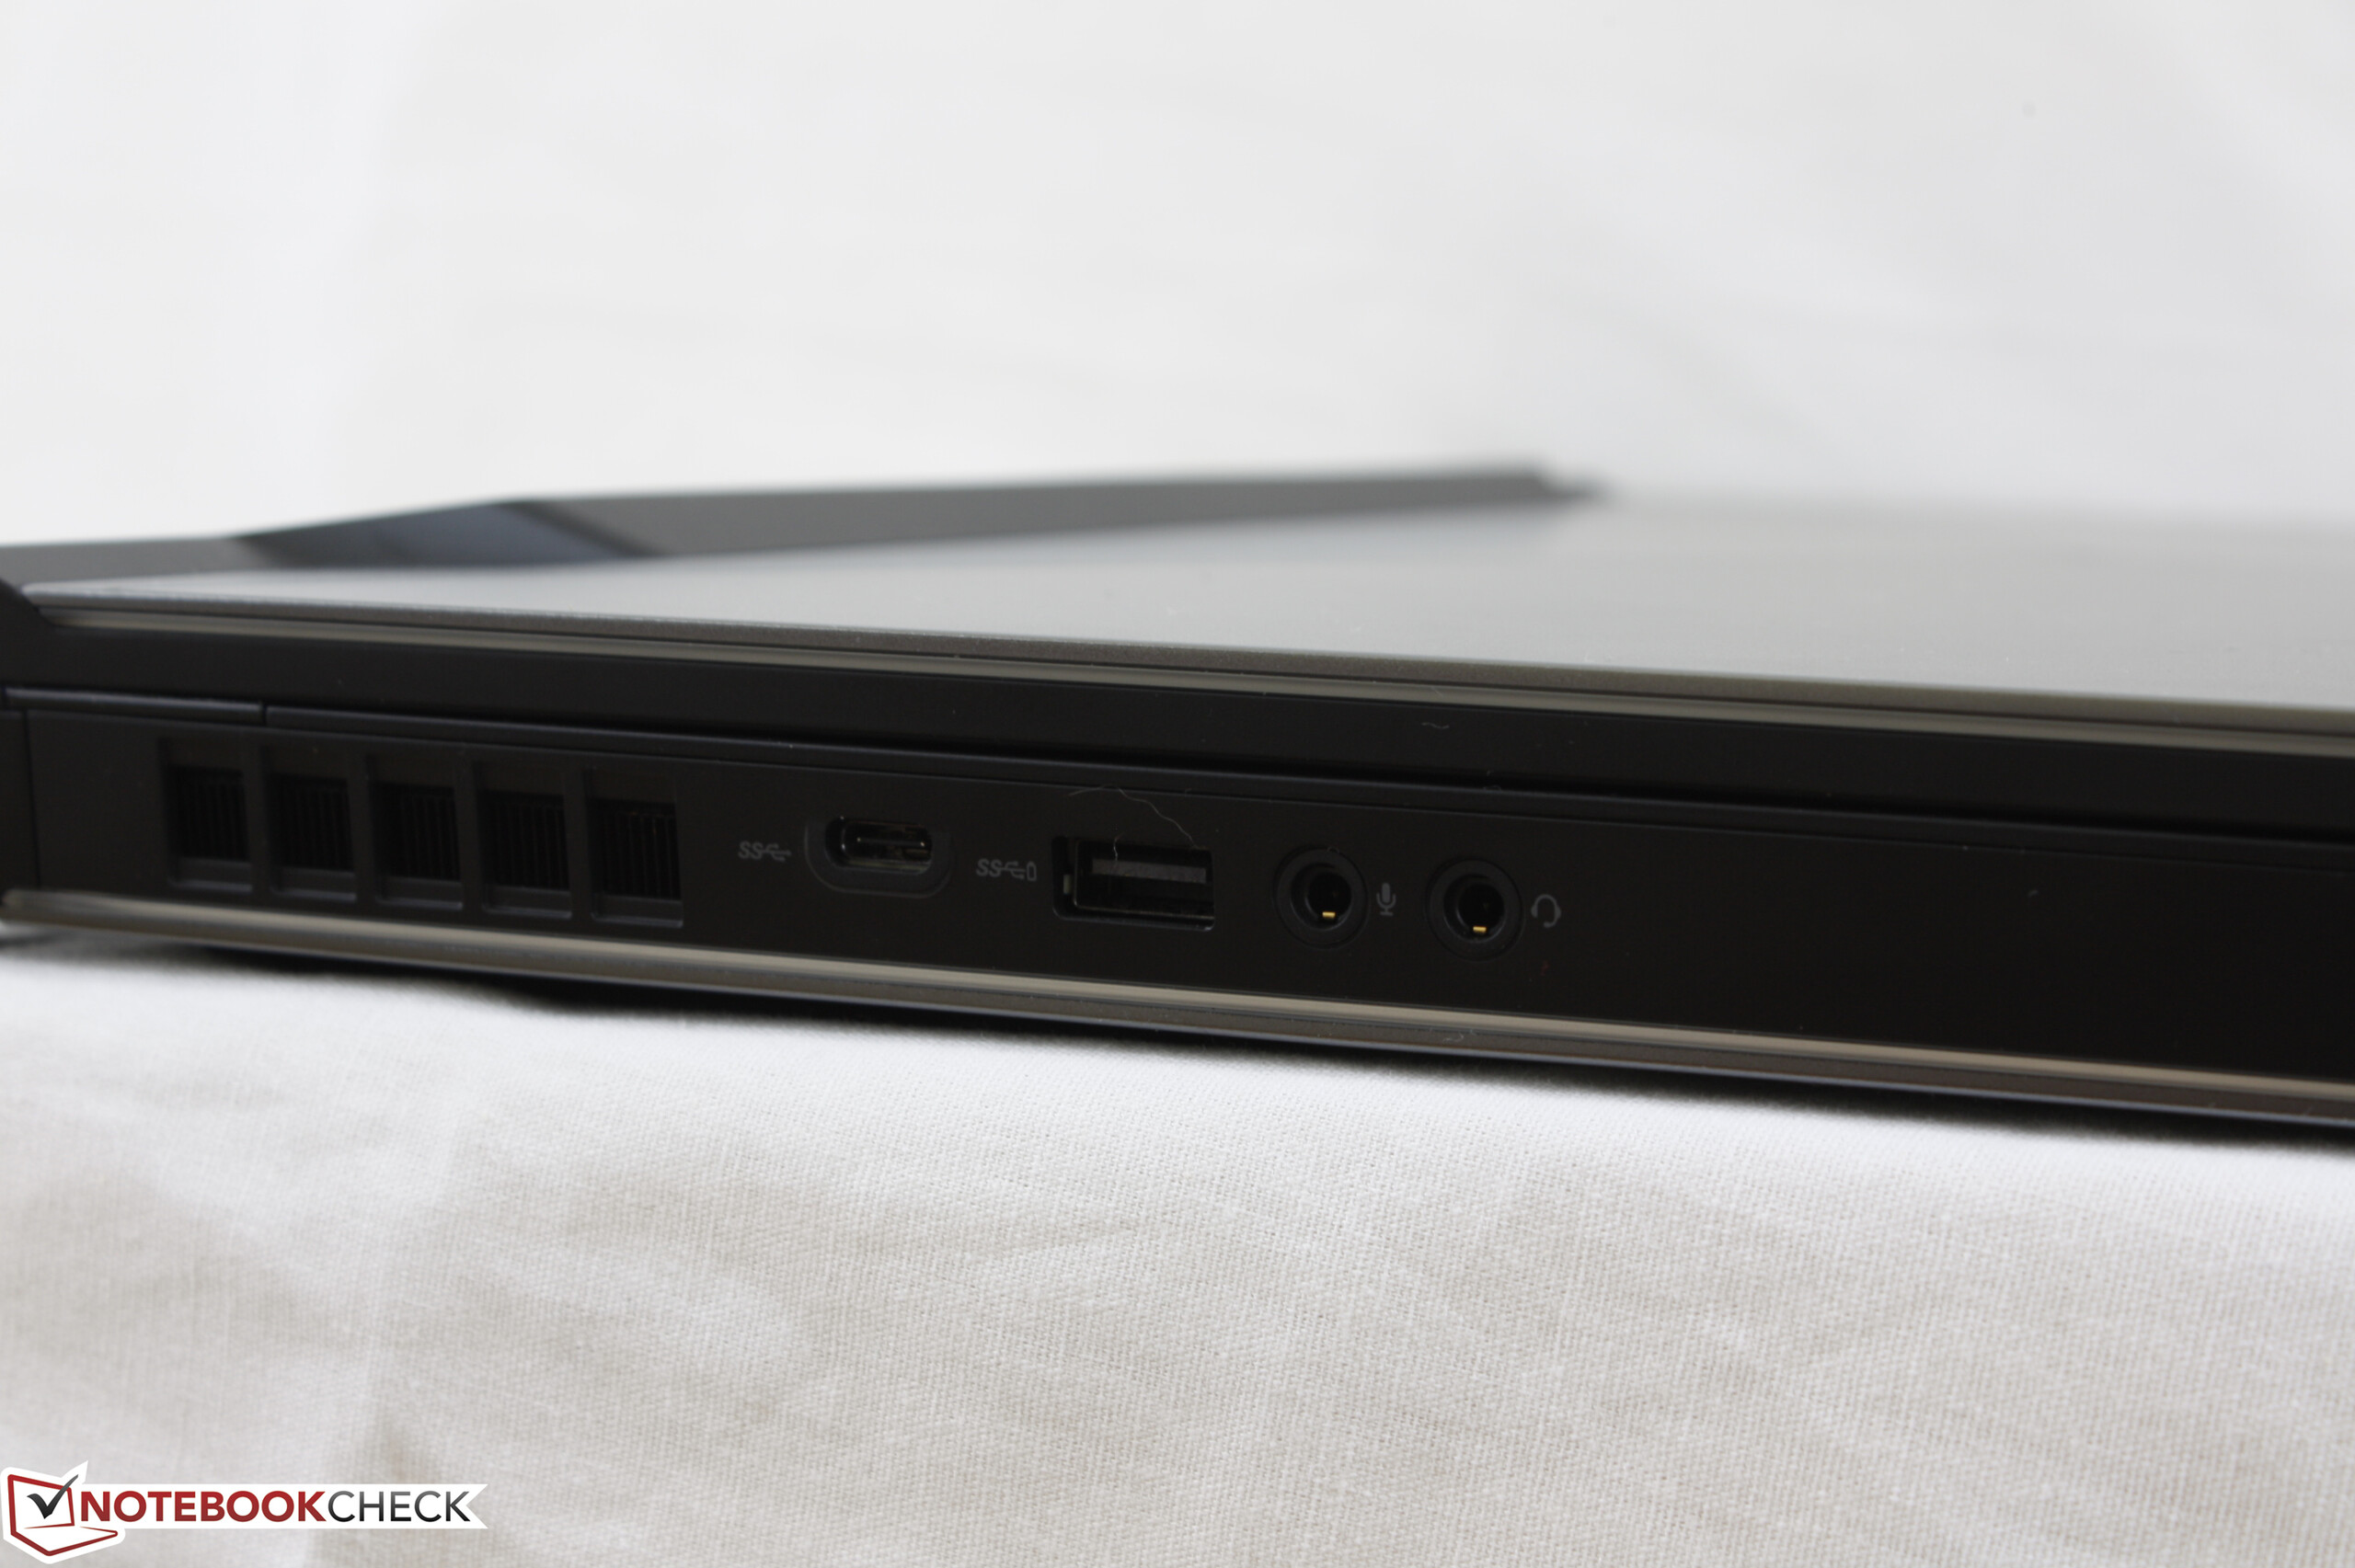
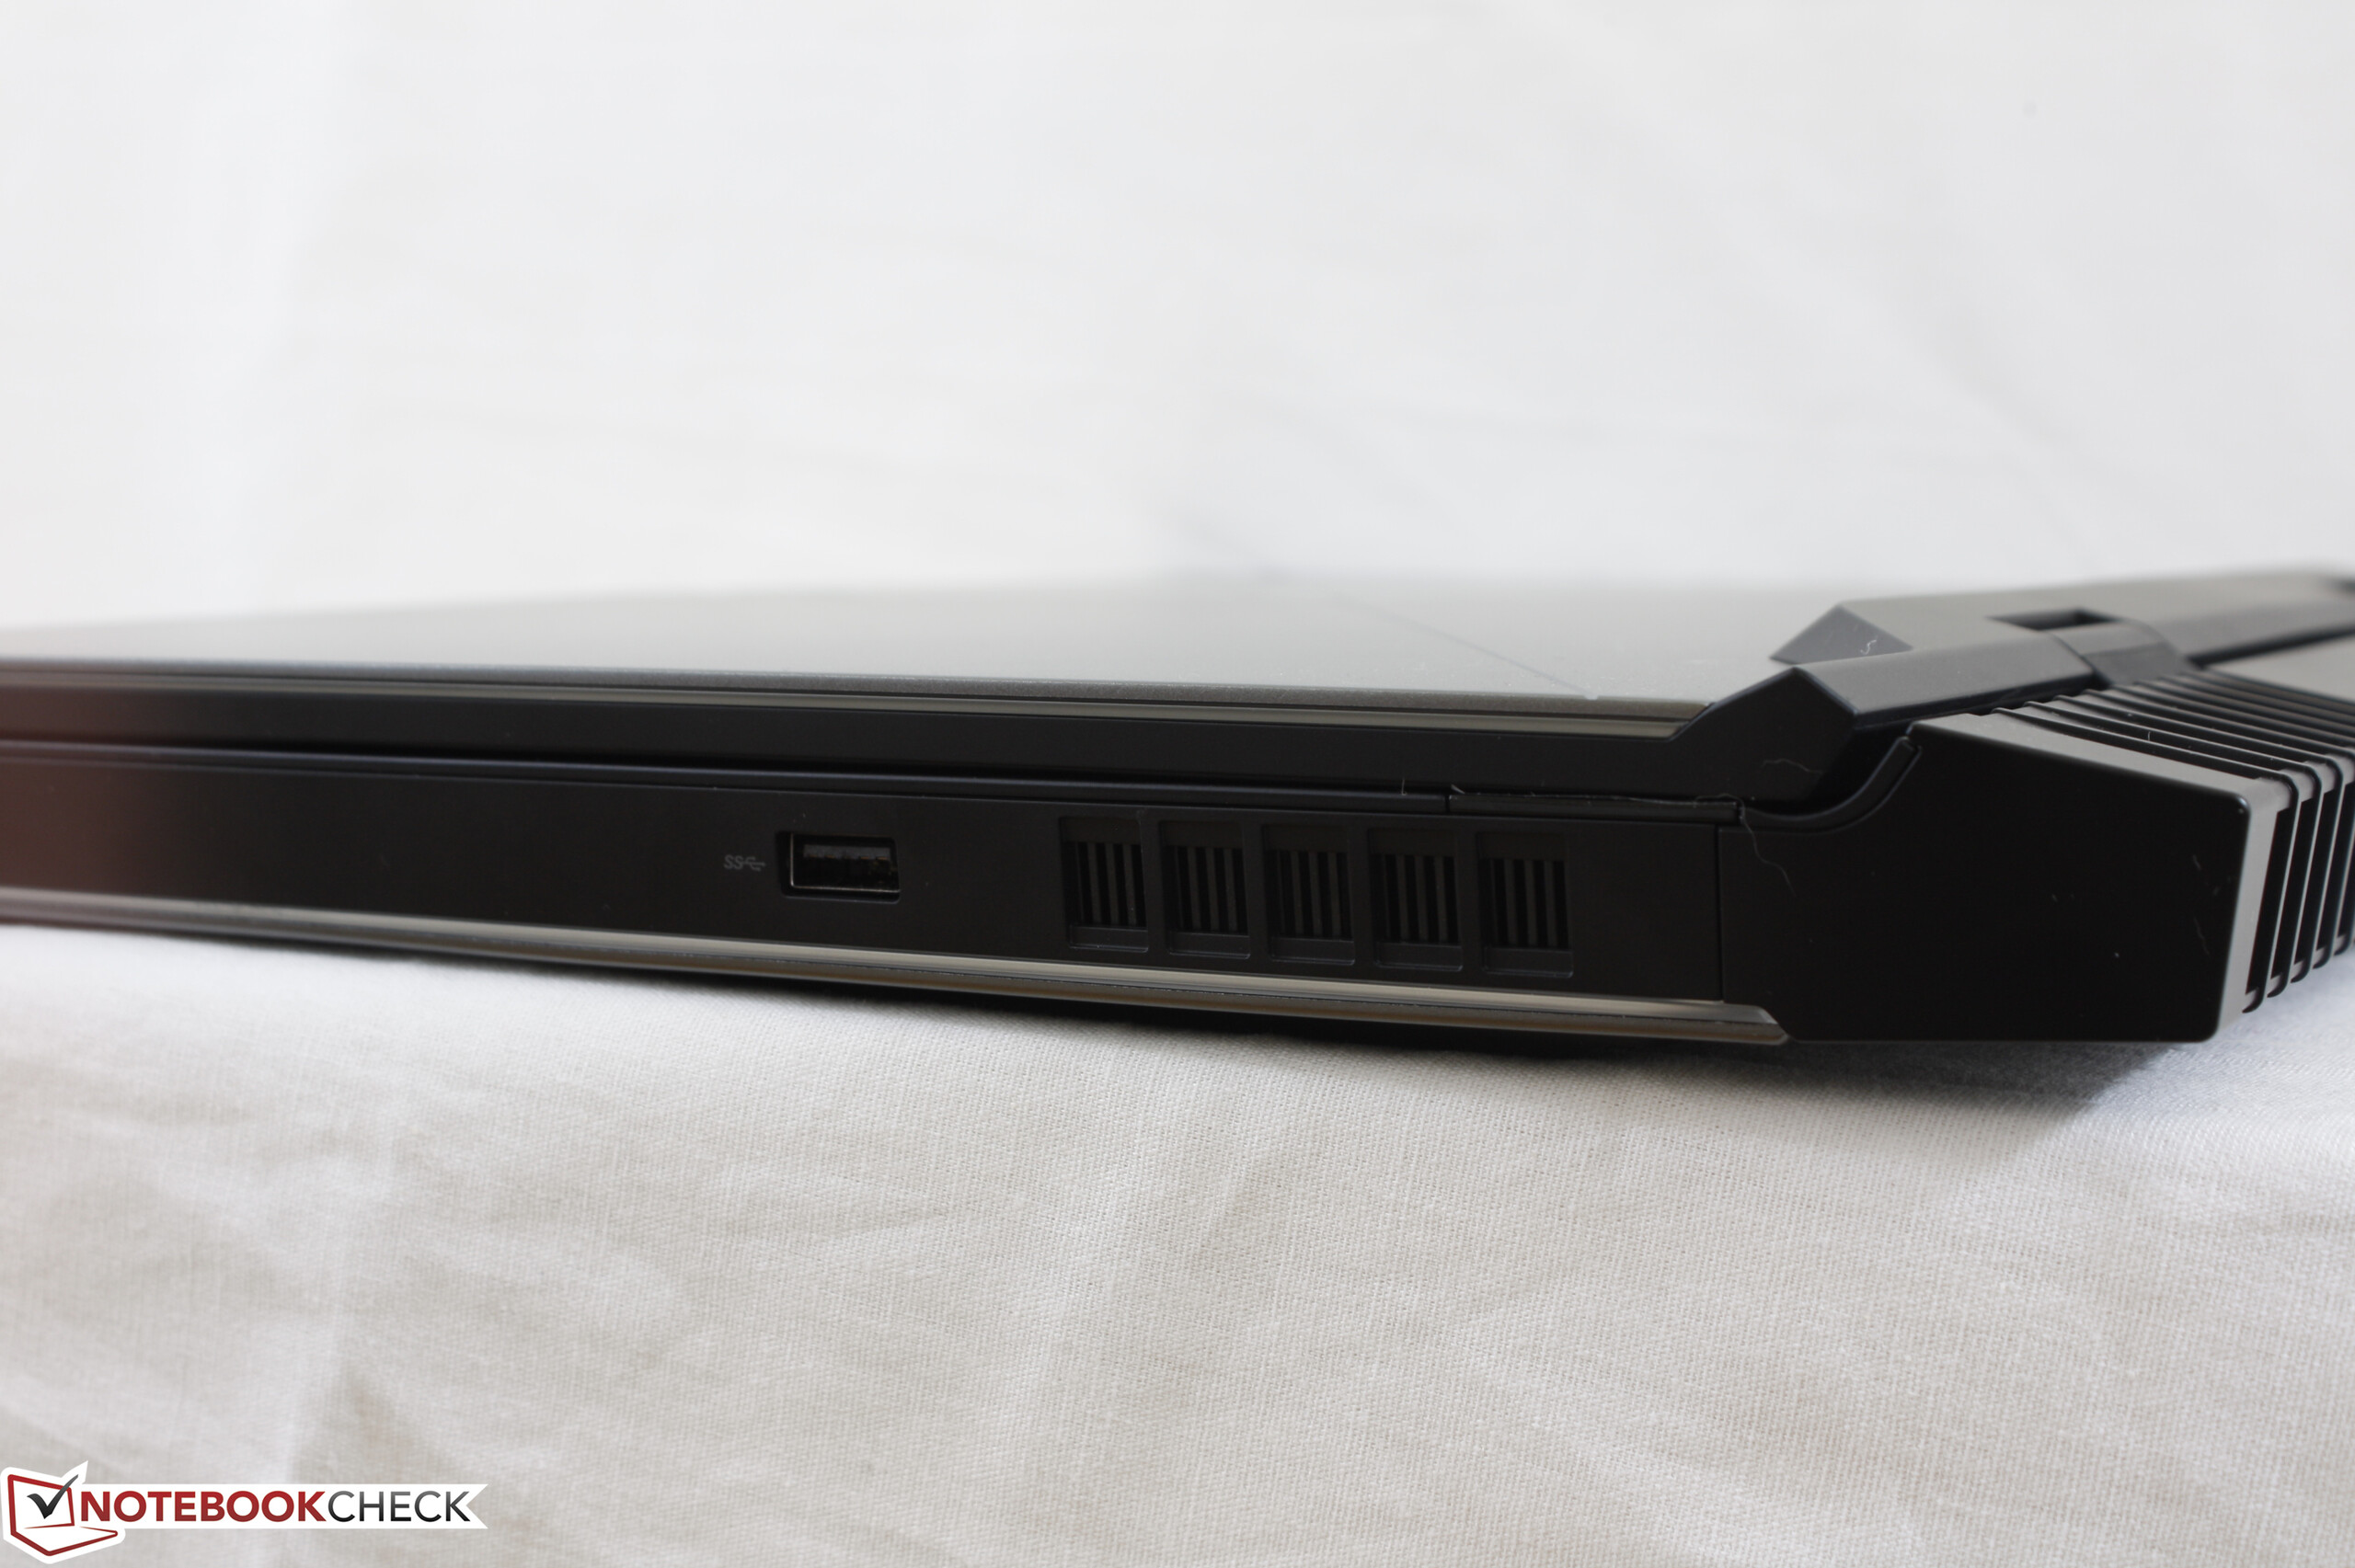
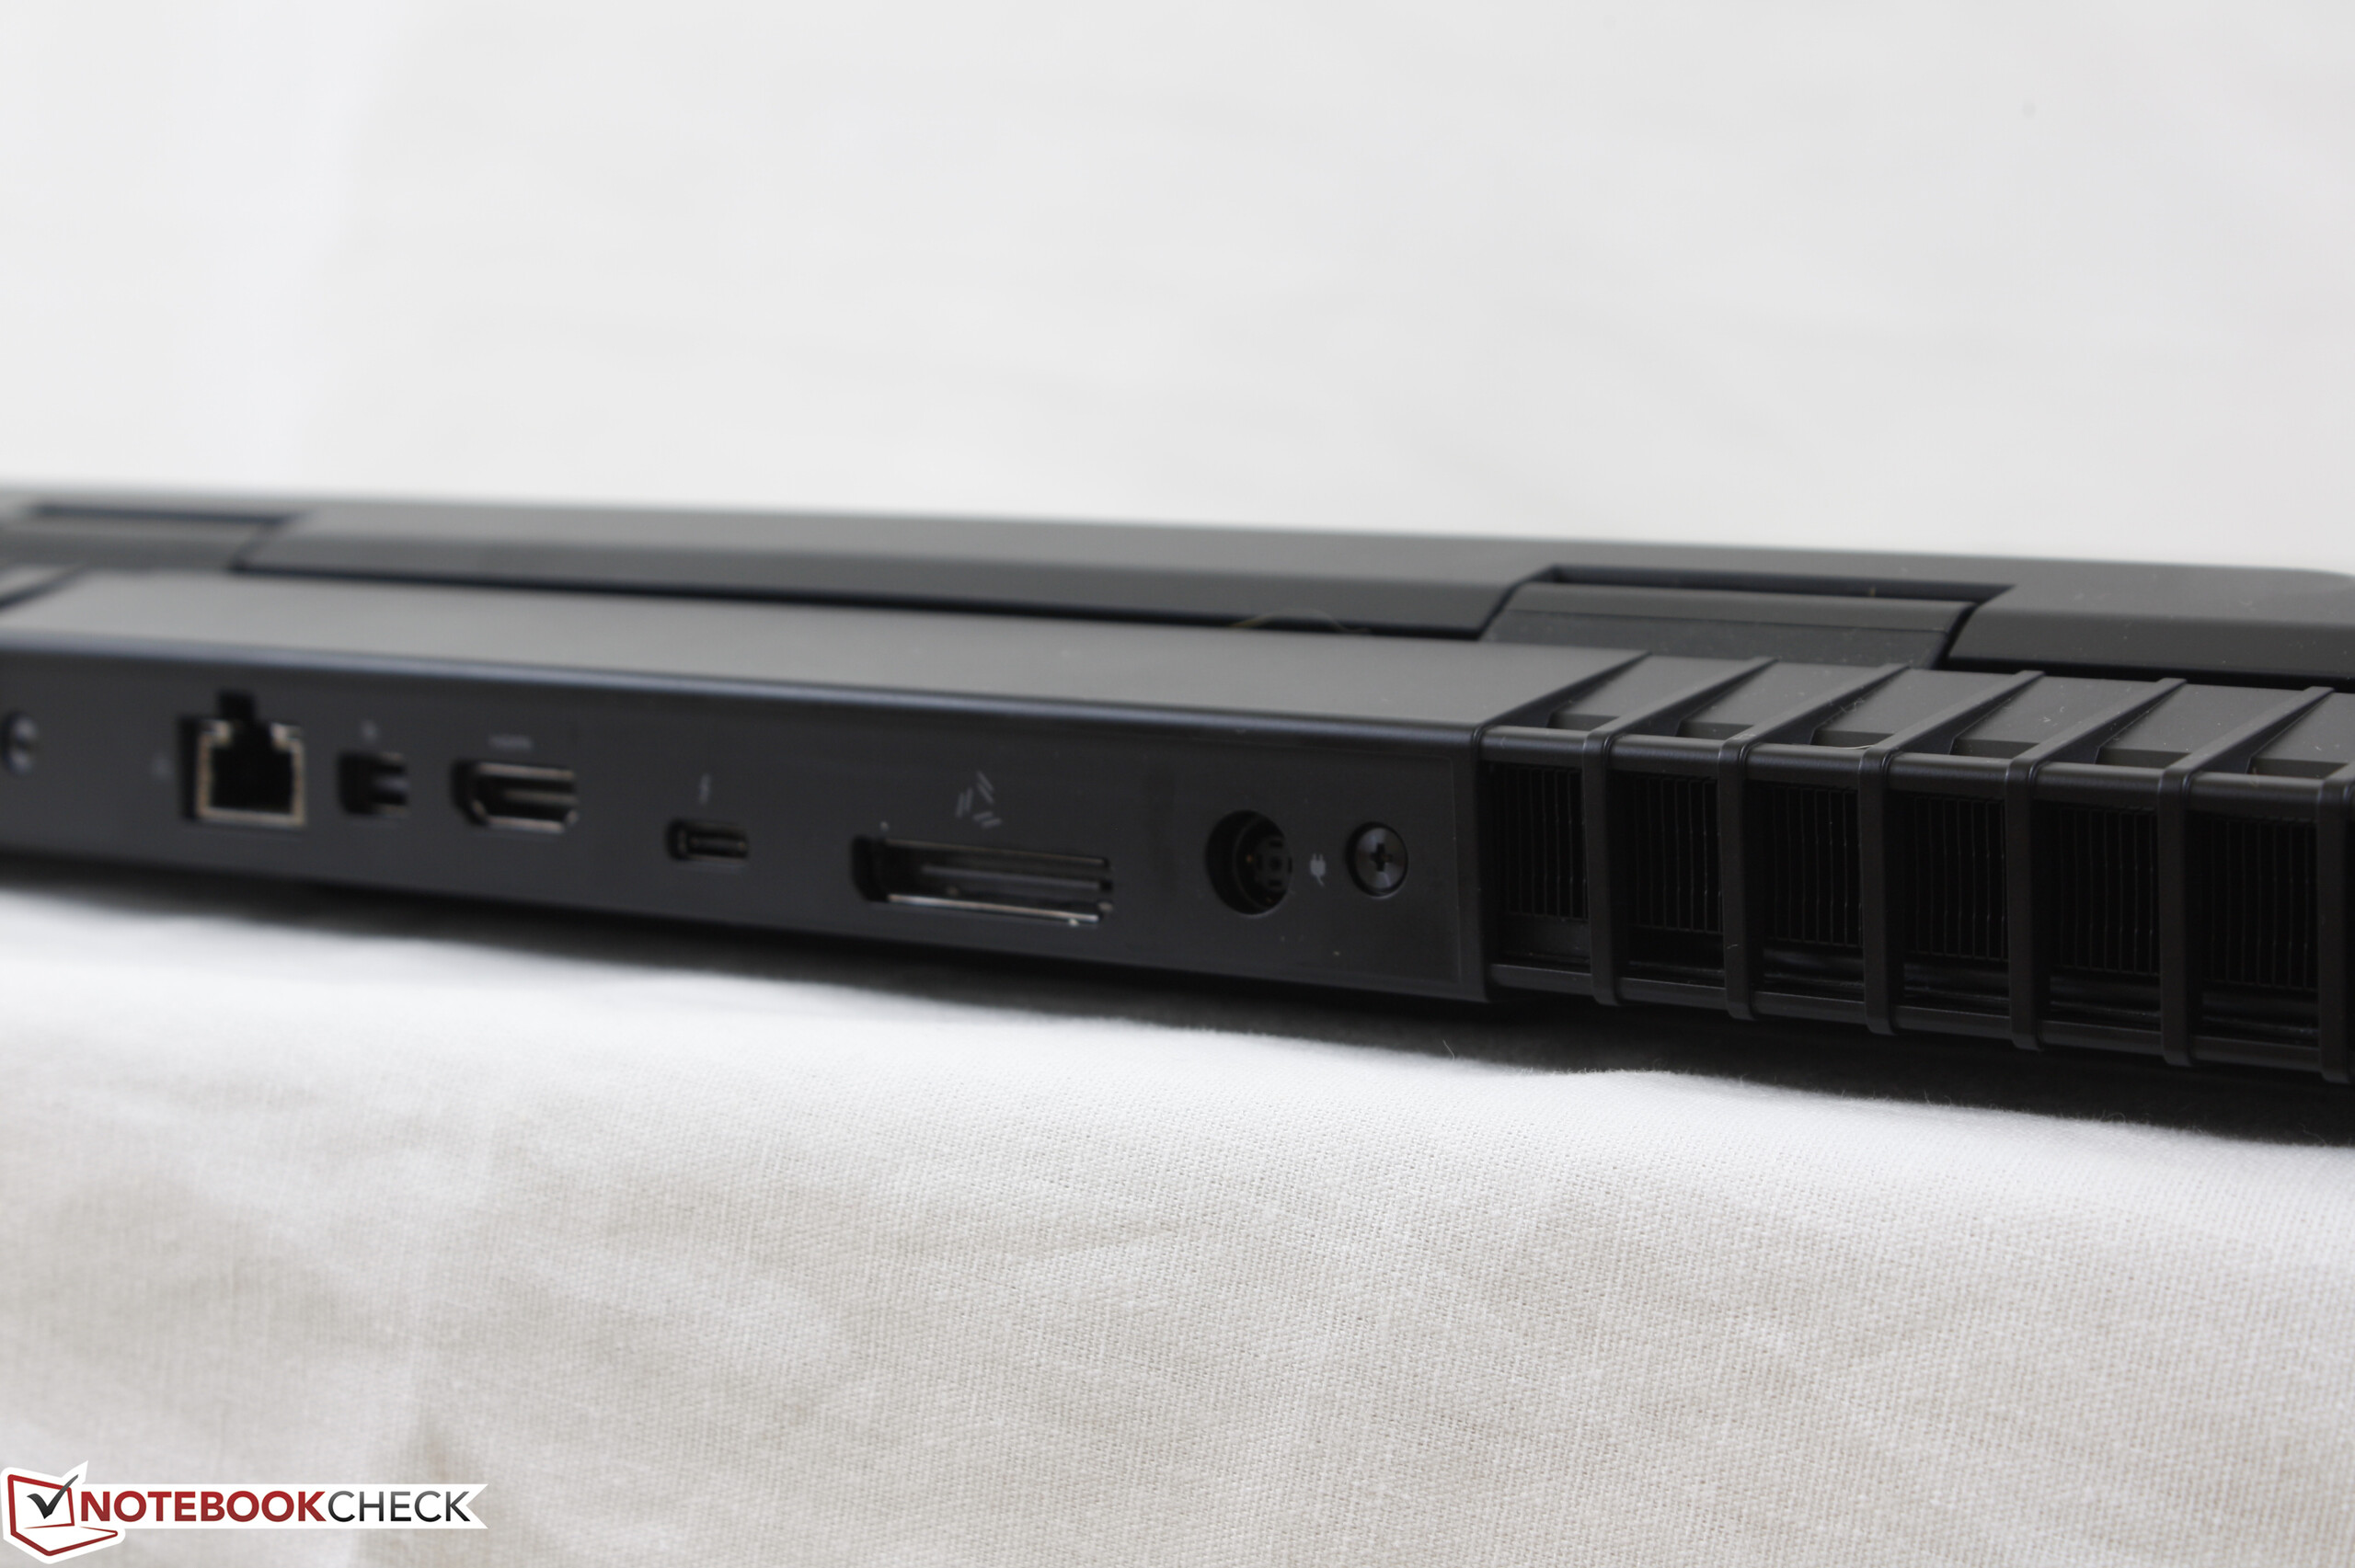
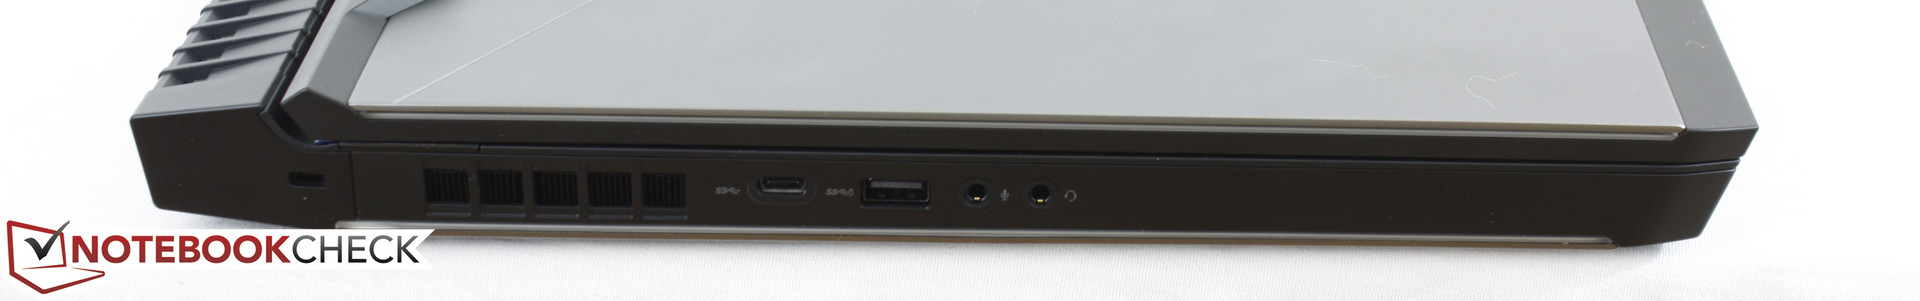
Beyond these red flags in performance, there is little to complain about the rest of the notebook. A wider range of features wouldn't hurt such as individually-lit RGB keys, more USB Type-A ports, and an integrated SD reader, though their omissions aren't necessarily the end of the world. Gamers who are interested in the Graphics Amplifier port and strong chassis design will find the entry-level SKUs to be worth considering. Otherwise, there are quieter (and thicker) systems out there for users who want to configure with the GTX 1080 GPU.
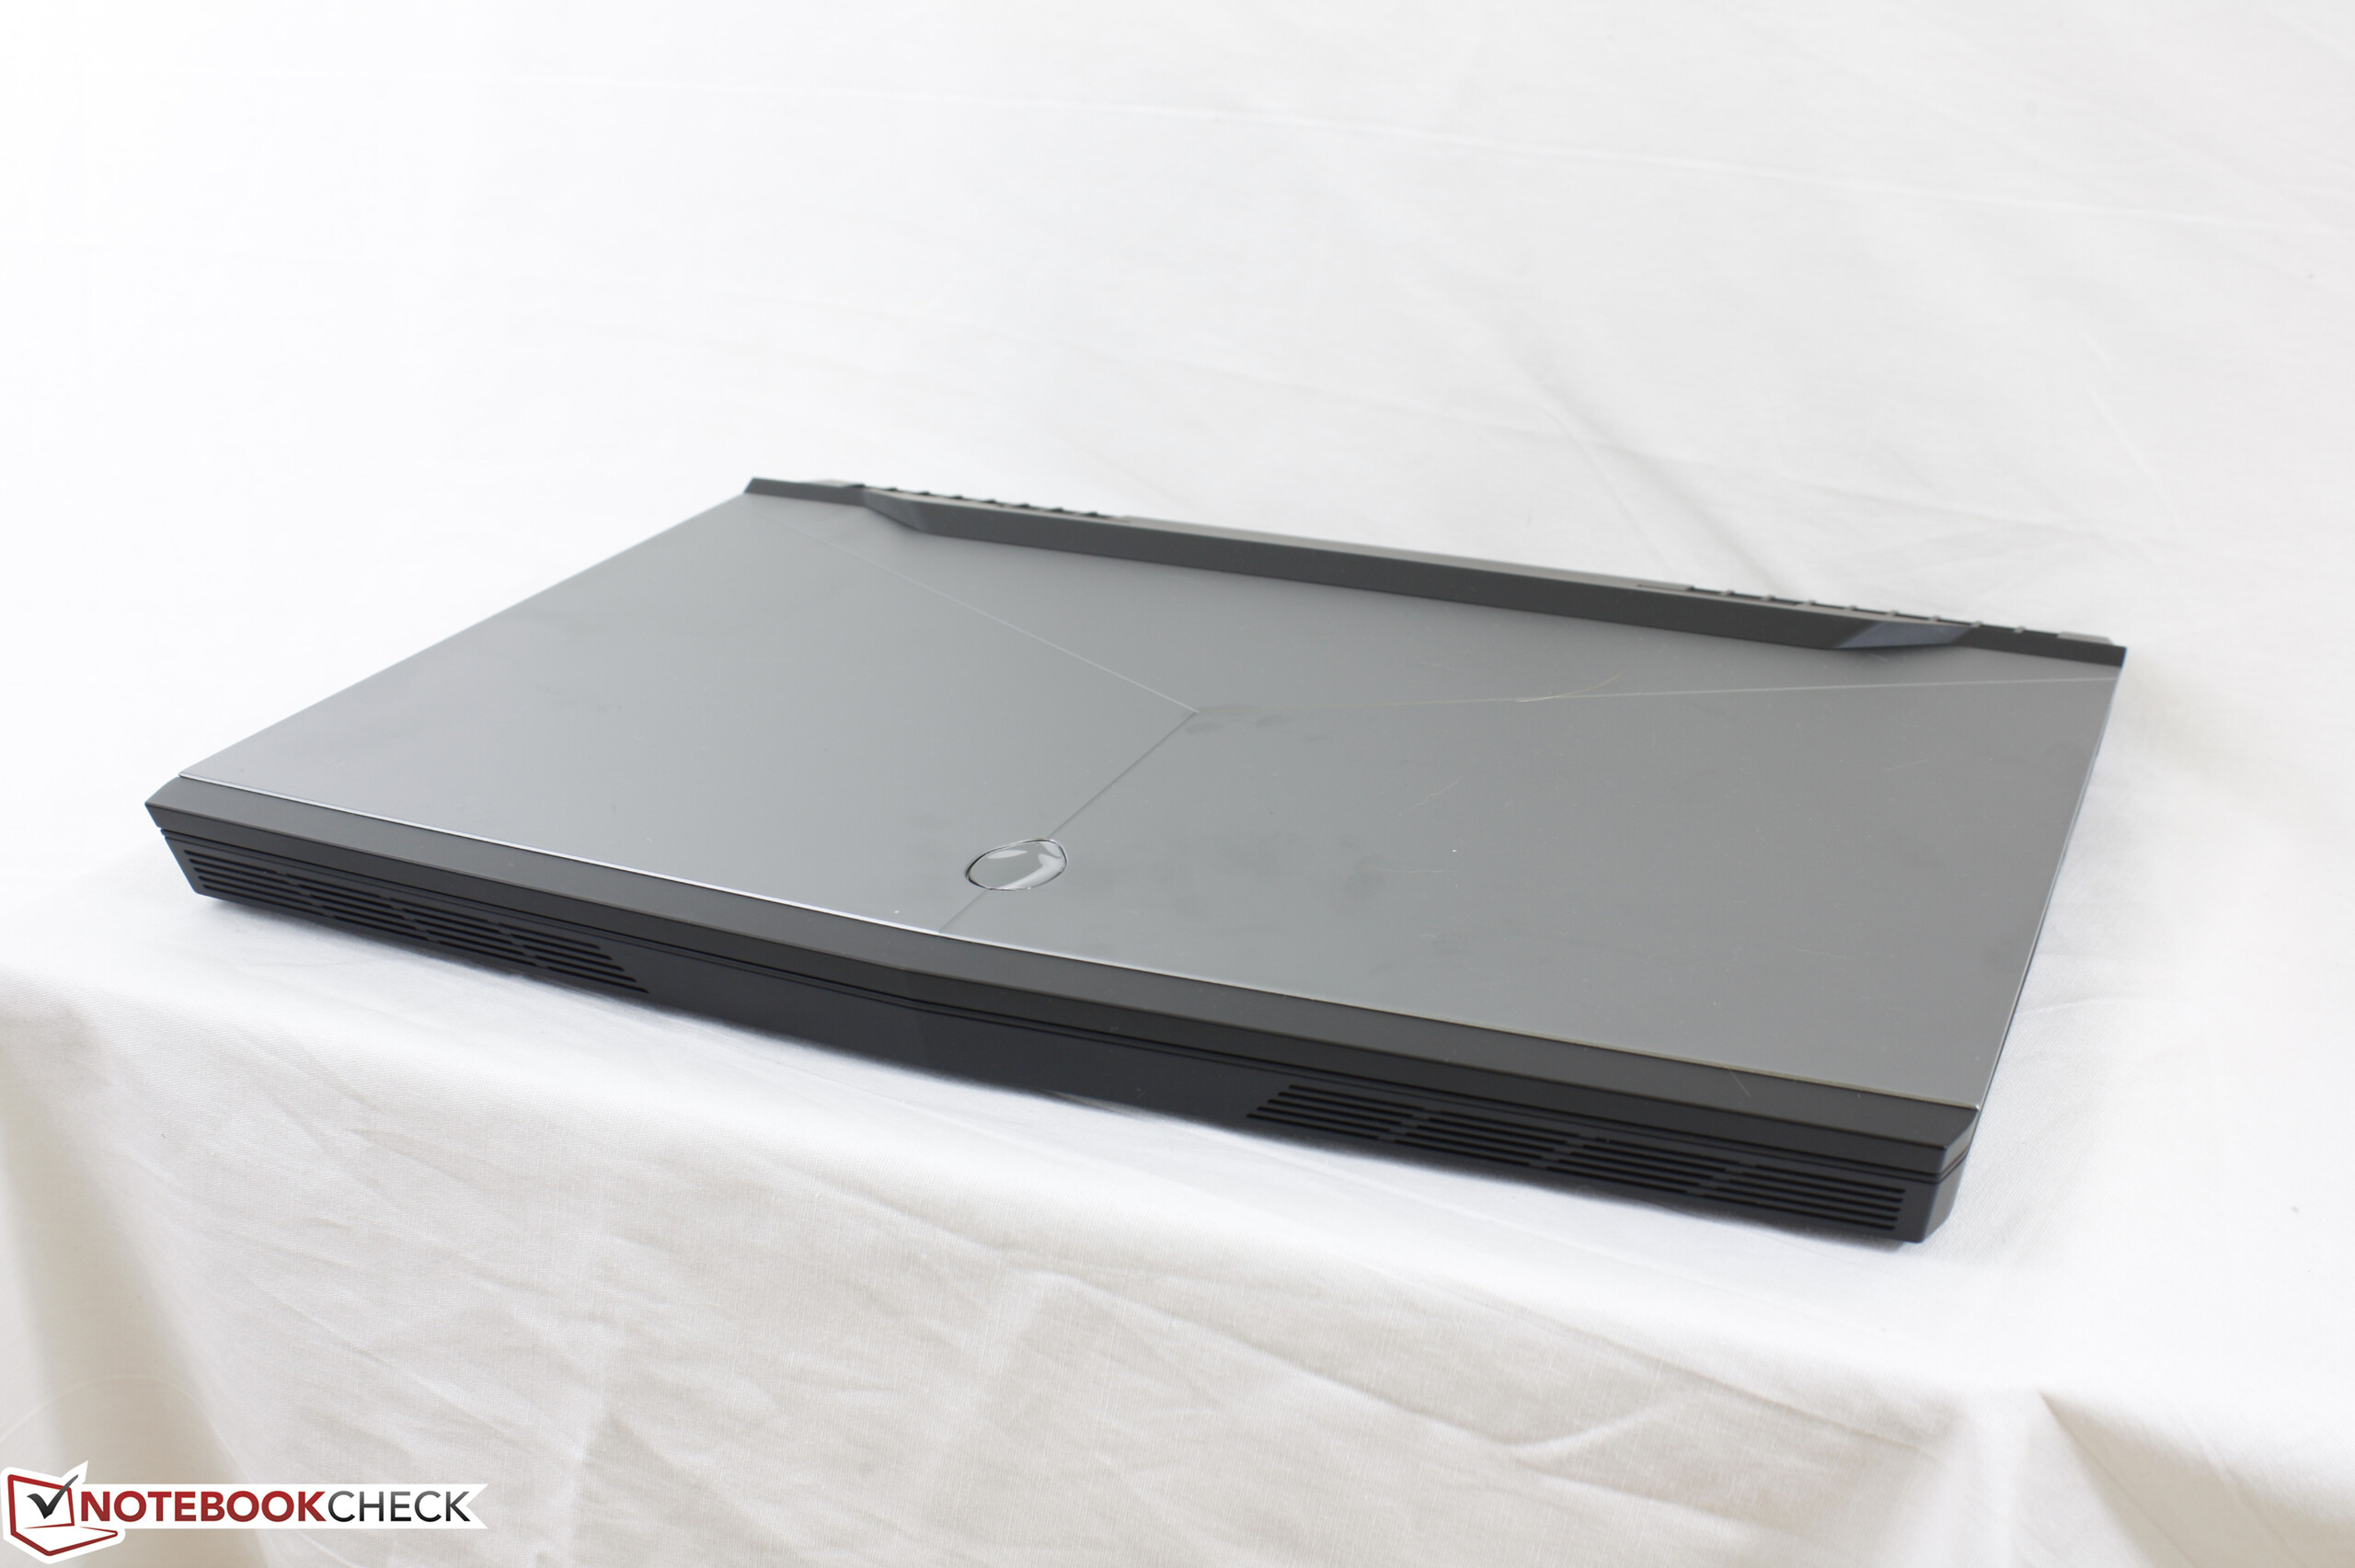
The new chassis is incredibly well-designed and feels premium to the touch. Just note that the GTX 1080 is pushing the limit of what the notebook's cooling solution can effectively handle.
Alienware 17 R4
- 05/03/2017 v6 (old)
Allen Ngo
Price comparison
