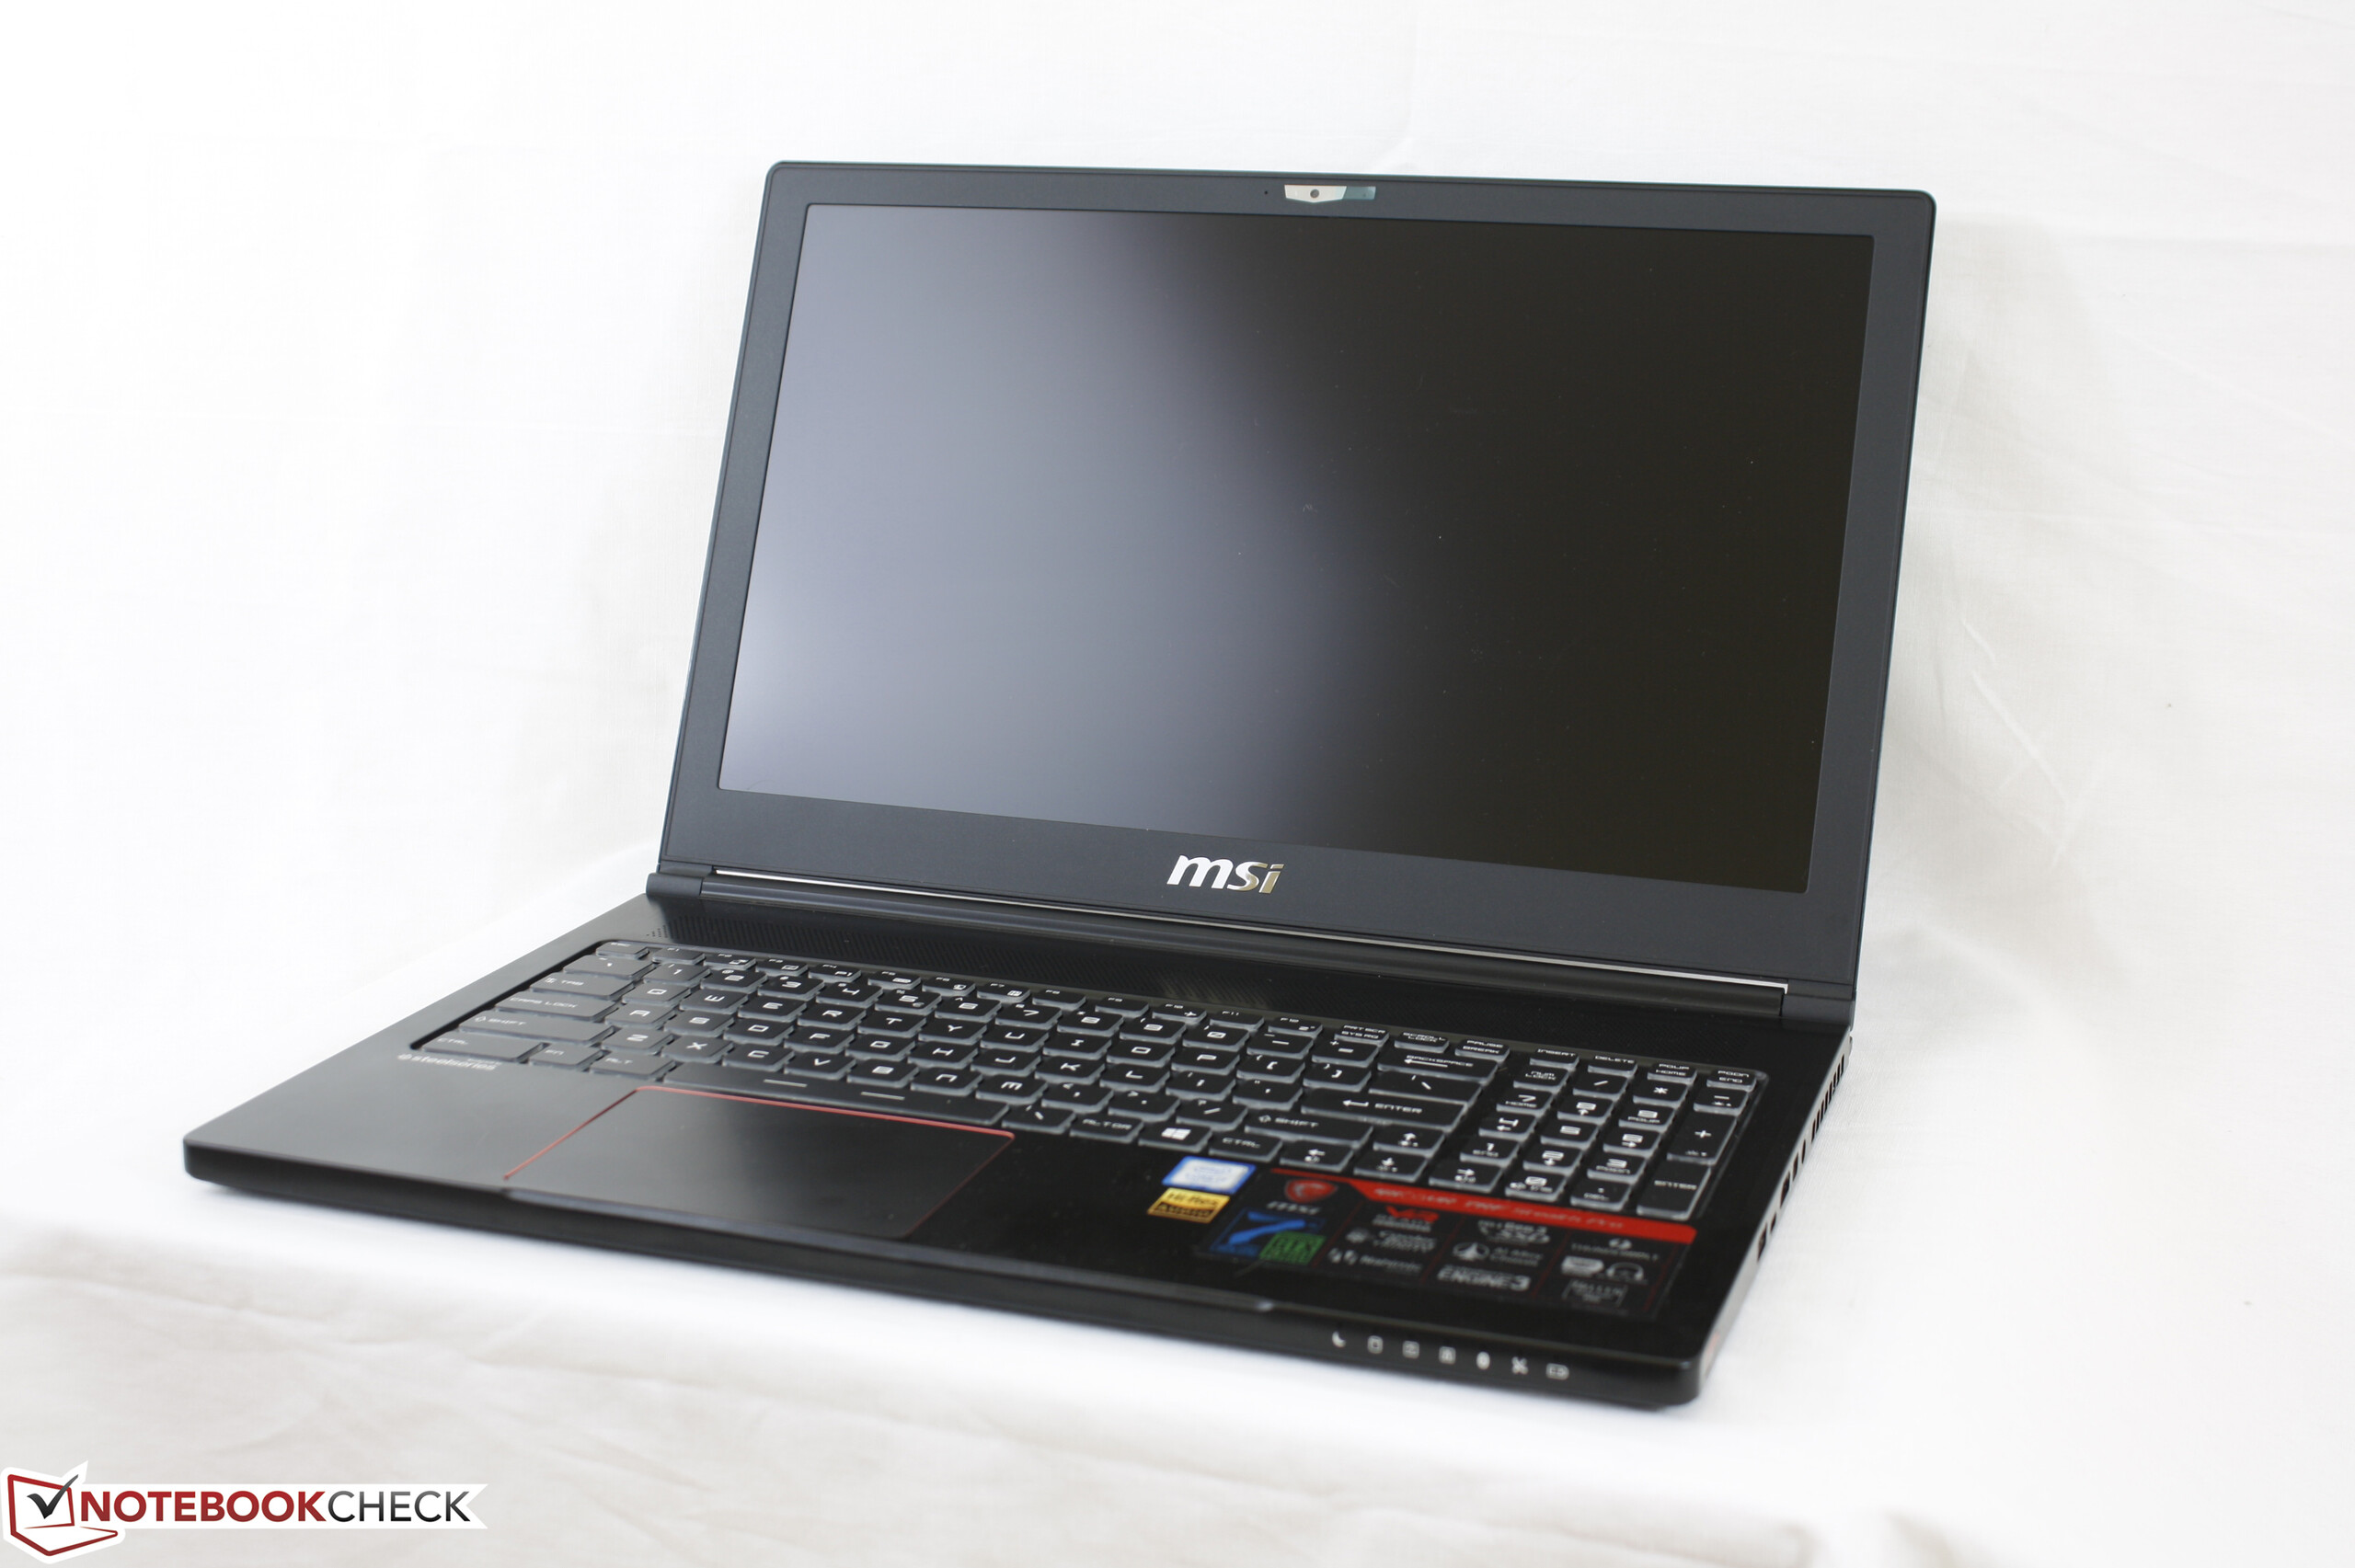
Kısa inceleme: MSI GS63VR 7RF (7700HQ, 4K UHD, GTX 1060) Laptop


| SD Card Reader | |
| average JPG Copy Test (av. of 3 runs) | |
| Dell XPS 15 9560 (i7-7700HQ, UHD) | |
| Asus FX502VM-AS73 | |
| MSI GS63VR 7RF-228US | |
| maximum AS SSD Seq Read Test (1GB) | |
| Dell XPS 15 9560 (i7-7700HQ, UHD) | |
| Asus FX502VM-AS73 | |
| MSI GS63VR 7RF-228US | |
| Networking | |
| iperf3 transmit AX12 | |
| MSI GS63VR 7RF-228US | |
| Dell XPS 15 9560 (i7-7700HQ, UHD) | |
| Asus FX502VM-AS73 | |
| iperf3 receive AX12 | |
| MSI GS63VR 7RF-228US | |
| Dell XPS 15 9560 (i7-7700HQ, UHD) | |
| Asus FX502VM-AS73 | |
| |||||||||||||||||||||||||
Aydınlatma: 92 %
Batarya modunda parlaklık: 274.2 cd/m²
Kontrast: 623:1 (Siyah: 0.44 cd/m²)
ΔE ColorChecker Calman: 8 | ∀{0.5-29.43 Ø4.72}
ΔE Greyscale Calman: 9.1 | ∀{0.09-98 Ø4.97}
72.1% sRGB (Argyll 1.6.3 3D)
45.7% AdobeRGB 1998 (Argyll 1.6.3 3D)
49.81% AdobeRGB 1998 (Argyll 3D)
72.6% sRGB (Argyll 3D)
48.21% Display P3 (Argyll 3D)
Gamma: 2.24
CCT: 5020 K
| MSI GS63VR 7RF-228US IPS, 15.6", 3840x2160 | Dell XPS 15 9560 (i7-7700HQ, UHD) IGZO IPS, 15.6", 3840x2160 | Asus FX502VM-AS73 TN LED, 15.6", 1920x1080 | Alienware 15 R3 HPJGK_B156HTN (AUO51ED), TN, 15.6", 1920x1080 | Apple MacBook Pro 15 2016 (2.9 GHz, 460) Apple APPA030, IPS, 15.4", 2880x1800 | |
|---|---|---|---|---|---|
| Display | 75% | -21% | 32% | 73% | |
| Display P3 Coverage (%) | 48.21 | 89.7 86% | 38.28 -21% | 66 37% | 99 105% |
| sRGB Coverage (%) | 72.6 | 100 38% | 56.9 -22% | 90.5 25% | 100 38% |
| AdobeRGB 1998 Coverage (%) | 49.81 | 100 101% | 39.47 -21% | 66.2 33% | 87.3 75% |
| Response Times | -85% | 2% | 30% | -101% | |
| Response Time Grey 50% / Grey 80% * (ms) | 28 ? | 57.2 ? -104% | 28.4 ? -1% | 25 ? 11% | 46 ? -64% |
| Response Time Black / White * (ms) | 23.6 ? | 39.2 ? -66% | 22.4 ? 5% | 12 ? 49% | 56 ? -137% |
| PWM Frequency (Hz) | 1351 ? | 962 | 119000 ? | ||
| Screen | 39% | -11% | 15% | 56% | |
| Brightness middle (cd/m²) | 274.2 | 370.1 35% | 209.5 -24% | 386 41% | 420 53% |
| Brightness (cd/m²) | 263 | 356 35% | 205 -22% | 382 45% | 401 52% |
| Brightness Distribution (%) | 92 | 87 -5% | 92 0% | 93 1% | 90 -2% |
| Black Level * (cd/m²) | 0.44 | 0.37 16% | 0.69 -57% | 0.39 11% | 0.3 32% |
| Contrast (:1) | 623 | 1000 61% | 304 -51% | 990 59% | 1400 125% |
| Colorchecker dE 2000 * | 8 | 5.3 34% | 4.7 41% | 10.2 -27% | 3.33 58% |
| Colorchecker dE 2000 max. * | 14.6 | 9.9 32% | 19.7 -35% | 15.81 -8% | 5.11 65% |
| Greyscale dE 2000 * | 9.1 | 4.6 49% | 1.8 80% | 11.28 -24% | 2.73 70% |
| Gamma | 2.24 98% | 2.31 95% | 2.23 99% | 2.23 99% | 2.48 89% |
| CCT | 5020 129% | 6284 103% | 6975 93% | 11383 57% | 6457 101% |
| Color Space (Percent of AdobeRGB 1998) (%) | 45.7 | 88.3 93% | 36.2 -21% | 59 29% | 78.09 71% |
| Color Space (Percent of sRGB) (%) | 72.1 | 100 39% | 56.6 -21% | 90 25% | 99.97 39% |
| Toplam Ortalama (Program / Ayarlar) | 10% /
30% | -10% /
-11% | 26% /
20% | 9% /
39% |
* ... daha küçük daha iyidir
Yanıt Sürelerini Görüntüle
| ↔ Tepki Süresi Siyahtan Beyaza | ||
|---|---|---|
| 23.6 ms ... yükseliş ↗ ve sonbahar↘ birleşimi | ↗ 15.2 ms yükseliş | 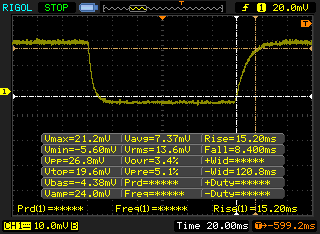 |
| ↘ 8.4 ms sonbahar | ||
| Ekran, testlerimizde iyi yanıt oranları gösteriyor ancak rekabetçi oyuncular için çok yavaş olabilir. Karşılaştırıldığında, test edilen tüm cihazlar 0.1 (minimum) ile 240 (maksimum) ms arasında değişir. » Tüm cihazların 54 %'si daha iyi. Bu, ölçülen yanıt süresinin test edilen tüm cihazların ortalamasından (19.8 ms) daha kötü olduğu anlamına gelir. | ||
| ↔ Tepki Süresi %50 Griden %80 Griye | ||
| 28 ms ... yükseliş ↗ ve sonbahar↘ birleşimi | ↗ 15.6 ms yükseliş | 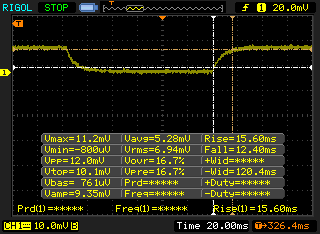 |
| ↘ 12.4 ms sonbahar | ||
| Ekran, testlerimizde nispeten yavaş yanıt oranları gösteriyor ve oyuncular için çok yavaş olabilir. Karşılaştırıldığında, test edilen tüm cihazlar 0.165 (minimum) ile 636 (maksimum) ms arasında değişir. » Tüm cihazların 38 %'si daha iyi. Bu, ölçülen yanıt süresinin test edilen tüm cihazların ortalamasına benzer olduğu anlamına gelir (31 ms). | ||
Ekran Titremesi / PWM (Darbe Genişliği Modülasyonu)
| Ekran titriyor / PWM algılandı | 1351 Hz | ≤ 39 % parlaklık ayarı | 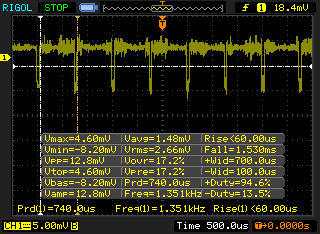 |
Ekran arka ışığı 1351 Hz'de titriyor (en kötü durum, örneğin PWM kullanılması) 39 % ve altındaki parlaklık ayarında titreme algılandı. Bu parlaklık ayarının üzerinde titreme veya PWM olmamalıdır. 1351 Hz frekansı oldukça yüksektir, bu nedenle PWM'ye duyarlı çoğu kullanıcı herhangi bir titremeyi fark etmemelidir. Karşılaştırıldığında: Test edilen tüm cihazların %52 %'si ekranı karartmak için PWM kullanmıyor. PWM tespit edilirse, ortalama 7753 (minimum: 5 - maksimum: 343500) Hz ölçüldü. | |||
| Cinebench R15 | |
| CPU Single 64Bit | |
| i7-7700K Gigabyte Z270-Gaming K3 | |
| MSI GS63VR 7RF-228US | |
| Eurocom Sky X7E2 | |
| Asus Strix GL702VSK | |
| EVGA SC17 GTX 1070 | |
| MSI GP62-2QEi781FD | |
| Asus GL702VM-GC102D | |
| Lenovo IdeaPad Y50 | |
| CPU Multi 64Bit | |
| i7-7700K Gigabyte Z270-Gaming K3 | |
| Eurocom Sky X7E2 | |
| MSI GS63VR 7RF-228US | |
| Asus Strix GL702VSK | |
| EVGA SC17 GTX 1070 | |
| MSI GP62-2QEi781FD | |
| Asus GL702VM-GC102D | |
| Lenovo IdeaPad Y50 | |
| Cinebench R11.5 | |
| CPU Single 64Bit | |
| i7-7700K Gigabyte Z270-Gaming K3 | |
| Asus Strix GL702VSK | |
| MSI GS63VR 7RF-228US | |
| Eurocom Sky X7E2 | |
| EVGA SC17 GTX 1070 | |
| MSI GP62-2QEi781FD | |
| Asus GL702VM-GC102D | |
| Lenovo IdeaPad Y50 | |
| CPU Multi 64Bit | |
| i7-7700K Gigabyte Z270-Gaming K3 | |
| Eurocom Sky X7E2 | |
| MSI GS63VR 7RF-228US | |
| Asus Strix GL702VSK | |
| EVGA SC17 GTX 1070 | |
| MSI GP62-2QEi781FD | |
| Asus GL702VM-GC102D | |
| Lenovo IdeaPad Y50 | |
| Cinebench R10 | |
| Rendering Multiple CPUs 32Bit | |
| i7-7700K Gigabyte Z270-Gaming K3 | |
| Eurocom Sky X7E2 | |
| MSI GS63VR 7RF-228US | |
| Asus Strix GL702VSK | |
| EVGA SC17 GTX 1070 | |
| Asus GL702VM-GC102D | |
| MSI GP62-2QEi781FD | |
| Lenovo IdeaPad Y50 | |
| Rendering Single 32Bit | |
| i7-7700K Gigabyte Z270-Gaming K3 | |
| Eurocom Sky X7E2 | |
| Asus Strix GL702VSK | |
| MSI GS63VR 7RF-228US | |
| EVGA SC17 GTX 1070 | |
| MSI GP62-2QEi781FD | |
| Asus GL702VM-GC102D | |
| Lenovo IdeaPad Y50 | |
| wPrime 2.10 - 1024m | |
| Lenovo IdeaPad Y50 | |
| MSI GS63VR 7RF-228US | |
| Asus Strix GL702VSK | |
| EVGA SC17 GTX 1070 | |
| MSI GP62-2QEi781FD | |
| Eurocom Sky X7E2 | |
| i7-7700K Gigabyte Z270-Gaming K3 | |
| 3DMark | |
| 3840x2160 Fire Strike Ultra Physics | |
| Eurocom Sky X7E2 | |
| EVGA SC17 GTX 1070 | |
| MSI GS63VR 7RF-228US | |
| Asus GL702VM-GC102D | |
| Fire Strike Extreme Physics | |
| Eurocom Sky X7E2 | |
| MSI GP62-2QEi781FD | |
| Asus Strix GL702VSK | |
| EVGA SC17 GTX 1070 | |
| MSI GS63VR 7RF-228US | |
| Asus GL702VM-GC102D | |
| Lenovo IdeaPad Y50 | |
| 1920x1080 Fire Strike Physics | |
| i7-7700K Gigabyte Z270-Gaming K3 | |
| Eurocom Sky X7E2 | |
| MSI GP62-2QEi781FD | |
| Asus Strix GL702VSK | |
| EVGA SC17 GTX 1070 | |
| MSI GS63VR 7RF-228US | |
| Asus GL702VM-GC102D | |
| Lenovo IdeaPad Y50 | |
* ... daha küçük daha iyidir
| PCMark 8 | |
| Home Score Accelerated v2 | |
| Alienware 15 R3 | |
| Asus FX502VM-AS73 | |
| MSI GS63VR 7RF-228US | |
| Gigabyte P55W v7 | |
| Dell XPS 15 9560 (i7-7700HQ, UHD) | |
| Work Score Accelerated v2 | |
| Gigabyte P55W v7 | |
| Alienware 15 R3 | |
| MSI GS63VR 7RF-228US | |
| Dell XPS 15 9560 (i7-7700HQ, UHD) | |
| Asus FX502VM-AS73 | |
| Creative Score Accelerated v2 | |
| Alienware 15 R3 | |
| Asus FX502VM-AS73 | |
| MSI GS63VR 7RF-228US | |
| Dell XPS 15 9560 (i7-7700HQ, UHD) | |
| PCMark 8 Home Score Accelerated v2 | 4141 puan | |
| PCMark 8 Creative Score Accelerated v2 | 5318 puan | |
| PCMark 8 Work Score Accelerated v2 | 5268 puan | |
Yardım | ||
| MSI GS63VR 7RF-228US Samsung SM961 MZVKW512HMJP m.2 PCI-e | Dell XPS 15 9560 (i7-7700HQ, UHD) Lite-On CX2-8B512-Q11 | Asus FX502VM-AS73 SK Hynix HFS256G39TND-N210A | Alienware 15 R3 | Apple MacBook Pro 15 2016 (2.9 GHz, 460) Apple SSD SM1024L | |
|---|---|---|---|---|---|
| CrystalDiskMark 3.0 | -7% | -64% | -26% | -19% | |
| Read Seq (MB/s) | 2141 | 1684 -21% | 503 -77% | 1123 -48% | 1458 -32% |
| Write Seq (MB/s) | 1621 | 1106 -32% | 138.2 -91% | 429.2 -74% | 1440 -11% |
| Read 512 (MB/s) | 499.7 | 977 96% | 343.5 -31% | 833 67% | 914 83% |
| Write 512 (MB/s) | 1531 | 1119 -27% | 137.8 -91% | 428.1 -72% | 1058 -31% |
| Read 4k (MB/s) | 54.2 | 45.14 -17% | 29.36 -46% | 37.8 -30% | 9.786 -82% |
| Write 4k (MB/s) | 158.2 | 134.1 -15% | 70.9 -55% | 122.9 -22% | 10.9 -93% |
| Read 4k QD32 (MB/s) | 632 | 509 -19% | 369.9 -41% | 542 -14% | 679 7% |
| Write 4k QD32 (MB/s) | 527 | 398.1 -24% | 99.7 -81% | 429.8 -18% | 562 7% |

| 3DMark | |
| 1920x1080 Fire Strike Graphics | |
| Asus Strix GL702VSK | |
| Asus Strix GTX 980 Ti Desktop PC | |
| Nvidia GeForce GTX 1060 Founders Edition 6 GB | |
| Asus FX502VM-AS73 | |
| MSI GS63VR 7RF-228US | |
| Razer Blade (2016) FHD | |
| Asus Strix GL502VY-DS71 | |
| Schenker XMG P407 | |
| 3840x2160 Fire Strike Ultra Graphics | |
| Asus Strix GTX 980 Ti Desktop PC | |
| Nvidia GeForce GTX 1060 Founders Edition 6 GB | |
| Asus FX502VM-AS73 | |
| MSI GS63VR 7RF-228US | |
| Razer Blade (2016) FHD | |
| Asus Strix GL502VY-DS71 | |
| Schenker XMG P407 | |
| Fire Strike Extreme Graphics | |
| Asus Strix GL702VSK | |
| Asus Strix GTX 980 Ti Desktop PC | |
| Asus FX502VM-AS73 | |
| MSI GS63VR 7RF-228US | |
| Razer Blade (2016) FHD | |
| Asus Strix GL502VY-DS71 | |
| Schenker XMG P407 | |
| 3DMark 11 | |
| 1280x720 Performance GPU | |
| Asus Strix GTX 980 Ti Desktop PC | |
| Asus Strix GL702VSK | |
| Nvidia GeForce GTX 1060 Founders Edition 6 GB | |
| Asus FX502VM-AS73 | |
| MSI GS63VR 7RF-228US | |
| Razer Blade (2016) FHD | |
| Asus Strix GL502VY-DS71 | |
| Schenker XMG P407 | |
| 1280x720 Performance Combined | |
| Asus Strix GTX 980 Ti Desktop PC | |
| Nvidia GeForce GTX 1060 Founders Edition 6 GB | |
| Asus FX502VM-AS73 | |
| MSI GS63VR 7RF-228US | |
| Asus Strix GL502VY-DS71 | |
| Razer Blade (2016) FHD | |
| Schenker XMG P407 | |
| Asus Strix GL702VSK | |
| 3DMark 11 Performance | 12530 puan | |
| 3DMark Cloud Gate Standard Score | 17664 puan | |
| 3DMark Fire Strike Score | 9485 puan | |
| 3DMark Fire Strike Extreme Score | 5047 puan | |
Yardım | ||
| düşük | orta | yüksek | ultra | 4K | |
|---|---|---|---|---|---|
| BioShock Infinite (2013) | 100.6 | ||||
| Metro: Last Light (2013) | 78.1 | ||||
| Thief (2014) | 74.9 | ||||
| The Witcher 3 (2015) | 76 | 39.4 | 26.3 | ||
| Batman: Arkham Knight (2015) | 58 | 29 | |||
| Metal Gear Solid V (2015) | 60 | 40.8 | |||
| Fallout 4 (2015) | 64 | 26.2 | |||
| Rise of the Tomb Raider (2016) | 64.1 | 25.5 | |||
| Doom (2016) | 92.3 | 30.5 | |||
| Overwatch (2016) | 104.6 | 54.5 | |||
| Mafia 3 (2016) | 43.6 | 13.1 |
| Fallout 4 - 3840x2160 High Preset AA:T AF:16x | |
| Eurocom Tornado F5 Killer Edition | |
| Gigabyte P57X v7 | |
| Nvidia GeForce GTX 1060 Founders Edition 6 GB | |
| MSI GS63VR 7RF-228US | |
| MSI GE72 7RE-046 | |
| Dell XPS 15 9560 (i7-7700HQ, UHD) | |
| The Witcher 3 - 3840x2160 High Graphics & Postprocessing (Nvidia HairWorks Off) | |
| Eurocom Tornado F5 Killer Edition | |
| Nvidia GeForce GTX 1060 Founders Edition 6 GB | |
| MSI GS63VR 7RF-228US | |
| MSI GE72 7RE-046 | |
| Batman: Arkham Knight - 3840x2160 High / On (Interactive Smoke & Paper Debris Off) AA:SM AF:8x | |
| Eurocom Tornado F5 Killer Edition | |
| Gigabyte P57X v7 | |
| Nvidia GeForce GTX 1060 Founders Edition 6 GB | |
| MSI GS63VR 7RF-228US | |
| MSI GE72 7RE-046 | |
| Dell XPS 15 9560 (i7-7700HQ, UHD) | |
| Rise of the Tomb Raider - 3840x2160 High Preset AA:FX AF:4x | |
| Eurocom Tornado F5 Killer Edition | |
| Gigabyte P57X v7 | |
| Nvidia GeForce GTX 1060 Founders Edition 6 GB | |
| Nvidia GeForce GTX 1060 Founders Edition 6 GB | |
| MSI GS63VR 7RF-228US | |
| MSI GE72 7RE-046 | |
| Dell XPS 15 9560 (i7-7700HQ, UHD) | |
| Doom - 3840x2160 High Preset AA:FX | |
| Eurocom Tornado F5 Killer Edition | |
| Nvidia GeForce GTX 1060 Founders Edition 6 GB | |
| MSI GS63VR 7RF-228US | |
| MSI GE72 7RE-046 | |
| Dell XPS 15 9560 (i7-7700HQ, UHD) | |
| Overwatch - 3840x2160 High (Render Scale 100 %) AA:SM AF:4x | |
| Eurocom Tornado F5 Killer Edition | |
| Nvidia GeForce GTX 1060 Founders Edition 6 GB | |
| MSI GS63VR 7RF-228US | |
| MSI GE72 7RE-046 | |
| Dell XPS 15 9560 (i7-7700HQ, UHD) | |
| Mafia 3 - 3840x2160 High Preset | |
| Eurocom Tornado F5 Killer Edition | |
| MSI GS63VR 7RF-228US | |
| MSI GE72 7RE-046 | |
Ses yüksekliği
| Boşta |
| 33.1 / 33.1 / 34 dB |
| Çalışırken |
| 37.2 / 47.1 dB |
 | ||
30 dB sessiz 40 dB(A) duyulabilirlik 50 dB(A) gürültülü |
||
min: | ||
| MSI GS63VR 7RF-228US GeForce GTX 1060 Mobile, i7-7700HQ, Samsung SM961 MZVKW512HMJP m.2 PCI-e | Dell XPS 15 9560 (i7-7700HQ, UHD) GeForce GTX 1050 Mobile, i7-7700HQ, Lite-On CX2-8B512-Q11 | Asus FX502VM-AS73 GeForce GTX 1060 Mobile, i7-7700HQ, SK Hynix HFS256G39TND-N210A | Alienware 15 R3 GeForce GTX 1070 Mobile, i7-7700HQ | Apple MacBook Pro 15 2016 (2.9 GHz, 460) Radeon Pro 460, 6920HQ, Apple SSD SM1024L | MSI GS60 6QE-002US GeForce GTX 970M, 6700HQ, Samsung SM951 MZHPV128 m.2 PCI-e | |
|---|---|---|---|---|---|---|
| Noise | -1% | -2% | -10% | 6% | -5% | |
| kapalı / ortam * (dB) | 28.8 | 28.4 1% | 28.7 -0% | 30 -4% | 29 -1% | |
| Idle Minimum * (dB) | 33.1 | 29 12% | 30.6 8% | 31 6% | 30.3 8% | 35.2 -6% |
| Idle Average * (dB) | 33.1 | 29 12% | 30.6 8% | 32 3% | 30.3 8% | 35.3 -7% |
| Idle Maximum * (dB) | 34 | 32.2 5% | 31 9% | 42 -24% | 30.3 11% | 35.5 -4% |
| Load Average * (dB) | 37.2 | 47.1 -27% | 46.2 -24% | 49 -32% | 35.1 6% | 40.4 -9% |
| Witcher 3 ultra * (dB) | 46.1 | 52 -13% | ||||
| Load Maximum * (dB) | 47.1 | 47.1 -0% | 52.3 -11% | 50 -6% | 46 2% | 47.2 -0% |
* ... daha küçük daha iyidir
(±) The Witcher 3 oynarken, üst tarafın ortalama sıcaklığı 35.1 °C / 95 F olup, cihazın 33.9 °C / 93 F.
(+) Avuç içi dayanakları ve dokunmatik yüzey maksimum (32.4 °C / 90.3 F) cilt sıcaklığına ulaşıyor ve bu nedenle sıcak değil.
(-) Benzer cihazların avuç içi dayanağı alanının ortalama sıcaklığı 28.8 °C / 83.8 F (-3.6 °C / -6.5 F) idi.
MSI GS63VR 7RF-228US ses analizi
(±) | hoparlör ses yüksekliği ortalama ama iyi (75 dB)
Bas 100 - 315Hz
(-) | neredeyse hiç bas yok - ortalama olarak medyandan 25.3% daha düşük
(±) | Bas doğrusallığı ortalamadır (12.4% delta - önceki frekans)
Ortalar 400 - 2000 Hz
(+) | dengeli ortalar - medyandan yalnızca 3.3% uzakta
(±) | Ortaların doğrusallığı ortalamadır (7% delta - önceki frekans)
Yüksekler 2 - 16 kHz
(±) | daha yüksek en yüksekler - ortalama olarak medyandan 8.1% daha yüksek
(±) | Yükseklerin doğrusallığı ortalamadır (8.6% delta - önceki frekans)
Toplam 100 - 16.000 Hz
(±) | Genel sesin doğrusallığı ortalamadır (28.4% ortancaya göre fark)
Aynı sınıfla karşılaştırıldığında
» Bu sınıftaki tüm test edilen cihazların %94%'si daha iyi, 1% benzer, 4% daha kötüydü
» En iyisinin deltası 6% idi, ortalama 18% idi, en kötüsü 132% idi
Test edilen tüm cihazlarla karşılaştırıldığında
» Test edilen tüm cihazların %86'si daha iyi, 3 benzer, % 12 daha kötüydü
» En iyisinin deltası 4% idi, ortalama 23% idi, en kötüsü 134% idi
Apple MacBook 12 (Early 2016) 1.1 GHz ses analizi
(+) | hoparlörler nispeten yüksek sesle çalabilir (83.6 dB)
Bas 100 - 315Hz
(±) | azaltılmış bas - ortalama olarak medyandan 11.3% daha düşük
(±) | Bas doğrusallığı ortalamadır (14.2% delta - önceki frekans)
Ortalar 400 - 2000 Hz
(+) | dengeli ortalar - medyandan yalnızca 2.4% uzakta
(+) | orta frekanslar doğrusaldır (5.5% deltadan önceki frekansa)
Yüksekler 2 - 16 kHz
(+) | dengeli yüksekler - medyandan yalnızca 2% uzakta
(+) | yüksekler doğrusaldır (4.5% deltadan önceki frekansa)
Toplam 100 - 16.000 Hz
(+) | genel ses doğrusaldır (10.2% ortancaya göre fark)
Aynı sınıfla karşılaştırıldığında
» Bu sınıftaki tüm test edilen cihazların %7%'si daha iyi, 2% benzer, 91% daha kötüydü
» En iyisinin deltası 5% idi, ortalama 18% idi, en kötüsü 53% idi
Test edilen tüm cihazlarla karşılaştırıldığında
» Test edilen tüm cihazların %5'si daha iyi, 1 benzer, % 94 daha kötüydü
» En iyisinin deltası 4% idi, ortalama 23% idi, en kötüsü 134% idi
| Kapalı / Bekleme modu | |
| Boşta | |
| Çalışırken |
|
Key:
min: | |
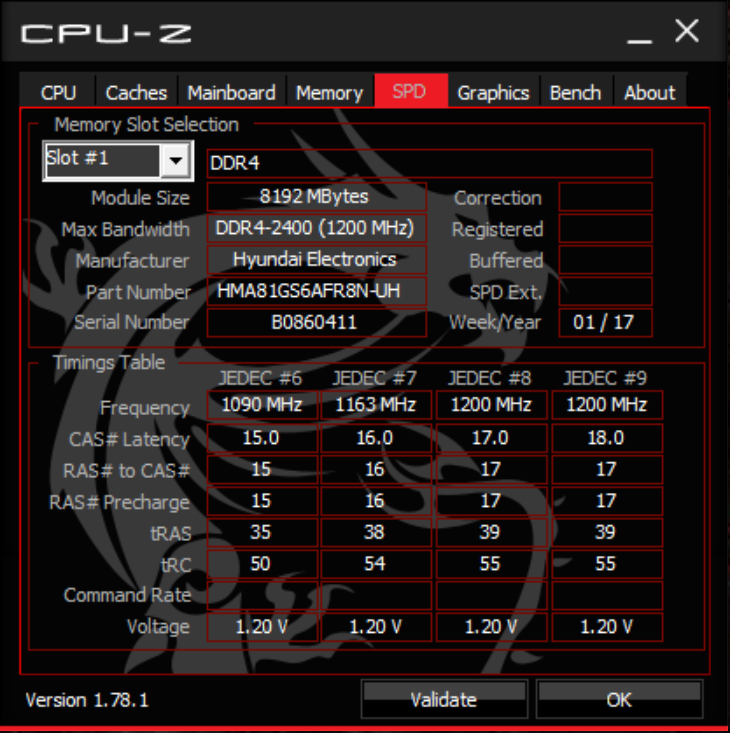
| MSI GS63VR 7RF-228US i7-7700HQ, GeForce GTX 1060 Mobile, Samsung SM961 MZVKW512HMJP m.2 PCI-e, IPS, 3840x2160, 15.6" | Dell XPS 15 9560 (i7-7700HQ, UHD) i7-7700HQ, GeForce GTX 1050 Mobile, Lite-On CX2-8B512-Q11, IGZO IPS, 3840x2160, 15.6" | Asus FX502VM-AS73 i7-7700HQ, GeForce GTX 1060 Mobile, SK Hynix HFS256G39TND-N210A, TN LED, 1920x1080, 15.6" | Alienware 15 R3 i7-7700HQ, GeForce GTX 1070 Mobile, , TN, 1920x1080, 15.6" | Gigabyte P55W v7 i7-7700HQ, GeForce GTX 1060 Mobile, Liteonit CV3-8D256, IPS, 1920x1080, 15.6" | MSI GS63VR-6RF16H22 Stealth Pro 6700HQ, GeForce GTX 1060 Mobile, Samsung SM951 MZVPV256HDGL m.2 PCI-e, IPS, 1920x1080, 15.6" | |
|---|---|---|---|---|---|---|
| Power Consumption | 7% | 2% | -31% | 21% | -27% | |
| Idle Minimum * (Watt) | 14.5 | 11.9 18% | 14.9 -3% | 19 -31% | 8 45% | 18 -24% |
| Idle Average * (Watt) | 17.3 | 17.1 1% | 15.1 13% | 23 -33% | 13 25% | 22 -27% |
| Idle Maximum * (Watt) | 17.4 | 17.3 1% | 15.2 13% | 29 -67% | 18 -3% | 30 -72% |
| Load Average * (Watt) | 93 | 94.7 -2% | 105.8 -14% | 85 9% | 76 18% | 77 17% |
| Witcher 3 ultra * (Watt) | 128.8 | 104.8 19% | ||||
| Load Maximum * (Watt) | 122 | 148.8 | 192 | 143 | 165 |
* ... daha küçük daha iyidir
| MSI GS63VR 7RF-228US i7-7700HQ, GeForce GTX 1060 Mobile, 65 Wh | Dell XPS 15 9560 (i7-7700HQ, UHD) i7-7700HQ, GeForce GTX 1050 Mobile, 97 Wh | Asus FX502VM-AS73 i7-7700HQ, GeForce GTX 1060 Mobile, 64 Wh | Alienware 15 R3 i7-7700HQ, GeForce GTX 1070 Mobile, 99 Wh | Apple MacBook Pro 15 2016 (2.9 GHz, 460) 6920HQ, Radeon Pro 460, 76 Wh | |
|---|---|---|---|---|---|
| Pil Çalışma Süresi | 78% | -1% | 15% | 67% | |
| Reader / Idle (h) | 6.4 | 13.9 117% | 6.1 -5% | 6.4 0% | |
| WiFi v1.3 (h) | 3.9 | 7.2 85% | 4.6 18% | 4.4 13% | 10.3 164% |
| Load (h) | 1.3 | 1.7 31% | 1.1 -15% | 1.7 31% | 0.9 -31% |
Artılar
Eksiler

Orjinal GS60 zamanının ötesindeydi. Süper ince kasa ve 4K UHD seçenekleri Broadwell ve Maxwell işlemciler ile desteklenememişti. Ancak artık Intel ve Nvidia donanım olarak MSI'ın bu vizyonunu destekleyebiliyor. Karşımızda MacBook 15 Pro kadar ince bir oyun / iş cihazı görmek artık mümkün.
Cihazın eksiklikleri farkedilir ve çeşitlilik gösteriyor. Evet cihaz rakiplerinin önünde ancak fan sesi rahatsız edici olabilir. Batarya ömrü, ses kalitesi ve parlaklık daha iyi olabilirmiş. Bunun dışında işlemcinin maksimum saat hızını koruyamaması, grafik kartının daha büyük cihazlara göre daha fazla ısınması gibi durumlar söz konusu.
The base 1080p SKU is an easier recommendation over the 4K UHD option. Unless if gaming at native 4K UHD on low-medium settings with no G-Sync sounds appealing, the GTX 1060 still pairs best with a 1080p display. Furthermore, the 1080p panel offers higher contrast and wider colors than the 4K UHD panel for a cheaper price, so 4K UHD users are essentially giving up display quality for those denser pixels.
1080p modelini 4K modele göre önermek daha kolay. GTX 1060, 1080p ile daha iyi sonuç veriyor. GS63VR, GS60 modeline göre biraz daha sessiz ve performans yönünden büyük bir ilerleme kaydediyor. Ancak ekran, batarya ömrü ve kasa yönünden çok büyük bir değişiklik yok.
MSI GS63VR 7RF-228US
- 03/24/2017 v6 (old)
Allen Ngo
Price comparison
