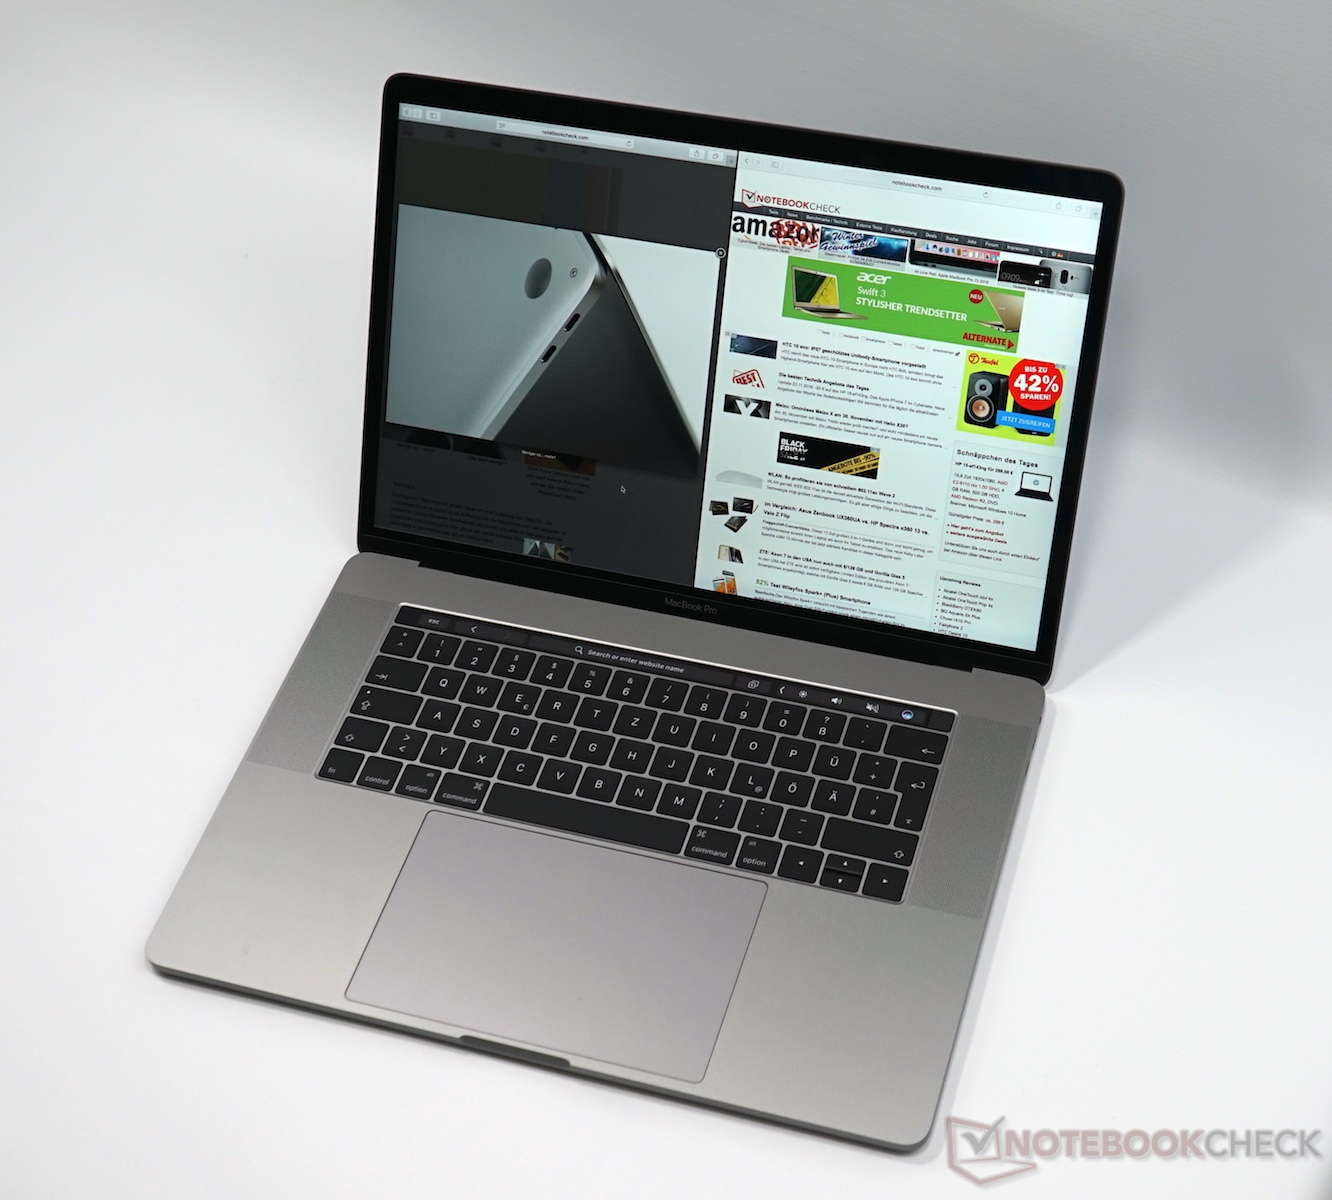
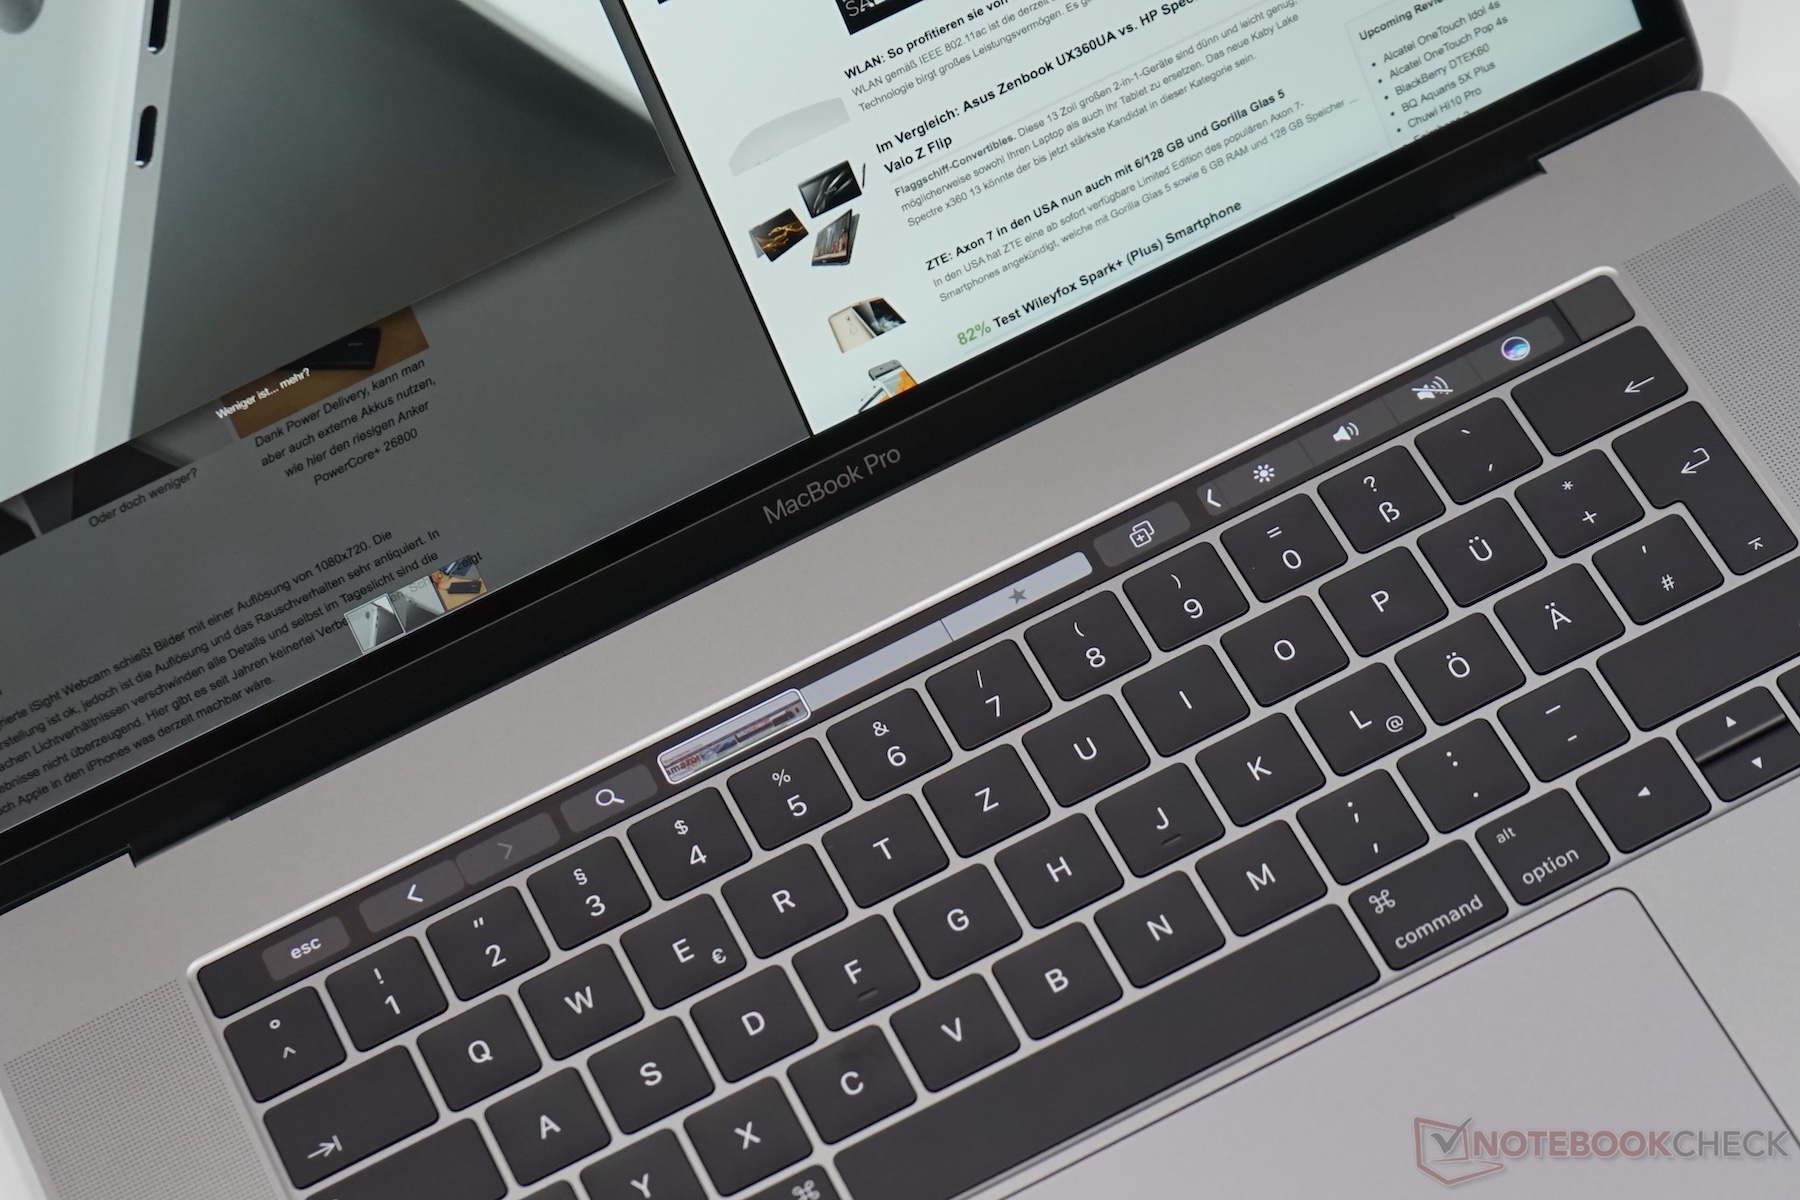
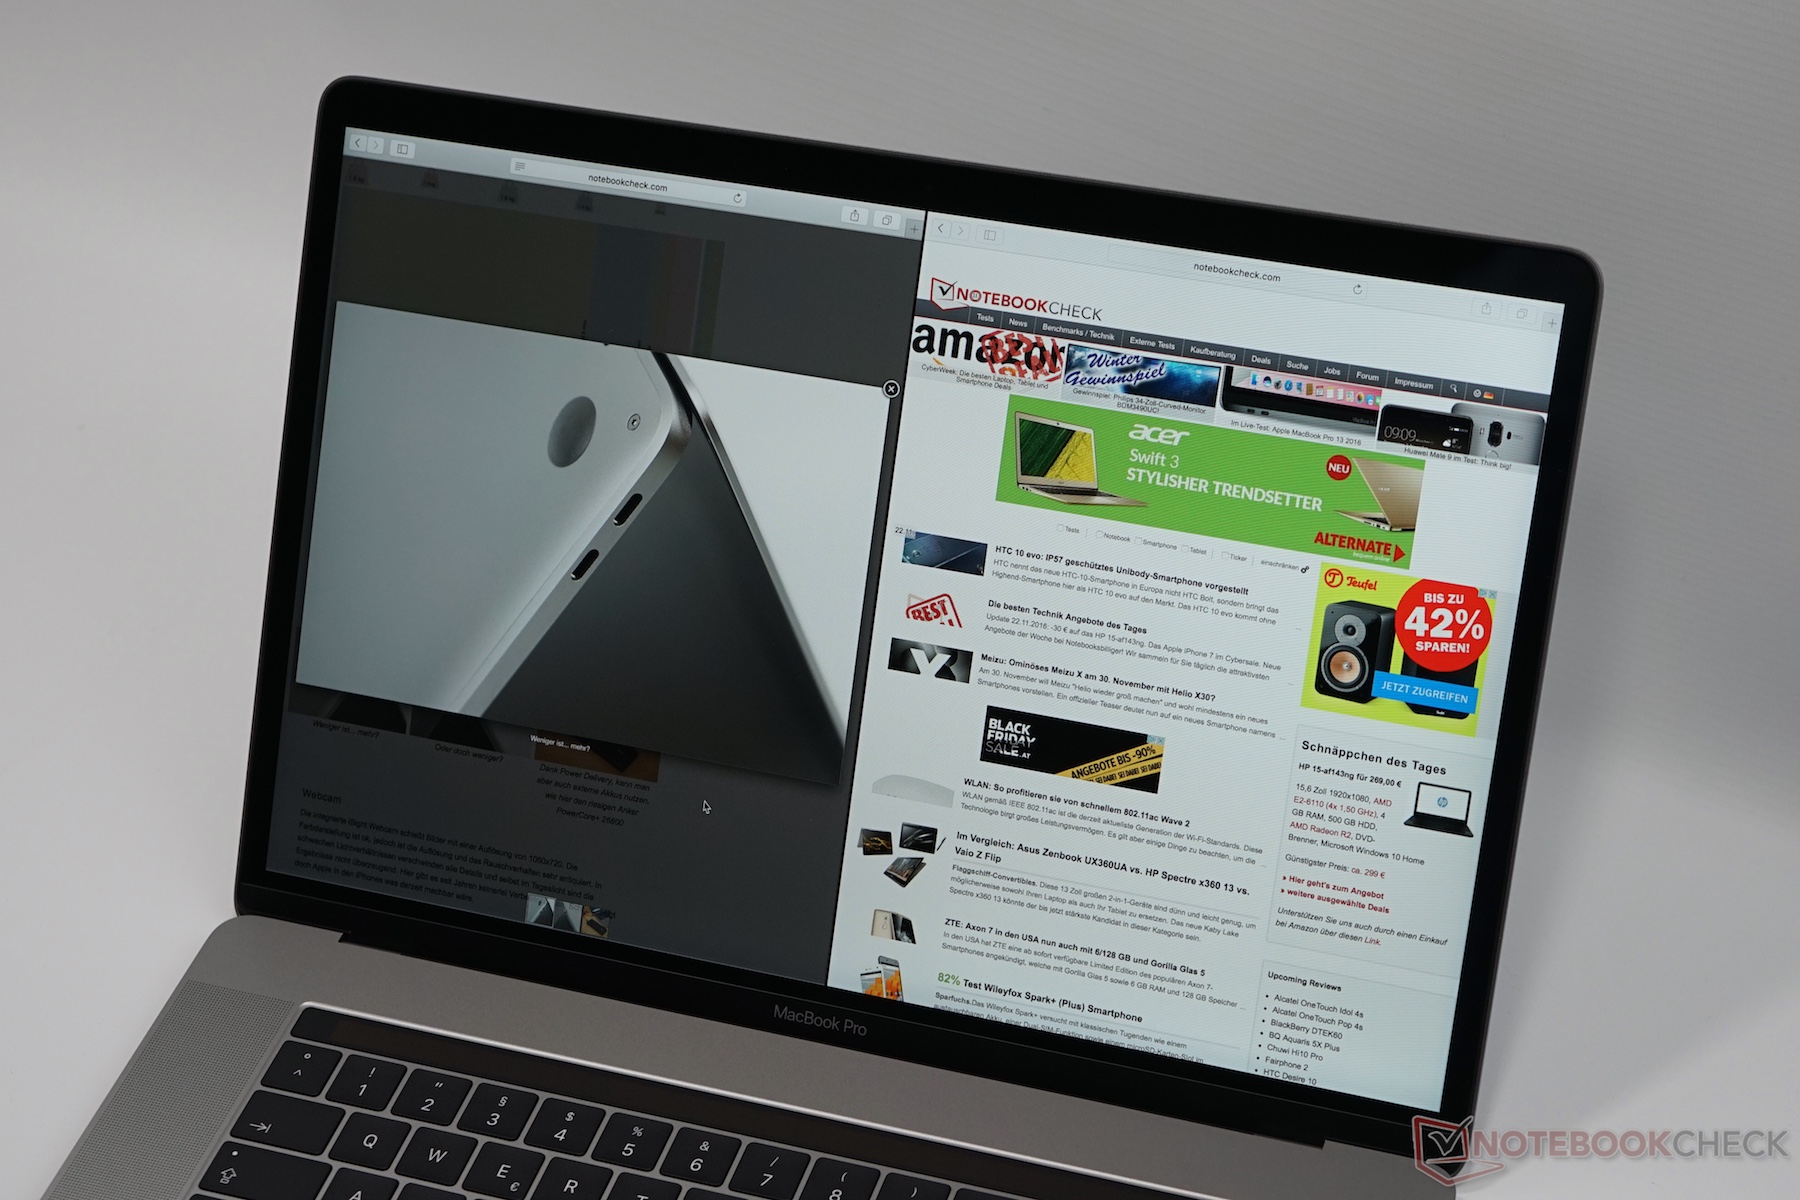
Kısa inceleme: Apple MacBook Pro 15 (Late 2016, 2.6 GHz i7) Notebook


| Networking | |
| iperf3 transmit AX12 | |
| Apple MacBook Pro 15 2016 (2.6 GHz, 450) (Klaus I211) | |
| Apple MacBook Pro Retina 13 inch 2013-10 (Klaus I211) | |
| Apple MacBook Pro 13 2016 (Klaus I211) | |
| Acer Spin 7 SP714-51-M09D (jseb) | |
| Dell XPS 13 9360 QHD+ i7 | |
| Lenovo ThinkPad T460s-20FA003GGE | |
| iperf3 receive AX12 | |
| Apple MacBook Pro 15 2016 (2.6 GHz, 450) (Klaus I211) | |
| Apple MacBook Pro Retina 13 inch 2013-10 (Klaus I211) | |
| Apple MacBook Pro 13 2016 (Klaus I211) | |
| Dell XPS 13 9360 QHD+ i7 | |
| Lenovo ThinkPad T460s-20FA003GGE | |
| Acer Spin 7 SP714-51-M09D (jseb) | |
| |||||||||||||||||||||||||
Aydınlatma: 92 %
Batarya modunda parlaklık: 483 cd/m²
Kontrast: 1464:1 (Siyah: 0.33 cd/m²)
ΔE ColorChecker Calman: 1.4 | ∀{0.5-29.43 Ø4.73}
ΔE Greyscale Calman: 1.5 | ∀{0.09-98 Ø4.97}
Gamma: 2.34
CCT: 6650 K
| Apple MacBook Pro 15 2016 (2.6 GHz, 450) 2880x1800, 15.4" | Apple MacBook Pro 13 2016 APPA034, , 2560x1600, 13.3" | Apple MacBook Pro Retina 15 inch 2015-05 APPA02E, , 2880x1800, 15.4" | Dell XPS 15 9550 i7 FHD 1920x1080, 15.6" | Asus Zenbook UX510UW-CN044T LG Philips LP156WF6-SPB6, , 1920x1080, 15.6" | |
|---|---|---|---|---|---|
| Display | |||||
| Display P3 Coverage (%) | 97.1 | 61.4 | 68.5 | 61.5 | |
| sRGB Coverage (%) | 99.8 | 90.8 | 97.2 | 80.4 | |
| AdobeRGB 1998 Coverage (%) | 86.7 | 62.9 | 70.4 | 58.8 | |
| Response Times | -33% | -48% | 16% | ||
| Response Time Grey 50% / Grey 80% * (ms) | 47.3 ? | 47.2 ? -0% | 64 ? -35% | 40 ? 15% | |
| Response Time Black / White * (ms) | 31.2 ? | 51.6 ? -65% | 50 ? -60% | 26 ? 17% | |
| PWM Frequency (Hz) | 117000 ? | ||||
| Screen | -12% | -24% | -119% | -114% | |
| Brightness middle (cd/m²) | 483 | 600 24% | 341 -29% | 371.5 -23% | 326 -33% |
| Brightness (cd/m²) | 465 | 564 21% | 315 -32% | 356 -23% | 316 -32% |
| Brightness Distribution (%) | 92 | 89 -3% | 82 -11% | 92 0% | 80 -13% |
| Black Level * (cd/m²) | 0.33 | 0.57 -73% | 0.34 -3% | 0.252 24% | 0.35 -6% |
| Contrast (:1) | 1464 | 1053 -28% | 1003 -31% | 1474 1% | 931 -36% |
| Colorchecker dE 2000 * | 1.4 | 1.5 -7% | 2.07 -48% | 5.55 -296% | 5.49 -292% |
| Colorchecker dE 2000 max. * | 3 | 2.9 3% | 3.27 -9% | 10.95 -265% | 11.36 -279% |
| Greyscale dE 2000 * | 1.5 | 2 -33% | 1.9 -27% | 7.1 -373% | 4.84 -223% |
| Gamma | 2.34 94% | 2.27 97% | 2.62 84% | 2.1 105% | 2.23 99% |
| CCT | 6650 98% | 6855 95% | 6514 100% | 5971 109% | |
| Color Space (Percent of AdobeRGB 1998) (%) | 77 | 58 | 63.4 | 53 | |
| Color Space (Percent of sRGB) (%) | 92 | 91 | 97.9 | 80 | |
| Toplam Ortalama (Program / Ayarlar) | -23% /
-16% | -24% /
-24% | -84% /
-105% | -49% /
-88% |
* ... daha küçük daha iyidir
Yanıt Sürelerini Görüntüle
| ↔ Tepki Süresi Siyahtan Beyaza | ||
|---|---|---|
| 31.2 ms ... yükseliş ↗ ve sonbahar↘ birleşimi | ↗ 16.7 ms yükseliş | 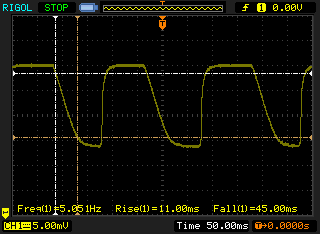 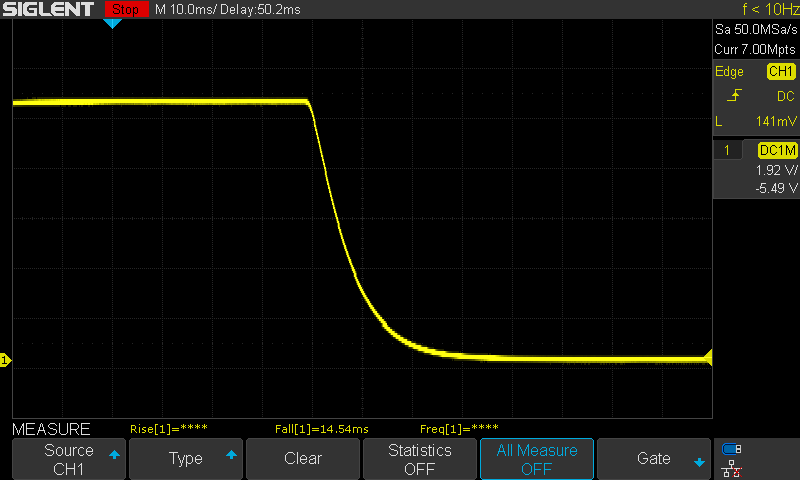 |
| ↘ 14.5 ms sonbahar | ||
| Ekran, testlerimizde yavaş yanıt oranları gösteriyor ve oyuncular için yetersiz olacaktır. Karşılaştırıldığında, test edilen tüm cihazlar 0.1 (minimum) ile 240 (maksimum) ms arasında değişir. » Tüm cihazların 84 %'si daha iyi. Bu, ölçülen yanıt süresinin test edilen tüm cihazların ortalamasından (19.9 ms) daha kötü olduğu anlamına gelir. | ||
| ↔ Tepki Süresi %50 Griden %80 Griye | ||
| 47.3 ms ... yükseliş ↗ ve sonbahar↘ birleşimi | ↗ 22.1 ms yükseliş | 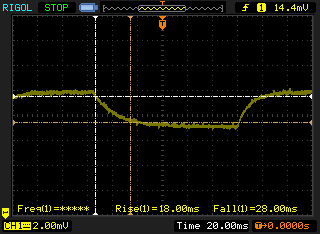 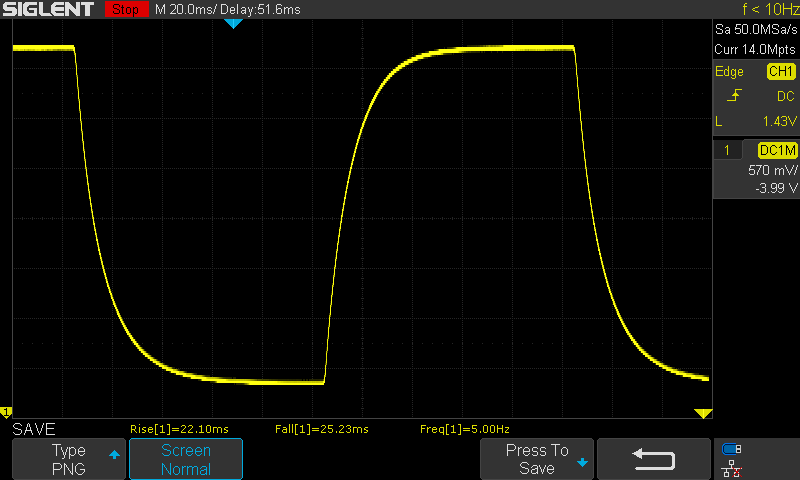 |
| ↘ 25.2 ms sonbahar | ||
| Ekran, testlerimizde yavaş yanıt oranları gösteriyor ve oyuncular için yetersiz olacaktır. Karşılaştırıldığında, test edilen tüm cihazlar 0.165 (minimum) ile 636 (maksimum) ms arasında değişir. » Tüm cihazların 82 %'si daha iyi. Bu, ölçülen yanıt süresinin test edilen tüm cihazların ortalamasından (31.1 ms) daha kötü olduğu anlamına gelir. | ||
Ekran Titremesi / PWM (Darbe Genişliği Modülasyonu)
| Ekran titriyor / PWM algılandı | 117000 Hz | ≤ 80 % parlaklık ayarı | 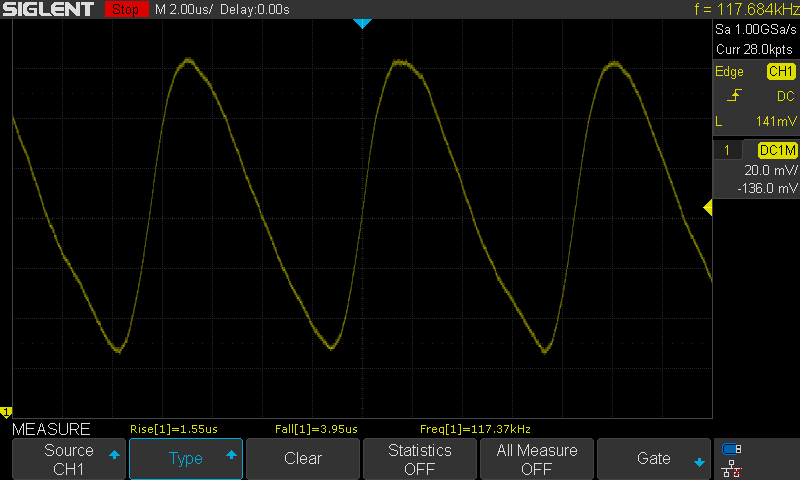 |
| ≤ 200 cd/m² parlaklık | |||
Ekran arka ışığı 117000 Hz'de titriyor (en kötü durum, örneğin PWM kullanılması) 80 % (200 cd/m²) ve altındaki parlaklık ayarında titreme algılandı. Bu parlaklık ayarının üzerinde titreme veya PWM olmamalıdır. 117000 Hz frekansı oldukça yüksektir, bu nedenle PWM'ye duyarlı çoğu kullanıcı herhangi bir titremeyi fark etmemelidir. Titreşim, yüksek parlaklık ayarında bile meydana gelir ve günlük kullanım sırasında kullanıcıyı etkileyebilir. Karşılaştırıldığında: Test edilen tüm cihazların %52 %'si ekranı karartmak için PWM kullanmıyor. PWM tespit edilirse, ortalama 7798 (minimum: 5 - maksimum: 343500) Hz ölçüldü. | |||
| Cinebench R15 | |
| CPU Single 64Bit | |
| Dell XPS 15 9550 i7 FHD | |
| Apple MacBook Pro Retina 15 inch 2015-05 | |
| Apple MacBook Pro Retina 15 inch 2015-05 | |
| Apple MacBook Pro 15 2016 (2.6 GHz, 450) | |
| Asus Zenbook UX510UW-CN044T | |
| Apple MacBook Pro 13 2016 | |
| Apple MacBook Pro 13 2016 | |
| CPU Multi 64Bit | |
| Dell XPS 15 9550 i7 FHD | |
| Apple MacBook Pro 15 2016 (2.6 GHz, 450) | |
| Apple MacBook Pro Retina 15 inch 2015-05 | |
| Apple MacBook Pro Retina 15 inch 2015-05 | |
| Asus Zenbook UX510UW-CN044T | |
| Apple MacBook Pro 13 2016 | |
| Apple MacBook Pro 13 2016 | |
| PCMark 8 Home Score Accelerated v2 | 3637 puan | |
| PCMark 8 Work Score Accelerated v2 | 4426 puan | |
Yardım | ||
| 3DMark 11 - 1280x720 Performance | |
| HP Omen 15-ax007ng | |
| Apple MacBook Pro 15 2016 (2.9 GHz, 460) | |
| Apple MacBook Pro 15 2016 (2.6 GHz, 450) | |
| Asus Zenbook UX510UW-CN044T | |
| Asus N552VX-FY103T | |
| Apple MacBook Pro Retina 15 inch 2015-05 | |
| Apple MacBook Pro 13 2016 | |
| 3DMark - 1920x1080 Fire Strike Score | |
| HP Omen 15-ax007ng | |
| Apple MacBook Pro 15 2016 (2.9 GHz, 460) | |
| Dell XPS 15 9550 i7 FHD | |
| Asus Zenbook UX510UW-CN044T | |
| Apple MacBook Pro 15 2016 (2.6 GHz, 450) | |
| Asus N552VX-FY103T | |
| Apple MacBook Pro Retina 15 inch 2015-05 | |
| Apple MacBook Pro 13 2016 | |
| Unigine Valley 1.0 - 1920x1080 Extreme HD Preset OpenGL AA:x8 | |
| Apple MacBook Pro 15 2016 (2.9 GHz, 460) | |
| Apple MacBook Pro 15 2016 (2.9 GHz, 460) | |
| Apple MacBook Pro 15 2016 (2.6 GHz, 450) | |
| Apple MacBook Pro 13 2016 | |
| 3DMark 06 Standard Score | 24189 puan | |
| 3DMark Vantage P Result | 14245 puan | |
| 3DMark 11 Performance | 4914 puan | |
| 3DMark Cloud Gate Standard Score | 14305 puan | |
| 3DMark Fire Strike Score | 3027 puan | |
| 3DMark Fire Strike Extreme Score | 1440 puan | |
| 3DMark Time Spy Score | 1074 puan | |
Yardım | ||
| Fallout 4 | |
| 1280x720 Low Preset AA:FX | |
| Apple MacBook Pro 15 2016 (2.6 GHz, 450) | |
| Apple MacBook Pro 13 2016 | |
| Acer Spin 7 SP714-51-M09D | |
| Apple MacBook 12 (Early 2016) 1.1 GHz | |
| 1920x1080 High Preset AA:T AF:16x | |
| Dell XPS 15 9550 i7 FHD | |
| Apple MacBook Pro 15 2016 (2.6 GHz, 450) | |
| XCOM 2 - 1920x1080 Medium Preset AA:FX AF:2x | |
| Apple MacBook Pro 15 2016 (2.6 GHz, 450) | |
| Deus Ex Mankind Divided | |
| 1280x720 Low Preset AF:1x | |
| Apple MacBook Pro 15 2016 (2.6 GHz, 450) | |
| Asus Zenbook UX510UW-CN044T | |
| Acer Aspire E5-575G-549D | |
| Apple MacBook Pro 13 2016 | |
| Apple MacBook Pro 13 2016 | |
| Acer Spin 7 SP714-51-M09D | |
| 1920x1080 High Preset AF:4x | |
| Apple MacBook Pro 15 2016 (2.6 GHz, 450) | |
| Apple MacBook Pro 15 2016 (2.6 GHz, 450) | |
| Asus Zenbook UX510UW-CN044T | |
| Acer Aspire E5-575G-549D | |
| düşük | orta | yüksek | ultra | 4K | |
|---|---|---|---|---|---|
| The Witcher 3 (2015) | 40.9 | 20.3 | |||
| Dota 2 Reborn (2015) | 67.2 | ||||
| World of Warships (2015) | 44.6 | ||||
| Anno 2205 (2015) | 87 | 18.3 | |||
| Fallout 4 (2015) | 70 | 24.1 | |||
| Rainbow Six Siege (2015) | 39.6 | 34.1 | |||
| Rise of the Tomb Raider (2016) | 66.6 | 20.7 | |||
| XCOM 2 (2016) | 63.7 | 24.2 | 15.5 | 5.6 | |
| Far Cry Primal (2016) | 29 | 26 | 17 | ||
| The Division (2016) | 77 | 21.6 | 15.8 | ||
| Doom (2016) | 53.4 | 20.4 | |||
| Overwatch (2016) | 153 | 57 | 39.5 | ||
| Deus Ex Mankind Divided (2016) | 51.2 | 18.3 | 7.5 | ||
| Mafia 3 (2016) | 28.3 | ||||
| Battlefield 1 (2016) | 101 | 24.2 | 21.7 | ||
| Civilization 6 (2016) | 61 | 25.8 | |||
| Farming Simulator 17 (2016) | 63.4 | 24.7 | |||
| Call of Duty Infinite Warfare (2016) | 58.7 | 36 | |||
| Dishonored 2 (2016) | 29.5 | ||||
| Watch Dogs 2 (2016) | 47.4 | 17.6 | |||
| For Honor (2017) | 82.3 | 29.3 | 27.9 | 19.4 | |
| Ghost Recon Wildlands (2017) | 48.2 | 21.3 | 18.5 | 8 | |
| Mass Effect Andromeda (2017) | 68.2 | 26.5 | 16.4 | ||
| Rocket League (2017) | 47.5 | 19.3 | |||
| Playerunknown's Battlegrounds (PUBG) (2017) | 63.3 | ||||
| F1 2017 (2017) | 95 | 41 | 33 | ||
| Ark Survival Evolved (2017) | 38.9 | 12 |
(±) Üst taraftaki maksimum sıcaklık, 36.8 °C / 98 F ortalamasına kıyasla 43 °C / 109 F'dir. , Multimedia sınıfı için 21 ile 71 °C arasında değişir.
(±) Alt kısım, 39.1 °C / 102 F ortalamasına kıyasla maksimum 40 °C / 104 F'ye kadar ısınır
(+) Boşta kullanımda, üst tarafın ortalama sıcaklığı 24.8 °C / 77 F olup, cihazın 31.3 °C / 88 F.
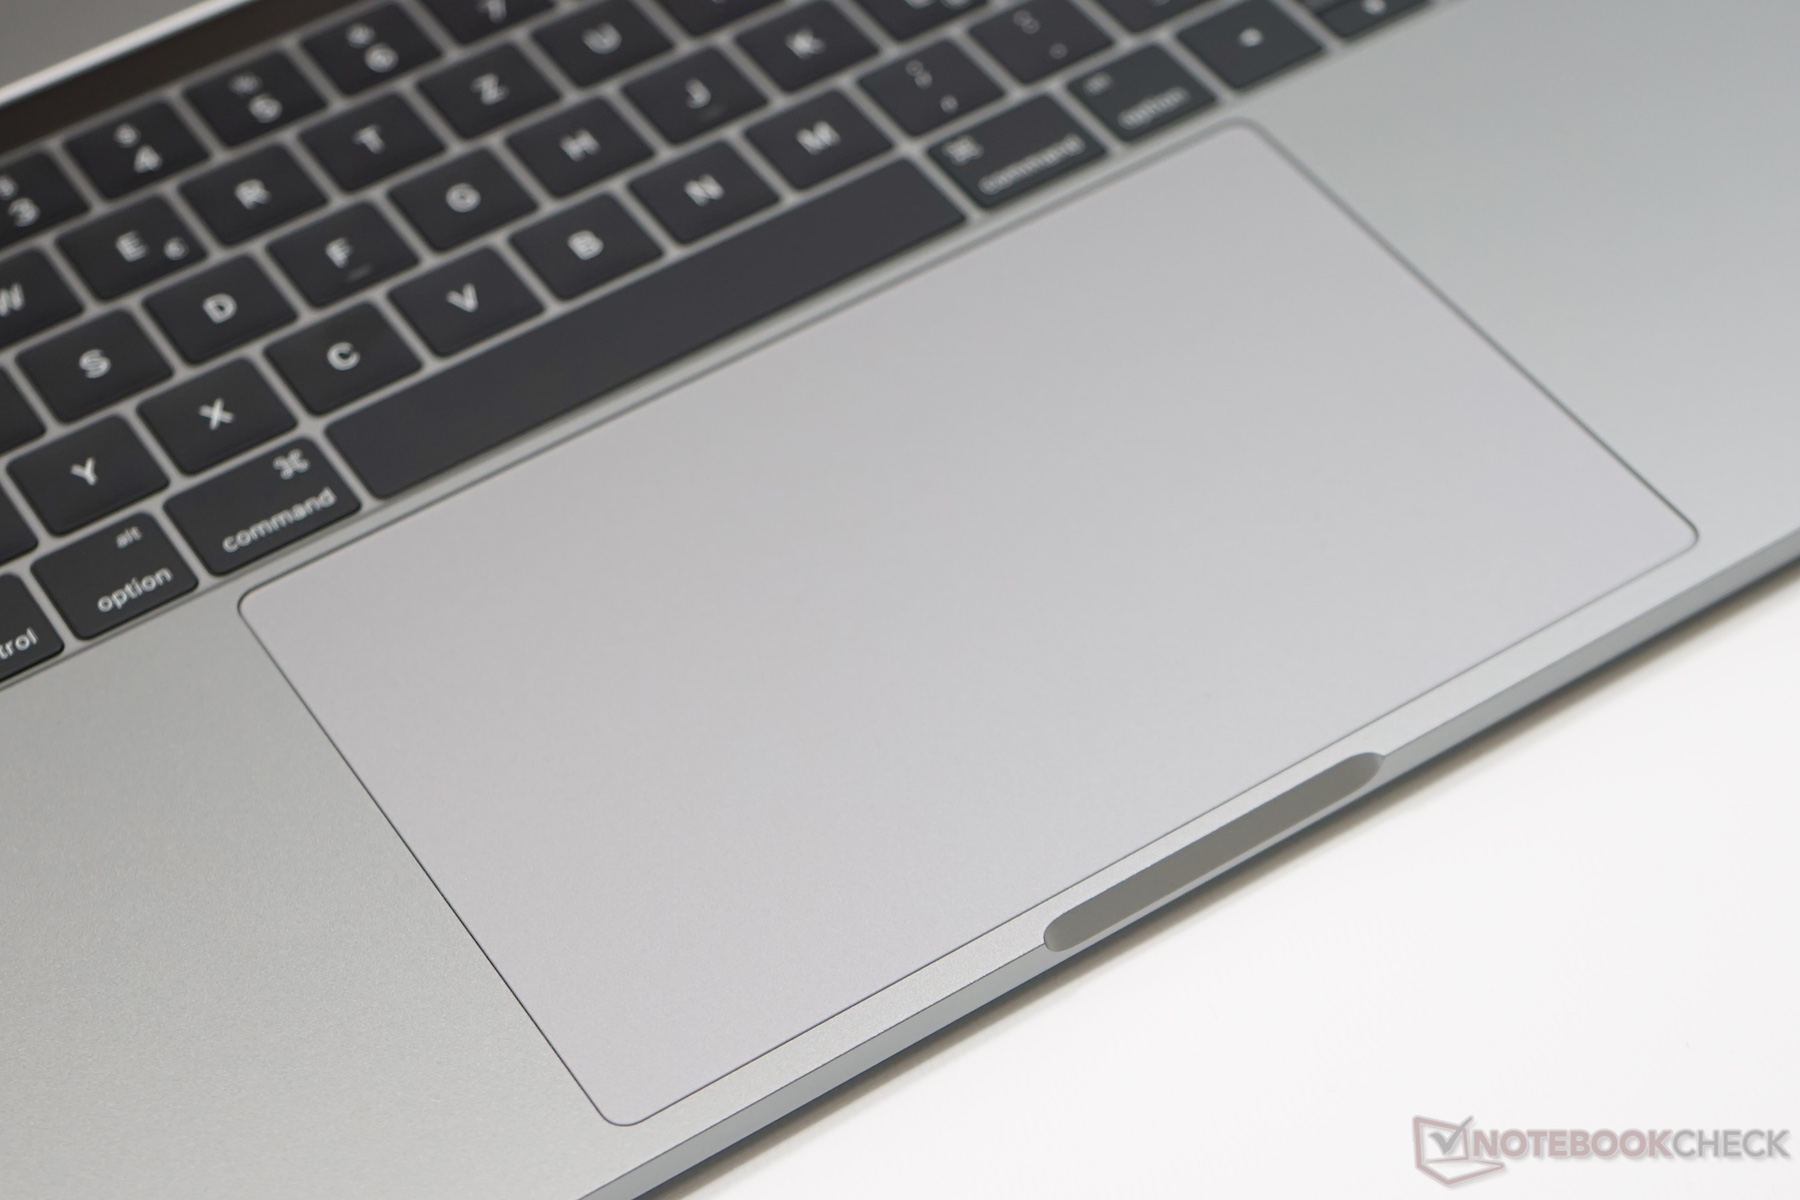
(+) Avuç içi dayanakları ve dokunmatik yüzey, maksimum 28 °C / 82.4 F ile cilt sıcaklığından daha soğuktur ve bu nedenle dokunulduğunda soğuktur.
(±) Benzer cihazların avuç içi dayanağı alanının ortalama sıcaklığı 28.7 °C / 83.7 F (+0.7 °C / 1.3 F) idi.
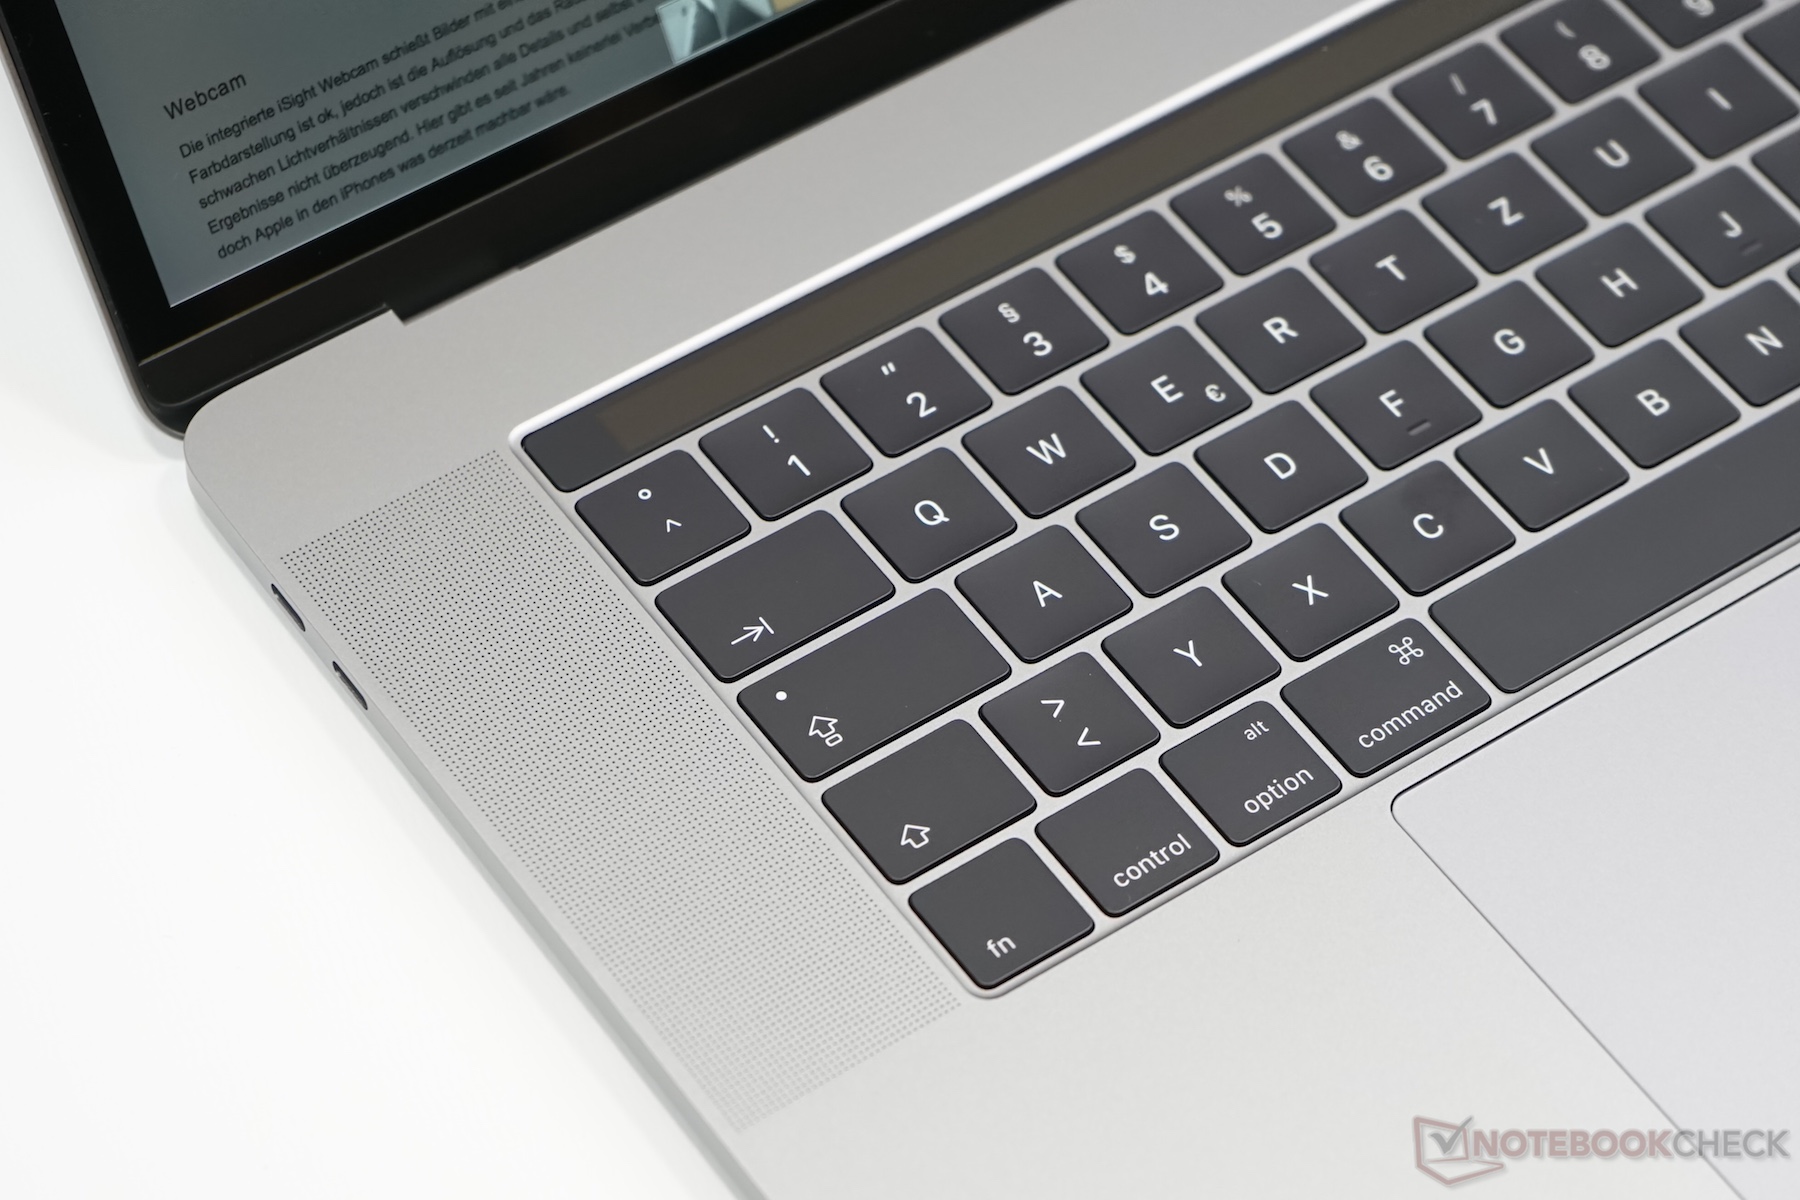
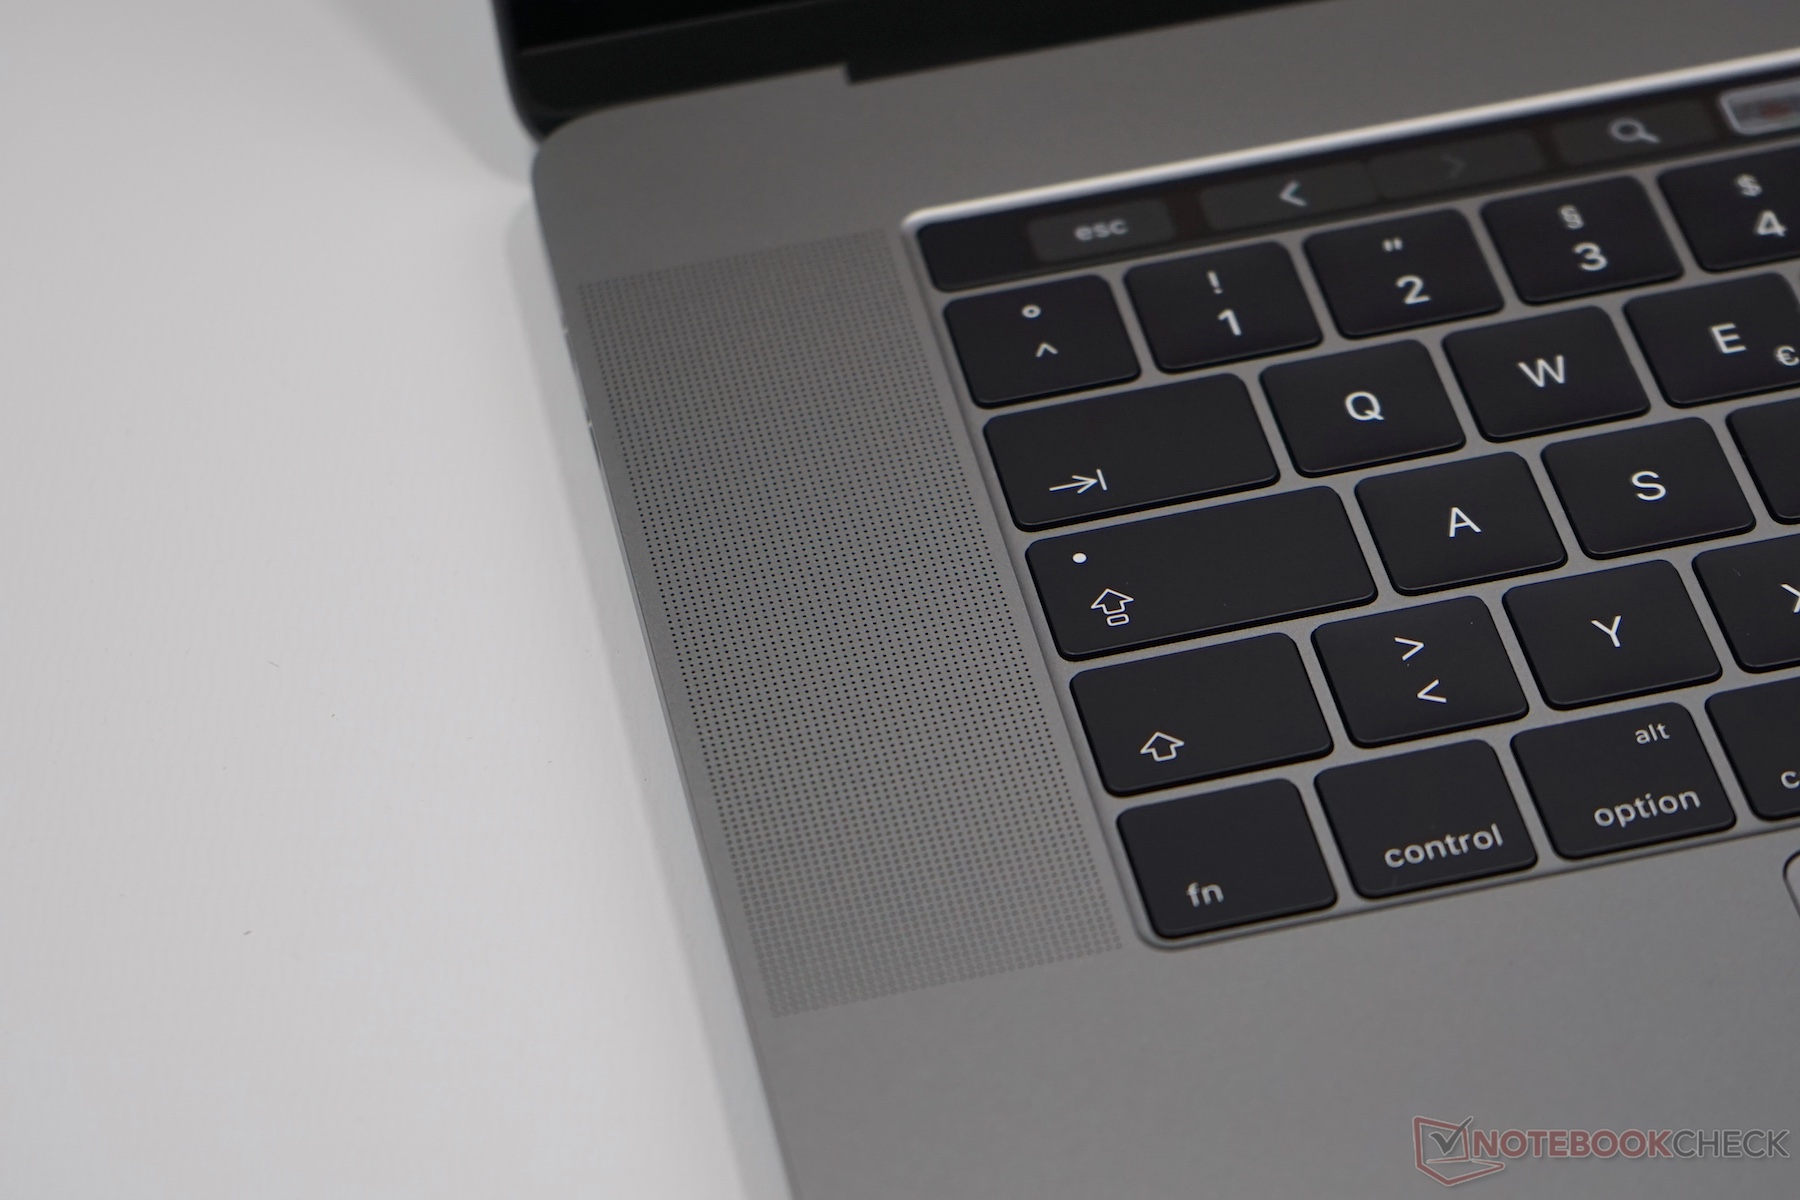
Apple MacBook Pro 15 2016 (2.6 GHz, 450) ses analizi
(+) | hoparlörler nispeten yüksek sesle çalabilir (86 dB)
Bas 100 - 315Hz
(±) | azaltılmış bas - ortalama olarak medyandan 6.9% daha düşük
(±) | Bas doğrusallığı ortalamadır (12.7% delta - önceki frekans)
Ortalar 400 - 2000 Hz
(±) | daha yüksek ortalar - ortalama olarak medyandan 5% daha yüksek
(±) | Ortaların doğrusallığı ortalamadır (9.5% delta - önceki frekans)
Yüksekler 2 - 16 kHz
(+) | dengeli yüksekler - medyandan yalnızca 2% uzakta
(+) | yüksekler doğrusaldır (4.3% deltadan önceki frekansa)
Toplam 100 - 16.000 Hz
(+) | genel ses doğrusaldır (9.7% ortancaya göre fark)
Aynı sınıfla karşılaştırıldığında
» Bu sınıftaki tüm test edilen cihazların %13%'si daha iyi, 1% benzer, 85% daha kötüydü
» En iyisinin deltası 5% idi, ortalama 17% idi, en kötüsü 45% idi
Test edilen tüm cihazlarla karşılaştırıldığında
» Test edilen tüm cihazların %4'si daha iyi, 1 benzer, % 95 daha kötüydü
» En iyisinin deltası 4% idi, ortalama 24% idi, en kötüsü 134% idi
Apple MacBook 12 (Early 2016) 1.1 GHz ses analizi
(+) | hoparlörler nispeten yüksek sesle çalabilir (83.6 dB)
Bas 100 - 315Hz
(±) | azaltılmış bas - ortalama olarak medyandan 11.3% daha düşük
(±) | Bas doğrusallığı ortalamadır (14.2% delta - önceki frekans)
Ortalar 400 - 2000 Hz
(+) | dengeli ortalar - medyandan yalnızca 2.4% uzakta
(+) | orta frekanslar doğrusaldır (5.5% deltadan önceki frekansa)
Yüksekler 2 - 16 kHz
(+) | dengeli yüksekler - medyandan yalnızca 2% uzakta
(+) | yüksekler doğrusaldır (4.5% deltadan önceki frekansa)
Toplam 100 - 16.000 Hz
(+) | genel ses doğrusaldır (10.2% ortancaya göre fark)
Aynı sınıfla karşılaştırıldığında
» Bu sınıftaki tüm test edilen cihazların %7%'si daha iyi, 2% benzer, 91% daha kötüydü
» En iyisinin deltası 5% idi, ortalama 18% idi, en kötüsü 53% idi
Test edilen tüm cihazlarla karşılaştırıldığında
» Test edilen tüm cihazların %5'si daha iyi, 1 benzer, % 94 daha kötüydü
» En iyisinin deltası 4% idi, ortalama 24% idi, en kötüsü 134% idi
Apple MacBook Pro 13 2016 ses analizi
(+) | hoparlörler nispeten yüksek sesle çalabilir (83.2 dB)
Bas 100 - 315Hz
(±) | azaltılmış bas - ortalama olarak medyandan 8.4% daha düşük
(-) | bas doğrusal değildir (16.7% delta ile önceki frekans)
Ortalar 400 - 2000 Hz
(+) | dengeli ortalar - medyandan yalnızca 4.7% uzakta
(+) | orta frekanslar doğrusaldır (6.3% deltadan önceki frekansa)
Yüksekler 2 - 16 kHz
(+) | dengeli yüksekler - medyandan yalnızca 1.1% uzakta
(+) | yüksekler doğrusaldır (2.6% deltadan önceki frekansa)
Toplam 100 - 16.000 Hz
(+) | genel ses doğrusaldır (9.8% ortancaya göre fark)
Aynı sınıfla karşılaştırıldığında
» Bu sınıftaki tüm test edilen cihazların %6%'si daha iyi, 2% benzer, 92% daha kötüydü
» En iyisinin deltası 5% idi, ortalama 18% idi, en kötüsü 53% idi
Test edilen tüm cihazlarla karşılaştırıldığında
» Test edilen tüm cihazların %4'si daha iyi, 1 benzer, % 95 daha kötüydü
» En iyisinin deltası 4% idi, ortalama 24% idi, en kötüsü 134% idi
| Apple MacBook Pro 15 2016 (2.6 GHz, 450) 6700HQ, Radeon Pro 450, 76 Wh | Apple MacBook Pro 13 2016 6360U, Iris Graphics 540, 54 Wh | Apple MacBook Pro Retina 15 inch 2015-05 4870HQ, Radeon R9 M370X, 100 Wh | Dell XPS 15 9550 i7 FHD 6700HQ, GeForce GTX 960M, 84 Wh | Asus Zenbook UX510UW-CN044T 6500U, GeForce GTX 960M, 48 Wh | |
|---|---|---|---|---|---|
| Pil Çalışma Süresi | 41% | 17% | 46% | 11% | |
| H.264 (h) | 8.6 | 10.3 20% | 6.9 -20% | 7.1 -17% | |
| WiFi v1.3 (h) | 10 | 11.4 14% | 7.2 -28% | 9.1 -9% | 7.2 -28% |
| Load (h) | 0.9 | 1.7 89% | 1.8 100% | 1.8 100% | 1.6 78% |
| Reader / Idle (h) | 42.6 | 17.3 | 16.3 | 13.6 |
Price comparison
