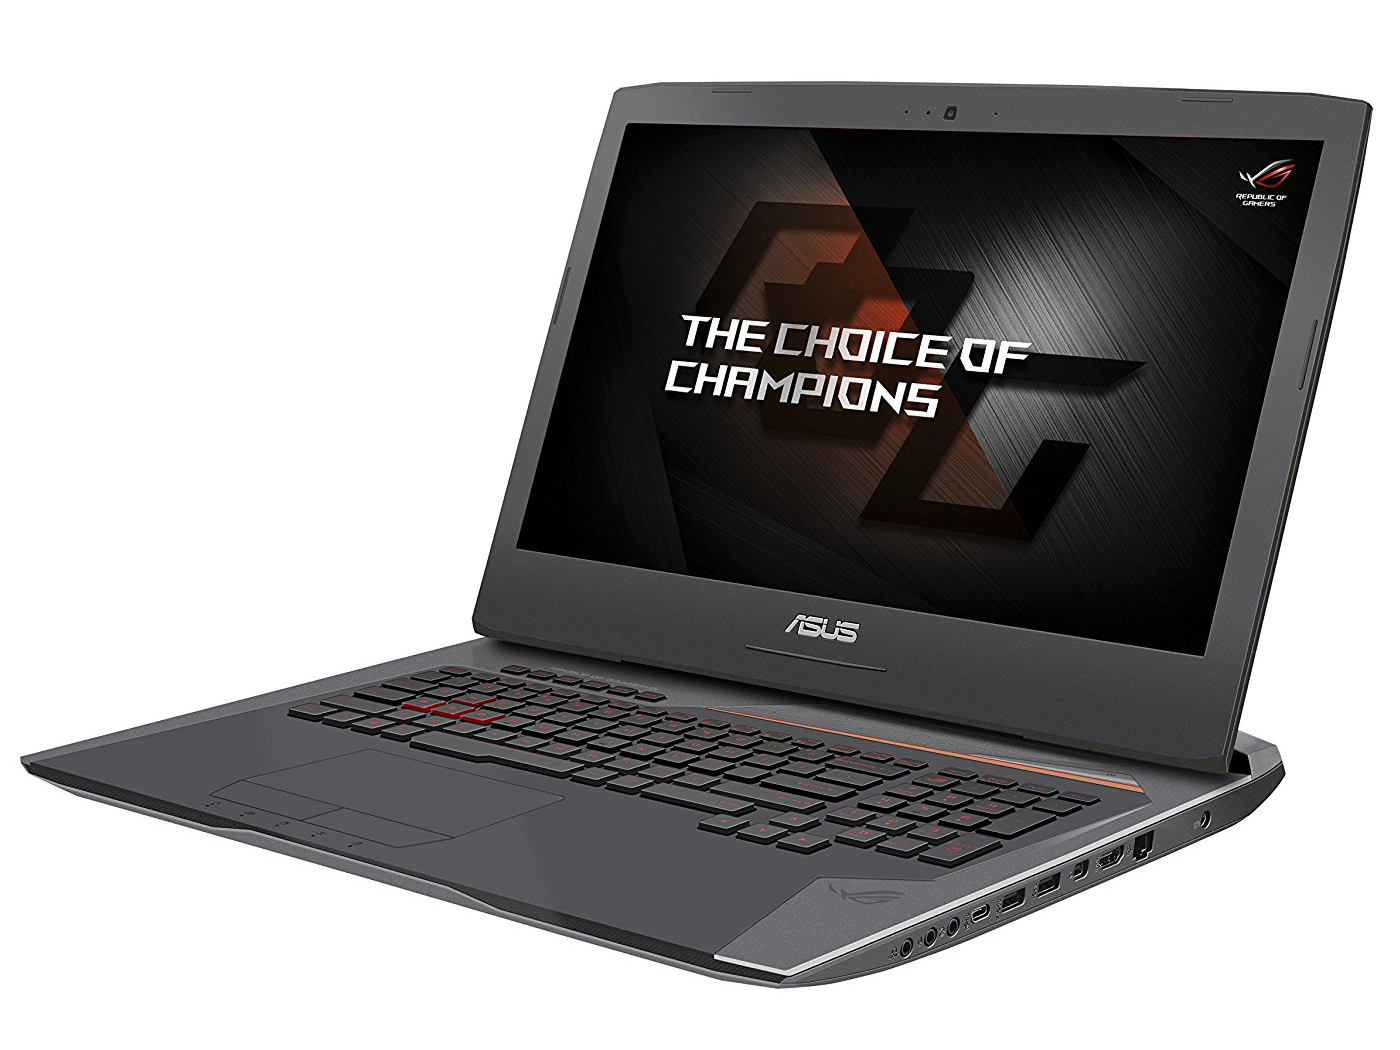
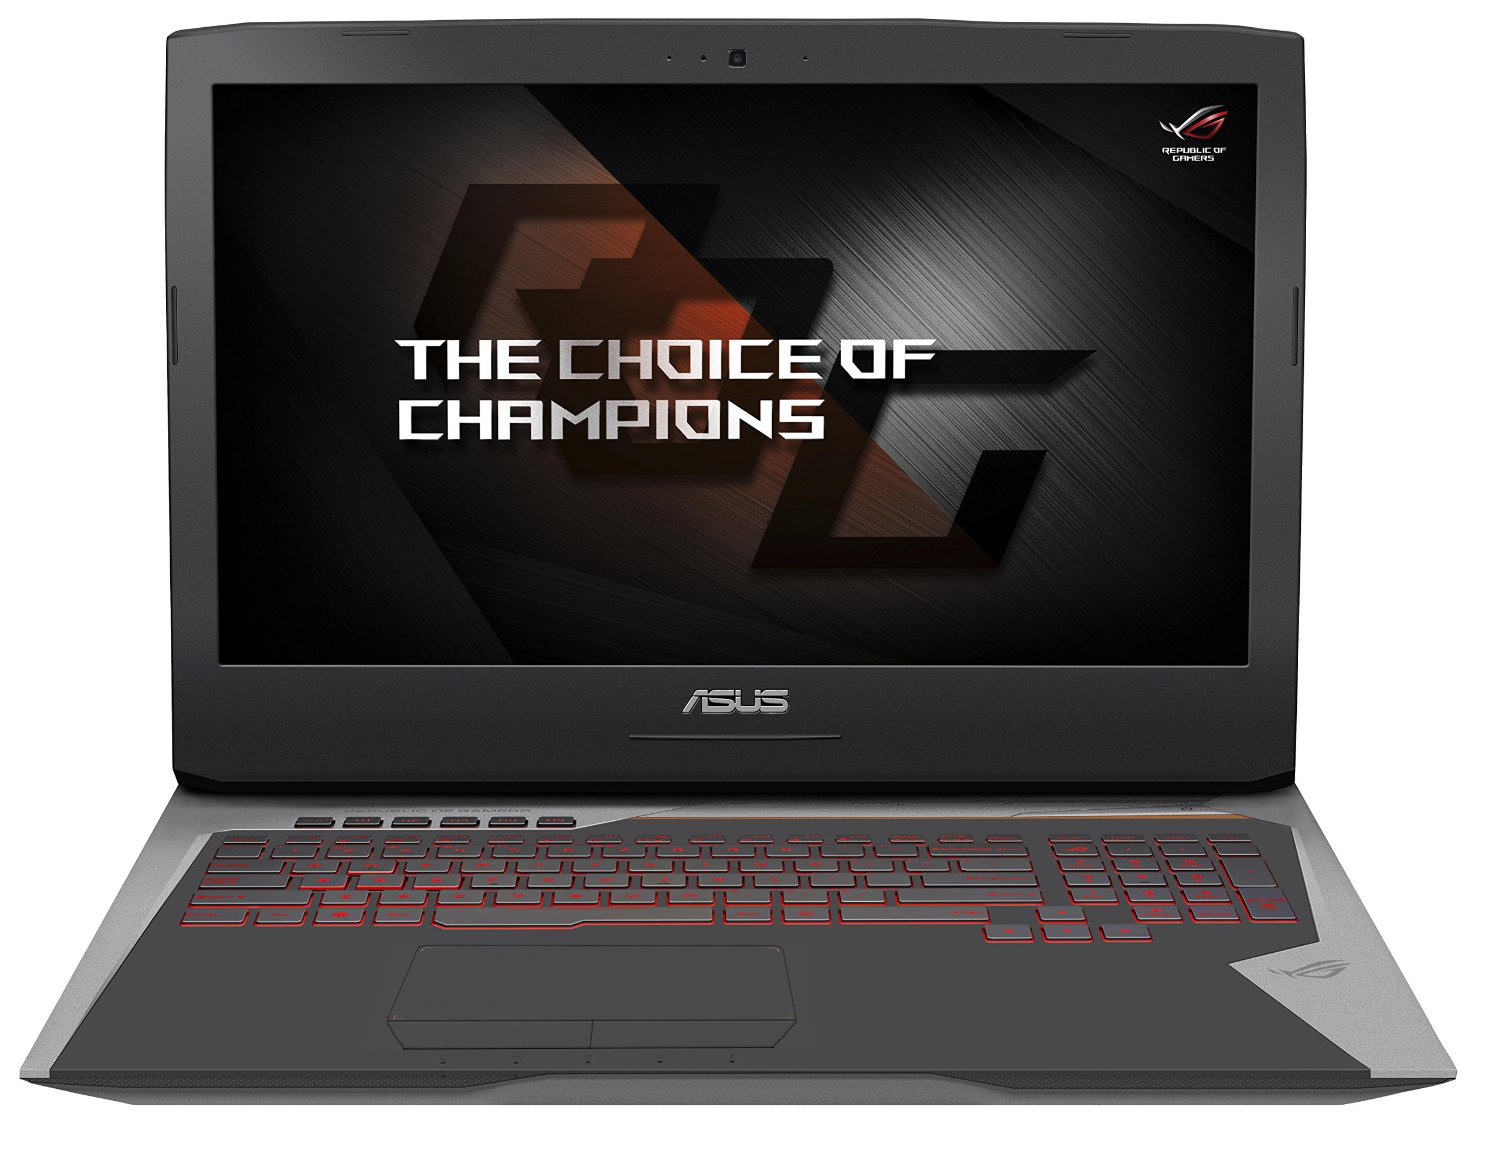
Kısa inceleme: Asus ROG G752VS (7700HQ, GTX 1070, FHD) Laptop
| SD Card Reader | |
| average JPG Copy Test (av. of 3 runs) | |
| MSI GT72VR 7RE-433 | |
| Acer Predator 17 G9-793-70PJ | |
| Gigabyte P57X v7 | |
| Asus G752VS-BA338T | |
| Asus G752VS-XB78K | |
| Nexoc G734IV | |
| maximum AS SSD Seq Read Test (1GB) | |
| MSI GT72VR 7RE-433 | |
| Gigabyte P57X v7 | |
| Acer Predator 17 G9-793-70PJ | |
| Nexoc G734IV | |
| Asus G752VS-BA338T | |
| Asus G752VS-XB78K | |
| Networking | |
| iperf3 transmit AX12 | |
| Acer Predator 17 G9-793-70PJ | |
| MSI GT72VR 7RE-433 | |
| Alienware 17 R4 | |
| Nexoc G734IV | |
| Asus G752VS-BA338T | |
| iperf3 receive AX12 | |
| Acer Predator 17 G9-793-70PJ | |
| Asus G752VS-BA338T | |
| Nexoc G734IV | |
| MSI GT72VR 7RE-433 | |
| Alienware 17 R4 | |
| |||||||||||||||||||||||||
Aydınlatma: 88 %
Batarya modunda parlaklık: 307 cd/m²
Kontrast: 959:1 (Siyah: 0.32 cd/m²)
ΔE ColorChecker Calman: 5.53 | ∀{0.5-29.43 Ø4.71}
ΔE Greyscale Calman: 7 | ∀{0.09-98 Ø4.96}
90% sRGB (Argyll 1.6.3 3D)
58% AdobeRGB 1998 (Argyll 1.6.3 3D)
62.8% AdobeRGB 1998 (Argyll 3D)
90.3% sRGB (Argyll 3D)
61.6% Display P3 (Argyll 3D)
Gamma: 2.48
CCT: 8103 K
| Asus G752VS-BA338T AU Optronics B173HAN01.1 (AUO119D), IPS, 1920x1080 | Asus G752VS-XB78K LG Philips LP173WF4-SPF3 (LGD04E8), IPS, 1920x1080 | MSI GT72VR 7RE-433 Chi Mei N173HHE-G32 (CMN1747), TN LED, 1920x1080 | Gigabyte P57X v7 SHP145E, IPS, 3840x2160 | Nexoc G734IV LG Philips LP173WF4-SPD1 (LGD046C), IPS, 1920x1080 | Acer Predator 17 G9-793-70PJ AU Optronics B173ZAN01.0 (AUO109B), IPS, 3840x2160 | Alienware 17 R4 TN LED, 2560x1440 | |
|---|---|---|---|---|---|---|---|
| Display | 1% | 3% | 37% | -1% | 36% | -4% | |
| Display P3 Coverage (%) | 61.6 | 66.9 9% | 68.3 11% | 87.8 43% | 66.2 7% | 86.4 40% | 61.2 -1% |
| sRGB Coverage (%) | 90.3 | 85.2 -6% | 86.7 -4% | 100 11% | 83.7 -7% | 99.9 11% | 82.9 -8% |
| AdobeRGB 1998 Coverage (%) | 62.8 | 62.3 -1% | 63.4 1% | 98.9 57% | 61.2 -3% | 99.1 58% | 60.5 -4% |
| Response Times | 5% | 46% | -67% | -13% | -19% | 34% | |
| Response Time Grey 50% / Grey 80% * (ms) | 36 ? | 38 ? -6% | 29 ? 19% | 55.6 ? -54% | 42 ? -17% | 50 ? -39% | 30 ? 17% |
| Response Time Black / White * (ms) | 26 ? | 22 ? 15% | 7 ? 73% | 46.8 ? -80% | 28 ? -8% | 25.6 ? 2% | 12.8 ? 51% |
| PWM Frequency (Hz) | 1000 ? | ||||||
| Screen | 14% | -9% | 17% | 12% | 22% | -4% | |
| Brightness middle (cd/m²) | 307 | 328 7% | 299 -3% | 441.3 44% | 348 13% | 343 12% | 402.3 31% |
| Brightness (cd/m²) | 300 | 317 6% | 277 -8% | 408 36% | 336 12% | 328 9% | 372 24% |
| Brightness Distribution (%) | 88 | 88 0% | 87 -1% | 86 -2% | 91 3% | 84 -5% | 86 -2% |
| Black Level * (cd/m²) | 0.32 | 0.3 6% | 0.27 16% | 0.44 -38% | 0.32 -0% | 0.29 9% | 0.62 -94% |
| Contrast (:1) | 959 | 1093 14% | 1107 15% | 1003 5% | 1088 13% | 1183 23% | 649 -32% |
| Colorchecker dE 2000 * | 5.53 | 3.74 32% | 9.65 -75% | 5.1 8% | 4.13 25% | 4.01 27% | 5.6 -1% |
| Colorchecker dE 2000 max. * | 11.54 | 8.97 22% | 15.43 -34% | 9.8 15% | 9.21 20% | 6.03 48% | 9.8 15% |
| Greyscale dE 2000 * | 7 | 2.67 62% | 9.68 -38% | 4.3 39% | 3.52 50% | 4.7 33% | 4.7 33% |
| Gamma | 2.48 89% | 2.41 91% | 1.89 116% | 2.08 106% | 2.32 95% | 2.4 92% | 2.14 103% |
| CCT | 8103 80% | 6861 95% | 11652 56% | 7345 88% | 6228 104% | 6451 101% | 7519 86% |
| Color Space (Percent of AdobeRGB 1998) (%) | 58 | 56 -3% | 75 29% | 87 50% | 55 -5% | 88 52% | 53.7 -7% |
| Color Space (Percent of sRGB) (%) | 90 | 85 -6% | 100 11% | 100 11% | 84 -7% | 100 11% | 82.2 -9% |
| Toplam Ortalama (Program / Ayarlar) | 7% /
10% | 13% /
1% | -4% /
10% | -1% /
6% | 13% /
19% | 9% /
1% |
* ... daha küçük daha iyidir
Ekran Titremesi / PWM (Darbe Genişliği Modülasyonu)
| Ekran titriyor / PWM algılanmadı | 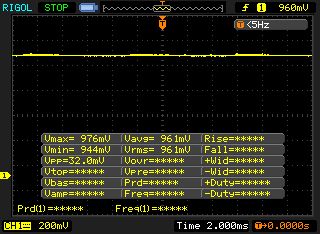 | ||
Karşılaştırıldığında: Test edilen tüm cihazların %52 %'si ekranı karartmak için PWM kullanmıyor. PWM tespit edilirse, ortalama 7754 (minimum: 5 - maksimum: 343500) Hz ölçüldü. | |||
Yanıt Sürelerini Görüntüle
| ↔ Tepki Süresi Siyahtan Beyaza | ||
|---|---|---|
| 26 ms ... yükseliş ↗ ve sonbahar↘ birleşimi | ↗ 14.4 ms yükseliş | 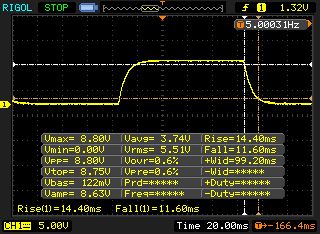 |
| ↘ 11.6 ms sonbahar | ||
| Ekran, testlerimizde nispeten yavaş yanıt oranları gösteriyor ve oyuncular için çok yavaş olabilir. Karşılaştırıldığında, test edilen tüm cihazlar 0.1 (minimum) ile 240 (maksimum) ms arasında değişir. » Tüm cihazların 63 %'si daha iyi. Bu, ölçülen yanıt süresinin test edilen tüm cihazların ortalamasından (19.8 ms) daha kötü olduğu anlamına gelir. | ||
| ↔ Tepki Süresi %50 Griden %80 Griye | ||
| 36 ms ... yükseliş ↗ ve sonbahar↘ birleşimi | ↗ 18 ms yükseliş | 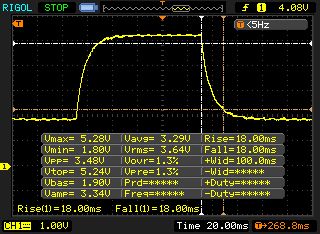 |
| ↘ 18 ms sonbahar | ||
| Ekran, testlerimizde yavaş yanıt oranları gösteriyor ve oyuncular için yetersiz olacaktır. Karşılaştırıldığında, test edilen tüm cihazlar 0.165 (minimum) ile 636 (maksimum) ms arasında değişir. » Tüm cihazların 51 %'si daha iyi. Bu, ölçülen yanıt süresinin test edilen tüm cihazların ortalamasından (31 ms) daha kötü olduğu anlamına gelir. | ||
| Cinebench R15 | |
| CPU Single 64Bit | |
| Alienware 17 R4 | |
| Asus G752VS-BA338T | |
| Asus G752VS-XB78K | |
| MSI GT72VR 7RE-433 | |
| Acer Predator 17 G9-793-70PJ | |
| Gigabyte P57X v7 | |
| Nexoc G734IV | |
| CPU Multi 64Bit | |
| Alienware 17 R4 | |
| Asus G752VS-XB78K | |
| Asus G752VS-BA338T | |
| Nexoc G734IV | |
| MSI GT72VR 7RE-433 | |
| Gigabyte P57X v7 | |
| Acer Predator 17 G9-793-70PJ | |
| Cinebench R11.5 | |
| CPU Multi 64Bit | |
| Alienware 17 R4 | |
| Asus G752VS-XB78K | |
| Asus G752VS-BA338T | |
| MSI GT72VR 7RE-433 | |
| Nexoc G734IV | |
| Acer Predator 17 G9-793-70PJ | |
| Gigabyte P57X v7 | |
| CPU Single 64Bit | |
| Asus G752VS-BA338T | |
| MSI GT72VR 7RE-433 | |
| Acer Predator 17 G9-793-70PJ | |
| Asus G752VS-XB78K | |
| Gigabyte P57X v7 | |
| Nexoc G734IV | |
| Alienware 17 R4 | |
| Cinebench R10 | |
| Rendering Multiple CPUs 32Bit | |
| Alienware 17 R4 | |
| Asus G752VS-XB78K | |
| Asus G752VS-BA338T | |
| MSI GT72VR 7RE-433 | |
| Nexoc G734IV | |
| Rendering Single 32Bit | |
| Alienware 17 R4 | |
| Asus G752VS-XB78K | |
| Asus G752VS-BA338T | |
| MSI GT72VR 7RE-433 | |
| Nexoc G734IV | |
| Geekbench 3 | |
| 32 Bit Multi-Core Score | |
| Nexoc G734IV | |
| Asus G752VS-BA338T | |
| MSI GT72VR 7RE-433 | |
| 32 Bit Single-Core Score | |
| Asus G752VS-BA338T | |
| Nexoc G734IV | |
| MSI GT72VR 7RE-433 | |
| Geekbench 4.0 | |
| 64 Bit Multi-Core Score | |
| Nexoc G734IV | |
| Asus G752VS-BA338T | |
| MSI GT72VR 7RE-433 | |
| 64 Bit Single-Core Score | |
| Asus G752VS-BA338T | |
| Nexoc G734IV | |
| MSI GT72VR 7RE-433 | |
| Geekbench 4.4 | |
| 64 Bit Multi-Core Score | |
| Asus G752VS-BA338T | |
| 64 Bit Single-Core Score | |
| Asus G752VS-BA338T | |
| JetStream 1.1 - 1.1 Total | |
| Asus G752VS-BA338T | |
| Nexoc G734IV | |
| MSI GT72VR 7RE-433 | |
| Asus G752VS-XB78K | |
| Alienware 17 R4 | |
| PCMark 7 Score | 6805 puan | |
| PCMark 8 Home Score Accelerated v2 | 5103 puan | |
| PCMark 8 Creative Score Accelerated v2 | 8191 puan | |
| PCMark 8 Work Score Accelerated v2 | 5410 puan | |
Yardım | ||
| PCMark 8 | |
| Home Score Accelerated v2 | |
| Asus G752VS-XB78K | |
| Asus G752VS-BA338T | |
| Alienware 17 R4 | |
| MSI GT72VR 7RE-433 | |
| Acer Predator 17 G9-793-70PJ | |
| Nexoc G734IV | |
| Gigabyte P57X v7 | |
| Work Score Accelerated v2 | |
| Asus G752VS-XB78K | |
| Asus G752VS-BA338T | |
| MSI GT72VR 7RE-433 | |
| Nexoc G734IV | |
| Alienware 17 R4 | |
| Acer Predator 17 G9-793-70PJ | |
| Gigabyte P57X v7 | |

| Asus G752VS-BA338T Samsung SM961 MZVKW512HMJP m.2 PCI-e | MSI GT72VR 7RE-433 Kingston RBU-SNS8152S3256GG5 | Gigabyte P57X v7 Transcend MTS800 256GB M.2 (TS256GMTS800) | Nexoc G734IV Samsung SM961 MZVKW512HMJP m.2 PCI-e | Alienware 17 R4 SK Hynix PC300 NVMe 512 GB | Asus G752VS-XB78K Toshiba NVMe THNSN5512GPU7 | |
|---|---|---|---|---|---|---|
| CrystalDiskMark 3.0 | -49% | -58% | -6% | -11% | 19% | |
| Read Seq (MB/s) | 2791 | 521 -81% | 517 -81% | 2268 -19% | 1277 -54% | 1718 -38% |
| Write Seq (MB/s) | 1596 | 311.8 -80% | 305.7 -81% | 1559 -2% | 786 -51% | 1305 -18% |
| Read 512 (MB/s) | 400.8 | 403.1 1% | 315 -21% | 413.8 3% | 894 123% | 1250 212% |
| Write 512 (MB/s) | 1606 | 332.3 -79% | 306.1 -81% | 1167 -27% | 659 -59% | 1438 -10% |
| Read 4k (MB/s) | 55.1 | 33.35 -39% | 26.04 -53% | 54 -2% | 38.11 -31% | 44.42 -19% |
| Write 4k (MB/s) | 163.8 | 111.1 -32% | 82.3 -50% | 154.9 -5% | 128.5 -22% | 154.4 -6% |
| Read 4k QD32 (MB/s) | 607 | 331.1 -45% | 281.3 -54% | 634 4% | 628 3% | 744 23% |
| Write 4k QD32 (MB/s) | 527 | 318.3 -40% | 296 -44% | 509 -3% | 531 1% | 578 10% |
| 3DMark 06 Standard Score | 30279 puan | |
| 3DMark 11 Performance | 17222 puan | |
| 3DMark Ice Storm Standard Score | 122763 puan | |
| 3DMark Cloud Gate Standard Score | 26609 puan | |
| 3DMark Fire Strike Score | 14277 puan | |
| 3DMark Fire Strike Extreme Score | 7961 puan | |
| 3DMark Time Spy Score | 5392 puan | |
Yardım | ||
| 3DMark - 1920x1080 Fire Strike Graphics | |
| Alienware 17 R4 | |
| Asus G752VS-BA338T | |
| MSI GT72VR 7RE-433 | |
| Nexoc G734IV | |
| Gigabyte P57X v7 | |
| Acer Predator 17 G9-793-70PJ | |
| Asus G752VS-XB78K | |
| 3DMark 11 - 1280x720 Performance GPU | |
| Alienware 17 R4 | |
| Asus G752VS-BA338T | |
| Gigabyte P57X v7 | |
| MSI GT72VR 7RE-433 | |
| Acer Predator 17 G9-793-70PJ | |
| Asus G752VS-XB78K | |
| Nexoc G734IV | |
| BioShock Infinite - 1920x1080 Ultra Preset, DX11 (DDOF) | |
| Alienware 17 R4 | |
| Asus G752VS-BA338T | |
| Asus G752VS-XB78K | |
| MSI GT72VR 7RE-433 | |
| Gigabyte P57X v7 | |
| Nexoc G734IV | |
| The Witcher 3 - 1920x1080 Ultra Graphics & Postprocessing (HBAO+) | |
| Alienware 17 R4 | |
| Asus G752VS-BA338T | |
| Acer Predator 17 G9-793-70PJ | |
| Asus G752VS-XB78K | |
| Far Cry Primal - 1920x1080 Ultra Preset AA:SM | |
| Asus G752VS-XB78K | |
| Asus G752VS-BA338T | |
| Rise of the Tomb Raider - 1920x1080 Very High Preset AA:FX AF:16x | |
| Alienware 17 R4 | |
| Asus G752VS-BA338T | |
| Asus G752VS-XB78K | |
| Nexoc G734IV | |
| For Honor - 1920x1080 Extreme Preset AA:T AF:16x | |
| Asus G752VS-BA338T | |
| Acer Predator 17 G9-793-70PJ | |
| düşük | orta | yüksek | ultra | |
|---|---|---|---|---|
| Tomb Raider (2013) | 431.5 | 407.8 | 339 | 192 |
| BioShock Infinite (2013) | 260.3 | 220.8 | 207.5 | 139.4 |
| The Witcher 3 (2015) | 228.1 | 184.4 | 117 | 59.6 |
| Rise of the Tomb Raider (2016) | 219.7 | 180.1 | 117.7 | 99 |
| Far Cry Primal (2016) | 118 | 103 | 93 | 86 |
| For Honor (2017) | 242.6 | 160 | 154 | 113.4 |
| Ghost Recon Wildlands (2017) | 127 | 96.3 | 91 | 54.4 |
| Prey (2017) | 142 | 140.2 | 135.2 | 132.5 |
Ses yüksekliği
| Boşta |
| 30 / 32 / 36 dB |
| HDD |
| 34 dB |
| DVD |
| 40 / dB |
| Çalışırken |
| 43 / 49 dB |
 | ||
30 dB sessiz 40 dB(A) duyulabilirlik 50 dB(A) gürültülü |
||
min: | ||
| Asus G752VS-BA338T i7-7700HQ, GeForce GTX 1070 Mobile | MSI GT72VR 7RE-433 i7-7700HQ, GeForce GTX 1070 Mobile | Gigabyte P57X v7 i7-7700HQ, GeForce GTX 1070 Mobile | Nexoc G734IV i7-7700HQ, GeForce GTX 1070 Mobile | Acer Predator 17 G9-793-70PJ i7-7700HQ, GeForce GTX 1070 Mobile | Alienware 17 R4 i7-7820HK, GeForce GTX 1080 Mobile | Asus G752VS-XB78K 6820HK, GeForce GTX 1070 Mobile | |
|---|---|---|---|---|---|---|---|
| Noise | -1% | 0% | -13% | -4% | -8% | 3% | |
| kapalı / ortam * (dB) | 30 | 31 -3% | 29 3% | 30 -0% | 31 -3% | 28.2 6% | 30 -0% |
| Idle Minimum * (dB) | 30 | 34 -13% | 30.4 -1% | 34 -13% | 32 -7% | 35.6 -19% | 31 -3% |
| Idle Average * (dB) | 32 | 35 -9% | 32.1 -0% | 35 -9% | 35 -9% | 35.6 -11% | 32 -0% |
| Idle Maximum * (dB) | 36 | 37 -3% | 32.1 11% | 46 -28% | 38 -6% | 35.7 1% | 33 8% |
| Load Average * (dB) | 43 | 37 14% | 45.6 -6% | 49 -14% | 42 2% | 50.2 -17% | 40 7% |
| Witcher 3 ultra * (dB) | 43 | 44 -2% | 50.2 -17% | ||||
| Load Maximum * (dB) | 49 | 44 10% | 51.5 -5% | 56 -14% | 50 -2% | 50.2 -2% | 47 4% |
* ... daha küçük daha iyidir
(±) Üst taraftaki maksimum sıcaklık, 40.4 °C / 105 F ortalamasına kıyasla 41 °C / 106 F'dir. , Gaming sınıfı için 21.2 ile 68.8 °C arasında değişir.
(+) Alt kısım, 43.2 °C / 110 F ortalamasına kıyasla maksimum 39.3 °C / 103 F'ye kadar ısınır
(+) Boşta kullanımda, üst tarafın ortalama sıcaklığı 26.8 °C / 80 F olup, cihazın 33.9 °C / 93 F.
(+) The Witcher 3 oynarken, üst tarafın ortalama sıcaklığı 31.3 °C / 88 F olup, cihazın 33.9 °C / 93 F.
(+) Avuç içi dayanakları ve dokunmatik yüzey, maksimum 27.6 °C / 81.7 F ile cilt sıcaklığından daha soğuktur ve bu nedenle dokunulduğunda soğuktur.
(±) Benzer cihazların avuç içi dayanağı alanının ortalama sıcaklığı 28.8 °C / 83.8 F (+1.2 °C / 2.1 F) idi.
| Asus G752VS-BA338T i7-7700HQ, GeForce GTX 1070 Mobile | MSI GT72VR 7RE-433 i7-7700HQ, GeForce GTX 1070 Mobile | Gigabyte P57X v7 i7-7700HQ, GeForce GTX 1070 Mobile | Nexoc G734IV i7-7700HQ, GeForce GTX 1070 Mobile | Acer Predator 17 G9-793-70PJ i7-7700HQ, GeForce GTX 1070 Mobile | Alienware 17 R4 i7-7820HK, GeForce GTX 1080 Mobile | Asus G752VS-XB78K 6820HK, GeForce GTX 1070 Mobile | |
|---|---|---|---|---|---|---|---|
| Heat | -4% | -20% | -15% | 1% | -18% | -7% | |
| Maximum Upper Side * (°C) | 41 | 41.5 -1% | 51.2 -25% | 48.1 -17% | 39.1 5% | 49.6 -21% | 42.9 -5% |
| Maximum Bottom * (°C) | 39.3 | 50.6 -29% | 56.8 -45% | 59.3 -51% | 42.1 -7% | 56 -42% | 41.5 -6% |
| Idle Upper Side * (°C) | 28.8 | 26.4 8% | 29.2 -1% | 28.2 2% | 27.9 3% | 29.6 -3% | 31.6 -10% |
| Idle Bottom * (°C) | 27.3 | 25.4 7% | 29.2 -7% | 26 5% | 26.1 4% | 29.2 -7% | 29.5 -8% |
* ... daha küçük daha iyidir
Asus G752VS-BA338T ses analizi
(±) | hoparlör ses yüksekliği ortalama ama iyi (80 dB)
Bas 100 - 315Hz
(±) | azaltılmış bas - ortalama olarak medyandan 9.4% daha düşük
(±) | Bas doğrusallığı ortalamadır (11.1% delta - önceki frekans)
Ortalar 400 - 2000 Hz
(+) | dengeli ortalar - medyandan yalnızca 4.2% uzakta
(+) | orta frekanslar doğrusaldır (6% deltadan önceki frekansa)
Yüksekler 2 - 16 kHz
(±) | azaltılmış yüksekler - ortalama olarak medyandan 7.7% daha düşük
(±) | Yükseklerin doğrusallığı ortalamadır (10% delta - önceki frekans)
Toplam 100 - 16.000 Hz
(±) | Genel sesin doğrusallığı ortalamadır (21.2% ortancaya göre fark)
Aynı sınıfla karşılaştırıldığında
» Bu sınıftaki tüm test edilen cihazların %76%'si daha iyi, 4% benzer, 19% daha kötüydü
» En iyisinin deltası 6% idi, ortalama 18% idi, en kötüsü 132% idi
Test edilen tüm cihazlarla karşılaştırıldığında
» Test edilen tüm cihazların %59'si daha iyi, 7 benzer, % 34 daha kötüydü
» En iyisinin deltası 4% idi, ortalama 23% idi, en kötüsü 134% idi
Acer Predator 17 G9-793-70PJ ses analizi
(+) | hoparlörler nispeten yüksek sesle çalabilir (87 dB)
Bas 100 - 315Hz
(±) | azaltılmış bas - ortalama olarak medyandan 5.5% daha düşük
(±) | Bas doğrusallığı ortalamadır (8% delta - önceki frekans)
Ortalar 400 - 2000 Hz
(+) | dengeli ortalar - medyandan yalnızca 2.9% uzakta
(+) | orta frekanslar doğrusaldır (3.5% deltadan önceki frekansa)
Yüksekler 2 - 16 kHz
(±) | azaltılmış yüksekler - ortalama olarak medyandan 5.2% daha düşük
(+) | yüksekler doğrusaldır (6.2% deltadan önceki frekansa)
Toplam 100 - 16.000 Hz
(+) | genel ses doğrusaldır (10.3% ortancaya göre fark)
Aynı sınıfla karşılaştırıldığında
» Bu sınıftaki tüm test edilen cihazların %6%'si daha iyi, 2% benzer, 93% daha kötüydü
» En iyisinin deltası 6% idi, ortalama 18% idi, en kötüsü 132% idi
Test edilen tüm cihazlarla karşılaştırıldığında
» Test edilen tüm cihazların %5'si daha iyi, 1 benzer, % 94 daha kötüydü
» En iyisinin deltası 4% idi, ortalama 23% idi, en kötüsü 134% idi
| Kapalı / Bekleme modu | |
| Boşta | |
| Çalışırken |
|
Key:
min: | |
| Asus G752VS-BA338T i7-7700HQ, GeForce GTX 1070 Mobile | MSI GT72VR 7RE-433 i7-7700HQ, GeForce GTX 1070 Mobile | Gigabyte P57X v7 i7-7700HQ, GeForce GTX 1070 Mobile | Nexoc G734IV i7-7700HQ, GeForce GTX 1070 Mobile | Acer Predator 17 G9-793-70PJ i7-7700HQ, GeForce GTX 1070 Mobile | Alienware 17 R4 i7-7820HK, GeForce GTX 1080 Mobile | Asus G752VS-XB78K 6820HK, GeForce GTX 1070 Mobile | |
|---|---|---|---|---|---|---|---|
| Power Consumption | 4% | -13% | 20% | -14% | -37% | -10% | |
| Idle Minimum * (Watt) | 21 | 20 5% | 15.7 25% | 12 43% | 23 -10% | 37.5 -79% | 24 -14% |
| Idle Average * (Watt) | 27 | 27 -0% | 23.4 13% | 17 37% | 33 -22% | 37.6 -39% | 31 -15% |
| Idle Maximum * (Watt) | 32 | 31 3% | 23.5 27% | 22 31% | 40 -25% | 37.6 -18% | 36 -13% |
| Load Average * (Watt) | 86 | 86 -0% | 184.6 -115% | 86 -0% | 94 -9% | 122.4 -42% | 94 -9% |
| Witcher 3 ultra * (Watt) | 165 | 177 -7% | 180.3 -9% | ||||
| Load Maximum * (Watt) | 206 | 184 11% | 233.1 -13% | 224 -9% | 228 -11% | 277.4 -35% | 204 1% |
* ... daha küçük daha iyidir
| Asus G752VS-BA338T i7-7700HQ, GeForce GTX 1070 Mobile, 90 Wh | MSI GT72VR 7RE-433 i7-7700HQ, GeForce GTX 1070 Mobile, 83 Wh | Gigabyte P57X v7 i7-7700HQ, GeForce GTX 1070 Mobile, 75.81 Wh | Nexoc G734IV i7-7700HQ, GeForce GTX 1070 Mobile, 60 Wh | Acer Predator 17 G9-793-70PJ i7-7700HQ, GeForce GTX 1070 Mobile, 88 Wh | Alienware 17 R4 i7-7820HK, GeForce GTX 1080 Mobile, 99 Wh | Asus G752VS-XB78K 6820HK, GeForce GTX 1070 Mobile, 90 Wh | |
|---|---|---|---|---|---|---|---|
| Pil Çalışma Süresi | -17% | -30% | -19% | -20% | -34% | -25% | |
| Reader / Idle (h) | 7.4 | 5.3 -28% | 4.3 -42% | 7.7 4% | 5.4 -27% | 4.6 -38% | 5.2 -30% |
| H.264 (h) | 4.3 | 3.8 -12% | 3.3 -23% | 3.1 -28% | |||
| WiFi v1.3 (h) | 4.9 | 3.8 -22% | 2.6 -47% | 3.4 -31% | 3.6 -27% | 3 -39% | 3.5 -29% |
| Load (h) | 1.6 | 1.5 -6% | 1.6 0% | 1.2 -25% | 1.5 -6% | 1.2 -25% | 1.4 -13% |
Artılar
Eksiler
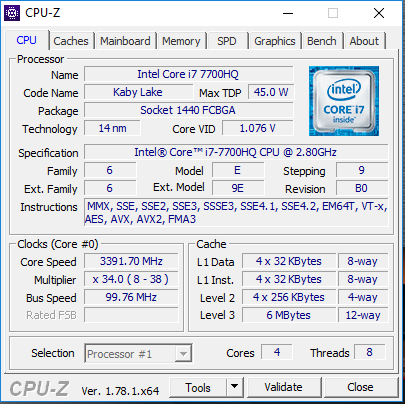
G752VS-BA338T, Asus'un 17 inçlik oyun serisi modellerinde ve Kaby Lake işlemciye sahip. Yeni Core i7-7700HQ işlemci eski Skylake modellerine göre büyük bir hız farkı getirmiyor.
Kaby Lake işlemcilerin farkı daha verim odaklı olup, batarya kullanım sürelerine pozitif etkide bulunmaları.
İşlemci / Grafik kartı kombinasyonu tüm modern oyunları yüksek çözünürlük ve maksimum detaylarda çalıştırmak için yeterli. Nvidia'nın G-Sync teknolojisi ile 120 Hz ekran üzerinde akıcı görüntüler sunulabiliyor ve harici bir ekranda daha yüksek çözünürlüklerin desteklenmesine imkan veriliyor.
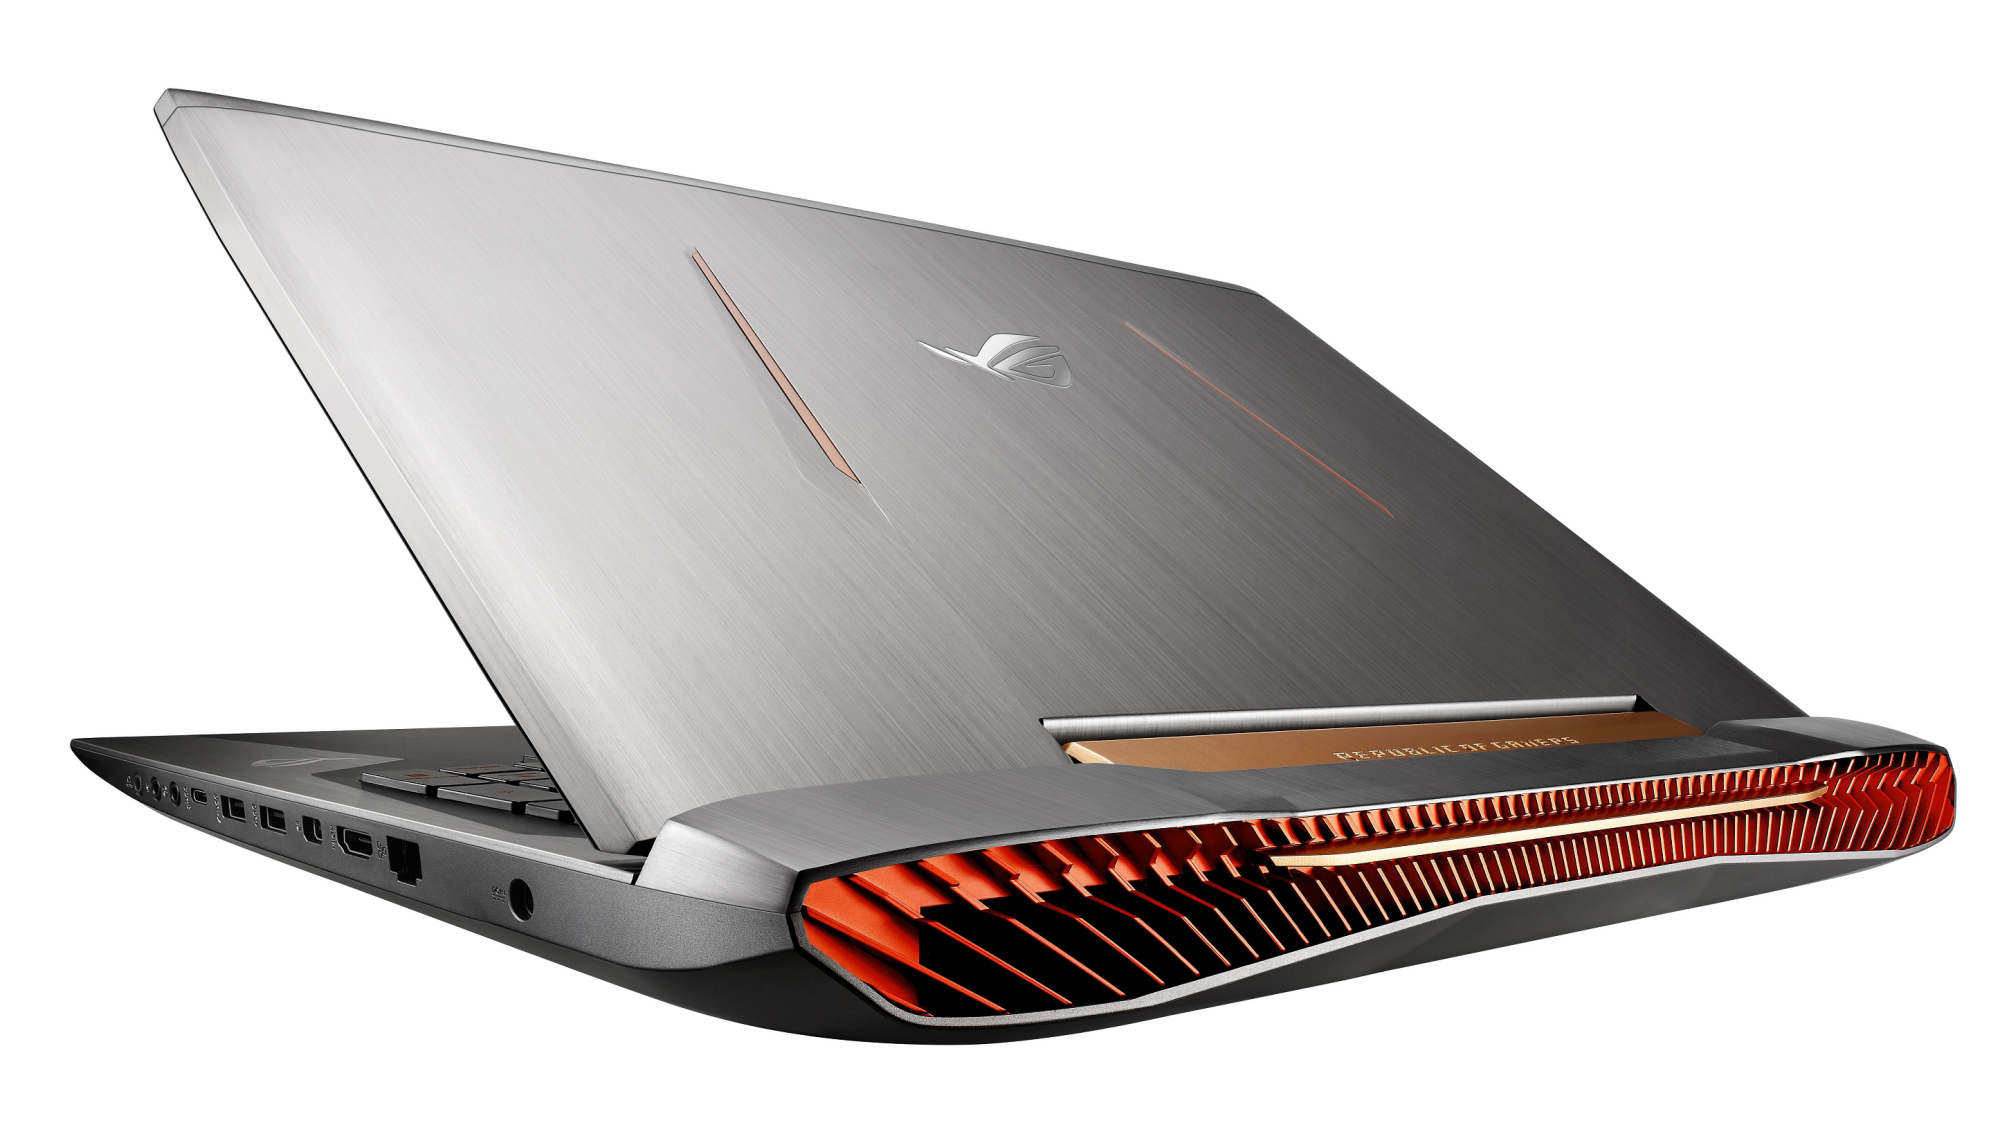
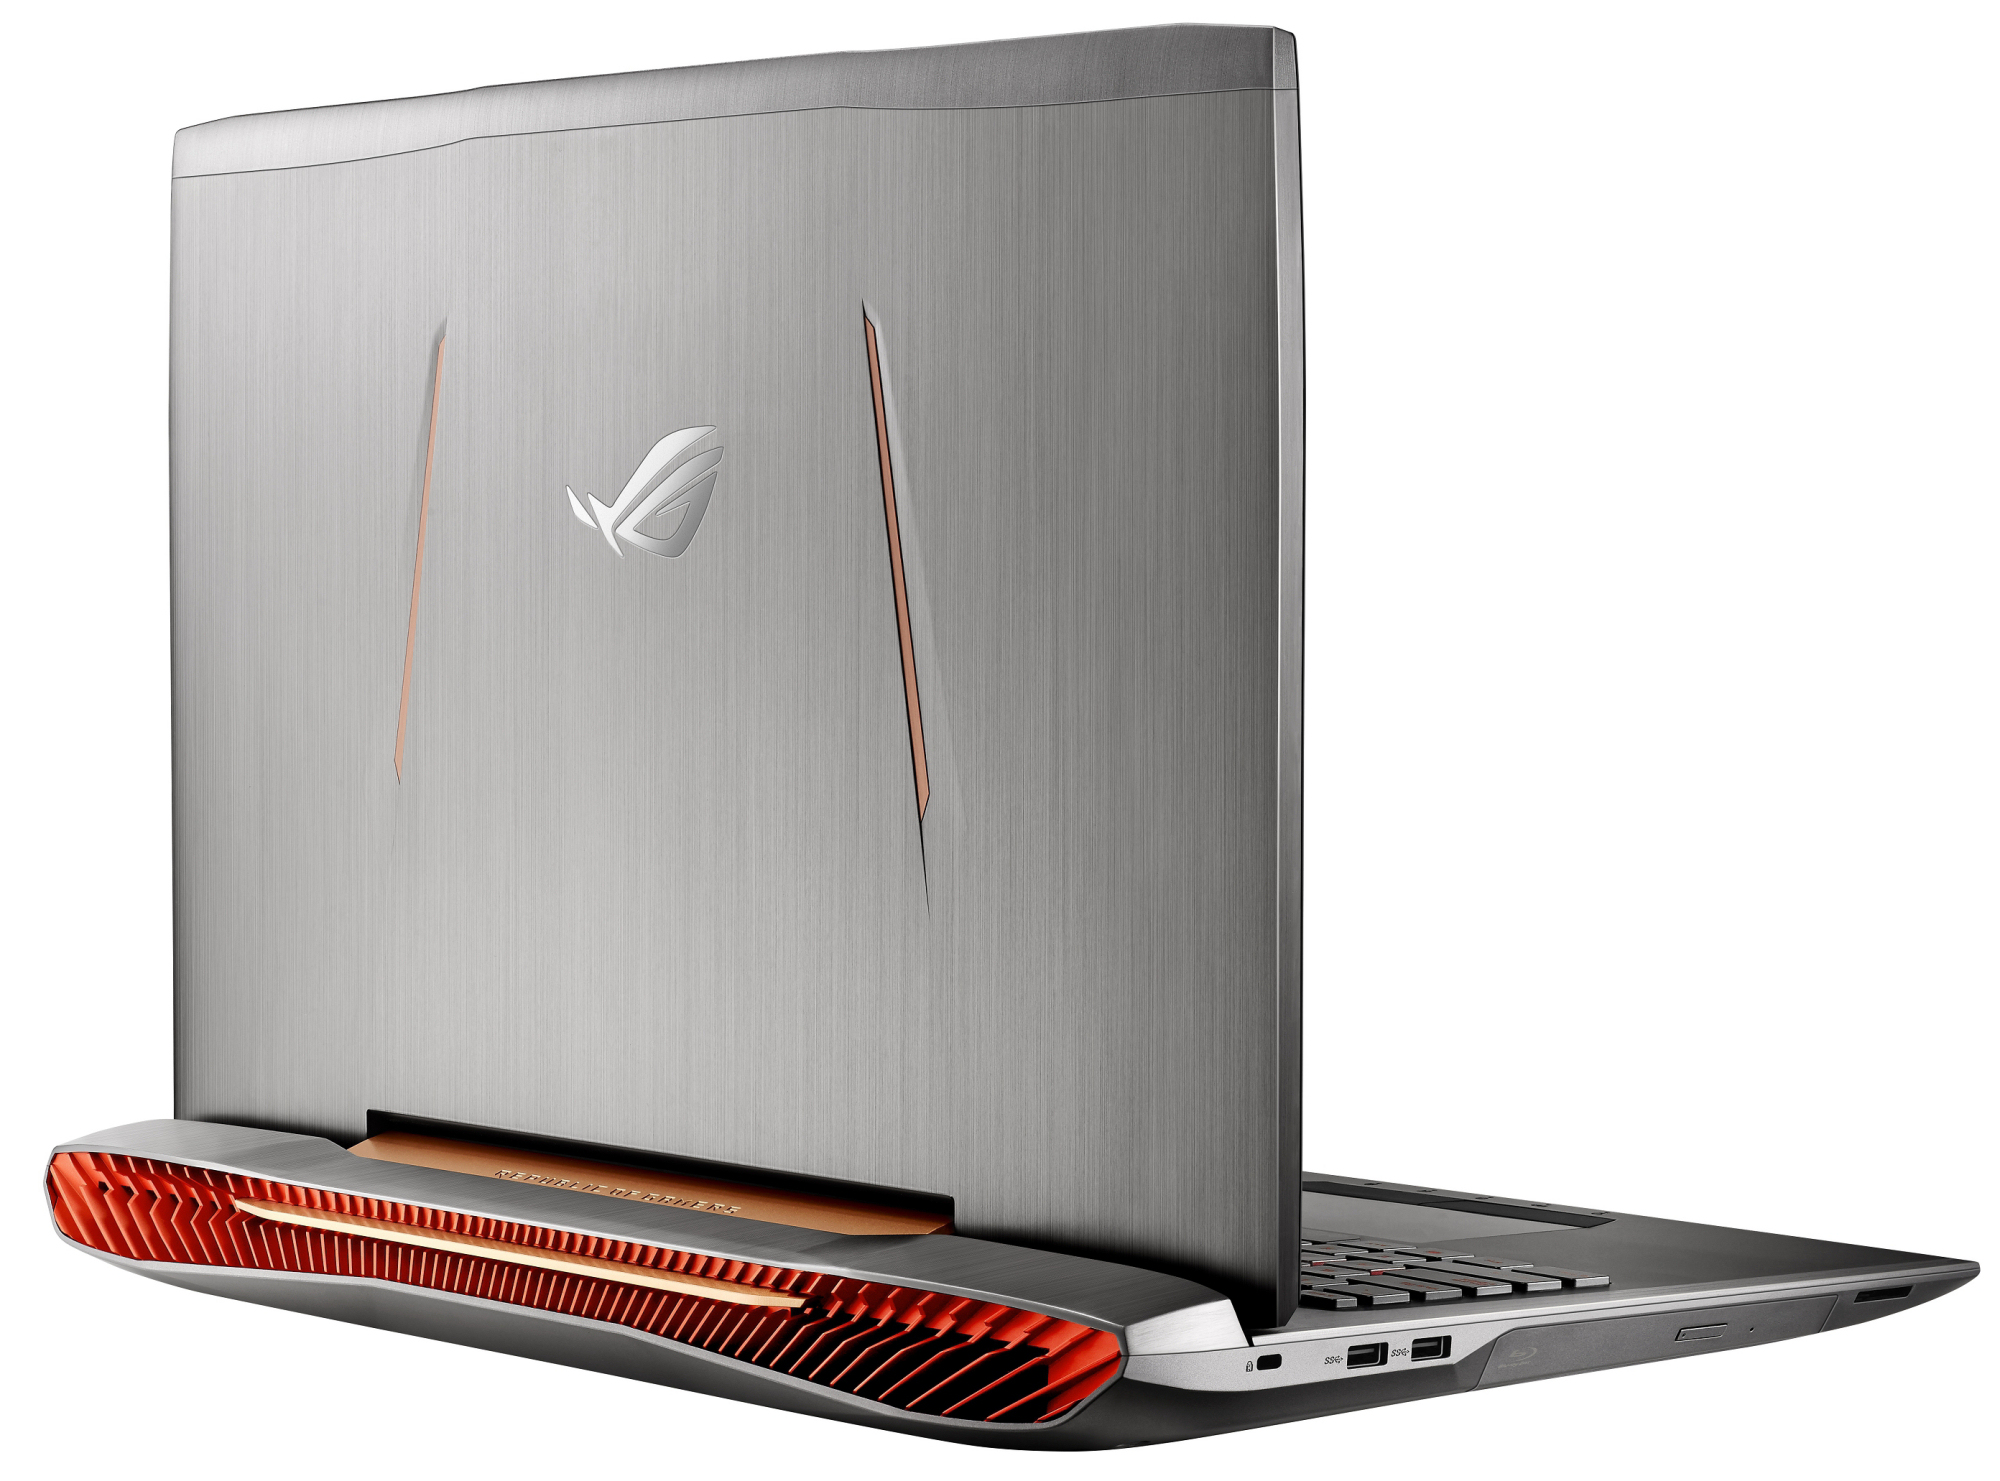
Sistemin ses üretimi güçlü donanımına rağmen çok yüksek değil. Aynı şey sıcaklık üretimi için de geçerli. Kullanılan hızlı NVMe-SSD ve ikinci bir NVMe-SSD için boş alan da cihazın geleceğe dönük güncelleme yapılmasına olanak sağlıyor. Alışıldık 2.5 inçlik sabit disk de sistemde mevcut. Bakım kapağı sayesinde sürücüleri değiştirmek de kolay.
Yazının orjinali için tıklayın.
Asus G752VS-BA338T
- 05/30/2017 v6 (old)
Sascha Mölck
Price comparison
