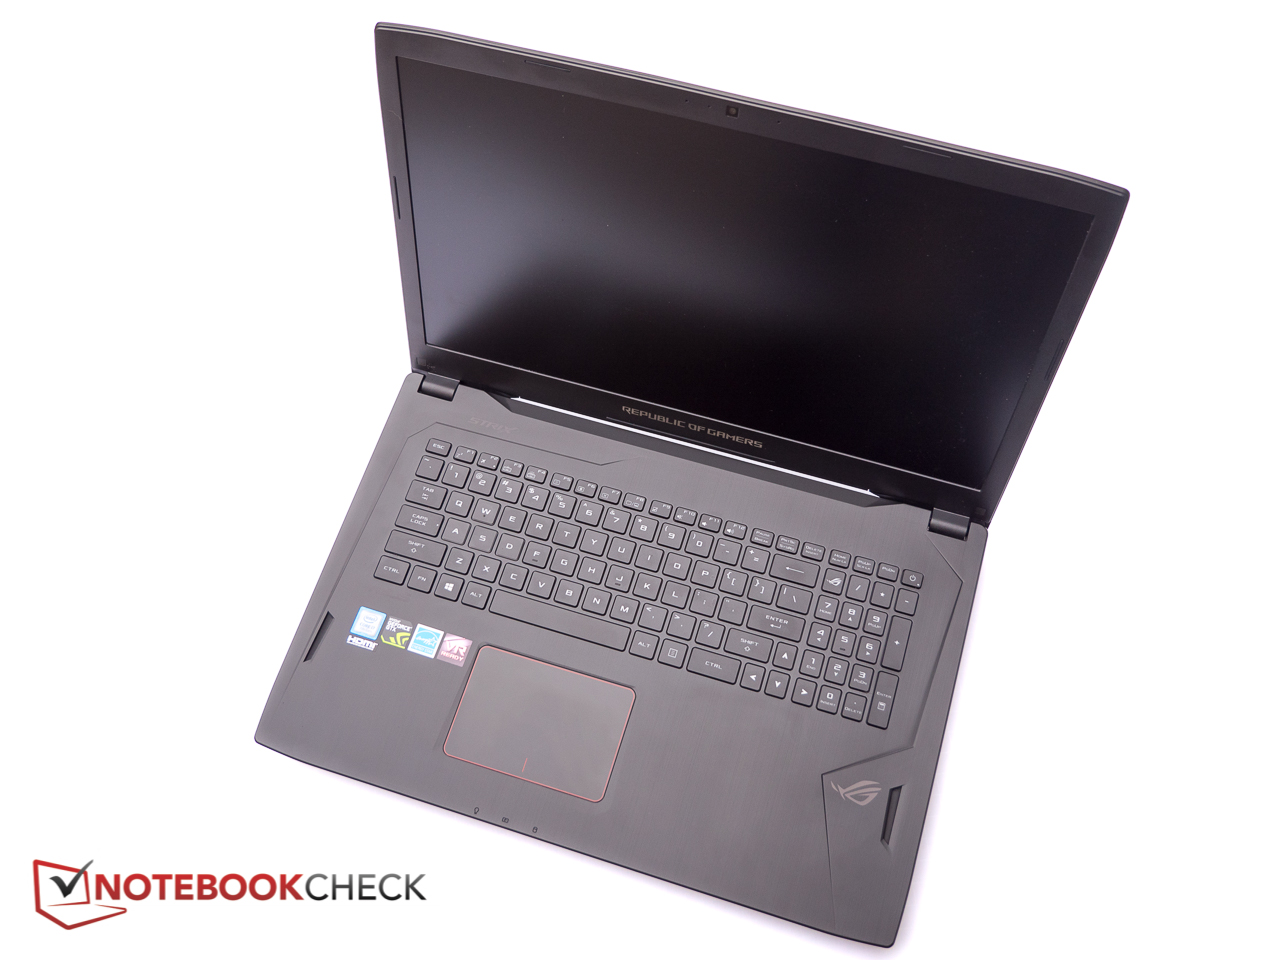
Kısa inceleme: Asus ROG Strix GL702VI (i7-7700HQ, GTX 1080) Laptop
| SD Card Reader | |
| average JPG Copy Test (av. of 3 runs) | |
| Aorus X7 v7 (Toshiba Exceria Pro SDXC 64 GB UHS-II) | |
| Schenker XMG U727 2017 (Toshiba Exceria Pro SDXC 64 GB UHS-II) | |
| Sınıf ortalaması Gaming (20.9 - 210, n=53, son 2 yıl) | |
| Acer Predator 17 X GX-792-76DL (Toshiba Exceria Pro SDXC 64 GB UHS-II) | |
| Asus ROG Strix GL702VI-WB74 | |
| Asus ROG Strix GL703VD-DB74 (Toshiba Exceria Pro SDXC 64 GB UHS-II) | |
| Razer Blade Pro 2017 (Toshiba Exceria Pro SDXC 64 GB UHS-II) | |
| maximum AS SSD Seq Read Test (1GB) | |
| Aorus X7 v7 (Toshiba Exceria Pro SDXC 64 GB UHS-II) | |
| Schenker XMG U727 2017 (Toshiba Exceria Pro SDXC 64 GB UHS-II) | |
| Sınıf ortalaması Gaming (25.5 - 261, n=50, son 2 yıl) | |
| Asus ROG Strix GL702VI-WB74 | |
| Acer Predator 17 X GX-792-76DL (Toshiba Exceria Pro SDXC 64 GB UHS-II) | |
| Asus ROG Strix GL703VD-DB74 (Toshiba Exceria Pro SDXC 64 GB UHS-II) | |
| Razer Blade Pro 2017 (Toshiba Exceria Pro SDXC 64 GB UHS-II) | |
| Networking | |
| iperf3 transmit AX12 | |
| Acer Predator 17 X GX-792-76DL | |
| Alienware 17 R4 | |
| Schenker XMG U727 2017 | |
| Razer Blade Pro 2017 | |
| Aorus X7 v7 | |
| Asus ROG Strix GL702VI-WB74 | |
| iperf3 receive AX12 | |
| Schenker XMG U727 2017 | |
| Acer Predator 17 X GX-792-76DL | |
| Razer Blade Pro 2017 | |
| Alienware 17 R4 | |
| Asus ROG Strix GL702VI-WB74 | |
| Aorus X7 v7 | |
| |||||||||||||||||||||||||
Aydınlatma: 92 %
Batarya modunda parlaklık: 312.9 cd/m²
Kontrast: 1009:1 (Siyah: 0.31 cd/m²)
ΔE ColorChecker Calman: 3.82 | ∀{0.5-29.43 Ø4.72}
ΔE Greyscale Calman: 3.3 | ∀{0.09-98 Ø4.97}
87.4% sRGB (Argyll 1.6.3 3D)
62.3% AdobeRGB 1998 (Argyll 1.6.3 3D)
62.6% AdobeRGB 1998 (Argyll 3D)
87.4% sRGB (Argyll 3D)
61.7% Display P3 (Argyll 3D)
Gamma: 2.18
CCT: 7037 K
| Asus ROG Strix GL702VI-WB74 AU Optronics B173HAN01.1, IPS, 17.3", 1920x1080 | Acer Predator 17 X GX-792-76DL LP173WF4-SPF5 (LGD056D), IPS, 17.3", 1920x1080 | Schenker XMG U727 2017 AU Optronics B173ZAN01.0 (AUO109B), AHVA, 17.3", 3840x2160 | Alienware 17 R4 TN LED, 17.3", 2560x1440 | Aorus X7 v7 AU Optronics B173QTN01.4 (AUO1496), TN LED, 17.3", 2560x1440 | Asus ROG Strix GL703VD-DB74 LG Philips LP173WF4-SPF5, IPS, 17.3", 1920x1080 | Razer Blade Pro 2017 Sharp LQ173D1JW33 (SHP145A), IGZO, 17.3", 3840x2160 | |
|---|---|---|---|---|---|---|---|
| Display | 0% | 38% | -3% | 1% | 3% | 39% | |
| Display P3 Coverage (%) | 61.7 | 66 7% | 86.6 40% | 61.2 -1% | 63 2% | 67.6 10% | 88.9 44% |
| sRGB Coverage (%) | 87.4 | 83.7 -4% | 99.9 14% | 82.9 -5% | 87.1 0% | 86.1 -1% | 100 14% |
| AdobeRGB 1998 Coverage (%) | 62.6 | 61.2 -2% | 99.5 59% | 60.5 -3% | 63.7 2% | 62.9 0% | 99.7 59% |
| Response Times | -21% | -20% | 30% | 52% | 15% | -65% | |
| Response Time Grey 50% / Grey 80% * (ms) | 32 ? | 45 ? -41% | 44 ? -38% | 30 ? 6% | 24 ? 25% | 30.8 ? 4% | 60.8 ? -90% |
| Response Time Black / White * (ms) | 27.6 ? | 28 ? -1% | 28 ? -1% | 12.8 ? 54% | 6 ? 78% | 20.4 ? 26% | 38.4 ? -39% |
| PWM Frequency (Hz) | 119000 ? | 204.9 ? | |||||
| Screen | -4% | 15% | -24% | -29% | -10% | -10% | |
| Brightness middle (cd/m²) | 312.9 | 380 21% | 362 16% | 402.3 29% | 375 20% | 421.2 35% | 230 -26% |
| Brightness (cd/m²) | 308 | 362 18% | 344 12% | 372 21% | 353 15% | 393 28% | 207 -33% |
| Brightness Distribution (%) | 92 | 91 -1% | 85 -8% | 86 -7% | 85 -8% | 85 -8% | 83 -10% |
| Black Level * (cd/m²) | 0.31 | 0.37 -19% | 0.35 -13% | 0.62 -100% | 0.58 -87% | 0.44 -42% | 0.2 35% |
| Contrast (:1) | 1009 | 1027 2% | 1034 2% | 649 -36% | 647 -36% | 957 -5% | 1150 14% |
| Colorchecker dE 2000 * | 3.82 | 4.12 -8% | 2.46 36% | 5.6 -47% | 6.06 -59% | 5 -31% | 5.62 -47% |
| Colorchecker dE 2000 max. * | 7.06 | 8.19 -16% | 4.26 40% | 9.8 -39% | 10.54 -49% | 8.8 -25% | 10.24 -45% |
| Greyscale dE 2000 * | 3.3 | 3.95 -20% | 2.9 12% | 4.7 -42% | 5.68 -72% | 5 -52% | 4.54 -38% |
| Gamma | 2.18 101% | 2.47 89% | 2.31 95% | 2.14 103% | 2.3 96% | 2.18 101% | 2.36 93% |
| CCT | 7037 92% | 6539 99% | 6120 106% | 7519 86% | 7998 81% | 6882 94% | 6625 98% |
| Color Space (Percent of AdobeRGB 1998) (%) | 62.3 | 55 -12% | 88 41% | 53.7 -14% | 57 -9% | 62.94 1% | 88 41% |
| Color Space (Percent of sRGB) (%) | 87.4 | 84 -4% | 100 14% | 82.2 -6% | 87 0% | 86.1 -1% | 100 14% |
| Toplam Ortalama (Program / Ayarlar) | -8% /
-5% | 11% /
15% | 1% /
-13% | 8% /
-12% | 3% /
-4% | -12% /
-7% |
* ... daha küçük daha iyidir
Yanıt Sürelerini Görüntüle
| ↔ Tepki Süresi Siyahtan Beyaza | ||
|---|---|---|
| 27.6 ms ... yükseliş ↗ ve sonbahar↘ birleşimi | ↗ 15.2 ms yükseliş | 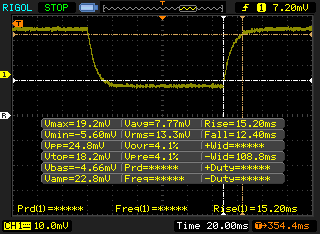 |
| ↘ 12.4 ms sonbahar | ||
| Ekran, testlerimizde nispeten yavaş yanıt oranları gösteriyor ve oyuncular için çok yavaş olabilir. Karşılaştırıldığında, test edilen tüm cihazlar 0.1 (minimum) ile 240 (maksimum) ms arasında değişir. » Tüm cihazların 70 %'si daha iyi. Bu, ölçülen yanıt süresinin test edilen tüm cihazların ortalamasından (19.8 ms) daha kötü olduğu anlamına gelir. | ||
| ↔ Tepki Süresi %50 Griden %80 Griye | ||
| 32 ms ... yükseliş ↗ ve sonbahar↘ birleşimi | ↗ 15.6 ms yükseliş | 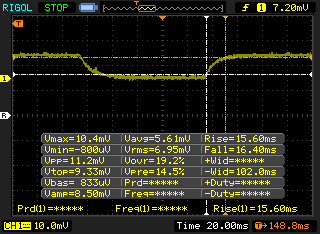 |
| ↘ 16.4 ms sonbahar | ||
| Ekran, testlerimizde yavaş yanıt oranları gösteriyor ve oyuncular için yetersiz olacaktır. Karşılaştırıldığında, test edilen tüm cihazlar 0.165 (minimum) ile 636 (maksimum) ms arasında değişir. » Tüm cihazların 43 %'si daha iyi. Bu, ölçülen yanıt süresinin test edilen tüm cihazların ortalamasına benzer olduğu anlamına gelir (31 ms). | ||
Ekran Titremesi / PWM (Darbe Genişliği Modülasyonu)
| Ekran titriyor / PWM algılanmadı |  | ||
Karşılaştırıldığında: Test edilen tüm cihazların %52 %'si ekranı karartmak için PWM kullanmıyor. PWM tespit edilirse, ortalama 7753 (minimum: 5 - maksimum: 343500) Hz ölçüldü. | |||
| Cinebench R15 | |
| CPU Single 64Bit | |
| Sınıf ortalaması Gaming (188.8 - 343, n=105, son 2 yıl) | |
| Schenker XMG U727 2017 | |
| Acer Predator 17 X GX-792-76DL | |
| Alienware 17 R4 | |
| Aorus X7 v7 | |
| Razer Blade Pro 2017 | |
| Ortalama Intel Core i7-7700HQ (120 - 162, n=110) | |
| Lenovo Legion Y520-15IKBM 80YY001APB | |
| Asus ROG Strix GL702VI-WB74 | |
| CPU Multi 64Bit | |
| Sınıf ortalaması Gaming (1578 - 6271, n=104, son 2 yıl) | |
| Schenker XMG U727 2017 | |
| Acer Predator 17 X GX-792-76DL | |
| Alienware 17 R4 | |
| Aorus X7 v7 | |
| Razer Blade Pro 2017 | |
| Ortalama Intel Core i7-7700HQ (603 - 747, n=111) | |
| Asus ROG Strix GL702VI-WB74 | |
| Lenovo Legion Y520-15IKBM 80YY001APB | |
| Cinebench R11.5 | |
| CPU Single 64Bit | |
| Sınıf ortalaması Gaming (3.3 - 3.98, n=8, son 2 yıl) | |
| Schenker XMG U727 2017 | |
| Acer Predator 17 X GX-792-76DL | |
| Aorus X7 v7 | |
| Razer Blade Pro 2017 | |
| Ortalama Intel Core i7-7700HQ (1.36 - 1.84, n=80) | |
| Alienware 17 R4 | |
| Asus ROG Strix GL702VI-WB74 | |
| CPU Multi 64Bit | |
| Sınıf ortalaması Gaming (29.8 - 70.7, n=8, son 2 yıl) | |
| Schenker XMG U727 2017 | |
| Acer Predator 17 X GX-792-76DL | |
| Alienware 17 R4 | |
| Aorus X7 v7 | |
| Razer Blade Pro 2017 | |
| Asus ROG Strix GL702VI-WB74 | |
| Ortalama Intel Core i7-7700HQ (6.67 - 8.23, n=81) | |
| wPrime 2.10 - 1024m | |
| Asus ROG Strix GL702VI-WB74 | |
| Lenovo Legion Y520-15IKBM 80YY001APB | |
| Ortalama Intel Core i7-7700HQ (210 - 379, n=48) | |
| Alienware 17 R4 | |
| Sınıf ortalaması Gaming (33 - 210, n=5, son 2 yıl) | |
* ... daha küçük daha iyidir
| PCMark 8 | |
| Home Score Accelerated v2 | |
| Acer Predator 17 X GX-792-76DL | |
| Sınıf ortalaması Gaming (n=1son 2 yıl) | |
| Aorus X7 v7 | |
| Alienware 17 R4 | |
| Asus ROG Strix GL702VI-WB74 | |
| Ortalama Intel Core i7-7700HQ, NVIDIA GeForce GTX 1080 Mobile (n=1) | |
| Schenker XMG U727 2017 | |
| Razer Blade Pro 2017 | |
| Work Score Accelerated v2 | |
| Acer Predator 17 X GX-792-76DL | |
| Aorus X7 v7 | |
| Asus ROG Strix GL702VI-WB74 | |
| Ortalama Intel Core i7-7700HQ, NVIDIA GeForce GTX 1080 Mobile (n=1) | |
| Alienware 17 R4 | |
| Schenker XMG U727 2017 | |
| Sınıf ortalaması Gaming (n=1son 2 yıl) | |
| Razer Blade Pro 2017 | |
| Creative Score Accelerated v2 | |
| Acer Predator 17 X GX-792-76DL | |
| Alienware 17 R4 | |
| Aorus X7 v7 | |
| Asus ROG Strix GL702VI-WB74 | |
| Ortalama Intel Core i7-7700HQ, NVIDIA GeForce GTX 1080 Mobile (n=1) | |
| PCMark 8 Home Score Accelerated v2 | 4970 puan | |
| PCMark 8 Creative Score Accelerated v2 | 7853 puan | |
| PCMark 8 Work Score Accelerated v2 | 5199 puan | |
| PCMark 10 Score | 4632 puan | |
Yardım | ||
| Asus ROG Strix GL702VI-WB74 Samsung PM961 MZVLW256HEHP | Acer Predator 17 X GX-792-76DL Toshiba NVMe THNSN5512GPU7 | Schenker XMG U727 2017 Samsung SM961 MZVPW256 m.2 PCI-e | MSI GT75VR 7RF-012 Titan Pro 2x Samsung SM961 MZVPW256HEGL NVMe (RAID 0) | Alienware 17 R4 SK Hynix PC300 NVMe 512 GB | Aorus X7 v7 Samsung SM961 MZVPW256HEGL | Ortalama Samsung PM961 MZVLW256HEHP | |
|---|---|---|---|---|---|---|---|
| AS SSD | 11% | 53% | 47% | -27% | 31% | -123% | |
| Score Total (Points) | 2536 | 2581 2% | 3938 55% | 3392 34% | 2072 -18% | 3668 45% | 2565 ? 1% |
| Score Write (Points) | 584 | 930 59% | 1187 103% | 1289 121% | 858 47% | 1021 75% | 587 ? 1% |
| Score Read (Points) | 1321 | 1118 -15% | 1858 41% | 1412 7% | 831 -37% | 1803 36% | 1378 ? 4% |
| Access Time Write * (ms) | 0.033 | 0.028 15% | 0.021 36% | 0.029 12% | 0.123 -273% | 0.031 6% | 0.4637 ? -1305% |
| Access Time Read * (ms) | 0.058 | 0.061 -5% | 0.033 43% | 0.041 29% | 0.042 28% | 0.059 -2% | 0.06777 ? -17% |
| 4K-64 Write (MB/s) | 352.7 | 623 77% | 866 146% | 925 162% | 671 90% | 791 124% | 419 ? 19% |
| 4K-64 Read (MB/s) | 1046 | 853 -18% | 1527 46% | 1048 0% | 620 -41% | 1485 42% | 1112 ? 6% |
| 4K Write (MB/s) | 114.1 | 133.8 17% | 175.9 54% | 128.8 13% | 113.4 -1% | 123.3 8% | 91.6 ? -20% |
| 4K Read (MB/s) | 49.71 | 39.52 -20% | 56.8 14% | 50.1 1% | 35.61 -28% | 48.35 -3% | 45.1 ? -9% |
| Seq Write (MB/s) | 1171 | 1338 14% | 1445 23% | 2352 101% | 735 -37% | 1067 -9% | 960 ? -18% |
| Seq Read (MB/s) | 2260 | 2261 0% | 2746 22% | 3137 39% | 1752 -22% | 2690 19% | 2019 ? -11% |
* ... daha küçük daha iyidir

| 3DMark 11 | |
| 1280x720 Performance GPU | |
| Sınıf ortalaması Gaming (21841 - 80022, n=103, son 2 yıl) | |
| Schenker XMG U727 2017 | |
| Acer Predator 17 X GX-792-76DL | |
| Ortalama NVIDIA GeForce GTX 1080 Mobile (24868 - 31412, n=26) | |
| Alienware 17 R4 | |
| Asus ROG Strix GL702VI-WB74 | |
| Asus Strix GL702VSK | |
| Aorus X7 v7 | |
| Asus ROG Strix GL703VD-DB74 | |
| 1280x720 Performance Combined | |
| Sınıf ortalaması Gaming (10258 - 30851, n=103, son 2 yıl) | |
| Schenker XMG U727 2017 | |
| Ortalama NVIDIA GeForce GTX 1080 Mobile (7533 - 16949, n=26) | |
| Acer Predator 17 X GX-792-76DL | |
| Alienware 17 R4 | |
| Aorus X7 v7 | |
| Asus ROG Strix GL702VI-WB74 | |
| Asus Strix GL702VSK | |
| Asus ROG Strix GL703VD-DB74 | |
| 3DMark | |
| 1280x720 Cloud Gate Standard Graphics | |
| Sınıf ortalaması Gaming (86886 - 223650, n=60, son 2 yıl) | |
| Acer Predator 17 X GX-792-76DL | |
| Alienware 17 R4 | |
| Ortalama NVIDIA GeForce GTX 1080 Mobile (88432 - 143992, n=24) | |
| Schenker XMG U727 2017 | |
| Aorus X7 v7 | |
| Asus ROG Strix GL702VI-WB74 | |
| Asus Strix GL702VSK | |
| Asus ROG Strix GL703VD-DB74 | |
| 1920x1080 Fire Strike Graphics | |
| Sınıf ortalaması Gaming (12242 - 62849, n=114, son 2 yıl) | |
| Acer Predator 17 X GX-792-76DL | |
| Alienware 17 R4 | |
| Schenker XMG U727 2017 | |
| Ortalama NVIDIA GeForce GTX 1080 Mobile (18879 - 23091, n=24) | |
| Asus ROG Strix GL702VI-WB74 | |
| Aorus X7 v7 | |
| Asus Strix GL702VSK | |
| Asus ROG Strix GL703VD-DB74 | |
| 1920x1080 Ice Storm Extreme Graphics | |
| Sınıf ortalaması Gaming (544538 - 659227, n=4, son 2 yıl) | |
| Acer Predator 17 X GX-792-76DL | |
| Alienware 17 R4 | |
| Aorus X7 v7 | |
| Ortalama NVIDIA GeForce GTX 1080 Mobile (186545 - 390417, n=8) | |
| Asus Strix GL702VSK | |
| 3DMark 11 Performance | 16156 puan | |
| 3DMark Cloud Gate Standard Score | 26020 puan | |
| 3DMark Fire Strike Score | 14301 puan | |
Yardım | ||
| Rise of the Tomb Raider - 1920x1080 Very High Preset AA:FX AF:16x (değere göre sırala) | |
| Asus ROG Strix GL702VI-WB74 | |
| Acer Predator 17 X GX-792-76DL | |
| Alienware 17 R4 | |
| Asus Strix GL702VSK | |
| Ortalama NVIDIA GeForce GTX 1080 Mobile (100.5 - 126.1, n=10) | |
| BioShock Infinite - 1920x1080 Ultra Preset, DX11 (DDOF) (değere göre sırala) | |
| Asus ROG Strix GL702VI-WB74 | |
| Acer Predator 17 X GX-792-76DL | |
| Acer Predator 17 X GX-792-76DL | |
| Alienware 17 R4 | |
| Aorus X7 v7 | |
| Asus Strix GL702VSK | |
| Ortalama NVIDIA GeForce GTX 1080 Mobile (151 - 181.2, n=12) | |
| The Witcher 3 - 1920x1080 Ultra Graphics & Postprocessing (HBAO+) (değere göre sırala) | |
| Asus ROG Strix GL702VI-WB74 | |
| Acer Predator 17 X GX-792-76DL | |
| Schenker XMG U727 2017 | |
| Alienware 17 R4 | |
| Aorus X7 v7 | |
| Asus Strix GL702VSK | |
| Ortalama NVIDIA GeForce GTX 1080 Mobile (61.7 - 78.1, n=23) | |
| Sınıf ortalaması Gaming (104.7 - 240, n=6, son 2 yıl) | |
| Middle-earth: Shadow of War - 1920x1080 Ultra Preset AA:T (değere göre sırala) | |
| Asus ROG Strix GL702VI-WB74 | |
| Ortalama NVIDIA GeForce GTX 1080 Mobile (85 - 99, n=4) | |
| Batman: Arkham Knight - 1920x1080 High / On AA:SM AF:16x (değere göre sırala) | |
| Asus ROG Strix GL702VI-WB74 | |
| Alienware 17 R4 | |
| Ortalama NVIDIA GeForce GTX 1080 Mobile (76 - 141, n=7) | |
| düşük | orta | yüksek | ultra | |
|---|---|---|---|---|
| Hitman: Absolution (2012) | 94.3 | 86.1 | 77.3 | 72.6 |
| BioShock Infinite (2013) | 221 | 192.8 | 181.4 | 159.6 |
| Company of Heroes 2 (2013) | 59.9 | 57.9 | 55.9 | 54.4 |
| Middle-earth: Shadow of Mordor (2014) | 166.5 | 151.8 | 145.4 | 134.8 |
| The Witcher 3 (2015) | 190 | 164.6 | 123.6 | 72 |
| Batman: Arkham Knight (2015) | 121 | 118 | 105 | 76 |
| Rise of the Tomb Raider (2016) | 148.8 | 139 | 115.3 | 100.5 |
| Ashes of the Singularity (2016) | 52.6 | 50.9 | ||
| Deus Ex Mankind Divided (2016) | 95.6 | 89.8 | 64.2 | 52.1 |
| Ark Survival Evolved (2017) | 118.6 | 88.4 | 63 | 45.1 |
| Middle-earth: Shadow of War (2017) | 123 | 114 | 99 | 85 |
| The Evil Within 2 (2017) | 72.1 | 66 | 64.9 | 61.7 |
| ELEX (2017) | 119.2 | 117.6 | 99 | 90.6 |
Ses yüksekliği
| Boşta |
| 30.6 / 30.6 / 30.6 dB |
| Çalışırken |
| 38.5 / 57 dB |
 | ||
30 dB sessiz 40 dB(A) duyulabilirlik 50 dB(A) gürültülü |
||
min: | ||
| Asus ROG Strix GL702VI-WB74 GeForce GTX 1080 Mobile, i7-7700HQ, Samsung PM961 MZVLW256HEHP | Asus G701VIK-BA049T GeForce GTX 1080 Mobile, i7-7820HK, 2x Samsung SM961 MZVPW256HEGL NVMe (RAID 0) | Acer Predator 17 X GX-792-76DL GeForce GTX 1080 Mobile, i7-7820HK, Toshiba NVMe THNSN5512GPU7 | Schenker XMG U727 2017 GeForce GTX 1080 Mobile, i7-7700K, Samsung SM961 MZVPW256 m.2 PCI-e | Alienware 17 R4 GeForce GTX 1080 Mobile, i7-7820HK, SK Hynix PC300 NVMe 512 GB | Aorus X7 v7 GeForce GTX 1070 Mobile, i7-7820HK, Samsung SM961 MZVPW256HEGL | Asus ROG Strix GL703VD-DB74 GeForce GTX 1050 Mobile, i7-7700HQ, SanDisk SD8SN8U256G1002 | MSI GT75VR 7RF-012 Titan Pro GeForce GTX 1080 Mobile, i7-7820HK, 2x Samsung SM961 MZVPW256HEGL NVMe (RAID 0) | Asus Strix GL702VSK GeForce GTX 1070 Mobile, i7-7700HQ, HGST Travelstar 7K1000 HTS721010A9E630 | |
|---|---|---|---|---|---|---|---|---|---|
| Noise | -7% | -7% | -6% | -9% | -7% | 4% | -11% | 2% | |
| kapalı / ortam * (dB) | 28.2 | 30 -6% | 30 -6% | 30 -6% | 28.2 -0% | 30 -6% | 27.9 1% | 30 -6% | 28.6 -1% |
| Idle Minimum * (dB) | 30.6 | 30 2% | 33 -8% | 31 -1% | 35.6 -16% | 33 -8% | 30.4 1% | 33 -8% | 30.6 -0% |
| Idle Average * (dB) | 30.6 | 31 -1% | 35 -14% | 34 -11% | 35.6 -16% | 36 -18% | 30.4 1% | 34 -11% | 30.6 -0% |
| Idle Maximum * (dB) | 30.6 | 36 -18% | 37 -21% | 37 -21% | 35.7 -17% | 41 -34% | 30.4 1% | 38 -24% | 30.6 -0% |
| Load Average * (dB) | 38.5 | 47 -22% | 40 -4% | 44 -14% | 50.2 -30% | 41 -6% | 36.4 5% | 44 -14% | 39.8 -3% |
| Witcher 3 ultra * (dB) | 52 | 51 2% | 50.2 3% | 45 13% | 46 12% | 56 -8% | |||
| Load Maximum * (dB) | 57 | 56 2% | 50 12% | 52 9% | 50.2 12% | 52 9% | 53 7% | 62 -9% | 48 16% |
* ... daha küçük daha iyidir
(+) Üst taraftaki maksimum sıcaklık, 40.4 °C / 105 F ortalamasına kıyasla 38.2 °C / 101 F'dir. , Gaming sınıfı için 21.2 ile 68.8 °C arasında değişir.
(±) Alt kısım, 43.2 °C / 110 F ortalamasına kıyasla maksimum 42 °C / 108 F'ye kadar ısınır
(+) Boşta kullanımda, üst tarafın ortalama sıcaklığı 28.9 °C / 84 F olup, cihazın 33.9 °C / 93 F.
(+) The Witcher 3 oynarken, üst tarafın ortalama sıcaklığı 29.5 °C / 85 F olup, cihazın 33.9 °C / 93 F.
(+) Avuç içi dayanakları ve dokunmatik yüzey, maksimum 26 °C / 78.8 F ile cilt sıcaklığından daha soğuktur ve bu nedenle dokunulduğunda soğuktur.
(+) Benzer cihazların avuç içi dayanağı alanının ortalama sıcaklığı 28.8 °C / 83.8 F (+2.8 °C / 5 F) idi.
Asus ROG Strix GL702VI-WB74 ses analizi
(±) | hoparlör ses yüksekliği ortalama ama iyi (72.5 dB)
Bas 100 - 315Hz
(±) | azaltılmış bas - ortalama olarak medyandan 7.5% daha düşük
(±) | Bas doğrusallığı ortalamadır (7.5% delta - önceki frekans)
Ortalar 400 - 2000 Hz
(+) | dengeli ortalar - medyandan yalnızca 3.9% uzakta
(+) | orta frekanslar doğrusaldır (4.8% deltadan önceki frekansa)
Yüksekler 2 - 16 kHz
(+) | dengeli yüksekler - medyandan yalnızca 3.7% uzakta
(±) | Yükseklerin doğrusallığı ortalamadır (10.4% delta - önceki frekans)
Toplam 100 - 16.000 Hz
(+) | genel ses doğrusaldır (14.4% ortancaya göre fark)
Aynı sınıfla karşılaştırıldığında
» Bu sınıftaki tüm test edilen cihazların %27%'si daha iyi, 7% benzer, 66% daha kötüydü
» En iyisinin deltası 6% idi, ortalama 18% idi, en kötüsü 132% idi
Test edilen tüm cihazlarla karşılaştırıldığında
» Test edilen tüm cihazların %18'si daha iyi, 4 benzer, % 78 daha kötüydü
» En iyisinin deltası 4% idi, ortalama 23% idi, en kötüsü 134% idi
Apple MacBook 12 (Early 2016) 1.1 GHz ses analizi
(+) | hoparlörler nispeten yüksek sesle çalabilir (83.6 dB)
Bas 100 - 315Hz
(±) | azaltılmış bas - ortalama olarak medyandan 11.3% daha düşük
(±) | Bas doğrusallığı ortalamadır (14.2% delta - önceki frekans)
Ortalar 400 - 2000 Hz
(+) | dengeli ortalar - medyandan yalnızca 2.4% uzakta
(+) | orta frekanslar doğrusaldır (5.5% deltadan önceki frekansa)
Yüksekler 2 - 16 kHz
(+) | dengeli yüksekler - medyandan yalnızca 2% uzakta
(+) | yüksekler doğrusaldır (4.5% deltadan önceki frekansa)
Toplam 100 - 16.000 Hz
(+) | genel ses doğrusaldır (10.2% ortancaya göre fark)
Aynı sınıfla karşılaştırıldığında
» Bu sınıftaki tüm test edilen cihazların %7%'si daha iyi, 2% benzer, 91% daha kötüydü
» En iyisinin deltası 5% idi, ortalama 18% idi, en kötüsü 53% idi
Test edilen tüm cihazlarla karşılaştırıldığında
» Test edilen tüm cihazların %5'si daha iyi, 1 benzer, % 94 daha kötüydü
» En iyisinin deltası 4% idi, ortalama 23% idi, en kötüsü 134% idi
| Kapalı / Bekleme modu | |
| Boşta | |
| Çalışırken |
|
Key:
min: | |
| Asus ROG Strix GL702VI-WB74 i7-7700HQ, GeForce GTX 1080 Mobile, Samsung PM961 MZVLW256HEHP, IPS, 1920x1080, 17.3" | Acer Predator 17 X GX-792-76DL i7-7820HK, GeForce GTX 1080 Mobile, Toshiba NVMe THNSN5512GPU7, IPS, 1920x1080, 17.3" | Schenker XMG U727 2017 i7-7700K, GeForce GTX 1080 Mobile, Samsung SM961 MZVPW256 m.2 PCI-e, AHVA, 3840x2160, 17.3" | Alienware 17 R4 i7-7820HK, GeForce GTX 1080 Mobile, SK Hynix PC300 NVMe 512 GB, TN LED, 2560x1440, 17.3" | Aorus X7 v7 i7-7820HK, GeForce GTX 1070 Mobile, Samsung SM961 MZVPW256HEGL, TN LED, 2560x1440, 17.3" | MSI GT75VR 7RF-012 Titan Pro i7-7820HK, GeForce GTX 1080 Mobile, 2x Samsung SM961 MZVPW256HEGL NVMe (RAID 0), TN LED, 1920x1080, 17.3" | Asus G701VIK-BA049T i7-7820HK, GeForce GTX 1080 Mobile, 2x Samsung SM961 MZVPW256HEGL NVMe (RAID 0), IPS, 1920x1080, 17.3" | |
|---|---|---|---|---|---|---|---|
| Power Consumption | -37% | -73% | -47% | -33% | -62% | -39% | |
| Idle Minimum * (Watt) | 19.8 | 27 -36% | 32 -62% | 37.5 -89% | 27 -36% | 34 -72% | 24 -21% |
| Idle Average * (Watt) | 25.2 | 32 -27% | 43 -71% | 37.6 -49% | 33 -31% | 41 -63% | 31 -23% |
| Idle Maximum * (Watt) | 25.9 | 41 -58% | 51 -97% | 37.6 -45% | 40 -54% | 50 -93% | 38 -47% |
| Load Average * (Watt) | 84.1 | 102 -21% | 138 -64% | 122.4 -46% | 107 -27% | 106 -26% | 98 -17% |
| Witcher 3 ultra * (Watt) | 198.6 | 279 -40% | 180.3 9% | 190 4% | 257 -29% | ||
| Load Maximum * (Watt) | 171.1 | 248 -45% | 350 -105% | 277.4 -62% | 259 -51% | 320 -87% | 320 -87% |
* ... daha küçük daha iyidir
| Asus ROG Strix GL702VI-WB74 i7-7700HQ, GeForce GTX 1080 Mobile, 88 Wh | Acer Predator 17 X GX-792-76DL i7-7820HK, GeForce GTX 1080 Mobile, 88.8 Wh | Schenker XMG U727 2017 i7-7700K, GeForce GTX 1080 Mobile, 89 Wh | Alienware 17 R4 i7-7820HK, GeForce GTX 1080 Mobile, 99 Wh | Aorus X7 v7 i7-7820HK, GeForce GTX 1070 Mobile, 94 Wh | MSI GT75VR 7RF-012 Titan Pro i7-7820HK, GeForce GTX 1080 Mobile, 75 Wh | Asus Strix GL702VSK i7-7700HQ, GeForce GTX 1070 Mobile, 76 Wh | Asus G701VIK-BA049T i7-7820HK, GeForce GTX 1080 Mobile, 93 Wh | |
|---|---|---|---|---|---|---|---|---|
| Pil Çalışma Süresi | 0% | -18% | -21% | -21% | -37% | -10% | -1% | |
| Reader / Idle (h) | 6.4 | 5.2 -19% | 3.7 -42% | 4.6 -28% | 3.7 -42% | 3 -53% | 5.1 -20% | 5.7 -11% |
| WiFi v1.3 (h) | 3.5 | 4.2 20% | 2.8 -20% | 3 -14% | 3 -14% | 2.4 -31% | 3.4 -3% | 4 14% |
| Load (h) | 1.5 | 1.5 0% | 1.6 7% | 1.2 -20% | 1.4 -7% | 1.1 -27% | 1.4 -7% | 1.4 -7% |
Artılar
Eksiler

Genel olarak Asus ROG Strix GL702VI çok fazla eksikliği olmayan tatmin edici bir oyun cihazı. Sistemin tam potansiyeline erişemediğini düşünsek de bunun Asus tarafından sıcaklık yönetimini ön planda tutmasından kaynaklı diyebiliriz. Bunnla birlikte Asus'un kesinlikle fan yönetimini bir güncelleme ile elden geçirmesi gerekli, çünkü fanların davranışı bir süre sonra rahatsız hale gelebiliyor.
Asus ROG Strix GL702VI her ne kadar güçlü bileşenlere sahip olsa da saf performans yönünden biraz geri kalıyor.
Klavye uzun kullanım için ideal. Avuç içi bölgesi her daim serin. Bağlantı seçimleri yeterli. Nvidia GeForce GTX 1070 grafik kartı, 120 Hz G-Sync Full HD IPS ekran ile oyun deneyimi çok iyi. Cihazının sınırlarını zorlamak isteyen kullanıcılar başka alternatiflere bakmalı, ama bunun dışında Strix GL702VI makul ve ucuz bir alternatif.
Asus ROG Strix GL702VI-WB74
- 02/14/2018 v6 (old)
Bernhard Pechlaner
Price comparison