Kısa inceleme: Asus ROG Zephyrus M GM501 (i7-8750H, GTX 1070, Full-HD) Laptop
| Networking | |
| iperf3 transmit AX12 | |
| Asus Zephyrus M GM501 | |
| Acer Predator Triton 700 | |
| MSI GS63VR 7RG-005 | |
| Asus Zephyrus GX501 | |
| Gigabyte Aero 15X | |
| iperf3 receive AX12 | |
| MSI GS63VR 7RG-005 | |
| Gigabyte Aero 15X | |
| Asus Zephyrus GX501 | |
| Asus Zephyrus M GM501 | |
| Acer Predator Triton 700 | |
| |||||||||||||||||||||||||
Aydınlatma: 89 %
Batarya modunda parlaklık: 307 cd/m²
Kontrast: 1228:1 (Siyah: 0.25 cd/m²)
ΔE ColorChecker Calman: 5.74 | ∀{0.5-29.43 Ø4.73}
calibrated: 1.94
ΔE Greyscale Calman: 6.44 | ∀{0.09-98 Ø4.97}
93% sRGB (Argyll 1.6.3 3D)
60% AdobeRGB 1998 (Argyll 1.6.3 3D)
67.2% AdobeRGB 1998 (Argyll 3D)
92.7% sRGB (Argyll 3D)
66.1% Display P3 (Argyll 3D)
Gamma: 2.48
CCT: 8395 K
| Asus Zephyrus M GM501 AUO B156HAN07.1 (AUO71ED), IPS, 1920x1080 | Asus Zephyrus GX501 AUO B156HAN04.2 (AUO42ED), IPS, 1920x1080 | Acer Predator Triton 700 AUO B156HAN04.2 (AUO42ED), IPS, 1920x1080 | Gigabyte Aero 15X Chi Mei N156HCA-EA1 (CMN15D7), IPS, 1920x1080 | MSI GS63VR 7RG-005 Chi Mei N156HHE-GA1 (CMN15F4), TN LED, 1920x1080 | |
|---|---|---|---|---|---|
| Display | -2% | -5% | -2% | 25% | |
| Display P3 Coverage (%) | 66.1 | 64.8 -2% | 62.5 -5% | 64.7 -2% | 91.6 39% |
| sRGB Coverage (%) | 92.7 | 91.8 -1% | 88.7 -4% | 90.4 -2% | 100 8% |
| AdobeRGB 1998 Coverage (%) | 67.2 | 65.9 -2% | 63.5 -6% | 65.7 -2% | 86.6 29% |
| Response Times | -322% | -382% | -364% | -11% | |
| Response Time Grey 50% / Grey 80% * (ms) | 6.6 ? | 40.4 ? -512% | 44.8 ? -579% | 43.2 ? -555% | 10.4 ? -58% |
| Response Time Black / White * (ms) | 10.4 ? | 24 ? -131% | 29.6 ? -185% | 28.4 ? -173% | 6.6 ? 37% |
| PWM Frequency (Hz) | 26000 ? | 25510 ? | |||
| Screen | 2% | 0% | -7% | 18% | |
| Brightness middle (cd/m²) | 307 | 328 7% | 291 -5% | 338 10% | 269 -12% |
| Brightness (cd/m²) | 296 | 305 3% | 277 -6% | 324 9% | 254 -14% |
| Brightness Distribution (%) | 89 | 83 -7% | 84 -6% | 88 -1% | 85 -4% |
| Black Level * (cd/m²) | 0.25 | 0.25 -0% | 0.22 12% | 0.34 -36% | 0.21 16% |
| Contrast (:1) | 1228 | 1312 7% | 1323 8% | 994 -19% | 1281 4% |
| Colorchecker dE 2000 * | 5.74 | 6.02 -5% | 5.52 4% | 5.92 -3% | 3 48% |
| Colorchecker dE 2000 max. * | 11.32 | 10.14 10% | 10.72 5% | 11.77 -4% | 5.62 50% |
| Colorchecker dE 2000 calibrated * | 1.94 | ||||
| Greyscale dE 2000 * | 6.44 | 6.32 2% | 6.59 -2% | 7.45 -16% | 3.18 51% |
| Gamma | 2.48 89% | 2.28 96% | 2.44 90% | 2.58 85% | 2.25 98% |
| CCT | 8395 77% | 8194 79% | 7816 83% | 6366 102% | 7274 89% |
| Color Space (Percent of AdobeRGB 1998) (%) | 60 | 60 0% | 58 -3% | 59 -2% | 77 28% |
| Color Space (Percent of sRGB) (%) | 93 | 92 -1% | 89 -4% | 90 -3% | 100 8% |
| Toplam Ortalama (Program / Ayarlar) | -107% /
-42% | -129% /
-52% | -124% /
-53% | 11% /
15% |
* ... daha küçük daha iyidir
Yanıt Sürelerini Görüntüle
| ↔ Tepki Süresi Siyahtan Beyaza | ||
|---|---|---|
| 10.4 ms ... yükseliş ↗ ve sonbahar↘ birleşimi | ↗ 5.2 ms yükseliş | 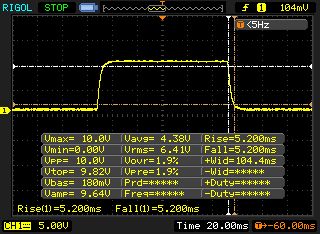 |
| ↘ 5.2 ms sonbahar | ||
| Ekran, testlerimizde iyi yanıt oranları gösteriyor ancak rekabetçi oyuncular için çok yavaş olabilir. Karşılaştırıldığında, test edilen tüm cihazlar 0.1 (minimum) ile 240 (maksimum) ms arasında değişir. » Tüm cihazların 28 %'si daha iyi. Bu, ölçülen yanıt süresinin test edilen tüm cihazların ortalamasından (19.9 ms) daha iyi olduğu anlamına gelir. | ||
| ↔ Tepki Süresi %50 Griden %80 Griye | ||
| 6.6 ms ... yükseliş ↗ ve sonbahar↘ birleşimi | ↗ 3.4 ms yükseliş | 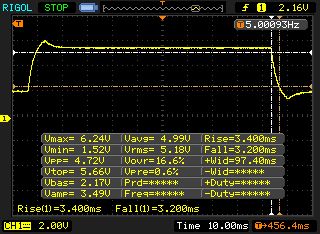 |
| ↘ 3.2 ms sonbahar | ||
| Ekran, testlerimizde çok hızlı yanıt oranları gösteriyor ve hızlı oyun oynamaya çok uygun olmalı. Karşılaştırıldığında, test edilen tüm cihazlar 0.165 (minimum) ile 636 (maksimum) ms arasında değişir. » Tüm cihazların 19 %'si daha iyi. Bu, ölçülen yanıt süresinin test edilen tüm cihazların ortalamasından (31.1 ms) daha iyi olduğu anlamına gelir. | ||
Ekran Titremesi / PWM (Darbe Genişliği Modülasyonu)
| Ekran titriyor / PWM algılanmadı | 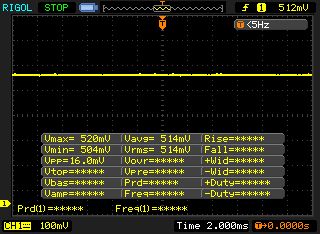 | ||
Karşılaştırıldığında: Test edilen tüm cihazların %52 %'si ekranı karartmak için PWM kullanmıyor. PWM tespit edilirse, ortalama 7798 (minimum: 5 - maksimum: 343500) Hz ölçüldü. | |||
| PCMark 8 Home Score Accelerated v2 | 4627 puan | |
| PCMark 8 Work Score Accelerated v2 | 5662 puan | |
| PCMark 10 Score | 5194 puan | |
Yardım | ||
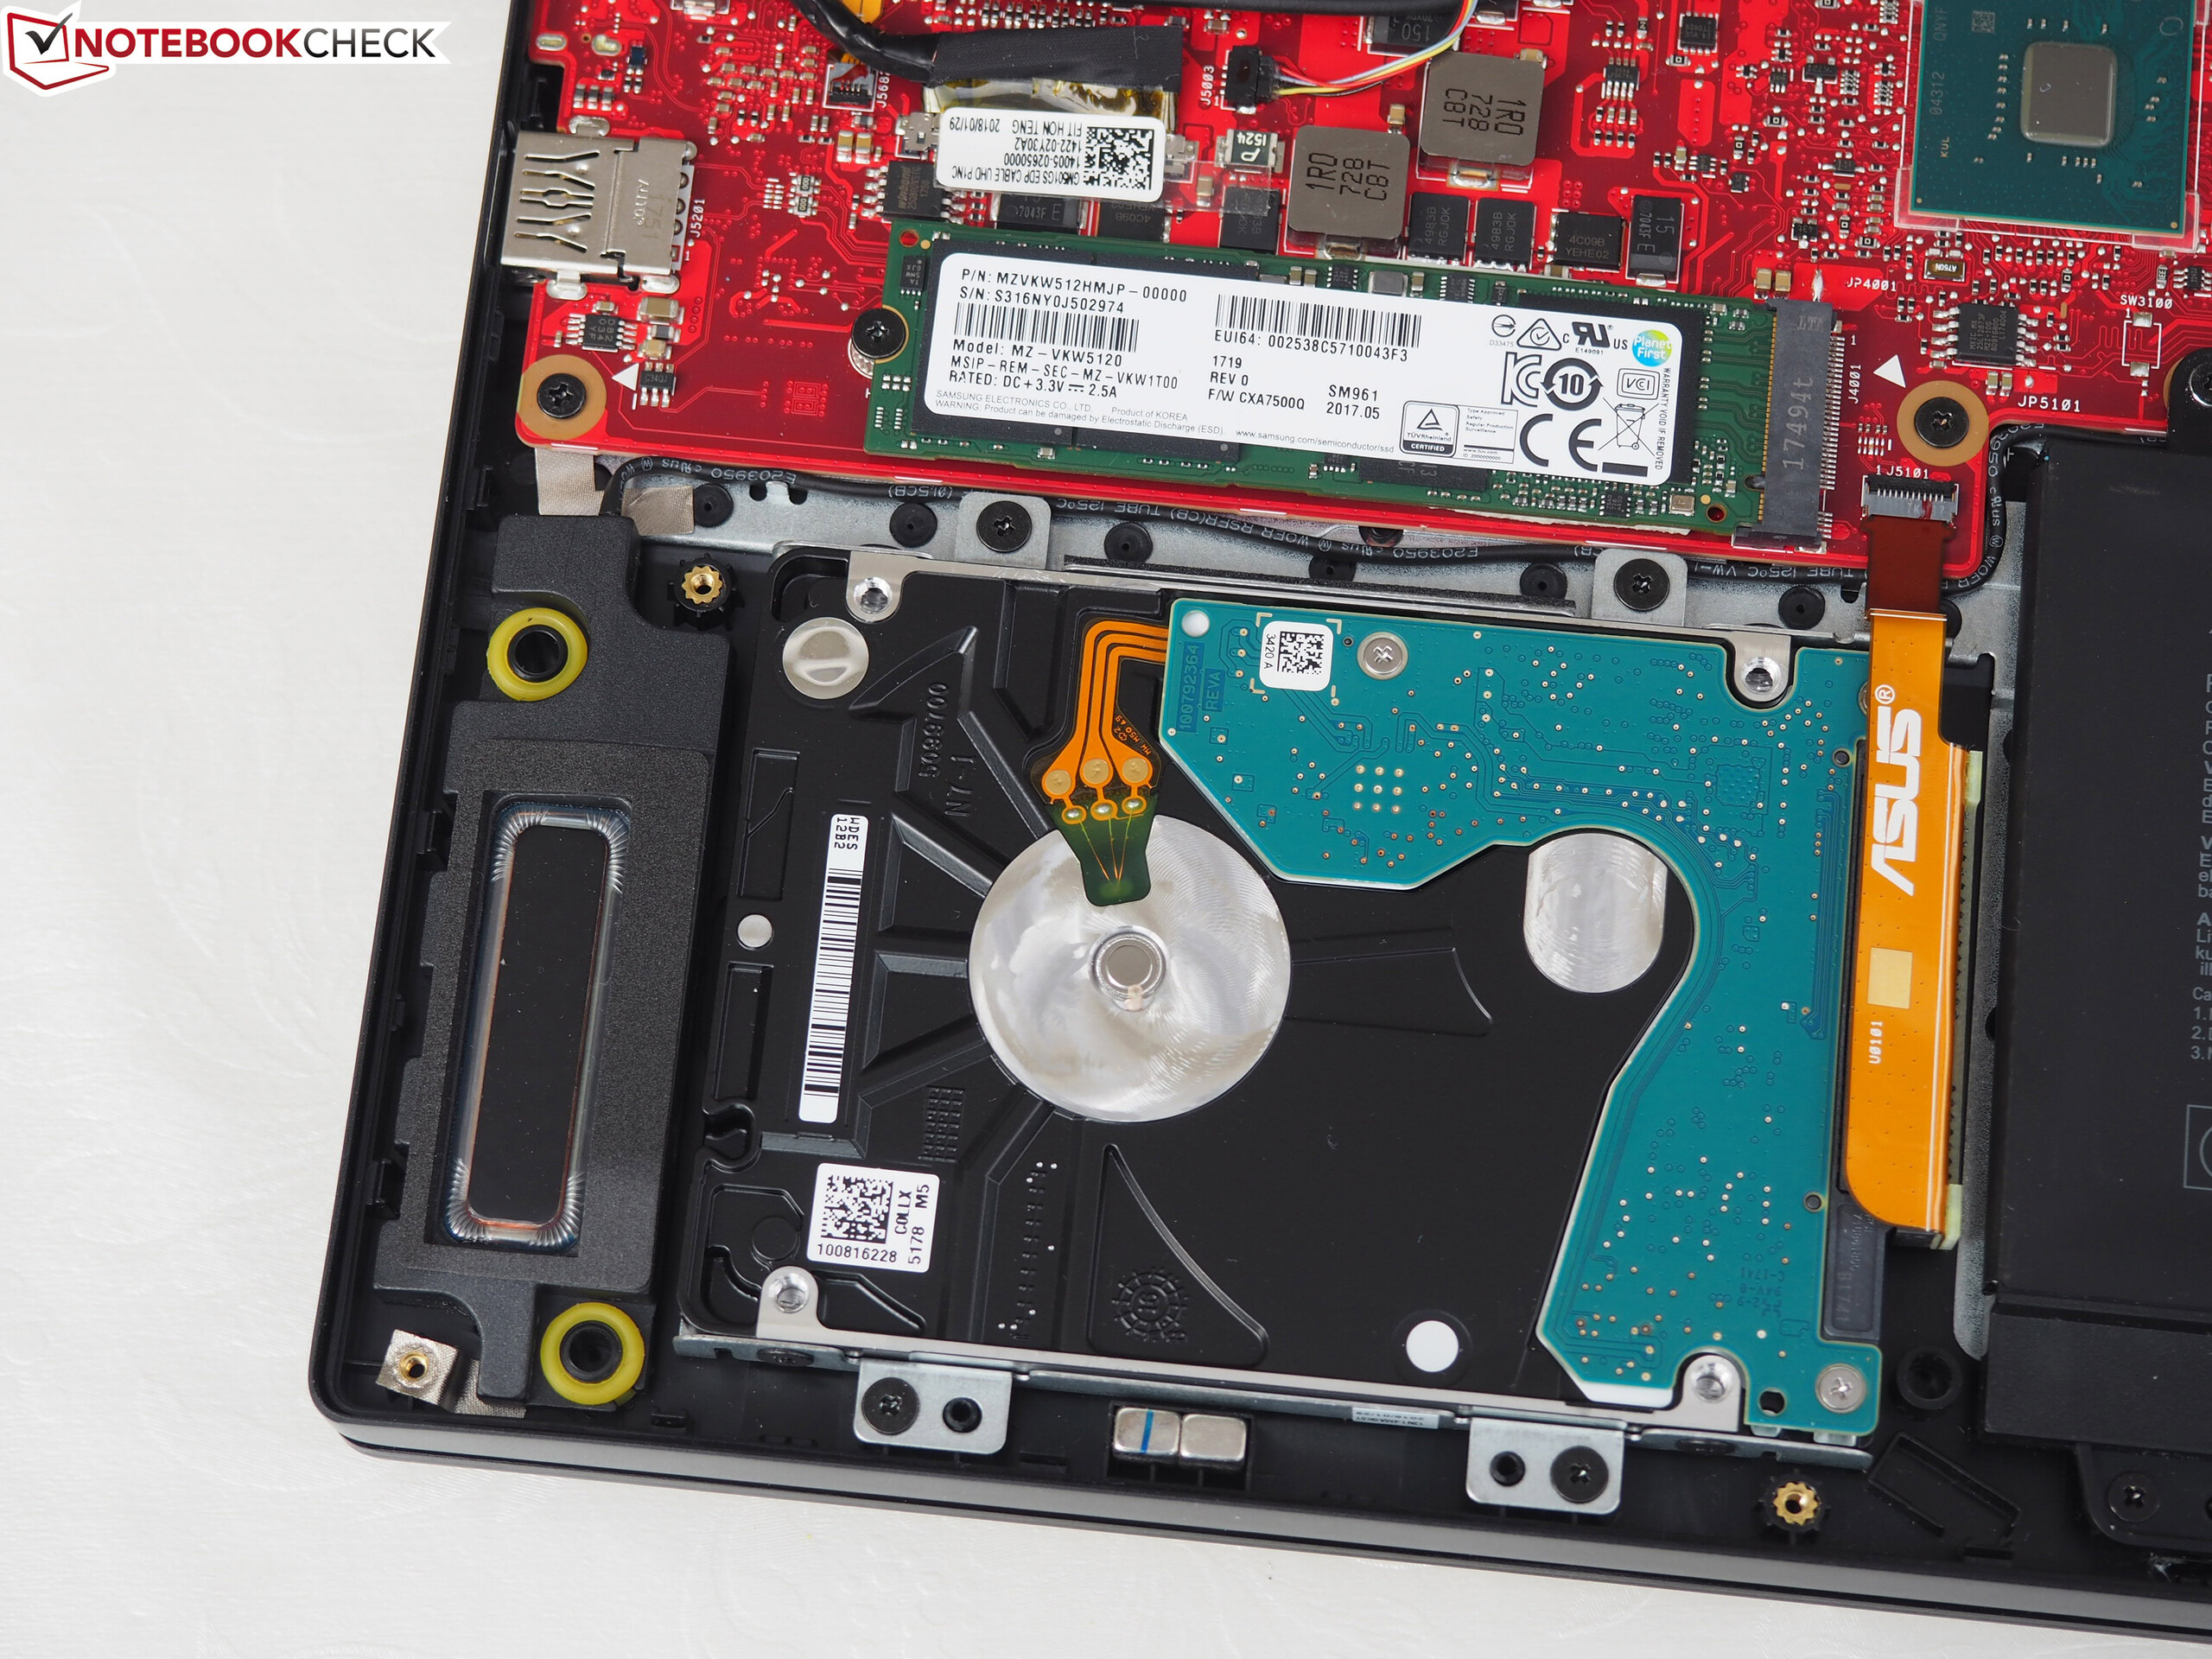
| Asus Zephyrus M GM501 Samsung SM961 MZVKW512HMJP m.2 PCI-e | Asus Zephyrus GX501 Samsung SSD SM961 1TB M.2 MZVKW1T0HMLH | Acer Predator Triton 700 2x SK Hynix Canvas SC300 512GB M.2 (HFS512G39MND) (RAID 0) | Gigabyte Aero 15X Samsung SM961 MZVKW512HMJP m.2 PCI-e | MSI GS63VR 7RG-005 Samsung SM961 MZVPW256HEGL | Ortalama Samsung SM961 MZVKW512HMJP m.2 PCI-e | |
|---|---|---|---|---|---|---|
| AS SSD | 5% | 2% | 8% | 5% | ||
| Seq Read (MB/s) | 2091 | 2517 20% | 2508 20% | 2382 14% | 2576 ? 23% | |
| Seq Write (MB/s) | 1580 | 2372 50% | 1124 -29% | 1281 -19% | 1438 ? -9% | |
| 4K Read (MB/s) | 43.42 | 41.47 -4% | 46.56 7% | 51 17% | 47.8 ? 10% | |
| 4K Write (MB/s) | 90.2 | 93 3% | 113.8 26% | 124.7 38% | 114.2 ? 27% | |
| Score Read (Points) | 1471 | 1350 -8% | 1522 3% | 1795 22% | 1475 ? 0% | |
| Score Write (Points) | 1446 | 1243 -14% | 1333 -8% | 1185 -18% | 1267 ? -12% | |
| Score Total (Points) | 3649 | 3282 -10% | 3570 -2% | 3848 5% | 3447 ? -6% |

| 3DMark 06 Standard Score | 31045 puan | |
| 3DMark 11 Performance | 18278 puan | |
| 3DMark Cloud Gate Standard Score | 36015 puan | |
| 3DMark Fire Strike Score | 14945 puan | |
Yardım | ||
| The Witcher 3 - 1920x1080 Ultra Graphics & Postprocessing (HBAO+) | |
| Sınıf ortalaması Gaming (95 - 240, n=8, son 2 yıl) | |
| Acer Predator Triton 700 | |
| Asus Zephyrus GX501 | |
| Asus Zephyrus M GM501 | |
| Ortalama NVIDIA GeForce GTX 1070 Mobile (48.2 - 68.4, n=41) | |
| Gigabyte Aero 15X | |
| MSI GS63VR 7RG-005 | |
| düşük | orta | yüksek | ultra | |
|---|---|---|---|---|
| The Witcher 3 (2015) | 106 | 59.4 | ||
| Rocket League (2017) | 143 | |||
| Dirt 4 (2017) | 126 | 78.4 | ||
| Playerunknown's Battlegrounds (PUBG) (2017) | 131 | 86.2 | ||
| F1 2017 (2017) | 119 | 88 | ||
| Middle-earth: Shadow of War (2017) | 102 | 75 | ||
| The Evil Within 2 (2017) | 59.6 | 58.1 | ||
| ELEX (2017) | 99.1 | 75 | ||
| Call of Duty WWII (2017) | 144 | 117 | ||
| Kingdom Come: Deliverance (2018) | 75.6 | 54.2 |
Ses yüksekliği
| Boşta |
| 30 / 31 / 33 dB |
| Çalışırken |
| 49 / 52 dB |
 | ||
30 dB sessiz 40 dB(A) duyulabilirlik 50 dB(A) gürültülü |
||
min: | ||
| Asus Zephyrus M GM501 GeForce GTX 1070 Mobile, i7-8750H | Asus Zephyrus GX501 GeForce GTX 1080 Max-Q, i7-7700HQ | Acer Predator Triton 700 GeForce GTX 1080 Max-Q, i7-7700HQ | Gigabyte Aero 15X GeForce GTX 1070 Max-Q, i7-7700HQ | MSI GS63VR 7RG-005 GeForce GTX 1070 Max-Q, i7-7700HQ | Ortalama NVIDIA GeForce GTX 1070 Mobile | Sınıf ortalaması Gaming | |
|---|---|---|---|---|---|---|---|
| Noise | 4% | -1% | 2% | 2% | -3% | 10% | |
| kapalı / ortam * (dB) | 29 | 31 -7% | 31 -7% | 30 -3% | 30 -3% | 29.8 ? -3% | 24.1 ? 17% |
| Idle Minimum * (dB) | 30 | 32 -7% | 33 -10% | 31 -3% | 31 -3% | 31.9 ? -6% | 25.8 ? 14% |
| Idle Average * (dB) | 31 | 33 -6% | 34 -10% | 32 -3% | 34 -10% | 33.4 ? -8% | 27.4 ? 12% |
| Idle Maximum * (dB) | 33 | 34 -3% | 40 -21% | 36 -9% | 35 -6% | 36.3 ? -10% | 30 ? 9% |
| Load Average * (dB) | 49 | 39 20% | 41 16% | 39 20% | 42 14% | 44.5 ? 9% | 43 ? 12% |
| Witcher 3 ultra * (dB) | 50 | 42 16% | 43 14% | 44 12% | 44 12% | ||
| Load Maximum * (dB) | 52 | 46 12% | 48 8% | 52 -0% | 46 12% | 51.4 ? 1% | 54 ? -4% |
* ... daha küçük daha iyidir
(-) Üst taraftaki maksimum sıcaklık, 40.4 °C / 105 F ortalamasına kıyasla 52 °C / 126 F'dir. , Gaming sınıfı için 21.2 ile 68.8 °C arasında değişir.
(-) Alt kısım, 43.2 °C / 110 F ortalamasına kıyasla maksimum 49 °C / 120 F'ye kadar ısınır
(+) Boşta kullanımda, üst tarafın ortalama sıcaklığı 28.8 °C / 84 F olup, cihazın 33.9 °C / 93 F.
(-) The Witcher 3 oynarken, üst tarafın ortalama sıcaklığı 43.3 °C / 110 F olup, cihazın 33.9 °C / 93 F.
(±) Avuç içi dayanakları ve dokunmatik yüzey maksimum 38 °C / 100.4 F ile dokunulamayacak kadar ısınabilir.
(-) Benzer cihazların avuç içi dayanağı alanının ortalama sıcaklığı 28.8 °C / 83.8 F (-9.2 °C / -16.6 F) idi.
| Asus Zephyrus M GM501 GeForce GTX 1070 Mobile, i7-8750H | Asus Zephyrus GX501 GeForce GTX 1080 Max-Q, i7-7700HQ | Acer Predator Triton 700 GeForce GTX 1080 Max-Q, i7-7700HQ | Gigabyte Aero 15X GeForce GTX 1070 Max-Q, i7-7700HQ | MSI GS63VR 7RG-005 GeForce GTX 1070 Max-Q, i7-7700HQ | Ortalama NVIDIA GeForce GTX 1070 Mobile | Sınıf ortalaması Gaming | |
|---|---|---|---|---|---|---|---|
| Heat | -6% | -14% | 6% | 3% | 2% | 1% | |
| Maximum Upper Side * (°C) | 52 | 57 -10% | 61 -17% | 51 2% | 47 10% | 47.1 ? 9% | 45.2 ? 13% |
| Maximum Bottom * (°C) | 49 | 54 -10% | 69 -41% | 58 -18% | 63 -29% | 50.9 ? -4% | 48 ? 2% |
| Idle Upper Side * (°C) | 31 | 32 -3% | 29 6% | 25 19% | 25 19% | 30.6 ? 1% | 31.1 ? -0% |
| Idle Bottom * (°C) | 31 | 31 -0% | 32 -3% | 25 19% | 27 13% | 30.3 ? 2% | 34.2 ? -10% |
* ... daha küçük daha iyidir
Asus Zephyrus M GM501 ses analizi
(+) | hoparlörler nispeten yüksek sesle çalabilir (86 dB)
Bas 100 - 315Hz
(+) | iyi bas - medyandan yalnızca 4.8% uzakta
(±) | Bas doğrusallığı ortalamadır (8.3% delta - önceki frekans)
Ortalar 400 - 2000 Hz
(+) | dengeli ortalar - medyandan yalnızca 3.2% uzakta
(+) | orta frekanslar doğrusaldır (3.6% deltadan önceki frekansa)
Yüksekler 2 - 16 kHz
(±) | daha yüksek en yüksekler - ortalama olarak medyandan 5.8% daha yüksek
(+) | yüksekler doğrusaldır (6.5% deltadan önceki frekansa)
Toplam 100 - 16.000 Hz
(+) | genel ses doğrusaldır (11.5% ortancaya göre fark)
Aynı sınıfla karşılaştırıldığında
» Bu sınıftaki tüm test edilen cihazların %10%'si daha iyi, 3% benzer, 87% daha kötüydü
» En iyisinin deltası 6% idi, ortalama 18% idi, en kötüsü 132% idi
Test edilen tüm cihazlarla karşılaştırıldığında
» Test edilen tüm cihazların %8'si daha iyi, 2 benzer, % 90 daha kötüydü
» En iyisinin deltası 4% idi, ortalama 24% idi, en kötüsü 134% idi
Acer Predator Triton 700 ses analizi
(+) | hoparlörler nispeten yüksek sesle çalabilir (83 dB)
Bas 100 - 315Hz
(-) | neredeyse hiç bas yok - ortalama olarak medyandan 15.2% daha düşük
(±) | Bas doğrusallığı ortalamadır (10.1% delta - önceki frekans)
Ortalar 400 - 2000 Hz
(±) | daha yüksek ortalar - ortalama olarak medyandan 8% daha yüksek
(+) | orta frekanslar doğrusaldır (6.7% deltadan önceki frekansa)
Yüksekler 2 - 16 kHz
(+) | dengeli yüksekler - medyandan yalnızca 2% uzakta
(+) | yüksekler doğrusaldır (4.9% deltadan önceki frekansa)
Toplam 100 - 16.000 Hz
(±) | Genel sesin doğrusallığı ortalamadır (19.9% ortancaya göre fark)
Aynı sınıfla karşılaştırıldığında
» Bu sınıftaki tüm test edilen cihazların %70%'si daha iyi, 6% benzer, 24% daha kötüydü
» En iyisinin deltası 6% idi, ortalama 18% idi, en kötüsü 132% idi
Test edilen tüm cihazlarla karşılaştırıldığında
» Test edilen tüm cihazların %51'si daha iyi, 7 benzer, % 42 daha kötüydü
» En iyisinin deltası 4% idi, ortalama 24% idi, en kötüsü 134% idi
| Kapalı / Bekleme modu | |
| Boşta | |
| Çalışırken |
|
Key:
min: | |
| Asus Zephyrus M GM501 GeForce GTX 1070 Mobile, i7-8750H | Asus Zephyrus GX501 GeForce GTX 1080 Max-Q, i7-7700HQ | Acer Predator Triton 700 GeForce GTX 1080 Max-Q, i7-7700HQ | Gigabyte Aero 15X GeForce GTX 1070 Max-Q, i7-7700HQ | MSI GS63VR 7RG-005 GeForce GTX 1070 Max-Q, i7-7700HQ | Ortalama NVIDIA GeForce GTX 1070 Mobile | Sınıf ortalaması Gaming | |
|---|---|---|---|---|---|---|---|
| Power Consumption | -1% | -33% | 28% | 21% | -21% | 1% | |
| Idle Minimum * (Watt) | 16 | 18 -13% | 28 -75% | 10 37% | 12 25% | 21 ? -31% | 13.2 ? 17% |
| Idle Average * (Watt) | 19 | 23 -21% | 33 -74% | 13 32% | 16 16% | 26.4 ? -39% | 18.9 ? 1% |
| Idle Maximum * (Watt) | 26 | 31 -19% | 41 -58% | 20 23% | 21 19% | 31.8 ? -22% | 24.3 ? 7% |
| Load Average * (Watt) | 103 | 79 23% | 94 9% | 79 23% | 85 17% | 117.7 ? -14% | 108 ? -5% |
| Witcher 3 ultra * (Watt) | 164 | 148 10% | 160 2% | 120 27% | 128 22% | ||
| Load Maximum * (Watt) | 223 | 196 12% | 222 -0% | 165 26% | 162 27% | 219 ? 2% | 254 ? -14% |
* ... daha küçük daha iyidir
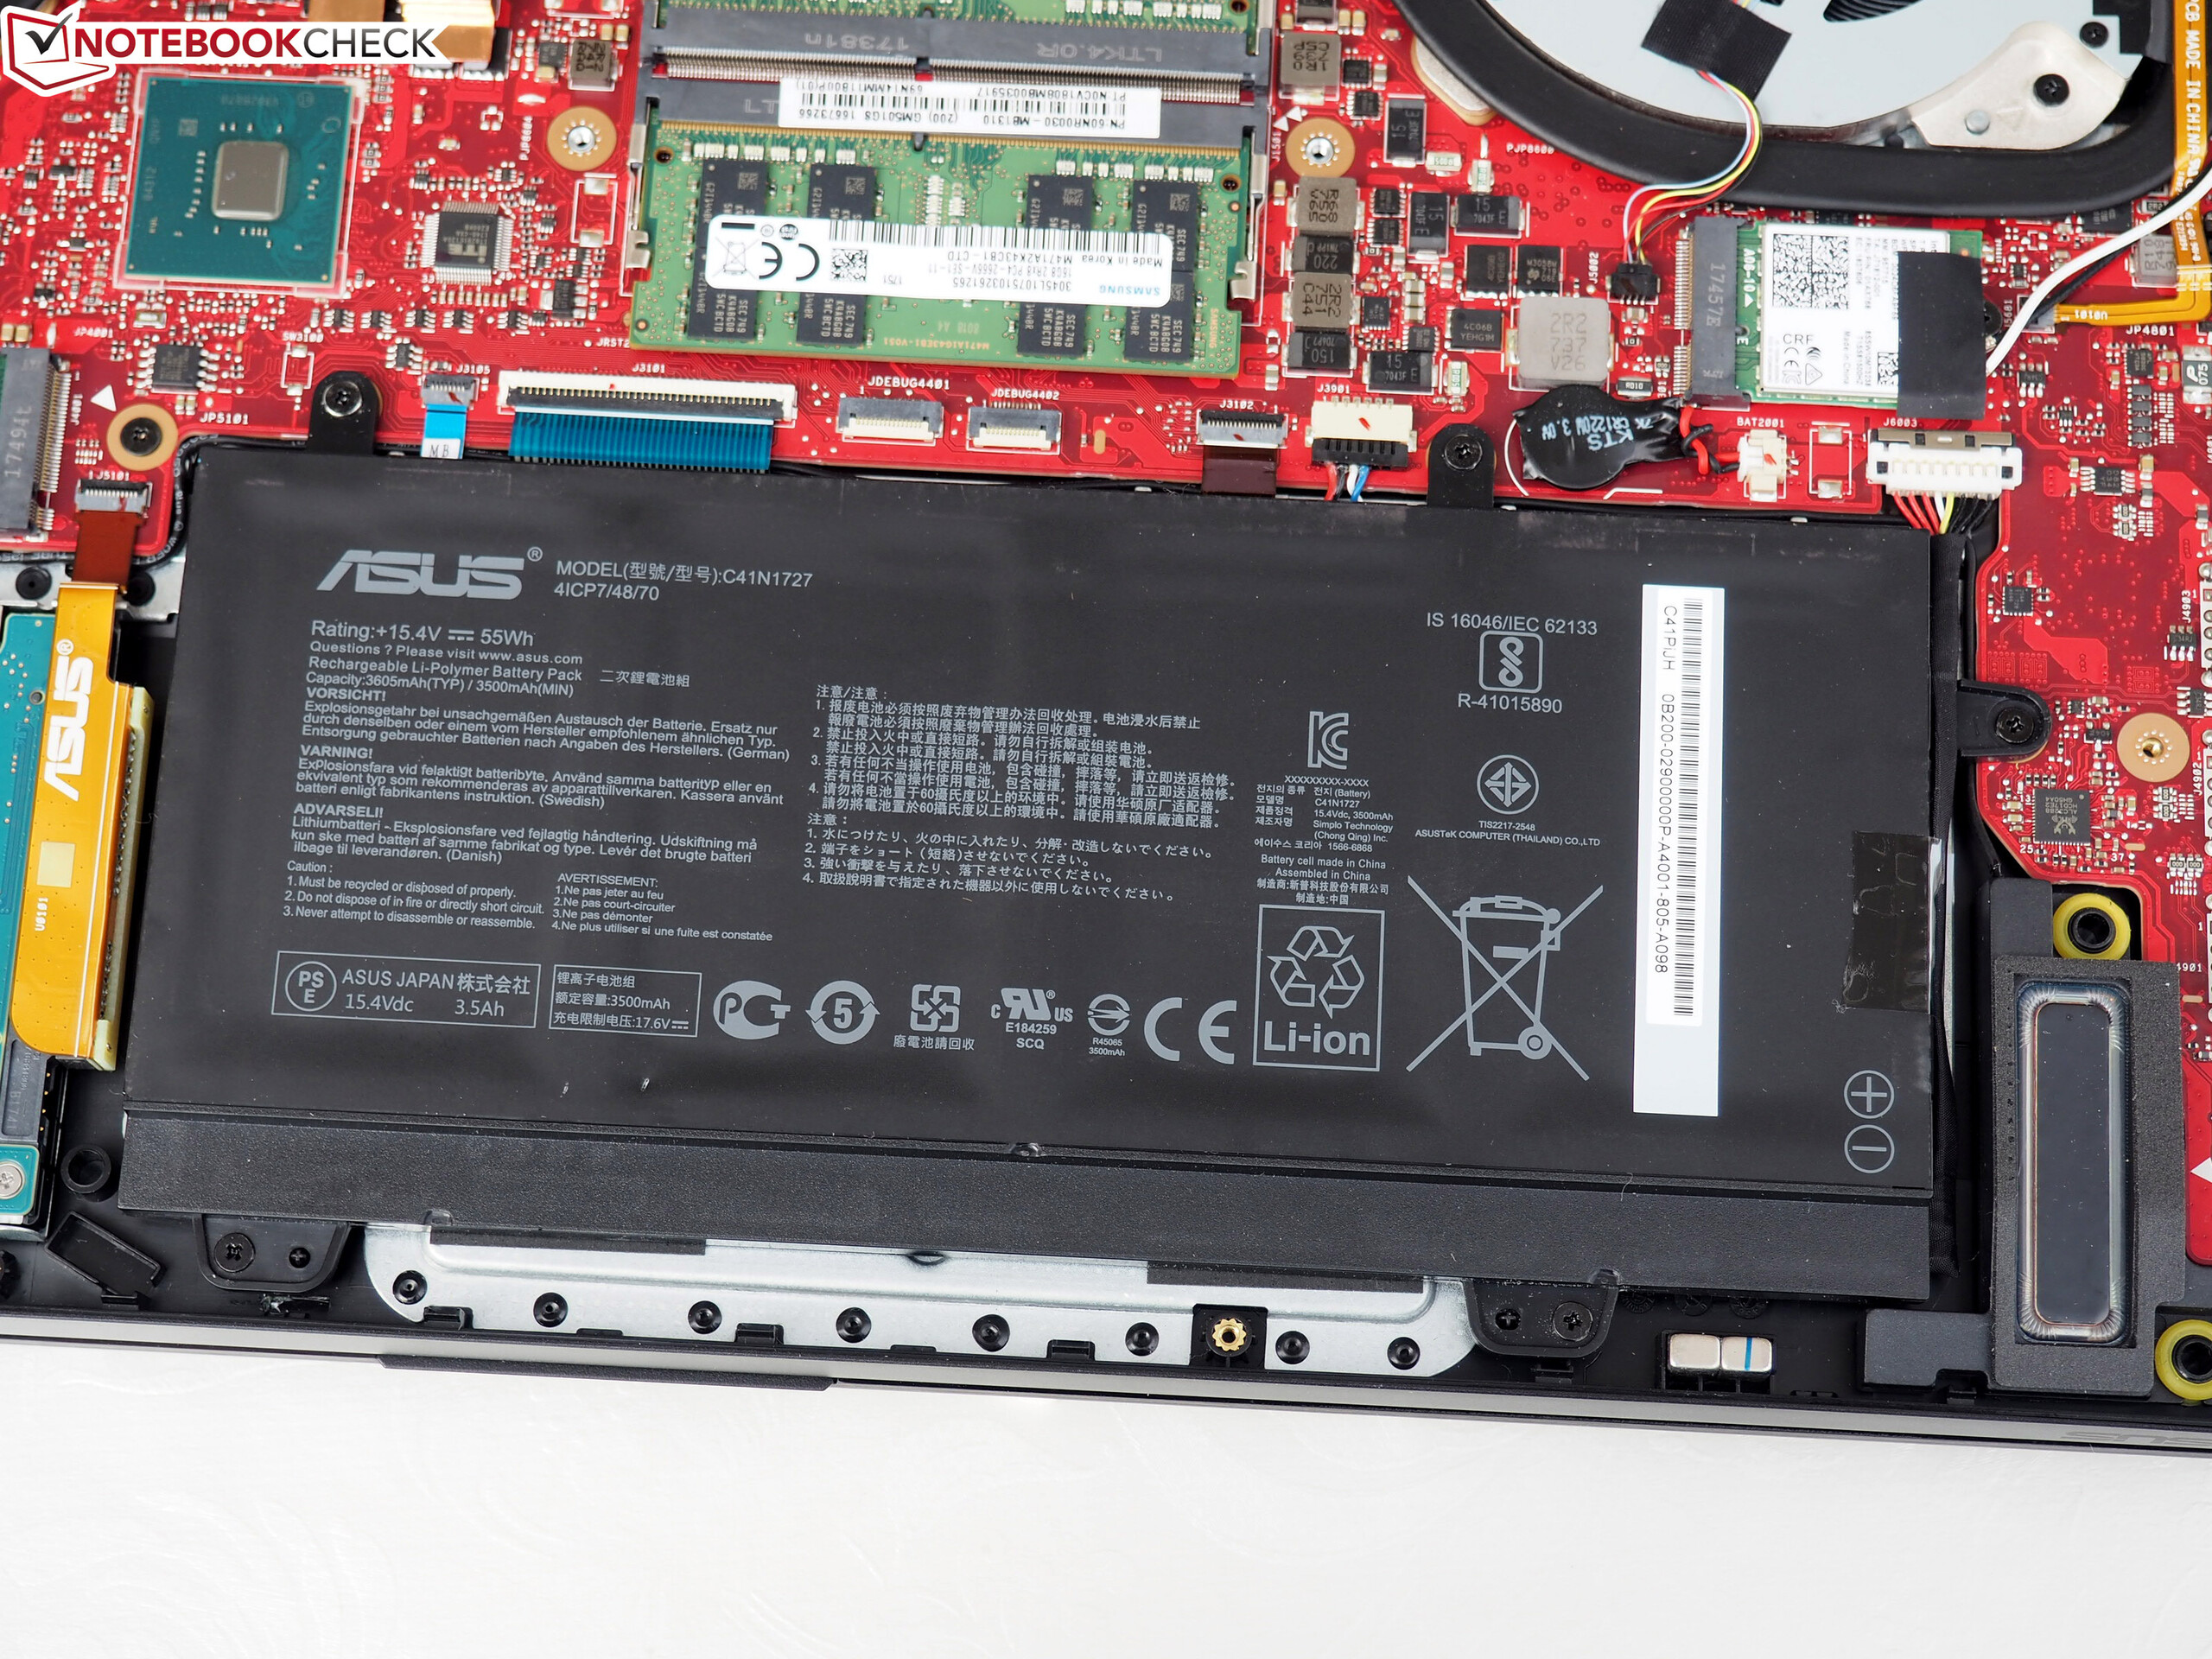
| Asus Zephyrus M GM501 GeForce GTX 1070 Mobile, i7-8750H, 55 Wh | Asus Zephyrus GX501 GeForce GTX 1080 Max-Q, i7-7700HQ, 50 Wh | Acer Predator Triton 700 GeForce GTX 1080 Max-Q, i7-7700HQ, 54 Wh | Gigabyte Aero 15X GeForce GTX 1070 Max-Q, i7-7700HQ, 94.2 Wh | MSI GS63VR 7RG-005 GeForce GTX 1070 Max-Q, i7-7700HQ, 52.4 Wh | Sınıf ortalaması Gaming | |
|---|---|---|---|---|---|---|
| Pil Çalışma Süresi | -26% | -20% | 182% | 28% | 127% | |
| Reader / Idle (h) | 4 | 3.1 -22% | 2.5 -37% | 13 225% | 5.7 43% | 8.71 ? 118% |
| H.264 (h) | 2.7 | 2.2 -19% | 1.8 -33% | 7.6 181% | 3.8 41% | 8.26 ? 206% |
| WiFi v1.3 (h) | 2.7 | 2.2 -19% | 2.4 -11% | 8.2 204% | 3.9 44% | 7.02 ? 160% |
| Load (h) | 1.2 | 0.7 -42% | 1.2 0% | 2.6 117% | 1 -17% | 1.47 ? 23% |
Artılar
Eksiler
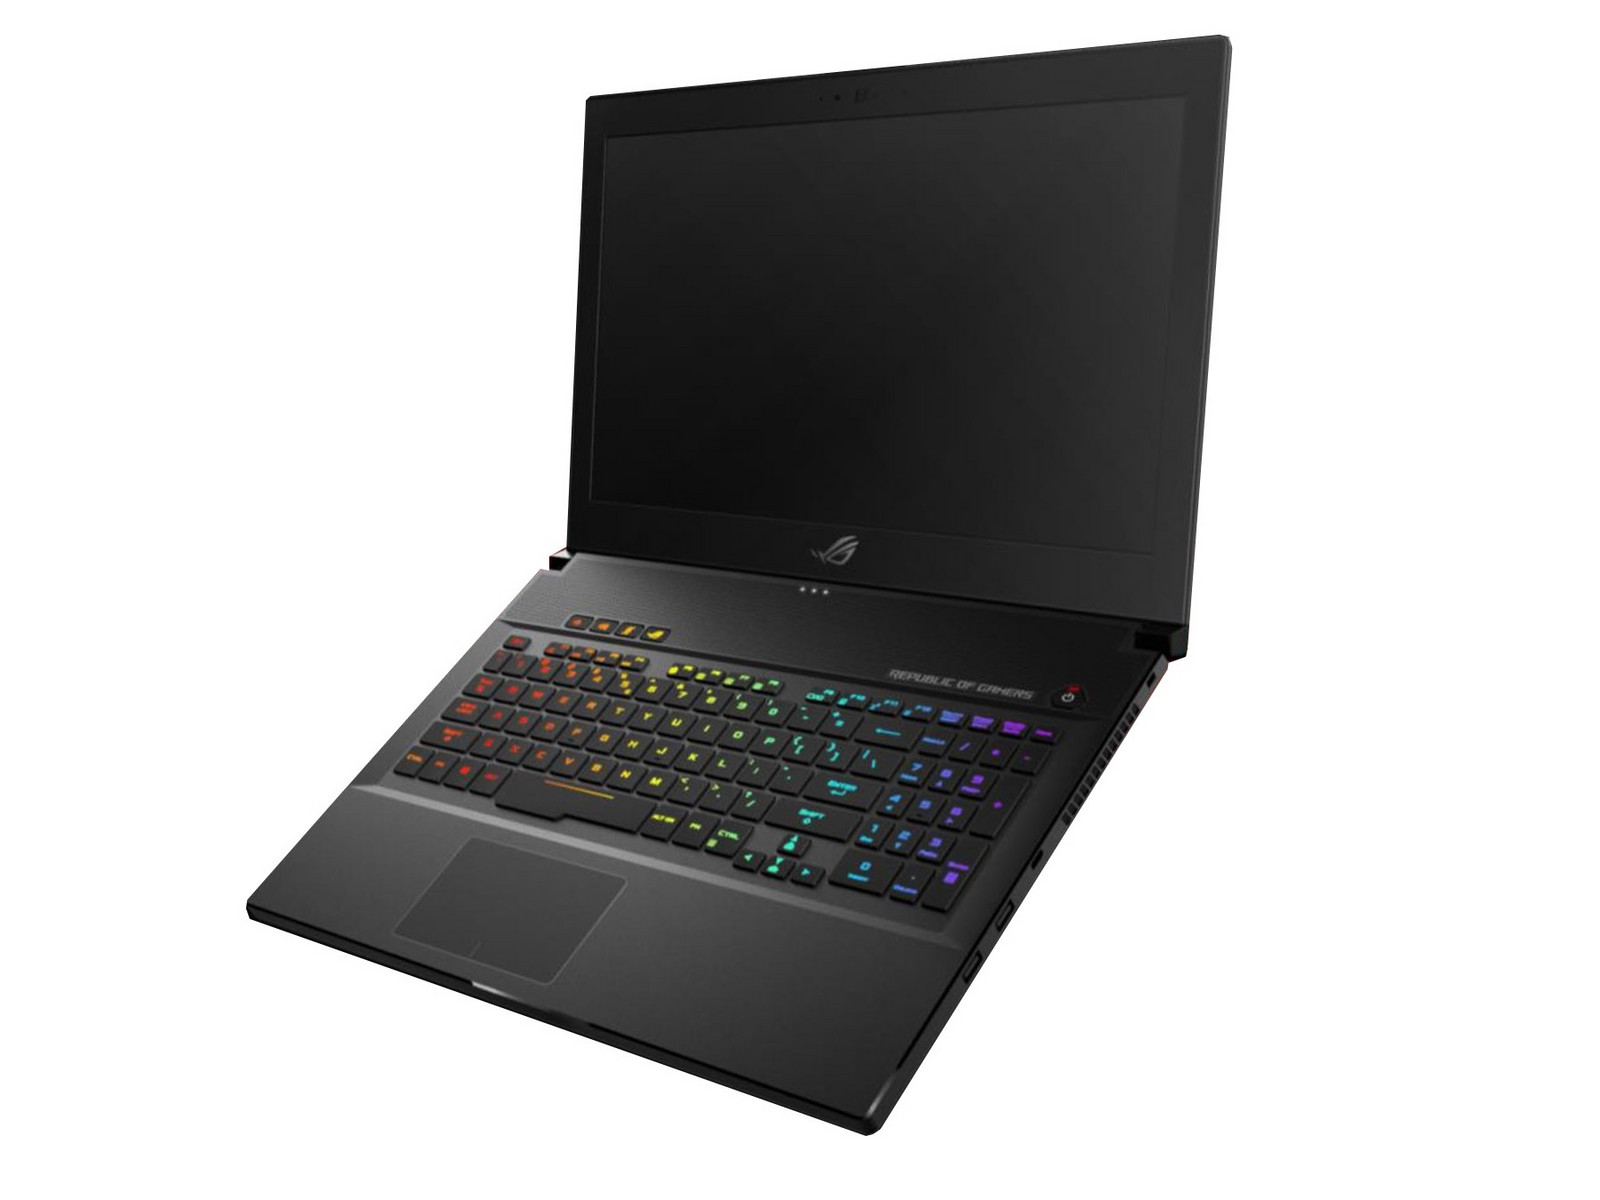
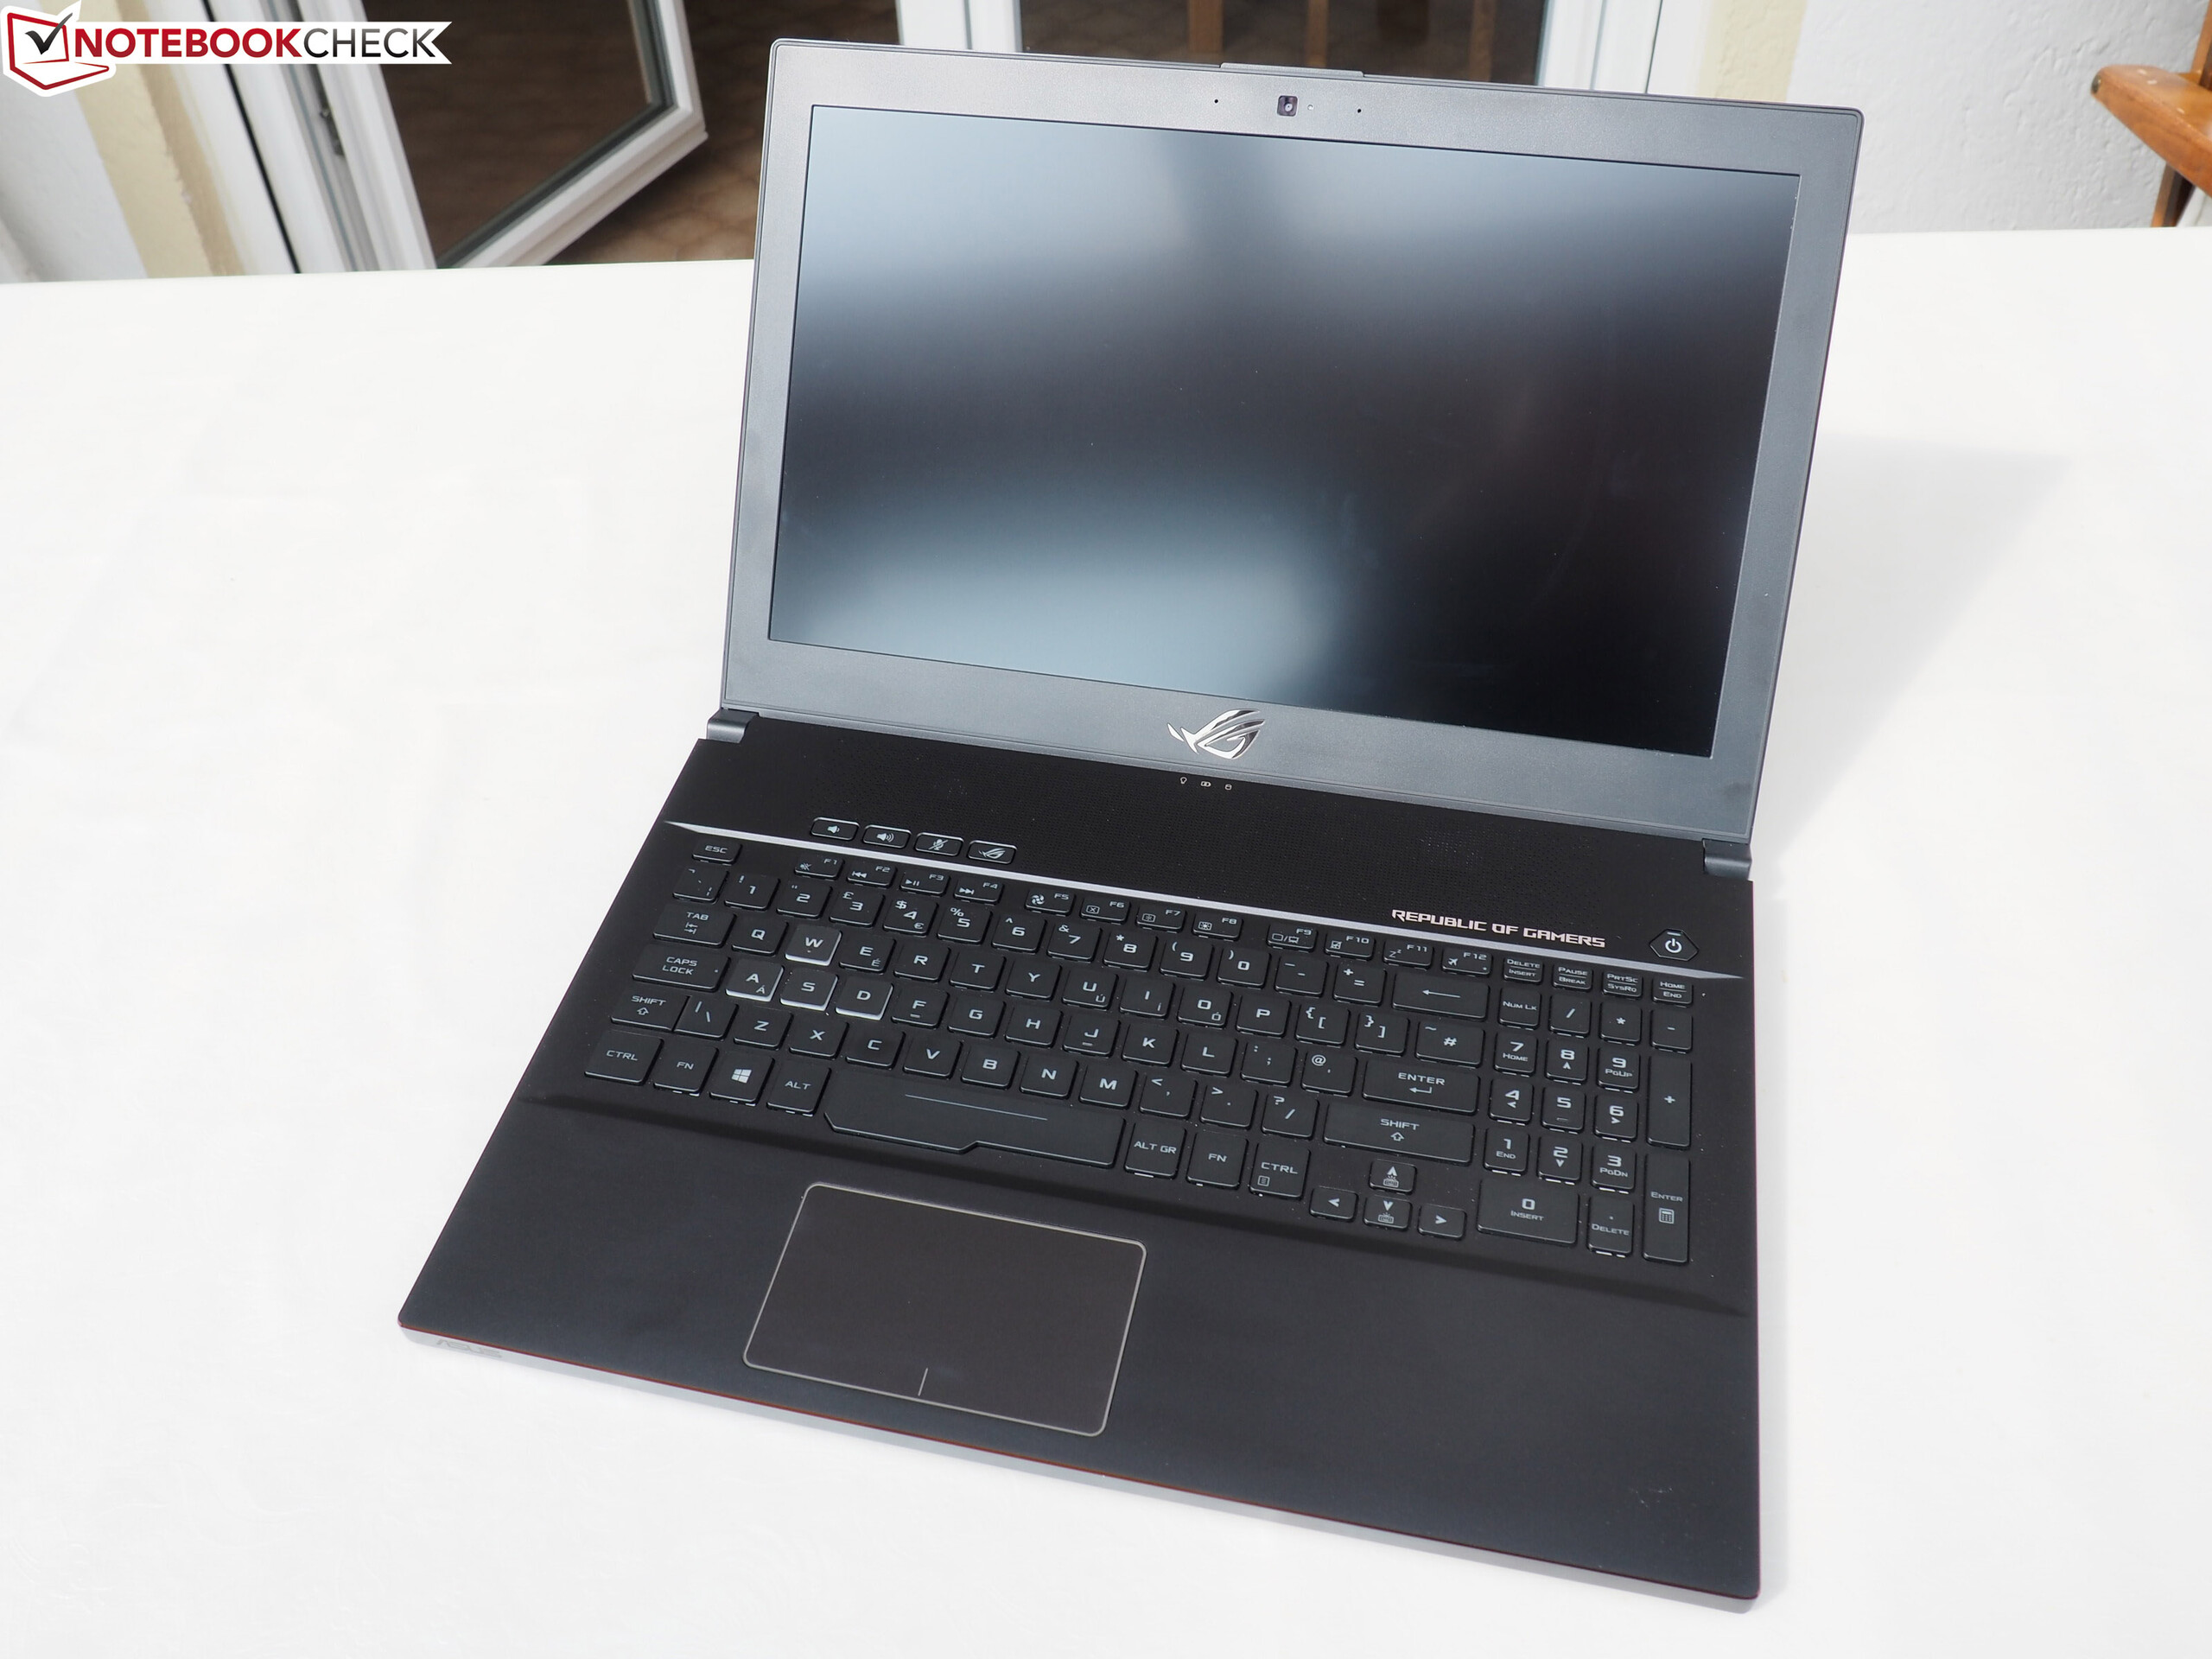
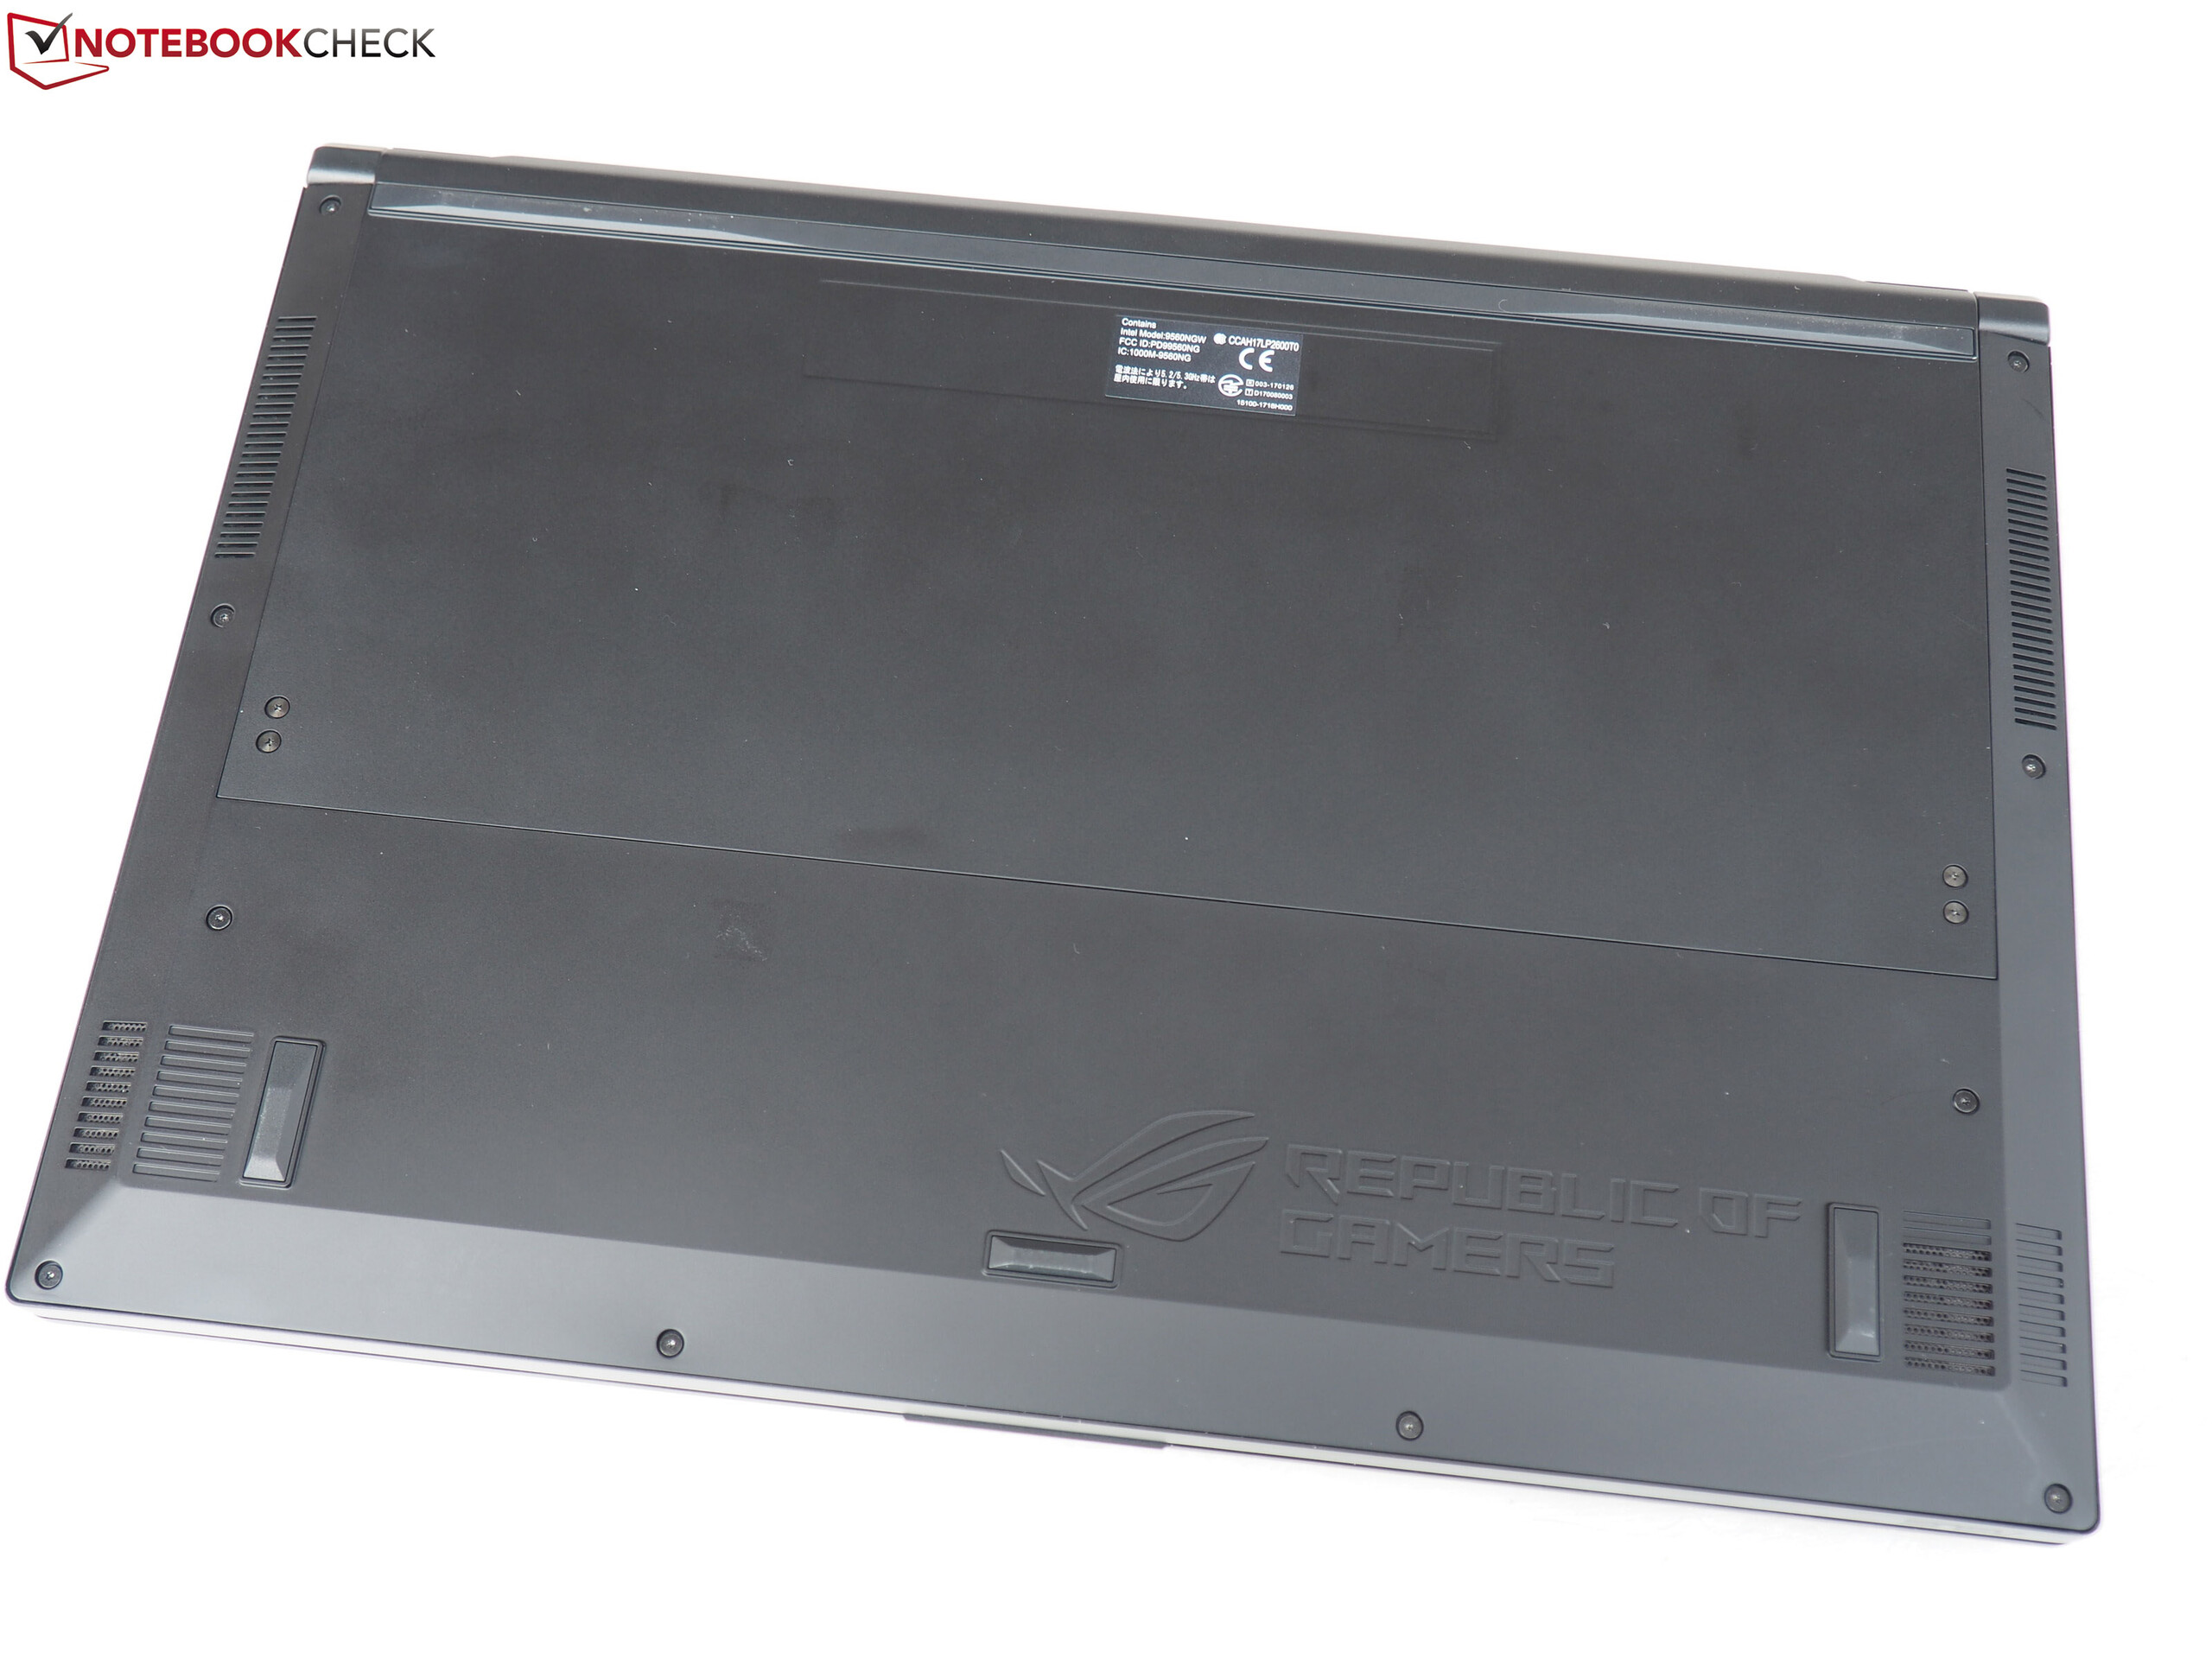
ROG Zephyrus GX501VI (GTX 1080 Max-Q) ile ROG Zephyrus M GM501GS (GeForce GTX 1070) modelleri arasında kalsanız, bizce ikincisi daha iyi olacaktır. GM501, 3D uygulamalarda çok daha gürültülü olsa da, daha ucuz ve benzer oyun performansını sunarken bizce daha iyi arayüzlere de sahip. Yüksek kontrastlı 144 Hz ekran G-Sync desteğine de sahip.
Malesef GM501, Optimus teknolojisinden ötürü uzun kullanım süreleri sunamıyor. Rakip modellerde daha geniş batarya seçenekleri olsa da; ince, hafif bir cihazda yüksek performans arayan oyuncuların GM501 ile mutlu olacağını düşünüyoruz.
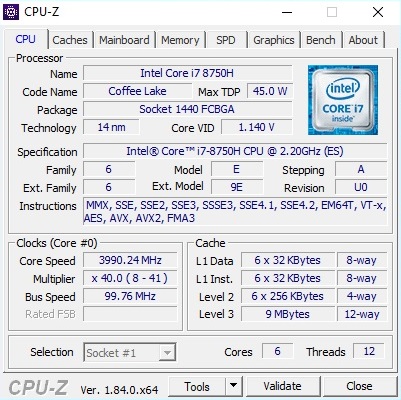
Intel'in 6 çekirdek mimarisini ilk defa mobil bir cihazda test ediyoruz. AMD'nin Ryzen mimarisi sonunda böyle bir güncelleme gerekiyordu.
Asus Zephyrus M GM501
- 04/02/2018 v6 (old)
Florian Glaser
Price comparison