Kısa inceleme: Asus ROG Zephyrus GX501 Laptop Review
| Networking | |
| iperf3 transmit AX12 | |
| Asus Zephyrus GX501 | |
| iperf3 receive AX12 | |
| Asus Zephyrus GX501 | |
| |||||||||||||||||||||||||
Aydınlatma: 83 %
Batarya modunda parlaklık: 328 cd/m²
Kontrast: 1312:1 (Siyah: 0.25 cd/m²)
ΔE ColorChecker Calman: 6.02 | ∀{0.5-29.43 Ø4.73}
ΔE Greyscale Calman: 6.32 | ∀{0.09-98 Ø4.97}
92% sRGB (Argyll 1.6.3 3D)
60% AdobeRGB 1998 (Argyll 1.6.3 3D)
65.9% AdobeRGB 1998 (Argyll 3D)
91.8% sRGB (Argyll 3D)
64.8% Display P3 (Argyll 3D)
Gamma: 2.28
CCT: 8194 K
Yanıt Sürelerini Görüntüle
| ↔ Tepki Süresi Siyahtan Beyaza | ||
|---|---|---|
| 24 ms ... yükseliş ↗ ve sonbahar↘ birleşimi | ↗ 11.6 ms yükseliş | 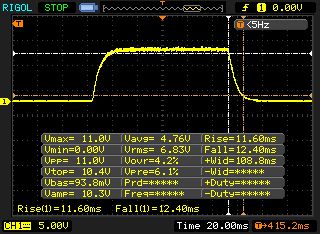 |
| ↘ 12.4 ms sonbahar | ||
| Ekran, testlerimizde iyi yanıt oranları gösteriyor ancak rekabetçi oyuncular için çok yavaş olabilir. Karşılaştırıldığında, test edilen tüm cihazlar 0.1 (minimum) ile 240 (maksimum) ms arasında değişir. » Tüm cihazların 54 %'si daha iyi. Bu, ölçülen yanıt süresinin test edilen tüm cihazların ortalamasından (19.9 ms) daha kötü olduğu anlamına gelir. | ||
| ↔ Tepki Süresi %50 Griden %80 Griye | ||
| 40.4 ms ... yükseliş ↗ ve sonbahar↘ birleşimi | ↗ 23.2 ms yükseliş | 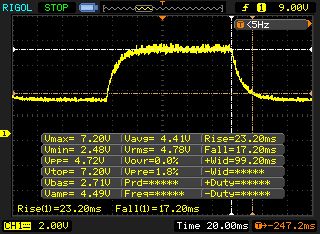 |
| ↘ 17.2 ms sonbahar | ||
| Ekran, testlerimizde yavaş yanıt oranları gösteriyor ve oyuncular için yetersiz olacaktır. Karşılaştırıldığında, test edilen tüm cihazlar 0.165 (minimum) ile 636 (maksimum) ms arasında değişir. » Tüm cihazların 63 %'si daha iyi. Bu, ölçülen yanıt süresinin test edilen tüm cihazların ortalamasından (31.1 ms) daha kötü olduğu anlamına gelir. | ||
Ekran Titremesi / PWM (Darbe Genişliği Modülasyonu)
| Ekran titriyor / PWM algılanmadı | 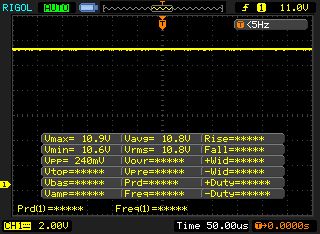 | ||
Karşılaştırıldığında: Test edilen tüm cihazların %52 %'si ekranı karartmak için PWM kullanmıyor. PWM tespit edilirse, ortalama 7798 (minimum: 5 - maksimum: 343500) Hz ölçüldü. | |||
| PCMark 8 Home Score Accelerated v2 | 5057 puan | |
| PCMark 8 Work Score Accelerated v2 | 5289 puan | |
| PCMark 10 Score | 5125 puan | |
Yardım | ||
| 3DMark 11 - 1280x720 Performance GPU | |
| Asus G701VIK-BA049T | |
| Alienware 17 R4 | |
| Aorus X7 v6 AO-S107Q716-PL-005 | |
| Asus Zephyrus GX501 | |
| Asus Strix GL702VSK | |
| MSI GT62VR 7RE-223 | |
| Acer Predator 17 G9-793-70PJ | |
| HP Omen 17-w110ng | |
| MSI GS63VR-6RF16H22 Stealth Pro | |
| Gigabyte Aero 15 | |
| MSI GE72 7RE-046 | |
| Asus ROG Strix GL553VD-DS71 | |
| Apple MacBook Pro 15 2017 (2.8 GHz, 555) | |
| Apple MacBook 12 (Early 2016) 1.1 GHz | |
| 3DMark | |
| 1280x720 Cloud Gate Standard Graphics | |
| Asus G701VIK-BA049T | |
| Alienware 17 R4 | |
| Aorus X7 v6 AO-S107Q716-PL-005 | |
| Asus Zephyrus GX501 | |
| MSI GT62VR 7RE-223 | |
| Acer Predator 17 G9-793-70PJ | |
| HP Omen 17-w110ng | |
| Gigabyte Aero 15 | |
| Asus Strix GL702VSK | |
| MSI GS63VR-6RF16H22 Stealth Pro | |
| MSI GE72 7RE-046 | |
| Asus ROG Strix GL553VD-DS71 | |
| Apple MacBook Pro 15 2017 (2.8 GHz, 555) | |
| Apple MacBook 12 (Early 2016) 1.1 GHz | |
| 1920x1080 Fire Strike Graphics | |
| Asus G701VIK-BA049T | |
| Alienware 17 R4 | |
| Aorus X7 v6 AO-S107Q716-PL-005 | |
| Asus Zephyrus GX501 | |
| MSI GT62VR 7RE-223 | |
| Asus Strix GL702VSK | |
| Acer Predator 17 G9-793-70PJ | |
| HP Omen 17-w110ng | |
| MSI GS63VR-6RF16H22 Stealth Pro | |
| Gigabyte Aero 15 | |
| MSI GE72 7RE-046 | |
| Asus ROG Strix GL553VD-DS71 | |
| Apple MacBook Pro 15 2017 (2.8 GHz, 555) | |
| Apple MacBook 12 (Early 2016) 1.1 GHz | |
| 3DMark Vantage P Result | 39562 puan | |
| 3DMark 11 Performance | 16821 puan | |
| 3DMark Ice Storm Standard Score | 140964 puan | |
| 3DMark Cloud Gate Standard Score | 27935 puan | |
| 3DMark Fire Strike Score | 14260 puan | |
| 3DMark Time Spy Score | 5390 puan | |
Yardım | ||
| düşük | orta | yüksek | ultra | QHD | 4K | |
|---|---|---|---|---|---|---|
| The Witcher 3 (2015) | 118 | 61.9 | 43.7 | |||
| Batman: Arkham Knight (2015) | 124 | 88 | 48 | |||
| Star Wars Battlefront (2015) | 164 | 144 | 55.6 | |||
| Assassin's Creed Syndicate (2015) | 74.4 | 50.3 | 40 | |||
| Rainbow Six Siege (2015) | 197 | 172 | 65.7 | |||
| Rise of the Tomb Raider (2016) | 125 | 105 | 43.6 | |||
| Far Cry Primal (2016) | 92 | 87 | 41 | |||
| The Division (2016) | 107 | 83.8 | 40.8 | |||
| Doom (2016) | 134 | 128 | 53.9 | |||
| Mirror's Edge Catalyst (2016) | 106 | 97.8 | 38.8 | |||
| Deus Ex Mankind Divided (2016) | 87.3 | 47.9 | 29.6 | |||
| Battlefield 1 (2016) | 130 | 113 | 49 | |||
| Titanfall 2 (2016) | 131 | 113 | 46.6 | |||
| Call of Duty Infinite Warfare (2016) | 123 | 118 | 63.7 | |||
| Dishonored 2 (2016) | 78.2 | 66.5 | 43.4 | |||
| Watch Dogs 2 (2016) | 86.7 | 66.7 | 34.9 | |||
| Resident Evil 7 (2017) | 166 | 140 | 47.4 | |||
| For Honor (2017) | 155 | 115 | 47.9 | |||
| Ghost Recon Wildlands (2017) | 86.7 | 51.9 | 34.1 | |||
| Mass Effect Andromeda (2017) | 81.4 | 73.2 | 35.1 | |||
| Warhammer 40.000: Dawn of War III (2017) | 88 | 86 | 41.9 | |||
| Prey (2017) | 135 | 131 | 50.5 | |||
| Rocket League (2017) | 235 | 103 | ||||
| Dirt 4 (2017) | 136 | 88.4 | ||||
| Team Fortress 2 (2017) | 124 | 125 | ||||
| Playerunknown's Battlegrounds (PUBG) (2017) | 125 | 111 | 104 | 79 | 27.1 | |
| Final Fantasy XV Benchmark (2018) | 130 | 86 | 64 | 27.2 | ||
| Far Cry New Dawn (2019) | 66 | 38 | ||||
| Dirt Rally 2.0 (2019) | 75 | 55.9 | 33.7 | |||
| The Division 2 (2019) | 74 | 51.5 | 27.8 | |||
| League of Legends (2019) | 145 | 144 |
Ses yüksekliği
| Boşta |
| 32 / 33 / 34 dB |
| Çalışırken |
| 39 / 46 dB |
 | ||
30 dB sessiz 40 dB(A) duyulabilirlik 50 dB(A) gürültülü |
||
min: | ||
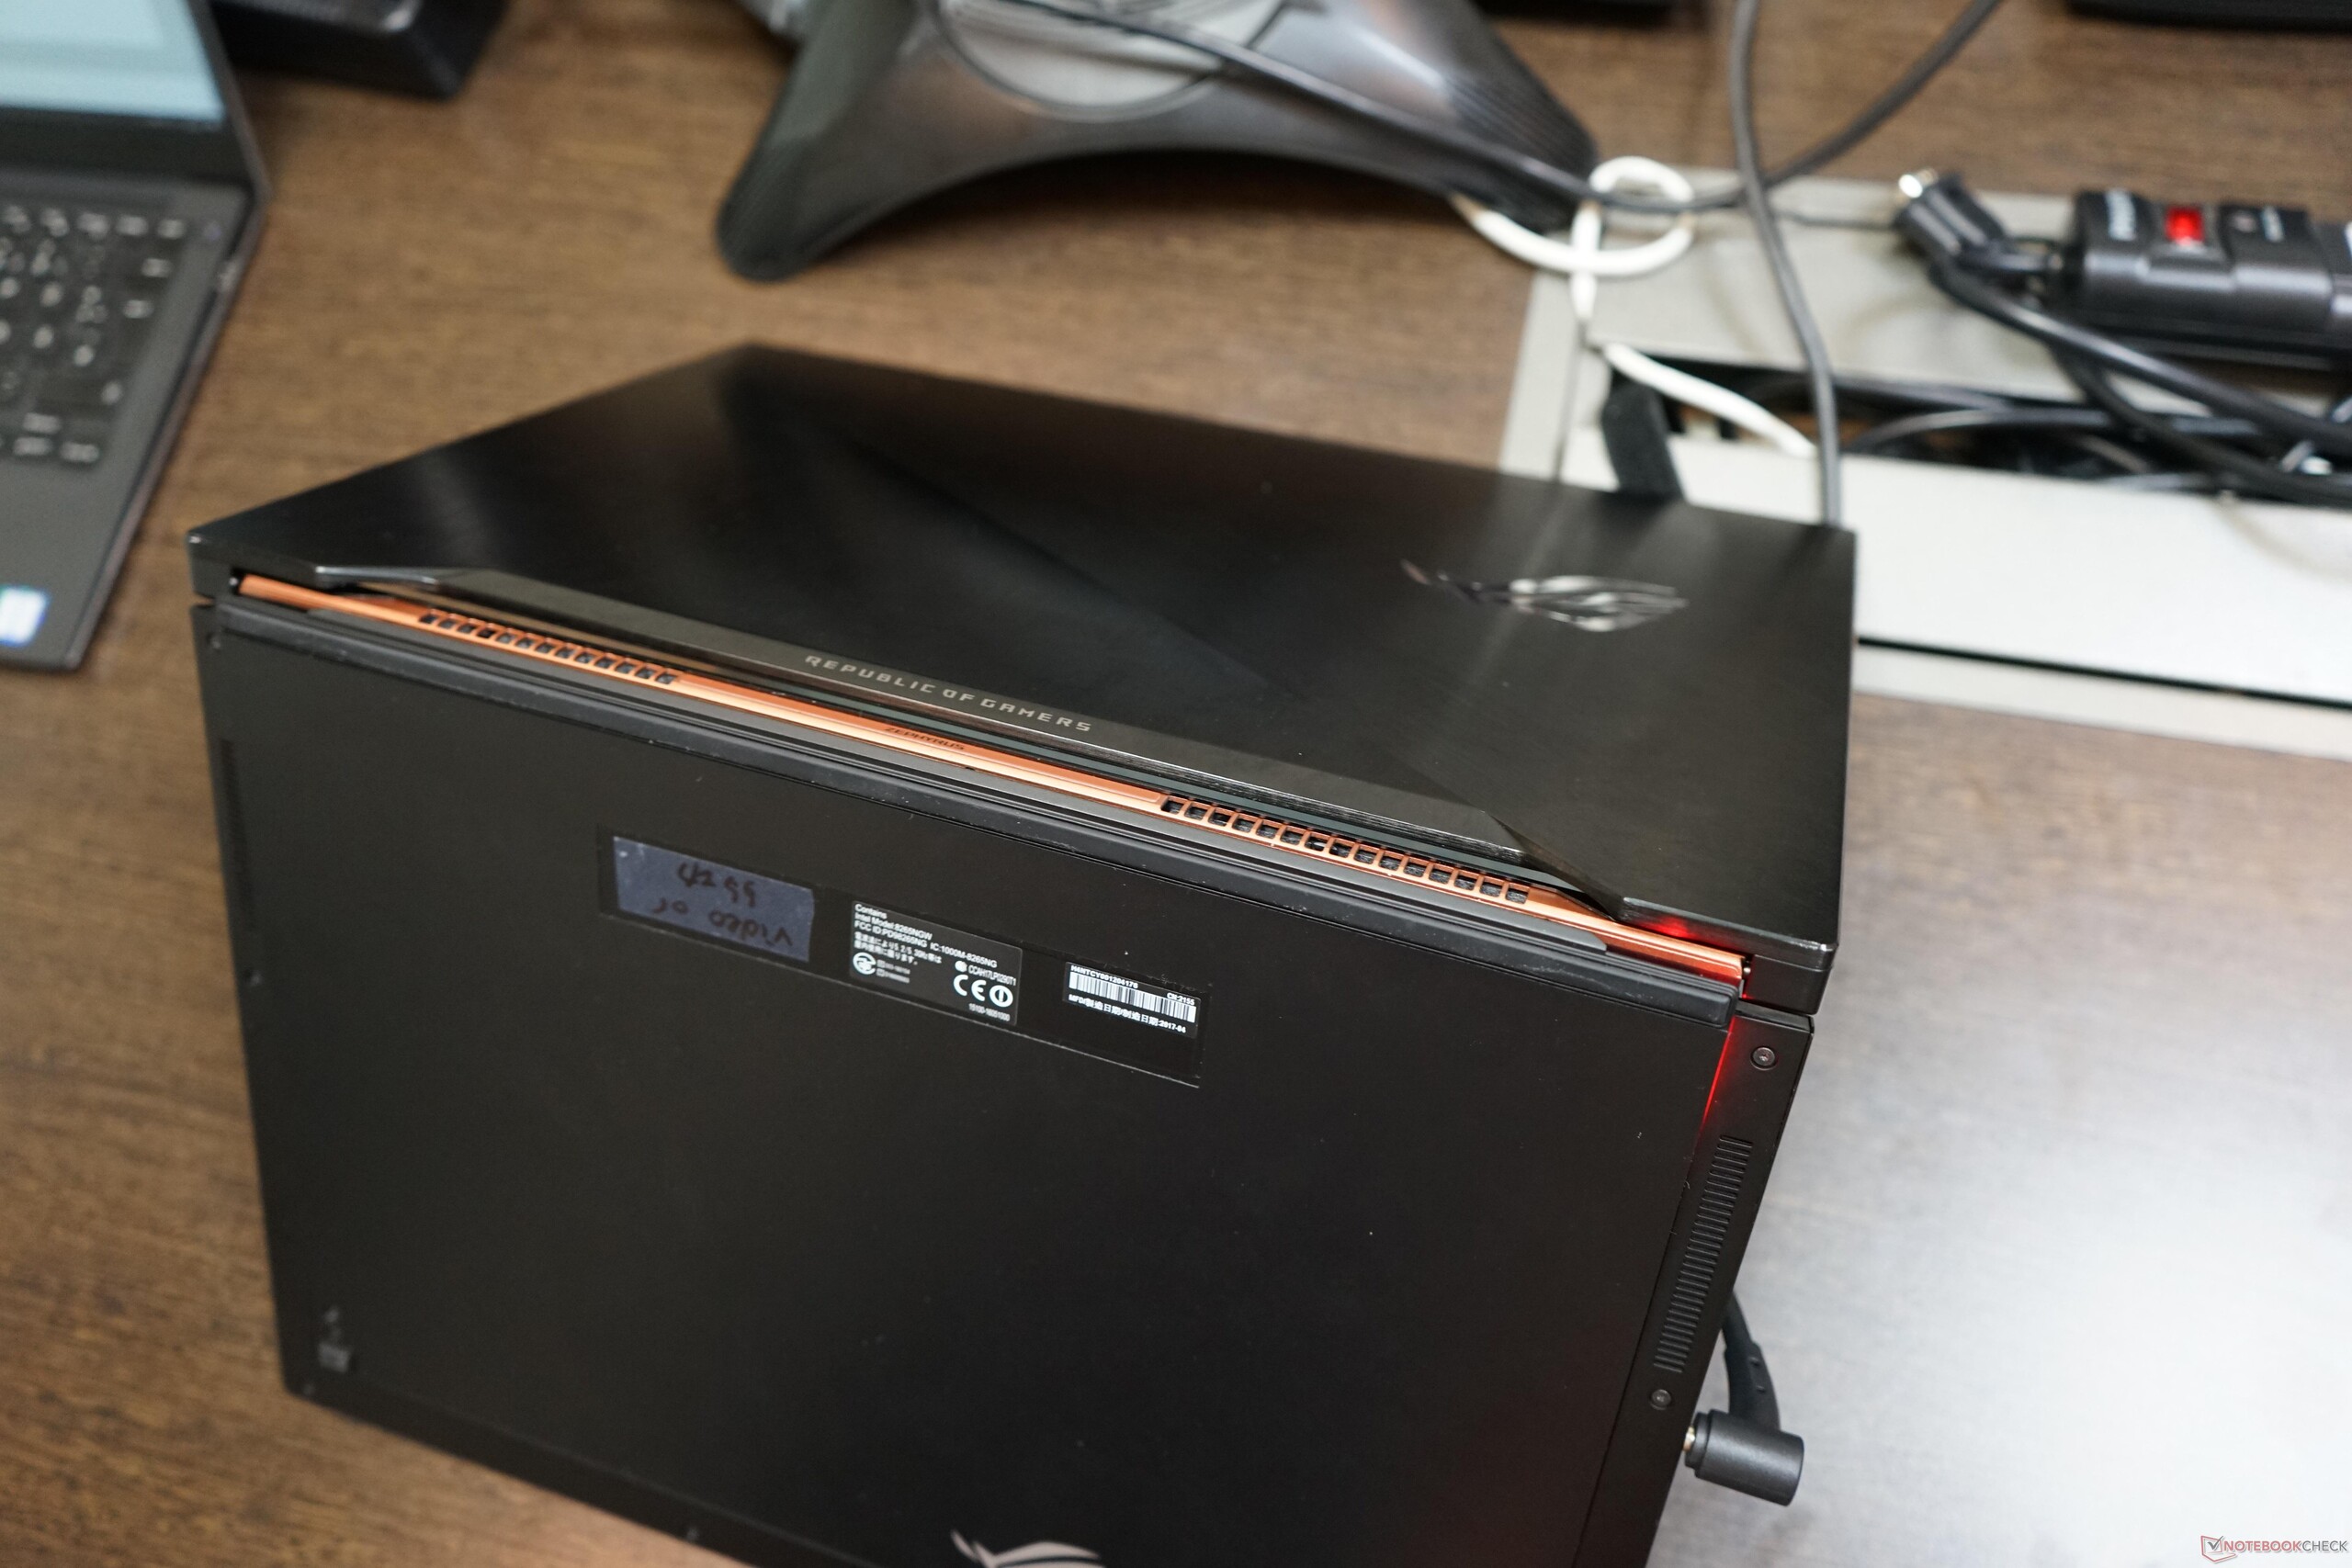
(-) Üst taraftaki maksimum sıcaklık, 40.4 °C / 105 F ortalamasına kıyasla 57 °C / 135 F'dir. , Gaming sınıfı için 21.2 ile 68.8 °C arasında değişir.
(-) Alt kısım, 43.2 °C / 110 F ortalamasına kıyasla maksimum 54 °C / 129 F'ye kadar ısınır
(+) Boşta kullanımda, üst tarafın ortalama sıcaklığı 30.7 °C / 87 F olup, cihazın 33.9 °C / 93 F.
(-) The Witcher 3 oynarken, üst tarafın ortalama sıcaklığı 46.8 °C / 116 F olup, cihazın 33.9 °C / 93 F.
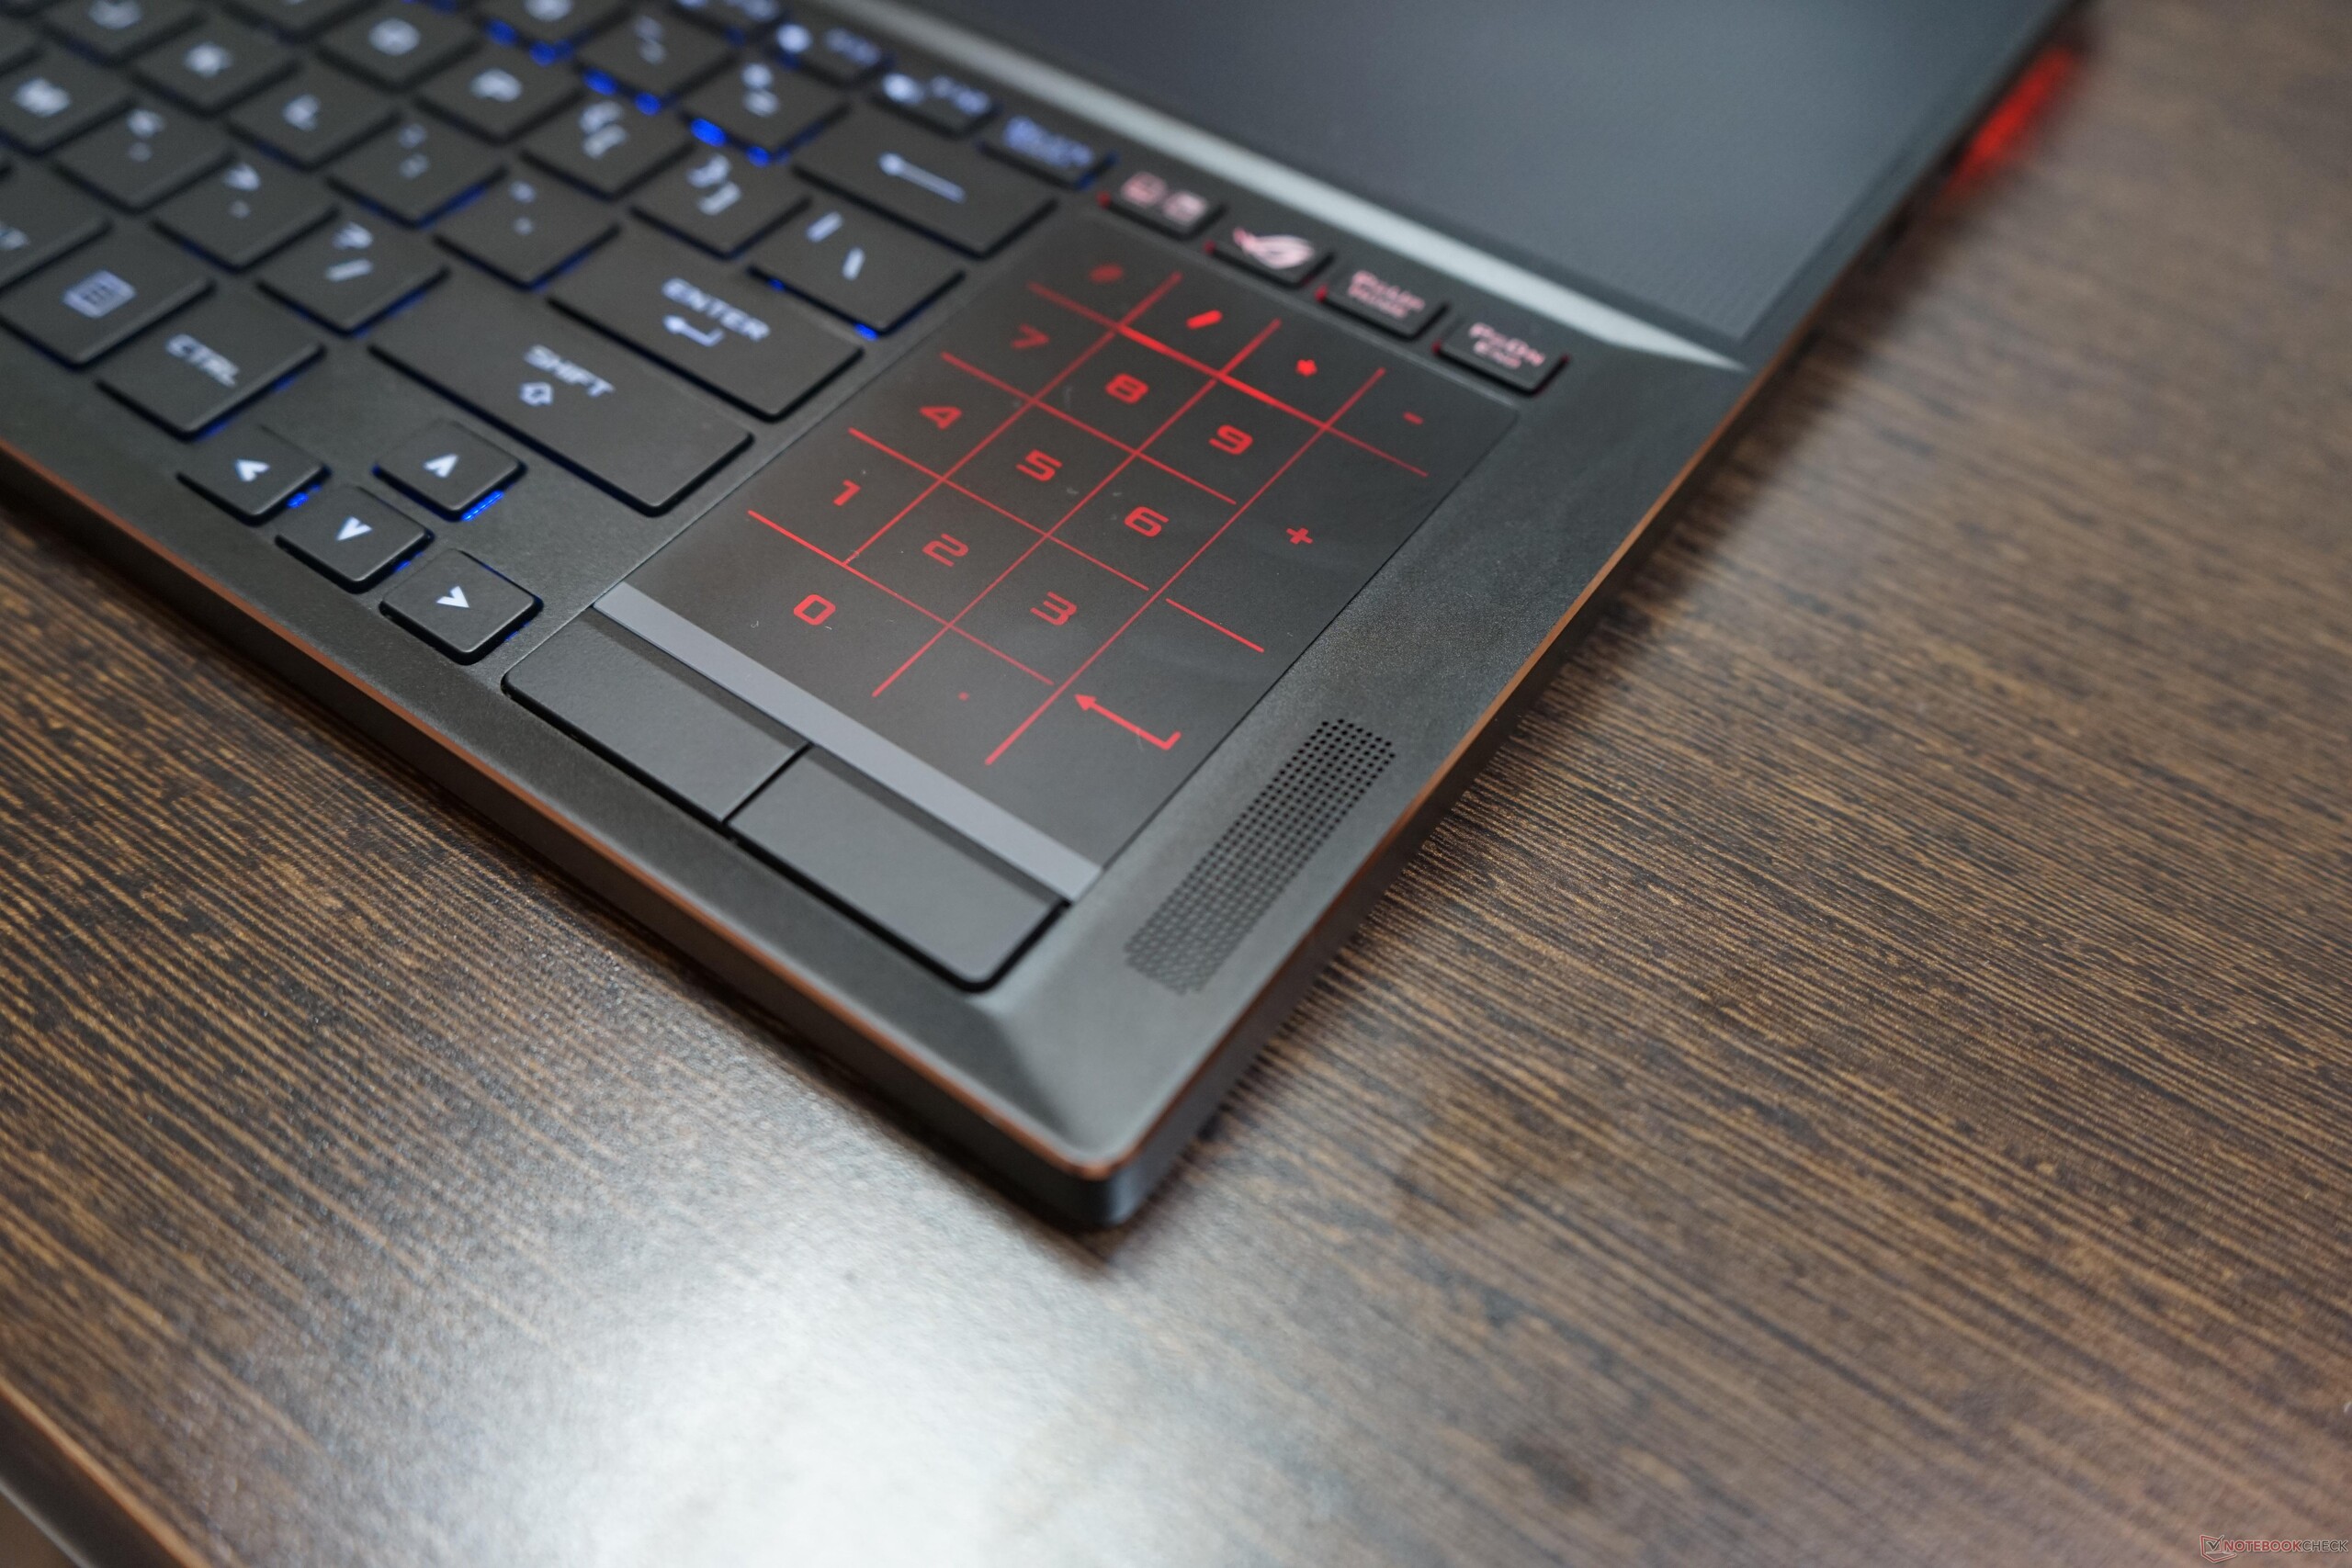
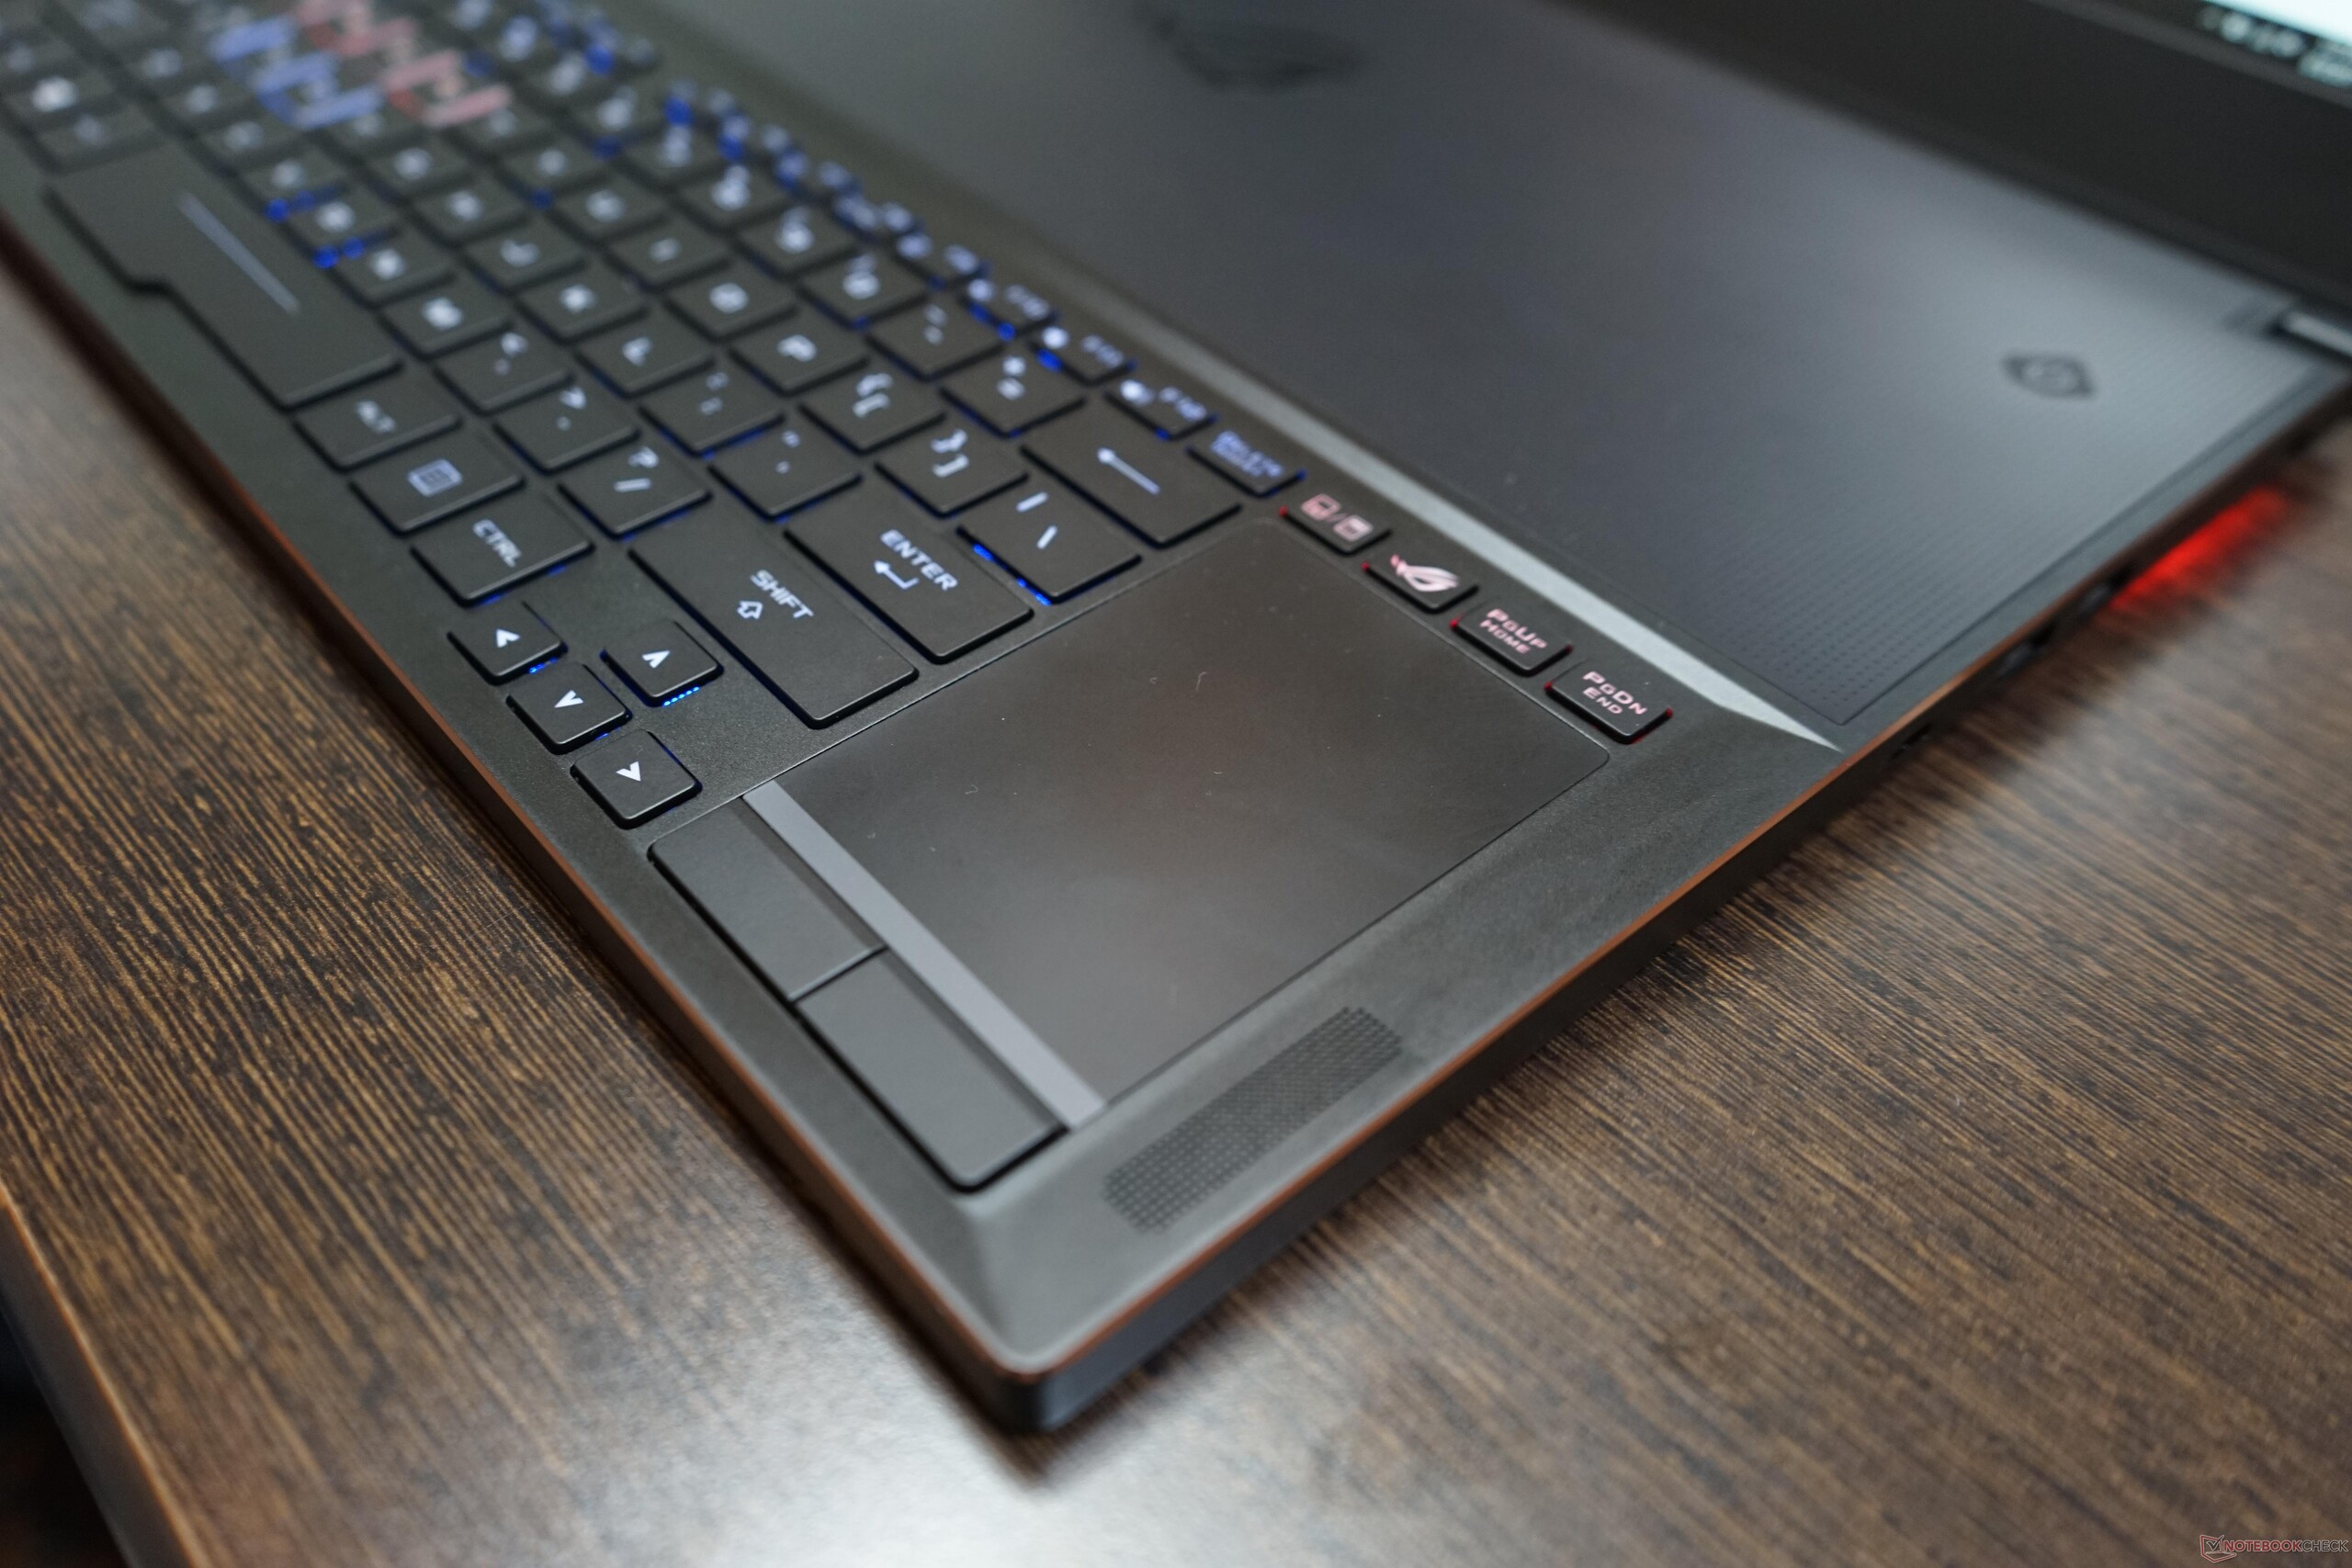
(-) Avuç içi dayanakları ve dokunmatik yüzey maksimum 42 °C / 107.6 F ile dokunulamayacak kadar ısınabilir.
(-) Benzer cihazların avuç içi dayanağı alanının ortalama sıcaklığı 28.8 °C / 83.8 F (-13.2 °C / -23.8 F) idi.
Asus Zephyrus GX501 ses analizi
(+) | hoparlörler nispeten yüksek sesle çalabilir (83 dB)
Bas 100 - 315Hz
(-) | neredeyse hiç bas yok - ortalama olarak medyandan 23.2% daha düşük
(±) | Bas doğrusallığı ortalamadır (12.5% delta - önceki frekans)
Ortalar 400 - 2000 Hz
(+) | dengeli ortalar - medyandan yalnızca 2.4% uzakta
(+) | orta frekanslar doğrusaldır (4.8% deltadan önceki frekansa)
Yüksekler 2 - 16 kHz
(+) | dengeli yüksekler - medyandan yalnızca 2.2% uzakta
(+) | yüksekler doğrusaldır (2% deltadan önceki frekansa)
Toplam 100 - 16.000 Hz
(±) | Genel sesin doğrusallığı ortalamadır (16.8% ortancaya göre fark)
Aynı sınıfla karşılaştırıldığında
» Bu sınıftaki tüm test edilen cihazların %44%'si daha iyi, 11% benzer, 46% daha kötüydü
» En iyisinin deltası 6% idi, ortalama 18% idi, en kötüsü 132% idi
Test edilen tüm cihazlarla karşılaştırıldığında
» Test edilen tüm cihazların %29'si daha iyi, 8 benzer, % 63 daha kötüydü
» En iyisinin deltası 4% idi, ortalama 24% idi, en kötüsü 134% idi
Gigabyte Aero 15 ses analizi
(±) | hoparlör ses yüksekliği ortalama ama iyi (79 dB)
Bas 100 - 315Hz
(-) | neredeyse hiç bas yok - ortalama olarak medyandan 23.3% daha düşük
(±) | Bas doğrusallığı ortalamadır (10.7% delta - önceki frekans)
Ortalar 400 - 2000 Hz
(+) | dengeli ortalar - medyandan yalnızca 1.8% uzakta
(+) | orta frekanslar doğrusaldır (4.1% deltadan önceki frekansa)
Yüksekler 2 - 16 kHz
(+) | dengeli yüksekler - medyandan yalnızca 2.6% uzakta
(+) | yüksekler doğrusaldır (5.1% deltadan önceki frekansa)
Toplam 100 - 16.000 Hz
(±) | Genel sesin doğrusallığı ortalamadır (18.3% ortancaya göre fark)
Aynı sınıfla karşılaştırıldığında
» Bu sınıftaki tüm test edilen cihazların %56%'si daha iyi, 7% benzer, 38% daha kötüydü
» En iyisinin deltası 5% idi, ortalama 17% idi, en kötüsü 45% idi
Test edilen tüm cihazlarla karşılaştırıldığında
» Test edilen tüm cihazların %40'si daha iyi, 8 benzer, % 52 daha kötüydü
» En iyisinin deltası 4% idi, ortalama 24% idi, en kötüsü 134% idi
| Kapalı / Bekleme modu | |
| Boşta | |
| Çalışırken |
|
Key:
min: | |
Price comparison
