Kısa inceleme: Dell Latitude 7390 2-in-1 (i7-8650U, FHD)

| SD Card Reader | |
| average JPG Copy Test (av. of 3 runs) | |
| Lenovo ThinkPad X1 Carbon 2018-20KGS03900 (Toshiba Exceria Pro M501) | |
| Dell Latitude 7390 2-in-1 (Toshiba Exceria Pro M501 UHS-II) | |
| Dell Latitude 13 7380 (Toshiba Exceria Pro SDXC 64 GB UHS-II) | |
| Toshiba Portege A30-D-139 (Toshiba Exceria Pro SDXC 64 GB UHS-II) | |
| Asus ZenBook 13 UX331UN (Toshiba Exceria Pro M501 microSDXC 64GB) | |
| Sınıf ortalaması Office (19.8 - 198.5, n=21, son 2 yıl) | |
| maximum AS SSD Seq Read Test (1GB) | |
| Dell Latitude 7390 2-in-1 (Toshiba Exceria Pro M501 UHS-II) | |
| Lenovo ThinkPad X1 Carbon 2018-20KGS03900 (Toshiba Exceria Pro M501) | |
| Dell Latitude 13 7380 (Toshiba Exceria Pro SDXC 64 GB UHS-II) | |
| Toshiba Portege A30-D-139 (Toshiba Exceria Pro SDXC 64 GB UHS-II) | |
| Asus ZenBook 13 UX331UN (Toshiba Exceria Pro M501 microSDXC 64GB) | |
| Sınıf ortalaması Office (27.4 - 249, n=20, son 2 yıl) | |
| Networking | |
| iperf3 transmit AX12 | |
| Toshiba Portege A30-D-139 | |
| Asus ZenBook 13 UX331UN | |
| Dell Latitude 13 7380 | |
| Lenovo ThinkPad X1 Carbon 2018-20KGS03900 | |
| Dell Latitude 7390 2-in-1 | |
| HP Elitebook 1040 G4-2XU40UT | |
| iperf3 receive AX12 | |
| Dell Latitude 7390 2-in-1 | |
| Lenovo ThinkPad X1 Carbon 2018-20KGS03900 | |
| HP Elitebook 1040 G4-2XU40UT | |
| Dell Latitude 13 7380 | |
| Toshiba Portege A30-D-139 | |
| Asus ZenBook 13 UX331UN | |
| |||||||||||||||||||||||||
Aydınlatma: 83 %
Batarya modunda parlaklık: 318.2 cd/m²
Kontrast: 1061:1 (Siyah: 0.3 cd/m²)
ΔE ColorChecker Calman: 4.25 | ∀{0.5-29.43 Ø4.72}
calibrated: 4.38
ΔE Greyscale Calman: 2.1 | ∀{0.09-98 Ø4.97}
85% sRGB (Argyll 1.6.3 3D)
56% AdobeRGB 1998 (Argyll 1.6.3 3D)
62.9% AdobeRGB 1998 (Argyll 3D)
86.1% sRGB (Argyll 3D)
62.5% Display P3 (Argyll 3D)
Gamma: 2.311
CCT: 6588 K
| Dell Latitude 7390 2-in-1 AUO462D, IPS, 13.3", 1920x1080 | Dell Latitude 13 7380 LGD0589, IPS, 13.3", 1920x1080 | Lenovo ThinkPad X1 Carbon 2018-20KGS03900 B140QAN02.0, IPS, 14", 2560x1440 | HP Elitebook 1040 G4-2XU40UT Chi Mei CMN14D7, IPS, 14", 1920x1080 | Asus ZenBook 13 UX331UN AU Optronics B133HAN04.9, IPS, 13.3", 1920x1080 | Toshiba Portege A30-D-139 Toshiba TOS508F, IPS, 13.3", 1920x1080 | |
|---|---|---|---|---|---|---|
| Display | 6% | 38% | 10% | 1% | 11% | |
| Display P3 Coverage (%) | 62.5 | 65.5 5% | 87.7 40% | 66.8 7% | 63.3 1% | 68 9% |
| sRGB Coverage (%) | 86.1 | 91.8 7% | 100 16% | 97.1 13% | 86.7 1% | 98.1 14% |
| AdobeRGB 1998 Coverage (%) | 62.9 | 65.8 5% | 99.9 59% | 69 10% | 63.4 1% | 70 11% |
| Response Times | 17% | -17% | 16% | 16% | 10% | |
| Response Time Grey 50% / Grey 80% * (ms) | 48.8 ? | 34 ? 30% | 59.2 ? -21% | 34.4 ? 30% | 44 ? 10% | 40 ? 18% |
| Response Time Black / White * (ms) | 30.4 ? | 29.6 ? 3% | 34.4 ? -13% | 30 ? 1% | 24 ? 21% | 30 ? 1% |
| PWM Frequency (Hz) | 26040 ? | 208 ? | ||||
| Screen | -31% | 36% | -3% | 1% | -10% | |
| Brightness middle (cd/m²) | 318.2 | 317 0% | 578 82% | 295.9 -7% | 329 3% | 319 0% |
| Brightness (cd/m²) | 312 | 295 -5% | 533 71% | 287 -8% | 306 -2% | 296 -5% |
| Brightness Distribution (%) | 83 | 87 5% | 84 1% | 87 5% | 86 4% | 88 6% |
| Black Level * (cd/m²) | 0.3 | 0.3 -0% | 0.38 -27% | 0.23 23% | 0.3 -0% | 0.28 7% |
| Contrast (:1) | 1061 | 1057 0% | 1521 43% | 1287 21% | 1097 3% | 1139 7% |
| Colorchecker dE 2000 * | 4.25 | 6.3 -48% | 1.9 55% | 2.83 33% | 4.07 4% | 4.04 5% |
| Colorchecker dE 2000 max. * | 9.49 | 10.4 -10% | 3.8 60% | 7.34 23% | 7.05 26% | 8.09 15% |
| Colorchecker dE 2000 calibrated * | 4.38 | 0.8 82% | ||||
| Greyscale dE 2000 * | 2.1 | 7.8 -271% | 3 -43% | 5.2 -148% | 2.76 -31% | 5.5 -162% |
| Gamma | 2.311 95% | 1.81 122% | 2.14 103% | 2.28 96% | 2.56 86% | 2.4 92% |
| CCT | 6588 99% | 7120 91% | 6377 102% | 7056 92% | 6915 94% | 7198 90% |
| Color Space (Percent of AdobeRGB 1998) (%) | 56 | 61 9% | 88.8 59% | 63 13% | 56 0% | 64 14% |
| Color Space (Percent of sRGB) (%) | 85 | 92 8% | 100 18% | 97 14% | 86 1% | 98 15% |
| Toplam Ortalama (Program / Ayarlar) | -3% /
-17% | 19% /
30% | 8% /
2% | 6% /
3% | 4% /
-3% |
* ... daha küçük daha iyidir
Yanıt Sürelerini Görüntüle
| ↔ Tepki Süresi Siyahtan Beyaza | ||
|---|---|---|
| 30.4 ms ... yükseliş ↗ ve sonbahar↘ birleşimi | ↗ 16.4 ms yükseliş | 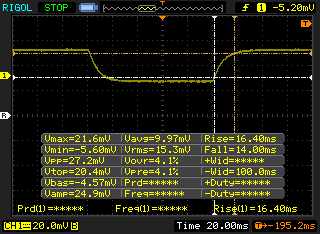 |
| ↘ 14 ms sonbahar | ||
| Ekran, testlerimizde yavaş yanıt oranları gösteriyor ve oyuncular için yetersiz olacaktır. Karşılaştırıldığında, test edilen tüm cihazlar 0.1 (minimum) ile 240 (maksimum) ms arasında değişir. » Tüm cihazların 82 %'si daha iyi. Bu, ölçülen yanıt süresinin test edilen tüm cihazların ortalamasından (19.8 ms) daha kötü olduğu anlamına gelir. | ||
| ↔ Tepki Süresi %50 Griden %80 Griye | ||
| 48.8 ms ... yükseliş ↗ ve sonbahar↘ birleşimi | ↗ 23.6 ms yükseliş | 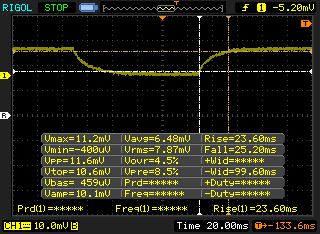 |
| ↘ 25.2 ms sonbahar | ||
| Ekran, testlerimizde yavaş yanıt oranları gösteriyor ve oyuncular için yetersiz olacaktır. Karşılaştırıldığında, test edilen tüm cihazlar 0.165 (minimum) ile 636 (maksimum) ms arasında değişir. » Tüm cihazların 84 %'si daha iyi. Bu, ölçülen yanıt süresinin test edilen tüm cihazların ortalamasından (31 ms) daha kötü olduğu anlamına gelir. | ||
Ekran Titremesi / PWM (Darbe Genişliği Modülasyonu)
| Ekran titriyor / PWM algılanmadı |  | ||
Karşılaştırıldığında: Test edilen tüm cihazların %52 %'si ekranı karartmak için PWM kullanmıyor. PWM tespit edilirse, ortalama 7753 (minimum: 5 - maksimum: 343500) Hz ölçüldü. | |||
| wPrime 2.10 - 1024m | |
| Dell Latitude 13 7380 | |
| Sınıf ortalaması Office (208 - 675, n=8, son 2 yıl) | |
| HP Elitebook 1040 G4-2XU40UT | |
| Dell Latitude 7390 2-in-1 | |
| Ortalama Intel Core i7-8650U (268 - 335, n=3) | |
* ... daha küçük daha iyidir
| PCMark 8 Home Score Accelerated v2 | 3760 puan | |
| PCMark 8 Creative Score Accelerated v2 | 4869 puan | |
| PCMark 8 Work Score Accelerated v2 | 4978 puan | |
| PCMark 10 Score | 3520 puan | |
Yardım | ||
| Dell Latitude 7390 2-in-1 SK hynix PC401 NVMe 500 GB | Lenovo ThinkPad X1 Carbon 2018-20KGS03900 Samsung SSD PM981 MZVLB512HAJQ | HP Elitebook 1040 G4-2XU40UT Toshiba XG4 NVMe (THNSN5512GPUK) | Asus ZenBook 13 UX331UN SK Hynix HFS256G39TND-N210A | Toshiba Portege A30-D-139 Toshiba SG5 THNSNK128GVN8 | |
|---|---|---|---|---|---|
| AS SSD | 65% | -12% | -80% | -91% | |
| Copy Game MB/s (MB/s) | 473.6 | 1107 134% | 394.2 -17% | 154.1 -67% | |
| Copy Program MB/s (MB/s) | 223.5 | 460.2 106% | 133.7 -40% | 129.7 -42% | |
| Copy ISO MB/s (MB/s) | 1377 | 1247 -9% | 534 -61% | 192.4 -86% | |
| Score Total (Points) | 2057 | 3529 72% | 2299 12% | 991 -52% | 650 -68% |
| Score Write (Points) | 781 | 1801 131% | 848 9% | 323 -59% | 163 -79% |
| Score Read (Points) | 877 | 1168 33% | 979 12% | 445 -49% | 330 -62% |
| Access Time Write * (ms) | 0.052 | 0.027 48% | 0.038 27% | 0.23 -342% | 0.085 -63% |
| Access Time Read * (ms) | 0.045 | 0.029 36% | 0.105 -133% | 0.09 -100% | 0.2 -344% |
| 4K-64 Write (MB/s) | 606 | 1529 152% | 662 9% | 233.1 -62% | 83.7 -86% |
| 4K-64 Read (MB/s) | 643 | 876 36% | 782 22% | 368.4 -43% | 257.8 -60% |
| 4K Write (MB/s) | 103.4 | 134.3 30% | 100.1 -3% | 68.9 -33% | 66.8 -35% |
| 4K Read (MB/s) | 42.12 | 52.4 24% | 38.49 -9% | 27.98 -34% | 21.64 -49% |
| Seq Write (MB/s) | 711 | 1376 94% | 863 21% | 213.7 -70% | 128.6 -82% |
| Seq Read (MB/s) | 1911 | 2396 25% | 1585 -17% | 483.7 -75% | 502 -74% |
* ... daha küçük daha iyidir

| 3DMark 11 | |
| 1280x720 Performance GPU | |
| Sınıf ortalaması Office (2551 - 18313, n=70, son 2 yıl) | |
| Asus ZenBook 13 UX331UN | |
| Lenovo ThinkPad X1 Carbon 2018-20KGS03900 | |
| Ortalama Intel UHD Graphics 620 (1144 - 3432, n=244) | |
| HP Elitebook 1040 G4-2XU40UT | |
| Dell Latitude 13 7380 | |
| Dell Latitude 7390 2-in-1 | |
| Toshiba Portege A30-D-139 | |
| 1280x720 Performance Combined | |
| Sınıf ortalaması Office (2054 - 16787, n=70, son 2 yıl) | |
| Asus ZenBook 13 UX331UN | |
| Lenovo ThinkPad X1 Carbon 2018-20KGS03900 | |
| HP Elitebook 1040 G4-2XU40UT | |
| Dell Latitude 7390 2-in-1 | |
| Ortalama Intel UHD Graphics 620 (927 - 2505, n=244) | |
| Dell Latitude 13 7380 | |
| Toshiba Portege A30-D-139 | |
| 3DMark | |
| 1280x720 Cloud Gate Standard Graphics | |
| Sınıf ortalaması Office (11640 - 118515, n=37, son 2 yıl) | |
| Asus ZenBook 13 UX331UN | |
| Lenovo ThinkPad X1 Carbon 2018-20KGS03900 | |
| HP Elitebook 1040 G4-2XU40UT | |
| Ortalama Intel UHD Graphics 620 (6205 - 16400, n=225) | |
| Dell Latitude 7390 2-in-1 | |
| Dell Latitude 13 7380 | |
| Toshiba Portege A30-D-139 | |
| 1920x1080 Fire Strike Graphics | |
| Sınıf ortalaması Office (736 - 21871, n=73, son 2 yıl) | |
| Asus ZenBook 13 UX331UN | |
| Lenovo ThinkPad X1 Carbon 2018-20KGS03900 | |
| HP Elitebook 1040 G4-2XU40UT | |
| Ortalama Intel UHD Graphics 620 (557 - 2608, n=213) | |
| Dell Latitude 7390 2-in-1 | |
| Dell Latitude 13 7380 | |
| Toshiba Portege A30-D-139 | |
| 1920x1080 Ice Storm Extreme Graphics | |
| Sınıf ortalaması Office (80312 - 189437, n=6, son 2 yıl) | |
| Dell Latitude 7390 2-in-1 | |
| Ortalama Intel UHD Graphics 620 (26409 - 59483, n=71) | |
| Dell Latitude 13 7380 | |
| 3DMark 06 Standard Score | 9648 puan | |
| 3DMark 11 Performance | 1808 puan | |
| 3DMark Ice Storm Standard Score | 64396 puan | |
| 3DMark Cloud Gate Standard Score | 8115 puan | |
| 3DMark Fire Strike Score | 950 puan | |
| 3DMark Fire Strike Extreme Score | 395 puan | |
Yardım | ||
| düşük | orta | yüksek | ultra | |
|---|---|---|---|---|
| BioShock Infinite (2013) | 56 | 33 | 27 | 10 |
Ses yüksekliği
| Boşta |
| 28.2 / 28.2 / 28.2 dB |
| Çalışırken |
| 32 / 41.6 dB |
 | ||
30 dB sessiz 40 dB(A) duyulabilirlik 50 dB(A) gürültülü |
||
min: | ||
| Dell Latitude 7390 2-in-1 UHD Graphics 620, i7-8650U, SK hynix PC401 NVMe 500 GB | Dell Latitude 13 7380 HD Graphics 620, i7-7600U, Samsung PM961 MZVLW256HEHP | Lenovo ThinkPad X1 Carbon 2018-20KGS03900 UHD Graphics 620, i5-8550U, Samsung SSD PM981 MZVLB512HAJQ | HP Elitebook 1040 G4-2XU40UT HD Graphics 630, i7-7820HQ, Toshiba XG4 NVMe (THNSN5512GPUK) | Asus ZenBook 13 UX331UN GeForce MX150, i5-8550U, SK Hynix HFS256G39TND-N210A | Toshiba Portege A30-D-139 HD Graphics 620, i3-7100U, Toshiba SG5 THNSNK128GVN8 | |
|---|---|---|---|---|---|---|
| Noise | 3% | -3% | 2% | -8% | -7% | |
| kapalı / ortam * (dB) | 28.2 | 28 1% | 28.9 -2% | 28.2 -0% | 30.13 -7% | 30 -6% |
| Idle Minimum * (dB) | 28.2 | 28 1% | 28.9 -2% | 28.2 -0% | 30.13 -7% | 30 -6% |
| Idle Average * (dB) | 28.2 | 28 1% | 28.9 -2% | 28.2 -0% | 30.3 -7% | 30 -6% |
| Idle Maximum * (dB) | 28.2 | 29.6 -5% | 32.5 -15% | 28.2 -0% | 30.3 -7% | 30 -6% |
| Load Average * (dB) | 32 | 30.6 4% | 35.1 -10% | 33.3 -4% | 39.2 -23% | 39.3 -23% |
| Load Maximum * (dB) | 41.6 | 35.4 15% | 35.1 16% | 35.3 15% | 41 1% | 38.3 8% |
* ... daha küçük daha iyidir
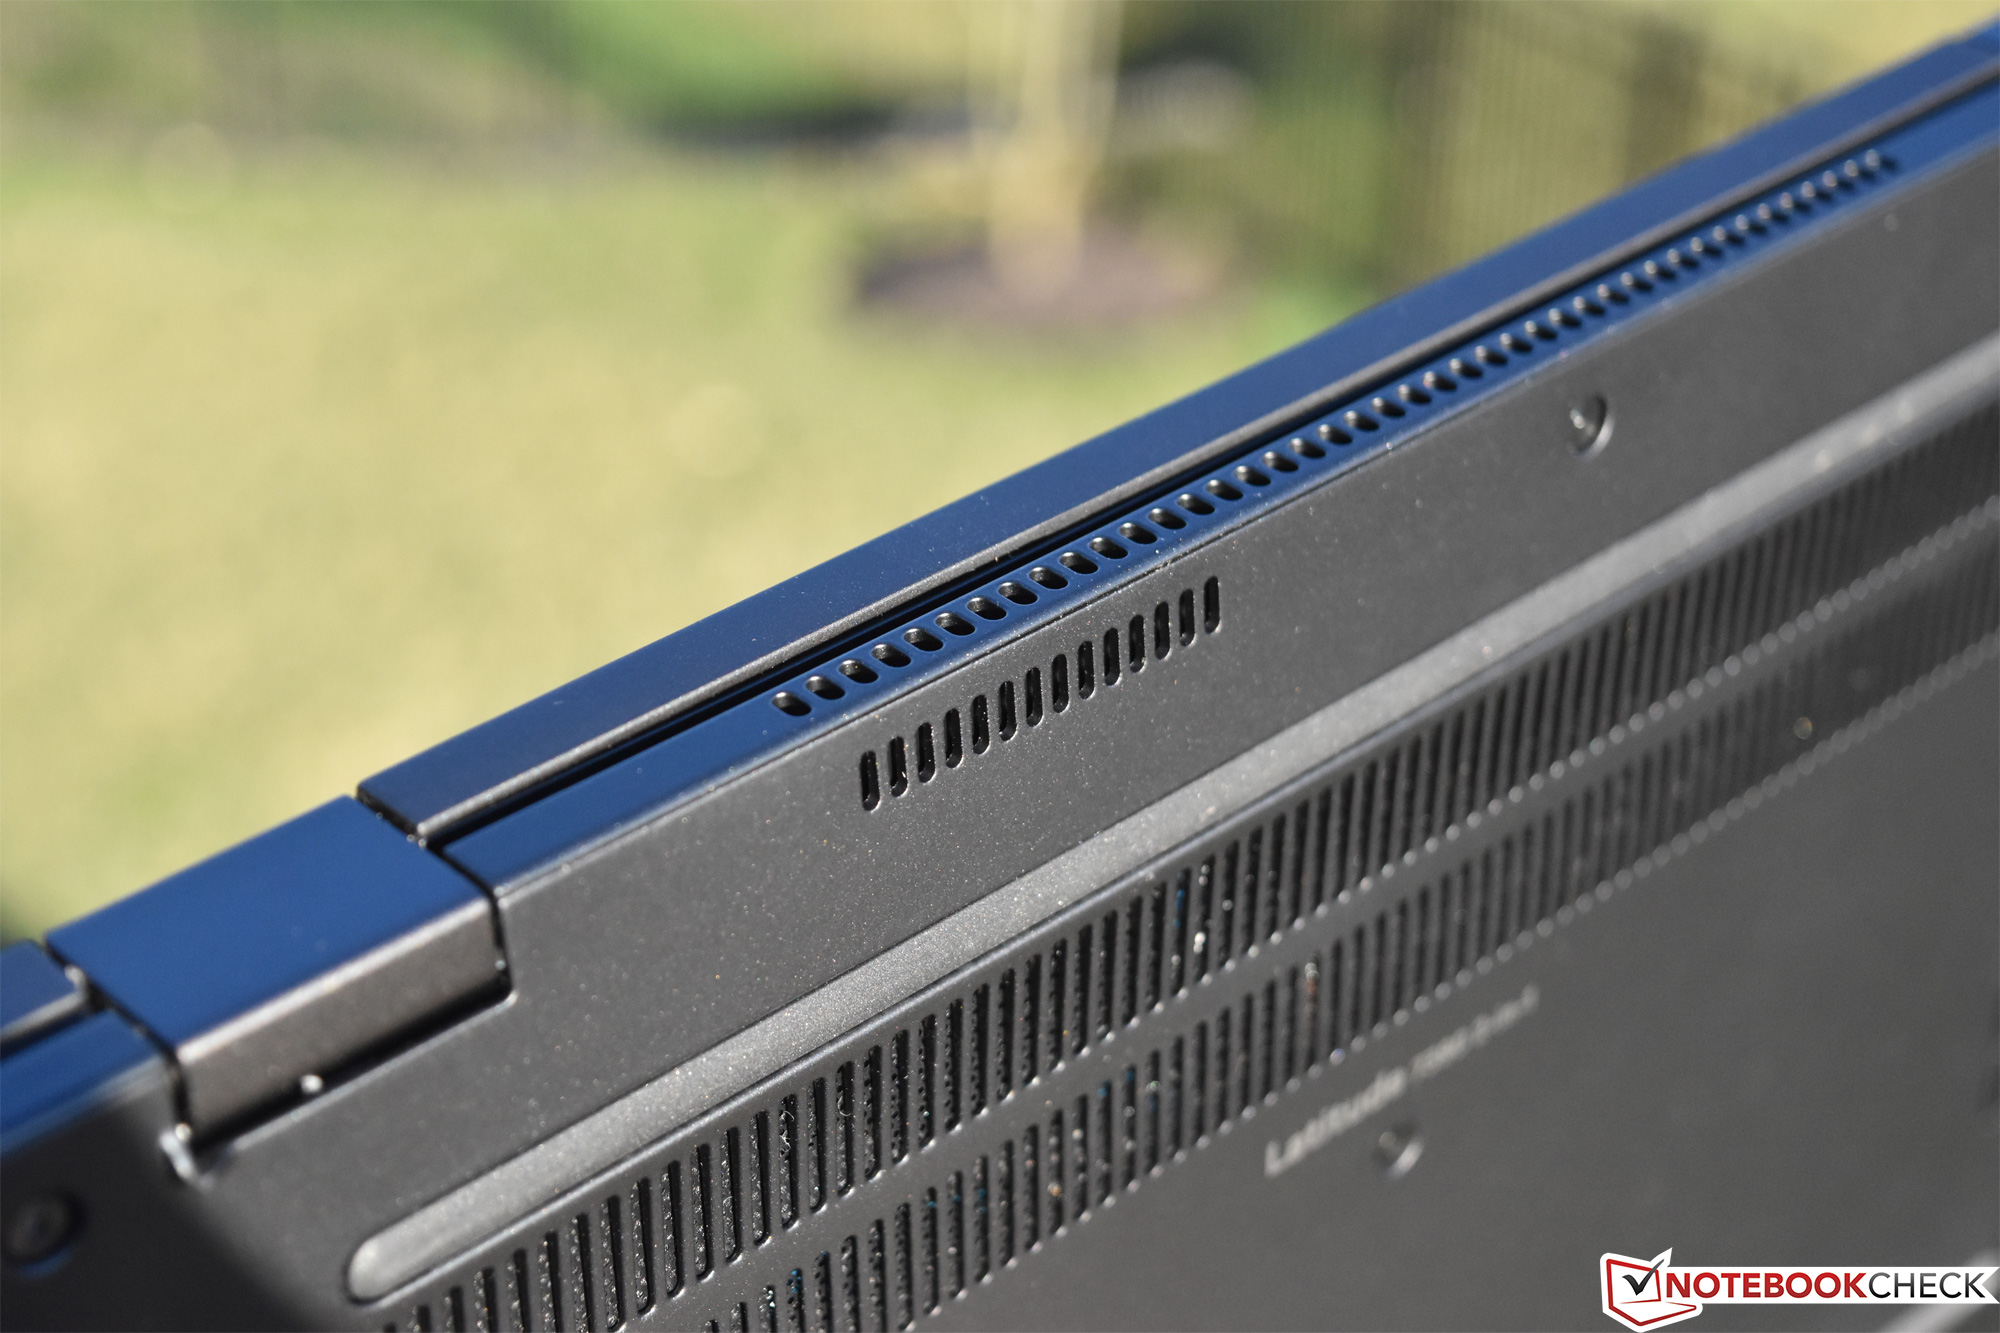
(±) Üst taraftaki maksimum sıcaklık, 34.3 °C / 94 F ortalamasına kıyasla 44 °C / 111 F'dir. , Office sınıfı için 21.2 ile 62.5 °C arasında değişir.
(-) Alt kısım, 36.8 °C / 98 F ortalamasına kıyasla maksimum 50.6 °C / 123 F'ye kadar ısınır
(+) Boşta kullanımda, üst tarafın ortalama sıcaklığı 25.2 °C / 77 F olup, cihazın 29.5 °C / 85 F.
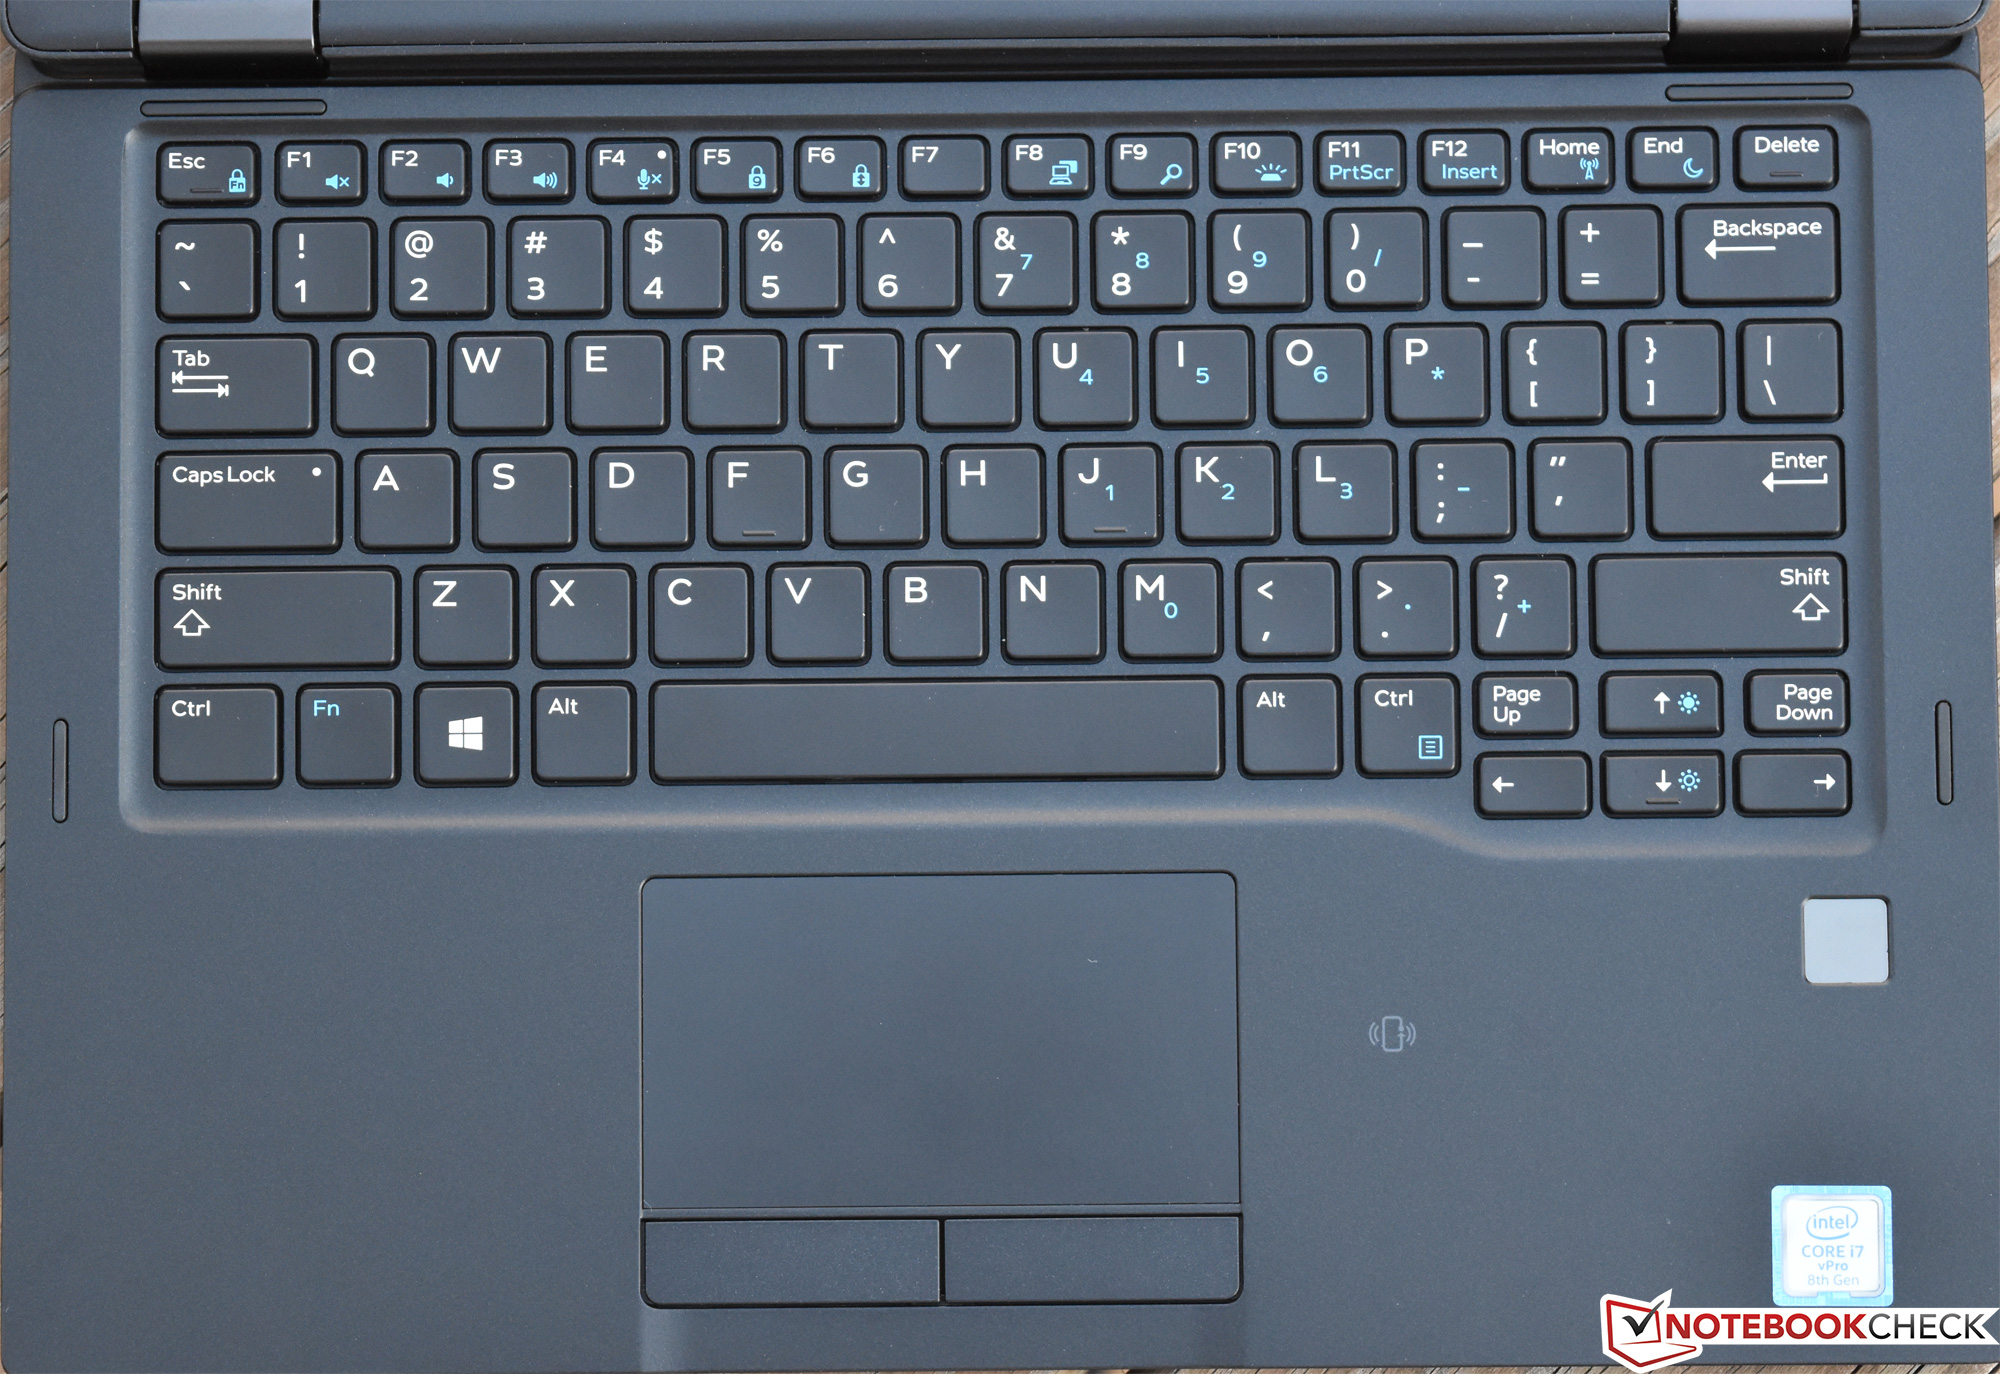
(+) Avuç içi dayanakları ve dokunmatik yüzey, maksimum 27.4 °C / 81.3 F ile cilt sıcaklığından daha soğuktur ve bu nedenle dokunulduğunda soğuktur.
(±) Benzer cihazların avuç içi dayanağı alanının ortalama sıcaklığı 27.5 °C / 81.5 F (+0.1 °C / 0.2 F) idi.
Dell Latitude 7390 2-in-1 ses analizi
(+) | hoparlörler nispeten yüksek sesle çalabilir (84.3 dB)
Bas 100 - 315Hz
(-) | neredeyse hiç bas yok - ortalama olarak medyandan 17.1% daha düşük
(±) | Bas doğrusallığı ortalamadır (9% delta - önceki frekans)
Ortalar 400 - 2000 Hz
(±) | daha yüksek ortalar - ortalama olarak medyandan 6.4% daha yüksek
(±) | Ortaların doğrusallığı ortalamadır (11.1% delta - önceki frekans)
Yüksekler 2 - 16 kHz
(±) | daha yüksek en yüksekler - ortalama olarak medyandan 6% daha yüksek
(±) | Yükseklerin doğrusallığı ortalamadır (11% delta - önceki frekans)
Toplam 100 - 16.000 Hz
(±) | Genel sesin doğrusallığı ortalamadır (22.8% ortancaya göre fark)
Aynı sınıfla karşılaştırıldığında
» Bu sınıftaki tüm test edilen cihazların %62%'si daha iyi, 8% benzer, 30% daha kötüydü
» En iyisinin deltası 7% idi, ortalama 21% idi, en kötüsü 53% idi
Test edilen tüm cihazlarla karşılaştırıldığında
» Test edilen tüm cihazların %68'si daha iyi, 5 benzer, % 27 daha kötüydü
» En iyisinin deltası 4% idi, ortalama 23% idi, en kötüsü 134% idi
Lenovo ThinkPad X1 Carbon 2018-20KGS03900 ses analizi
(+) | hoparlörler nispeten yüksek sesle çalabilir (83.6 dB)
Bas 100 - 315Hz
(-) | neredeyse hiç bas yok - ortalama olarak medyandan 25.9% daha düşük
(±) | Bas doğrusallığı ortalamadır (9.8% delta - önceki frekans)
Ortalar 400 - 2000 Hz
(+) | dengeli ortalar - medyandan yalnızca 3.8% uzakta
(±) | Ortaların doğrusallığı ortalamadır (9% delta - önceki frekans)
Yüksekler 2 - 16 kHz
(+) | dengeli yüksekler - medyandan yalnızca 2.1% uzakta
(+) | yüksekler doğrusaldır (4% deltadan önceki frekansa)
Toplam 100 - 16.000 Hz
(±) | Genel sesin doğrusallığı ortalamadır (18.7% ortancaya göre fark)
Aynı sınıfla karşılaştırıldığında
» Bu sınıftaki tüm test edilen cihazların %34%'si daha iyi, 7% benzer, 59% daha kötüydü
» En iyisinin deltası 7% idi, ortalama 21% idi, en kötüsü 53% idi
Test edilen tüm cihazlarla karşılaştırıldığında
» Test edilen tüm cihazların %43'si daha iyi, 8 benzer, % 50 daha kötüydü
» En iyisinin deltası 4% idi, ortalama 23% idi, en kötüsü 134% idi
| Kapalı / Bekleme modu | |
| Boşta | |
| Çalışırken |
|
Key:
min: | |
| Dell Latitude 7390 2-in-1 i7-8650U, UHD Graphics 620, SK hynix PC401 NVMe 500 GB, IPS, 1920x1080, 13.3" | Dell Latitude 13 7380 i7-7600U, HD Graphics 620, Samsung PM961 MZVLW256HEHP, IPS, 1920x1080, 13.3" | Lenovo ThinkPad X1 Carbon 2018-20KGS03900 i5-8550U, UHD Graphics 620, Samsung SSD PM981 MZVLB512HAJQ, IPS, 2560x1440, 14" | HP Elitebook 1040 G4-2XU40UT i7-7820HQ, HD Graphics 630, Toshiba XG4 NVMe (THNSN5512GPUK), IPS, 1920x1080, 14" | Asus ZenBook 13 UX331UN i5-8550U, GeForce MX150, SK Hynix HFS256G39TND-N210A, IPS, 1920x1080, 13.3" | Toshiba Portege A30-D-139 i3-7100U, HD Graphics 620, Toshiba SG5 THNSNK128GVN8, IPS, 1920x1080, 13.3" | |
|---|---|---|---|---|---|---|
| Power Consumption | -1% | -60% | -60% | -9% | -10% | |
| Idle Minimum * (Watt) | 2.6 | 3.2 -23% | 3.8 -46% | 5.1 -96% | 2.2 15% | 3.2 -23% |
| Idle Average * (Watt) | 5.7 | 5.5 4% | 8.9 -56% | 7 -23% | 5 12% | 6.8 -19% |
| Idle Maximum * (Watt) | 6 | 6.1 -2% | 11.9 -98% | 11.7 -95% | 8 -33% | 8 -33% |
| Load Average * (Watt) | 29.2 | 29.5 -1% | 47.5 -63% | 41.2 -41% | 33 -13% | 30.4 -4% |
| Load Maximum * (Watt) | 38.8 | 32 18% | 52.5 -35% | 56.9 -47% | 49.4 -27% | 28 28% |
* ... daha küçük daha iyidir
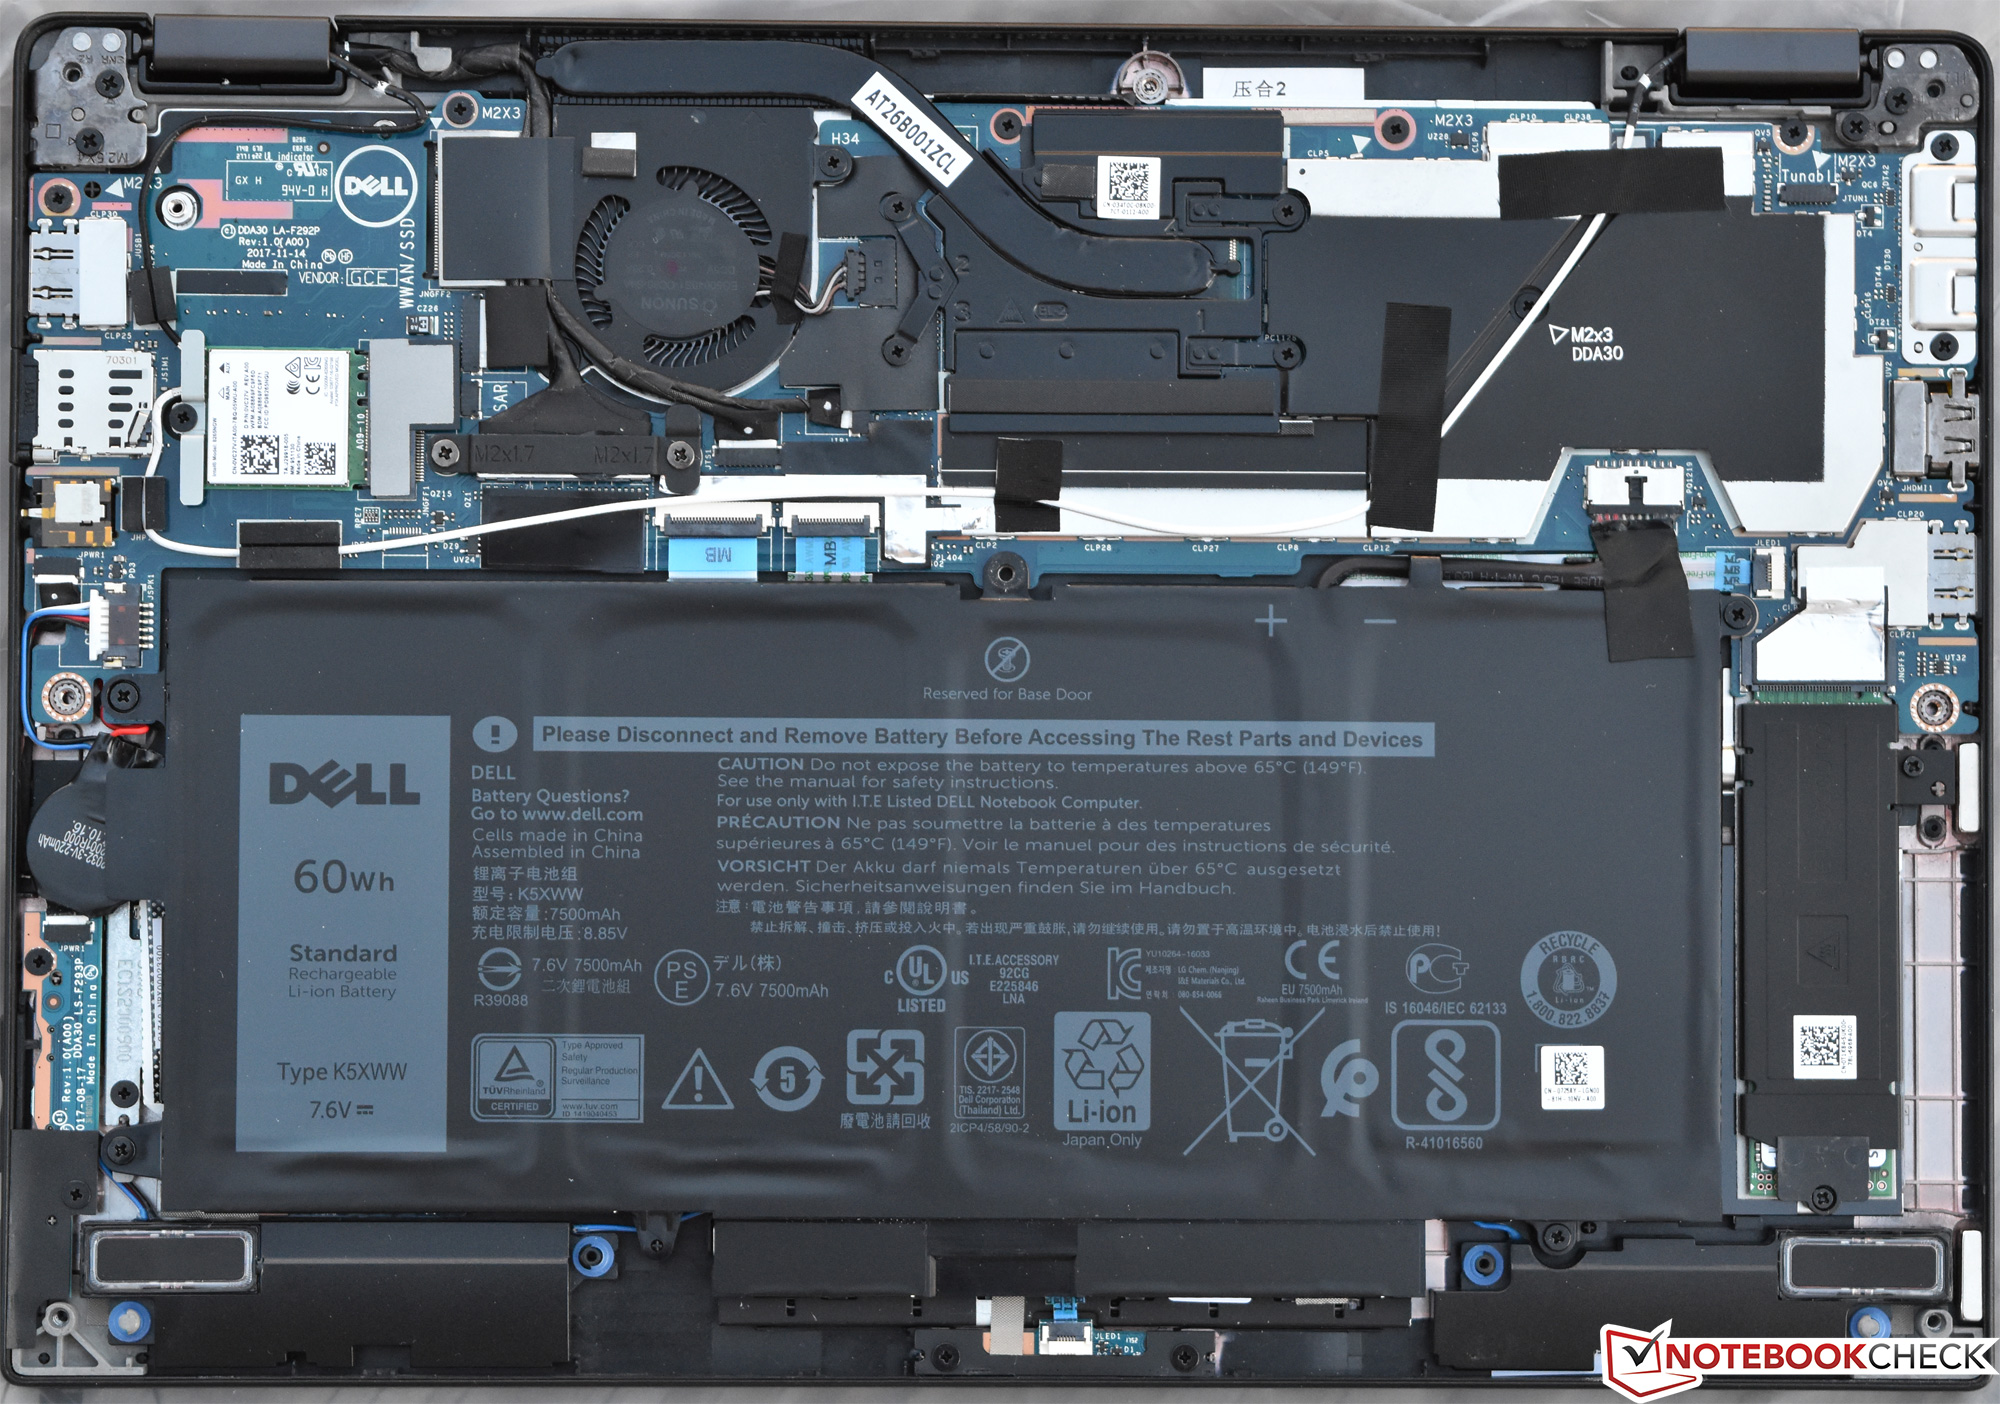
| Dell Latitude 7390 2-in-1 i7-8650U, UHD Graphics 620, 60 Wh | Dell Latitude 13 7380 i7-7600U, HD Graphics 620, 60 Wh | Lenovo ThinkPad X1 Carbon 2018-20KGS03900 i5-8550U, UHD Graphics 620, 57 Wh | HP Elitebook 1040 G4-2XU40UT i7-7820HQ, HD Graphics 630, 67 Wh | Asus ZenBook 13 UX331UN i5-8550U, GeForce MX150, 50 Wh | Toshiba Portege A30-D-139 i3-7100U, HD Graphics 620, 45 Wh | |
|---|---|---|---|---|---|---|
| Pil Çalışma Süresi | 9% | -14% | -5% | -12% | 11% | |
| WiFi v1.3 (h) | 9.2 | 10.5 14% | 8.7 -5% | 11.1 21% | 9 -2% | 9.1 -1% |
| Load (h) | 2.3 | 2.4 4% | 1.8 -22% | 1.6 -30% | 1.8 -22% | 2.8 22% |
Artılar
Eksiler
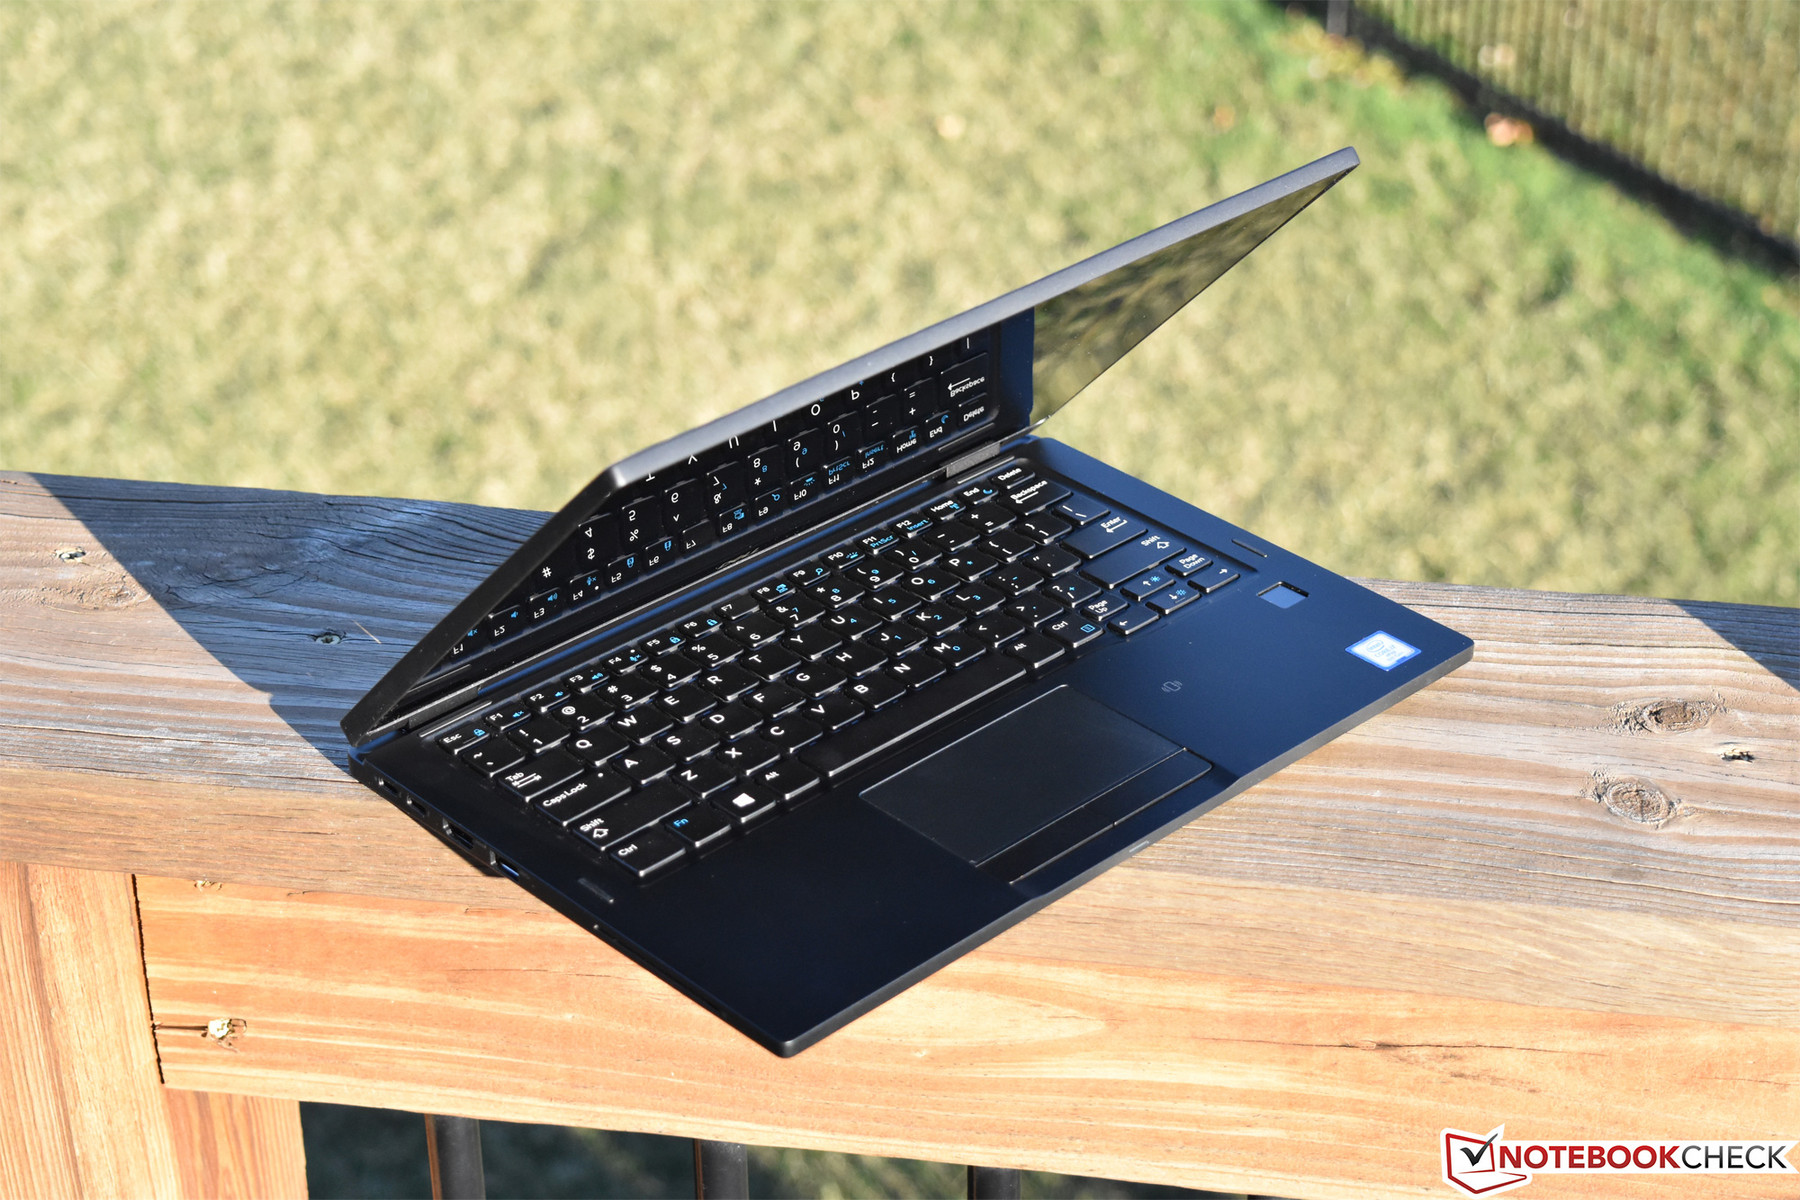
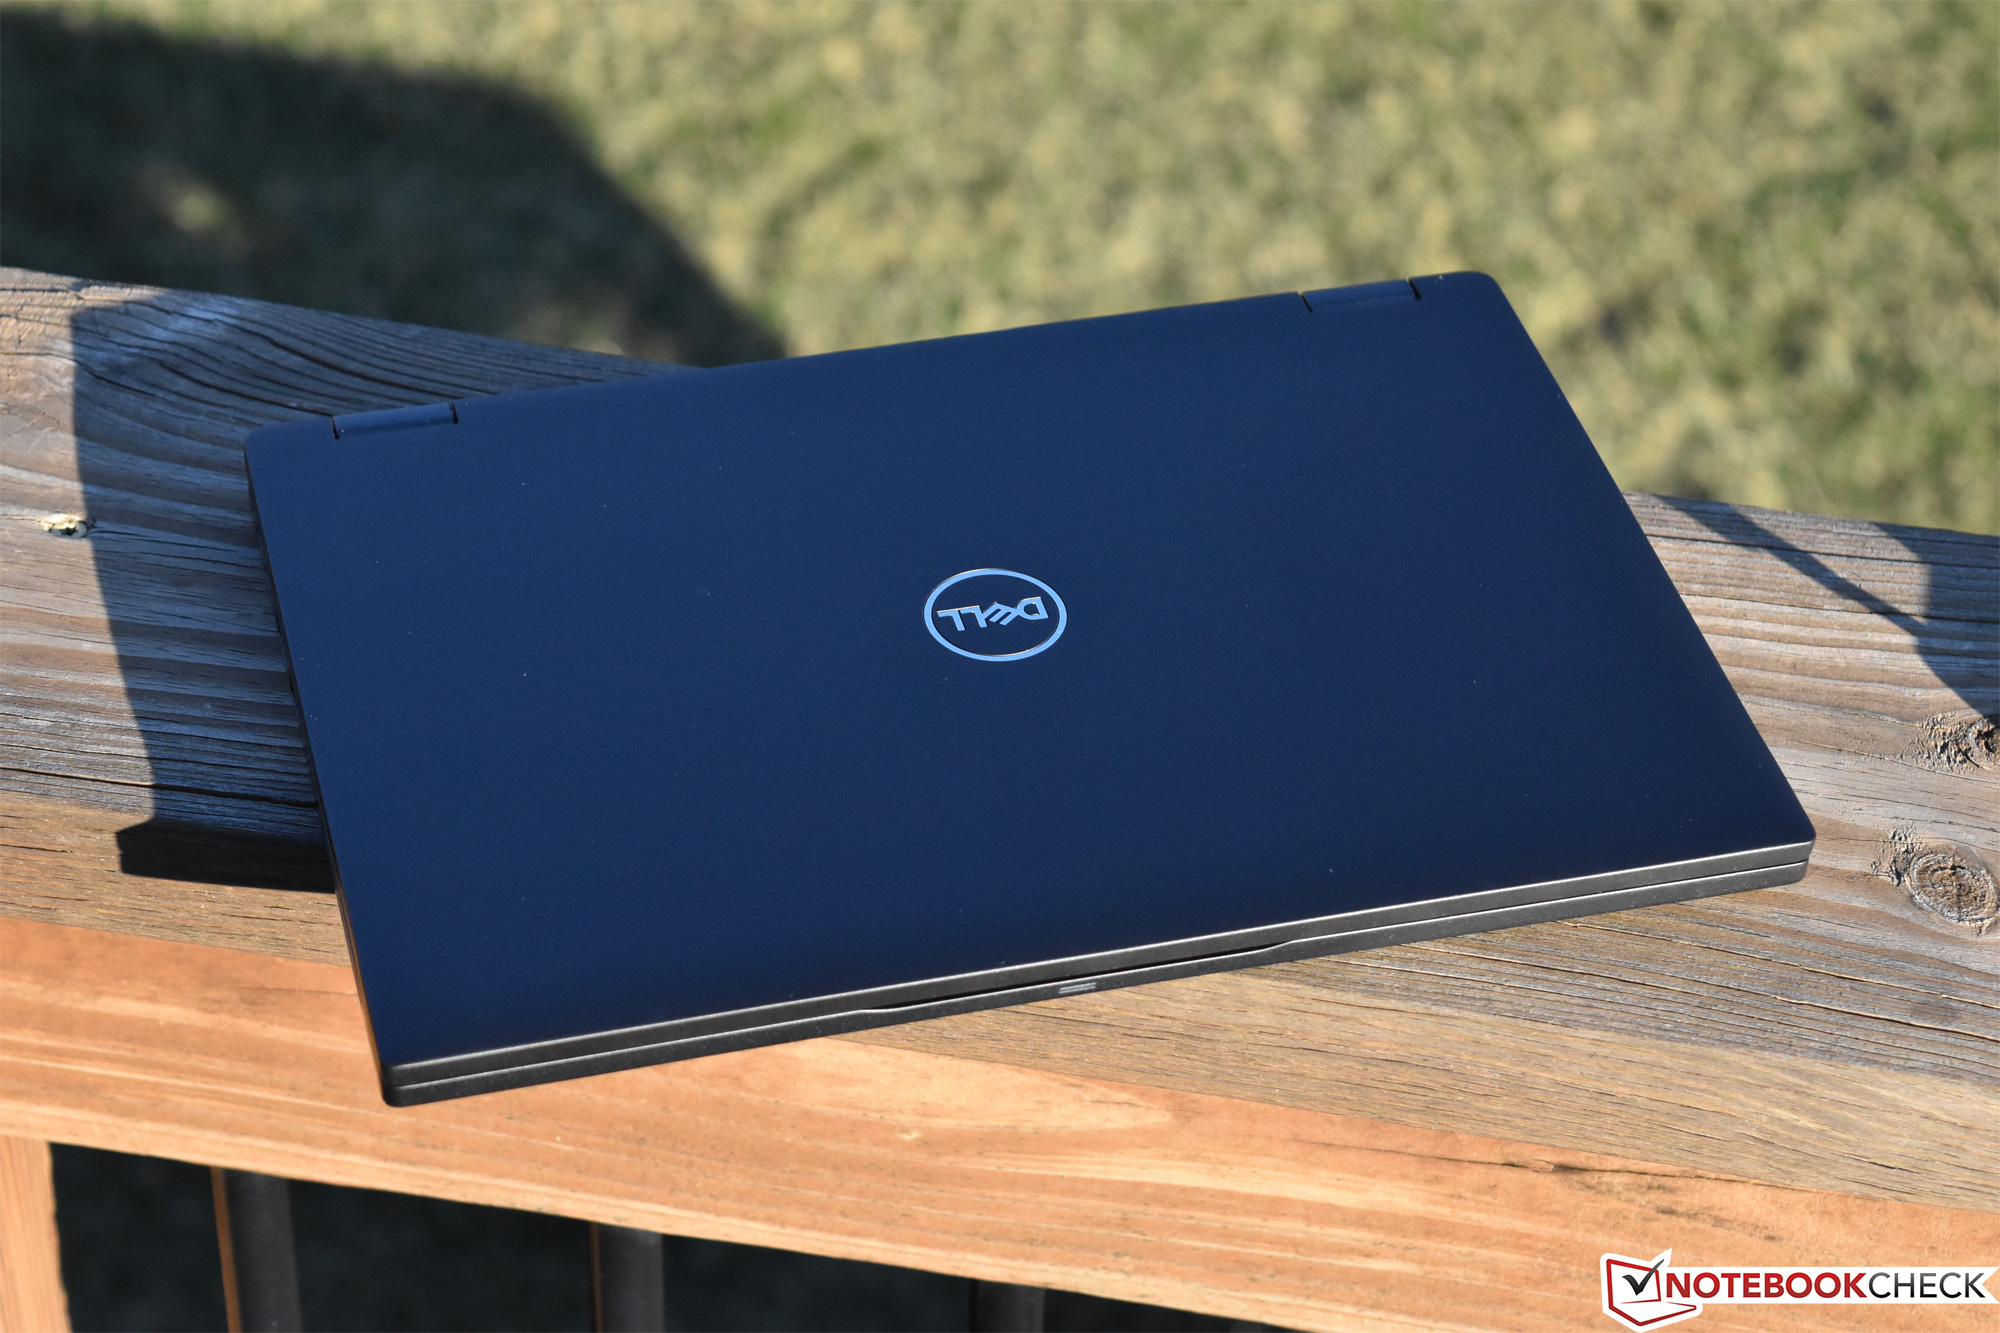
Latitude 7390 2si1 arada modeli iyi bir yapım kalitesine sahip, hızlı bir sistem sunan ilgi çekici bir cihaz. Bağlantı olanakları, depolama alanı, kolay bakım imkanı gibi harika özellikleri var. Ancak işlemci performansı önceki jenerasyonlara göre sadece biraz daha iyi ve Core i7 seçeneği ne kadar doğru tartışılır. Core i5 versiyonu hem bütçe hem performans açısından daha iyi bir tercih olabilir.
Latitude 7390 2si1 arada modeli iyi düşünülmüş, sağlam ve ilgi çekici bir model. Ancak bazı dezavantajları var ve küçük bir yatırımdan fazlasını gerektiriyor. Dolayısıyla satın almadan önce yüzeyi iyice kazımak gerekli.
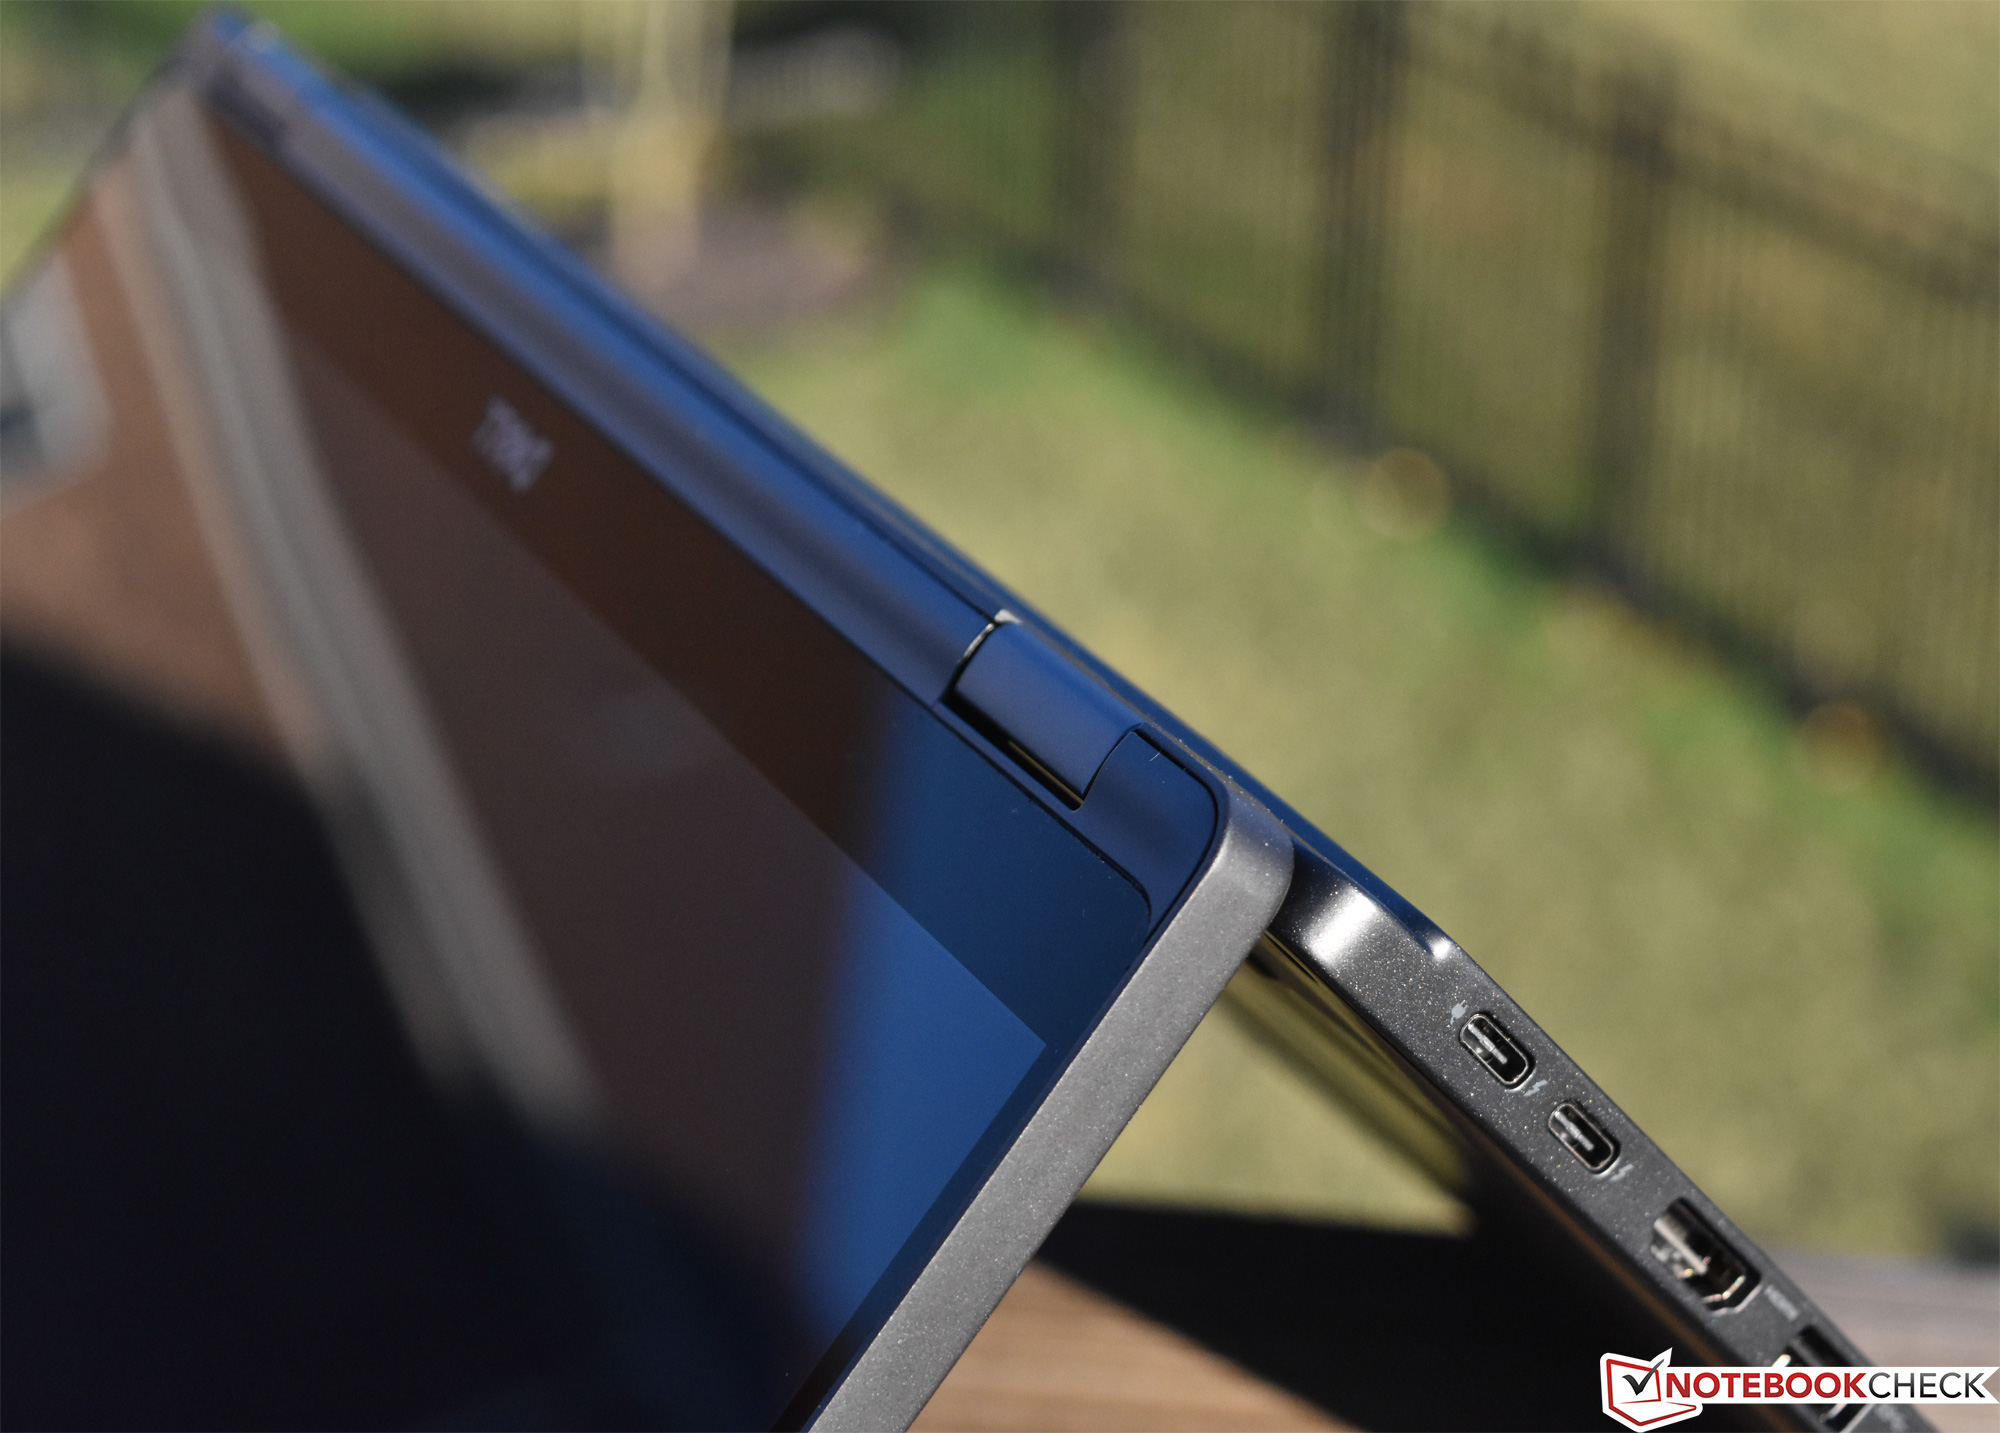
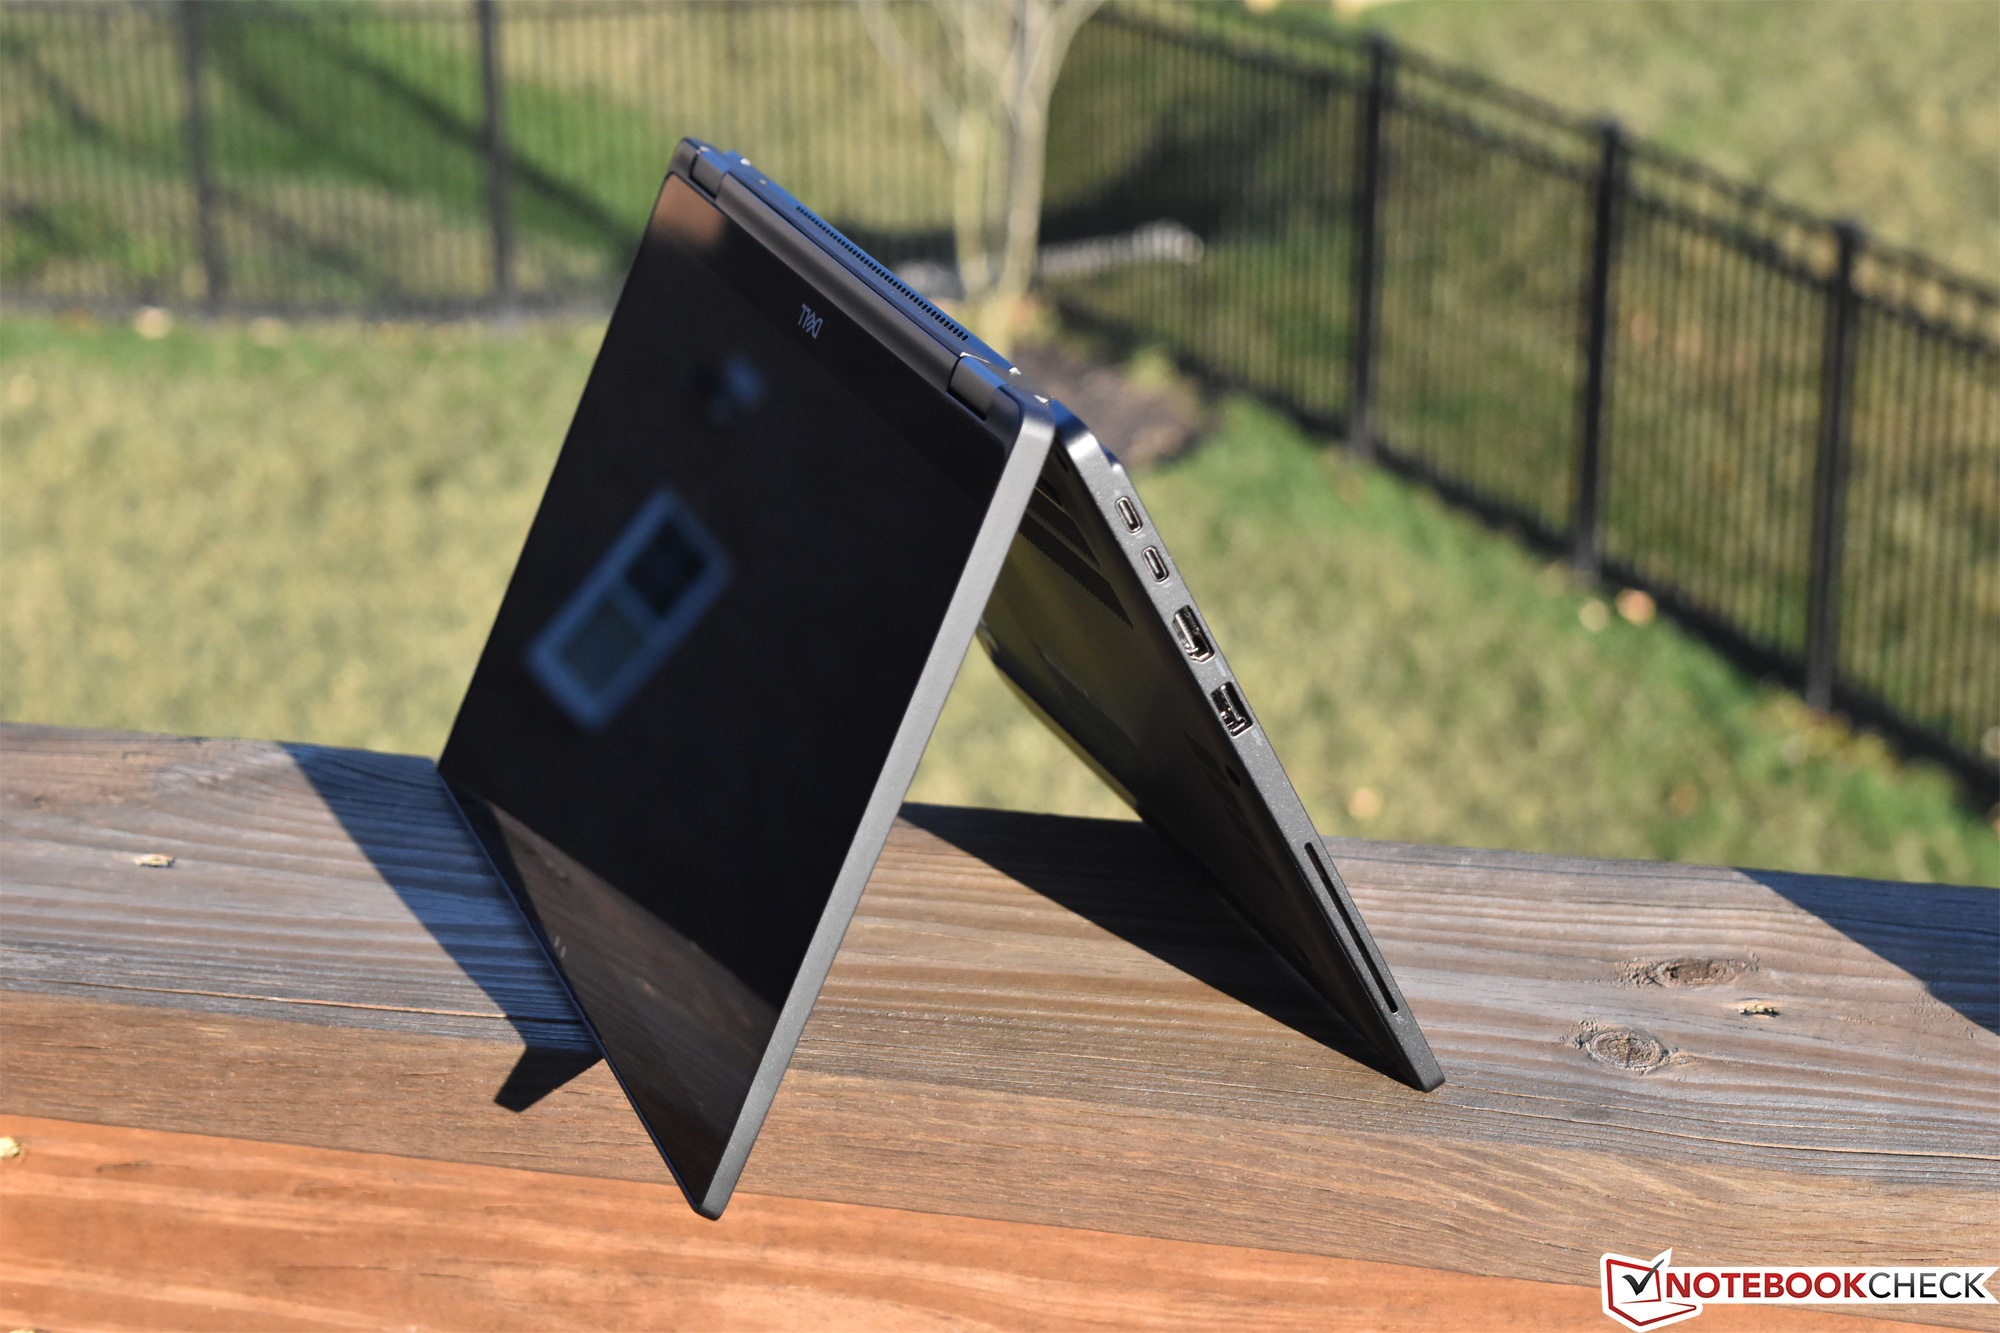
Bazı alanlarda soru işaretleri mevcut. Sadece yansıtmalı dokunmatik ekranlar seçilebiliyor, dolayısıyla renk kapsamı etkileyici değil. NVMe SSD, Samsung modelleri kadar iyi değil. Cihaz, boyutu için biraz ağır bunun sebebi de ekran kapağının kalın olması olarak açıklanabilir. Kapak ayrıca çok stabil değil ve durduğu yerde kolayca sallanabilir. Son olarak bir iş cihazının dönüştürülebilir bir model olması ne kadar gerekli tartışmaya açık bir soru. Dell, Latitude 7380 modeli ile aslında ortaya çok daha iyi bir çözüm koymuş ve üstelik yansıtmasız bir ekran seçeneği ile daha hafif ve daha stabil bir model sunuyor.
Dell Latitude 7390 2-in-1
- 03/20/2018 v6 (old)
Steve Schardein
Price comparison
