Dell Latitude 7310 Core i7 Dizüstü Bilgisayar İncelemesi: Daha İyi Görünüm, Aynı Performans
Dell Latitude 7310, daha yeni ve şık bir görünüm için tüm şasiyi yenileyerek geçen yılki Latitude 7300'ü başarıyla tamamladı. Aslında bu iki sistem benzer özellikleri ve dahili donanımı paylaştığı için 14 inç Latitude 7410'un 13.3 inç versiyonudur. Mevcut SKU'lar, 8 GB RAM, 128 GB SSD ile 10. nesil Comet Lake-U Core i5-10210U CPU'dan, ve 328 RAM, 1 TB SSD ve 1080p ekran ile Core $ i7-10610U'ya 1500 $ 'a kadar 1500 USD için 3000 $' dan fazla ekran. Sistem ayrıca Latitude 7310 2'si 1 arada adlı dönüştürülebilir bir varyantla birlikte gelir. İncelediğimiz birim, yaklaşık 2300 ABD Doları için Core i7-10610U, 16 GB RAM, 512 GB SSD ve 1080p ekran ile daha üst düzey bir kapak yapılandırmasıdır. Latitude 7310'un rakipleri, Lenovo ThinkPad X390 / X395, HP EliteBook 735, Dynabook Portege X30L-G veya tüketici hibrit Yüzey Dizüstü Bilgisayarı 3 veya ThinkBook serisi.Daha fazla Dell yorumu: Latitude 7410Alienware m15 R2Precision 5540XPS 15 9500G5 15 SE
Derecelendirme | Tarih | Modeli | Ağırlık | Yükseklik | Boyut | Çözünürlük | Fiyat |
|---|---|---|---|---|---|---|---|
| 89.4 % v7 (old) | 07/2020 | Dell Latitude 7310 i7-10610U, UHD Graphics 620 | 1.2 kg | 18.3 mm | 13.30" | 1920x1080 | |
| 88.8 % v7 (old) | 10/2019 | Lenovo ThinkPad X395 R3 PRO 3300U, Vega 6 | 1.3 kg | 16.9 mm | 13.30" | 1920x1080 | |
| 86 % v7 (old) | HP EliteBook 735 G6 7KN29EA R5 PRO 3500U, Vega 8 | 1.5 kg | 17.7 mm | 13.30" | 1920x1080 | ||
| 92.1 % v7 (old) | 06/2020 | Apple MacBook Pro 13 2020 2GHz i5 10th-Gen i5-1038NG7, Iris Plus Graphics G7 (Ice Lake 64 EU) | 1.4 kg | 15.6 mm | 13.30" | 2560x1600 | |
| 82.6 % v7 (old) | 09/2020 | HP ProBook 455 G7-175W8EA R7 4700U, Vega 7 | 1.8 kg | 19 mm | 15.60" | 1920x1080 |
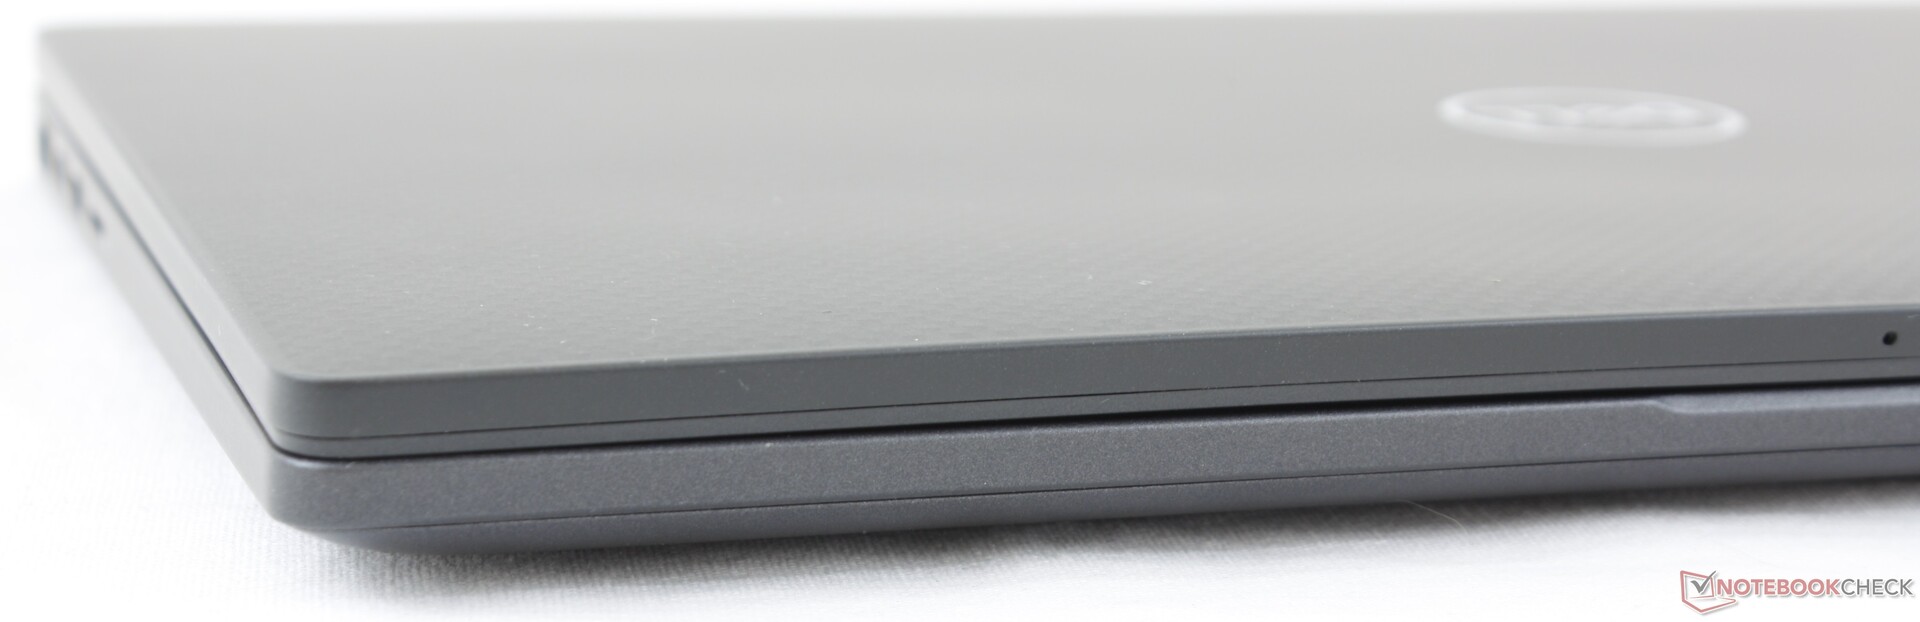
Durum
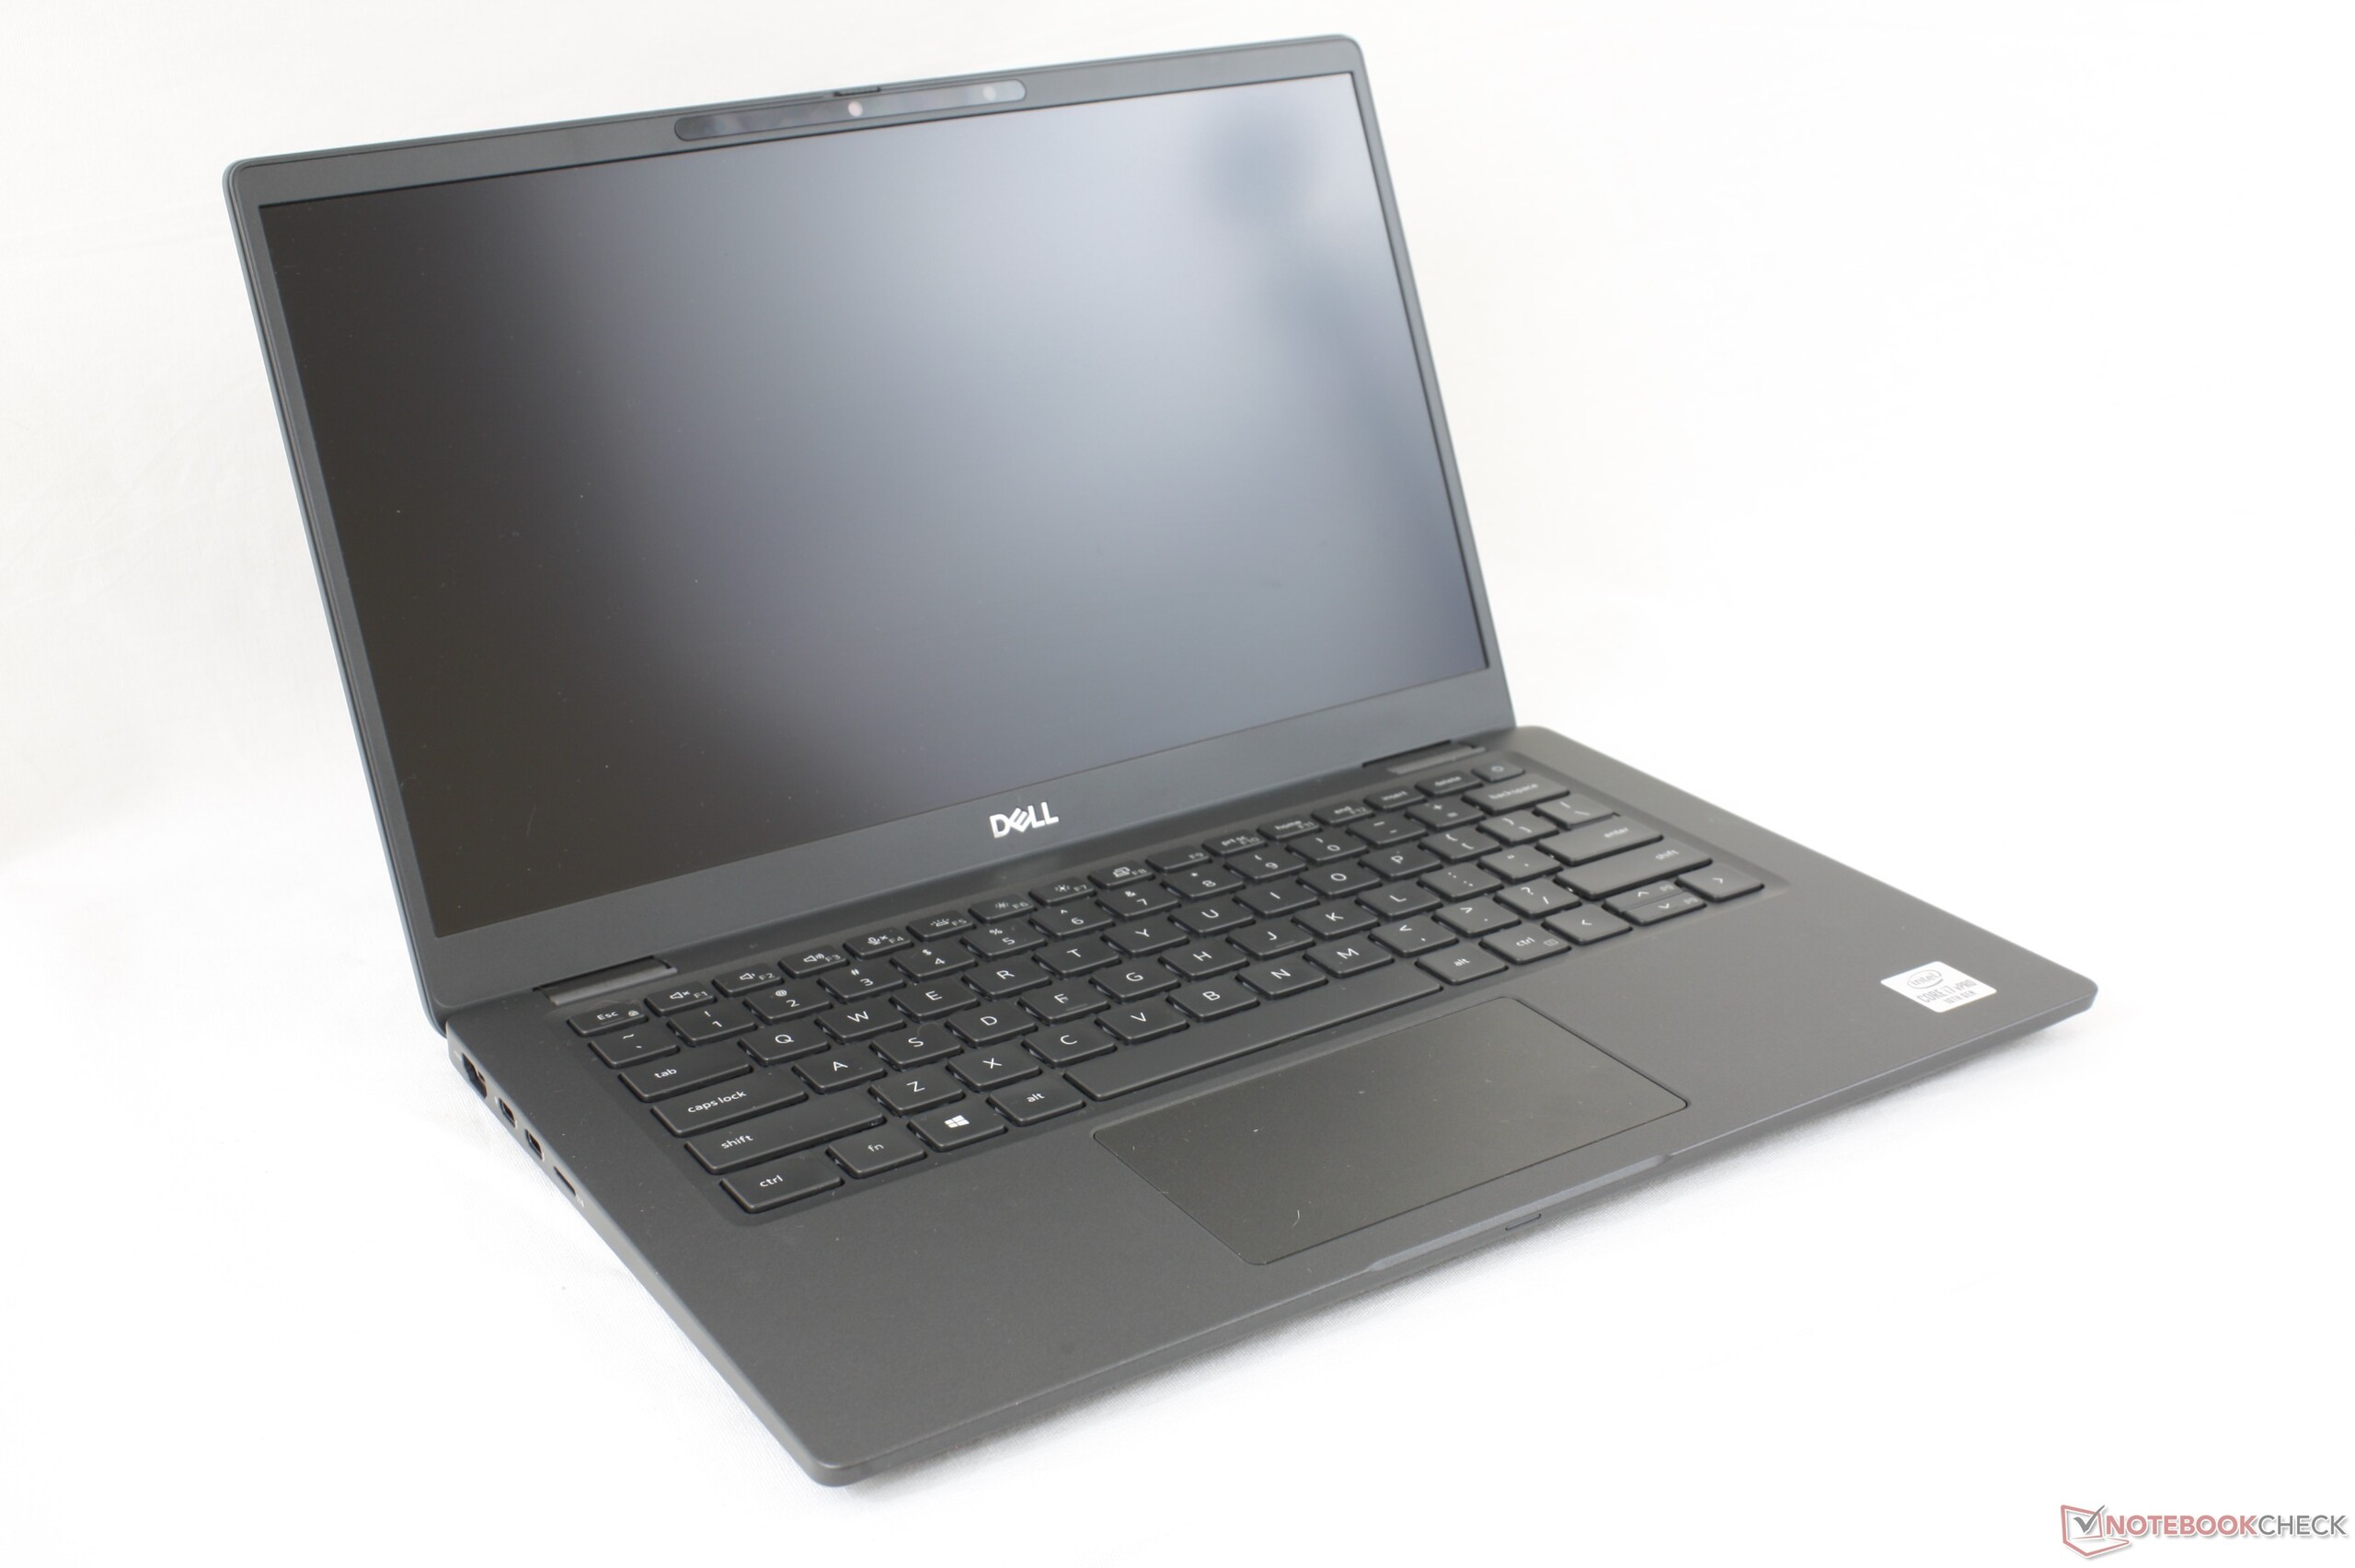
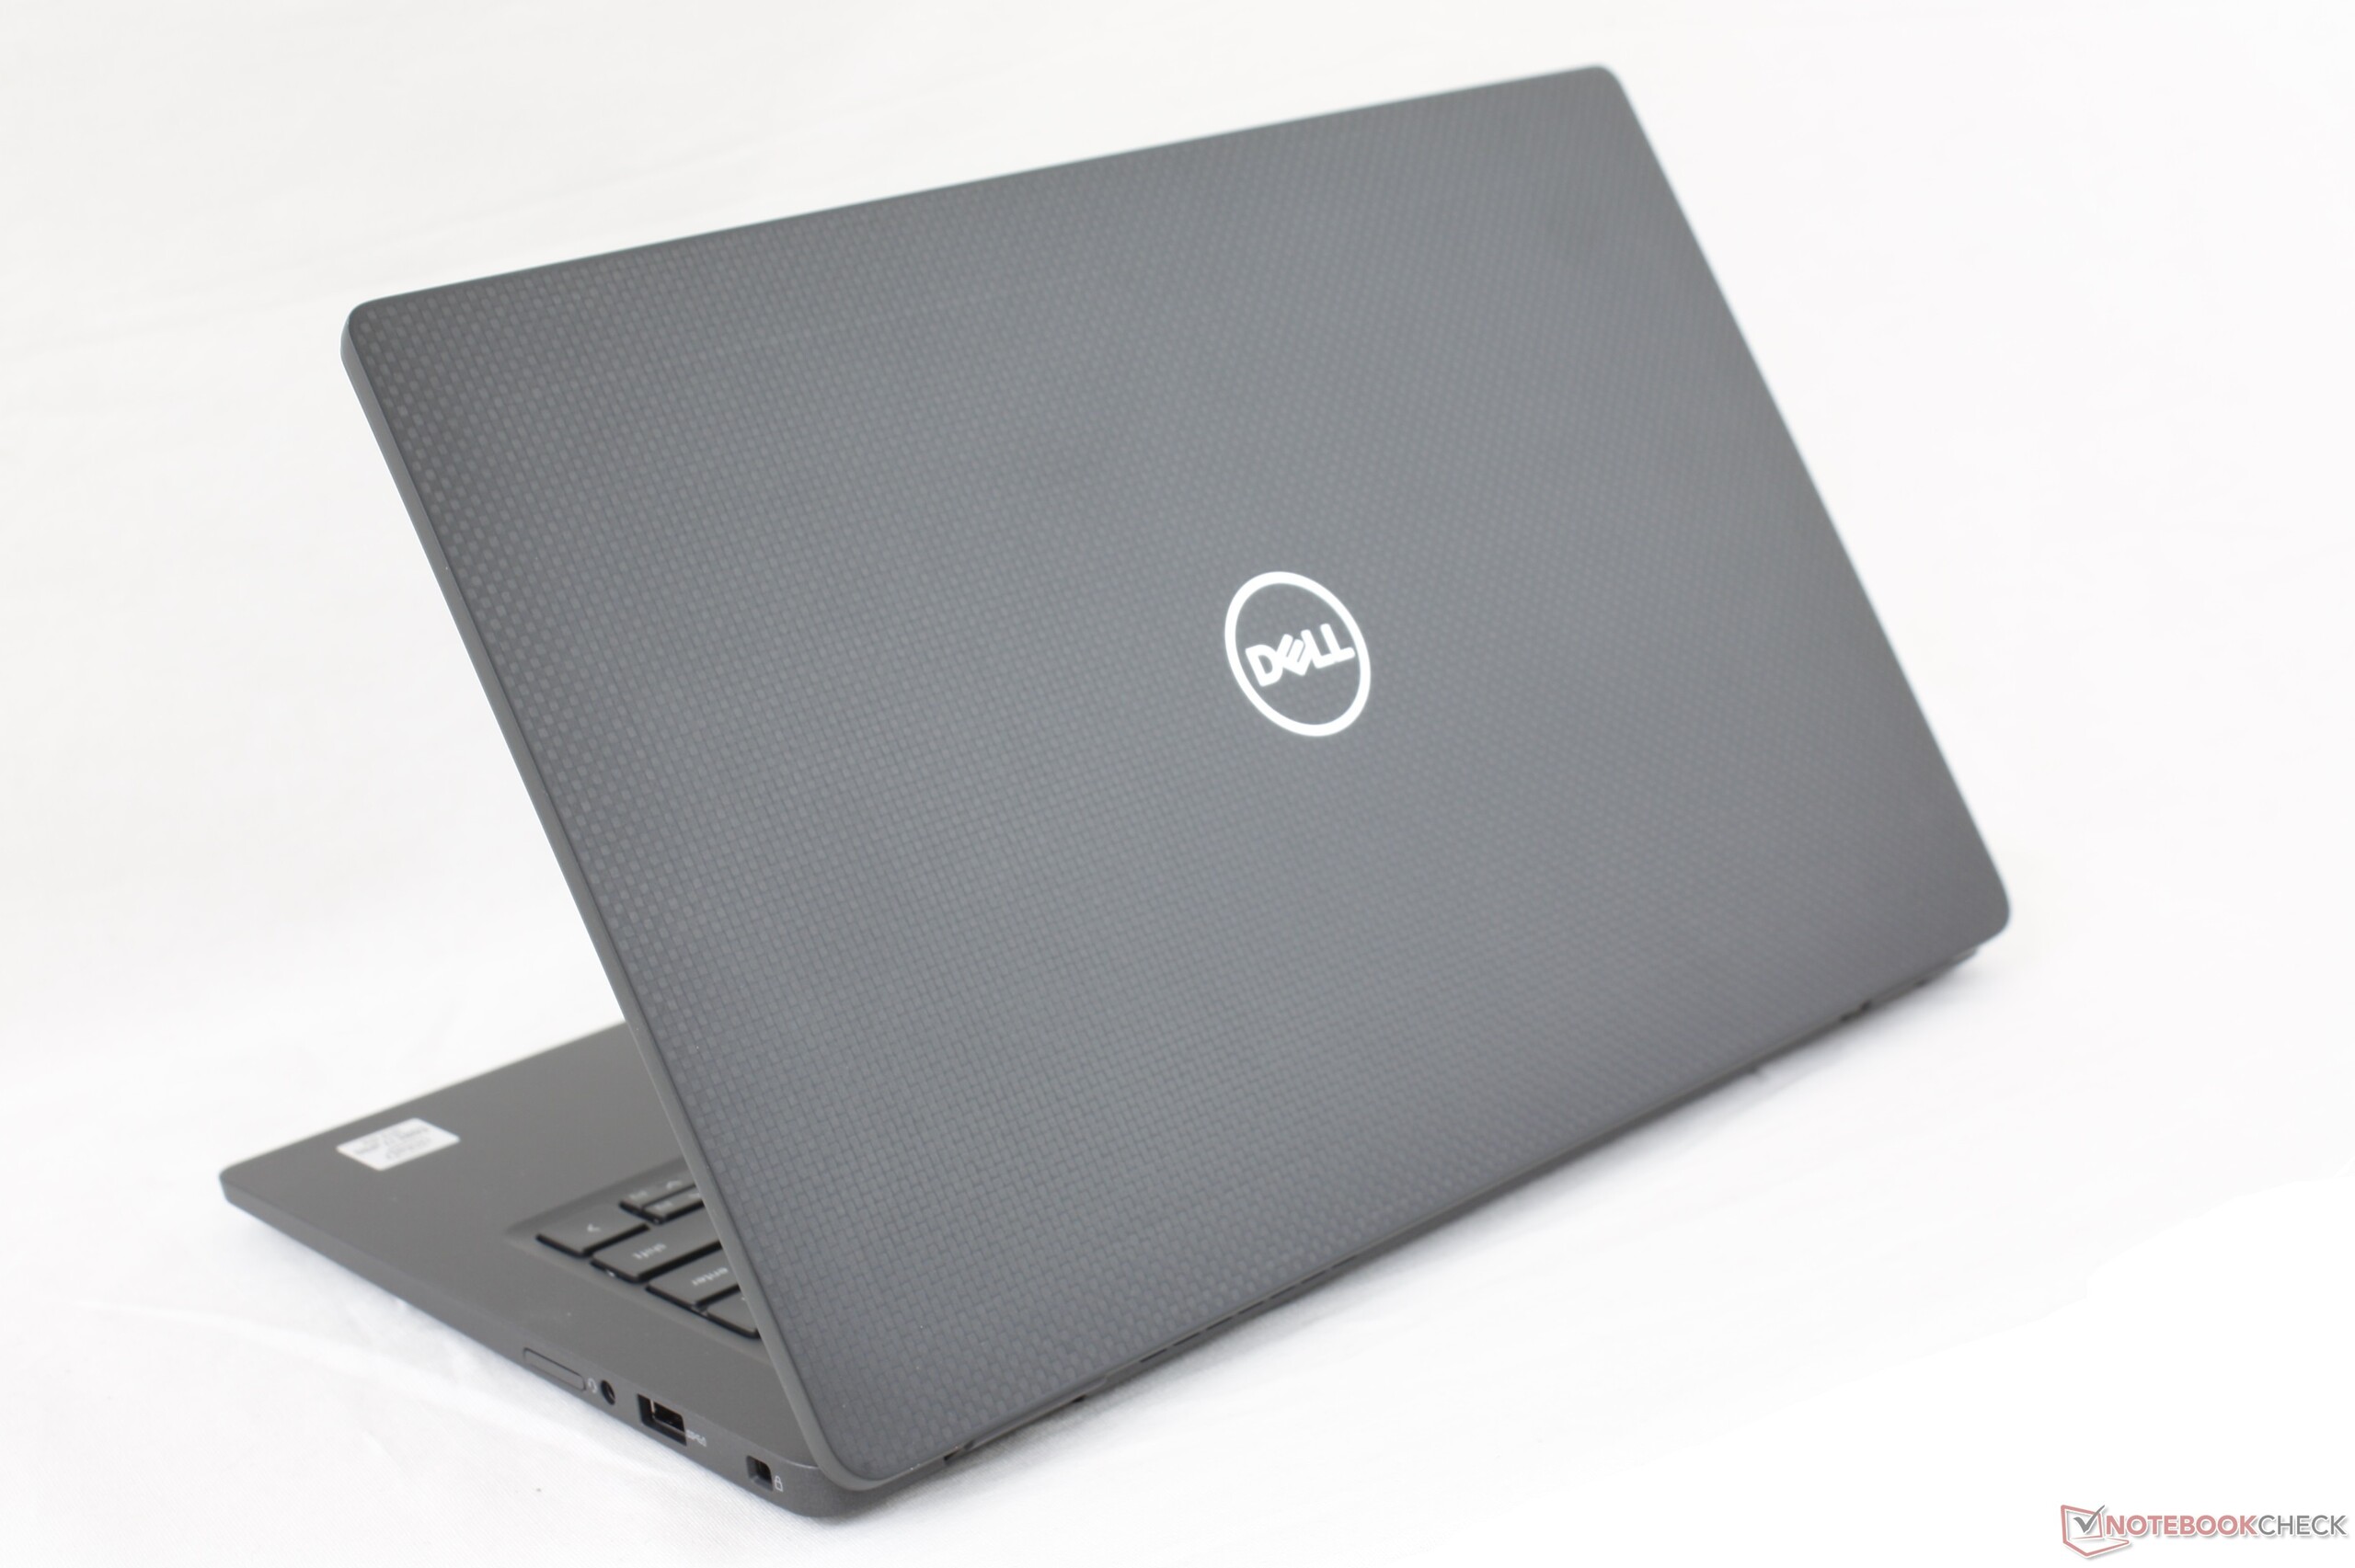
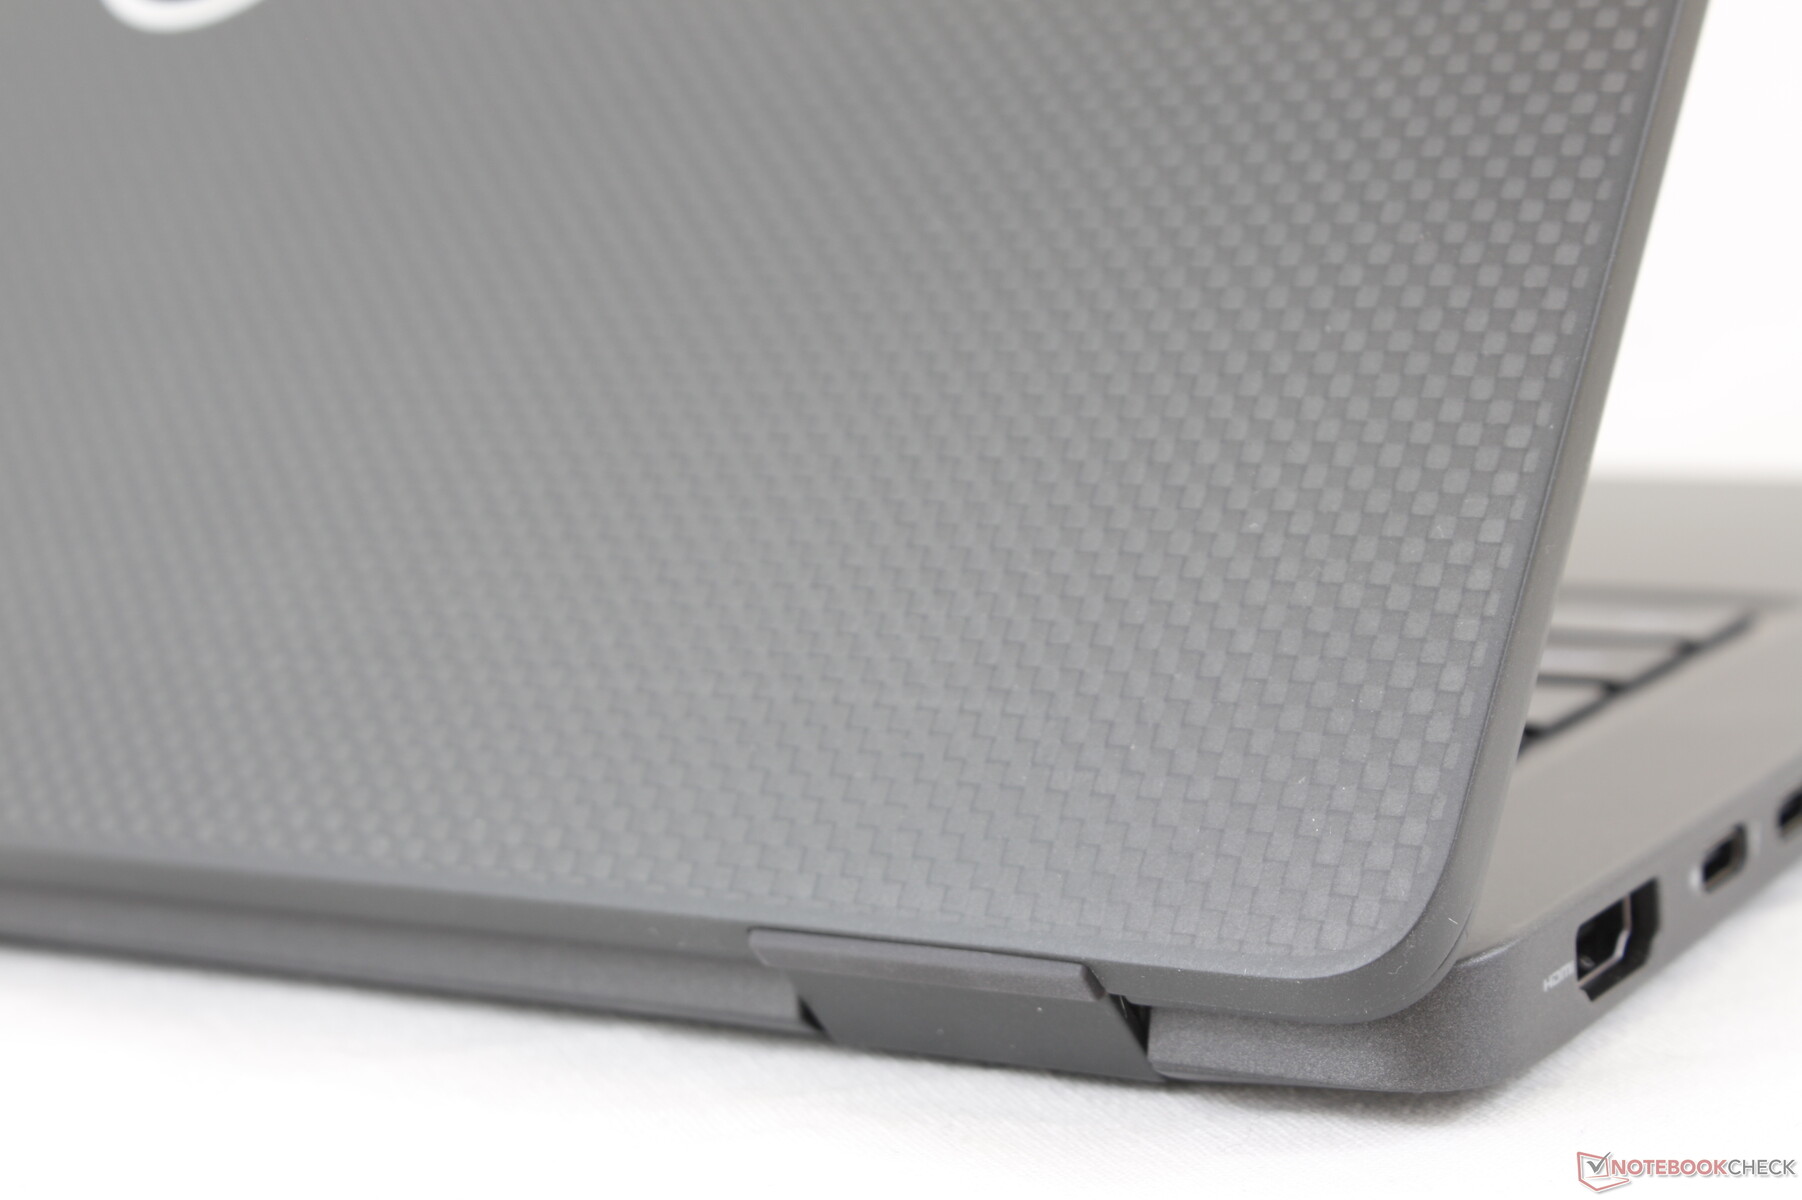
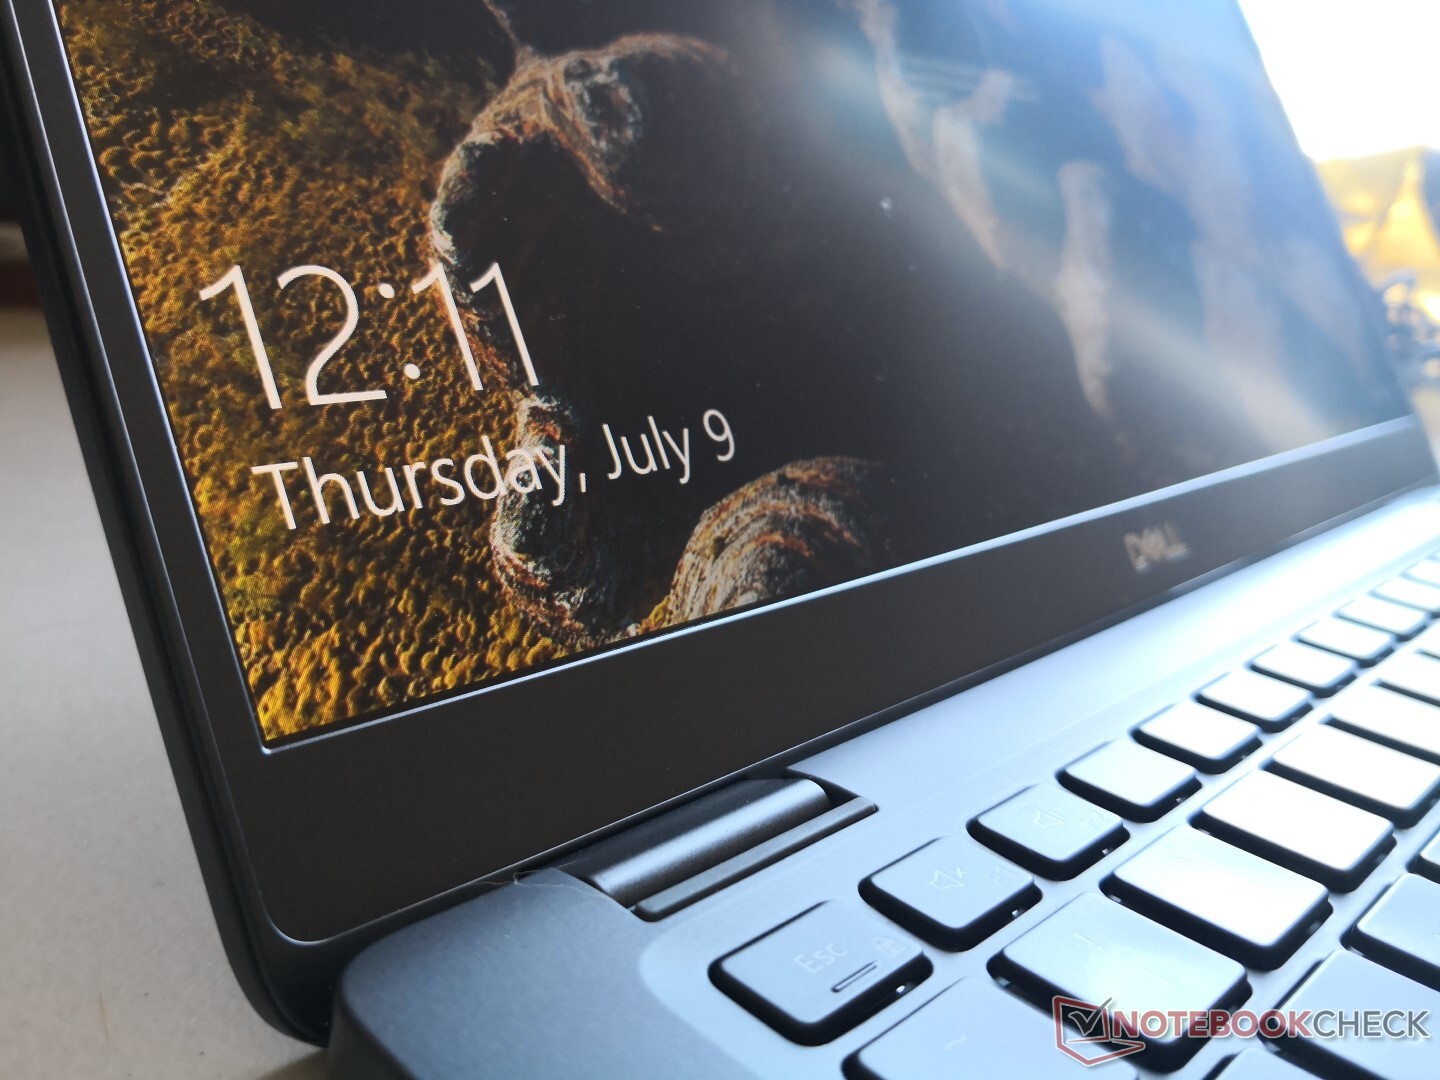
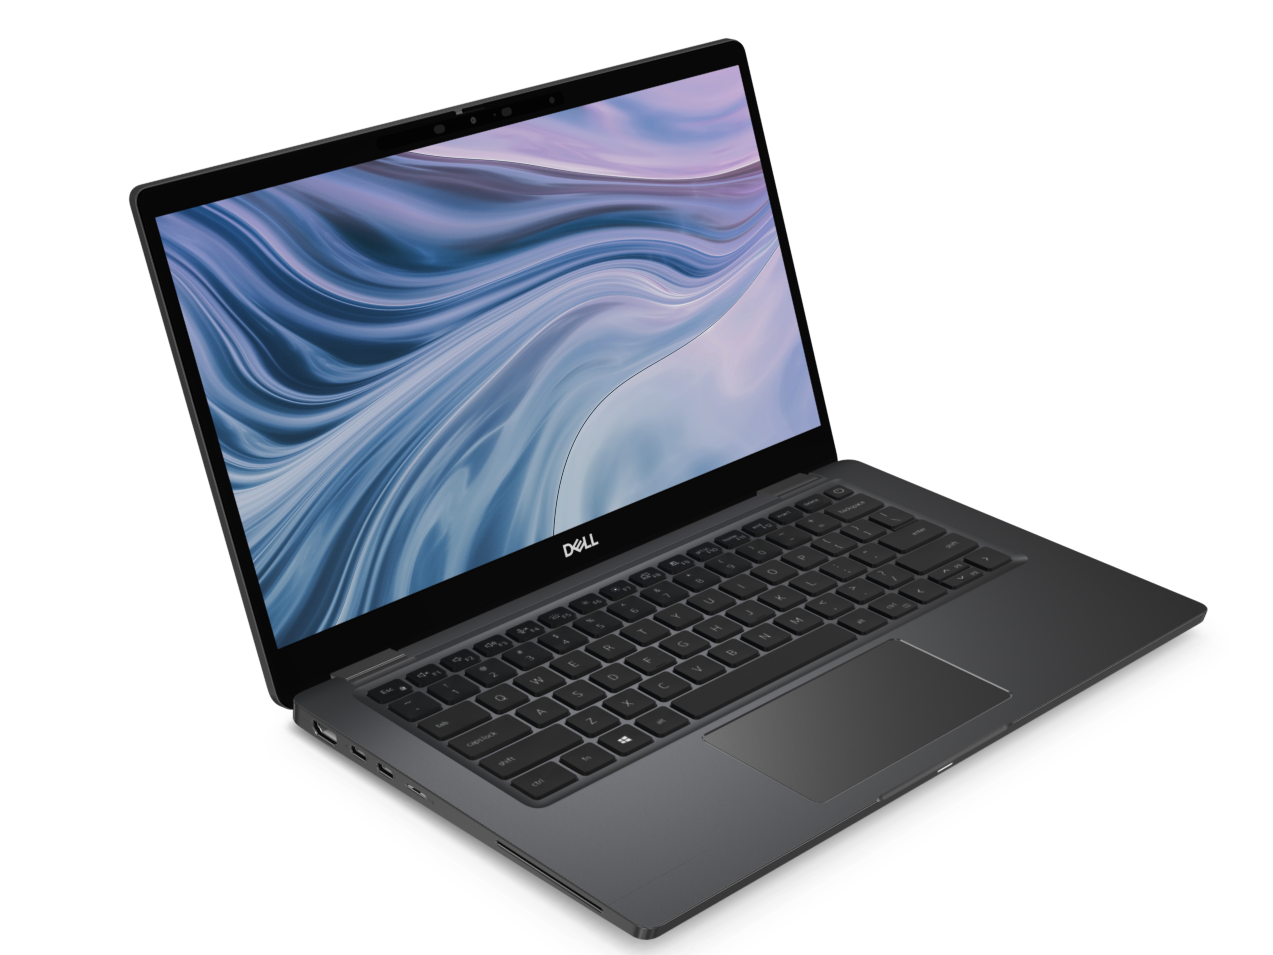
XPS 13'ün gösterişli ve göz alıcı görünümünün aksine, Latitude 7310, geleneksel konferans odalarına ve profesyonel ortamlara uymak için çok daha göze çarpmaz. Karbon fiber şasi ve yumuşak doku, bazı XPS 13 veya XPS 15 modellerinde bulunan karbon fiber avuç içi dayanıklarına benzer, aynı zamanda güçlü ve modern ThinkPad T serisi dizüstü bilgisayarlarla karşılaştırılabilir. Bununla birlikte, E7440 gibi eski Latitude dizüstü bilgisayarlardan farklı olarak, iç metal iskelet yoktur ve bu nedenle sistem hafifçe bükülme veya çöküntülere bükülecektir.Latitude 7410'daki gibi bir alüminyum alaşım seçeneği mevcuttur. karbon fiber konfigürasyonumuza göre tasarım, ancak çoğunlukla kullanıcı tercihine bağlıdır.
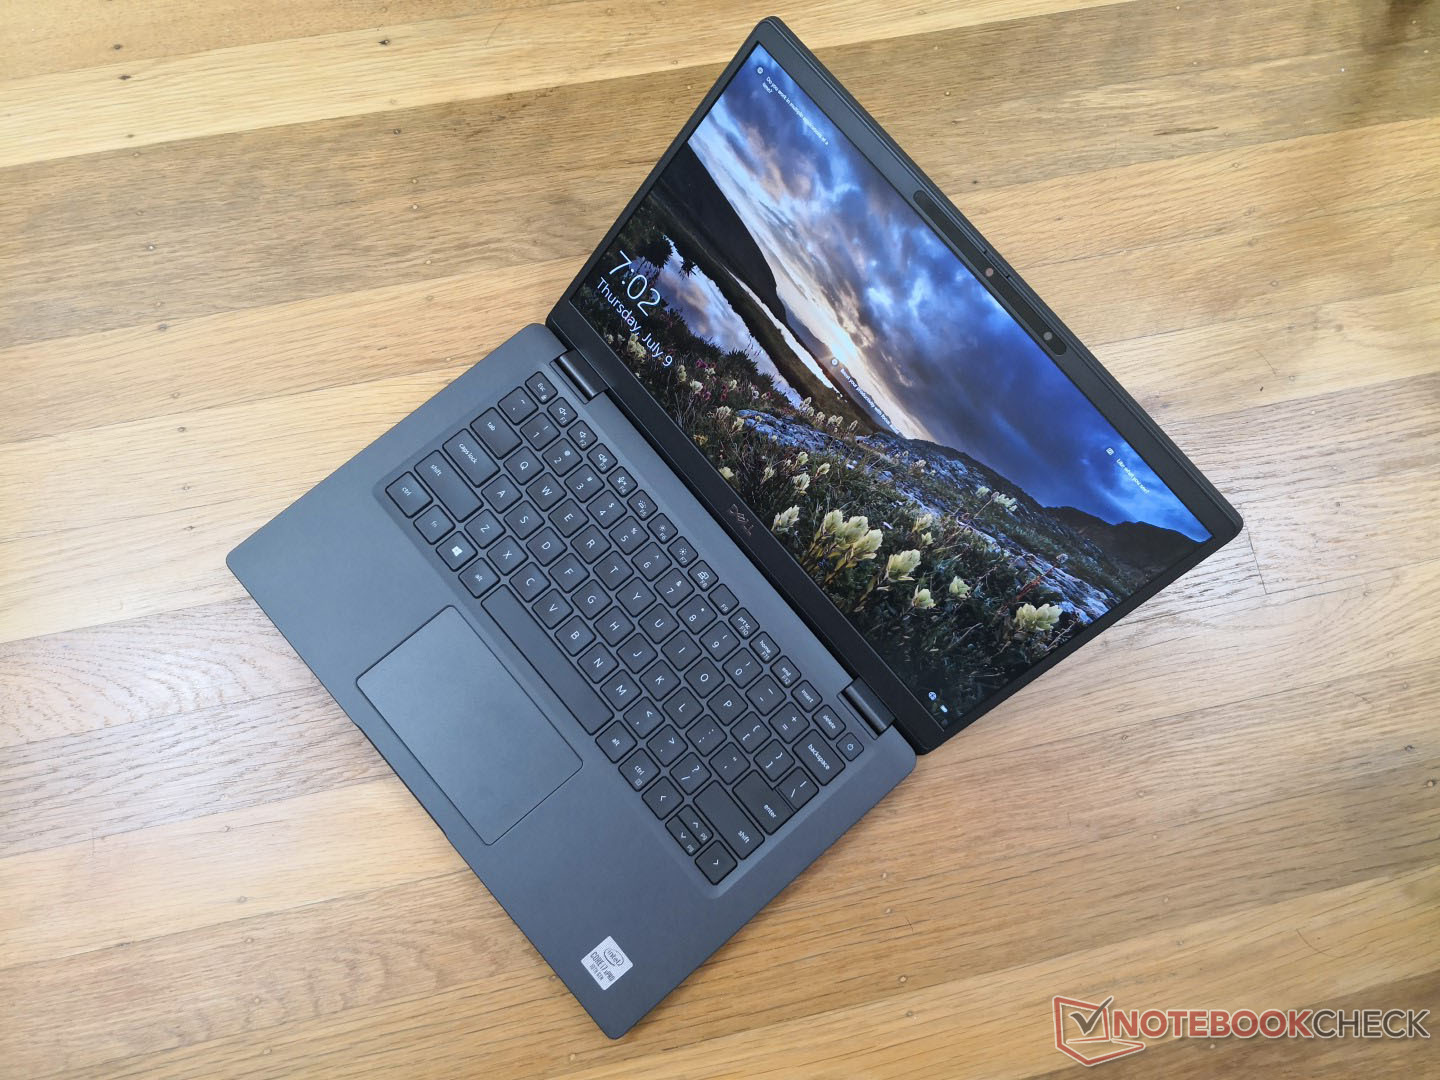
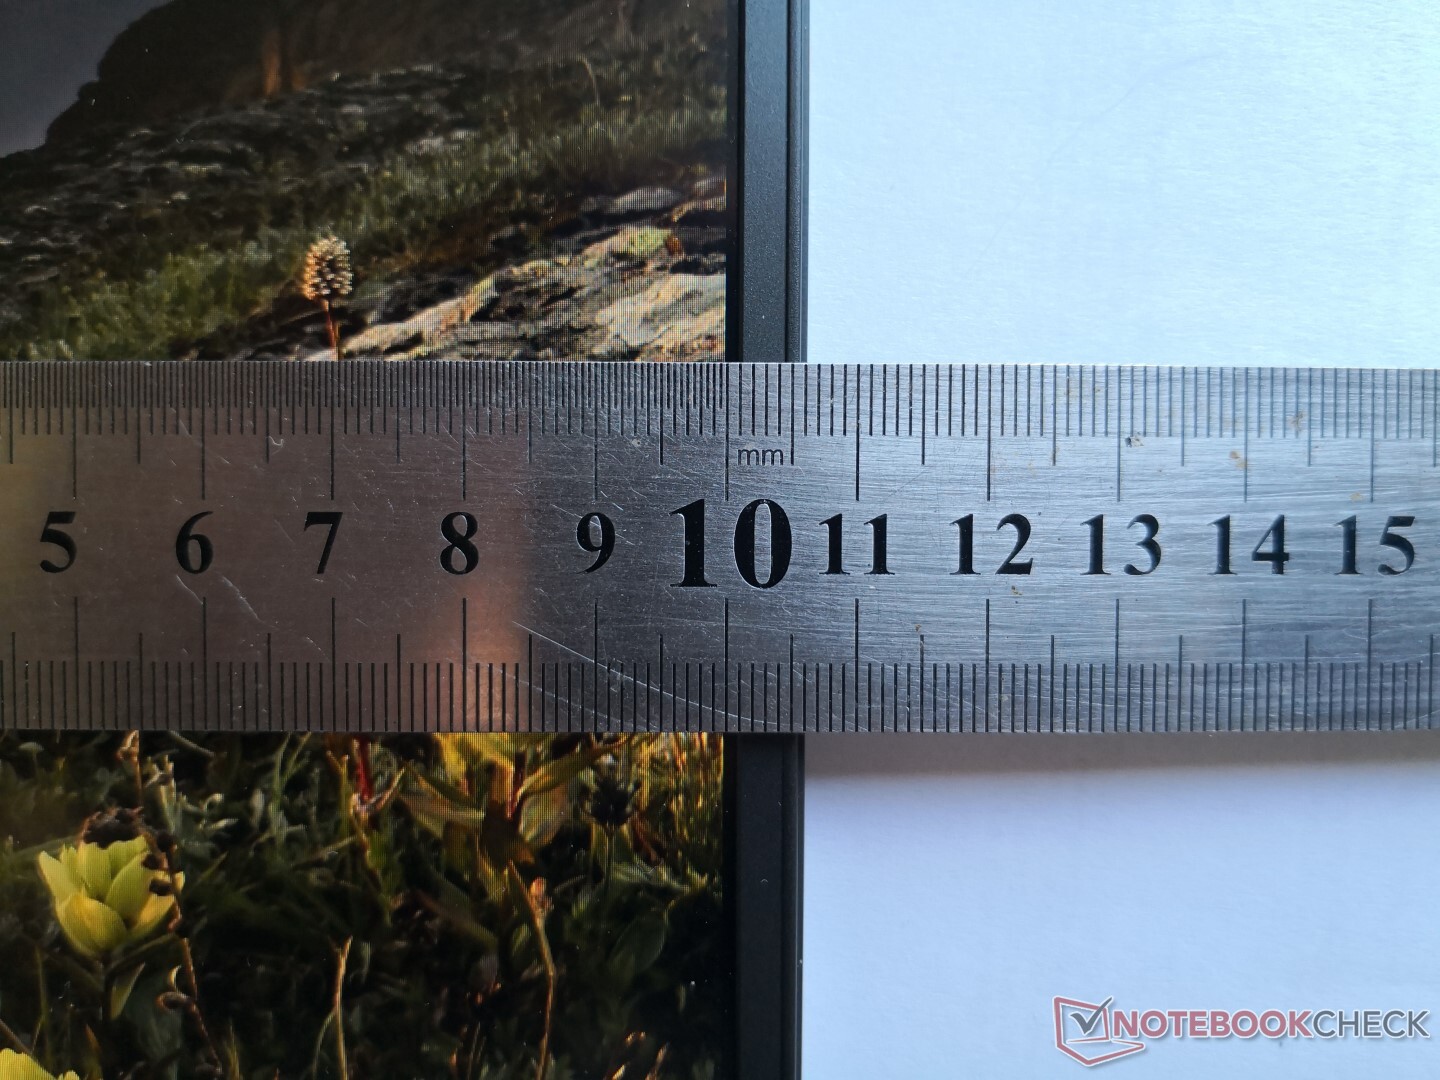
Sistem öncekinden biraz daha kısa olmasına rağmen, en göze çarpan fark, daha ince olan XPS 13 9300 kadar hafif olması için yaklaşık 200 g daha hafif olmasıdır. Bu, hafif olduğunu tespit ettiğimiz Latitude 7410'un aksine diğer 14 inçlik alt kitaplardan daha ağır. Bu boyut sınıfındaki "nihai" süper hafif iş dizüstü bilgisayarı Toshiba Portege X30L olmaya devam ediyor.
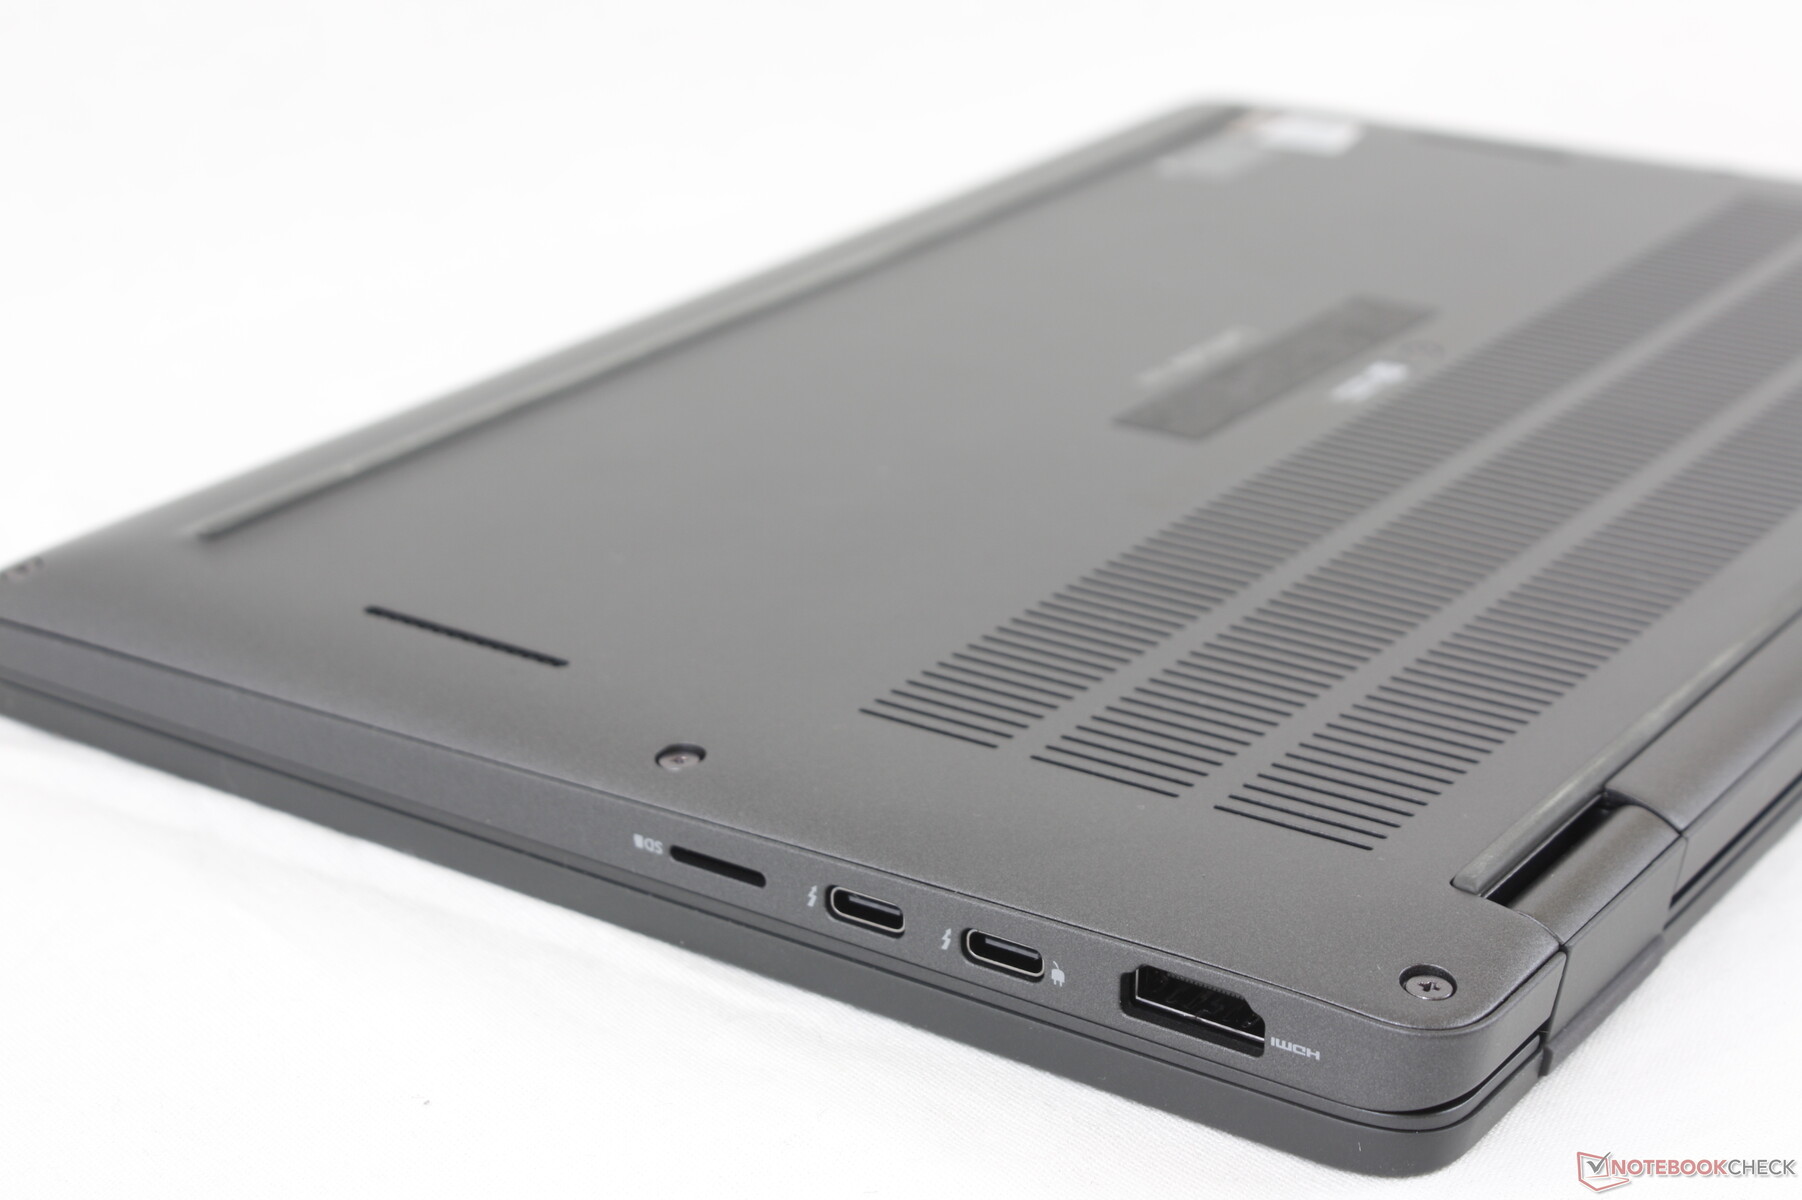
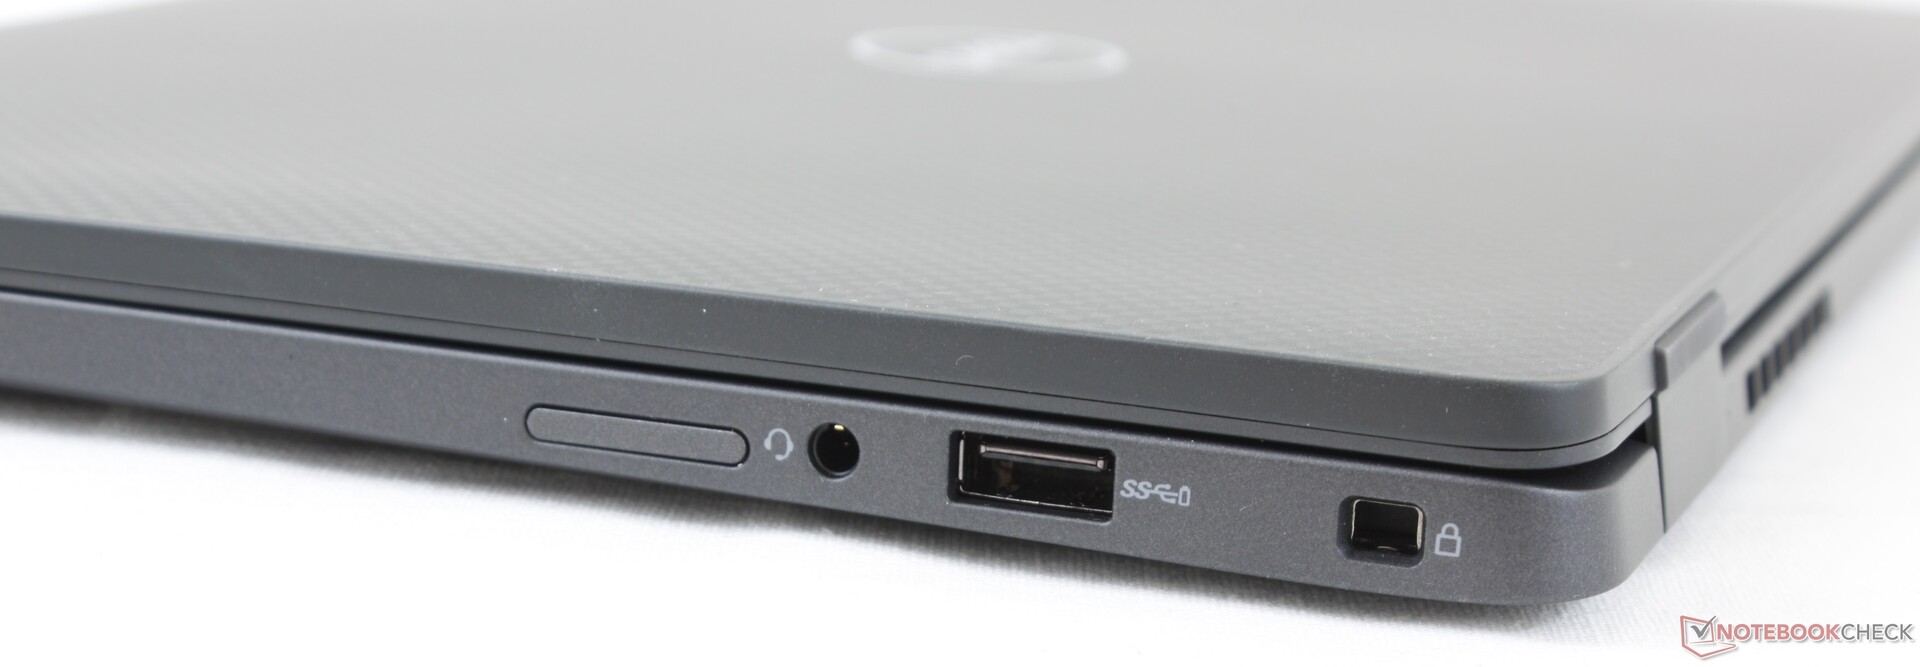
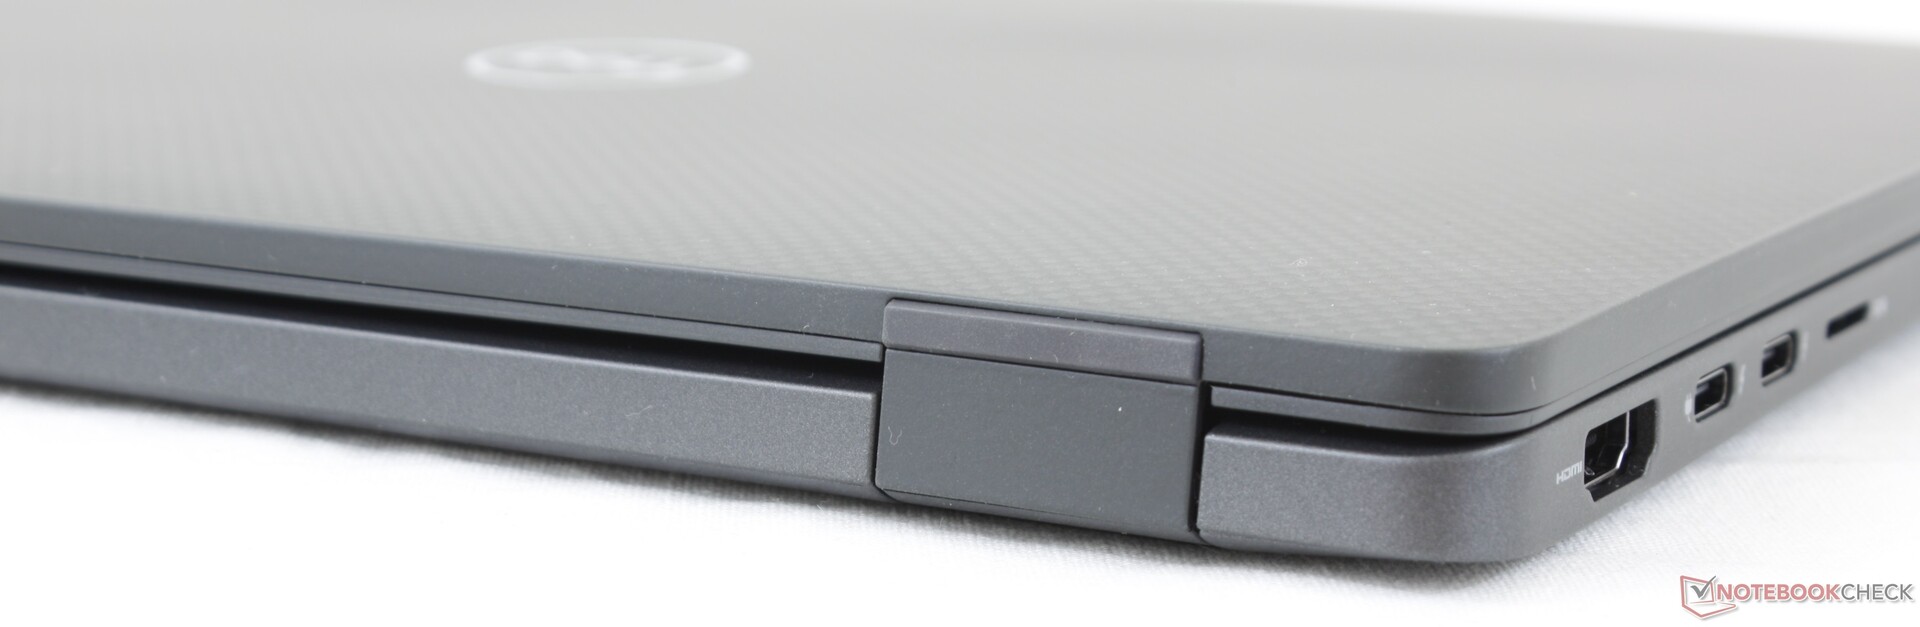
Bağlantı
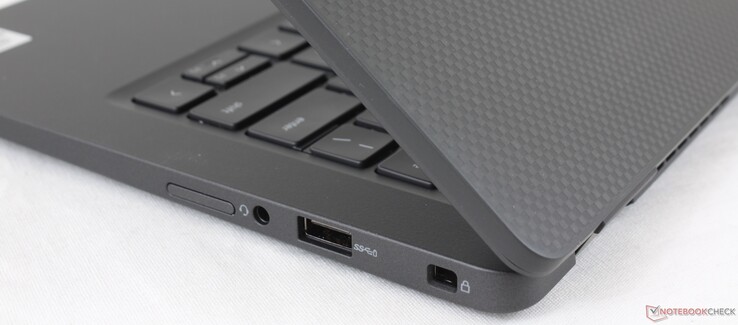
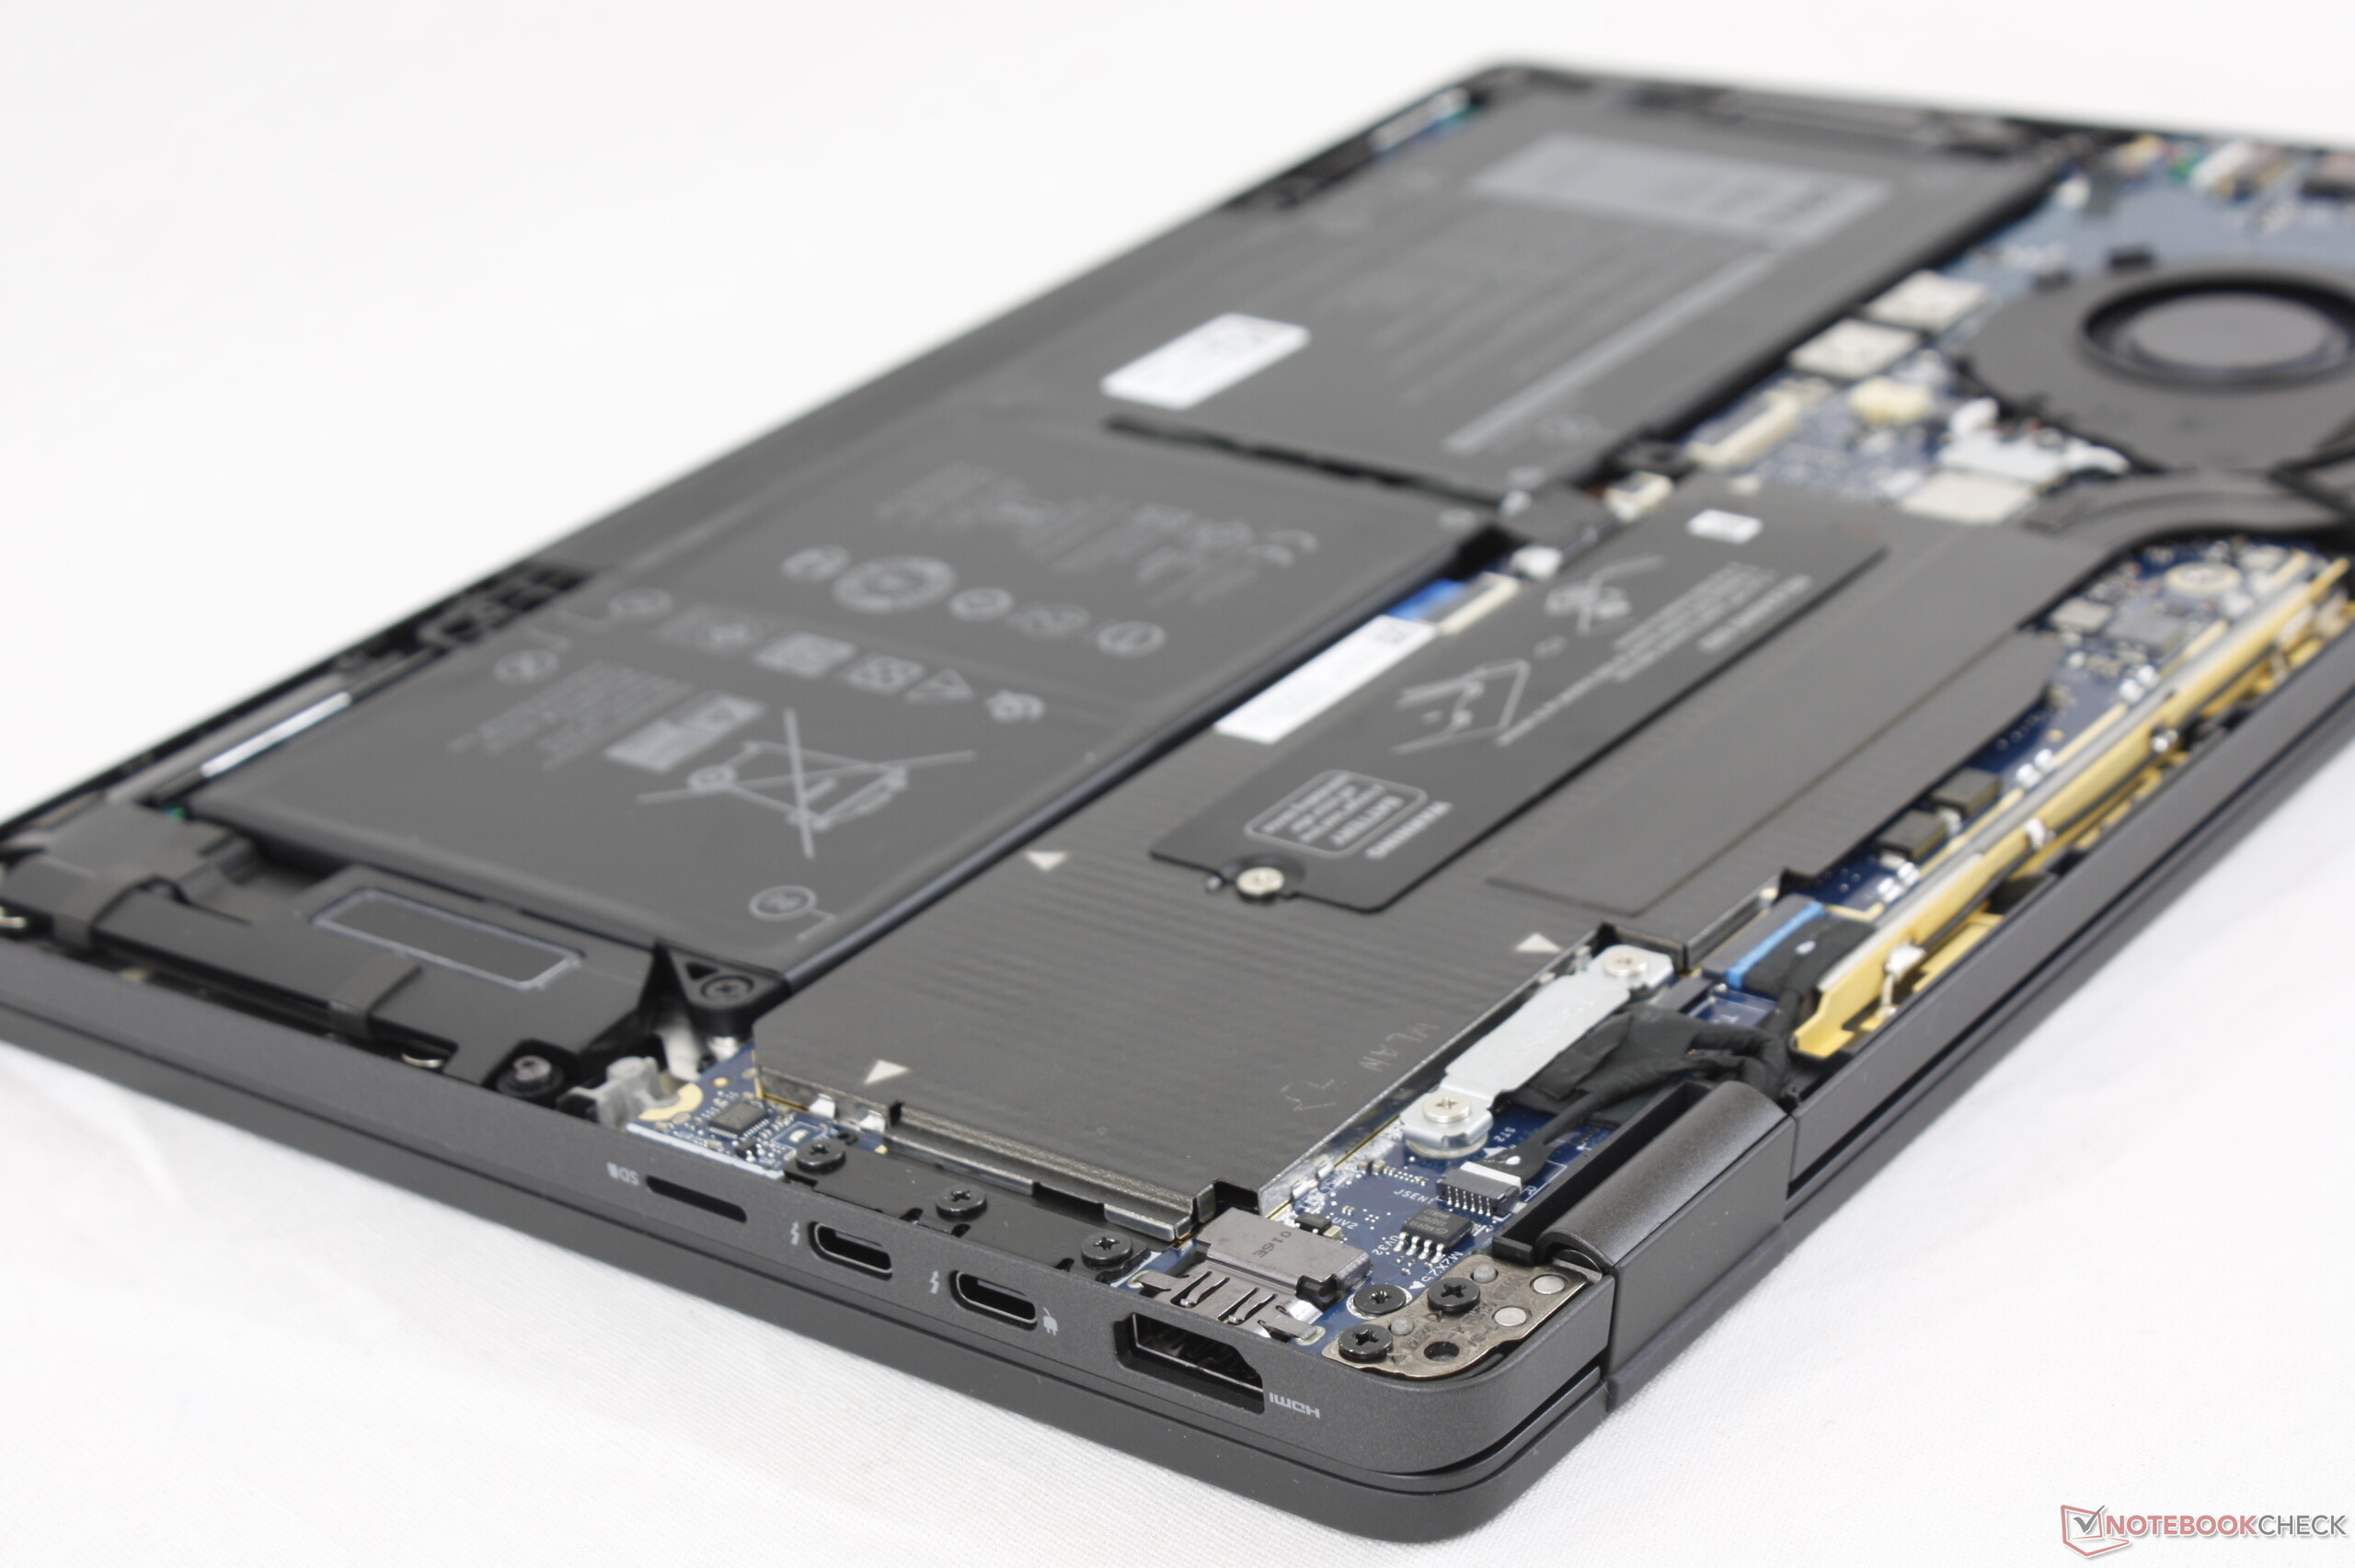
Bağlantı noktası seçenekleri ve konumlandırma, Latitude 7410'un bir USB Tip-A bağlantı noktası ile aynıdır. En önemlisi, Dell tescilli varil AC adaptör bağlantı noktasını hem şarj etme hem de yerleştirme istasyonları için ikinci bir Thunderbolt 3 bağlantı noktası lehine düşürdü. USIM ve Akıllı Kart okuyucular isteğe bağlı olarak kalır.
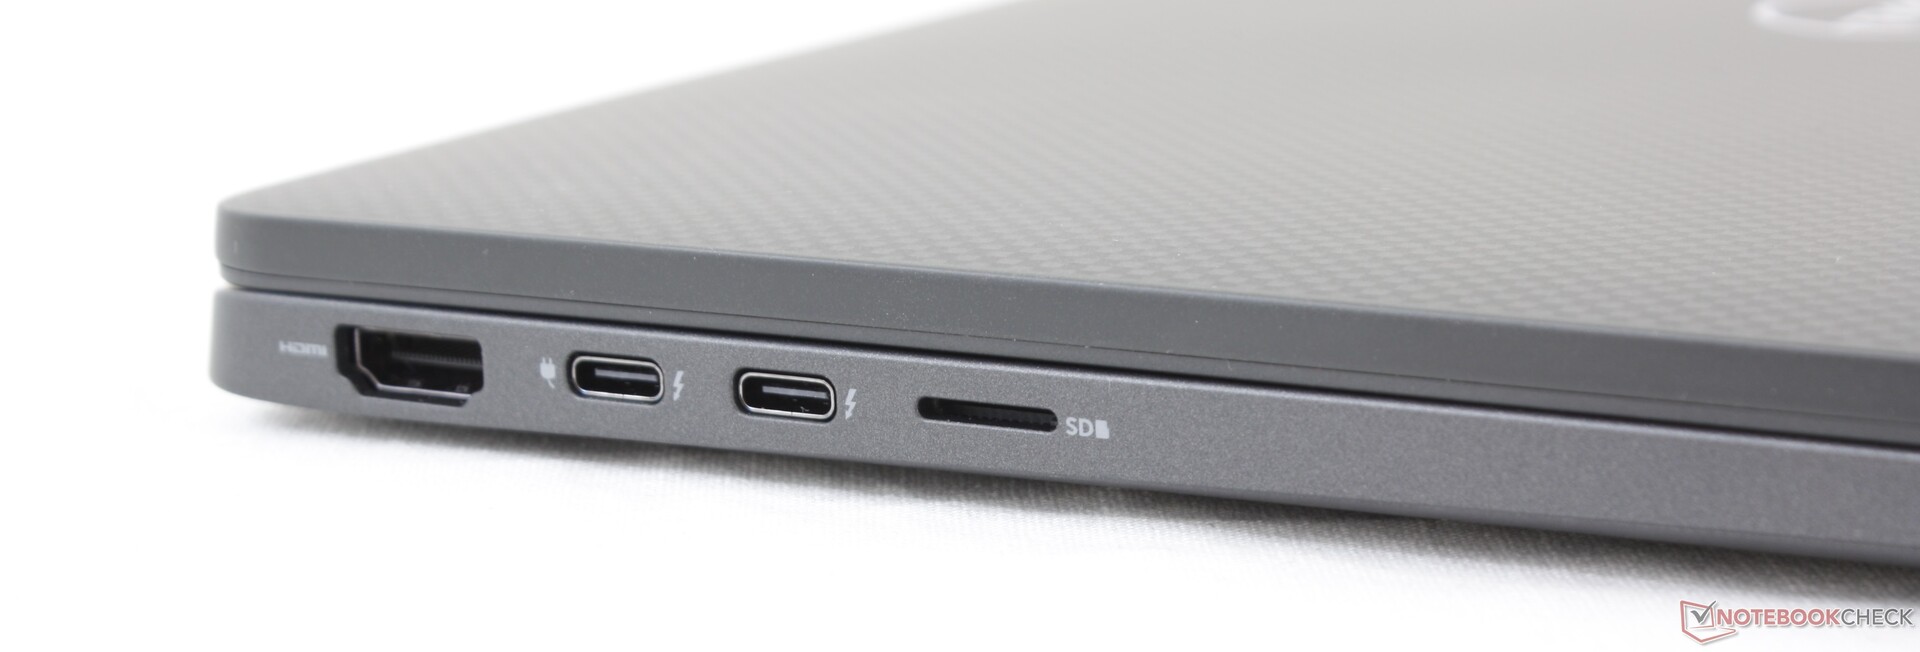
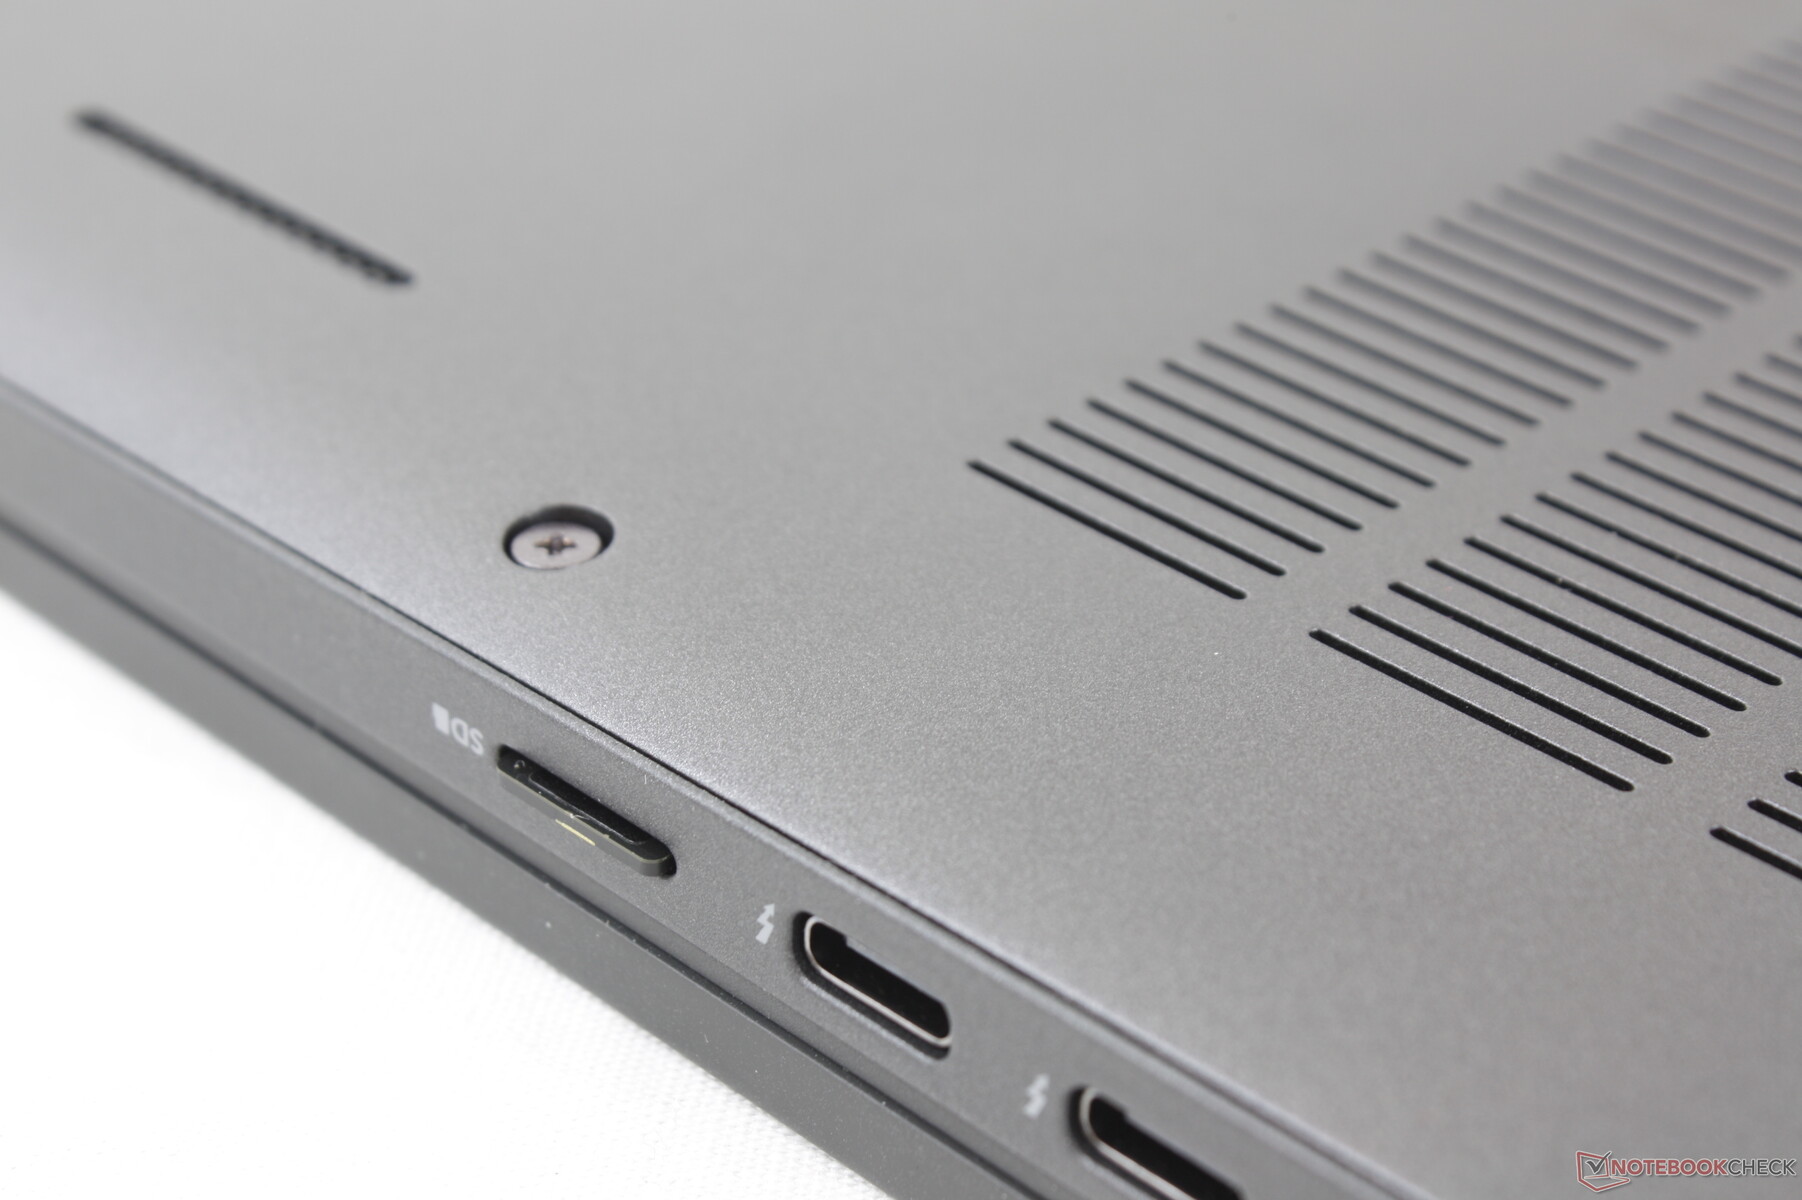
SD Kart Okuyucu
Yaylı MicroSD kart okuyucusundan aktarım hızları, herhangi bir işletme alt not defterinde en hızlı olmaya devam ediyor. UHS-II test kartımızdan masaüstüne 1 GB görüntü taşımak, ThinkPad X395'teki 16 saniyeye kıyasla sadece 6 saniye sürer.
| SD Card Reader | |
| average JPG Copy Test (av. of 3 runs) | |
| Dell Latitude 7300-P99G (Toshiba Exceria Pro M501 microSDXC 64GB) | |
| Dell Latitude 7310 (Toshiba Exceria Pro M501 64 GB UHS-II) | |
| Lenovo ThinkPad X395 | |
| Asus ZenBook S13 UX392FN (Toshiba Exceria Pro M501 64 GB UHS-II) | |
| maximum AS SSD Seq Read Test (1GB) | |
| Dell Latitude 7310 (Toshiba Exceria Pro M501 64 GB UHS-II) | |
| Dell Latitude 7300-P99G (Toshiba Exceria Pro M501 microSDXC 64GB) | |
| Lenovo ThinkPad X395 | |
| Asus ZenBook S13 UX392FN (Toshiba Exceria Pro M501 64 GB UHS-II) | |
İletişim
Kullanıcılar Wi-Fi 5 veya Wi-Fi 6 bağlantısı için sırasıyla Intel 9560 veya AX201 arasında yapılandırma yapabilir. WLAN modülü kullanıcı tarafından yükseltilemediğinden dikkatli seçin. Netgear RAX200 test yönlendiricimizle eşleştirildiğinde hiçbir bağlantı sorunu yaşamadık.
| Networking | |
| iperf3 transmit AX12 | |
| Asus Zephyrus G14 GA401IV | |
| Dell Latitude 7310 | |
| Dell XPS 13 9300 4K UHD | |
| Dell Latitude 7410 | |
| iperf3 receive AX12 | |
| Dell XPS 13 9300 4K UHD | |
| Asus Zephyrus G14 GA401IV | |
| Dell Latitude 7410 | |
| Dell Latitude 7310 | |
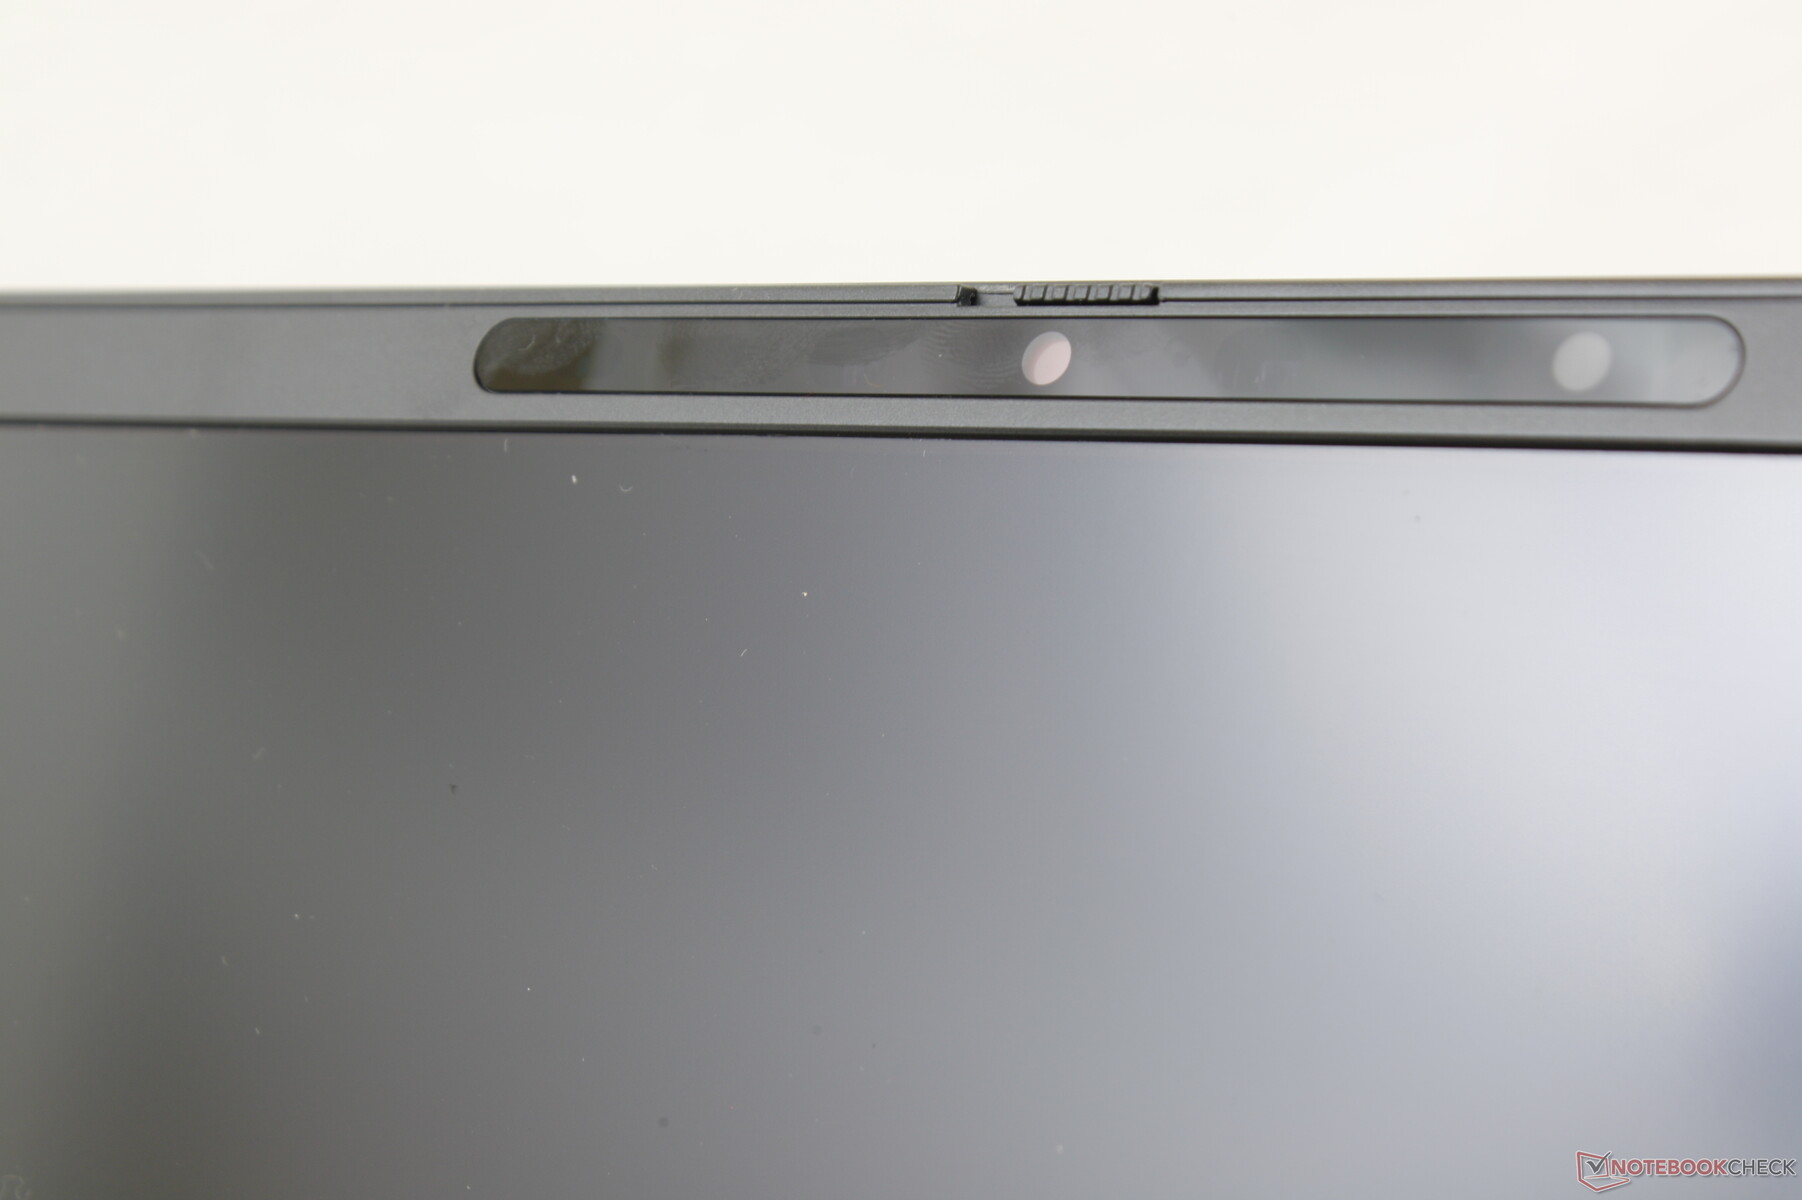
Web kamerası


Güvenlik
Latitude 7410'daki aynı güvenlik özellikleri, vPro, web kamerası deklanşörü, parmak izi okuyucu, IR kamera, Dell Mobile Connect ve tam eller serbest oturum açma için Dell'in özel yakınlık sensörü de dahil olmak üzere Latitude 7310'da da mevcuttur. Bunların çoğu isteğe bağlıdır.
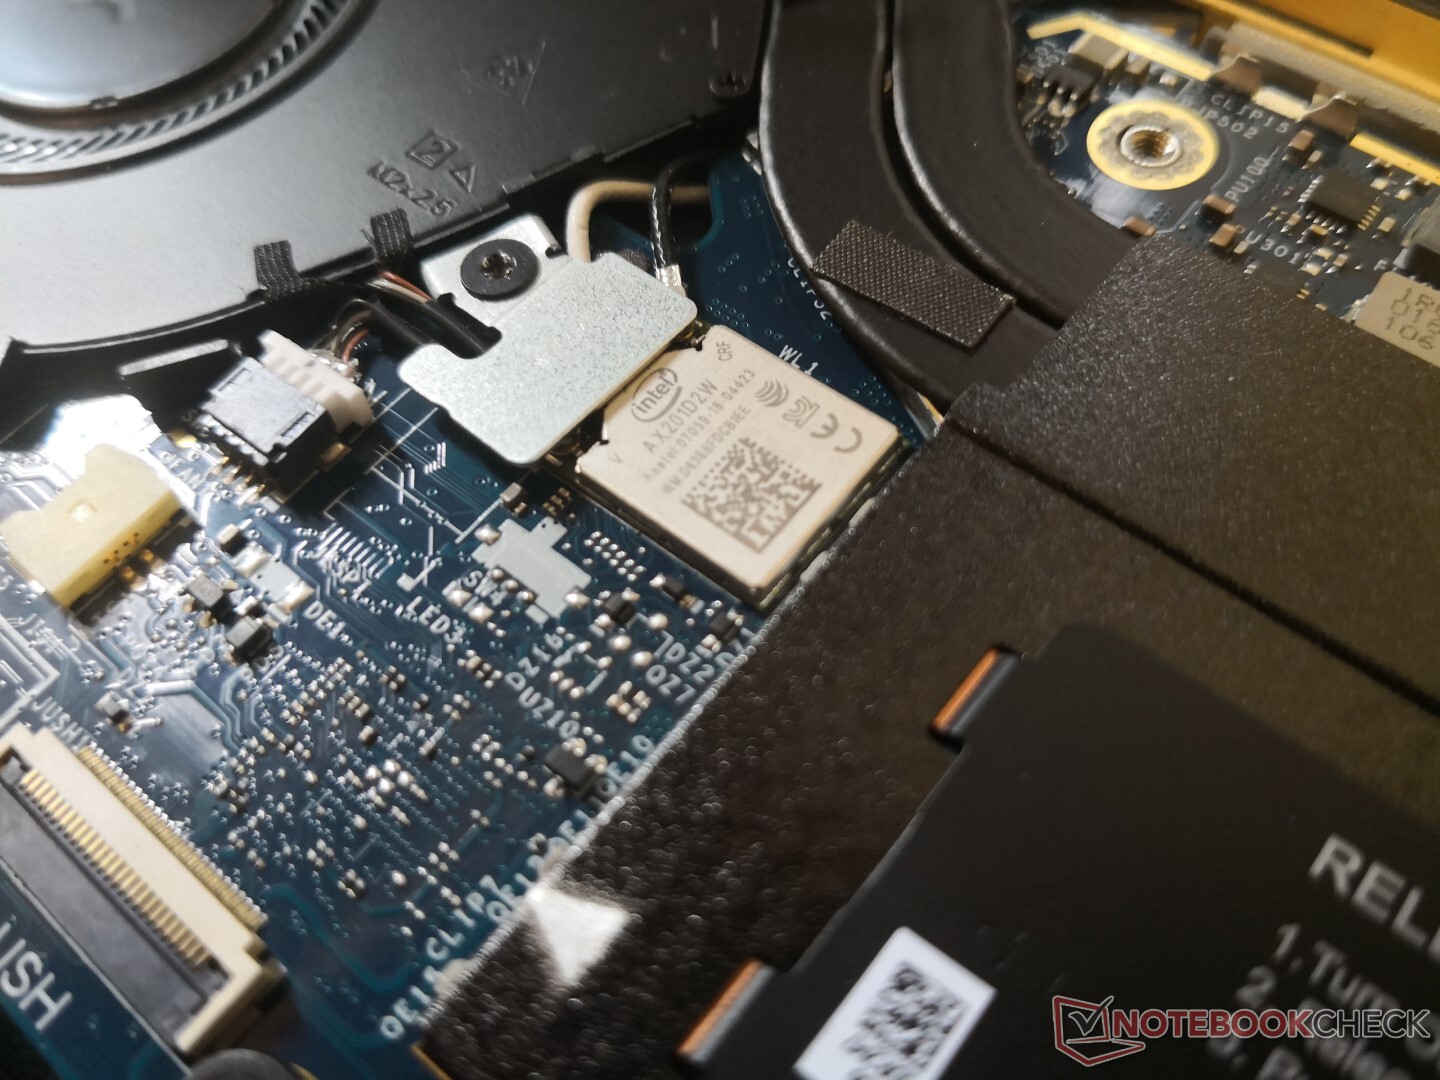
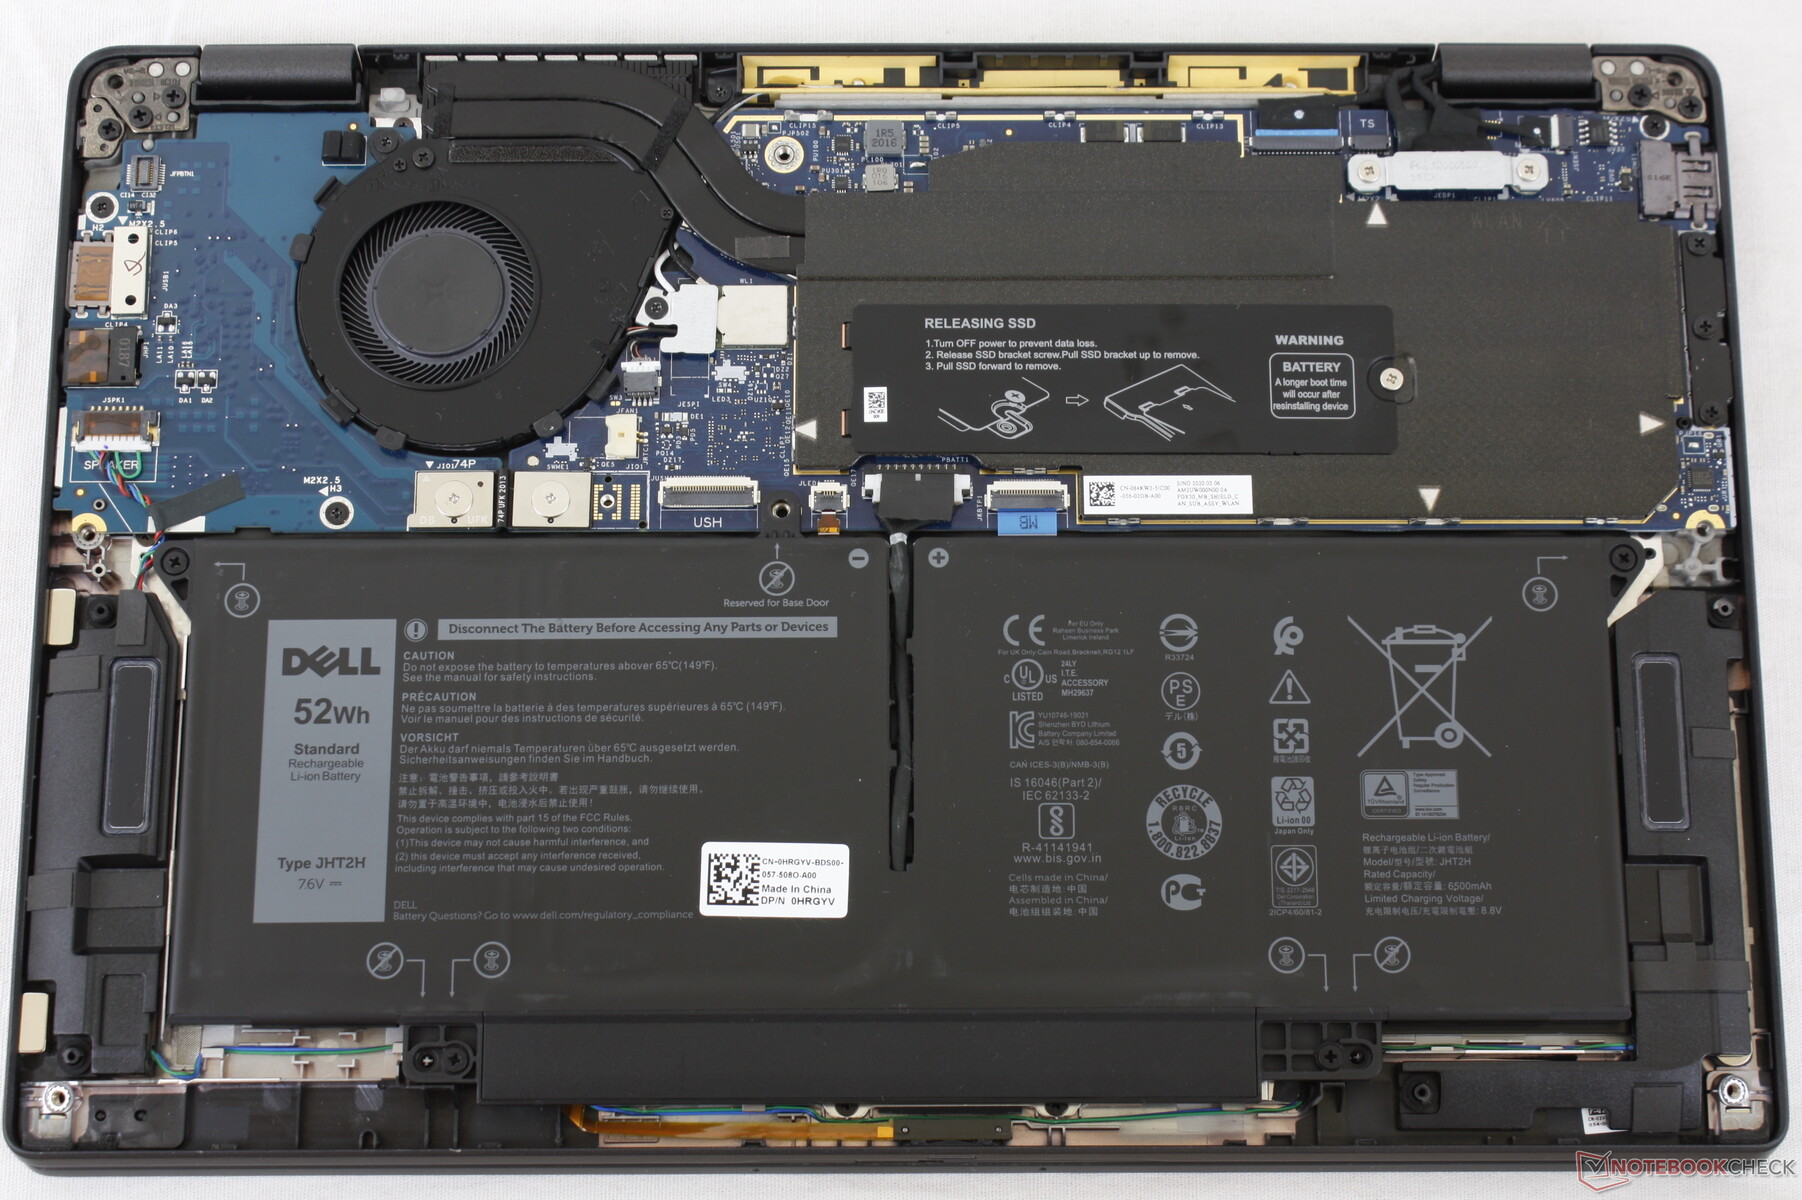
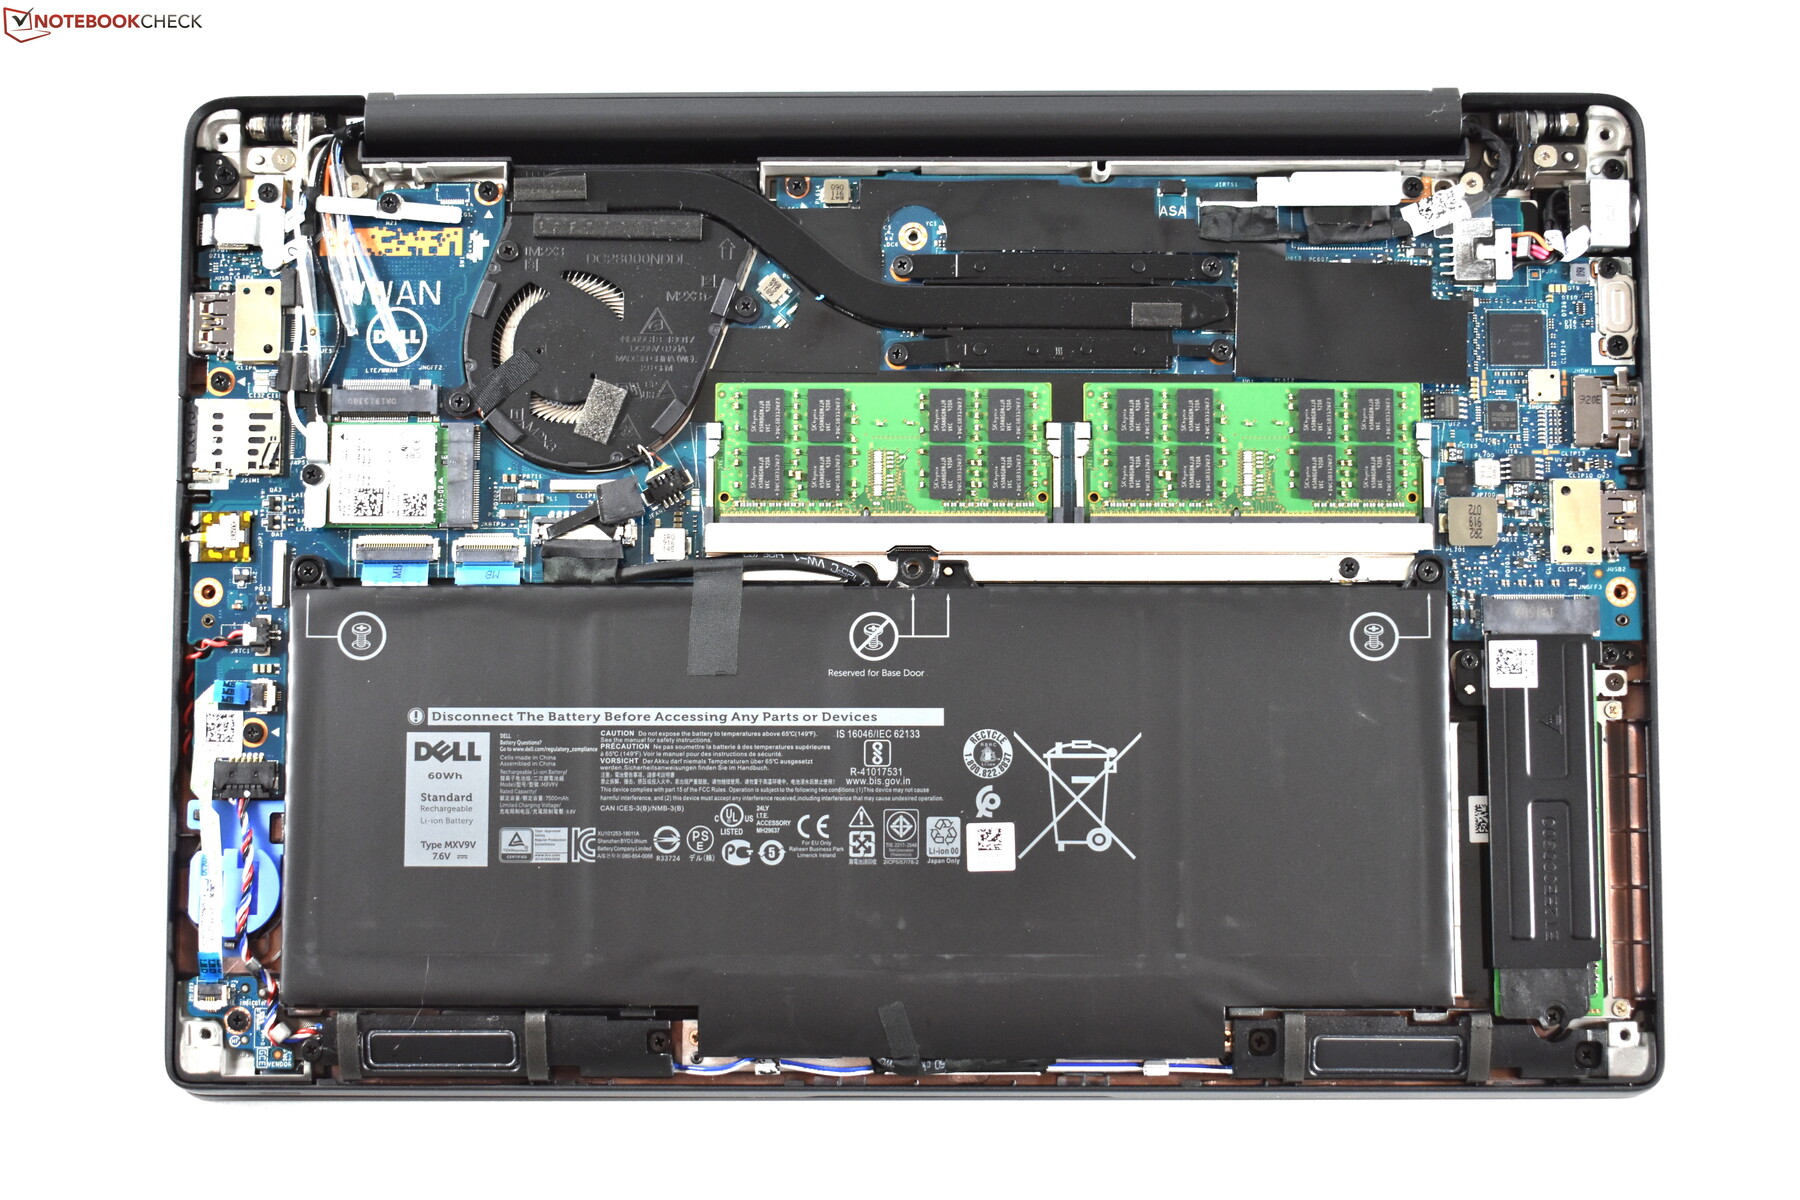
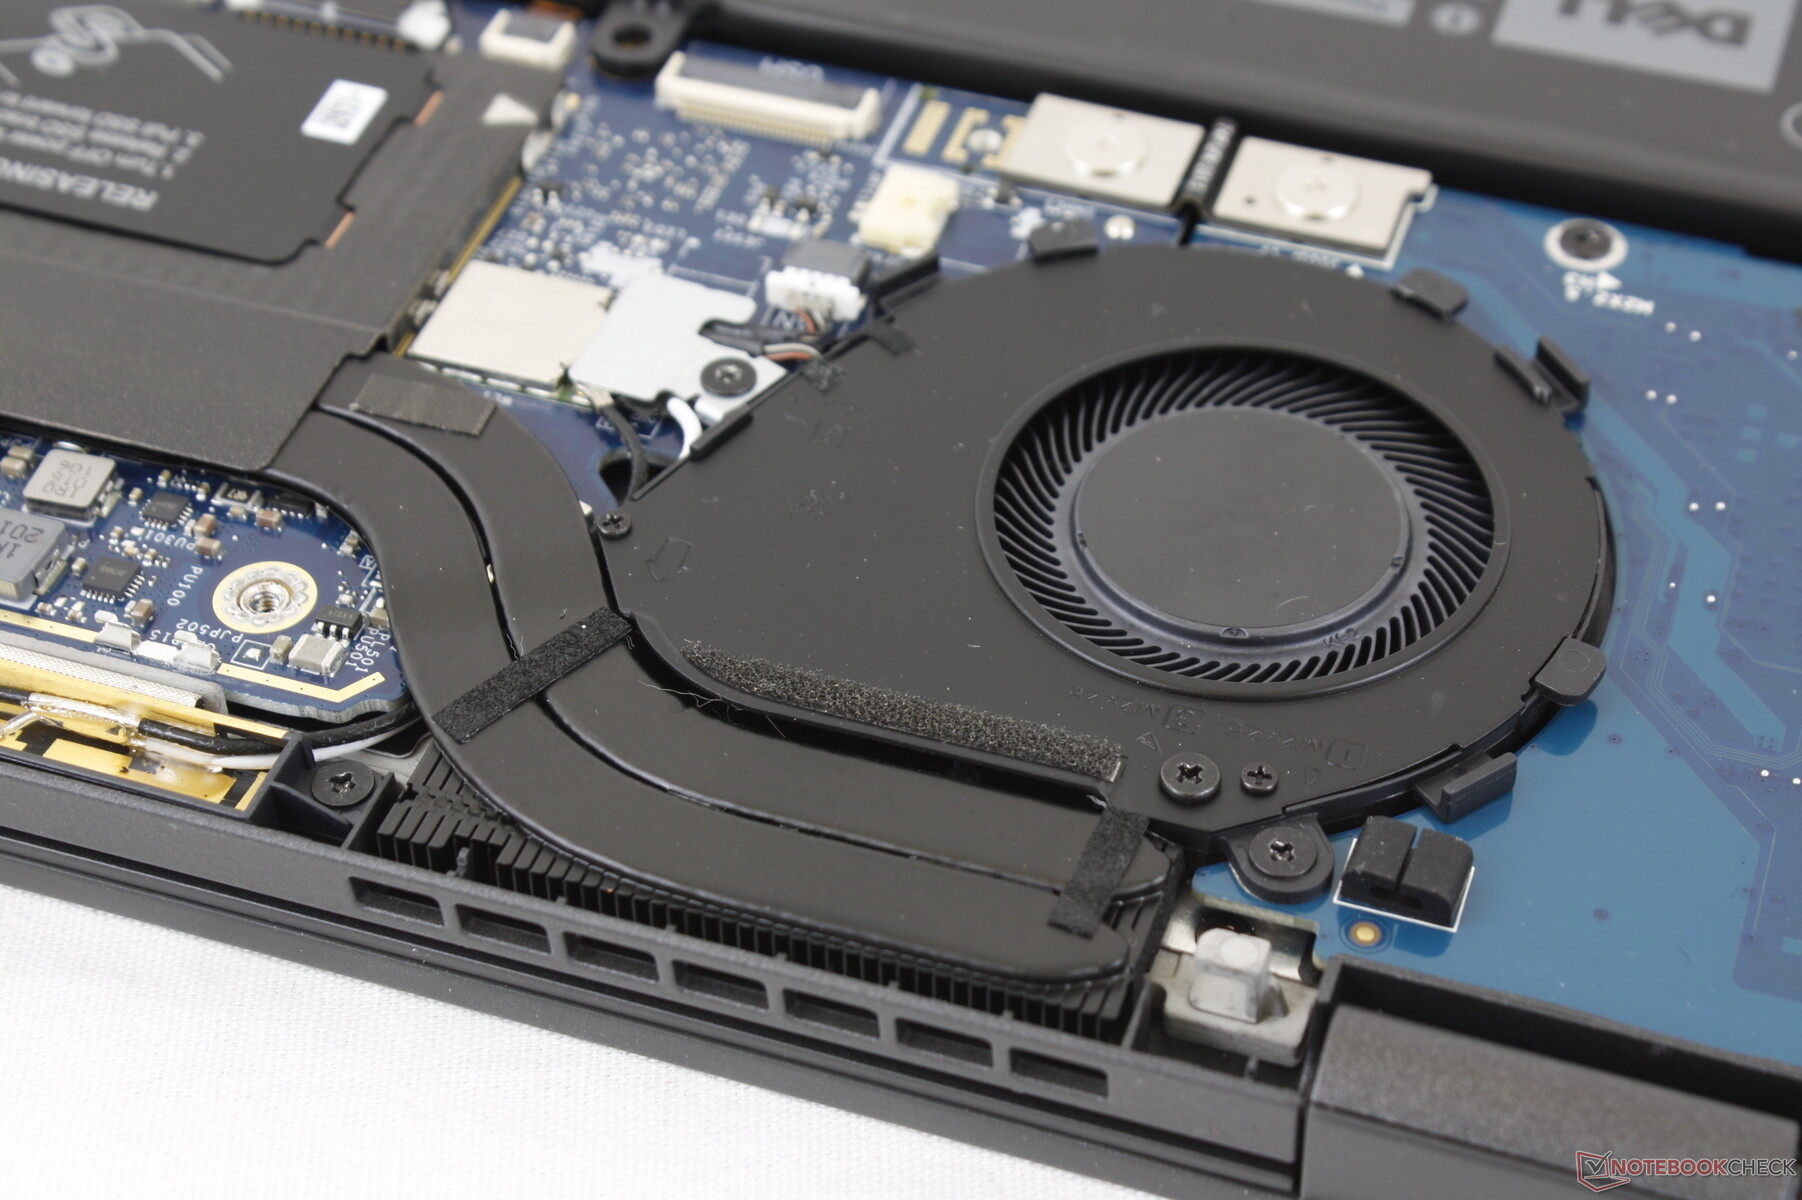
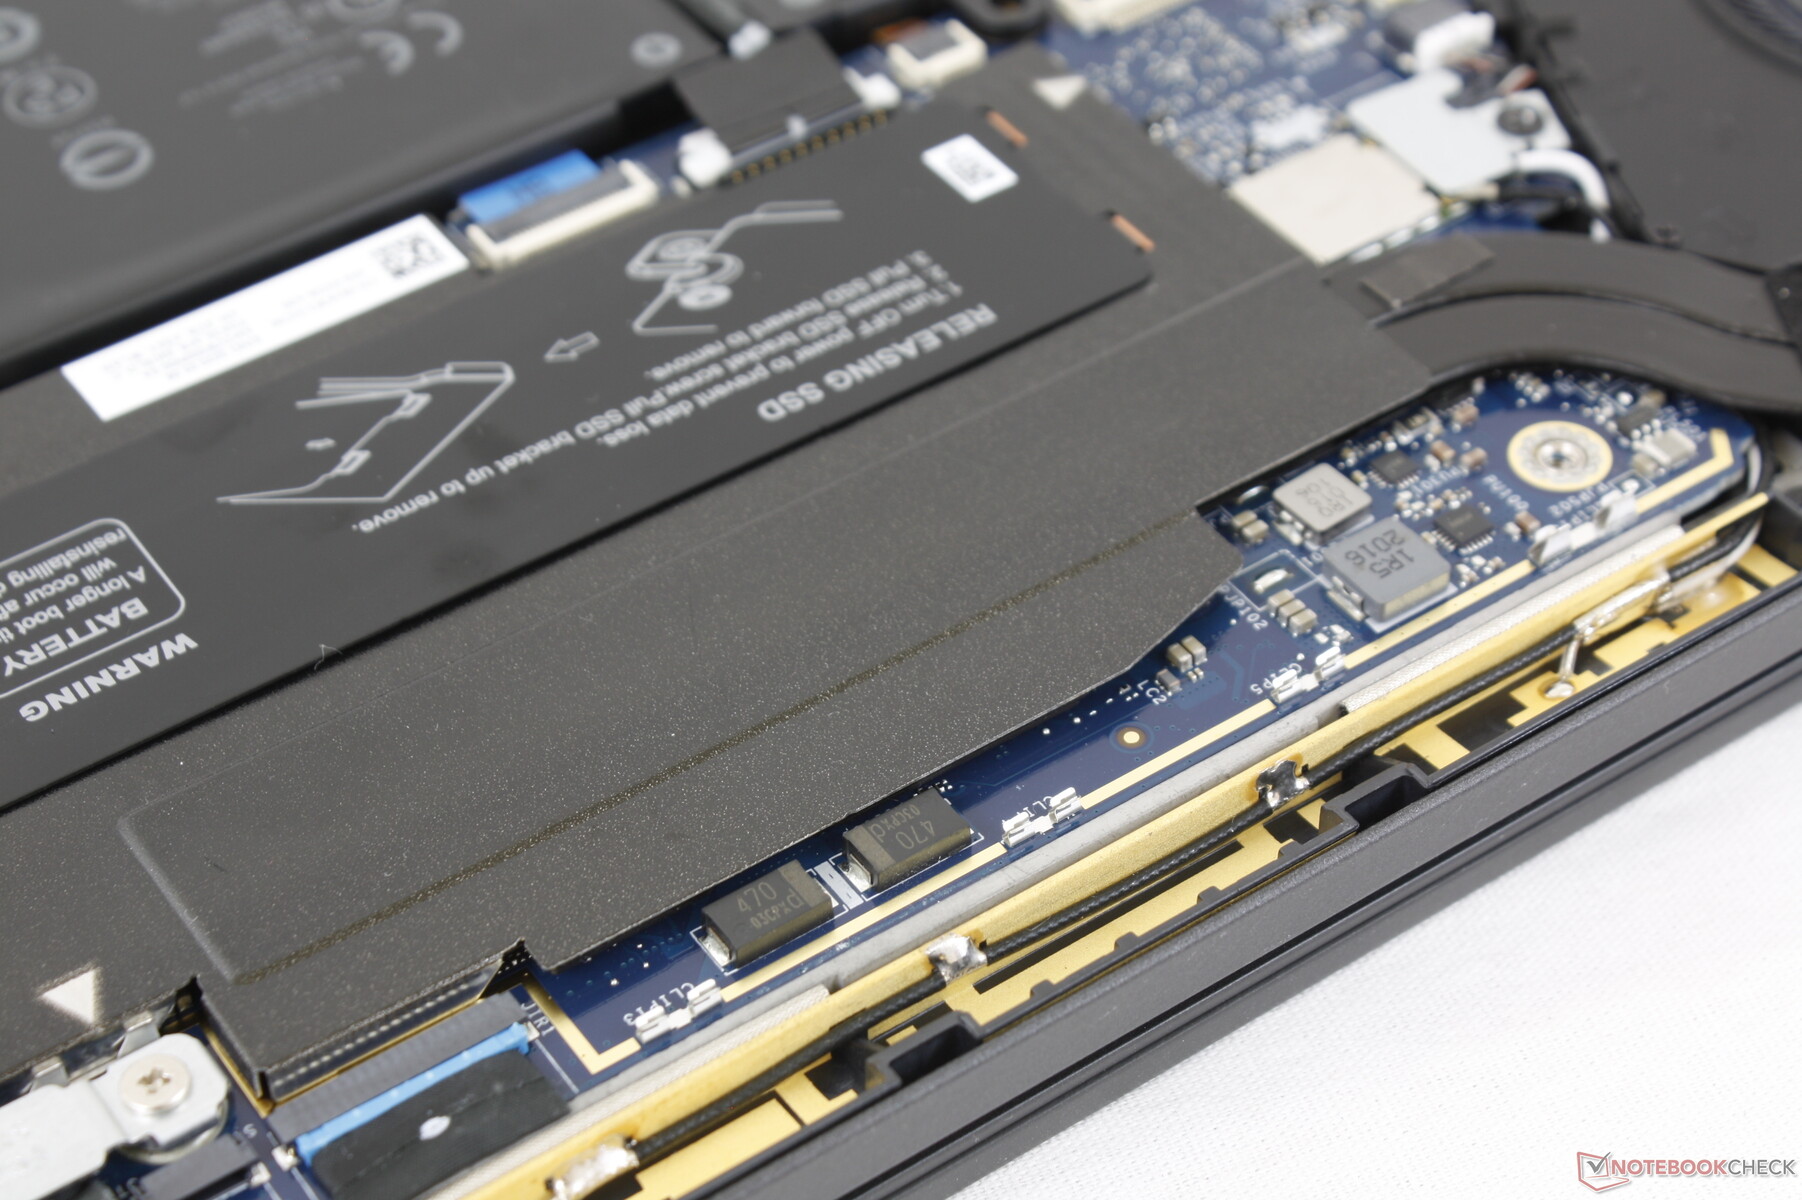
Bakım
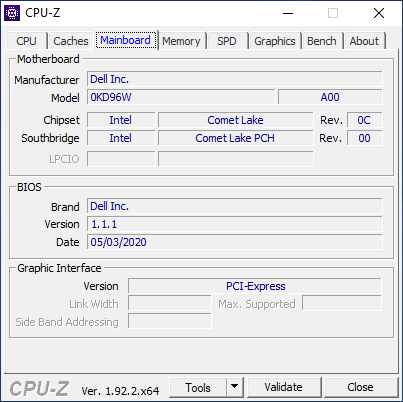
Alt panel, kolay servis verilebilmesi için sekiz Philips vida ile sabitlenmiştir. Ancak, Latitude 7300'den ayrılan RAM ve WLAN lehimlendiği için gerçekte yükseltilecek çok şey yok. Anakartın 14 inç Latitude 7410 ile çok ortak noktası olduğuna dikkat edin.
Aksesuarlar ve Garanti
Kutuda AC adaptörü ve normal evrak işleri dışında hiçbir ekstra yoktur. Bununla birlikte, çift Thunderbolt 3 bağlantı noktası, çok çeşitli yerleştirme istasyonlarına, monitörlere ve Dell UltraSharp serisi gibi evden diğer ekstra işlere izin verir. Üç yıllık sınırlı garanti, beş yıla kadar uzatma seçenekleriyle standart olarak gelir.
Giriş cihazları
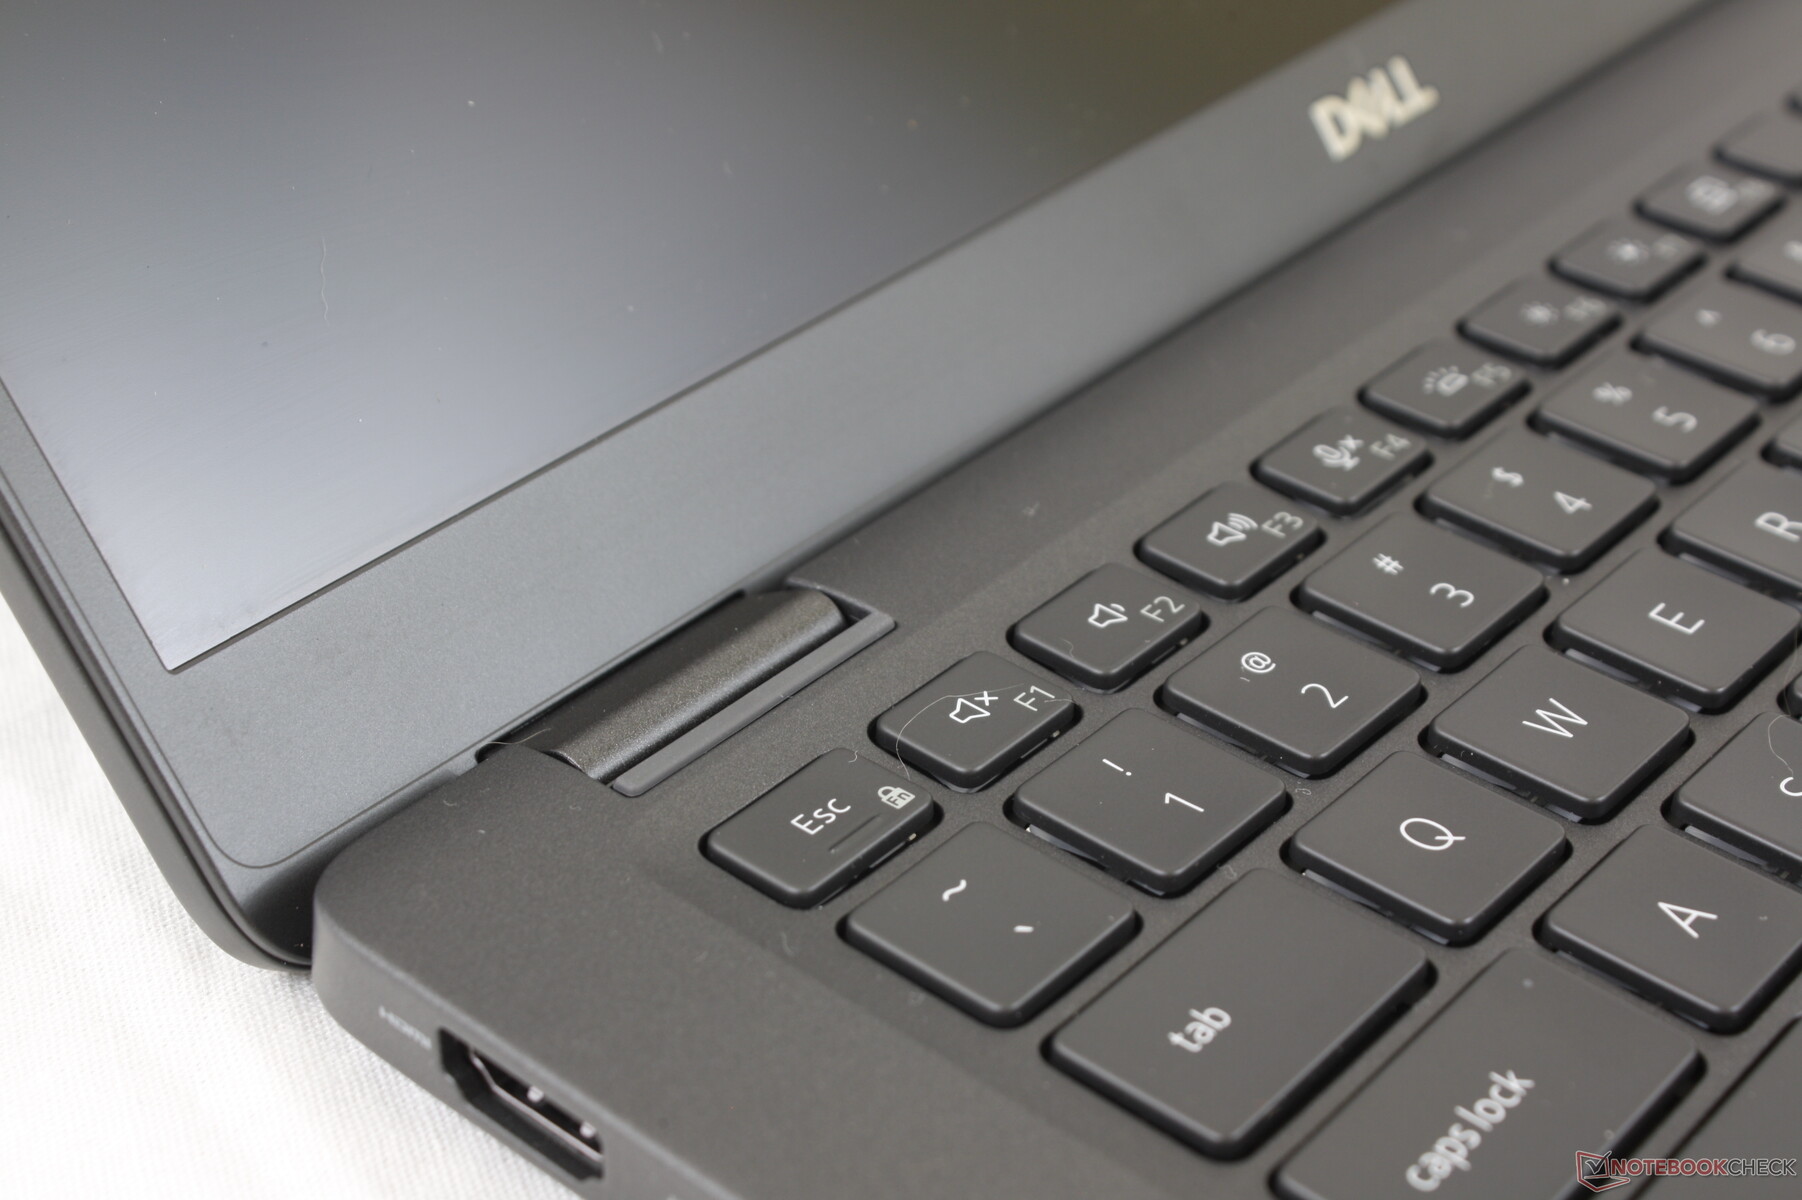
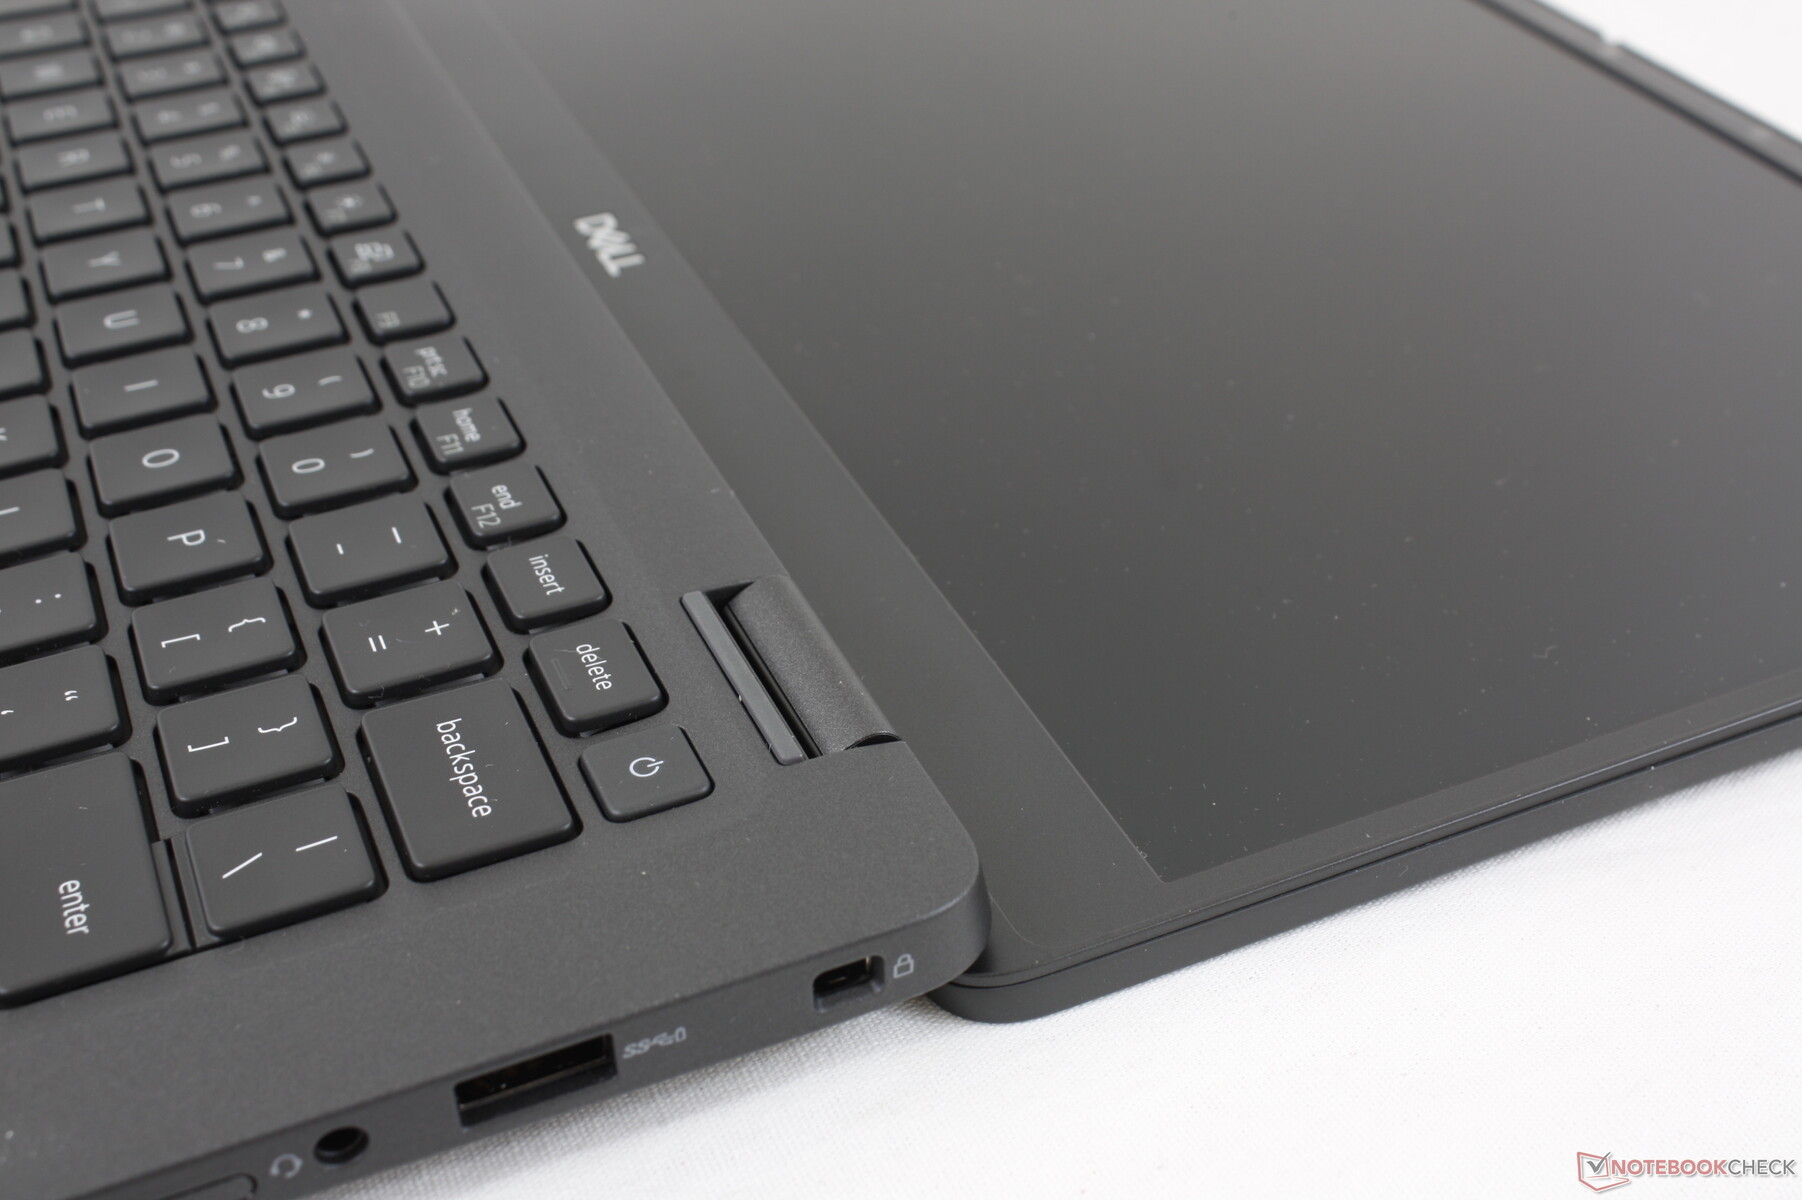
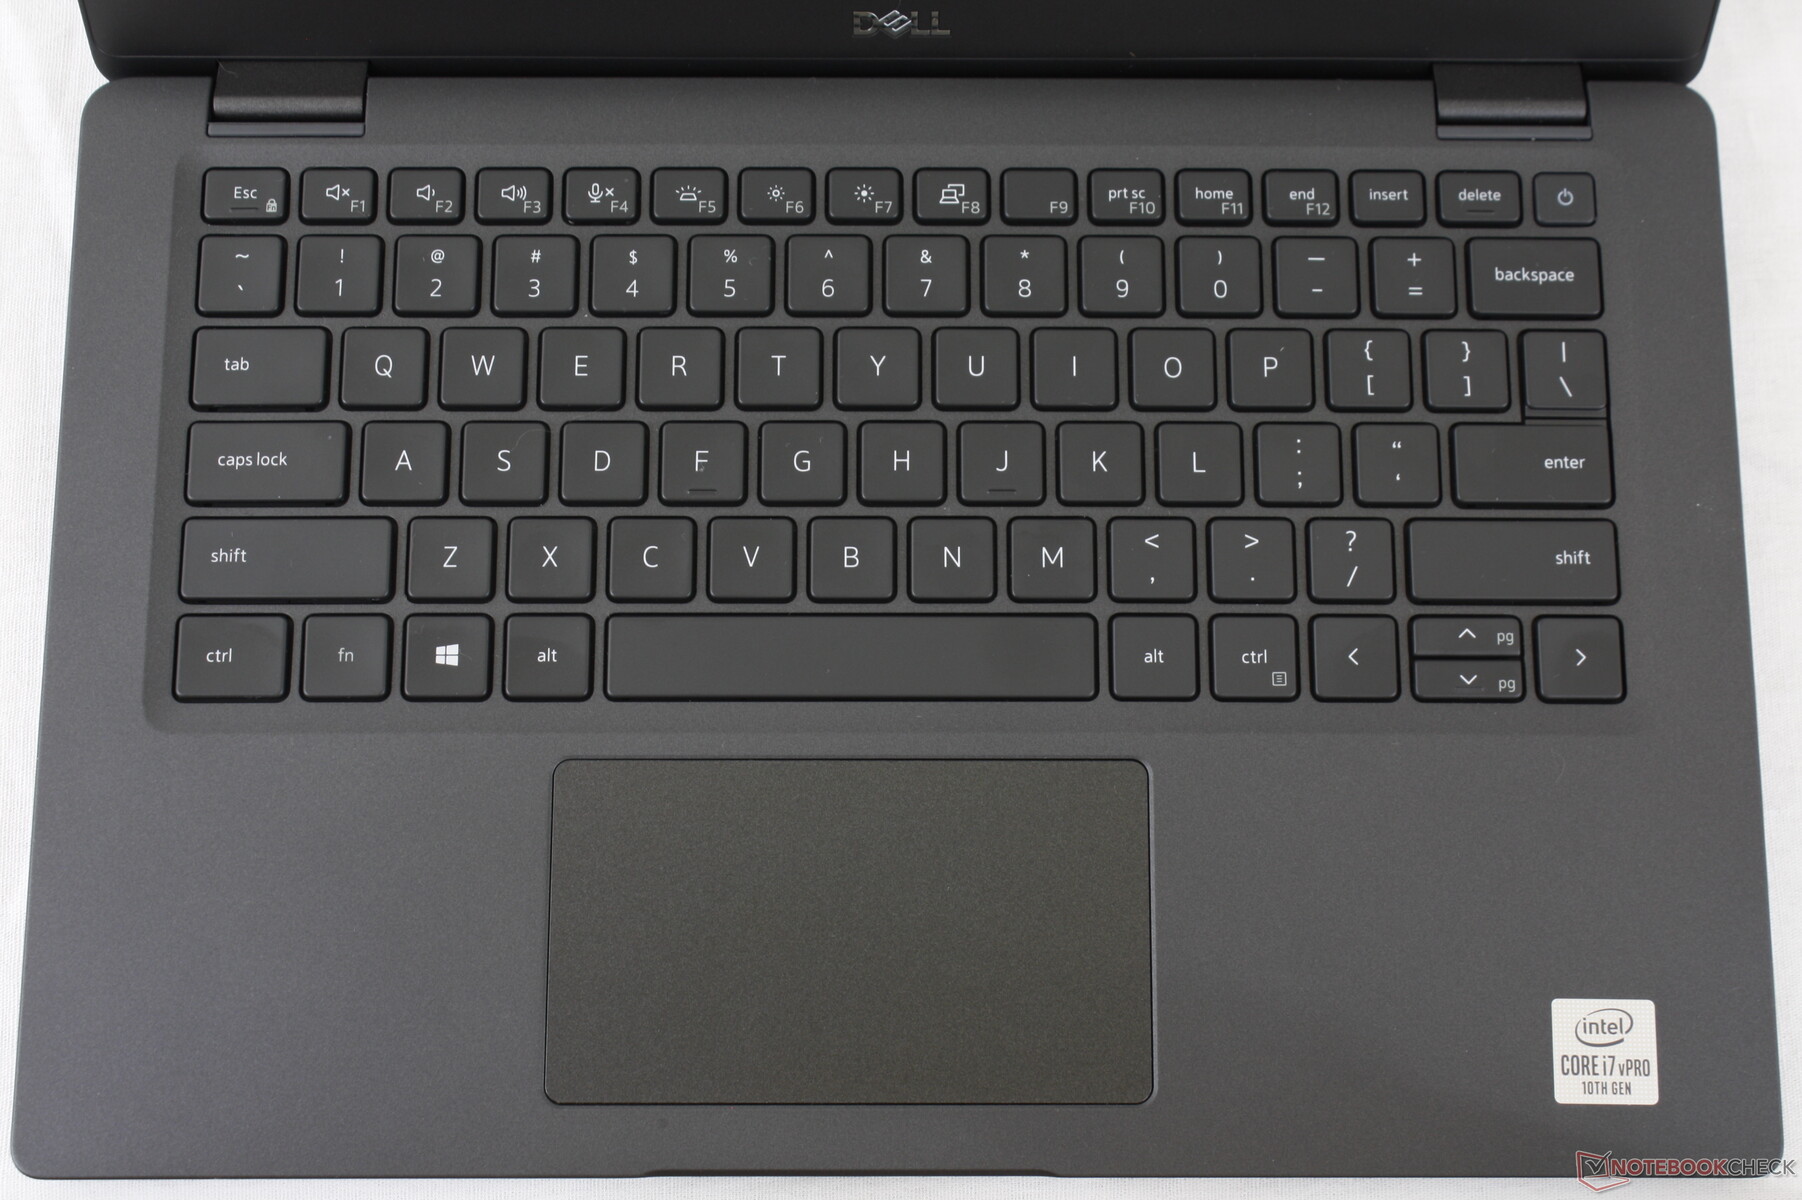
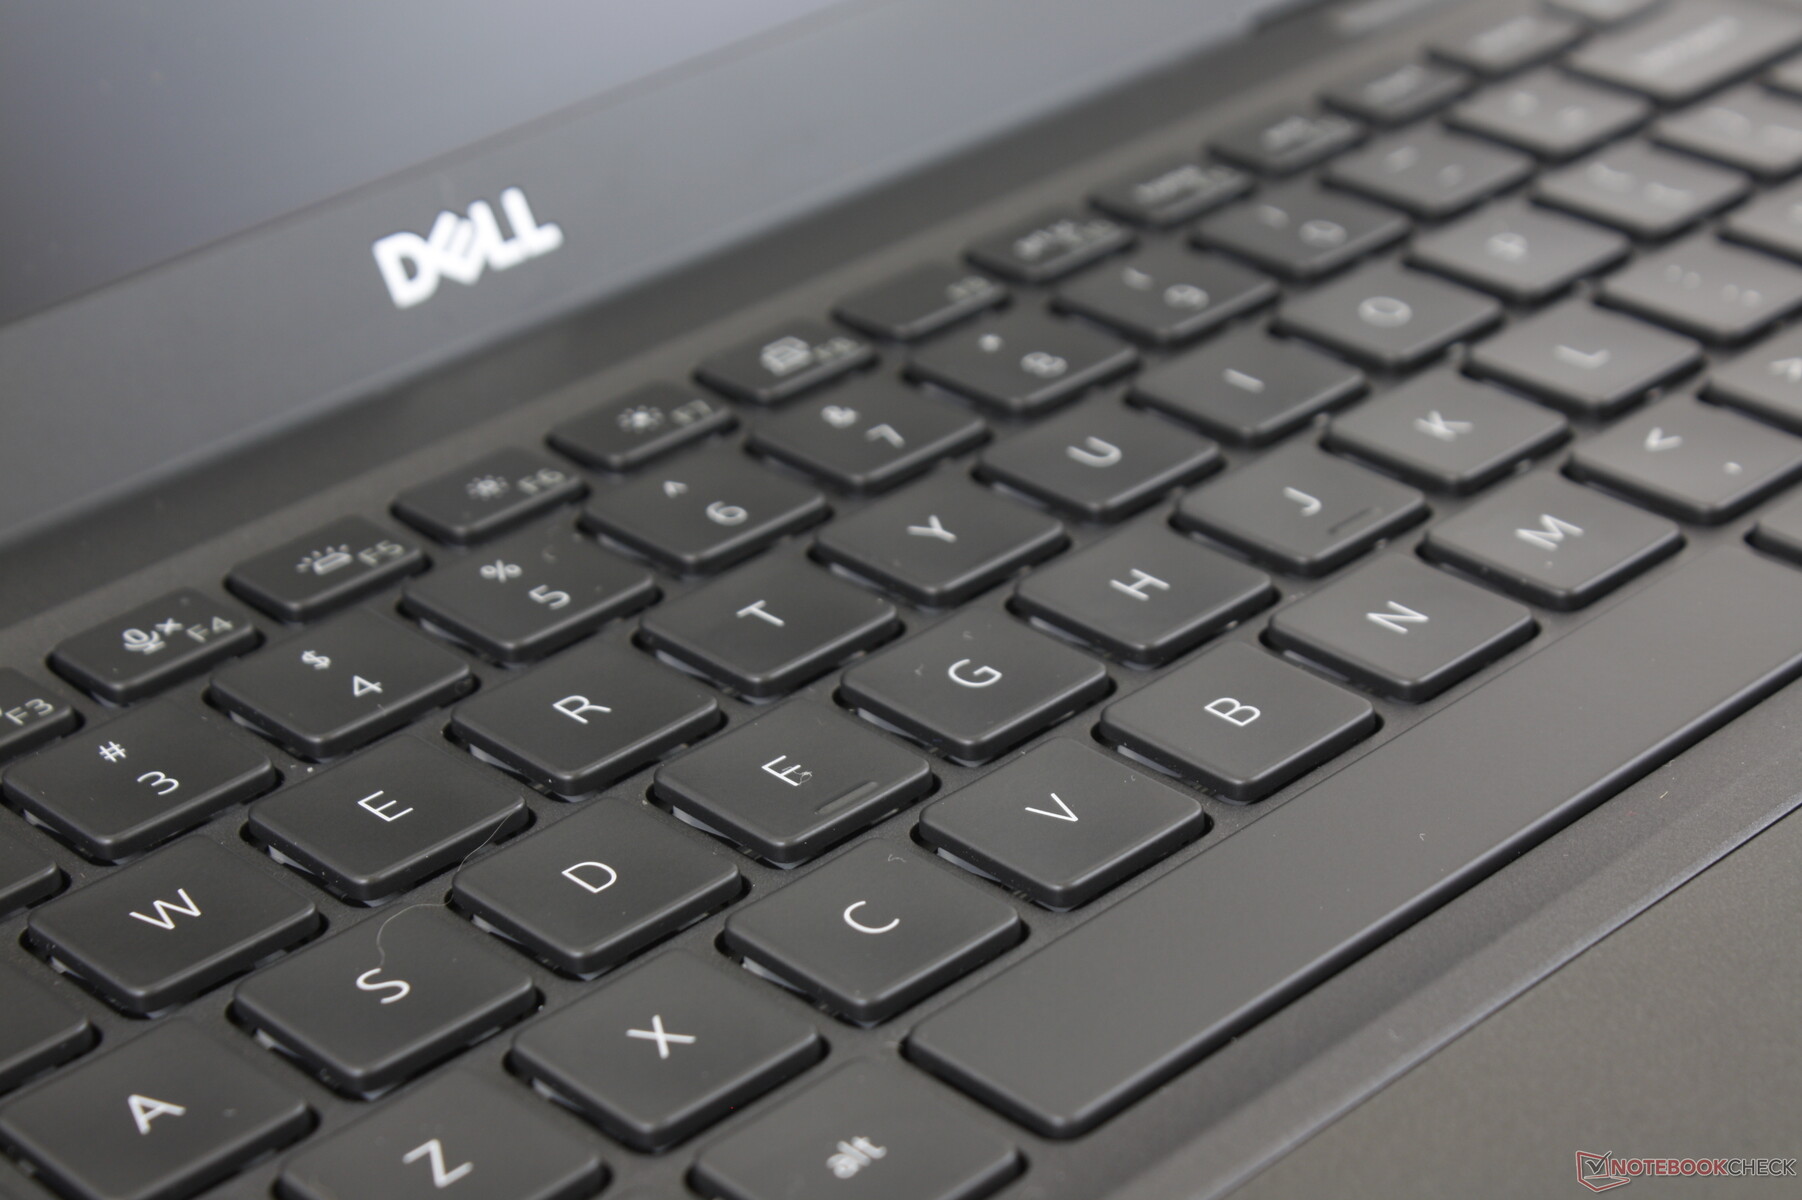
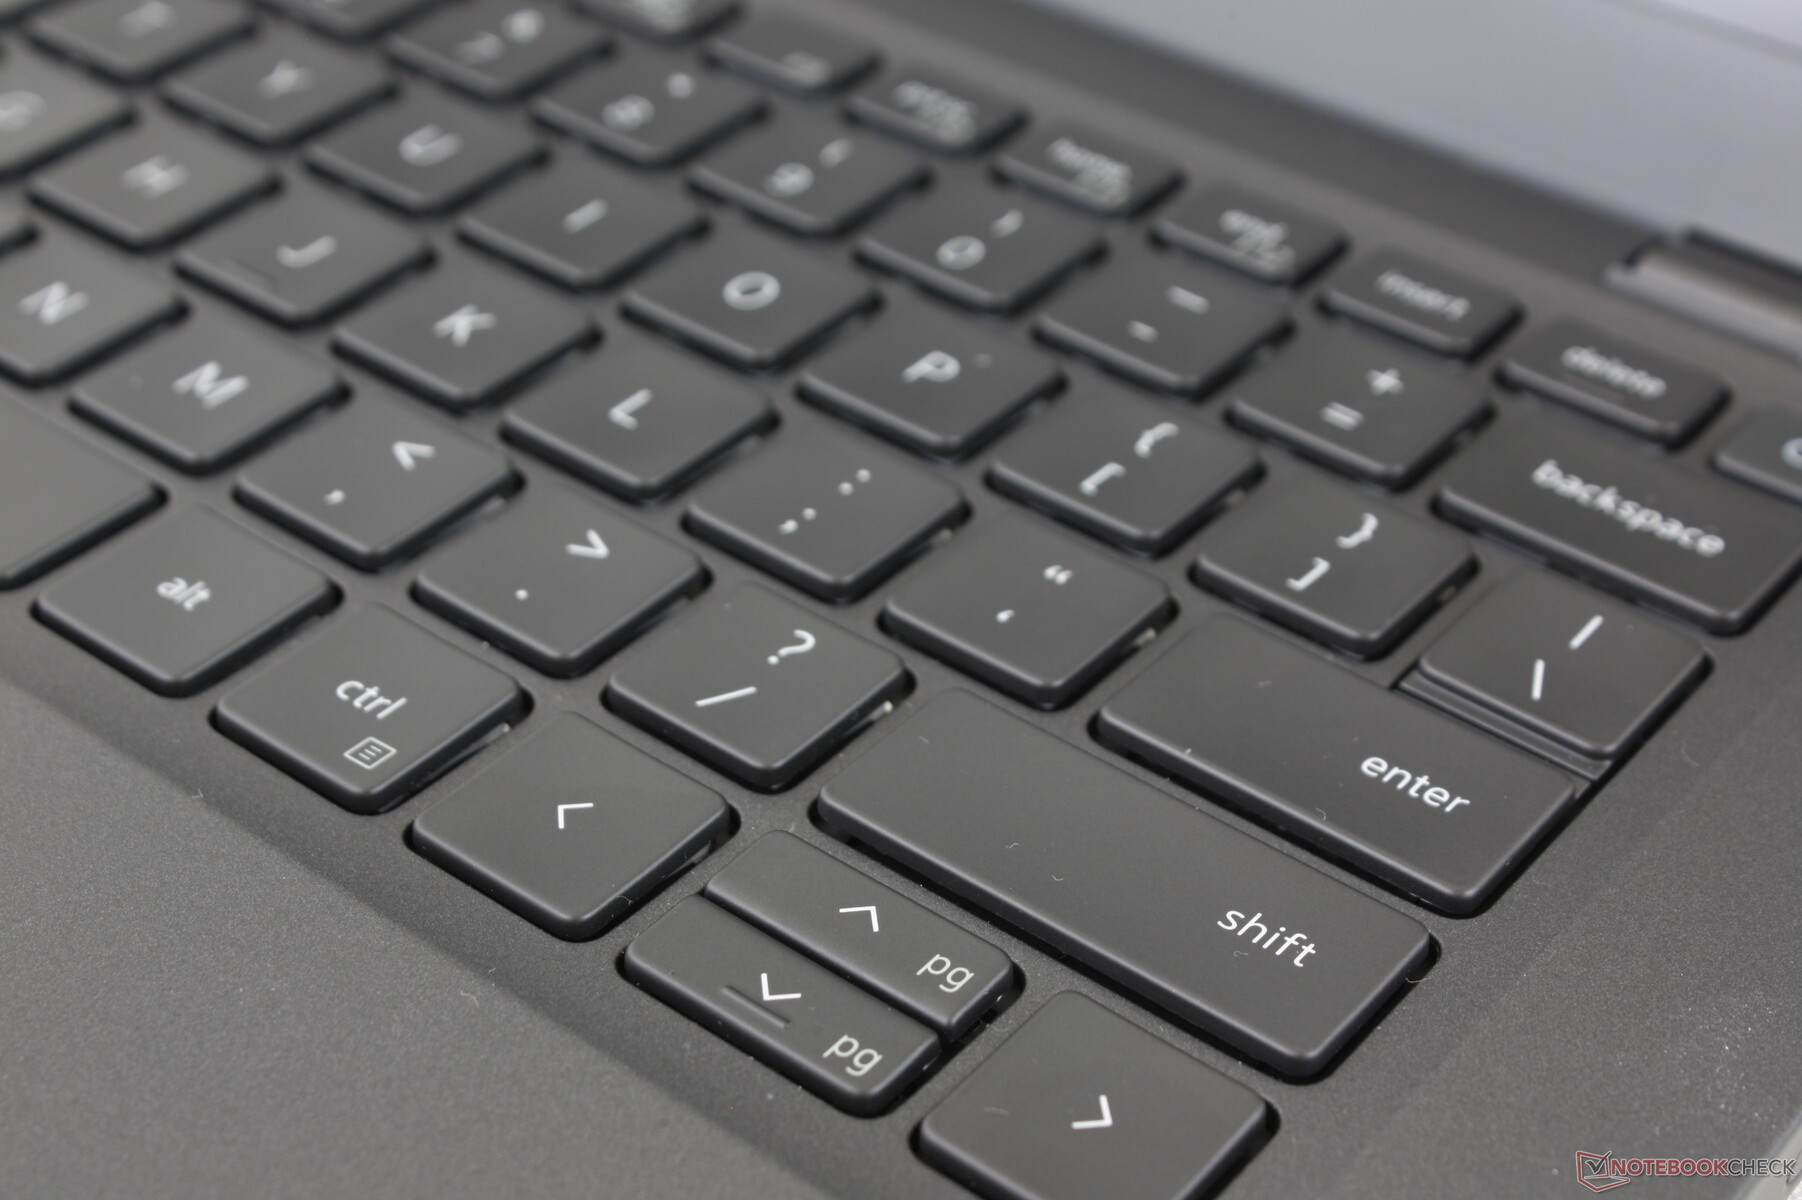
Klavye klavye düzeni ve geri bildirimi, Latitude 7310 aynı tasarımı kullandığından Latitude 7410 ile aynıdır. Yazma, XPS 13'ten daha derin tuş hareketi ile ancak HP Spectre 13'ten biraz daha spongier geribildirim ile Latitude 7300 ile aynı hissi veriyor. Tuşlar sığ olmadığı için yazmak için XPS 13'ten daha rahat buluyoruz. Ana QWERTY tuşları, Space ve Enter tuşları dikkat çekici derecede daha yüksekken basıldığında nispeten sessizdir. İki seviyeli klavye arka ışığı standart olarak gelir ve tüm tuş sembolleri, sağ üstteki Güç düğmesi için saklanır.
Dokunmatik
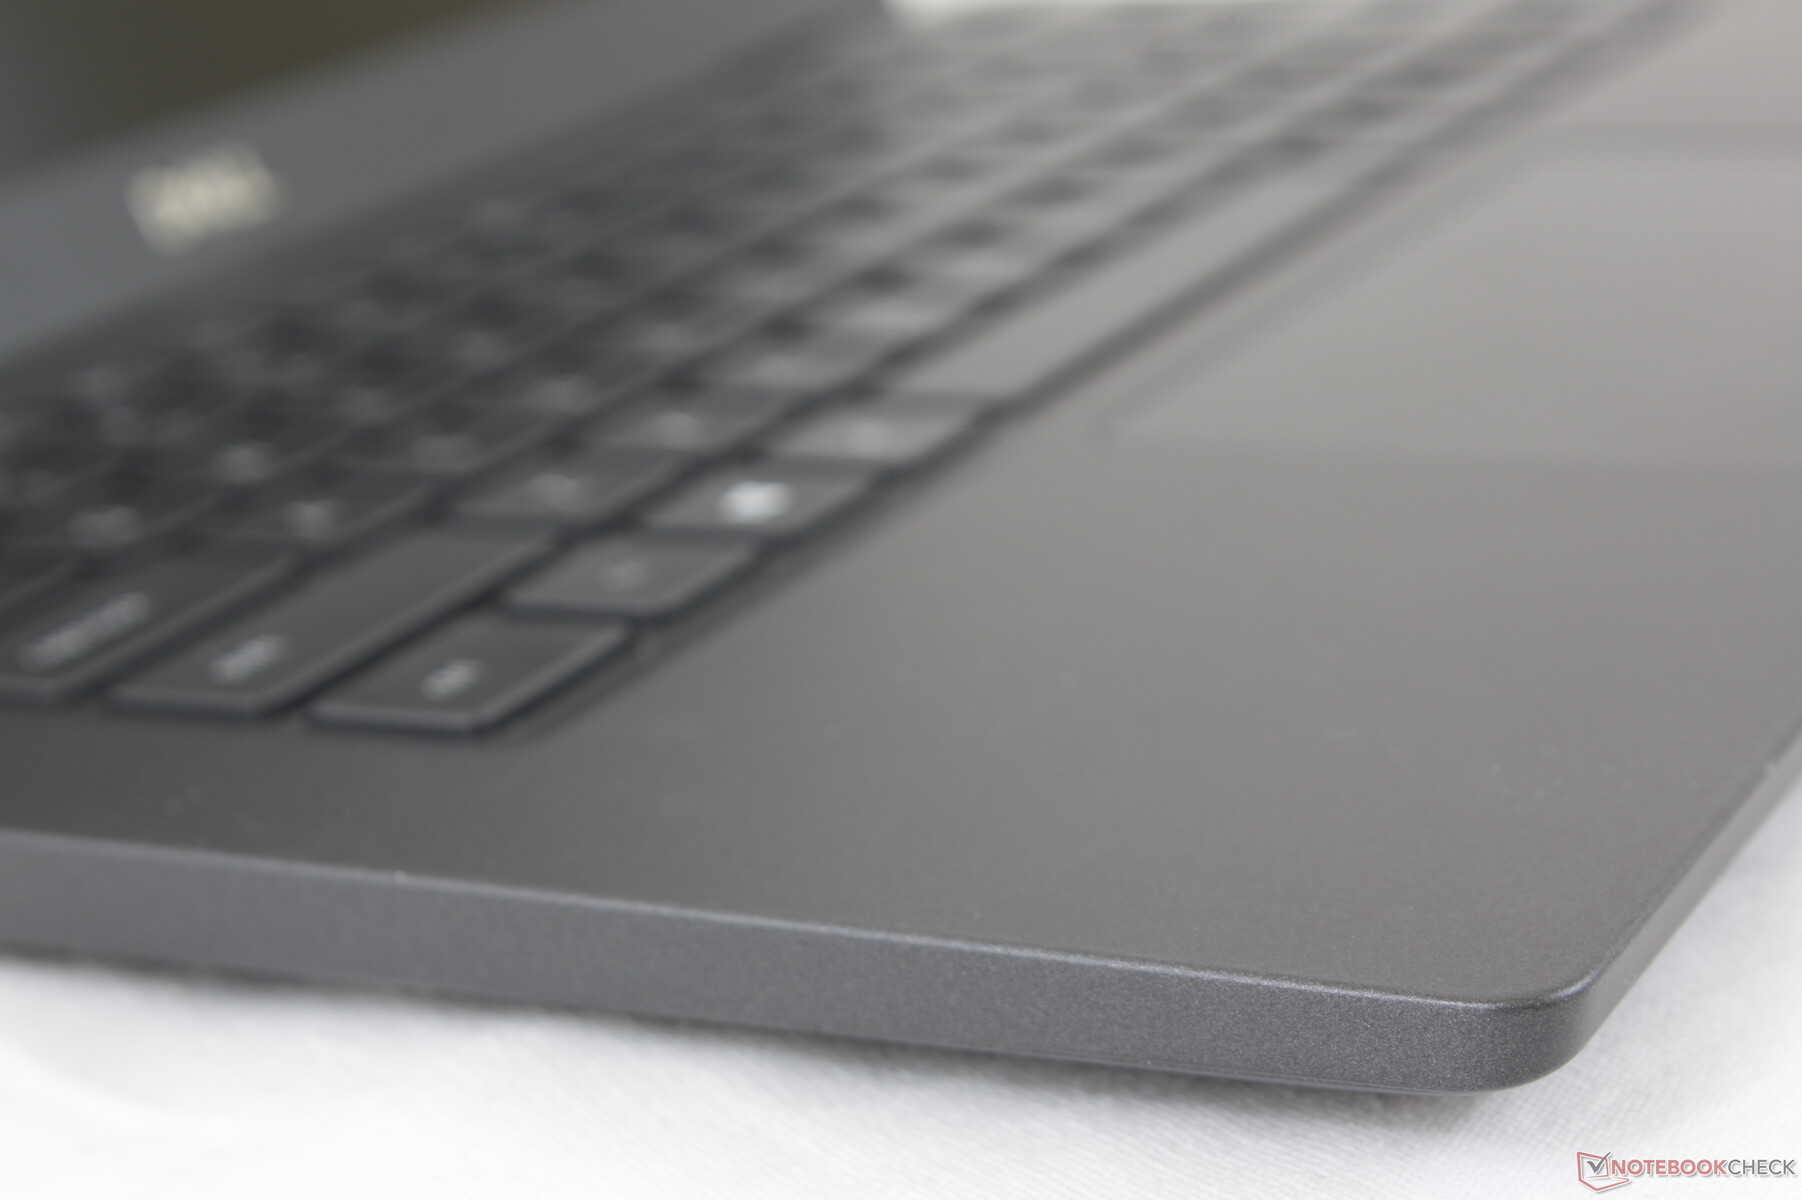
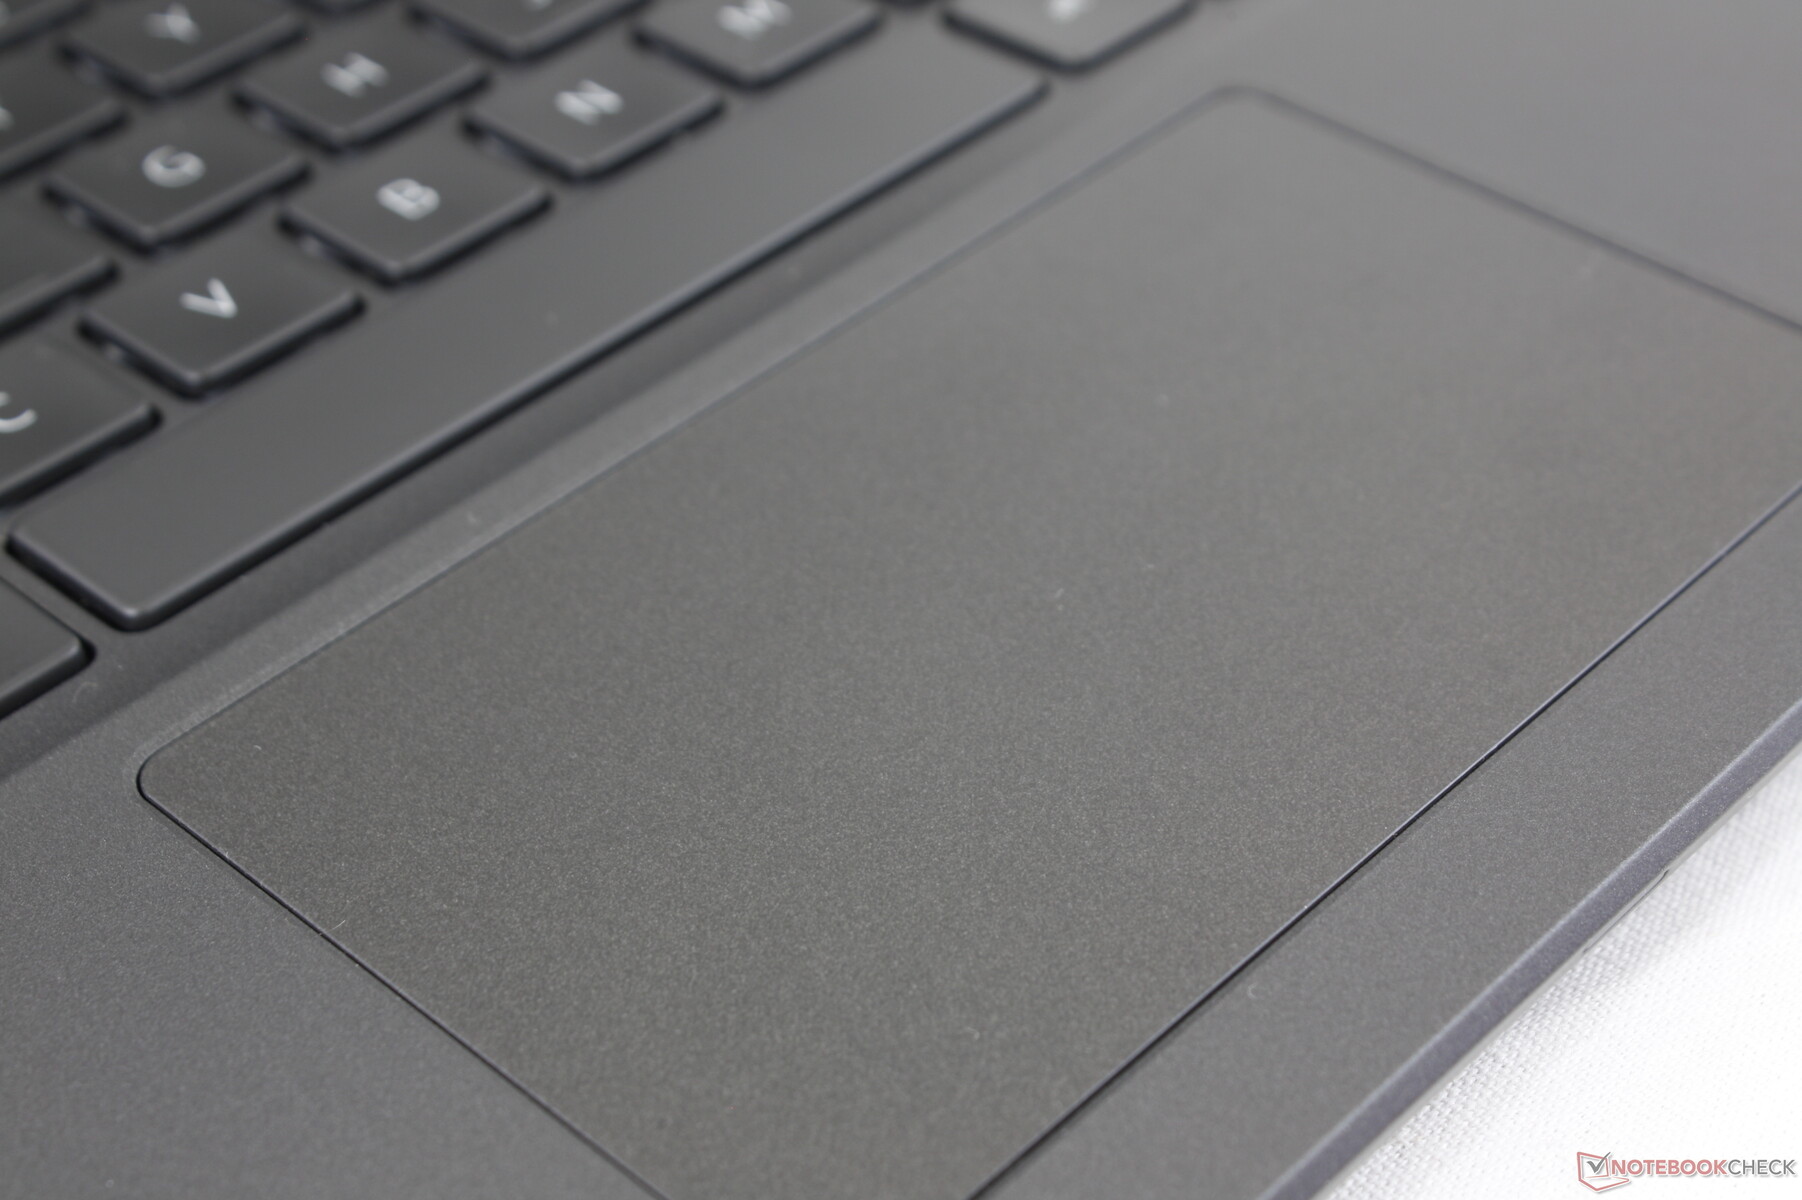
Latitude 7400'den 7410'a atlamaya benzer şekilde, Latitude 7310, 7300'deki özel fare düğmelerini daha büyük bir tıklama yüzeyi (10.5 x 6.1 cm ve 10 x 5 cm) lehine atlar. Sonuç, kaydırmayı daha kolay hale getirir ve hassasiyet ve daha zor sürükleme ve bırakma maliyetiyle sınırlı değildir. Bu, yeni clickpad tuşlarının basıldığında yumuşak ve tatmin edici olmayan geri bildirimlerle süngerimsi olmasıyla daha da kötüleşiyor. Bu nedenle daha eski Latitude 7300 dokunmatik yüzeyi tercih ediyoruz. Parlak tarafta, tıklama yüzeyi pürüzsüz ve neredeyse dokusız ve çok az yapışma. Tıklama da diğer dizüstü bilgisayarlardan daha sessizdir, ancak bunun nedeni büyük olasılıkla yukarıda belirtilen yumuşak geri bildirimlerdir.
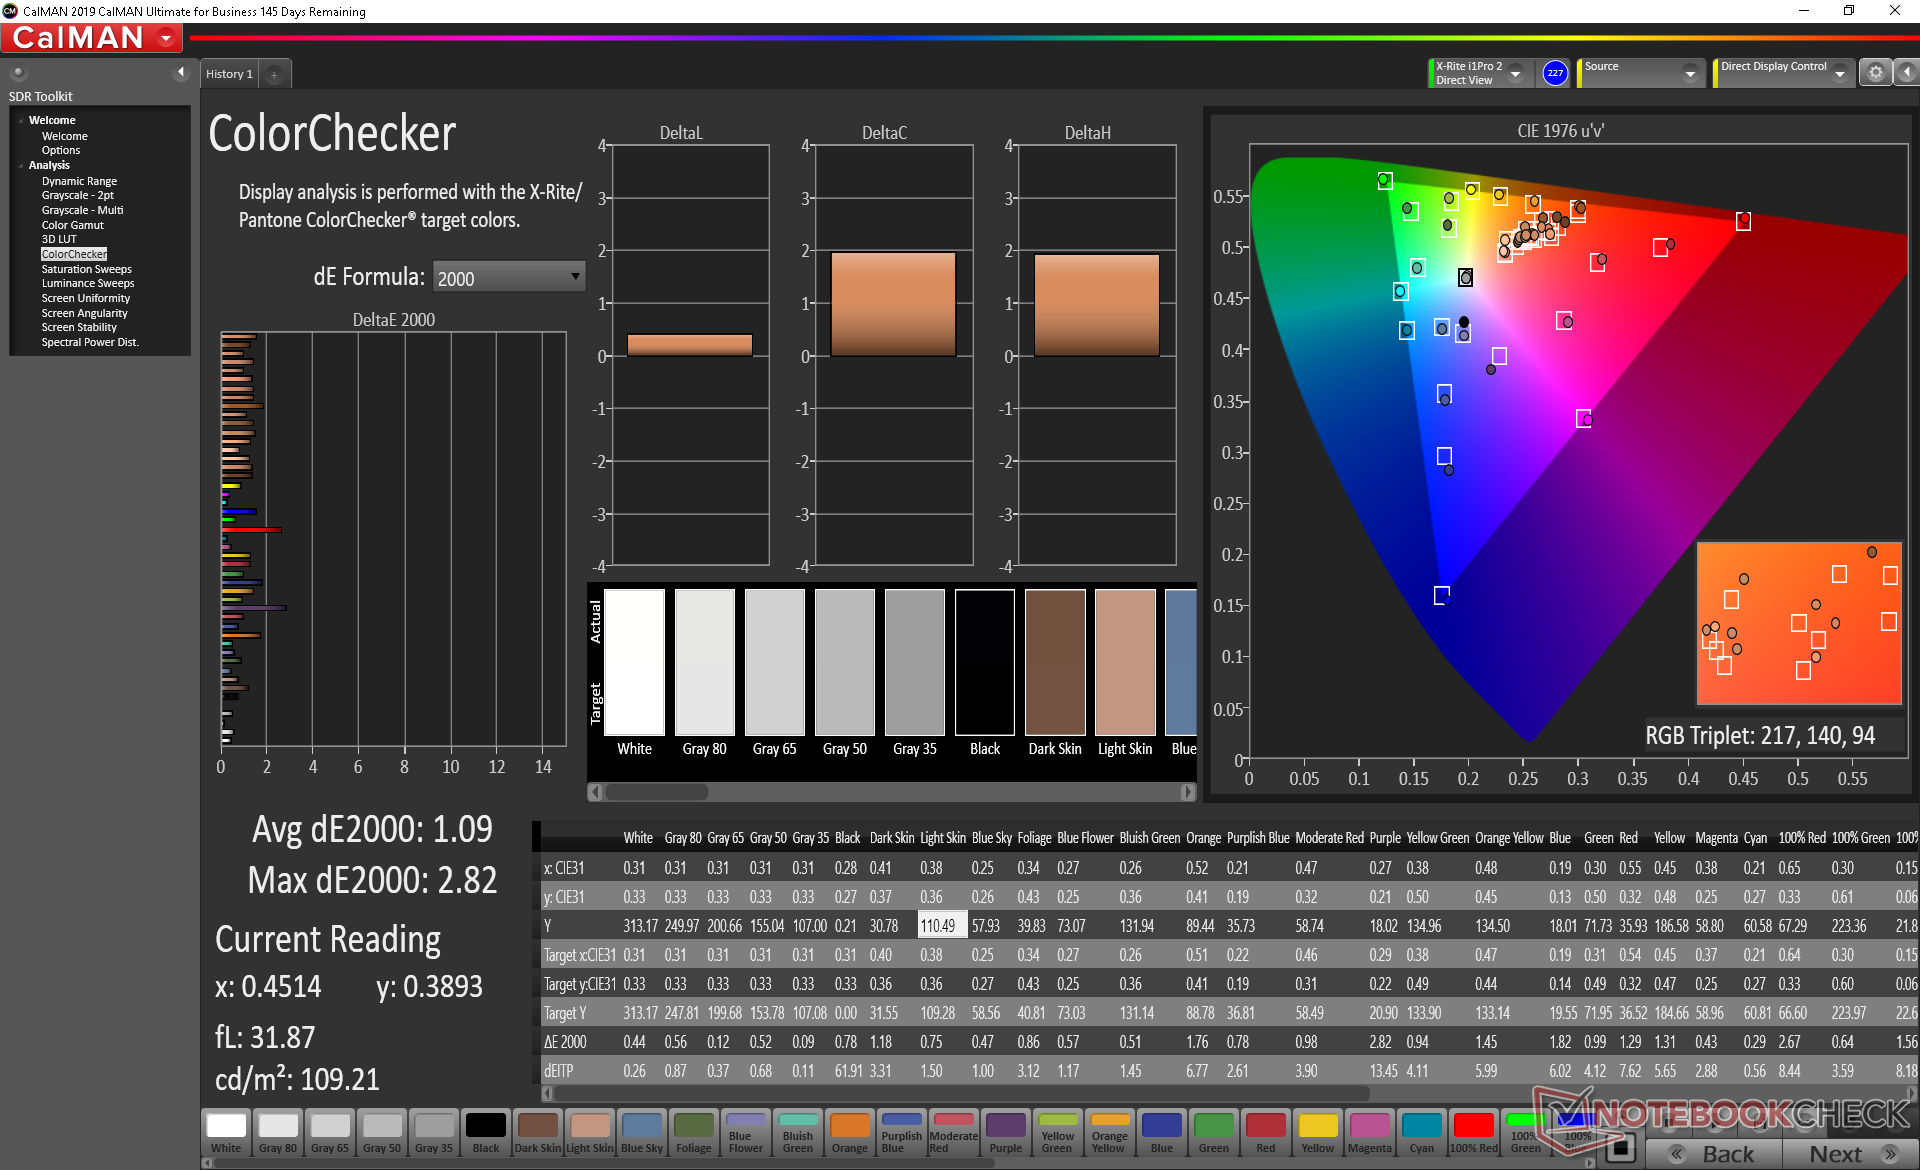
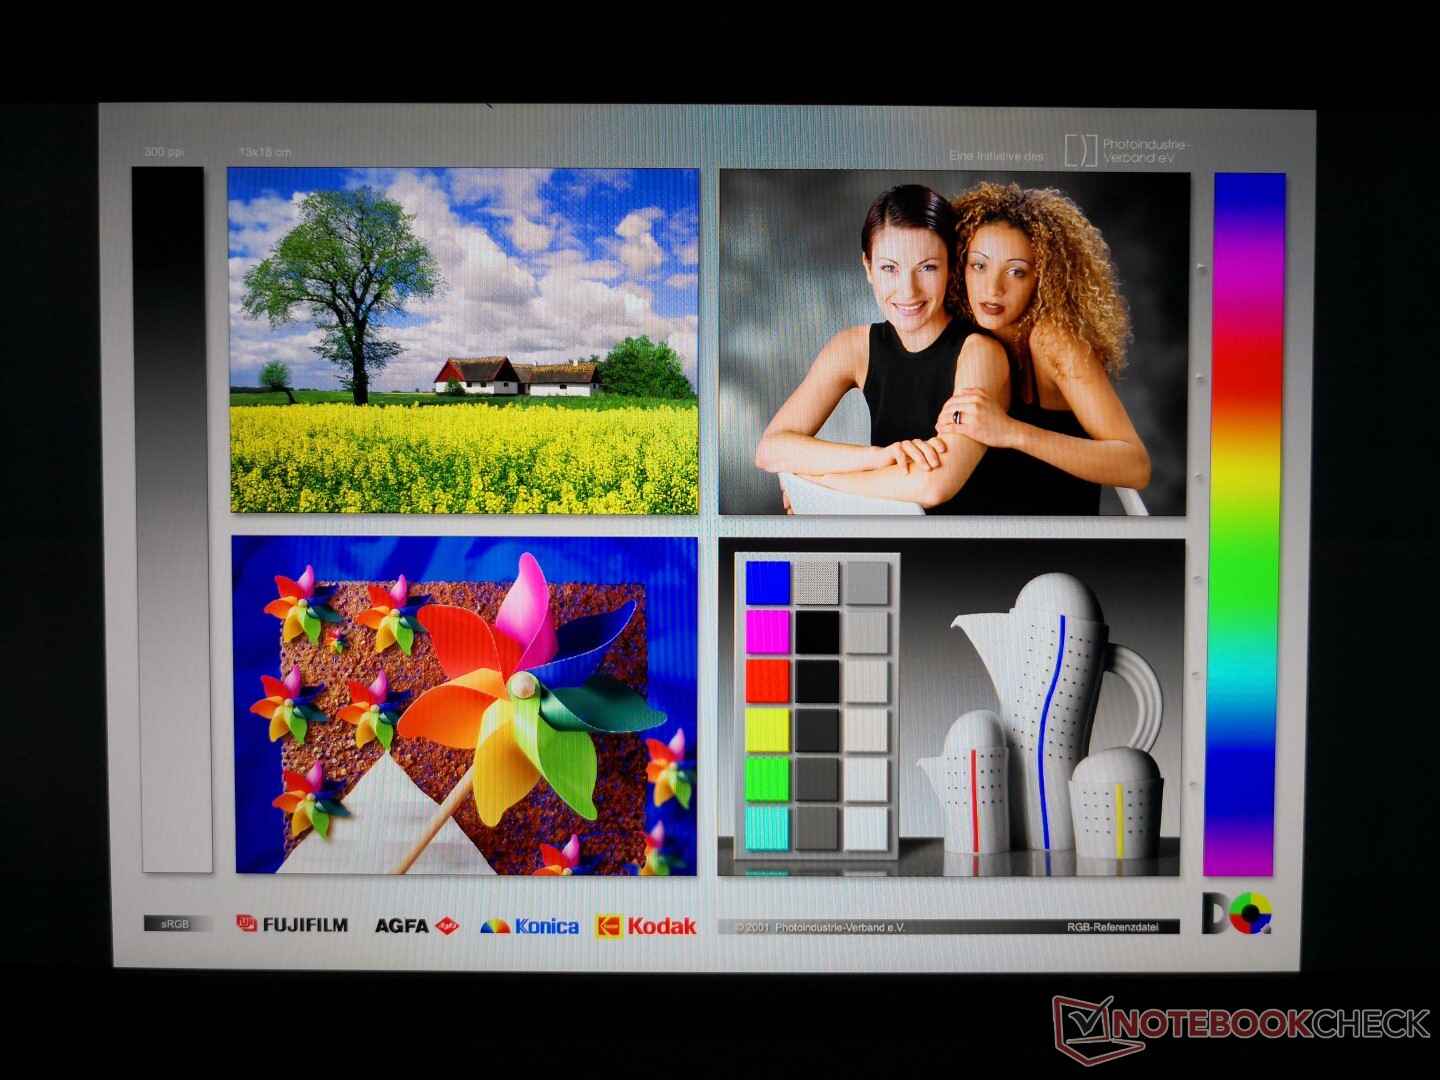
Görüntüle
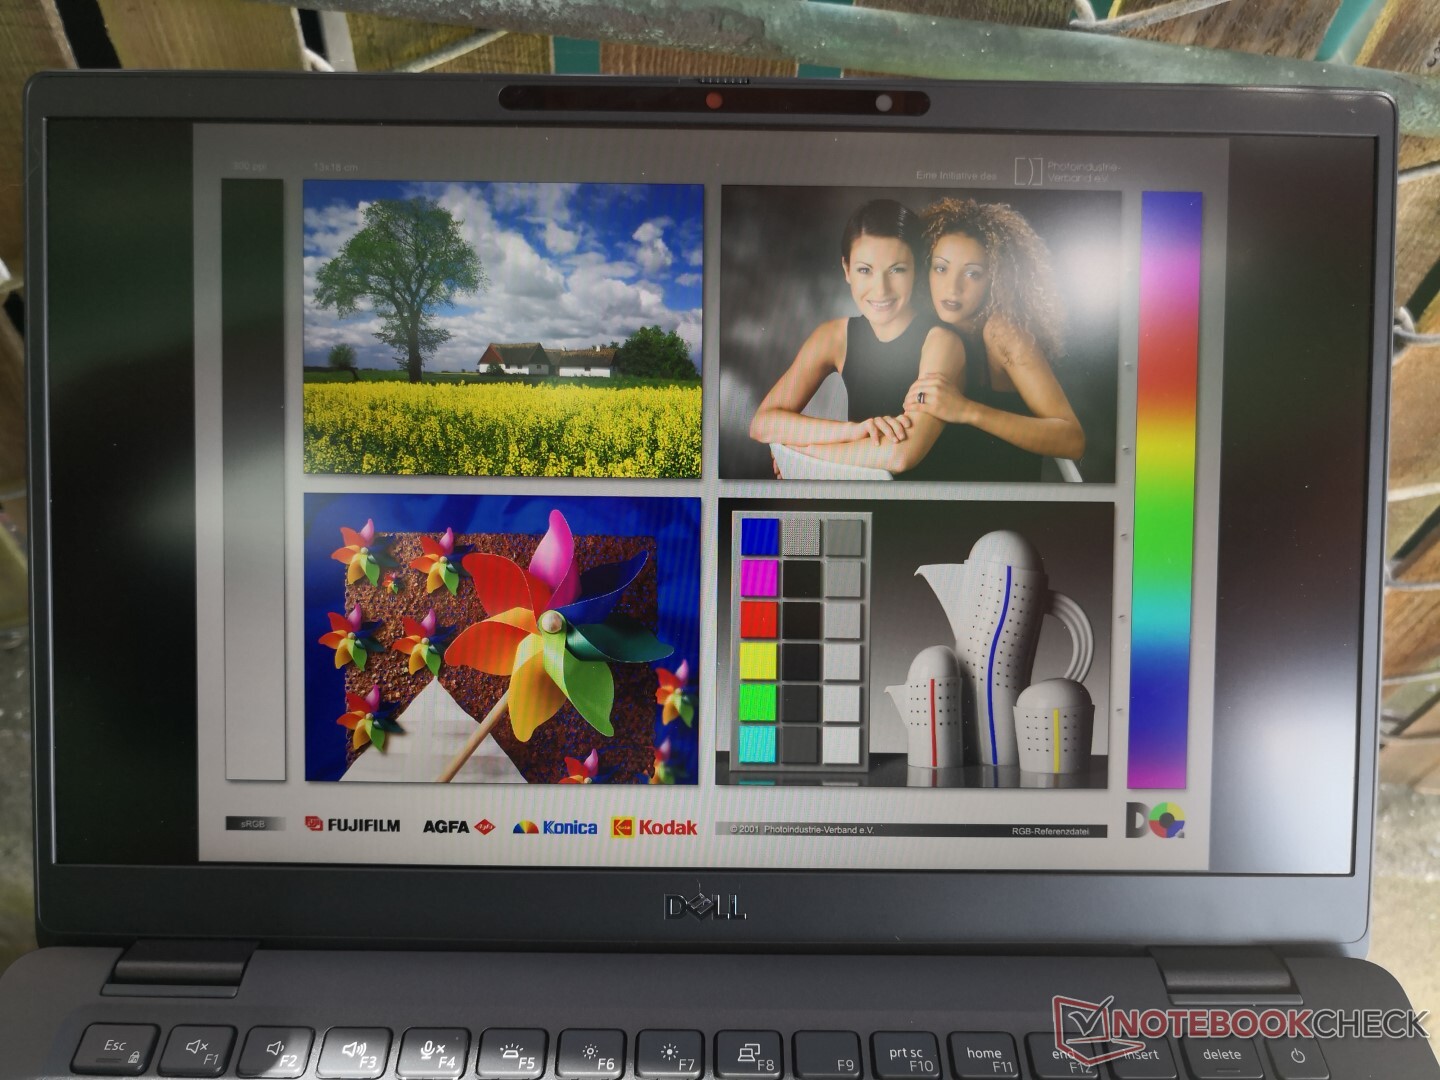
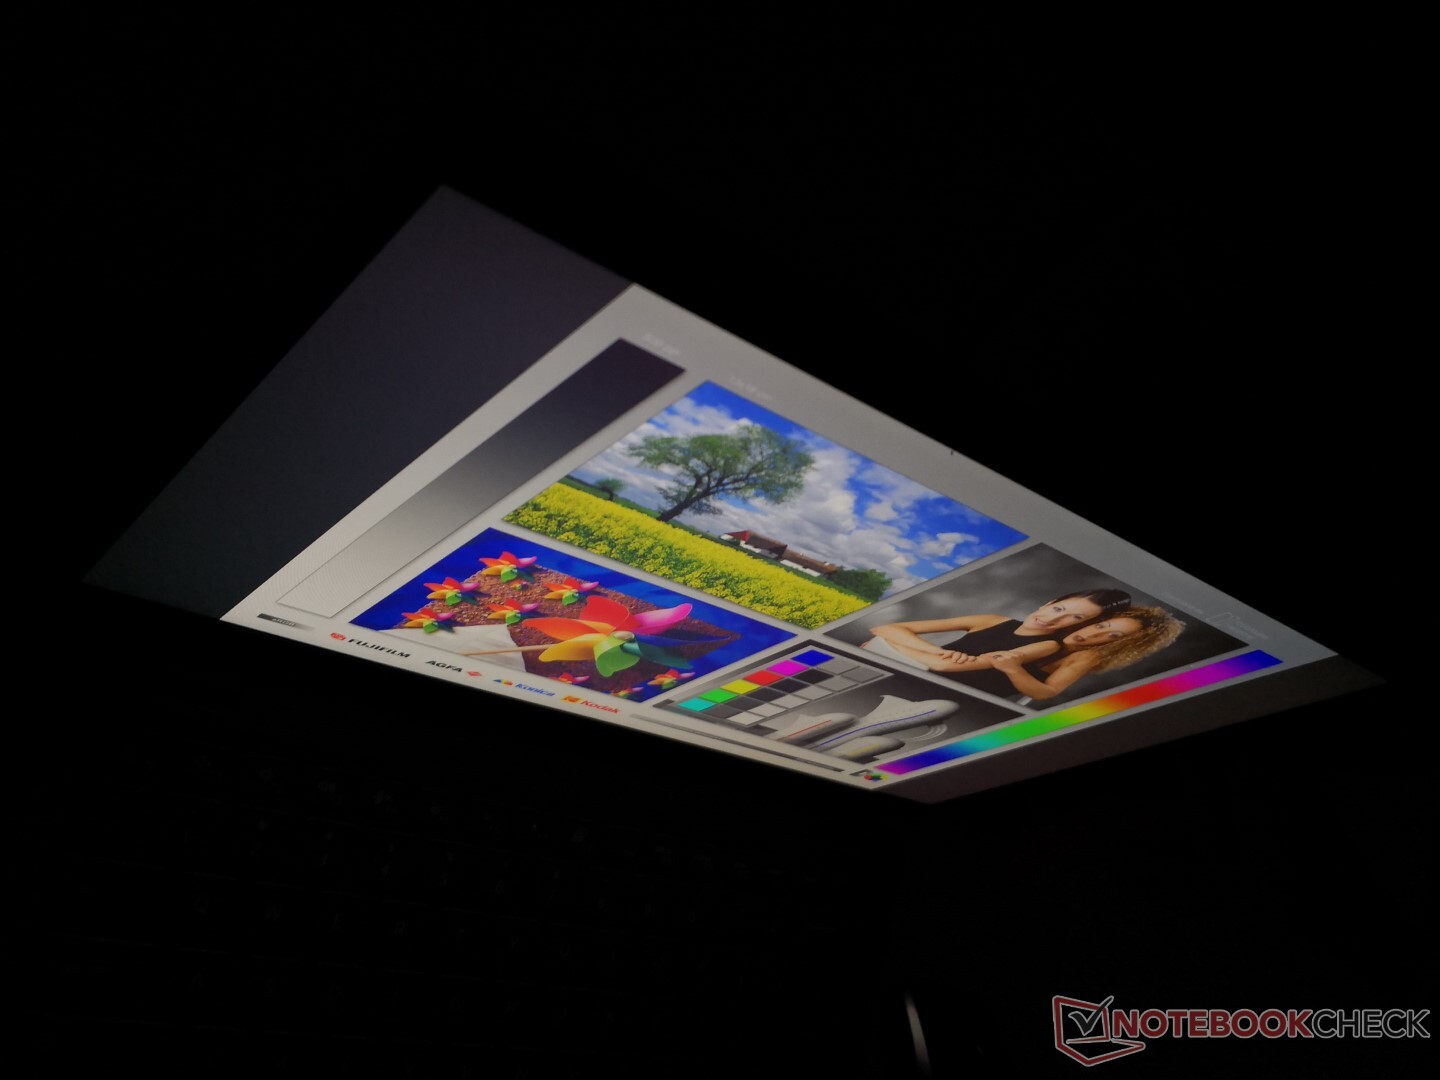
Latitude 7310'umuz 2018 Latitude 7390'da bulunanla aynı AU Optronics B133HAN 1080p IPS paneliyle birlikte gelir. Bu nedenle, bu sistemlerin her ikisi de iki yıllık boşluklarına rağmen benzer ekran özelliklerini paylaşır. Kontrast ve renkler, kategori için ortalama parlaklık ve yanıt süreleriyle mükemmel kalır. Latitude 7410'daki düşük mavi ışık paneli seçeneği, Latitude 7310 serisinde mevcut değildir.

| |||||||||||||||||||||||||
Aydınlatma: 89 %
Batarya modunda parlaklık: 332.7 cd/m²
Kontrast: 1331:1 (Siyah: 0.25 cd/m²)
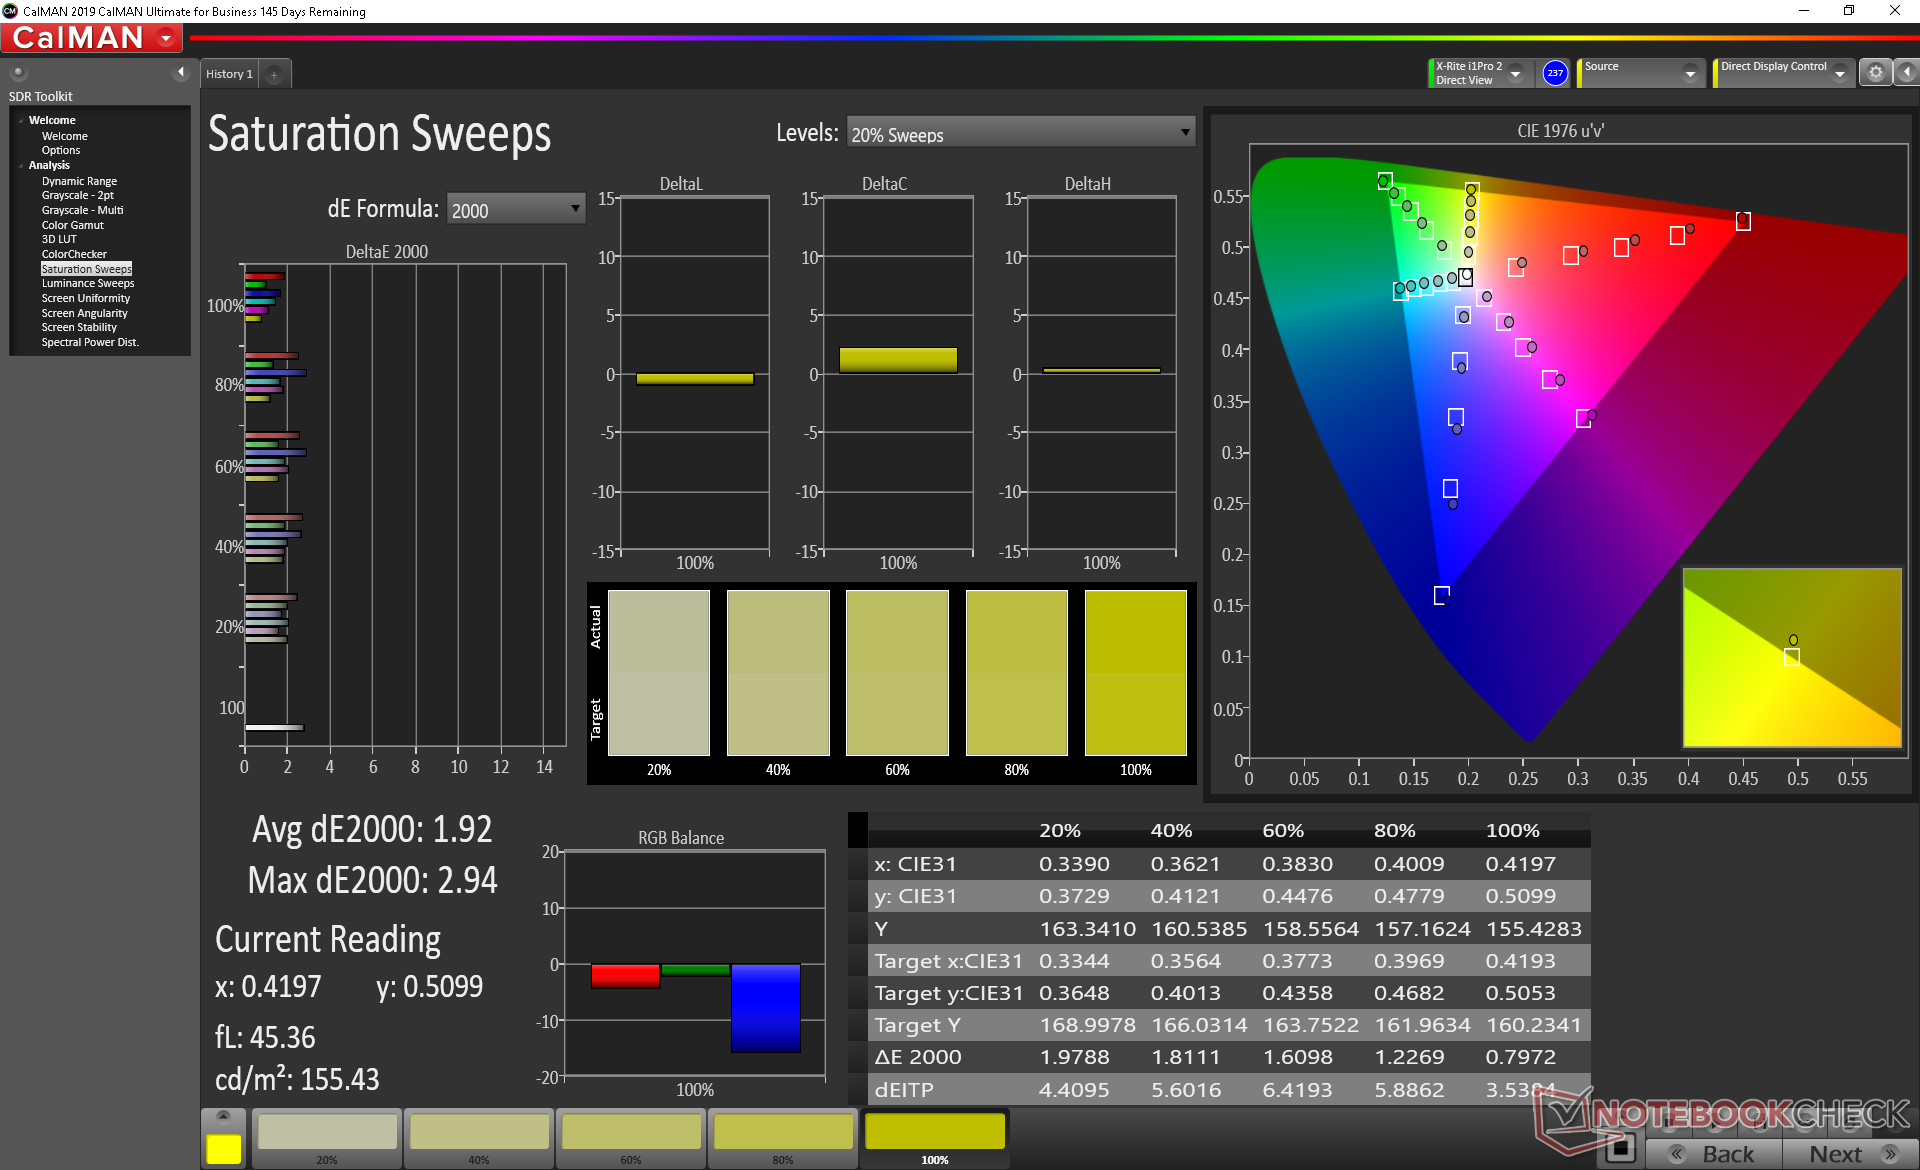
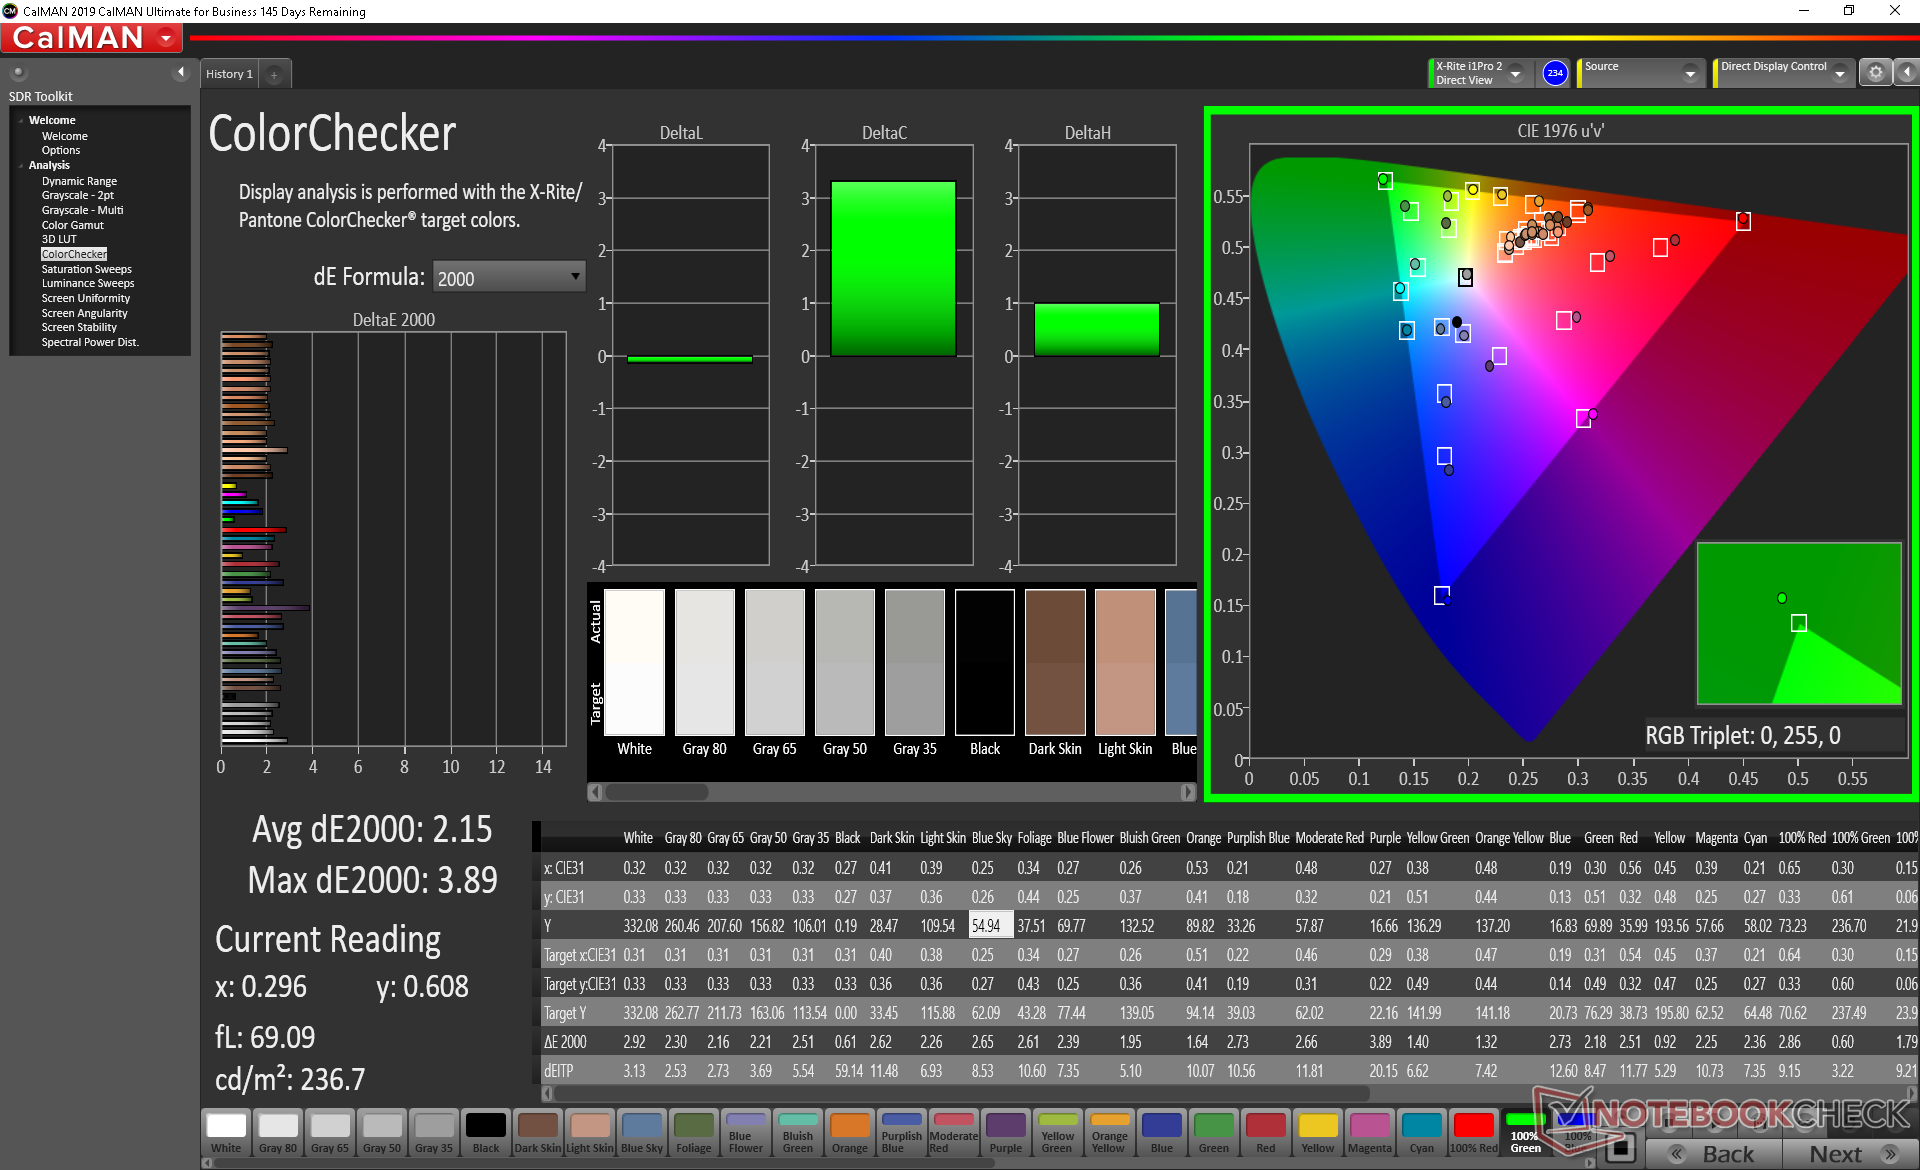
ΔE ColorChecker Calman: 2.15 | ∀{0.5-29.43 Ø4.71}
calibrated: 1.09
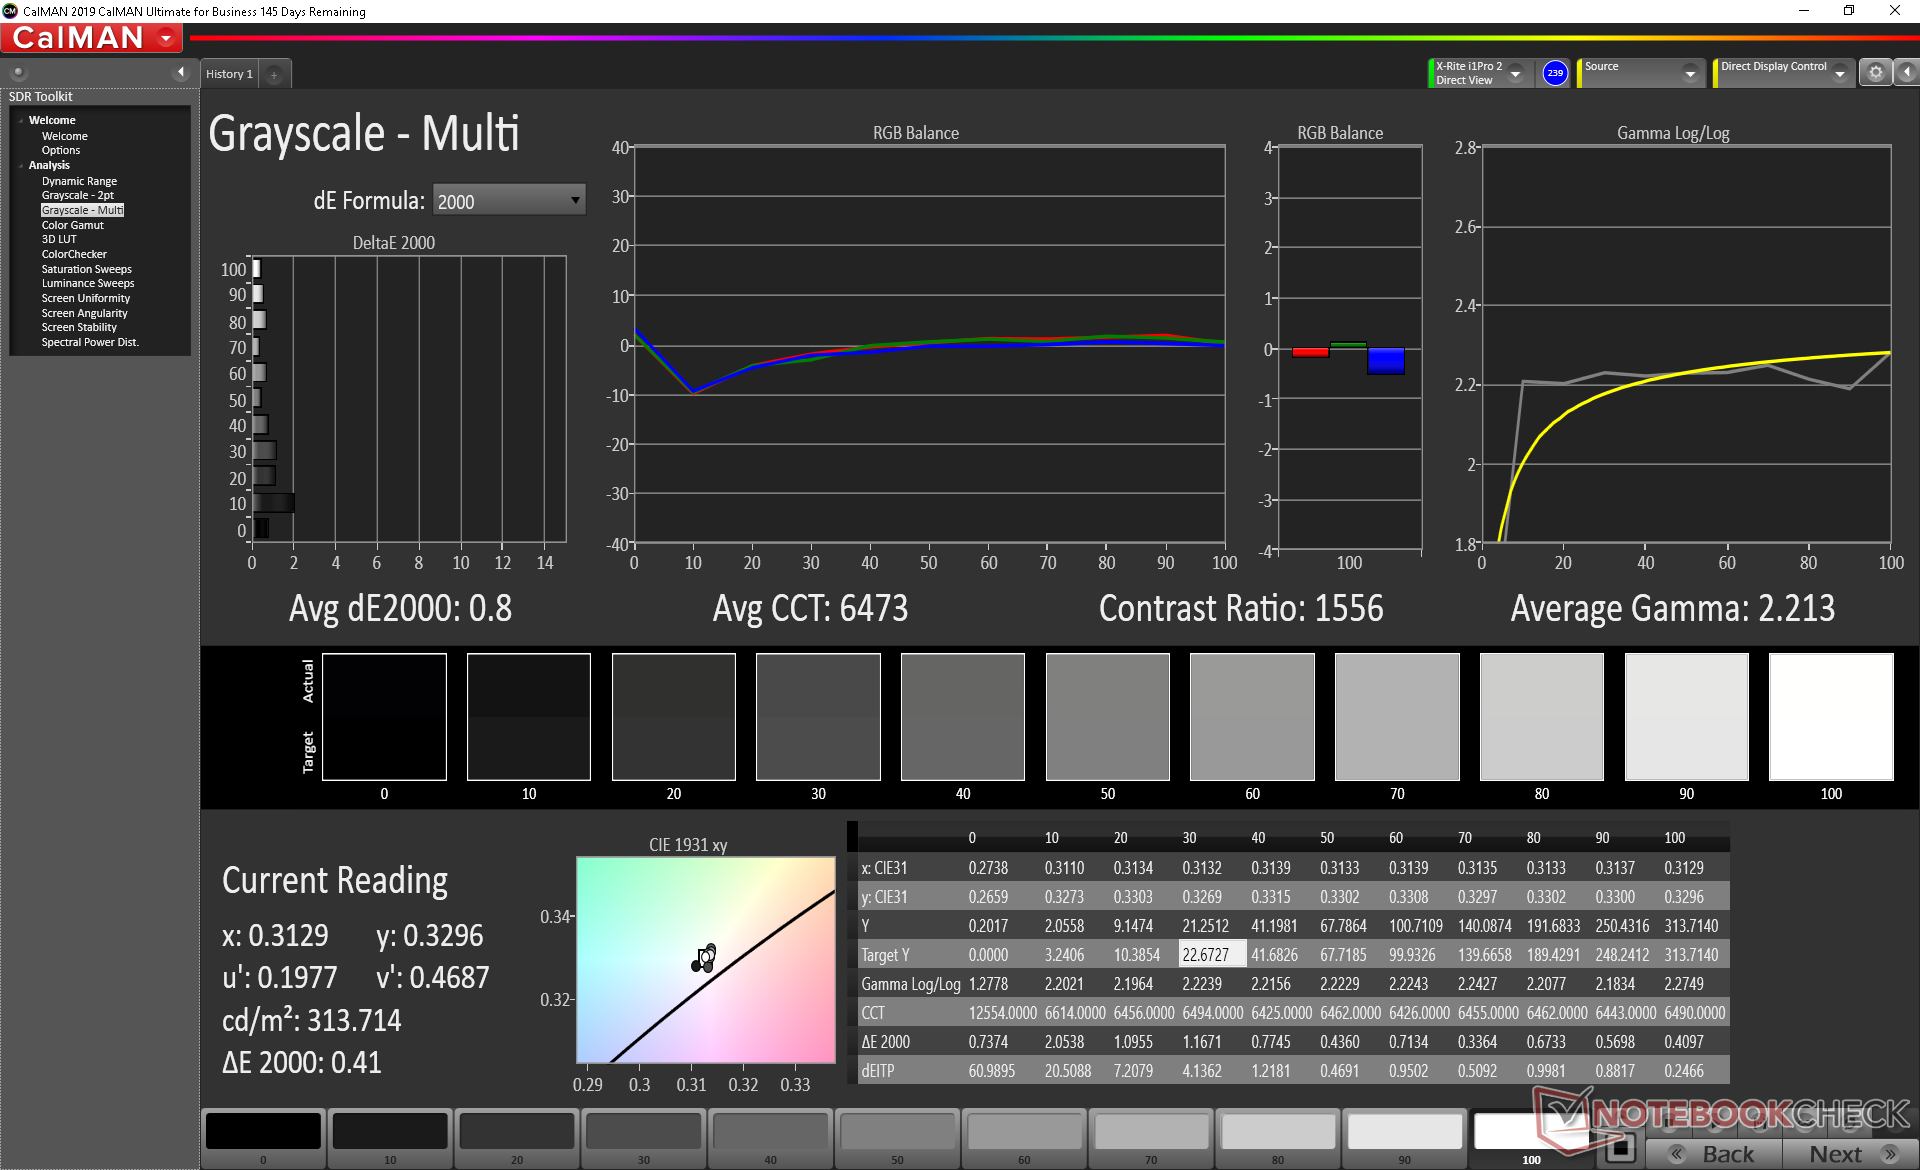
ΔE Greyscale Calman: 2.5 | ∀{0.09-98 Ø4.96}
99.4% sRGB (Argyll 1.6.3 3D)
64.1% AdobeRGB 1998 (Argyll 1.6.3 3D)
72.4% AdobeRGB 1998 (Argyll 3D)
99.3% sRGB (Argyll 3D)
71.8% Display P3 (Argyll 3D)
Gamma: 2.3
CCT: 6347 K
| Dell Latitude 7310 AU Optronics B133HAN, IPS, 13.3", 1920x1080 | Dell Latitude 7300-P99G B133HAK, IPS LED, 13.3", 1920x1080 | Asus ZenBook S13 UX392FN Tianma XM, IPS, 13.9", 1920x1080 | Lenovo ThinkPad X395 LP133WF7-SPB1, IPS, 13.3", 1920x1080 | HP EliteBook 735 G6 7KN29EA CMN139E, IPS LED, 13.3", 1920x1080 | Apple MacBook Pro 13 2020 2GHz i5 10th-Gen APPA03D, IPS, 13.3", 2560x1600 | |
|---|---|---|---|---|---|---|
| Display | -9% | -5% | -8% | -40% | 19% | |
| Display P3 Coverage (%) | 71.8 | 64.6 -10% | 67.5 -6% | 64.1 -11% | 41.53 -42% | 98.8 38% |
| sRGB Coverage (%) | 99.3 | 91.5 -8% | 95.8 -4% | 95.2 -4% | 61.7 -38% | 99.9 1% |
| AdobeRGB 1998 Coverage (%) | 72.4 | 65.5 -10% | 69 -5% | 65.8 -9% | 43 -41% | 86.4 19% |
| Response Times | 5% | -1% | -23% | 8% | -13% | |
| Response Time Grey 50% / Grey 80% * (ms) | 40.8 ? | 39 ? 4% | 47.2 ? -16% | 55 ? -35% | 38 ? 7% | 46 ? -13% |
| Response Time Black / White * (ms) | 28.8 ? | 27 ? 6% | 24.8 ? 14% | 32 ? -11% | 26.4 ? 8% | 32.4 ? -13% |
| PWM Frequency (Hz) | 26040 | 113600 ? | ||||
| Screen | -66% | -0% | -9% | -114% | 17% | |
| Brightness middle (cd/m²) | 332.7 | 341 2% | 466 40% | 356 7% | 294 -12% | 512 54% |
| Brightness (cd/m²) | 329 | 306 -7% | 462 40% | 336 2% | 277 -16% | 491 49% |
| Brightness Distribution (%) | 89 | 79 -11% | 90 1% | 88 -1% | 87 -2% | 91 2% |
| Black Level * (cd/m²) | 0.25 | 0.31 -24% | 0.33 -32% | 0.16 36% | 0.18 28% | 0.32 -28% |
| Contrast (:1) | 1331 | 1100 -17% | 1412 6% | 2225 67% | 1633 23% | 1600 20% |
| Colorchecker dE 2000 * | 2.15 | 6.43 -199% | 1.93 10% | 3.6 -67% | 6.8 -216% | 1.7 21% |
| Colorchecker dE 2000 max. * | 3.89 | 10.33 -166% | 4.26 -10% | 5.5 -41% | 23.8 -512% | 3.4 13% |
| Colorchecker dE 2000 calibrated * | 1.09 | 2.36 -117% | 1.99 -83% | 1.11 -2% | 4.8 -340% | 1 8% |
| Greyscale dE 2000 * | 2.5 | 6.9 -176% | 1.7 32% | 4.7 -88% | 5.9 -136% | 1.9 24% |
| Gamma | 2.3 96% | 2.23 99% | 2.15 102% | 2.92 75% | 1.96 112% | 2.19 100% |
| CCT | 6347 102% | 8338 78% | 6382 102% | 6222 104% | 6979 93% | 6817 95% |
| Color Space (Percent of AdobeRGB 1998) (%) | 64.1 | 59 -8% | 62.2 -3% | 61 -5% | 39.6 -38% | 77.4 21% |
| Color Space (Percent of sRGB) (%) | 99.4 | 91 -8% | 95.7 -4% | 96 -3% | 61.5 -38% | 99.9 1% |
| Toplam Ortalama (Program / Ayarlar) | -23% /
-47% | -2% /
-1% | -13% /
-10% | -49% /
-85% | 8% /
14% |
* ... daha küçük daha iyidir
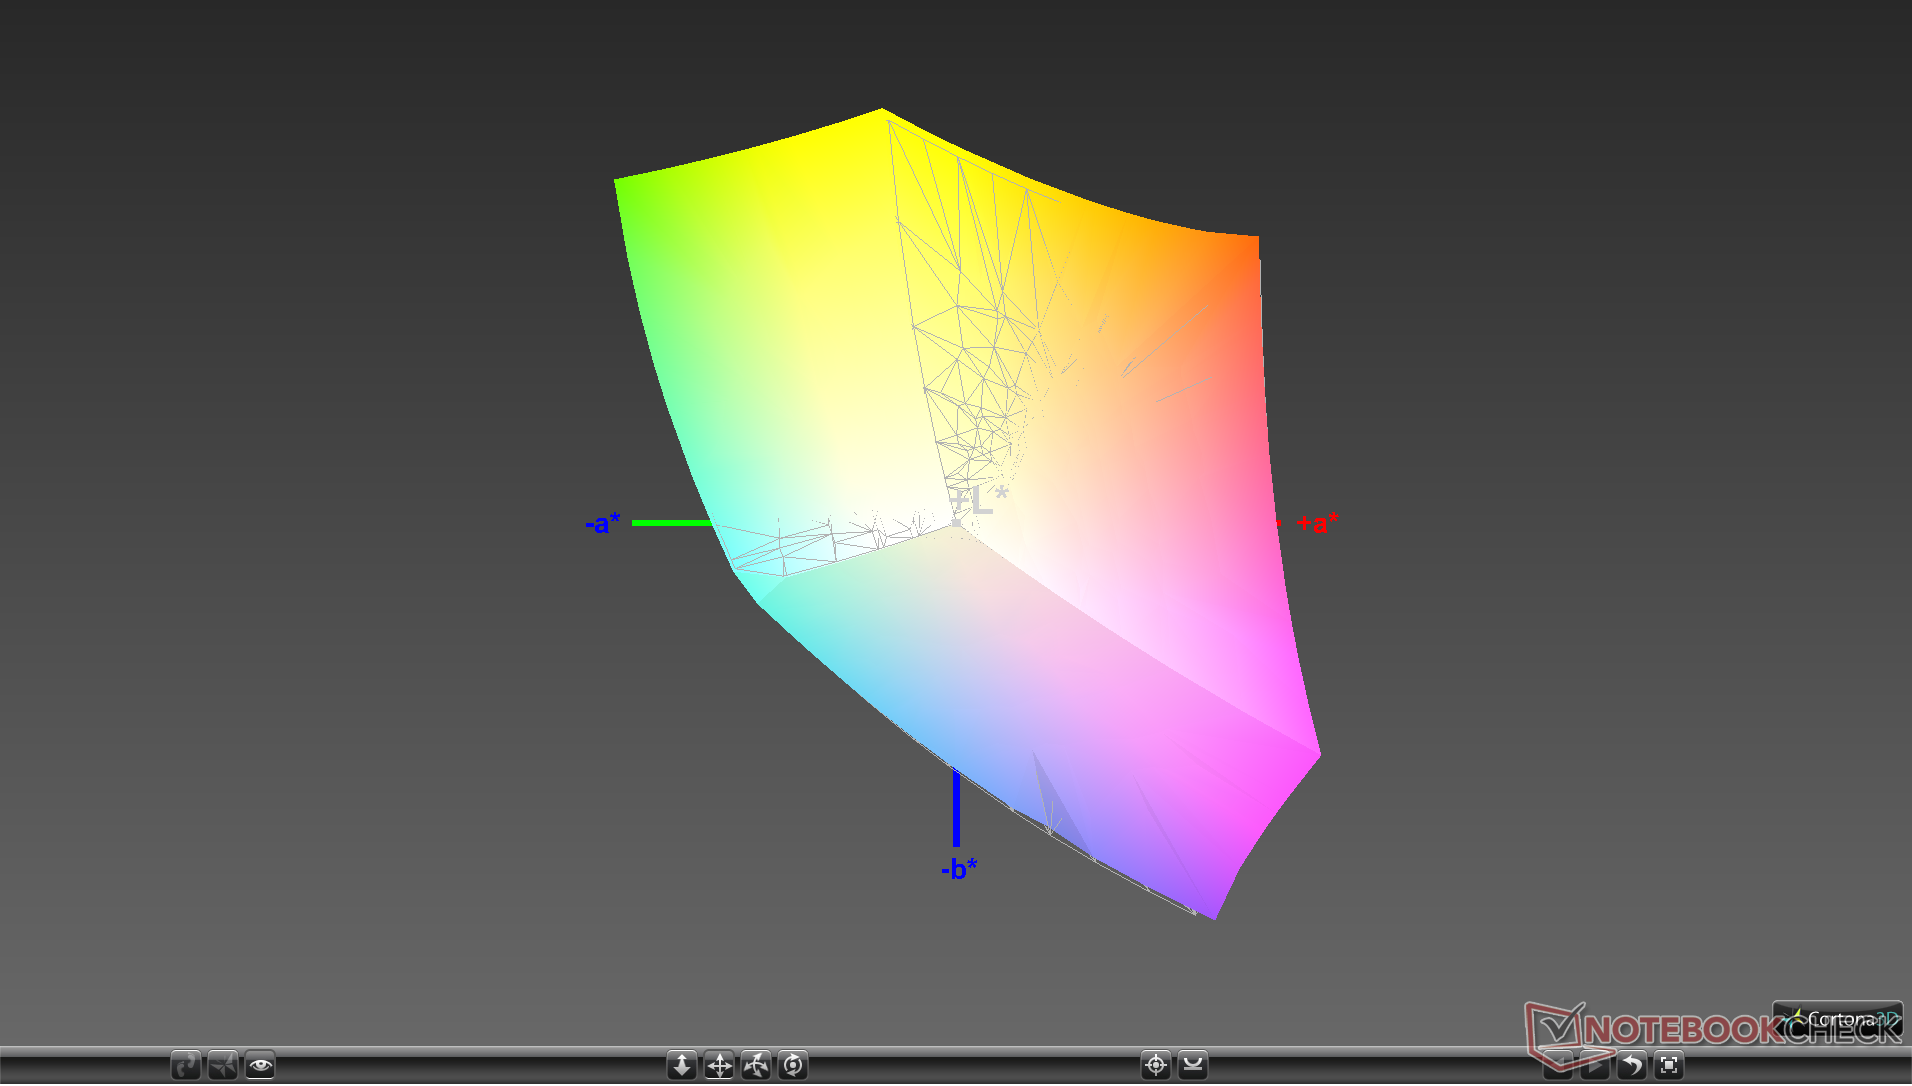
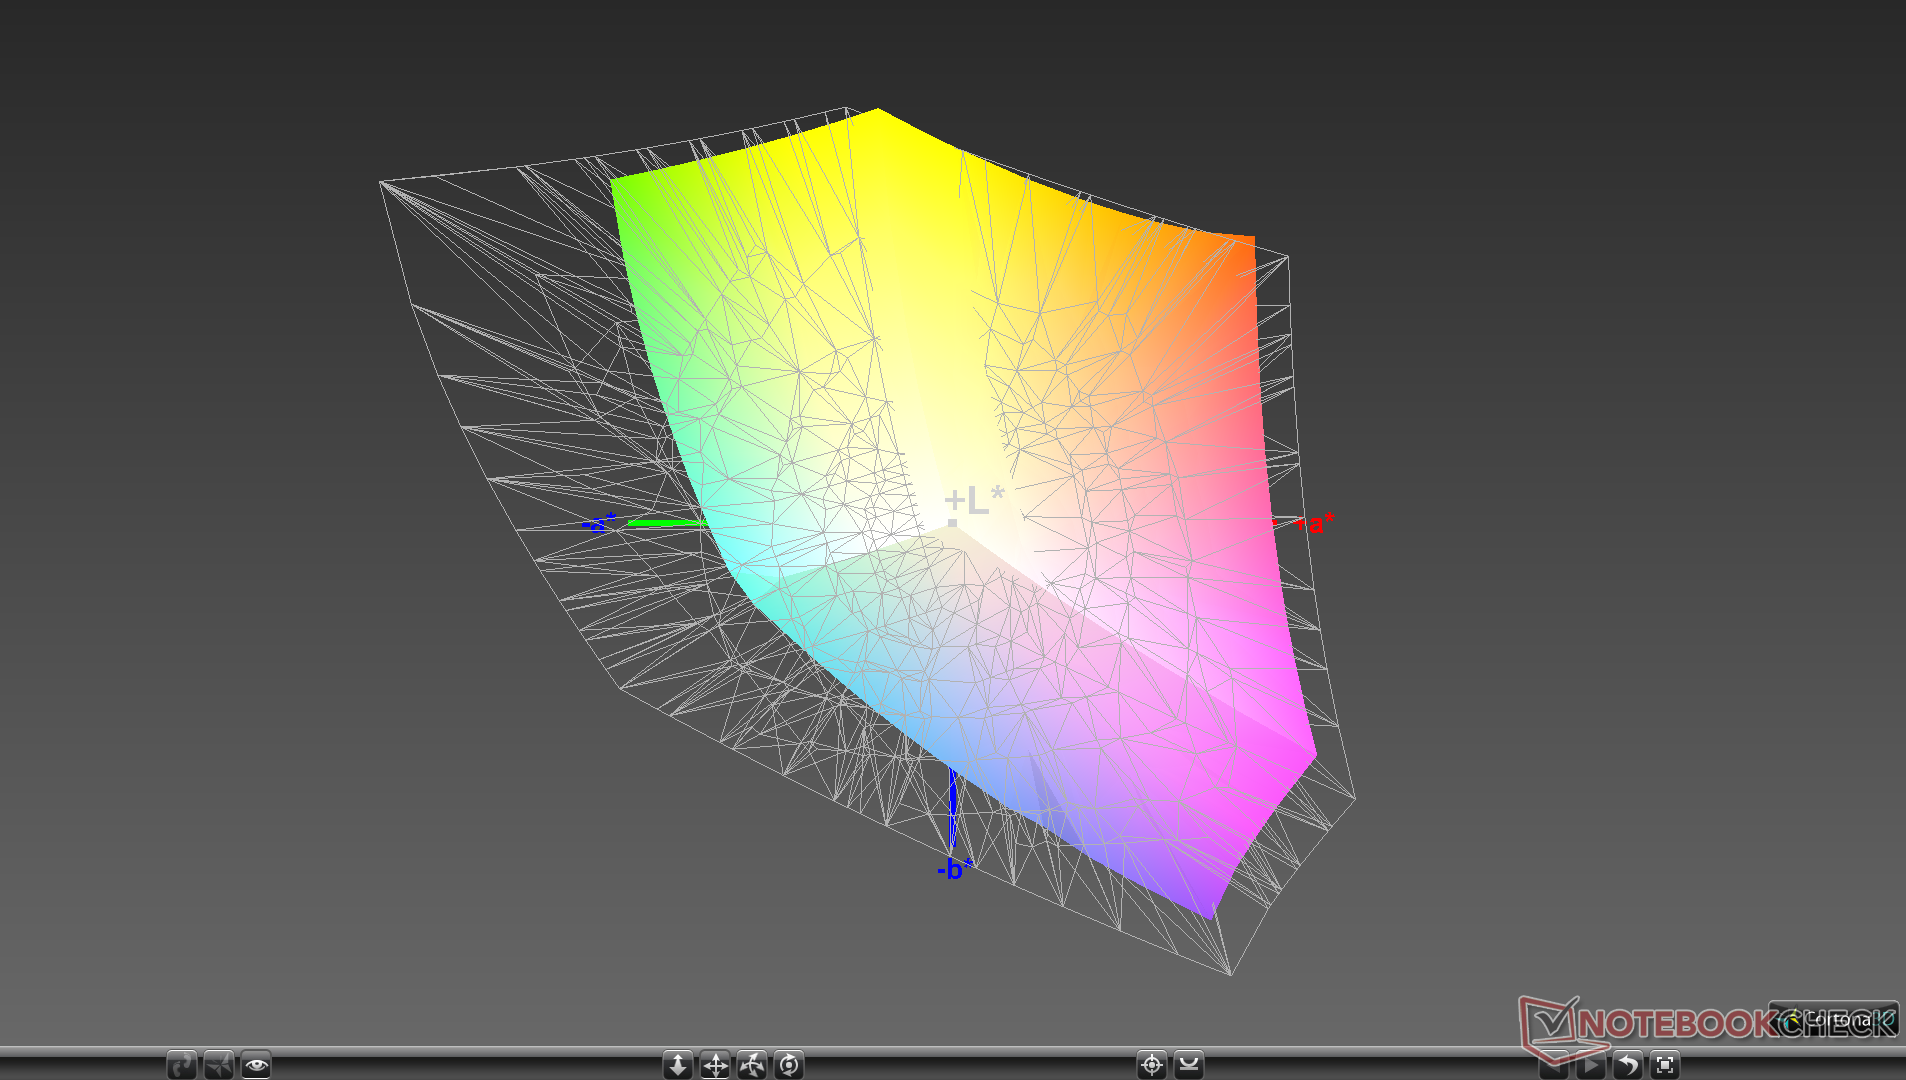
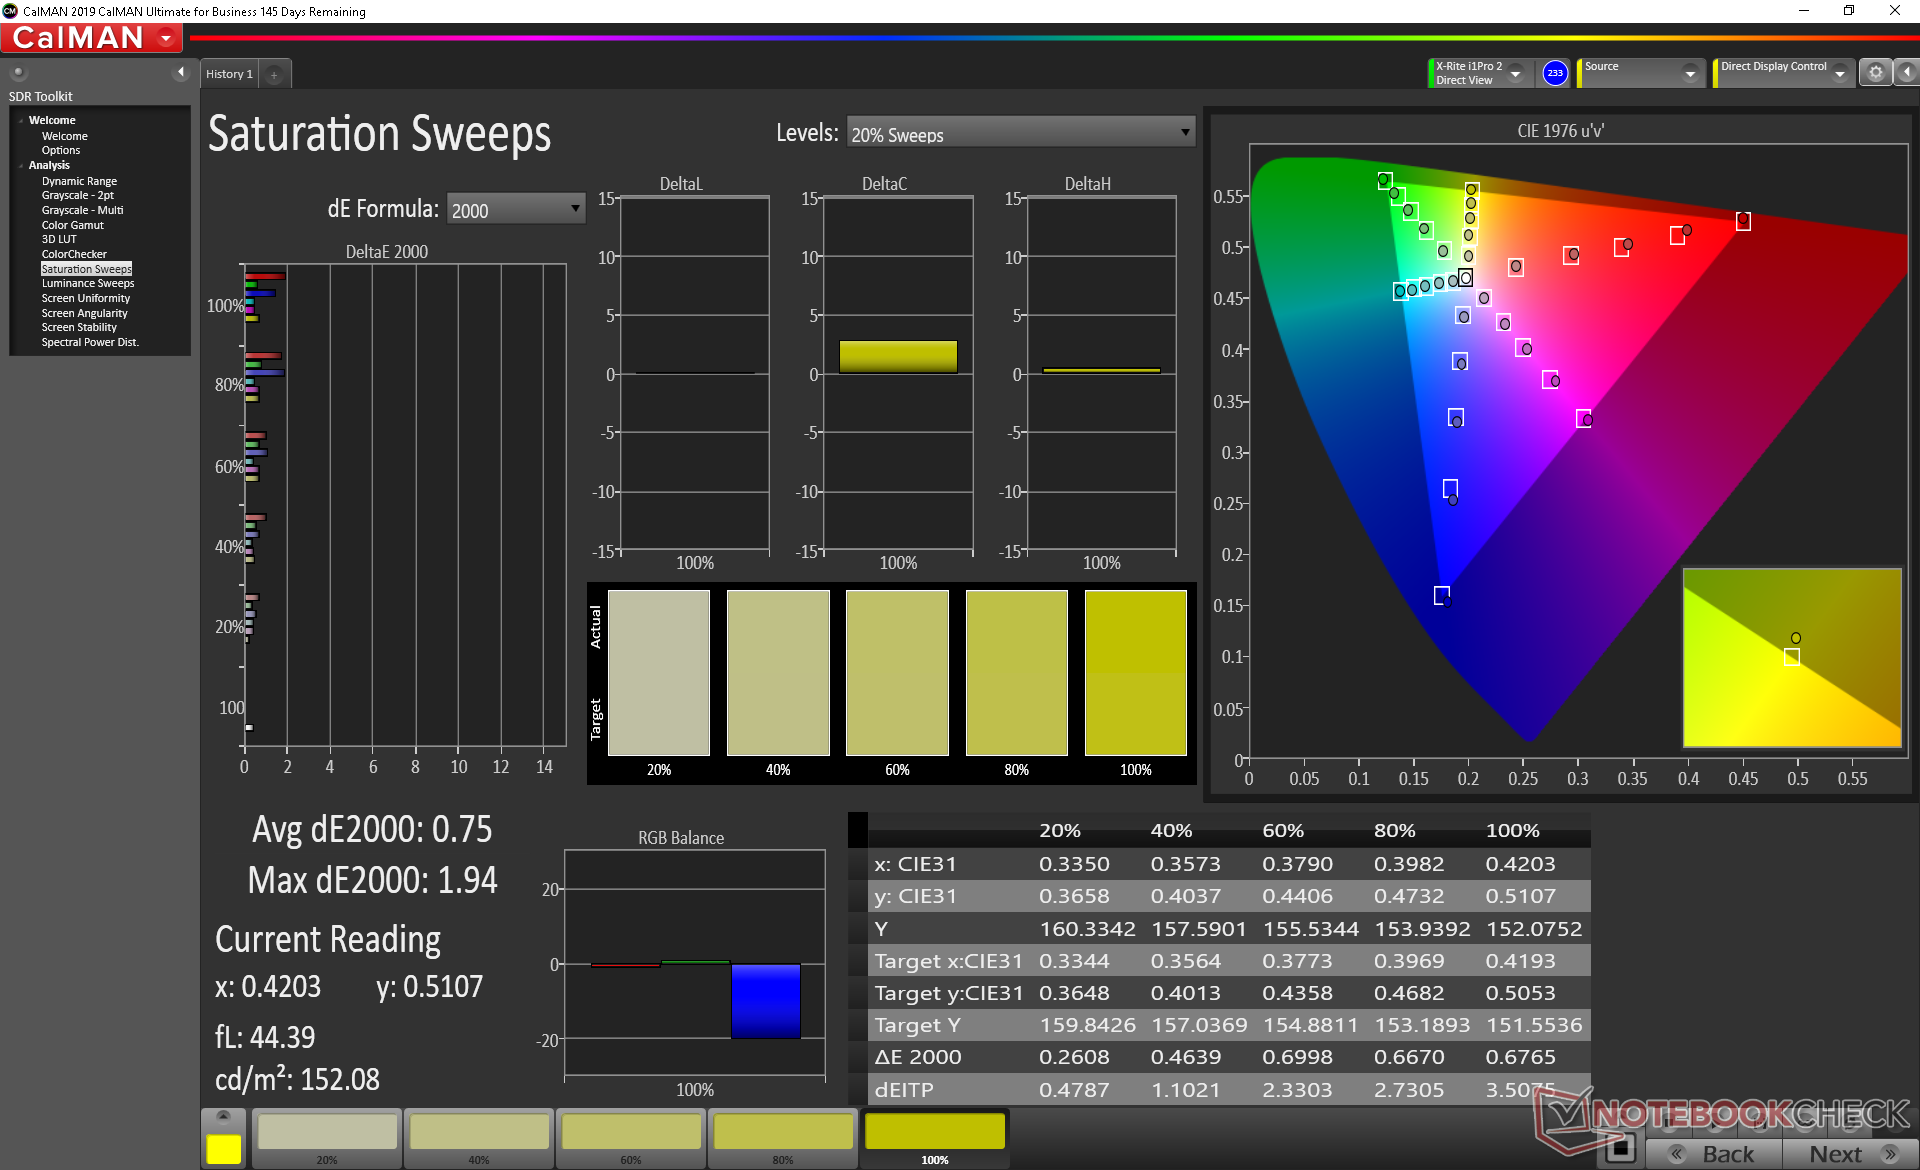
Renk alanı, sRGB'yi tamamen ve AdobeRGB'nin yaklaşık yüzde 64'ünü diğer orta sınıftan üst seviye Ultrabook'lara uygun olacak şekilde kaplar. Daha da geniş bir renk yelpazesi için XPS 15 veya Precision serisine bakın.
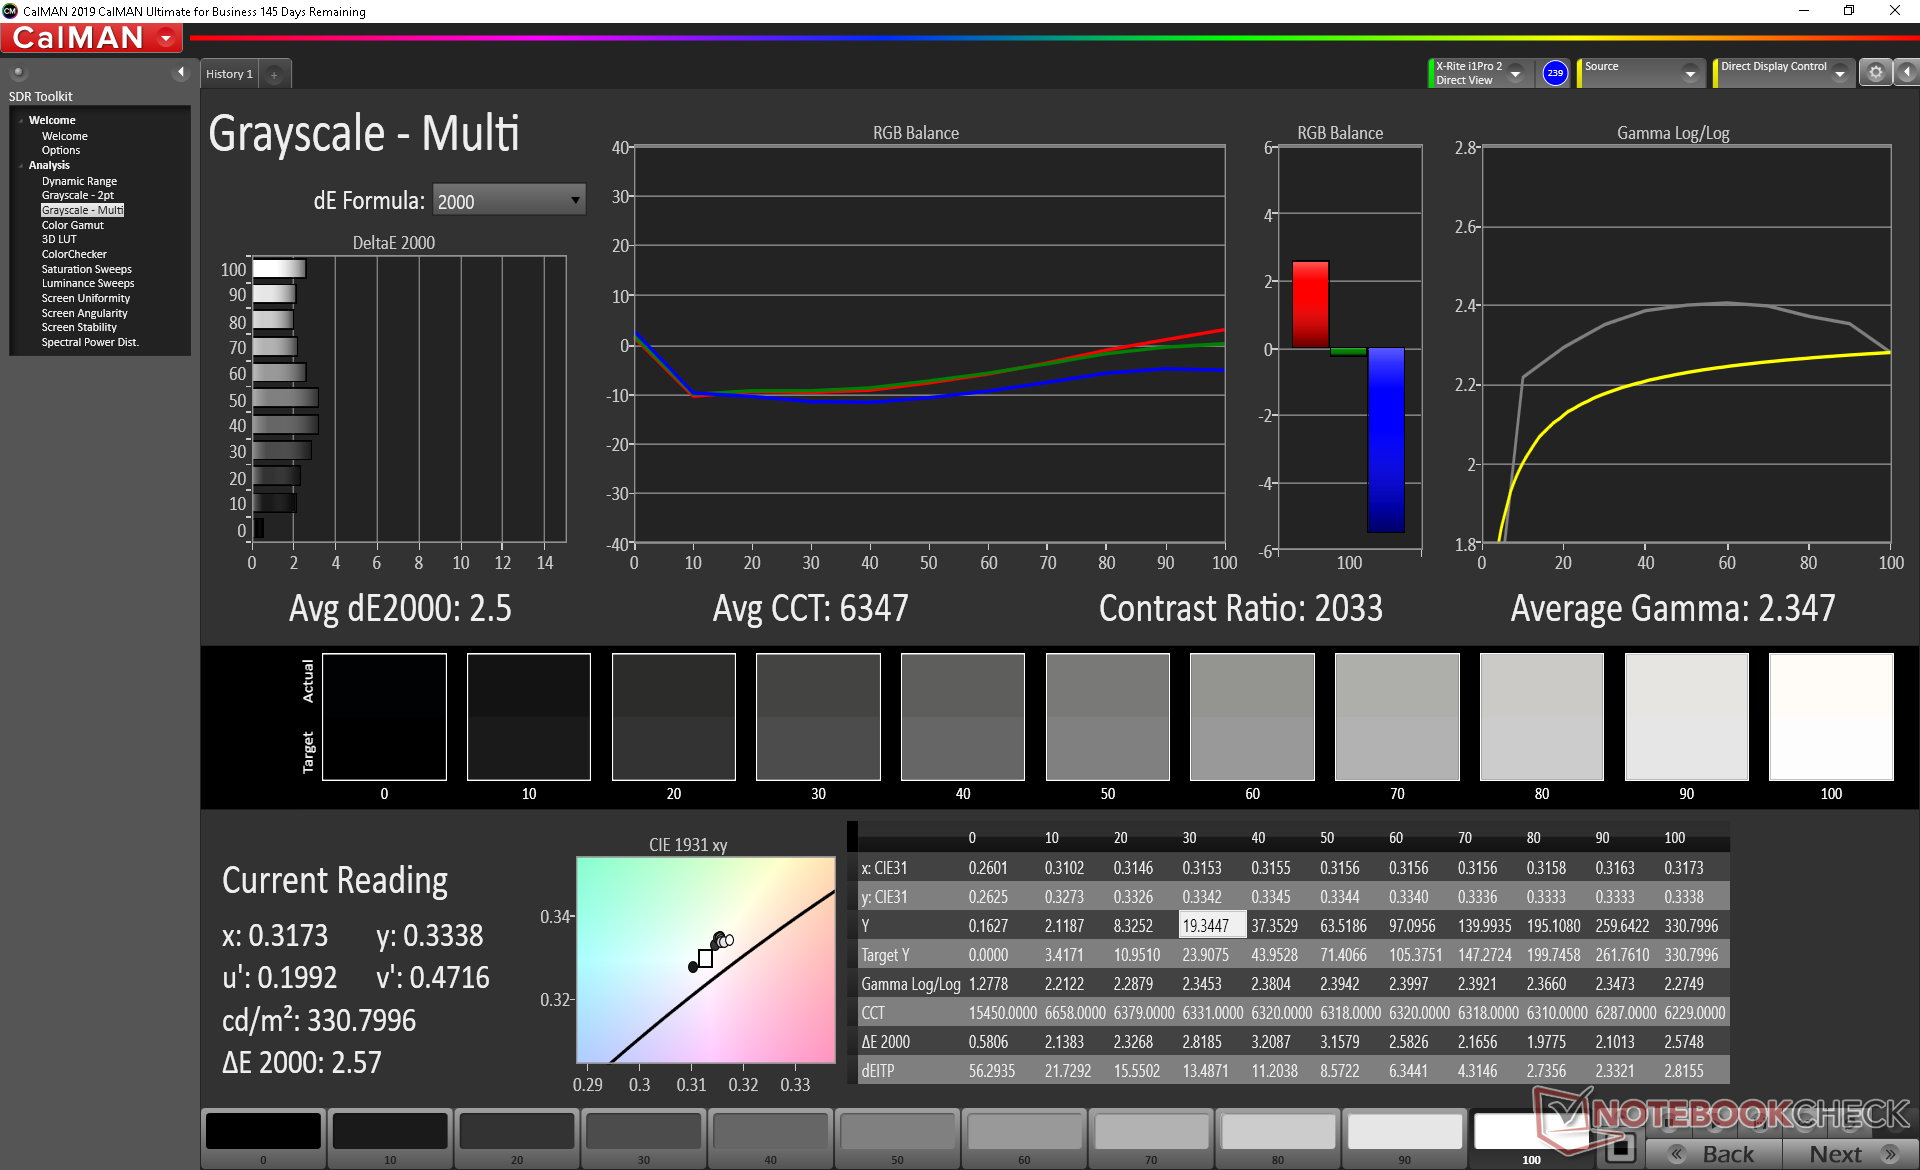
Ekran, sırasıyla sadece 2,5 ve 2,15 ortalama gri tonlama ve renk deltaE değerleri ile kutudan iyi kalibre edilmiştir. Paneli daha da kalibre etmek bu değerleri çok az iyileştirir.
Yanıt Sürelerini Görüntüle
| ↔ Tepki Süresi Siyahtan Beyaza | ||
|---|---|---|
| 28.8 ms ... yükseliş ↗ ve sonbahar↘ birleşimi | ↗ 14.8 ms yükseliş | 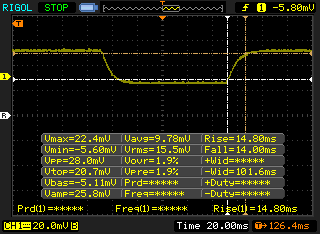 |
| ↘ 14 ms sonbahar | ||
| Ekran, testlerimizde nispeten yavaş yanıt oranları gösteriyor ve oyuncular için çok yavaş olabilir. Karşılaştırıldığında, test edilen tüm cihazlar 0.1 (minimum) ile 240 (maksimum) ms arasında değişir. » Tüm cihazların 76 %'si daha iyi. Bu, ölçülen yanıt süresinin test edilen tüm cihazların ortalamasından (19.8 ms) daha kötü olduğu anlamına gelir. | ||
| ↔ Tepki Süresi %50 Griden %80 Griye | ||
| 40.8 ms ... yükseliş ↗ ve sonbahar↘ birleşimi | ↗ 22.4 ms yükseliş | 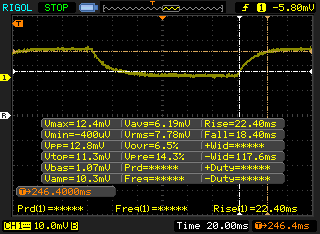 |
| ↘ 18.4 ms sonbahar | ||
| Ekran, testlerimizde yavaş yanıt oranları gösteriyor ve oyuncular için yetersiz olacaktır. Karşılaştırıldığında, test edilen tüm cihazlar 0.165 (minimum) ile 636 (maksimum) ms arasında değişir. » Tüm cihazların 64 %'si daha iyi. Bu, ölçülen yanıt süresinin test edilen tüm cihazların ortalamasından (30.9 ms) daha kötü olduğu anlamına gelir. | ||
Ekran Titremesi / PWM (Darbe Genişliği Modülasyonu)
| Ekran titriyor / PWM algılanmadı | 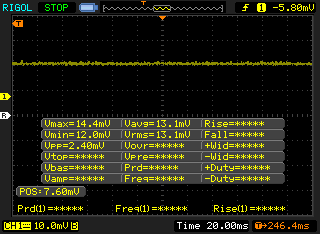 | ||
Karşılaştırıldığında: Test edilen tüm cihazların %52 %'si ekranı karartmak için PWM kullanmıyor. PWM tespit edilirse, ortalama 7741 (minimum: 5 - maksimum: 343500) Hz ölçüldü. | |||
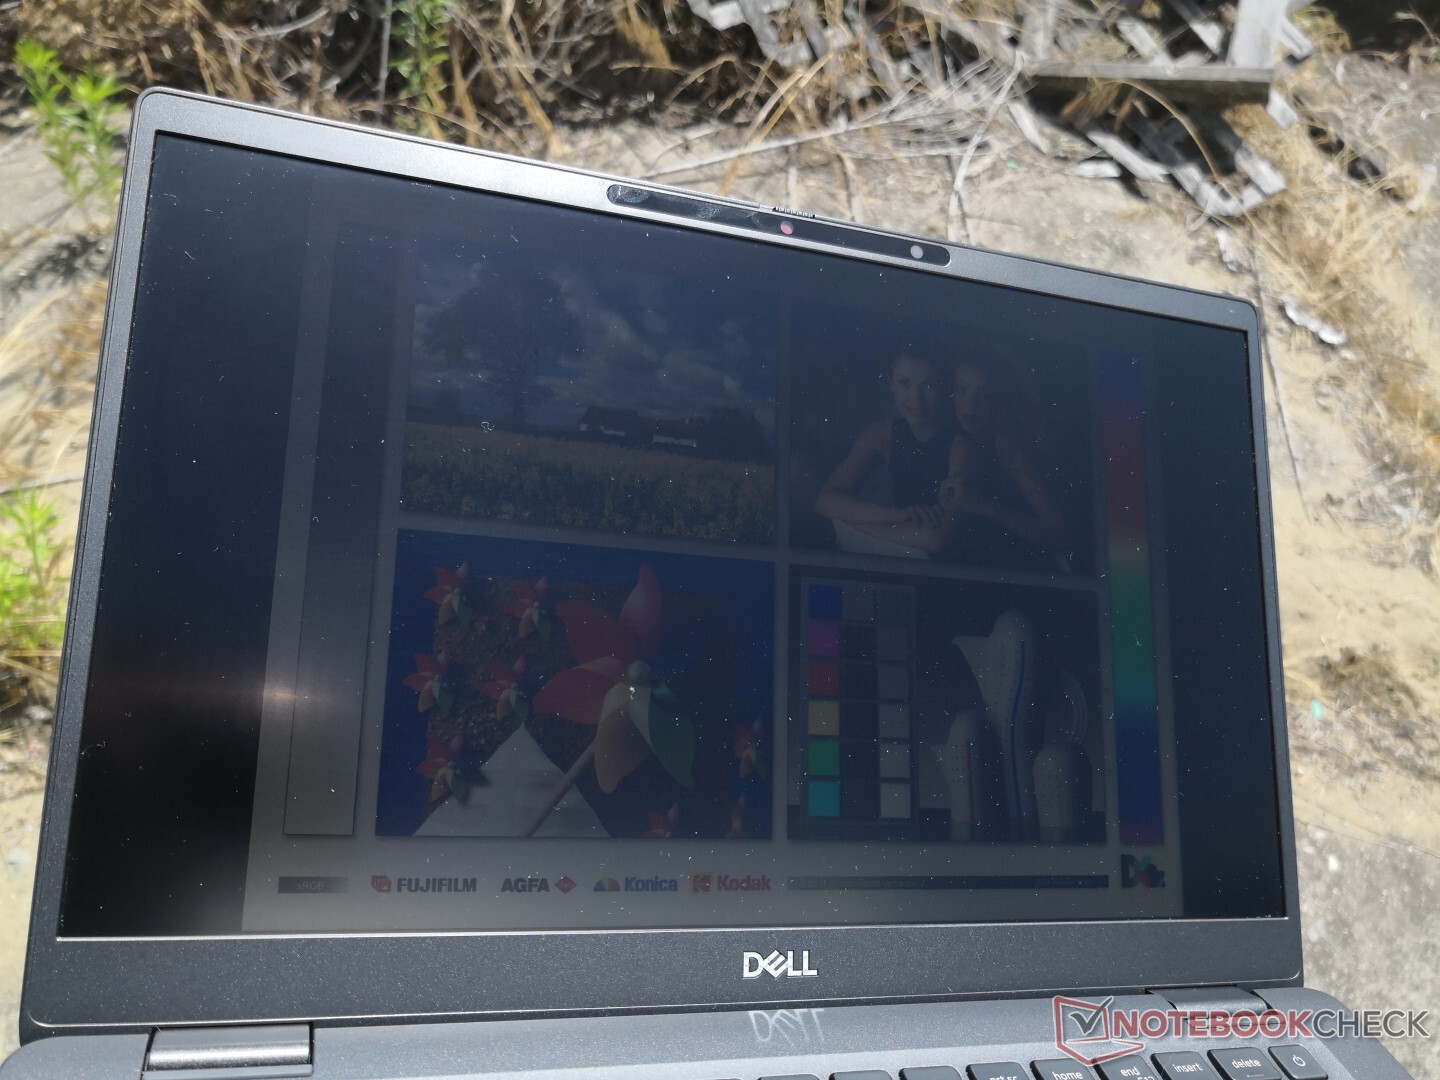
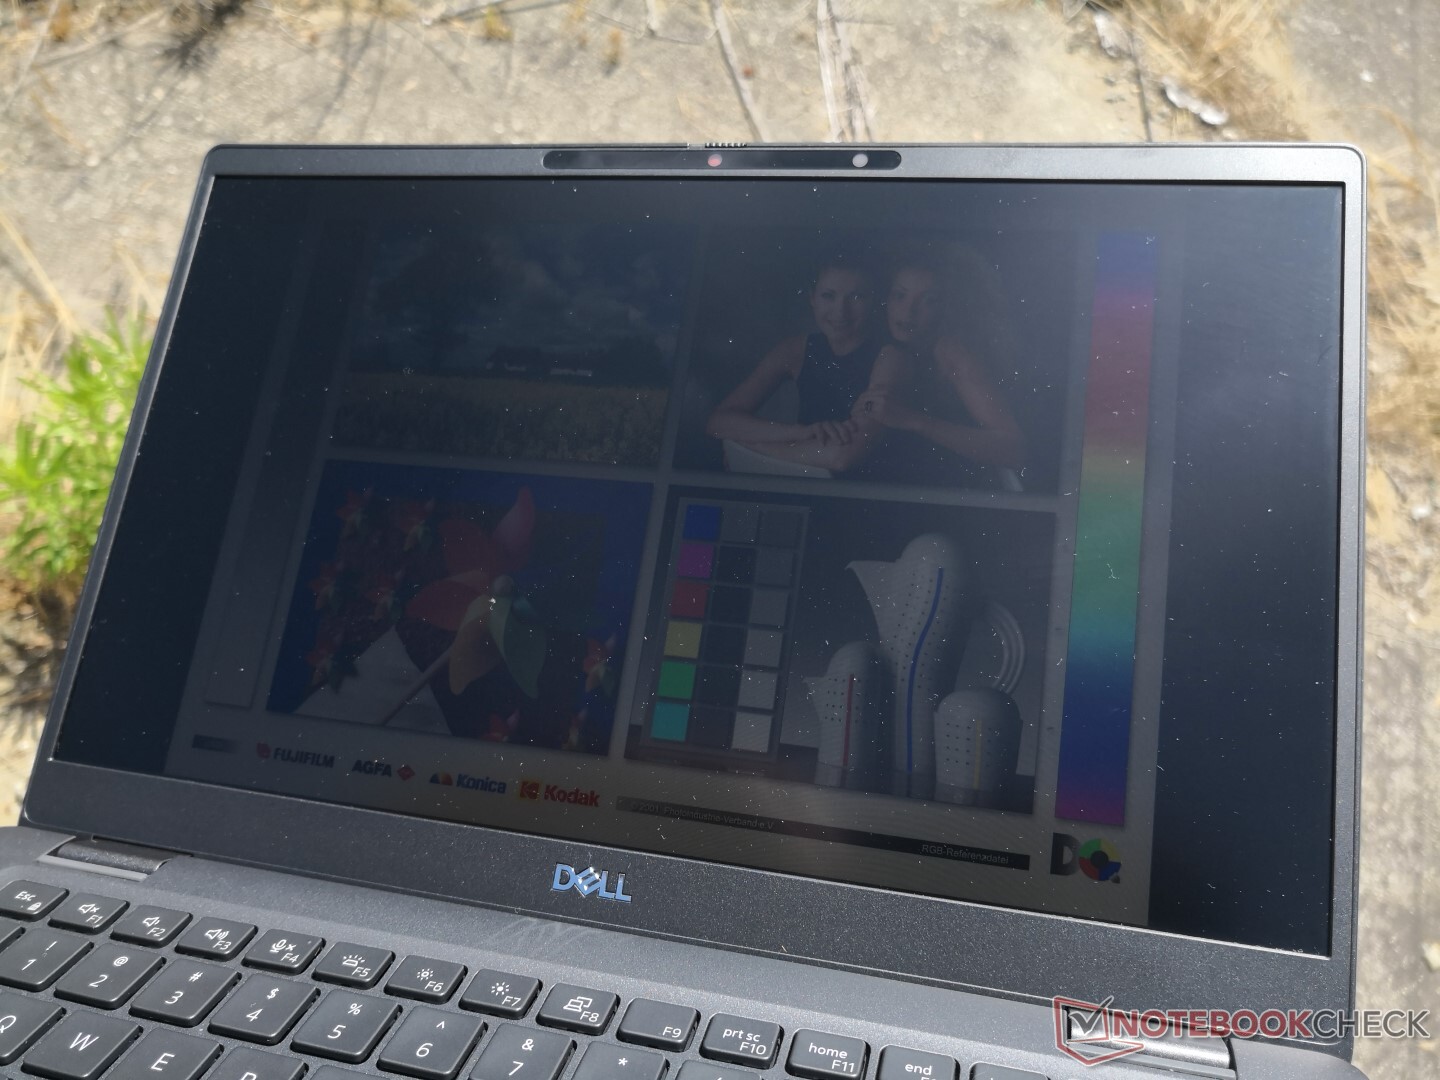
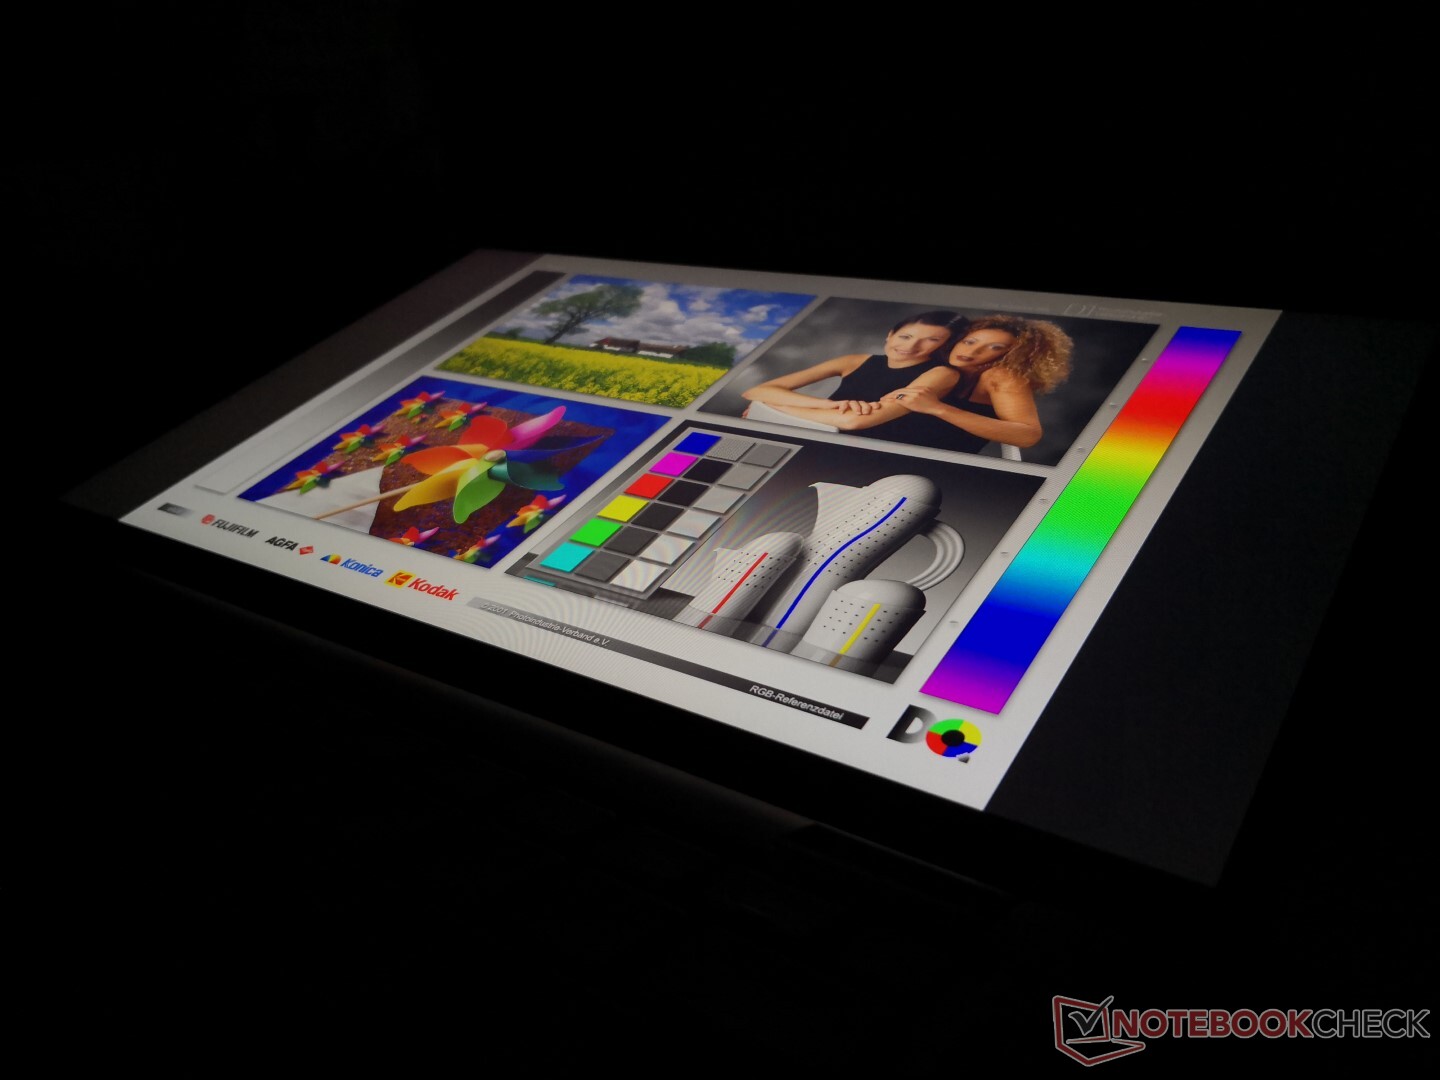
Dış mekan görünürlüğü, bu fiyat aralığındaki diğer alt defterlerin çoğu kadar iyi değildir. Sadece 330 nit'de ekran,> 500 nit seçeneğinin bulunduğu XPS 13 veya MacBook Pro 13'ten daha kararlıdır. Örneğin HP EliteBook 1030, 1000 nit seçeneğine sahiptir ve Latitude 7310'un özellikle çok hafif ve taşınabilir olması nedeniyle yakın bir şeye sahip olmaması çok kötüdür.
Verim
Aynı dört çekirdekli Core i5-10210U, i5-10310U ve i7-10610U CPU seçenekleri, Latitude 7410'daki gibi burada mevcuttur. Ne yazık ki, bu aynı zamanda masada AMD veya Nvidia seçeneklerinin olmadığı anlamına gelir. Altıgen çekirdekli Core i7-10710U dışındaki çoğu Comet Lake-U CPU'nun son nesil Whisky Lake-U serisinden çok az daha hızlı performans gösterdiğini zaten kanıtlamıştık. olası en iyi puanlar için aşağıdaki karşılaştırmalar.

İşlemci
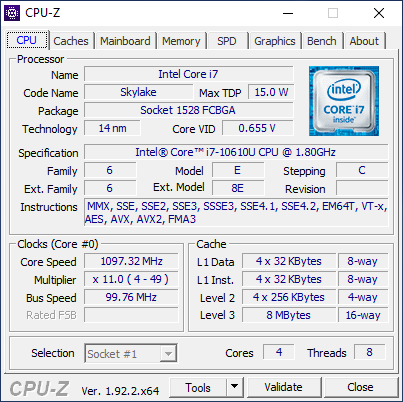
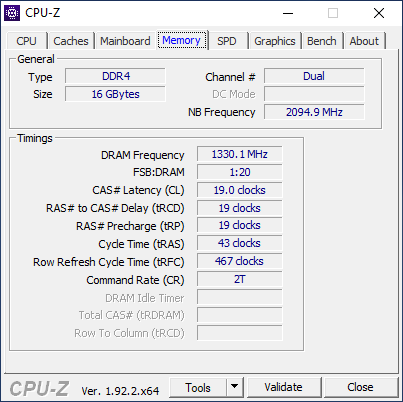
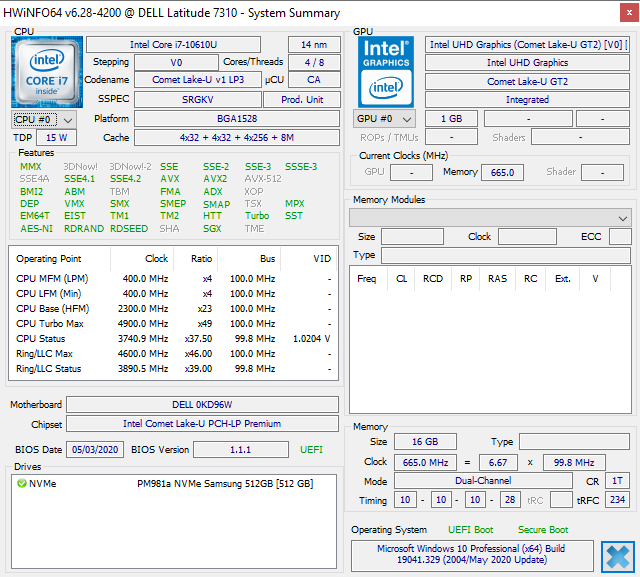
CPU performansı temelde daha büyük Latitude 7410'da kaydettiklerimizle aynıdır, bu da daha küçük 13.3 inç form faktörümüze rağmen işlemci performansının daha yavaş olmadığı anlamına gelir. Core i7-10610U, daha ucuz olan Core i5-10210U'dan veya hatta geçen yılki Core i7-8665U'dan neredeyse hiç olmadığı için ham performans hala hayal kırıklığı yaratıyor. Core i7-10610U ve Core i7-10510U arasındaki temel fark performanstan ziyade vPro desteğine düşüyor. Daha fazla teknik bilgi ve kıyaslama için Core i7-10610U'daki özel sayfamıza bakın.
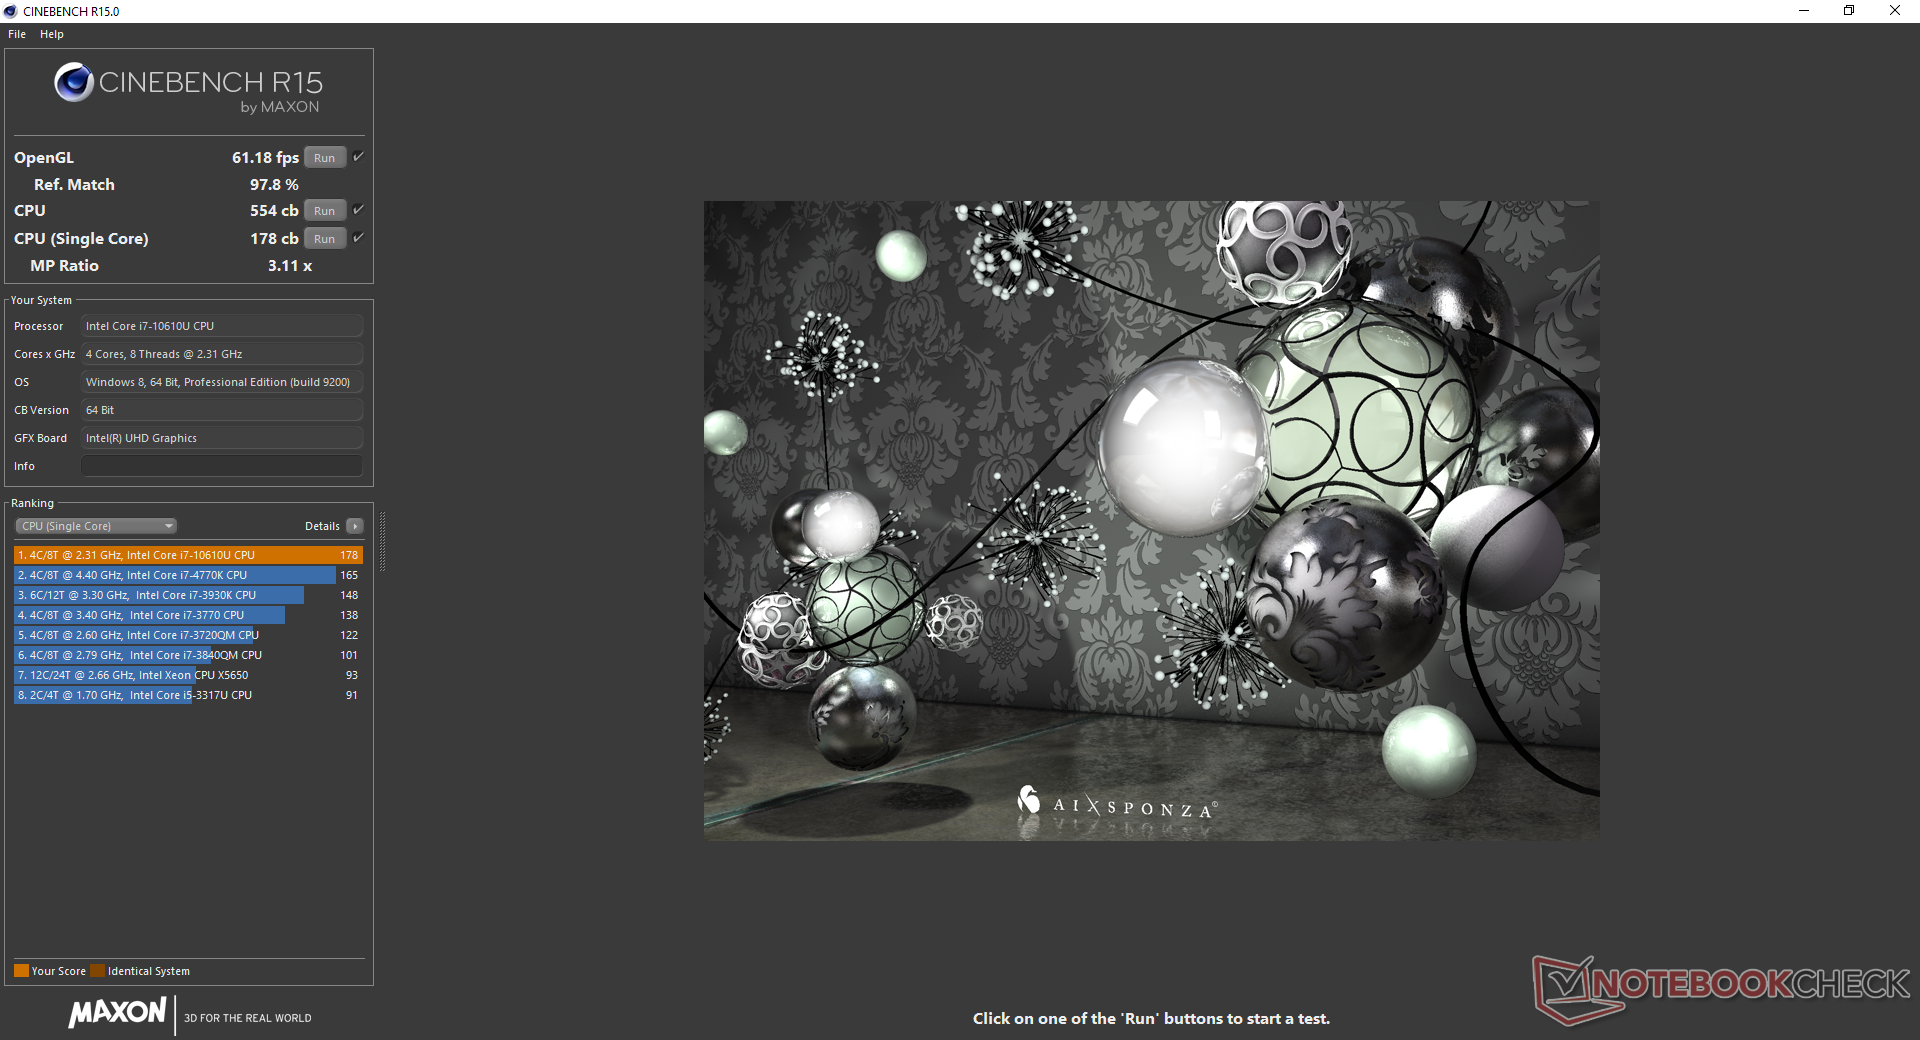
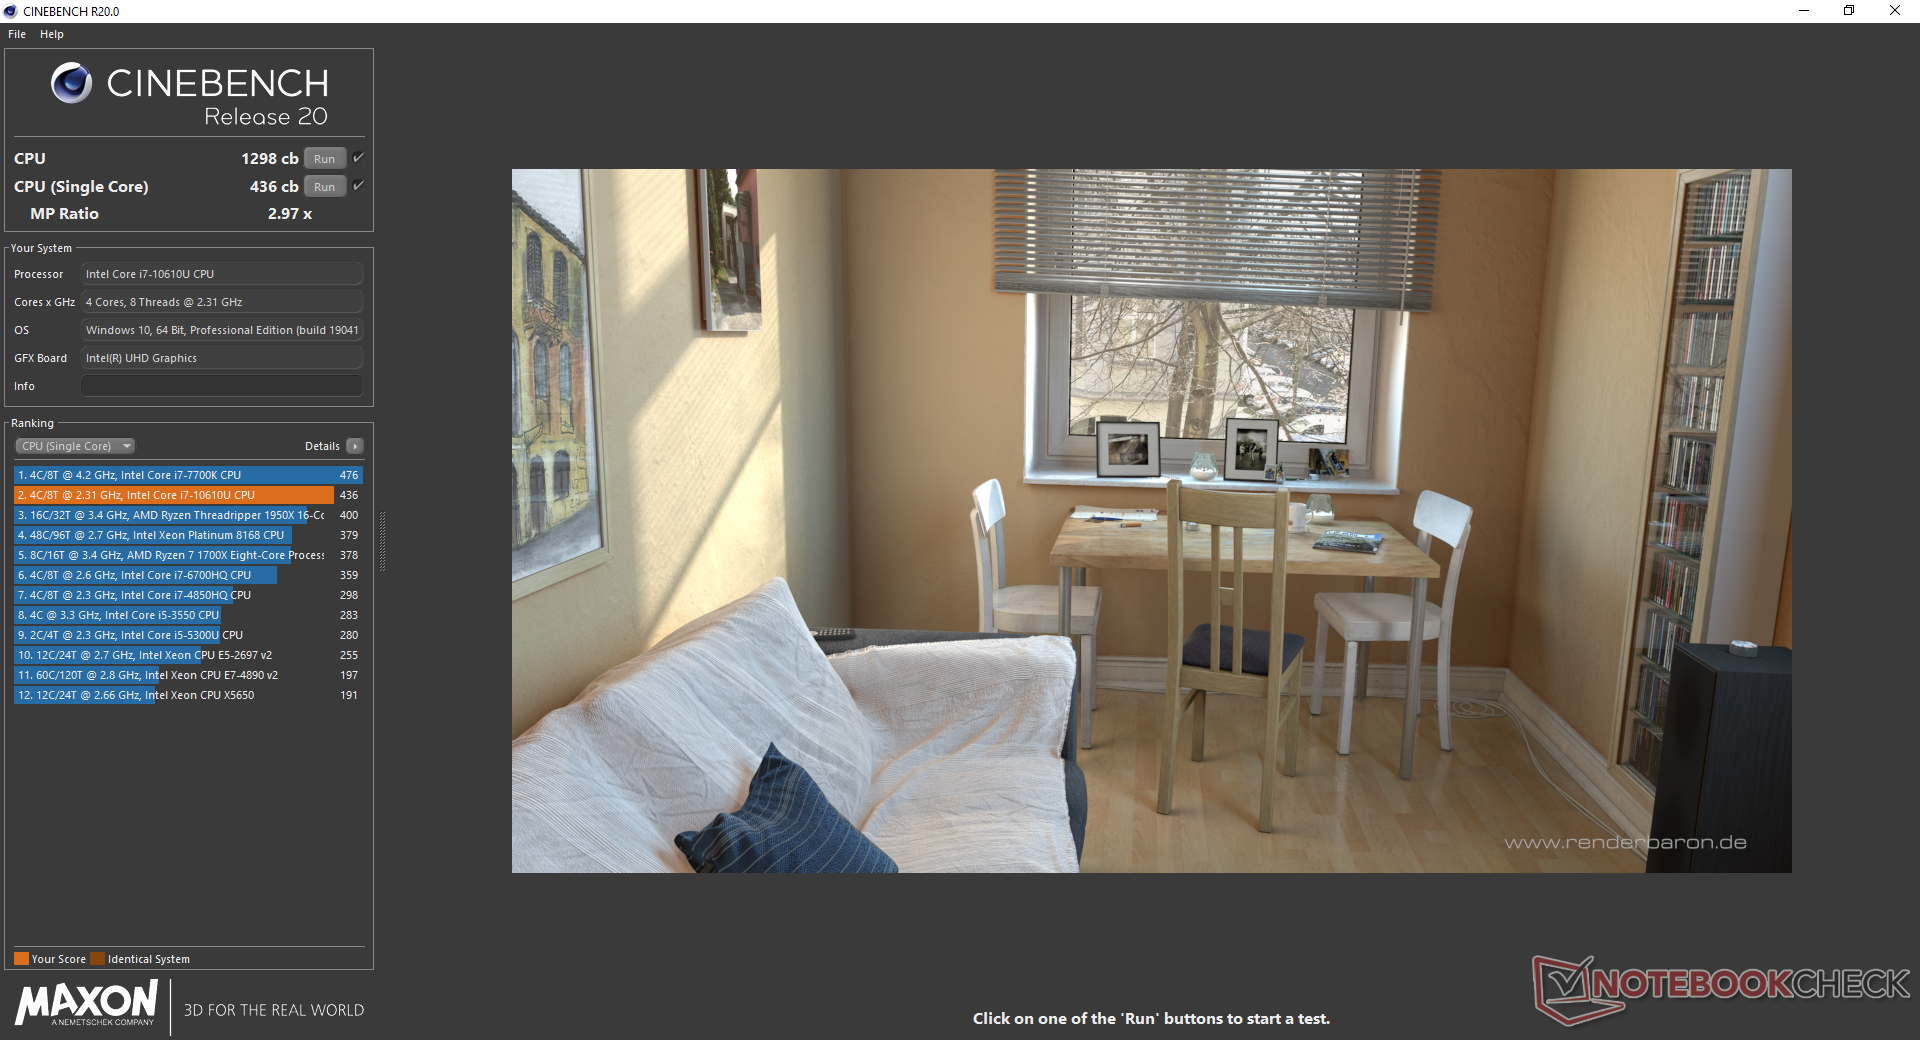
Cinebench R15: CPU Multi 64Bit | CPU Single 64Bit
Blender: v2.79 BMW27 CPU
7-Zip 18.03: 7z b 4 -mmt1 | 7z b 4
Geekbench 5.5: Single-Core | Multi-Core
HWBOT x265 Benchmark v2.2: 4k Preset
LibreOffice : 20 Documents To PDF
R Benchmark 2.5: Overall mean
| Cinebench R20 / CPU (Multi Core) | |
| HP ProBook 455 G7-175W8EA | |
| Dell XPS 13 7390 Core i7-10710U | |
| HP Envy x360 13-ay0010nr | |
| Dell XPS 13 9300 i5 FHD | |
| Ortalama Intel Core i7-10610U (1271 - 1663, n=6) | |
| Acer Swift 3 SF314-42-R27B | |
| Lenovo ThinkPad X1 Carbon 2020-20UAS04T00 | |
| Dell XPS 13 9300 4K UHD | |
| Dell Latitude 7310 | |
| Dell Latitude 7300-P99G | |
| Lenovo ThinkPad L13 Yoga 20R6S00800 | |
| HP EliteBook x360 830 G6 | |
| Dell XPS 13 7390 2-in-1 Core i3 | |
| Cinebench R20 / CPU (Single Core) | |
| HP ProBook 455 G7-175W8EA | |
| Dell XPS 13 7390 Core i7-10710U | |
| Dell XPS 13 9300 4K UHD | |
| Lenovo ThinkPad X1 Carbon 2020-20UAS04T00 | |
| Dell Latitude 7310 | |
| Ortalama Intel Core i7-10610U (349 - 482, n=6) | |
| Acer Swift 3 SF314-42-R27B | |
| Dell XPS 13 9300 i5 FHD | |
| HP Envy x360 13-ay0010nr | |
| Lenovo ThinkPad L13 Yoga 20R6S00800 | |
| Dell Latitude 7300-P99G | |
| Dell XPS 13 7390 2-in-1 Core i3 | |
| HP EliteBook x360 830 G6 | |
| Cinebench R15 / CPU Multi 64Bit | |
| Dell XPS 13 7390 Core i7-10710U | |
| HP ProBook 455 G7-175W8EA | |
| HP Envy x360 13-ay0010nr | |
| Dell XPS 13 9300 4K UHD | |
| Lenovo ThinkPad X1 Carbon 2020-20UAS04T00 | |
| Dell Latitude 7300-P99G | |
| Dell XPS 13 9300 i5 FHD | |
| Dell XPS 13 9300 i5 FHD | |
| Ortalama Intel Core i7-10610U (548 - 738, n=6) | |
| Acer Swift 3 SF314-42-R27B | |
| Dell Latitude 7310 | |
| HP EliteBook x360 830 G6 | |
| Lenovo ThinkPad L13 Yoga 20R6S00800 | |
| Dell XPS 13 7390 2-in-1 Core i3 | |
| Lenovo ThinkPad 13 20J1005TPB | |
| Cinebench R15 / CPU Single 64Bit | |
| Dell Latitude 7300-P99G | |
| Lenovo ThinkPad X1 Carbon 2020-20UAS04T00 | |
| Dell XPS 13 9300 4K UHD | |
| HP ProBook 455 G7-175W8EA | |
| Dell XPS 13 7390 Core i7-10710U | |
| Dell Latitude 7310 | |
| Ortalama Intel Core i7-10610U (133 - 200, n=6) | |
| HP Envy x360 13-ay0010nr | |
| Dell XPS 13 9300 i5 FHD | |
| Acer Swift 3 SF314-42-R27B | |
| Lenovo ThinkPad L13 Yoga 20R6S00800 | |
| HP EliteBook x360 830 G6 | |
| Dell XPS 13 7390 2-in-1 Core i3 | |
| Lenovo ThinkPad 13 20J1005TPB | |
| Blender / v2.79 BMW27 CPU | |
| Dell XPS 13 7390 2-in-1 Core i3 | |
| Acer Swift 3 SF314-42-R27B | |
| Dell Latitude 7310 | |
| Lenovo ThinkPad L13 Yoga 20R6S00800 | |
| Lenovo ThinkPad X1 Carbon 2020-20UAS04T00 | |
| Dell XPS 13 9300 i5 FHD | |
| Ortalama Intel Core i7-10610U (641 - 816, n=6) | |
| Dell XPS 13 9300 4K UHD | |
| HP Envy x360 13-ay0010nr | |
| Dell XPS 13 7390 Core i7-10710U | |
| HP ProBook 455 G7-175W8EA | |
| 7-Zip 18.03 / 7z b 4 -mmt1 | |
| Dell Latitude 7310 | |
| Lenovo ThinkPad X1 Carbon 2020-20UAS04T00 | |
| Ortalama Intel Core i7-10610U (3653 - 4853, n=6) | |
| Lenovo ThinkPad L13 Yoga 20R6S00800 | |
| Dell XPS 13 9300 4K UHD | |
| HP EliteBook x360 830 G6 | |
| Dell XPS 13 7390 Core i7-10710U | |
| HP Envy x360 13-ay0010nr | |
| HP ProBook 455 G7-175W8EA | |
| Dell XPS 13 9300 i5 FHD | |
| Acer Swift 3 SF314-42-R27B | |
| Dell XPS 13 7390 2-in-1 Core i3 | |
| 7-Zip 18.03 / 7z b 4 | |
| HP ProBook 455 G7-175W8EA | |
| Dell XPS 13 7390 Core i7-10710U | |
| HP Envy x360 13-ay0010nr | |
| Dell XPS 13 9300 4K UHD | |
| Lenovo ThinkPad L13 Yoga 20R6S00800 | |
| Dell XPS 13 9300 i5 FHD | |
| Ortalama Intel Core i7-10610U (15369 - 20332, n=6) | |
| Lenovo ThinkPad X1 Carbon 2020-20UAS04T00 | |
| Dell Latitude 7310 | |
| HP EliteBook x360 830 G6 | |
| Acer Swift 3 SF314-42-R27B | |
| Dell XPS 13 7390 2-in-1 Core i3 | |
| Geekbench 5.5 / Single-Core | |
| Dell XPS 13 9300 4K UHD | |
| Dell Latitude 7310 | |
| Dell XPS 13 9300 i5 FHD | |
| Ortalama Intel Core i7-10610U (1155 - 1261, n=6) | |
| Lenovo ThinkPad X1 Carbon 2020-20UAS04T00 | |
| HP ProBook 455 G7-175W8EA | |
| Lenovo ThinkPad L13 Yoga 20R6S00800 | |
| HP Envy x360 13-ay0010nr | |
| Acer Swift 3 SF314-42-R27B | |
| Geekbench 5.5 / Multi-Core | |
| Dell XPS 13 9300 4K UHD | |
| HP ProBook 455 G7-175W8EA | |
| HP Envy x360 13-ay0010nr | |
| Dell XPS 13 9300 i5 FHD | |
| Lenovo ThinkPad L13 Yoga 20R6S00800 | |
| Ortalama Intel Core i7-10610U (3731 - 4622, n=6) | |
| Lenovo ThinkPad X1 Carbon 2020-20UAS04T00 | |
| Dell Latitude 7310 | |
| Acer Swift 3 SF314-42-R27B | |
| HWBOT x265 Benchmark v2.2 / 4k Preset | |
| HP ProBook 455 G7-175W8EA | |
| HP Envy x360 13-ay0010nr | |
| Dell XPS 13 9300 4K UHD | |
| Dell XPS 13 7390 Core i7-10710U | |
| Ortalama Intel Core i7-10610U (4.54 - 5.66, n=6) | |
| Lenovo ThinkPad X1 Carbon 2020-20UAS04T00 | |
| Dell Latitude 7310 | |
| Lenovo ThinkPad L13 Yoga 20R6S00800 | |
| Acer Swift 3 SF314-42-R27B | |
| Dell XPS 13 9300 i5 FHD | |
| Dell XPS 13 7390 2-in-1 Core i3 | |
| LibreOffice / 20 Documents To PDF | |
| HP ProBook 455 G7-175W8EA | |
| Dell XPS 13 9300 4K UHD | |
| Ortalama Intel Core i7-10610U (56.1 - 106, n=6) | |
| Acer Swift 3 SF314-42-R27B | |
| HP Envy x360 13-ay0010nr | |
| Dell Latitude 7310 | |
| Lenovo ThinkPad X1 Carbon 2020-20UAS04T00 | |
| R Benchmark 2.5 / Overall mean | |
| Dell XPS 13 9300 i5 FHD | |
| Ortalama Intel Core i7-10610U (0.637 - 0.855, n=6) | |
| Lenovo ThinkPad L13 Yoga 20R6S00800 | |
| Acer Swift 3 SF314-42-R27B | |
| Dell XPS 13 9300 4K UHD | |
| Lenovo ThinkPad X1 Carbon 2020-20UAS04T00 | |
| Dell Latitude 7310 | |
| HP ProBook 455 G7-175W8EA | |
| HP Envy x360 13-ay0010nr | |
Cinebench R15: CPU Multi 64Bit | CPU Single 64Bit
Blender: v2.79 BMW27 CPU
7-Zip 18.03: 7z b 4 -mmt1 | 7z b 4
Geekbench 5.5: Single-Core | Multi-Core
HWBOT x265 Benchmark v2.2: 4k Preset
LibreOffice : 20 Documents To PDF
R Benchmark 2.5: Overall mean
* ... daha küçük daha iyidir
Sistem performansı
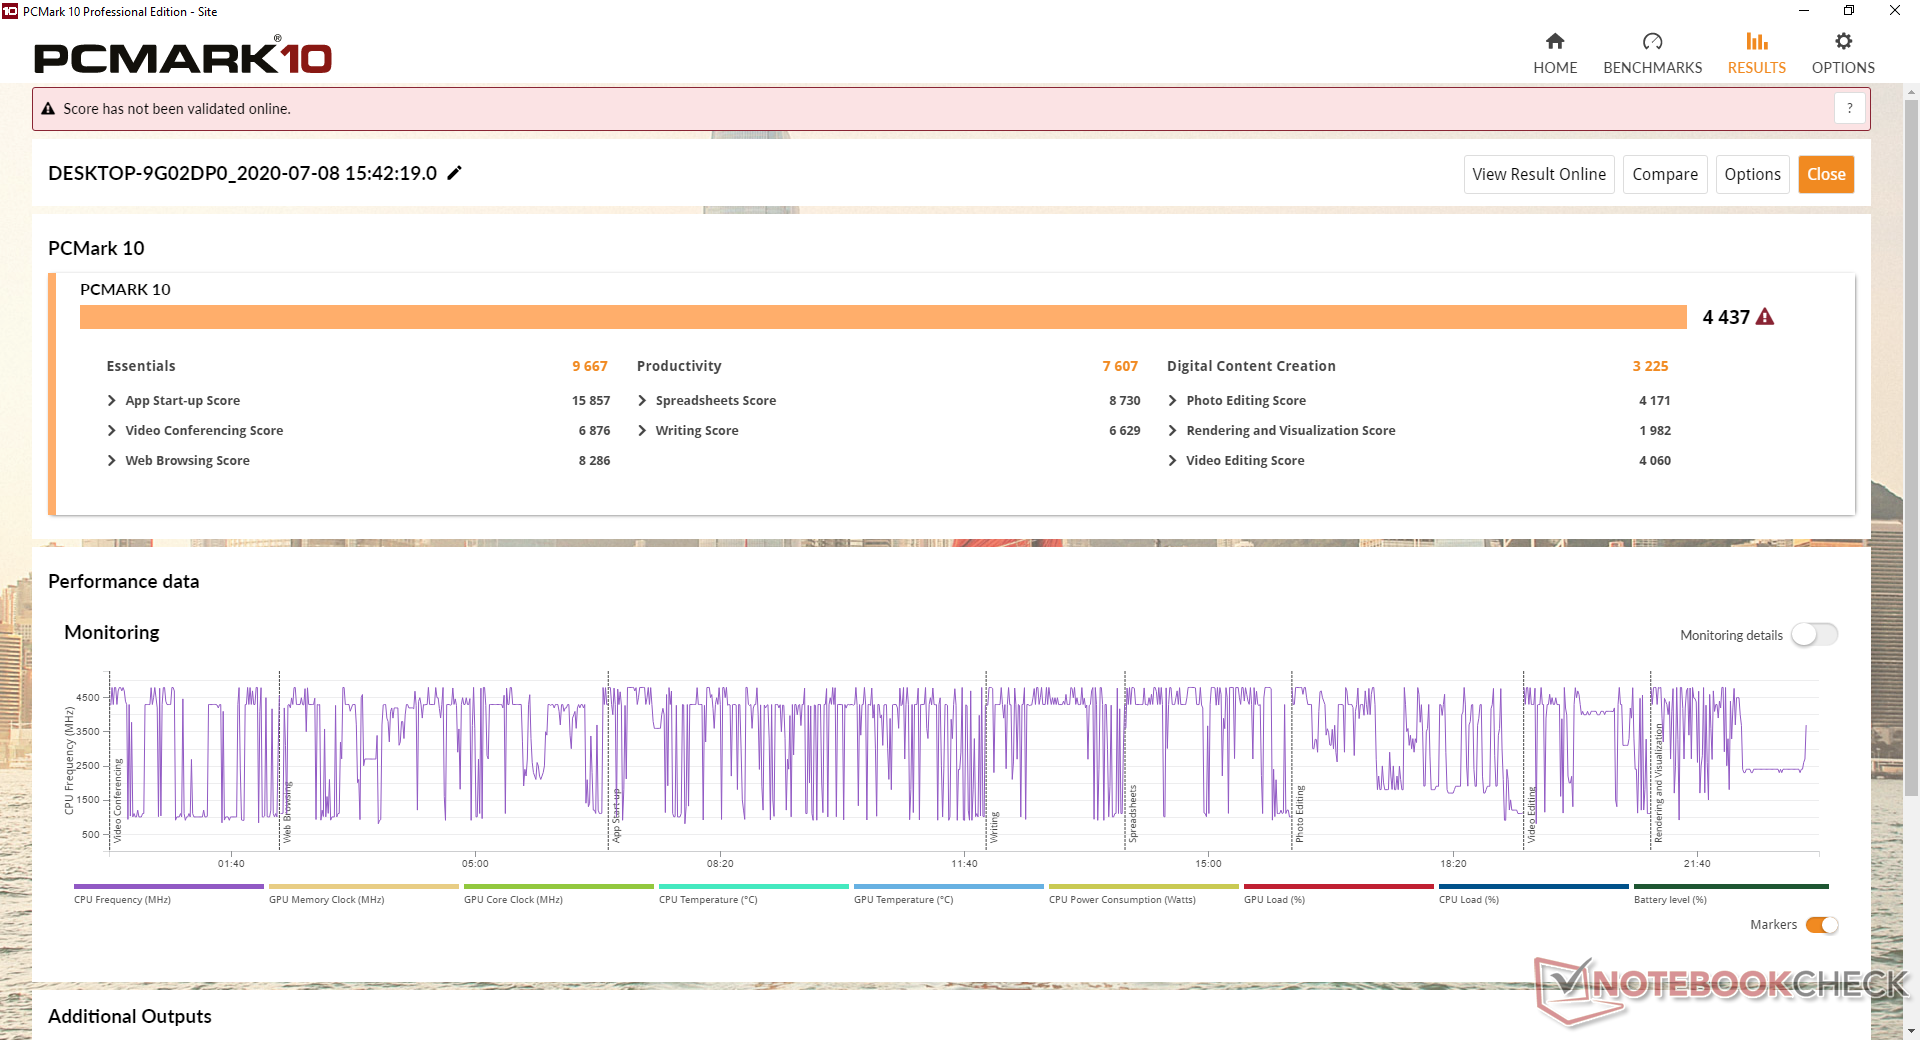
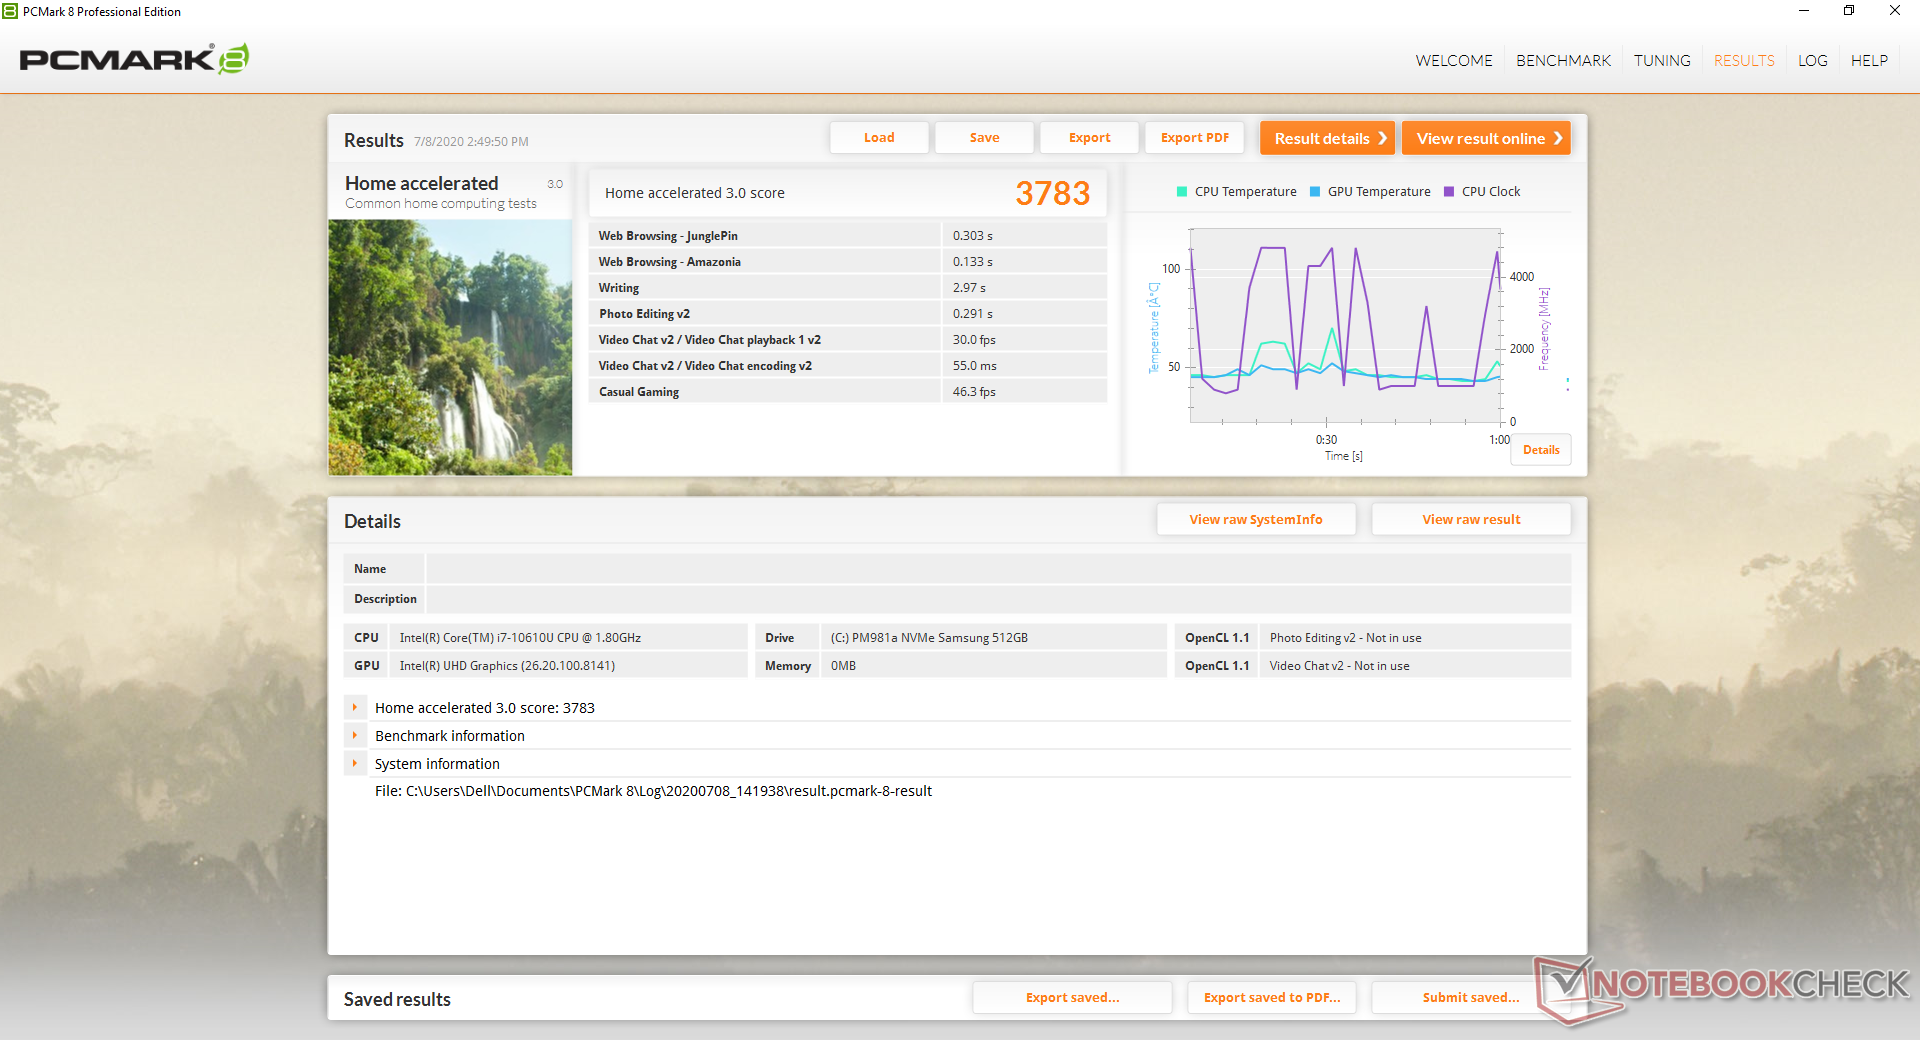
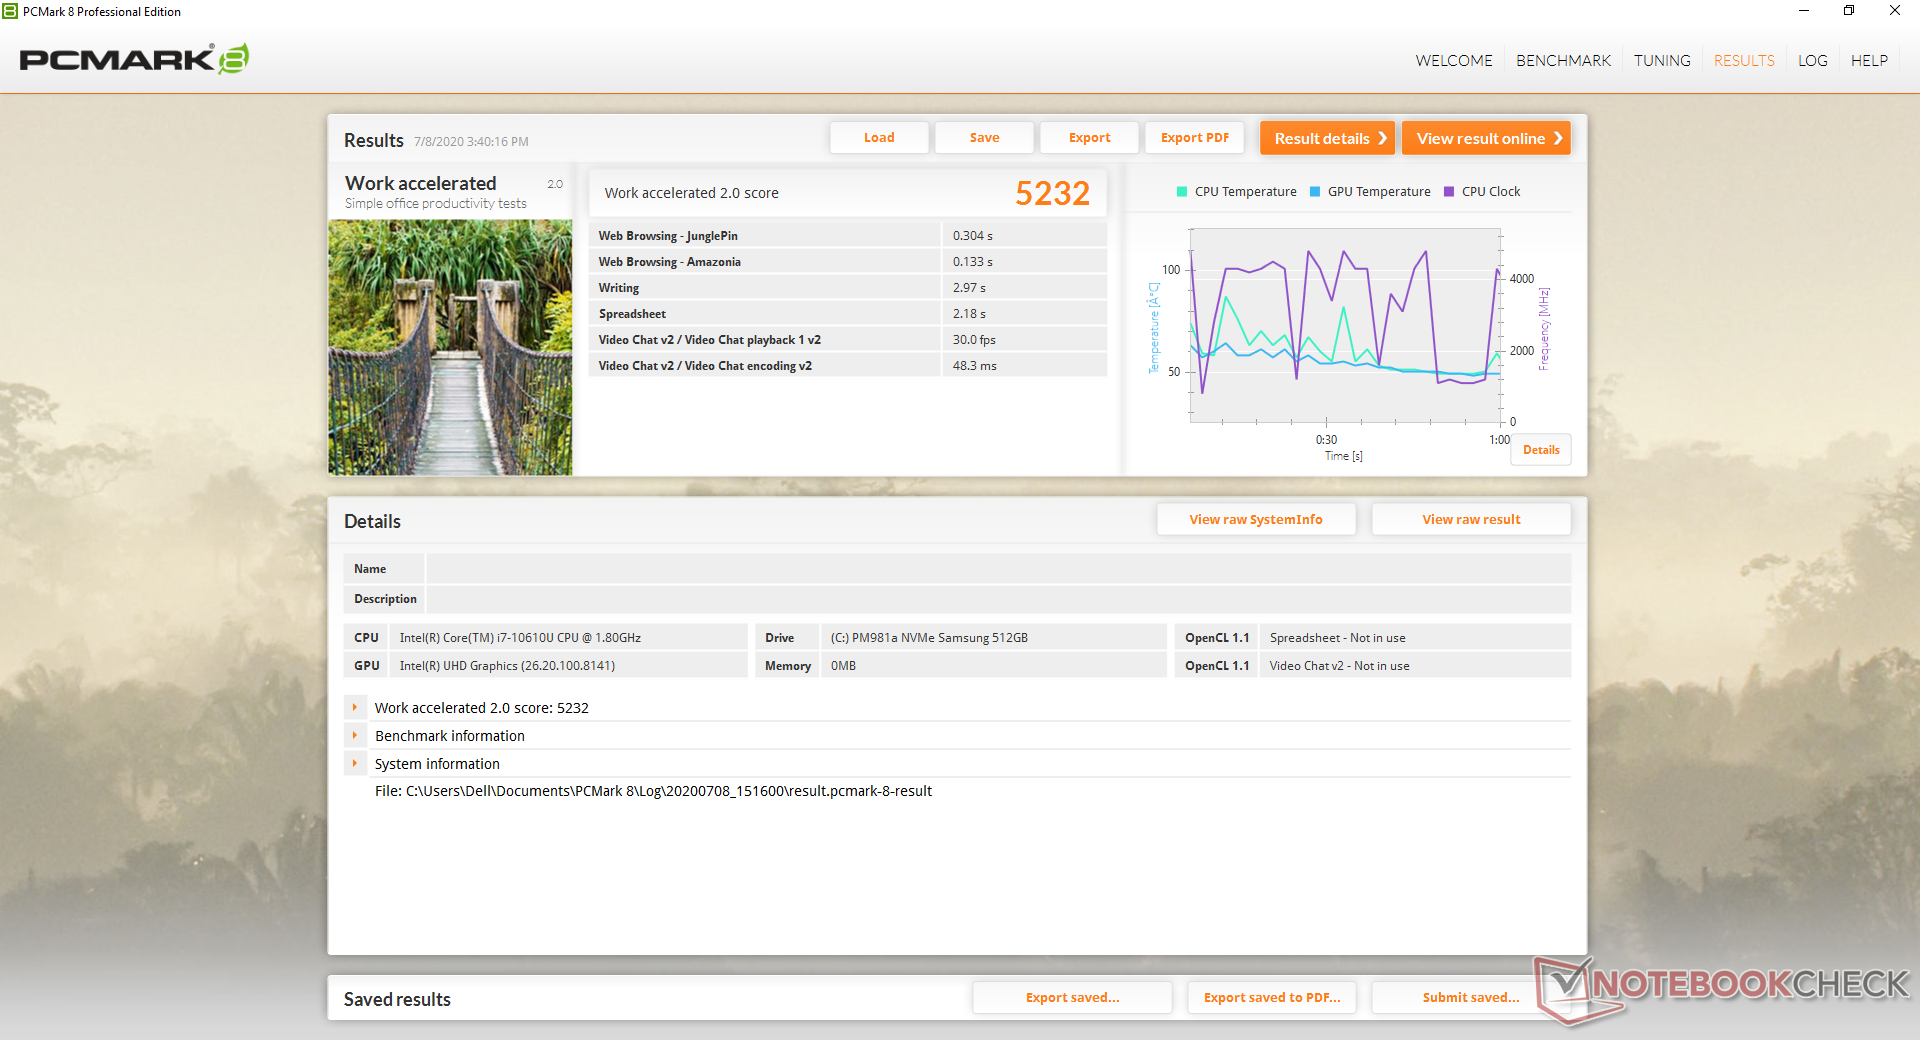
PCMark sonuçları, diğer Lateks 7310 ile geçen yılki Latitude 7300 arasındaki farkın neredeyse aynı olması için diğer birçok ULV 13.3 inçlik dizüstü bilgisayarlardan sürekli olarak daha yüksektir. Ünite ile geçirdiğimiz süre boyunca herhangi bir yazılım sorunu yaşamadık, ancak ayarları doğrudan sistem performansını ve davranışını etkilediğinden, önceden yüklenmiş Dell Optimizer, Güncelleme, Güç Yöneticisi ve Dijital Teslimat uygulamalarına aşina olmanızı öneririz. Örneğin, benzersiz yakınlık sensörü yalnızca Optimizer üzerinden değiştirilebilir.
| PCMark 10 | |
| Score | |
| Dell Latitude 7310 | |
| Ortalama Intel Core i7-10610U, Intel UHD Graphics 620 (4120 - 4437, n=4) | |
| Dell Latitude 7300-P99G | |
| Lenovo ThinkPad X395 | |
| HP EliteBook 735 G6 7KN29EA | |
| Apple MacBook Pro 13 2020 2GHz i5 10th-Gen | |
| Essentials | |
| Dell Latitude 7310 | |
| Dell Latitude 7300-P99G | |
| Ortalama Intel Core i7-10610U, Intel UHD Graphics 620 (8541 - 9667, n=4) | |
| Apple MacBook Pro 13 2020 2GHz i5 10th-Gen | |
| Lenovo ThinkPad X395 | |
| HP EliteBook 735 G6 7KN29EA | |
| Productivity | |
| Dell Latitude 7310 | |
| Ortalama Intel Core i7-10610U, Intel UHD Graphics 620 (6710 - 7607, n=4) | |
| Dell Latitude 7300-P99G | |
| Lenovo ThinkPad X395 | |
| HP EliteBook 735 G6 7KN29EA | |
| Apple MacBook Pro 13 2020 2GHz i5 10th-Gen | |
| Digital Content Creation | |
| Ortalama Intel Core i7-10610U, Intel UHD Graphics 620 (3156 - 3344, n=4) | |
| Apple MacBook Pro 13 2020 2GHz i5 10th-Gen | |
| Dell Latitude 7310 | |
| Lenovo ThinkPad X395 | |
| HP EliteBook 735 G6 7KN29EA | |
| Dell Latitude 7300-P99G | |
| PCMark 8 | |
| Home Score Accelerated v2 | |
| Dell Latitude 7300-P99G | |
| Apple MacBook Pro 13 2020 2GHz i5 10th-Gen | |
| Dell Latitude 7310 | |
| Ortalama Intel Core i7-10610U, Intel UHD Graphics 620 (3334 - 3783, n=4) | |
| HP EliteBook 735 G6 7KN29EA | |
| Lenovo ThinkPad X395 | |
| Work Score Accelerated v2 | |
| Dell Latitude 7310 | |
| Dell Latitude 7300-P99G | |
| Ortalama Intel Core i7-10610U, Intel UHD Graphics 620 (4528 - 5232, n=4) | |
| HP EliteBook 735 G6 7KN29EA | |
| Lenovo ThinkPad X395 | |
| Apple MacBook Pro 13 2020 2GHz i5 10th-Gen | |
| PCMark 8 Home Score Accelerated v2 | 3783 puan | |
| PCMark 8 Work Score Accelerated v2 | 5232 puan | |
| PCMark 10 Score | 4437 puan | |
Yardım | ||
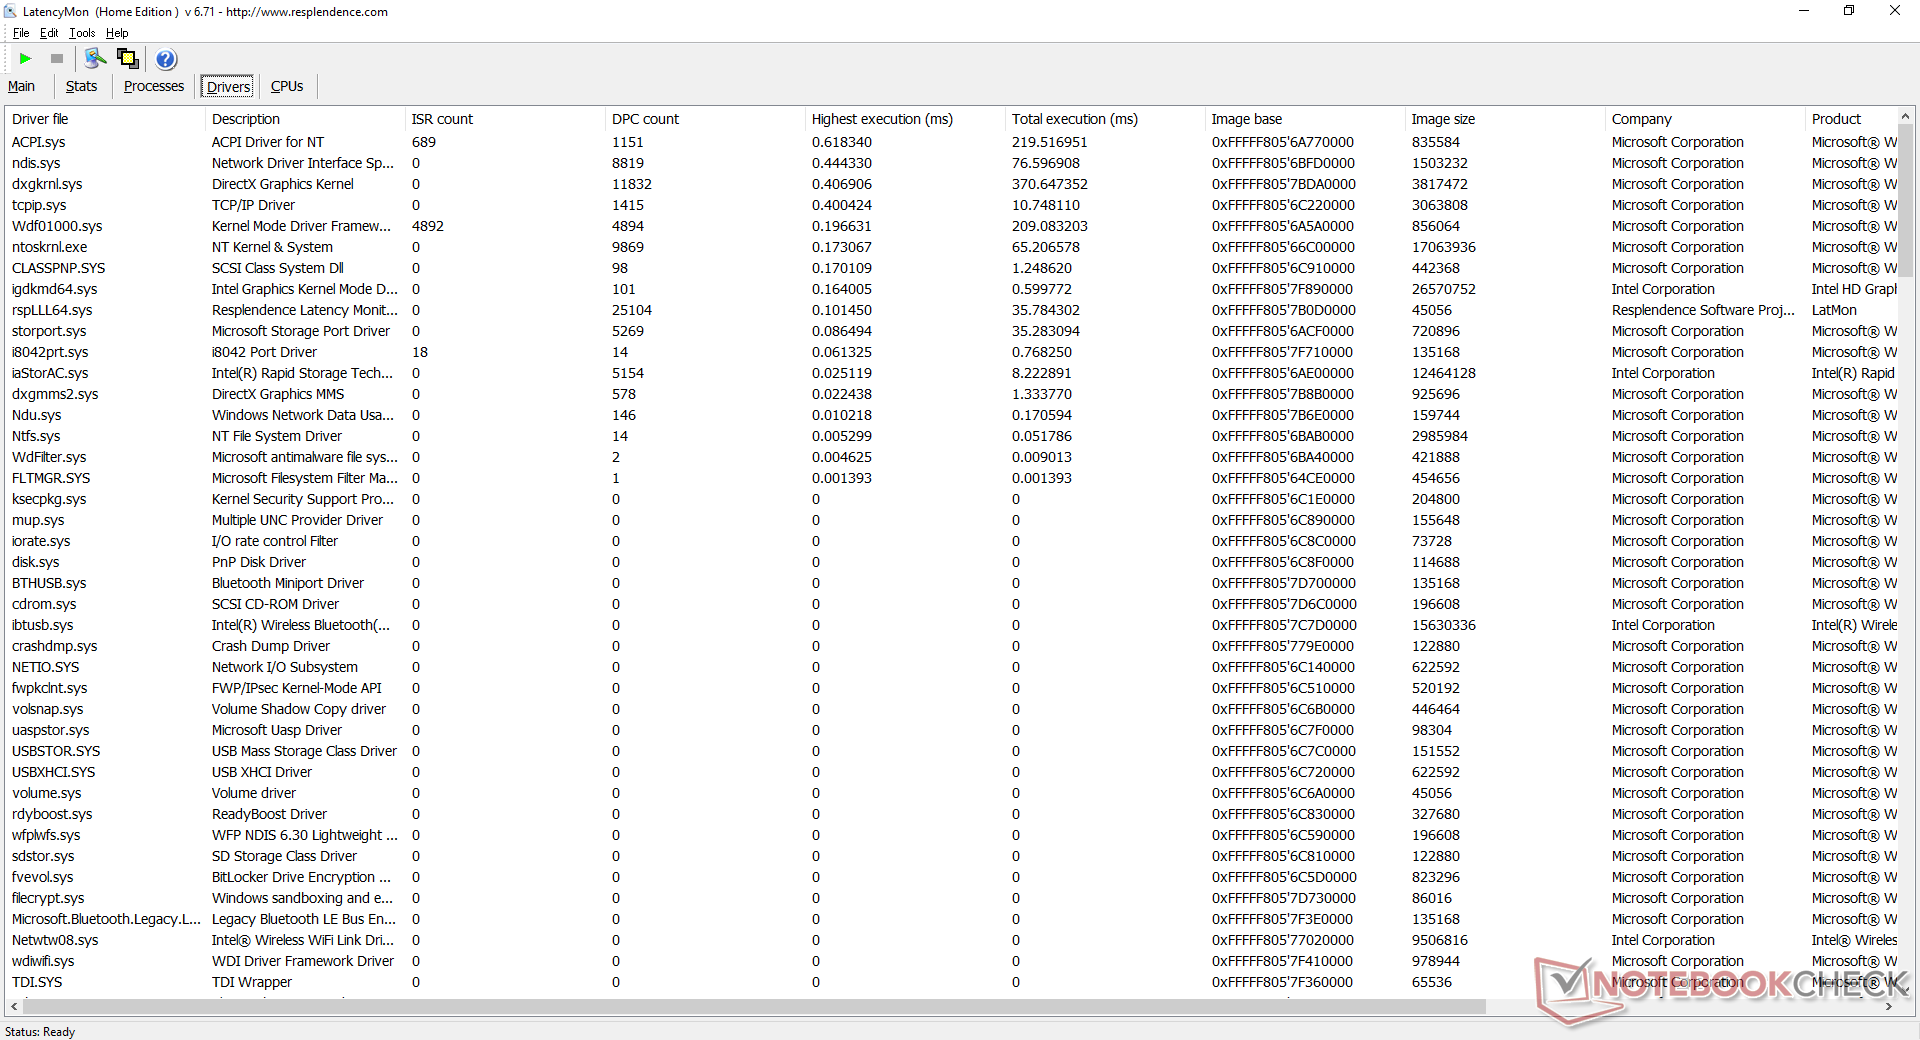
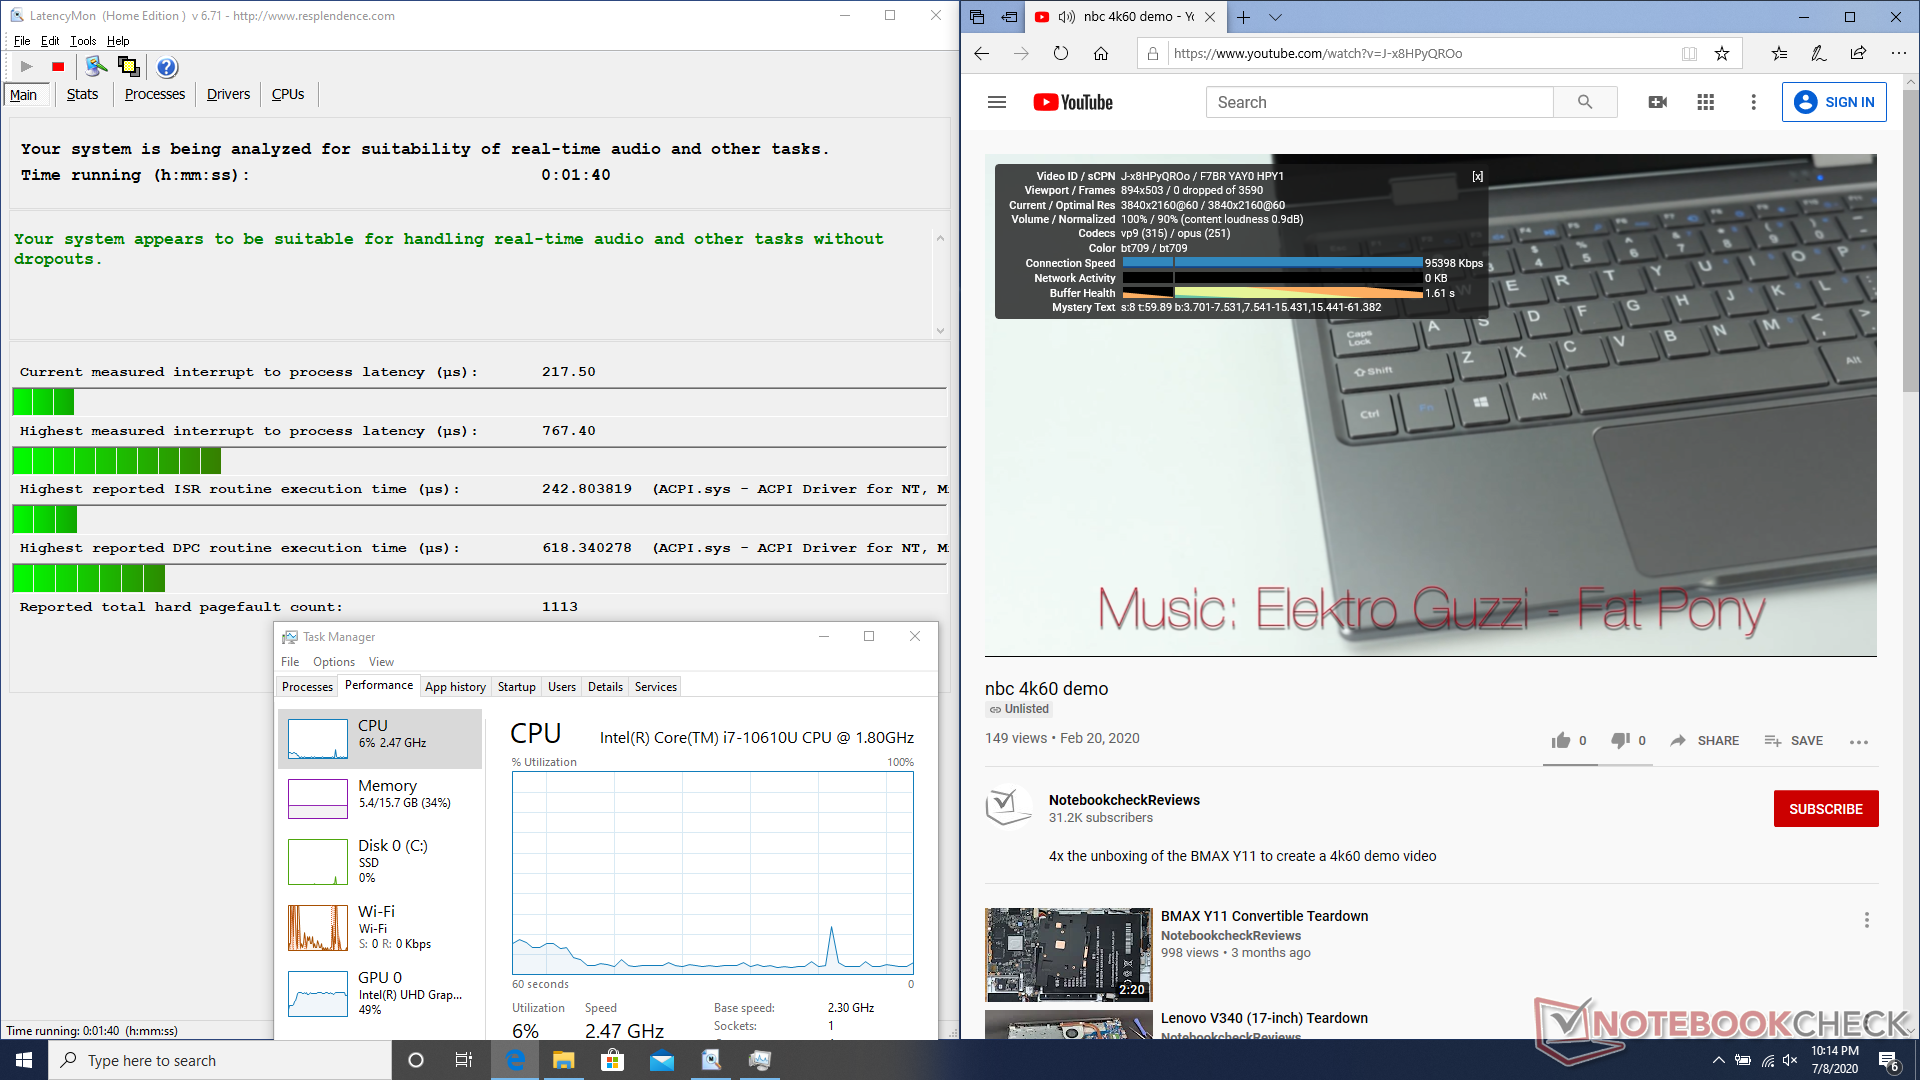
DPC Gecikmesi
LatencyMon, ana sayfamızda birden çok tarayıcı sekmesi açarken DPC gecikme sorunu göstermez. YouTube'da 4K video oynatımı da bildirilen herhangi bir atlanmış kare yok.
| DPC Latencies / LatencyMon - interrupt to process latency (max), Web, Youtube, Prime95 | |
| Dell XPS 13 9300 4K UHD | |
| HP EliteBook 735 G6 7KN29EA | |
| Dell XPS 13 9300 i5 FHD | |
| HP Envy x360 13-ay0010nr | |
| HP ProBook 455 G7-175W8EA | |
| Acer Swift 3 SF314-42-R27B | |
| Dell Latitude 7410 | |
| Dell Latitude 7310 | |
* ... daha küçük daha iyidir
Storage Devices
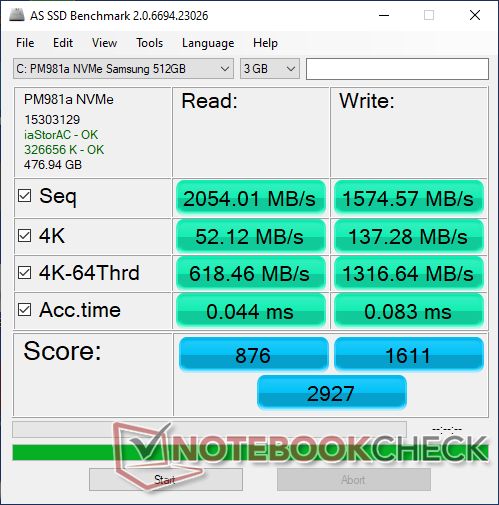
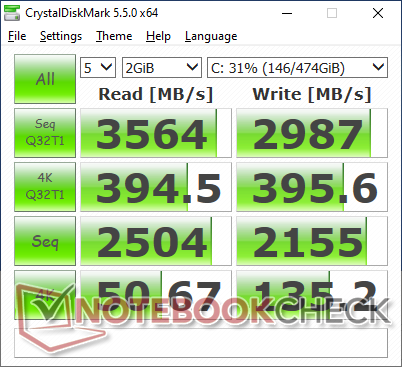
Whereas our 2019 Latitude 7300 came with a fast 512 GB Samsung PM981 NVMe SSD, our Latitude 7310 comes with an even faster 512 GB Samsung PM981a for higher theoretical sequential read (3500 MB/s vs. 3000 MB/s) and write rates (2900 MB/s vs. 1800 MB/s). In practice, however, you're not likely going to notice any real-world performance advantages between a Samsung PM981 or PM981a when running light loads that this particular office laptop is designed for.
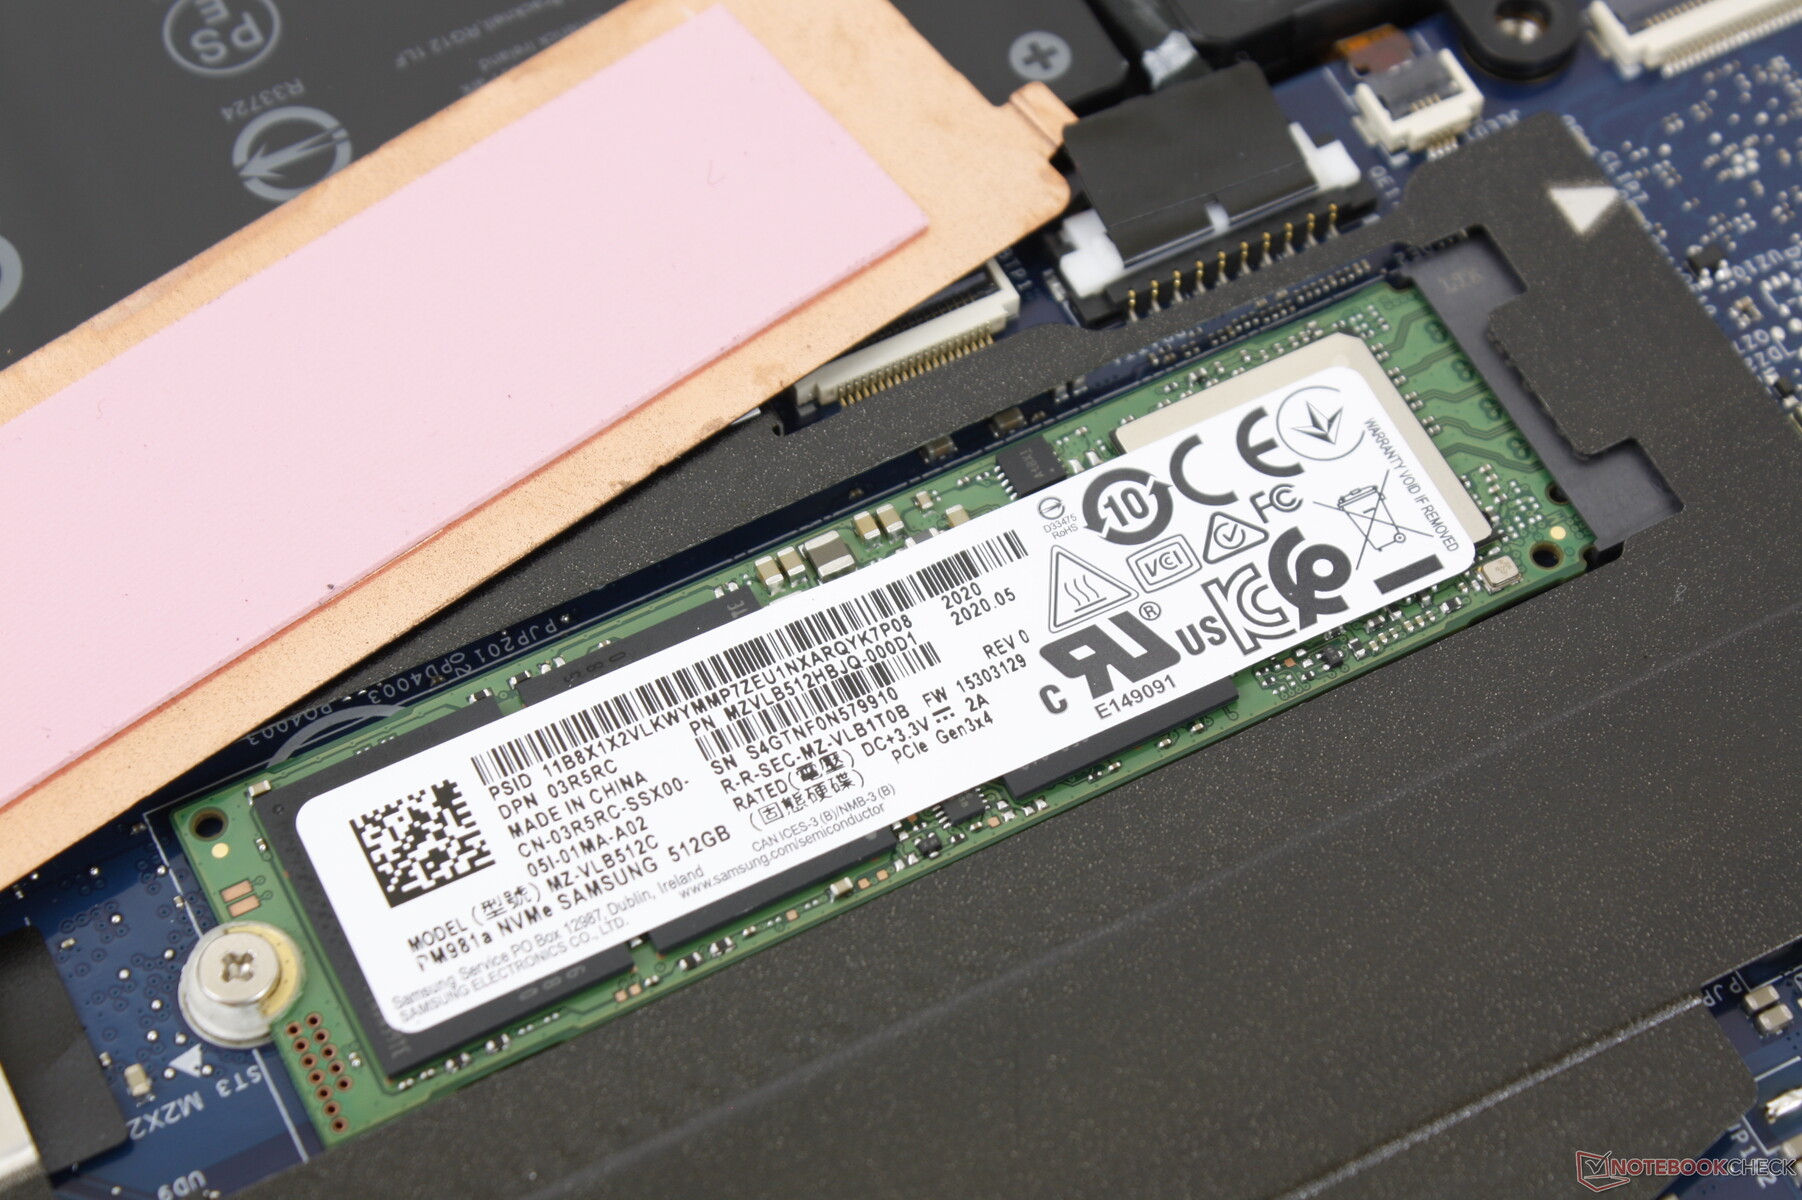
| Dell Latitude 7310 Samsung SSD PM981a MZVLB512HBJQ | Dell Latitude 7300-P99G Samsung SSD PM981 MZVLB512HAJQ | Asus ZenBook S13 UX392FN WDC PC SN520 SDAPNUW-512G | HP EliteBook 735 G6 7KN29EA WDC PC SN520 SDAPNUW-256G | Apple MacBook Pro 13 2020 2GHz i5 10th-Gen Apple SSD SM0512F | |
|---|---|---|---|---|---|
| AS SSD | 21% | -4% | -53% | -70% | |
| Seq Read (MB/s) | 2054 | 2749 34% | 1224 -40% | 1499 -27% | 1300 -37% |
| Seq Write (MB/s) | 1575 | 1367 -13% | 907 -42% | 1172 -26% | 1518 -4% |
| 4K Read (MB/s) | 52.1 | 49.94 -4% | 41.46 -20% | 35.42 -32% | 14.09 -73% |
| 4K Write (MB/s) | 137.3 | 137.6 0% | 126.2 -8% | 77.2 -44% | 24.25 -82% |
| 4K-64 Read (MB/s) | 618 | 987 60% | 1021 65% | 463.6 -25% | 725 17% |
| 4K-64 Write (MB/s) | 1317 | 1465 11% | 1251 -5% | 413.3 -69% | 169.6 -87% |
| Access Time Read * (ms) | 0.044 | 0.042 5% | 0.053 -20% | 0.133 -202% | 0.172 -291% |
| Access Time Write * (ms) | 0.083 | 0.029 65% | 0.027 67% | 0.049 41% | 0.155 -87% |
| Score Read (Points) | 876 | 1312 50% | 1185 35% | 649 -26% | 869 -1% |
| Score Write (Points) | 1611 | 1739 8% | 1468 -9% | 608 -62% | 346 -79% |
| Score Total (Points) | 2927 | 3662 25% | 3250 11% | 1582 -46% | 1667 -43% |
| Copy ISO MB/s (MB/s) | 2297 | 2761 20% | 1404 -39% | 1249 -46% | |
| Copy Program MB/s (MB/s) | 540 | 622 15% | 402.4 -25% | 53.5 -90% | |
| Copy Game MB/s (MB/s) | 1288 | 1584 23% | 902 -30% | 201.3 -84% | |
| CrystalDiskMark 5.2 / 6 | 2% | -14% | -41% | -38% | |
| Write 4K (MB/s) | 135.2 | 141.1 4% | 149.2 10% | 116 -14% | 28.16 -79% |
| Read 4K (MB/s) | 50.7 | 46.37 -9% | 47.18 -7% | 39.81 -21% | 17.5 -65% |
| Write Seq (MB/s) | 2155 | 1994 -7% | 750 -65% | 1300 -40% | 1195 -45% |
| Read Seq (MB/s) | 2504 | 2275 -9% | 1137 -55% | 803 -68% | 1470 -41% |
| Write 4K Q32T1 (MB/s) | 395.6 | 493.3 25% | 749 89% | 187.6 -53% | 205 -48% |
| Read 4K Q32T1 (MB/s) | 394.5 | 429 9% | 478.7 21% | 305.9 -22% | 692 75% |
| Write Seq Q32T1 (MB/s) | 2987 | 2992 0% | 1453 -51% | 1299 -57% | 1475 -51% |
| Read Seq Q32T1 (MB/s) | 3564 | 3562 0% | 1713 -52% | 1741 -51% | 1920 -46% |
| Write 4K Q8T8 (MB/s) | 409.1 | ||||
| Read 4K Q8T8 (MB/s) | 1137 | ||||
| Toplam Ortalama (Program / Ayarlar) | 12% /
14% | -9% /
-8% | -47% /
-48% | -54% /
-56% |
* ... daha küçük daha iyidir

Disk Throttling: DiskSpd Read Loop, Queue Depth 8
GPU Performance
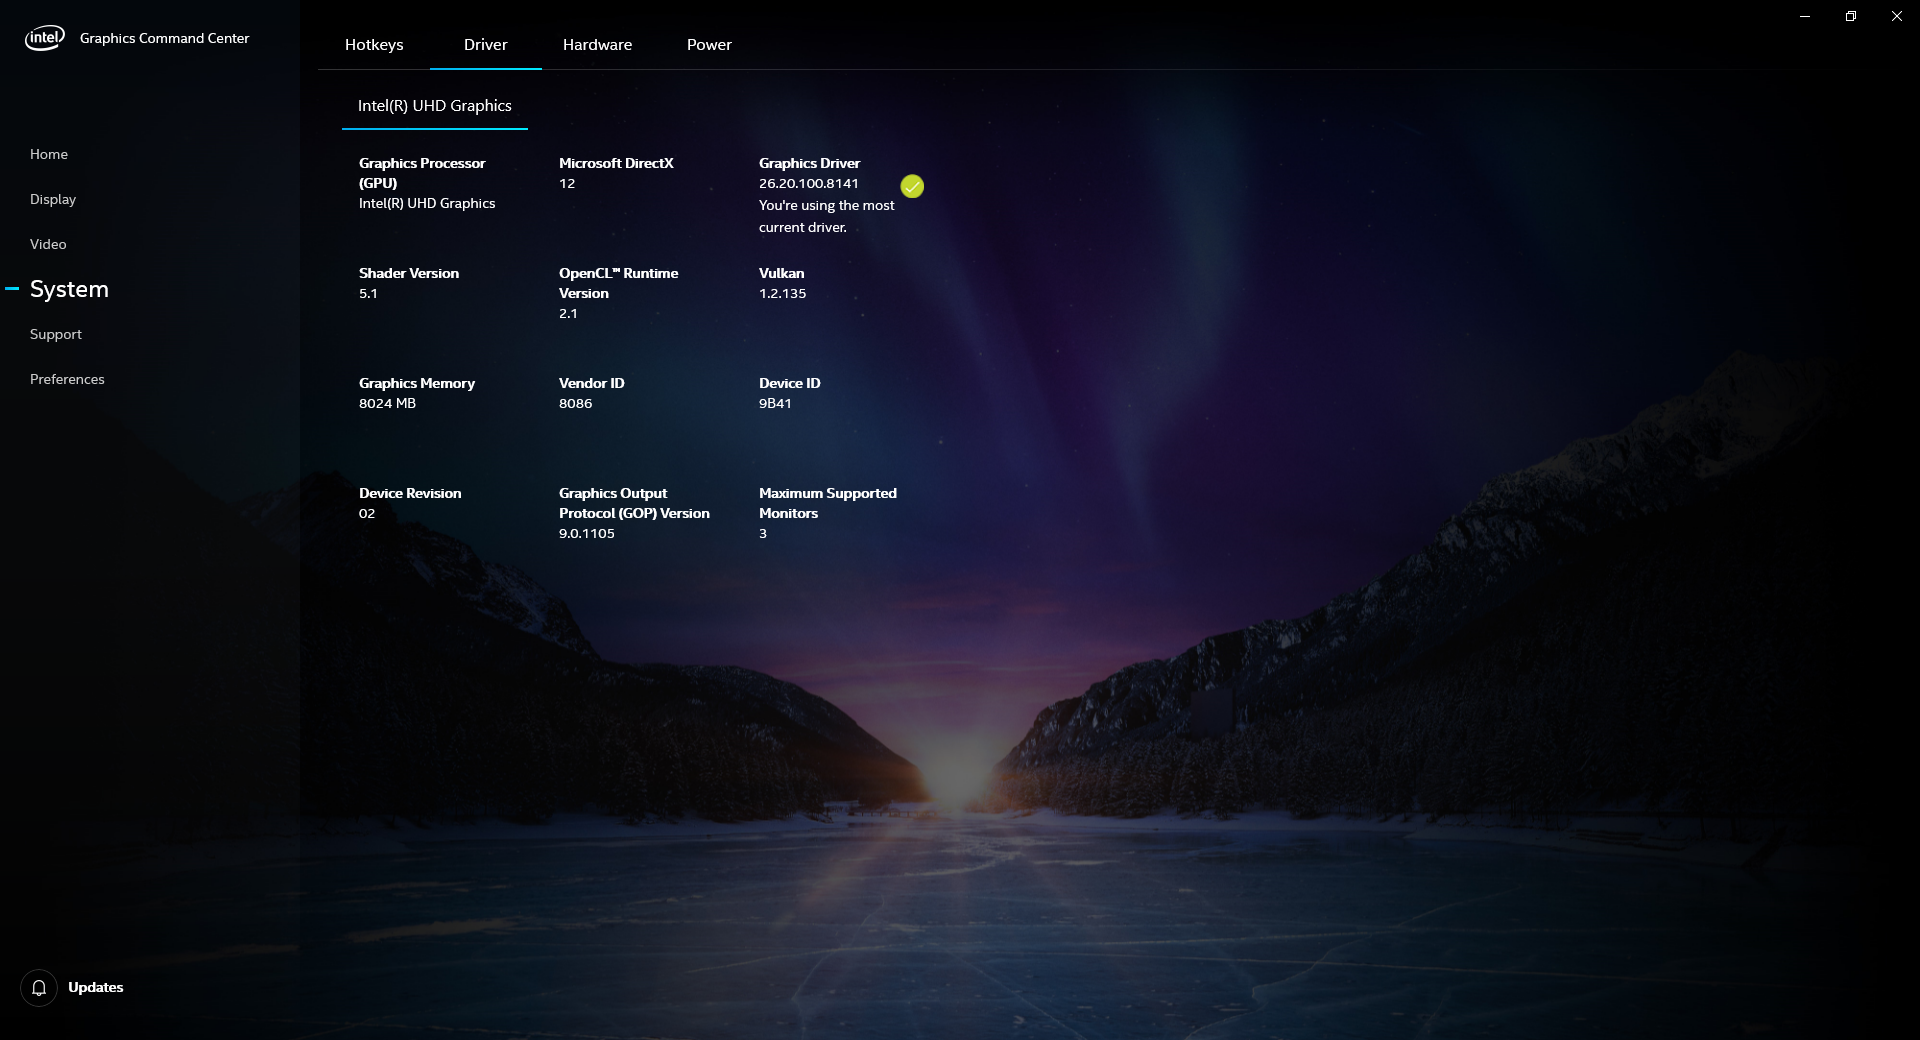
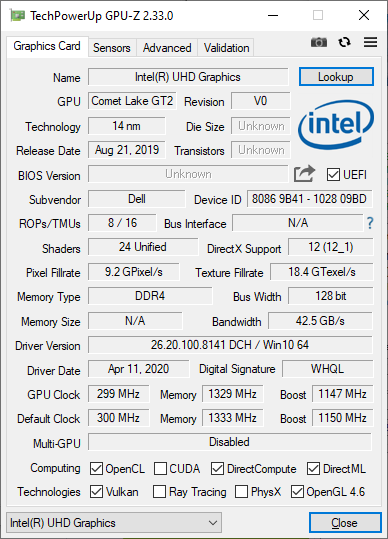
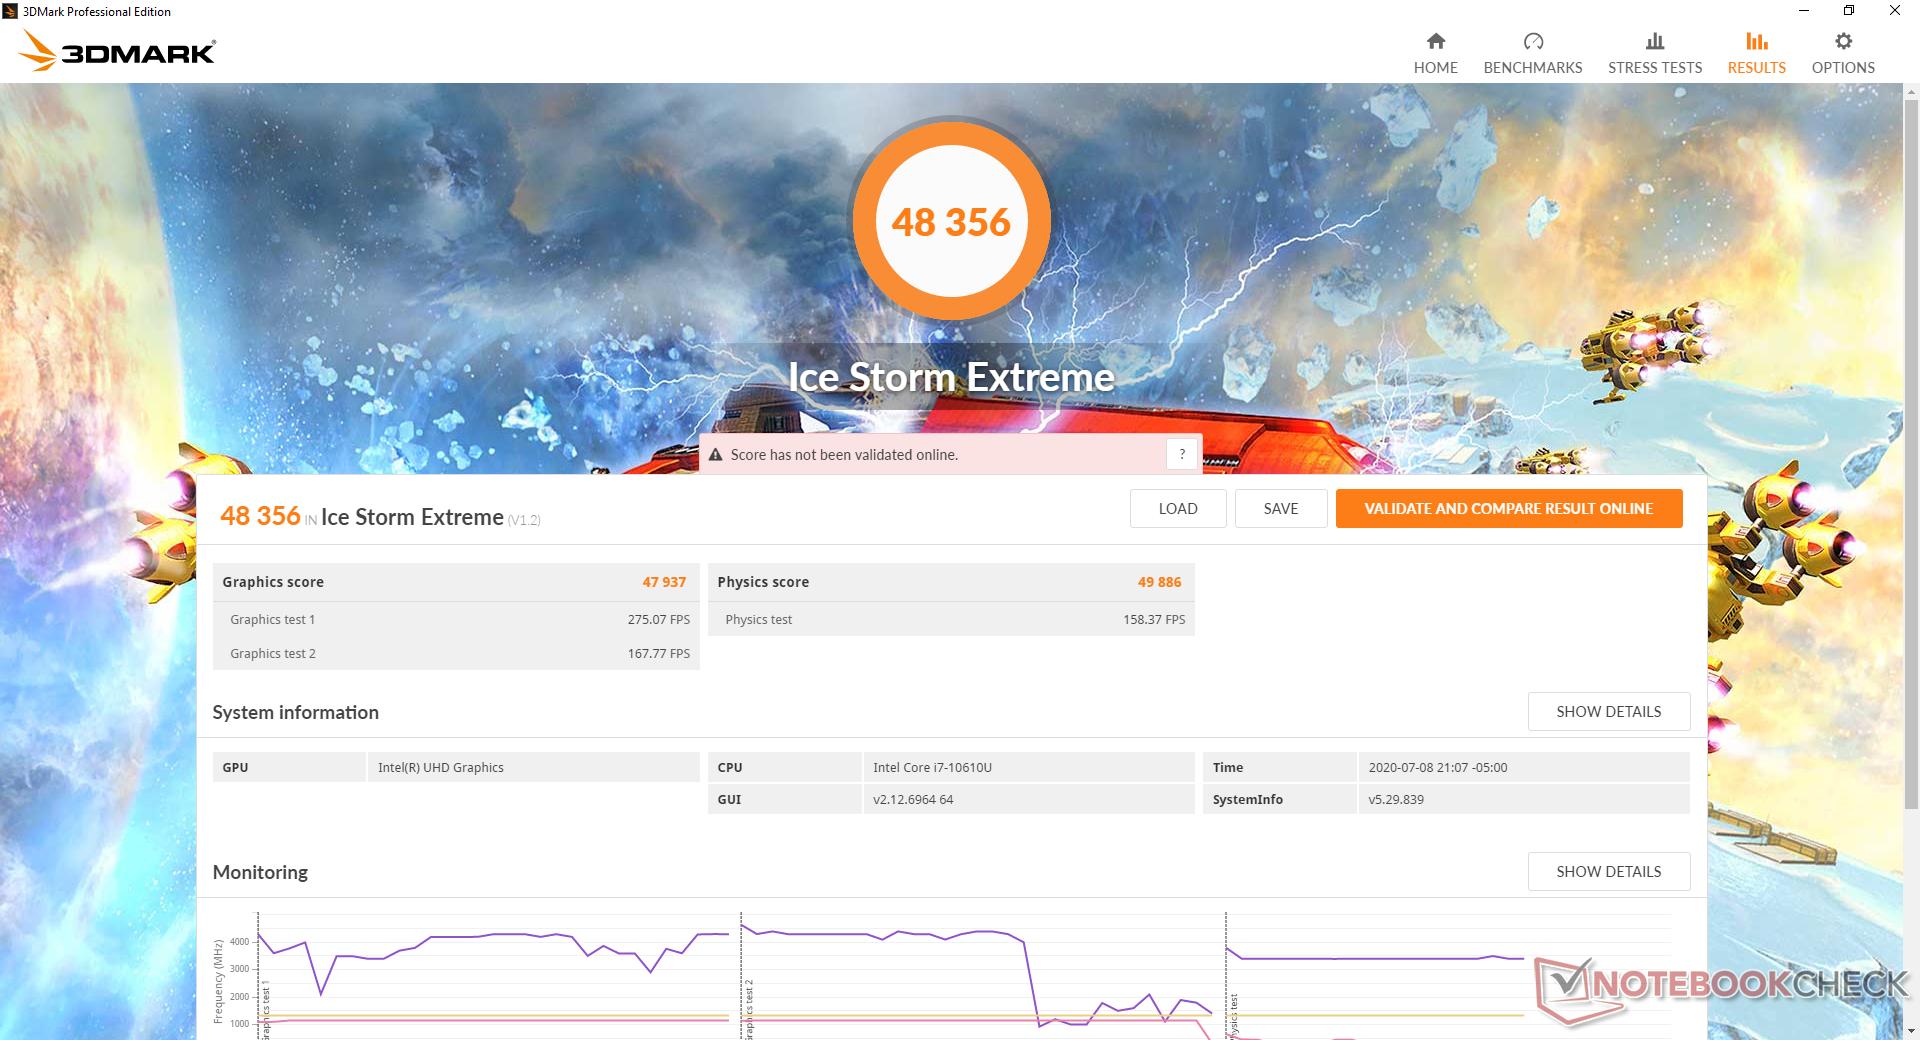
The integrated UHD Graphics 620 is nothing special as it's the same GPU we've been seeing for years. Its meager performance shouldn't be an issue for the target audience where workloads are less likely to be heavy on graphics, but it's also a shame that there are no Iris, GeForce MX, or RX Vega options which would have boosted GPU performance significantly. Lenovo, for example, recently launched a handful of faster ThinkPad systems all sporting AMD's latest processors with vPro-like features.
See our dedicated page on the UHD Graphics 620 for more technical information and benchmarks.
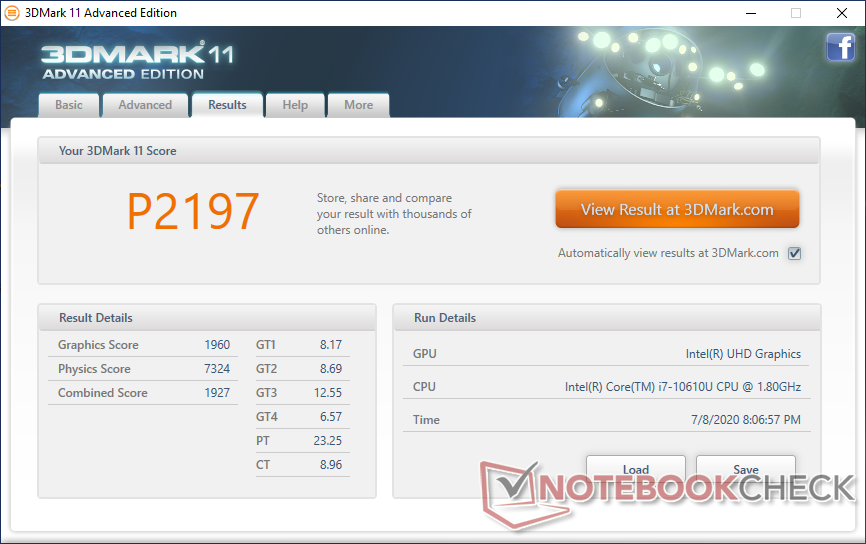
| 3DMark 11 Performance | 2197 puan | |
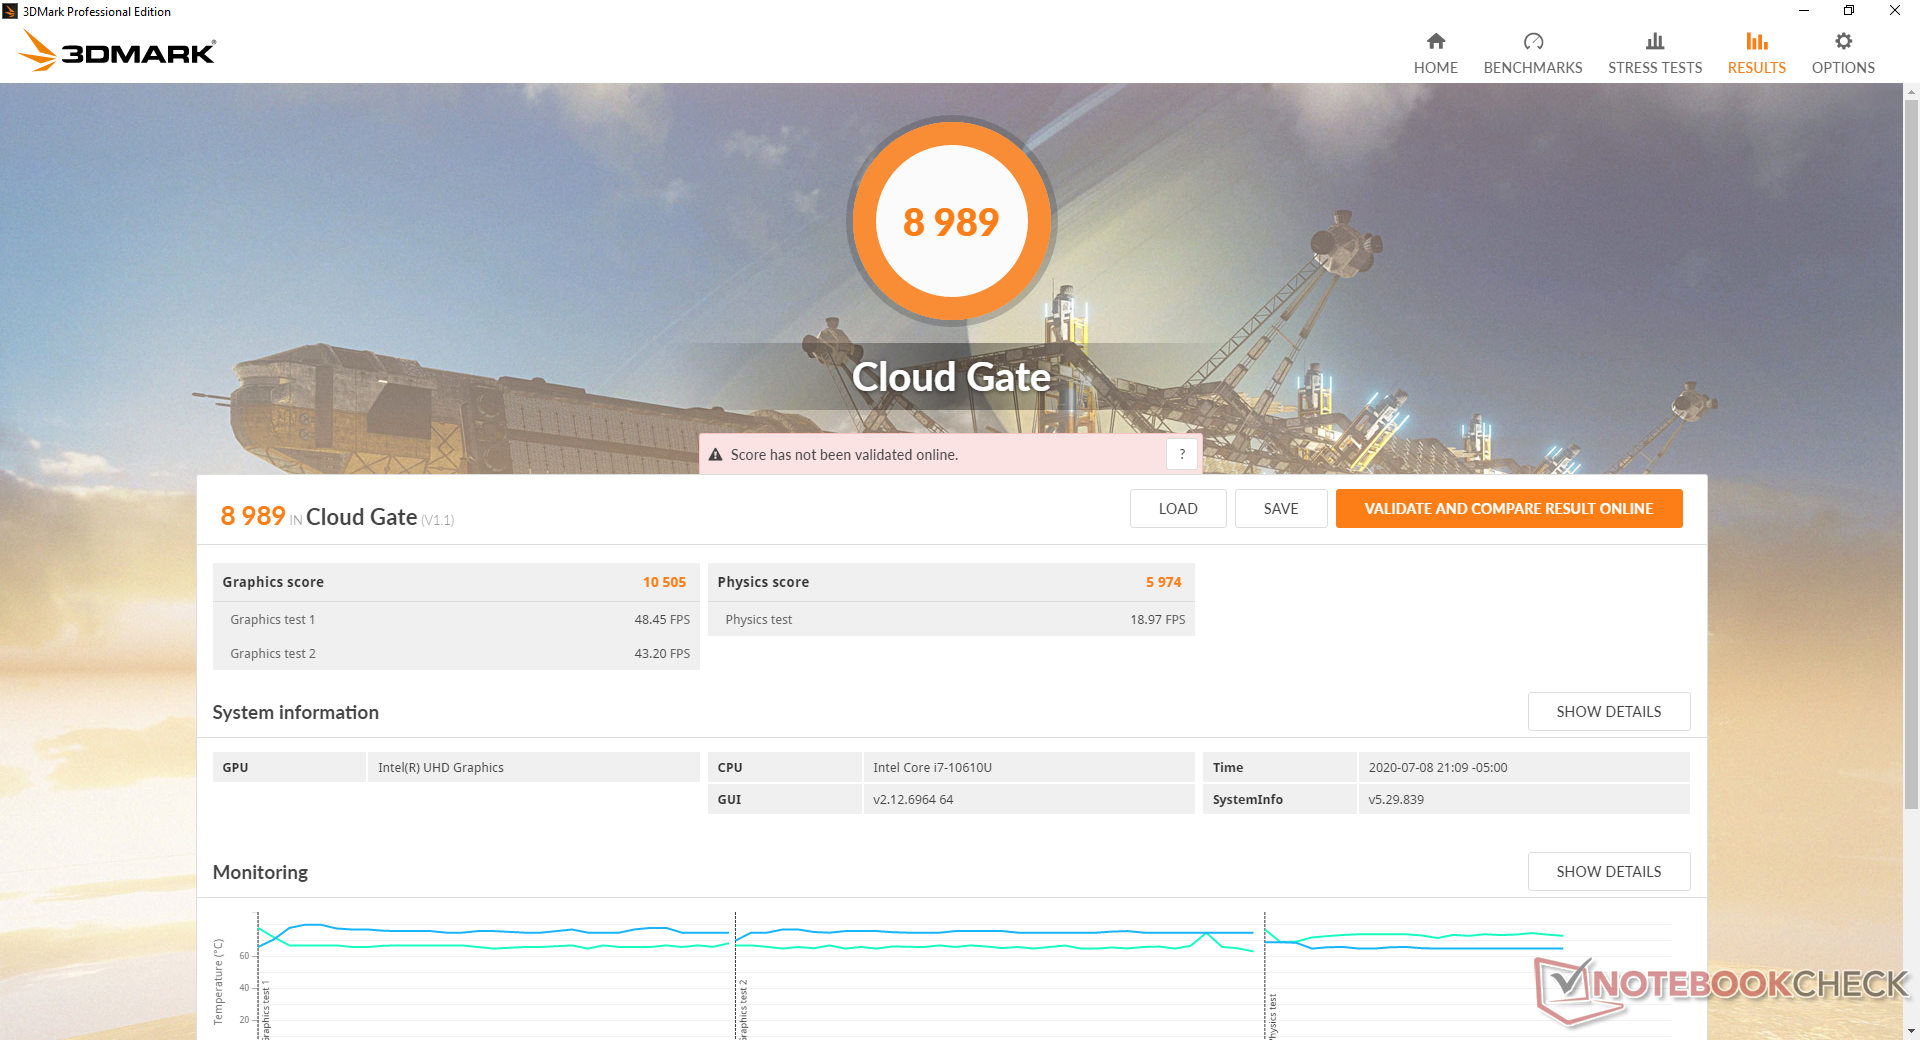
| 3DMark Cloud Gate Standard Score | 8989 puan | |
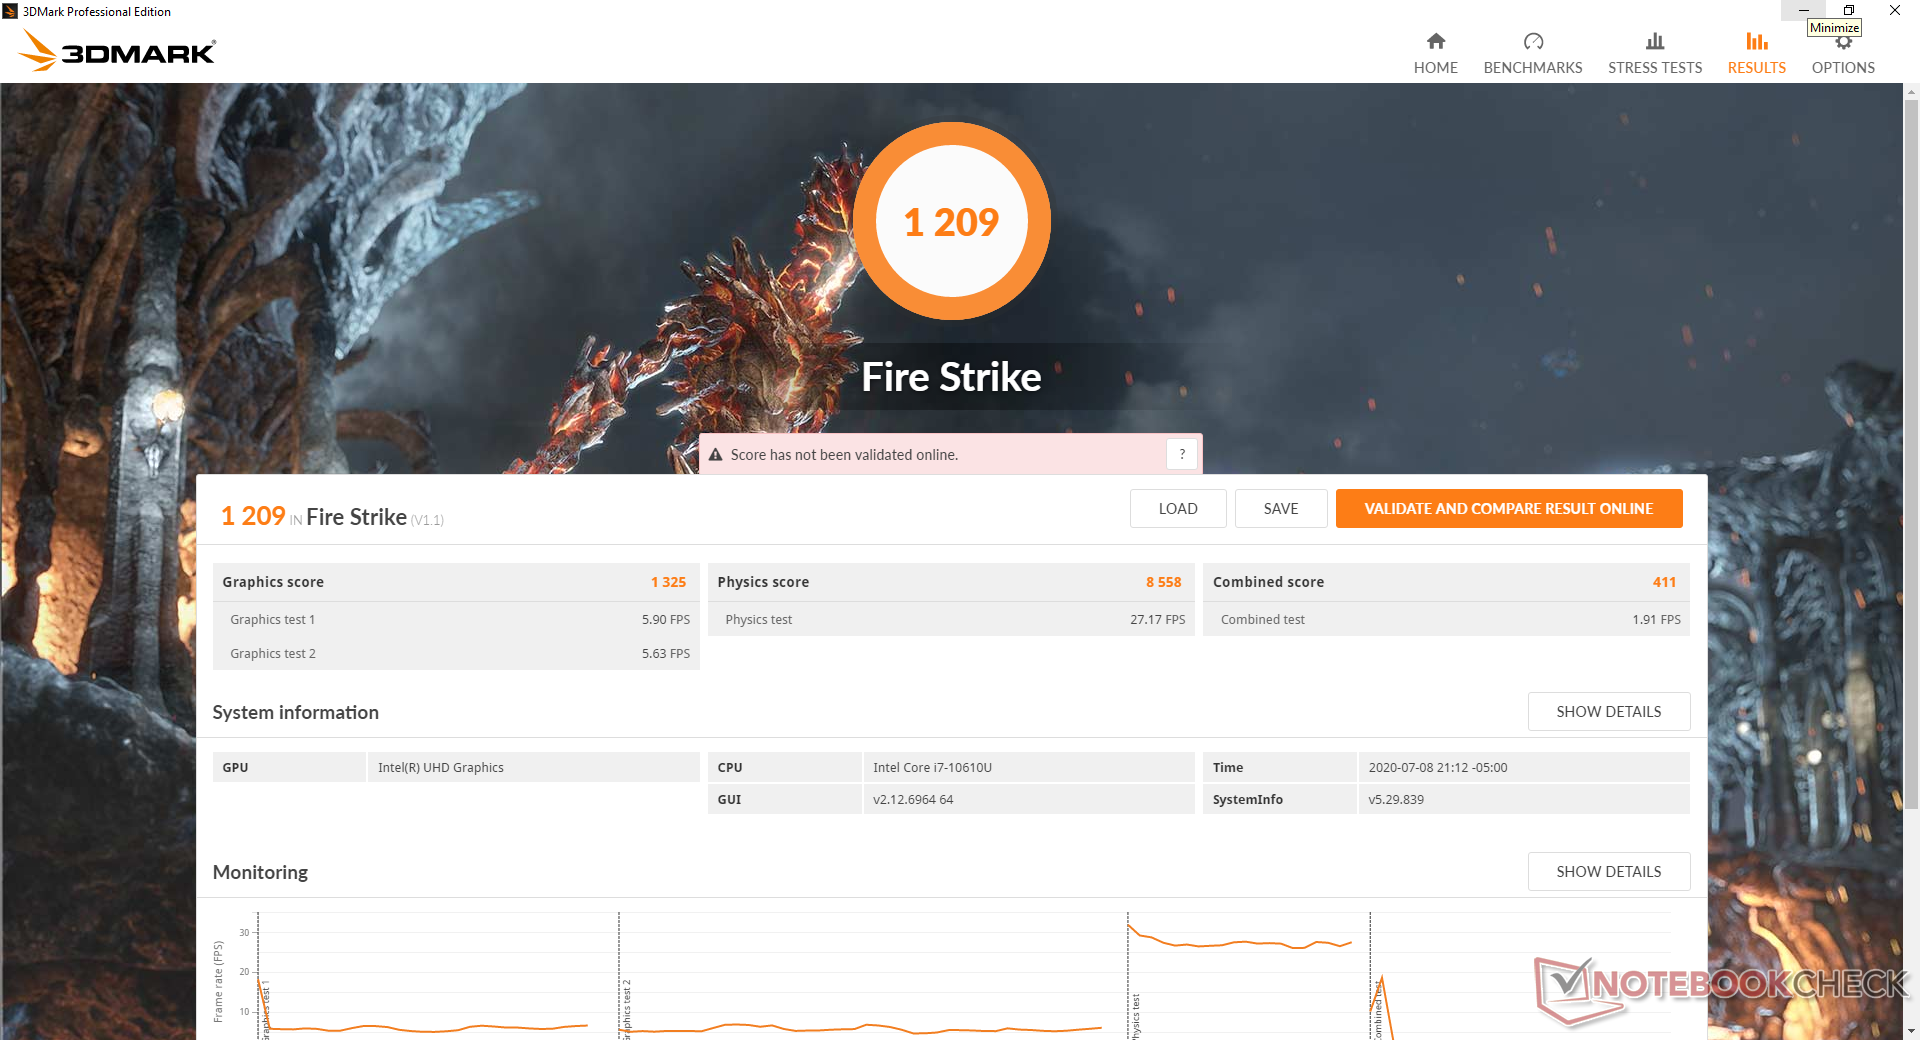
| 3DMark Fire Strike Score | 1209 puan | |
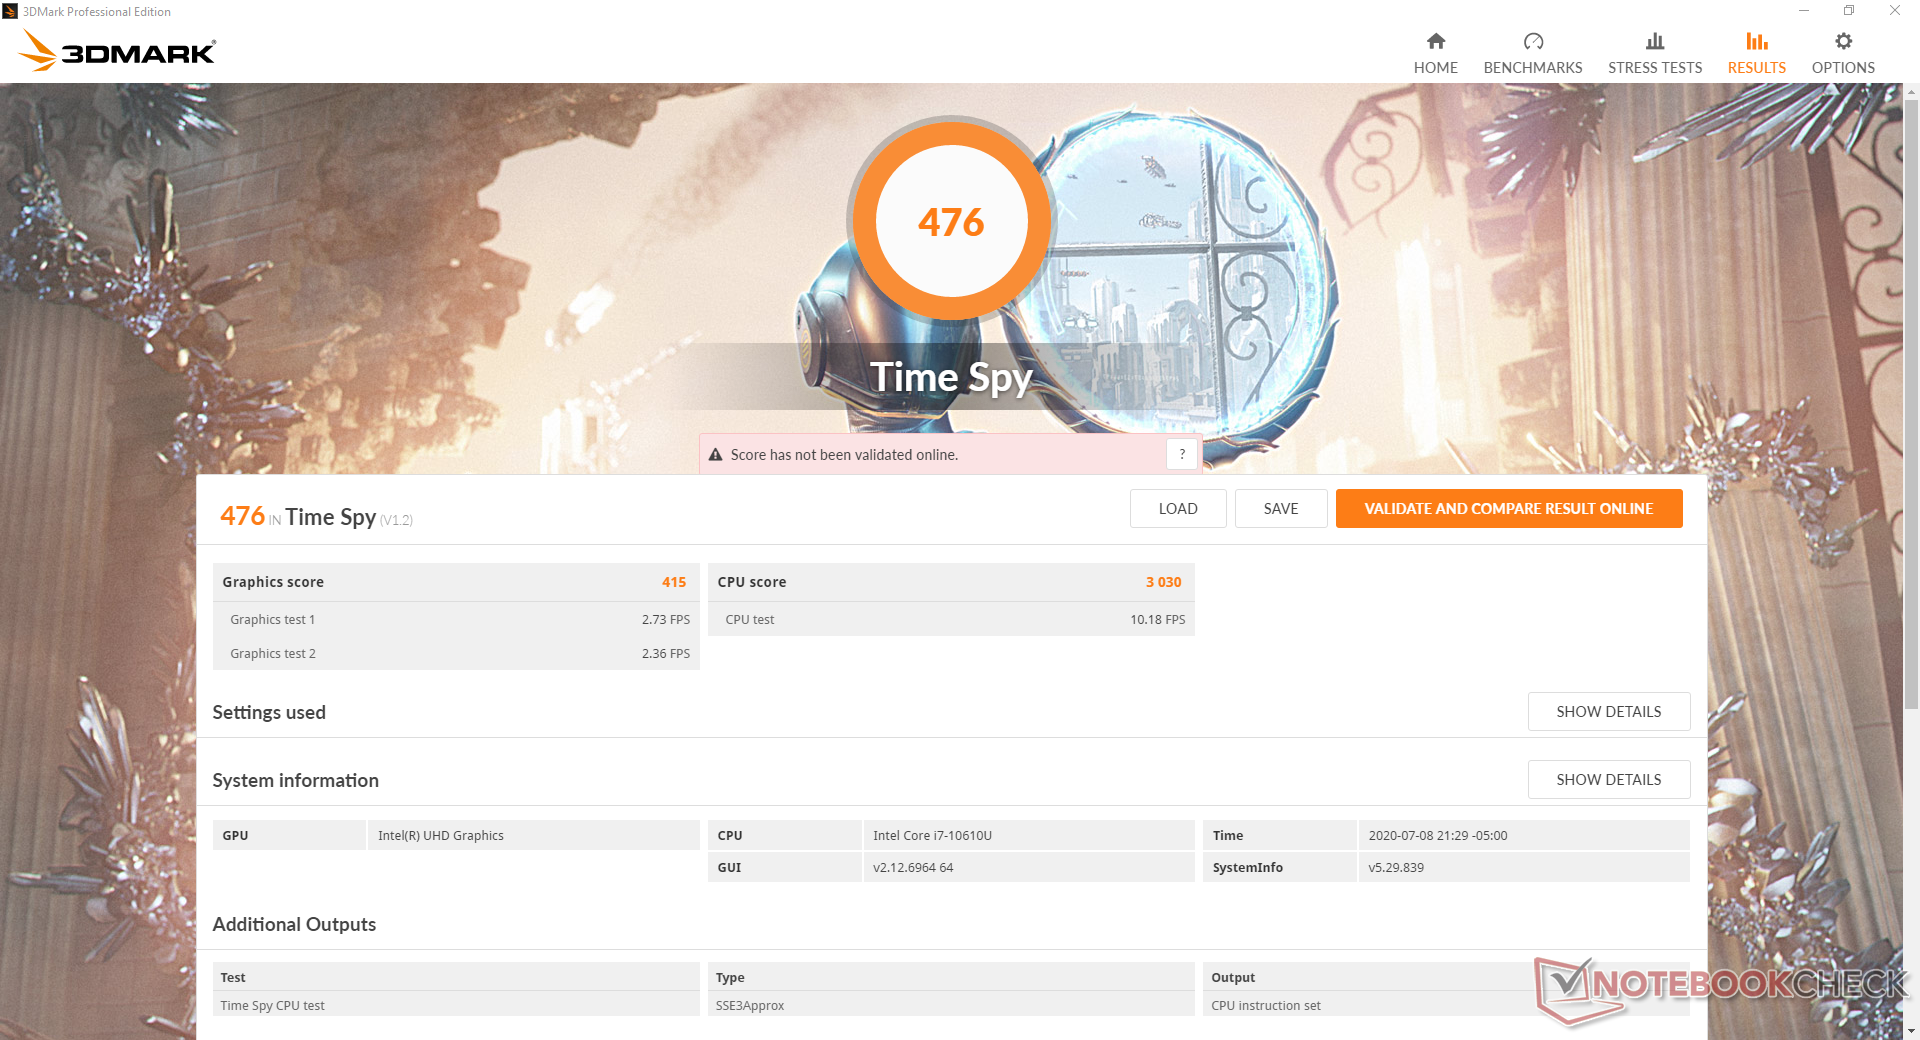
| 3DMark Time Spy Score | 476 puan | |
Yardım | ||
| düşük | orta | yüksek | ultra | |
|---|---|---|---|---|
| The Witcher 3 (2015) | 20.7 | 10.9 | ||
| Dota 2 Reborn (2015) | 84.5 | 49.3 | 22.8 | 20.3 |
| X-Plane 11.11 (2018) | 13.2 | 10.7 | 11.2 |
Emissions
System Noise
With nothing more than a 15 W CPU to cool, the internal fan should be silent or at least quiet most of the time and that is exactly what we are getting here. Even when running our 90-second 3DMark 06 benchmark, for example, fan noise would rise to just 30 dB(A) against a background of 29 dB(A) to be essentially inaudible in a typical office or classroom environment.
We're able to record a maximum fan noise of 41.3 dB(A) only after running Prime95 for several minutes similar to what we observed on the Latitude 7410. Otherwise, fan noise will rarely go beyond 35 dB(A) unless if you intend to run intensive tasks for long periods.
| Dell Latitude 7310 UHD Graphics 620, i7-10610U, Samsung SSD PM981a MZVLB512HBJQ | Dell Latitude 7300-P99G UHD Graphics 620, i7-8665U, Samsung SSD PM981 MZVLB512HAJQ | Asus ZenBook S13 UX392FN GeForce MX150, i7-8565U, WDC PC SN520 SDAPNUW-512G | Lenovo ThinkPad X395 Vega 6, R3 PRO 3300U, Samsung SSD PM981a MZVLB256HBHQ | HP EliteBook 735 G6 7KN29EA Vega 8, R5 PRO 3500U, WDC PC SN520 SDAPNUW-256G | Apple MacBook Pro 13 2020 2GHz i5 10th-Gen Iris Plus Graphics G7 (Ice Lake 64 EU), i5-1038NG7, Apple SSD SM0512F | |
|---|---|---|---|---|---|---|
| Noise | -2% | -5% | -2% | -1% | -4% | |
| kapalı / ortam * (dB) | 29 | 30 -3% | 28.1 3% | 30.2 -4% | 29.6 -2% | 29.6 -2% |
| Idle Minimum * (dB) | 29 | 30 -3% | 28.1 3% | 30.2 -4% | 29.6 -2% | 29.6 -2% |
| Idle Average * (dB) | 29 | 30 -3% | 28.1 3% | 30.2 -4% | 29.6 -2% | 29.6 -2% |
| Idle Maximum * (dB) | 29 | 30 -3% | 29 -0% | 30.2 -4% | 30.9 -7% | 29.6 -2% |
| Load Average * (dB) | 30.1 | 35 -16% | 41.1 -37% | 34.3 -14% | 33.9 -13% | 34.4 -14% |
| Load Maximum * (dB) | 41.3 | 35 15% | 41.1 -0% | 34.3 17% | 33.9 18% | 42.1 -2% |
| Witcher 3 ultra * (dB) | 41.1 | 36.1 |
* ... daha küçük daha iyidir
Ses yüksekliği
| Boşta |
| 29 / 29 / 29 dB |
| Çalışırken |
| 30.1 / 41.3 dB |
 | ||
30 dB sessiz 40 dB(A) duyulabilirlik 50 dB(A) gürültülü |
||
min: | ||
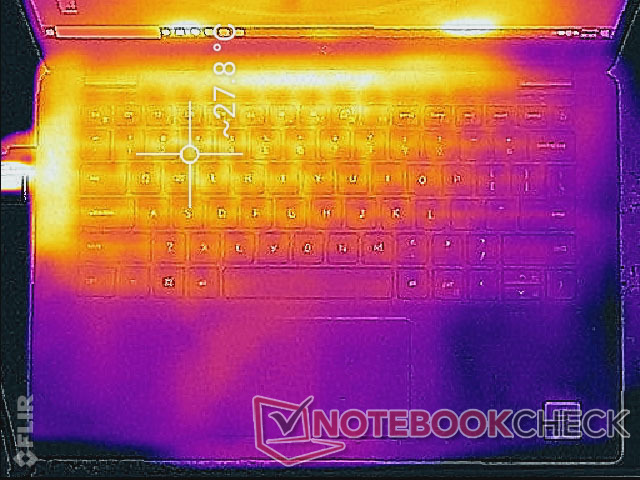
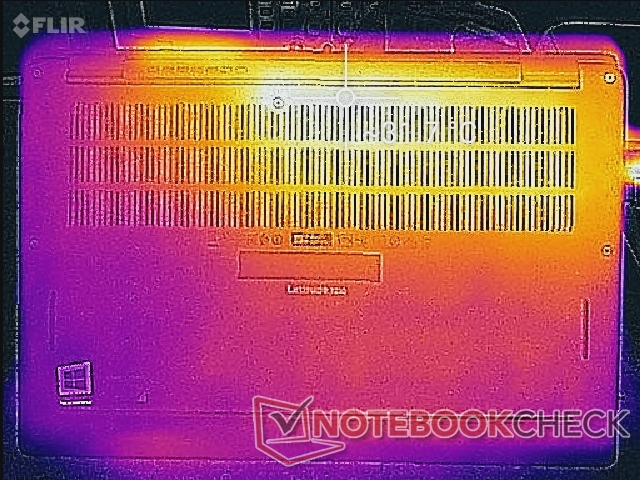
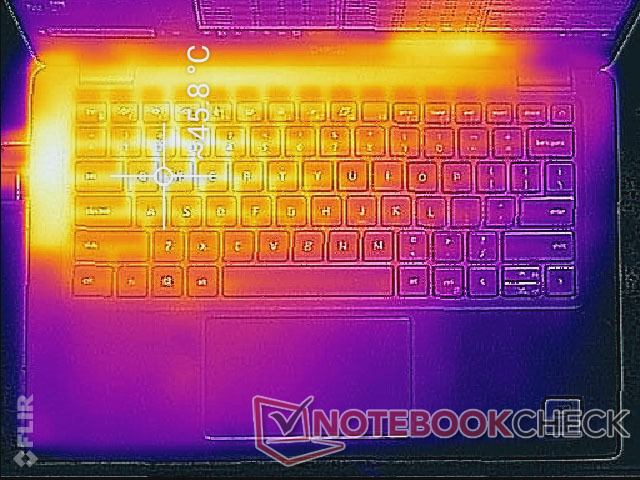
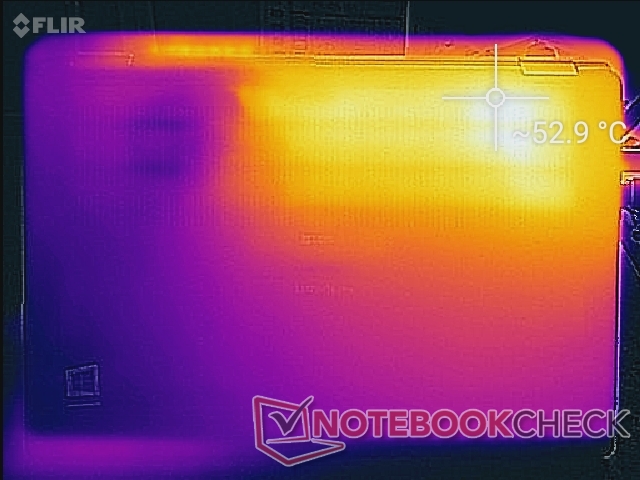
Temperature
Surface temperatures are warmer on the left half of the laptop than the right as shown by the temperature maps below. When under Prime95+FurMark stress, hot spots can become as warm as 45 C to 53 C on the top and bottom, respectively. Typing on the left half of the keyboard can feel uncomfortable if the system is under high processing loads as a result.
The temperature gradient is different from last year's Latitude 7300 where hot spots can be as warm as 62 C near the top center of the keyboard instead.
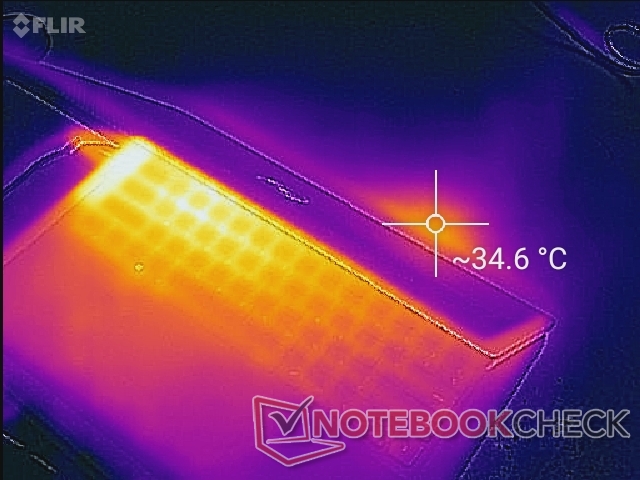
(-) Üst taraftaki maksimum sıcaklık, 34.3 °C / 94 F ortalamasına kıyasla 45.2 °C / 113 F'dir. , Office sınıfı için 21.2 ile 62.5 °C arasında değişir.
(-) Alt kısım, 36.8 °C / 98 F ortalamasına kıyasla maksimum 52.8 °C / 127 F'ye kadar ısınır
(+) Boşta kullanımda, üst tarafın ortalama sıcaklığı 26.3 °C / 79 F olup, cihazın 29.5 °C / 85 F.
(+) Avuç içi dayanakları ve dokunmatik yüzey, maksimum 27.2 °C / 81 F ile cilt sıcaklığından daha soğuktur ve bu nedenle dokunulduğunda soğuktur.
(±) Benzer cihazların avuç içi dayanağı alanının ortalama sıcaklığı 27.6 °C / 81.7 F (+0.4 °C / 0.7 F) idi.
Stress Test
We stress the system with synthetic loads to identify for any potential throttling issues. When running Prime95, CPU clock rates would spike to 4.1 GHz for about 10 seconds before hitting a core temperature of 95 C. Clock rates would then quickly decline and stabilize at 2.4 GHz for a more tolerable core temperature of 69 C. Processor performance would throttle further down to 1.1 GHz if both the CPU and GPU are at 100 percent utilization. Perhaps unsurprisingly, these results are essentially the same as what we observed on the Latitude 7410 which comes with the same Core i7-10610U CPU.
Running on batteries will not limit performance. A 3DMark 11 test on battery power returns almost the same scores as when the system is connected to mains.
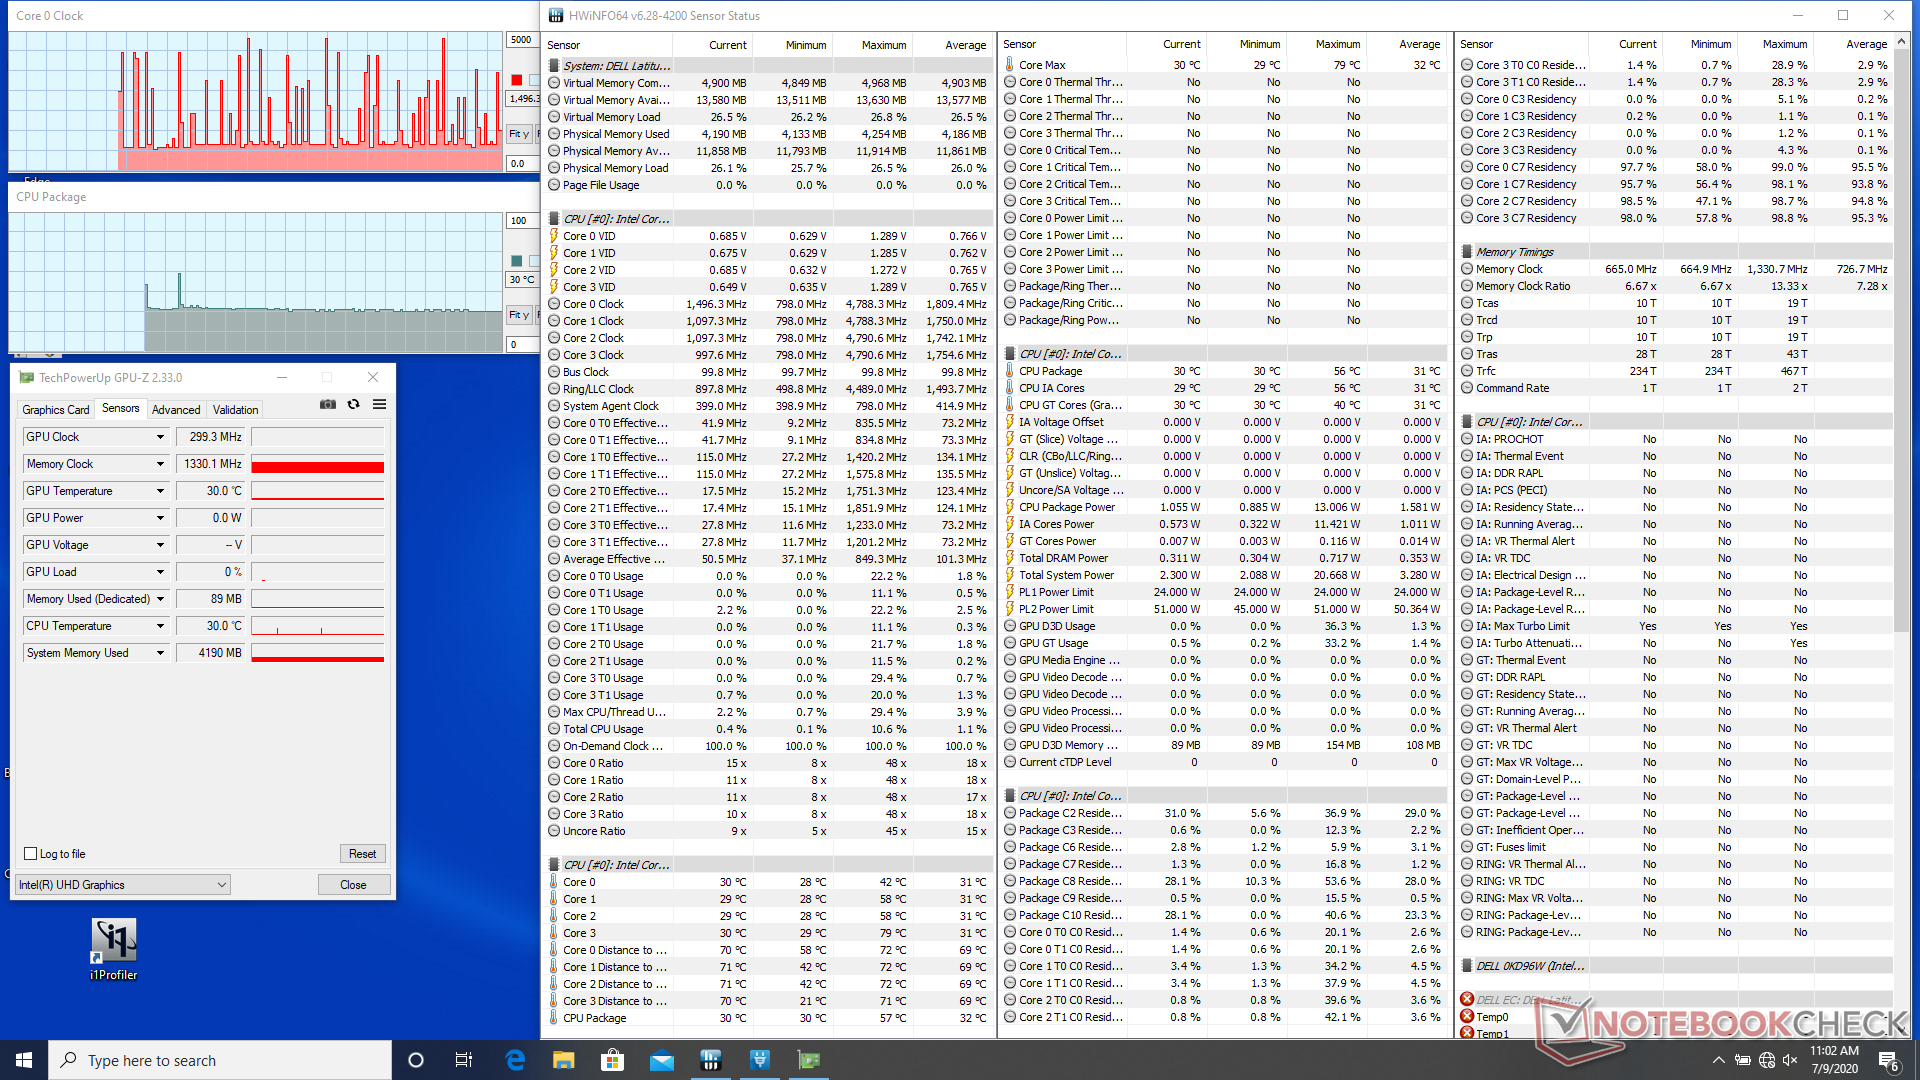
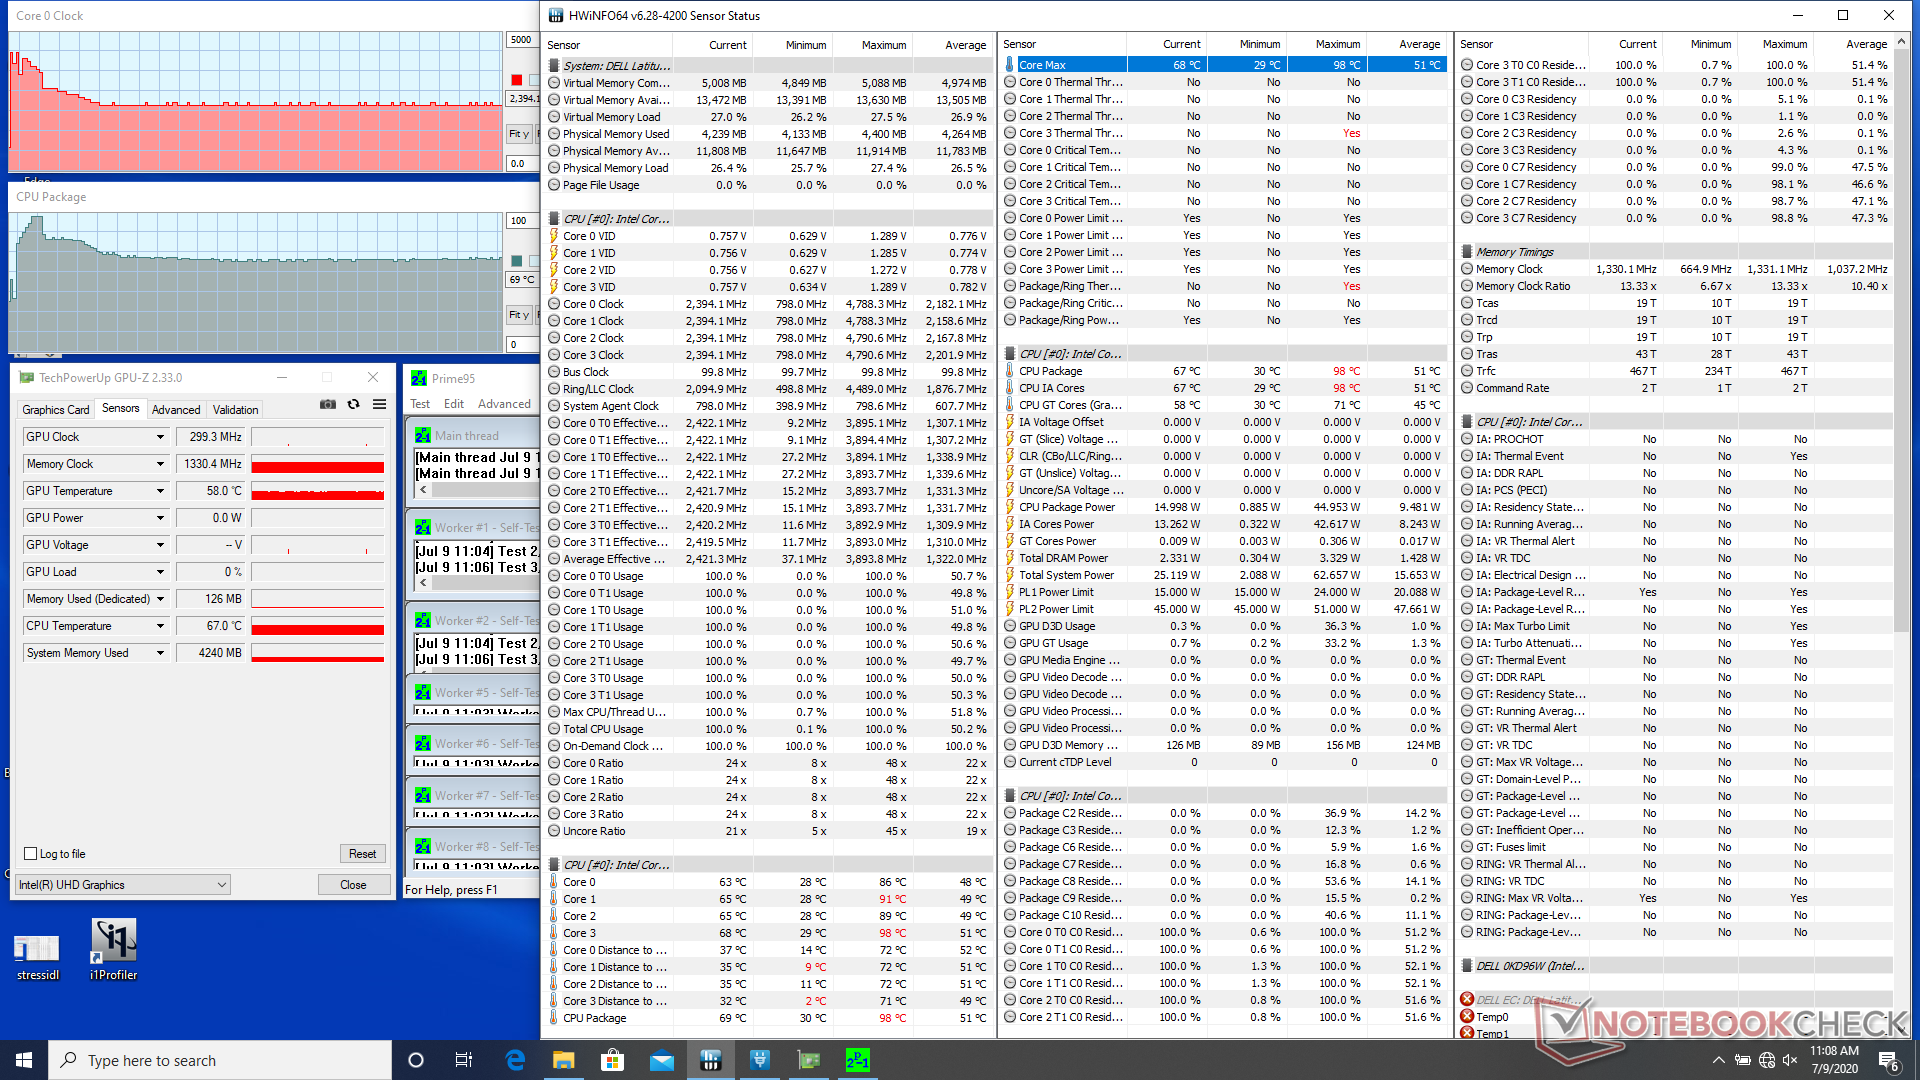
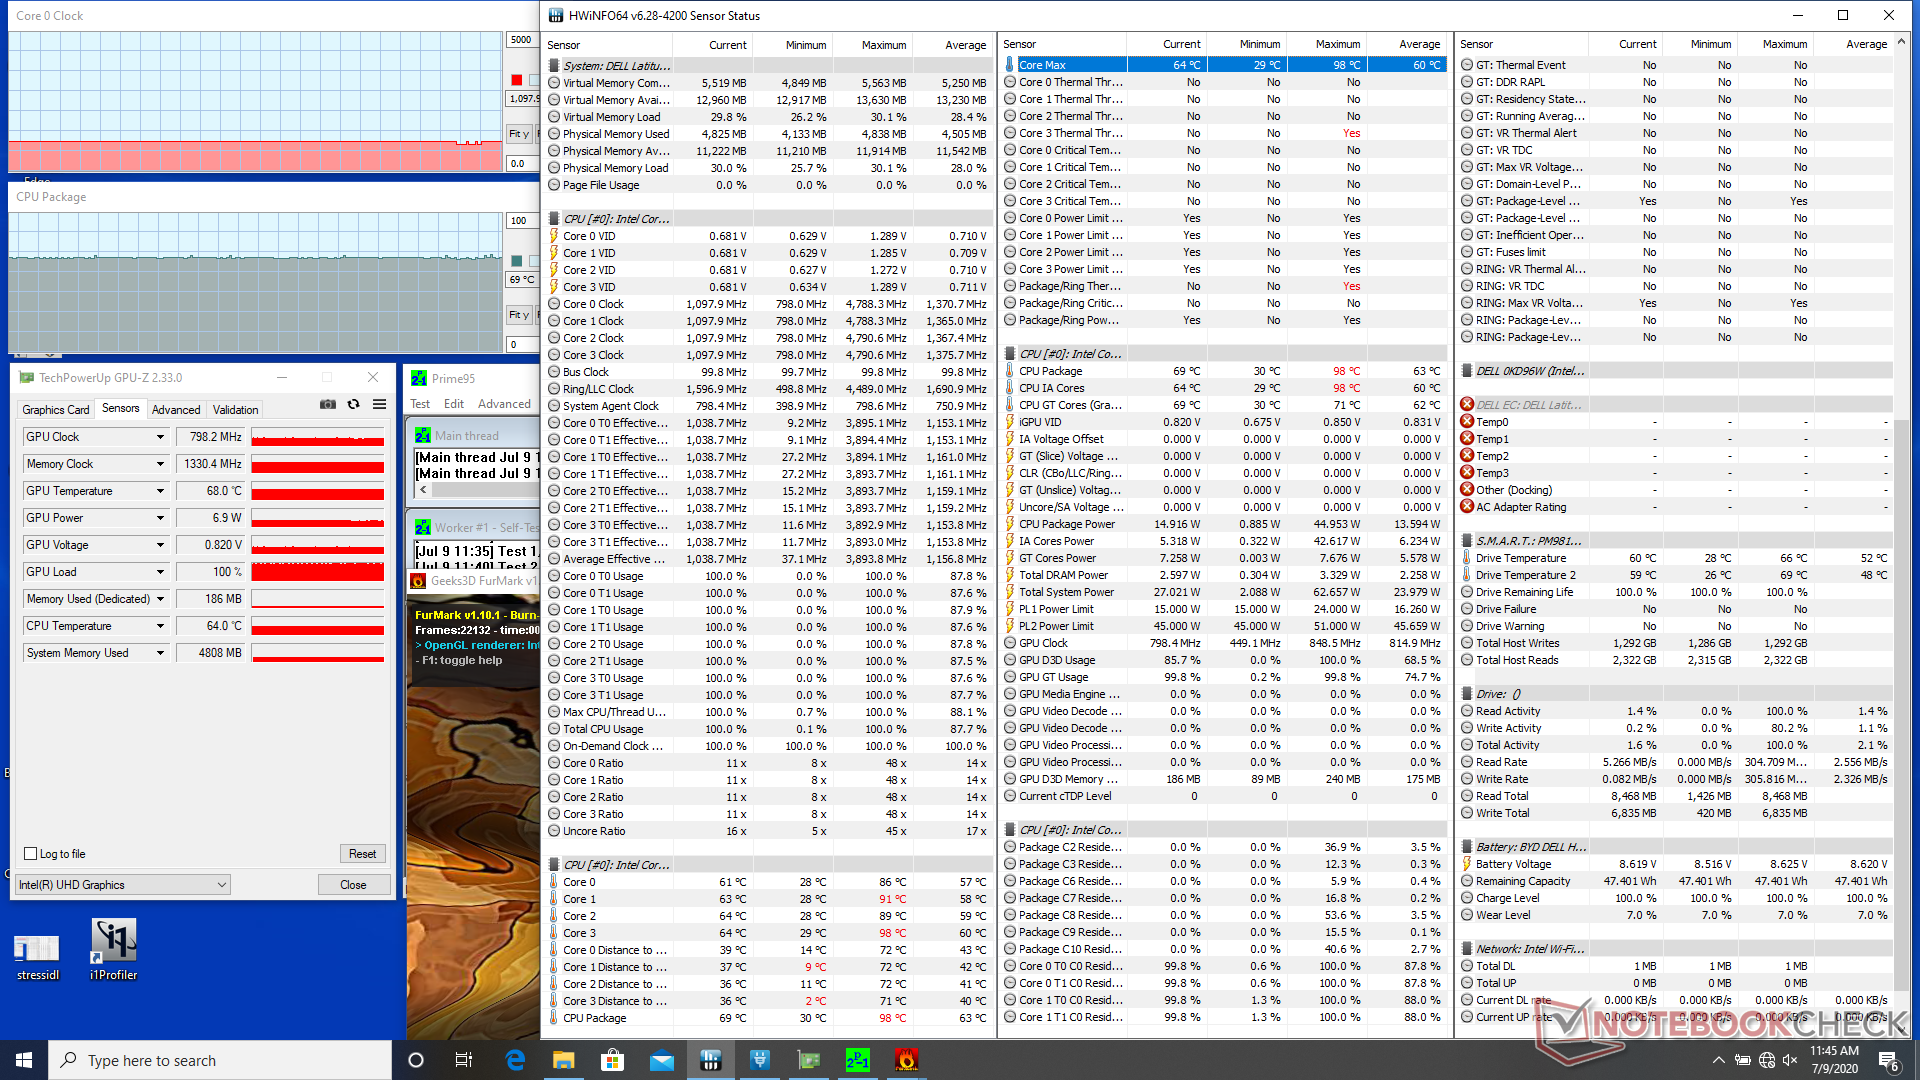
| CPU Clock (GHz) | GPU Clock (MHz) | Average CPU Temperature (°C) | |
| System Idle | -- | -- | 30 |
| Prime95 Stress | 2.4 | -- | 69 |
| Prime95 + FurMark Stress | 1.1 | 798 | 69 |
Speakers


Dell Latitude 7310 ses analizi
(+) | hoparlörler nispeten yüksek sesle çalabilir (84 dB)
Bas 100 - 315Hz
(-) | neredeyse hiç bas yok - ortalama olarak medyandan 16.2% daha düşük
(±) | Bas doğrusallığı ortalamadır (11.5% delta - önceki frekans)
Ortalar 400 - 2000 Hz
(+) | dengeli ortalar - medyandan yalnızca 2.8% uzakta
(+) | orta frekanslar doğrusaldır (4.4% deltadan önceki frekansa)
Yüksekler 2 - 16 kHz
(+) | dengeli yüksekler - medyandan yalnızca 2.5% uzakta
(+) | yüksekler doğrusaldır (4% deltadan önceki frekansa)
Toplam 100 - 16.000 Hz
(+) | genel ses doğrusaldır (12.4% ortancaya göre fark)
Aynı sınıfla karşılaştırıldığında
» Bu sınıftaki tüm test edilen cihazların %5%'si daha iyi, 2% benzer, 93% daha kötüydü
» En iyisinin deltası 7% idi, ortalama 21% idi, en kötüsü 53% idi
Test edilen tüm cihazlarla karşılaştırıldığında
» Test edilen tüm cihazların %11'si daha iyi, 2 benzer, % 87 daha kötüydü
» En iyisinin deltası 4% idi, ortalama 23% idi, en kötüsü 134% idi
Apple MacBook 12 (Early 2016) 1.1 GHz ses analizi
(+) | hoparlörler nispeten yüksek sesle çalabilir (83.6 dB)
Bas 100 - 315Hz
(±) | azaltılmış bas - ortalama olarak medyandan 11.3% daha düşük
(±) | Bas doğrusallığı ortalamadır (14.2% delta - önceki frekans)
Ortalar 400 - 2000 Hz
(+) | dengeli ortalar - medyandan yalnızca 2.4% uzakta
(+) | orta frekanslar doğrusaldır (5.5% deltadan önceki frekansa)
Yüksekler 2 - 16 kHz
(+) | dengeli yüksekler - medyandan yalnızca 2% uzakta
(+) | yüksekler doğrusaldır (4.5% deltadan önceki frekansa)
Toplam 100 - 16.000 Hz
(+) | genel ses doğrusaldır (10.2% ortancaya göre fark)
Aynı sınıfla karşılaştırıldığında
» Bu sınıftaki tüm test edilen cihazların %7%'si daha iyi, 2% benzer, 90% daha kötüydü
» En iyisinin deltası 5% idi, ortalama 18% idi, en kötüsü 53% idi
Test edilen tüm cihazlarla karşılaştırıldığında
» Test edilen tüm cihazların %5'si daha iyi, 1 benzer, % 94 daha kötüydü
» En iyisinin deltası 4% idi, ortalama 23% idi, en kötüsü 134% idi
Energy Management
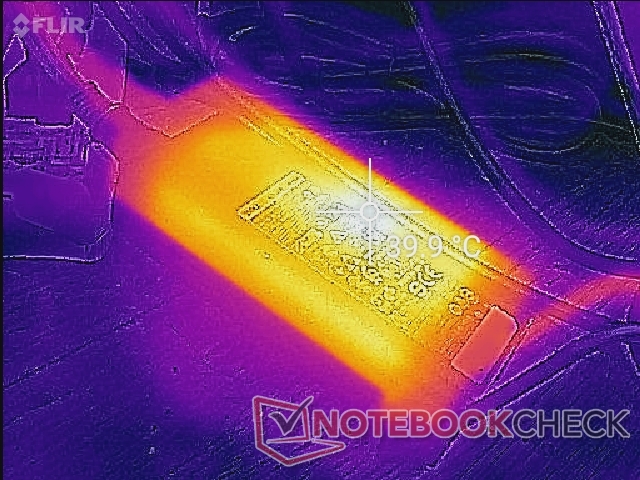
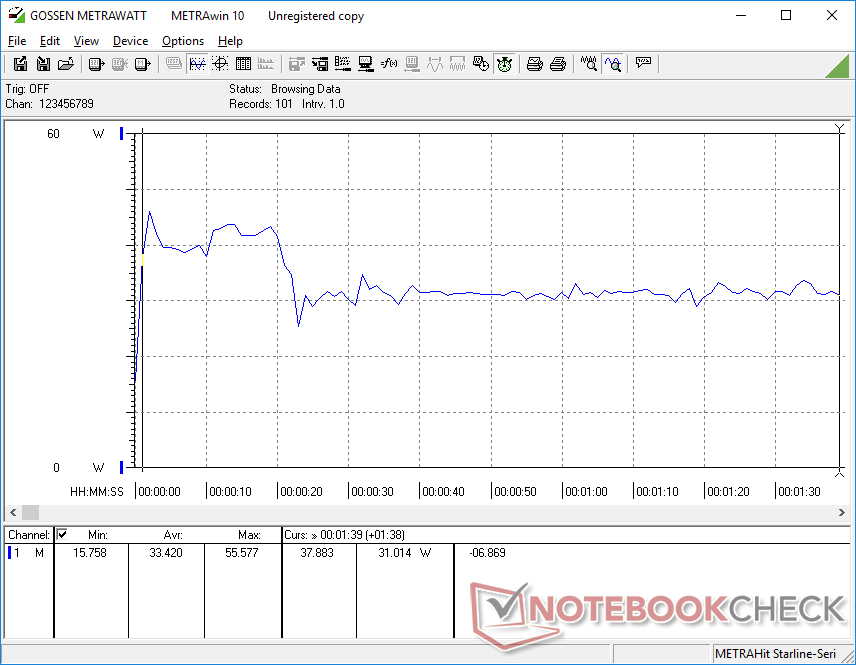
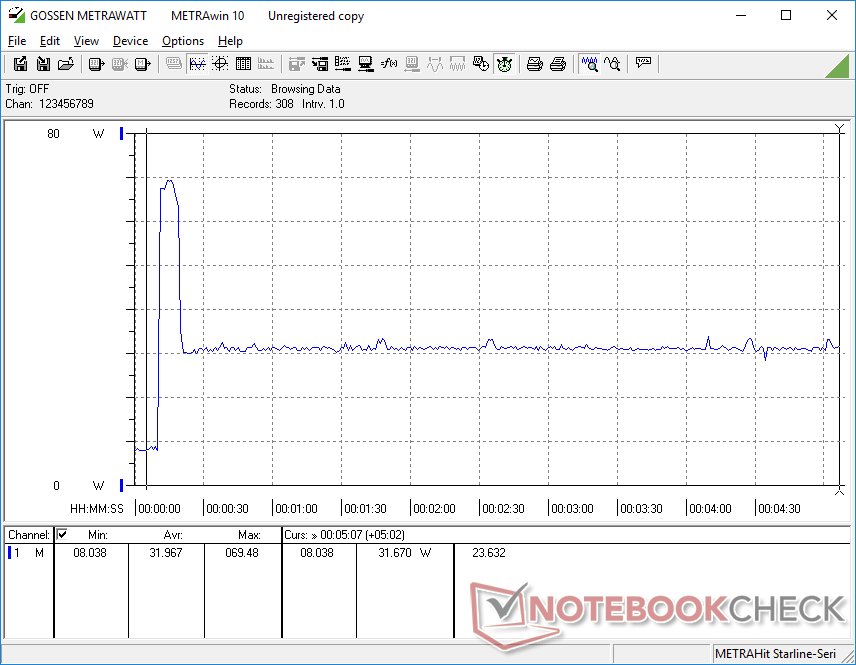
Power Consumption
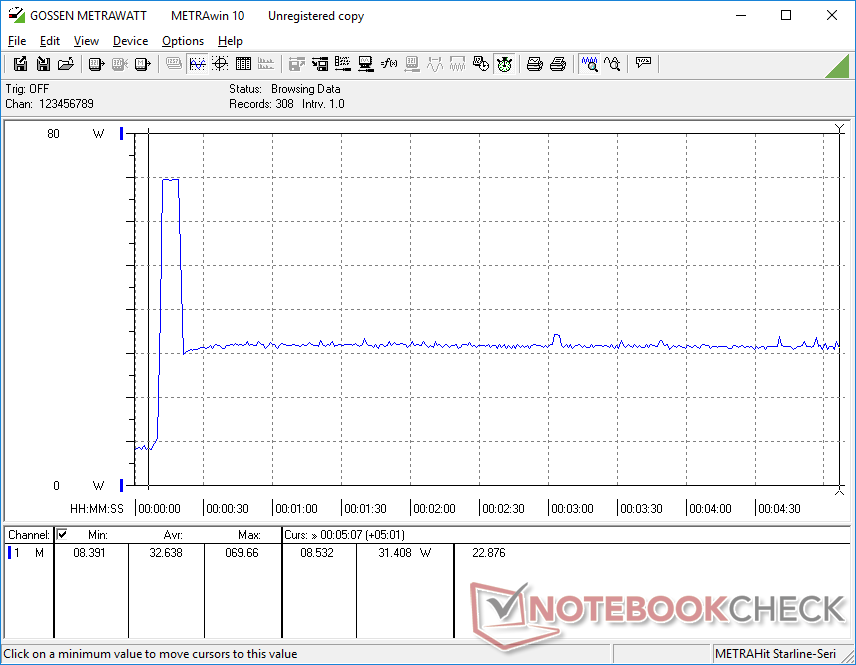
Idling on desktop consumes between 2 W and 5 W even when set to the maximum brightness setting to be more efficient than most other 13.3-inch laptops. The low consumption can be partly attributed to the low-power backlight.
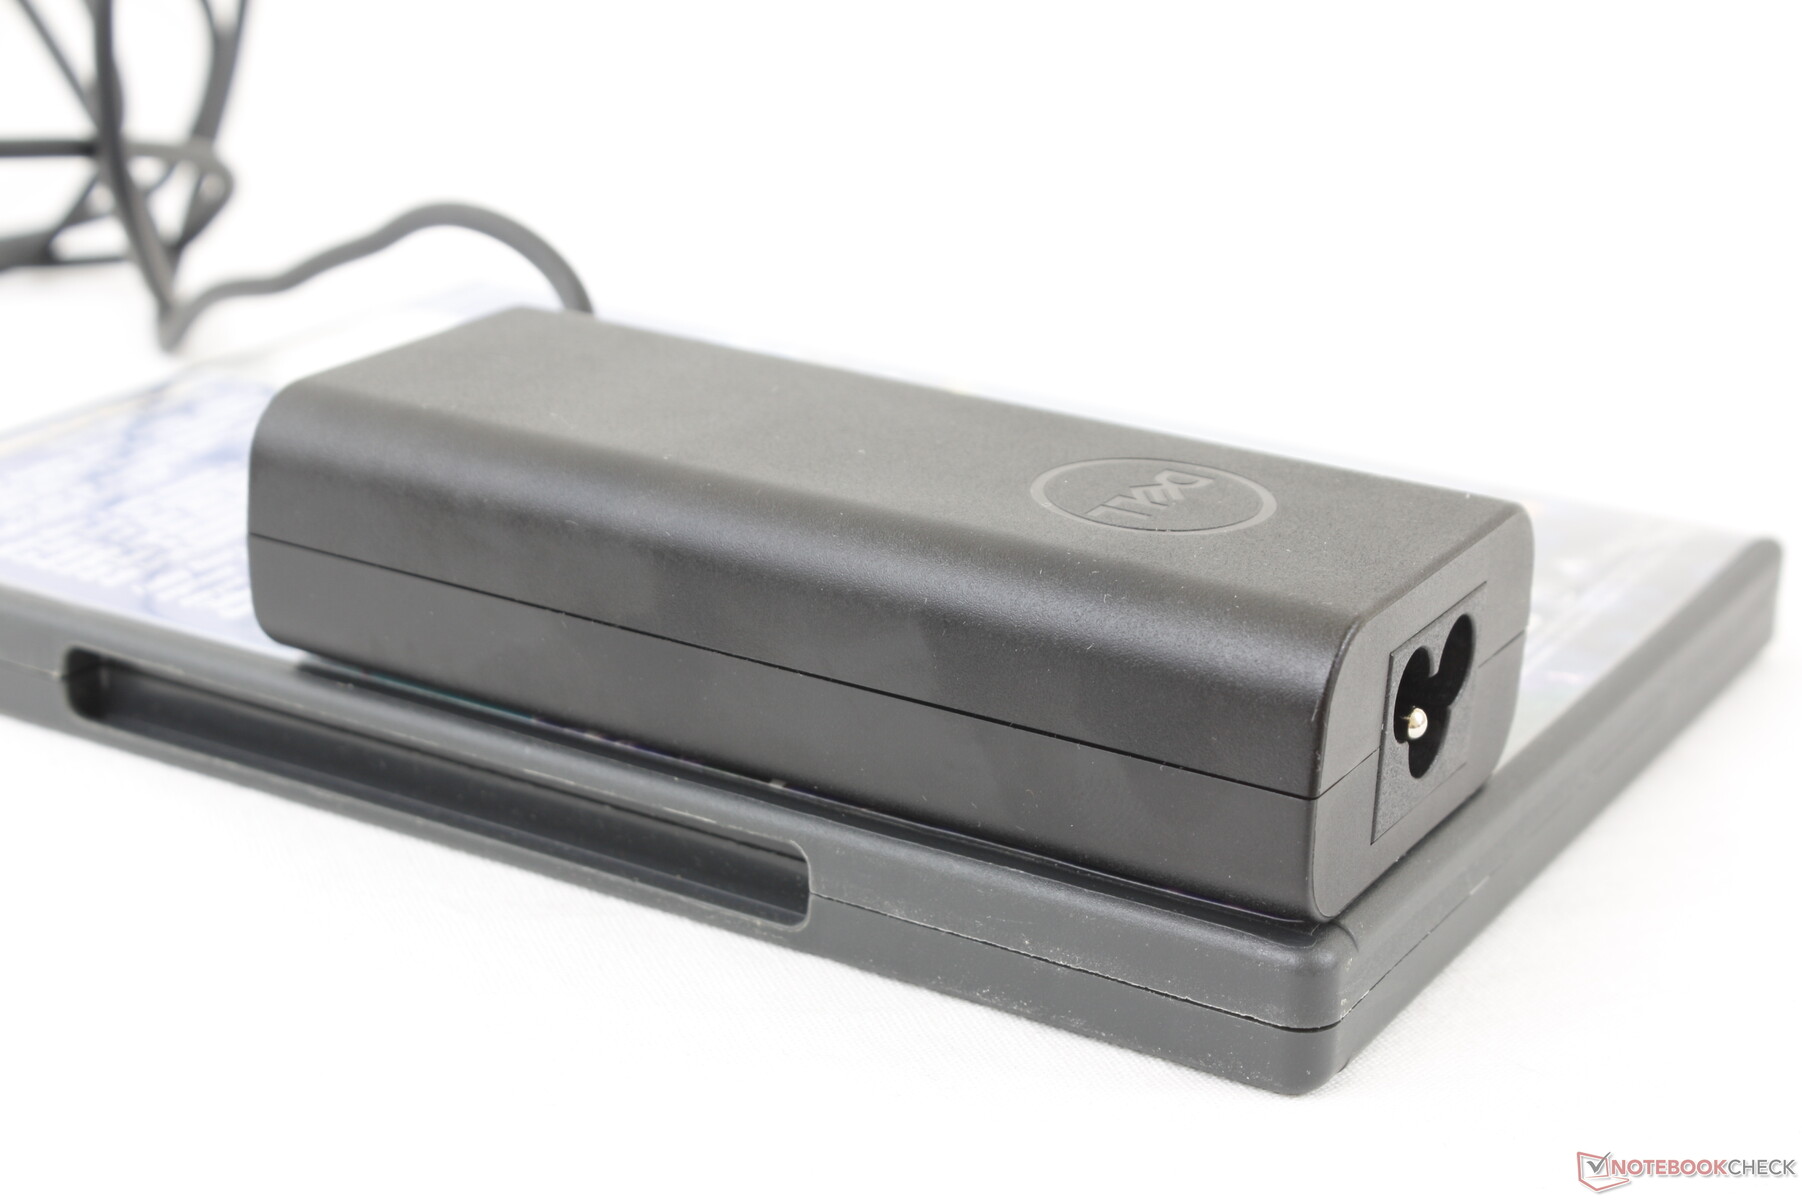
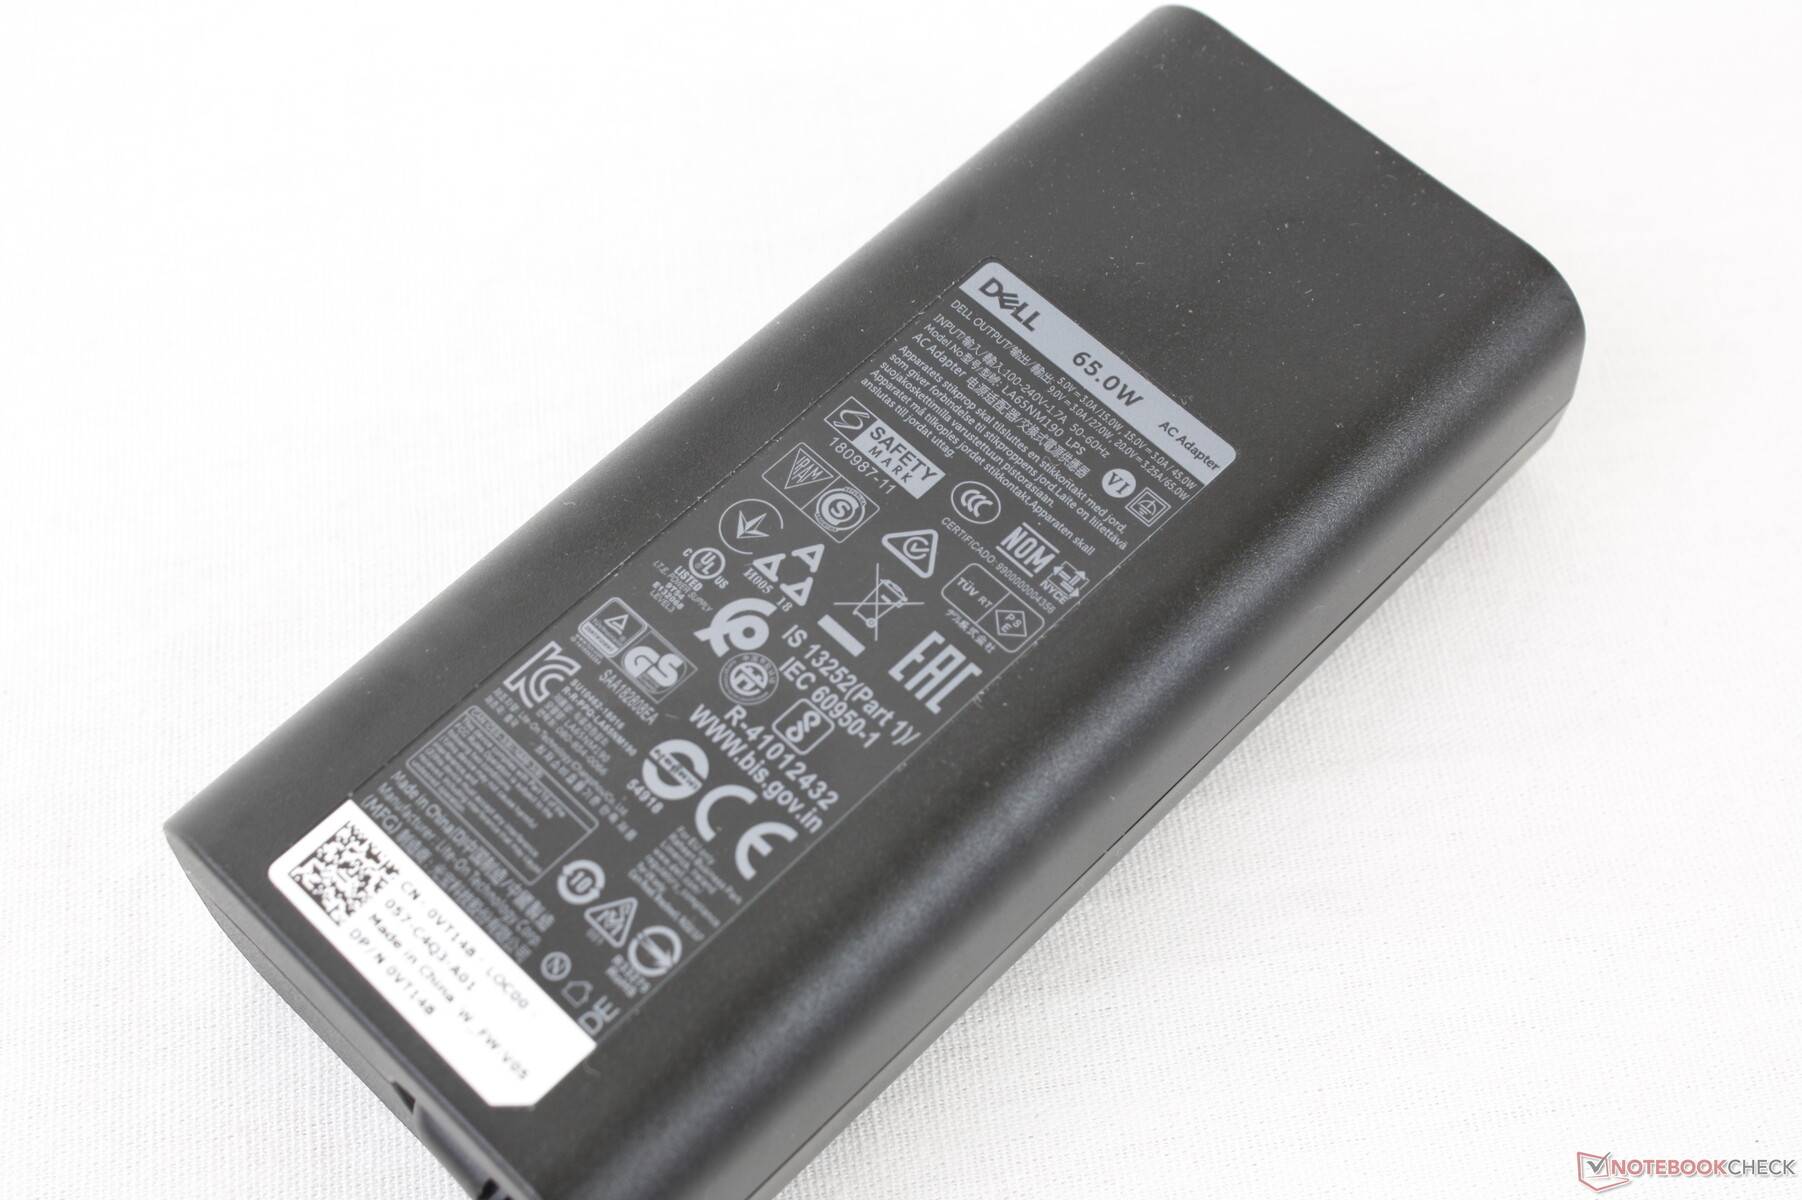
When running higher loads, power consumption becomes more in line with the competition including the Ryzen-powered ThinkPad X395 or HP EliteBook 735 G6 which are each able to offer both faster graphics performance than our Dell. We're able to record a maximum consumption of 69.7 W from the small-medium (~11.2 x 5.2 x 2.8 cm) 65 W AC adapter when running Prime95 and FurMark simultaneously, but this rate is only temporary as shown by our graphs below due to thermal limitations. Power consumption behavior matches our Stress Test clock rate observations above.
| Kapalı / Bekleme modu | |
| Boşta | |
| Çalışırken |
|
Key:
min: | |
| Dell Latitude 7310 i7-10610U, UHD Graphics 620, Samsung SSD PM981a MZVLB512HBJQ, IPS, 1920x1080, 13.3" | Dell Latitude 7300-P99G i7-8665U, UHD Graphics 620, Samsung SSD PM981 MZVLB512HAJQ, IPS LED, 1920x1080, 13.3" | Asus ZenBook S13 UX392FN i7-8565U, GeForce MX150, WDC PC SN520 SDAPNUW-512G, IPS, 1920x1080, 13.9" | Lenovo ThinkPad X395 R3 PRO 3300U, Vega 6, Samsung SSD PM981a MZVLB256HBHQ, IPS, 1920x1080, 13.3" | HP EliteBook 735 G6 7KN29EA R5 PRO 3500U, Vega 8, WDC PC SN520 SDAPNUW-256G, IPS LED, 1920x1080, 13.3" | Apple MacBook Pro 13 2020 2GHz i5 10th-Gen i5-1038NG7, Iris Plus Graphics G7 (Ice Lake 64 EU), Apple SSD SM0512F, IPS, 2560x1600, 13.3" | |
|---|---|---|---|---|---|---|
| Power Consumption | -26% | -46% | -29% | -53% | -60% | |
| Idle Minimum * (Watt) | 2.7 | 2.5 7% | 3.4 -26% | 4 -48% | 5.6 -107% | 3.8 -41% |
| Idle Average * (Watt) | 4.4 | 6.6 -50% | 6.3 -43% | 6.3 -43% | 8.1 -84% | 8.6 -95% |
| Idle Maximum * (Watt) | 4.8 | 8.7 -81% | 10.4 -117% | 9.3 -94% | 9.6 -100% | 10.3 -115% |
| Load Average * (Watt) | 33.4 | 35.4 -6% | 51 -53% | 34 -2% | 34.3 -3% | 52.1 -56% |
| Load Maximum * (Watt) | 69.7 | 68.1 2% | 62.7 10% | 42 40% | 48.6 30% | 65.2 6% |
| Witcher 3 ultra * (Watt) | 39 | 48.2 |
* ... daha küçük daha iyidir
Battery Life
Battery options include 3-cell 39 Wh or 4-cell 52 Wh with the latter being slightly heavier for longer battery life. The large 60 Wh battery on last year's Latitude 7300 is no longer an option, but battery life thankfully hasn't suffered as we're able to record over 12 hours of real-world WLAN use on our 52 Wh configuration despite the smaller battery. Runtimes on the 39 Wh option will drop by about a quarter to 9 hours.
Recharging from empty to full capacity takes two full hours.
| Dell Latitude 7310 i7-10610U, UHD Graphics 620, 52 Wh | Dell Latitude 7300-P99G i7-8665U, UHD Graphics 620, 60 Wh | Asus ZenBook S13 UX392FN i7-8565U, GeForce MX150, 50 Wh | Lenovo ThinkPad X395 R3 PRO 3300U, Vega 6, 48 Wh | HP EliteBook 735 G6 7KN29EA R5 PRO 3500U, Vega 8, 50 Wh | Apple MacBook Pro 13 2020 2GHz i5 10th-Gen i5-1038NG7, Iris Plus Graphics G7 (Ice Lake 64 EU), 58 Wh | |
|---|---|---|---|---|---|---|
| Pil Çalışma Süresi | -4% | -21% | 16% | -35% | -4% | |
| Reader / Idle (h) | 37.4 | 28.5 -24% | 18.4 -51% | |||
| WiFi v1.3 (h) | 12.6 | 10.8 -14% | 8.4 -33% | 10.9 -13% | 8.2 -35% | 12.1 -4% |
| Load (h) | 1.8 | 1.9 6% | 1.7 -6% | 3.8 111% |
Artılar
Eksiler
Verdict
As if last year's Latitude 7300 wasn't compact enough, the Latitude 7310 is now even smaller, lighter, and more discreet to fit in just about any office or work environment. Aside from the spongy clickpad, there's not much to dislike about Dell's latest high-end subnotebook.
What bothers us more is the lack of certain features. The TrackPoint and dedicated mouse keys come to mind which would have absolutely made clicking and cursor control easier and more accurate. Users who prefer having tactile mouse buttons and upgradeable RAM and WLAN will still have strong reasons to prefer the Latitude 7300 over the 7310. Additionally, a brighter 500-nit or greater display option would have made the laptop an even better outdoor or travel companion.
The lack of better processor options outside of the quad-core Comet Lake-U is also becoming more obvious. Although the laptop isn't targeting high-performance users, competitors are beginning to offer much faster AMD Ryzen CPUs under the same or similar power envelope for superior performance-per-Watt. The fact that the Latitude 7300 can perform almost identically to the Latitude 7310 doesn't help it, either.
The Latitude 7310 is a more refined version of the Latitude 7300. It drops a couple of features along the way, but the sleeker and more portable design may be worth it for travelers or business users constantly on the move.
Dell Latitude 7310
- 07/13/2020 v7 (old)
Allen Ngo
Price comparison

