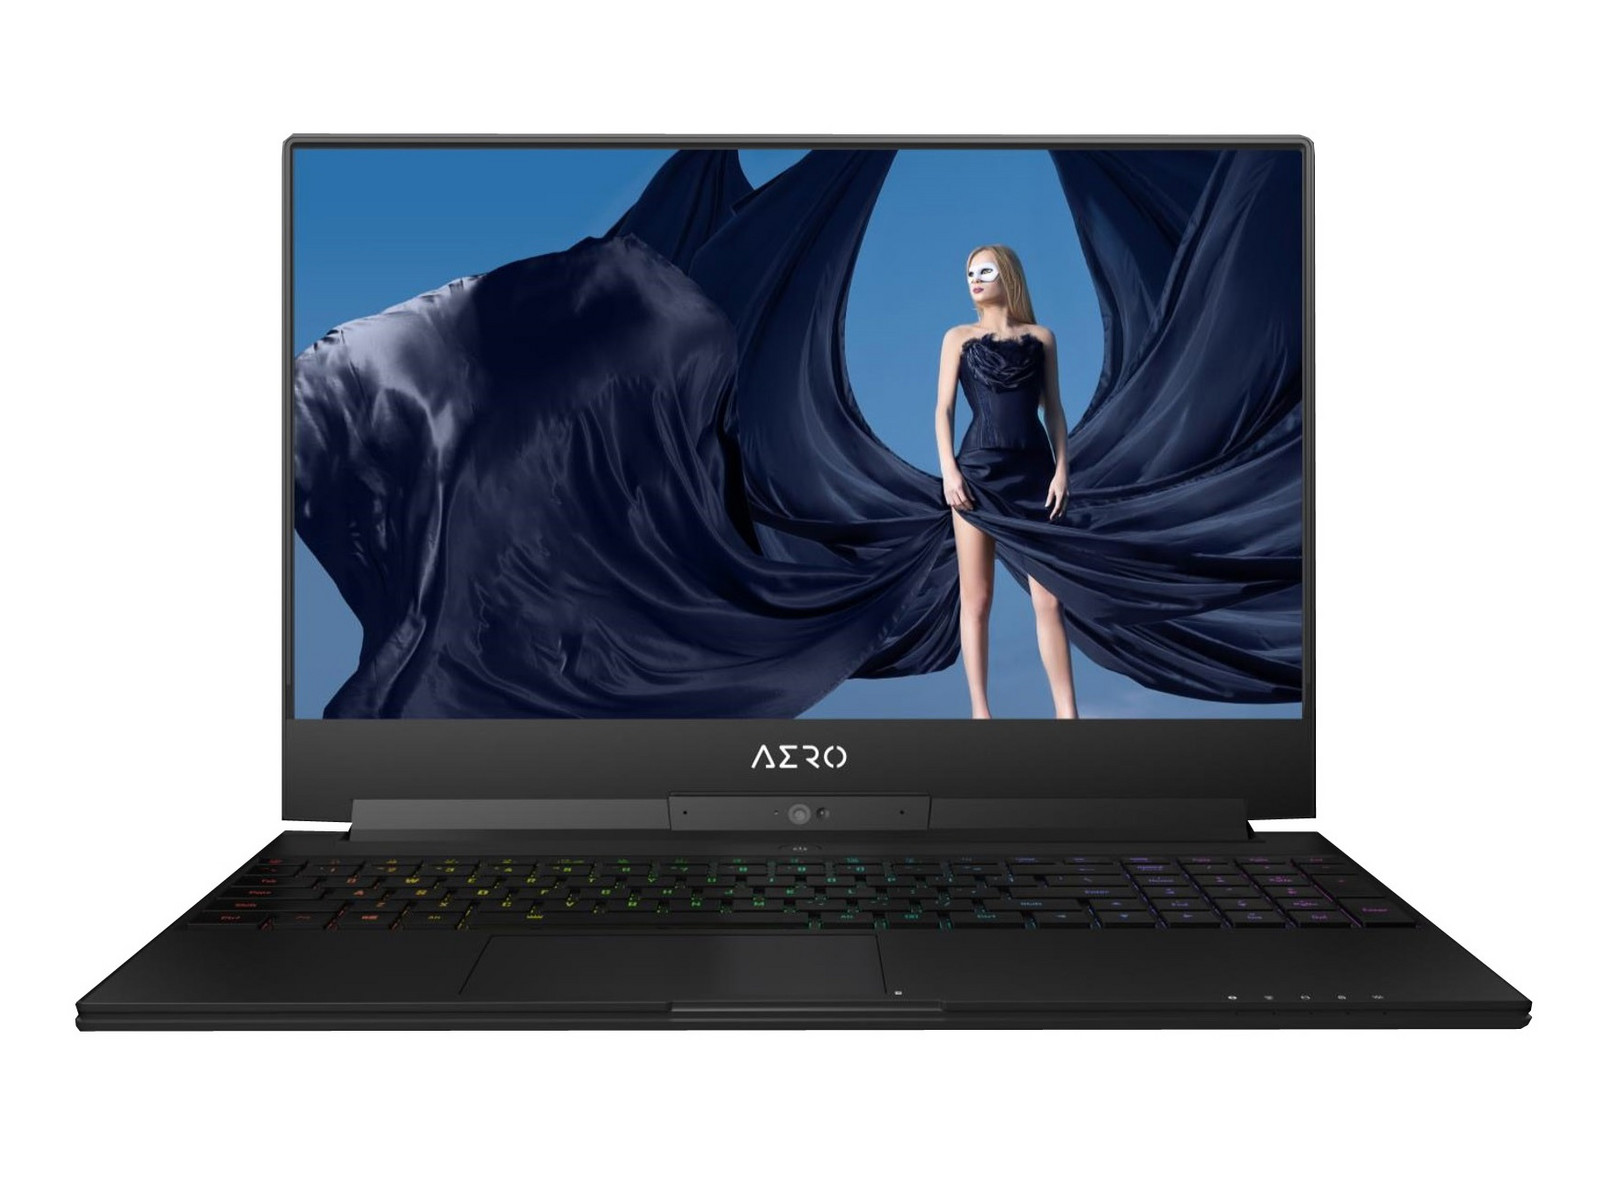
Kısa inceleme: Gigabyte Aero 15X v8 (i7-8750H, GTX 1070 Max-Q, Full-HD) Laptop
| SD Card Reader | |
| average JPG Copy Test (av. of 3 runs) | |
| Gigabyte Aero 15X v8 (Toshiba Exceria Pro SDXC 64 GB UHS-II) | |
| MSI GS63VR 7RG-005 (Toshiba Exceria Pro SDXC 64 GB UHS-II) | |
| Sınıf ortalaması Gaming (20.9 - 210, n=54, son 2 yıl) | |
| Gigabyte Aero 15X (Toshiba Exceria Pro SDXC 64 GB UHS-II) | |
| maximum AS SSD Seq Read Test (1GB) | |
| Gigabyte Aero 15X v8 (Toshiba Exceria Pro SDXC 64 GB UHS-II) | |
| MSI GS63VR 7RG-005 (Toshiba Exceria Pro SDXC 64 GB UHS-II) | |
| Sınıf ortalaması Gaming (25.5 - 261, n=51, son 2 yıl) | |
| Gigabyte Aero 15X (Toshiba Exceria Pro SDXC 64 GB UHS-II) | |
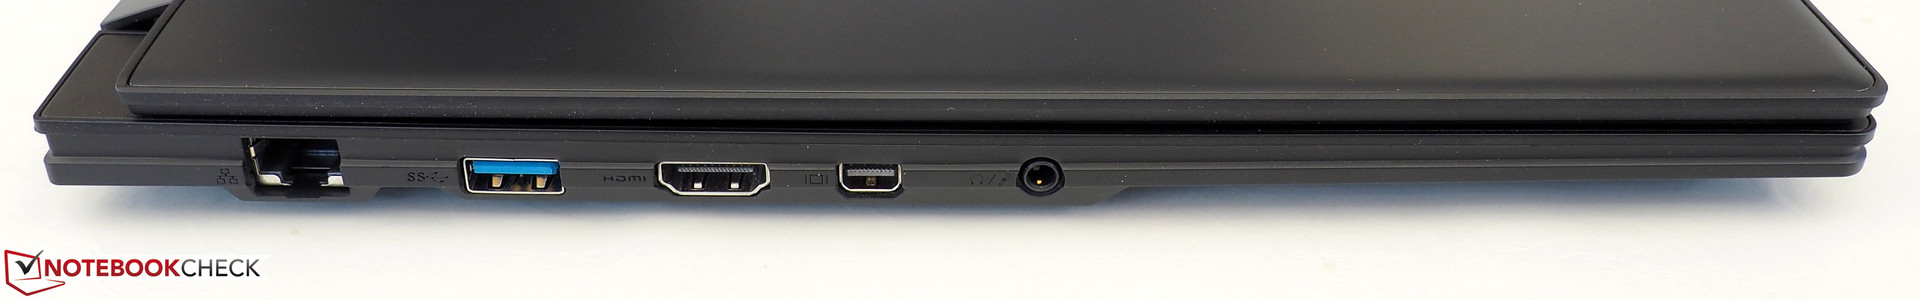
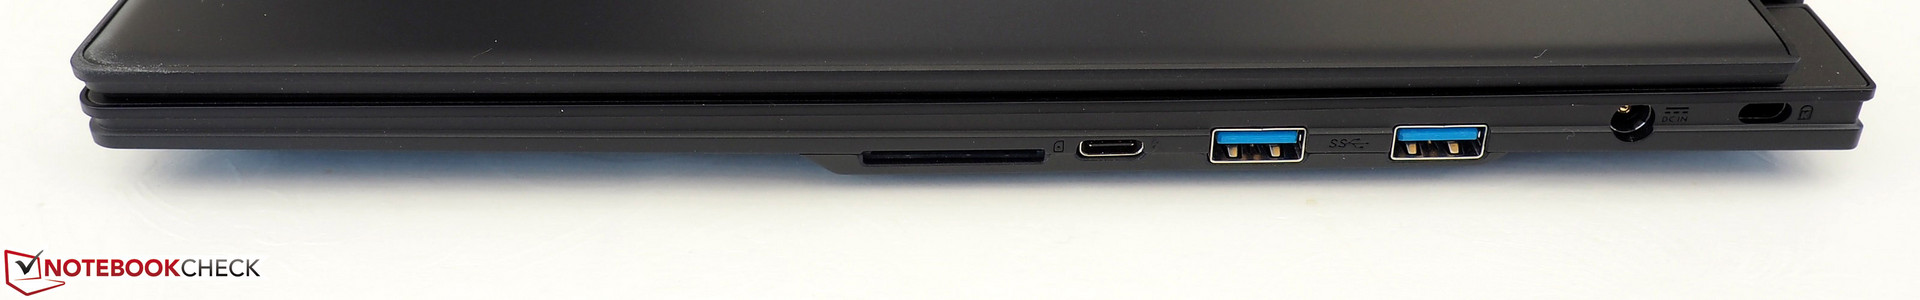
| Networking | |
| iperf3 transmit AX12 | |
| Asus Zephyrus M GM501 | |
| Acer Predator Triton 700 | |
| MSI GS63VR 7RG-005 | |
| Gigabyte Aero 15X v8 | |
| Gigabyte Aero 15X | |
| iperf3 receive AX12 | |
| MSI GS63VR 7RG-005 | |
| Gigabyte Aero 15X | |
| Asus Zephyrus M GM501 | |
| Acer Predator Triton 700 | |
| Gigabyte Aero 15X v8 | |
| |||||||||||||||||||||||||
Aydınlatma: 78 %
Batarya modunda parlaklık: 313 cd/m²
Kontrast: 948:1 (Siyah: 0.33 cd/m²)
ΔE ColorChecker Calman: 1.29 | ∀{0.5-29.43 Ø4.72}
ΔE Greyscale Calman: 0.69 | ∀{0.09-98 Ø4.97}
94% sRGB (Argyll 1.6.3 3D)
60% AdobeRGB 1998 (Argyll 1.6.3 3D)
64.9% AdobeRGB 1998 (Argyll 3D)
93.8% sRGB (Argyll 3D)
63.6% Display P3 (Argyll 3D)
Gamma: 2.43
CCT: 6550 K
| Gigabyte Aero 15X v8 LGD05C0, IPS, 1920x1080 | Gigabyte Aero 15X Chi Mei N156HCA-EA1 (CMN15D7), IPS, 1920x1080 | MSI GS63VR 7RG-005 Chi Mei N156HHE-GA1 (CMN15F4), TN LED, 1920x1080 | Asus Zephyrus M GM501 AUO B156HAN07.1 (AUO71ED), IPS, 1920x1080 | Acer Predator Triton 700 AUO B156HAN04.2 (AUO42ED), IPS, 1920x1080 | |
|---|---|---|---|---|---|
| Display | -0% | 28% | 2% | -3% | |
| Display P3 Coverage (%) | 63.6 | 64.7 2% | 91.6 44% | 66.1 4% | 62.5 -2% |
| sRGB Coverage (%) | 93.8 | 90.4 -4% | 100 7% | 92.7 -1% | 88.7 -5% |
| AdobeRGB 1998 Coverage (%) | 64.9 | 65.7 1% | 86.6 33% | 67.2 4% | 63.5 -2% |
| Response Times | -156% | 40% | 34% | -166% | |
| Response Time Grey 50% / Grey 80% * (ms) | 16.8 ? | 43.2 ? -157% | 10.4 ? 38% | 6.6 ? 61% | 44.8 ? -167% |
| Response Time Black / White * (ms) | 11.2 ? | 28.4 ? -154% | 6.6 ? 41% | 10.4 ? 7% | 29.6 ? -164% |
| PWM Frequency (Hz) | 26000 ? | 25510 ? | |||
| Screen | -179% | -58% | -157% | -155% | |
| Brightness middle (cd/m²) | 313 | 338 8% | 269 -14% | 307 -2% | 291 -7% |
| Brightness (cd/m²) | 300 | 324 8% | 254 -15% | 296 -1% | 277 -8% |
| Brightness Distribution (%) | 78 | 88 13% | 85 9% | 89 14% | 84 8% |
| Black Level * (cd/m²) | 0.33 | 0.34 -3% | 0.21 36% | 0.25 24% | 0.22 33% |
| Contrast (:1) | 948 | 994 5% | 1281 35% | 1228 30% | 1323 40% |
| Colorchecker dE 2000 * | 1.29 | 5.92 -359% | 3 -133% | 5.74 -345% | 5.52 -328% |
| Colorchecker dE 2000 max. * | 2.04 | 11.77 -477% | 5.62 -175% | 11.32 -455% | 10.72 -425% |
| Greyscale dE 2000 * | 0.69 | 7.45 -980% | 3.18 -361% | 6.44 -833% | 6.59 -855% |
| Gamma | 2.43 91% | 2.58 85% | 2.25 98% | 2.48 89% | 2.44 90% |
| CCT | 6550 99% | 6366 102% | 7274 89% | 8395 77% | 7816 83% |
| Color Space (Percent of AdobeRGB 1998) (%) | 60 | 59 -2% | 77 28% | 60 0% | 58 -3% |
| Color Space (Percent of sRGB) (%) | 94 | 90 -4% | 100 6% | 93 -1% | 89 -5% |
| Colorchecker dE 2000 calibrated * | 1.94 | ||||
| Toplam Ortalama (Program / Ayarlar) | -112% /
-140% | 3% /
-28% | -40% /
-100% | -108% /
-126% |
* ... daha küçük daha iyidir
Yanıt Sürelerini Görüntüle
| ↔ Tepki Süresi Siyahtan Beyaza | ||
|---|---|---|
| 11.2 ms ... yükseliş ↗ ve sonbahar↘ birleşimi | ↗ 6 ms yükseliş | 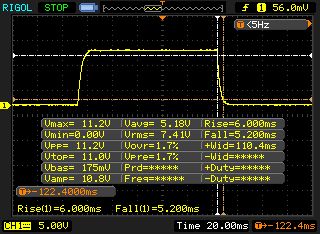 |
| ↘ 5.2 ms sonbahar | ||
| Ekran, testlerimizde iyi yanıt oranları gösteriyor ancak rekabetçi oyuncular için çok yavaş olabilir. Karşılaştırıldığında, test edilen tüm cihazlar 0.1 (minimum) ile 240 (maksimum) ms arasında değişir. » Tüm cihazların 30 %'si daha iyi. Bu, ölçülen yanıt süresinin test edilen tüm cihazların ortalamasından (19.9 ms) daha iyi olduğu anlamına gelir. | ||
| ↔ Tepki Süresi %50 Griden %80 Griye | ||
| 16.8 ms ... yükseliş ↗ ve sonbahar↘ birleşimi | ↗ 8.4 ms yükseliş | 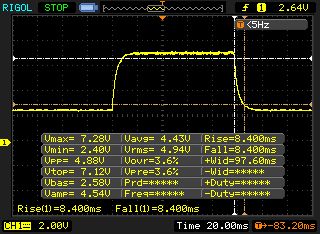 |
| ↘ 8.4 ms sonbahar | ||
| Ekran, testlerimizde iyi yanıt oranları gösteriyor ancak rekabetçi oyuncular için çok yavaş olabilir. Karşılaştırıldığında, test edilen tüm cihazlar 0.165 (minimum) ile 636 (maksimum) ms arasında değişir. » Tüm cihazların 31 %'si daha iyi. Bu, ölçülen yanıt süresinin test edilen tüm cihazların ortalamasından (31.1 ms) daha iyi olduğu anlamına gelir. | ||
Ekran Titremesi / PWM (Darbe Genişliği Modülasyonu)
| Ekran titriyor / PWM algılanmadı | 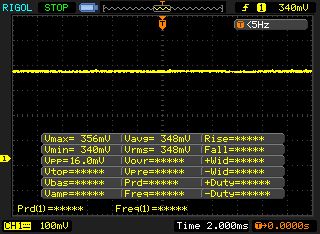 | ||
Karşılaştırıldığında: Test edilen tüm cihazların %52 %'si ekranı karartmak için PWM kullanmıyor. PWM tespit edilirse, ortalama 7784 (minimum: 5 - maksimum: 343500) Hz ölçüldü. | |||
| PCMark 8 Home Score Accelerated v2 | 4504 puan | |
| PCMark 8 Work Score Accelerated v2 | 5676 puan | |
| PCMark 10 Score | 5059 puan | |
Yardım | ||
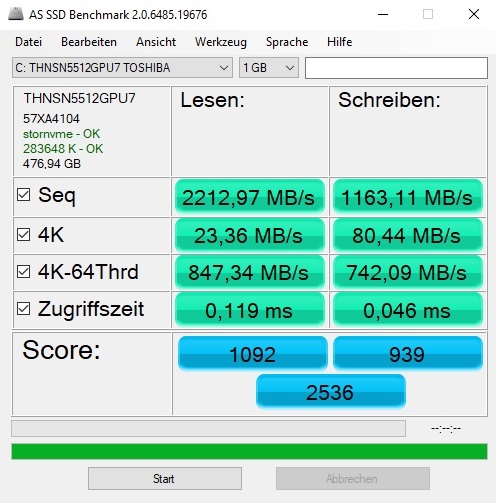
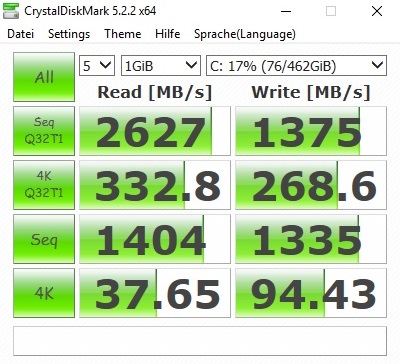
| Gigabyte Aero 15X v8 Toshiba NVMe THNSN5512GPU7 | Gigabyte Aero 15X Samsung SM961 MZVKW512HMJP m.2 PCI-e | MSI GS63VR 7RG-005 Samsung SM961 MZVPW256HEGL | Asus Zephyrus M GM501 Samsung SM961 MZVKW512HMJP m.2 PCI-e | Acer Predator Triton 700 2x SK Hynix Canvas SC300 512GB M.2 (HFS512G39MND) (RAID 0) | Ortalama Toshiba NVMe THNSN5512GPU7 | |
|---|---|---|---|---|---|---|
| AS SSD | 39% | 48% | 37% | 42% | 6% | |
| Seq Read (MB/s) | 2213 | 2508 13% | 2382 8% | 2091 -6% | 2517 14% | 2096 ? -5% |
| Seq Write (MB/s) | 1163 | 1124 -3% | 1281 10% | 1580 36% | 2372 104% | 1175 ? 1% |
| 4K Read (MB/s) | 23.36 | 46.56 99% | 51 118% | 43.42 86% | 41.47 78% | 31 ? 33% |
| 4K Write (MB/s) | 80.4 | 113.8 42% | 124.7 55% | 90.2 12% | 93 16% | 101.7 ? 26% |
| Score Read (Points) | 1092 | 1522 39% | 1795 64% | 1471 35% | 1350 24% | 1069 ? -2% |
| Score Write (Points) | 939 | 1333 42% | 1185 26% | 1446 54% | 1243 32% | 869 ? -7% |
| Score Total (Points) | 2536 | 3570 41% | 3848 52% | 3649 44% | 3282 29% | 2444 ? -4% |

| 3DMark 11 Performance | 15502 puan | |
| 3DMark Ice Storm Standard Score | 152533 puan | |
| 3DMark Cloud Gate Standard Score | 34461 puan | |
| 3DMark Fire Strike Score | 13281 puan | |
Yardım | ||
| The Witcher 3 - 1920x1080 Ultra Graphics & Postprocessing (HBAO+) | |
| Sınıf ortalaması Gaming (95 - 240, n=8, son 2 yıl) | |
| Acer Predator Triton 700 | |
| Asus Zephyrus M GM501 | |
| Gigabyte Aero 15X | |
| Gigabyte Aero 15X v8 | |
| Ortalama NVIDIA GeForce GTX 1070 Max-Q (46 - 55.3, n=19) | |
| MSI GS63VR 7RG-005 | |
| düşük | orta | yüksek | ultra | |
|---|---|---|---|---|
| The Witcher 3 (2015) | 92.8 | 52.4 | ||
| FIFA 18 (2017) | 153 | 152 | ||
| Wolfenstein II: The New Colossus (2017) | 89.4 | 83 | ||
| Star Wars Battlefront 2 (2017) | 88.9 | 78.5 | ||
| Fortnite (2018) | 122 | 101 | ||
| Final Fantasy XV Benchmark (2018) | 51.7 | |||
| Kingdom Come: Deliverance (2018) | 64.8 | 50.2 | ||
| Far Cry 5 (2018) | 79 | 75 |
Ses yüksekliği
| Boşta |
| 30 / 31 / 35 dB |
| Çalışırken |
| 49 / 54 dB |
 | ||
30 dB sessiz 40 dB(A) duyulabilirlik 50 dB(A) gürültülü |
||
min: | ||
| Gigabyte Aero 15X v8 GeForce GTX 1070 Max-Q, i7-8750H | Gigabyte Aero 15X GeForce GTX 1070 Max-Q, i7-7700HQ | MSI GS63VR 7RG-005 GeForce GTX 1070 Max-Q, i7-7700HQ | Asus Zephyrus M GM501 GeForce GTX 1070 Mobile, i7-8750H | Acer Predator Triton 700 GeForce GTX 1080 Max-Q, i7-7700HQ | Ortalama NVIDIA GeForce GTX 1070 Max-Q | Sınıf ortalaması Gaming | |
|---|---|---|---|---|---|---|---|
| Noise | 4% | 4% | 2% | 0% | 3% | 12% | |
| kapalı / ortam * (dB) | 29 | 30 -3% | 30 -3% | 29 -0% | 31 -7% | 29.4 ? -1% | 24.1 ? 17% |
| Idle Minimum * (dB) | 30 | 31 -3% | 31 -3% | 30 -0% | 33 -10% | 30.5 ? -2% | 25.8 ? 14% |
| Idle Average * (dB) | 31 | 32 -3% | 34 -10% | 31 -0% | 34 -10% | 31.8 ? -3% | 27.4 ? 12% |
| Idle Maximum * (dB) | 35 | 36 -3% | 35 -0% | 33 6% | 40 -14% | 34.6 ? 1% | 29.9 ? 15% |
| Load Average * (dB) | 49 | 39 20% | 42 14% | 49 -0% | 41 16% | 43.2 ? 12% | 43 ? 12% |
| Witcher 3 ultra * (dB) | 51 | 44 14% | 44 14% | 50 2% | 43 16% | ||
| Load Maximum * (dB) | 54 | 52 4% | 46 15% | 52 4% | 48 11% | 48.2 ? 11% | 54 ? -0% |
* ... daha küçük daha iyidir
(-) Üst taraftaki maksimum sıcaklık, 40.4 °C / 105 F ortalamasına kıyasla 53 °C / 127 F'dir. , Gaming sınıfı için 21.2 ile 68.8 °C arasında değişir.
(-) Alt kısım, 43.2 °C / 110 F ortalamasına kıyasla maksimum 65 °C / 149 F'ye kadar ısınır
(+) Boşta kullanımda, üst tarafın ortalama sıcaklığı 24.8 °C / 77 F olup, cihazın 33.9 °C / 93 F.
(-) The Witcher 3 oynarken, üst tarafın ortalama sıcaklığı 40.8 °C / 105 F olup, cihazın 33.9 °C / 93 F.
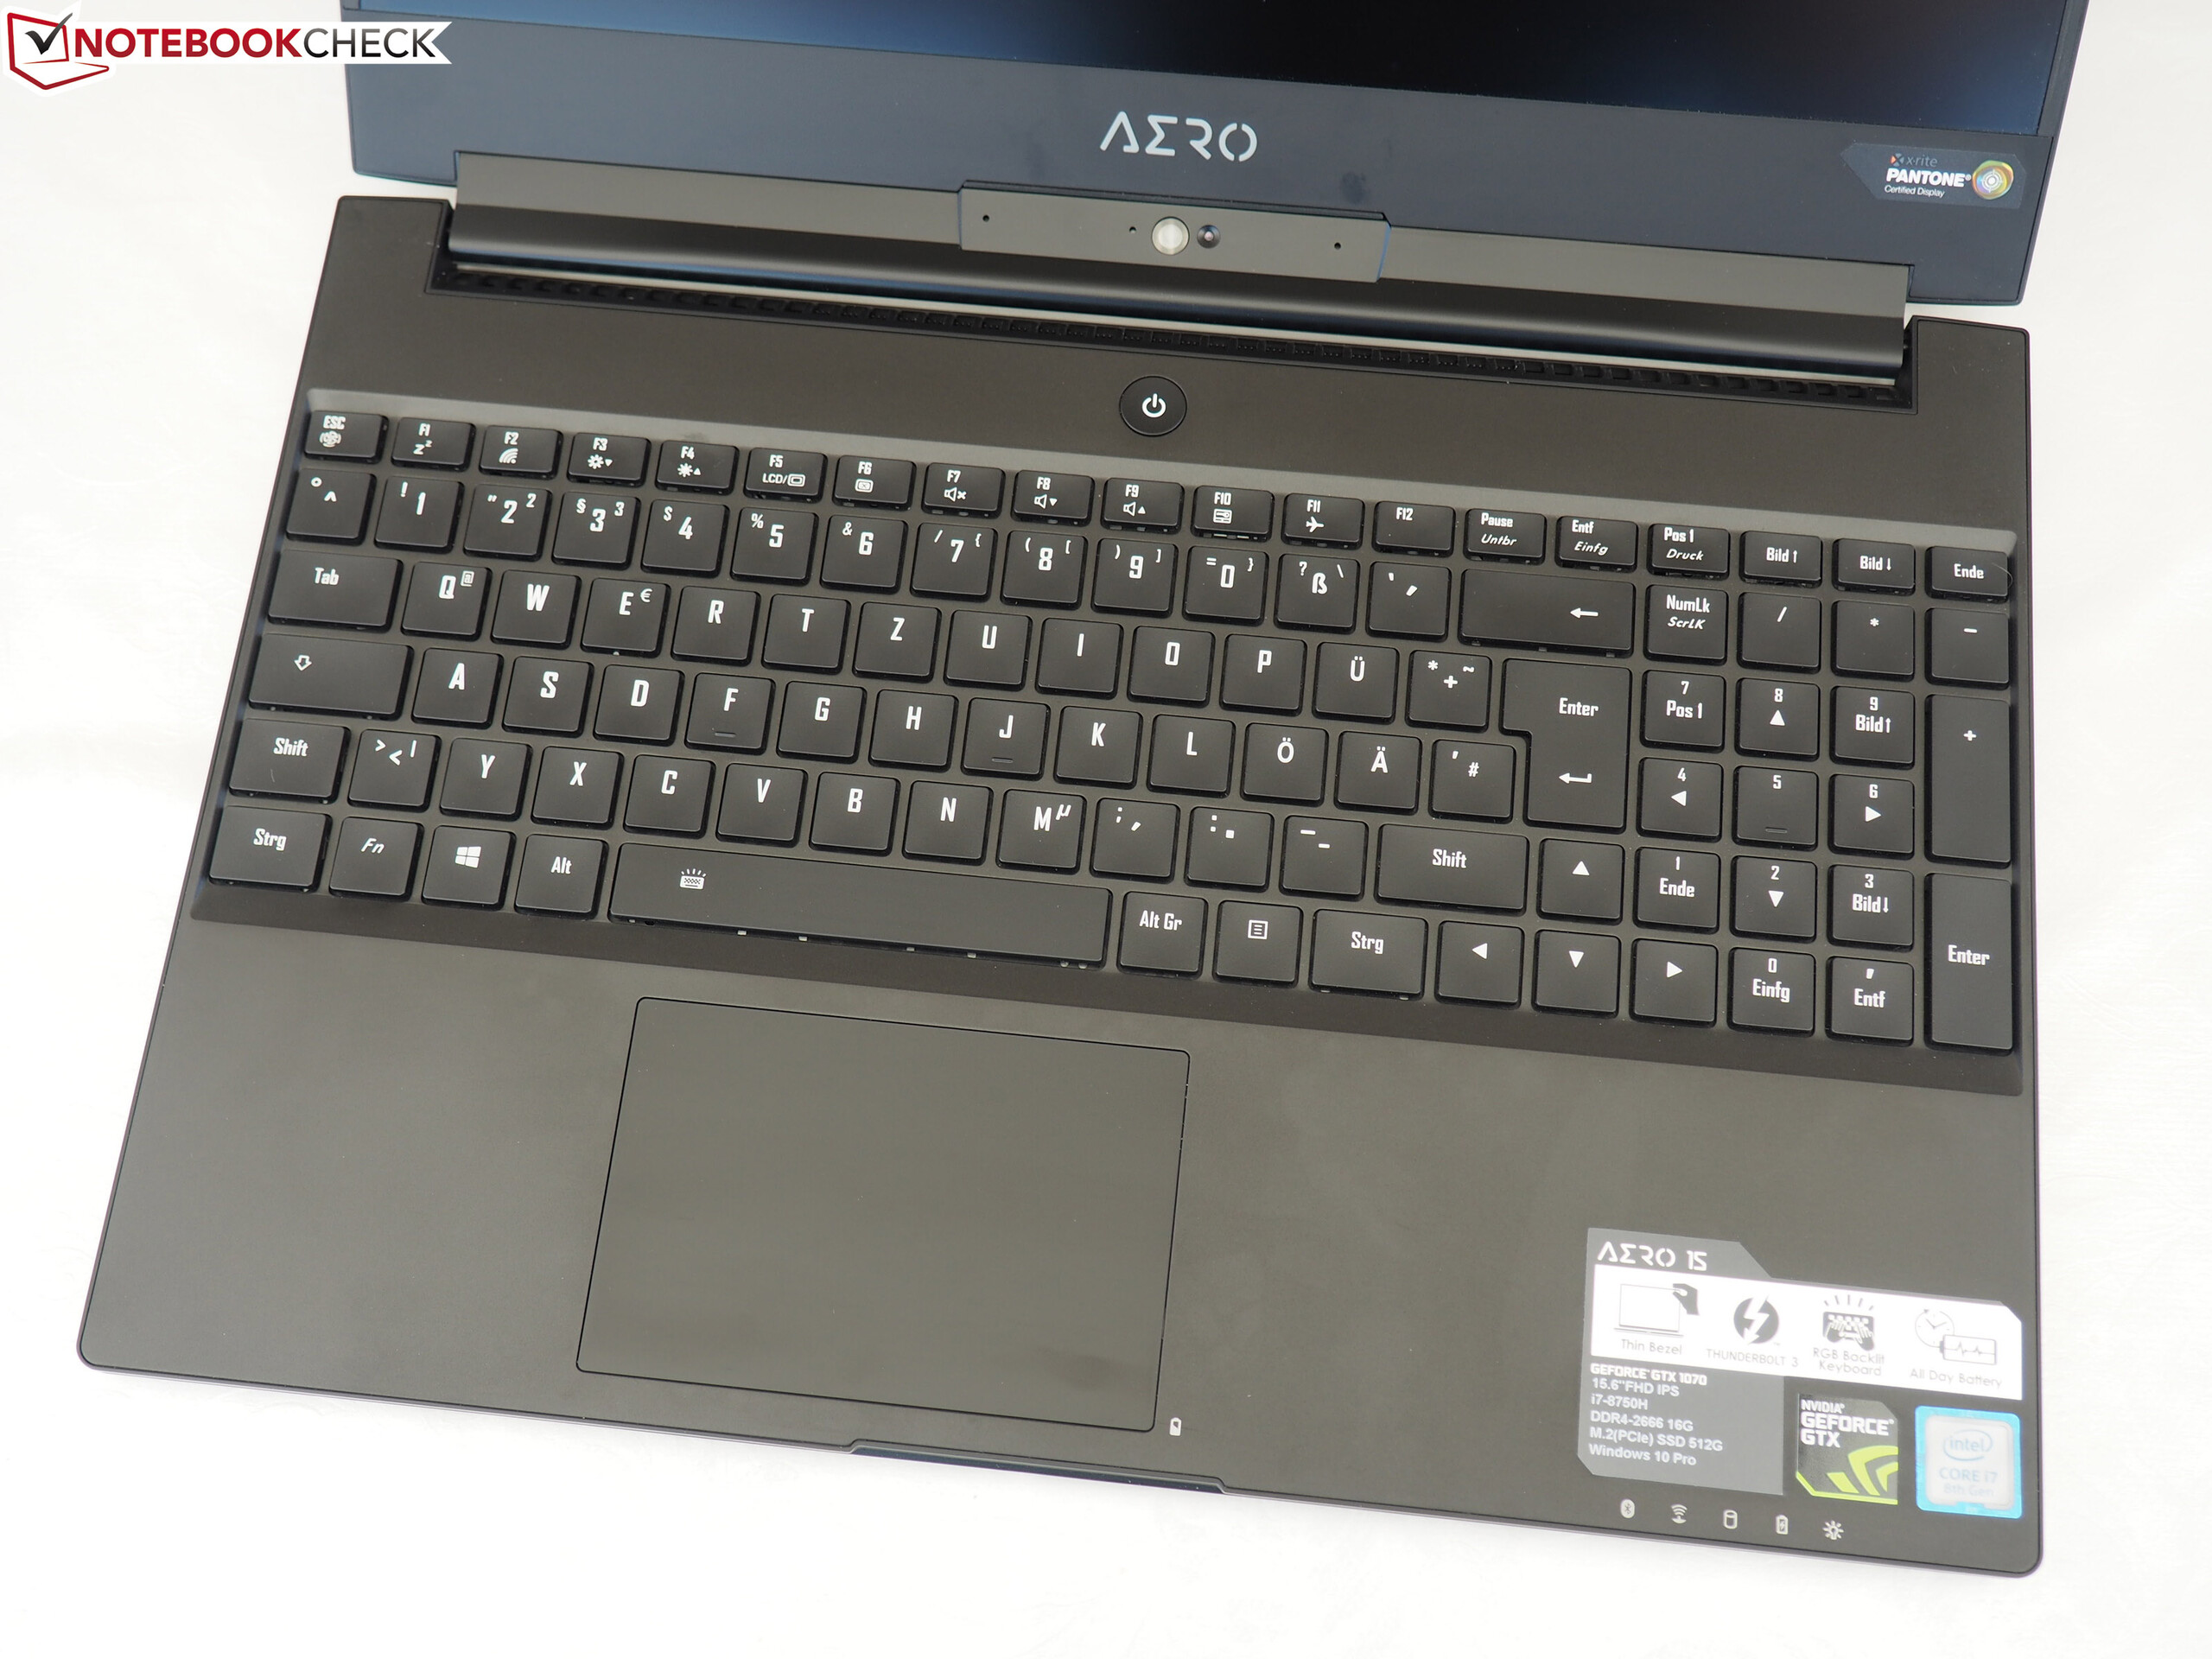
(±) Avuç içi dayanakları ve dokunmatik yüzey maksimum 38 °C / 100.4 F ile dokunulamayacak kadar ısınabilir.
(-) Benzer cihazların avuç içi dayanağı alanının ortalama sıcaklığı 28.8 °C / 83.8 F (-9.2 °C / -16.6 F) idi.
| Gigabyte Aero 15X v8 GeForce GTX 1070 Max-Q, i7-8750H | Gigabyte Aero 15X GeForce GTX 1070 Max-Q, i7-7700HQ | MSI GS63VR 7RG-005 GeForce GTX 1070 Max-Q, i7-7700HQ | Asus Zephyrus M GM501 GeForce GTX 1070 Mobile, i7-8750H | Acer Predator Triton 700 GeForce GTX 1080 Max-Q, i7-7700HQ | Ortalama NVIDIA GeForce GTX 1070 Max-Q | Sınıf ortalaması Gaming | |
|---|---|---|---|---|---|---|---|
| Heat | 9% | 7% | 1% | -10% | 1% | 2% | |
| Maximum Upper Side * (°C) | 53 | 51 4% | 47 11% | 52 2% | 61 -15% | 52.1 ? 2% | 45.2 ? 15% |
| Maximum Bottom * (°C) | 65 | 58 11% | 63 3% | 49 25% | 69 -6% | 57.3 ? 12% | 47.9 ? 26% |
| Idle Upper Side * (°C) | 26 | 25 4% | 25 4% | 31 -19% | 29 -12% | 29.2 ? -12% | 31.1 ? -20% |
| Idle Bottom * (°C) | 30 | 25 17% | 27 10% | 31 -3% | 32 -7% | 29.9 ? -0% | 34.2 ? -14% |
* ... daha küçük daha iyidir
Gigabyte Aero 15X v8 ses analizi
(±) | hoparlör ses yüksekliği ortalama ama iyi (78 dB)
Bas 100 - 315Hz
(-) | neredeyse hiç bas yok - ortalama olarak medyandan 16.8% daha düşük
(±) | Bas doğrusallığı ortalamadır (11.6% delta - önceki frekans)
Ortalar 400 - 2000 Hz
(+) | dengeli ortalar - medyandan yalnızca 4.3% uzakta
(+) | orta frekanslar doğrusaldır (5% deltadan önceki frekansa)
Yüksekler 2 - 16 kHz
(+) | dengeli yüksekler - medyandan yalnızca 3.6% uzakta
(±) | Yükseklerin doğrusallığı ortalamadır (9.1% delta - önceki frekans)
Toplam 100 - 16.000 Hz
(±) | Genel sesin doğrusallığı ortalamadır (18.4% ortancaya göre fark)
Aynı sınıfla karşılaştırıldığında
» Bu sınıftaki tüm test edilen cihazların %59%'si daha iyi, 9% benzer, 33% daha kötüydü
» En iyisinin deltası 6% idi, ortalama 18% idi, en kötüsü 132% idi
Test edilen tüm cihazlarla karşılaştırıldığında
» Test edilen tüm cihazların %41'si daha iyi, 8 benzer, % 52 daha kötüydü
» En iyisinin deltası 4% idi, ortalama 24% idi, en kötüsü 134% idi
MSI GS63VR 7RG-005 ses analizi
(+) | hoparlörler nispeten yüksek sesle çalabilir (90 dB)
Bas 100 - 315Hz
(-) | neredeyse hiç bas yok - ortalama olarak medyandan 21.3% daha düşük
(-) | bas doğrusal değildir (15.2% delta ile önceki frekans)
Ortalar 400 - 2000 Hz
(±) | daha yüksek ortalar - ortalama olarak medyandan 11% daha yüksek
(±) | Ortaların doğrusallığı ortalamadır (10% delta - önceki frekans)
Yüksekler 2 - 16 kHz
(+) | dengeli yüksekler - medyandan yalnızca 3.4% uzakta
(±) | Yükseklerin doğrusallığı ortalamadır (9.2% delta - önceki frekans)
Toplam 100 - 16.000 Hz
(±) | Genel sesin doğrusallığı ortalamadır (24.2% ortancaya göre fark)
Aynı sınıfla karşılaştırıldığında
» Bu sınıftaki tüm test edilen cihazların %87%'si daha iyi, 4% benzer, 9% daha kötüydü
» En iyisinin deltası 6% idi, ortalama 18% idi, en kötüsü 132% idi
Test edilen tüm cihazlarla karşılaştırıldığında
» Test edilen tüm cihazların %73'si daha iyi, 6 benzer, % 21 daha kötüydü
» En iyisinin deltası 4% idi, ortalama 24% idi, en kötüsü 134% idi
| Kapalı / Bekleme modu | |
| Boşta | |
| Çalışırken |
|
Key:
min: | |
| Gigabyte Aero 15X v8 GeForce GTX 1070 Max-Q, i7-8750H | Gigabyte Aero 15X GeForce GTX 1070 Max-Q, i7-7700HQ | MSI GS63VR 7RG-005 GeForce GTX 1070 Max-Q, i7-7700HQ | Asus Zephyrus M GM501 GeForce GTX 1070 Mobile, i7-8750H | Acer Predator Triton 700 GeForce GTX 1080 Max-Q, i7-7700HQ | Ortalama NVIDIA GeForce GTX 1070 Max-Q | Sınıf ortalaması Gaming | |
|---|---|---|---|---|---|---|---|
| Power Consumption | 17% | 9% | -16% | -52% | 6% | -15% | |
| Idle Minimum * (Watt) | 14 | 10 29% | 12 14% | 16 -14% | 28 -100% | 11.4 ? 19% | 13.2 ? 6% |
| Idle Average * (Watt) | 18 | 13 28% | 16 11% | 19 -6% | 33 -83% | 15.7 ? 13% | 18.9 ? -5% |
| Idle Maximum * (Watt) | 22 | 20 9% | 21 5% | 26 -18% | 41 -86% | 20.7 ? 6% | 24.3 ? -10% |
| Load Average * (Watt) | 91 | 79 13% | 85 7% | 103 -13% | 94 -3% | 98.1 ? -8% | 108.3 ? -19% |
| Witcher 3 ultra * (Watt) | 142 | 120 15% | 128 10% | 164 -15% | 160 -13% | ||
| Load Maximum * (Watt) | 173 | 165 5% | 162 6% | 223 -29% | 222 -28% | 173.8 ? -0% | 254 ? -47% |
* ... daha küçük daha iyidir
| Gigabyte Aero 15X v8 GeForce GTX 1070 Max-Q, i7-8750H, 94.24 Wh | Gigabyte Aero 15X GeForce GTX 1070 Max-Q, i7-7700HQ, 94.2 Wh | MSI GS63VR 7RG-005 GeForce GTX 1070 Max-Q, i7-7700HQ, 52.4 Wh | Asus Zephyrus M GM501 GeForce GTX 1070 Mobile, i7-8750H, 55 Wh | Acer Predator Triton 700 GeForce GTX 1080 Max-Q, i7-7700HQ, 54 Wh | Sınıf ortalaması Gaming | |
|---|---|---|---|---|---|---|
| Pil Çalışma Süresi | -3% | -57% | -65% | -71% | -24% | |
| Reader / Idle (h) | 12.7 | 13 2% | 5.7 -55% | 4 -69% | 2.5 -80% | 8.71 ? -31% |
| H.264 (h) | 8.4 | 7.6 -10% | 3.8 -55% | 2.7 -68% | 1.8 -79% | 8.26 ? -2% |
| WiFi v1.3 (h) | 8.6 | 8.2 -5% | 3.9 -55% | 2.7 -69% | 2.4 -72% | 7.04 ? -18% |
| Load (h) | 2.6 | 2.6 0% | 1 -62% | 1.2 -54% | 1.2 -54% | 1.47 ? -43% |
Artılar
Eksiler
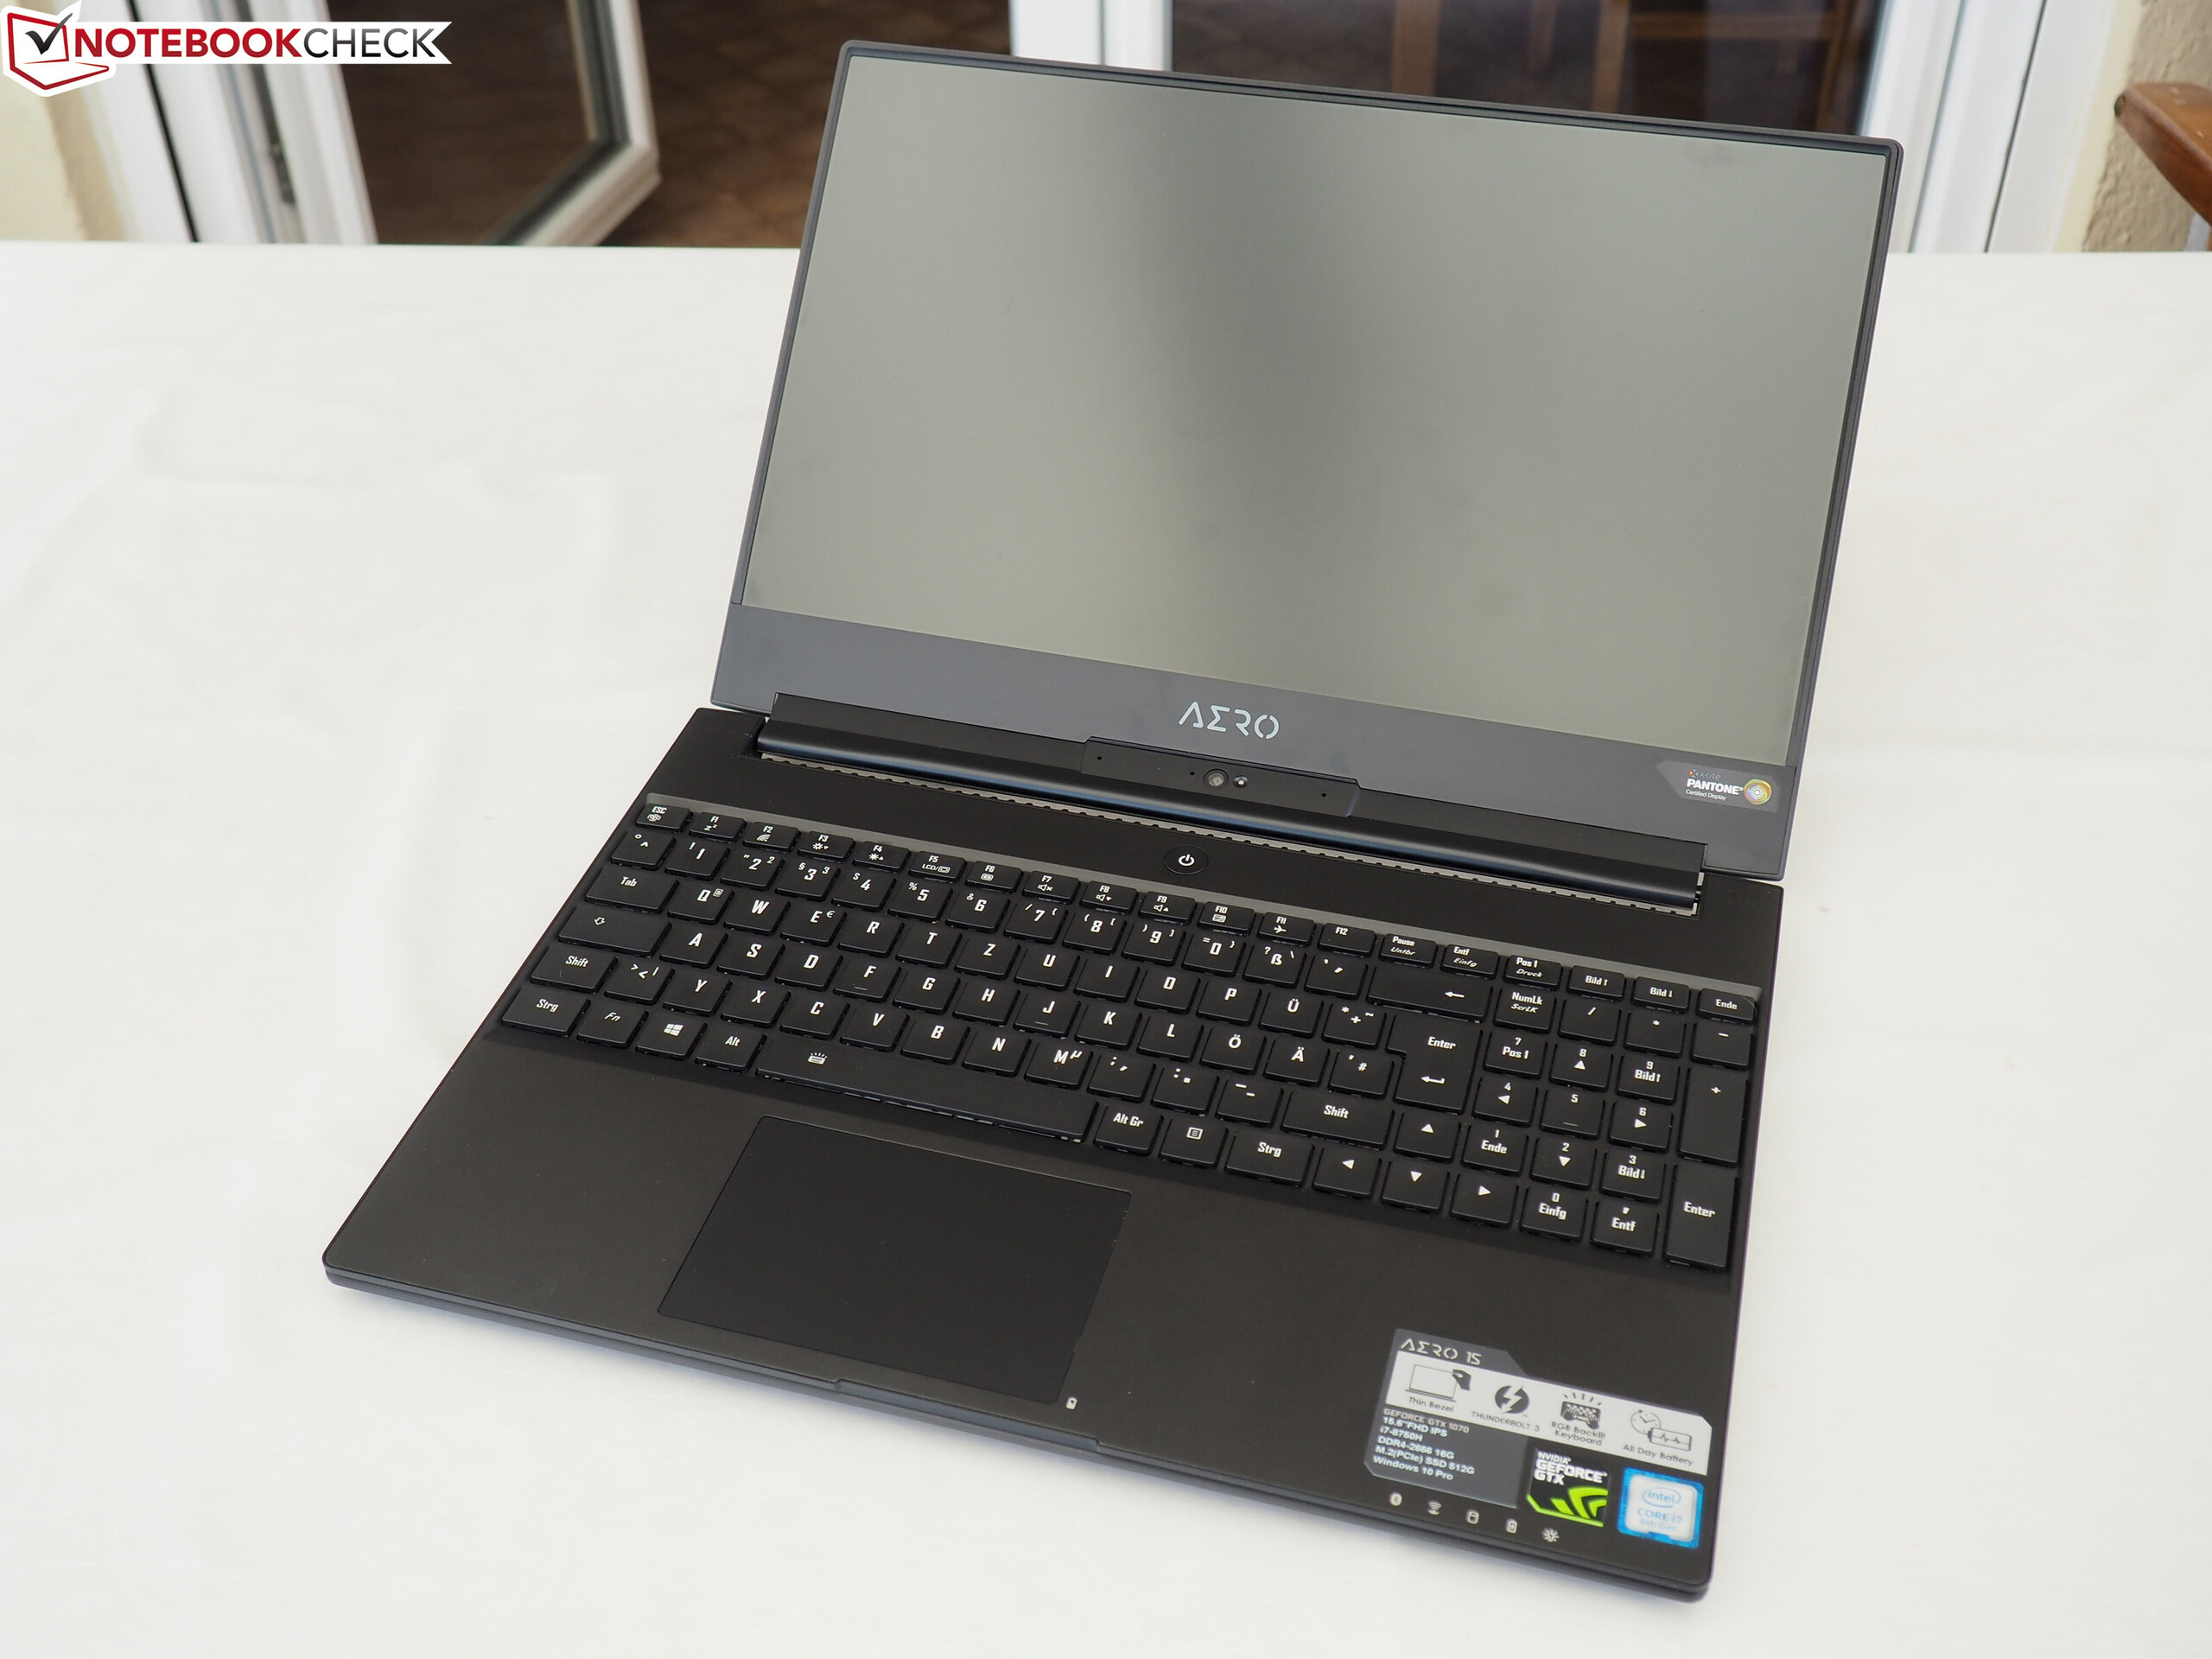
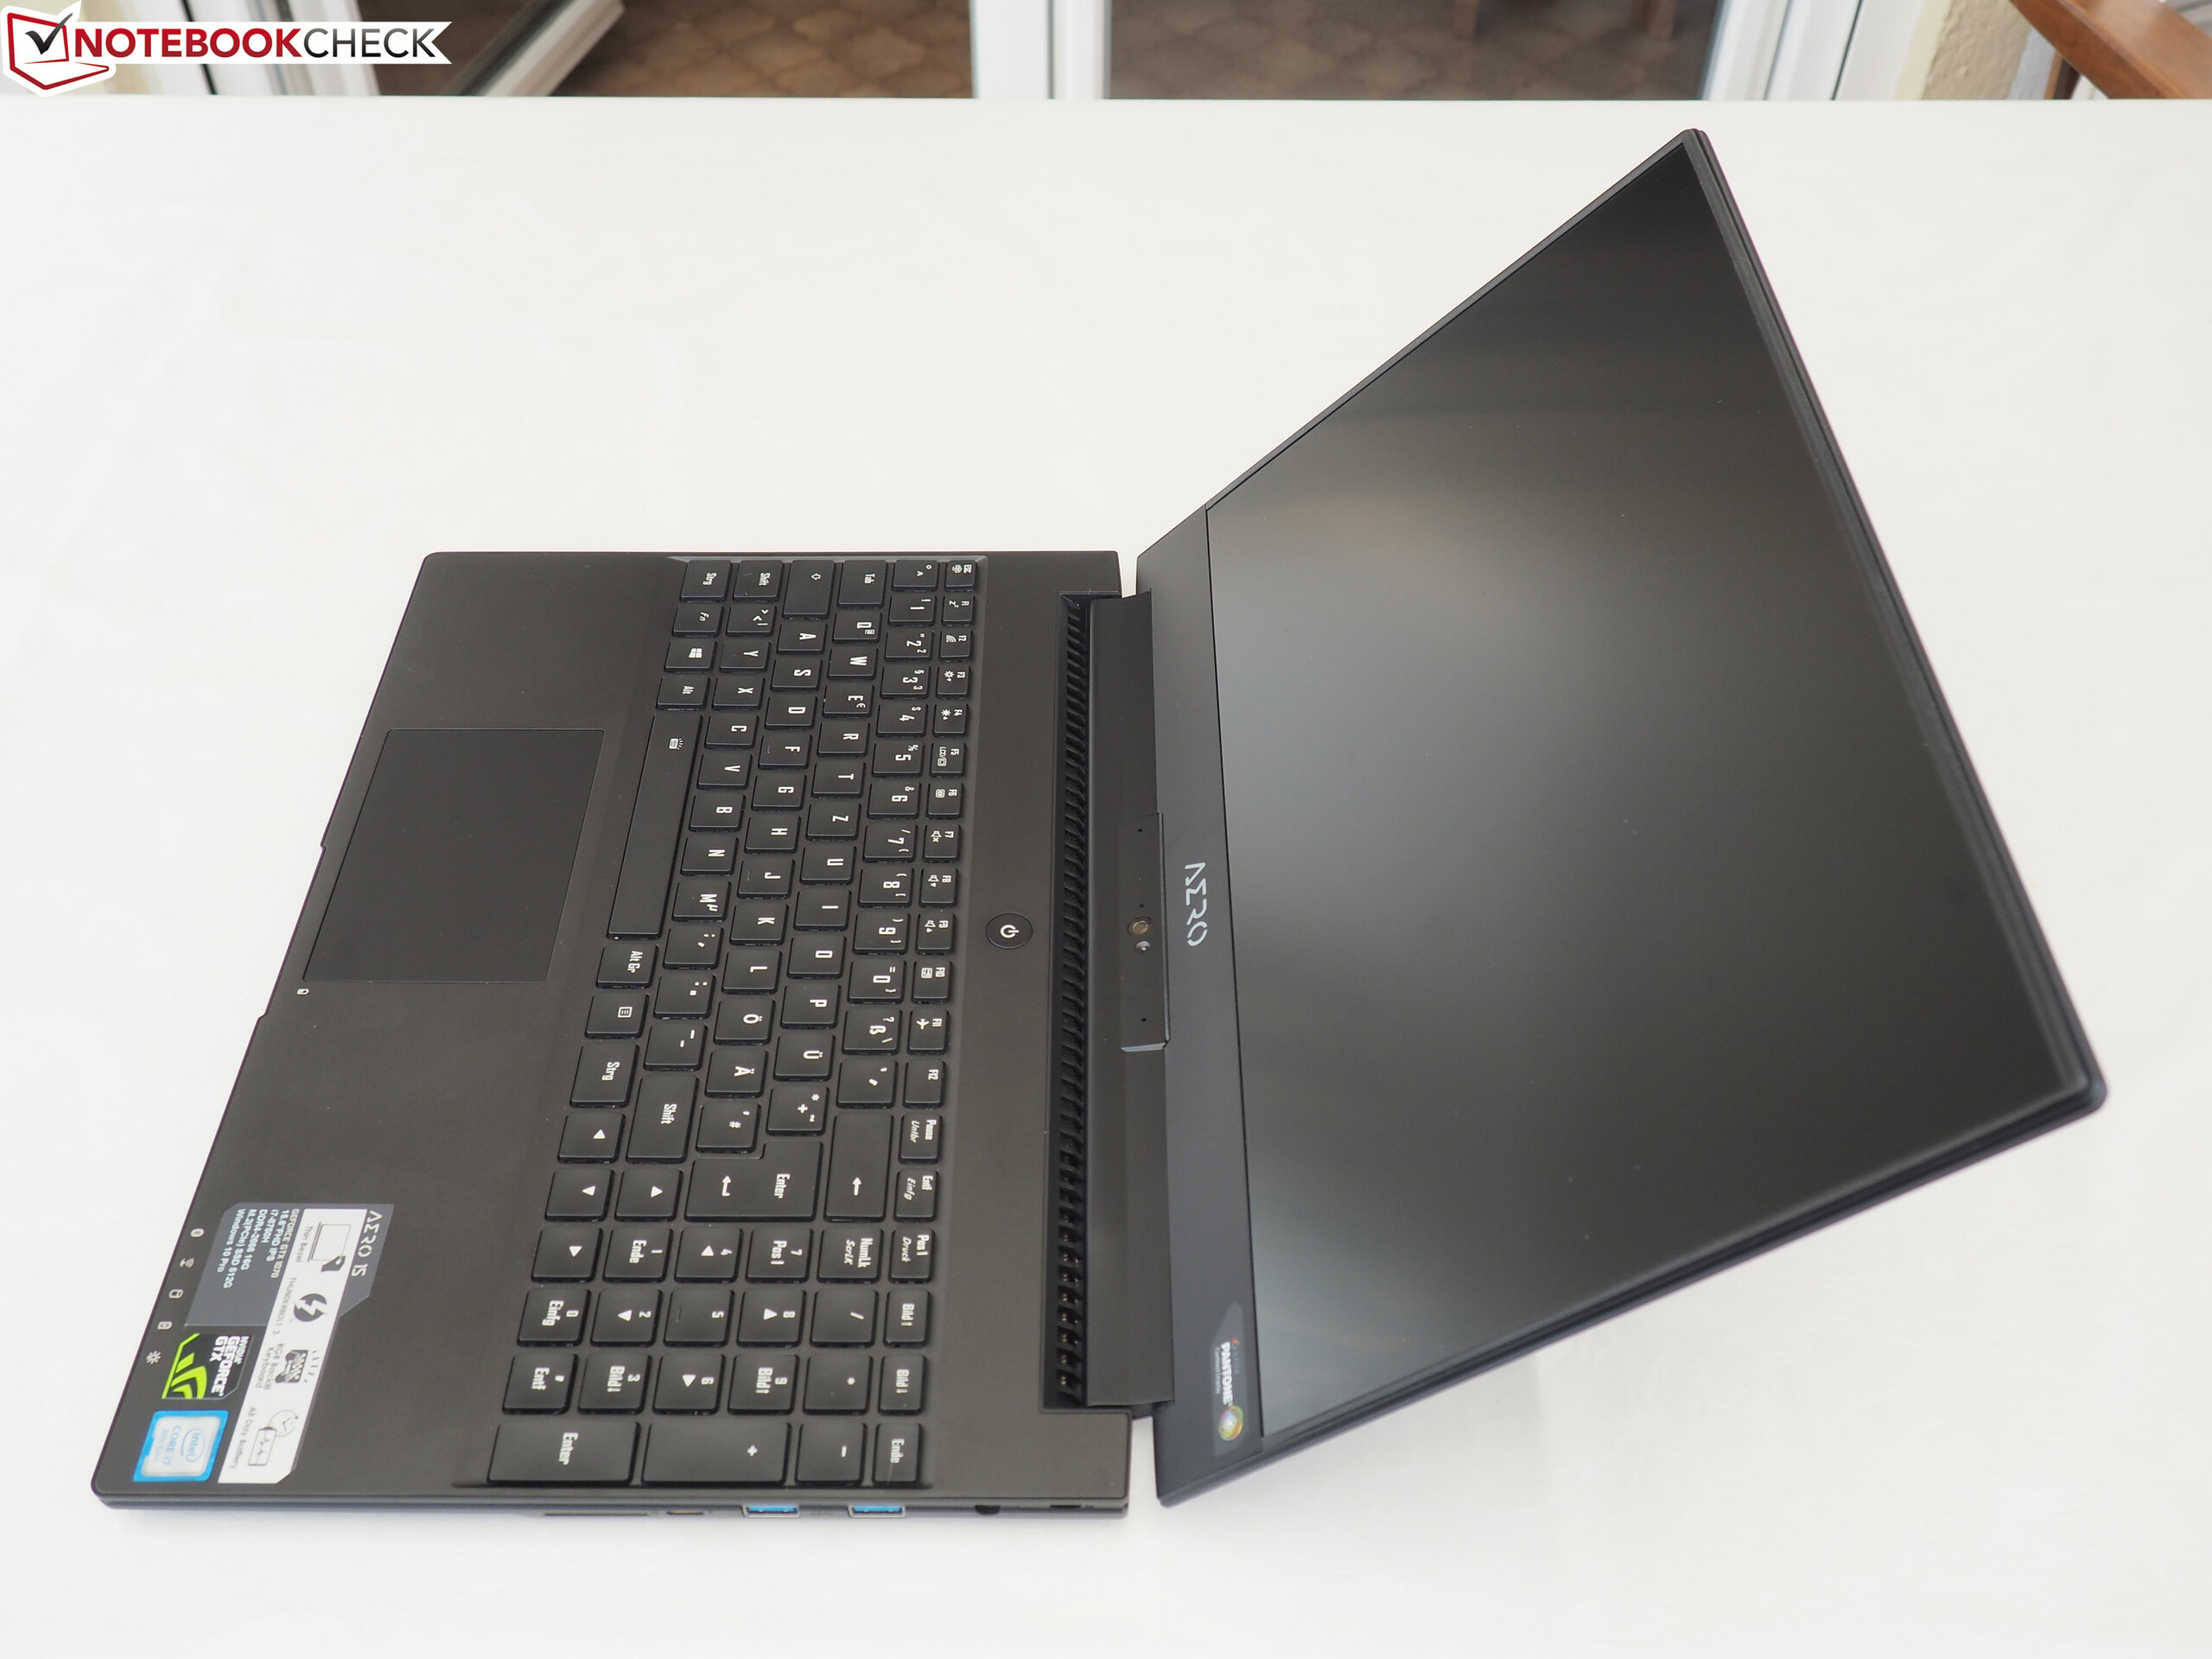
İnce, yüksek kalite üst sınıf laptoplar söz konusu olduğunda Gigabyte Aero 15X ve Asus GM501 tepe için yarışıyor. Her biri de kendi güçlü ve zayıf yönlerine sahip.
ROG Zepyhrus M daha güçlü bir ekran kartına sahip ve düşük sıcaklık değerleri ile gelirken Gigabyte daha iyi arayüzler, daha fazla bağlantı olanağı ve daha uzun batarya ömrü ile geliyor. Dar ekran çerçevesi ve renk tutarlılığı da kalabalıktan ayrılmasını sağlıyor.
Tüm bunlara karşın Gigabyte'ın sistem sesini kontrol altına alması gerek. Şu haliyle rahatsız edici olmasa da duyulabilir ses çıkarması duyarlı kullanıcıların satın almasını önleyebilir. Intel'ın 6 çekirdekl çipi soğutma sistemini sınırlarına 4 çekirdekli işlemcilere göre daha çabuk ve sık getiriyor.
İncelemenin orjinali için tıklayın.
Gigabyte Aero 15X v8
- 04/04/2018 v6 (old)
Florian Glaser
Price comparison