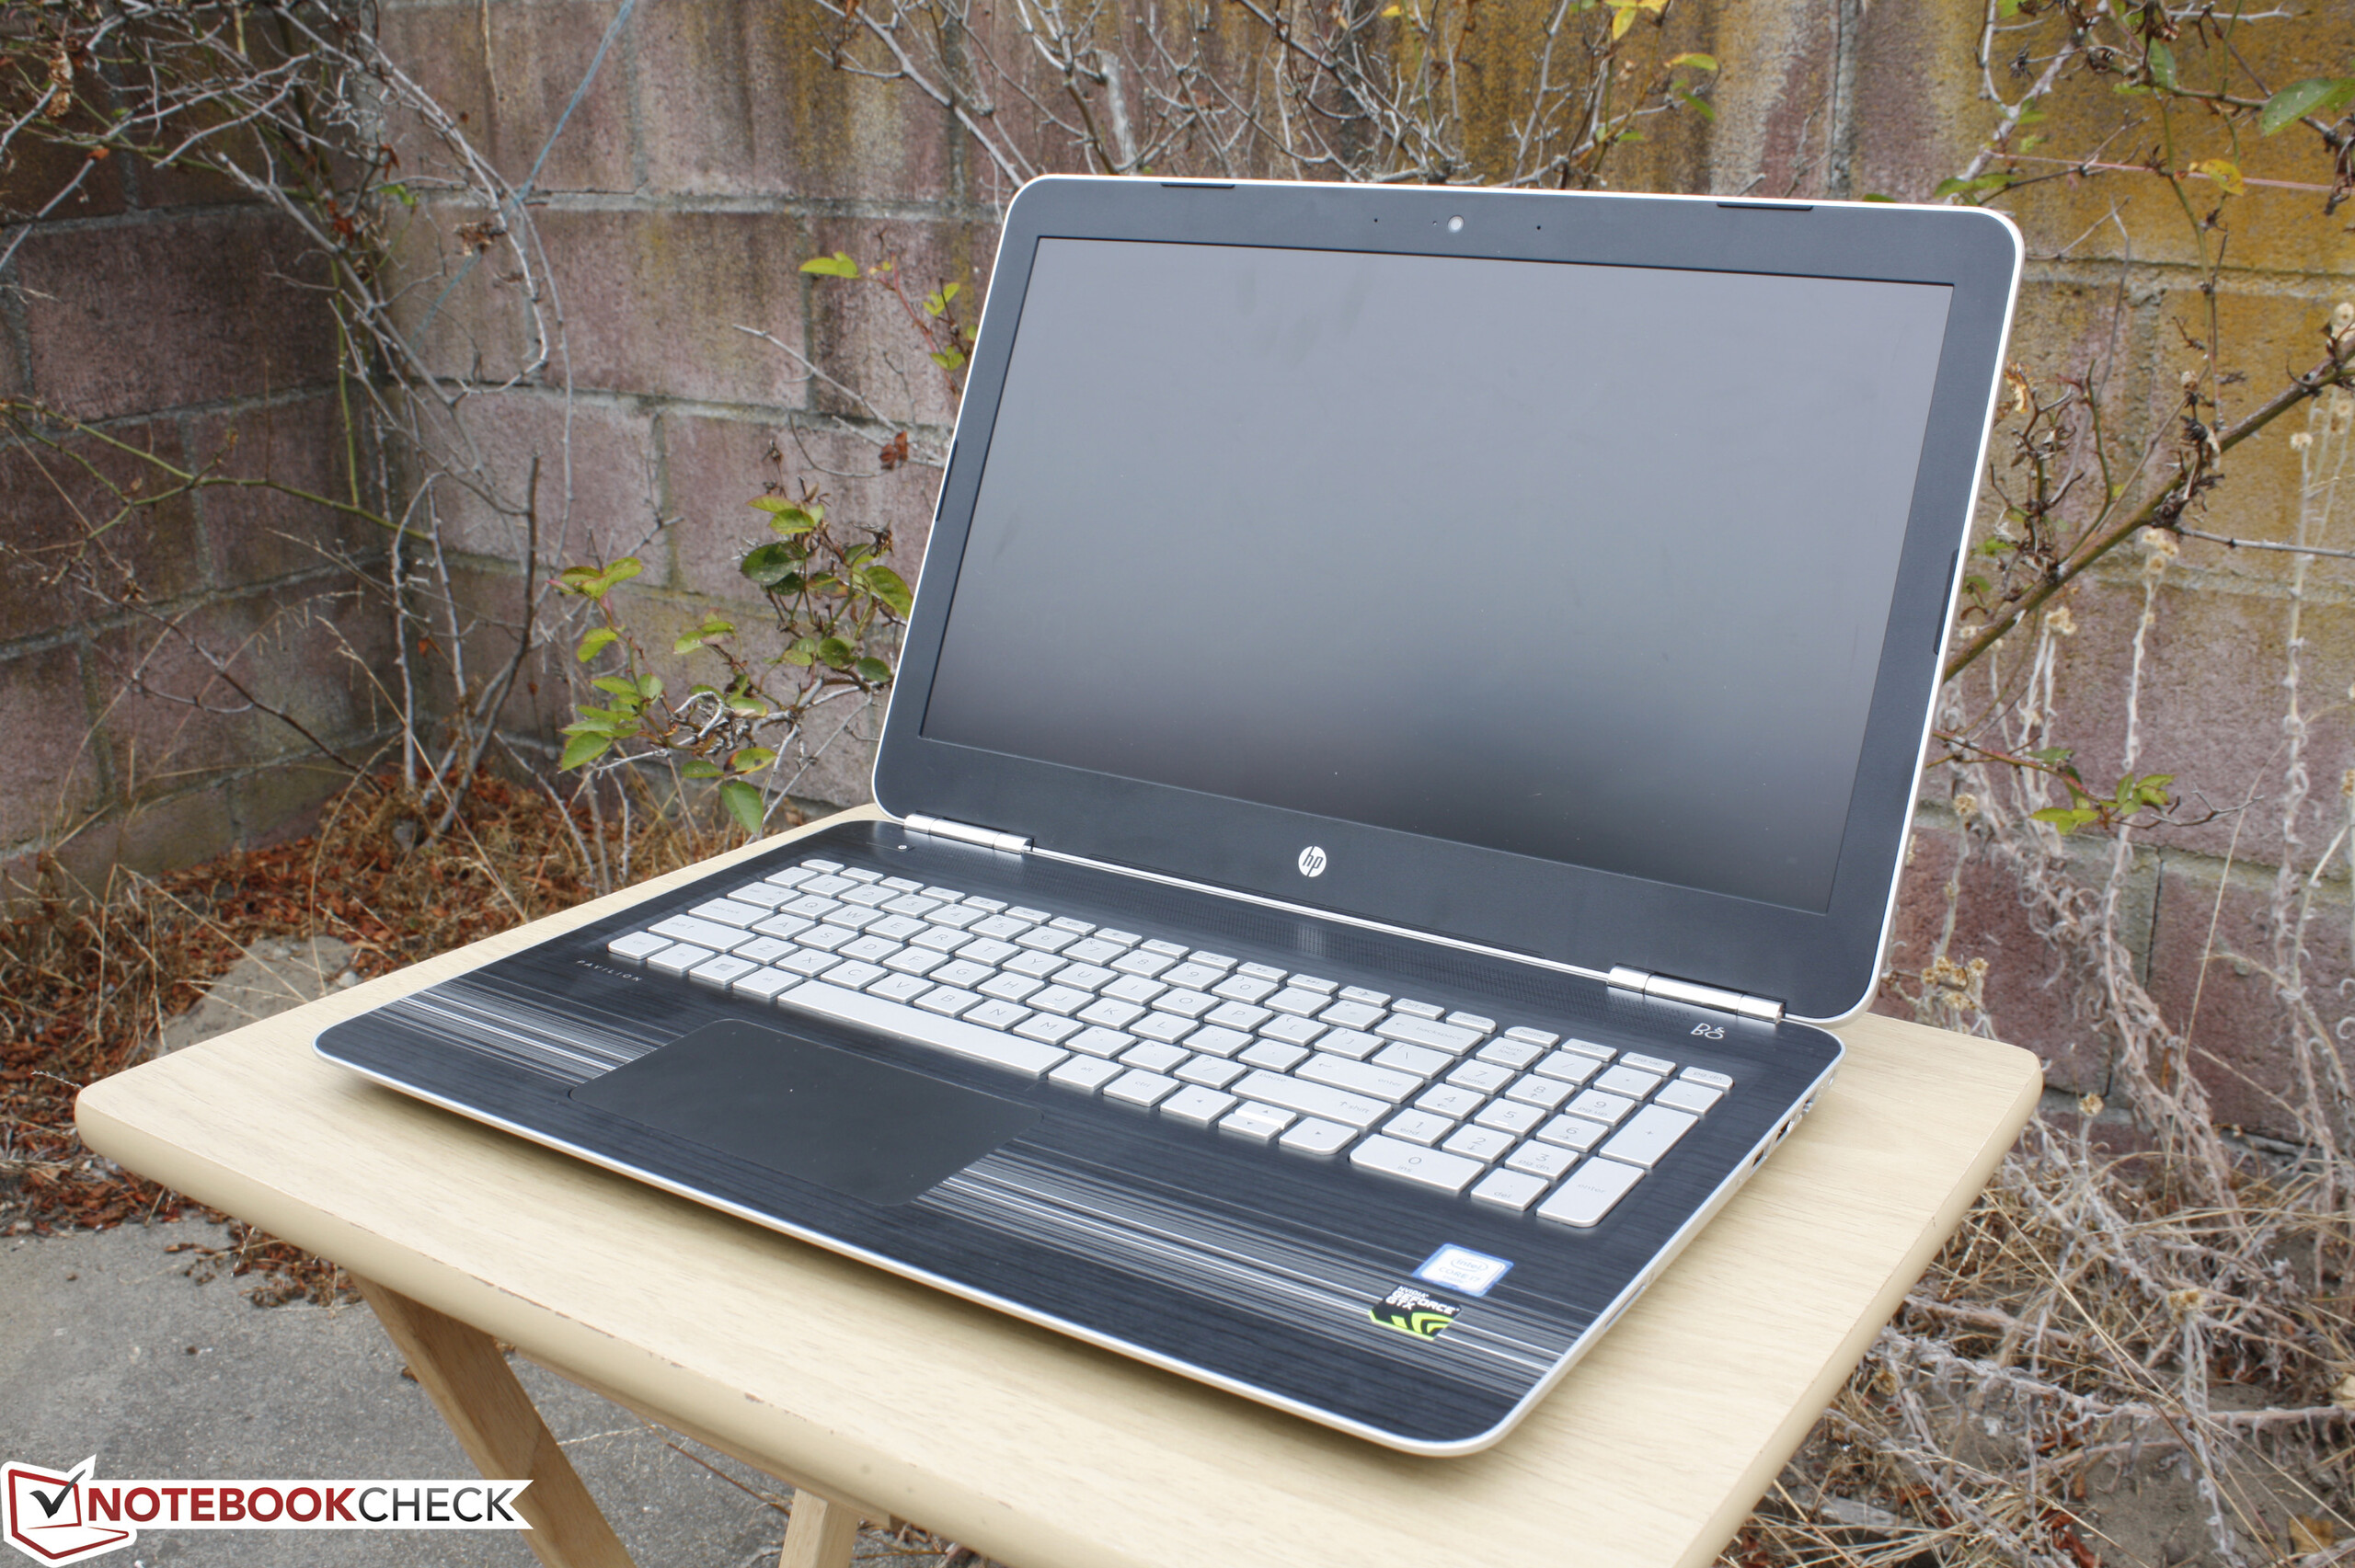
Kısa inceleme: HP Pavilion 15 UHD T9Y85AV Notebook


| SD Card Reader | |
| average JPG Copy Test (av. of 3 runs) | |
| Dell XPS 13 2016 9350 (FHD, i7-6560U) | |
| HP Pavilion 15-bk001ng x360 | |
| Apple MacBook Pro Retina 13 inch 2013-10 | |
| HP Pavilion 15 UHD T9Y85AV | |
| maximum AS SSD Seq Read Test (1GB) | |
| Dell XPS 13 2016 9350 (FHD, i7-6560U) | |
| HP Pavilion 15 UHD T9Y85AV | |
| HP Pavilion 15-bk001ng x360 | |
| Networking | |
| iperf Server (receive) TCP 1 m | |
| Apple MacBook 12 (Early 2016) 1.1 GHz | |
| Asus ZenPad 8.0 Z380M-6B026A | |
| iperf Client (transmit) TCP 1 m | |
| Apple MacBook 12 (Early 2016) 1.1 GHz | |
| Asus ZenPad 8.0 Z380M-6B026A | |
| |||||||||||||||||||||||||
Aydınlatma: 87 %
Batarya modunda parlaklık: 336.2 cd/m²
Kontrast: 534:1 (Siyah: 0.629 cd/m²)
ΔE ColorChecker Calman: 3.32 | ∀{0.5-29.43 Ø4.71}
ΔE Greyscale Calman: 2.88 | ∀{0.09-98 Ø4.96}
85.5% sRGB (Argyll 1.6.3 3D)
55.3% AdobeRGB 1998 (Argyll 1.6.3 3D)
61.8% AdobeRGB 1998 (Argyll 3D)
85.8% sRGB (Argyll 3D)
60% Display P3 (Argyll 3D)
Gamma: 2.34
CCT: 6279 K
| HP Pavilion 15 UHD T9Y85AV SDC5958, IPS, 15.6", 3840x2160 | HP Pavilion 15-ak003ng Samsung SDC5544, IPS, 15.6", 1920x1080 | MSI GL62-6QFi781H11 CMN N156HGE-EAL (CMN15D2), TN LED, 15.6", 1920x1080 | Asus ZenBook Pro UX501VW-DS71T IPS, 15.6", 3840x2160 | HP Omen 15-ax007ng LGD0519, IPS, 15.6", 1920x1080 | |
|---|---|---|---|---|---|
| Display | -27% | 32% | 6% | -16% | |
| Display P3 Coverage (%) | 60 | 43.03 -28% | 85.8 43% | 64.3 7% | 59.9 0% 40.34 -33% |
| sRGB Coverage (%) | 85.8 | 64.7 -25% | 99.8 16% | 89.9 5% | 85.9 0% 60.3 -30% |
| AdobeRGB 1998 Coverage (%) | 61.8 | 44.47 -28% | 84.1 36% | 65.4 6% | 61.6 0% 41.73 -32% |
| Response Times | -12% | 3% | -5% | -27% | |
| Response Time Grey 50% / Grey 80% * (ms) | 39.6 ? | 48 ? -21% | 43 ? -9% | 43.2 ? -9% | 55 ? -39% |
| Response Time Black / White * (ms) | 27.2 ? | 28 ? -3% | 23 ? 15% | 27.2 ? -0% | 31 ? -14% |
| PWM Frequency (Hz) | 1282 ? | 1000 ? | |||
| Screen | 4% | -63% | -22% | -29% | |
| Brightness middle (cd/m²) | 336.2 | 254 -24% | 216 -36% | 252.9 -25% | 214 -36% |
| Brightness (cd/m²) | 323 | 241 -25% | 202 -37% | 250 -23% | 203 -37% |
| Brightness Distribution (%) | 87 | 78 -10% | 83 -5% | 89 2% | 79 -9% |
| Black Level * (cd/m²) | 0.629 | 0.27 57% | 0.48 24% | 0.5 21% | 0.28 55% |
| Contrast (:1) | 534 | 941 76% | 450 -16% | 506 -5% | 764 43% |
| Colorchecker dE 2000 * | 3.32 | 3.54 -7% | 9.98 -201% | 5.22 -57% | 6.04 -82% |
| Colorchecker dE 2000 max. * | 7.4 | 17.12 -131% | 8.33 -13% | 12 -62% | |
| Greyscale dE 2000 * | 2.88 | 2.29 20% | 10.91 -279% | 6.74 -134% | 5.91 -105% |
| Gamma | 2.34 94% | 2.5 88% | 2.31 95% | 2.45 90% | 2.44 90% |
| CCT | 6279 104% | 6698 97% | 13185 49% | 6026 108% | 7362 88% |
| Color Space (Percent of AdobeRGB 1998) (%) | 55.3 | 41 -26% | 75 36% | 58.4 6% | 38 -31% |
| Color Space (Percent of sRGB) (%) | 85.5 | 64 -25% | 100 17% | 89.7 5% | 60 -30% |
| Toplam Ortalama (Program / Ayarlar) | -12% /
-5% | -9% /
-35% | -7% /
-14% | -24% /
-25% |
* ... daha küçük daha iyidir
Yanıt Sürelerini Görüntüle
| ↔ Tepki Süresi Siyahtan Beyaza | ||
|---|---|---|
| 27.2 ms ... yükseliş ↗ ve sonbahar↘ birleşimi | ↗ 7.6 ms yükseliş | 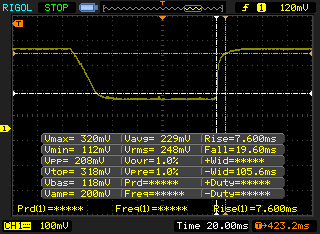 |
| ↘ 19.6 ms sonbahar | ||
| Ekran, testlerimizde nispeten yavaş yanıt oranları gösteriyor ve oyuncular için çok yavaş olabilir. Karşılaştırıldığında, test edilen tüm cihazlar 0.1 (minimum) ile 240 (maksimum) ms arasında değişir. » Tüm cihazların 69 %'si daha iyi. Bu, ölçülen yanıt süresinin test edilen tüm cihazların ortalamasından (19.8 ms) daha kötü olduğu anlamına gelir. | ||
| ↔ Tepki Süresi %50 Griden %80 Griye | ||
| 39.6 ms ... yükseliş ↗ ve sonbahar↘ birleşimi | ↗ 18.4 ms yükseliş | 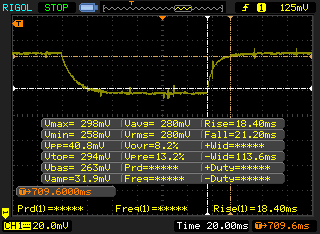 |
| ↘ 21.2 ms sonbahar | ||
| Ekran, testlerimizde yavaş yanıt oranları gösteriyor ve oyuncular için yetersiz olacaktır. Karşılaştırıldığında, test edilen tüm cihazlar 0.165 (minimum) ile 636 (maksimum) ms arasında değişir. » Tüm cihazların 61 %'si daha iyi. Bu, ölçülen yanıt süresinin test edilen tüm cihazların ortalamasından (31 ms) daha kötü olduğu anlamına gelir. | ||
Ekran Titremesi / PWM (Darbe Genişliği Modülasyonu)
| Ekran titriyor / PWM algılandı | 1282 Hz | ≤ 59 % parlaklık ayarı | 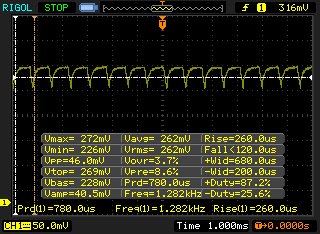 |
Ekran arka ışığı 1282 Hz'de titriyor (en kötü durum, örneğin PWM kullanılması) 59 % ve altındaki parlaklık ayarında titreme algılandı. Bu parlaklık ayarının üzerinde titreme veya PWM olmamalıdır. 1282 Hz frekansı oldukça yüksektir, bu nedenle PWM'ye duyarlı çoğu kullanıcı herhangi bir titremeyi fark etmemelidir. Karşılaştırıldığında: Test edilen tüm cihazların %52 %'si ekranı karartmak için PWM kullanmıyor. PWM tespit edilirse, ortalama 7754 (minimum: 5 - maksimum: 343500) Hz ölçüldü. | |||
| wPrime 2.10 - 1024m (değere göre sırala) | |
| HP Pavilion 15 UHD T9Y85AV | |
| DogHouse Systems Mobius SS | |
| Asus G701VO-CS74K | |
| MSI PX60 QD-034US | |
| Lenovo IdeaPad Y50 | |
| HP Spectre 13 | |
| Super Pi Mod 1.5 XS 32M - 32M (değere göre sırala) | |
| HP Pavilion 15 UHD T9Y85AV | |
| DogHouse Systems Mobius SS | |
| Asus G701VO-CS74K | |
| MSI PX60 QD-034US | |
| Lenovo IdeaPad Y50 | |
| HP Spectre 13 | |
* ... daha küçük daha iyidir
| PCMark 8 | |
| Home Score Accelerated v2 (değere göre sırala) | |
| HP Pavilion 15 UHD T9Y85AV | |
| HP Omen 15-ax007ng | |
| MSI GL62-6QFi781H11 | |
| HP Pavilion 15-ak003ng | |
| Asus ZenBook Pro UX501VW-DS71T | |
| Work Score Accelerated v2 (değere göre sırala) | |
| HP Pavilion 15 UHD T9Y85AV | |
| HP Omen 15-ax007ng | |
| MSI GL62-6QFi781H11 | |
| HP Pavilion 15-ak003ng | |
| Asus ZenBook Pro UX501VW-DS71T | |
| Creative Score Accelerated v2 (değere göre sırala) | |
| HP Pavilion 15 UHD T9Y85AV | |
| HP Omen 15-ax007ng | |
| MSI GL62-6QFi781H11 | |
| HP Pavilion 15-ak003ng | |
| Asus ZenBook Pro UX501VW-DS71T | |
| PCMark 8 Home Score Accelerated v2 | 3101 puan | |
| PCMark 8 Creative Score Accelerated v2 | 4648 puan | |
| PCMark 8 Work Score Accelerated v2 | 3717 puan | |
Yardım | ||
| HP Pavilion 15 UHD T9Y85AV SanDisk Z400s SD8SNAT-128G | HP Pavilion 15-ak003ng Samsung CM871 MZNLF128HCHP | MSI GL62-6QFi781H11 Toshiba HG6 THNSNJ128G8NY | Asus ZenBook Pro UX501VW-DS71T Samsung SM951 MZVPV512HDGL m.2 PCI-e | HP Omen 15-ax007ng Adata IM2S3138E-128GM-B | |
|---|---|---|---|---|---|
| CrystalDiskMark 3.0 | -38% | 51% | 321% | 17% | |
| Read Seq (MB/s) | 484.6 | 465.8 -4% | 530 9% | 1633 237% | 475.7 -2% |
| Write Seq (MB/s) | 185.2 | 120.2 -35% | 442.7 139% | 1579 753% | 169.2 -9% |
| Read 512 (MB/s) | 307.6 | 314.1 2% | 409.1 33% | 1068 247% | 327.6 7% |
| Write 512 (MB/s) | 180 | 75.9 -58% | 417.3 132% | 1570 772% | 169.6 -6% |
| Read 4k (MB/s) | 22.08 | 18.49 -16% | 21.81 -1% | 50.4 128% | 33.14 50% |
| Write 4k (MB/s) | 77.7 | 21.18 -73% | 93 20% | 128.6 66% | 81.4 5% |
| Read 4k QD32 (MB/s) | 143.7 | 94.8 -34% | 257 79% | 534 272% | 276.8 93% |
| Write 4k QD32 (MB/s) | 177.6 | 21.66 -88% | 168.3 -5% | 344 94% | 168 -5% |

| 3DMark 11 | |
| 1280x720 Performance GPU (değere göre sırala) | |
| HP Pavilion 15 UHD T9Y85AV | |
| Asus Strix GL502VY-DS71 | |
| Asus Strix GL502VT-DS74 | |
| HP Omen 15-ax007ng | |
| MSI GL62-6QFi781H11 | |
| HP Envy 17-n107ng | |
| Dell Inspiron 17 7778 | |
| 1280x720 Performance Combined (değere göre sırala) | |
| HP Pavilion 15 UHD T9Y85AV | |
| Asus Strix GL502VY-DS71 | |
| Asus Strix GL502VT-DS74 | |
| HP Omen 15-ax007ng | |
| MSI GL62-6QFi781H11 | |
| HP Envy 17-n107ng | |
| Dell Inspiron 17 7778 | |
| 3DMark | |
| 1280x720 Cloud Gate Standard Graphics (değere göre sırala) | |
| HP Pavilion 15 UHD T9Y85AV | |
| Asus Strix GL502VY-DS71 | |
| Asus Strix GL502VT-DS74 | |
| HP Omen 15-ax007ng | |
| MSI GL62-6QFi781H11 | |
| HP Envy 17-n107ng | |
| Dell Inspiron 17 7778 | |
| 1920x1080 Fire Strike Graphics (değere göre sırala) | |
| HP Pavilion 15 UHD T9Y85AV | |
| Asus Strix GL502VY-DS71 | |
| Asus Strix GL502VT-DS74 | |
| HP Omen 15-ax007ng | |
| MSI GL62-6QFi781H11 | |
| HP Envy 17-n107ng | |
| Dell Inspiron 17 7778 | |
| Fire Strike Extreme Graphics (değere göre sırala) | |
| HP Pavilion 15 UHD T9Y85AV | |
| Asus Strix GL502VY-DS71 | |
| Asus Strix GL502VT-DS74 | |
| 3840x2160 Fire Strike Ultra Graphics (değere göre sırala) | |
| HP Pavilion 15 UHD T9Y85AV | |
| Asus Strix GL502VY-DS71 | |
| 3DMark 11 Performance | 5775 puan | |
| 3DMark Ice Storm Standard Score | 37758 puan | |
| 3DMark Cloud Gate Standard Score | 16612 puan | |
| 3DMark Fire Strike Score | 3954 puan | |
| 3DMark Fire Strike Extreme Score | 1990 puan | |
Yardım | ||
| düşük | orta | yüksek | ultra | 4K | |
|---|---|---|---|---|---|
| Sleeping Dogs (2012) | 91.2 | 24.1 | |||
| BioShock Infinite (2013) | 110 | 45.8 | |||
| Metro: Last Light (2013) | 58.4 | 31.4 | |||
| Thief (2014) | 55 | 28.2 | |||
| Batman: Arkham Knight (2015) | 34 | 22 | |||
| Metal Gear Solid V (2015) | 45.9 | 32.1 | 14.5 | ||
| Fallout 4 (2015) | 29.9 | 24.1 | |||
| Rise of the Tomb Raider (2016) | 29.6 | 23.5 | |||
| Overwatch (2016) | 66.8 | 40.2 | 19.8 |
| Rise of the Tomb Raider - 1920x1080 Very High Preset AA:FX AF:16x | |
| Asus Strix GL502VY-DS71 | |
| Asus Strix GL502VT-DS74 | |
| HP Omen 15-ax007ng | |
| HP Pavilion 15 UHD T9Y85AV | |
| Dell XPS 15 9550 i7 FHD | |
| Medion Erazer P6661 MD 99873 | |
| BioShock Infinite - 1920x1080 Ultra Preset, DX11 (DDOF) | |
| Asus Strix GL502VY-DS71 | |
| Asus Strix GL502VT-DS74 | |
| HP Pavilion 15 UHD T9Y85AV | |
| Dell XPS 15 9550 i7 FHD | |
| Medion Erazer P6661 MD 99873 | |
| Sleeping Dogs - 1920x1080 Extreme Preset AA:Extreme | |
| Asus Strix GL502VY-DS71 | |
| Asus Strix GL502VT-DS74 | |
| HP Pavilion 15 UHD T9Y85AV | |
| Dell XPS 15 9550 i7 FHD | |
| Metro: Last Light - 1920x1080 Very High (DX11) AF:16x | |
| Asus Strix GL502VT-DS74 | |
| HP Pavilion 15 UHD T9Y85AV | |
| Dell XPS 15 9550 i7 FHD | |
| Medion Erazer P6661 MD 99873 | |
| Thief - 1920x1080 Very High Preset AA:FXAA & High SS AF:8x | |
| Asus Strix GL502VY-DS71 | |
| Asus Strix GL502VT-DS74 | |
| HP Pavilion 15 UHD T9Y85AV | |
| Dell XPS 15 9550 i7 FHD | |
| Medion Erazer P6661 MD 99873 | |
| Batman: Arkham Knight - 1920x1080 High / On AA:SM AF:16x | |
| Asus Strix GL502VT-DS74 | |
| Medion Erazer P6661 MD 99873 | |
| HP Pavilion 15 UHD T9Y85AV | |
| Dell XPS 15 9550 i7 FHD | |
| Metal Gear Solid V - 1920x1080 Extra High / On | |
| Asus Strix GL502VT-DS74 | |
| Asus Strix GL502VY-DS71 | |
| Dell XPS 15 9550 i7 FHD | |
| HP Pavilion 15 UHD T9Y85AV | |
| Fallout 4 - 1920x1080 Ultra Preset AA:T AF:16x | |
| Asus Strix GL502VY-DS71 | |
| Asus Strix GL502VT-DS74 | |
| Dell XPS 15 9550 i7 FHD | |
| HP Pavilion 15 UHD T9Y85AV | |
| Overwatch - 1920x1080 Epic (Render Scale 100 %) AA:SM AF:16x | |
| Asus Strix GL502VY-DS71 | |
| HP Omen 15-ax007ng | |
| HP Pavilion 15 UHD T9Y85AV | |
Ses yüksekliği
| Boşta |
| 32.3 / 32.4 / 32.4 dB |
| Çalışırken |
| 40.5 / 50.3 dB |
 | ||
30 dB sessiz 40 dB(A) duyulabilirlik 50 dB(A) gürültülü |
||
min: | ||
| HP Pavilion 15 UHD T9Y85AV GeForce GTX 960M, 6700HQ, SanDisk Z400s SD8SNAT-128G | HP Pavilion 15-ak003ng GeForce GTX 950M, 6700HQ, Samsung CM871 MZNLF128HCHP | MSI GL62-6QFi781H11 GeForce GTX 960M, 6700HQ, Toshiba HG6 THNSNJ128G8NY | Asus ZenBook Pro UX501VW-DS71T GeForce GTX 960M, 6700HQ, Samsung SM951 MZVPV512HDGL m.2 PCI-e | HP Omen 15-ax007ng GeForce GTX 965M, 6700HQ, Adata IM2S3138E-128GM-B | |
|---|---|---|---|---|---|
| Noise | -7% | -5% | 8% | -3% | |
| kapalı / ortam * (dB) | 29.5 | 30 -2% | 30 -2% | ||
| Idle Minimum * (dB) | 32.3 | 34 -5% | 35 -8% | 28.9 11% | 32 1% |
| Idle Average * (dB) | 32.4 | 35 -8% | 36 -11% | 28.9 11% | 33 -2% |
| Idle Maximum * (dB) | 32.4 | 36 -11% | 37 -14% | 30.2 7% | 36 -11% |
| Load Average * (dB) | 40.5 | 44 -9% | 41 -1% | 41.8 -3% | 43 -6% |
| Load Maximum * (dB) | 50.3 | 51 -1% | 46 9% | 43.9 13% | 49 3% |
* ... daha küçük daha iyidir
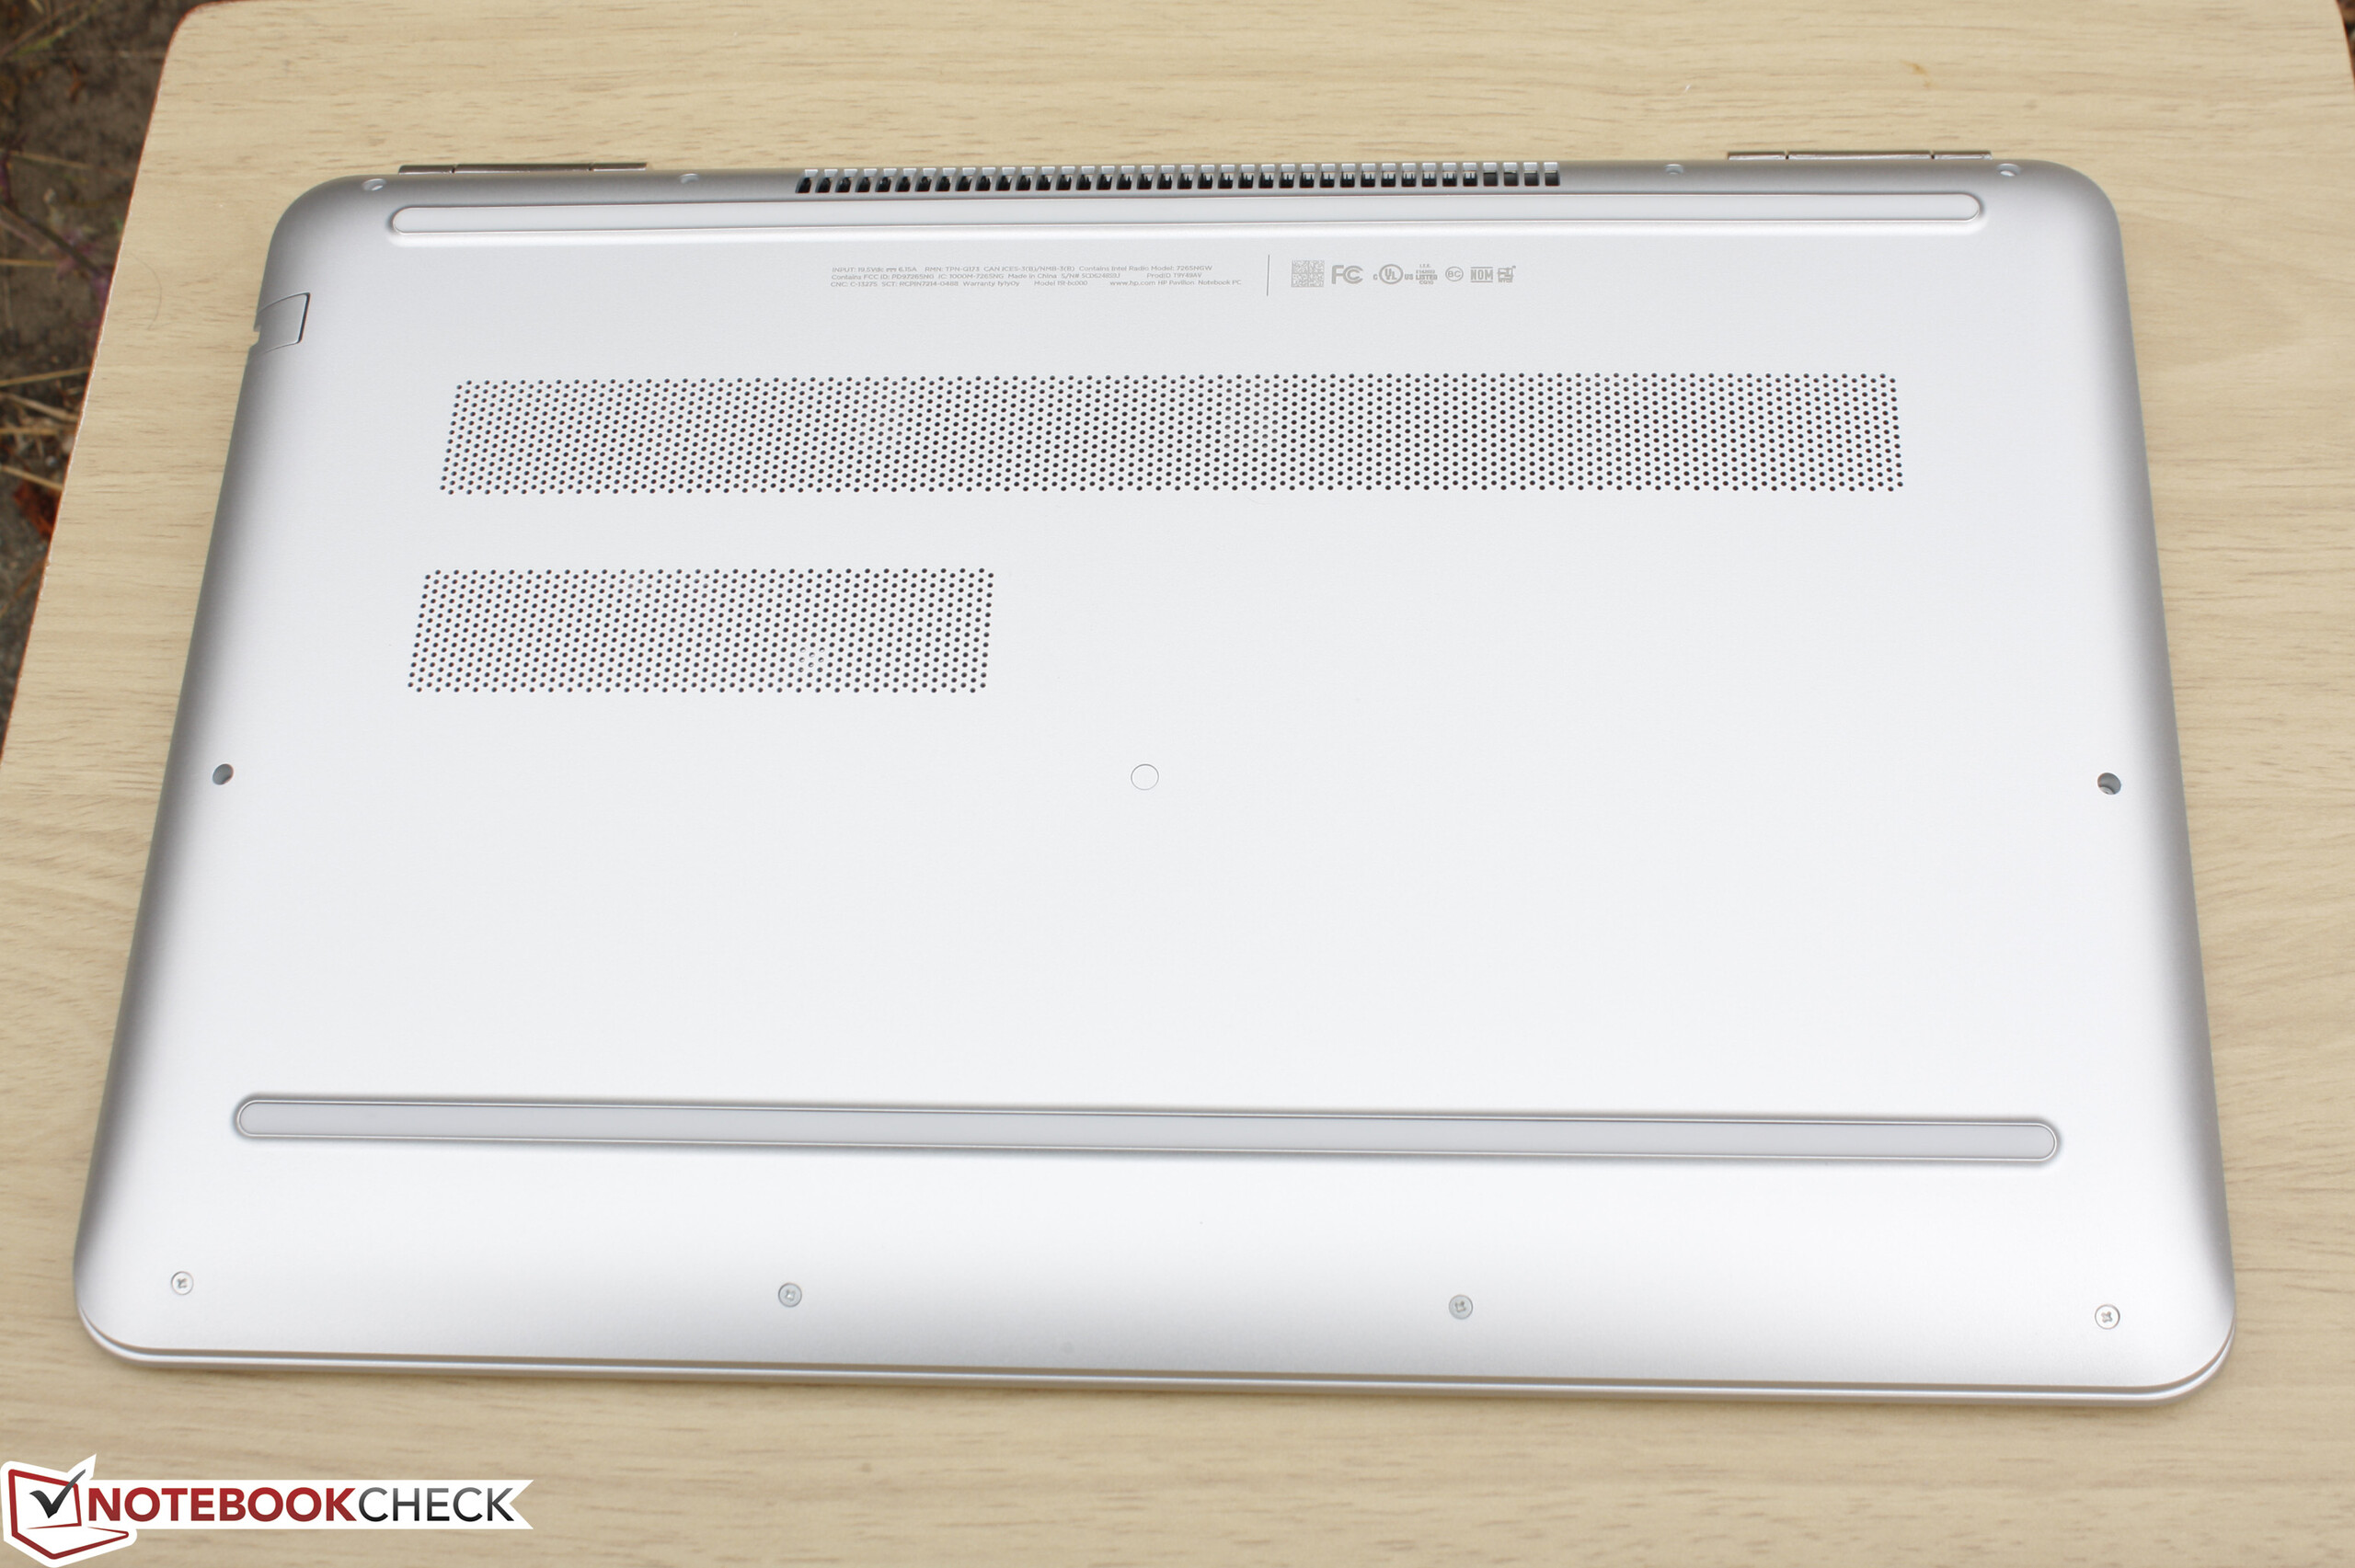
(±) Üst taraftaki maksimum sıcaklık, 40.4 °C / 105 F ortalamasına kıyasla 41 °C / 106 F'dir. , Gaming sınıfı için 21.2 ile 68.8 °C arasında değişir.
(±) Alt kısım, 43.2 °C / 110 F ortalamasına kıyasla maksimum 42.6 °C / 109 F'ye kadar ısınır
(+) Boşta kullanımda, üst tarafın ortalama sıcaklığı 23.7 °C / 75 F olup, cihazın 33.9 °C / 93 F.
(±) Avuç içi dayanakları ve dokunmatik yüzey maksimum 37.2 °C / 99 F ile dokunulamayacak kadar ısınabilir.
(-) Benzer cihazların avuç içi dayanağı alanının ortalama sıcaklığı 28.8 °C / 83.8 F (-8.4 °C / -15.2 F) idi.
HP Pavilion 15 UHD T9Y85AV ses analizi
(-) | hoparlörler çok yüksek ses çıkarmıyor (64 dB)
Analysis not possible as minimum curve is missing or too high
Apple MacBook 12 (Early 2016) 1.1 GHz ses analizi
(+) | hoparlörler nispeten yüksek sesle çalabilir (83.6 dB)
Bas 100 - 315Hz
(±) | azaltılmış bas - ortalama olarak medyandan 11.3% daha düşük
(±) | Bas doğrusallığı ortalamadır (14.2% delta - önceki frekans)
Ortalar 400 - 2000 Hz
(+) | dengeli ortalar - medyandan yalnızca 2.4% uzakta
(+) | orta frekanslar doğrusaldır (5.5% deltadan önceki frekansa)
Yüksekler 2 - 16 kHz
(+) | dengeli yüksekler - medyandan yalnızca 2% uzakta
(+) | yüksekler doğrusaldır (4.5% deltadan önceki frekansa)
Toplam 100 - 16.000 Hz
(+) | genel ses doğrusaldır (10.2% ortancaya göre fark)
Aynı sınıfla karşılaştırıldığında
» Bu sınıftaki tüm test edilen cihazların %7%'si daha iyi, 2% benzer, 90% daha kötüydü
» En iyisinin deltası 5% idi, ortalama 18% idi, en kötüsü 53% idi
Test edilen tüm cihazlarla karşılaştırıldığında
» Test edilen tüm cihazların %5'si daha iyi, 1 benzer, % 94 daha kötüydü
» En iyisinin deltası 4% idi, ortalama 23% idi, en kötüsü 134% idi
Schenker F516 Flex ses analizi
(-) | hoparlörler çok yüksek ses çıkarmıyor (69 dB)
Analysis not possible as minimum curve is missing or too high
| Kapalı / Bekleme modu | |
| Boşta | |
| Çalışırken |
|
Key:
min: | |
| HP Pavilion 15 UHD T9Y85AV 6700HQ, GeForce GTX 960M, SanDisk Z400s SD8SNAT-128G, IPS, 3840x2160, 15.6" | HP Pavilion 15-ak003ng 6700HQ, GeForce GTX 950M, Samsung CM871 MZNLF128HCHP, IPS, 1920x1080, 15.6" | MSI GL62-6QFi781H11 6700HQ, GeForce GTX 960M, Toshiba HG6 THNSNJ128G8NY, TN LED, 1920x1080, 15.6" | Asus Zenbook Pro UX501JW-FI218H 4720HQ, GeForce GTX 960M, SanDisk SD7SN3Q128G1002, IPS, 3840x2160, 15.6" | HP Omen 15-ax007ng 6700HQ, GeForce GTX 965M, Adata IM2S3138E-128GM-B, IPS, 1920x1080, 15.6" | |
|---|---|---|---|---|---|
| Power Consumption | 14% | -8% | -24% | 4% | |
| Idle Minimum * (Watt) | 8.3 | 7 16% | 10 -20% | 15.6 -88% | 7 16% |
| Idle Average * (Watt) | 14.8 | 11 26% | 14 5% | 20.5 -39% | 11 26% |
| Idle Maximum * (Watt) | 16.8 | 17 -1% | 19 -13% | 21.2 -26% | 19 -13% |
| Load Average * (Watt) | 71 | 69 3% | 82 -15% | 75.8 -7% | 79 -11% |
| Load Maximum * (Watt) | 119.2 | 89 25% | 118 1% | 72.9 39% | 119 -0% |
* ... daha küçük daha iyidir
| HP Pavilion 15 UHD T9Y85AV 6700HQ, GeForce GTX 960M, 61.5 Wh | HP Pavilion 15-ak003ng 6700HQ, GeForce GTX 950M, 48 Wh | MSI GL62-6QFi781H11 6700HQ, GeForce GTX 960M, 41.4 Wh | Asus ZenBook Pro UX501VW-DS71T 6700HQ, GeForce GTX 960M, 96 Wh | HP Omen 15-ax007ng 6700HQ, GeForce GTX 965M, 61.5 Wh | |
|---|---|---|---|---|---|
| Pil Çalışma Süresi | -3% | -33% | 34% | -2% | |
| Reader / Idle (h) | 8.5 | 9.5 12% | 5.7 -33% | 11.5 35% | 7.8 -8% |
| WiFi v1.3 (h) | 4.4 | 5.1 16% | 2.6 -41% | 6.3 43% | 4.5 2% |
| Load (h) | 1.6 | 1 -37% | 1.2 -25% | 2 25% | 1.6 0% |
Artılar
Eksiler
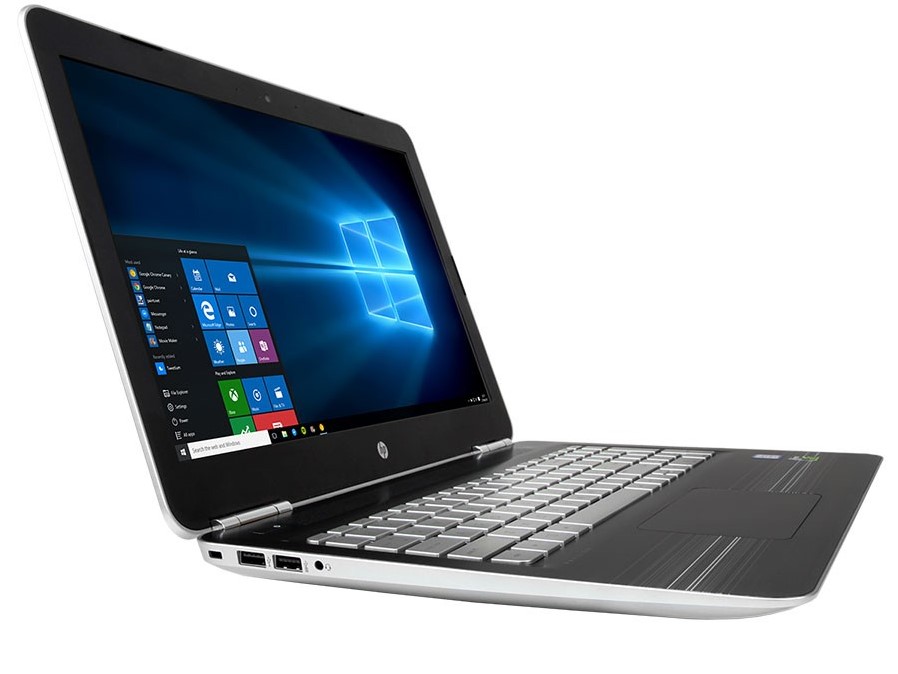

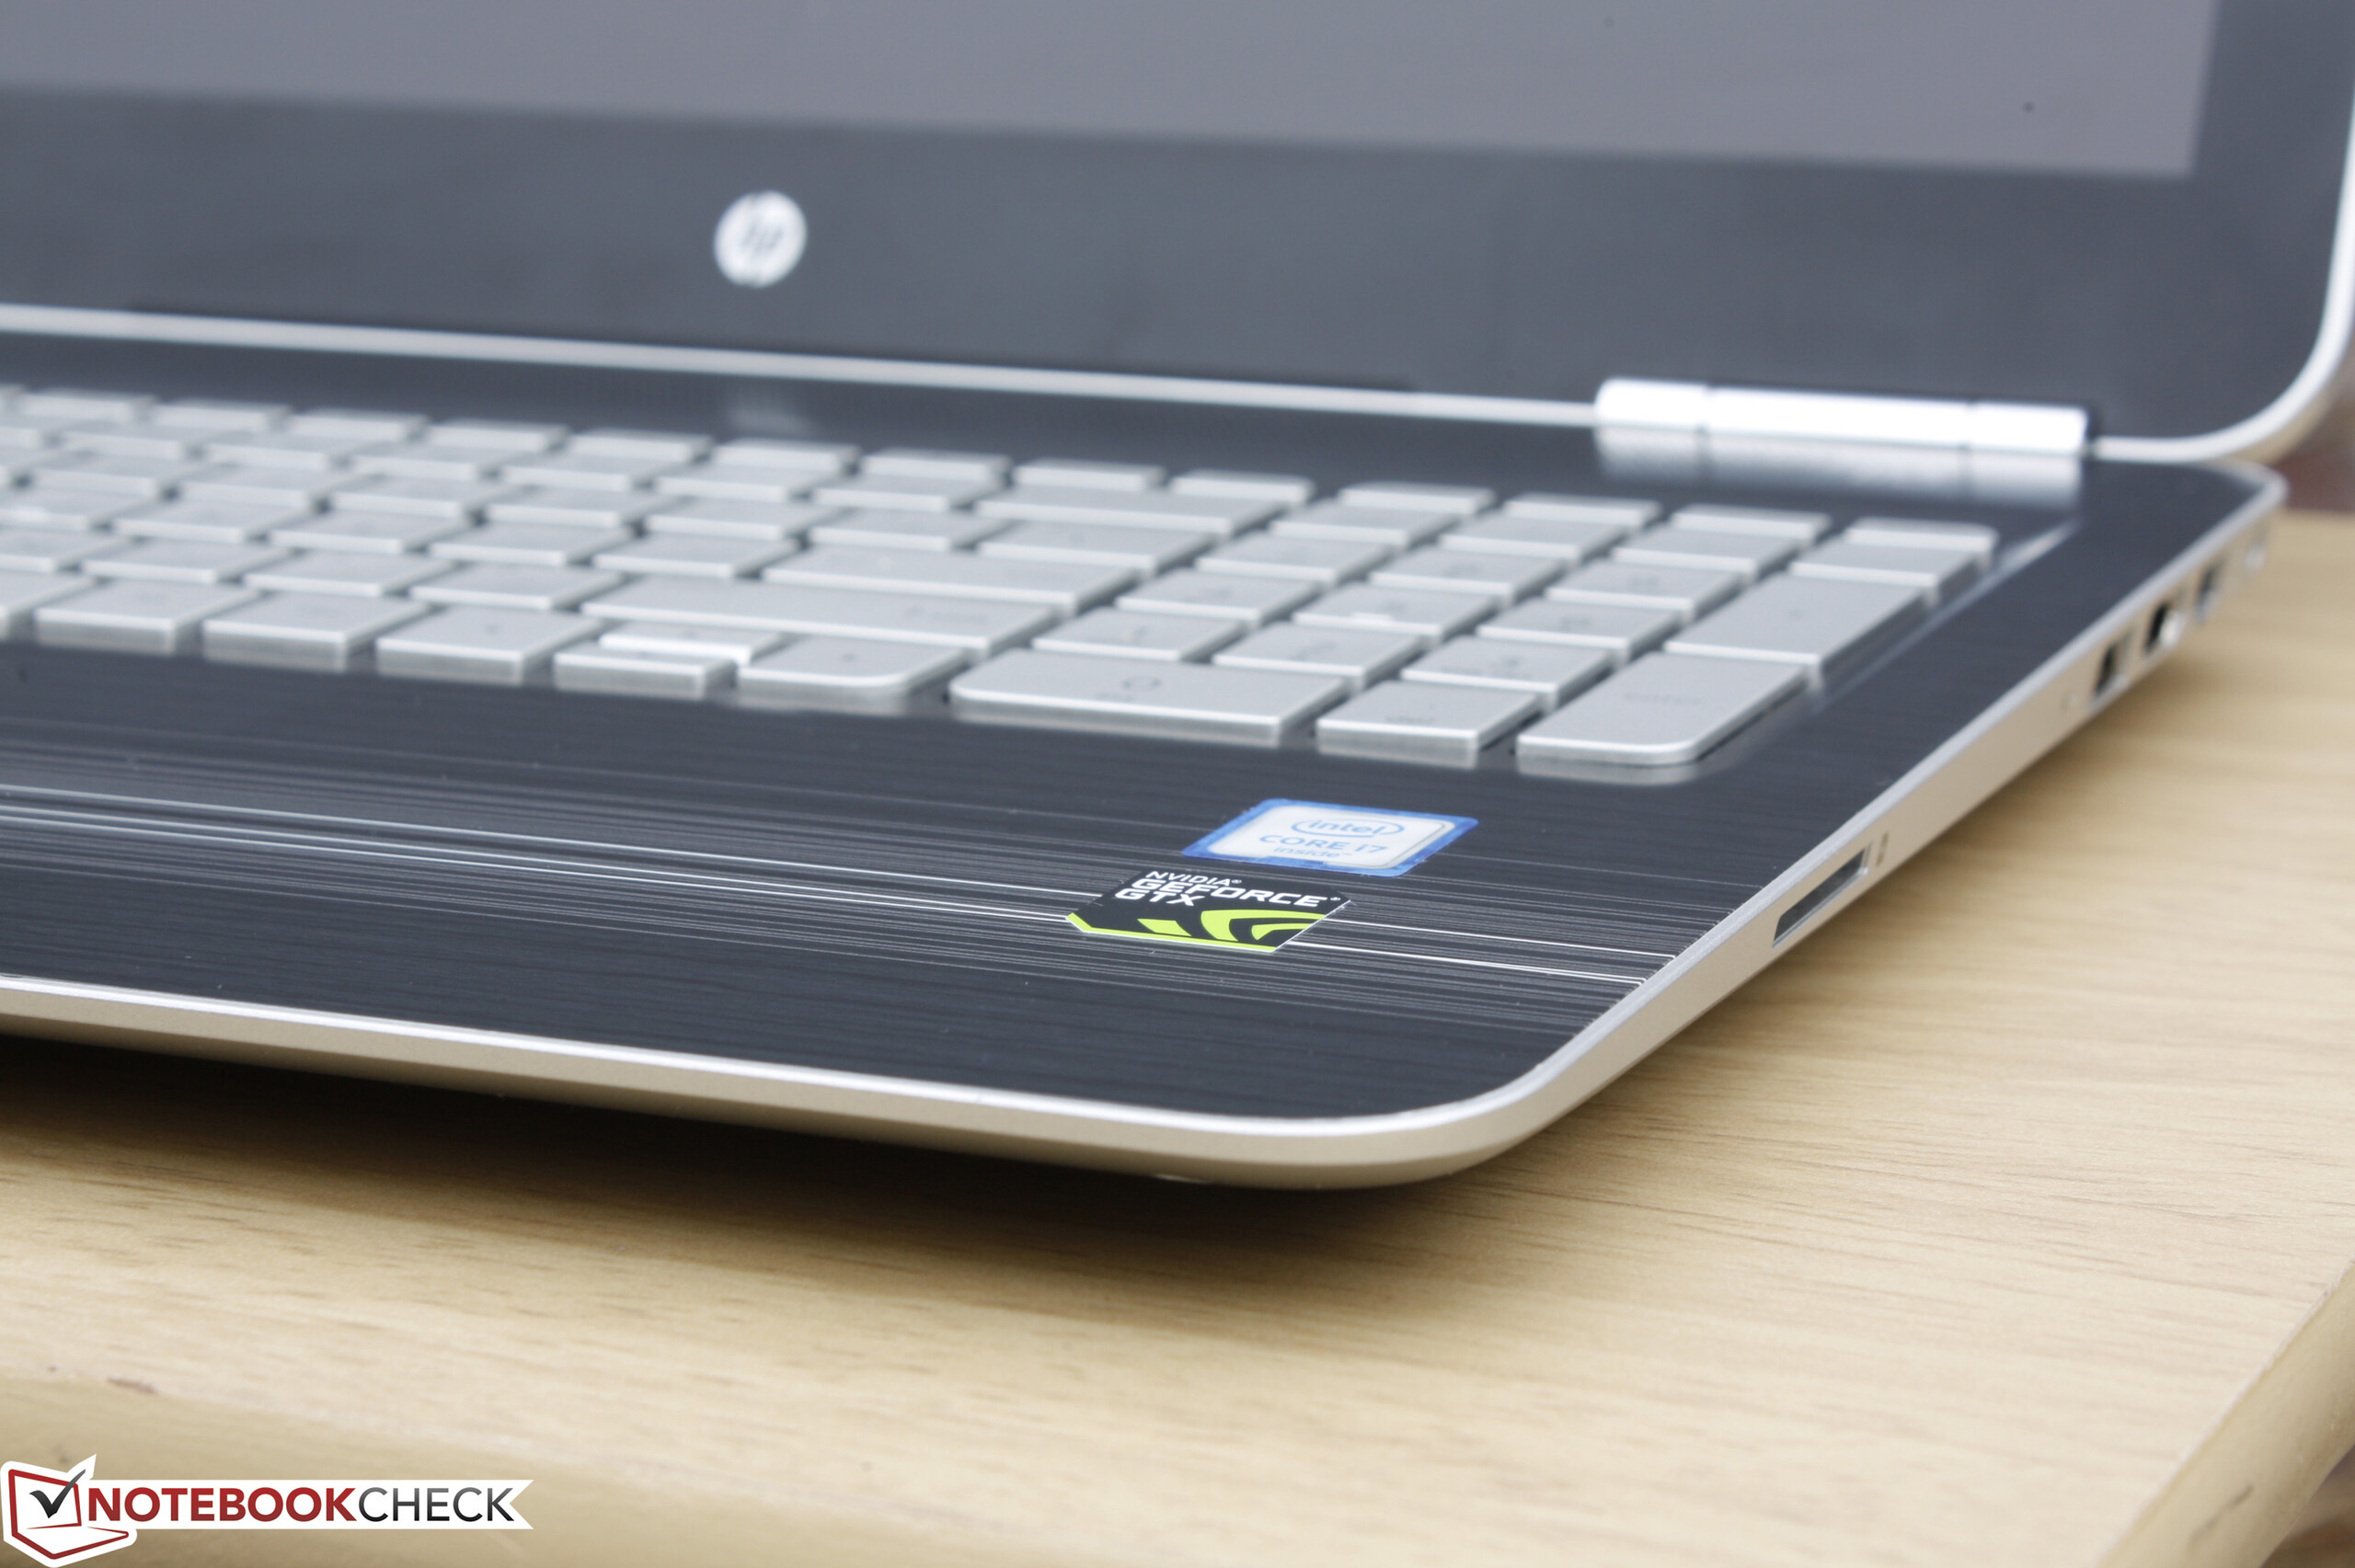
Yeni Pavilion 15 modeli GTX 950 grafik kartı bulunan Pavilion 15 ve en yeni GTX 965M kullanan Omen 15 modeli arasında kalıyor. Bu da cihazı Omen modeline göre biraz daha ucuz kılıyor. Her iki model de bunun dışında oldukça benzer, ancak Pavilion 15 modeli daha ilgi çekici ve ucuza oyun oynayabilmek isteyen kullanıcılar için ideal.
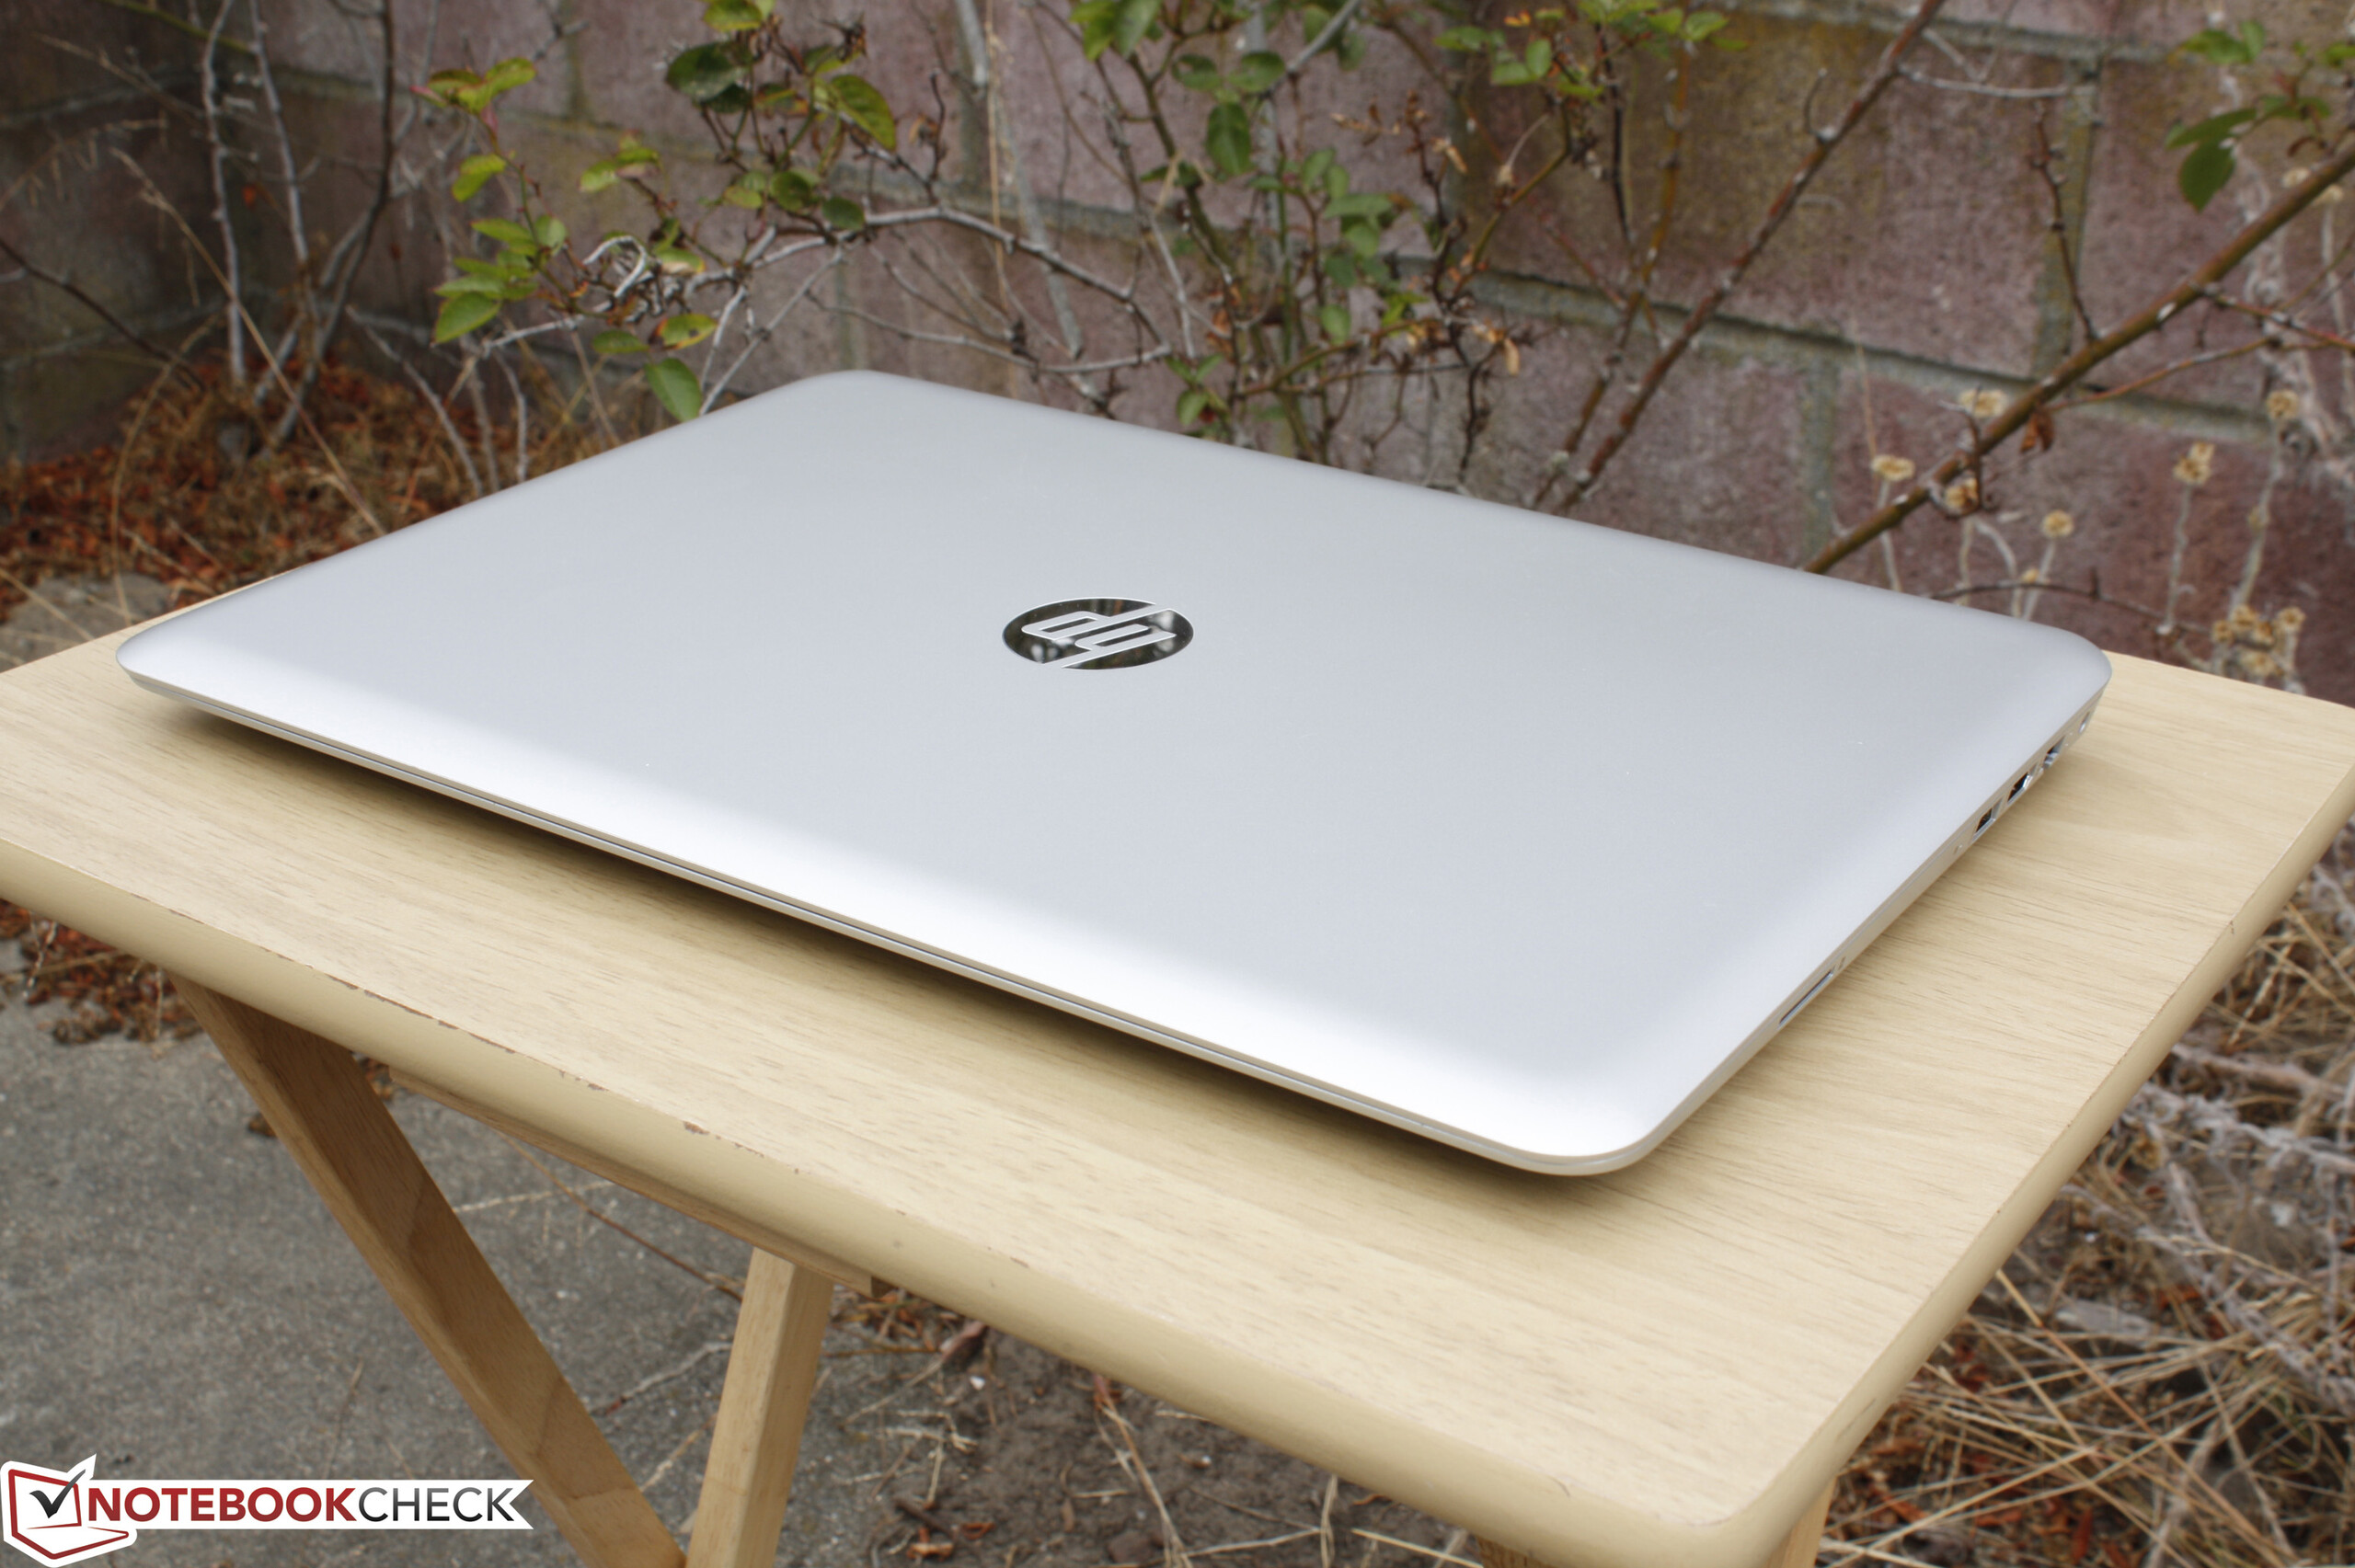
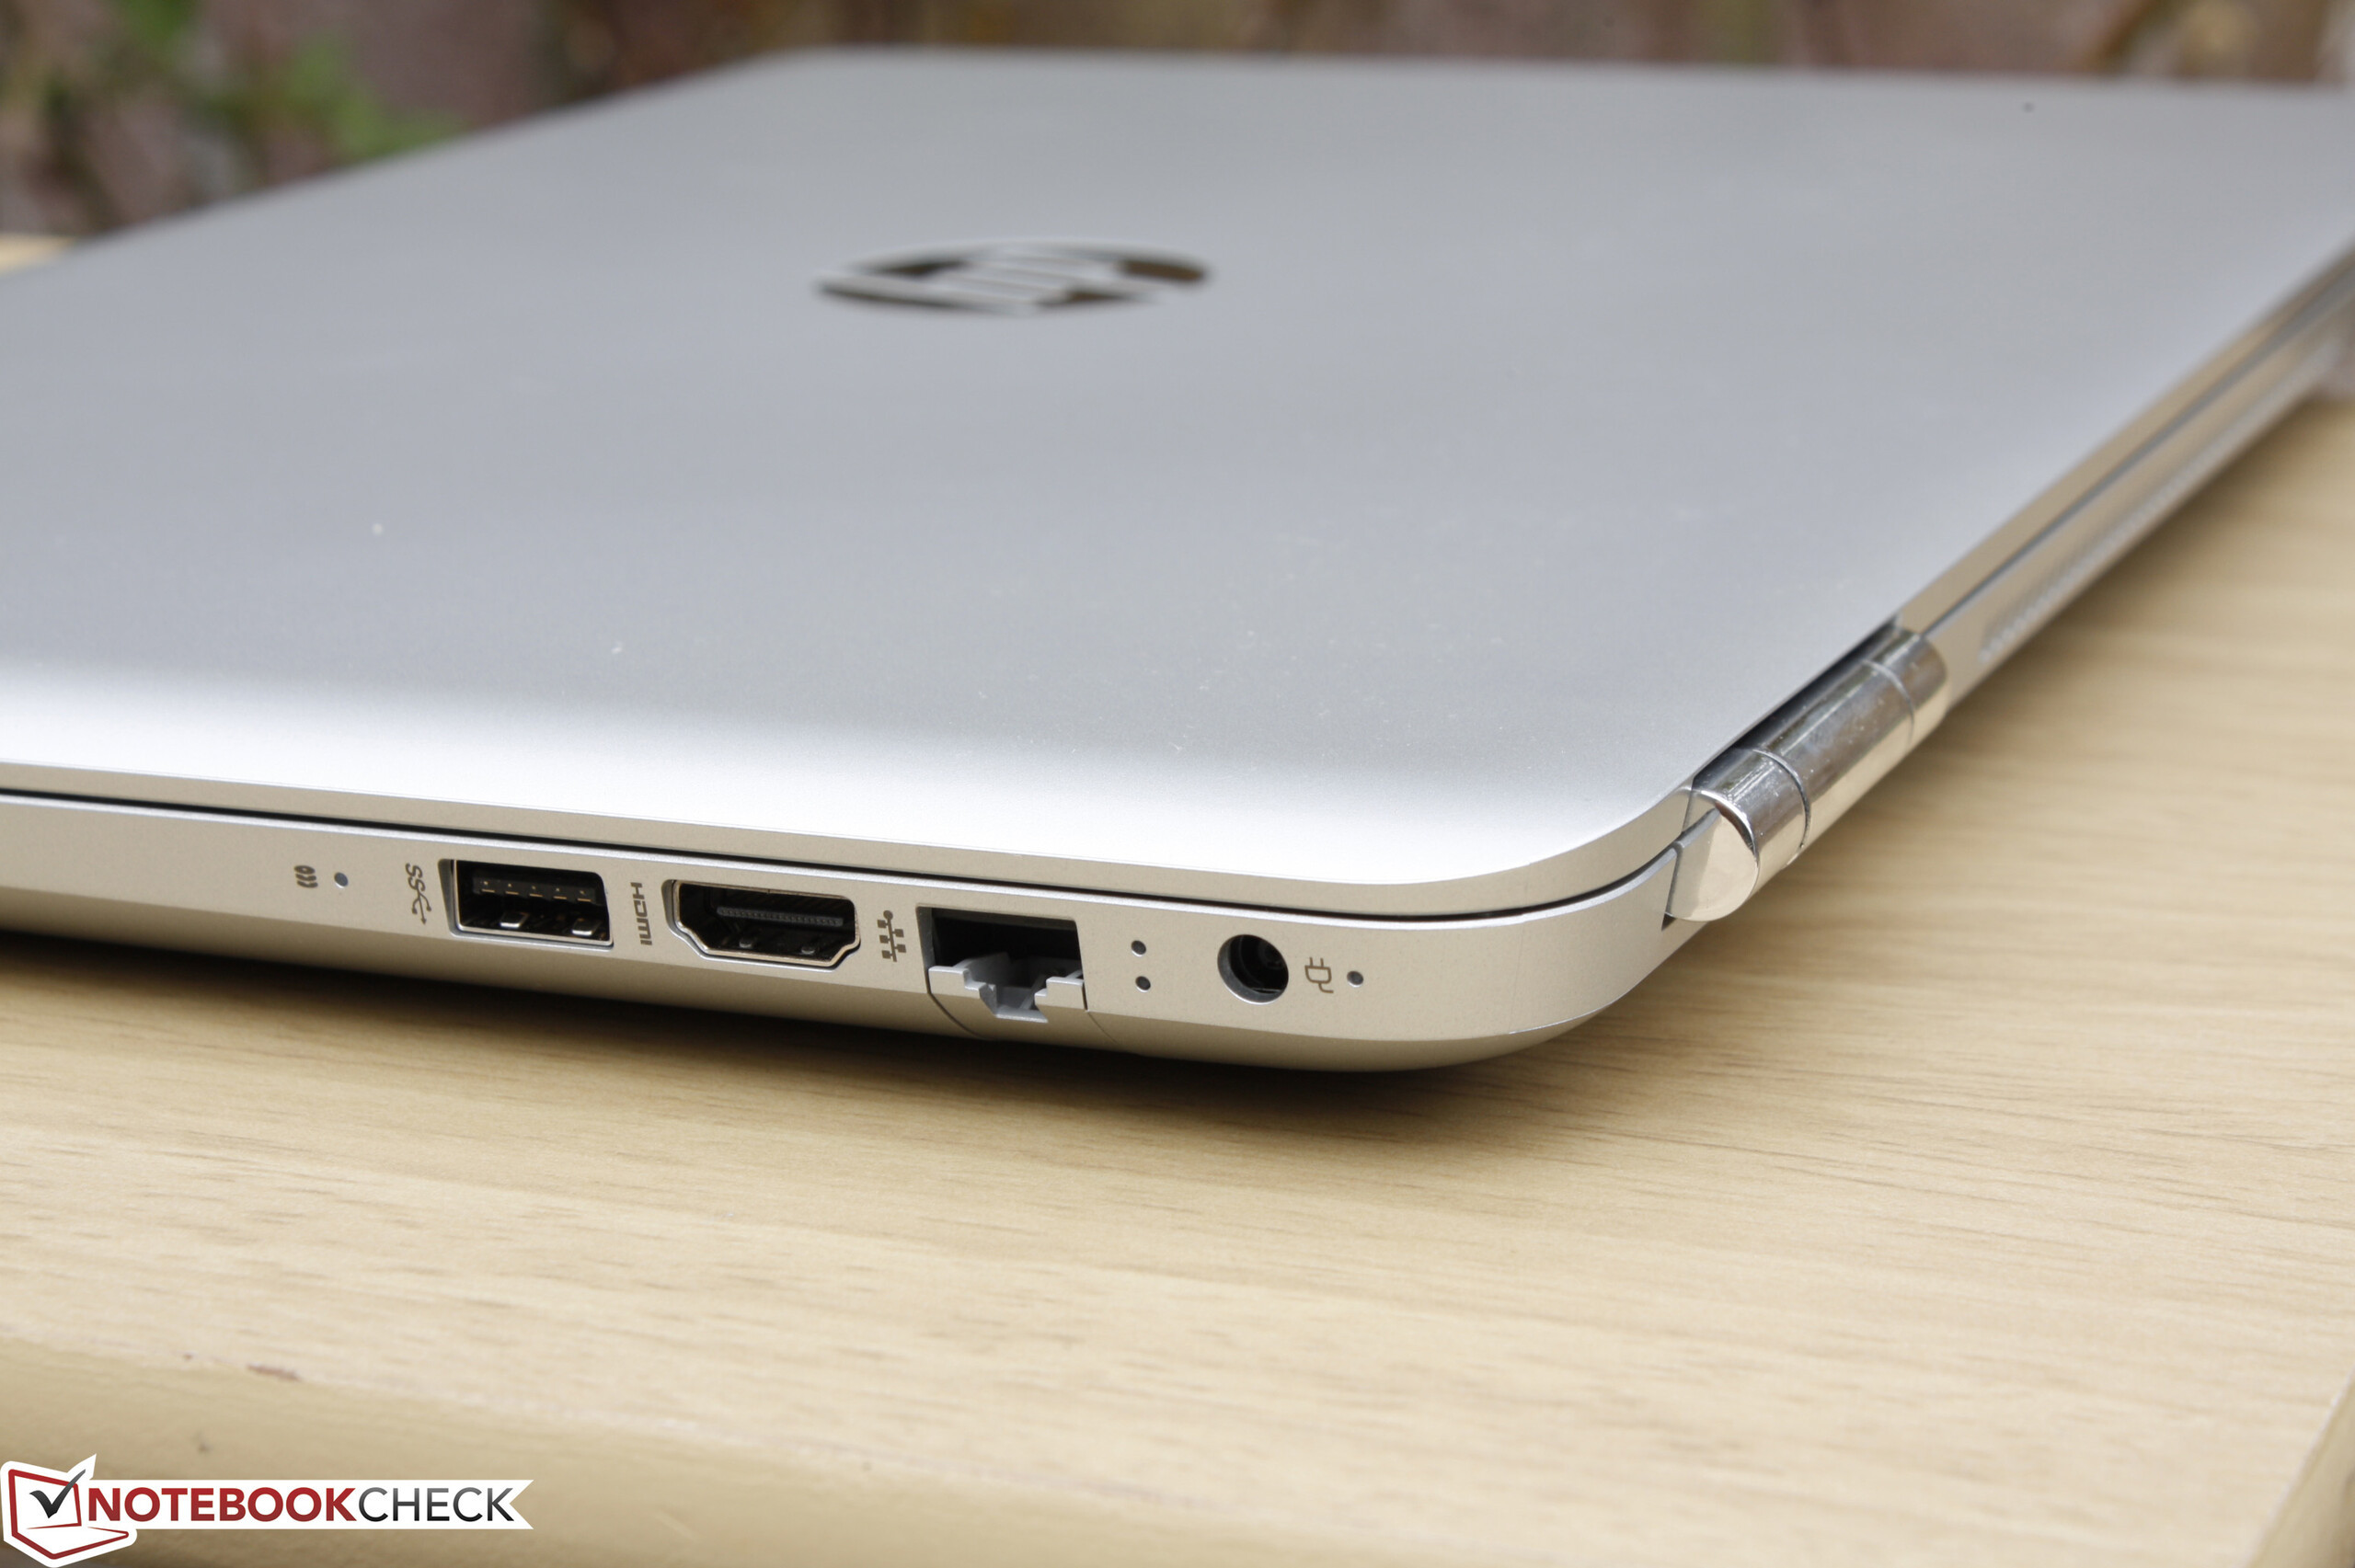
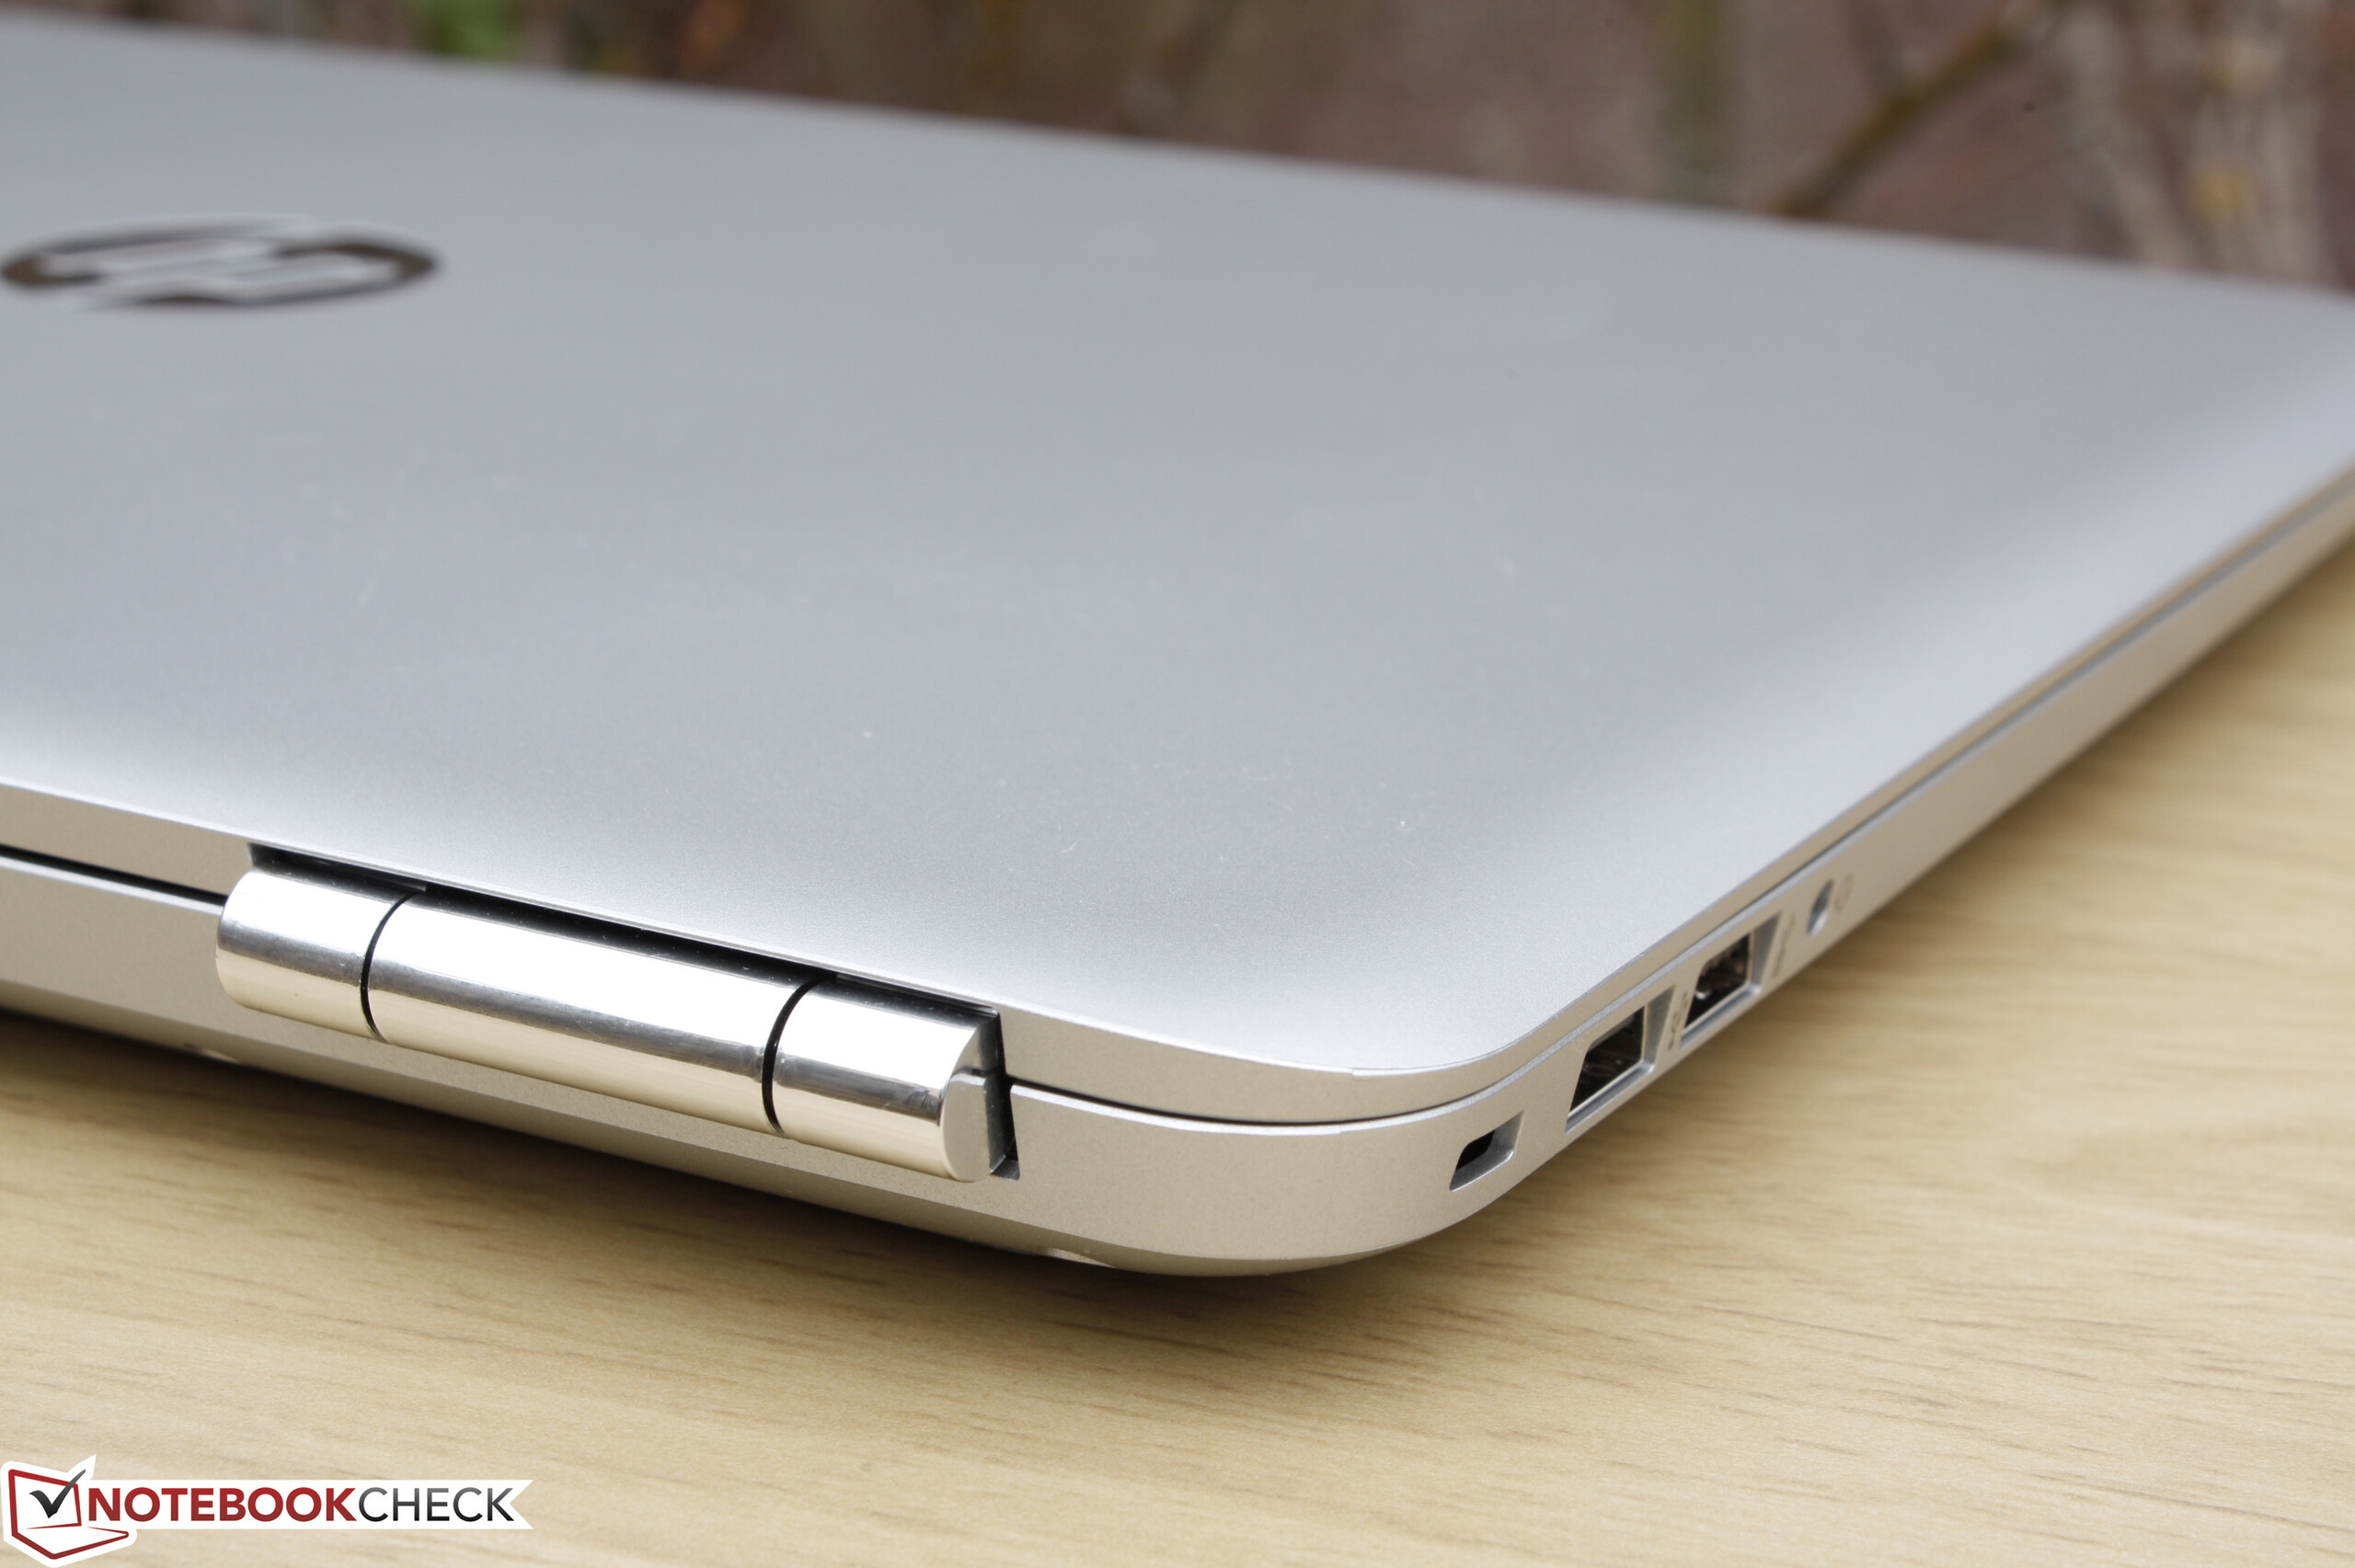
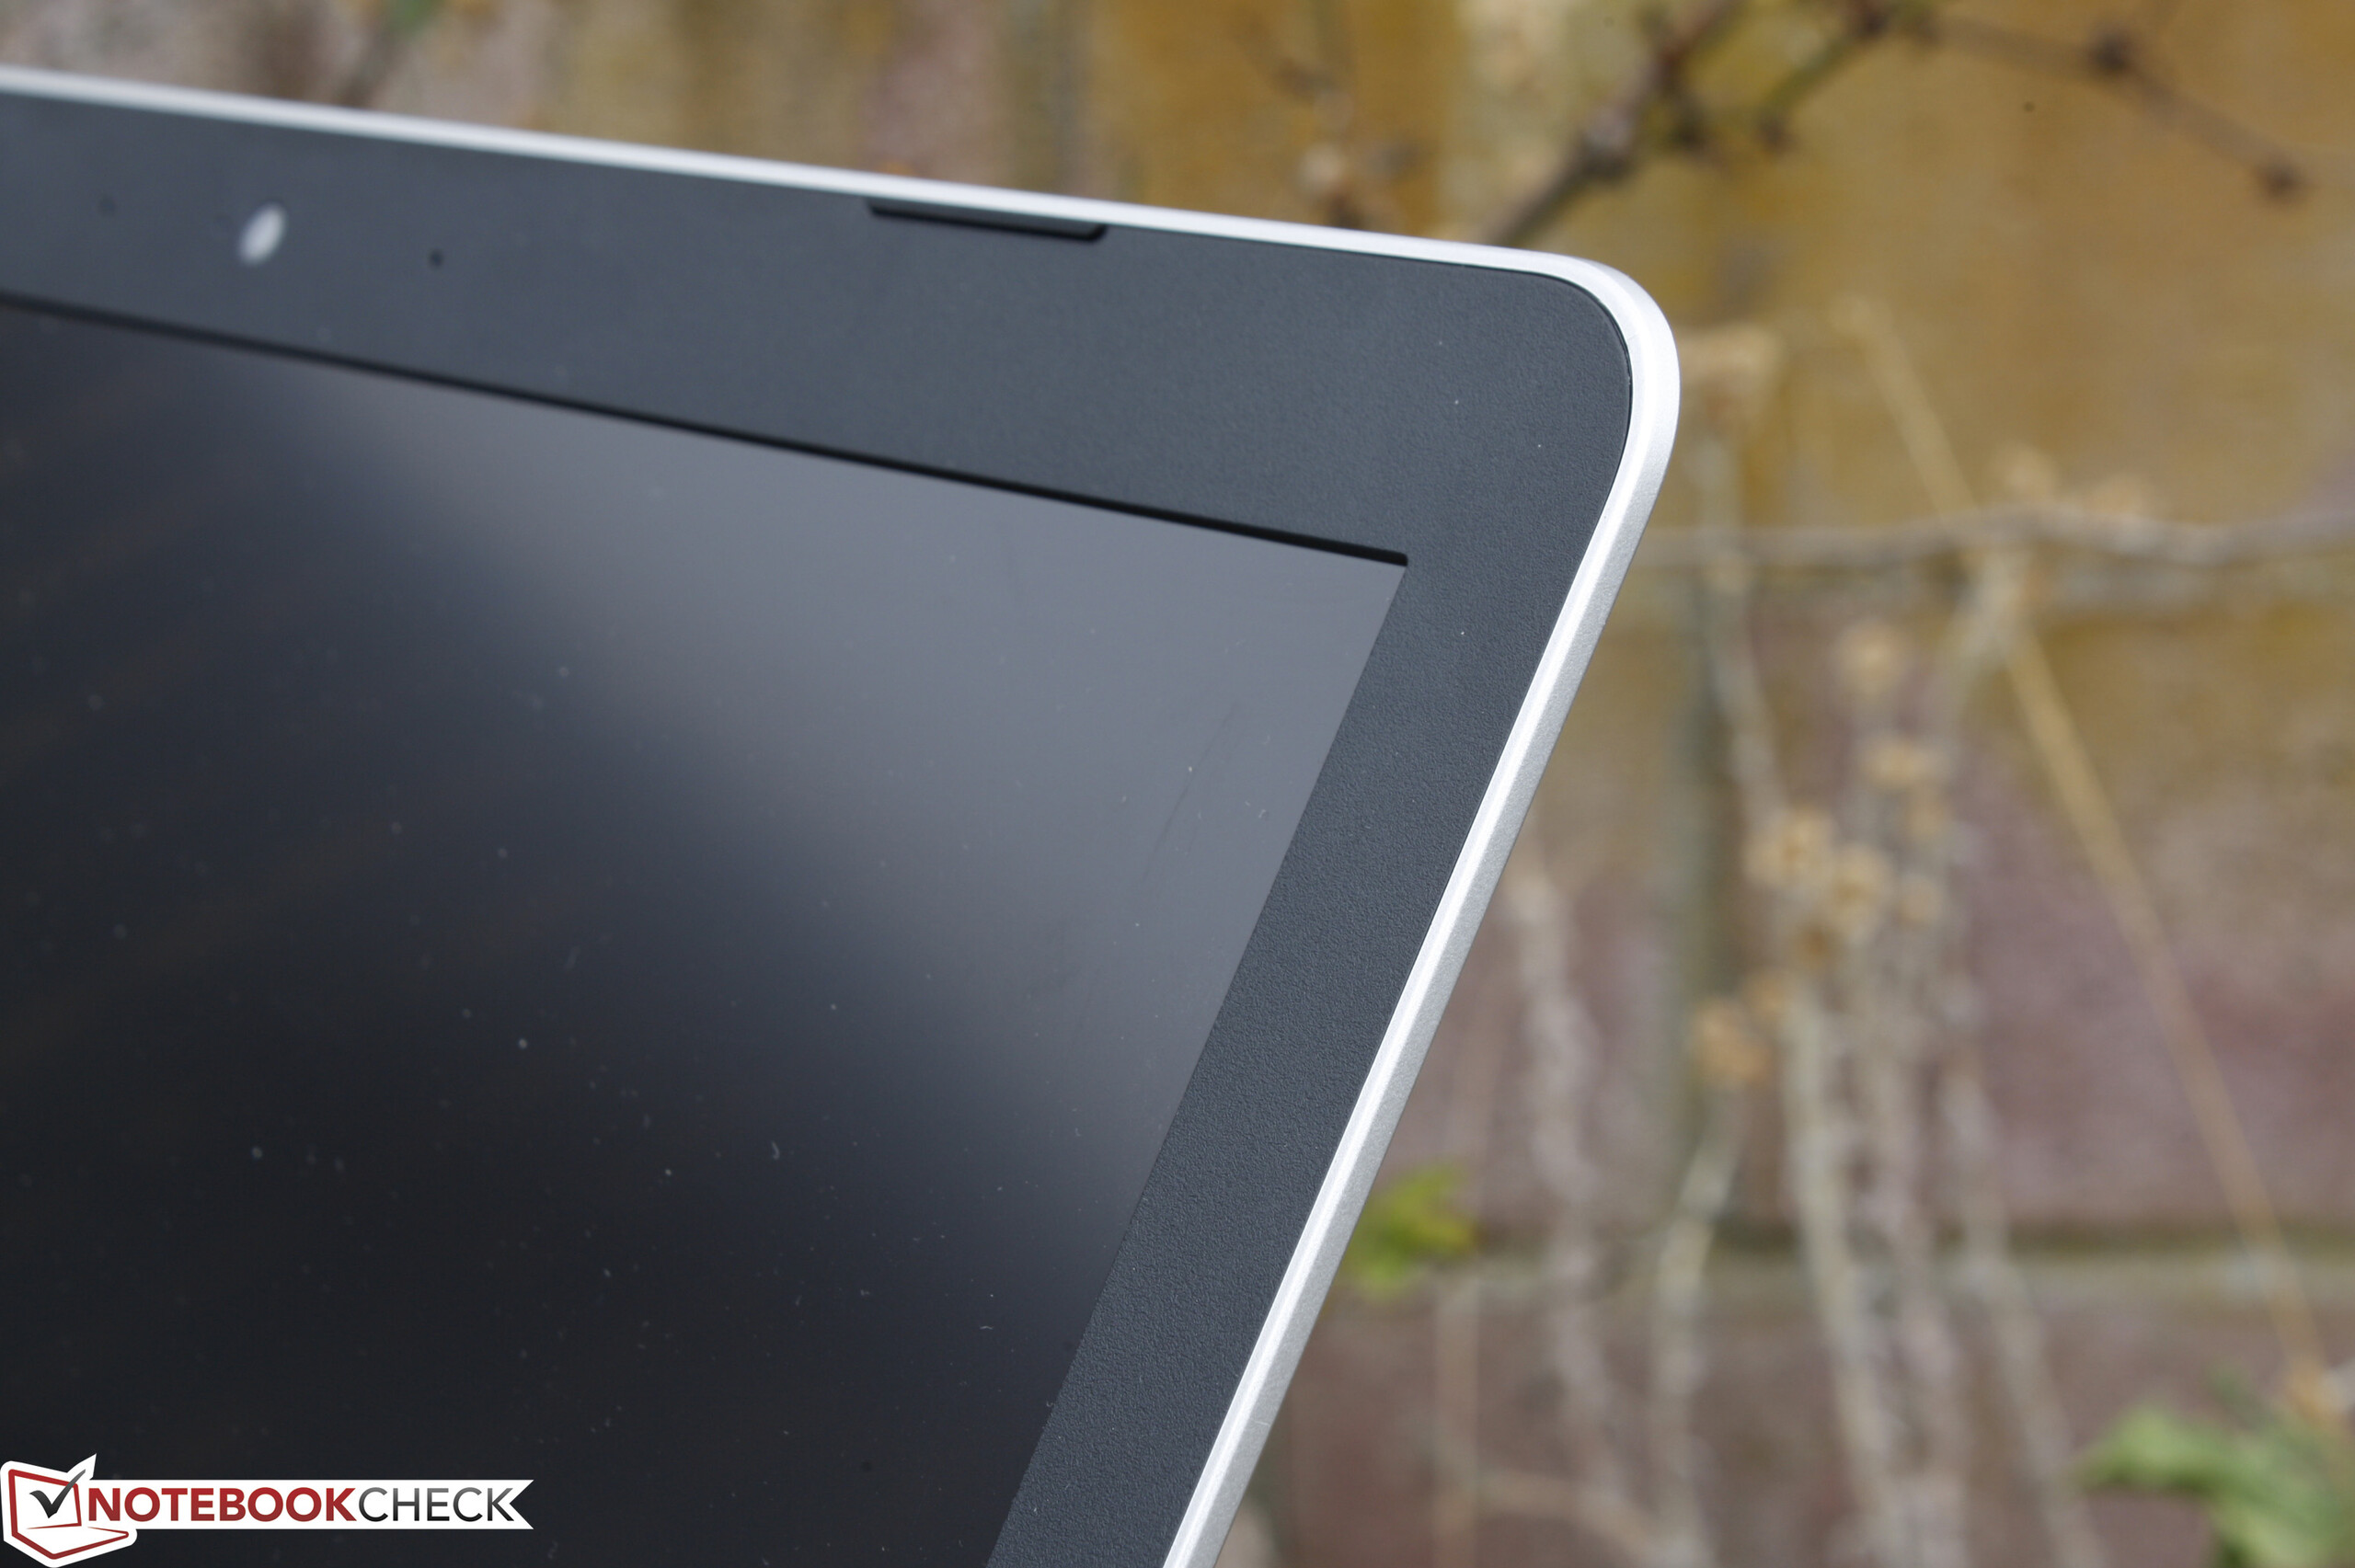
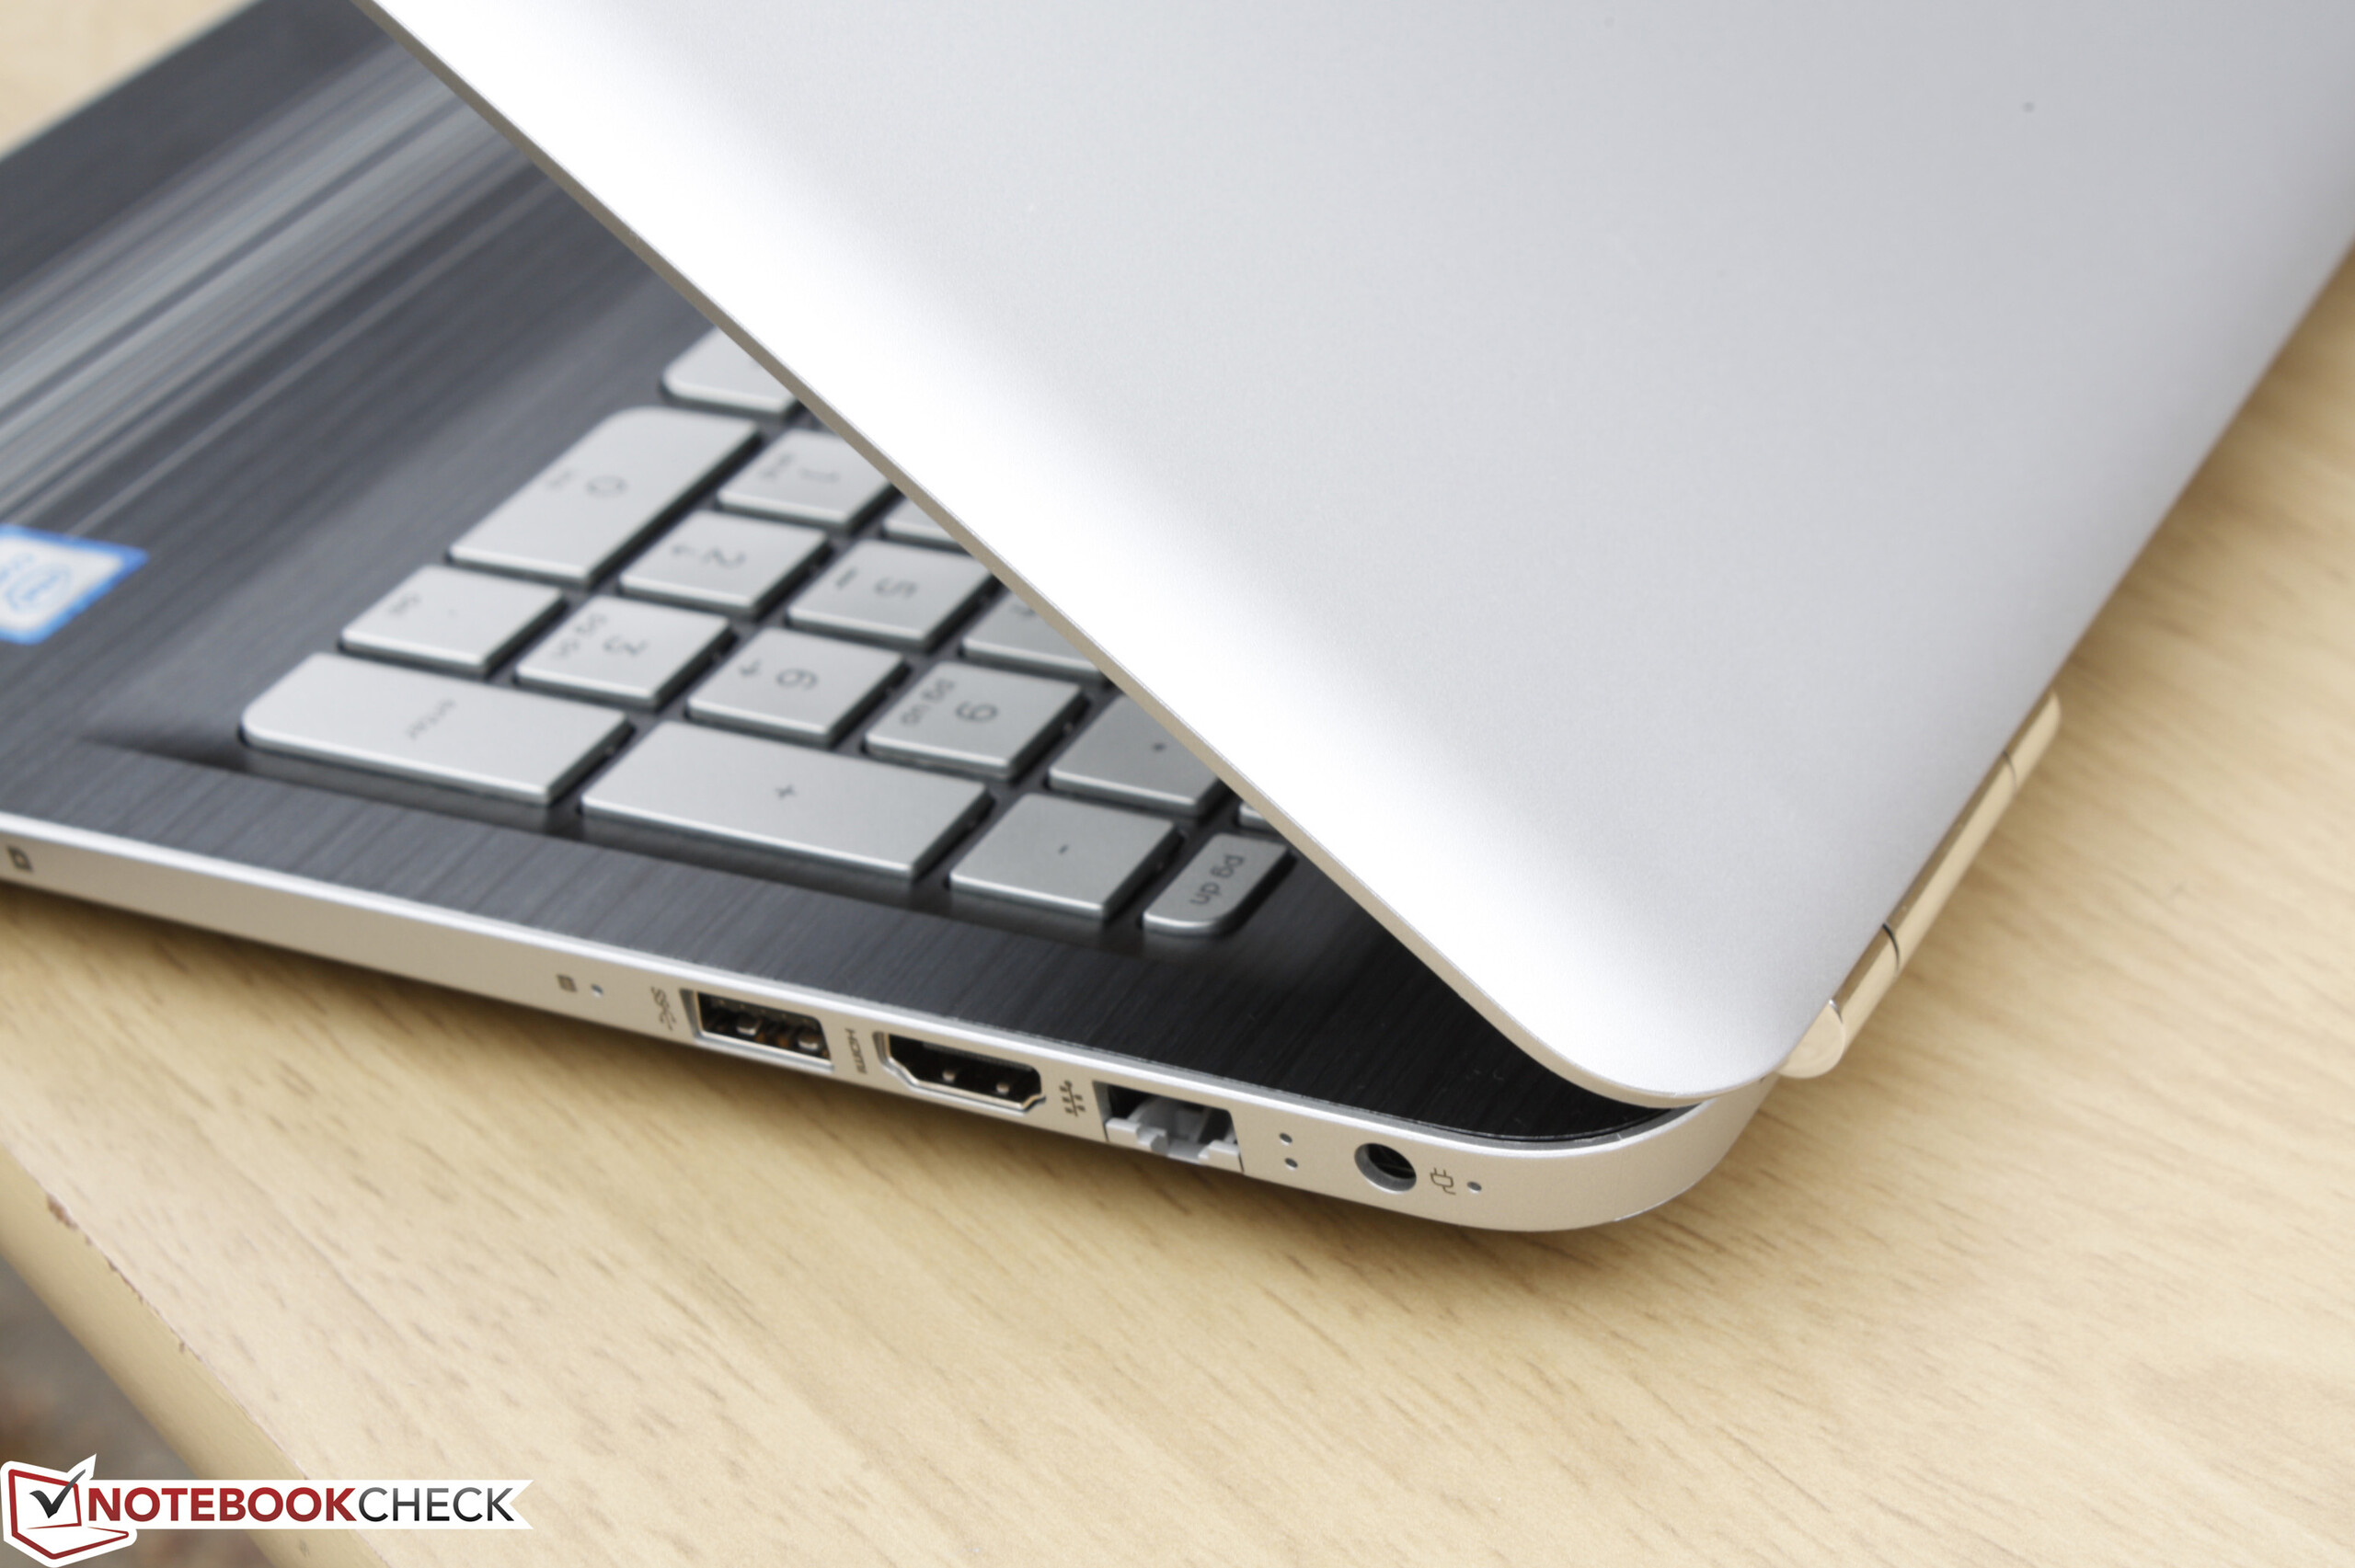
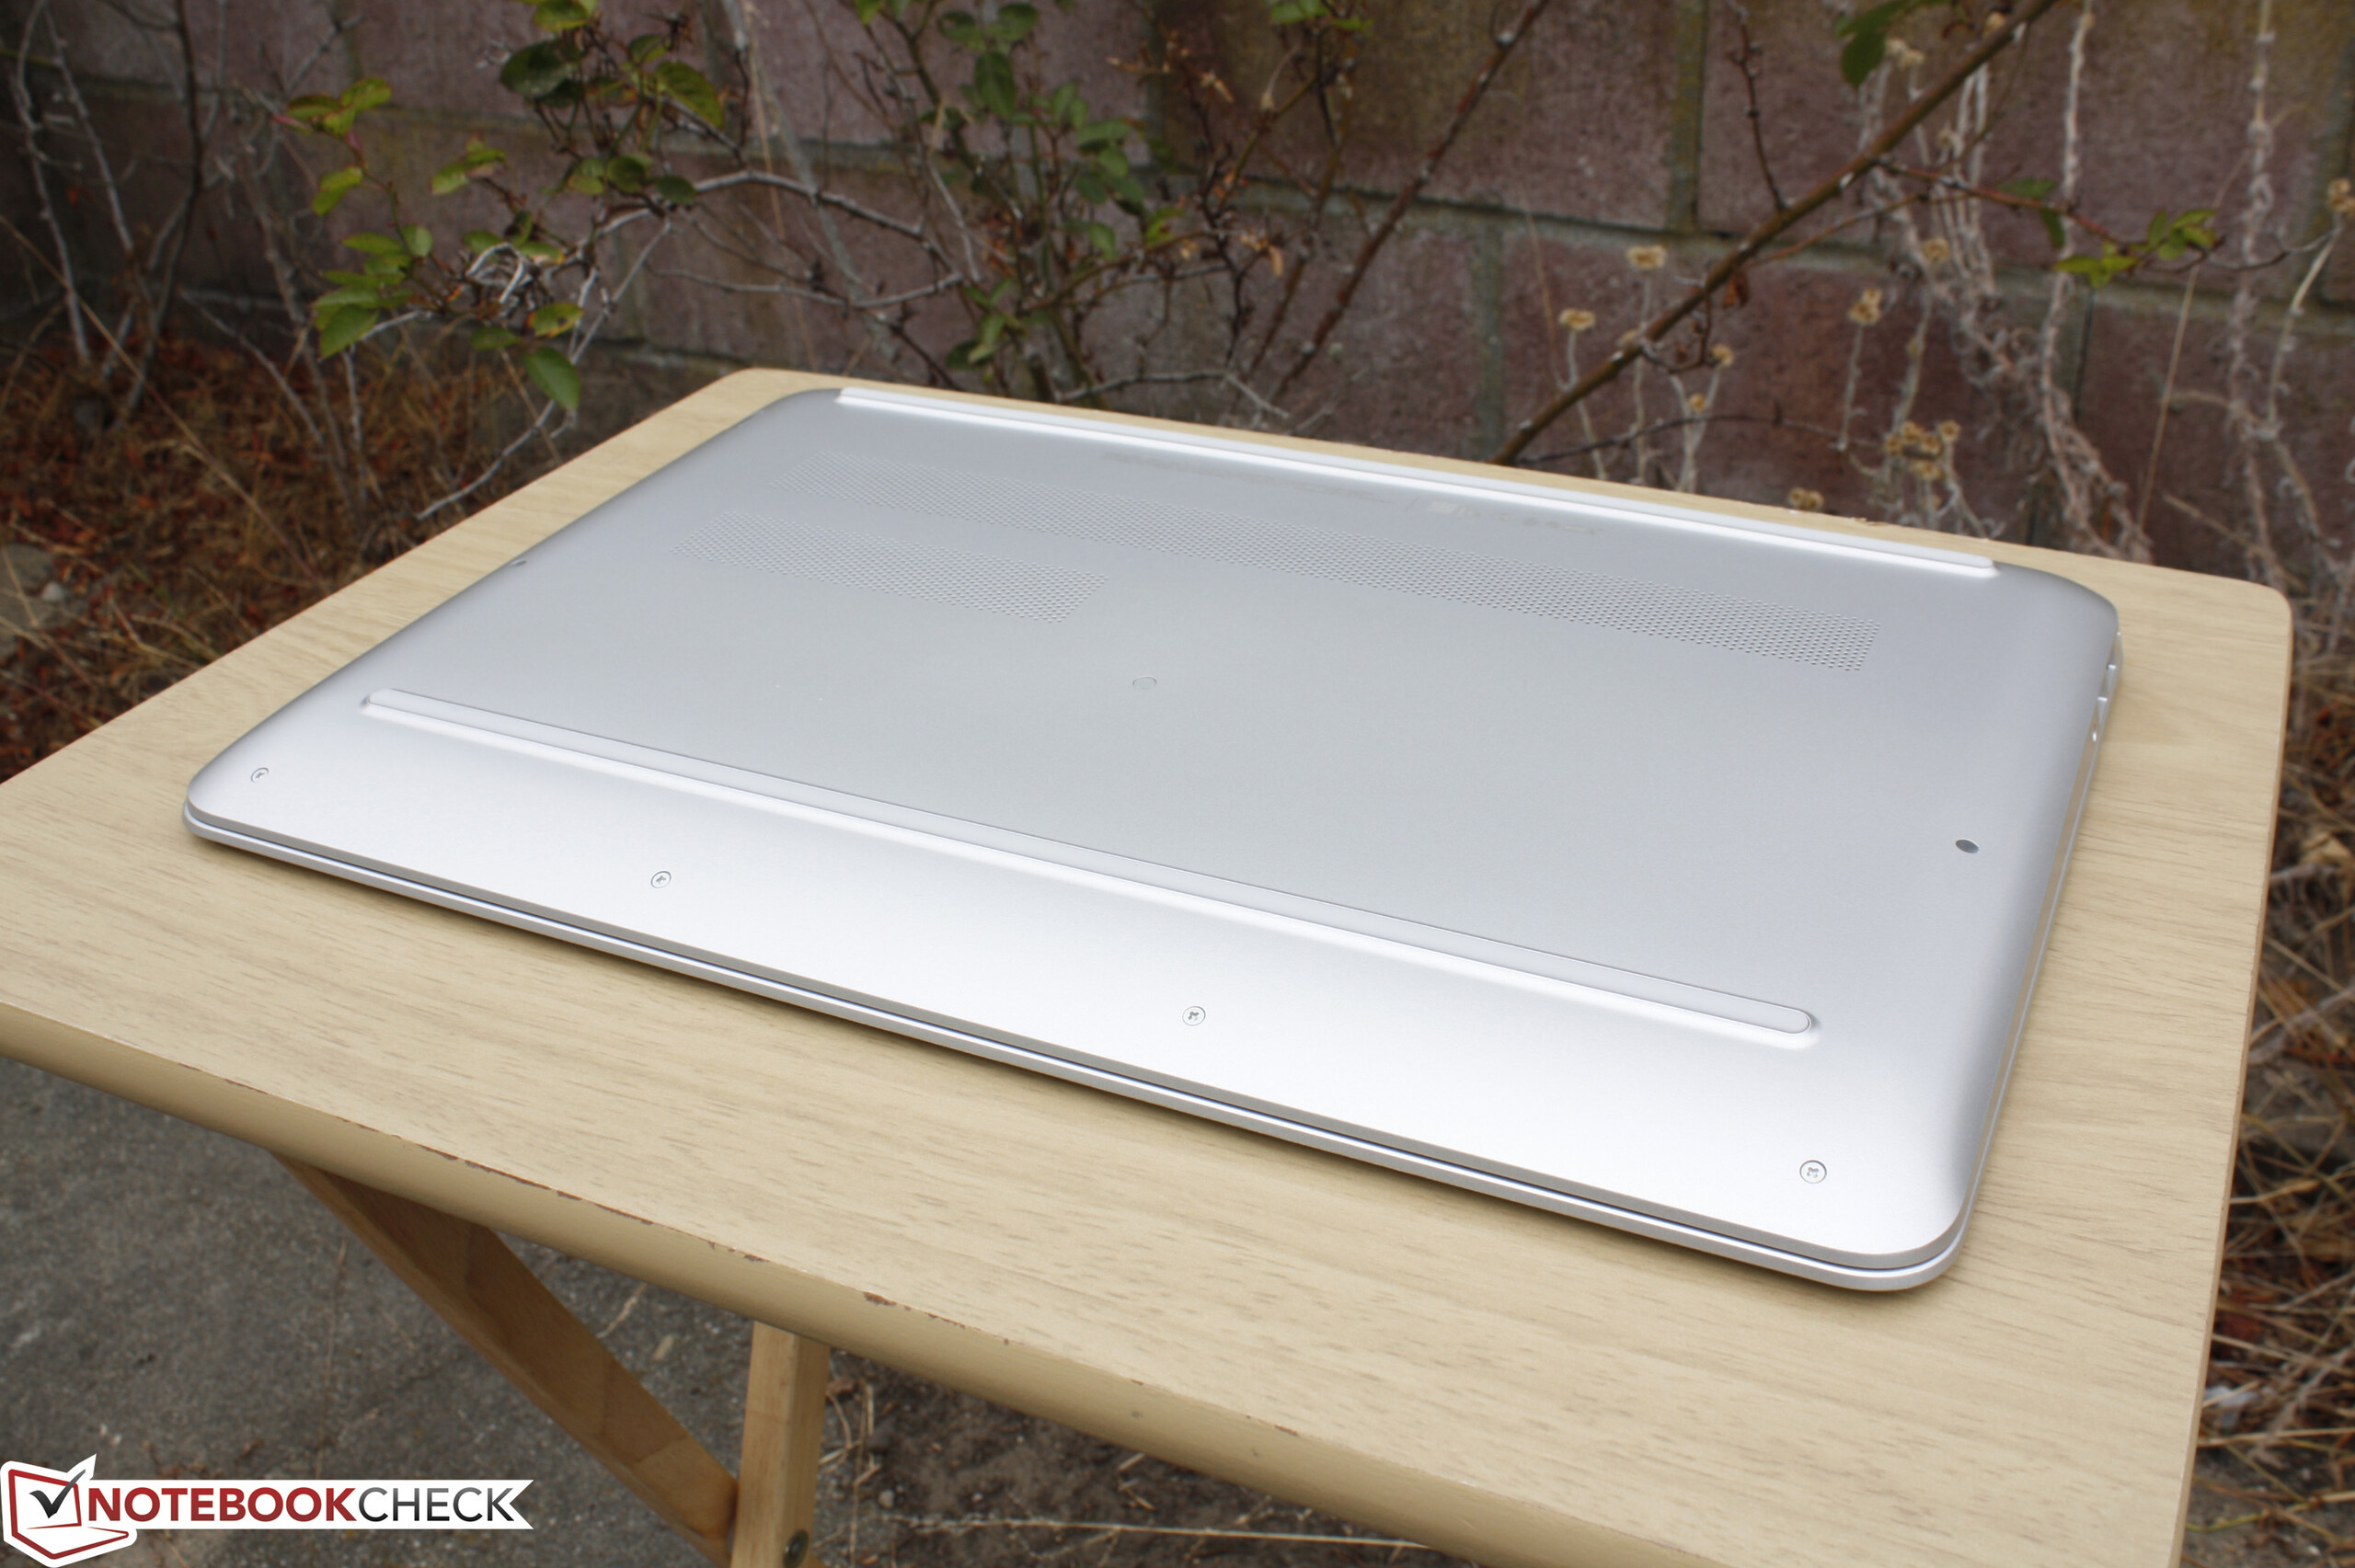
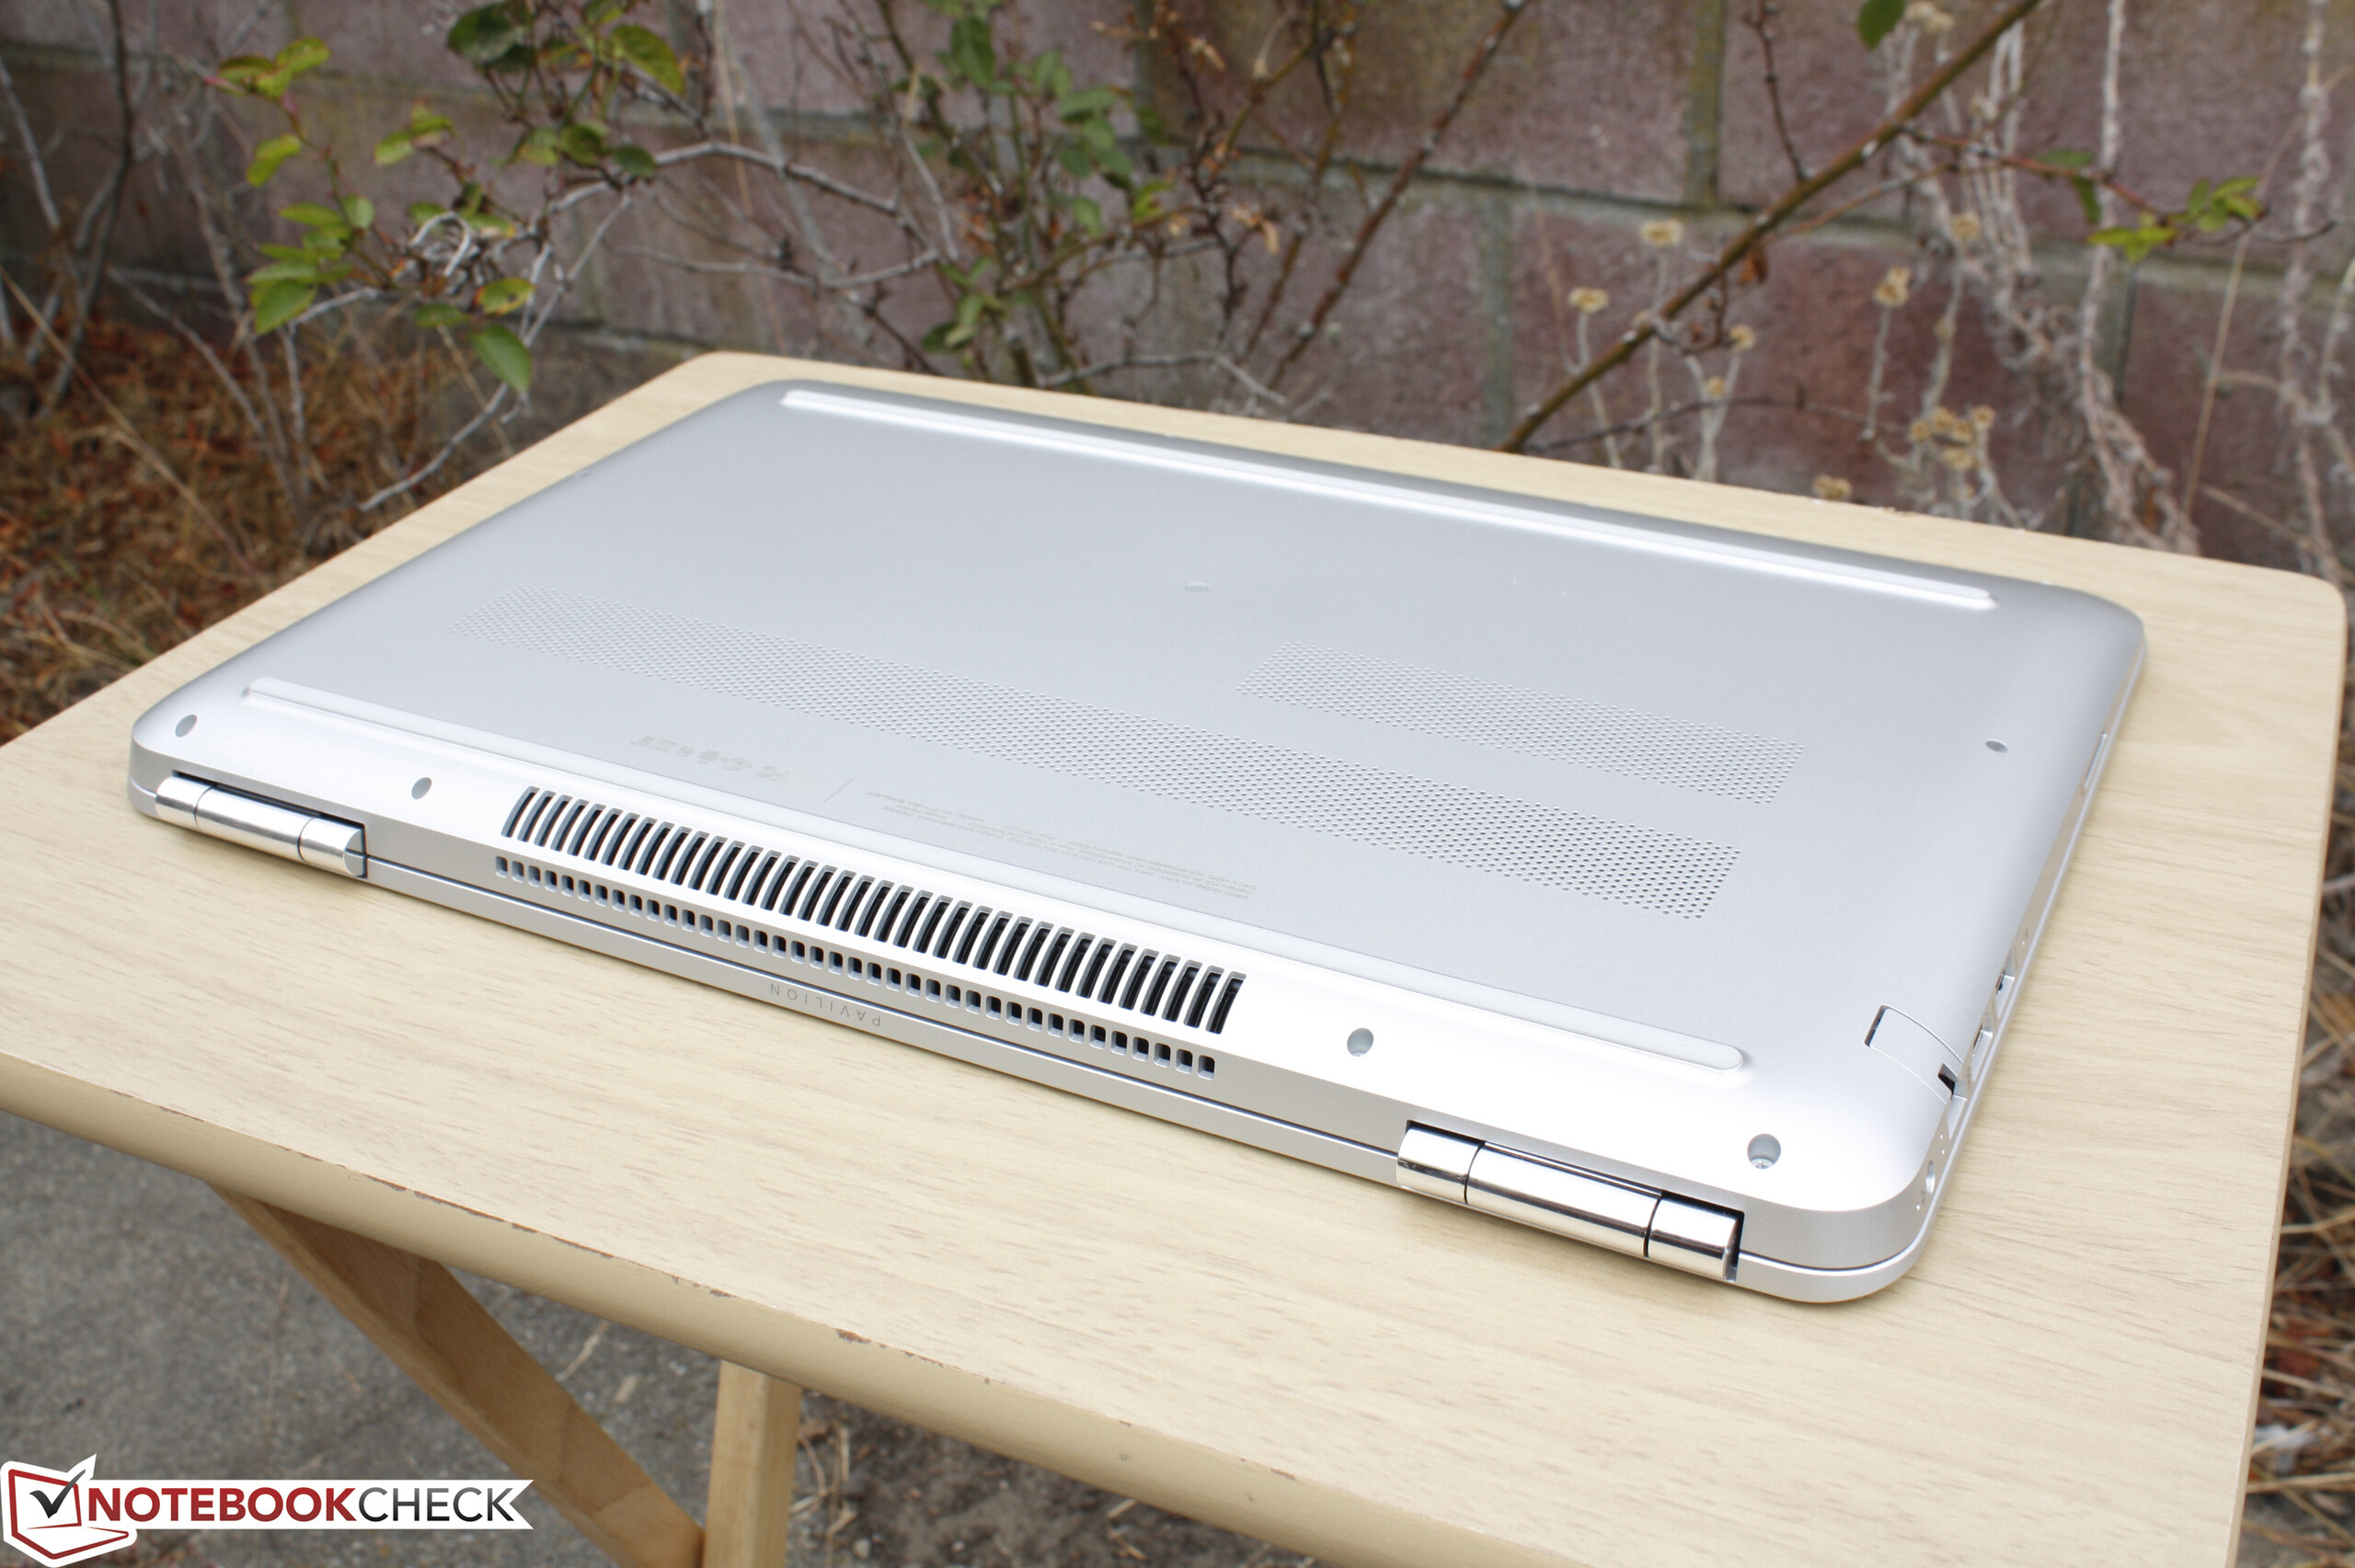
Çok büyük bir güncelleme olmasa da yeni kasa eskisine göre biraz daha iyi ancak yine de kalabalıktan ayrışmasına imkan sunmuyor. Bu yüzden Pavilion serisinin en büyük avantajı fiyatı.
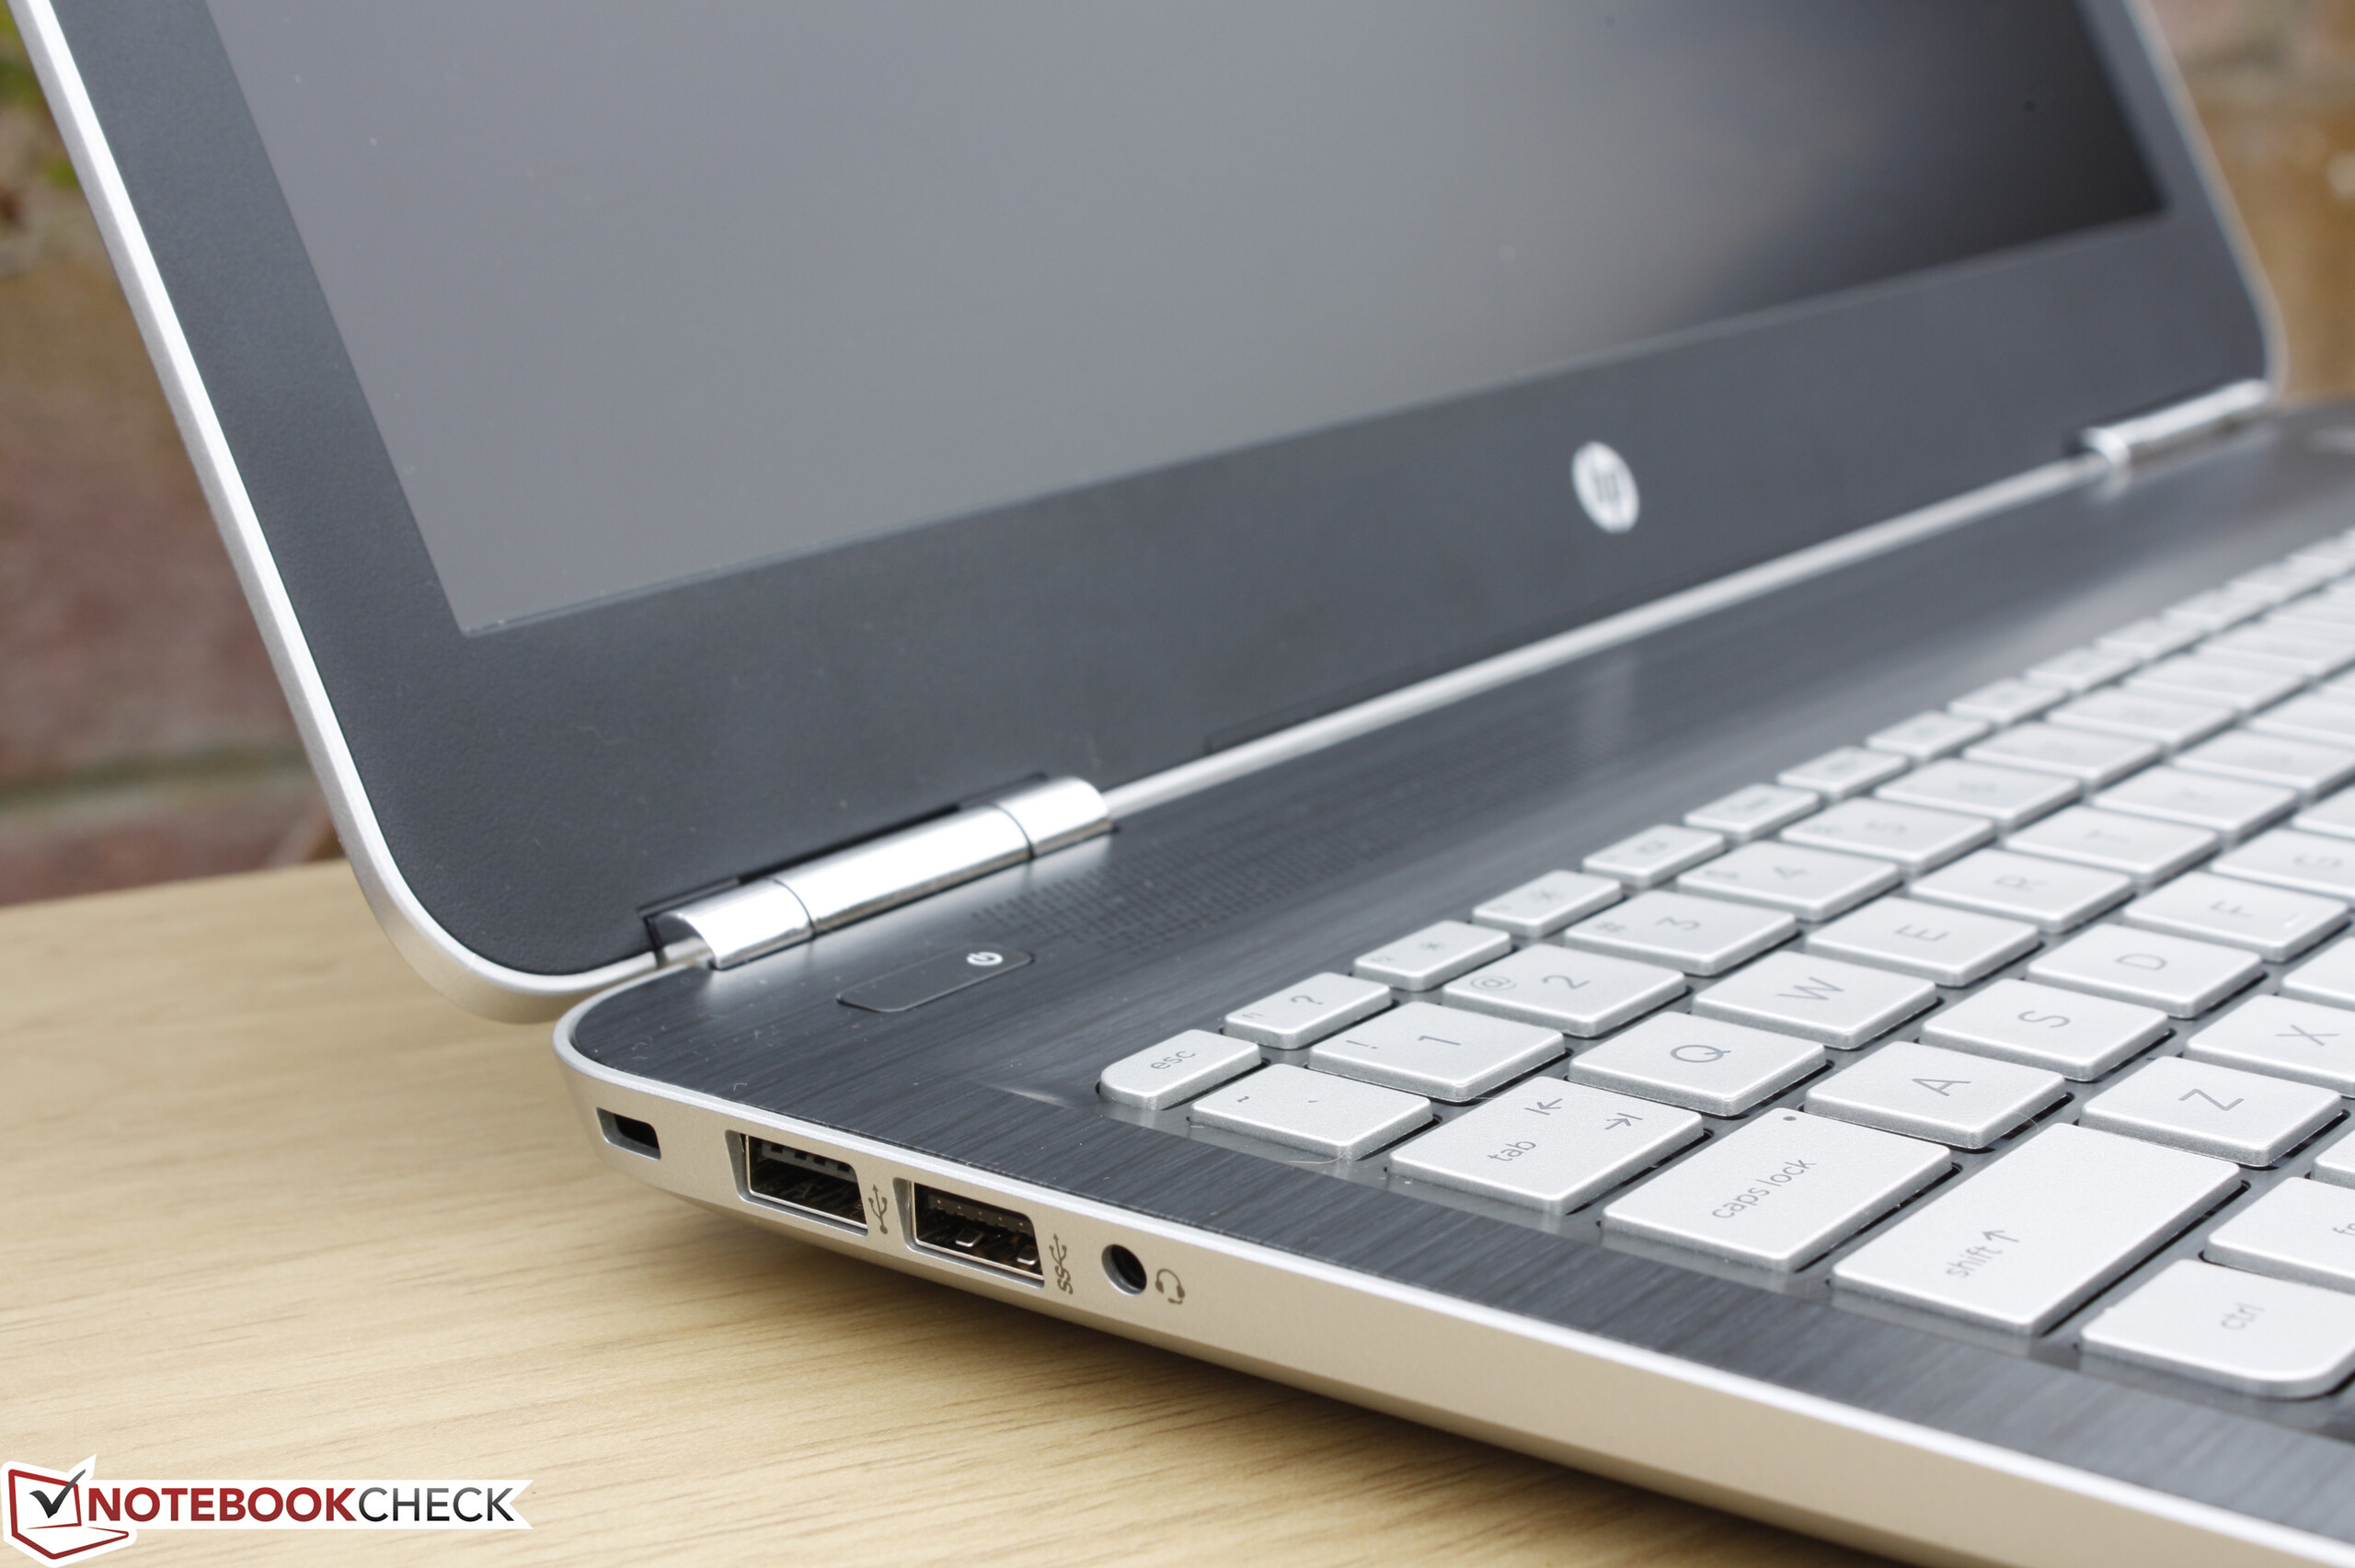
Tam anlamıyla kemik bir oyun ve multimedia cihazı ve rakiplerine göre daha ucuz. Donanım ve özellikleri rakiplerine göre daha düşük kalsa da, çekirdek özellikleri düşük bütçeli oyunculara çekici gelebilir.
Yazının orjinali için tıklayın.
HP Pavilion 15 UHD T9Y85AV
- 08/05/2016 v5.1 (old)
Allen Ngo
Price comparison
