Kısa inceleme: HTC U11
| Networking | |
| iperf3 transmit AX12 | |
| Samsung Galaxy S8 | |
| HTC U11 | |
| Sony Xperia XZ Premium | |
| LG G6 | |
| iperf3 receive AX12 | |
| Sony Xperia XZ Premium | |
| HTC U11 | |
| Samsung Galaxy S8 | |
| LG G6 | |


| |||||||||||||||||||||||||
Aydınlatma: 90 %
Batarya modunda parlaklık: 482 cd/m²
Kontrast: 1461:1 (Siyah: 0.33 cd/m²)
ΔE ColorChecker Calman: 3.2 | ∀{0.5-29.43 Ø4.71}
ΔE Greyscale Calman: 2.2 | ∀{0.09-98 Ø4.96}
Gamma: 2.22
CCT: 6581 K
| HTC U11 Super LCD5, 2560x1440, 5.5" | HTC 10 Super LCD 5, 2560x1440, 5.2" | Samsung Galaxy S8 Super AMOLED, 2960x1440, 5.8" | Huawei P10 Plus LTPS, 2560x1440, 5.5" | OnePlus 5 AMOLED, 1920x1080, 5.5" | Apple iPhone 7 Plus IPS, 1920x1080, 5.5" | Sony Xperia XZ Premium IPS, 3840x2160, 5.5" | |
|---|---|---|---|---|---|---|---|
| Screen | -12% | 3% | 5% | 13% | 23% | -11% | |
| Brightness middle (cd/m²) | 482 | 445 -8% | 566 17% | 568 18% | 426 -12% | 557 16% | 578 20% |
| Brightness (cd/m²) | 472 | 434 -8% | 564 19% | 562 19% | 431 -9% | 553 17% | 568 20% |
| Brightness Distribution (%) | 90 | 93 3% | 94 4% | 92 2% | 93 3% | 97 8% | 92 2% |
| Black Level * (cd/m²) | 0.33 | 0.36 -9% | 0.43 -30% | 0.35 -6% | 0.62 -88% | ||
| Contrast (:1) | 1461 | 1236 -15% | 1321 -10% | 1591 9% | 932 -36% | ||
| Colorchecker dE 2000 * | 3.2 | 2.8 13% | 2.7 16% | 2.4 25% | 1.6 50% | 1.4 56% | 2.8 13% |
| Colorchecker dE 2000 max. * | 5.4 | 5.8 -7% | 5.4 -0% | 3.8 30% | 4.1 24% | 3.1 43% | 5.1 6% |
| Greyscale dE 2000 * | 2.2 | 3.7 -68% | 3.1 -41% | 2.5 -14% | 1.7 23% | 1.3 41% | 2.8 -27% |
| Gamma | 2.22 99% | 2.31 95% | 2.15 102% | 2.37 93% | 2.25 98% | 2.21 100% | 2.15 102% |
| CCT | 6581 99% | 7164 91% | 6335 103% | 6779 96% | 6329 103% | 6667 97% | 6728 97% |
| Color Space (Percent of AdobeRGB 1998) (%) | 81.57 | 63.1 | |||||
| Color Space (Percent of sRGB) (%) | 99.87 | 99.83 |
* ... daha küçük daha iyidir
Ekran Titremesi / PWM (Darbe Genişliği Modülasyonu)
| Ekran titriyor / PWM algılanmadı | 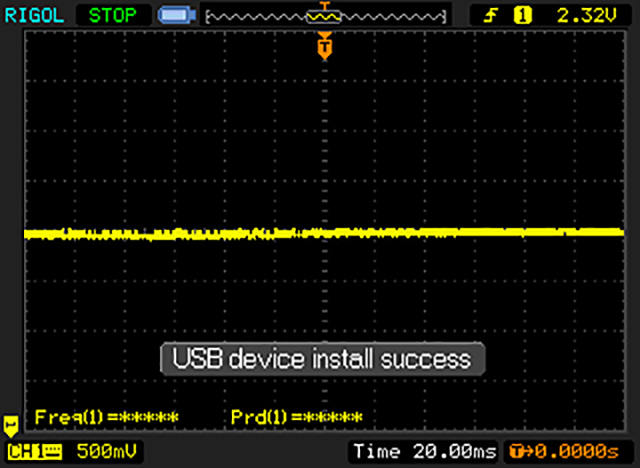 | ||
Karşılaştırıldığında: Test edilen tüm cihazların %52 %'si ekranı karartmak için PWM kullanmıyor. PWM tespit edilirse, ortalama 7754 (minimum: 5 - maksimum: 343500) Hz ölçüldü. | |||
Yanıt Sürelerini Görüntüle
| ↔ Tepki Süresi Siyahtan Beyaza | ||
|---|---|---|
| 24.8 ms ... yükseliş ↗ ve sonbahar↘ birleşimi | ↗ 10.8 ms yükseliş | 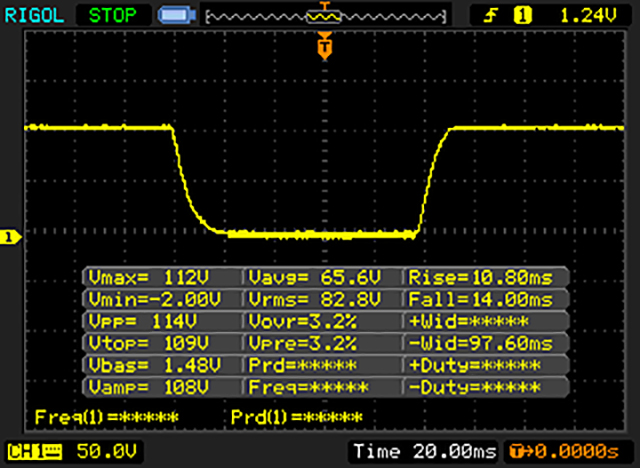 |
| ↘ 14 ms sonbahar | ||
| Ekran, testlerimizde iyi yanıt oranları gösteriyor ancak rekabetçi oyuncular için çok yavaş olabilir. Karşılaştırıldığında, test edilen tüm cihazlar 0.1 (minimum) ile 240 (maksimum) ms arasında değişir. » Tüm cihazların 58 %'si daha iyi. Bu, ölçülen yanıt süresinin test edilen tüm cihazların ortalamasından (19.8 ms) daha kötü olduğu anlamına gelir. | ||
| ↔ Tepki Süresi %50 Griden %80 Griye | ||
| 42 ms ... yükseliş ↗ ve sonbahar↘ birleşimi | ↗ 20.8 ms yükseliş | 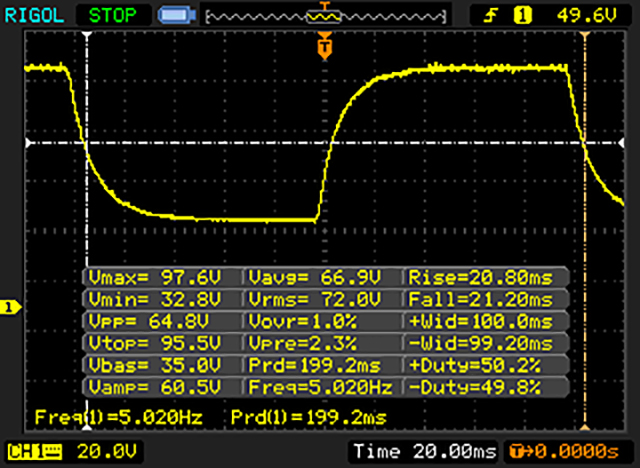 |
| ↘ 21.2 ms sonbahar | ||
| Ekran, testlerimizde yavaş yanıt oranları gösteriyor ve oyuncular için yetersiz olacaktır. Karşılaştırıldığında, test edilen tüm cihazlar 0.165 (minimum) ile 636 (maksimum) ms arasında değişir. » Tüm cihazların 67 %'si daha iyi. Bu, ölçülen yanıt süresinin test edilen tüm cihazların ortalamasından (31 ms) daha kötü olduğu anlamına gelir. | ||
| AnTuTu v6 - Total Score (değere göre sırala) | |
| HTC U11 | |
| HTC 10 | |
| Samsung Galaxy S8 | |
| Huawei P10 Plus | |
| Sony Xperia XZ Premium | |
| LG G6 | |
| Lenovo Moto Z | |
| Xiaomi Mi 6 | |
| OnePlus 5 | |
| Apple iPhone 7 Plus | |
| PCMark for Android | |
| Work performance score (değere göre sırala) | |
| HTC U11 | |
| HTC 10 | |
| Samsung Galaxy S8 | |
| Huawei P10 Plus | |
| Sony Xperia XZ Premium | |
| LG G6 | |
| Lenovo Moto Z | |
| Xiaomi Mi 6 | |
| OnePlus 5 | |
| Work 2.0 performance score (değere göre sırala) | |
| HTC U11 | |
| HTC 10 | |
| Samsung Galaxy S8 | |
| Huawei P10 Plus | |
| Sony Xperia XZ Premium | |
| LG G6 | |
| Xiaomi Mi 6 | |
| OnePlus 5 | |
| Geekbench 4.4 | |
| 64 Bit Single-Core Score (değere göre sırala) | |
| HTC U11 | |
| HTC 10 | |
| Samsung Galaxy S8 | |
| Huawei P10 Plus | |
| Sony Xperia XZ Premium | |
| LG G6 | |
| Xiaomi Mi 6 | |
| OnePlus 5 | |
| 64 Bit Multi-Core Score (değere göre sırala) | |
| HTC U11 | |
| HTC 10 | |
| Samsung Galaxy S8 | |
| Huawei P10 Plus | |
| Sony Xperia XZ Premium | |
| LG G6 | |
| Xiaomi Mi 6 | |
| OnePlus 5 | |
| GFXBench (DX / GLBenchmark) 2.7 | |
| T-Rex Onscreen (değere göre sırala) | |
| HTC U11 | |
| HTC 10 | |
| Samsung Galaxy S8 | |
| Huawei P10 Plus | |
| Sony Xperia XZ Premium | |
| LG G6 | |
| Lenovo Moto Z | |
| Xiaomi Mi 6 | |
| OnePlus 5 | |
| Apple iPhone 7 Plus | |
| 1920x1080 T-Rex Offscreen (değere göre sırala) | |
| HTC U11 | |
| HTC 10 | |
| Samsung Galaxy S8 | |
| Huawei P10 Plus | |
| Sony Xperia XZ Premium | |
| LG G6 | |
| Lenovo Moto Z | |
| Xiaomi Mi 6 | |
| OnePlus 5 | |
| Apple iPhone 7 Plus | |
| GFXBench 3.0 | |
| on screen Manhattan Onscreen OGL (değere göre sırala) | |
| HTC U11 | |
| HTC 10 | |
| Samsung Galaxy S8 | |
| Huawei P10 Plus | |
| Sony Xperia XZ Premium | |
| LG G6 | |
| Lenovo Moto Z | |
| Xiaomi Mi 6 | |
| OnePlus 5 | |
| Apple iPhone 7 Plus | |
| 1920x1080 1080p Manhattan Offscreen (değere göre sırala) | |
| HTC U11 | |
| HTC 10 | |
| Samsung Galaxy S8 | |
| Huawei P10 Plus | |
| Sony Xperia XZ Premium | |
| LG G6 | |
| Lenovo Moto Z | |
| Xiaomi Mi 6 | |
| OnePlus 5 | |
| Apple iPhone 7 Plus | |
| GFXBench 3.1 | |
| on screen Manhattan ES 3.1 Onscreen (değere göre sırala) | |
| HTC U11 | |
| HTC 10 | |
| Samsung Galaxy S8 | |
| Huawei P10 Plus | |
| Sony Xperia XZ Premium | |
| LG G6 | |
| Lenovo Moto Z | |
| Xiaomi Mi 6 | |
| OnePlus 5 | |
| Apple iPhone 7 Plus | |
| 1920x1080 Manhattan ES 3.1 Offscreen (değere göre sırala) | |
| HTC U11 | |
| HTC 10 | |
| Samsung Galaxy S8 | |
| Huawei P10 Plus | |
| Sony Xperia XZ Premium | |
| LG G6 | |
| Lenovo Moto Z | |
| Xiaomi Mi 6 | |
| OnePlus 5 | |
| Apple iPhone 7 Plus | |
| GFXBench | |
| on screen Car Chase Onscreen (değere göre sırala) | |
| HTC U11 | |
| HTC 10 | |
| Samsung Galaxy S8 | |
| Huawei P10 Plus | |
| Sony Xperia XZ Premium | |
| LG G6 | |
| Lenovo Moto Z | |
| Xiaomi Mi 6 | |
| OnePlus 5 | |
| 1920x1080 Car Chase Offscreen (değere göre sırala) | |
| HTC U11 | |
| HTC 10 | |
| Samsung Galaxy S8 | |
| Huawei P10 Plus | |
| Sony Xperia XZ Premium | |
| LG G6 | |
| Lenovo Moto Z | |
| Xiaomi Mi 6 | |
| OnePlus 5 | |
| Basemark ES 3.1 / Metal - offscreen Overall Score (değere göre sırala) | |
| HTC U11 | |
| HTC 10 | |
| Samsung Galaxy S8 | |
| LG G6 | |
| Lenovo Moto Z | |
| Xiaomi Mi 6 | |
| Apple iPhone 7 Plus | |
| Lightmark - 1920x1080 1080p (değere göre sırala) | |
| HTC U11 | |
| Samsung Galaxy S8 | |
| LG G6 | |
| Lenovo Moto Z | |
| Xiaomi Mi 6 | |
| WebXPRT 2015 - Overall (değere göre sırala) | |
| HTC U11 (Chrome 58) | |
| HTC 10 (Chrome 49) | |
| Samsung Galaxy S8 (Samsung Browser 5.2) | |
| Huawei P10 Plus | |
| Sony Xperia XZ Premium (Chrome 59) | |
| LG G6 (Chrome 57) | |
| Lenovo Moto Z (Chrome 53) | |
| OnePlus 5 (Chrome 59) | |
| Apple iPhone 7 Plus | |
| Octane V2 - Total Score (değere göre sırala) | |
| HTC U11 (Chrome 58) | |
| HTC 10 (Chrome 49) | |
| Samsung Galaxy S8 (Samsung Browser 5.2) | |
| Huawei P10 Plus (Chrome 58.0.3029.83) | |
| Sony Xperia XZ Premium (Chrome 59) | |
| LG G6 (Chrome 57) | |
| Lenovo Moto Z (Chrome 53) | |
| Xiaomi Mi 6 (Chrome Version 58) | |
| OnePlus 5 (Chrome 59) | |
| Apple iPhone 7 Plus (Safari Mobile 10.0) | |
| JetStream 1.1 - 1.1 Total (değere göre sırala) | |
| HTC U11 (Chrome 58) | |
| HTC 10 (Chrome 49) | |
| Samsung Galaxy S8 (Samsung Browser 5.2) | |
| Huawei P10 Plus | |
| Sony Xperia XZ Premium (Chrome 59) | |
| LG G6 (Chrome 57) | |
| Lenovo Moto Z (Chrome 53) | |
| Xiaomi Mi 6 (Chrome Version 58) | |
| OnePlus 5 (Chrome 59) | |
| Apple iPhone 7 Plus (Safari Mobile 10.0) | |
| Mozilla Kraken 1.1 - Total (değere göre sırala) | |
| HTC U11 (Chrome 58) | |
| HTC 10 (Chrome 49) | |
| Samsung Galaxy S8 (Samsung Browser 5.2) | |
| Huawei P10 Plus (Chrome 58.0.3029.83) | |
| Sony Xperia XZ Premium (Chrome 59) | |
| LG G6 (Chrome 57) | |
| Lenovo Moto Z (Chrome 53) | |
| Xiaomi Mi 6 (Chrome Version 58) | |
| OnePlus 5 (Chrome 59) | |
| Apple iPhone 7 Plus (Safari Mobile 10.0) | |
* ... daha küçük daha iyidir
| HTC U11 | HTC 10 | Samsung Galaxy S8 | Huawei P10 Plus | Sony Xperia XZ Premium | LG G6 | Lenovo Moto Z | Xiaomi Mi 6 | OnePlus 5 | |
|---|---|---|---|---|---|---|---|---|---|
| AndroBench 3-5 | -32% | -5% | 20% | -30% | -21% | -4% | -4% | -5% | |
| Sequential Read 256KB (MB/s) | 717 | 275.1 -62% | 793 11% | 733 2% | 687 -4% | 428.7 -40% | 439.7 -39% | 728 2% | 748 4% |
| Sequential Write 256KB (MB/s) | 206.4 | 115.6 -44% | 193.2 -6% | 182.6 -12% | 194 -6% | 122.8 -41% | 168.3 -18% | 196.7 -5% | 201.5 -2% |
| Random Read 4KB (MB/s) | 91.4 | 29.92 -67% | 127.2 39% | 173.1 89% | 74.1 -19% | 95.2 4% | 117.2 28% | 143.5 57% | 141 54% |
| Random Write 4KB (MB/s) | 80 | 15.89 -80% | 15.25 -81% | 149.8 87% | 17.2 -78% | 16.58 -79% | 74.9 -6% | 25.19 -69% | 19.3 -76% |
| Sequential Read 256KB SDCard (MB/s) | 68.8 ? | 83.3 ? 21% | 63.9 ? -7% | 54 ? -22% | 36.79 ? -47% | 77.6 ? 13% | 78.5 ? 14% | ||
| Sequential Write 256KB SDCard (MB/s) | 46.25 ? | 65.4 ? 41% | 53.5 ? 16% | 33.61 ? -27% | 33.31 ? -28% | 53.3 ? 15% | 45.64 ? -1% |
(-) Üst taraftaki maksimum sıcaklık, 35.3 °C / 96 F ortalamasına kıyasla 46.3 °C / 115 F'dir. , Smartphone sınıfı için 21.9 ile 247 °C arasında değişir.
(±) Alt kısım, 34 °C / 93 F ortalamasına kıyasla maksimum 40.2 °C / 104 F'ye kadar ısınır
(±) Boşta kullanımda, üst tarafın ortalama sıcaklığı 35.5 °C / 96 F olup, cihazın 33 °C / 91 F.
HTC U11 ses analizi
(±) | hoparlör ses yüksekliği ortalama ama iyi (81.4 dB)
Bas 100 - 315Hz
(-) | neredeyse hiç bas yok - ortalama olarak medyandan 24.5% daha düşük
(±) | Bas doğrusallığı ortalamadır (13.3% delta - önceki frekans)
Ortalar 400 - 2000 Hz
(+) | dengeli ortalar - medyandan yalnızca 4.1% uzakta
(±) | Ortaların doğrusallığı ortalamadır (7.4% delta - önceki frekans)
Yüksekler 2 - 16 kHz
(±) | daha yüksek en yüksekler - ortalama olarak medyandan 5.1% daha yüksek
(+) | yüksekler doğrusaldır (6.2% deltadan önceki frekansa)
Toplam 100 - 16.000 Hz
(±) | Genel sesin doğrusallığı ortalamadır (22.1% ortancaya göre fark)
Aynı sınıfla karşılaştırıldığında
» Bu sınıftaki tüm test edilen cihazların %47%'si daha iyi, 7% benzer, 46% daha kötüydü
» En iyisinin deltası 11% idi, ortalama 34% idi, en kötüsü 134% idi
Test edilen tüm cihazlarla karşılaştırıldığında
» Test edilen tüm cihazların %64'si daha iyi, 6 benzer, % 30 daha kötüydü
» En iyisinin deltası 4% idi, ortalama 23% idi, en kötüsü 134% idi
Huawei P10 Plus ses analizi
(±) | hoparlör ses yüksekliği ortalama ama iyi (75.6 dB)
Bas 100 - 315Hz
(-) | neredeyse hiç bas yok - ortalama olarak medyandan 17.3% daha düşük
(±) | Bas doğrusallığı ortalamadır (12.4% delta - önceki frekans)
Ortalar 400 - 2000 Hz
(+) | dengeli ortalar - medyandan yalnızca 3.1% uzakta
(+) | orta frekanslar doğrusaldır (6.9% deltadan önceki frekansa)
Yüksekler 2 - 16 kHz
(+) | dengeli yüksekler - medyandan yalnızca 1% uzakta
(+) | yüksekler doğrusaldır (3.9% deltadan önceki frekansa)
Toplam 100 - 16.000 Hz
(±) | Genel sesin doğrusallığı ortalamadır (16.8% ortancaya göre fark)
Aynı sınıfla karşılaştırıldığında
» Bu sınıftaki tüm test edilen cihazların %9%'si daha iyi, 7% benzer, 84% daha kötüydü
» En iyisinin deltası 11% idi, ortalama 34% idi, en kötüsü 134% idi
Test edilen tüm cihazlarla karşılaştırıldığında
» Test edilen tüm cihazların %30'si daha iyi, 8 benzer, % 63 daha kötüydü
» En iyisinin deltası 4% idi, ortalama 23% idi, en kötüsü 134% idi
no name ses analizi
(+) | hoparlörler nispeten yüksek sesle çalabilir (98.4 dB)
Bas 100 - 315Hz
(+) | iyi bas - medyandan yalnızca 1.8% uzakta
(+) | bas doğrusaldır (2.2% delta ile önceki frekans)
Ortalar 400 - 2000 Hz
(+) | dengeli ortalar - medyandan yalnızca 0.5% uzakta
(+) | orta frekanslar doğrusaldır (1.5% deltadan önceki frekansa)
Yüksekler 2 - 16 kHz
(±) | azaltılmış yüksekler - ortalama olarak medyandan 6.6% daha düşük
(+) | yüksekler doğrusaldır (2.7% deltadan önceki frekansa)
Toplam 100 - 16.000 Hz
(+) | genel ses doğrusaldır (9% ortancaya göre fark)
Aynı sınıfla karşılaştırıldığında
» Bu sınıftaki tüm test edilen cihazların %3%'si daha iyi, 1% benzer, 96% daha kötüydü
» En iyisinin deltası 4% idi, ortalama 23% idi, en kötüsü 134% idi
Test edilen tüm cihazlarla karşılaştırıldığında
» Test edilen tüm cihazların %3'si daha iyi, 1 benzer, % 96 daha kötüydü
» En iyisinin deltası 4% idi, ortalama 23% idi, en kötüsü 134% idi
| Kapalı / Bekleme modu | |
| Boşta | |
| Çalışırken |
|
Key:
min: | |
| HTC U11 3000 mAh | HTC 10 3000 mAh | Samsung Galaxy S8 3000 mAh | Huawei P10 Plus 3750 mAh | Sony Xperia XZ Premium 3230 mAh | Apple iPhone 7 Plus 2915 mAh | Lenovo Moto Z 2600 mAh | OnePlus 5 3300 mAh | |
|---|---|---|---|---|---|---|---|---|
| Power Consumption | -11% | 24% | -41% | -11% | -8% | 21% | -2% | |
| Idle Minimum * (Watt) | 0.73 | 0.68 7% | 0.78 -7% | 1.03 -41% | 0.62 15% | 0.77 -5% | 0.66 10% | 0.73 -0% |
| Idle Average * (Watt) | 1.96 | 1.49 24% | 1.1 44% | 2.61 -33% | 2.44 -24% | 2.04 -4% | 1.01 48% | 1.44 27% |
| Idle Maximum * (Watt) | 1.98 | 1.91 4% | 1.16 41% | 2.83 -43% | 2.59 -31% | 2.24 -13% | 1.09 45% | 1.5 24% |
| Load Average * (Watt) | 4.82 | 7.4 -54% | 4.15 14% | 7.03 -46% | 4.94 -2% | 4.69 3% | 3.97 18% | 6.91 -43% |
| Load Maximum * (Watt) | 7.15 | 9.71 -36% | 5.12 28% | 10.08 -41% | 7.91 -11% | 8.66 -21% | 8.34 -17% | 8.51 -19% |
* ... daha küçük daha iyidir
| HTC U11 3000 mAh | HTC 10 3000 mAh | Samsung Galaxy S8 3000 mAh | Huawei P10 Plus 3750 mAh | Apple iPhone 7 Plus 2915 mAh | Sony Xperia XZ Premium 3230 mAh | LG G6 3300 mAh | Lenovo Moto Z 2600 mAh | Xiaomi Mi 6 3350 mAh | |
|---|---|---|---|---|---|---|---|---|---|
| Pil Çalışma Süresi | 1% | 36% | 26% | 31% | 34% | 36% | 20% | 32% | |
| Reader / Idle (h) | 20.8 | 21.2 2% | 27.8 34% | 27.6 33% | 30.6 47% | 29.2 40% | 29.8 43% | 22.9 10% | |
| H.264 (h) | 8.3 | 10.8 30% | 12.9 55% | 12.6 52% | 13.6 64% | 13.4 61% | 13 57% | 12.1 46% | |
| WiFi v1.3 (h) | 9.3 | 6.9 -26% | 12 29% | 12.7 37% | 9.8 5% | 11.6 25% | 11.5 24% | 6.8 -27% | 12.3 32% |
| Load (h) | 3.5 | 3.4 -3% | 4.4 26% | 2.9 -17% | 3.8 9% | 3.9 11% | 4.2 20% | 5.3 51% |
| PCMark for Android - Work 2.0 battery life | |
| Samsung Galaxy J5 (2017) Duos | |
| Huawei Mate 9 | |
| Samsung Galaxy S8 | |
| Sony Xperia XZ | |
| HTC U11 | |
| HTC 10 | |
Artılar
Eksiler
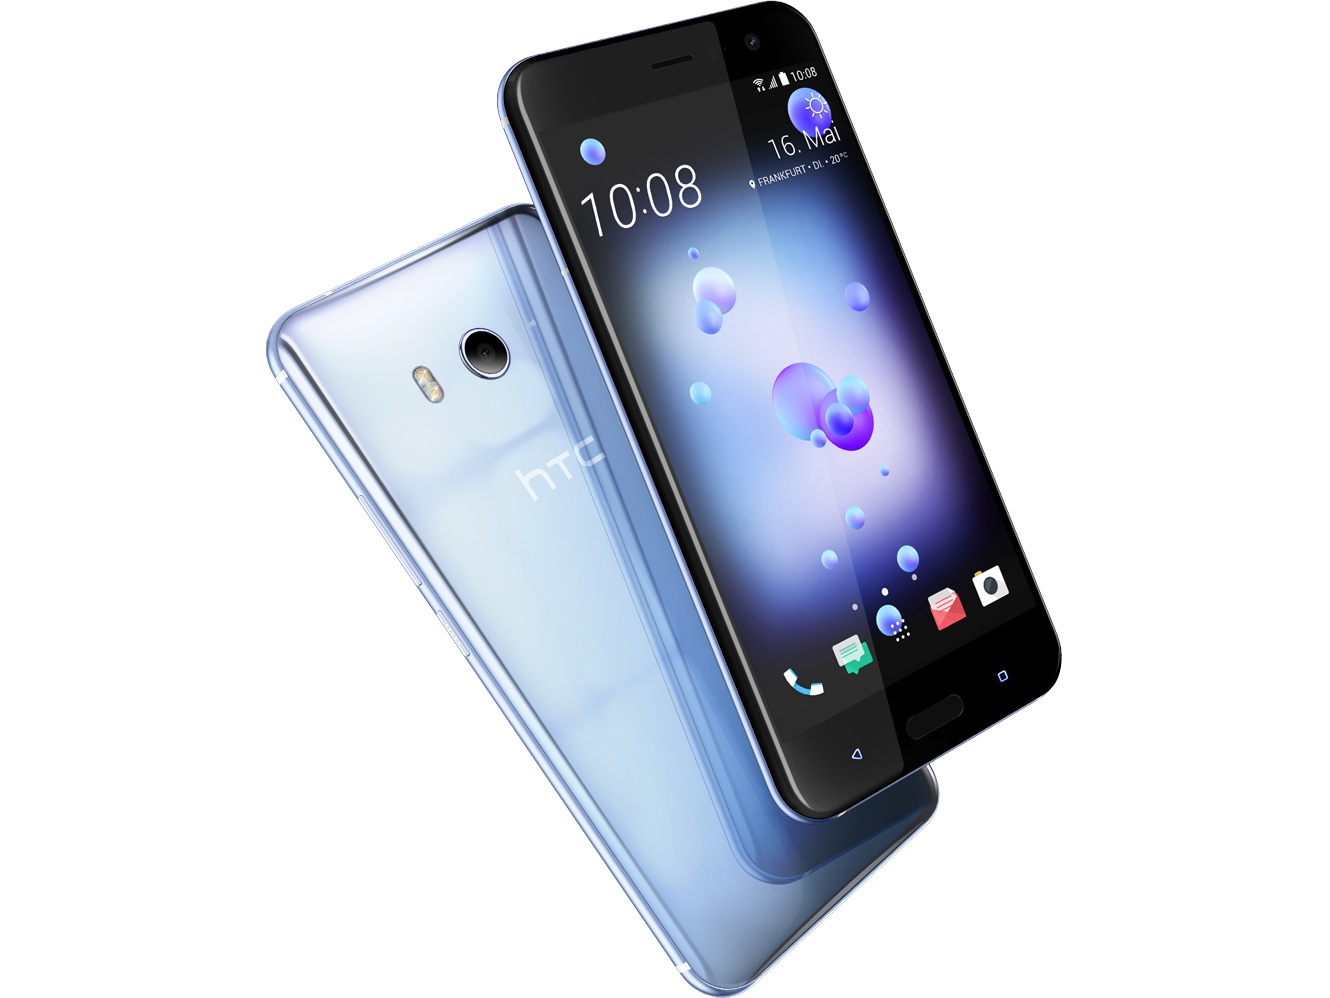
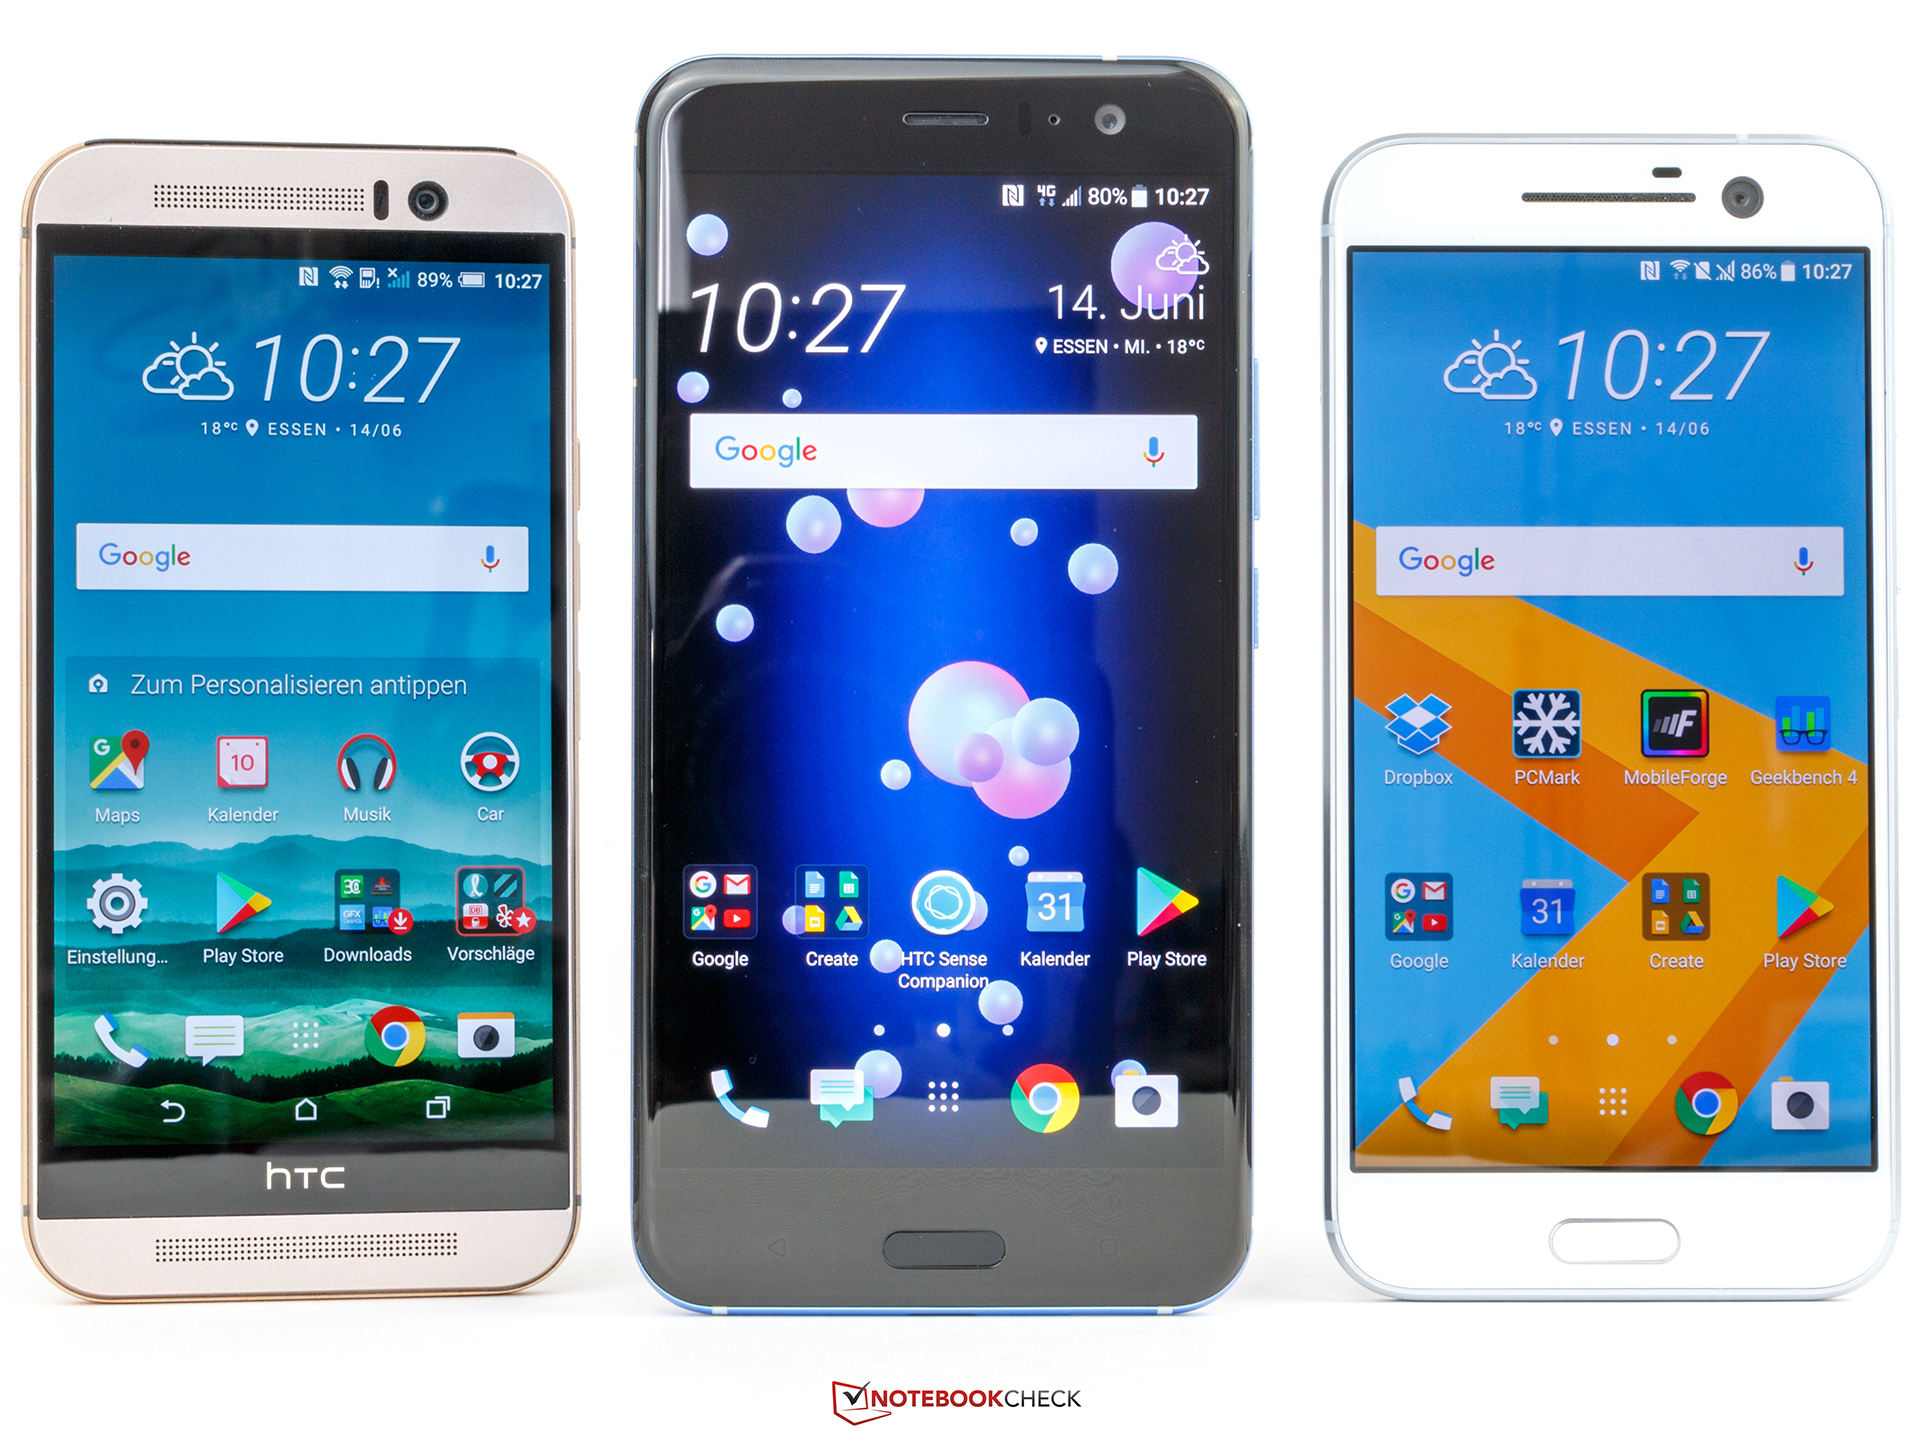
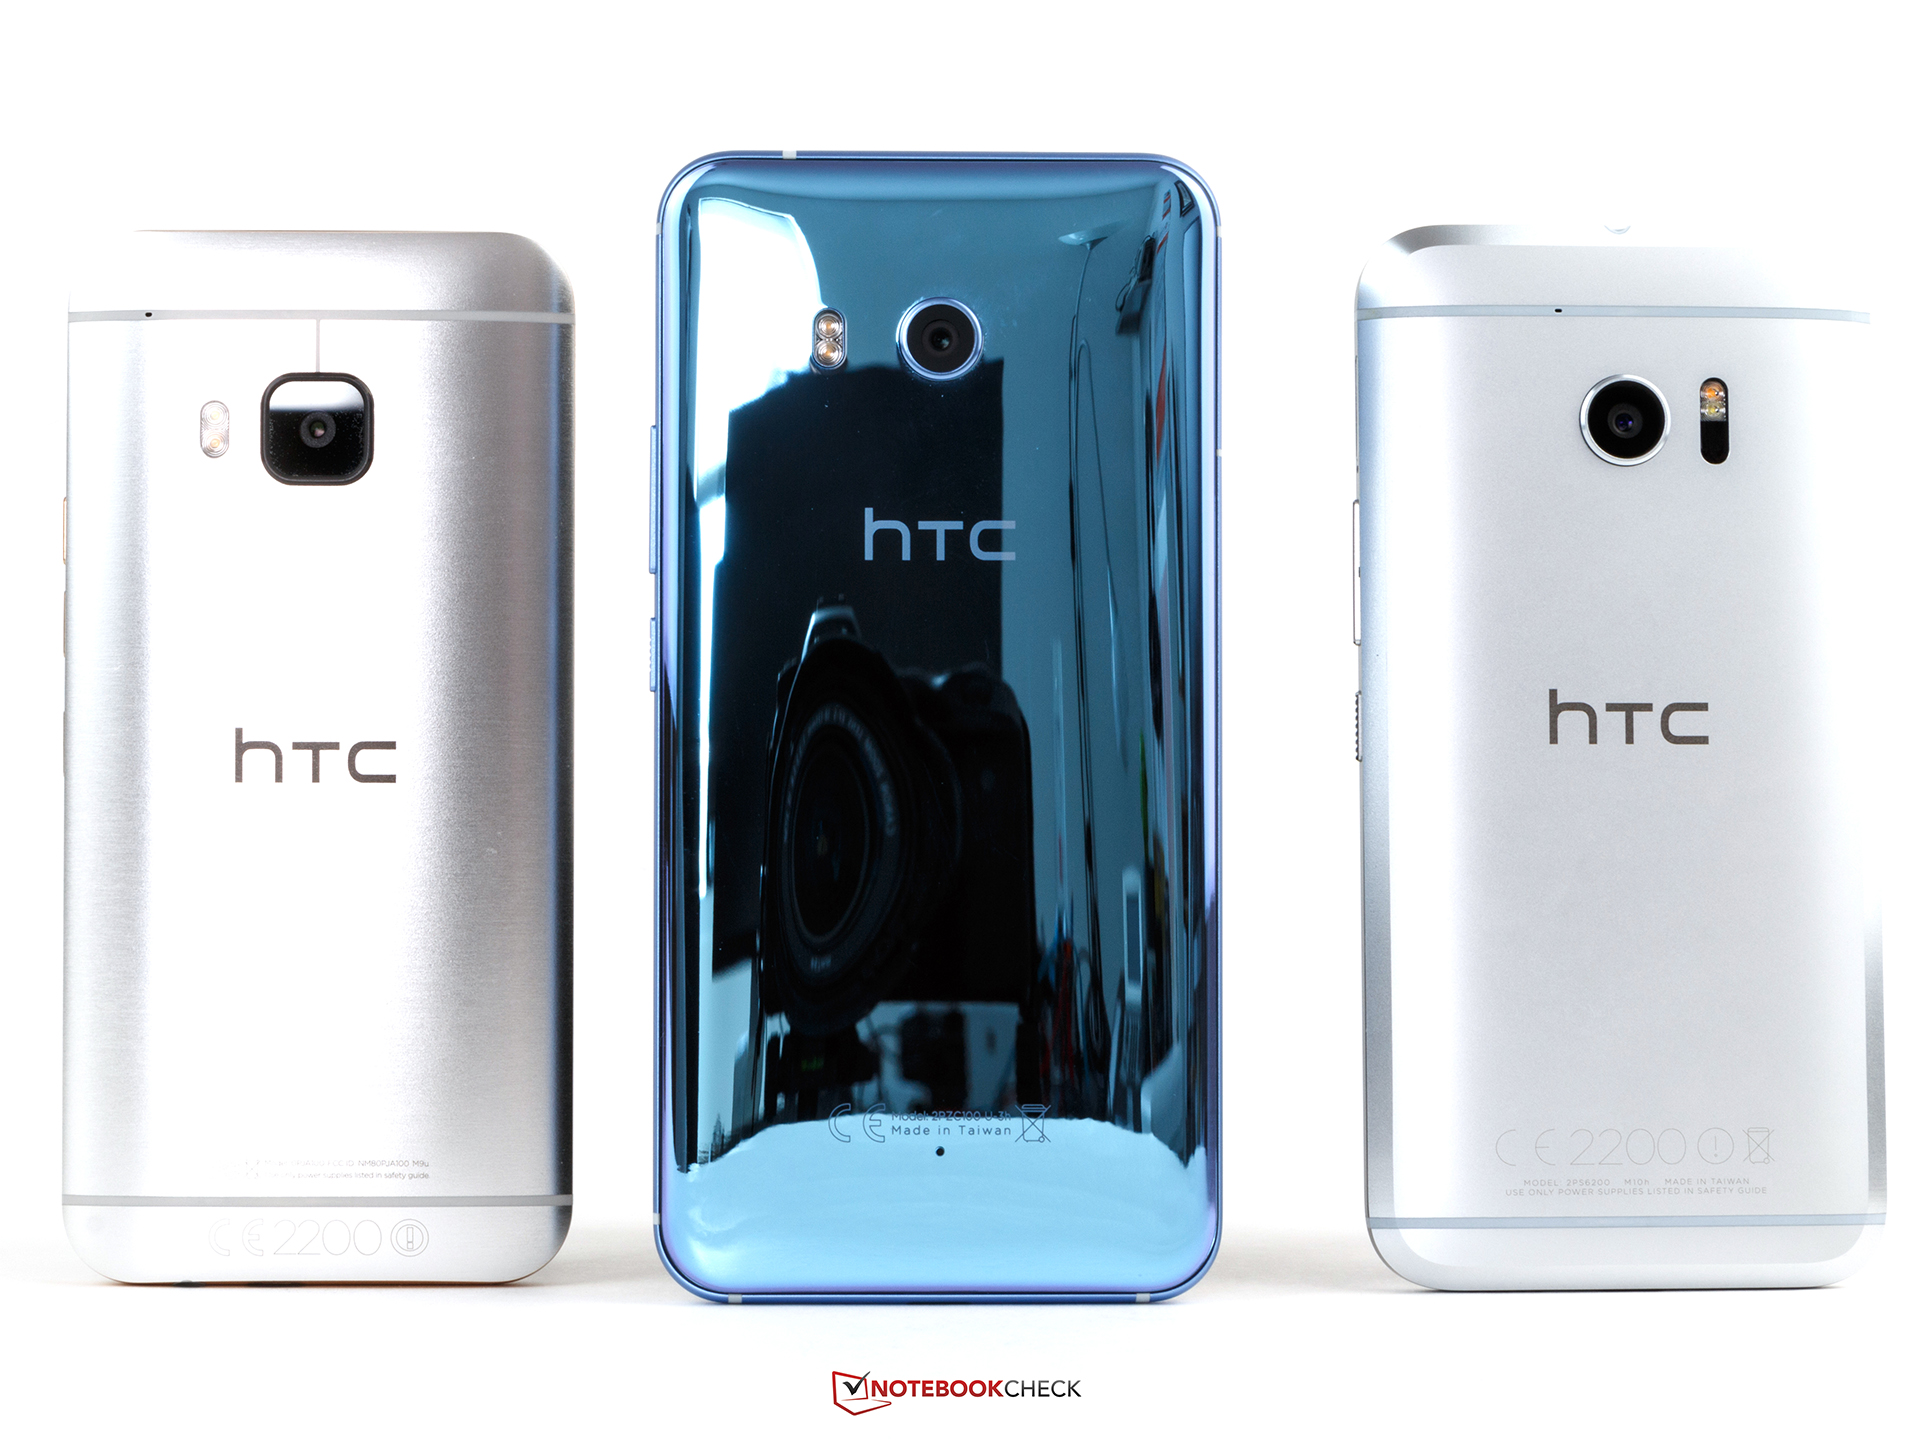
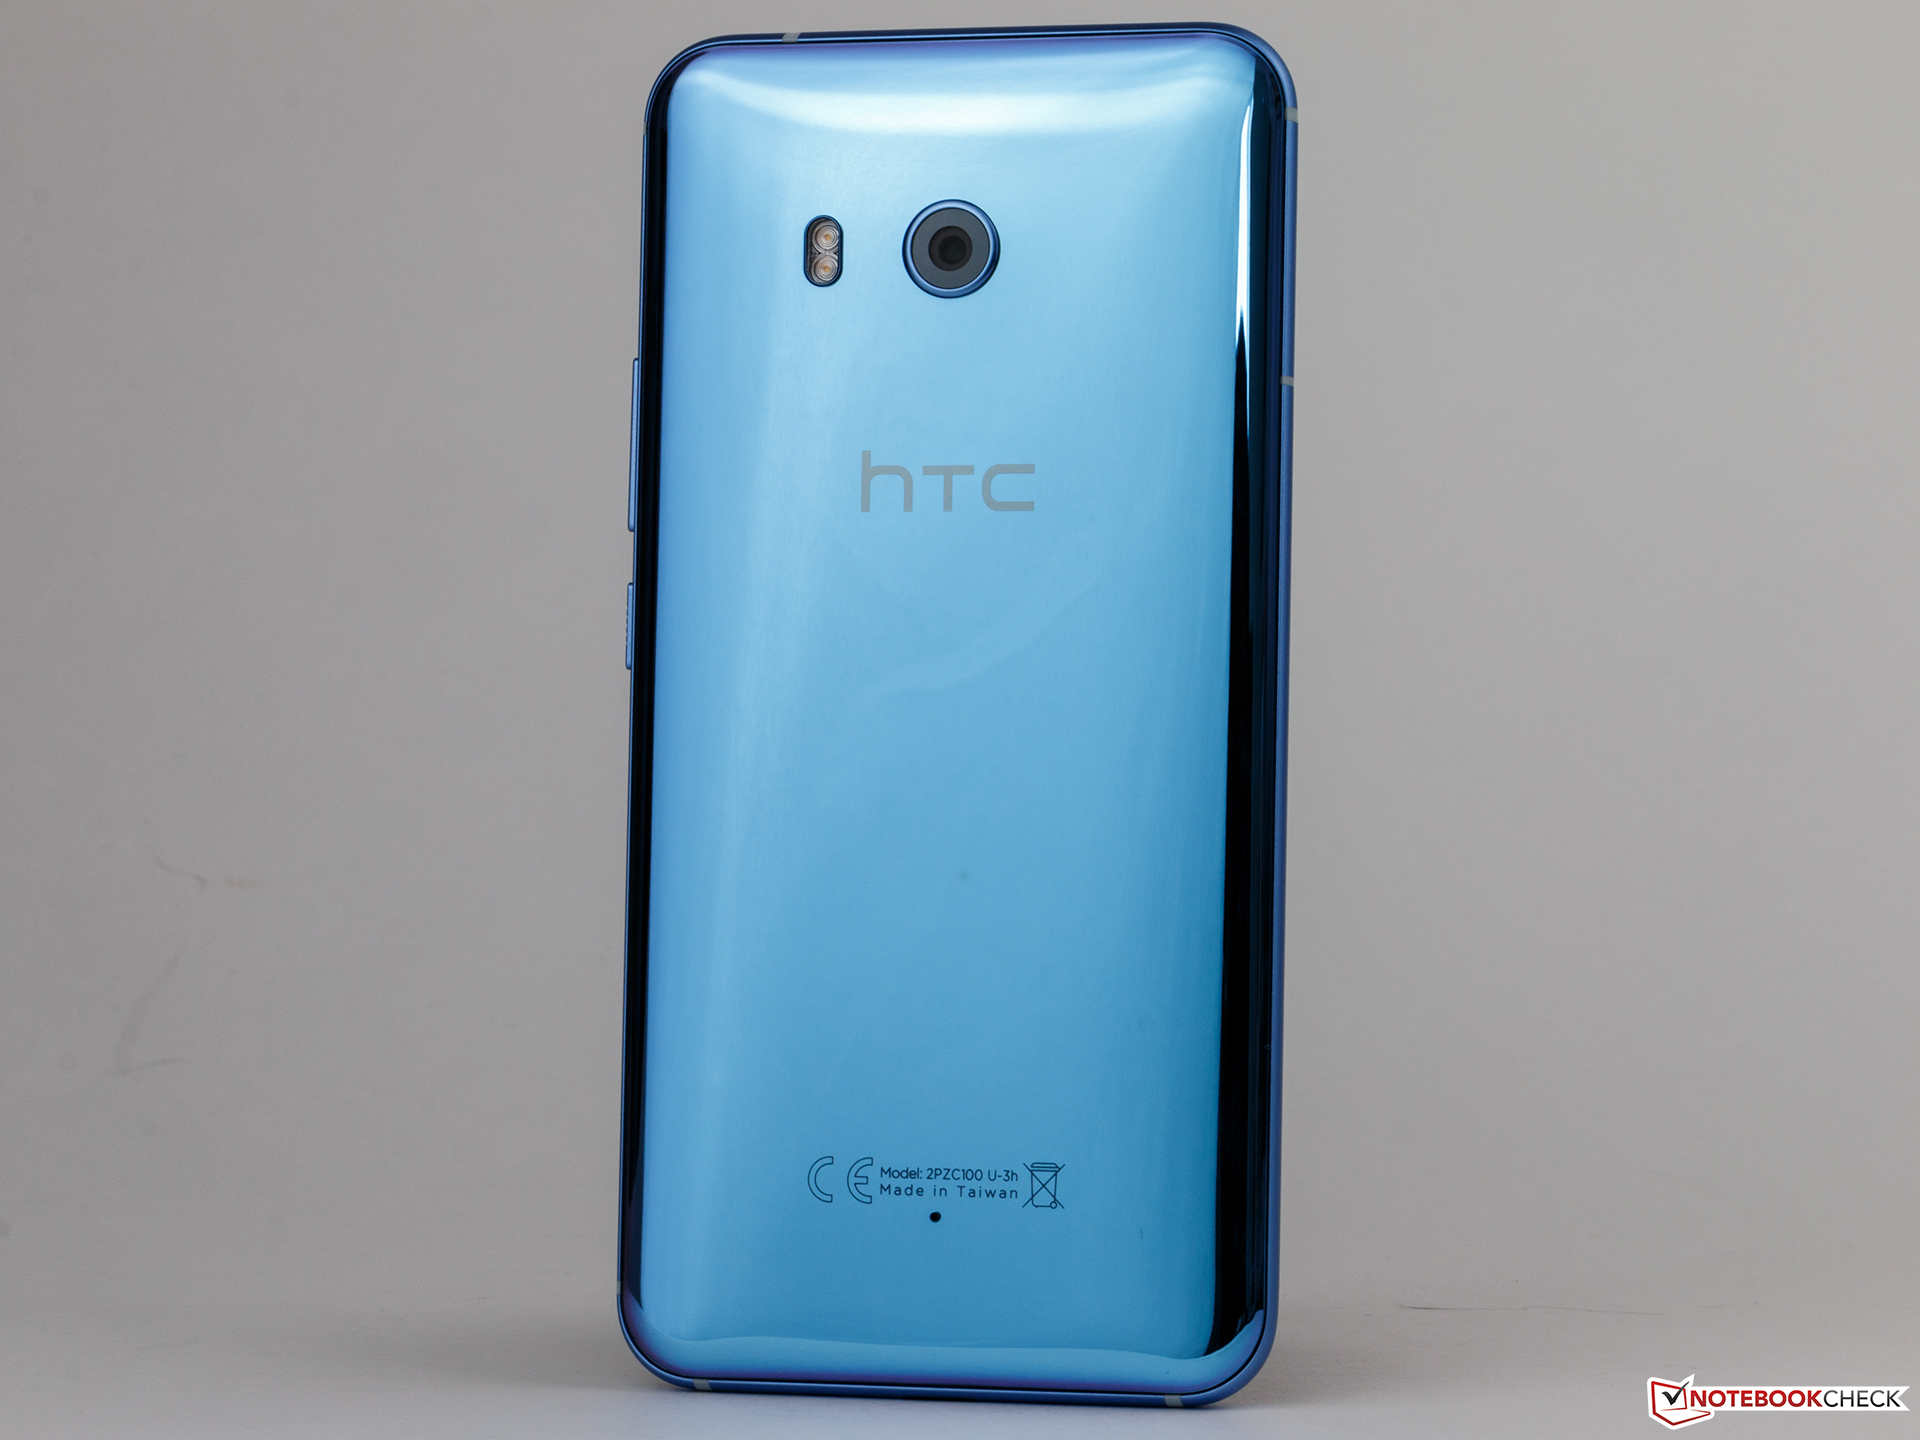
HTC'nin tasarımla çok oynamamasına karşın U11, HTC 10 modelinden farklı gözüküyor. Kullanılan farklı materyal ve renklerin de bunda etkisi var. Teknik özellikler yönünden ise cihaz üst segmentte. Üst sınıf işlemci ve yeterli depolama alanı sunuluyor.
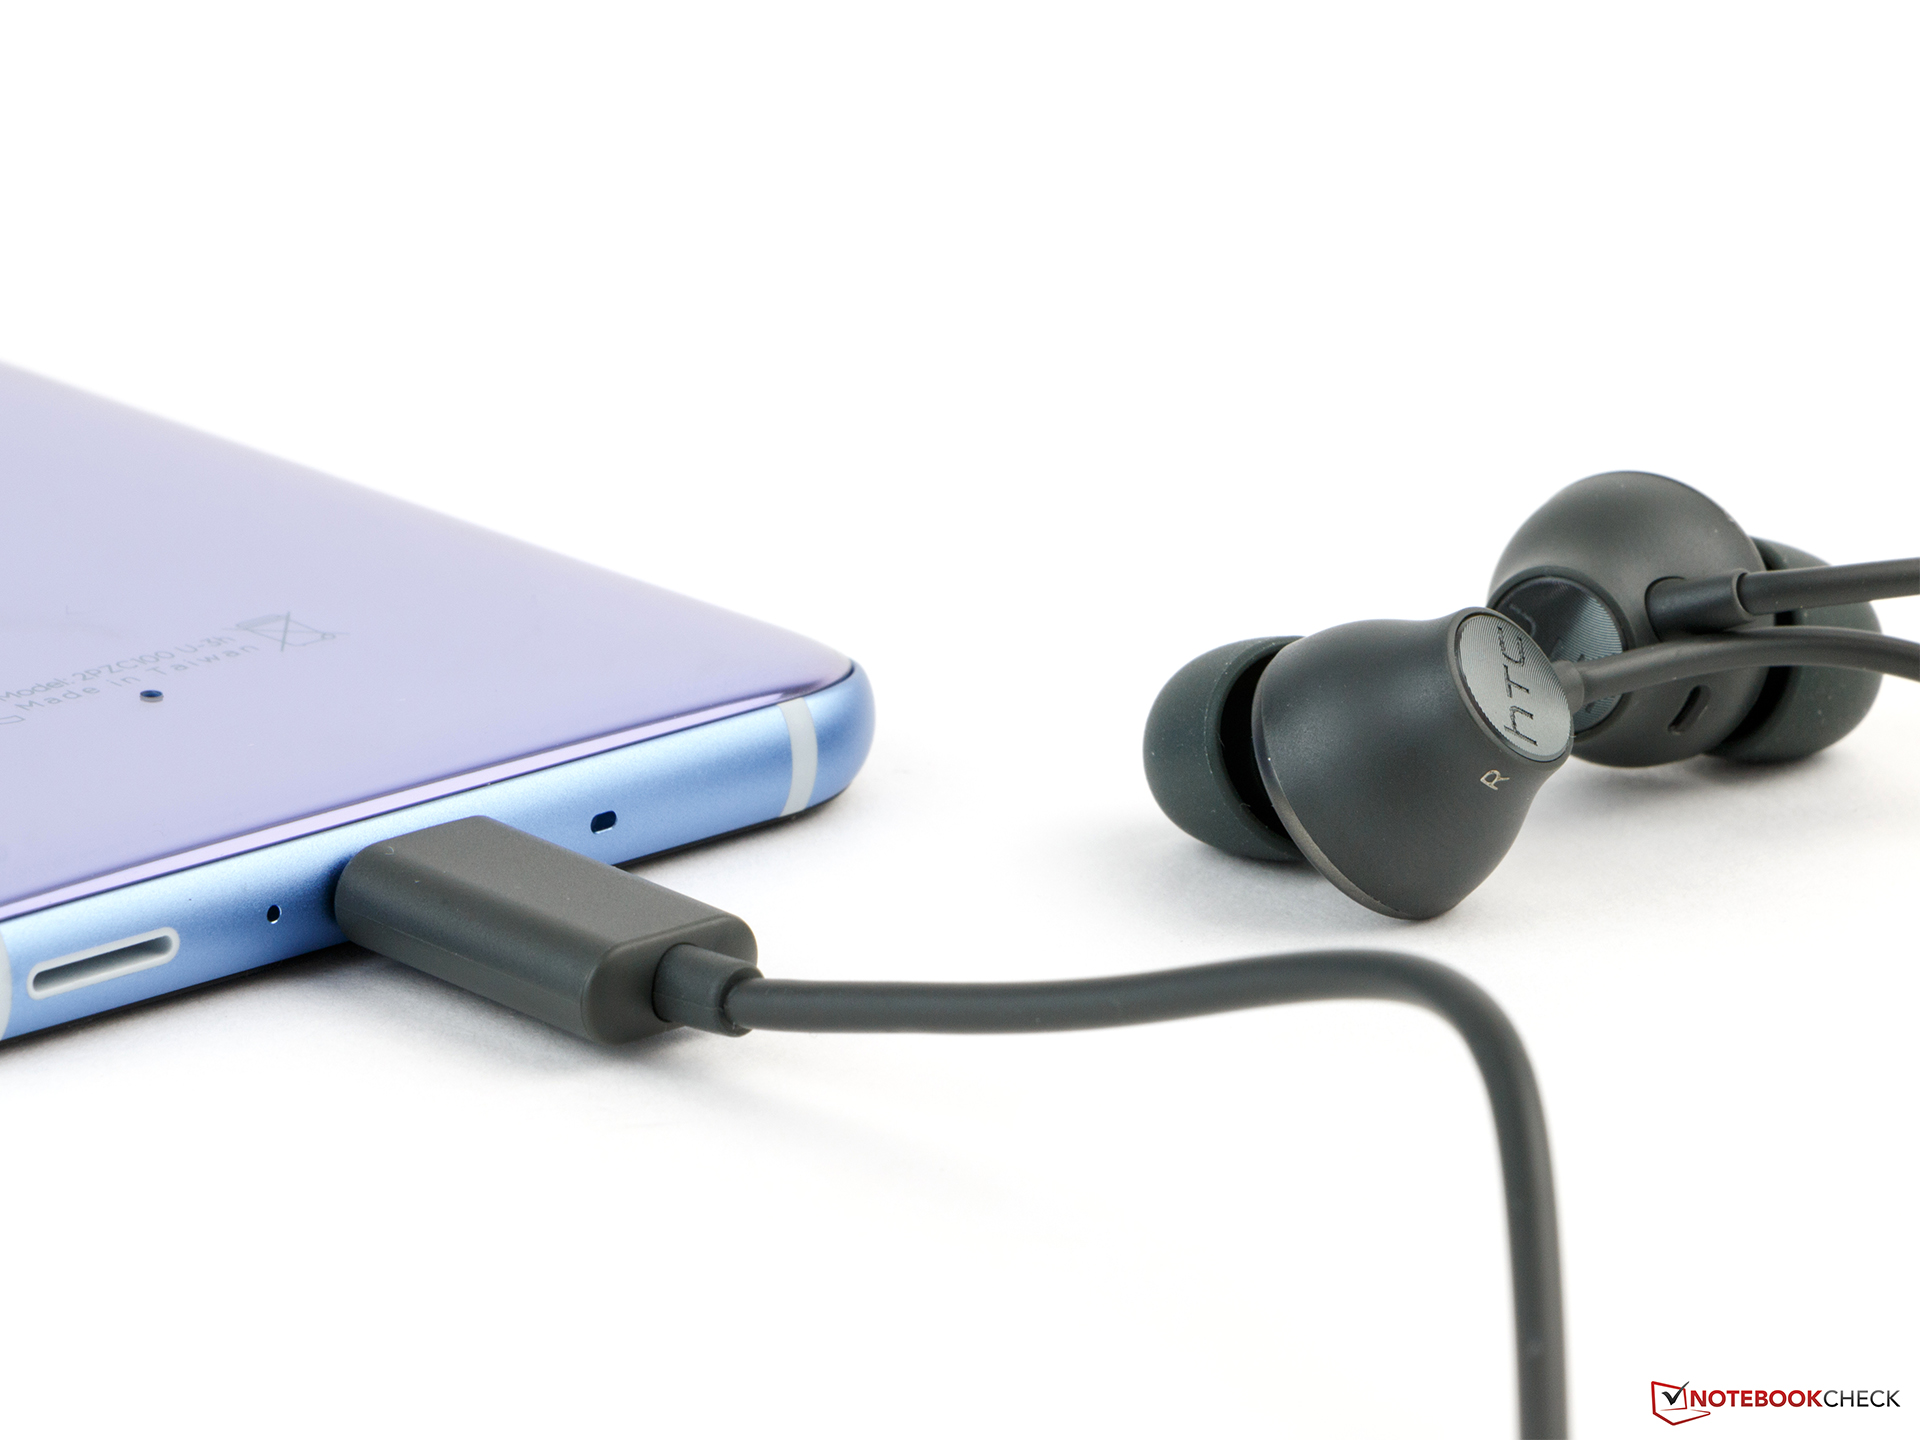
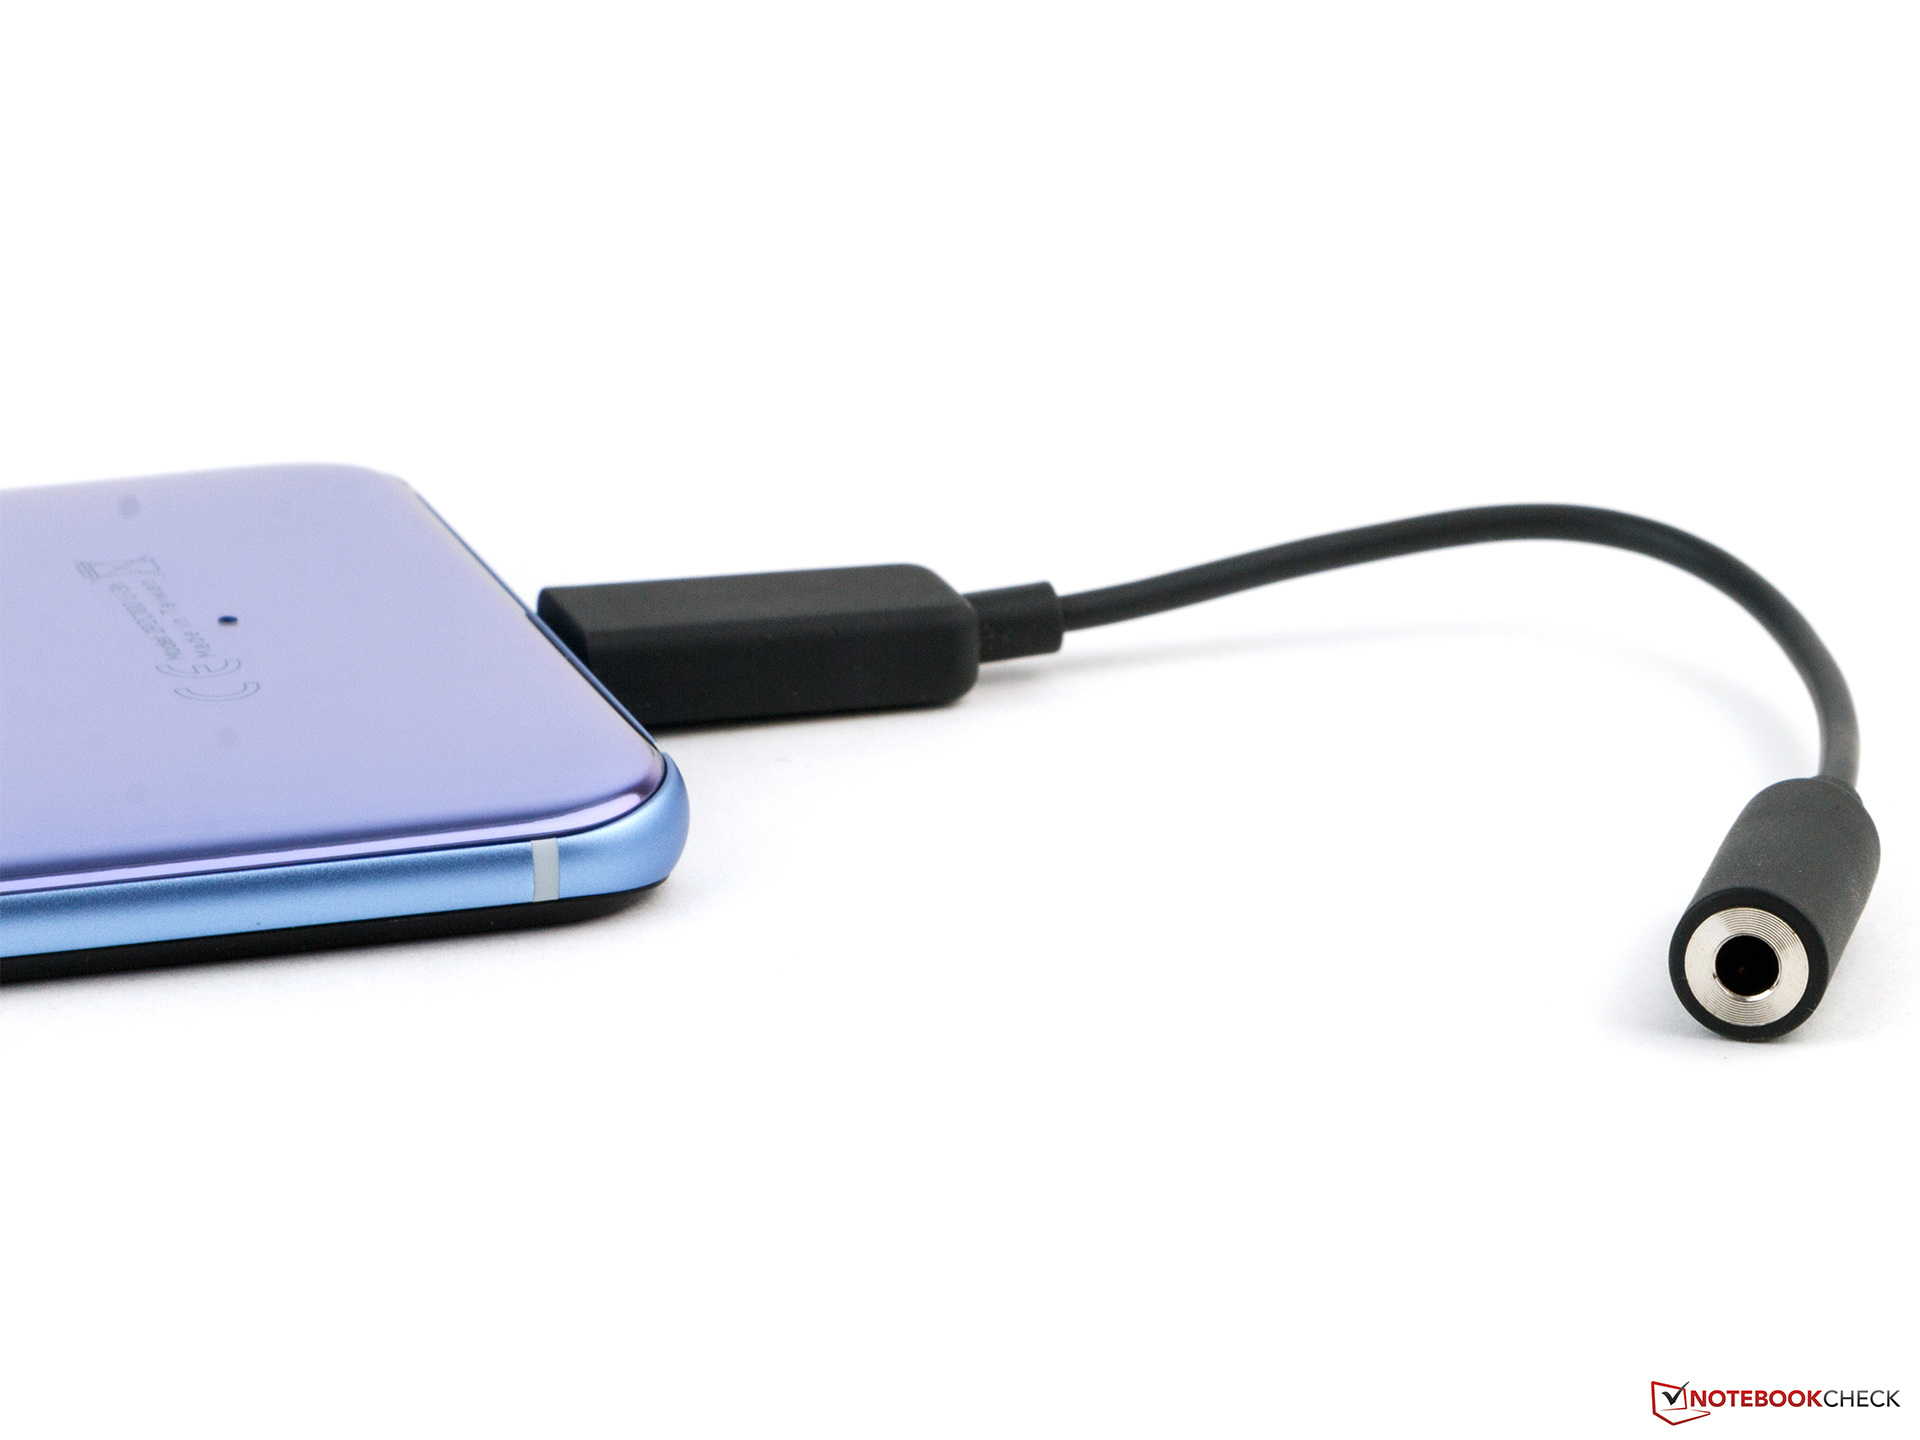
Ses her daim HTC'nin güçlü alanlarından biri olsa da U11 bu alandaki en iyisi artık değil Elbette ses teknolojisi yine mevcut, ancak USB tabanlı bir ses arayüzüne neden geçildiğini anlamak zor. Halbuki pakette gelen kulaklık oldukça iyi. Bluetooth kulaklık kullanmak isteyenler ise hayal kırıklığına uğrayabilir, zira aptX desteklenmiyor.
HTC U11 alışılmadık renkleri ile etkiliyor. Harika bir kamera, sistem performansı ise diğer sundukları arasında. Batarya ömrü ise, aradıklarımız arasında.
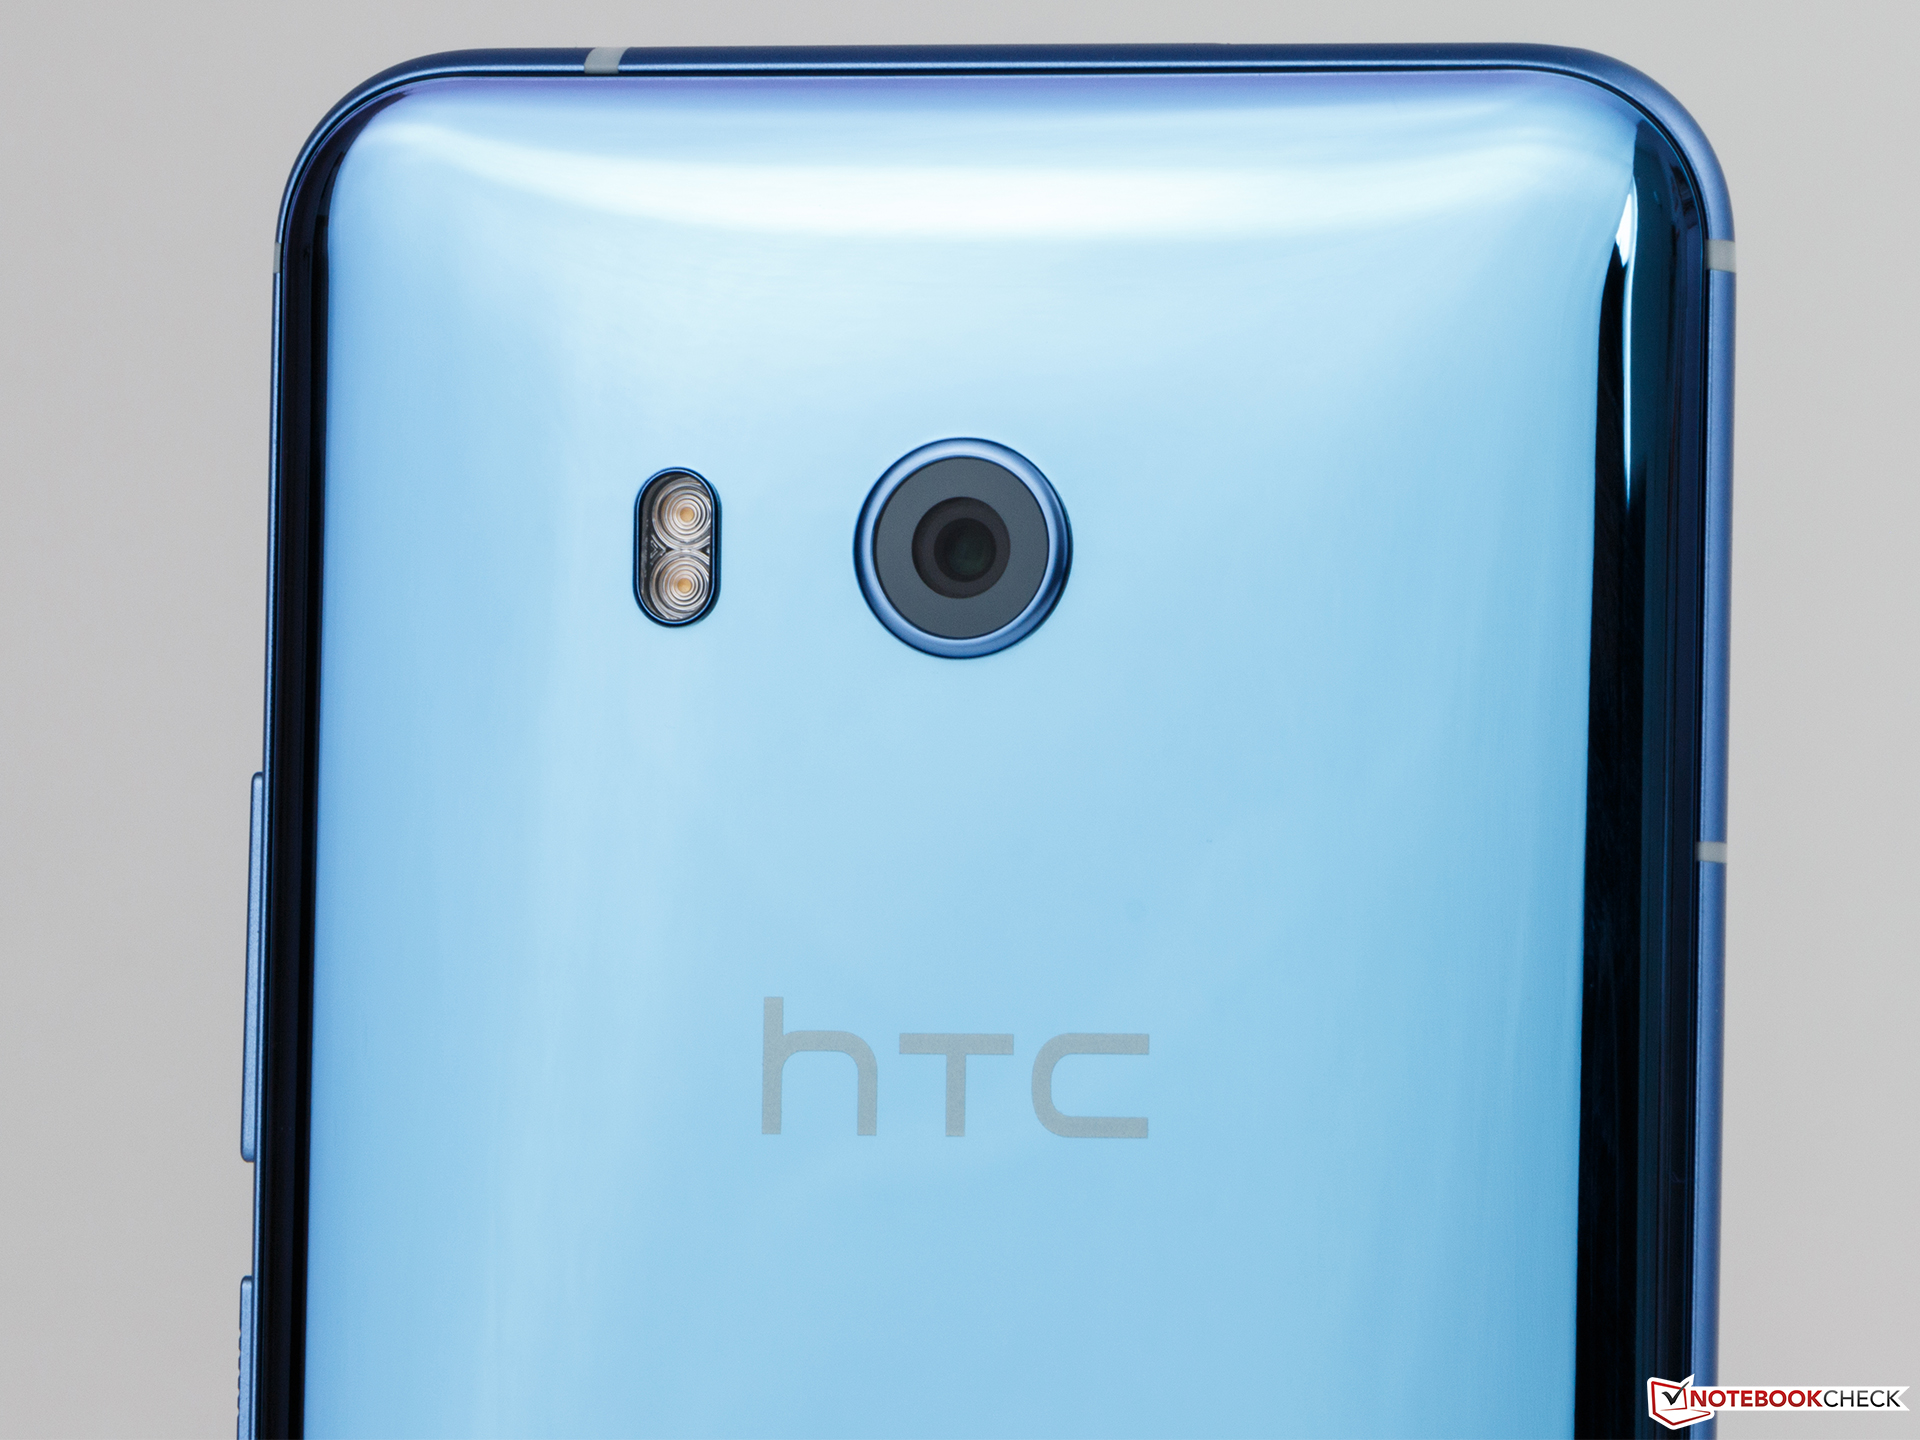
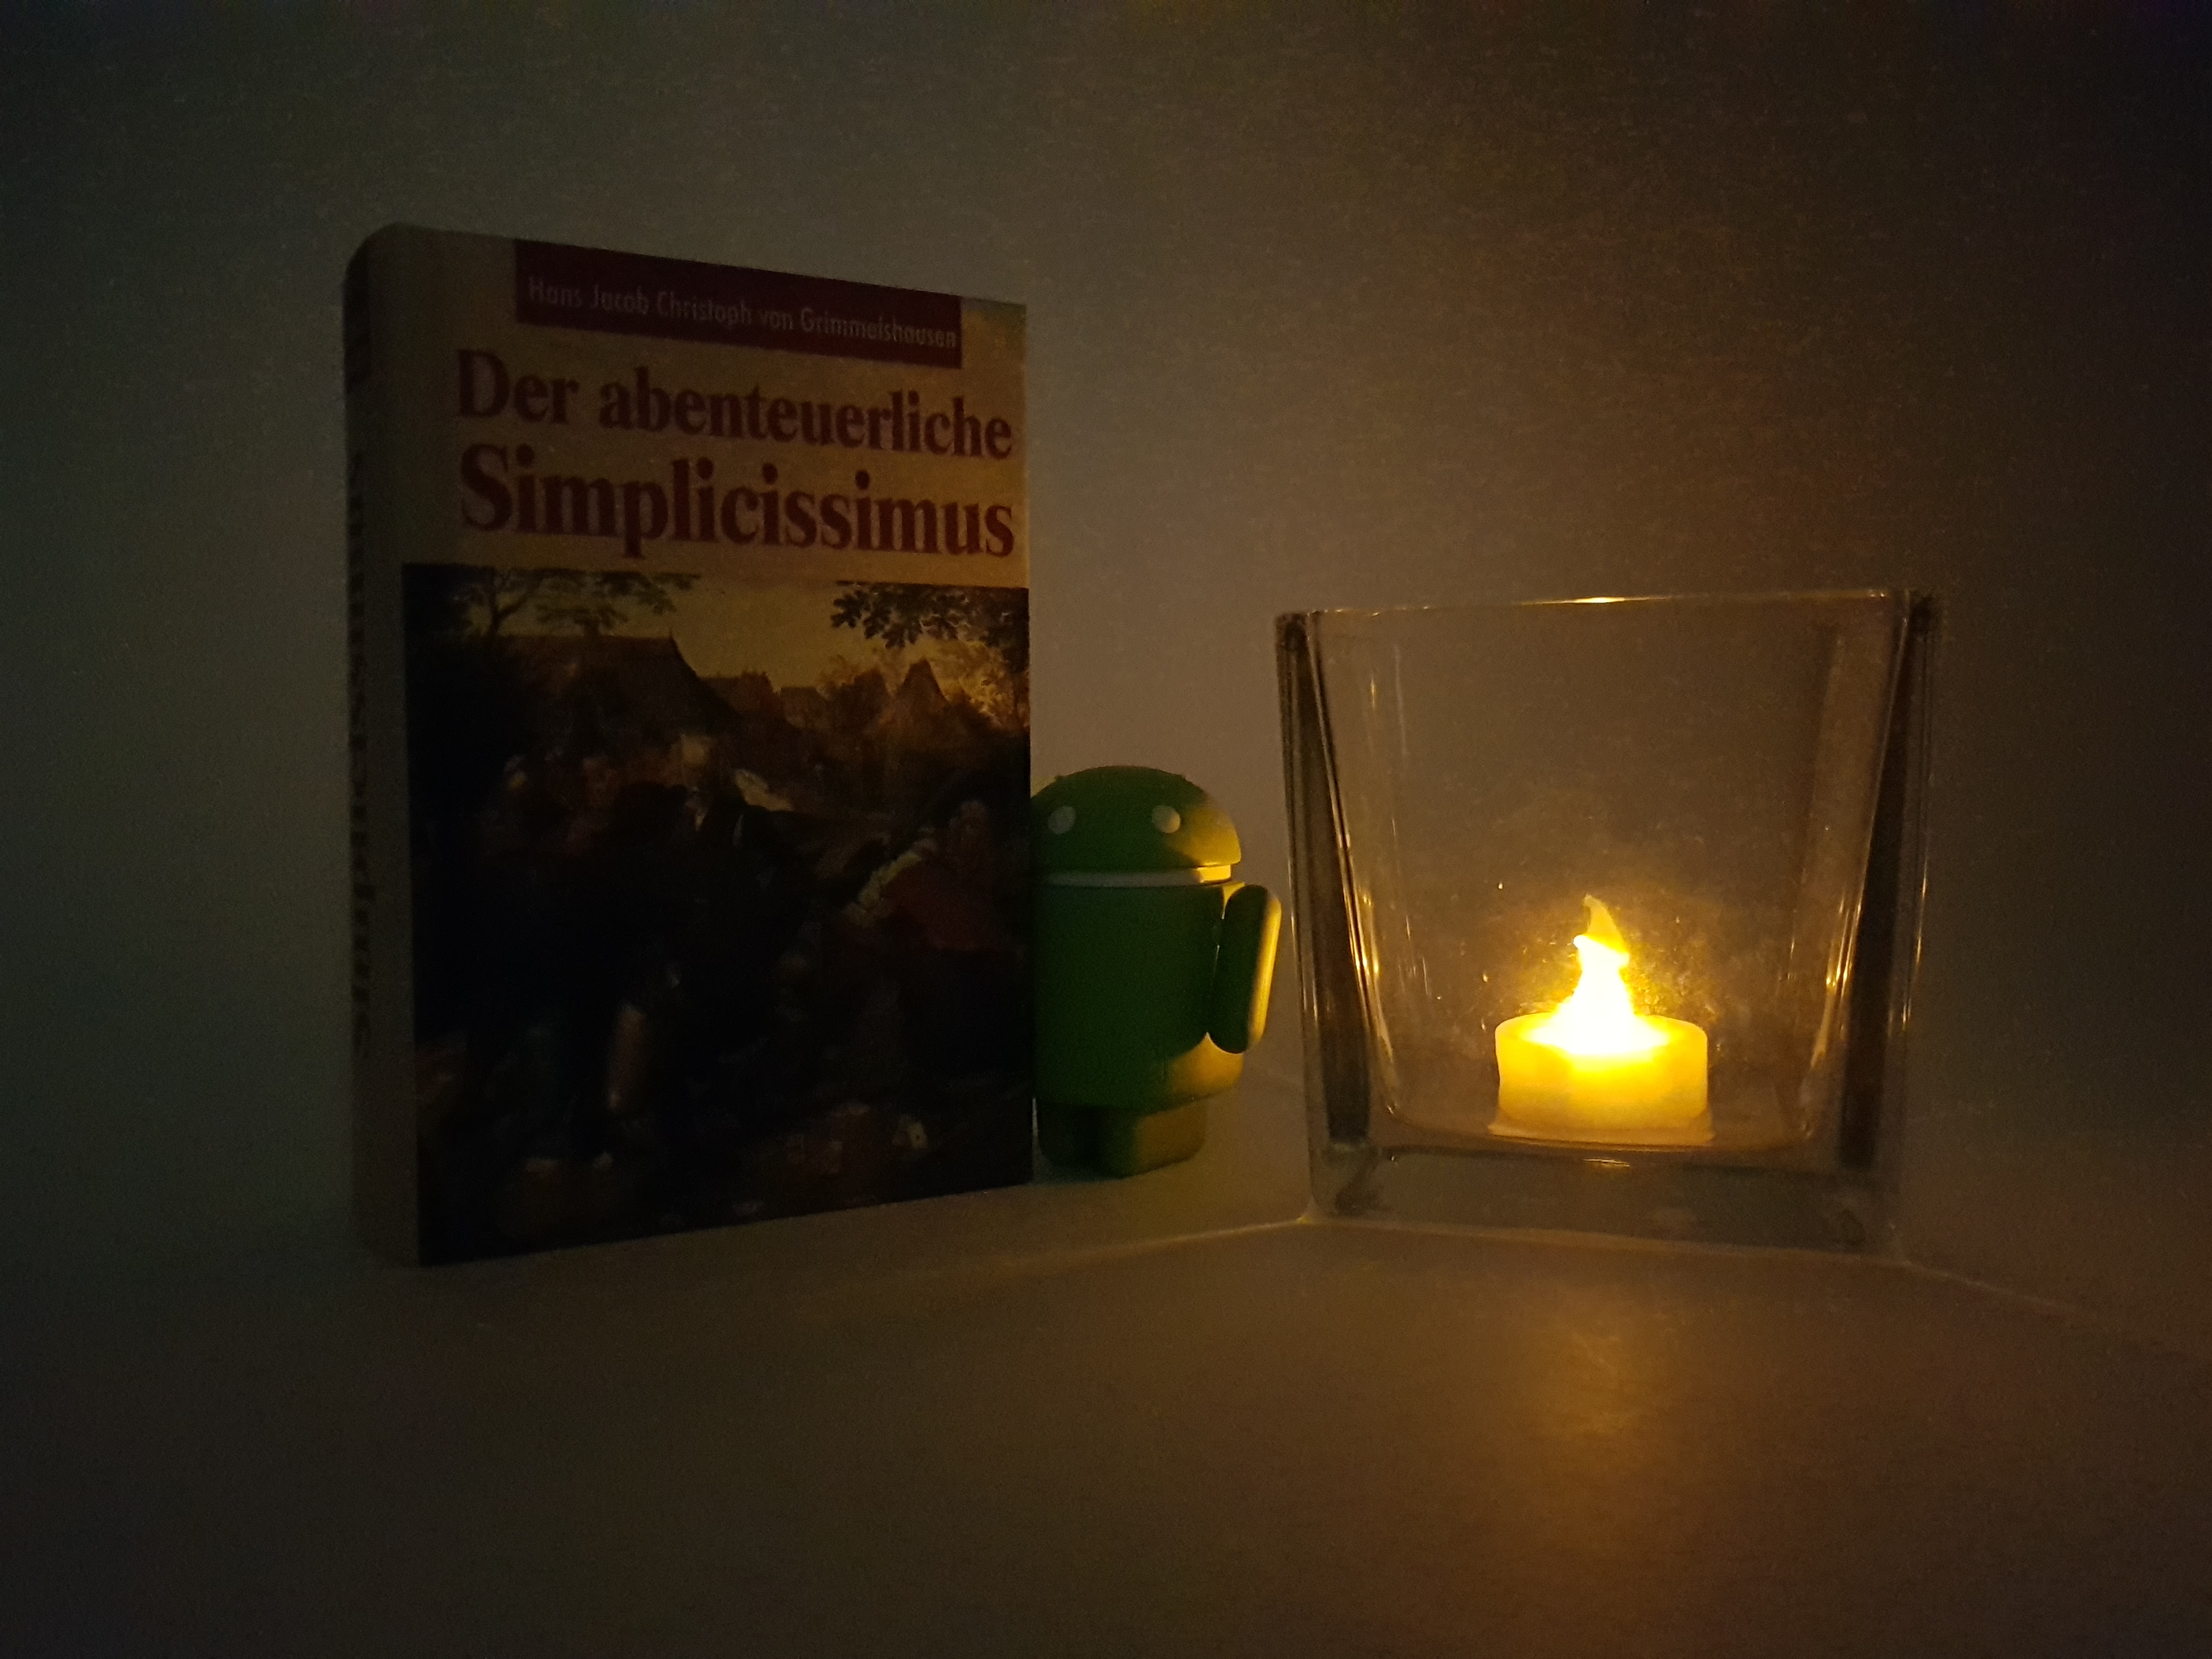
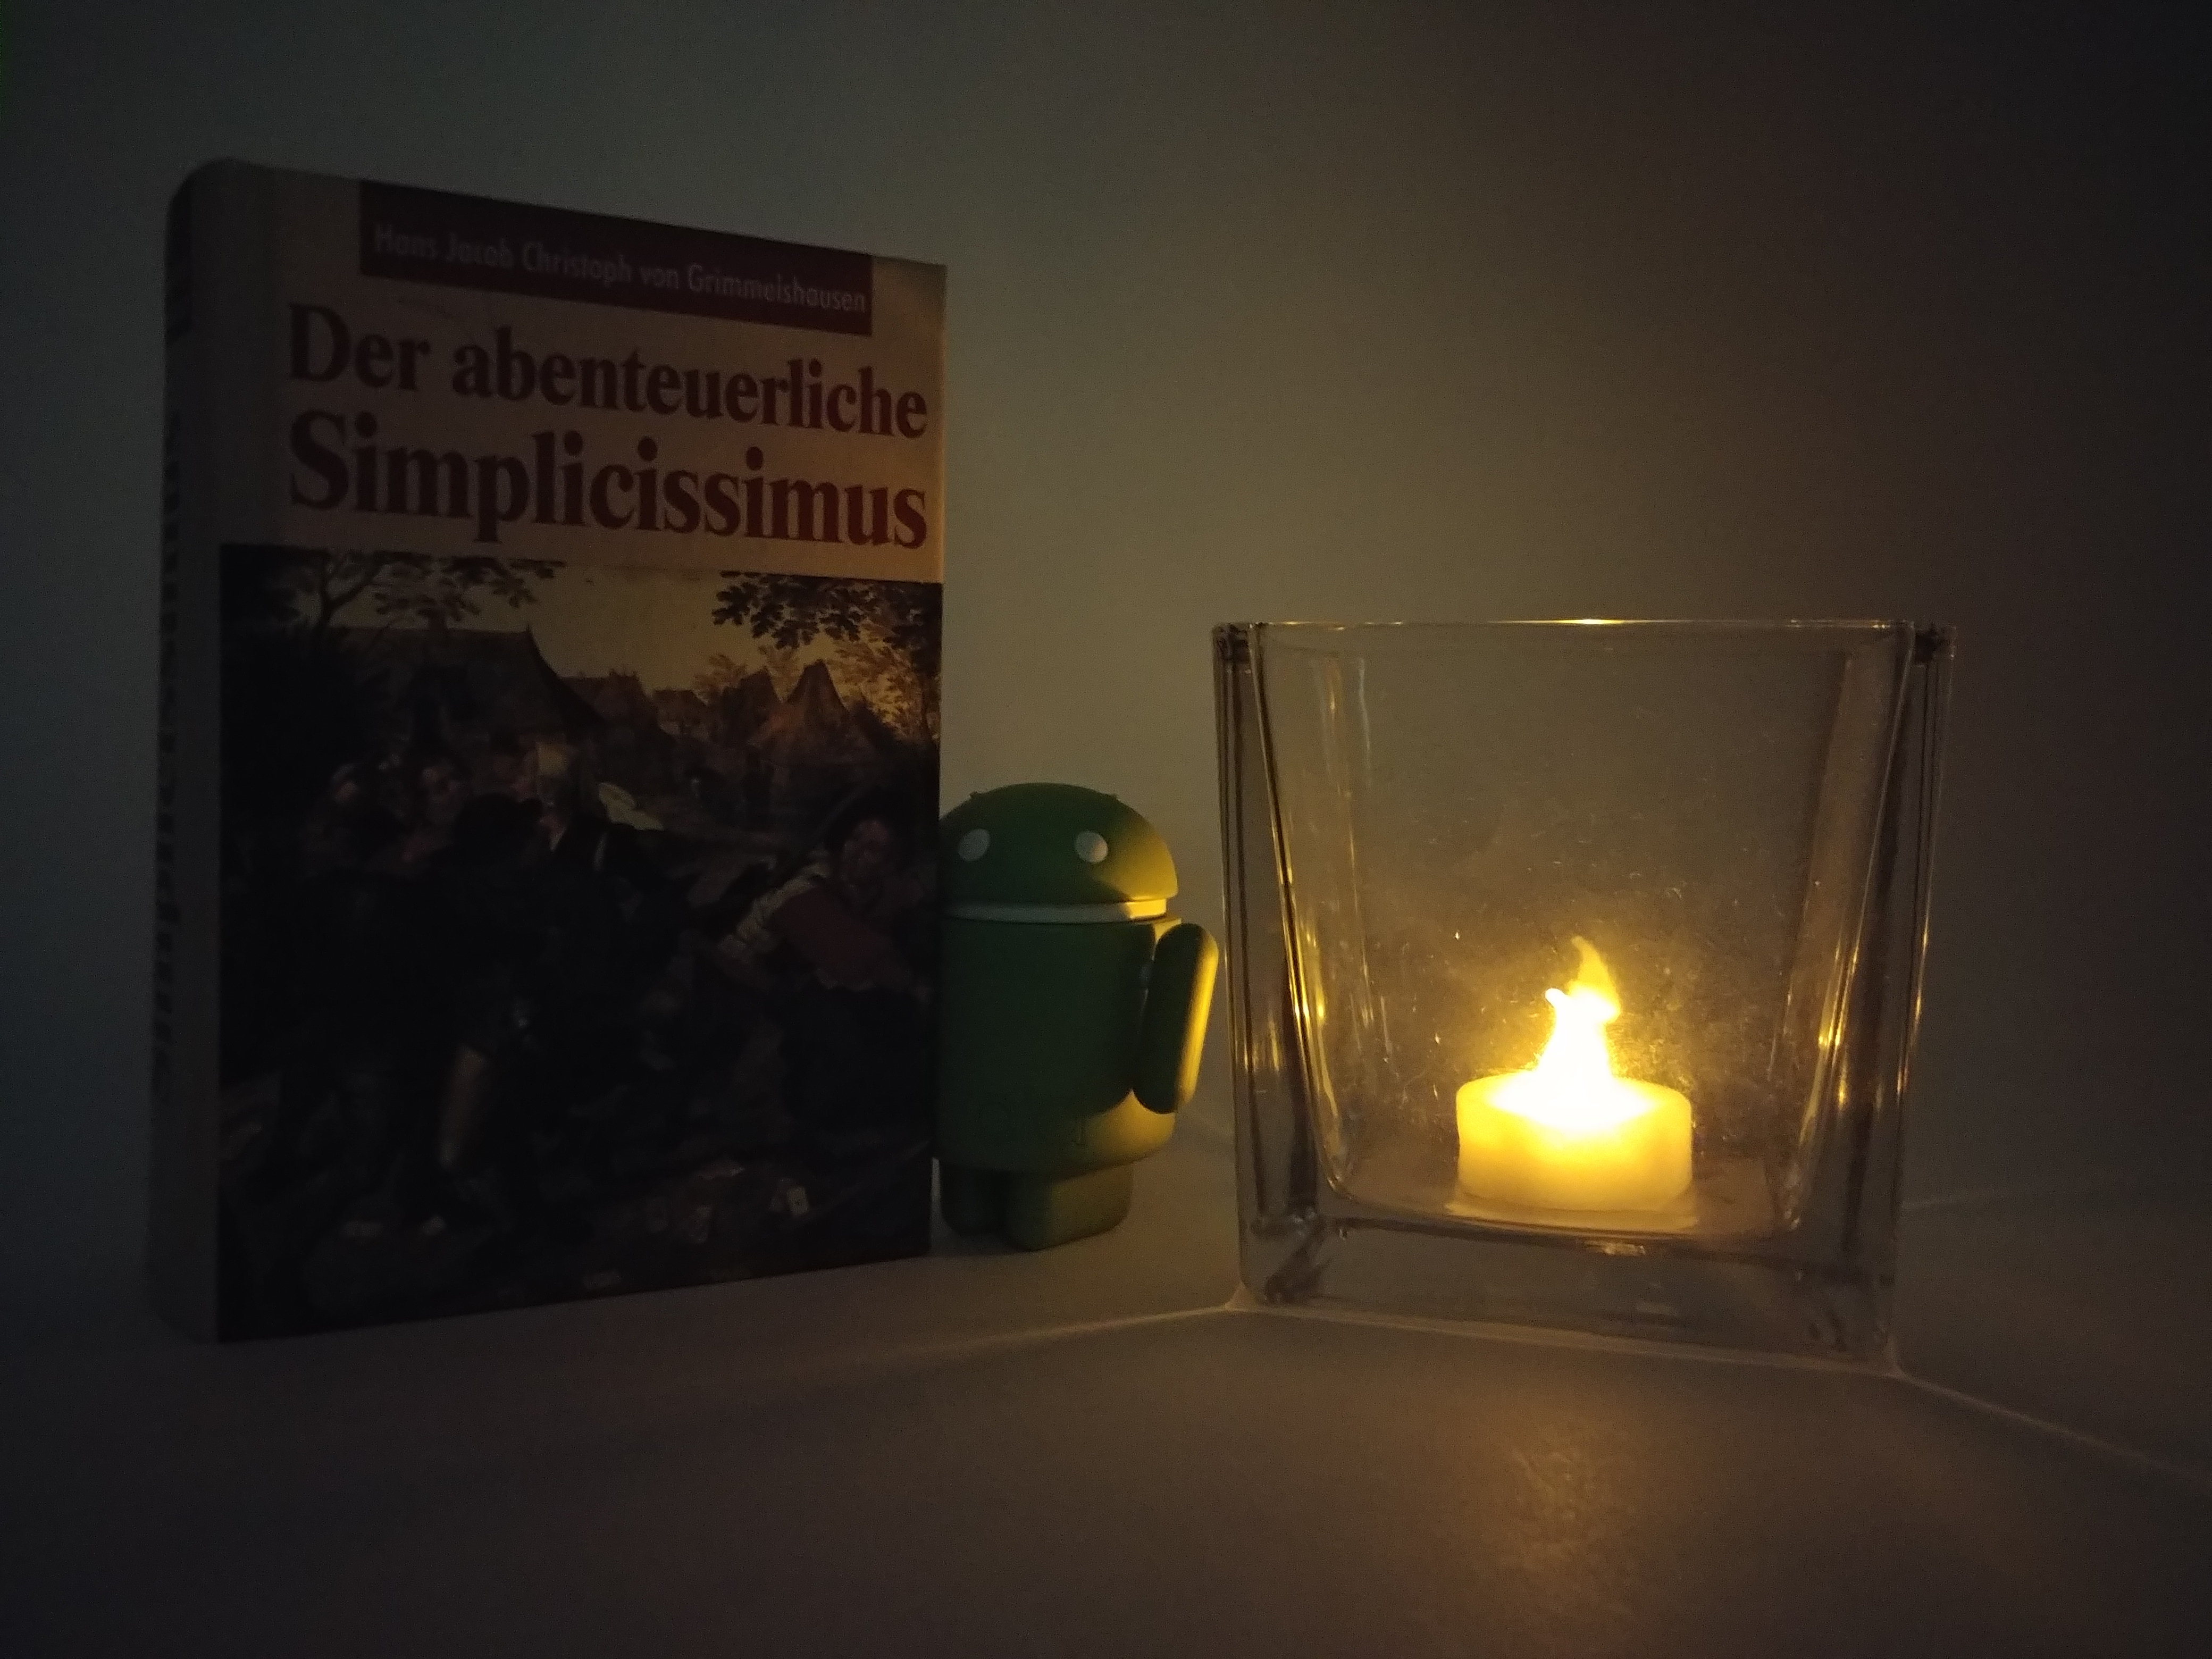
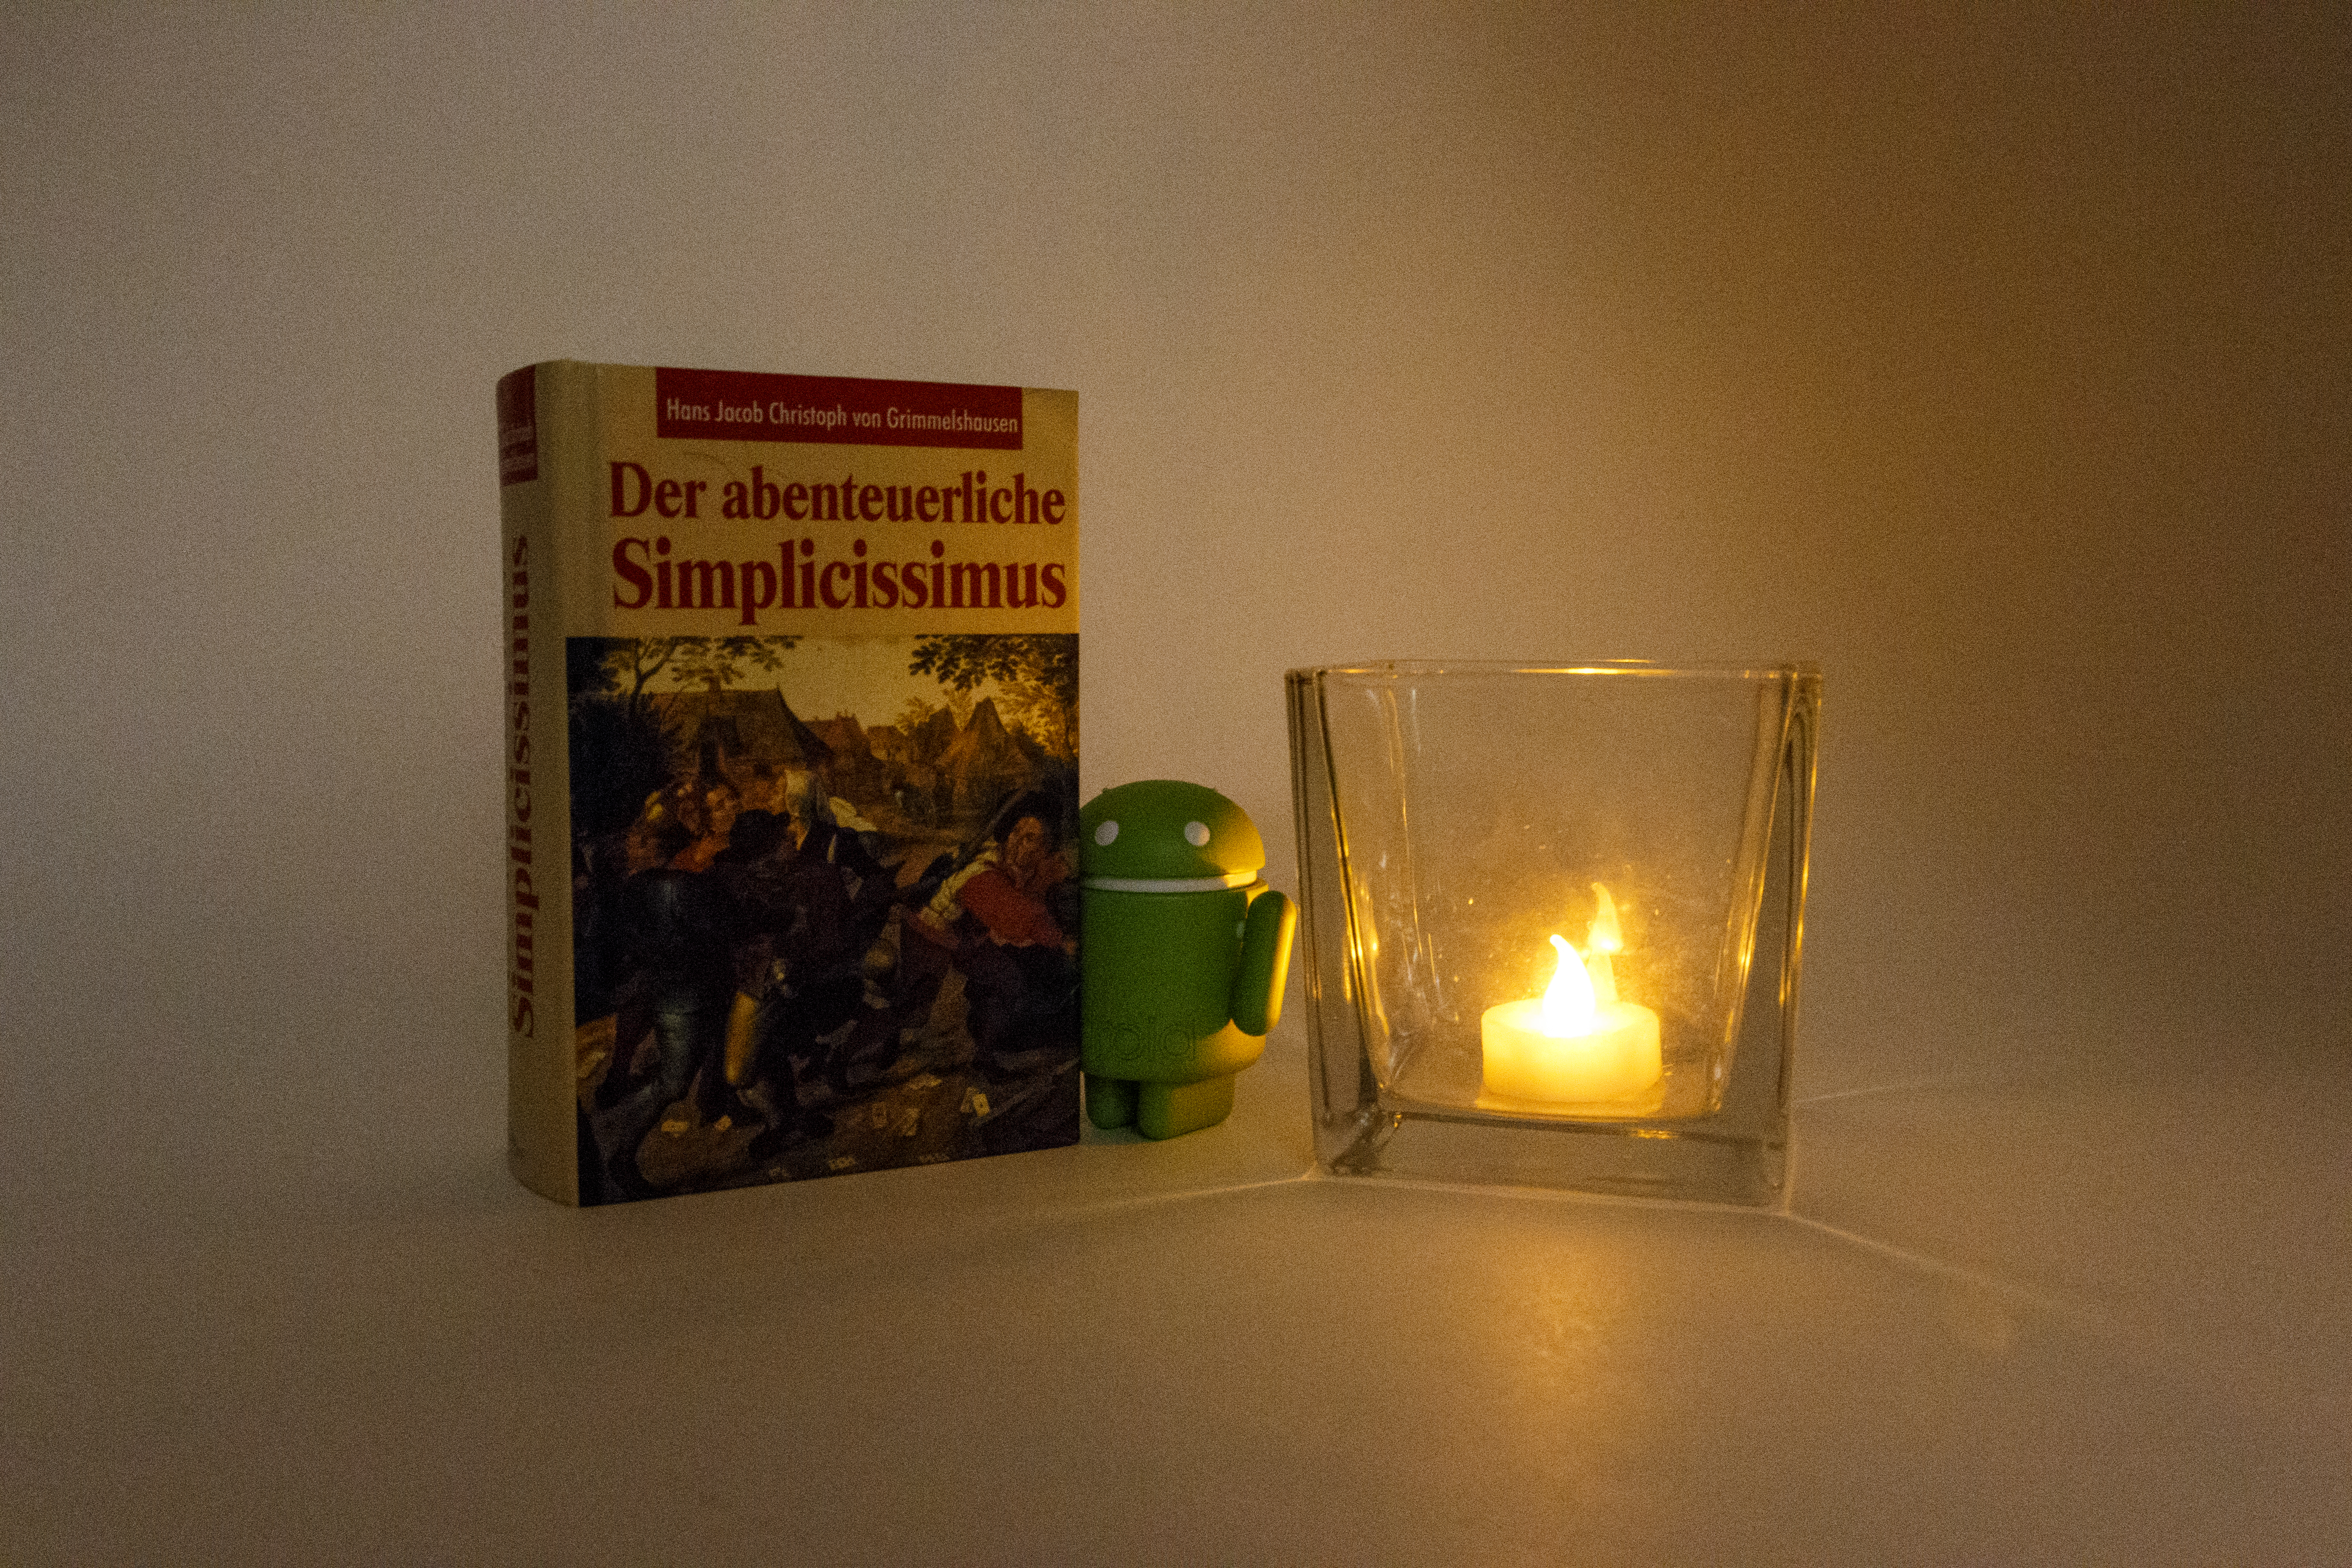
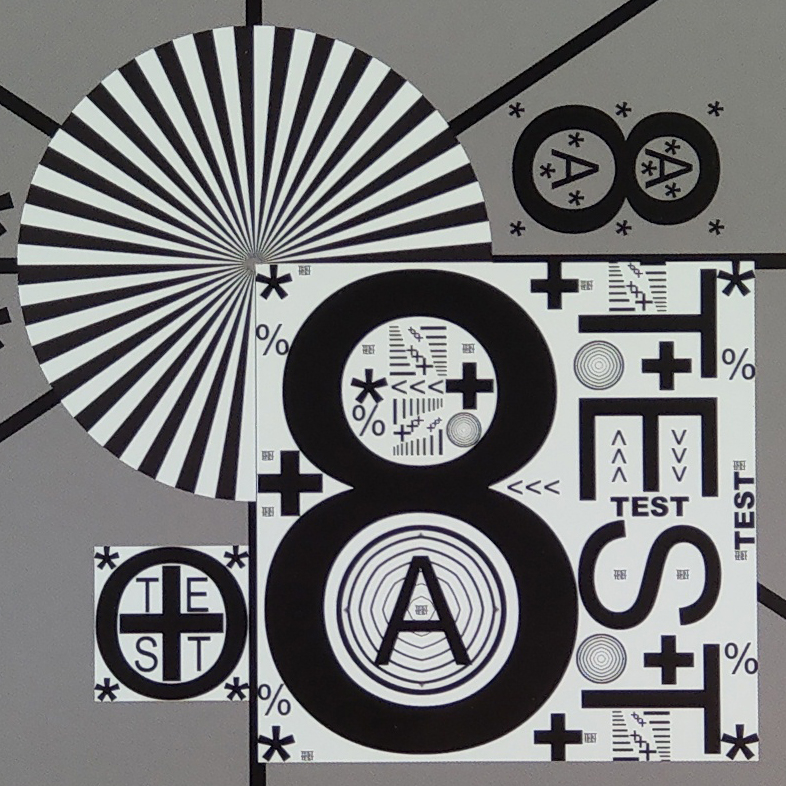
HTC U11, harika fotoğraflar çekiyor ve sınıfının lideri Galaxy S8'den düşük ışık performansında daha iyi. Yine de birincilik için yeterli değil.
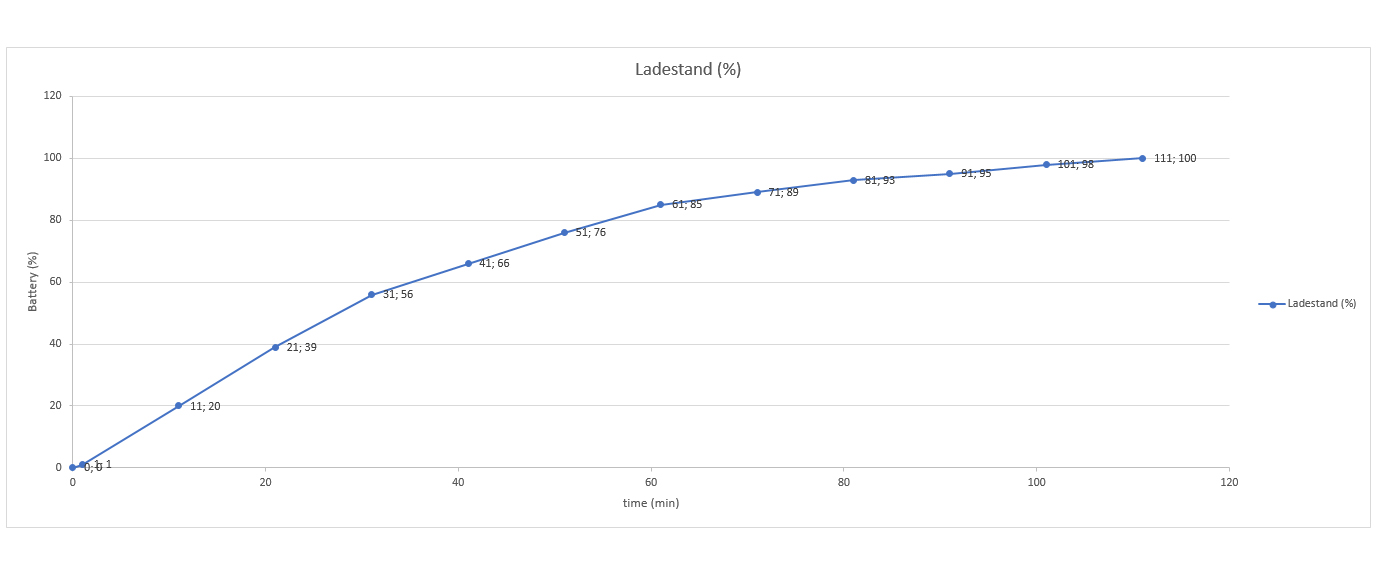
U11 rakiplerine kıyasla büyük olmasına karşın sadece 3000 mAh batarya kullanılmış. Daha geniş bir tercih elbette daha iyi olurdu, çünkü kullanım süreleri rakiplerine göre çok iyi değil. Yine de HTC U11 olağanüstü bir cihaz.
Yazının orjinali için tıklayın.
HTC U11
- 07/22/2017 v6 (old)
Daniel Schmidt
Price comparison