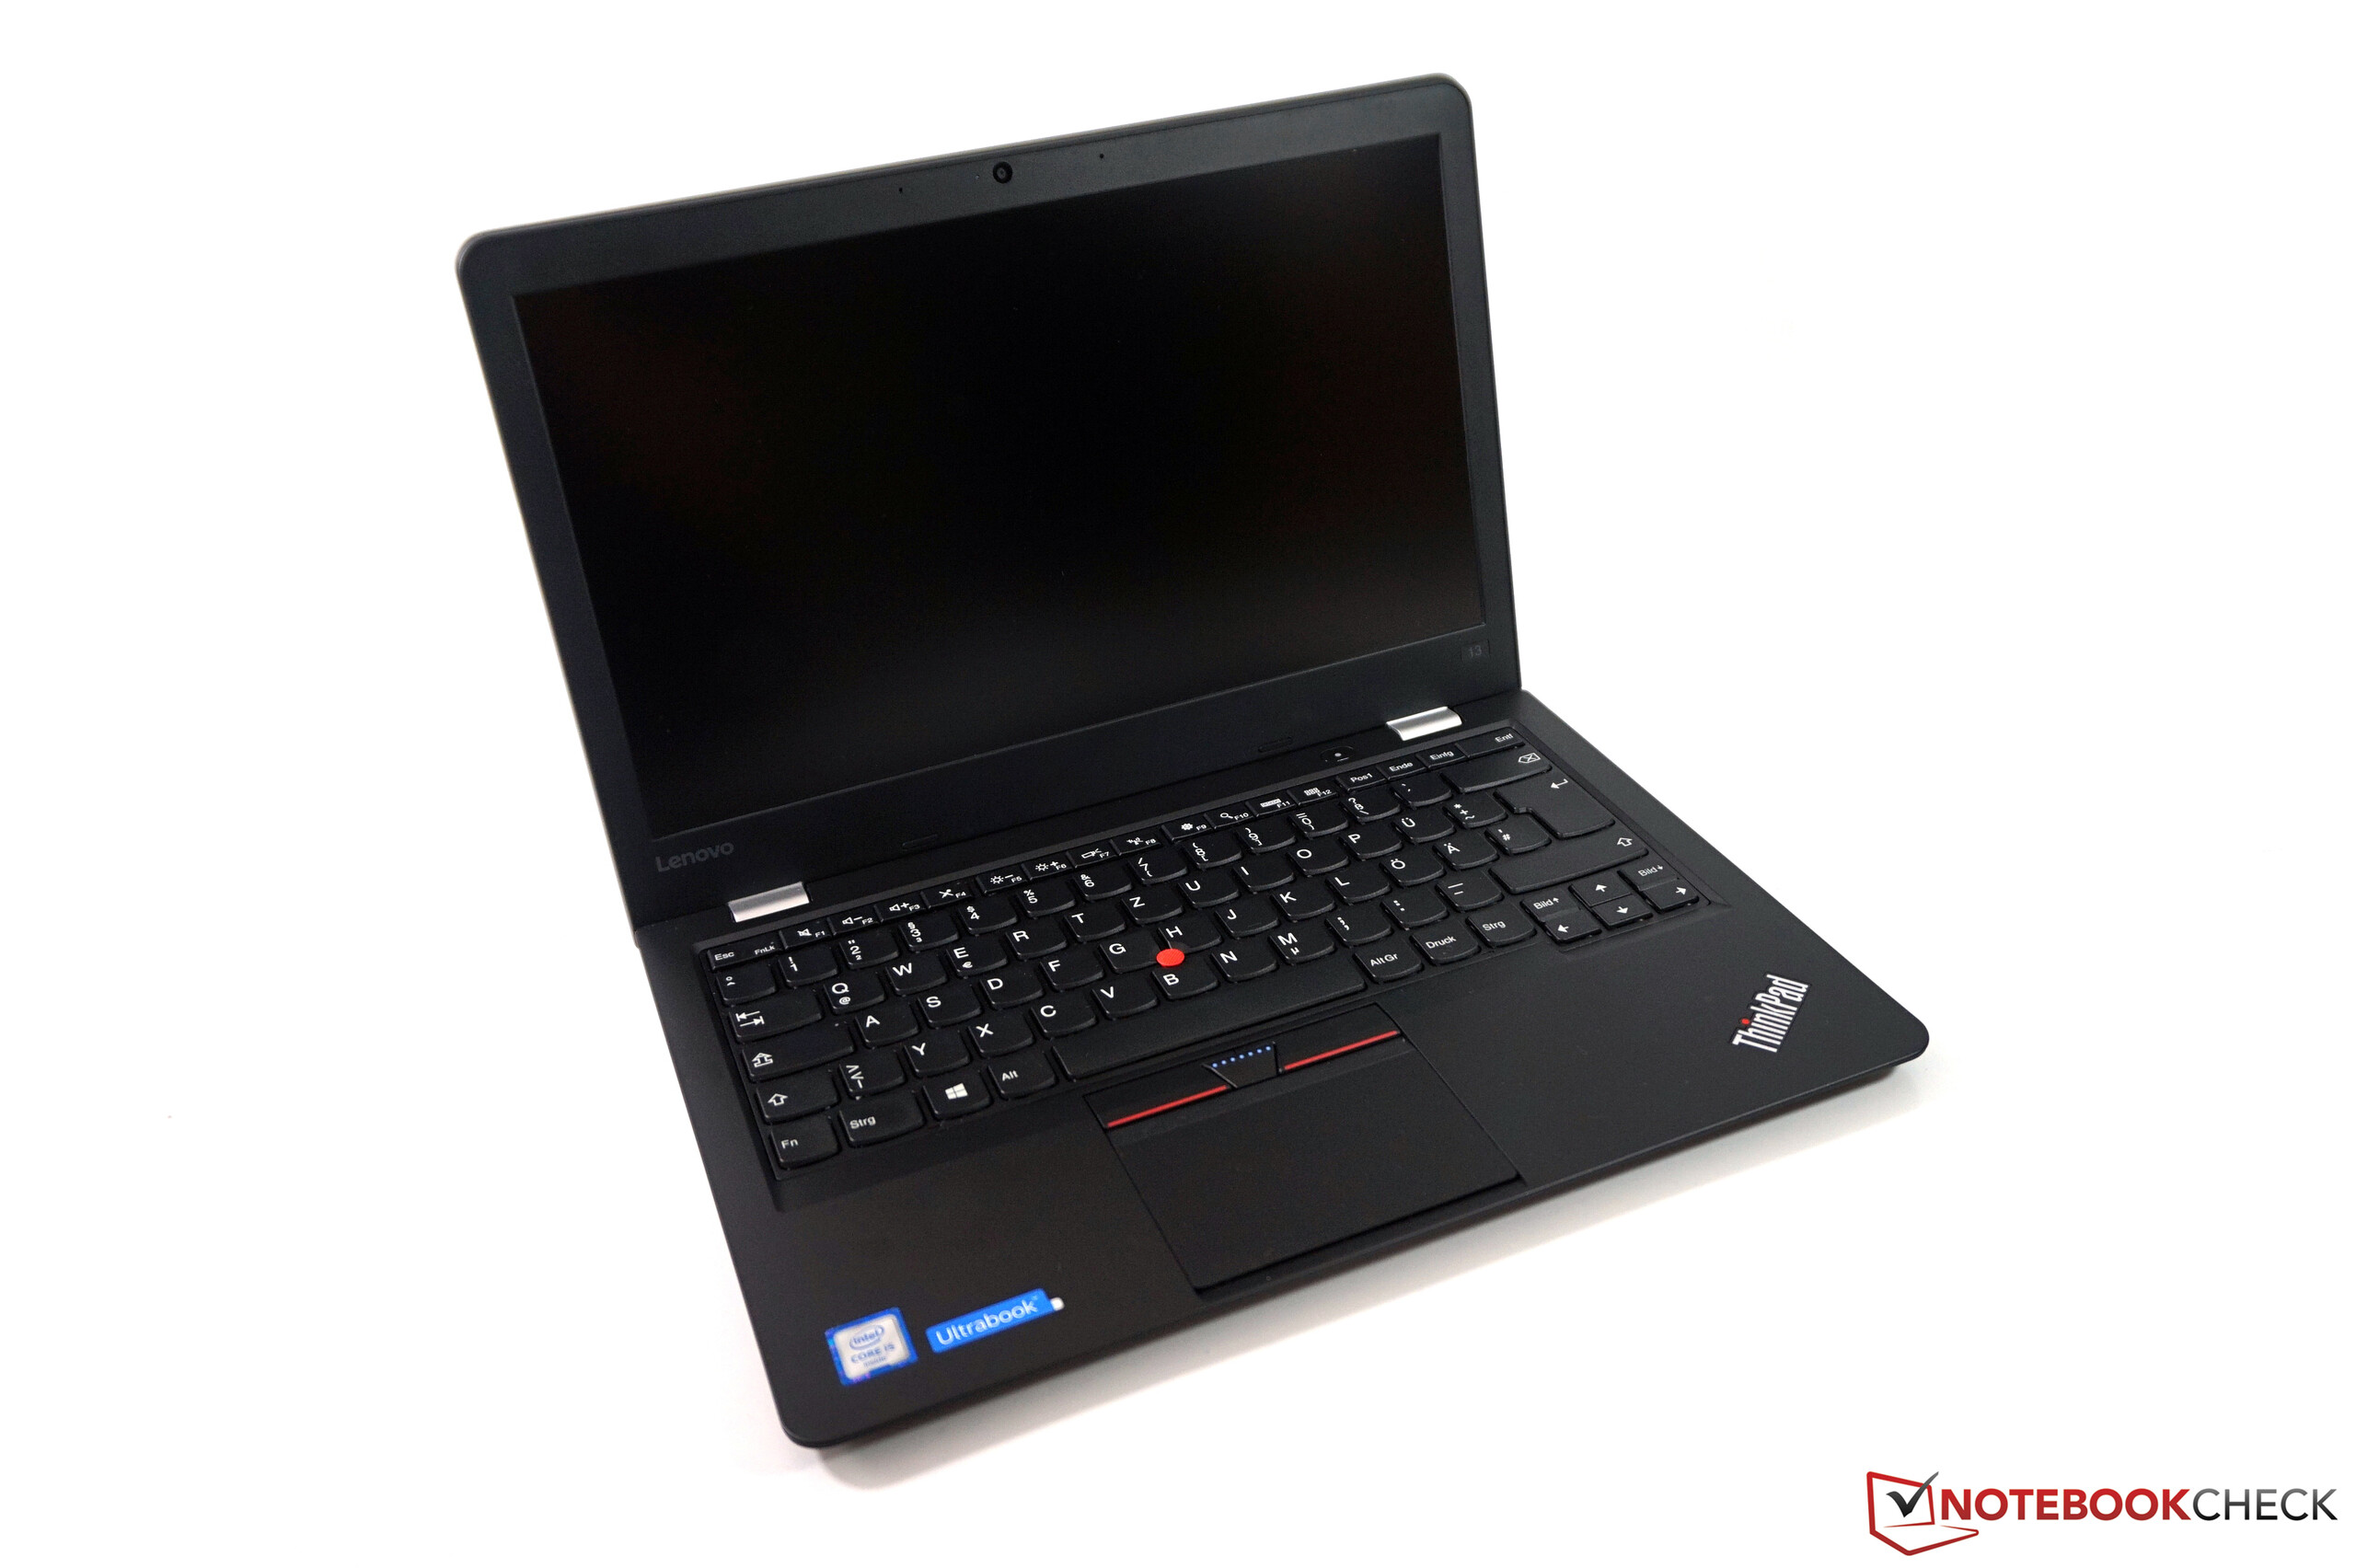
Kısa inceleme: Lenovo ThinkPad 13 Ultrabook
Ekran Titremesi / PWM (Darbe Genişliği Modülasyonu)
| Ekran titriyor / PWM algılanmadı | ||
Karşılaştırıldığında: Test edilen tüm cihazların %52 %'si ekranı karartmak için PWM kullanmıyor. PWM tespit edilirse, ortalama 7757 (minimum: 5 - maksimum: 343500) Hz ölçüldü. | ||
| |||||||||||||||||||||||||
Aydınlatma: 86 %
Batarya modunda parlaklık: 233 cd/m²
Kontrast: 1059:1 (Siyah: 0.22 cd/m²)
ΔE ColorChecker Calman: 5.41 | ∀{0.5-29.43 Ø4.71}
ΔE Greyscale Calman: 4.15 | ∀{0.09-98 Ø4.96}
57.16% sRGB (Argyll 1.6.3 3D)
36.52% AdobeRGB 1998 (Argyll 1.6.3 3D)
39.66% AdobeRGB 1998 (Argyll 3D)
57.4% sRGB (Argyll 3D)
38.35% Display P3 (Argyll 3D)
Gamma: 2.45
CCT: 6773 K
| Lenovo ThinkPad 13-20GKS01100 1920x1080, LP133WF2-SPL1 | Lenovo ThinkPad T460-20FN003LGE IPS, 1920x1080, Lenovo LEN40A9 / N140HCE-EAA | Acer TravelMate P238-M-5575 TN LED, 1366x768, AU Optronics B133XTN01.6 | Asus Zenbook UX303UA-FN121T TN LED, 1366x768, BOE HF HB133WX1-402 | Acer Aspire S 13 S5-371-71QZ IPS, 1920x1080, AUO B133HAN04.1 | Dell XPS 13-9350 IPS, 1920x1080, SHP1420 | Lenovo ThinkPad T460s-20F9003SGE IPS, 1920x1080, N140HCE-EAA, LEN40A9 | |
|---|---|---|---|---|---|---|---|
| Display | 9% | -3% | 12% | 16% | 8% | ||
| Display P3 Coverage (%) | 38.35 | 42.09 10% | 37.25 -3% | 43.08 12% | 44.53 16% | 41.65 9% | |
| sRGB Coverage (%) | 57.4 | 62 8% | 56.1 -2% | 64.8 13% | 66.8 16% | 61.6 7% | |
| AdobeRGB 1998 Coverage (%) | 39.66 | 43.6 10% | 38.49 -3% | 44.52 12% | 45.97 16% | 43.14 9% | |
| Response Times | 5% | -1% | 46% | -13% | -3% | ||
| Response Time Grey 50% / Grey 80% * (ms) | 43.2 ? | 42.4 ? 2% | 42 ? 3% | 23 ? 47% | 50 ? -16% | 42 ? 3% | |
| Response Time Black / White * (ms) | 26.8 ? | 24.8 ? 7% | 28 ? -4% | 15 ? 44% | 29.6 ? -10% | 29.2 ? -9% | |
| PWM Frequency (Hz) | 192 ? | ||||||
| Screen | -16% | -64% | -4% | 20% | 14% | -8% | |
| Brightness middle (cd/m²) | 233 | 230 -1% | 226 -3% | 203 -13% | 375 61% | 277.5 19% | 226 -3% |
| Brightness (cd/m²) | 227 | 216 -5% | 216 -5% | 193 -15% | 358 58% | 276 22% | 211 -7% |
| Brightness Distribution (%) | 86 | 85 -1% | 91 6% | 84 -2% | 87 1% | 88 2% | 89 3% |
| Black Level * (cd/m²) | 0.22 | 0.26 -18% | 0.49 -123% | 0.49 -123% | 0.39 -77% | 0.191 13% | 0.22 -0% |
| Contrast (:1) | 1059 | 885 -16% | 461 -56% | 414 -61% | 962 -9% | 1453 37% | 1027 -3% |
| Colorchecker dE 2000 * | 5.41 | 7.32 -35% | 13.15 -143% | 3.2 41% | 4.6 15% | 4.88 10% | 6.44 -19% |
| Colorchecker dE 2000 max. * | 13.61 | 18.14 -33% | 21.96 -61% | 4.13 70% | 8.8 35% | 17.18 -26% | |
| Greyscale dE 2000 * | 4.15 | 6.98 -68% | 14.47 -249% | 2.77 33% | 4 4% | 4.26 -3% | 5.87 -41% |
| Gamma | 2.45 90% | 2.5 88% | 2.73 81% | 2.46 89% | 2.34 94% | 2.59 85% | 2.37 93% |
| CCT | 6773 96% | 6683 97% | 19989 33% | 7176 91% | 7304 89% | 6562 99% | 6856 95% |
| Color Space (Percent of AdobeRGB 1998) (%) | 36.52 | 39.97 9% | 36 -1% | 41 12% | 57.9 59% | 41.6 14% | 39.58 8% |
| Color Space (Percent of sRGB) (%) | 57.16 | 61.55 8% | 56 -2% | 65 14% | 88.7 55% | 65.79 15% | 61.15 7% |
| Toplam Ortalama (Program / Ayarlar) | -1% /
-8% | -23% /
-43% | 18% /
6% | 4% /
15% | 15% /
15% | -1% /
-4% |
* ... daha küçük daha iyidir
Yanıt Sürelerini Görüntüle
| ↔ Tepki Süresi Siyahtan Beyaza | ||
|---|---|---|
| 26.8 ms ... yükseliş ↗ ve sonbahar↘ birleşimi | ↗ 9.6 ms yükseliş | |
| ↘ 17.2 ms sonbahar | ||
| Ekran, testlerimizde nispeten yavaş yanıt oranları gösteriyor ve oyuncular için çok yavaş olabilir. Karşılaştırıldığında, test edilen tüm cihazlar 0.1 (minimum) ile 240 (maksimum) ms arasında değişir. » Tüm cihazların 67 %'si daha iyi. Bu, ölçülen yanıt süresinin test edilen tüm cihazların ortalamasından (19.8 ms) daha kötü olduğu anlamına gelir. | ||
| ↔ Tepki Süresi %50 Griden %80 Griye | ||
| 43.2 ms ... yükseliş ↗ ve sonbahar↘ birleşimi | ↗ 19.6 ms yükseliş | |
| ↘ 23.6 ms sonbahar | ||
| Ekran, testlerimizde yavaş yanıt oranları gösteriyor ve oyuncular için yetersiz olacaktır. Karşılaştırıldığında, test edilen tüm cihazlar 0.165 (minimum) ile 636 (maksimum) ms arasında değişir. » Tüm cihazların 72 %'si daha iyi. Bu, ölçülen yanıt süresinin test edilen tüm cihazların ortalamasından (31 ms) daha kötü olduğu anlamına gelir. | ||
| PCMark 8 Home Score Accelerated v2 | 3024 puan | |
| PCMark 8 Creative Score Accelerated v2 | 3651 puan | |
| PCMark 8 Work Score Accelerated v2 | 4041 puan | |
Yardım | ||

| Lenovo ThinkPad 13-20GKS01100 Samsung SSD PM871 MZNLN256HCHP | Lenovo ThinkPad T460-20FN003LGE Toshiba HG6 THNSFJ256GCSU | Acer TravelMate P238-M-5575 Samsung SSD PM871 MZNLN256HCHP | Acer Aspire S 13 S5-371-71QZ LiteOn CV1-8B512 | Dell XPS 13-9350 Samsung PM951 NVMe MZ-VLV256D | Lenovo ThinkPad T460s-20F9003SGE Samsung CM871 MZ7LF192HCGS | |
|---|---|---|---|---|---|---|
| CrystalDiskMark 3.0 | -4% | 3% | 7% | 31% | -51% | |
| Write 4k QD32 (MB/s) | 276.2 | 216 -22% | 234.4 -15% | 211.2 -24% | 151.5 -45% | 36.43 -87% |
| Read 4k QD32 (MB/s) | 360.9 | 369.9 2% | 235.6 -35% | 301.3 -17% | 244.7 -32% | 94.9 -74% |
| Write 4k (MB/s) | 68.5 | 72.9 6% | 85.2 24% | 86.8 27% | 113 65% | 35.47 -48% |
| Read 4k (MB/s) | 31.85 | 21.7 -32% | 33.03 4% | 29.69 -7% | 38.52 21% | 5.78 -82% |
| Write 512 (MB/s) | 298.4 | 232.7 -22% | 305.1 2% | 389.7 31% | 308.6 3% | 167.2 -44% |
| Read 512 (MB/s) | 351.6 | 371.3 6% | 459.9 31% | 341.3 -3% | 684 95% | 259.2 -26% |
| Write Seq (MB/s) | 297.8 | 394.4 32% | 307.6 3% | 418.9 41% | 307.7 3% | 171.1 -43% |
| Read Seq (MB/s) | 461.7 | 458.9 -1% | 517 12% | 502 9% | 1097 138% | 446.5 -3% |
| 3DMark 06 Standard Score | 7597 puan | |
| 3DMark 11 Performance | 1372 puan | |
| 3DMark Cloud Gate Standard Score | 4922 puan | |
| 3DMark Fire Strike Score | 678 puan | |
Yardım | ||
| düşük | orta | yüksek | ultra | |
|---|---|---|---|---|
| Tomb Raider (2013) | 49.7 | 25.2 | 16.6 | |
| BioShock Infinite (2013) | 35.28 | 20.31 | 16.9 | |
| The Witcher 3 (2015) | 11.89 |
Ses yüksekliği
| Boşta |
| 29.1 / 29.1 / 29.1 dB |
| Çalışırken |
| 31.5 / 33.5 dB |
 | ||
30 dB sessiz 40 dB(A) duyulabilirlik 50 dB(A) gürültülü |
||
min: | ||
| Lenovo ThinkPad 13-20GKS01100 6200U, HD Graphics 520 | Lenovo ThinkPad T460-20FN003LGE 6200U, HD Graphics 520 | Acer TravelMate P238-M-5575 6200U, HD Graphics 520 | Asus Zenbook UX303UA-FN121T 6200U, HD Graphics 520 | Acer Aspire S 13 S5-371-71QZ 6500U, HD Graphics 520 | Dell XPS 13-9350 6200U, HD Graphics 520 | Lenovo ThinkPad T460s-20F9003SGE 6200U, HD Graphics 520 | |
|---|---|---|---|---|---|---|---|
| Noise | -4% | -9% | -8% | -8% | 4% | -2% | |
| kapalı / ortam * (dB) | 29.1 | 29 -0% | 31.2 -7% | 31.2 -7% | 29.1 -0% | ||
| Idle Minimum * (dB) | 29.1 | 29 -0% | 31.2 -7% | 32.6 -12% | 31.2 -7% | 28.2 3% | 29.1 -0% |
| Idle Average * (dB) | 29.1 | 29 -0% | 31.2 -7% | 32.7 -12% | 31.2 -7% | 28.3 3% | 29.1 -0% |
| Idle Maximum * (dB) | 29.1 | 29 -0% | 31.2 -7% | 32.7 -12% | 31.5 -8% | 28.4 2% | 29.1 -0% |
| Load Average * (dB) | 31.5 | 34.2 -9% | 35.71 -13% | 33.4 -6% | 35.7 -13% | 30.2 4% | 32.3 -3% |
| Load Maximum * (dB) | 33.5 | 37.8 -13% | 38.1 -14% | 33.4 -0% | 35.8 -7% | 30.2 10% | 36.6 -9% |
* ... daha küçük daha iyidir
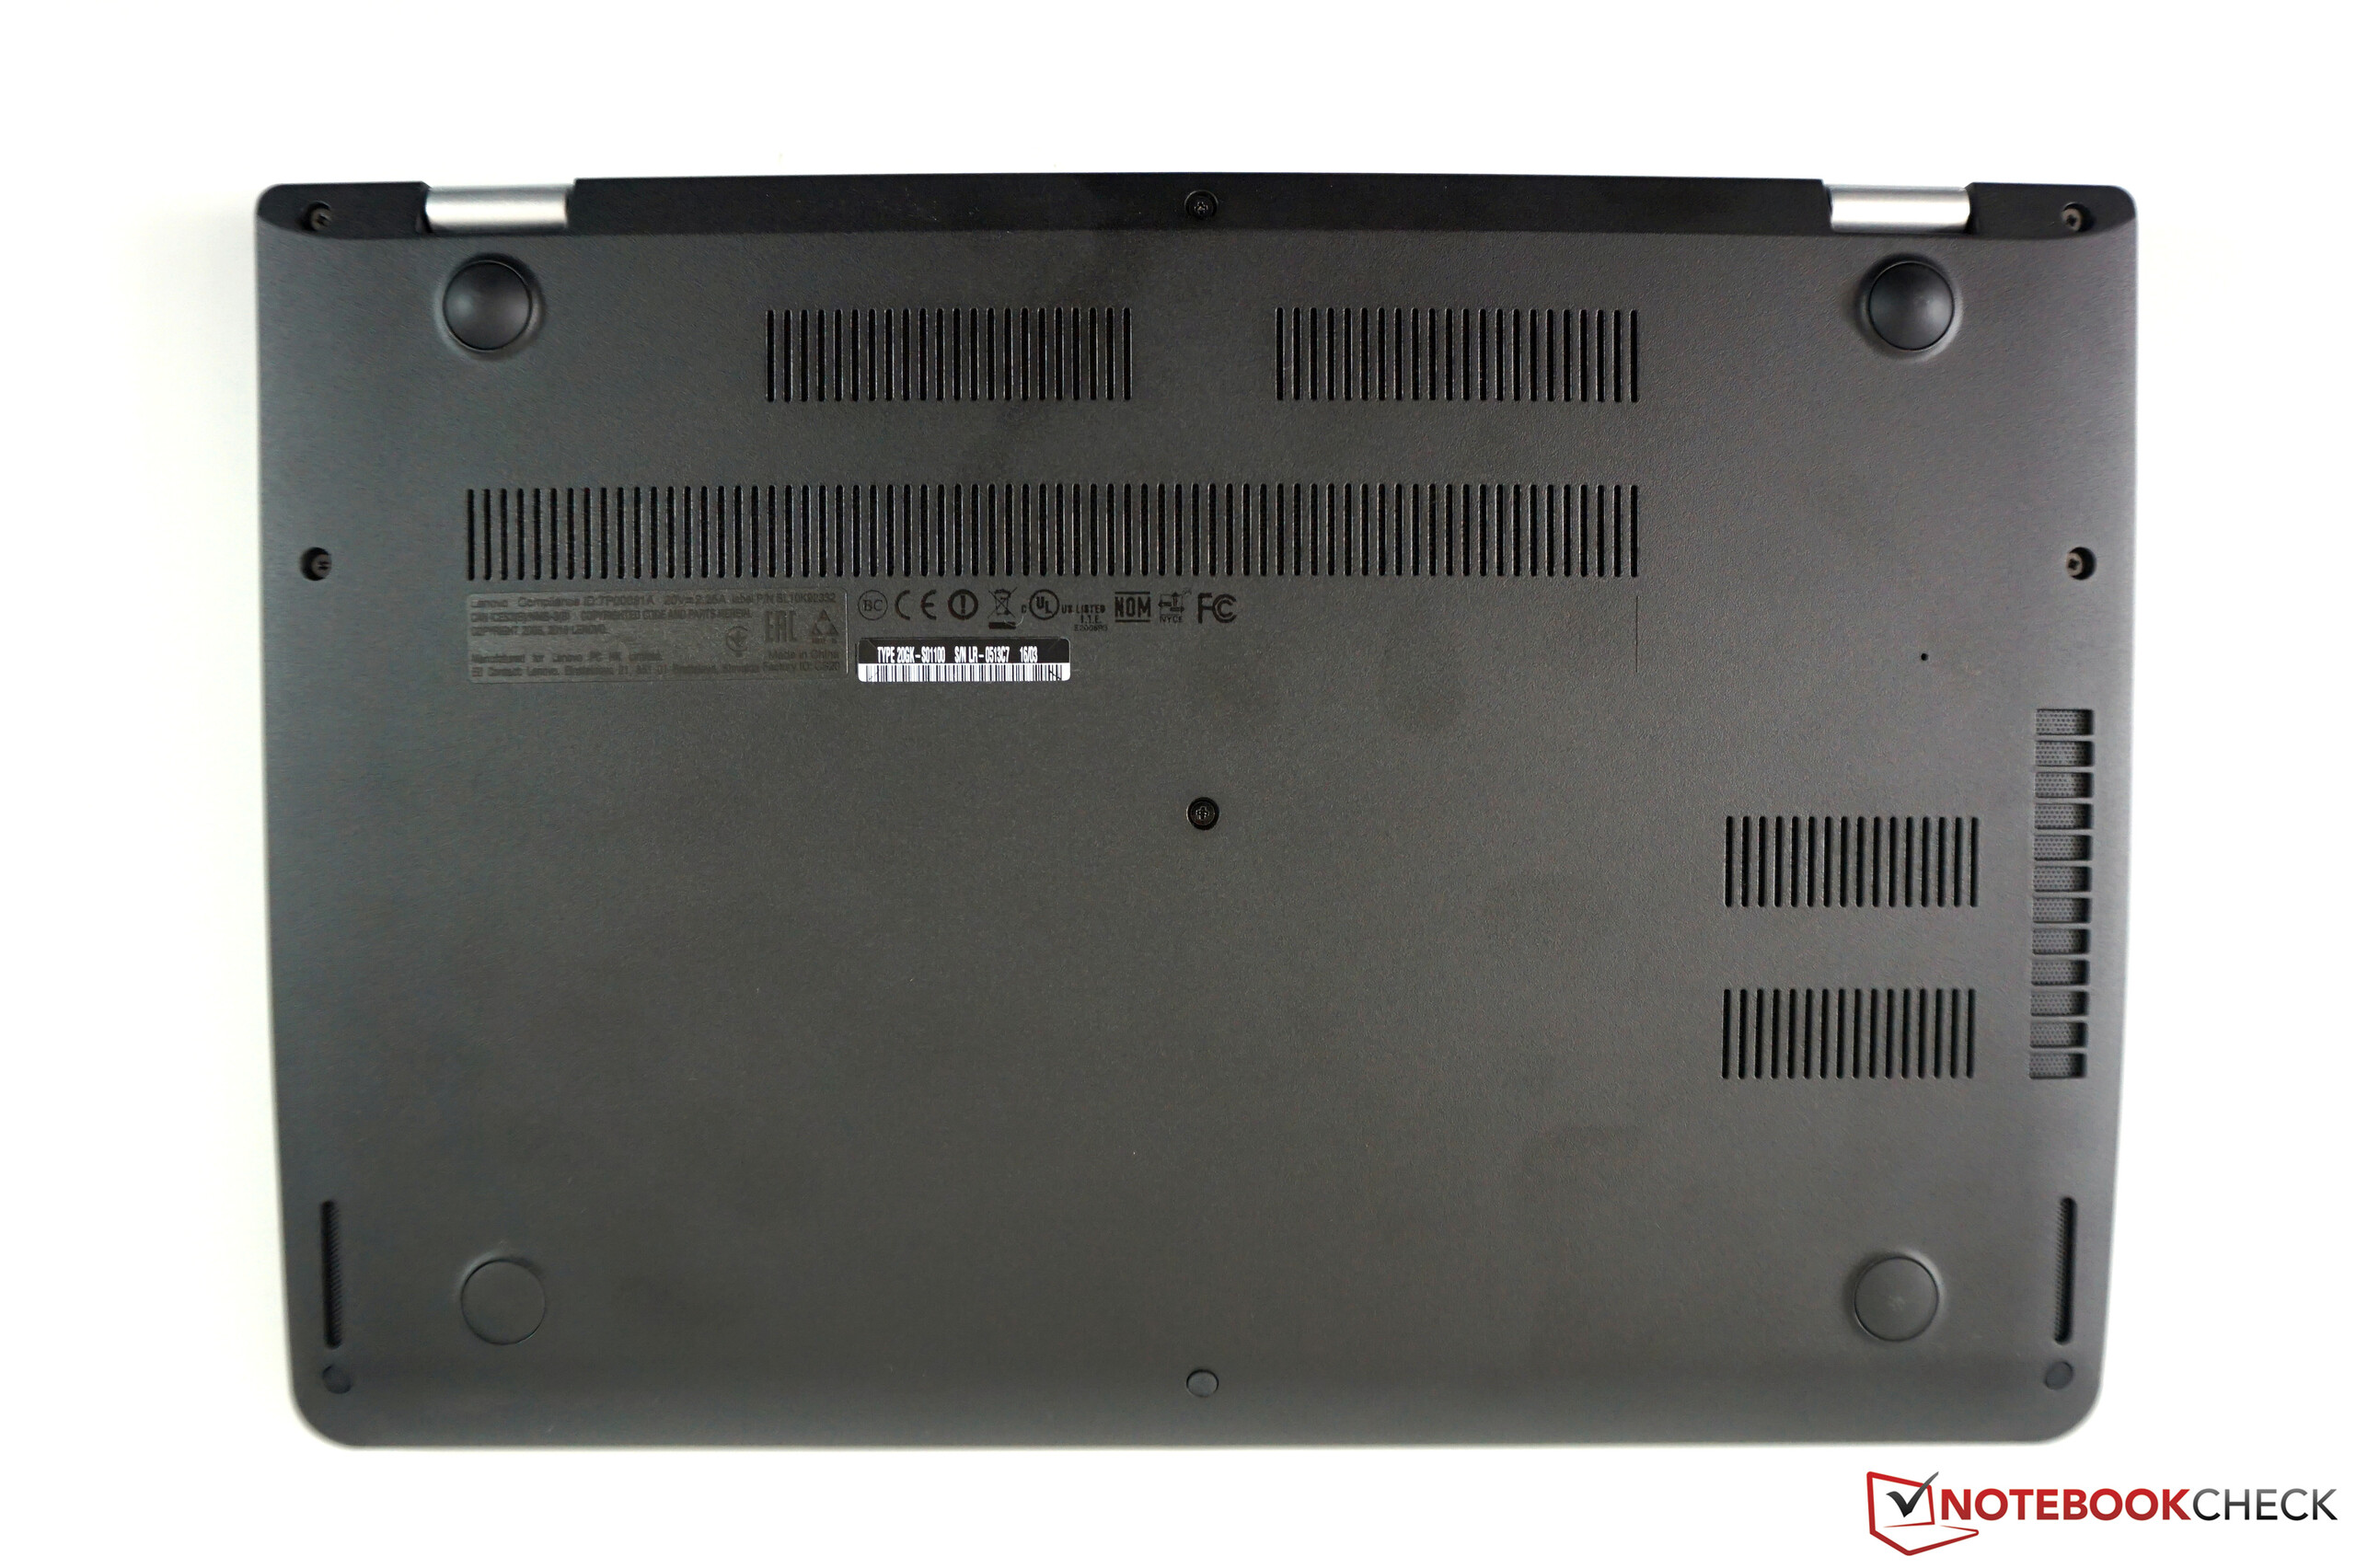
(±) Üst taraftaki maksimum sıcaklık, 34.3 °C / 94 F ortalamasına kıyasla 43.7 °C / 111 F'dir. , Office sınıfı için 21.2 ile 62.5 °C arasında değişir.
(±) Alt kısım, 36.8 °C / 98 F ortalamasına kıyasla maksimum 44.2 °C / 112 F'ye kadar ısınır
(+) Boşta kullanımda, üst tarafın ortalama sıcaklığı 28.5 °C / 83 F olup, cihazın 29.5 °C / 85 F.
(+) Avuç içi dayanakları ve dokunmatik yüzey, maksimum 26.8 °C / 80.2 F ile cilt sıcaklığından daha soğuktur ve bu nedenle dokunulduğunda soğuktur.
(±) Benzer cihazların avuç içi dayanağı alanının ortalama sıcaklığı 27.5 °C / 81.5 F (+0.7 °C / 1.3 F) idi.
| Lenovo ThinkPad 13-20GKS01100 6200U, HD Graphics 520 | Lenovo ThinkPad T460-20FN003LGE 6200U, HD Graphics 520 | Acer TravelMate P238-M-5575 6200U, HD Graphics 520 | Asus Zenbook UX303UA-FN121T 6200U, HD Graphics 520 | Acer Aspire S 13 S5-371-71QZ 6500U, HD Graphics 520 | Dell XPS 13-9350 6200U, HD Graphics 520 | Lenovo ThinkPad T460s-20F9003SGE 6200U, HD Graphics 520 | |
|---|---|---|---|---|---|---|---|
| Heat | 7% | 20% | 14% | 8% | 0% | 10% | |
| Maximum Upper Side * (°C) | 43.7 | 37.3 15% | 34.2 22% | 39.7 9% | 38.5 12% | 45.2 -3% | 41.4 5% |
| Maximum Bottom * (°C) | 44.2 | 44.3 -0% | 31 30% | 34.8 21% | 47.7 -8% | 45.2 -2% | 41 7% |
| Idle Upper Side * (°C) | 31.4 | 29 8% | 27.1 14% | 27.4 13% | 27.2 13% | 30.4 3% | 26.7 15% |
| Idle Bottom * (°C) | 32.1 | 30.1 6% | 27.7 14% | 27.7 14% | 27.4 15% | 31.2 3% | 27.8 13% |
* ... daha küçük daha iyidir
| Kapalı / Bekleme modu | |
| Boşta | |
| Çalışırken |
|
Key:
min: | |
| Lenovo ThinkPad 13-20GKS01100 6200U, HD Graphics 520, 1920x1080 | Lenovo ThinkPad T460-20FN003LGE 6200U, HD Graphics 520, 1920x1080 | Acer TravelMate P238-M-5575 6200U, HD Graphics 520, 1366x768 | Asus Zenbook UX303UA-FN121T 6200U, HD Graphics 520, 1366x768 | Acer Aspire S 13 S5-371-71QZ 6500U, HD Graphics 520, 1920x1080 | Lenovo ThinkPad T460s-20F9003SGE 6200U, HD Graphics 520, 1920x1080 | |
|---|---|---|---|---|---|---|
| Power Consumption | -14% | -2% | -12% | -20% | -14% | |
| Idle Minimum * (Watt) | 3.1 | 3.5 -13% | 3.2 -3% | 4.2 -35% | 4.1 -32% | 3.7 -19% |
| Idle Average * (Watt) | 5.5 | 6.7 -22% | 5.5 -0% | 6.2 -13% | 6.7 -22% | 6.8 -24% |
| Idle Maximum * (Watt) | 6 | 7.3 -22% | 6 -0% | 6.4 -7% | 7.4 -23% | 7.3 -22% |
| Load Average * (Watt) | 25.8 | 28.2 -9% | 29.5 -14% | 29 -12% | 32.4 -26% | 26.3 -2% |
| Load Maximum * (Watt) | 33.6 | 34.6 -3% | 30.9 8% | 31 8% | 32.4 4% | 34.6 -3% |
* ... daha küçük daha iyidir
| Lenovo ThinkPad 13-20GKS01100 42 Wh | Lenovo ThinkPad T460-20FN003LGE 46 Wh | Acer TravelMate P238-M-5575 49.7 Wh | Asus Zenbook UX303UA-FN121T 50 Wh | Acer Aspire S 13 S5-371-71QZ 45 Wh | Dell XPS 13-9350 56 Wh | Lenovo ThinkPad T460s-20F9003SGE 49 Wh | |
|---|---|---|---|---|---|---|---|
| Pil Çalışma Süresi | -7% | 33% | 18% | 4% | 6% | 1% | |
| Reader / Idle (h) | 15.7 | 15.9 1% | 21.5 37% | 17.1 9% | 13 -17% | 15.3 -3% | |
| H.264 (h) | 7.8 | 8.5 9% | 9.3 19% | 8.9 14% | |||
| WiFi v1.3 (h) | 6.2 | 5.6 -10% | 10.1 63% | 7.3 18% | 7.9 27% | 7.5 21% | 6.6 6% |
| Load (h) | 2.2 | 1.6 -27% | 2.5 14% | 1.7 -23% | 2.5 14% | 1.9 -14% |
Artılar
Eksiler
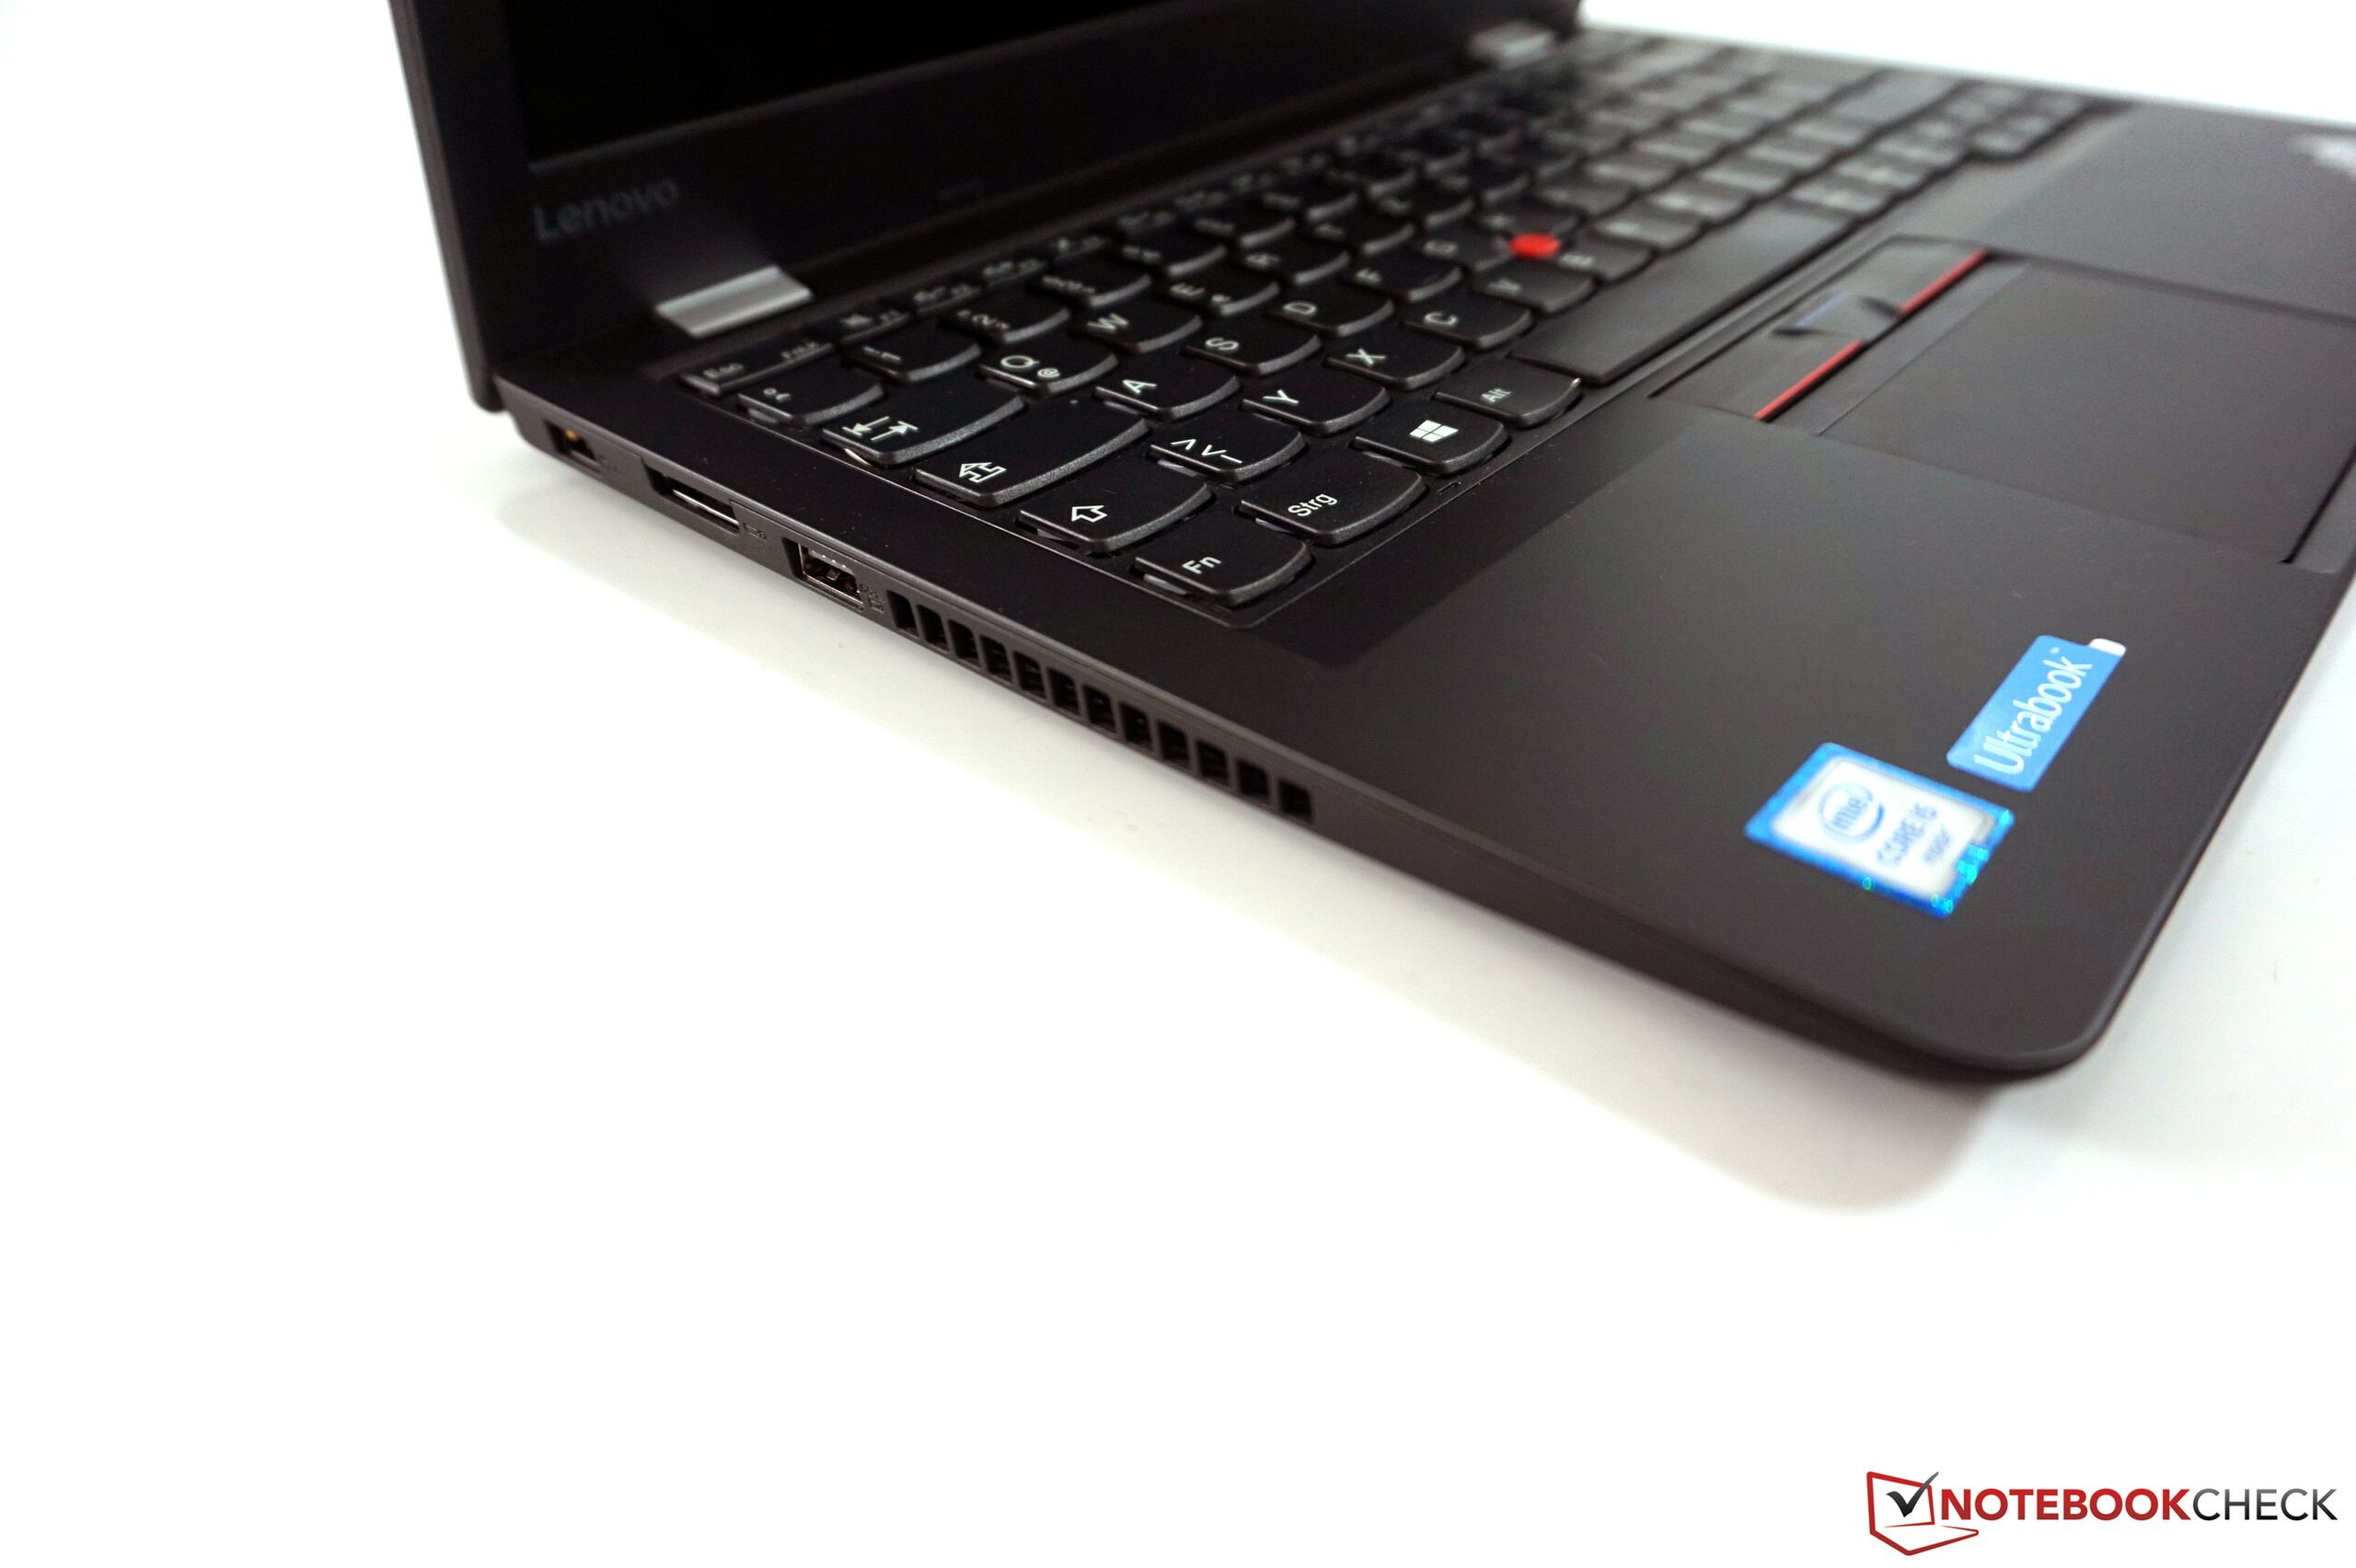
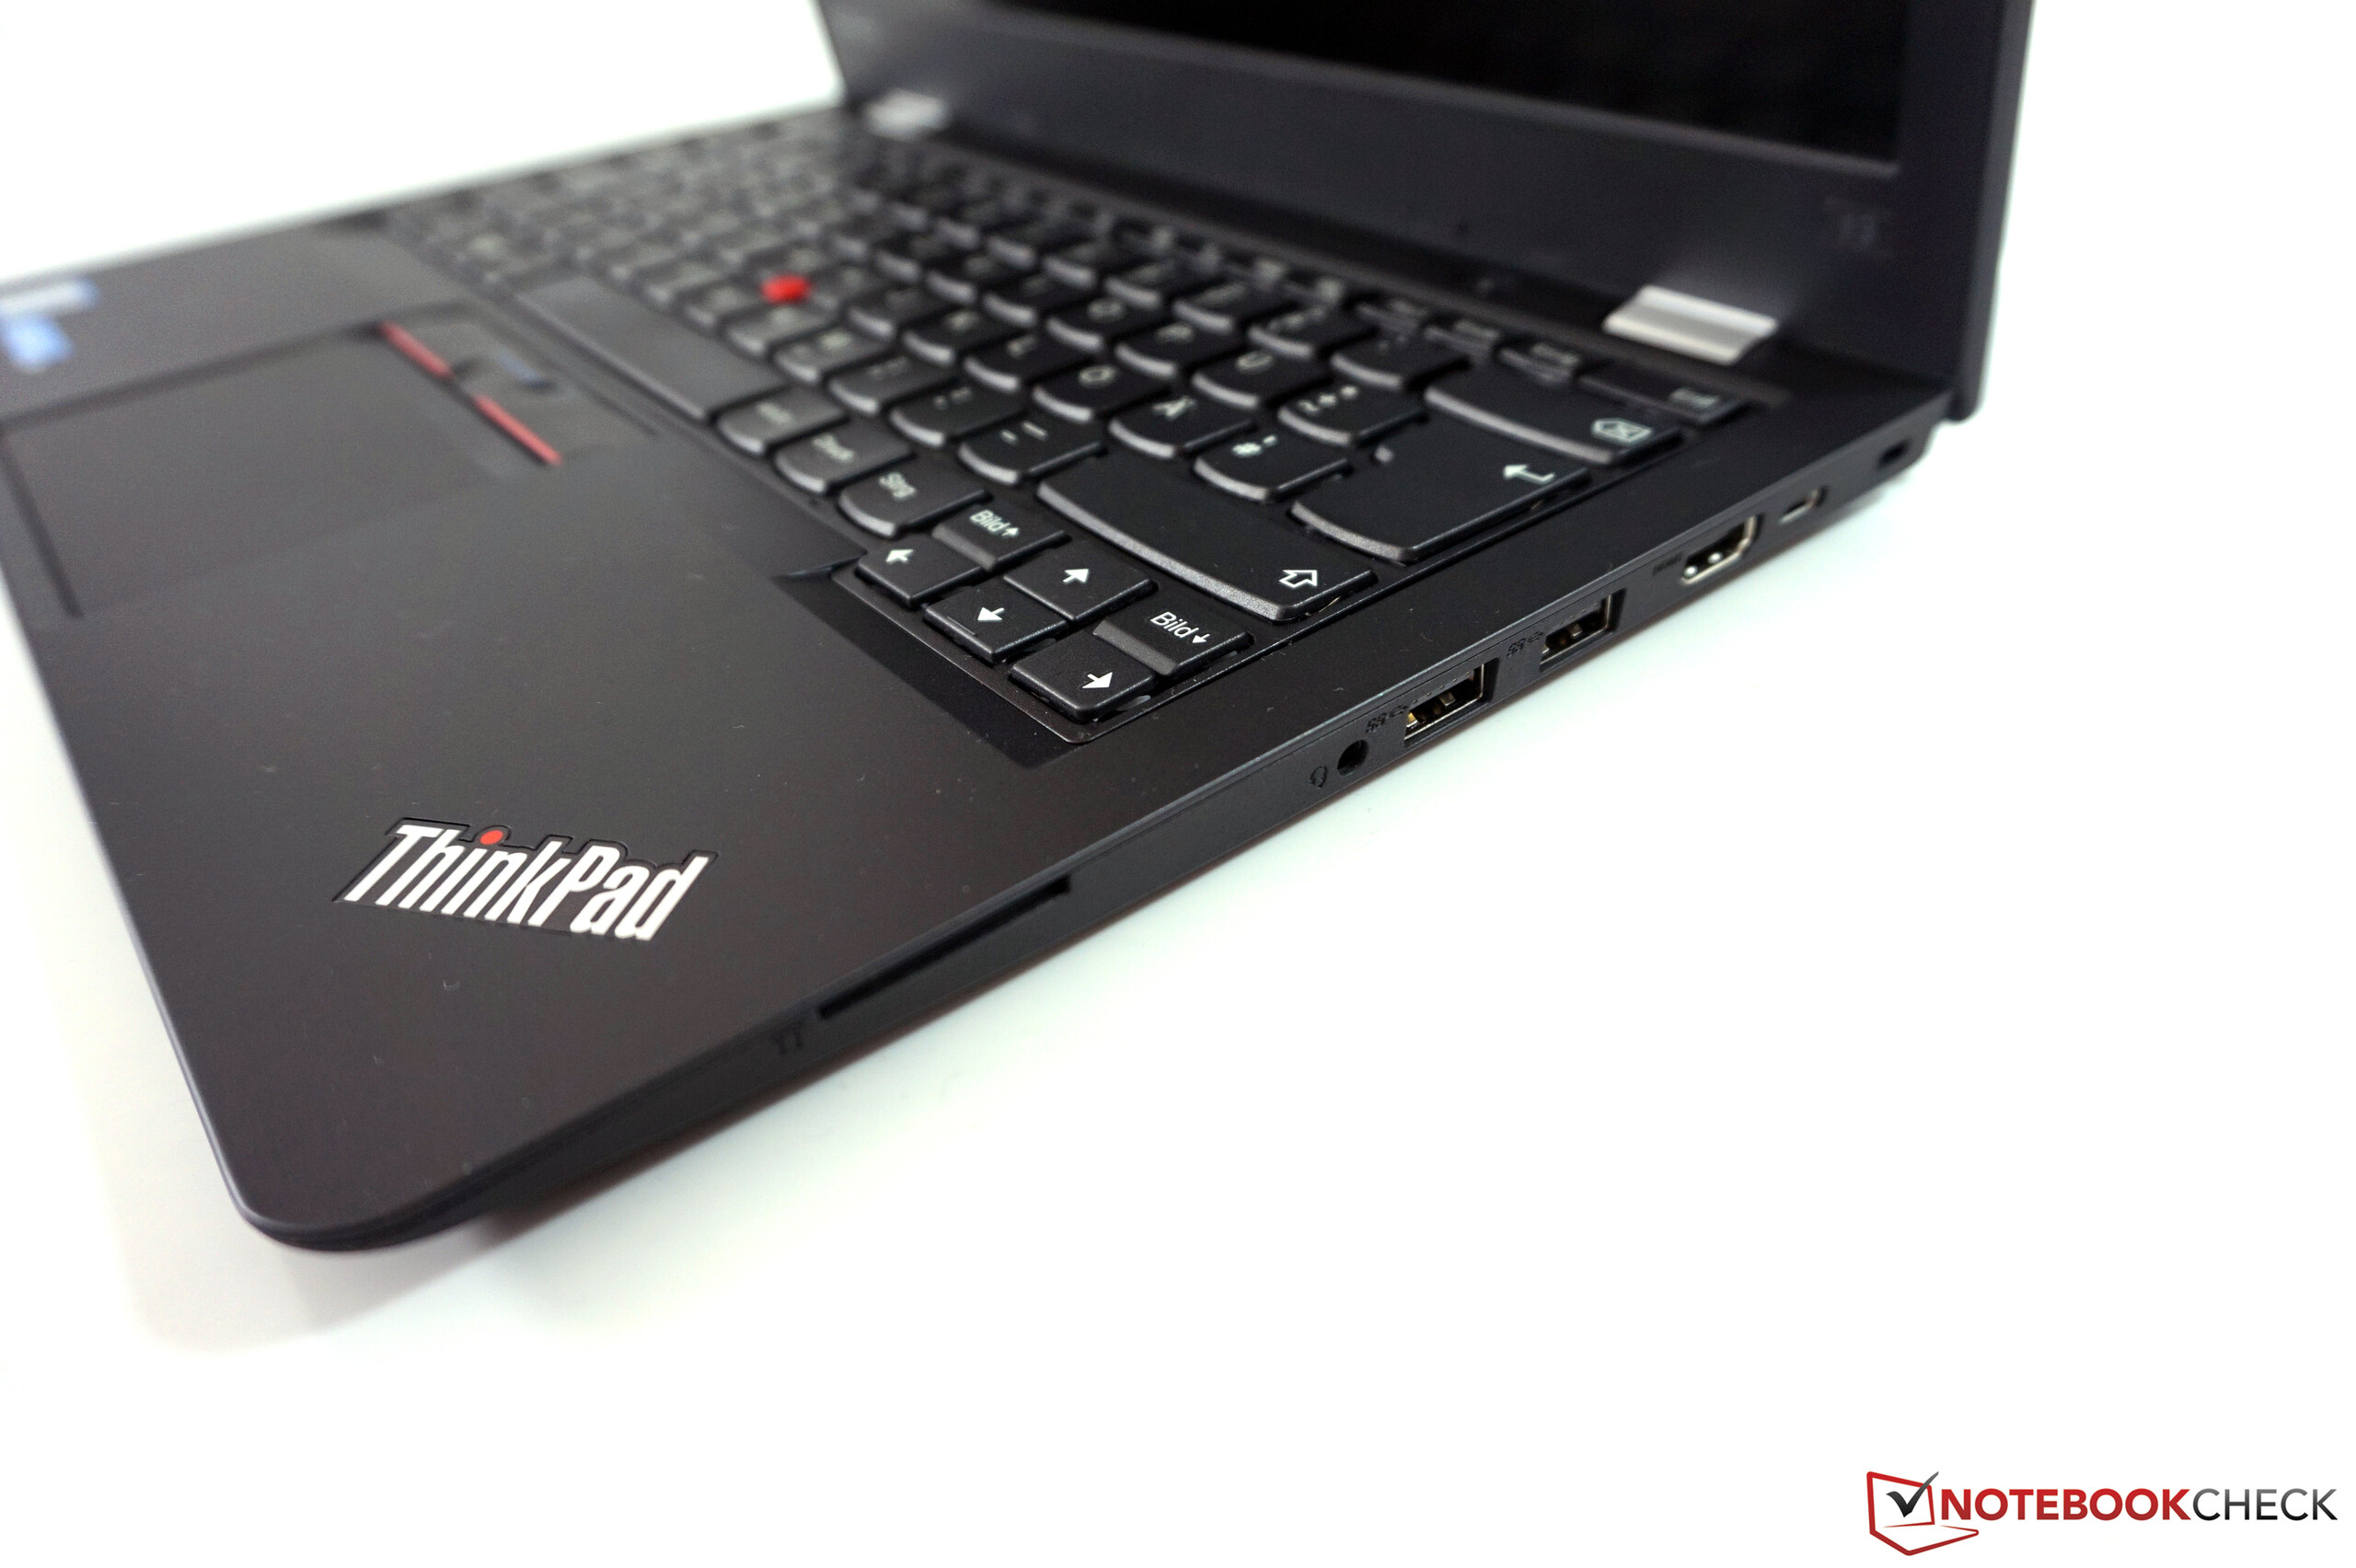
Yeni ThinkPad 13 ilginç bir cihaz. Modern bileşenlere sahip bir ultrabook ve görünen ciddi bir sorunu yok. Makul bir mat FHD ekran sunuluyor, elbette dış mekan kullanımı için daha parlak olabilir. SSD sayesinde performans oldukça iyi ve harika ThinkPad klavyesi aydınlatmalı olmamasına karşın mükemmel.
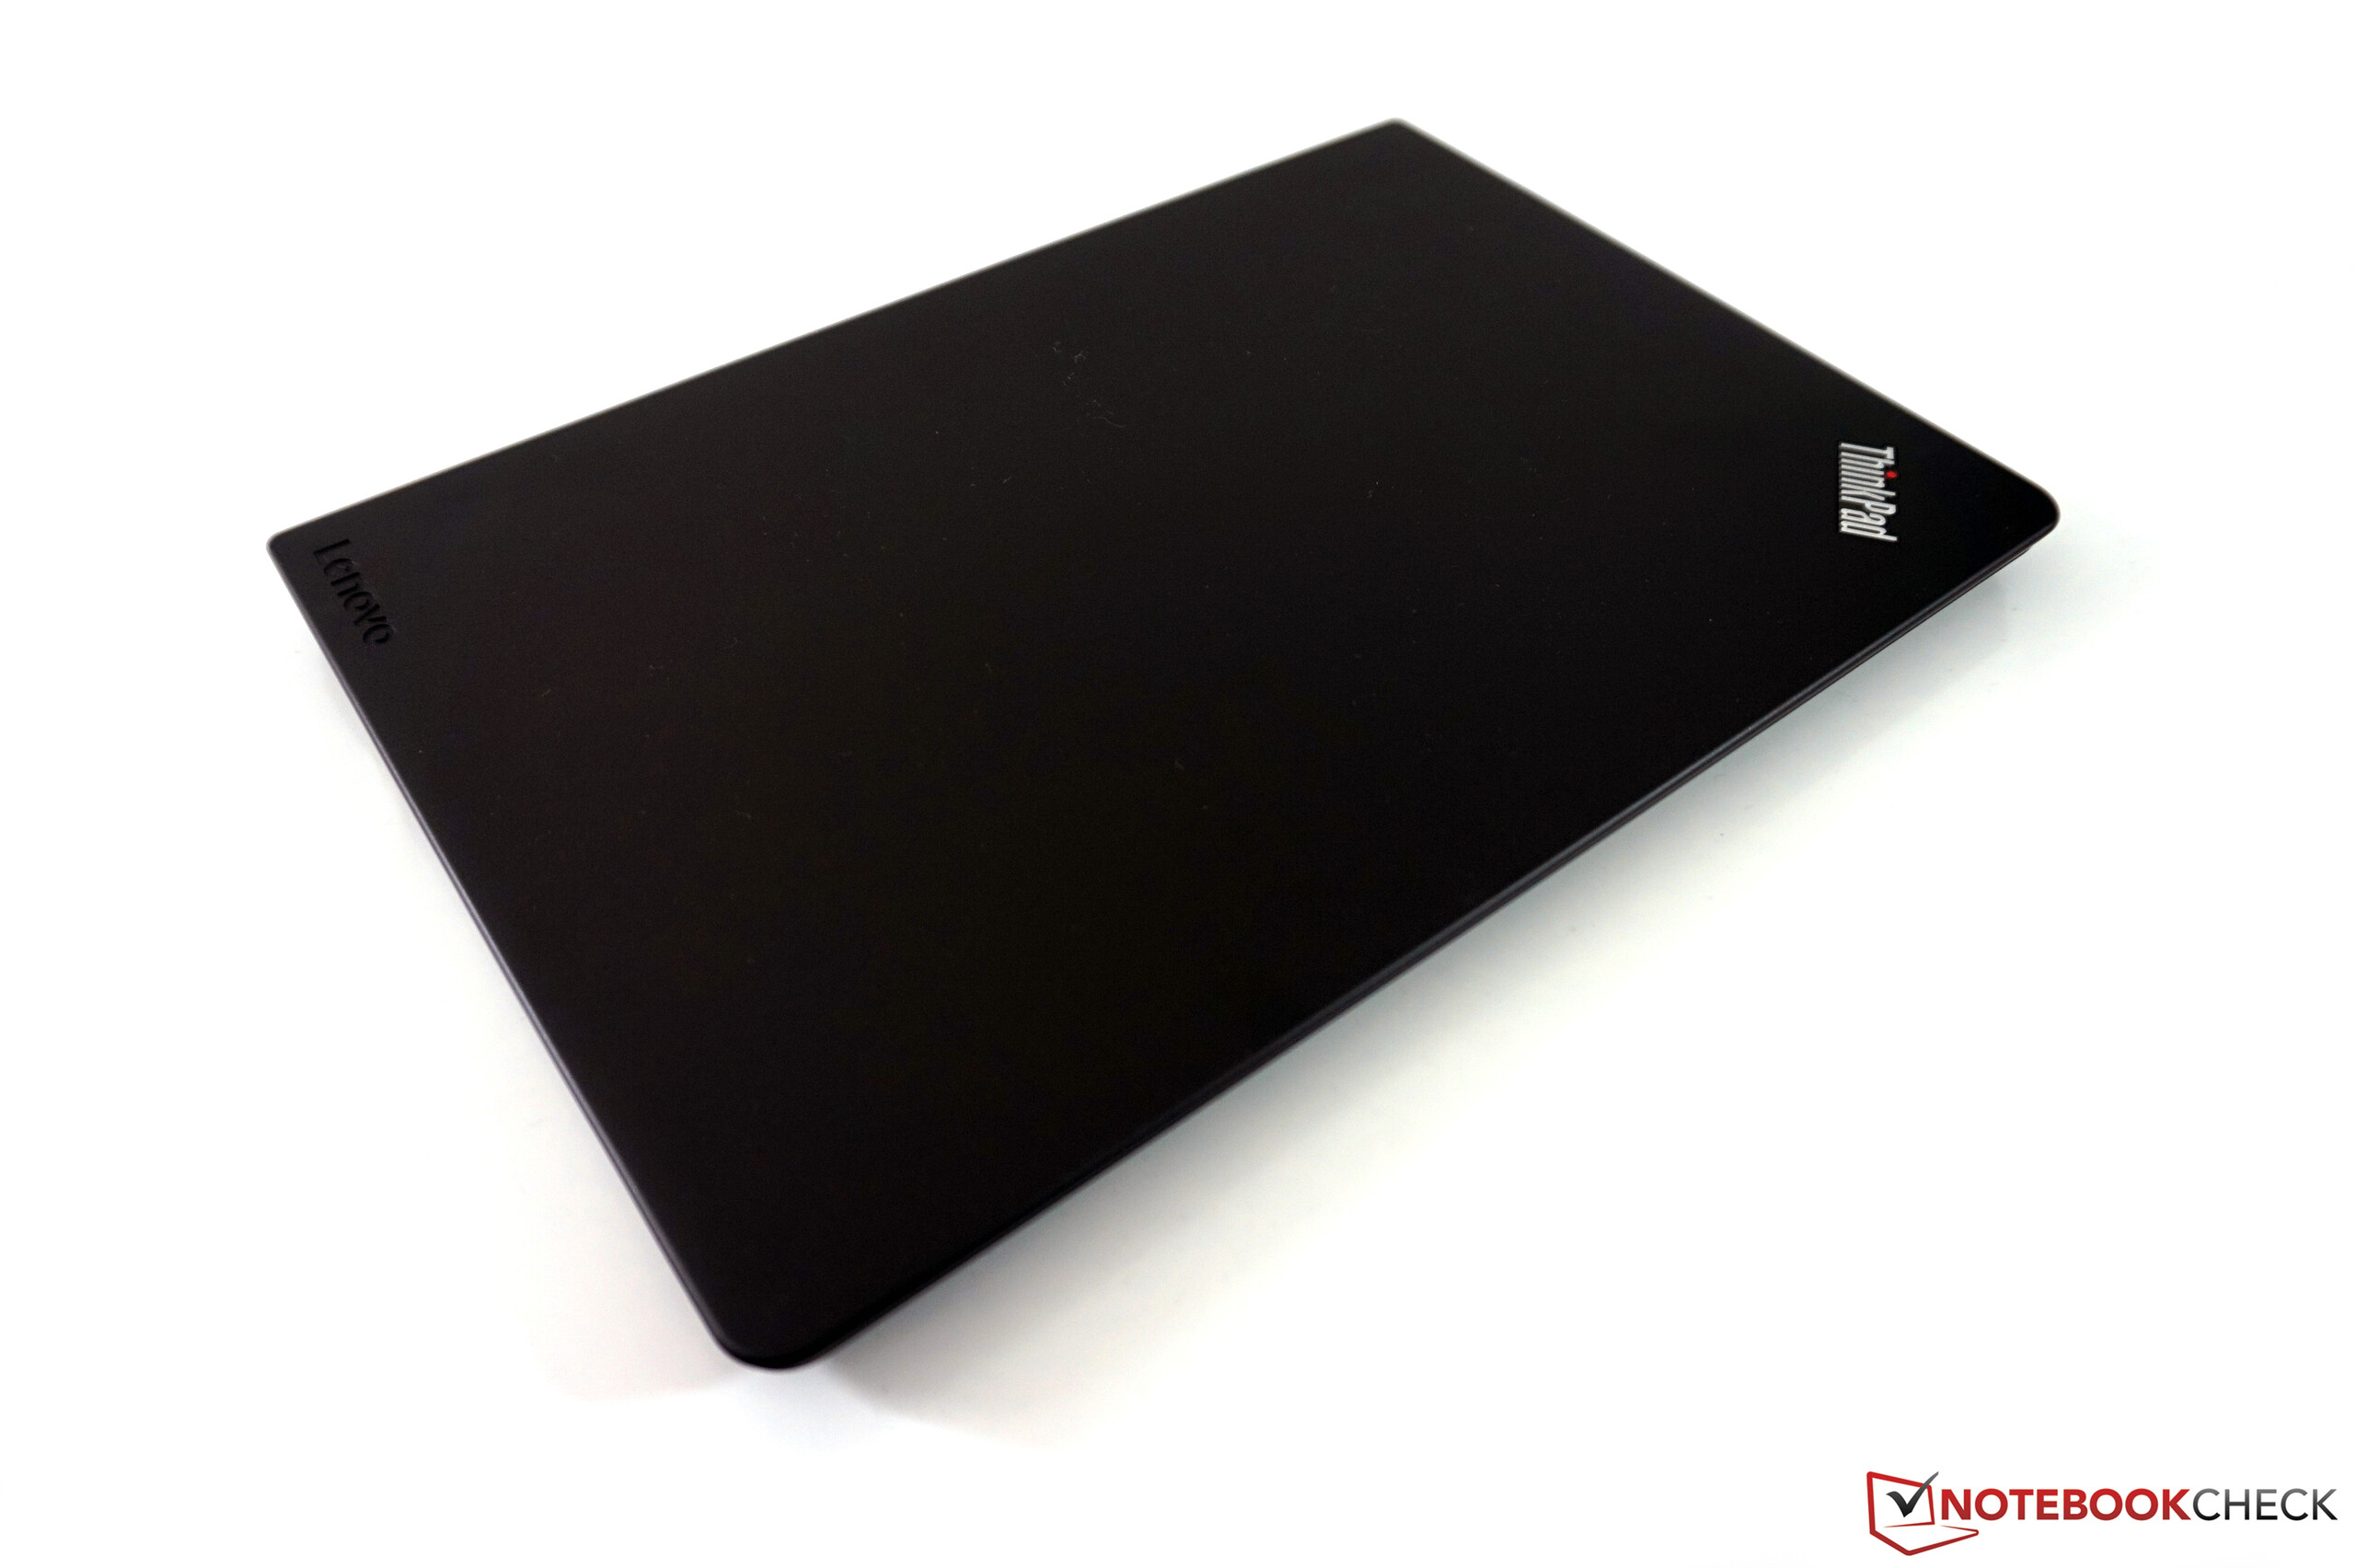
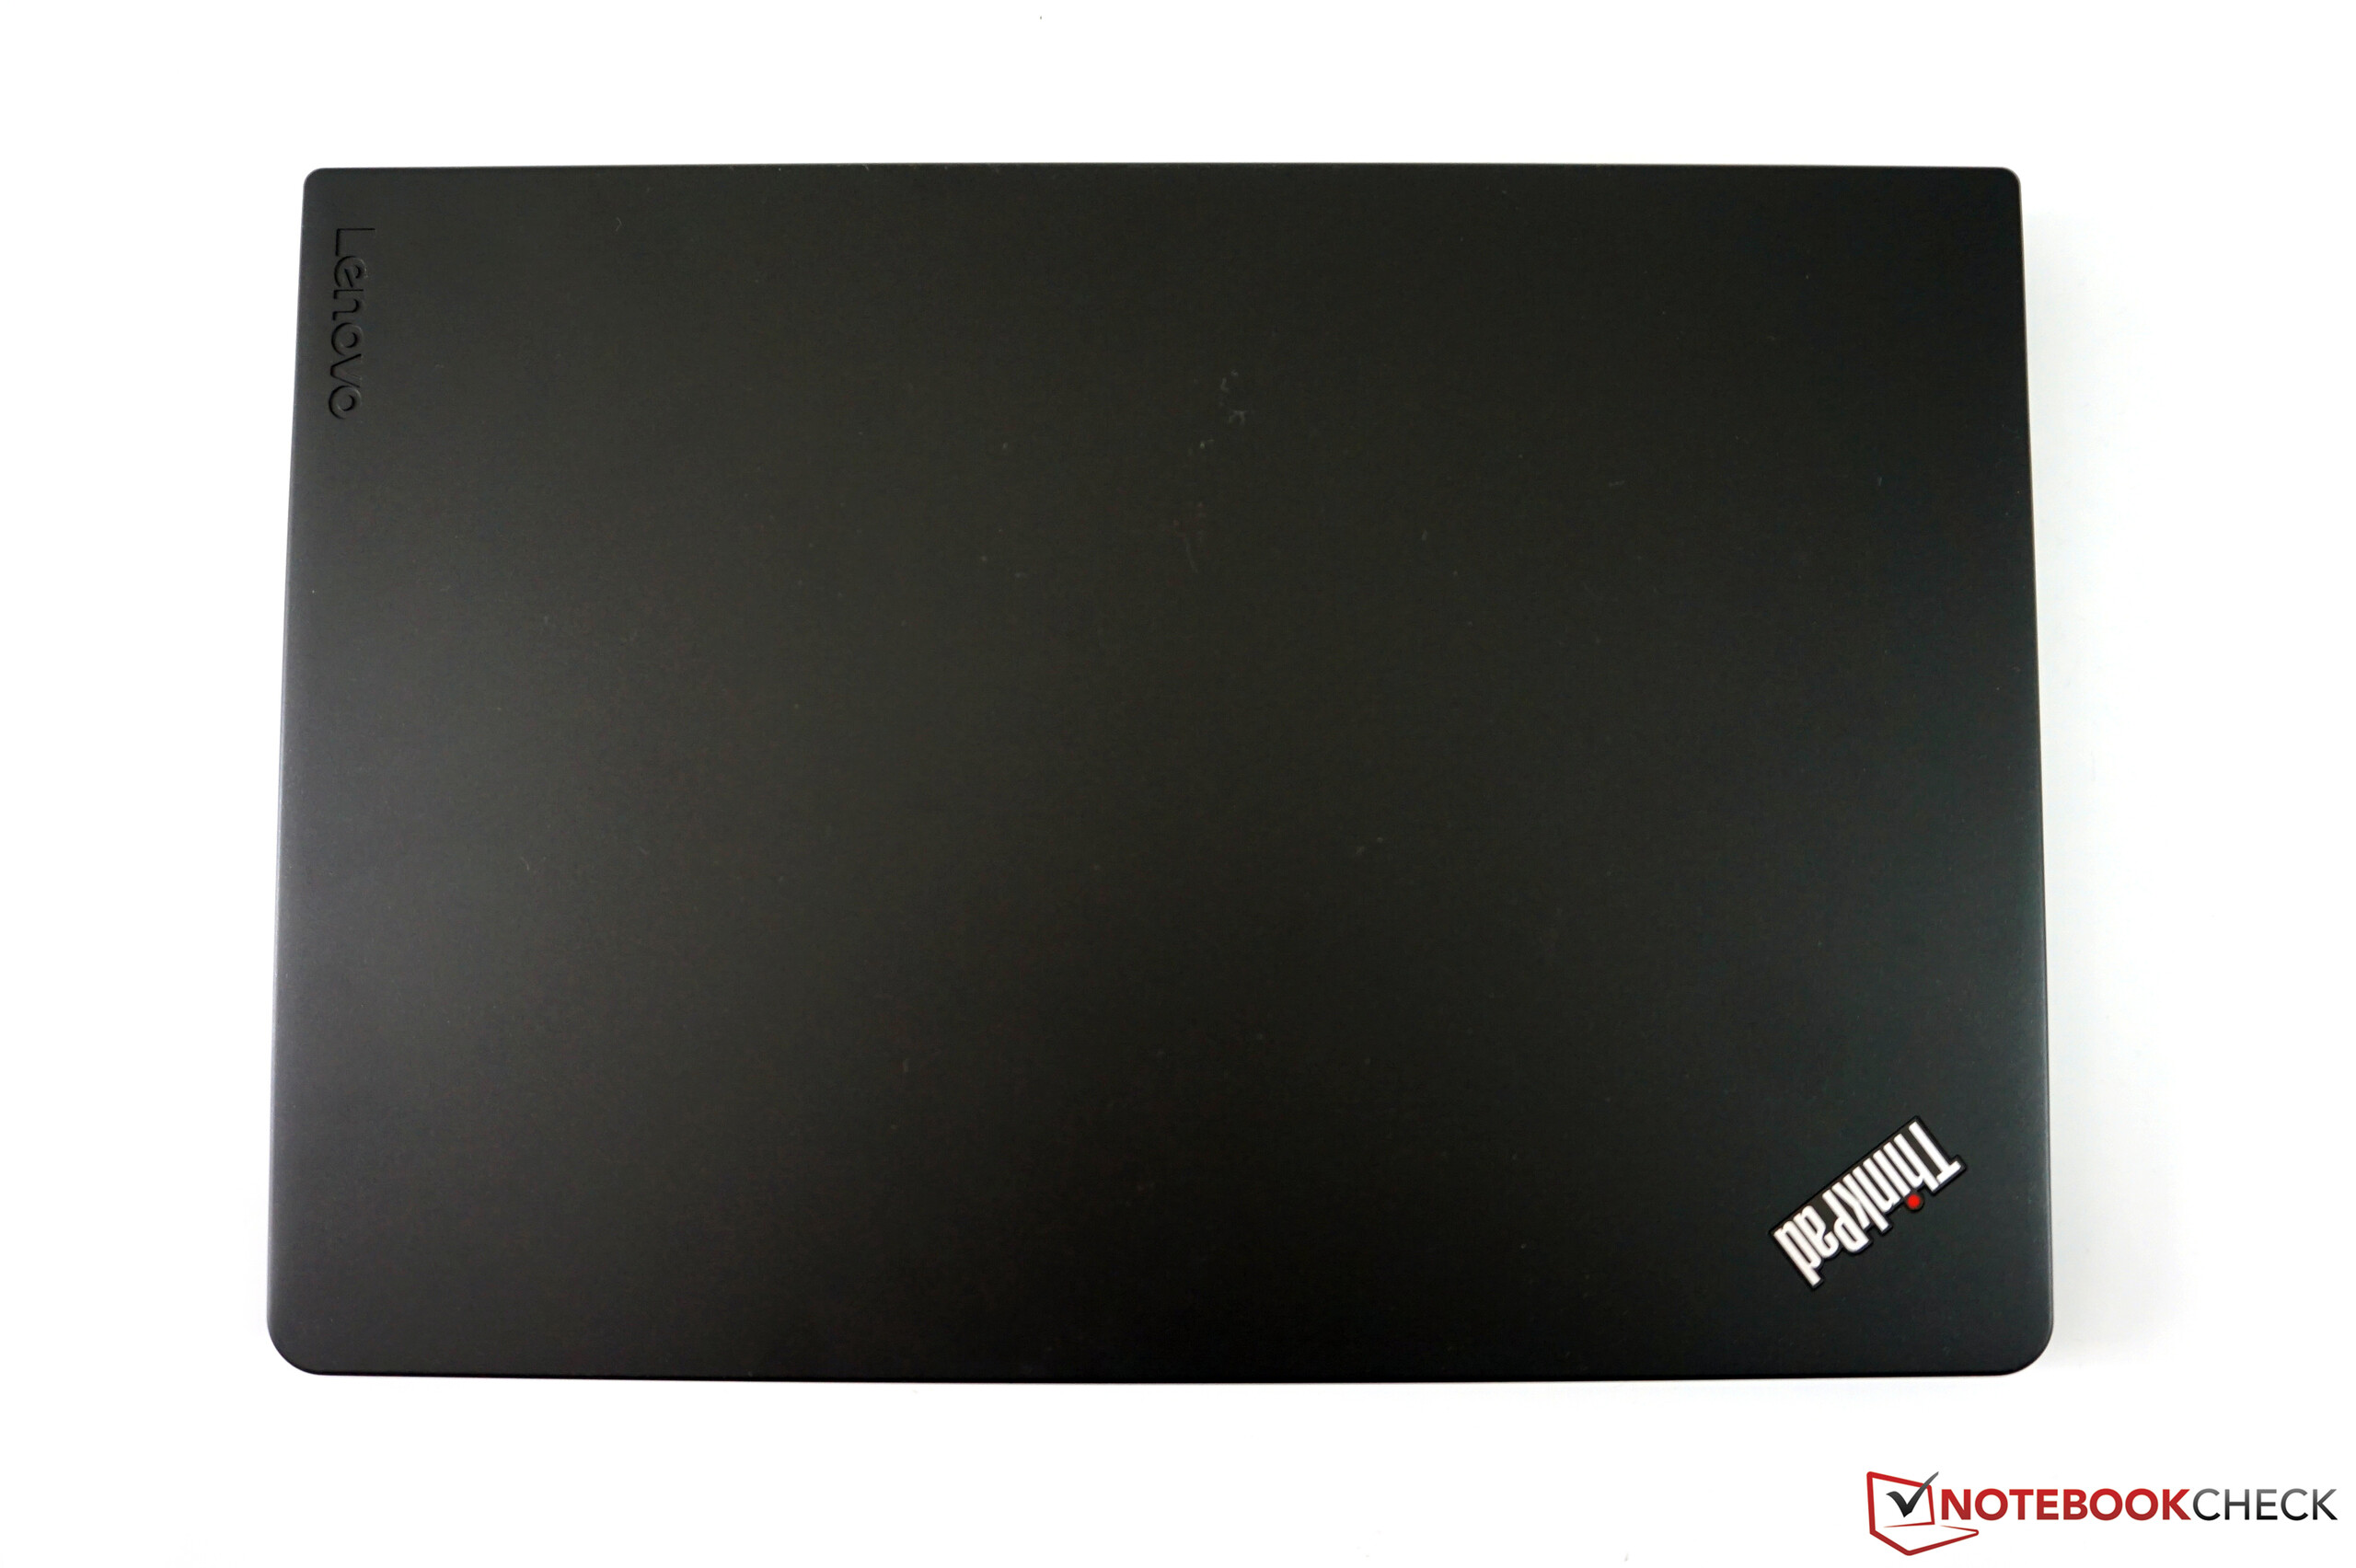
Kasa yönünden bazı ödünler vermek gerekli. Kasanın stabilitesi iyi, ancak ekran baskıya karşı o kadar dayanıklı değil. Ekran menteşeleri için de aynı şey geçerli. Güvenlik yönünden de bazı kısıtlamalar mevcut.
ThinkPad 13 modelinin kampüs için olanına özel bir öneri de bulunmak gerekli. Tam fiyatı olan 1000 Euro düşünüldüğünde Dell XPS 13 daha iyi bir alternatif olabilir.
Diğer ThinkPad modelleri ile kıyaslandığında performans neredeyse benzer. Daha fazla ücret ödediğinizde daha sağlam bir kasa ile daha kapsamlı güvenlik özelliklerine ve garanti süresine sahip olabilirsiniz.
İncelemenin tamamı için tıklayın.
Lenovo ThinkPad 13-20GKS01100
- 04/28/2017 v6 (old)
Andreas Osthoff
Price comparison
