Kısa inceleme: Lenovo ThinkPad P70 Workstation

| |||||||||||||||||||||||||
Aydınlatma: 85 %
Batarya modunda parlaklık: 361 cd/m²
Kontrast: 913:1 (Siyah: 0.4 cd/m²)
ΔE ColorChecker Calman: 3.8 | ∀{0.5-29.43 Ø4.73}
ΔE Greyscale Calman: 6.09 | ∀{0.09-98 Ø4.97}
99.97% sRGB (Argyll 1.6.3 3D)
76.01% AdobeRGB 1998 (Argyll 1.6.3 3D)
85.4% AdobeRGB 1998 (Argyll 3D)
100% sRGB (Argyll 3D)
90.8% Display P3 (Argyll 3D)
Gamma: 2.3
CCT: 6332 K
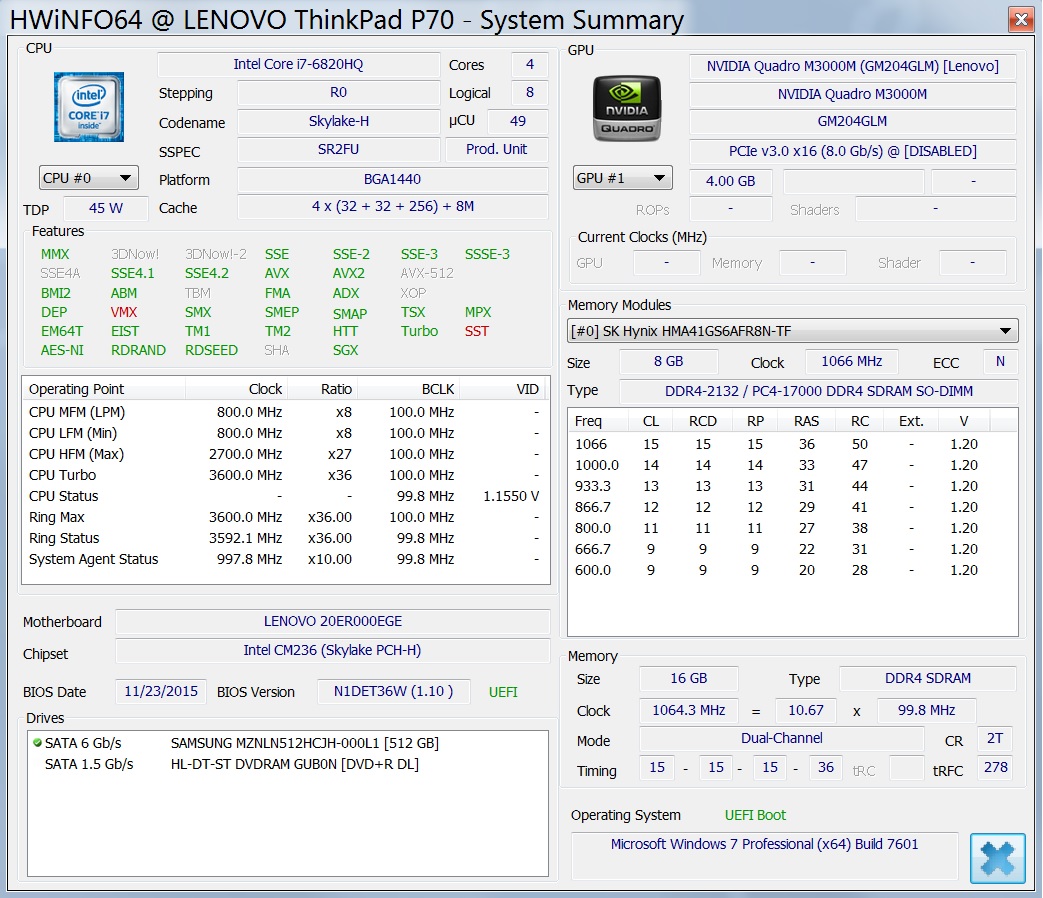
| Lenovo ThinkPad P70 Quadro M3000M, 6820HQ, Samsung SSD PM871 MZNLN512HCJH | Dell Precision 7710 FirePro W7170M, E3-1535M v5, Samsung SM951 MZVPV256HDGL m.2 PCI-e | HP ZBook 17 E9X11AA-ABA Quadro K610M, 4900MQ, Micron RealSSD C400 MTFDDAK128MAM | MSI WT72-2OL32SR311BW Quadro K4100M, 4980HQ, 4x Toshiba HG6 THNSNJ256G8NU (RAID 0) | Bullman E-Klasse 5 Quadro K3100M, 4790K, Samsung SSD SM951 256GB MZHPV256HDGL | |
|---|---|---|---|---|---|
| Display | -17% | 3% | -24% | -23% | |
| Display P3 Coverage (%) | 90.8 | 66.6 -27% | 85.7 -6% | 66.5 -27% | 66.5 -27% |
| sRGB Coverage (%) | 100 | 96.9 -3% | 100 0% | 84.3 -16% | 84.5 -15% |
| AdobeRGB 1998 Coverage (%) | 85.4 | 68.6 -20% | 99.2 16% | 61.7 -28% | 61.8 -28% |
| Response Times | -22% | ||||
| Response Time Grey 50% / Grey 80% * (ms) | 44 ? | 50 ? -14% | |||
| Response Time Black / White * (ms) | 27.6 ? | 36 ? -30% | |||
| PWM Frequency (Hz) | 228 ? | 198 ? | |||
| Screen | 4% | 13% | -9% | -1% | |
| Brightness middle (cd/m²) | 365 | 332 -9% | 320 -12% | 303 -17% | 355 -3% |
| Brightness (cd/m²) | 341 | 307 -10% | 311 -9% | 276 -19% | 335 -2% |
| Brightness Distribution (%) | 85 | 83 -2% | 88 4% | 83 -2% | 89 5% |
| Black Level * (cd/m²) | 0.4 | 0.33 17% | 0.359 10% | 0.34 15% | 0.44 -10% |
| Contrast (:1) | 913 | 1006 10% | 891 -2% | 891 -2% | 807 -12% |
| Colorchecker dE 2000 * | 3.8 | 3 21% | 2.04 46% | 5.57 -47% | 3.73 2% |
| Greyscale dE 2000 * | 6.09 | 4 34% | 2.45 60% | 4.08 33% | 2.84 53% |
| Gamma | 2.3 96% | 2 110% | 2.28 96% | 2.19 100% | 2.12 104% |
| CCT | 6332 103% | 7089 92% | 6518 100% | 7362 88% | 6457 101% |
| Color Space (Percent of AdobeRGB 1998) (%) | 76.01 | 62 -18% | 93 22% | 55.34 -27% | 55.45 -27% |
| Color Space (Percent of sRGB) (%) | 99.97 | 97 -3% | 100 0% | 84.21 -16% | 84.39 -16% |
| Toplam Ortalama (Program / Ayarlar) | -12% /
-4% | 8% /
11% | -17% /
-13% | -12% /
-7% |
* ... daha küçük daha iyidir
Yanıt Sürelerini Görüntüle
| ↔ Tepki Süresi Siyahtan Beyaza | ||
|---|---|---|
| 27.6 ms ... yükseliş ↗ ve sonbahar↘ birleşimi | ↗ 4.8 ms yükseliş | 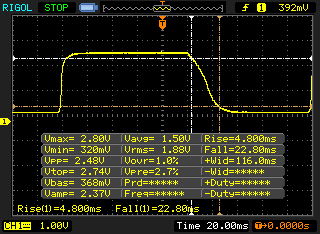 |
| ↘ 22.8 ms sonbahar | ||
| Ekran, testlerimizde nispeten yavaş yanıt oranları gösteriyor ve oyuncular için çok yavaş olabilir. Karşılaştırıldığında, test edilen tüm cihazlar 0.1 (minimum) ile 240 (maksimum) ms arasında değişir. » Tüm cihazların 70 %'si daha iyi. Bu, ölçülen yanıt süresinin test edilen tüm cihazların ortalamasından (19.9 ms) daha kötü olduğu anlamına gelir. | ||
| ↔ Tepki Süresi %50 Griden %80 Griye | ||
| 44 ms ... yükseliş ↗ ve sonbahar↘ birleşimi | ↗ 17.2 ms yükseliş | 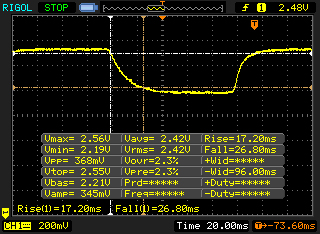 |
| ↘ 26.8 ms sonbahar | ||
| Ekran, testlerimizde yavaş yanıt oranları gösteriyor ve oyuncular için yetersiz olacaktır. Karşılaştırıldığında, test edilen tüm cihazlar 0.165 (minimum) ile 636 (maksimum) ms arasında değişir. » Tüm cihazların 73 %'si daha iyi. Bu, ölçülen yanıt süresinin test edilen tüm cihazların ortalamasından (31.1 ms) daha kötü olduğu anlamına gelir. | ||
Ekran Titremesi / PWM (Darbe Genişliği Modülasyonu)
| Ekran titriyor / PWM algılandı | 228 Hz | ≤ 95 % parlaklık ayarı | 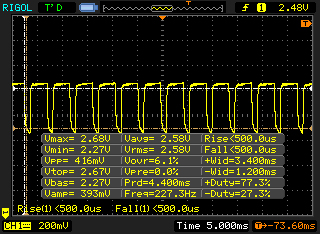 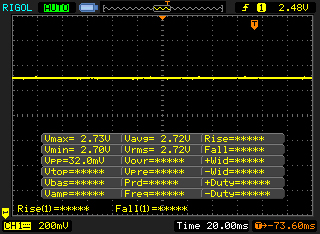 |
Ekran arka ışığı 228 Hz'de titriyor (en kötü durum, örneğin PWM kullanılması) 95 % ve altındaki parlaklık ayarında titreme algılandı. Bu parlaklık ayarının üzerinde titreme veya PWM olmamalıdır. 228 Hz frekansı nispeten düşüktür, bu nedenle hassas kullanıcılar belirtilen parlaklık ayarında ve altında muhtemelen titremeyi fark edecek ve göz yorgunluğu yaşayacaktır. Karşılaştırıldığında: Test edilen tüm cihazların %52 %'si ekranı karartmak için PWM kullanmıyor. PWM tespit edilirse, ortalama 7801 (minimum: 5 - maksimum: 343500) Hz ölçüldü. | |||
| Cinebench R15 | |
| CPU Multi 64Bit (değere göre sırala) | |
| Lenovo ThinkPad P70 | |
| Dell Precision 7710 | |
| HP ZBook 17 G2 J8Z55ET | |
| MSI WT72-2OL32SR311BW | |
| Bullman E-Klasse 5 | |
| Dell Precision 5510 | |
| MSI GE62-6QD16H11 | |
| CPU Single 64Bit (değere göre sırala) | |
| Lenovo ThinkPad P70 | |
| Dell Precision 7710 | |
| HP ZBook 17 G2 J8Z55ET | |
| MSI WT72-2OL32SR311BW | |
| Bullman E-Klasse 5 | |
| Dell Precision 5510 | |
| MSI GE62-6QD16H11 | |
| Cinebench R11.5 | |
| CPU Multi 64Bit (değere göre sırala) | |
| Lenovo ThinkPad P70 | |
| Dell Precision 7710 | |
| HP ZBook 17 G2 J8Z55ET | |
| MSI WT72-2OL32SR311BW | |
| Bullman E-Klasse 5 | |
| Dell Precision 5510 | |
| MSI GE62-6QD16H11 | |
| CPU Single 64Bit (değere göre sırala) | |
| Lenovo ThinkPad P70 | |
| Dell Precision 7710 | |
| HP ZBook 17 G2 J8Z55ET | |
| MSI WT72-2OL32SR311BW | |
| Bullman E-Klasse 5 | |
| Dell Precision 5510 | |
| MSI GE62-6QD16H11 | |
| Cinebench R10 | |
| Rendering Multiple CPUs 64Bit (değere göre sırala) | |
| Lenovo ThinkPad P70 | |
| Dell Precision 7710 | |
| HP ZBook 17 G2 J8Z55ET | |
| Bullman E-Klasse 5 | |
| Dell Precision 5510 | |
| MSI GE62-6QD16H11 | |
| Rendering Single CPUs 64Bit (değere göre sırala) | |
| Lenovo ThinkPad P70 | |
| Dell Precision 7710 | |
| HP ZBook 17 G2 J8Z55ET | |
| Bullman E-Klasse 5 | |
| Dell Precision 5510 | |
| MSI GE62-6QD16H11 | |
| PCMark 7 Score | 5003 puan | |
| PCMark 8 Home Score Accelerated v2 | 3345 puan | |
| PCMark 8 Work Score Accelerated v2 | 4411 puan | |
Yardım | ||
| PCMark 7 - Score (değere göre sırala) | |
| Lenovo ThinkPad P70 | |
| Dell Precision 7710 | |
| HP ZBook 17 G2 J8Z55ET | |
| Bullman E-Klasse 5 | |
| Dell Precision 5510 | |
| MSI GE62-6QD16H11 | |
| PCMark 8 | |
| Home Score Accelerated v2 (değere göre sırala) | |
| Lenovo ThinkPad P70 | |
| Dell Precision 7710 | |
| HP ZBook 17 G2 J8Z55ET | |
| MSI WT72-2OL32SR311BW | |
| Bullman E-Klasse 5 | |
| Dell Precision 5510 | |
| MSI GE62-6QD16H11 | |
| Work Score Accelerated v2 (değere göre sırala) | |
| Lenovo ThinkPad P70 | |
| Dell Precision 7710 | |
| HP ZBook 17 G2 J8Z55ET | |
| MSI WT72-2OL32SR311BW | |
| Bullman E-Klasse 5 | |
| Dell Precision 5510 | |
| MSI GE62-6QD16H11 | |

| LuxMark v2.0 64Bit | |
| Room GPUs-only (değere göre sırala) | |
| Lenovo ThinkPad P70 | |
| Dell Precision 7710 | |
| HP ZBook 17 G2 J8Z55ET | |
| MSI WT72-2OL32SR311BW | |
| Bullman E-Klasse 5 | |
| Dell Precision 5510 | |
| Schenker W706 | |
| Sala GPUs-only (değere göre sırala) | |
| Lenovo ThinkPad P70 | |
| Dell Precision 7710 | |
| HP ZBook 17 G2 J8Z55ET | |
| MSI WT72-2OL32SR311BW | |
| Bullman E-Klasse 5 | |
| Dell Precision 5510 | |
| Schenker W706 | |
| SiSoft Sandra 2016 | |
| Image Processing (değere göre sırala) | |
| Lenovo ThinkPad P70 | |
| Dell Precision 7710 | |
| Dell Precision 5510 | |
| Schenker W706 | |
| GP Cryptography (Higher Security AES256+SHA2-512) (değere göre sırala) | |
| Lenovo ThinkPad P70 | |
| Dell Precision 7710 | |
| Dell Precision 5510 | |
| Schenker W706 | |
| GP Financial Analysis (FP High/Double Precision) (değere göre sırala) | |
| Lenovo ThinkPad P70 | |
| Dell Precision 7710 | |
| Dell Precision 5510 | |
| Schenker W706 | |
| 3DMark 06 Standard Score | 26746 puan | |
| 3DMark Vantage P Result | 27405 puan | |
| 3DMark 11 Performance | 8493 puan | |
| 3DMark Ice Storm Standard Score | 42156 puan | |
| 3DMark Cloud Gate Standard Score | 19732 puan | |
| 3DMark Fire Strike Score | 5835 puan | |
Yardım | ||
| Unigine Heaven 3.0 | |
| 1920x1080 OpenGL, Normal Tessellation, High Shaders AA:Off AF:Off (değere göre sırala) | |
| Lenovo ThinkPad P70 | |
| Dell Precision 7710 | |
| HP ZBook 17 G2 J8Z55ET | |
| Bullman E-Klasse 5 | |
| Schenker W706 | |
| 1920x1080 DX 11, Normal Tessellation, High Shaders AA:Off AF:Off (değere göre sırala) | |
| Lenovo ThinkPad P70 | |
| Dell Precision 7710 | |
| HP ZBook 17 G2 J8Z55ET | |
| Bullman E-Klasse 5 | |
| Schenker W706 | |
| Unigine Valley 1.0 | |
| 1920x1080 Extreme HD DirectX AA:x8 (değere göre sırala) | |
| Lenovo ThinkPad P70 | |
| Dell Precision 7710 | |
| Schenker W706 | |
| 1920x1080 Extreme HD Preset OpenGL AA:x8 (değere göre sırala) | |
| Lenovo ThinkPad P70 | |
| Dell Precision 7710 | |
| Schenker W706 | |
| Tomb Raider | |
| 1366x768 High Preset AA:FX AF:8x (değere göre sırala) | |
| Lenovo ThinkPad P70 | |
| Dell Precision 7710 | |
| HP ZBook 17 G2 J8Z55ET | |
| Schenker W706 | |
| MSI GE72 965M Ti | |
| MSI GE62-2QEUi716H21BW | |
| 1920x1080 Ultra Preset AA:FX AF:16x (değere göre sırala) | |
| Lenovo ThinkPad P70 | |
| Dell Precision 7710 | |
| HP ZBook 17 G2 J8Z55ET | |
| Schenker W706 | |
| MSI GE72 965M Ti | |
| MSI GE62-2QEUi716H21BW | |
| BioShock Infinite | |
| 1366x768 High Preset (değere göre sırala) | |
| Lenovo ThinkPad P70 | |
| Dell Precision 7710 | |
| HP ZBook 17 G2 J8Z55ET | |
| Schenker W706 | |
| MSI GE72 965M Ti | |
| MSI GE62-2QEUi716H21BW | |
| 1920x1080 Ultra Preset, DX11 (DDOF) (değere göre sırala) | |
| Lenovo ThinkPad P70 | |
| Dell Precision 7710 | |
| HP ZBook 17 G2 J8Z55ET | |
| Schenker W706 | |
| MSI GE72 965M Ti | |
| MSI GE62-2QEUi716H21BW | |
| Just Cause 3 | |
| 1920x1080 High / On AA:FX AF:8x (değere göre sırala) | |
| Lenovo ThinkPad P70 | |
| MSI GE72 965M Ti | |
| 1920x1080 Very High / On AA:SM AF:16x (değere göre sırala) | |
| Lenovo ThinkPad P70 | |
| MSI GE72 965M Ti | |
| 3840x2160 High / On AA:FX AF:8x (değere göre sırala) | |
| Lenovo ThinkPad P70 | |
| Rainbow Six Siege | |
| 1920x1080 High Preset AA:T AF:4x (değere göre sırala) | |
| Lenovo ThinkPad P70 | |
| MSI GE72 965M Ti | |
| 1920x1080 Ultra Preset AA:T AF:16x (değere göre sırala) | |
| Lenovo ThinkPad P70 | |
| MSI GE72 965M Ti | |
| 3840x2160 High Preset AA:T AF:4x (değere göre sırala) | |
| Lenovo ThinkPad P70 | |
| Star Wars Battlefront | |
| 1920x1080 High Preset AA:FX (değere göre sırala) | |
| Lenovo ThinkPad P70 | |
| MSI GE72 965M Ti | |
| 1920x1080 Ultra Preset AA:FX (değere göre sırala) | |
| Lenovo ThinkPad P70 | |
| MSI GE72 965M Ti | |
| 3840x2160 High Preset AA:FX (değere göre sırala) | |
| Lenovo ThinkPad P70 | |
| MSI GE72 965M Ti | |
| The Witcher 3 | |
| 1920x1080 High Graphics & Postprocessing (Nvidia HairWorks Off) (değere göre sırala) | |
| Lenovo ThinkPad P70 | |
| Dell Precision 7710 | |
| Schenker W706 | |
| MSI GE72 965M Ti | |
| Schenker XMG P506 | |
| 1920x1080 Ultra Graphics & Postprocessing (HBAO+) (değere göre sırala) | |
| Lenovo ThinkPad P70 | |
| Dell Precision 7710 | |
| Schenker W706 | |
| MSI GE72 965M Ti | |
| Schenker XMG P506 | |
| 3840x2160 High Graphics & Postprocessing (Nvidia HairWorks Off) (değere göre sırala) | |
| Lenovo ThinkPad P70 | |
| Dirt Rally | |
| 1920x1080 High Preset (değere göre sırala) | |
| Lenovo ThinkPad P70 | |
| Dell Precision 7710 | |
| MSI WT72-2OL32SR311BW | |
| Bullman E-Klasse 5 | |
| Schenker W706 | |
| Schenker XMG P506 | |
| 1920x1080 Ultra Preset AA:4x MS (değere göre sırala) | |
| Lenovo ThinkPad P70 | |
| Dell Precision 7710 | |
| MSI WT72-2OL32SR311BW | |
| Bullman E-Klasse 5 | |
| Schenker W706 | |
| Schenker XMG P506 | |
| 3840x2160 High Preset (değere göre sırala) | |
| Lenovo ThinkPad P70 | |
| MSI WT72-2OL32SR311BW | |
| Bullman E-Klasse 5 | |
| GTA V | |
| 1920x1080 High/On (Advanced Graphics Off) AA:2xMSAA + FX AF:8x (değere göre sırala) | |
| Lenovo ThinkPad P70 | |
| 1920x1080 Highest AA:4xMSAA + FX AF:16x (değere göre sırala) | |
| Lenovo ThinkPad P70 | |
| 3840x2160 High/On (Advanced Graphics Off) AA:FX AF:8x (değere göre sırala) | |
| Lenovo ThinkPad P70 | |
| Thief | |
| 1366x768 High Preset AA:FXAA & Low SS AF:4x (değere göre sırala) | |
| Lenovo ThinkPad P70 | |
| Dell Precision 7710 | |
| HP ZBook 17 G2 J8Z55ET | |
| MSI WT72-2OL32SR311BW | |
| Bullman E-Klasse 5 | |
| Schenker W706 | |
| MSI GE72 965M Ti | |
| MSI GE62-2QEUi716H21BW | |
| 1920x1080 Very High Preset AA:FXAA & High SS AF:8x (değere göre sırala) | |
| Lenovo ThinkPad P70 | |
| Dell Precision 7710 | |
| HP ZBook 17 G2 J8Z55ET | |
| MSI WT72-2OL32SR311BW | |
| Bullman E-Klasse 5 | |
| Schenker W706 | |
| MSI GE72 965M Ti | |
| MSI GE62-2QEUi716H21BW | |
| Metro: Last Light | |
| 1366x768 High (DX11) AF:16x (değere göre sırala) | |
| Lenovo ThinkPad P70 | |
| Dell Precision 7710 | |
| HP ZBook 17 G2 J8Z55ET | |
| Schenker W706 | |
| MSI GE72 965M Ti | |
| 1920x1080 Very High (DX11) AF:16x (değere göre sırala) | |
| Lenovo ThinkPad P70 | |
| Dell Precision 7710 | |
| HP ZBook 17 G2 J8Z55ET | |
| Schenker W706 | |
| MSI GE72 965M Ti | |
| düşük | orta | yüksek | ultra | 4K | |
|---|---|---|---|---|---|
| Tomb Raider (2013) | 255.1 | 185 | 82.1 | ||
| BioShock Infinite (2013) | 176 | 163.8 | 69.7 | ||
| Metro: Last Light (2013) | 124.5 | 82.9 | 44.6 | ||
| Thief (2014) | 88.6 | 77.4 | 43.1 | ||
| GTA V (2015) | 136.1 | 69.1 | 29.7 | 35.3 | |
| Dirt Rally (2015) | 108.6 | 89.6 | 53.6 | 39.2 | |
| The Witcher 3 (2015) | 73.1 | 40.9 | 22.1 | 14.1 | |
| Star Wars Battlefront (2015) | 124.5 | 59.4 | 50.9 | 17.8 | |
| Rainbow Six Siege (2015) | 146.8 | 76.8 | 54.5 | 23.8 | |
| Just Cause 3 (2015) | 85.6 | 50.4 | 43.7 | 17.8 |
Ses yüksekliği
| Boşta |
| 30 / 30 / 30 dB |
| Çalışırken |
| 36.5 / 40.8 dB |
 | ||
30 dB sessiz 40 dB(A) duyulabilirlik 50 dB(A) gürültülü |
||
min: | ||
(+) Üst taraftaki maksimum sıcaklık, 38.2 °C / 101 F ortalamasına kıyasla 39 °C / 102 F'dir. , Workstation sınıfı için 22.2 ile 69.8 °C arasında değişir.
(+) Alt kısım, 41.1 °C / 106 F ortalamasına kıyasla maksimum 35.4 °C / 96 F'ye kadar ısınır
(+) Boşta kullanımda, üst tarafın ortalama sıcaklığı 28.2 °C / 83 F olup, cihazın 32 °C / 90 F.
(+) Avuç içi dayanakları ve dokunmatik yüzey, maksimum 28.1 °C / 82.6 F ile cilt sıcaklığından daha soğuktur ve bu nedenle dokunulduğunda soğuktur.
(±) Benzer cihazların avuç içi dayanağı alanının ortalama sıcaklığı 27.8 °C / 82 F (-0.3 °C / -0.6 F) idi.
| Kapalı / Bekleme modu | |
| Boşta | |
| Çalışırken |
|
Key:
min: | |
Artılar
Eksiler
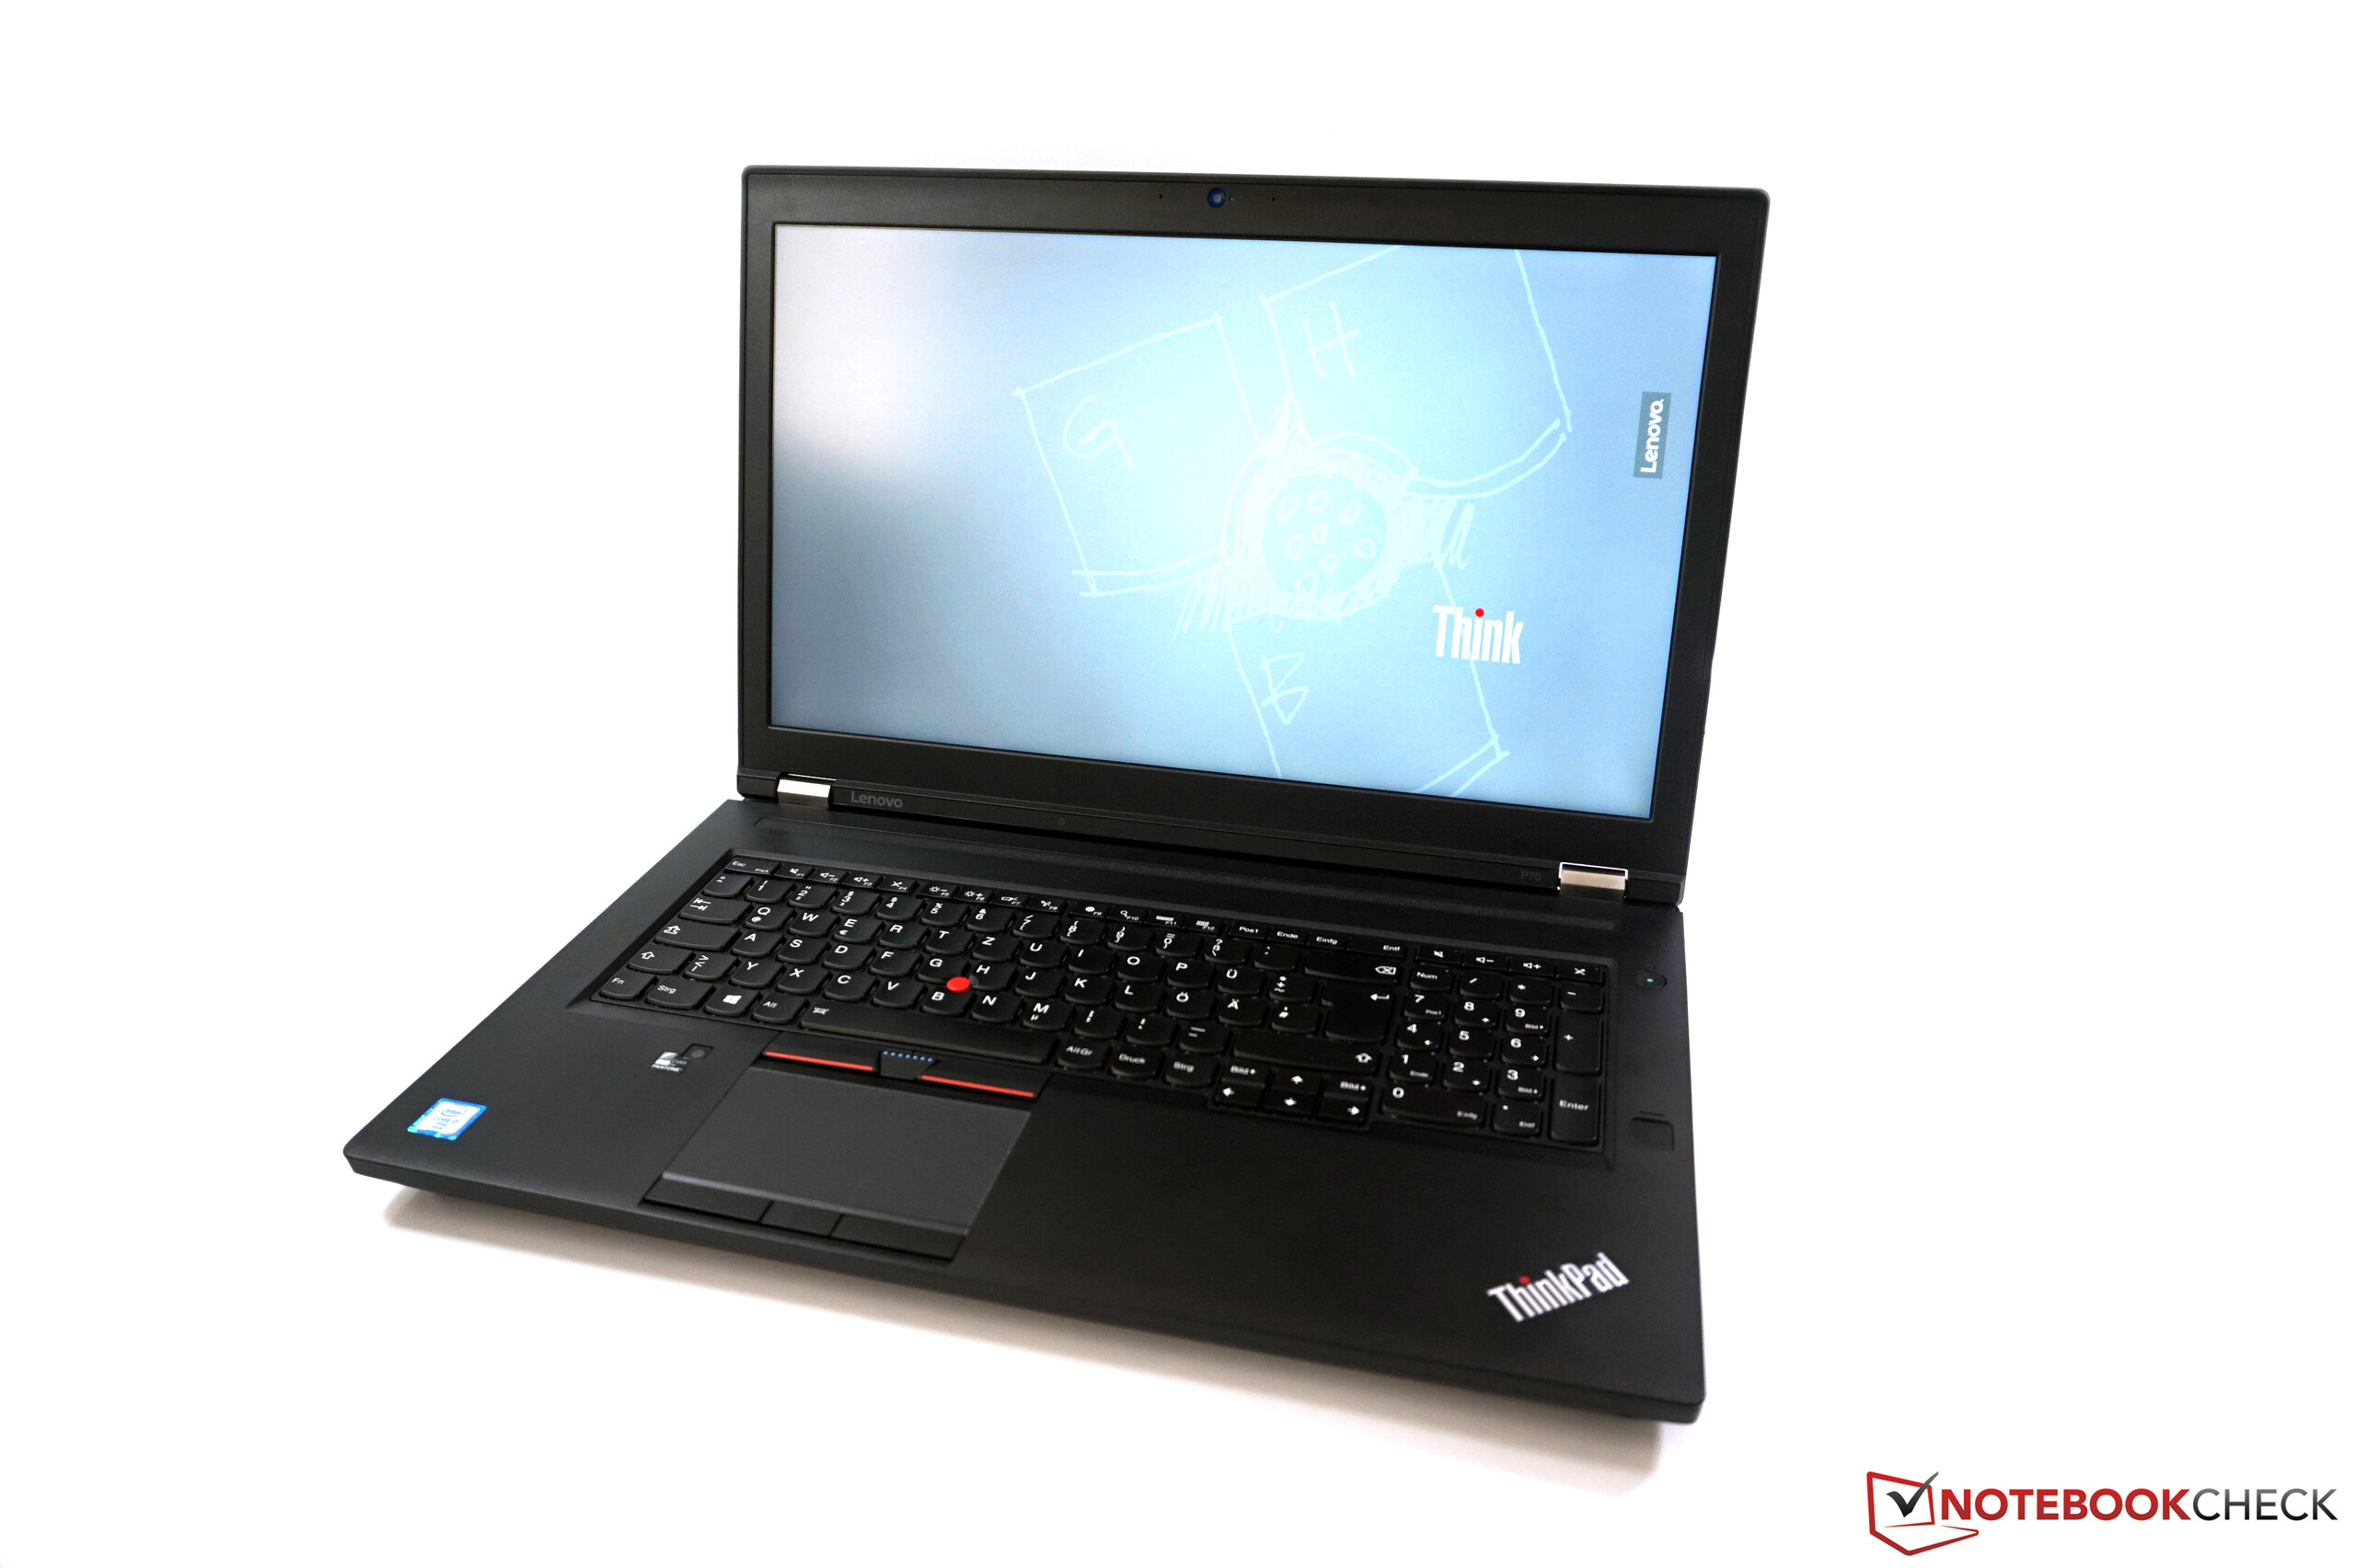
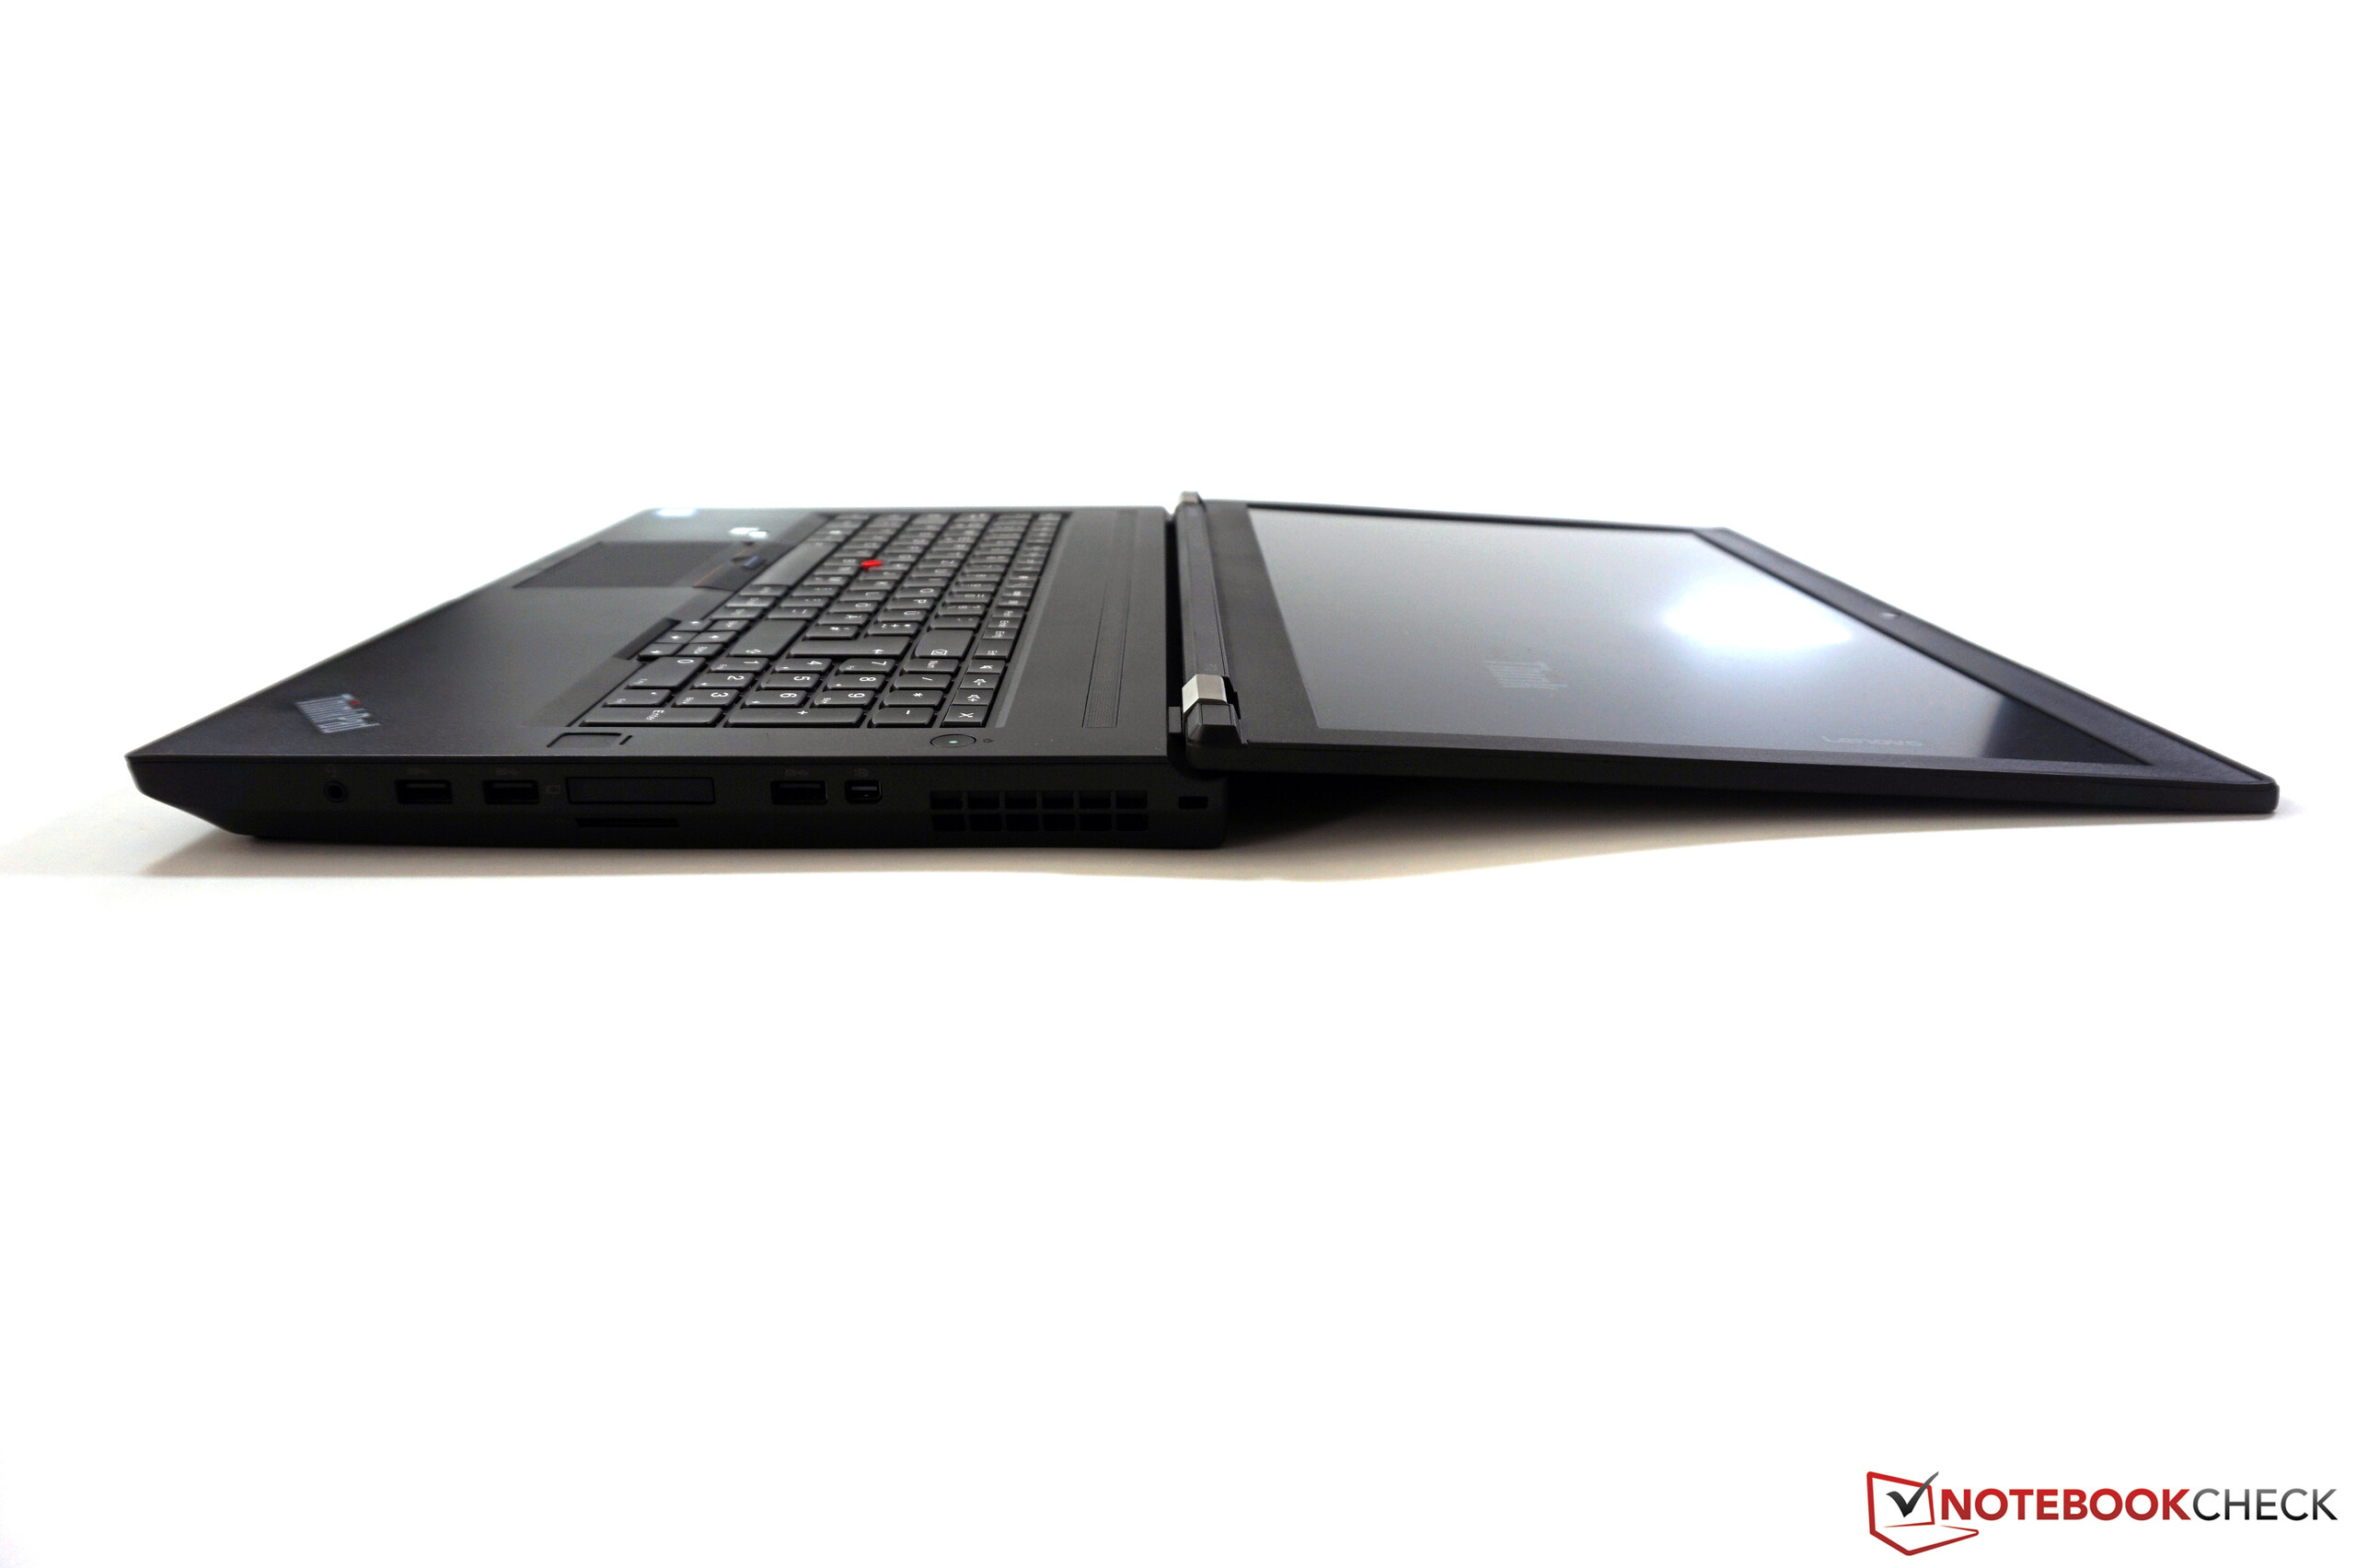
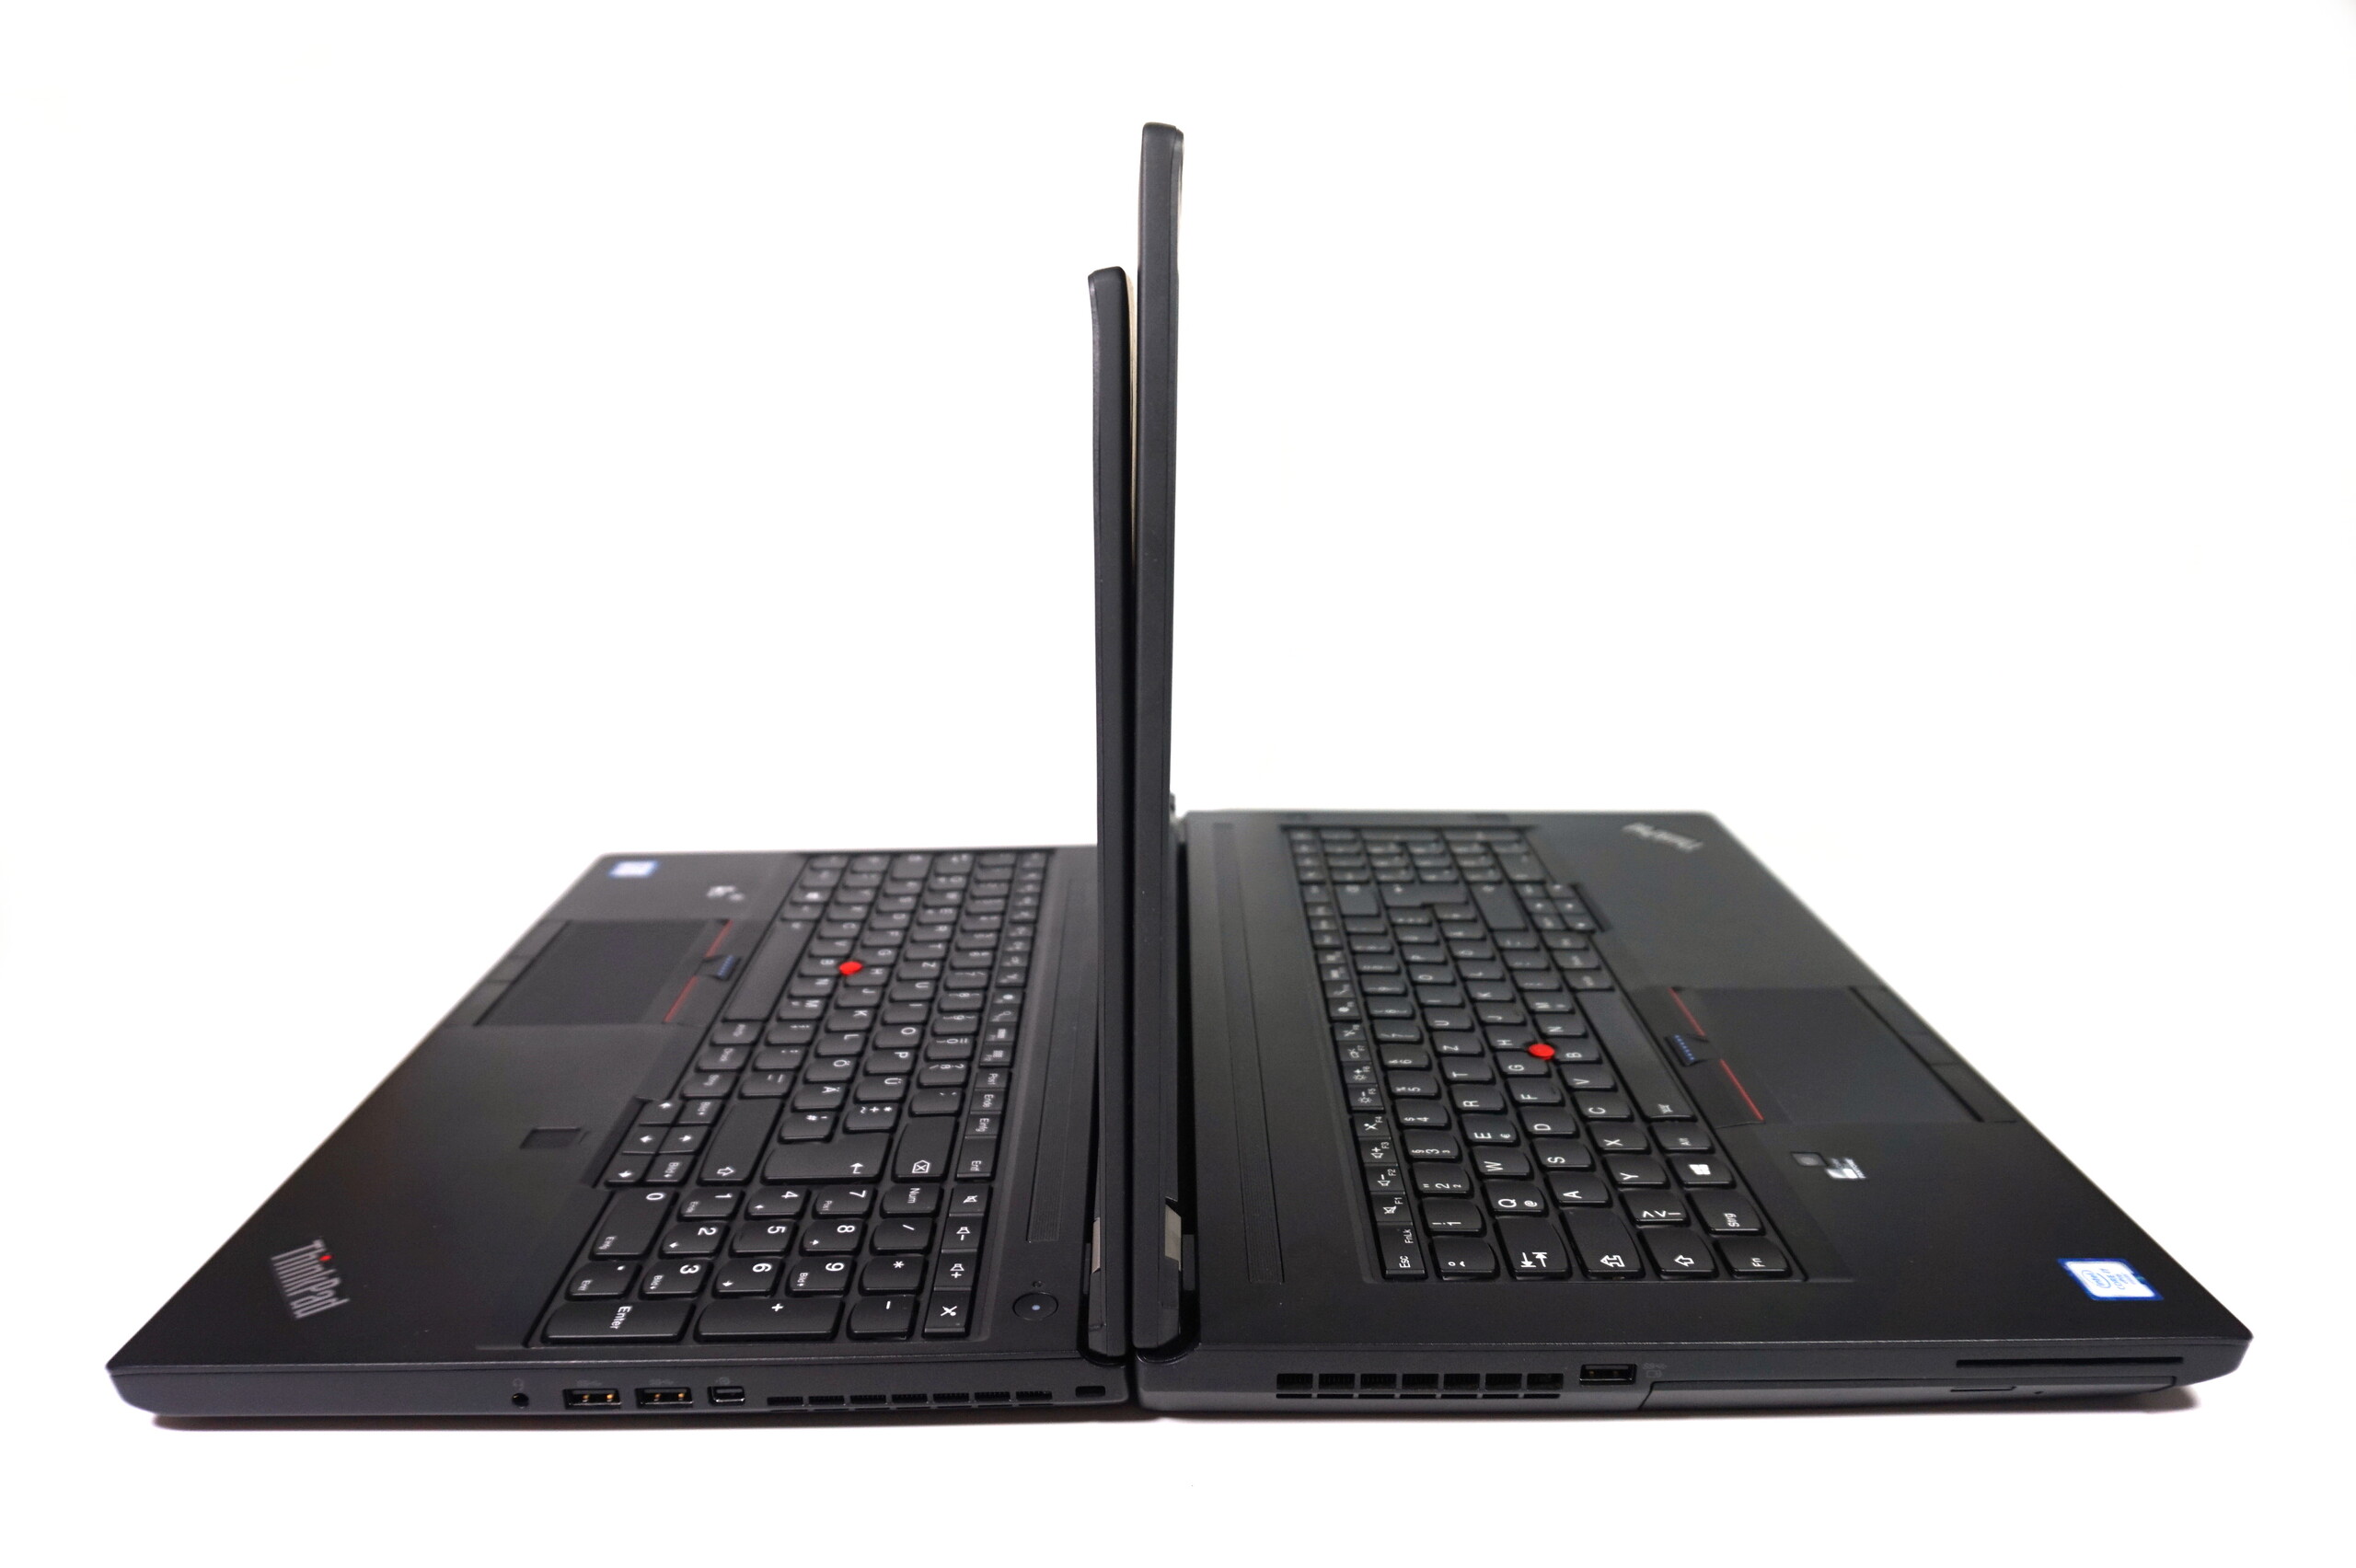
Lenovo'nun ThinkPad P70 modeli 17 inçlik çalışma istasyonu segmentine harika bir giriş. Lenovo'nun geri bildirimleri dikkate alıp bazı tasarım kararlarını gözden geçirmesi ve hatta geliştirmesi ise harika.
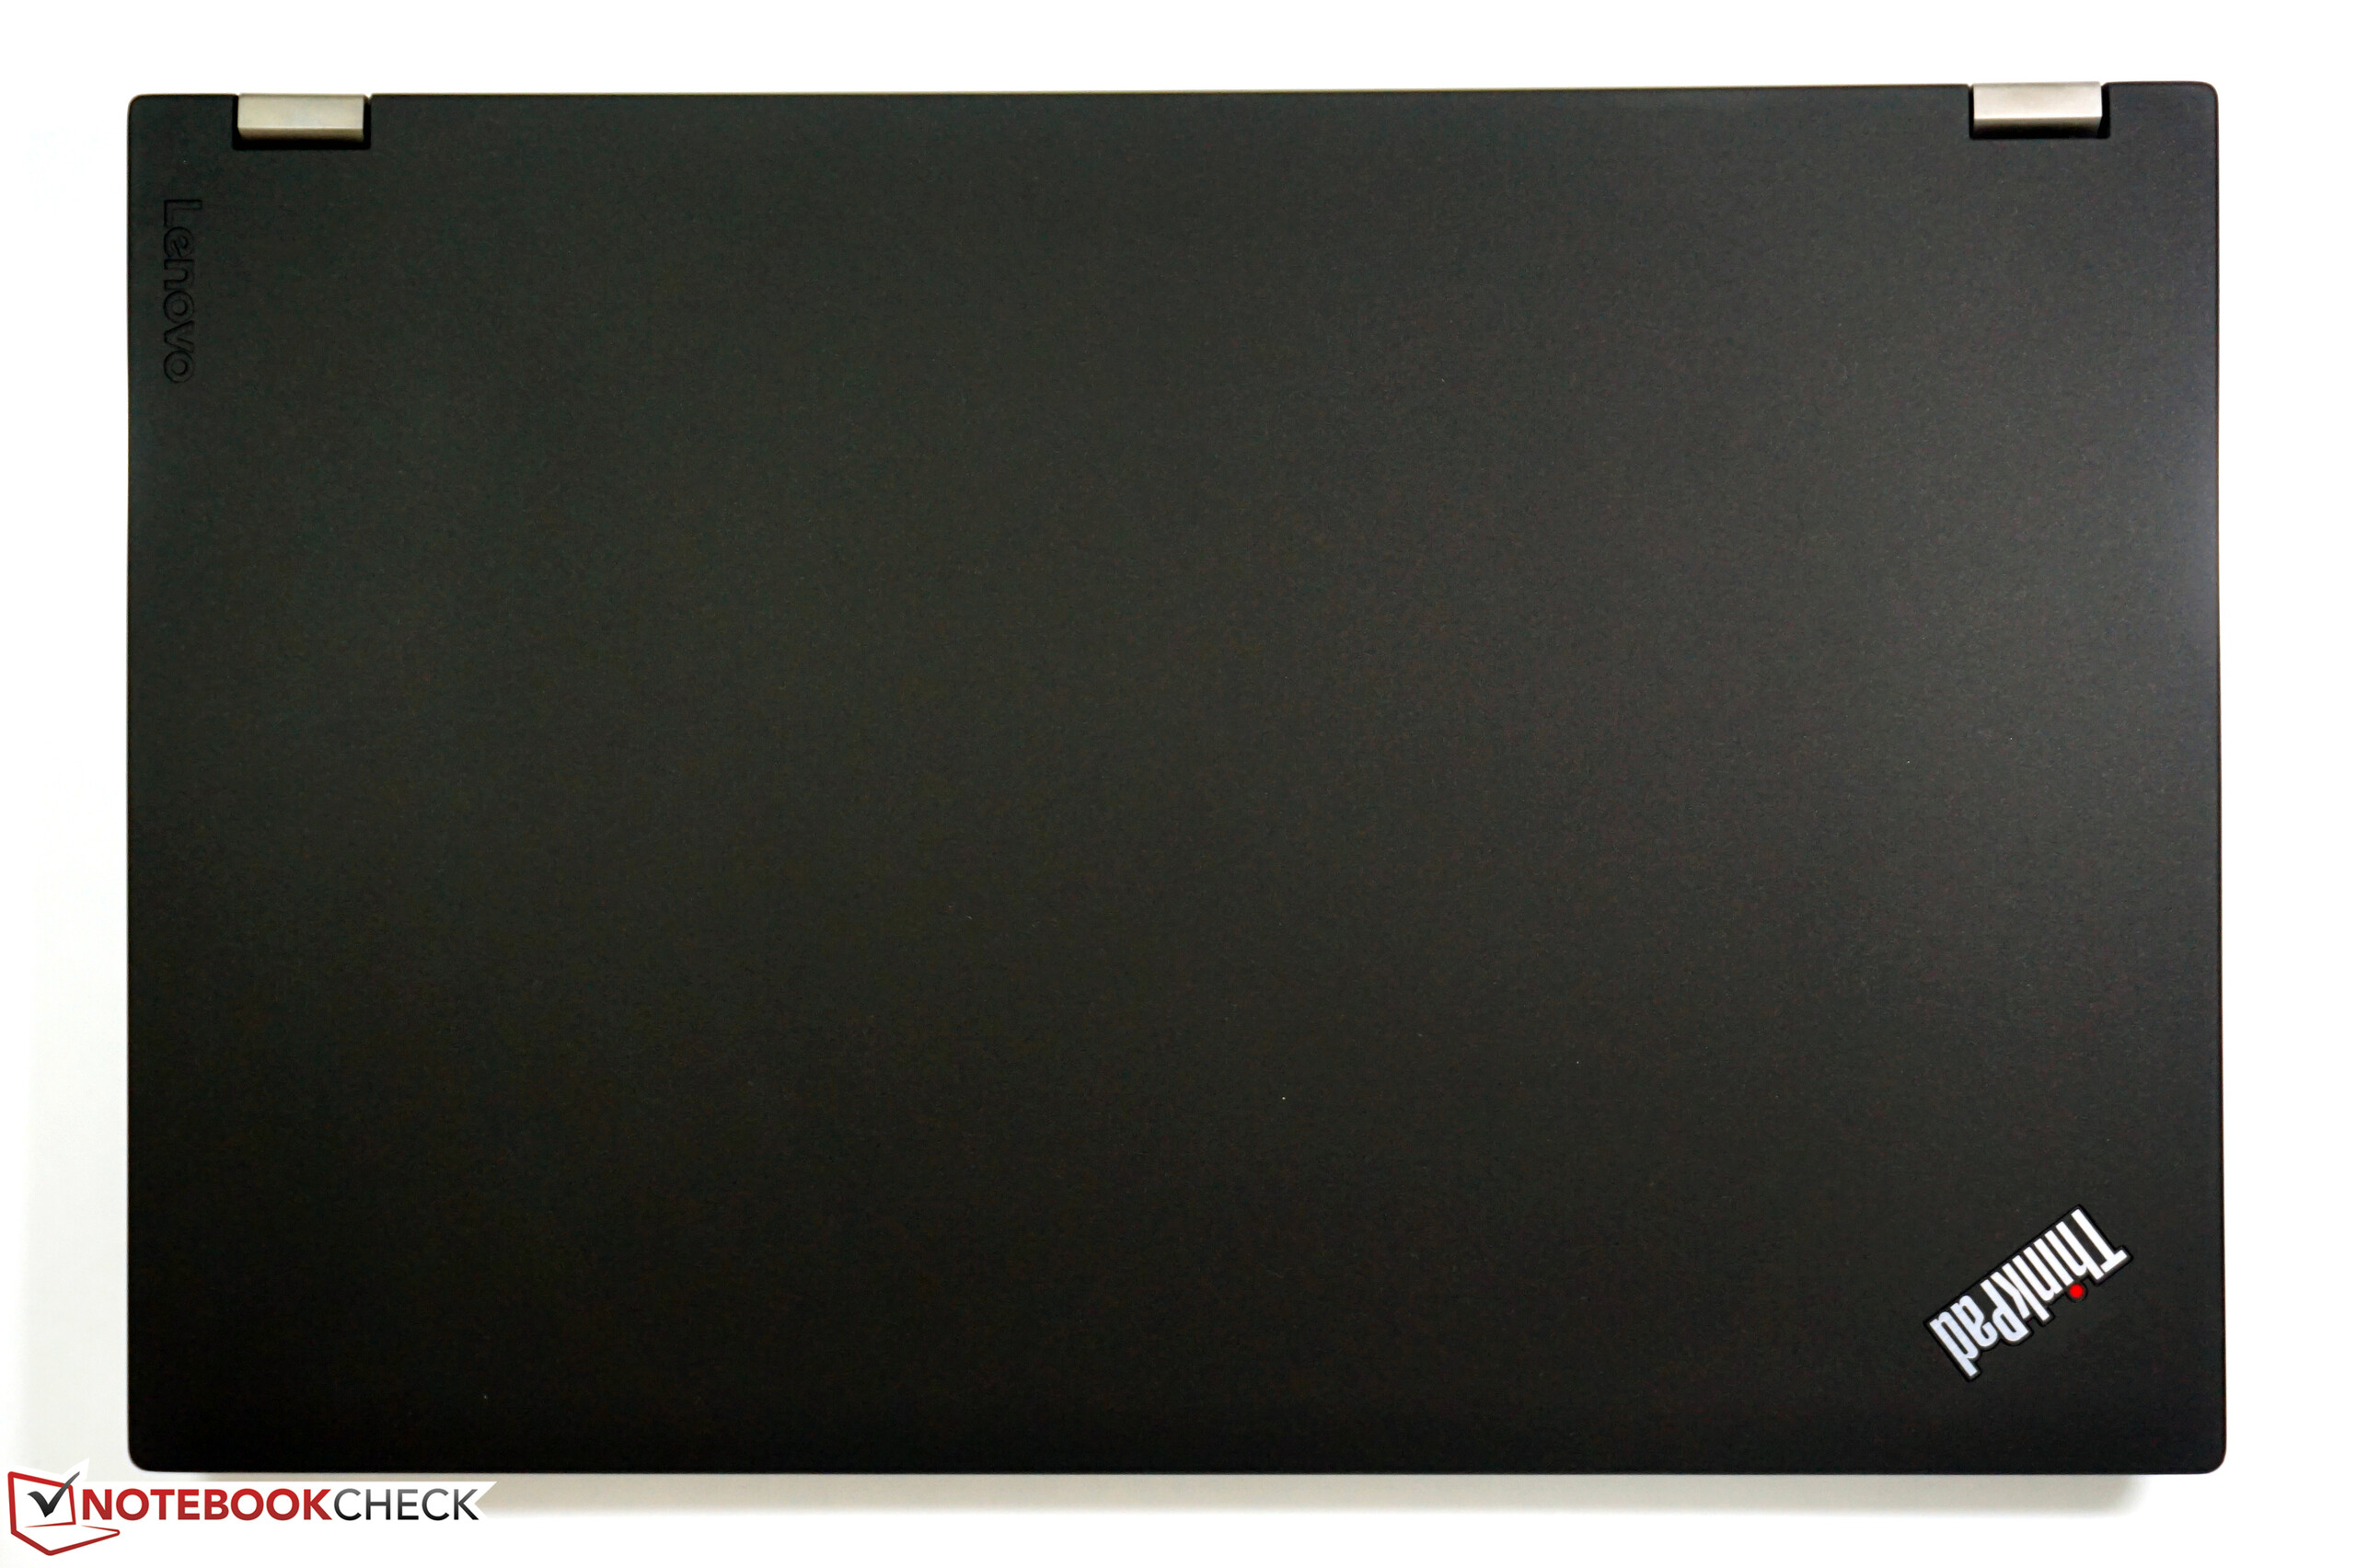
Cihazın kasası tekrar siyah ve harika bir yapım kalitesine sahip. Ekran kapağı ve menteşeler bazı açılarda sorun yaşayabiliyor, çünkü ekran oldukça ağır.
Cihazın en büyük özelliiği belki de performansı. Sessiz bir soğutma sistemi ile yoğun kullanımda bile tam performans almak mümkün. Sadece grafik kartı batarya kullanımında biraz performans kaybına uğruyor.
Bazı dezavantajlar yazdık ama bunlar Windows 7 yüklü cihazımız için çok büyük sorunlar değil. Ufak tefek sorunlar olmamasını beklemez olmazdı zaten. Belki en büyük sorun ekranın ışık kaybı. Bu fiyat aralığında bunun olmaması gerekirdi.
Eğer 4K ekran kullanacaksanız Windows 10 kullanmanızı tavsiye ederiz, çünkü Windows 7 ile ekran çözünürlüğü sorunları yaşamanız mümkün.
Yazının orjinali için tıklayın.
Lenovo ThinkPad P70
- 03/17/2016 v5 (old)
Andreas Osthoff
Price comparison
