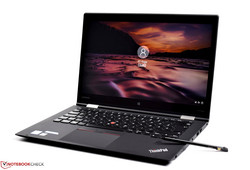
Kısa inceleme: Lenovo ThinkPad X1 Yoga 2017 (Core i7, OLED) dönüştürülebilir


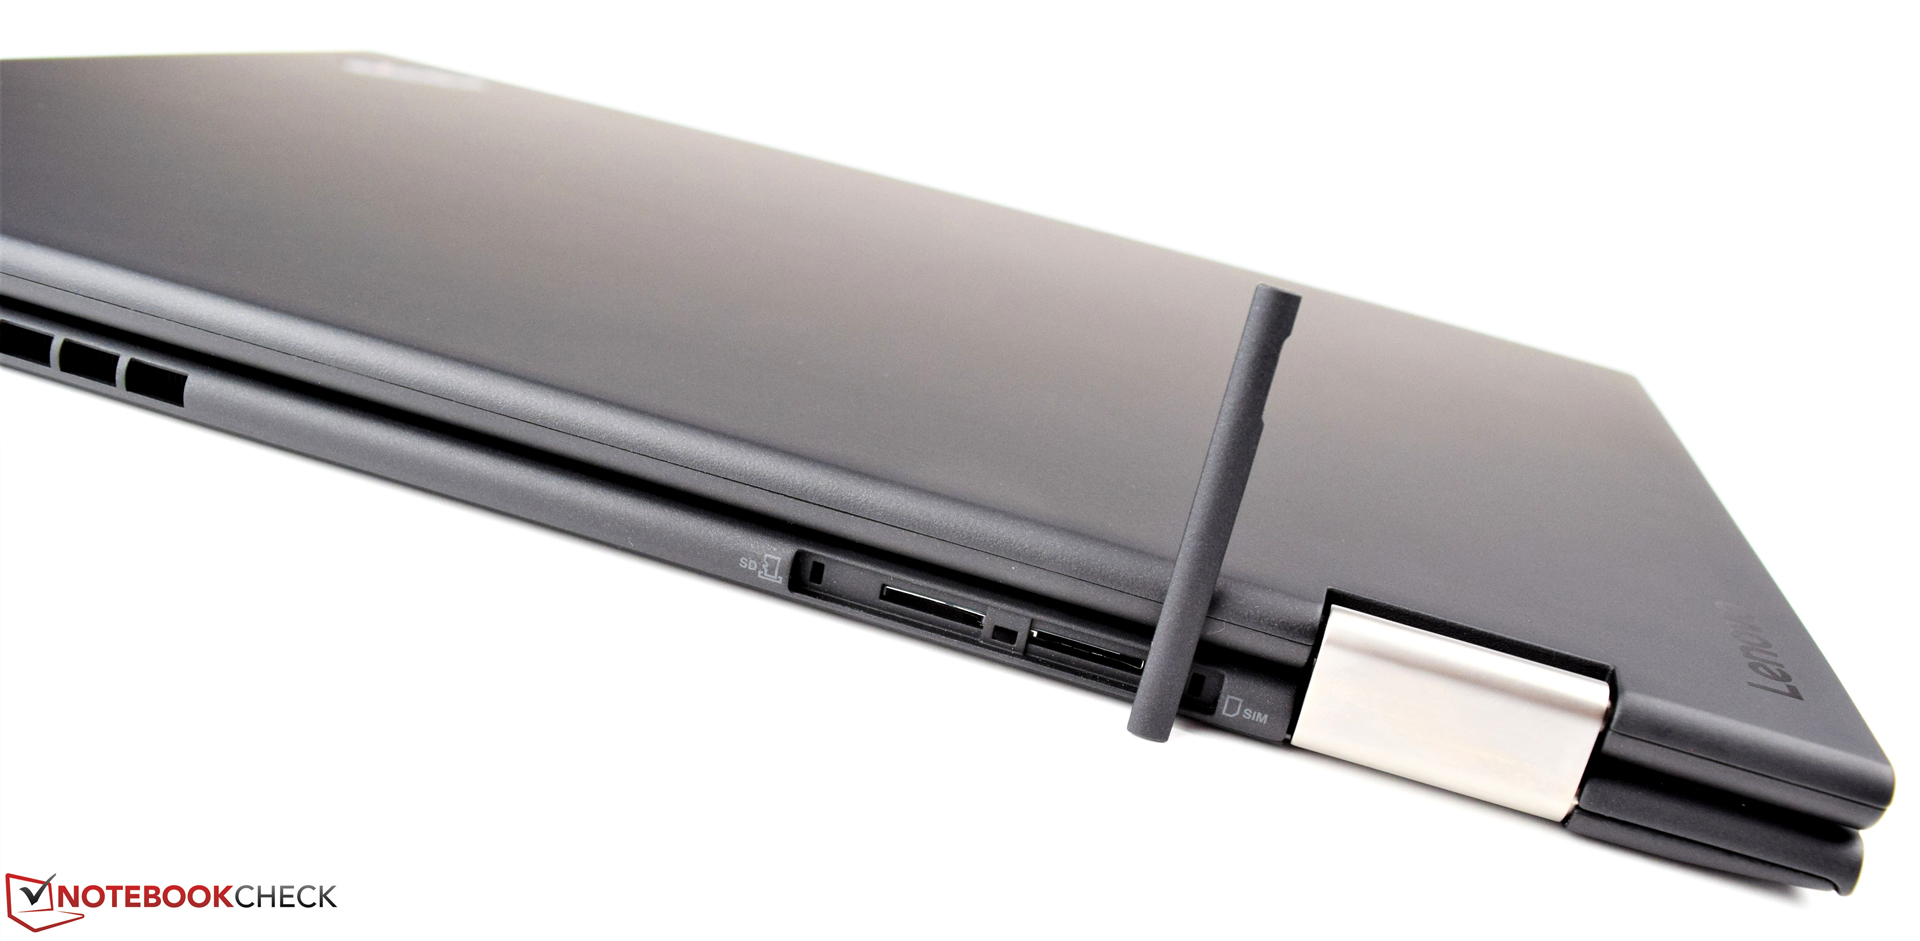
| SD Card Reader | |
| average JPG Copy Test (av. of 3 runs) | |
| Microsoft Surface Book with Performance Base | |
| Lenovo ThinkPad X1 Yoga 2017 20JES03T00 | |
| Dell Latitude 12 5285 2-in-1 | |
| maximum AS SSD Seq Read Test (1GB) | |
| Microsoft Surface Book with Performance Base | |
| Lenovo ThinkPad X1 Yoga 2017 20JES03T00 | |
| Dell Latitude 12 5285 2-in-1 | |
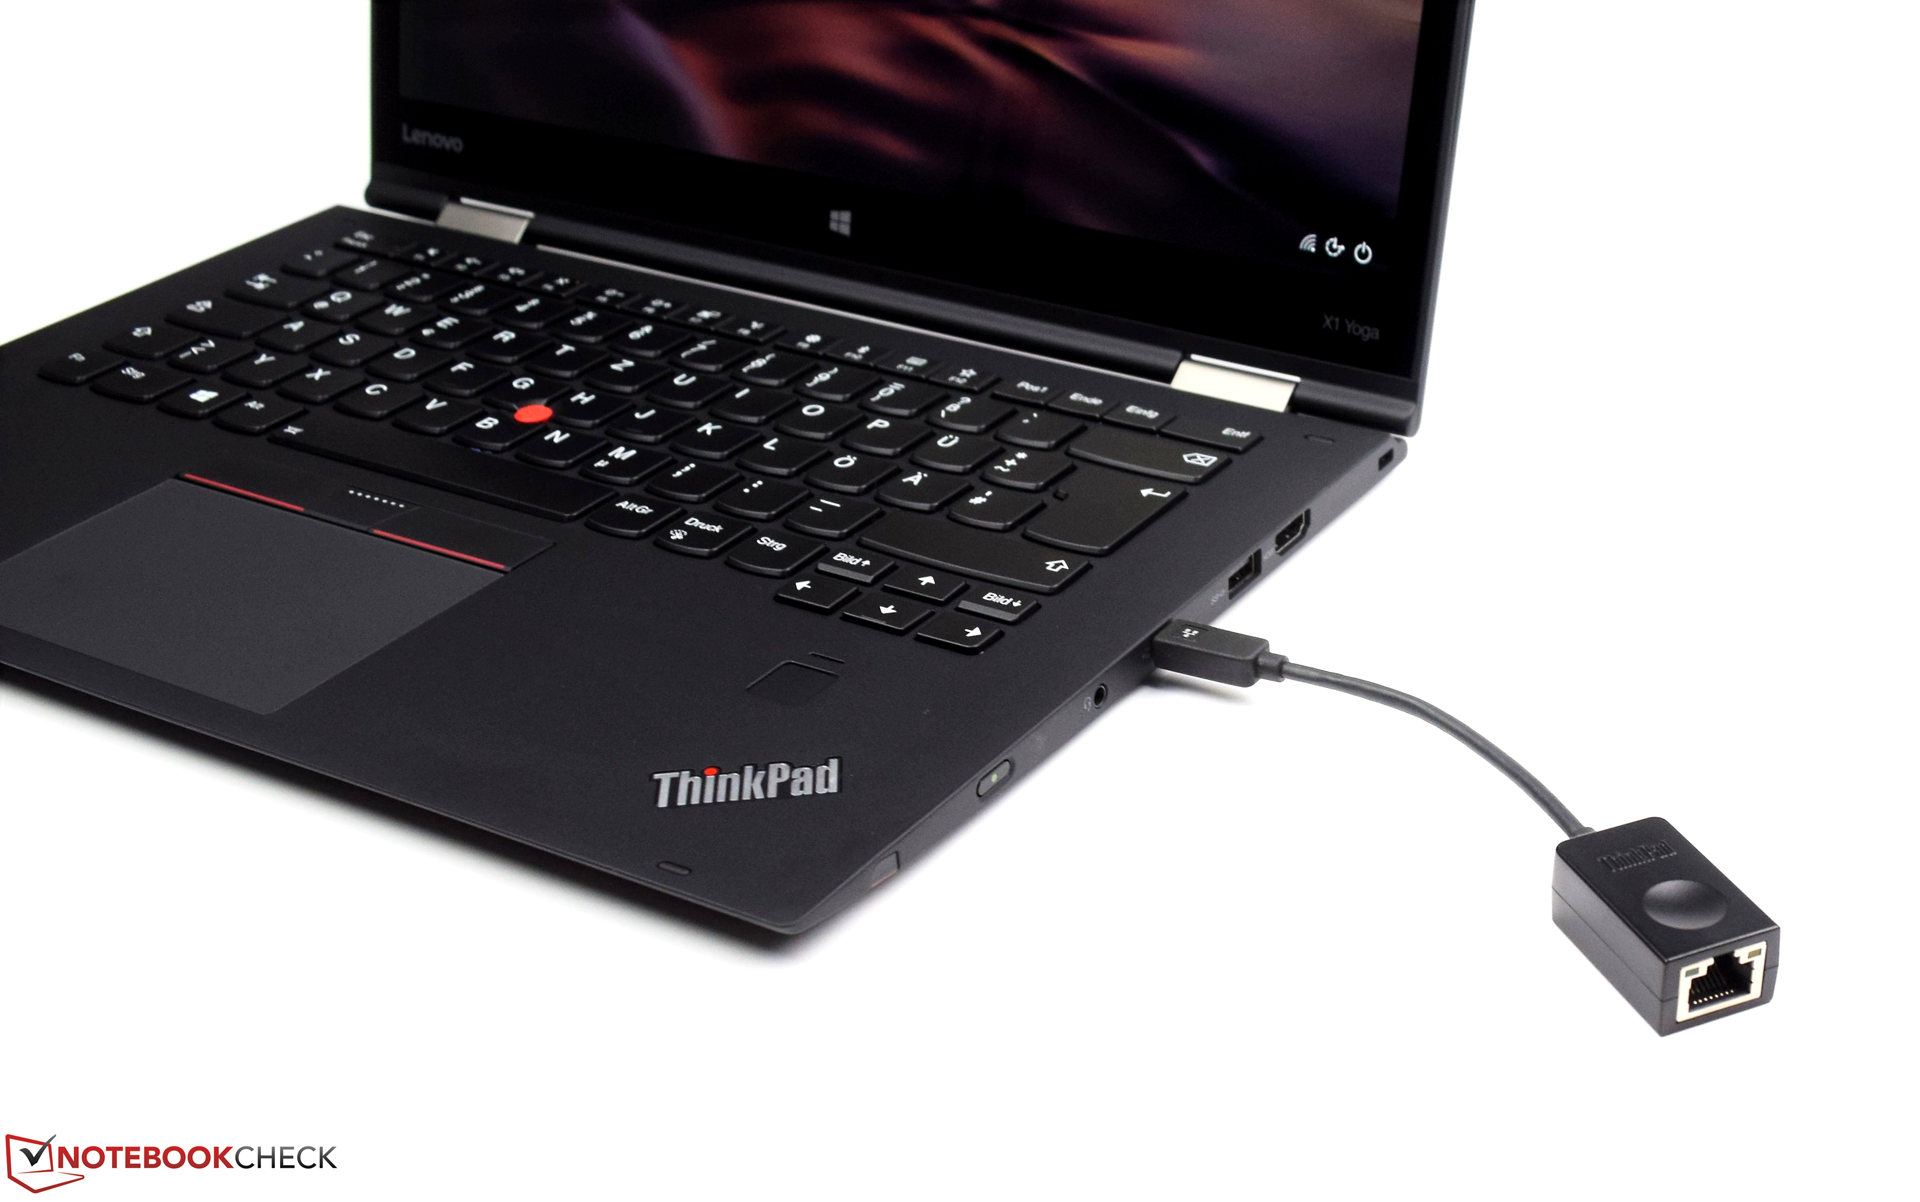
| Networking | |
| iperf3 transmit AX12 | |
| Toshiba Portege X20W-D-10R | |
| Microsoft Surface Book with Performance Base | |
| Lenovo ThinkPad X1 Yoga 2017 20JES03T00 | |
| HP EliteBook x360 1030 G2 | |
| Dell Latitude 12 5285 2-in-1 | |
| iperf3 receive AX12 | |
| Lenovo ThinkPad X1 Yoga 2017 20JES03T00 | |
| HP EliteBook x360 1030 G2 | |
| Microsoft Surface Book with Performance Base | |
| Toshiba Portege X20W-D-10R | |
| Dell Latitude 12 5285 2-in-1 | |
| |||||||||||||||||||||||||
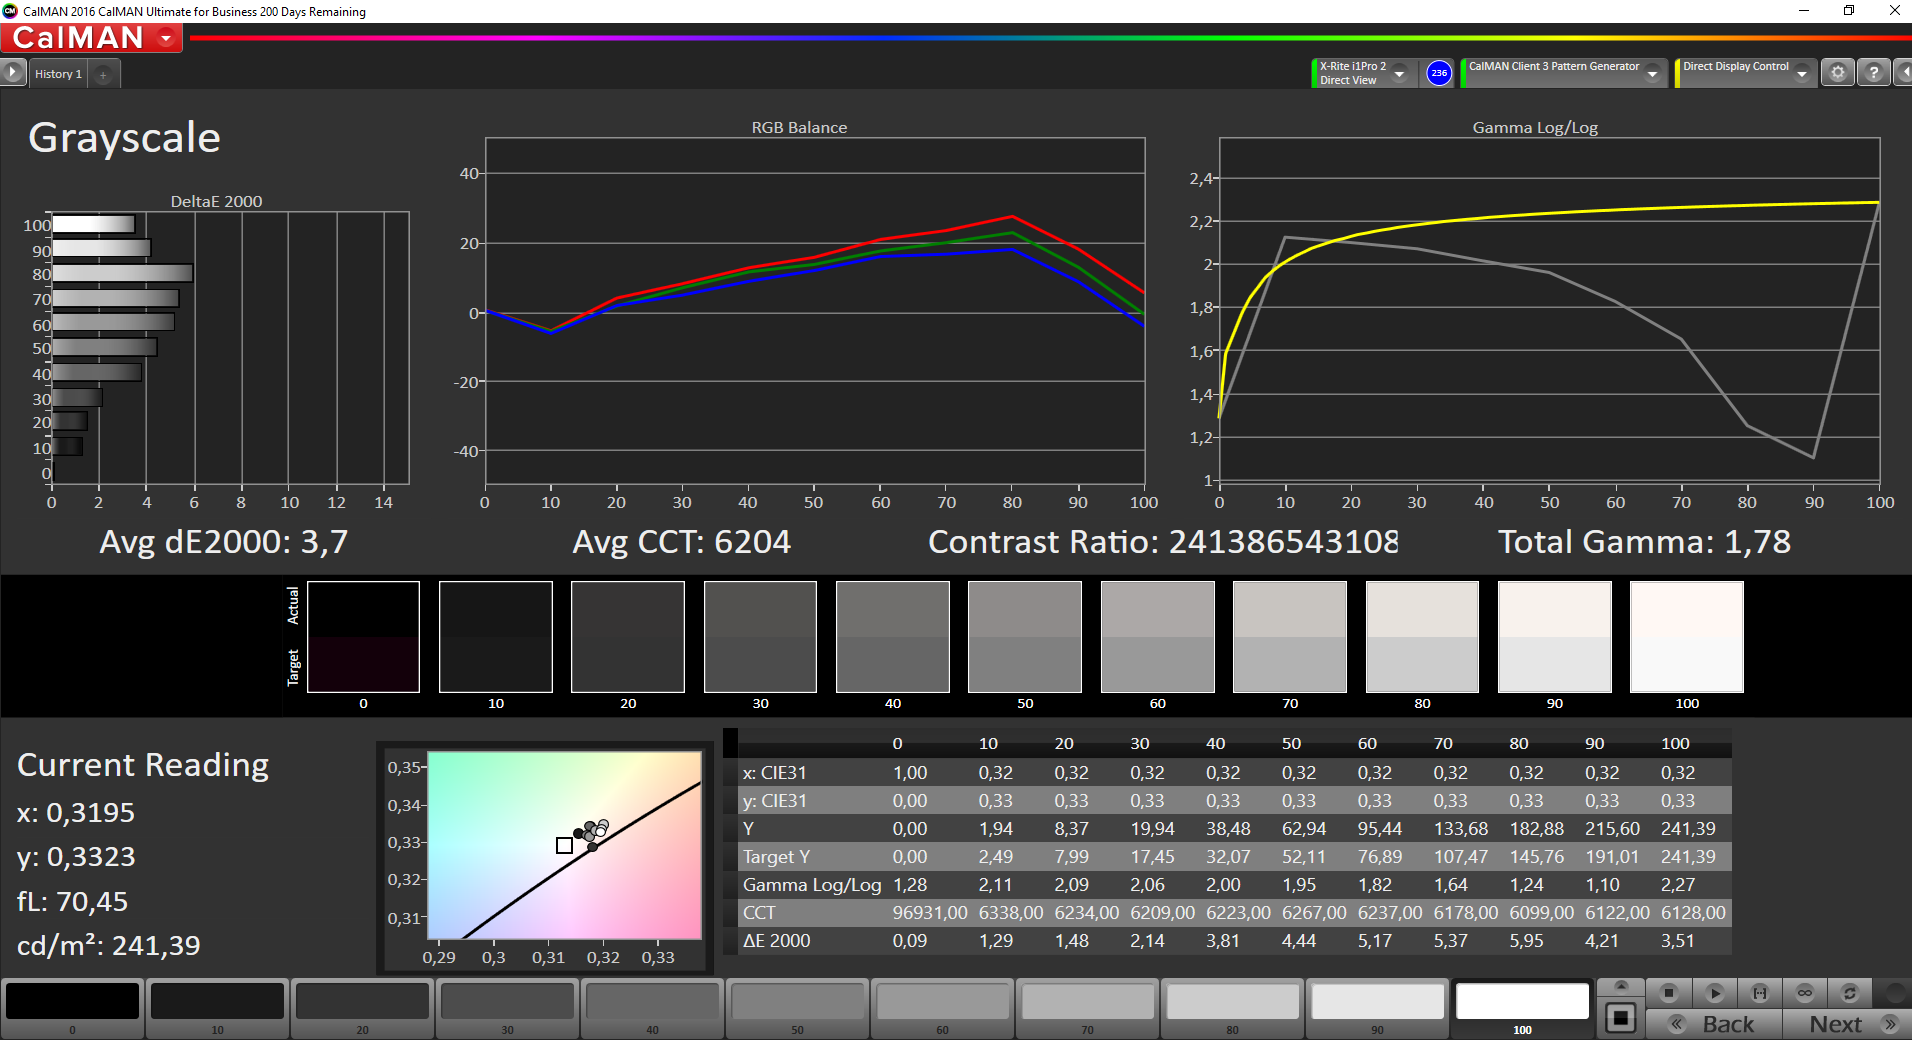
Aydınlatma: 95 %
Batarya modunda parlaklık: 242 cd/m²
Kontrast: ∞:1 (Siyah: 0 cd/m²)
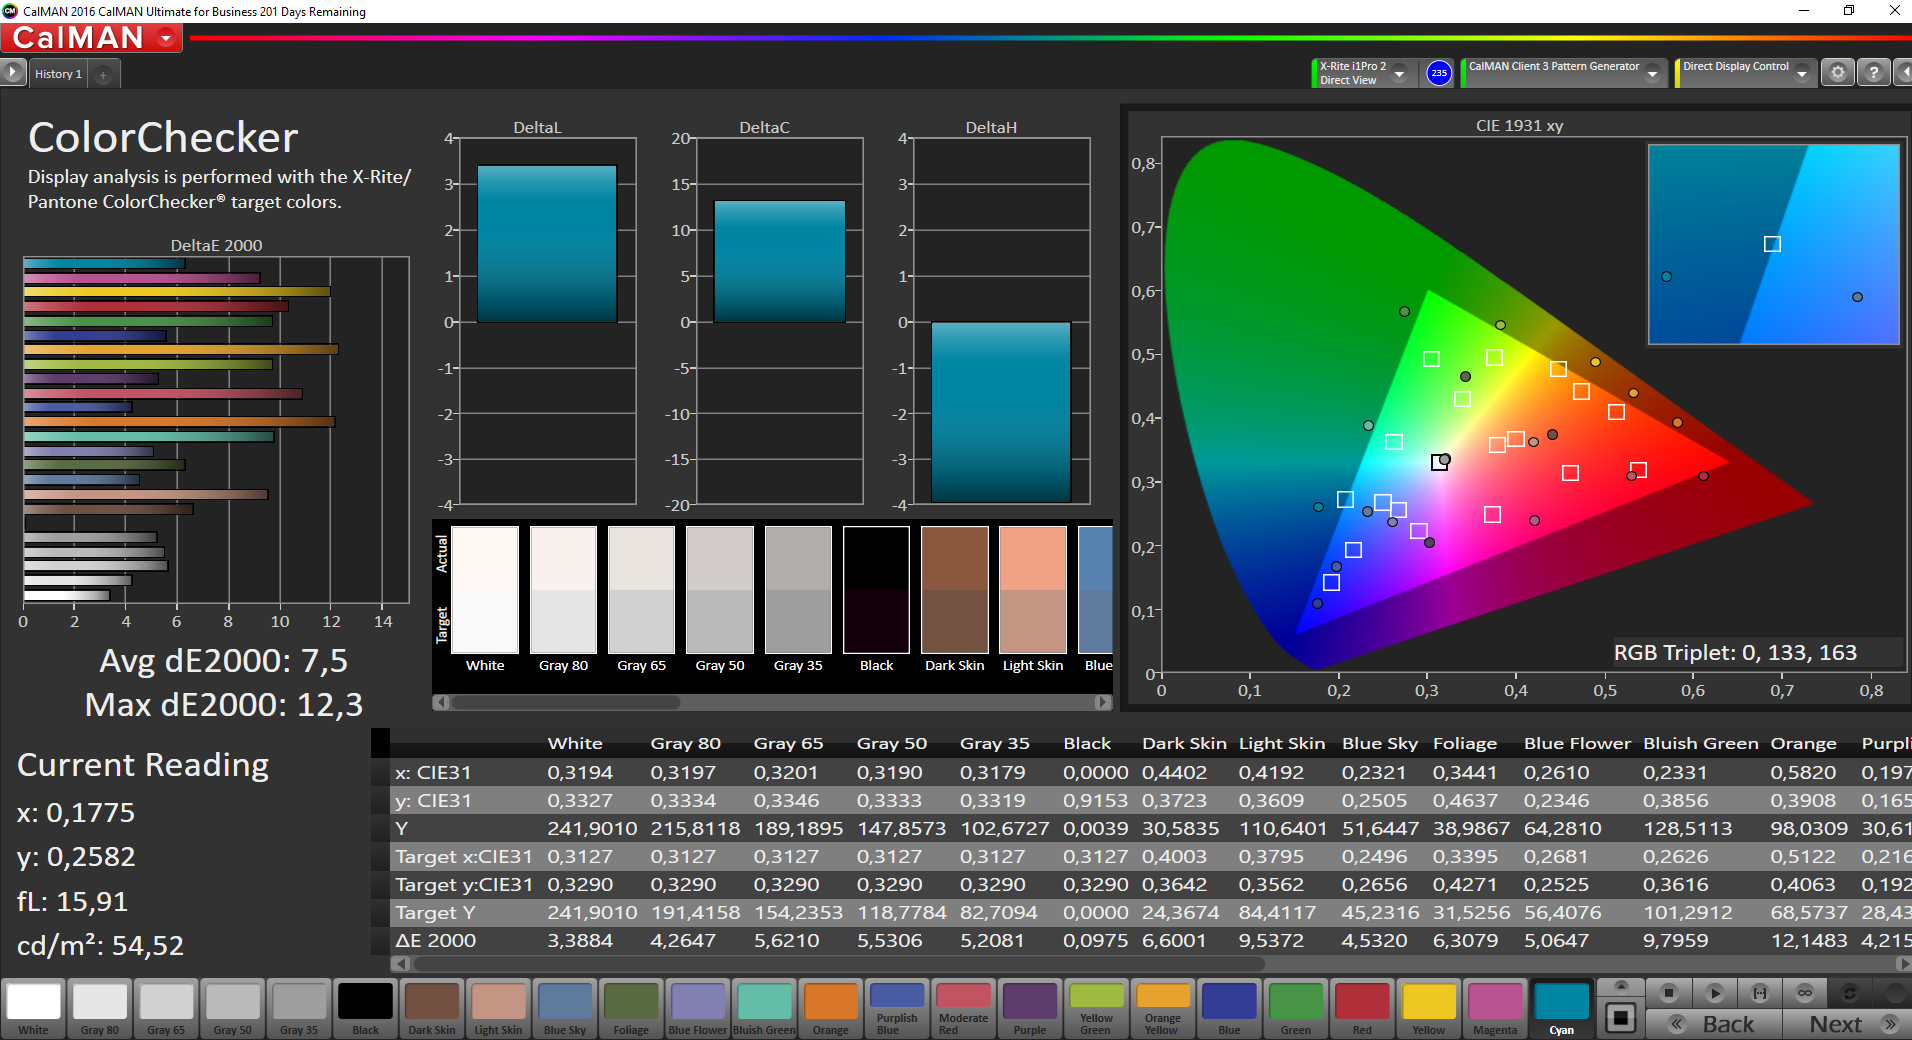
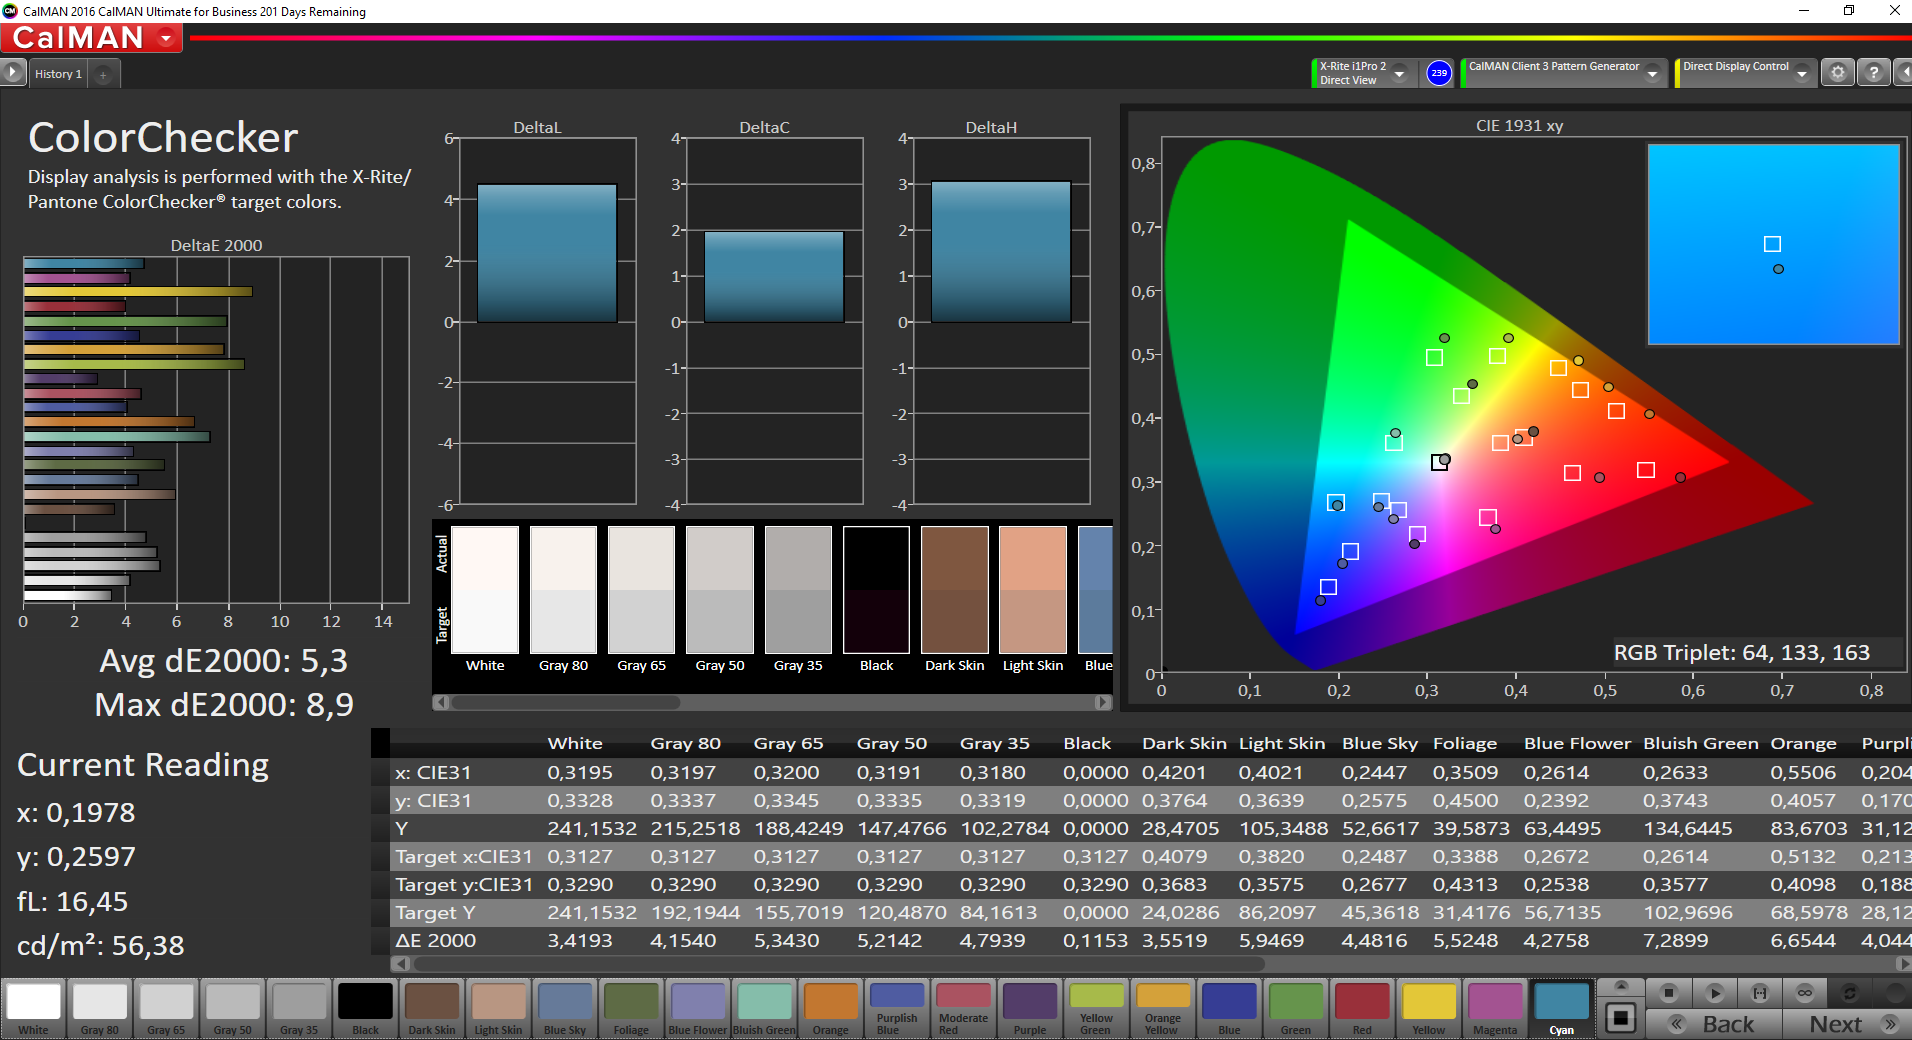
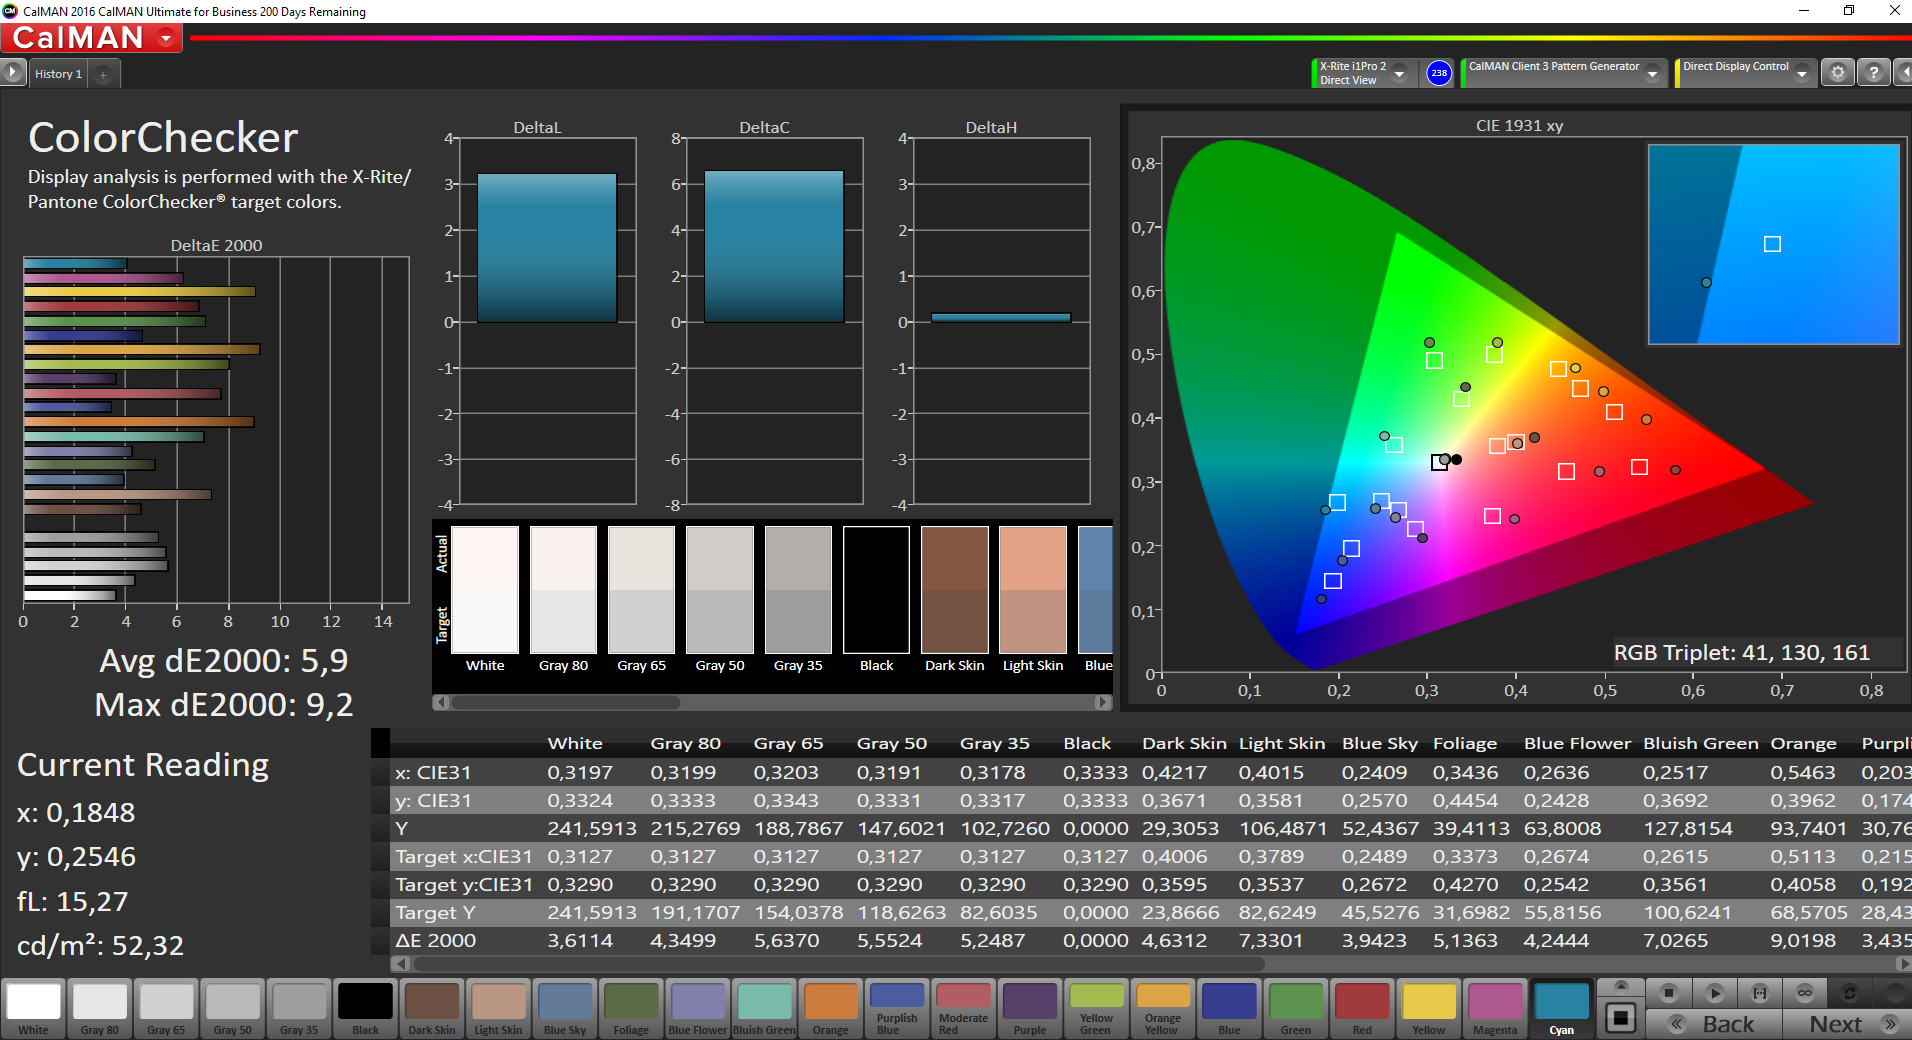
ΔE ColorChecker Calman: 5.3 | ∀{0.5-29.43 Ø4.71}
ΔE Greyscale Calman: 3.7 | ∀{0.09-98 Ø4.96}
100% sRGB (Argyll 1.6.3 3D)
84.8% AdobeRGB 1998 (Argyll 1.6.3 3D)
Gamma: 1.78
CCT: 6202 K
| Lenovo ThinkPad X1 Yoga 2017 20JES03T00 LEN4140, , 2560x1440, 14" | Lenovo ThinkPad X1 Yoga-20FRS1VS00 Samsung ATNA40JU01-0, , 2560x1440, 14" | HP EliteBook x360 1030 G2 CMN1374, , 1920x1080, 13.3" | Toshiba Portege X20W-D-10R Toshiba TOS508F, , 1920x1080, 12.5" | Dell Latitude 12 5285 2-in-1 BOE06DC, , 1920x1280, 12.3" | Microsoft Surface Book with Performance Base Panasonic MEI96A2, , 3000x2000, 13.5" | |
|---|---|---|---|---|---|---|
| Display | ||||||
| Display P3 Coverage (%) | 65.5 | 68.7 | 62.8 | 66.4 | ||
| sRGB Coverage (%) | 88.8 | 96.8 | 94 | 95.4 | ||
| AdobeRGB 1998 Coverage (%) | 64.9 | 70.4 | 64.7 | 67.6 | ||
| Response Times | 71% | -1092% | -1440% | -971% | -1325% | |
| Response Time Grey 50% / Grey 80% * (ms) | 3.6 ? | 1 ? 72% | 55.2 ? -1433% | 67 ? -1761% | 42.4 ? -1078% | 61 ? -1594% |
| Response Time Black / White * (ms) | 3.2 ? | 1 ? 69% | 27.2 ? -750% | 39 ? -1119% | 30.8 ? -863% | 37 ? -1056% |
| PWM Frequency (Hz) | 240.4 ? | 240 ? | 210.1 ? | |||
| Screen | 1% | -14% | -4% | 22% | 34% | |
| Brightness middle (cd/m²) | 243 | 279 15% | 262 8% | 442 82% | 523.2 115% | 459 89% |
| Brightness (cd/m²) | 240 | 277 15% | 256 7% | 410 71% | 522 117% | 423 76% |
| Brightness Distribution (%) | 95 | 91 -4% | 83 -13% | 86 -9% | 88 -7% | 86 -9% |
| Black Level * (cd/m²) | 0.25 | 0.22 | 0.42 | 0.37 | ||
| Colorchecker dE 2000 * | 5.3 | 5.15 3% | 5.13 3% | 5.22 2% | 4 25% | 2.28 57% |
| Colorchecker dE 2000 max. * | 8.9 | 8.28 7% | 9.46 -6% | 11.84 -33% | 8.6 3% | 3.61 59% |
| Greyscale dE 2000 * | 3.7 | 5.44 -47% | 6.23 -68% | 7.88 -113% | 5.5 -49% | 2.48 33% |
| Gamma | 1.78 124% | 2.28 96% | 2.45 90% | 2.51 88% | 2.16 102% | 2.5 88% |
| CCT | 6202 105% | 5686 114% | 6413 101% | 6756 96% | 7546 86% | 8602 76% |
| Color Space (Percent of AdobeRGB 1998) (%) | 84.8 | 98 16% | 57.84 -32% | 64 -25% | 64.86 -24% | 62 -27% |
| Color Space (Percent of sRGB) (%) | 100 | 100 0% | 88.57 -11% | 97 -3% | 93.97 -6% | 96 -4% |
| Contrast (:1) | 1048 | 2009 | 1246 | 1241 | ||
| Toplam Ortalama (Program / Ayarlar) | 36% /
15% | -553% /
-230% | -722% /
-291% | -475% /
-177% | -646% /
-238% |
* ... daha küçük daha iyidir


Yanıt Sürelerini Görüntüle
| ↔ Tepki Süresi Siyahtan Beyaza | ||
|---|---|---|
| 3.2 ms ... yükseliş ↗ ve sonbahar↘ birleşimi | ↗ 2 ms yükseliş | 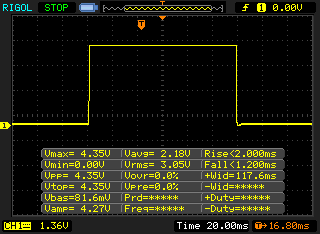 |
| ↘ 1.2 ms sonbahar | ||
| Ekran, testlerimizde çok hızlı yanıt oranları gösteriyor ve hızlı oyun oynamaya çok uygun olmalı. Karşılaştırıldığında, test edilen tüm cihazlar 0.1 (minimum) ile 240 (maksimum) ms arasında değişir. » Tüm cihazların 15 %'si daha iyi. Bu, ölçülen yanıt süresinin test edilen tüm cihazların ortalamasından (19.8 ms) daha iyi olduğu anlamına gelir. | ||
| ↔ Tepki Süresi %50 Griden %80 Griye | ||
| 3.6 ms ... yükseliş ↗ ve sonbahar↘ birleşimi | ↗ 1.6 ms yükseliş | 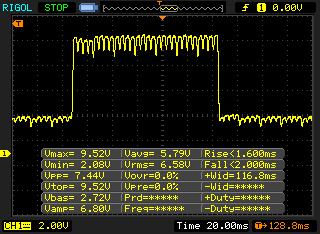 |
| ↘ 2 ms sonbahar | ||
| Ekran, testlerimizde çok hızlı yanıt oranları gösteriyor ve hızlı oyun oynamaya çok uygun olmalı. Karşılaştırıldığında, test edilen tüm cihazlar 0.165 (minimum) ile 636 (maksimum) ms arasında değişir. » Tüm cihazların 14 %'si daha iyi. Bu, ölçülen yanıt süresinin test edilen tüm cihazların ortalamasından (31 ms) daha iyi olduğu anlamına gelir. | ||
Ekran Titremesi / PWM (Darbe Genişliği Modülasyonu)
| Ekran titriyor / PWM algılandı | 240.4 Hz | ≤ 80 % parlaklık ayarı | 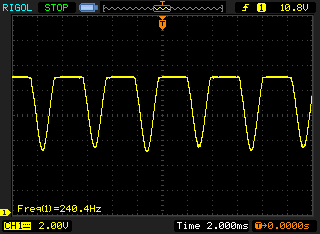 |
Ekran arka ışığı 240.4 Hz'de titriyor (en kötü durum, örneğin PWM kullanılması) 80 % ve altındaki parlaklık ayarında titreme algılandı. Bu parlaklık ayarının üzerinde titreme veya PWM olmamalıdır. 240.4 Hz frekansı nispeten düşüktür, bu nedenle hassas kullanıcılar belirtilen parlaklık ayarında ve altında muhtemelen titremeyi fark edecek ve göz yorgunluğu yaşayacaktır. Karşılaştırıldığında: Test edilen tüm cihazların %52 %'si ekranı karartmak için PWM kullanmıyor. PWM tespit edilirse, ortalama 7757 (minimum: 5 - maksimum: 343500) Hz ölçüldü. | |||
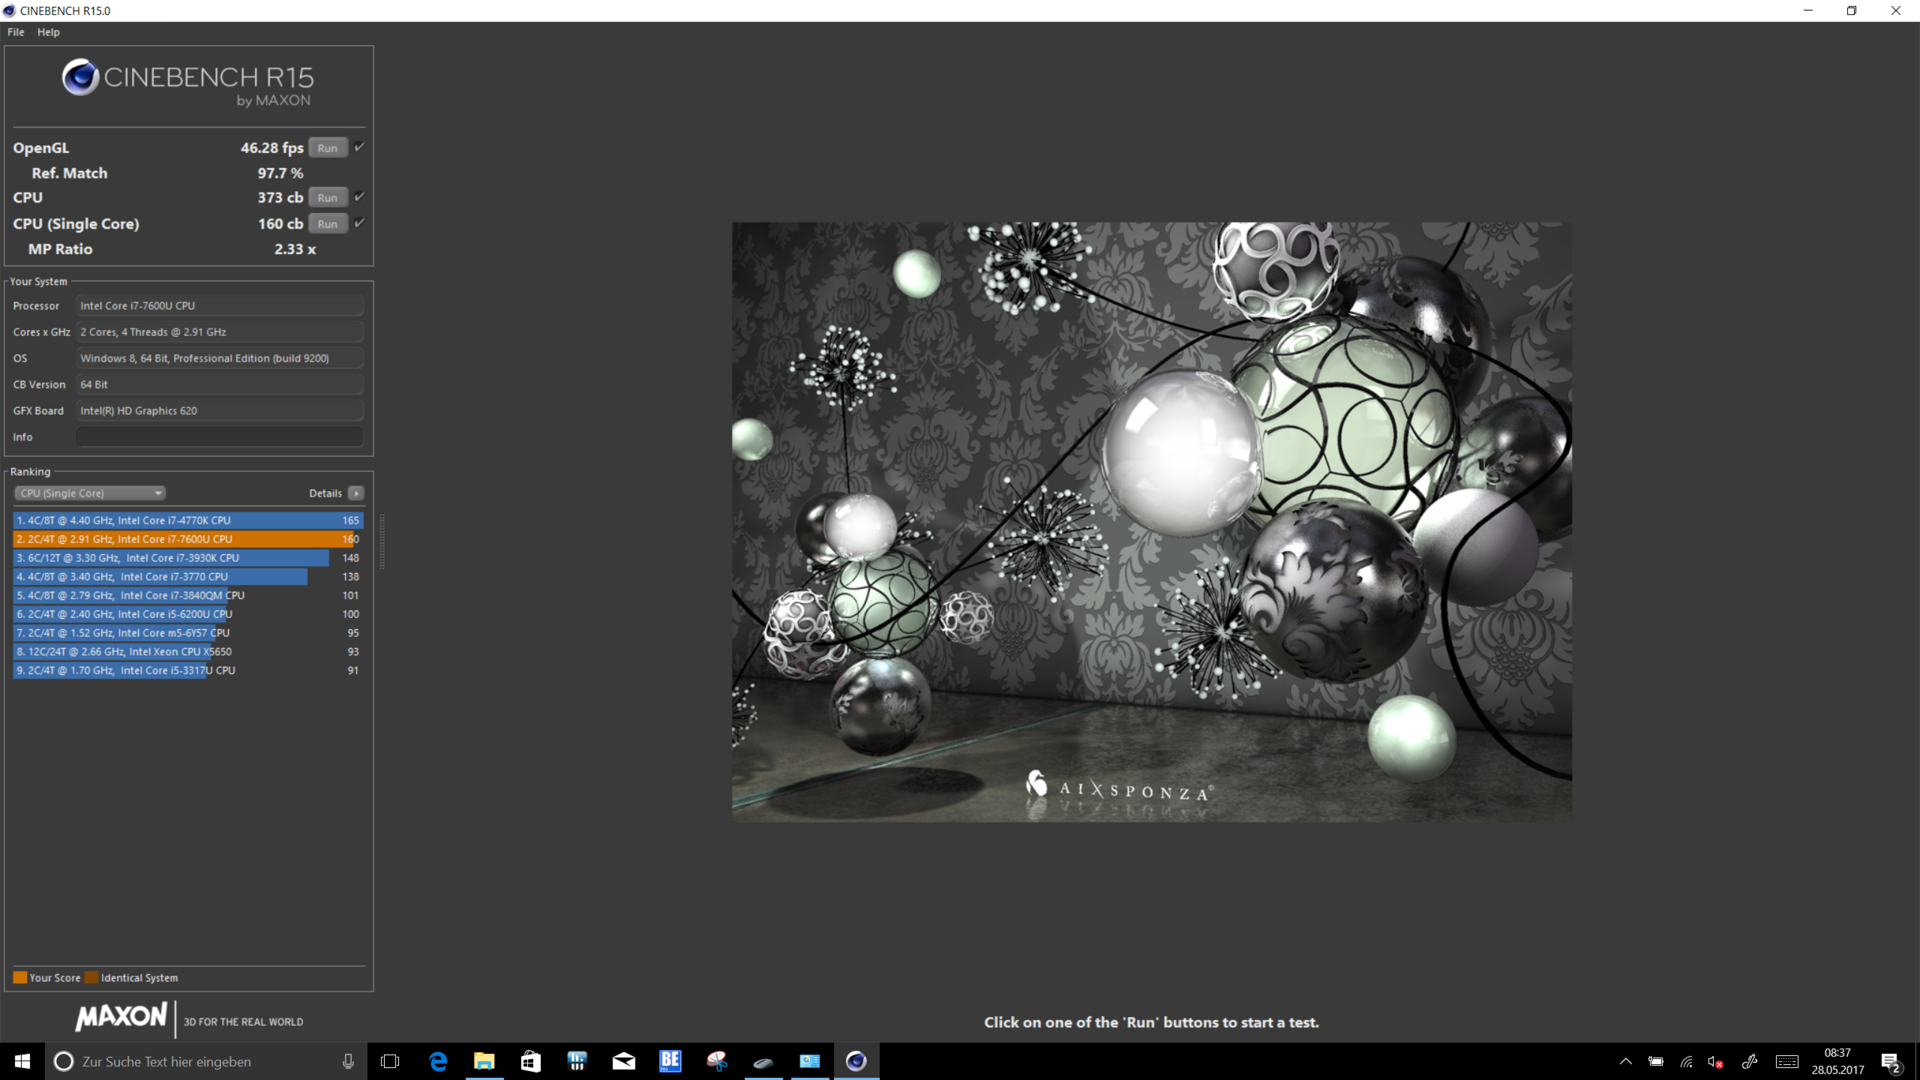
| Cinebench R15 | |
| CPU Single 64Bit | |
| Lenovo ThinkPad X1 Yoga 2017 20JES03T00 | |
| Toshiba Portege X20W-D-10R | |
| Dell Latitude 12 5285 2-in-1 | |
| HP EliteBook x360 1030 G2 | |
| Microsoft Surface Book with Performance Base | |
| Lenovo ThinkPad X1 Yoga-20FRS1VS00 | |
| CPU Multi 64Bit | |
| Lenovo ThinkPad X1 Yoga 2017 20JES03T00 | |
| HP EliteBook x360 1030 G2 | |
| Dell Latitude 12 5285 2-in-1 | |
| Microsoft Surface Book with Performance Base | |
| Toshiba Portege X20W-D-10R | |
| Lenovo ThinkPad X1 Yoga-20FRS1VS00 | |
| Cinebench R11.5 | |
| CPU Multi 64Bit | |
| Lenovo ThinkPad X1 Yoga 2017 20JES03T00 | |
| Dell Latitude 12 5285 2-in-1 | |
| HP EliteBook x360 1030 G2 | |
| Lenovo ThinkPad X1 Yoga-20FRS1VS00 | |
| CPU Single 64Bit | |
| Lenovo ThinkPad X1 Yoga 2017 20JES03T00 | |
| Dell Latitude 12 5285 2-in-1 | |
| HP EliteBook x360 1030 G2 | |
| Lenovo ThinkPad X1 Yoga-20FRS1VS00 | |
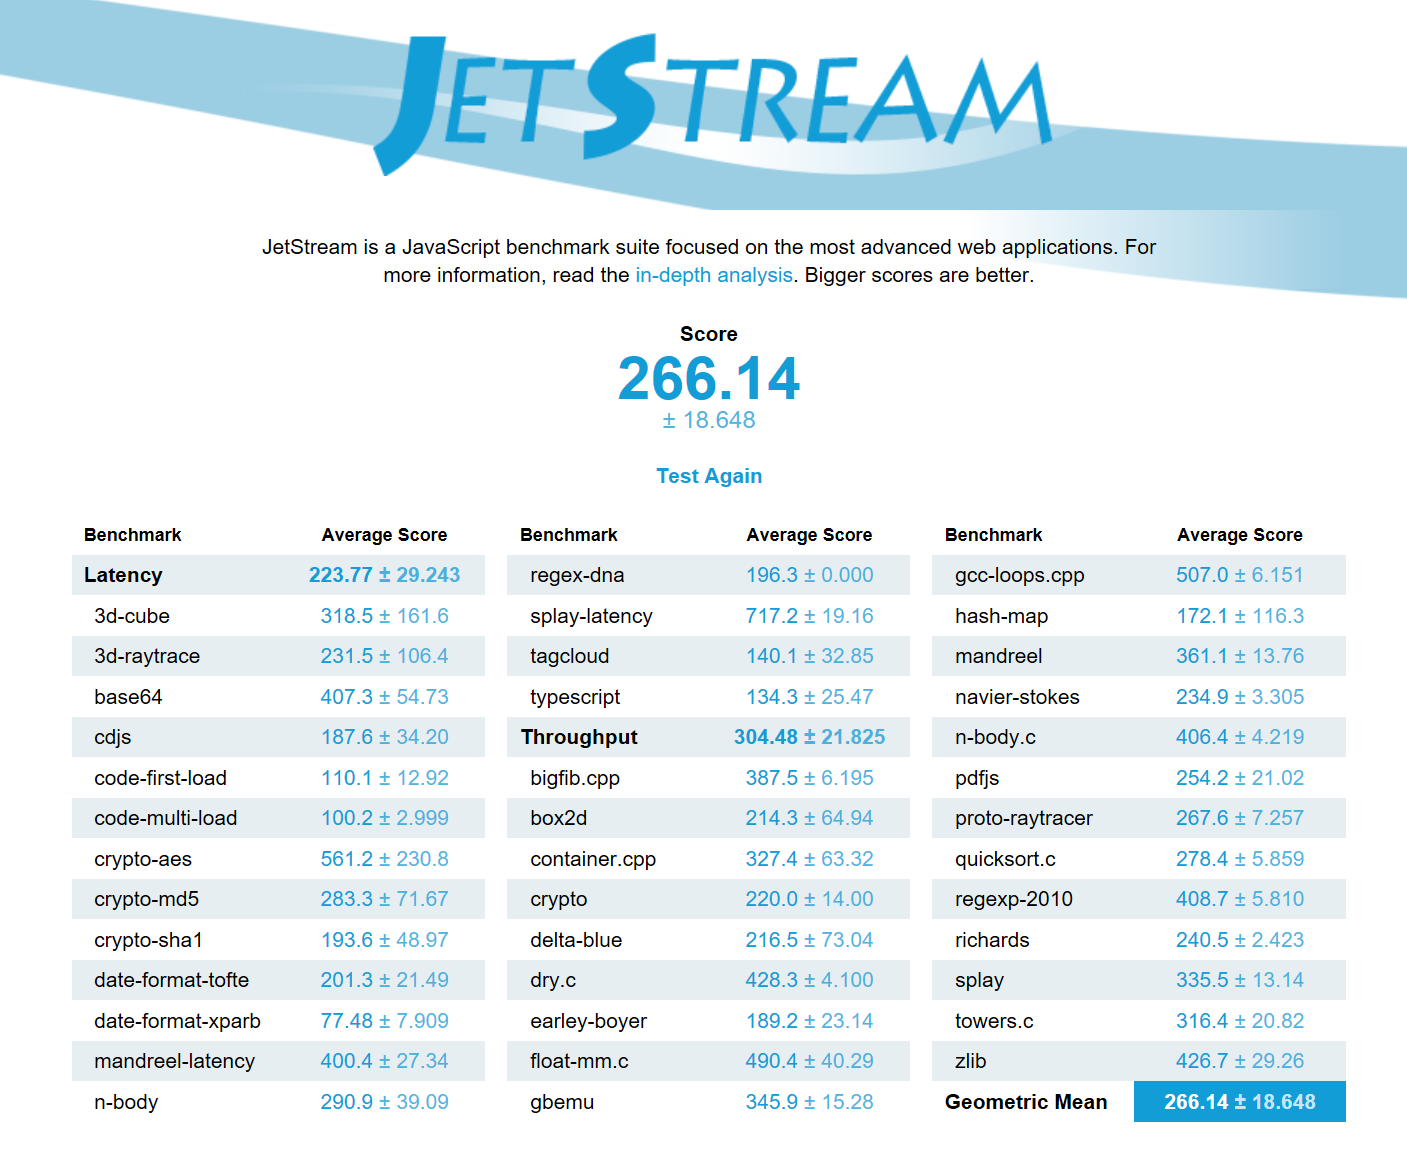
| JetStream 1.1 - 1.1 Total | |
| Lenovo ThinkPad X1 Yoga 2017 20JES03T00 | |
| Toshiba Portege X20W-D-10R | |
| Microsoft Surface Book with Performance Base | |
| HP EliteBook x360 1030 G2 | |
| Lenovo ThinkPad X1 Yoga-20FRS1VS00 | |
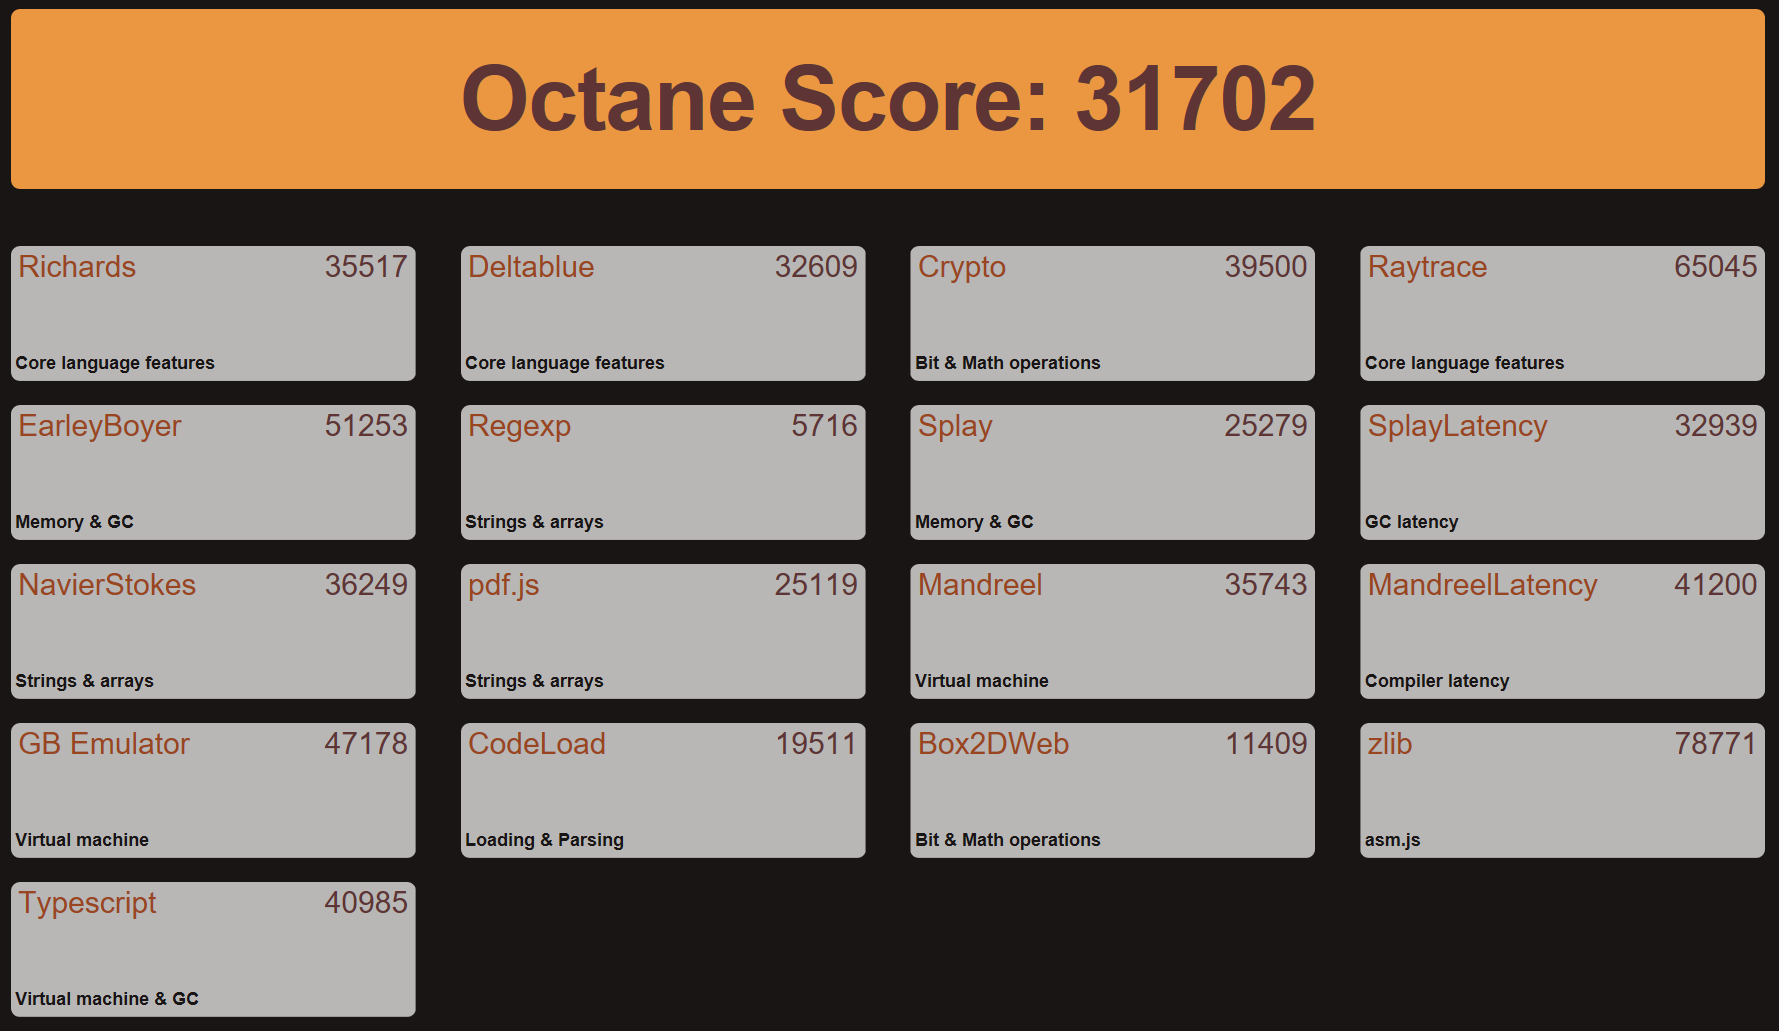
| Octane V2 - Total Score | |
| Toshiba Portege X20W-D-10R | |
| HP EliteBook x360 1030 G2 | |
| Microsoft Surface Book with Performance Base | |
| Lenovo ThinkPad X1 Yoga 2017 20JES03T00 | |
| Lenovo ThinkPad X1 Yoga-20FRS1VS00 | |
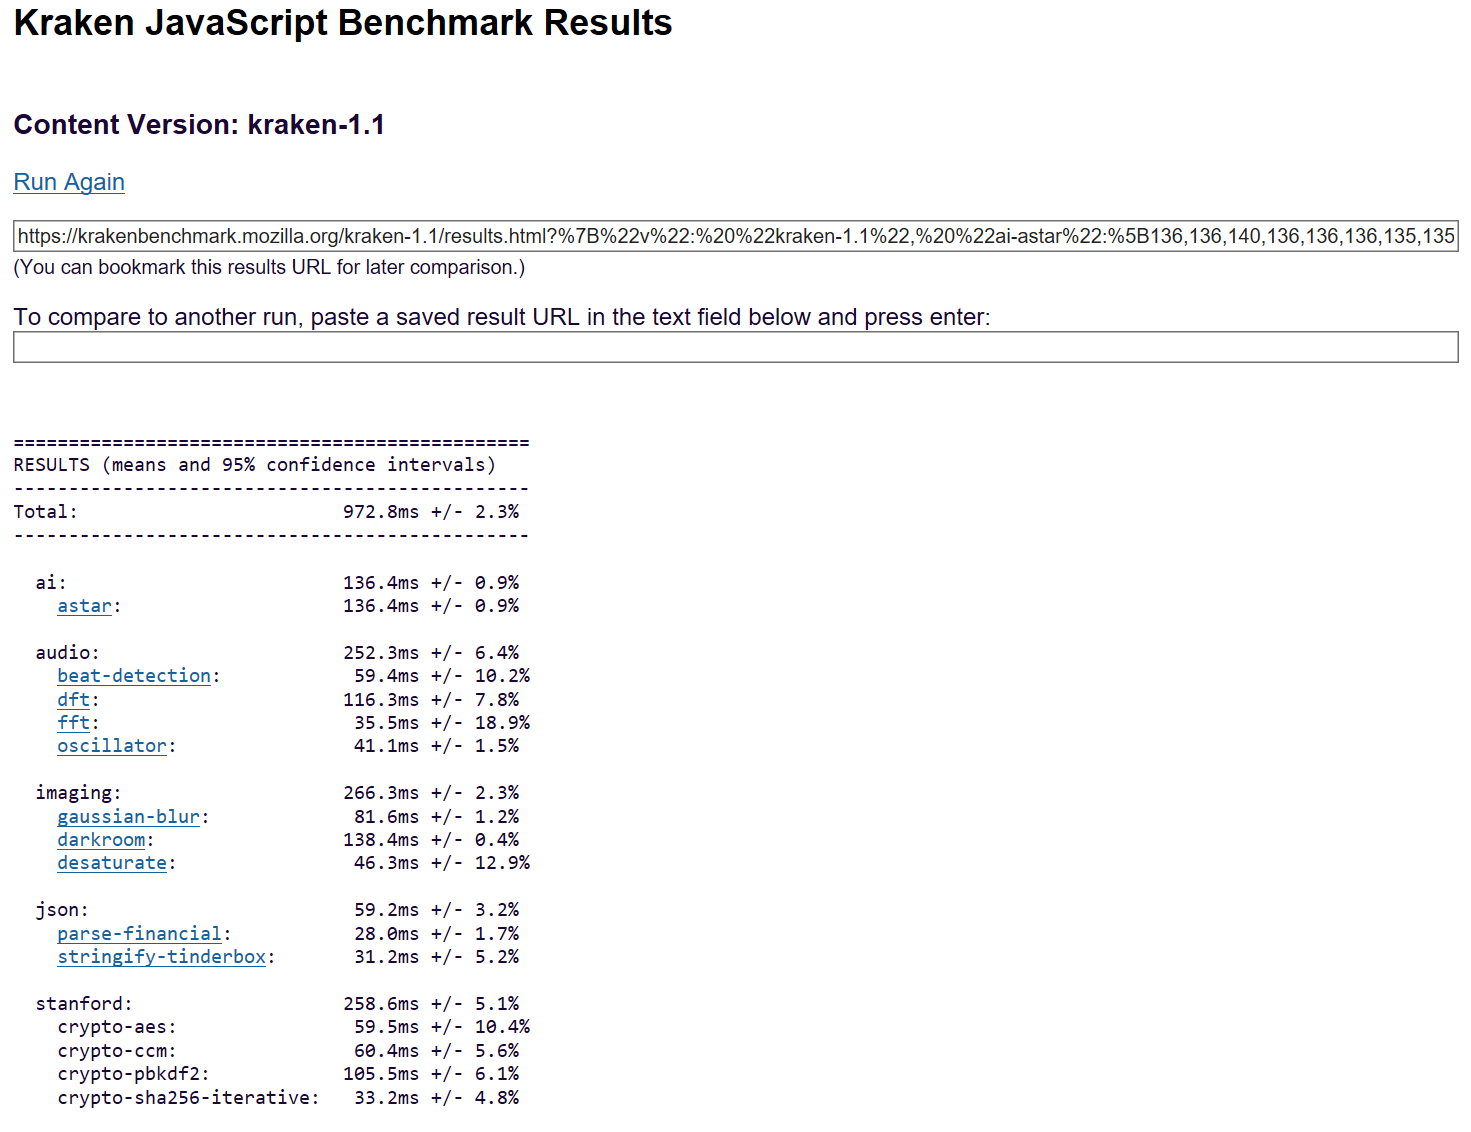
| Mozilla Kraken 1.1 - Total | |
| Lenovo ThinkPad X1 Yoga-20FRS1VS00 | |
| Microsoft Surface Book with Performance Base | |
| HP EliteBook x360 1030 G2 | |
| Toshiba Portege X20W-D-10R | |
| Lenovo ThinkPad X1 Yoga 2017 20JES03T00 | |
* ... daha küçük daha iyidir
| PCMark 8 | |
| Home Score Accelerated v2 | |
| Dell Latitude 12 5285 2-in-1 | |
| Lenovo ThinkPad X1 Yoga 2017 20JES03T00 | |
| HP EliteBook x360 1030 G2 | |
| Toshiba Portege X20W-D-10R | |
| Lenovo ThinkPad X1 Yoga-20FRS1VS00 | |
| Microsoft Surface Book with Performance Base | |
| Work Score Accelerated v2 | |
| Lenovo ThinkPad X1 Yoga 2017 20JES03T00 | |
| HP EliteBook x360 1030 G2 | |
| Toshiba Portege X20W-D-10R | |
| Lenovo ThinkPad X1 Yoga-20FRS1VS00 | |
| Microsoft Surface Book with Performance Base | |
| Dell Latitude 12 5285 2-in-1 | |
| Creative Score Accelerated v2 | |
| Lenovo ThinkPad X1 Yoga 2017 20JES03T00 | |
| HP EliteBook x360 1030 G2 | |
| Dell Latitude 12 5285 2-in-1 | |
| Microsoft Surface Book with Performance Base | |
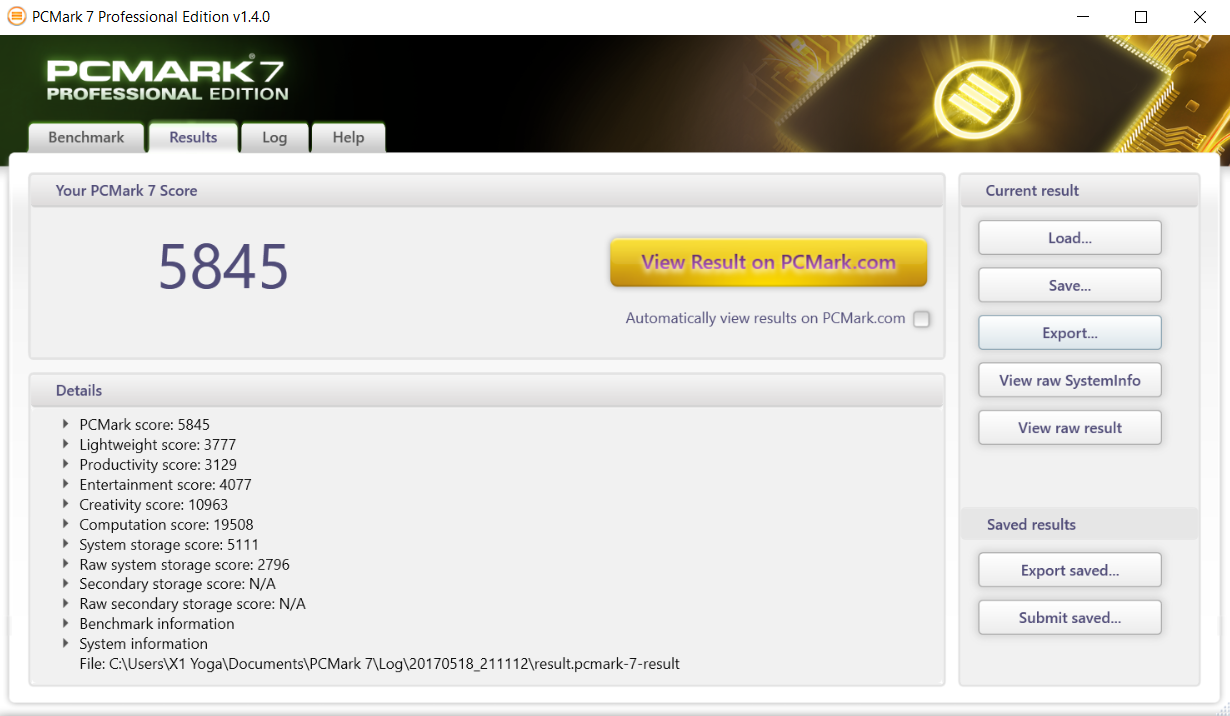
| PCMark 7 Score | 5845 puan | |
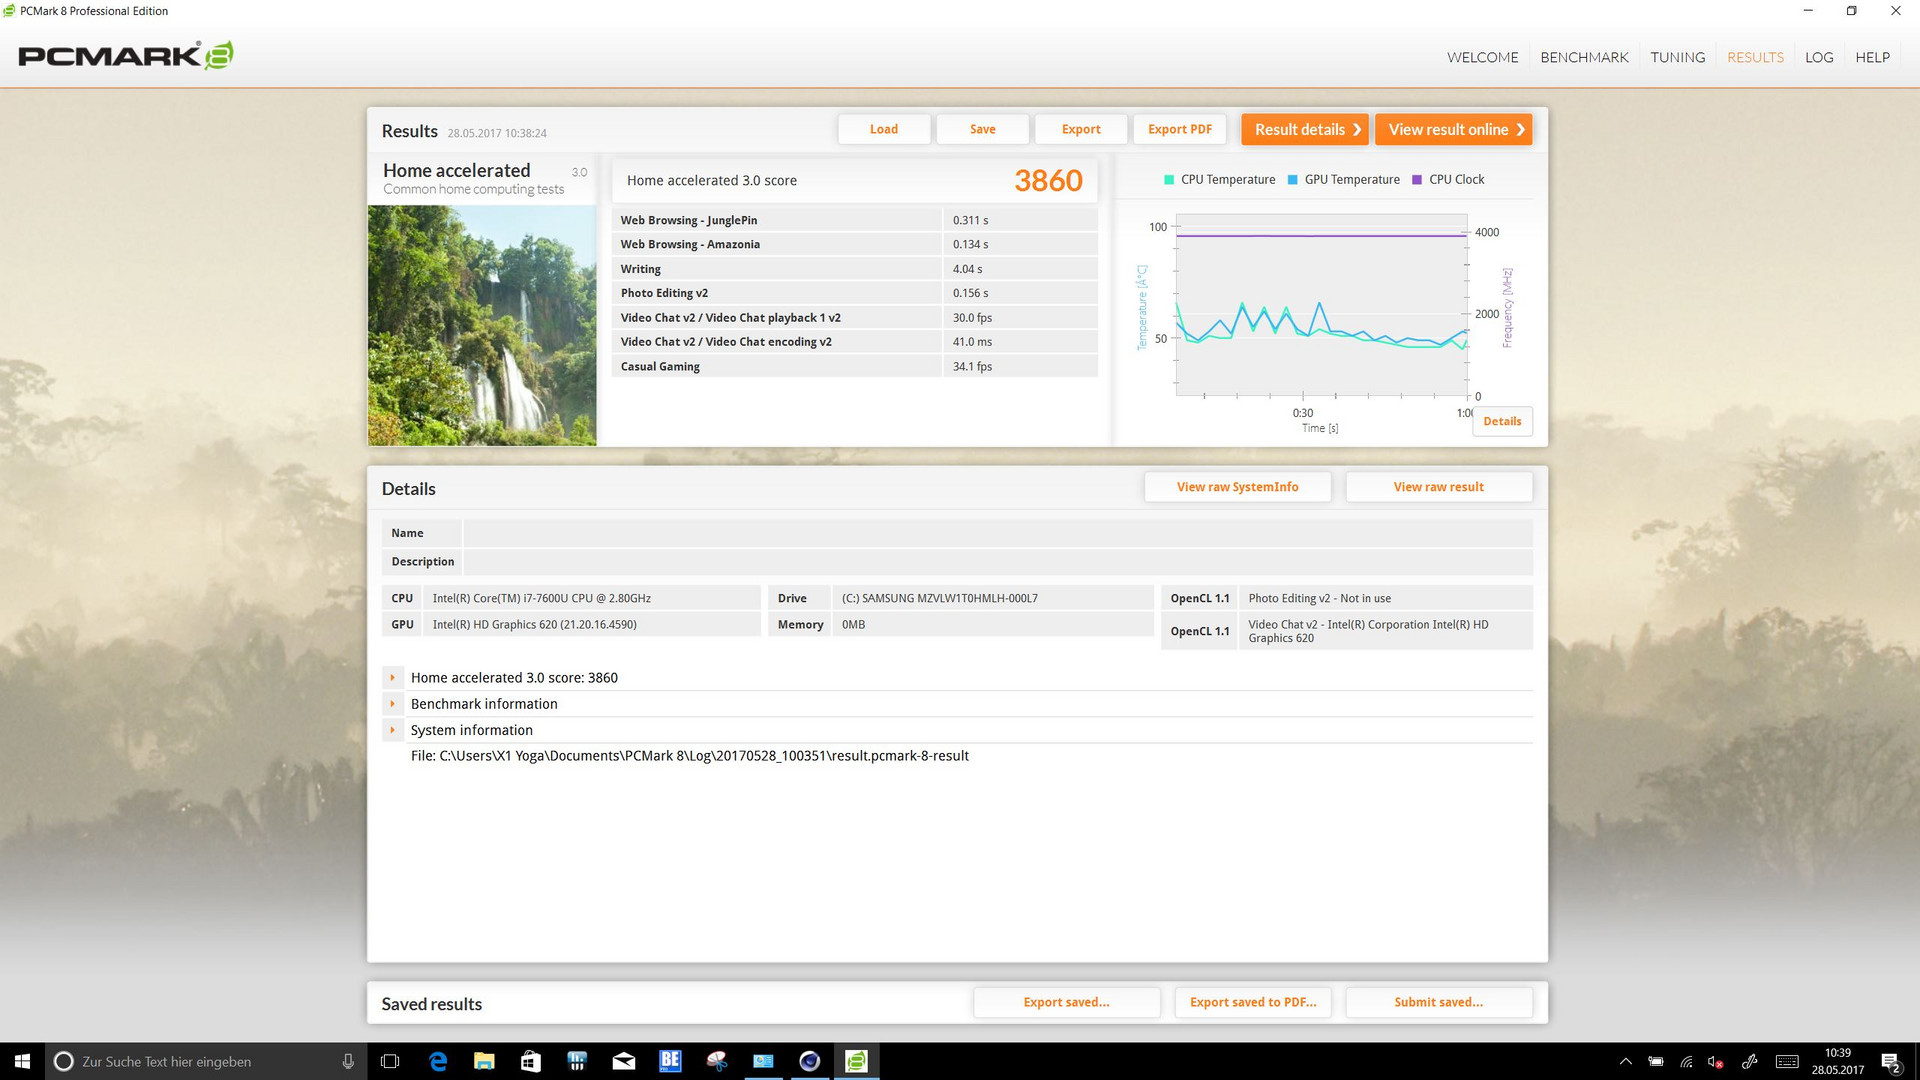
| PCMark 8 Home Score Accelerated v2 | 3860 puan | |
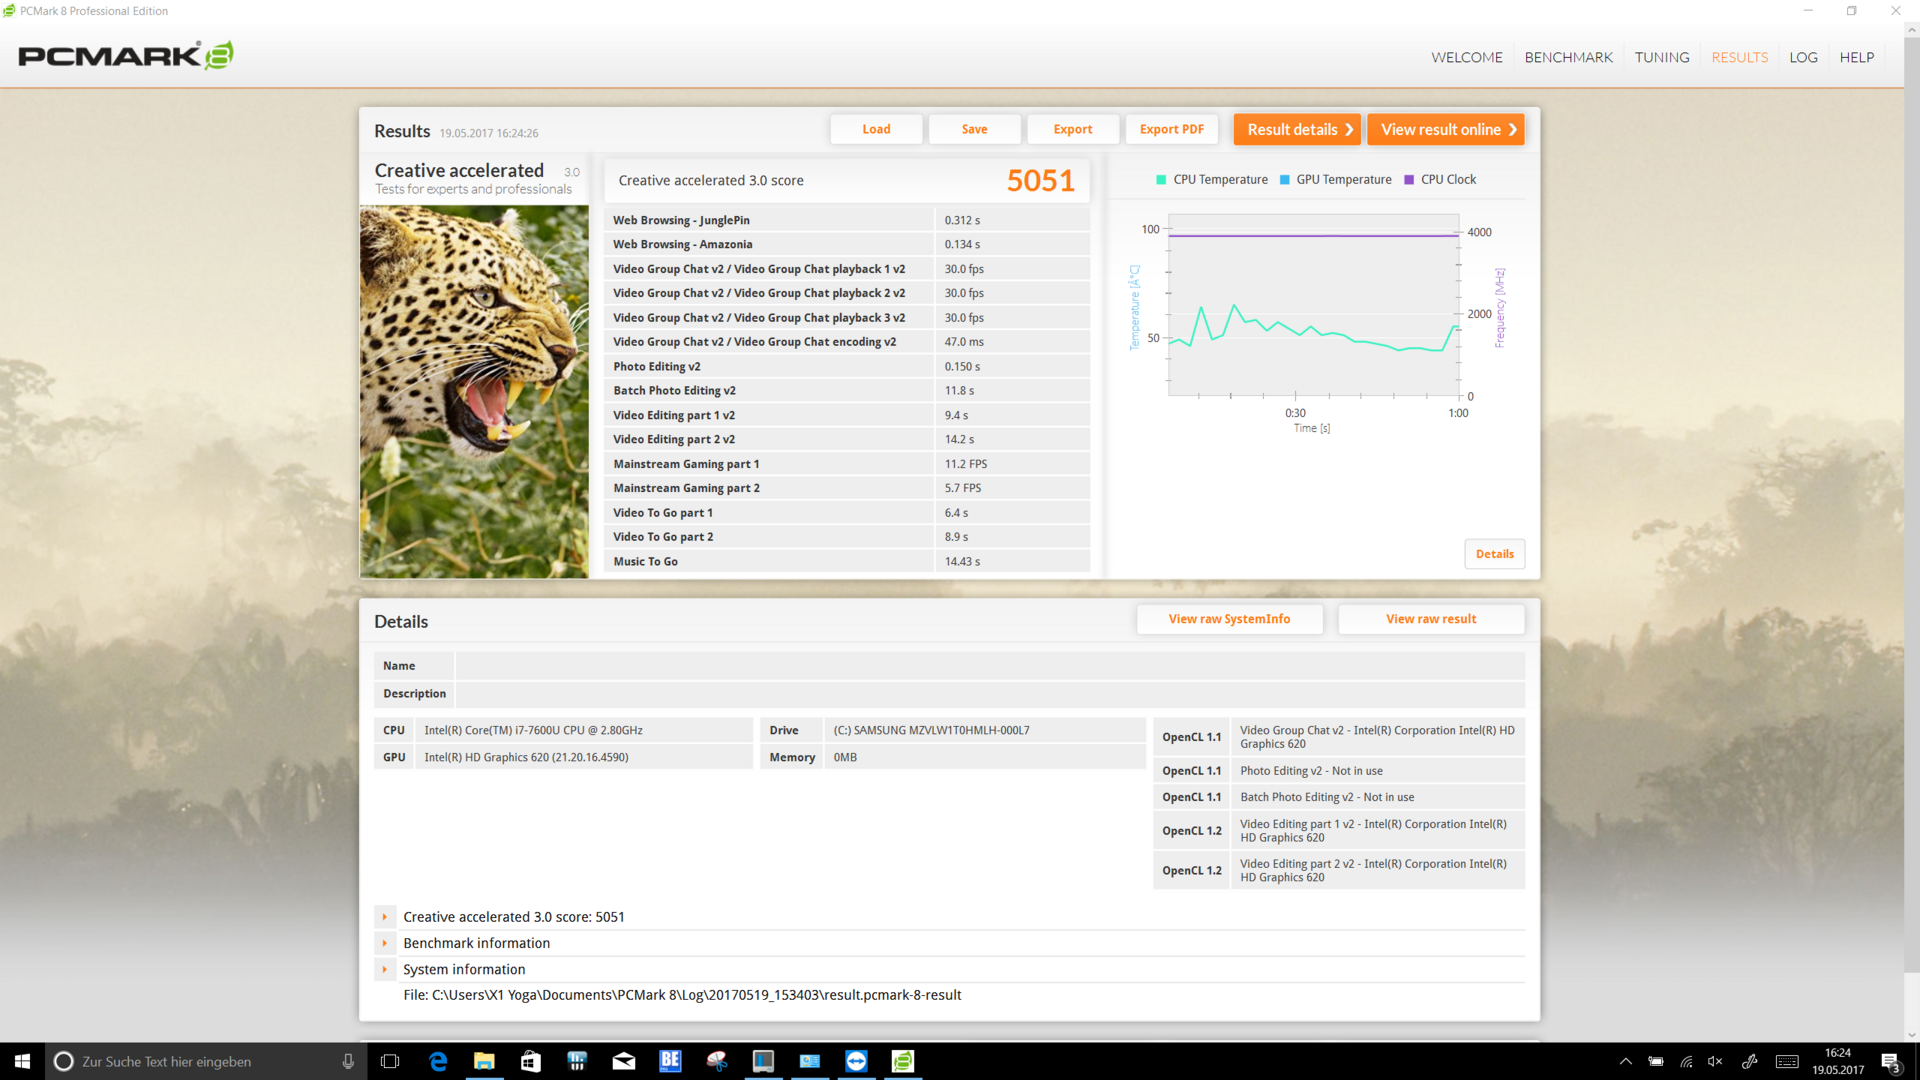
| PCMark 8 Creative Score Accelerated v2 | 5051 puan | |
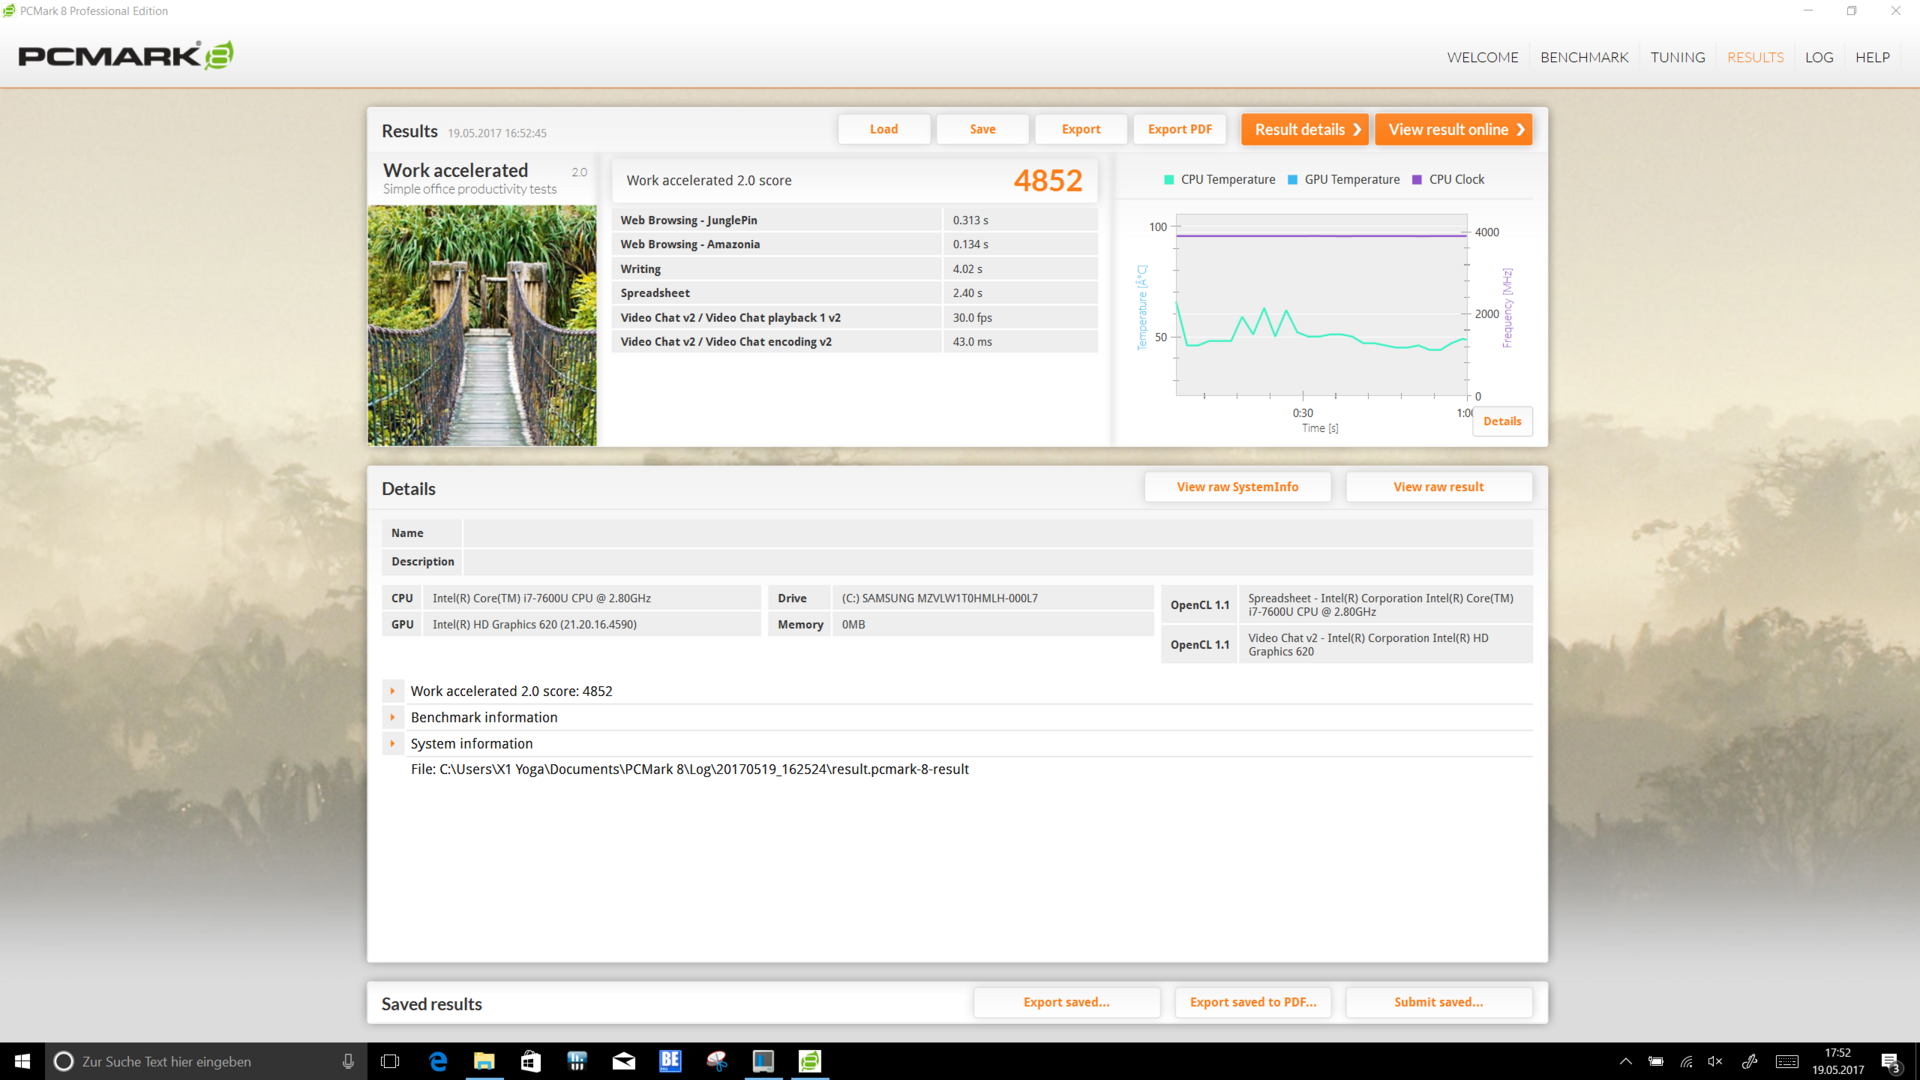
| PCMark 8 Work Score Accelerated v2 | 4852 puan | |
Yardım | ||
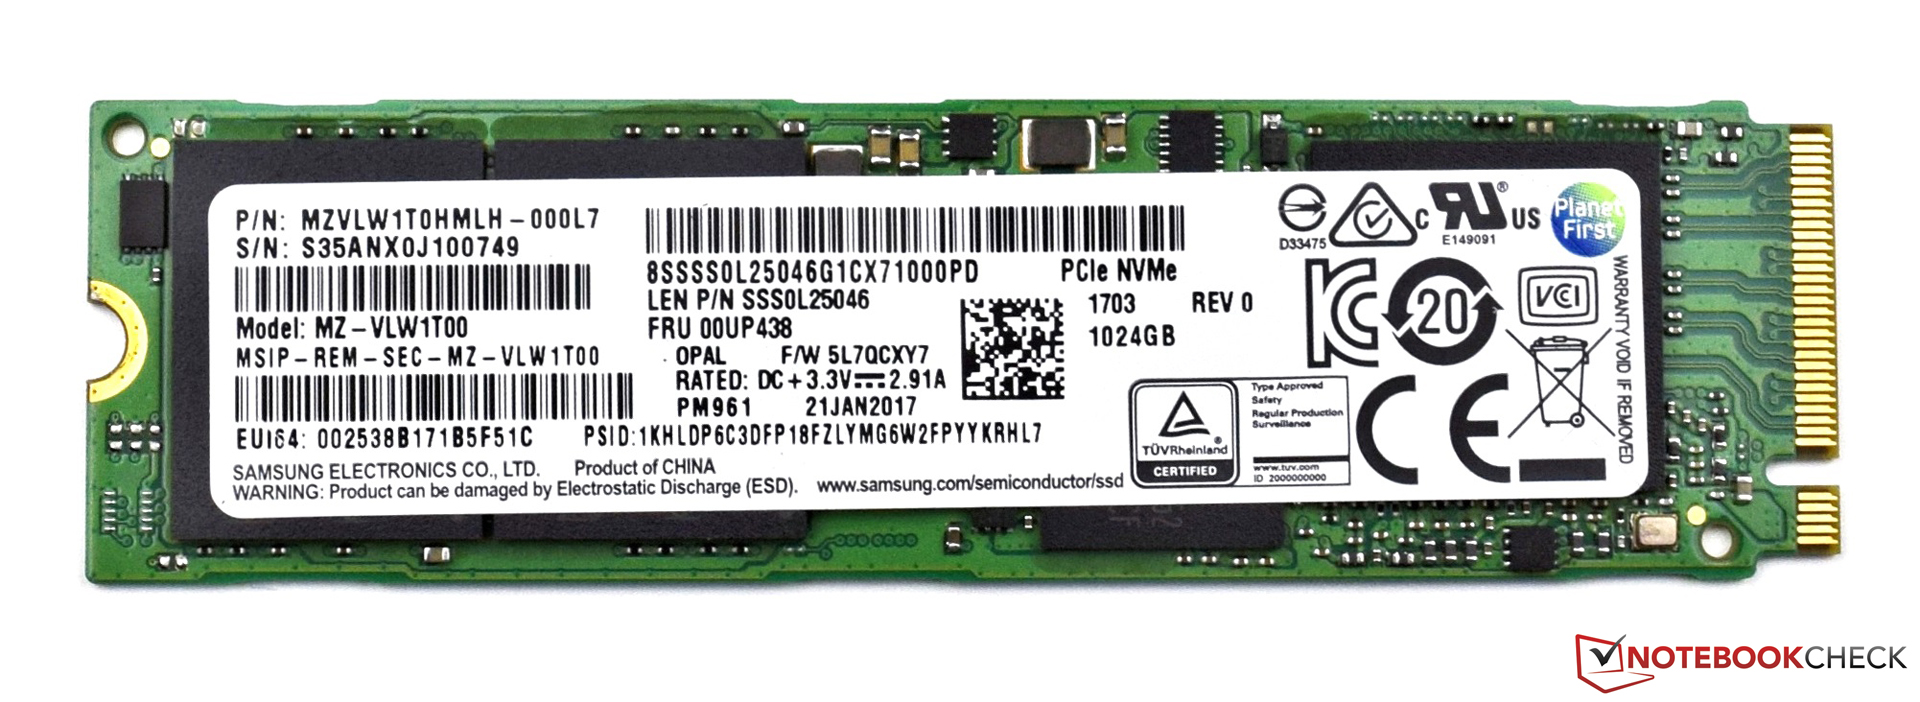
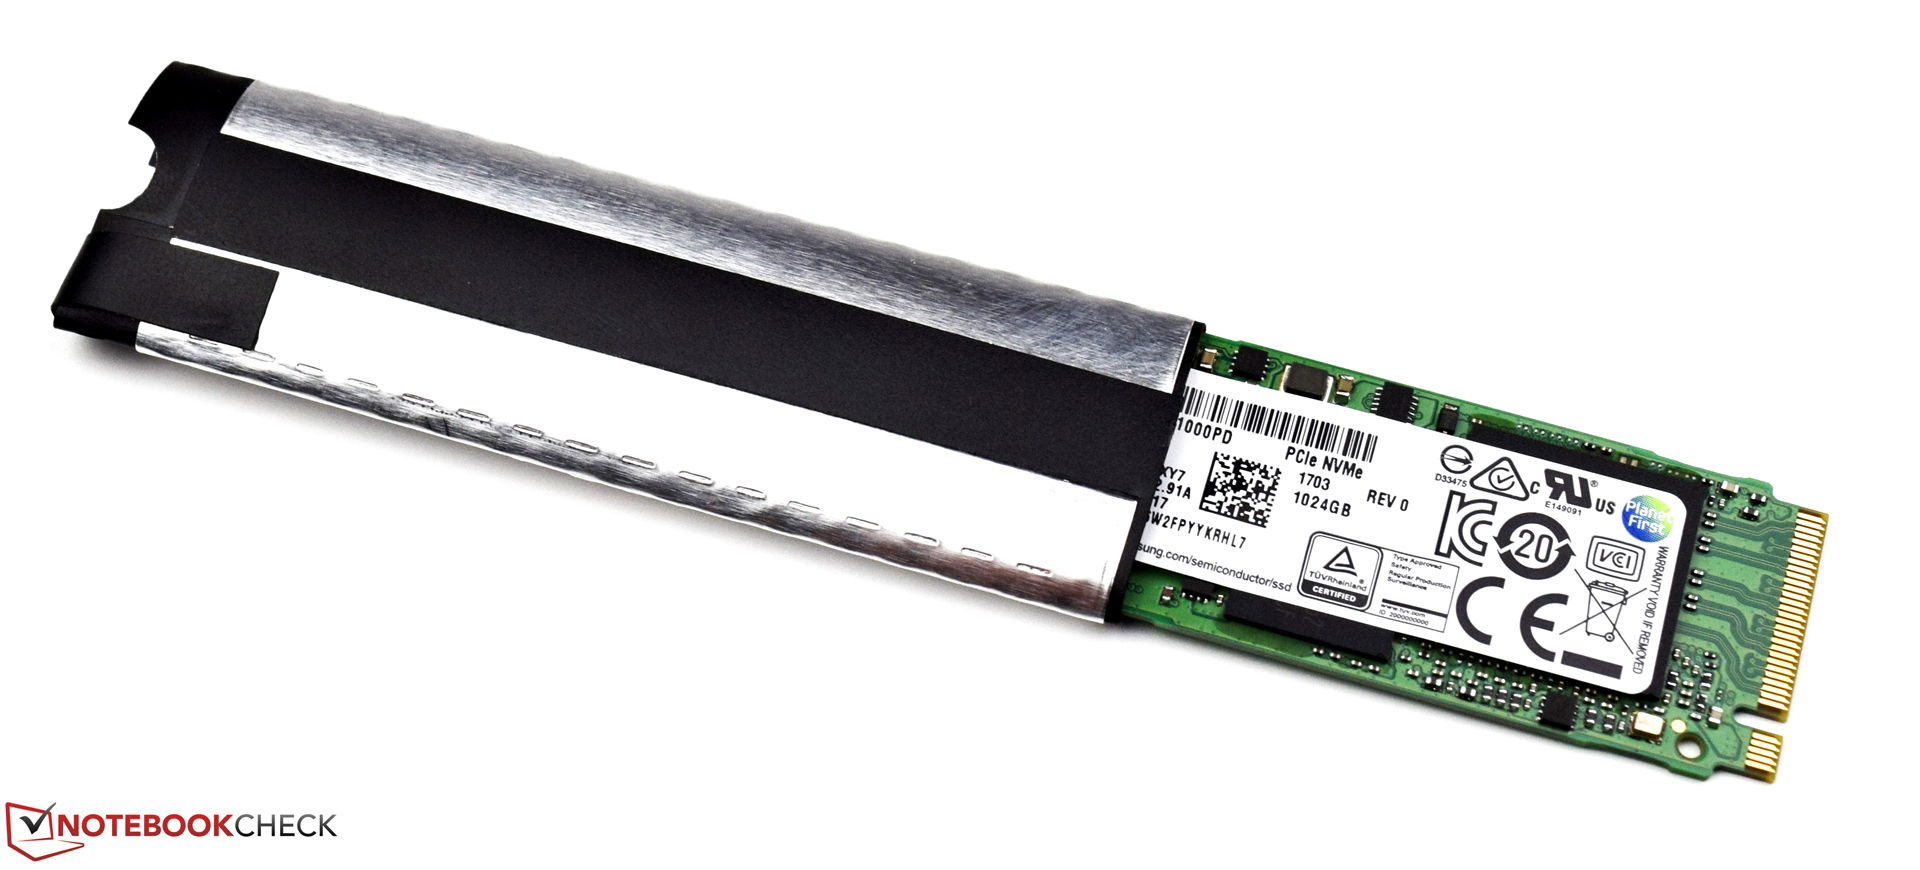
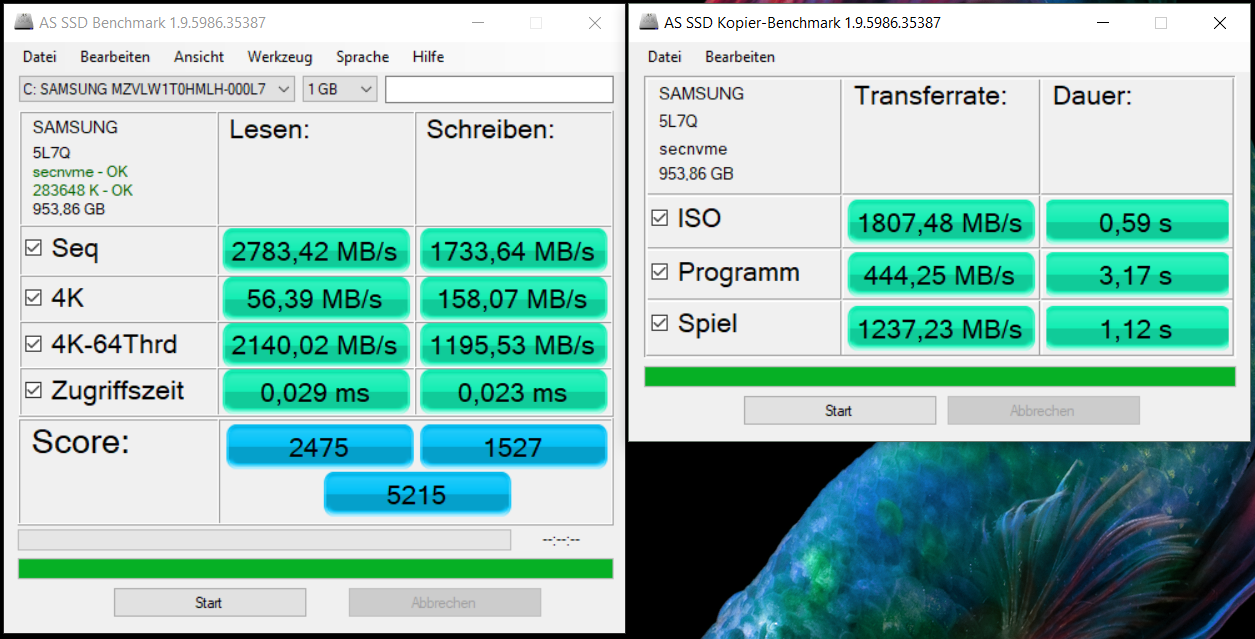
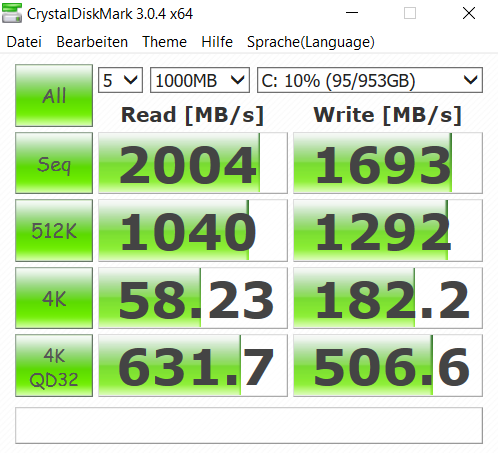
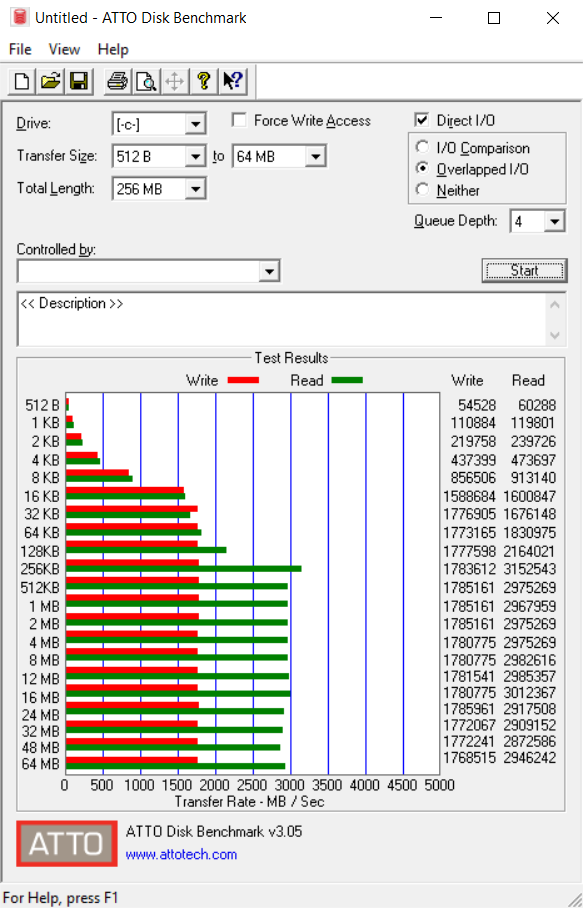
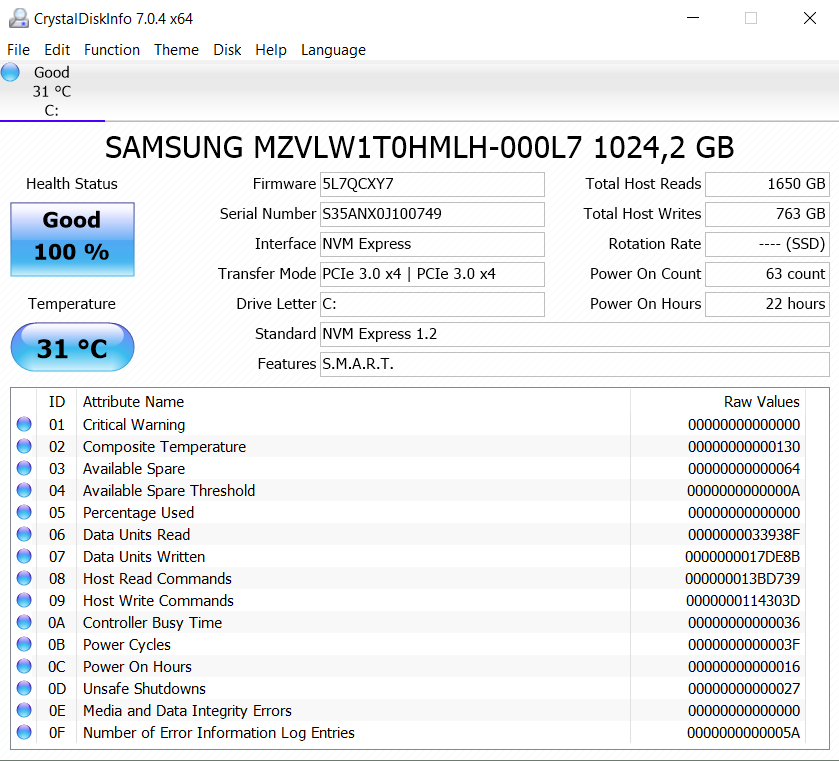
| Lenovo ThinkPad X1 Yoga 2017 20JES03T00 Samsung SSD PM961 1TB M.2 PCIe 3.0 x4 NVMe (MZVLW1T0) | Lenovo ThinkPad X1 Yoga-20FRS1VS00 Samsung SSD PM961 1TB M.2 PCIe 3.0 x4 NVMe (MZSLW1T0) | HP EliteBook x360 1030 G2 Sandisk SD8TN8U-256G-1006 | Toshiba Portege X20W-D-10R Toshiba SG5 THNSNK512GVN8 | Dell Latitude 12 5285 2-in-1 Samsung PM961 MZVLW256HEHP | Microsoft Surface Book with Performance Base Toshiba NVMe THNSN5256GPU7 | Apple MacBook 12 (Early 2016) 1.1 GHz Apple SSD AP0256 | |
|---|---|---|---|---|---|---|---|
| CrystalDiskMark 3.0 | -33% | -65% | -65% | -43% | -41% | -55% | |
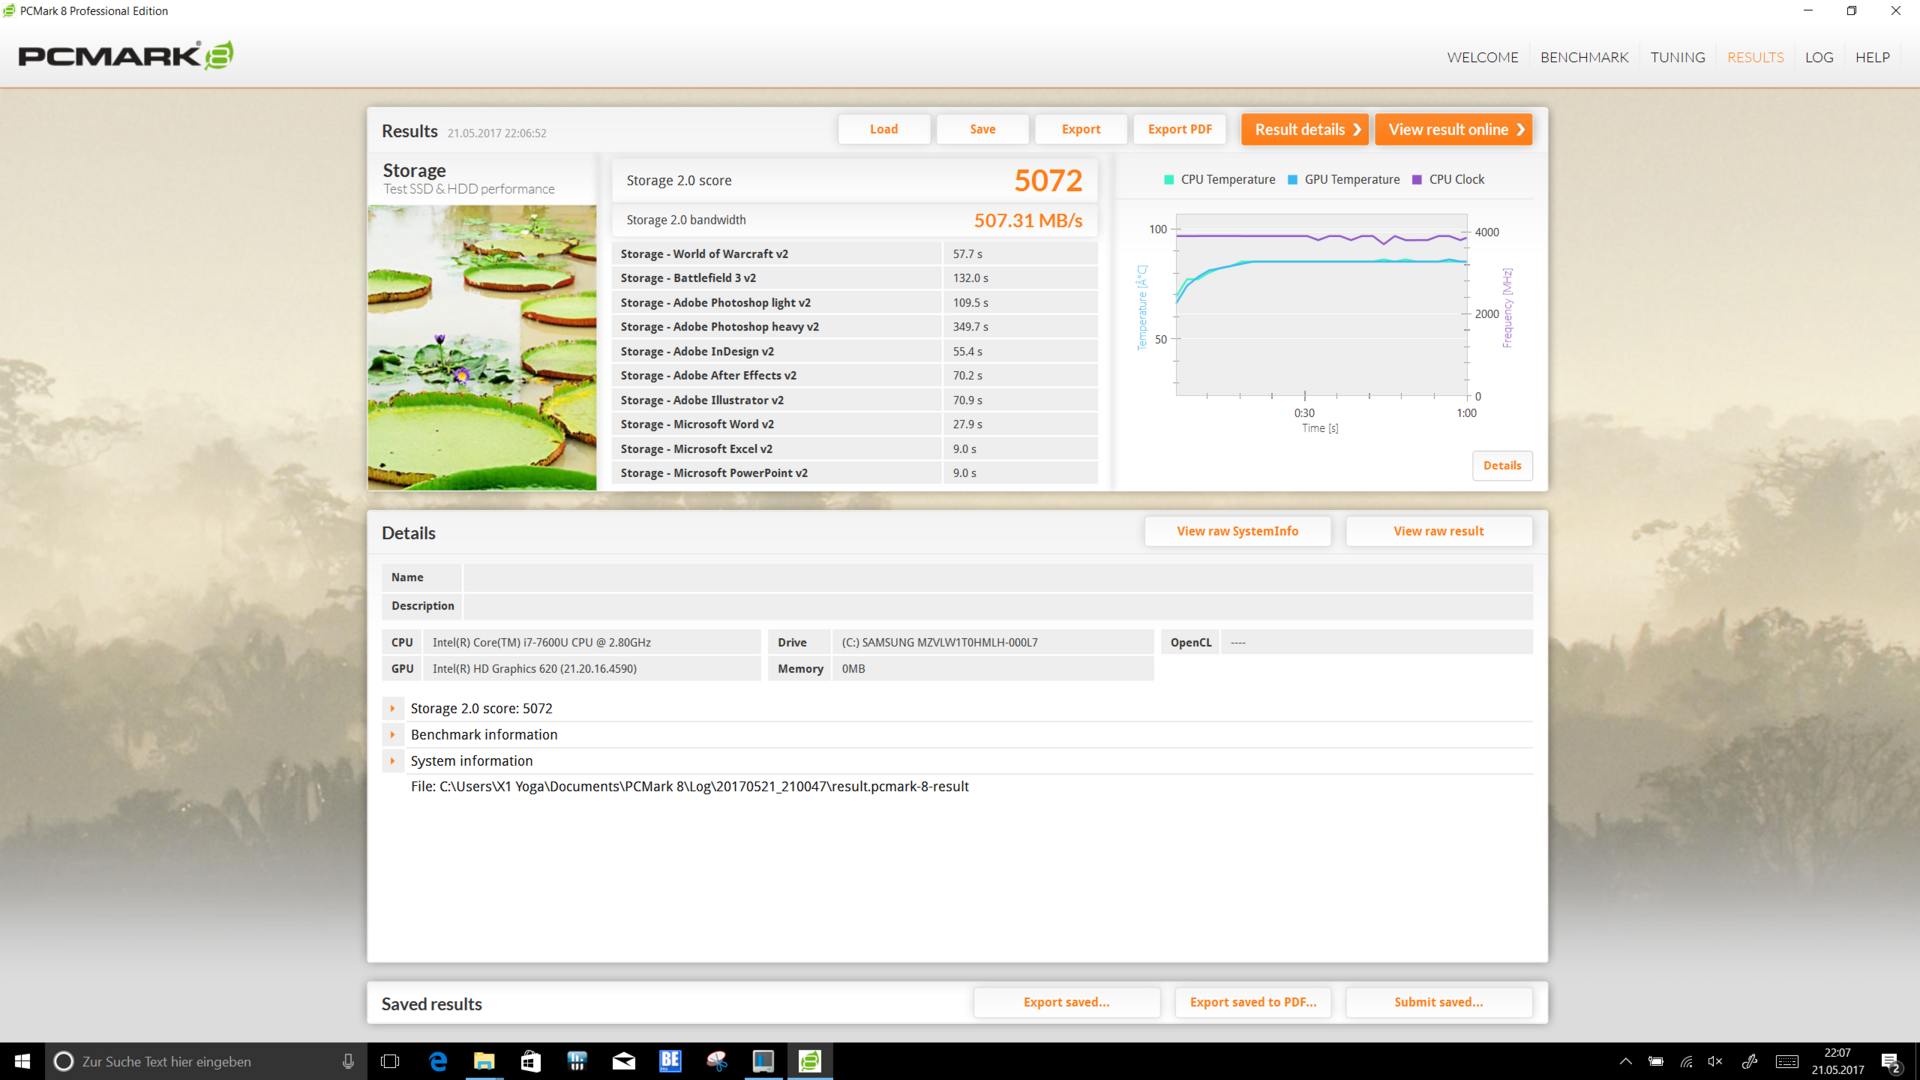
| Read Seq (MB/s) | 2004 | 1510 -25% | 467.1 -77% | 469 -77% | 1294 -35% | 1017 -49% | 754 -62% |
| Write Seq (MB/s) | 1693 | 1193 -30% | 443.6 -74% | 277.3 -84% | 865 -49% | 861 -49% | 638 -62% |
| Read 512 (MB/s) | 1040 | 312.3 -70% | 404.4 -61% | 406 -61% | 687 -34% | 616 -41% | |
| Write 512 (MB/s) | 1292 | 372.5 -71% | 266.6 -79% | 589 -54% | 698 -46% | 678 -48% | |
| Read 4k (MB/s) | 58.2 | 37 -36% | 29.43 -49% | 25.24 -57% | 31.75 -45% | 40.91 -30% | 14.6 -75% |
| Write 4k (MB/s) | 182.2 | 126 -31% | 56.5 -69% | 89.4 -51% | 72.2 -60% | 108.6 -40% | 20.5 -89% |
| Read 4k QD32 (MB/s) | 632 | 404 -36% | 311.3 -51% | 322.5 -49% | 493.3 -22% | 326.9 -48% | 464 -27% |
| Write 4k QD32 (MB/s) | 507 | 319 -37% | 225.2 -56% | 208.1 -59% | 434.5 -14% | 347.1 -32% | 315 -38% |

| 3DMark | |
| 1280x720 Cloud Gate Standard Graphics | |
| Microsoft Surface Book with Performance Base | |
| Dell Latitude 12 5285 2-in-1 | |
| HP EliteBook x360 1030 G2 | |
| Lenovo ThinkPad X1 Yoga 2017 20JES03T00 | |
| Lenovo ThinkPad X1 Yoga-20FRS1VS00 | |
| Toshiba Portege X20W-D-10R | |
| 1920x1080 Fire Strike Graphics | |
| Microsoft Surface Book with Performance Base | |
| Dell Latitude 12 5285 2-in-1 | |
| Lenovo ThinkPad X1 Yoga 2017 20JES03T00 | |
| HP EliteBook x360 1030 G2 | |
| Lenovo ThinkPad X1 Yoga-20FRS1VS00 | |
| 3DMark 11 - 1280x720 Performance GPU | |
| Microsoft Surface Book with Performance Base | |
| Lenovo ThinkPad X1 Yoga 2017 20JES03T00 | |
| Dell Latitude 12 5285 2-in-1 | |
| Toshiba Portege X20W-D-10R | |
| HP EliteBook x360 1030 G2 | |
| Lenovo ThinkPad X1 Yoga-20FRS1VS00 | |
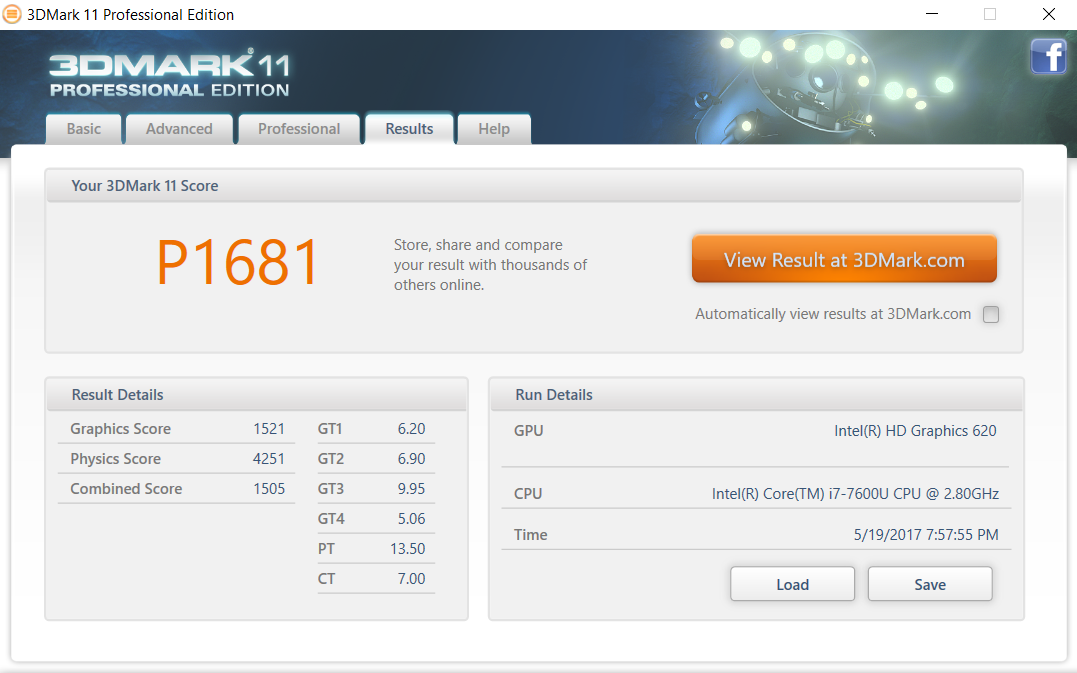
| 3DMark 11 Performance | 1794 puan | |
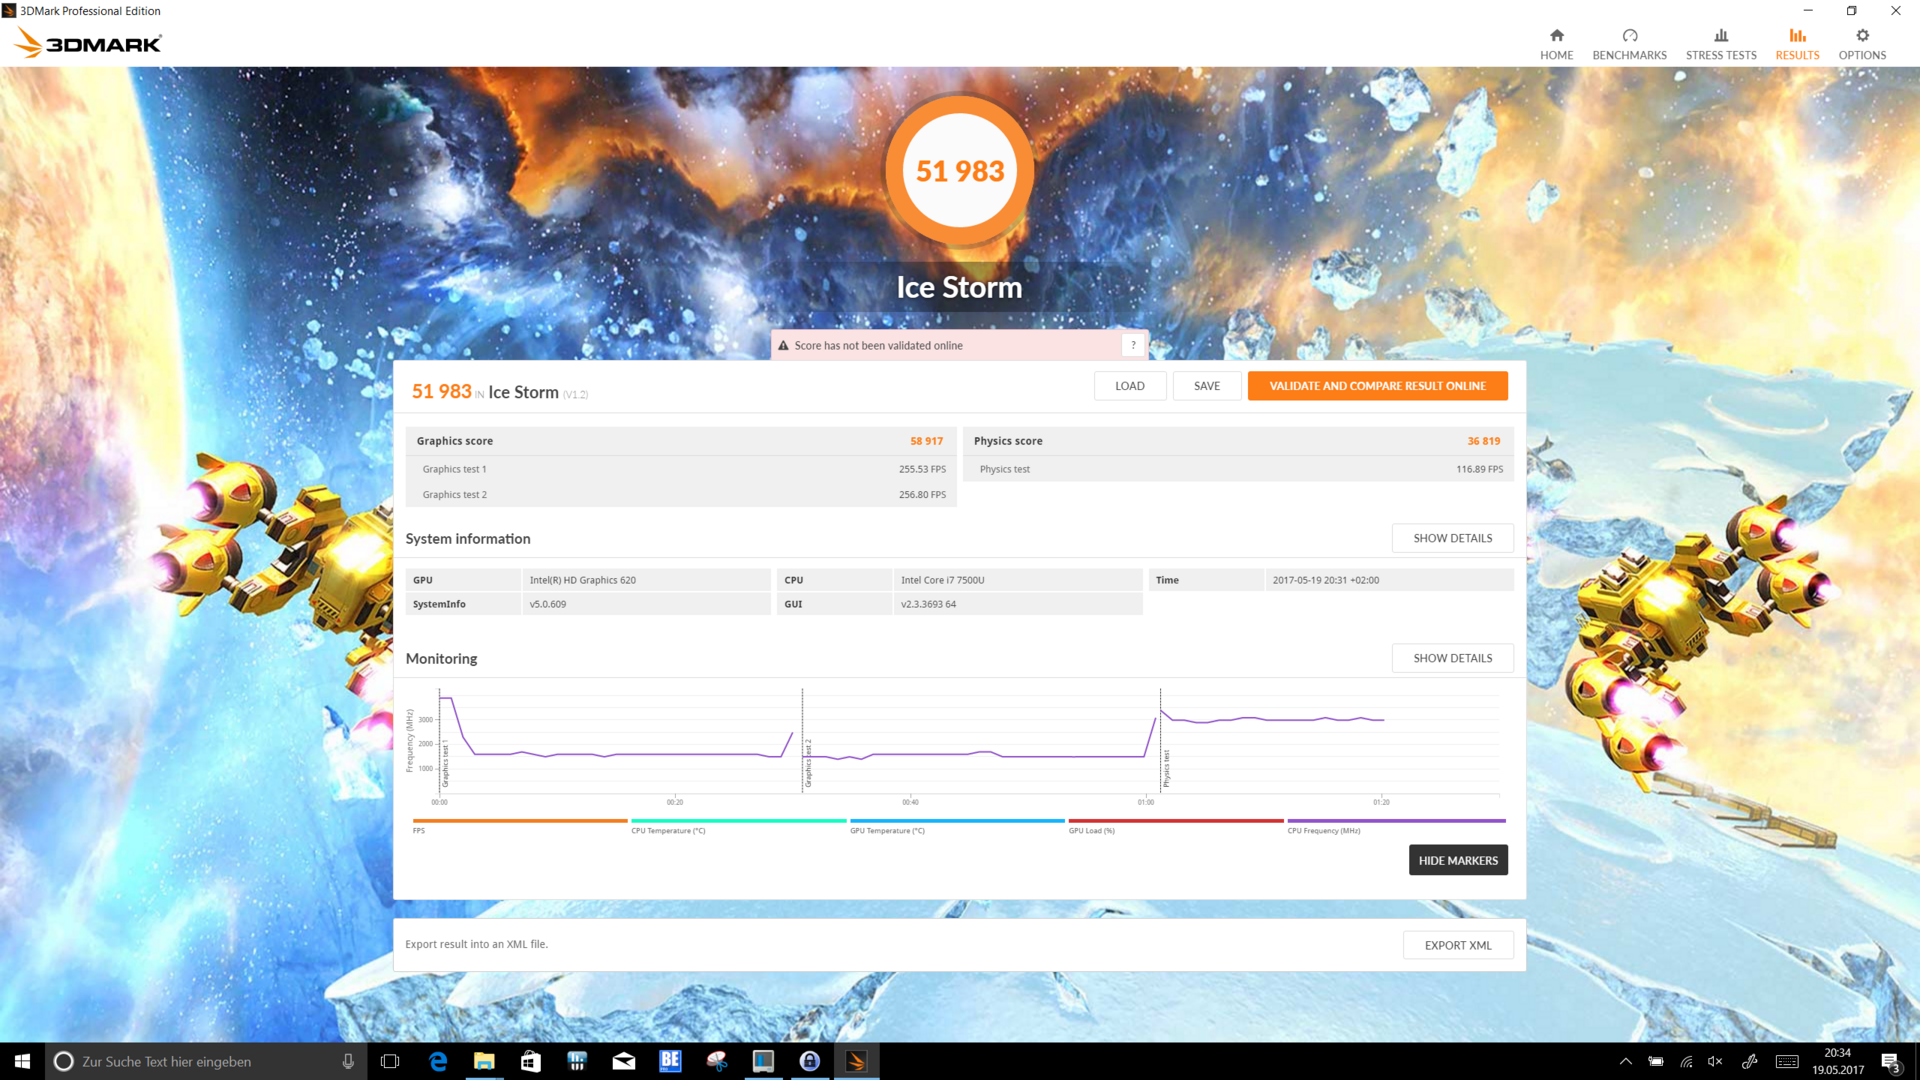
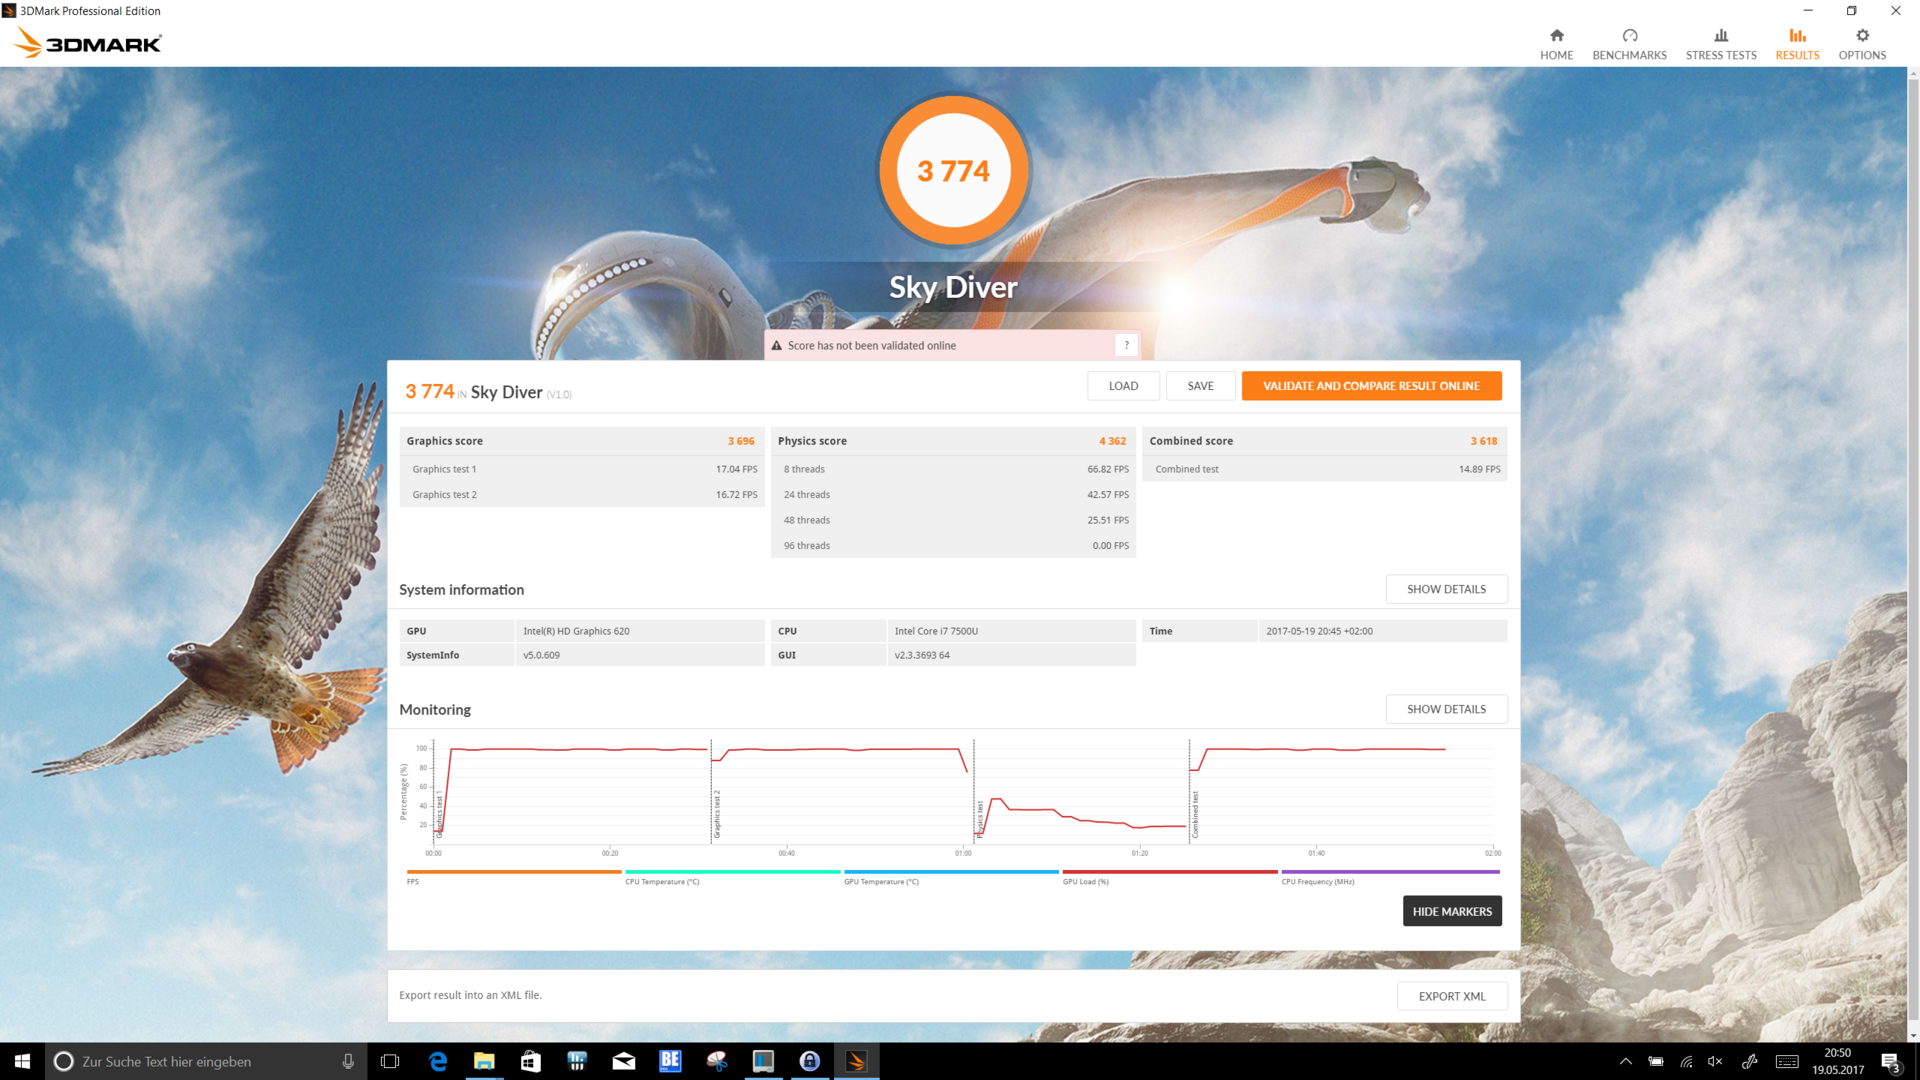
| 3DMark Ice Storm Standard Score | 51983 puan | |
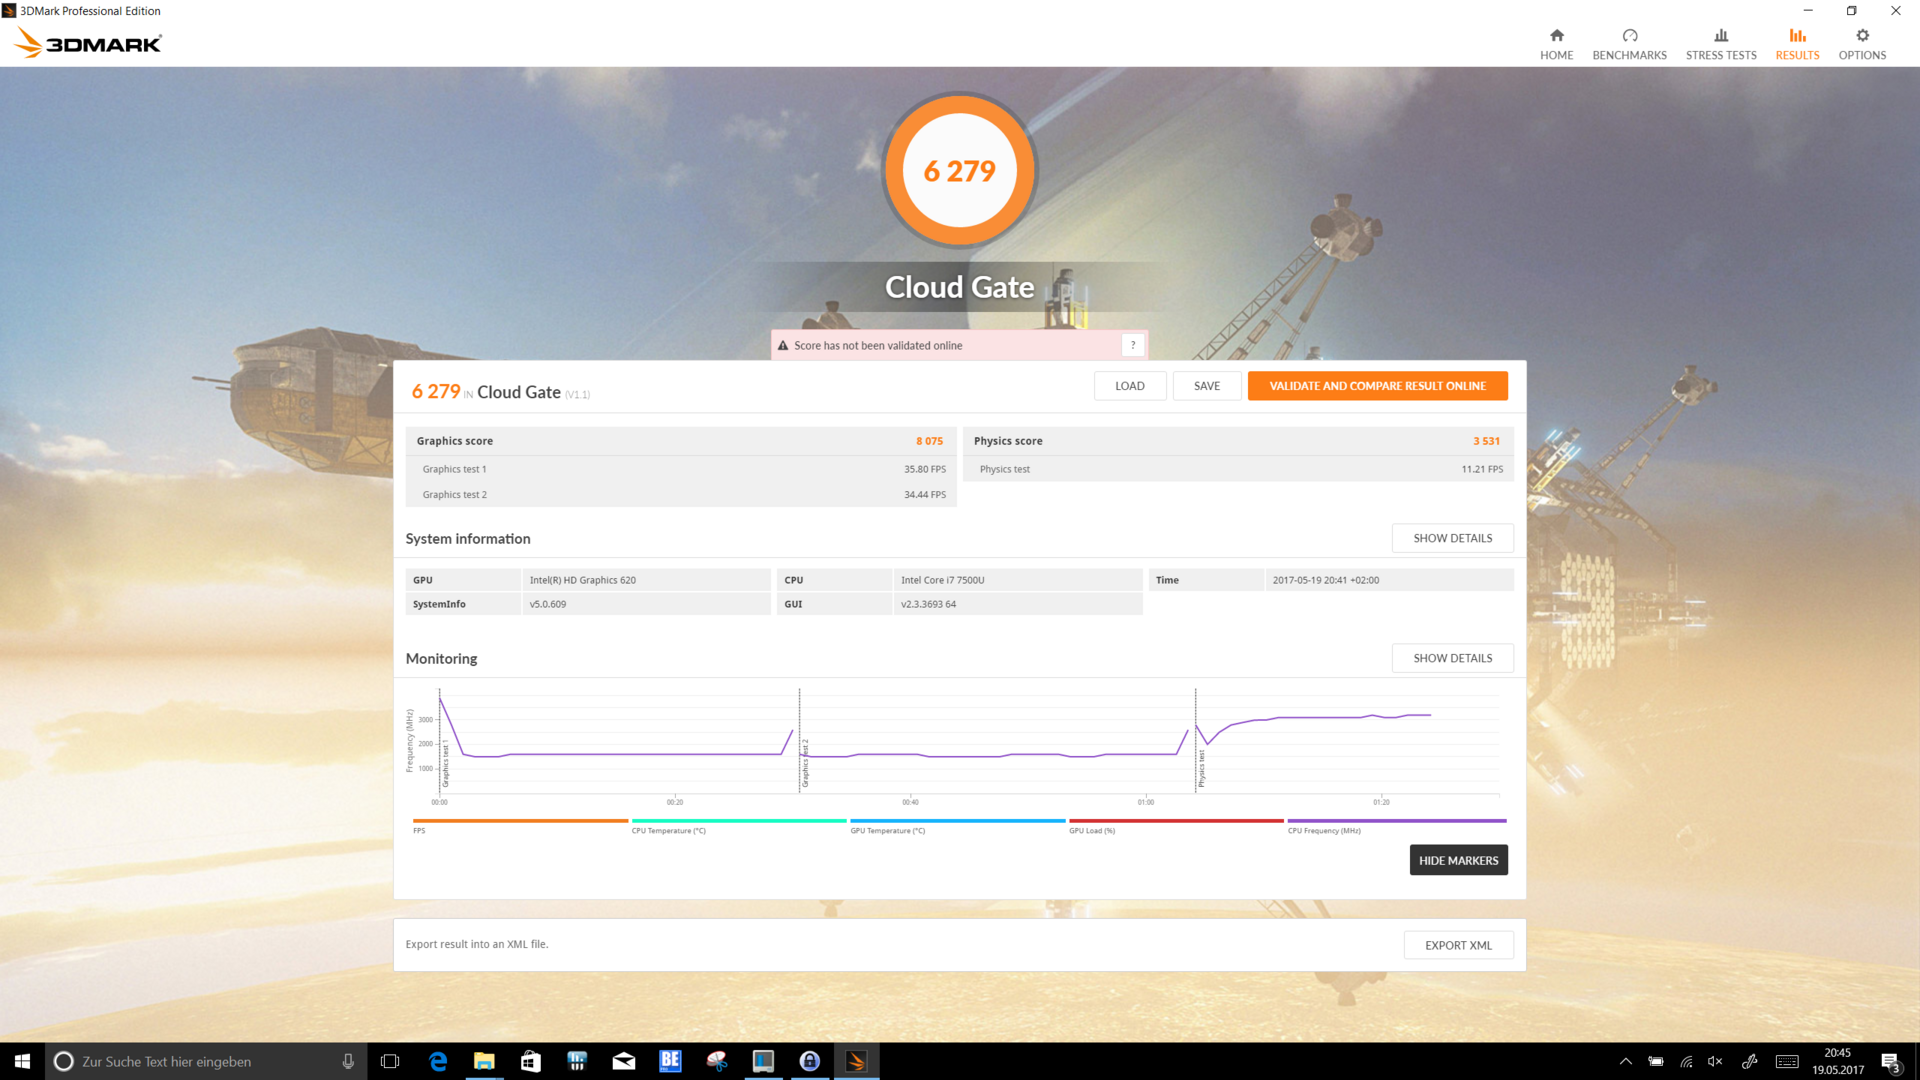
| 3DMark Cloud Gate Standard Score | 6279 puan | |
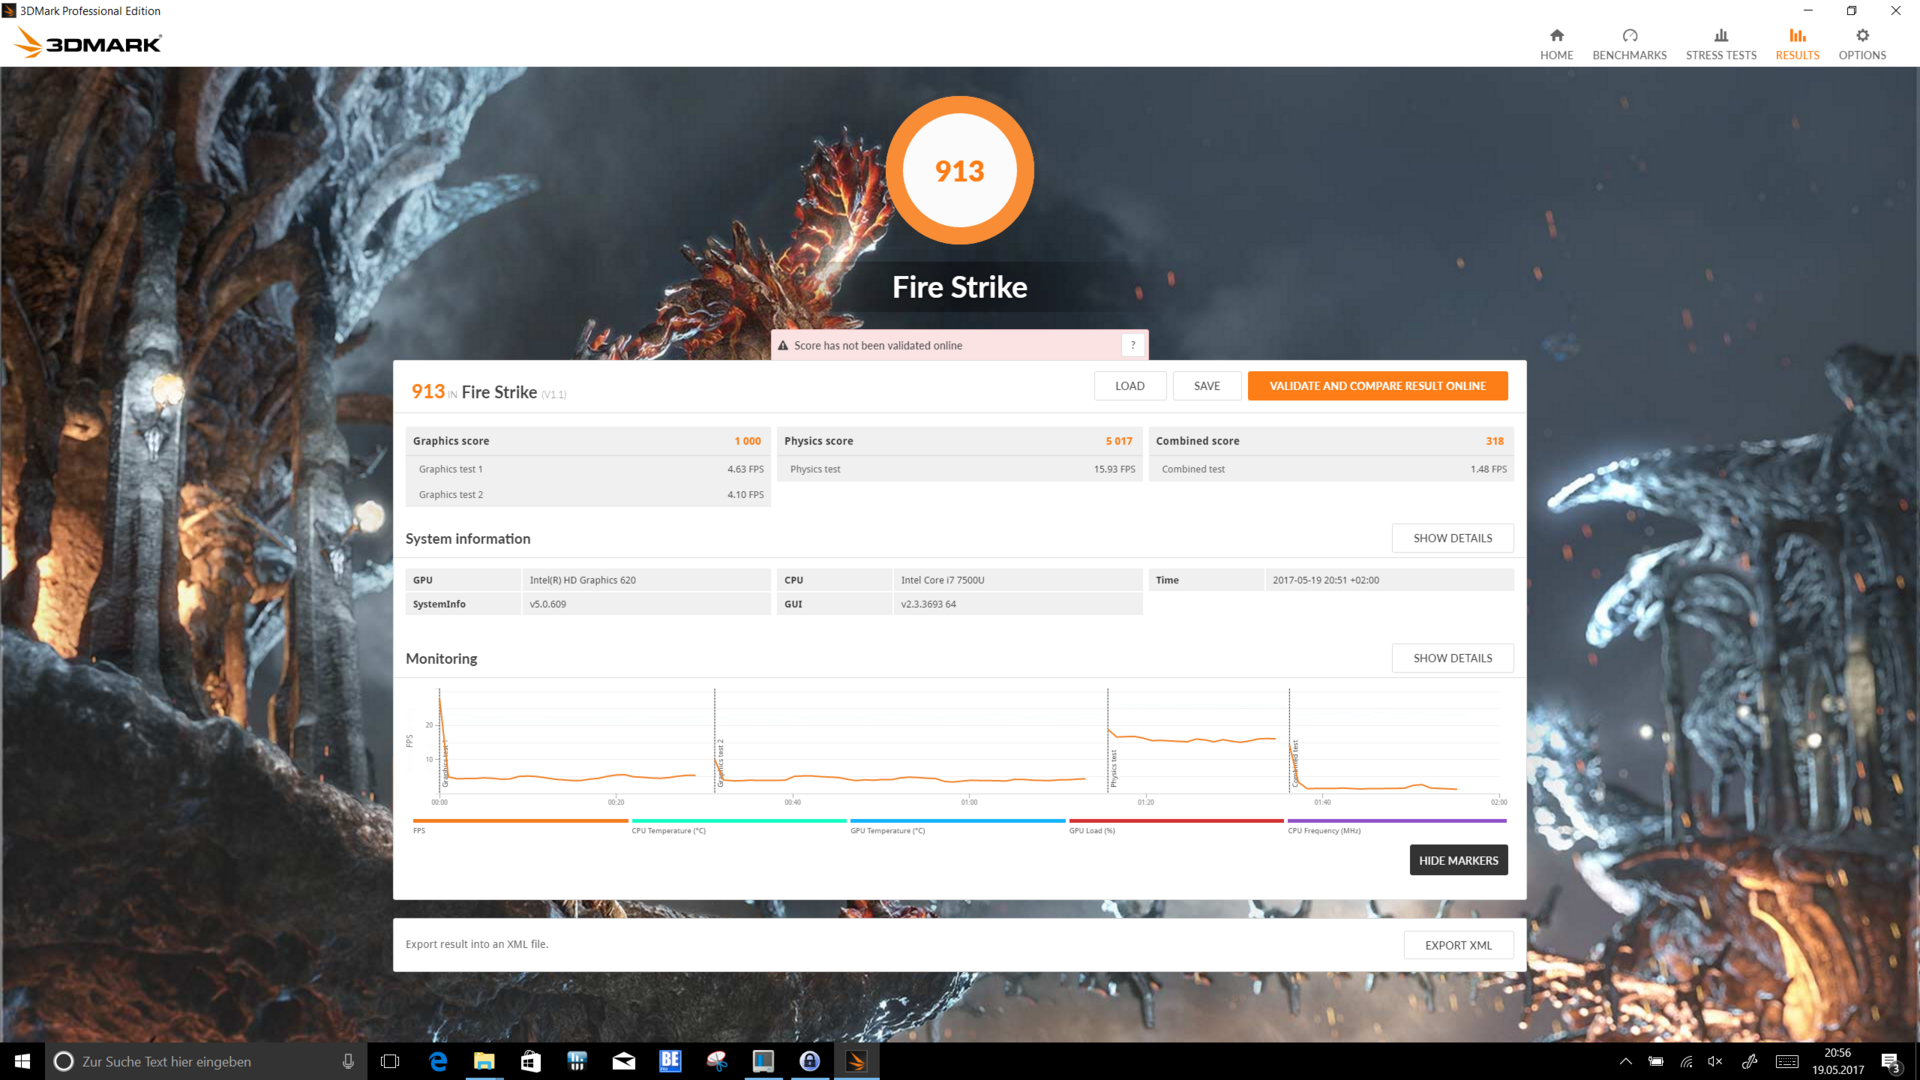
| 3DMark Fire Strike Score | 913 puan | |
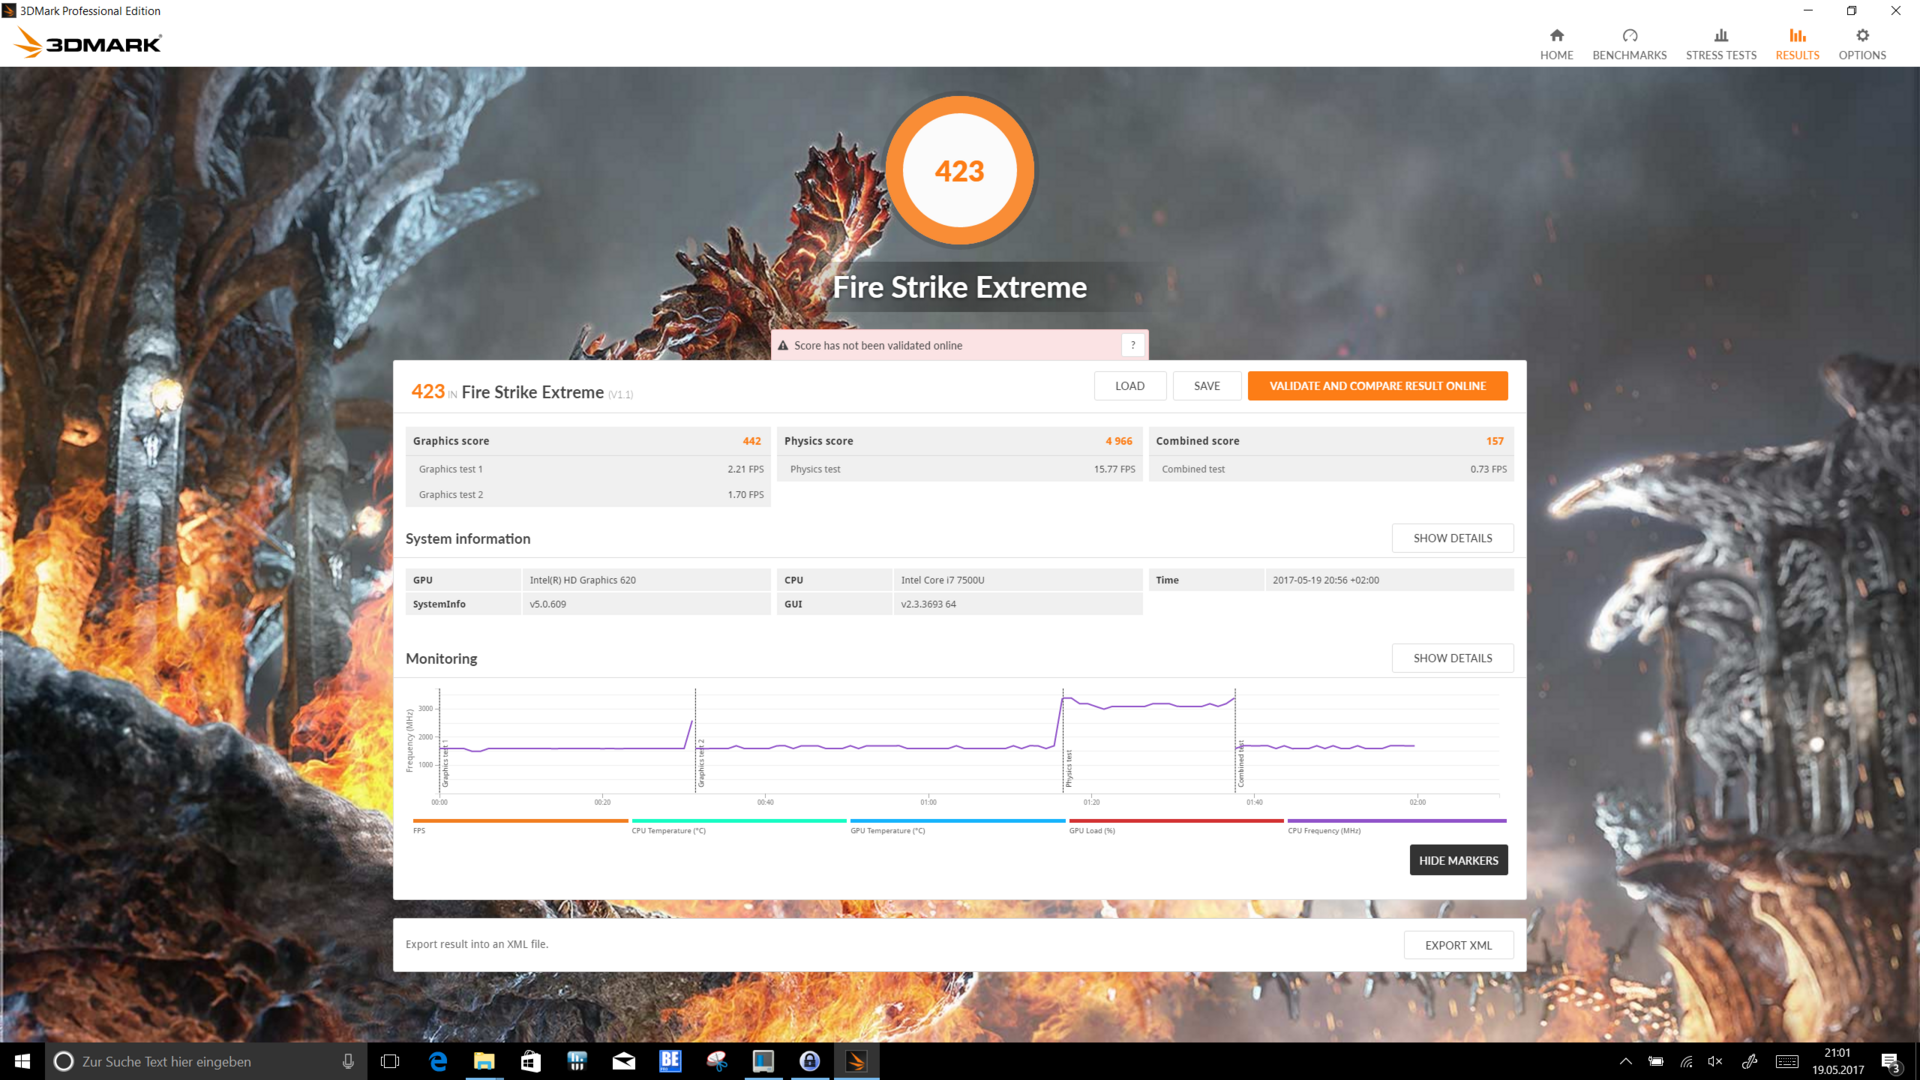
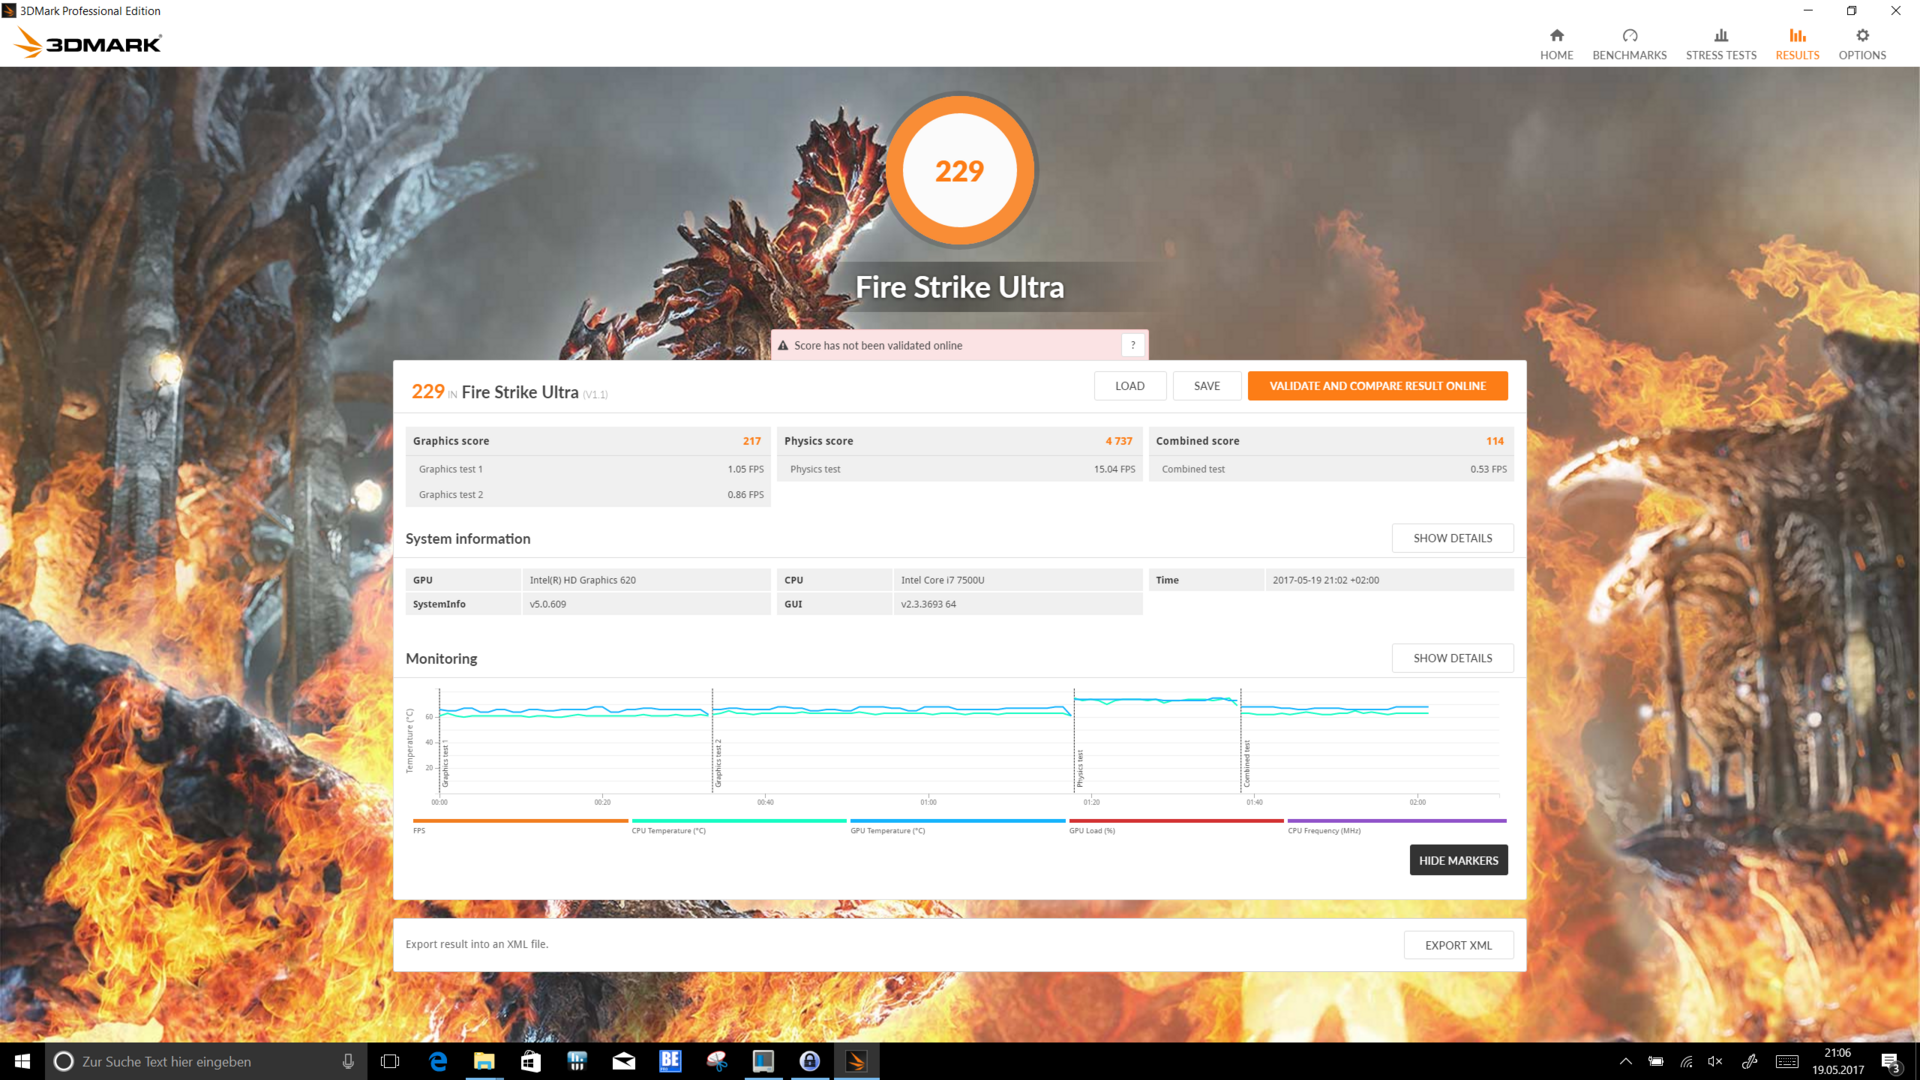
| 3DMark Fire Strike Extreme Score | 423 puan | |
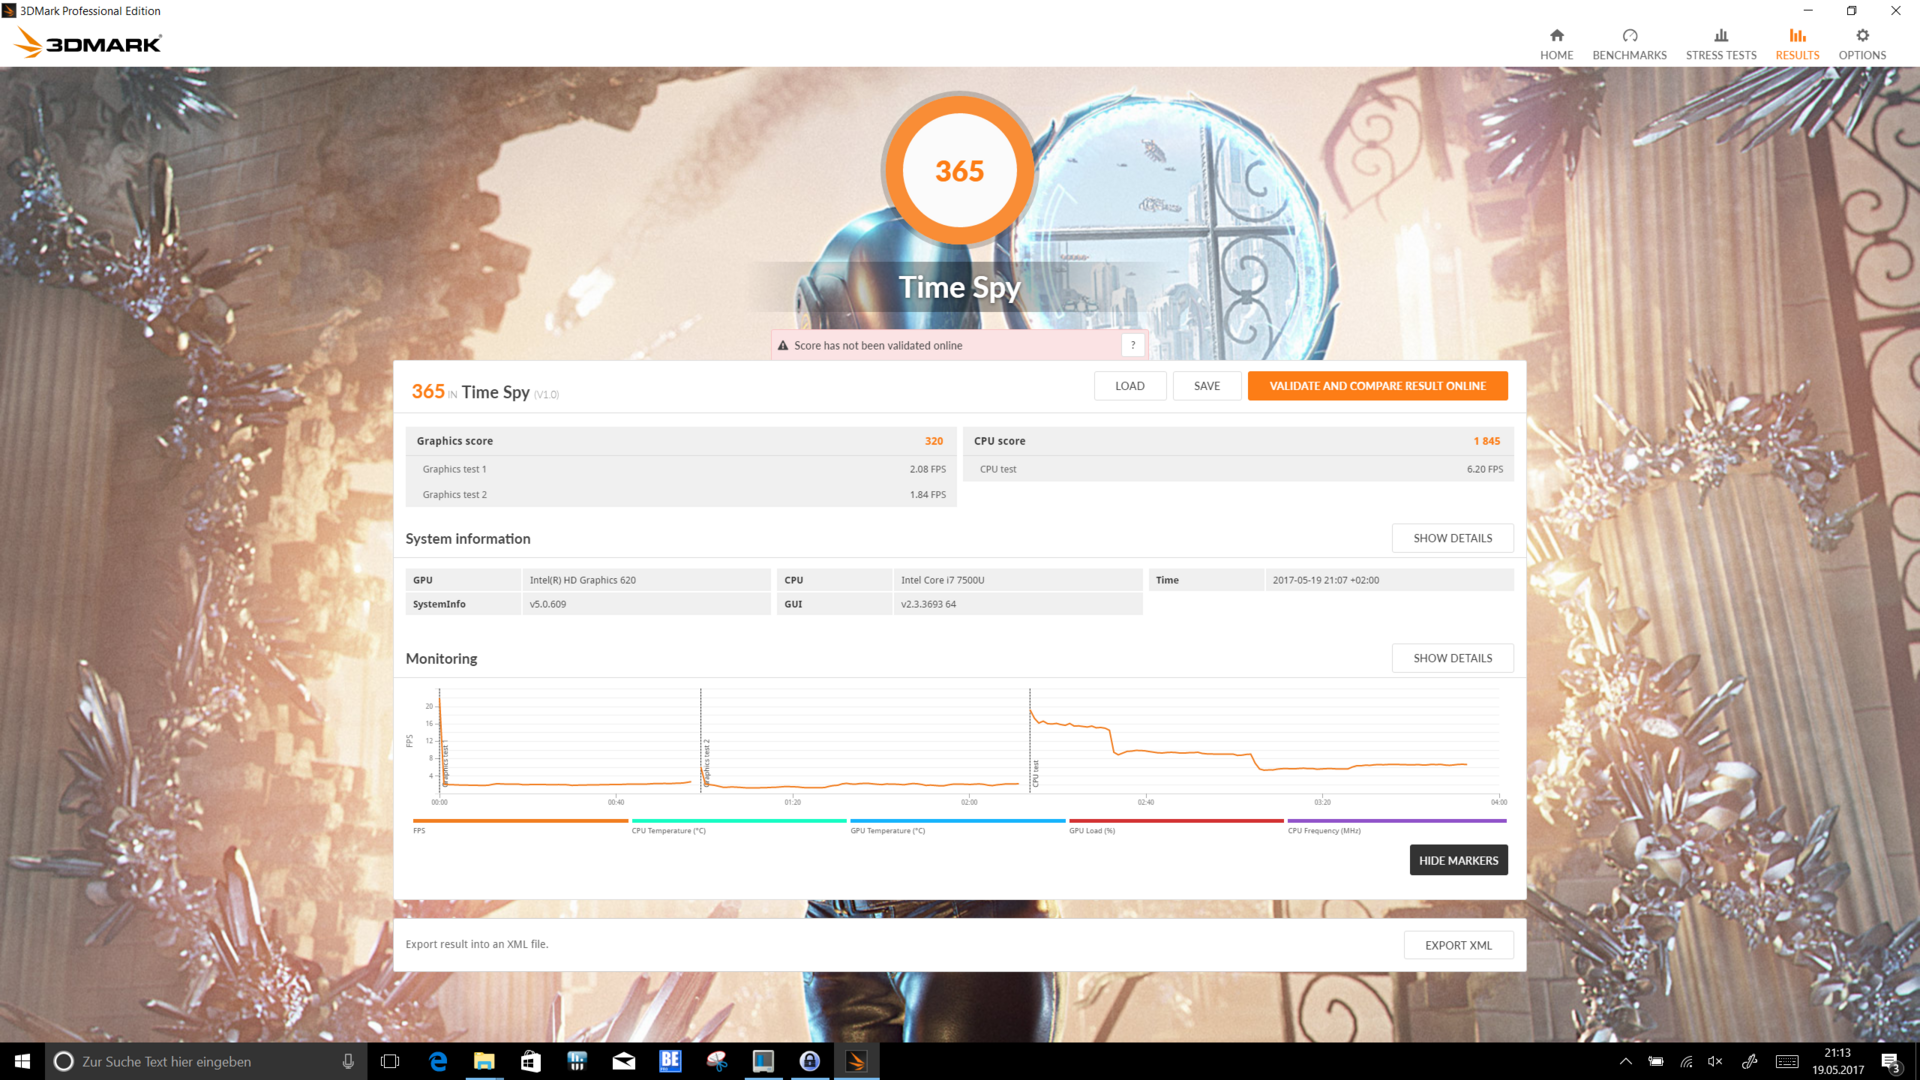
| 3DMark Time Spy Score | 365 puan | |
Yardım | ||
| düşük | orta | yüksek | ultra | |
|---|---|---|---|---|
| BioShock Infinite (2013) | 54.7 | 31 | 26.3 | 8.2 |
| Battlefield 4 (2013) | 35.3 | 29.1 | 20.1 | 6.3 |
| Rise of the Tomb Raider (2016) | 17.8 | 11.6 | 6.4 |
Ses yüksekliği
| Boşta |
| 29.3 / 31.1 / 33.3 dB |
| Çalışırken |
| 33.3 / 38.9 dB |
 | ||
30 dB sessiz 40 dB(A) duyulabilirlik 50 dB(A) gürültülü |
||
min: | ||
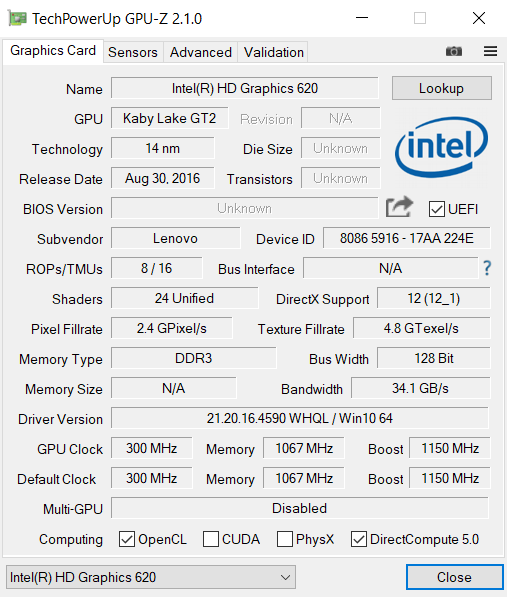
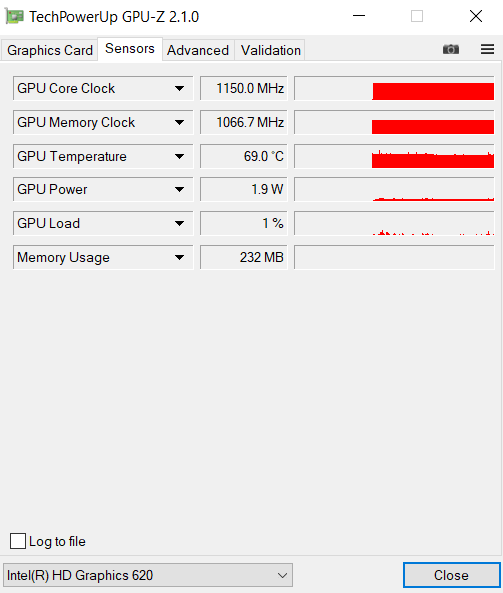
| Lenovo ThinkPad X1 Yoga 2017 20JES03T00 i7-7600U, HD Graphics 620 | Lenovo ThinkPad X1 Yoga-20FRS1VS00 6600U, HD Graphics 520 | HP EliteBook x360 1030 G2 i5-7300U, HD Graphics 620 | Toshiba Portege X20W-D-10R i7-7600U, HD Graphics 620 | Dell Latitude 12 5285 2-in-1 i7-7600U, HD Graphics 620 | Microsoft Surface Book with Performance Base 6600U, GeForce GTX 965M | |
|---|---|---|---|---|---|---|
| Noise | 3% | 5% | 5% | 9% | -1% | |
| kapalı / ortam * (dB) | 29.3 | 28.9 1% | 29 1% | 30.4 -4% | 28.2 4% | 29.4 -0% |
| Idle Minimum * (dB) | 29.3 | 28.9 1% | 29 1% | 30.5 -4% | 28.2 4% | 29.4 -0% |
| Idle Average * (dB) | 31.1 | 28.9 7% | 29 7% | 30.5 2% | 28.2 9% | 29.4 5% |
| Idle Maximum * (dB) | 33.3 | 28.9 13% | 29 13% | 30.5 8% | 28.2 15% | 29.7 11% |
| Load Average * (dB) | 33.3 | 35.3 -6% | 33.6 -1% | 31.2 6% | 30.4 9% | 39 -17% |
| Load Maximum * (dB) | 38.9 | 38.9 -0% | 35.8 8% | 31.3 20% | 34 13% | 40.2 -3% |
| Witcher 3 ultra * (dB) | 39.5 |
* ... daha küçük daha iyidir
| Lenovo ThinkPad X1 Yoga 2017 20JES03T00 i7-7600U, HD Graphics 620 | Lenovo ThinkPad X1 Yoga-20FRS1VS00 6600U, HD Graphics 520 | HP EliteBook x360 1030 G2 i5-7300U, HD Graphics 620 | Toshiba Portege X20W-D-10R i7-7600U, HD Graphics 620 | Dell Latitude 12 5285 2-in-1 i7-7600U, HD Graphics 620 | Microsoft Surface Book with Performance Base 6600U, GeForce GTX 965M | |
|---|---|---|---|---|---|---|
| Heat | -17% | 5% | 19% | -8% | -16% | |
| Maximum Upper Side * (°C) | 47.5 | 45.5 4% | 36.1 24% | 35.7 25% | 38.2 20% | 47 1% |
| Maximum Bottom * (°C) | 44.8 | 47.1 -5% | 36.7 18% | 24.2 46% | 48.6 -8% | 47 -5% |
| Idle Upper Side * (°C) | 23.7 | 31.1 -31% | 26.8 -13% | 23.4 1% | 29.6 -25% | 34.4 -45% |
| Idle Bottom * (°C) | 24.6 | 33.1 -35% | 26.5 -8% | 24.2 2% | 28.8 -17% | 27.7 -13% |
* ... daha küçük daha iyidir
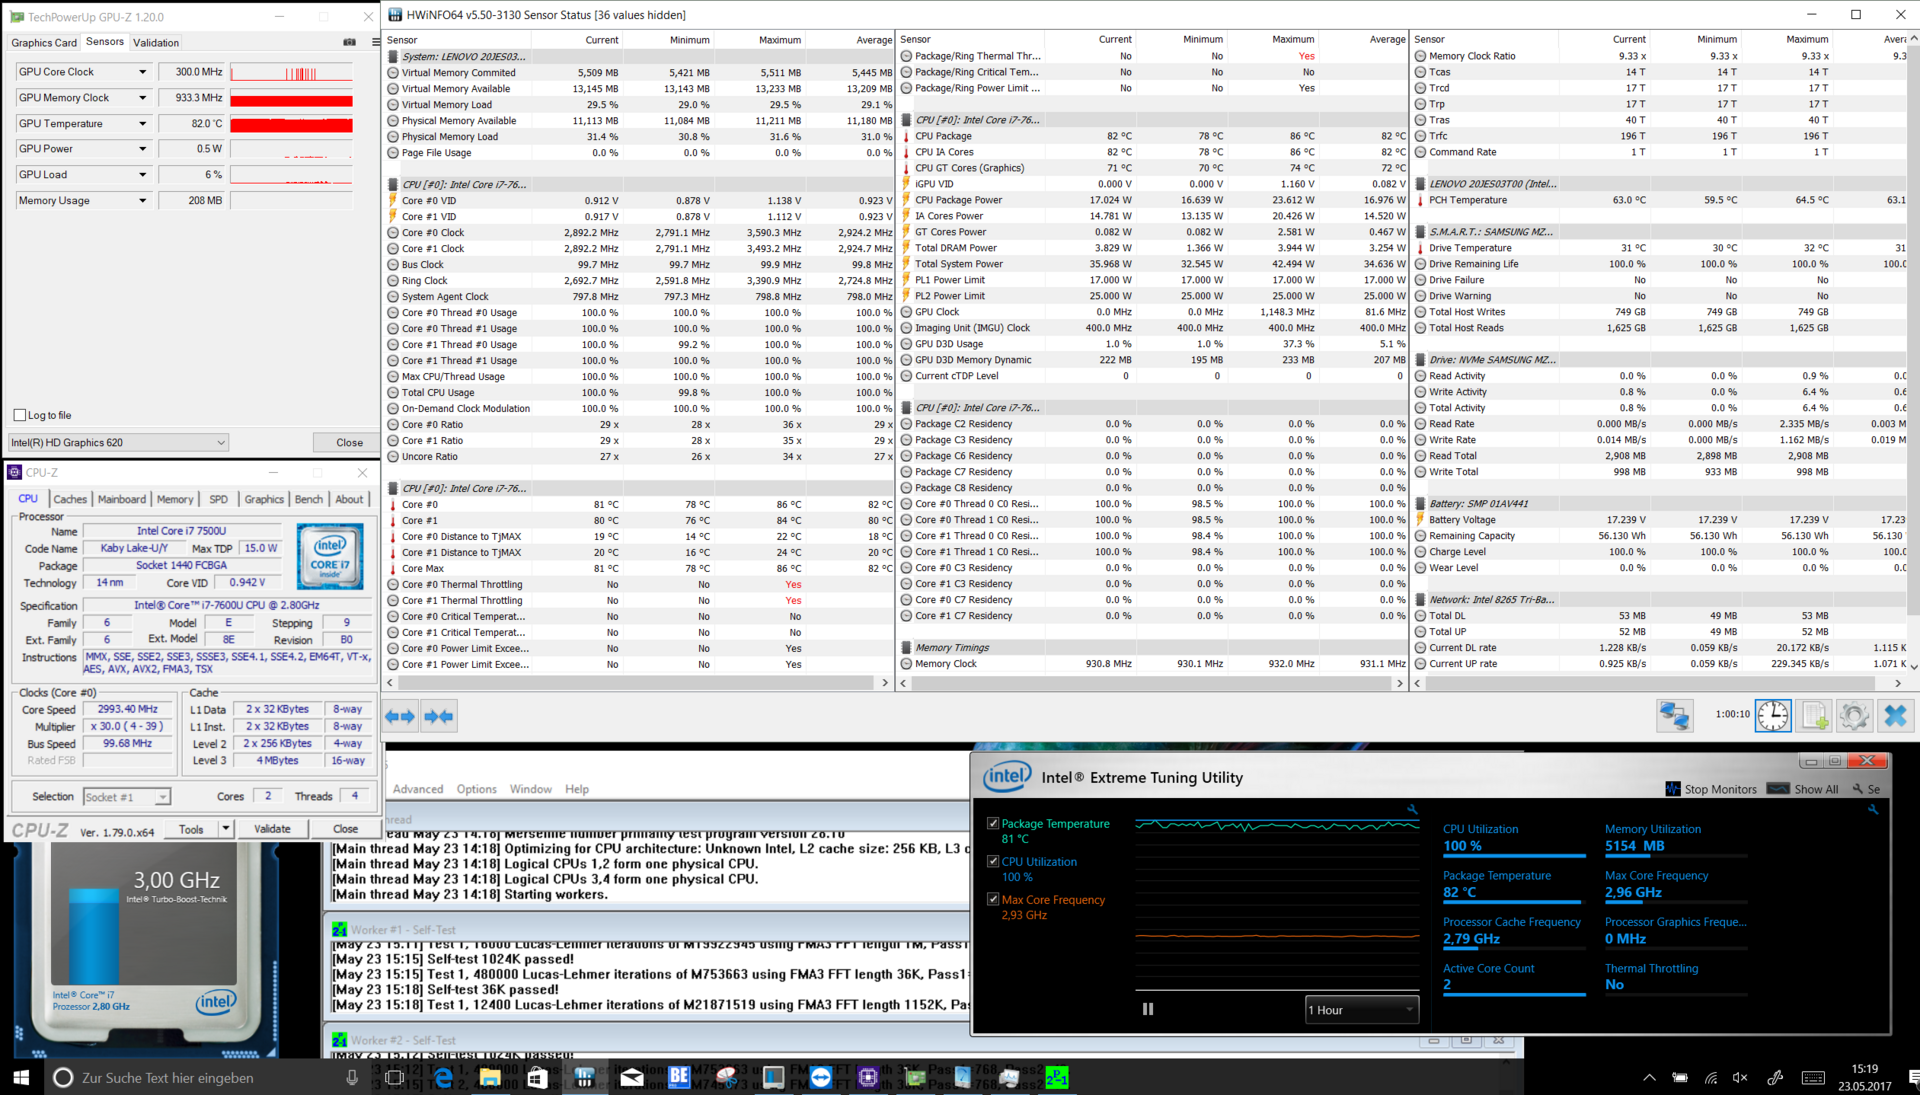
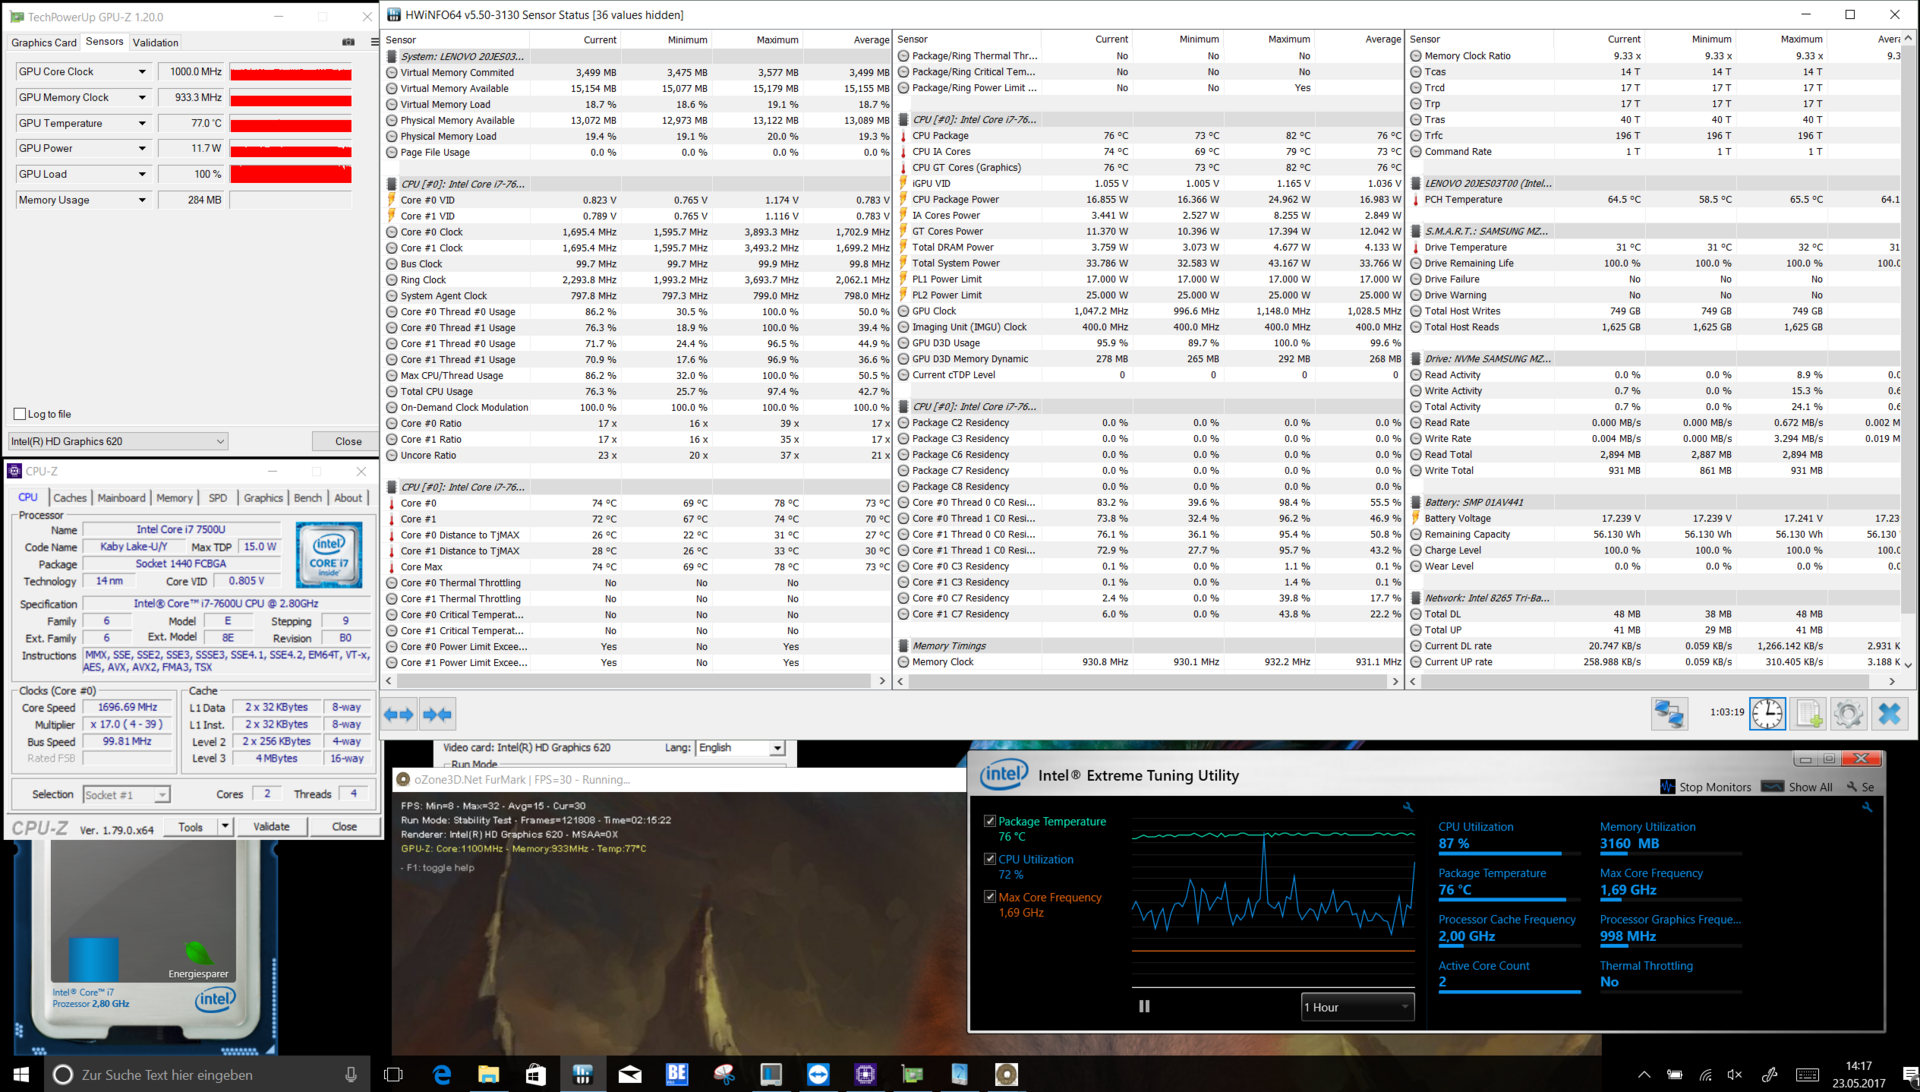
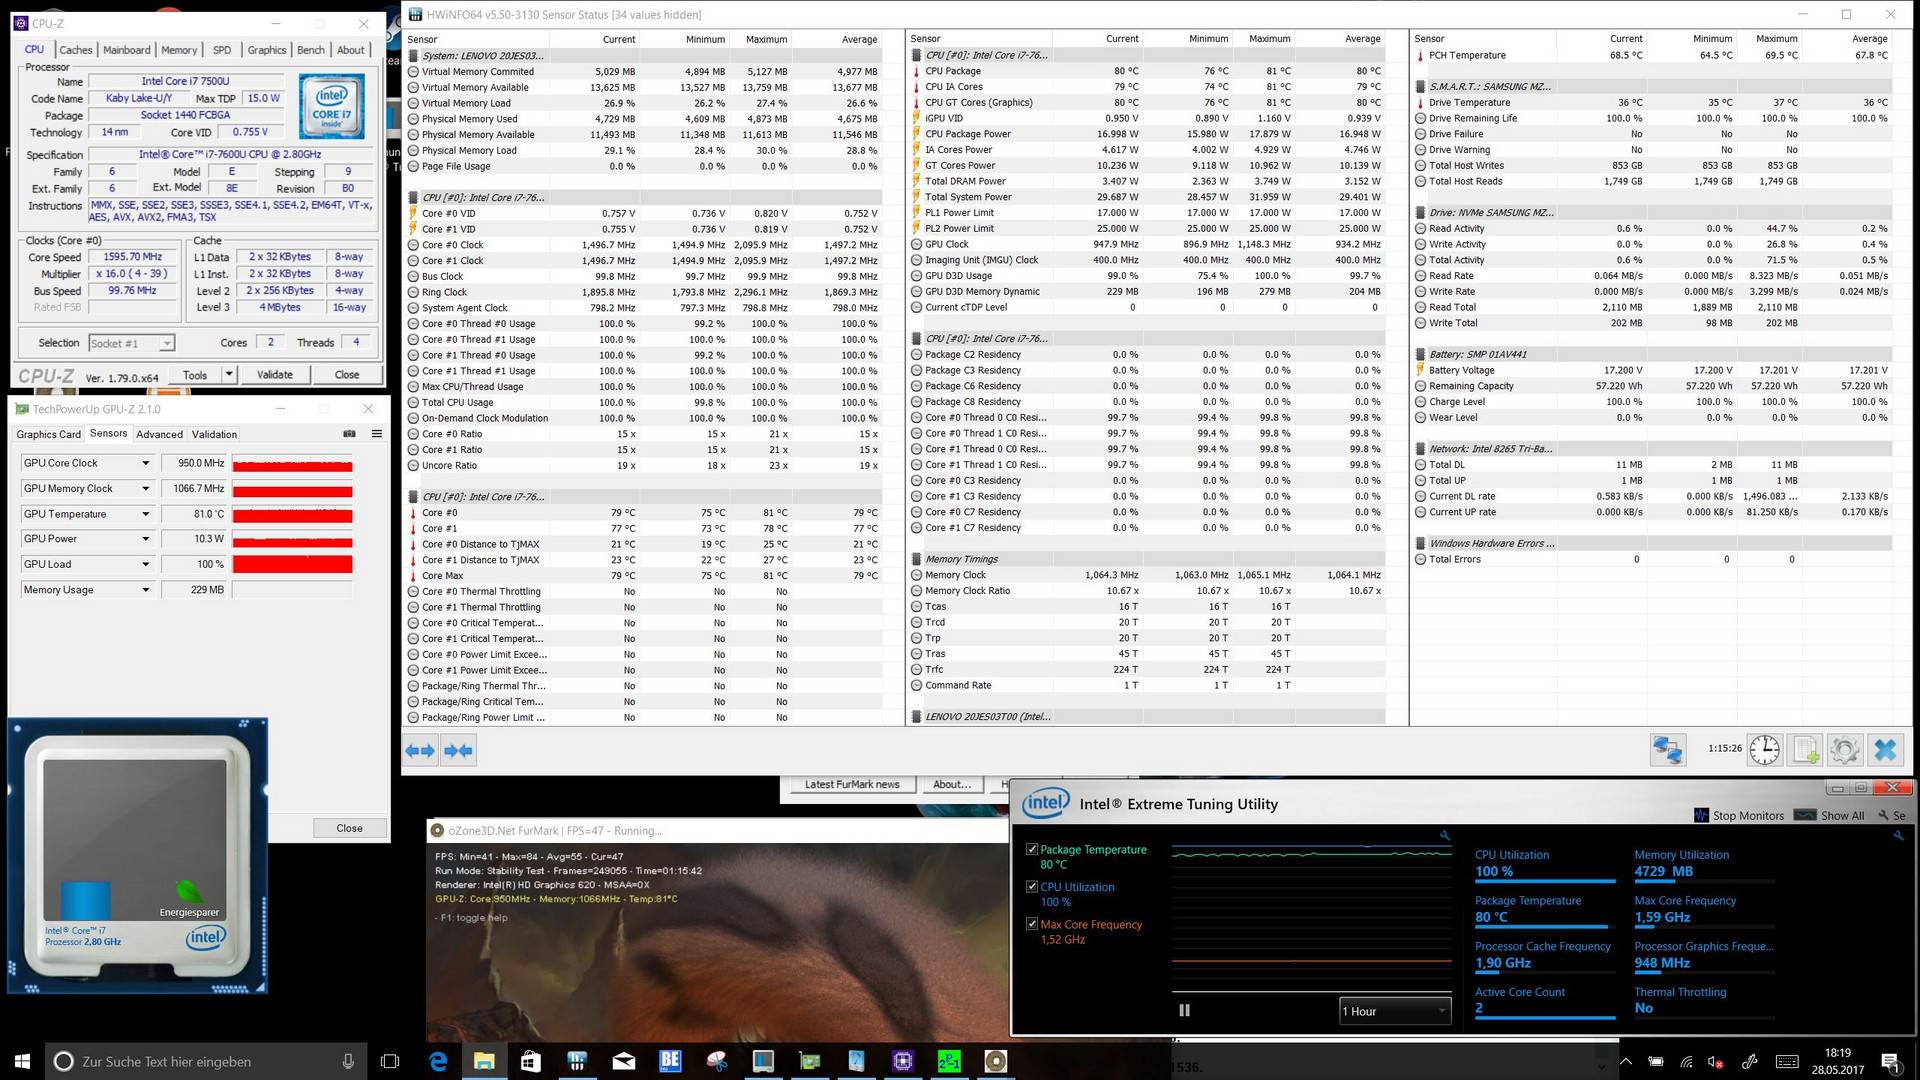
(-) Üst taraftaki maksimum sıcaklık, 35.4 °C / 96 F ortalamasına kıyasla 47.5 °C / 118 F'dir. , Convertible sınıfı için 19.6 ile 60 °C arasında değişir.
(±) Alt kısım, 36.9 °C / 98 F ortalamasına kıyasla maksimum 44.8 °C / 113 F'ye kadar ısınır
(+) Boşta kullanımda, üst tarafın ortalama sıcaklığı 22.9 °C / 73 F olup, cihazın 30.3 °C / 87 F.
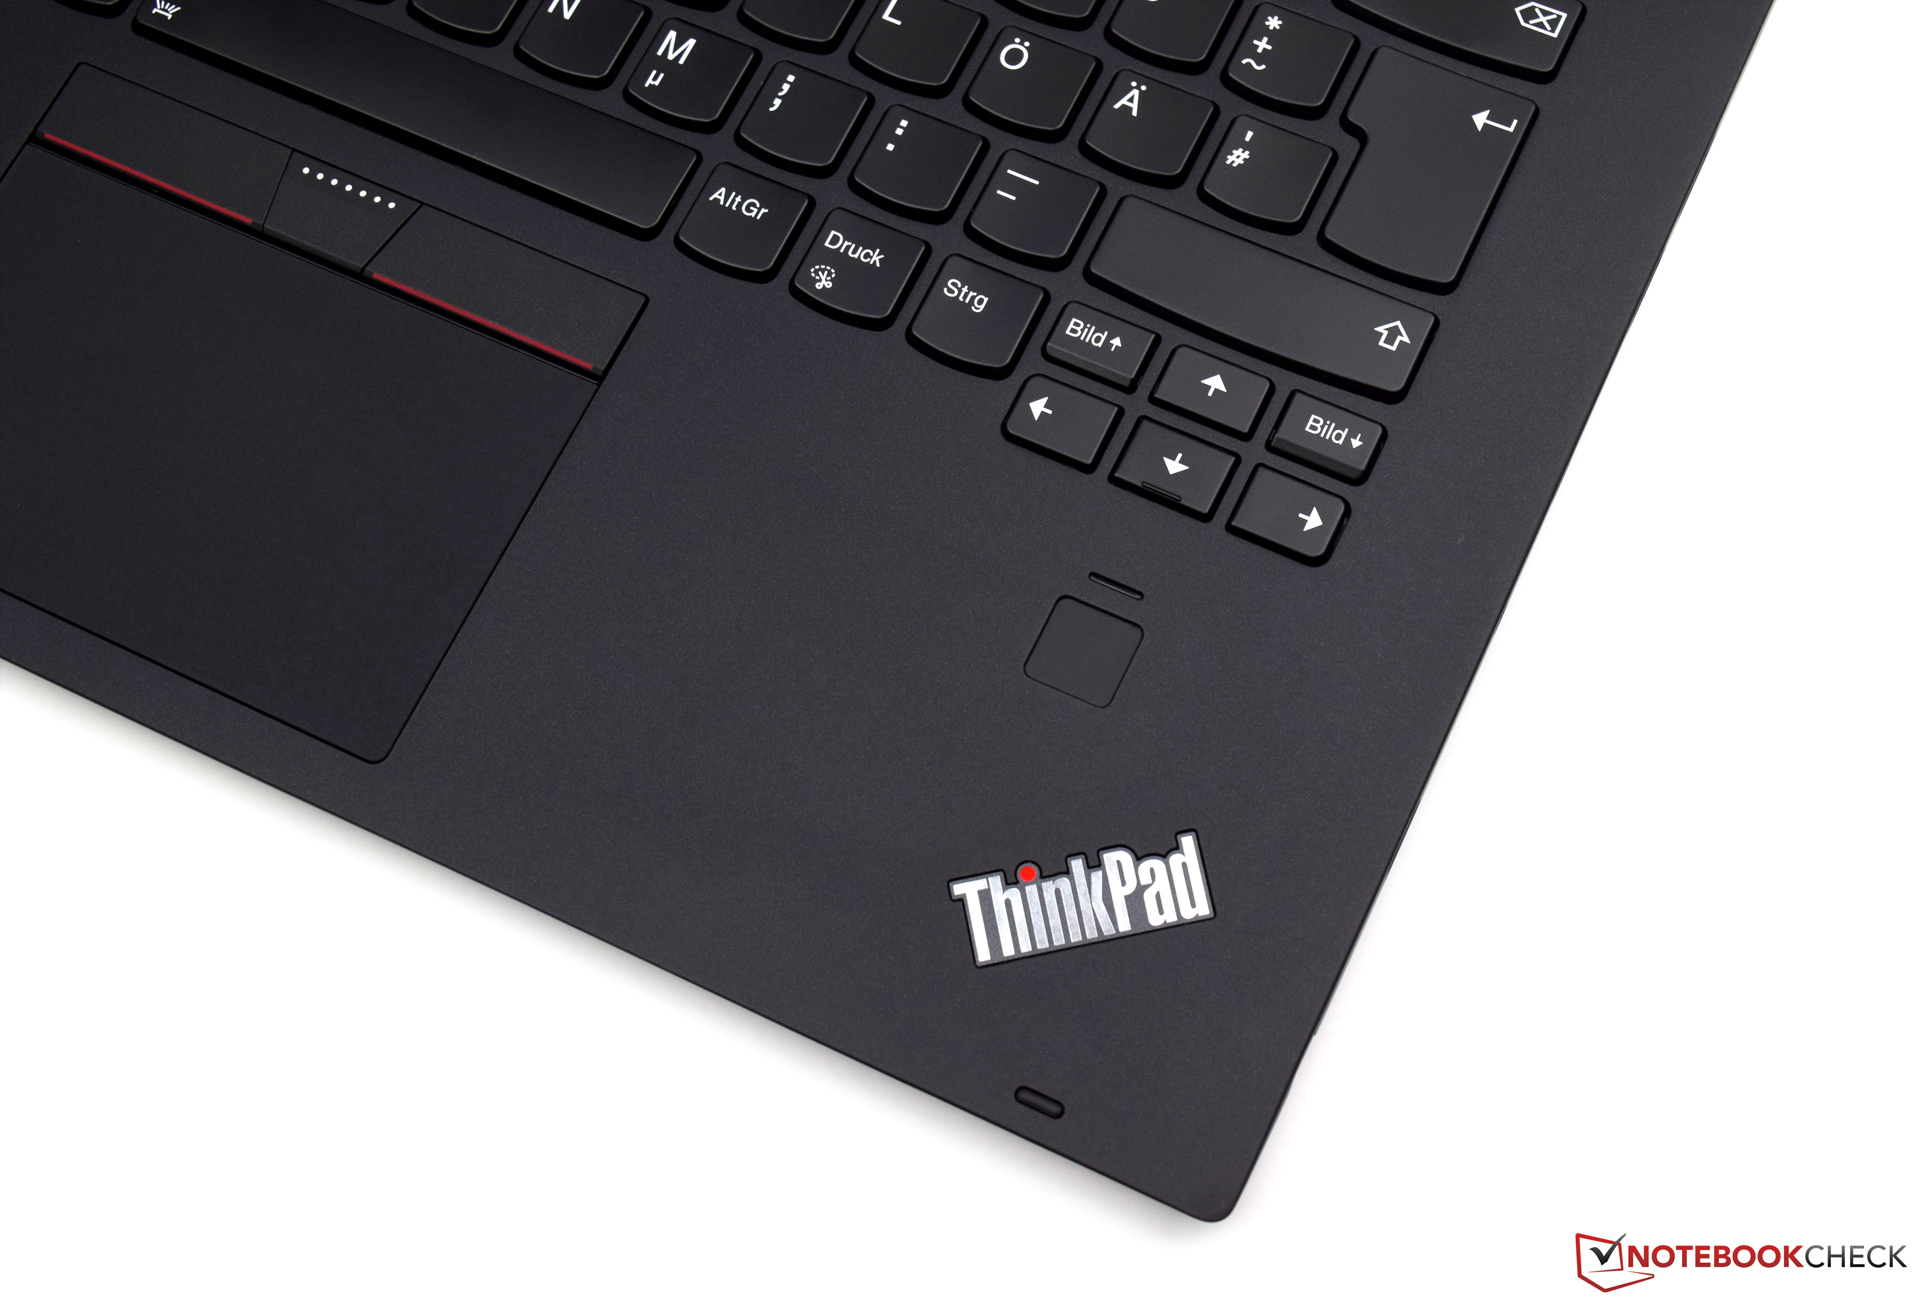
(+) Avuç içi dayanakları ve dokunmatik yüzey, maksimum 30.2 °C / 86.4 F ile cilt sıcaklığından daha soğuktur ve bu nedenle dokunulduğunda soğuktur.
(-) Benzer cihazların avuç içi dayanağı alanının ortalama sıcaklığı 28 °C / 82.4 F (-2.2 °C / -4 F) idi.
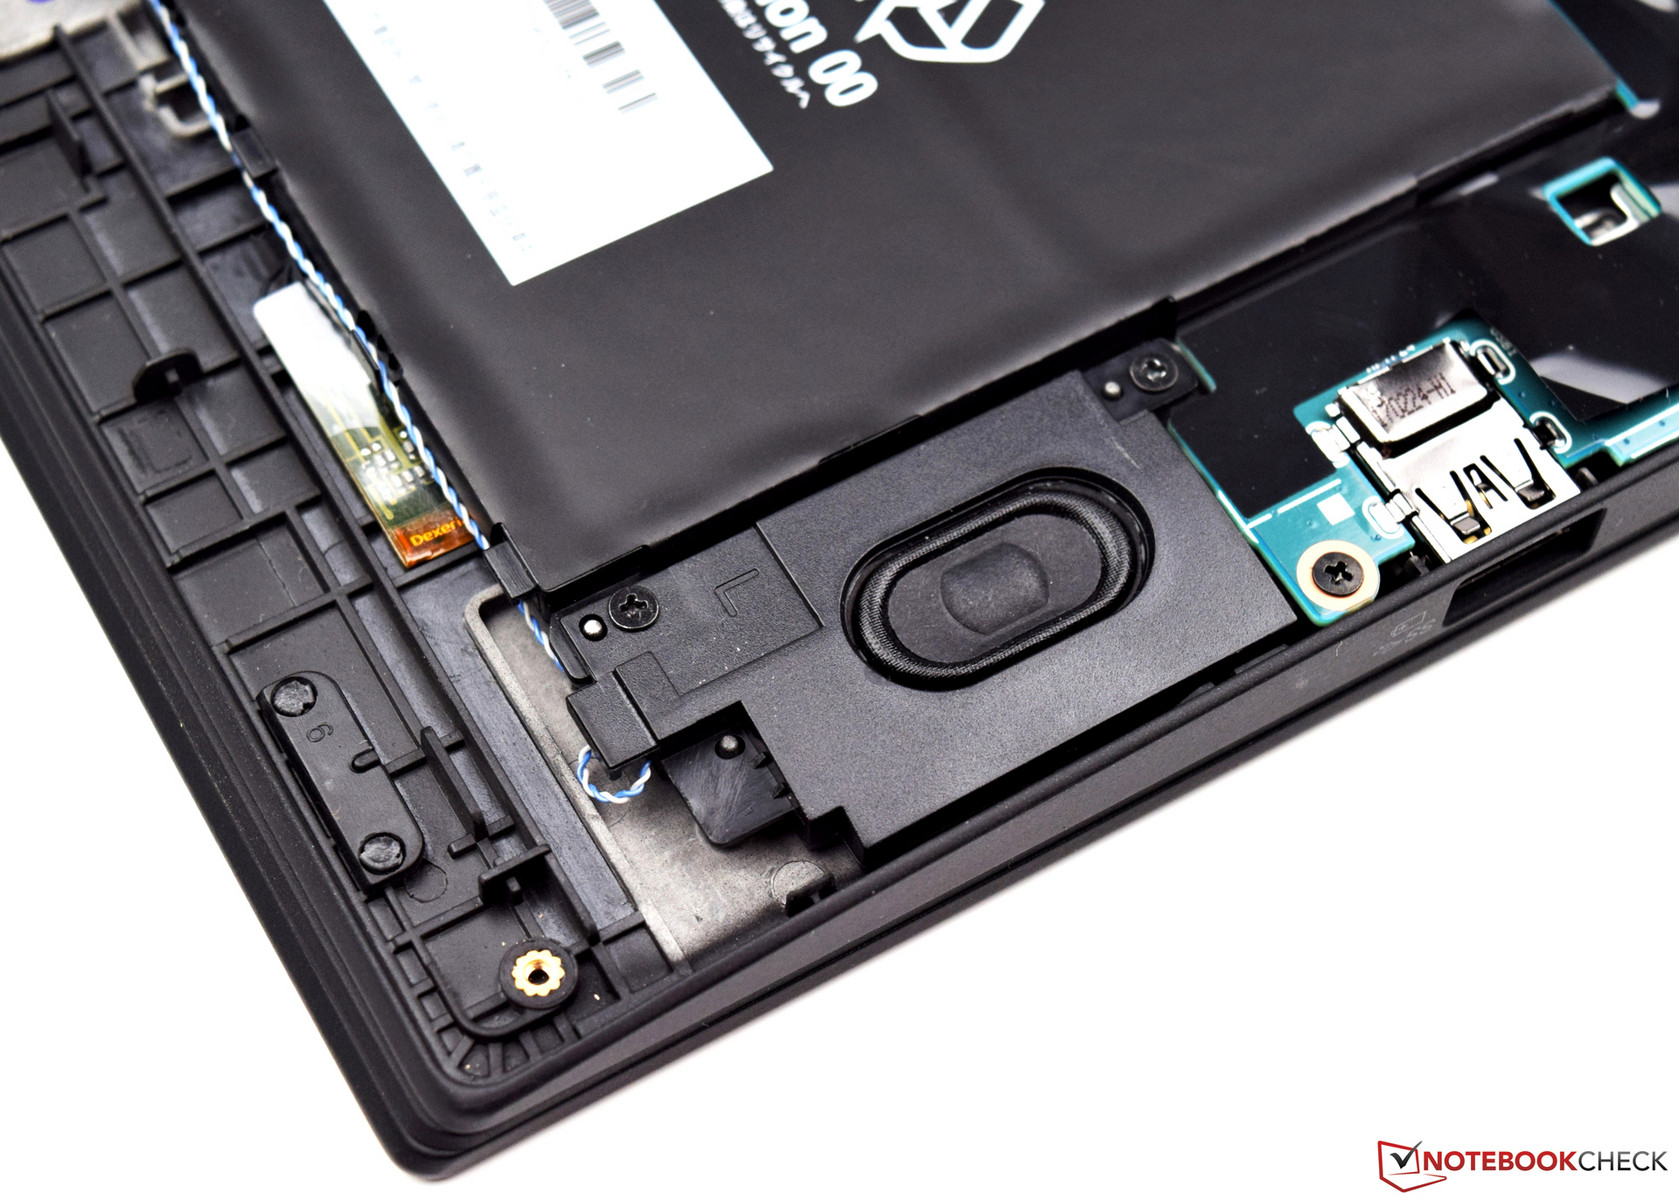
Lenovo ThinkPad X1 Yoga 2017 20JES03T00 ses analizi
(±) | hoparlör ses yüksekliği ortalama ama iyi (73.3 dB)
Bas 100 - 315Hz
(-) | neredeyse hiç bas yok - ortalama olarak medyandan 19.1% daha düşük
(±) | Bas doğrusallığı ortalamadır (8.6% delta - önceki frekans)
Ortalar 400 - 2000 Hz
(+) | dengeli ortalar - medyandan yalnızca 2.6% uzakta
(±) | Ortaların doğrusallığı ortalamadır (8% delta - önceki frekans)
Yüksekler 2 - 16 kHz
(+) | dengeli yüksekler - medyandan yalnızca 2.6% uzakta
(+) | yüksekler doğrusaldır (6.6% deltadan önceki frekansa)
Toplam 100 - 16.000 Hz
(±) | Genel sesin doğrusallığı ortalamadır (21.7% ortancaya göre fark)
Aynı sınıfla karşılaştırıldığında
» Bu sınıftaki tüm test edilen cihazların %60%'si daha iyi, 9% benzer, 31% daha kötüydü
» En iyisinin deltası 6% idi, ortalama 20% idi, en kötüsü 57% idi
Test edilen tüm cihazlarla karşılaştırıldığında
» Test edilen tüm cihazların %62'si daha iyi, 7 benzer, % 31 daha kötüydü
» En iyisinin deltası 4% idi, ortalama 23% idi, en kötüsü 134% idi
Toshiba Portege X20W-D-10R ses analizi
(-) | hoparlörler çok yüksek ses çıkarmıyor (64 dB)
Bas 100 - 315Hz
(-) | neredeyse hiç bas yok - ortalama olarak medyandan 24.3% daha düşük
(±) | Bas doğrusallığı ortalamadır (11.3% delta - önceki frekans)
Ortalar 400 - 2000 Hz
(+) | dengeli ortalar - medyandan yalnızca 3.5% uzakta
(±) | Ortaların doğrusallığı ortalamadır (7.9% delta - önceki frekans)
Yüksekler 2 - 16 kHz
(+) | dengeli yüksekler - medyandan yalnızca 4.8% uzakta
(+) | yüksekler doğrusaldır (6.2% deltadan önceki frekansa)
Toplam 100 - 16.000 Hz
(±) | Genel sesin doğrusallığı ortalamadır (27% ortancaya göre fark)
Aynı sınıfla karşılaştırıldığında
» Bu sınıftaki tüm test edilen cihazların %83%'si daha iyi, 3% benzer, 14% daha kötüydü
» En iyisinin deltası 6% idi, ortalama 20% idi, en kötüsü 57% idi
Test edilen tüm cihazlarla karşılaştırıldığında
» Test edilen tüm cihazların %83'si daha iyi, 4 benzer, % 14 daha kötüydü
» En iyisinin deltası 4% idi, ortalama 23% idi, en kötüsü 134% idi
| Kapalı / Bekleme modu | |
| Boşta | |
| Çalışırken |
|
Key:
min: | |
| Lenovo ThinkPad X1 Yoga 2017 20JES03T00 i7-7600U, HD Graphics 620, Samsung SSD PM961 1TB M.2 PCIe 3.0 x4 NVMe (MZVLW1T0), OLED, 2560x1440, 14" | Lenovo ThinkPad X1 Yoga-20FRS1VS00 6600U, HD Graphics 520, Samsung SSD PM961 1TB M.2 PCIe 3.0 x4 NVMe (MZSLW1T0), OLED, 2560x1440, 14" | HP EliteBook x360 1030 G2 i5-7300U, HD Graphics 620, Sandisk SD8TN8U-256G-1006, IPS, 1920x1080, 13.3" | Toshiba Portege X20W-D-10R i7-7600U, HD Graphics 620, Toshiba SG5 THNSNK512GVN8, IPS, 1920x1080, 12.5" | Dell Latitude 12 5285 2-in-1 i7-7600U, HD Graphics 620, Samsung PM961 MZVLW256HEHP, IPS, 1920x1280, 12.3" | Microsoft Surface Book with Performance Base 6600U, GeForce GTX 965M, Toshiba NVMe THNSN5256GPU7, IPS, 3000x2000, 13.5" | |
|---|---|---|---|---|---|---|
| Power Consumption | 1% | 28% | 39% | 25% | -28% | |
| Idle Minimum * (Watt) | 4.9 | 4.7 4% | 3.2 35% | 3.4 31% | 2.85 42% | 4.15 15% |
| Idle Average * (Watt) | 7.6 | 8.6 -13% | 5.5 28% | 5.8 24% | 6.76 11% | 8 -5% |
| Idle Maximum * (Watt) | 13.8 | 12.2 12% | 6.5 53% | 6.7 51% | 6.91 50% | 11.9 14% |
| Load Average * (Watt) | 33.4 | 29.7 11% | 29.7 11% | 21.4 36% | 32.88 2% | 67 -101% |
| Load Maximum * (Watt) | 46.5 | 50.5 -9% | 41.3 11% | 21.6 54% | 37.41 20% | 76 -63% |
| Witcher 3 ultra * (Watt) | 58 |
* ... daha küçük daha iyidir

| Lenovo ThinkPad X1 Yoga 2017 20JES03T00 i7-7600U, HD Graphics 620, 56 Wh | Lenovo ThinkPad X1 Yoga-20FRS1VS00 6600U, HD Graphics 520, 56 Wh | HP EliteBook x360 1030 G2 i5-7300U, HD Graphics 620, 57 Wh | Toshiba Portege X20W-D-10R i7-7600U, HD Graphics 620, 44 Wh | Dell Latitude 12 5285 2-in-1 i7-7600U, HD Graphics 620, 42 Wh | Microsoft Surface Book with Performance Base 6600U, GeForce GTX 965M, 78 Wh | |
|---|---|---|---|---|---|---|
| Pil Çalışma Süresi | 8% | 79% | 50% | 20% | 42% | |
| Reader / Idle (h) | 13.1 | 13.7 5% | 23.1 76% | 16.7 27% | 17.9 37% | 25.5 95% |
| H.264 (h) | 6.8 | 8.7 28% | 11 62% | |||
| WiFi v1.3 (h) | 6.1 | 5.3 -13% | 10.5 72% | 12 97% | 8.1 33% | 9.6 57% |
| Load (h) | 2 | 2.2 10% | 4.1 105% | 2.5 25% | 1.8 -10% | 1.5 -25% |
Artılar
Eksiler
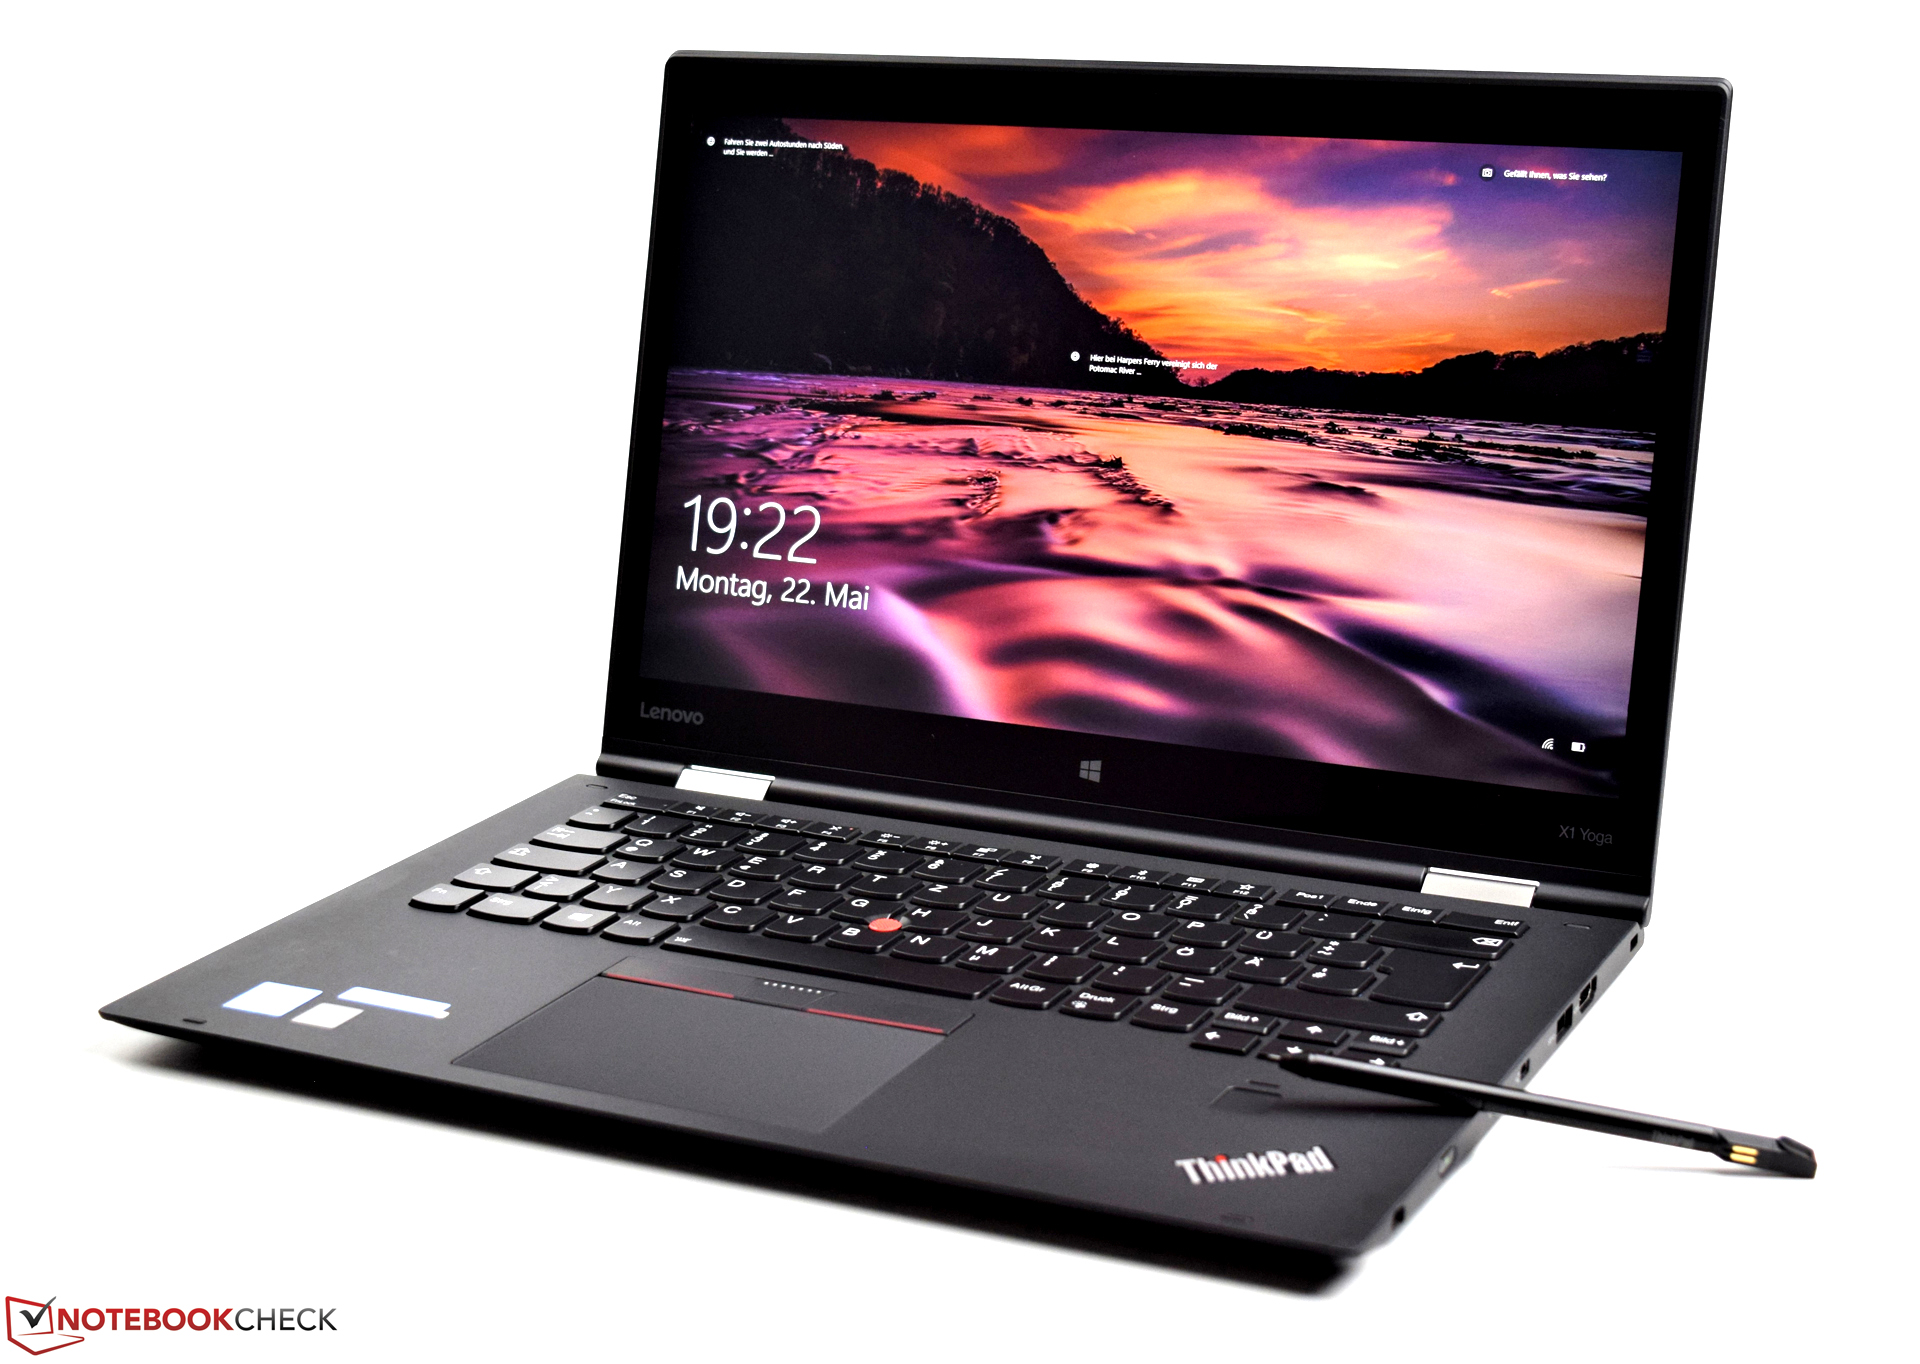
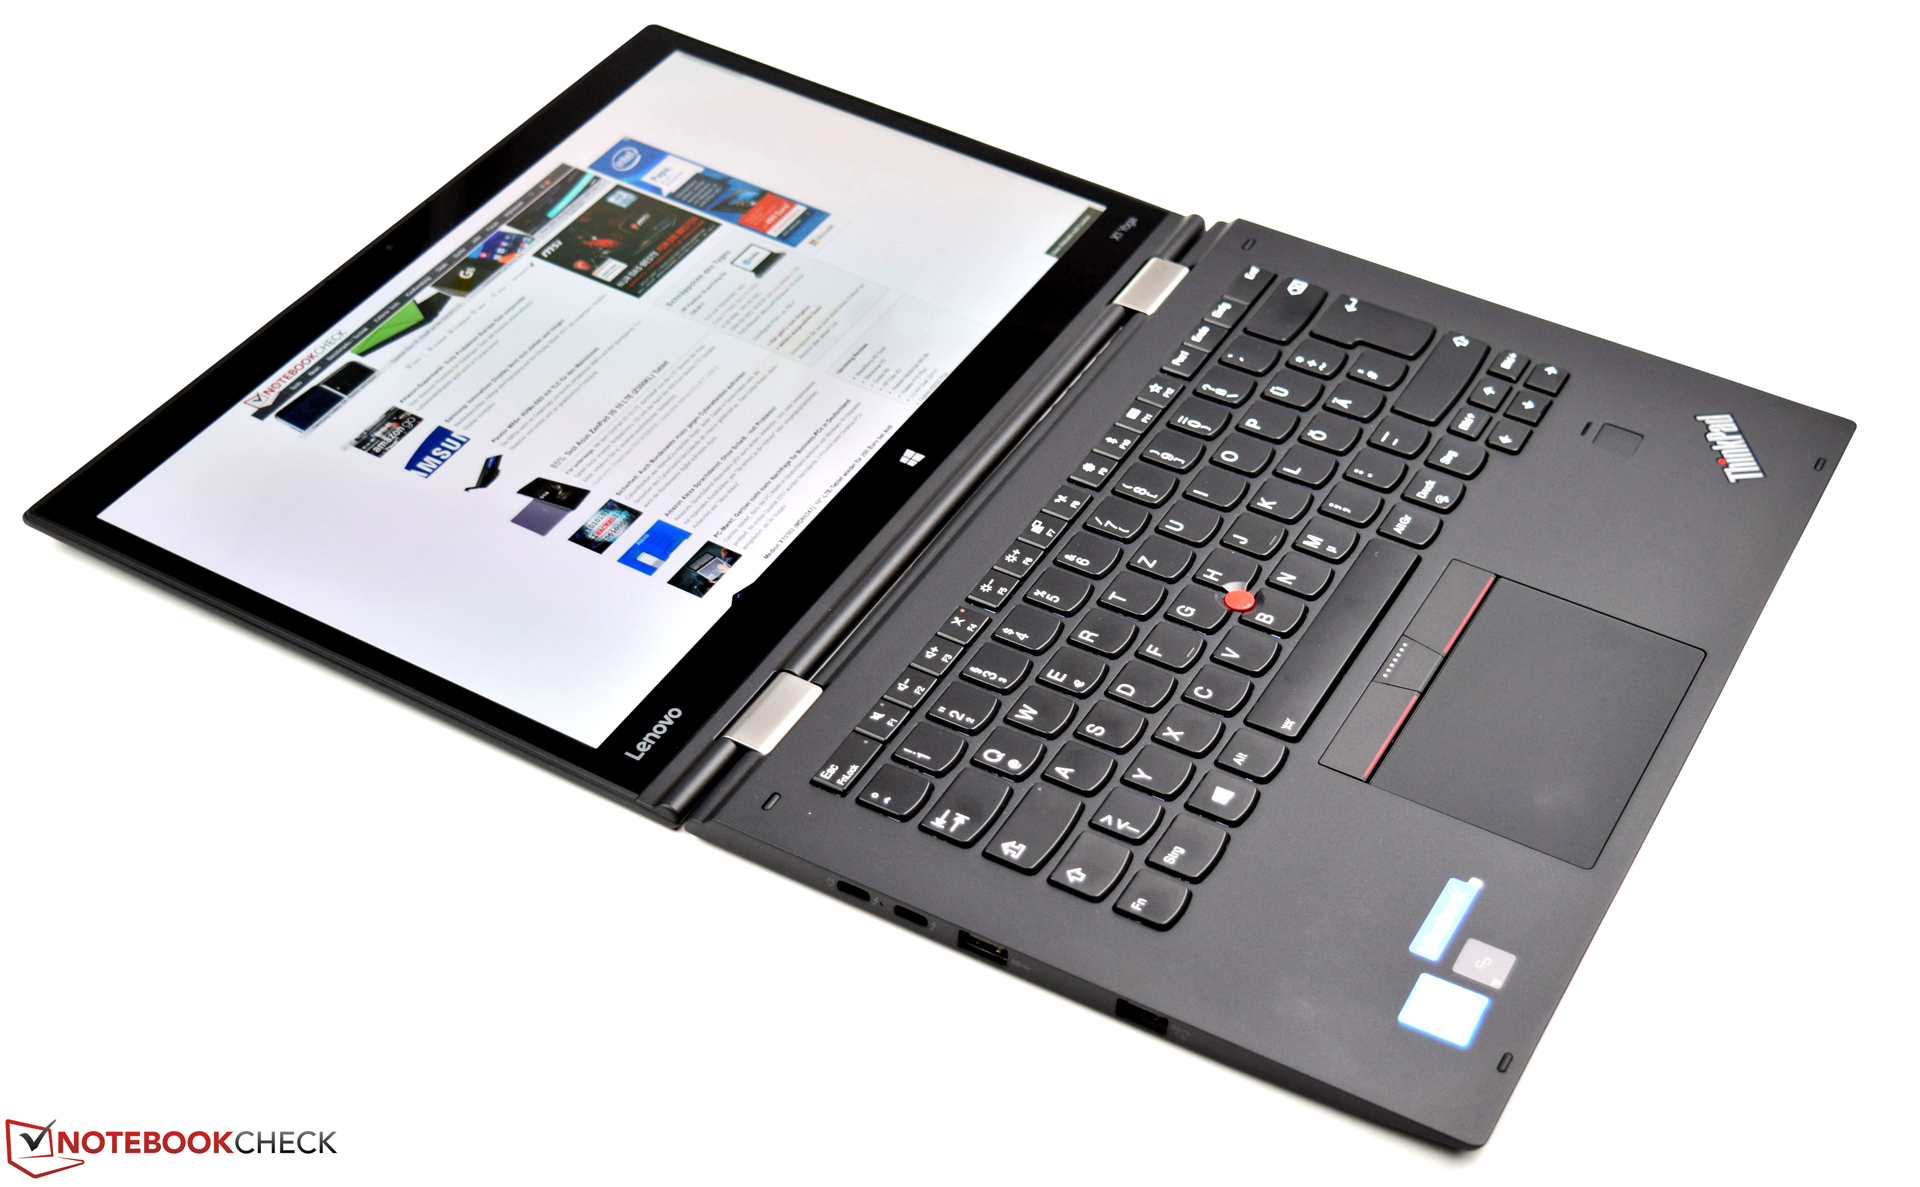
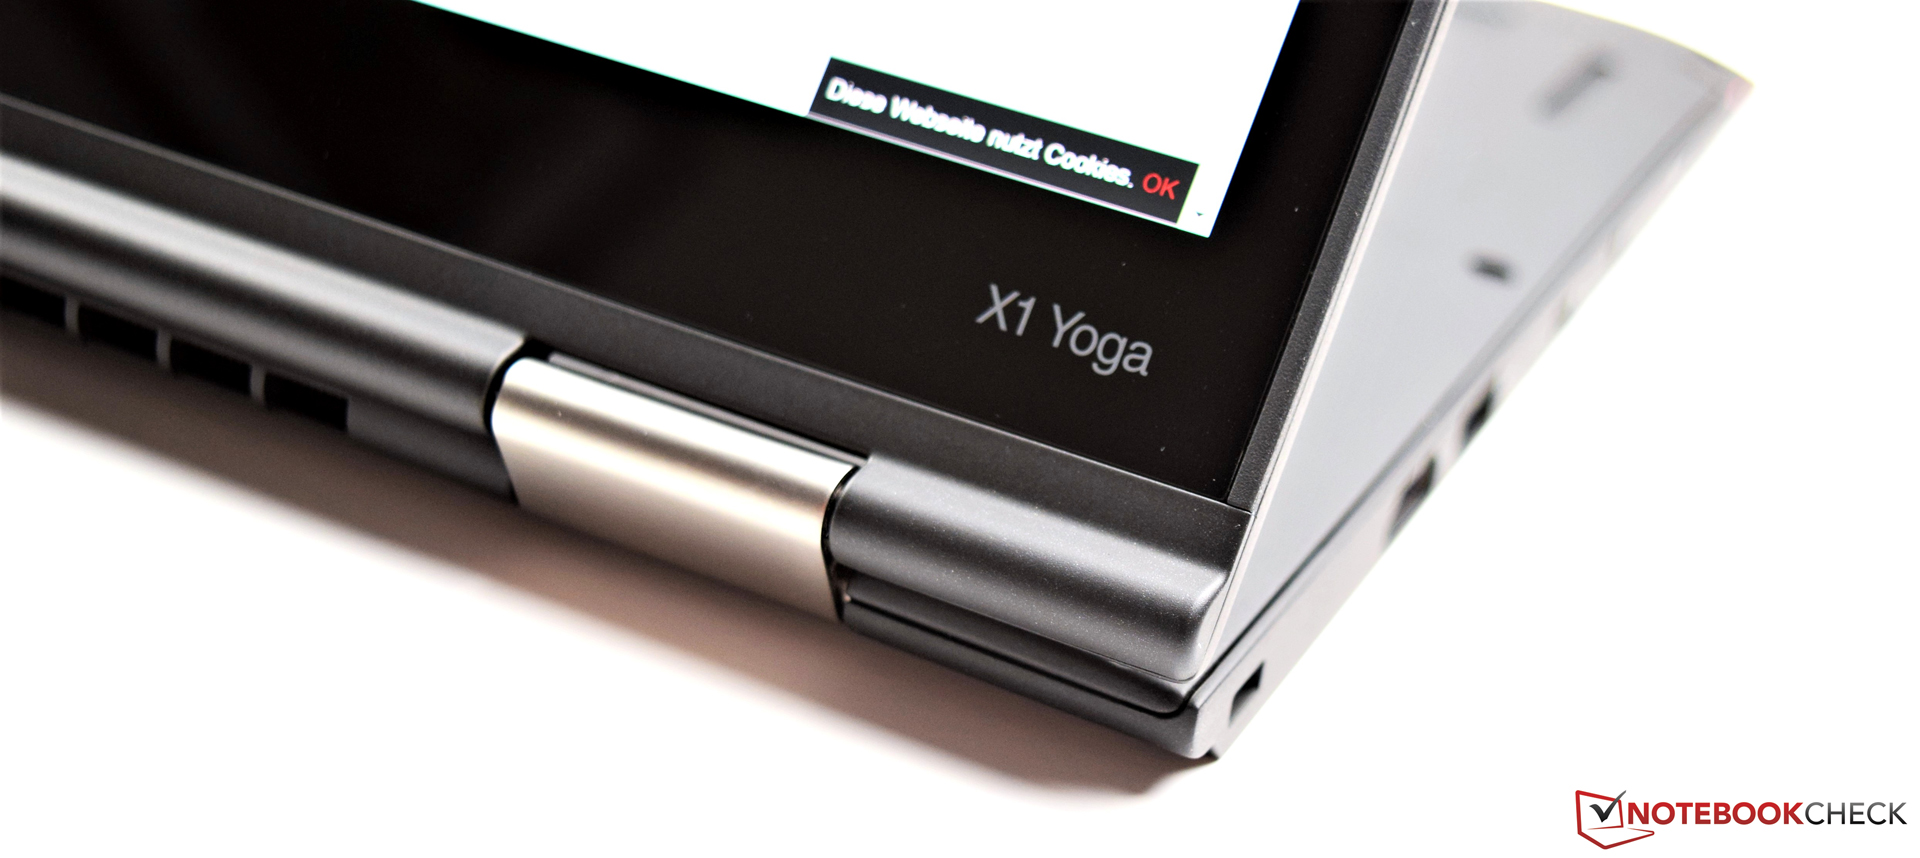
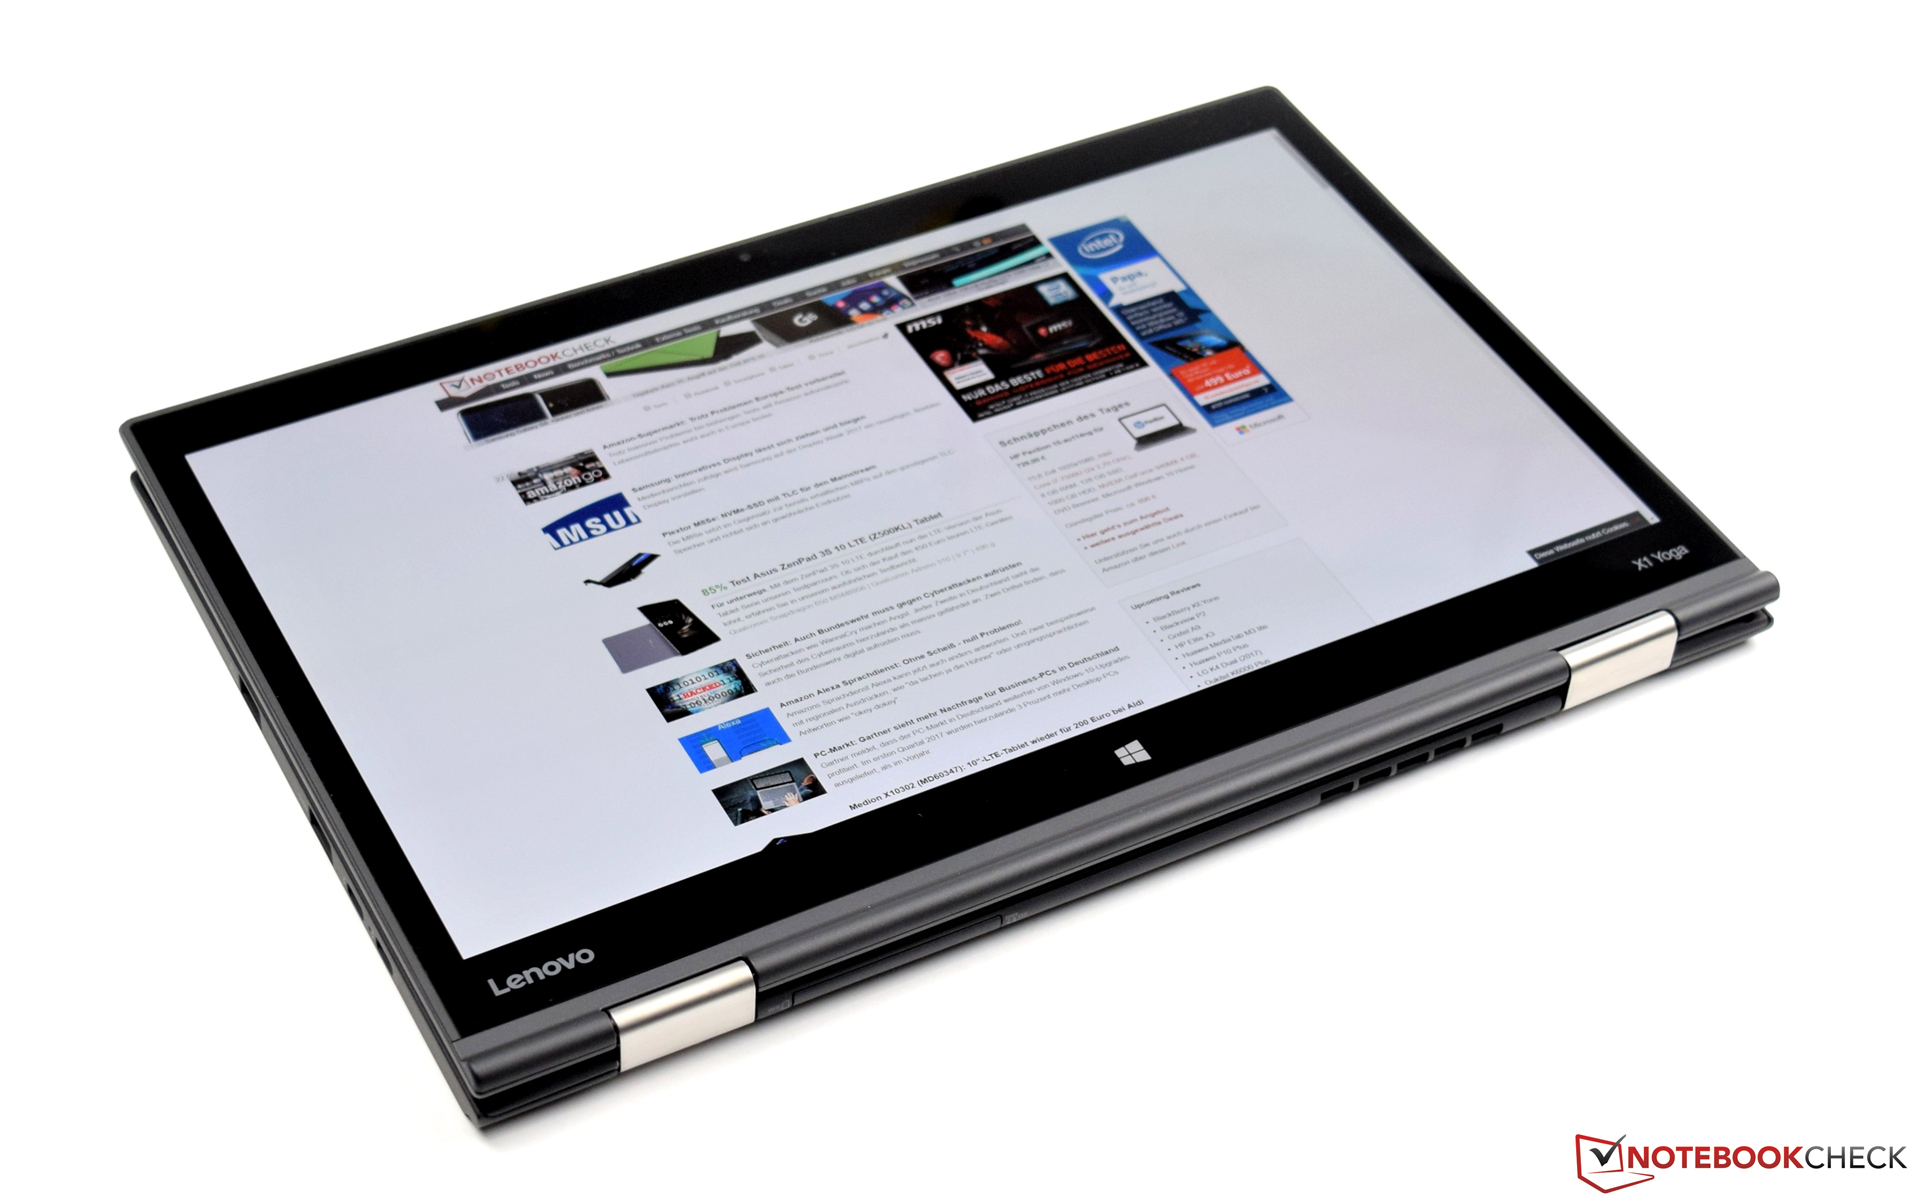
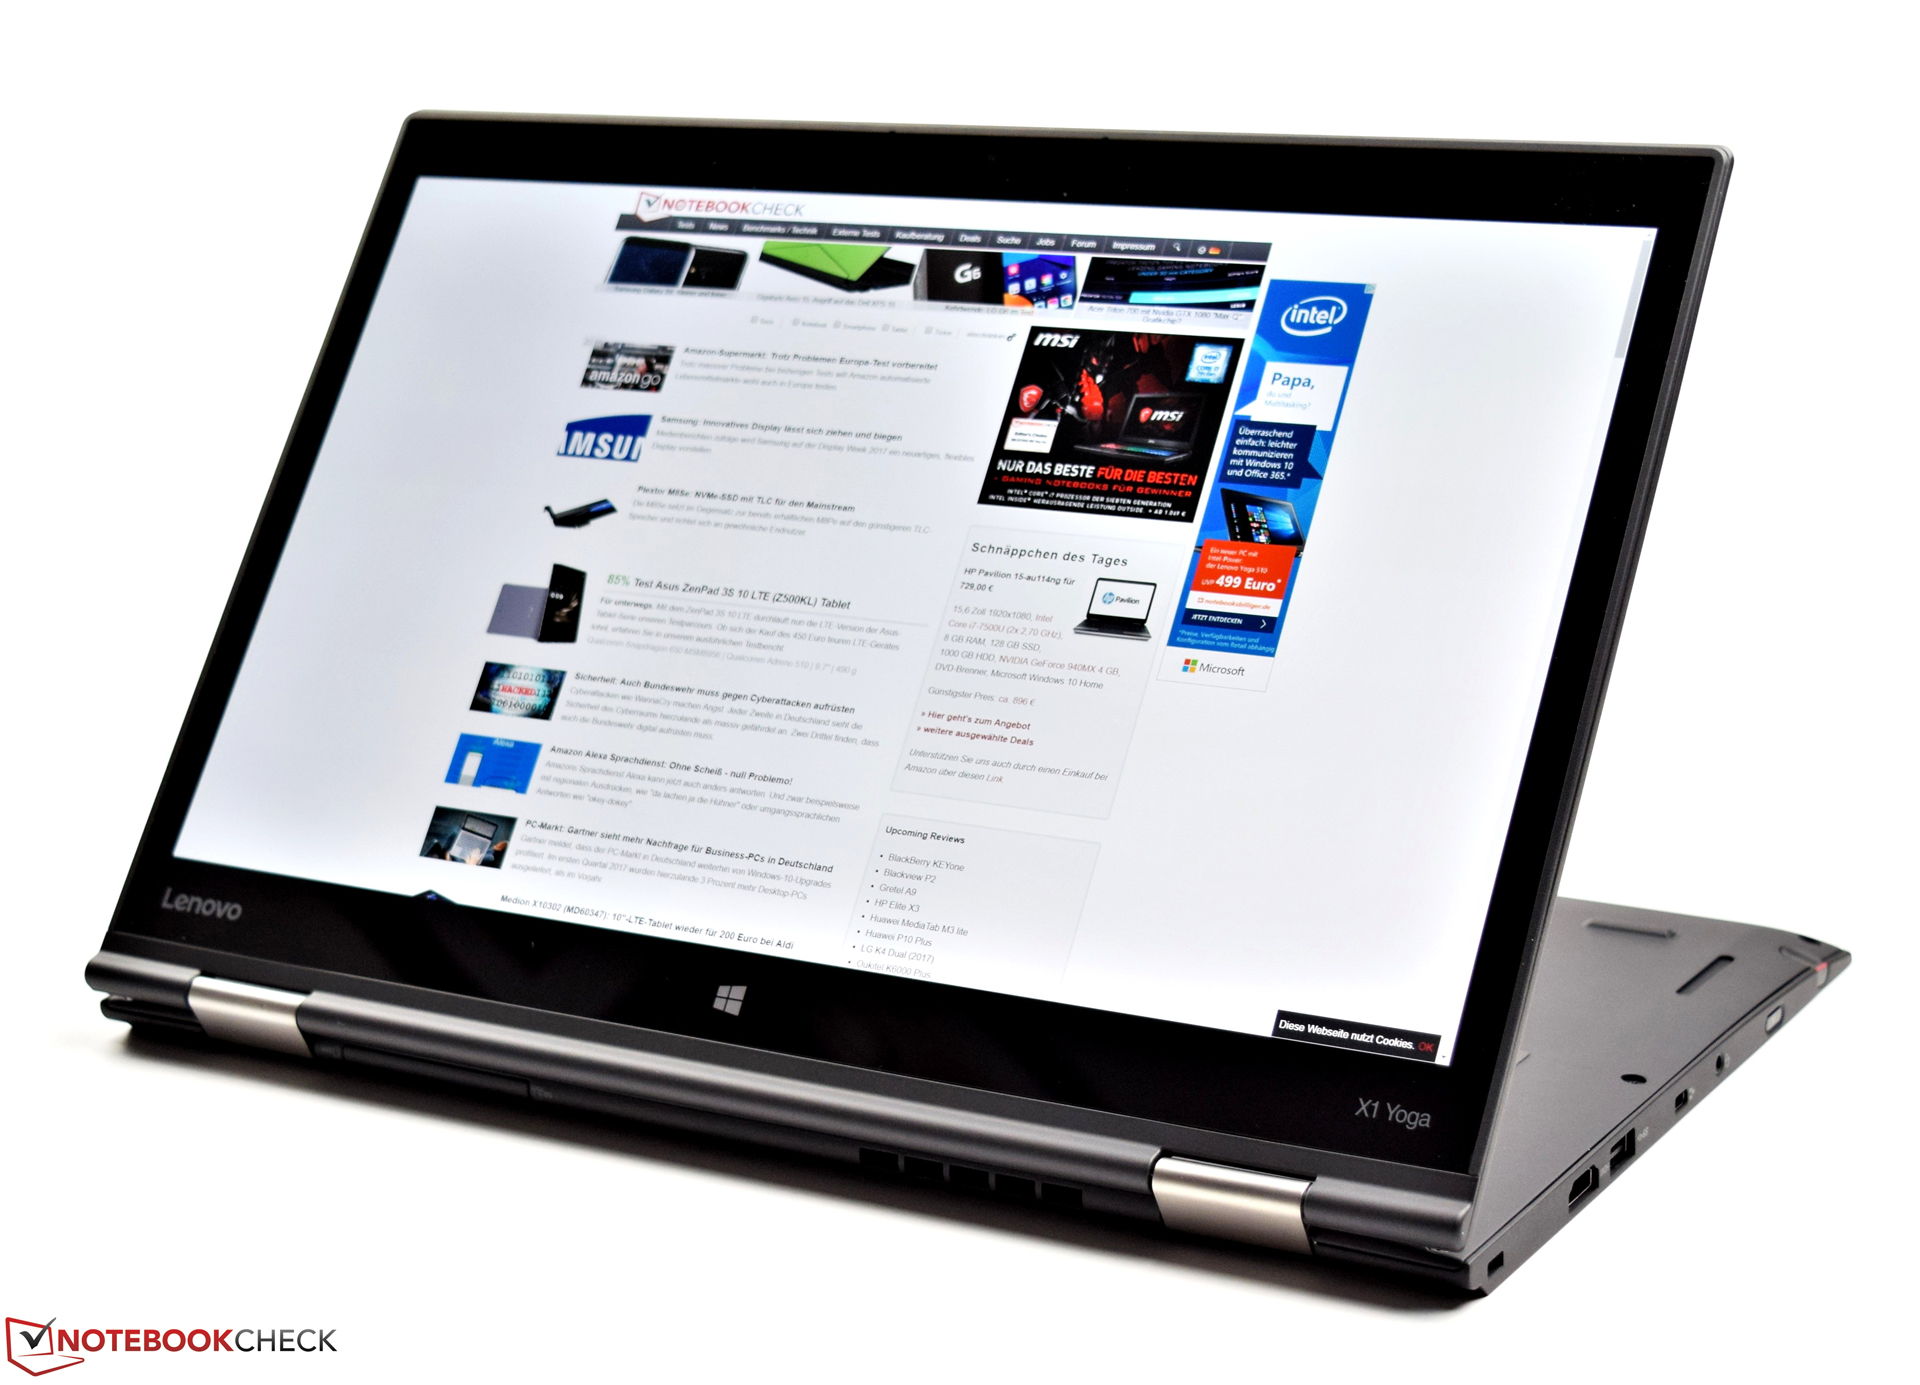
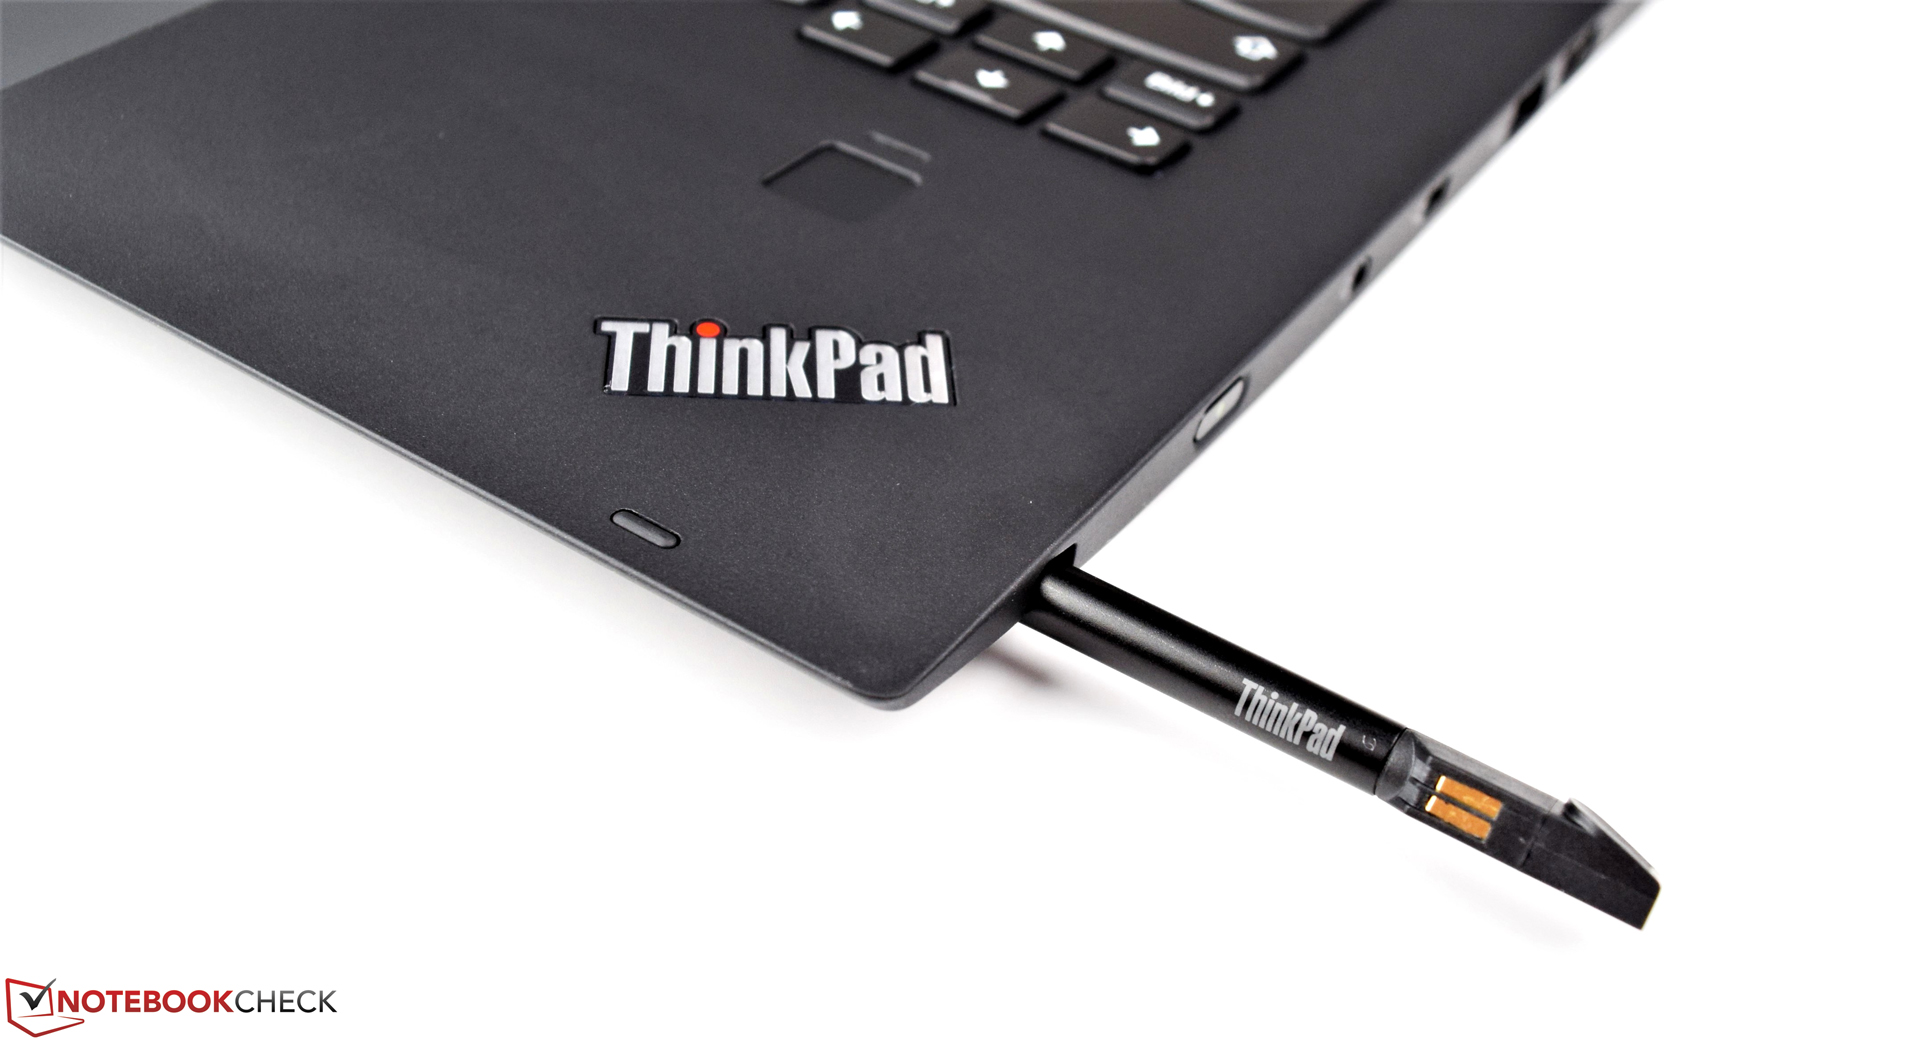
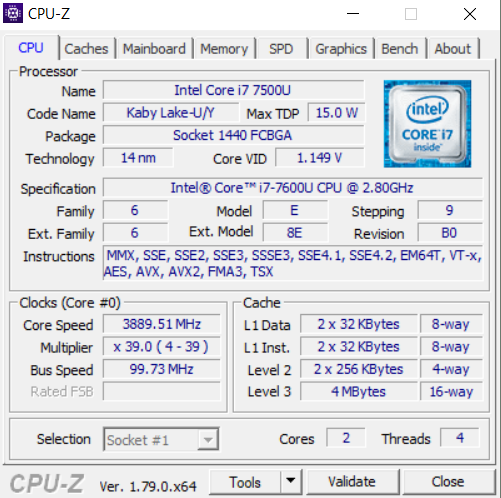
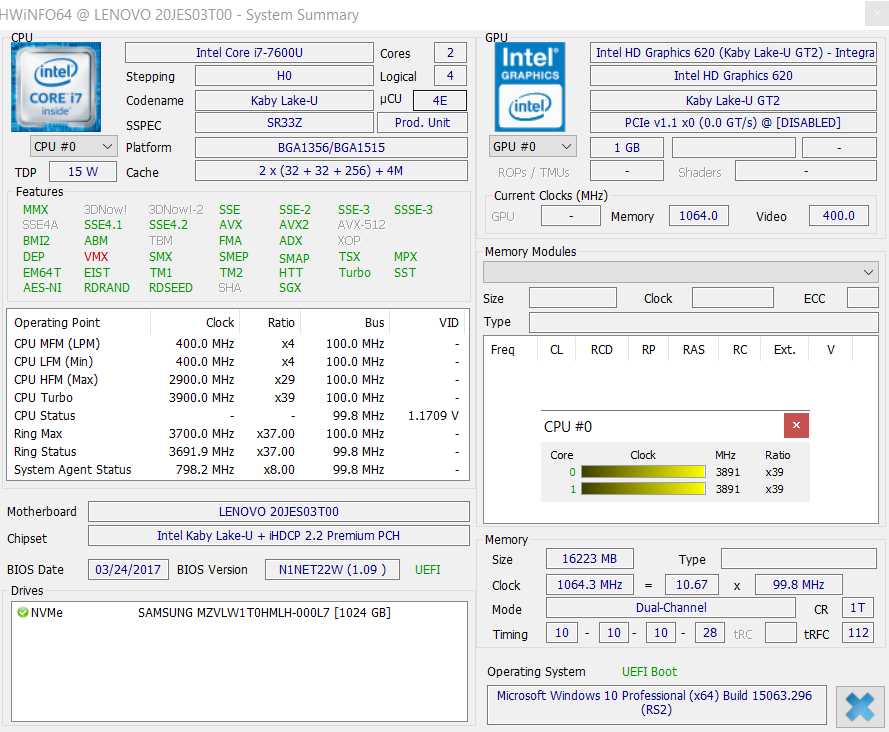
Lenovo'nun ThinkPad X1 Yoga 2017 modeli güçlü bir üst sınıf dönüştürülebilir model. Çok öne çıkmayışının sebebi harika OLED ekranından ziyade, 3300 Euro gibi bir fiyata sahip olması. ThinkPad X1 Yoga 2017 kesinlikle ucuz değil. Üst sınıf donanım rahat bir kullanım sunuyor. Test sonuçları da performansı onaylar şekilde. Intel Core i7-7600U sistem çipi geleceğe yönelik iyi bir yatırım olabilir. Sunulan depolama alanı ve bellek miktarı da cömert.
Eğer para sizin için sorun değilse, bu model aradığınız dönüştürülebilir model olabilir. Fiyatı ile aldığınız kullanım keyfi dengeli olacak mıdır? Buna sizin karar vermeniz gerekiyor.
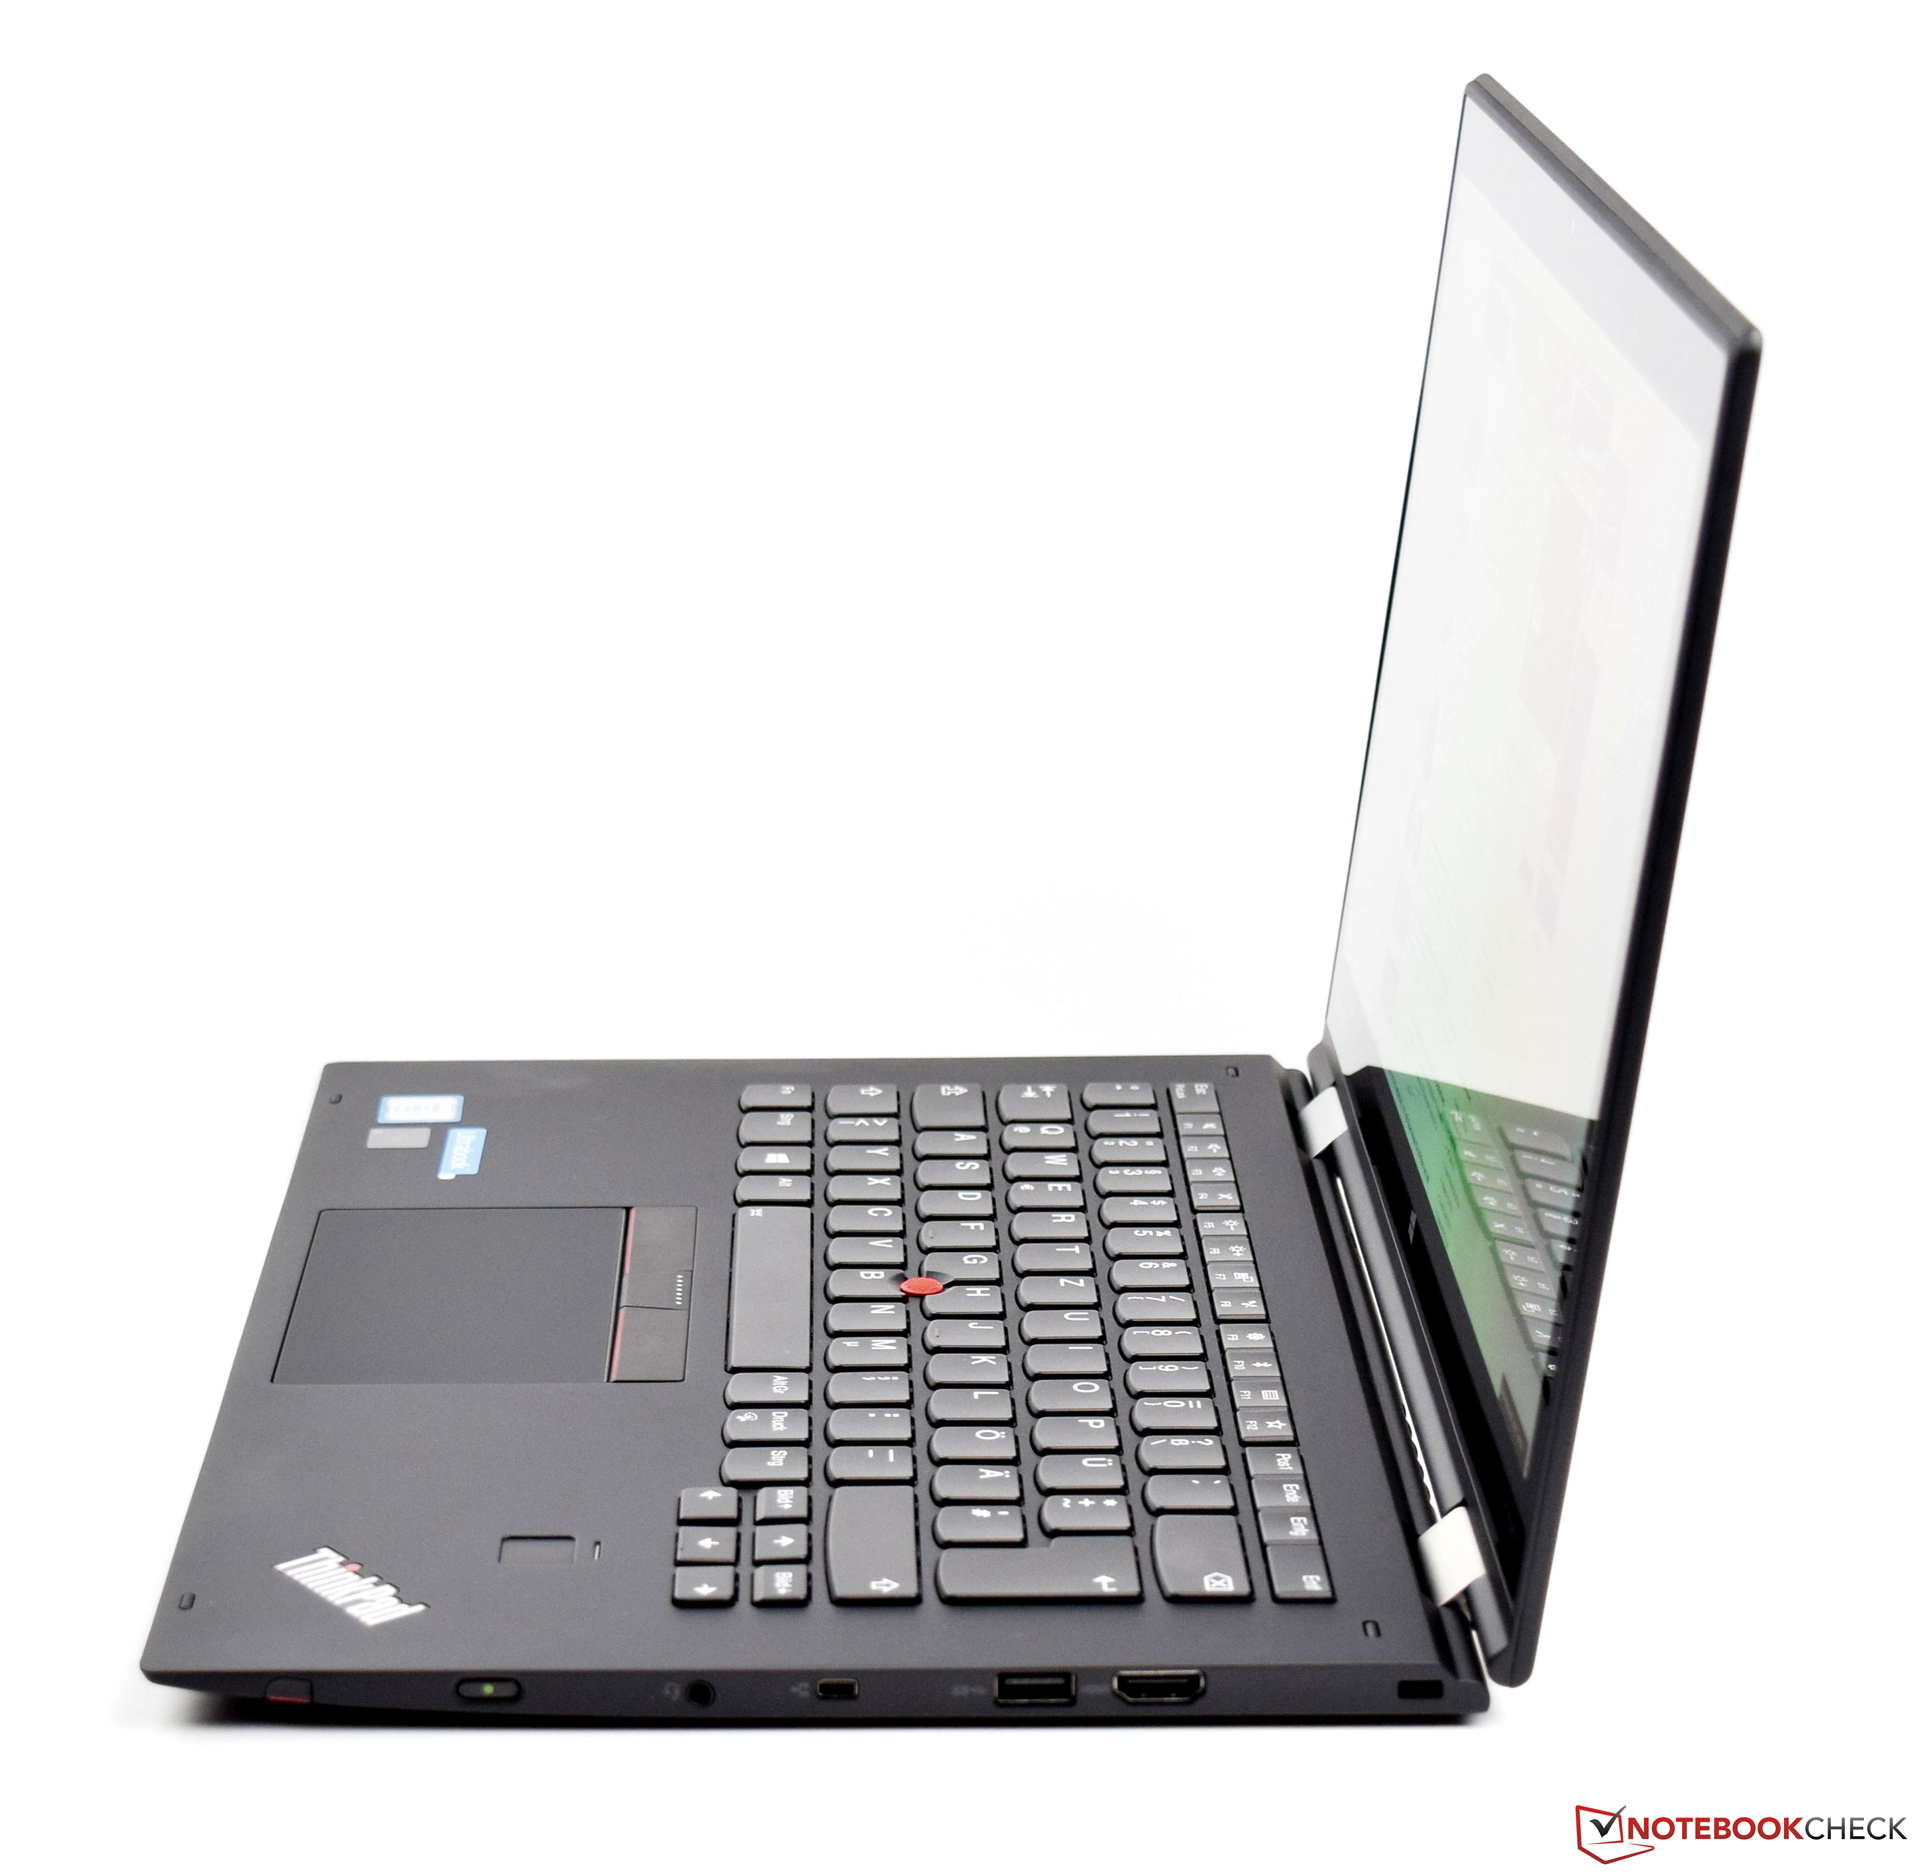
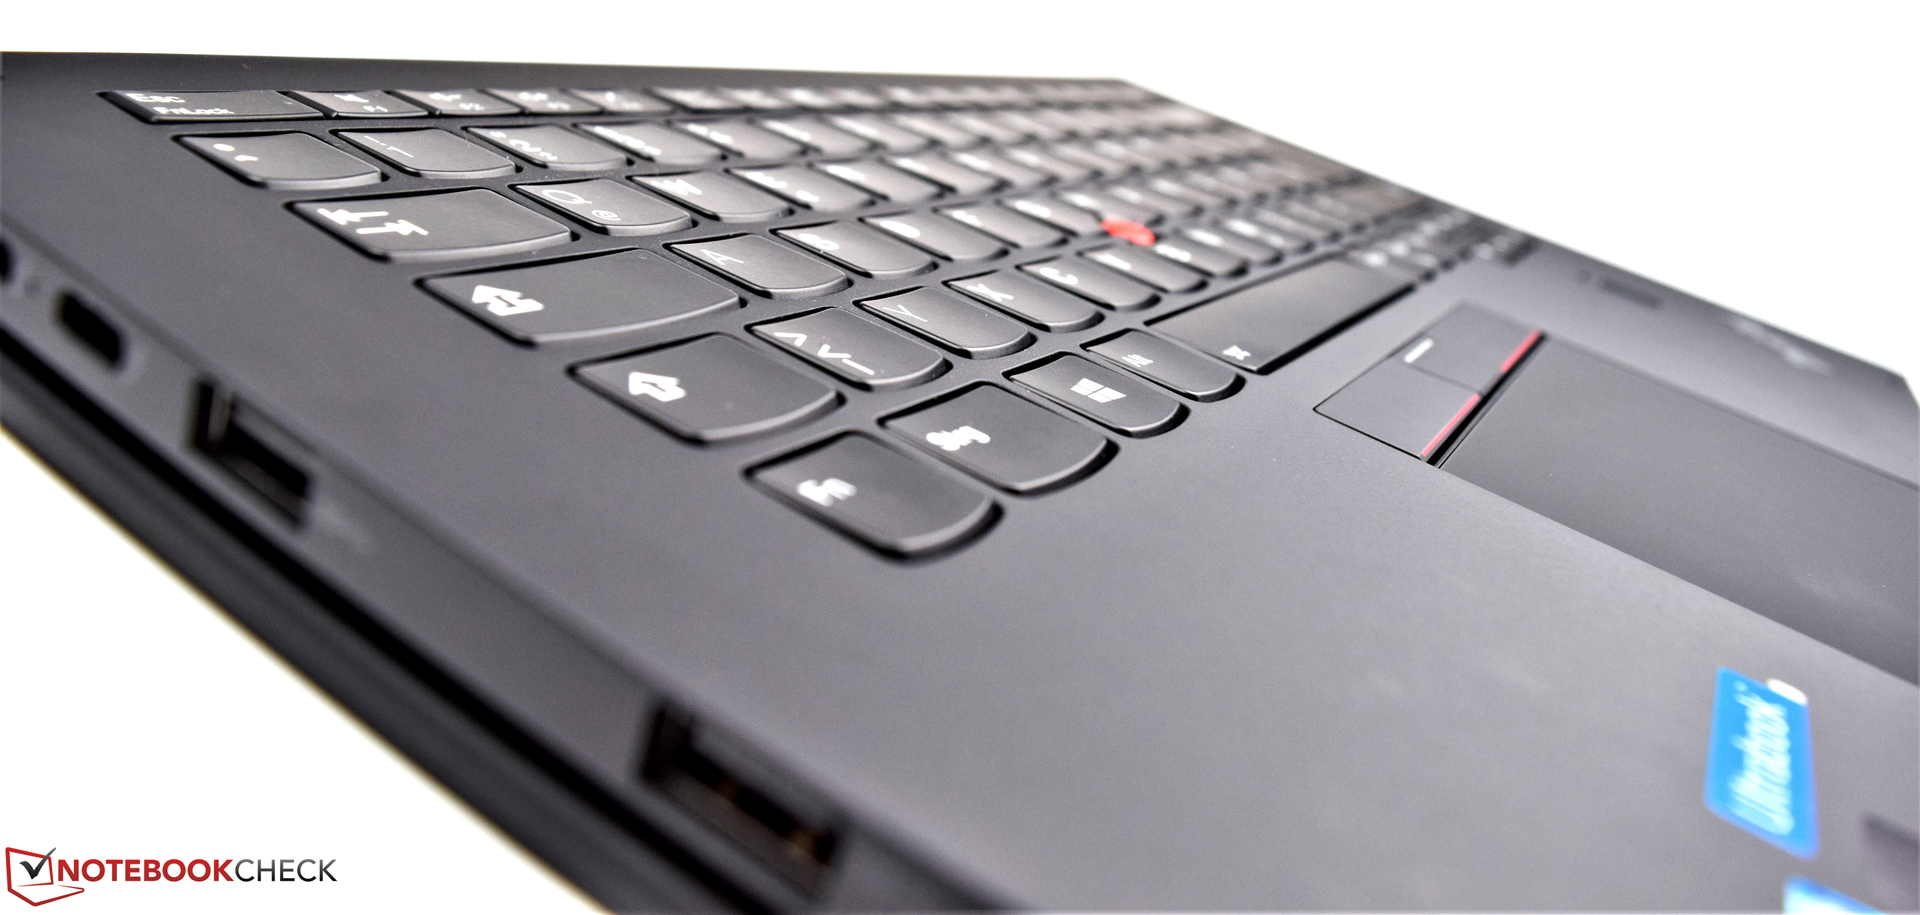
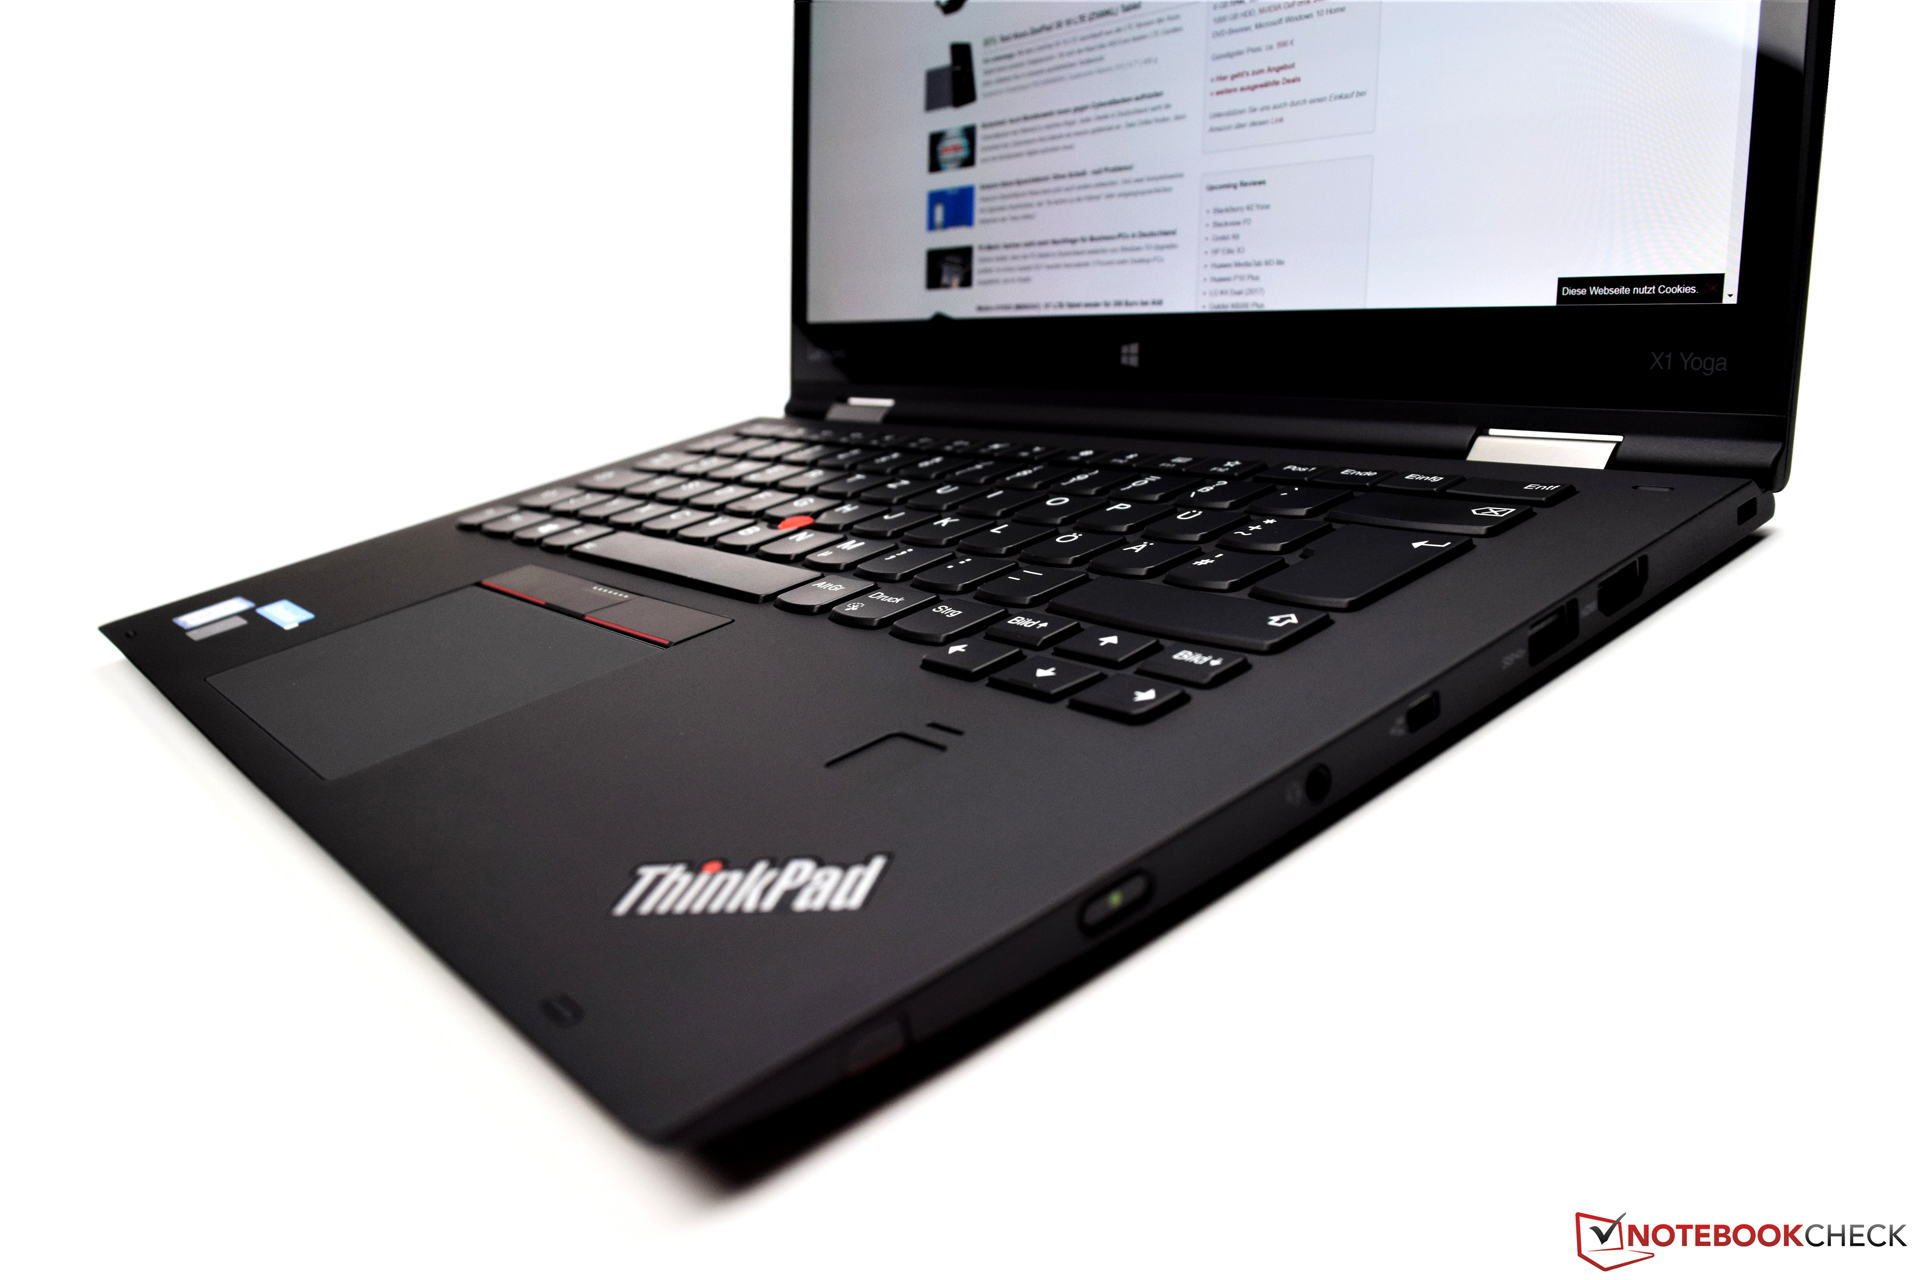
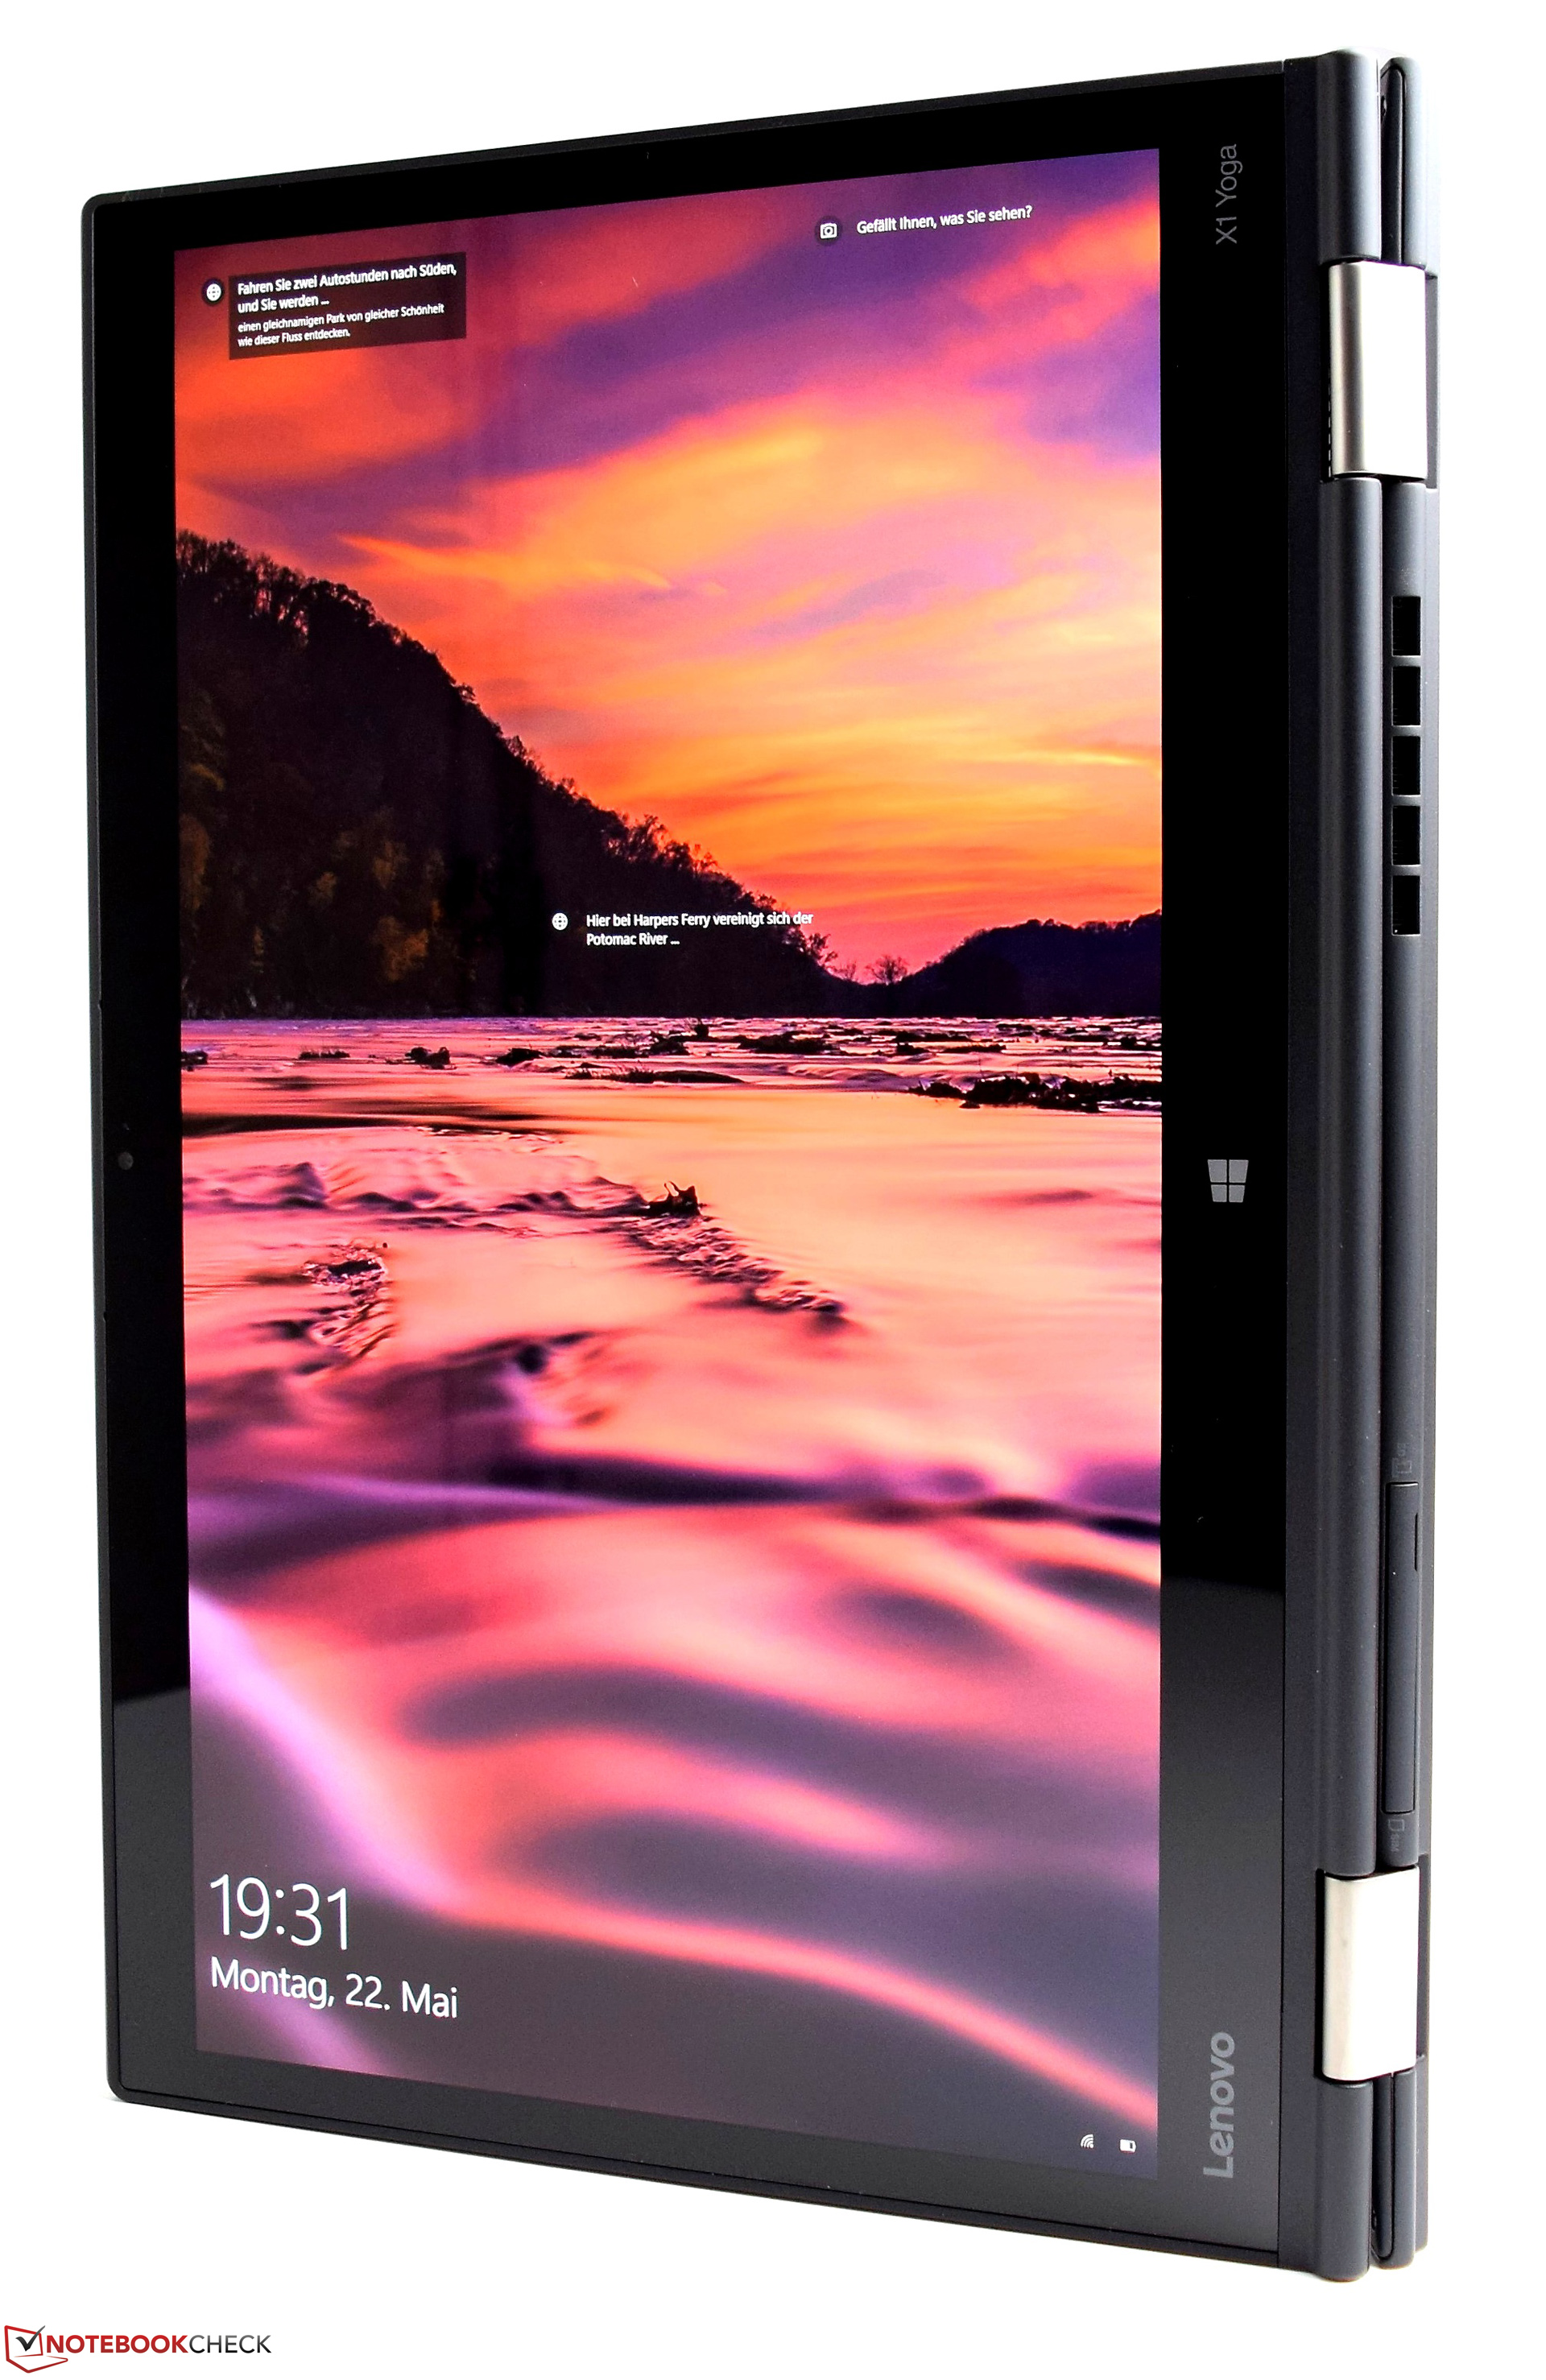
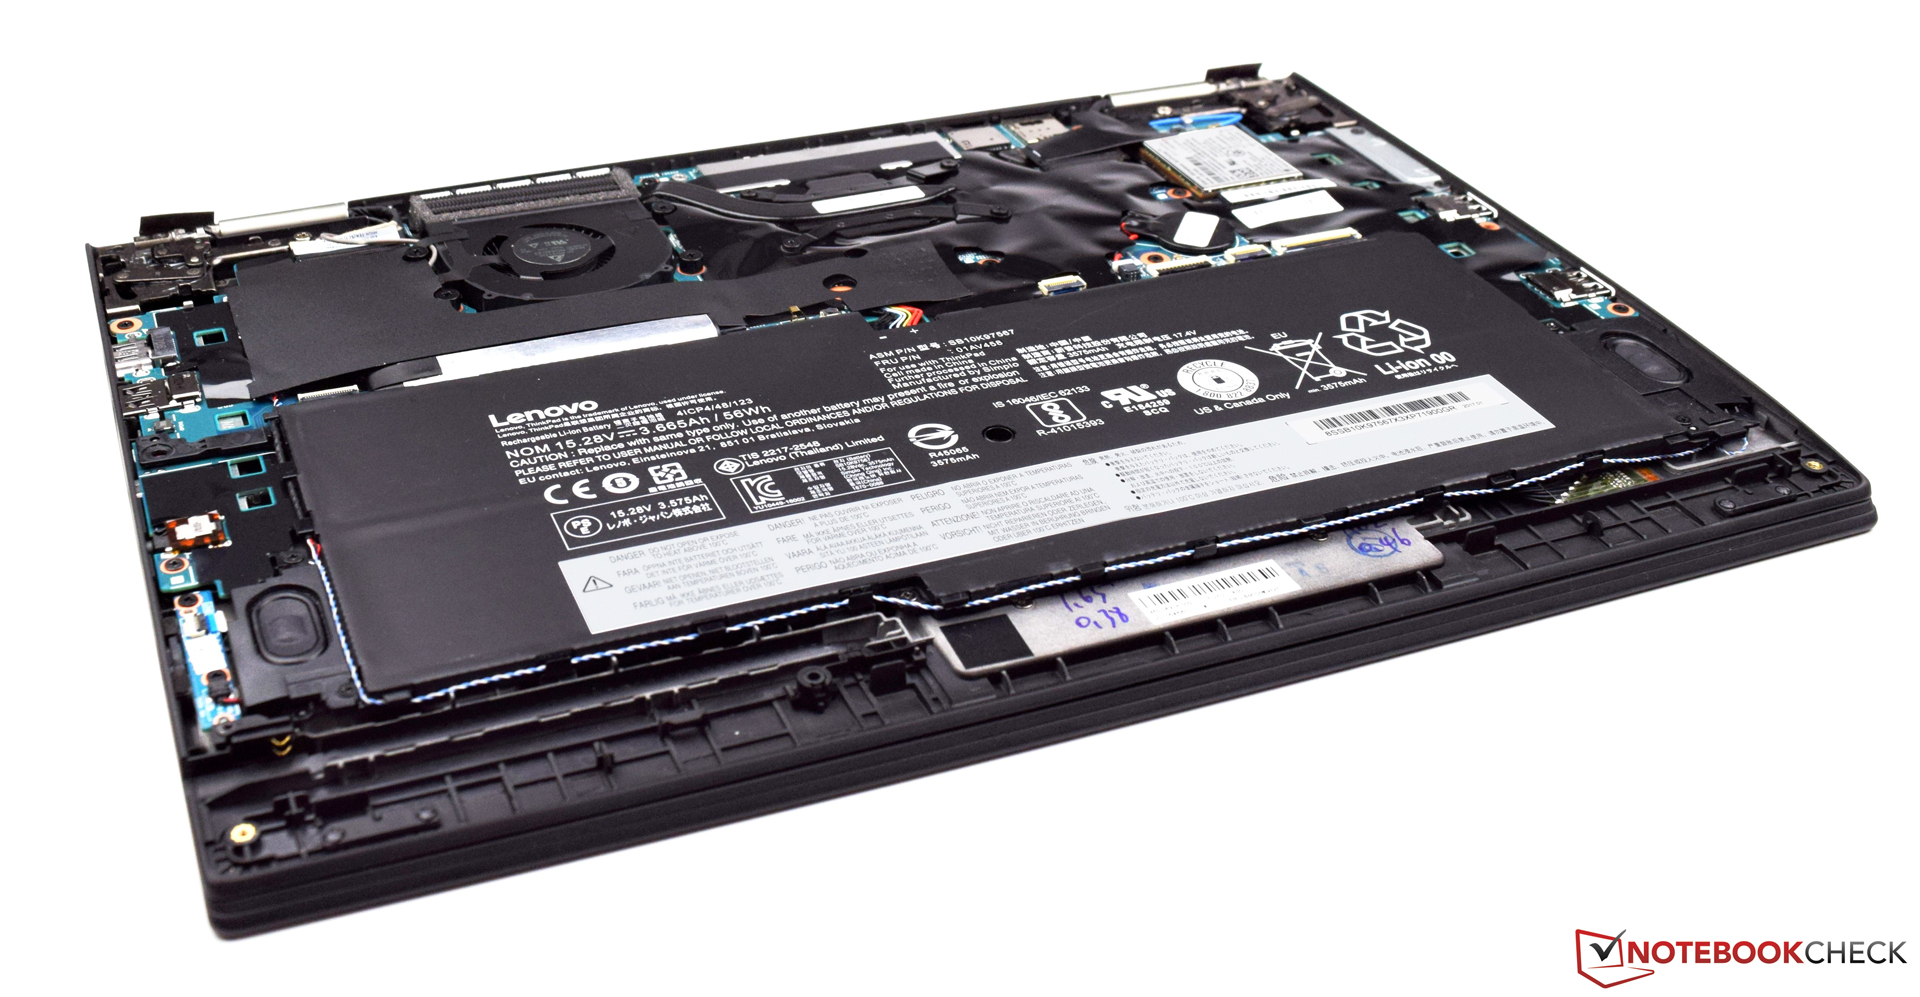
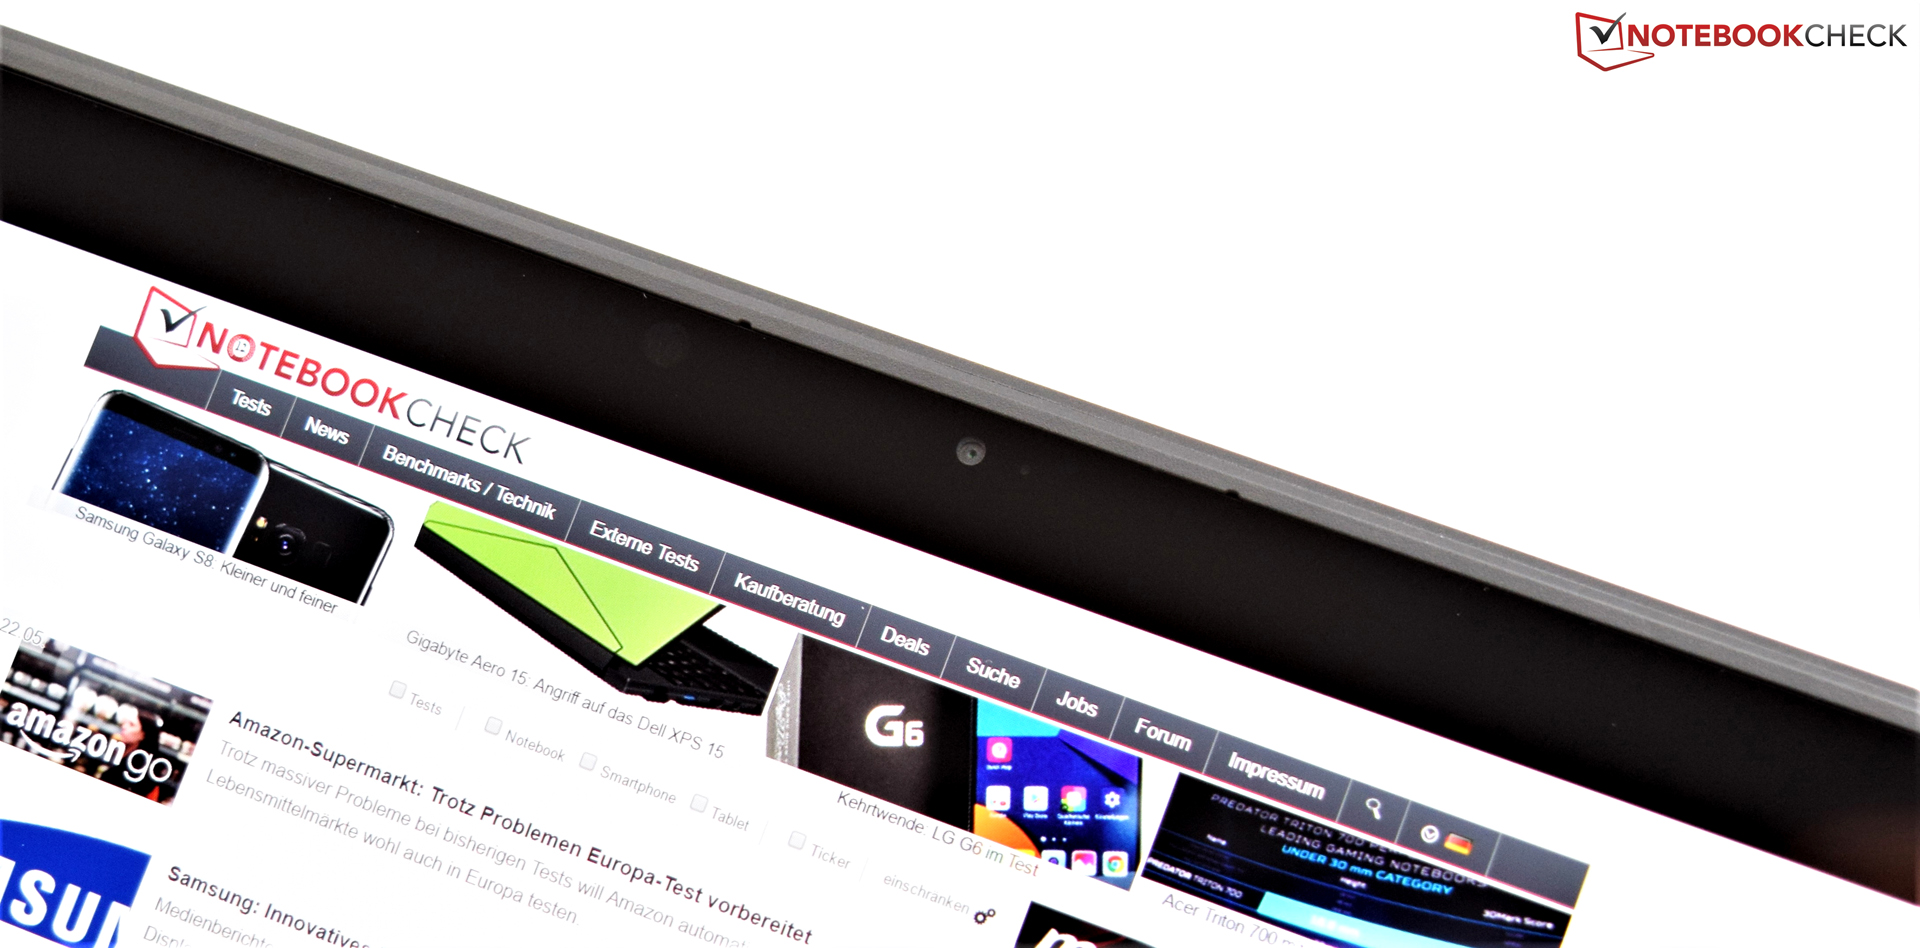
Yapım kalitesi çok iyi ve sadece ufak hatalar göze çarğıyor. Arayüzler de oldukça iyi. OLED ekran canlı renkler ile etkiliyor, ama ortalama parlaklığı beklediğimiz kadar yüksek değil. Sonuç olarak cihaz dış mekan kullanımı için çok uygun değil. Lenovo doanım üzerinde de güncelleme yapılmasına imkan sağlaya biraz daha iyi olabilirmiş.
Lenovo ThinkPad X1 Yoga 2017 20JES03T00
- 06/18/2017 v6 (old)
Sebastian Bade
Price comparison