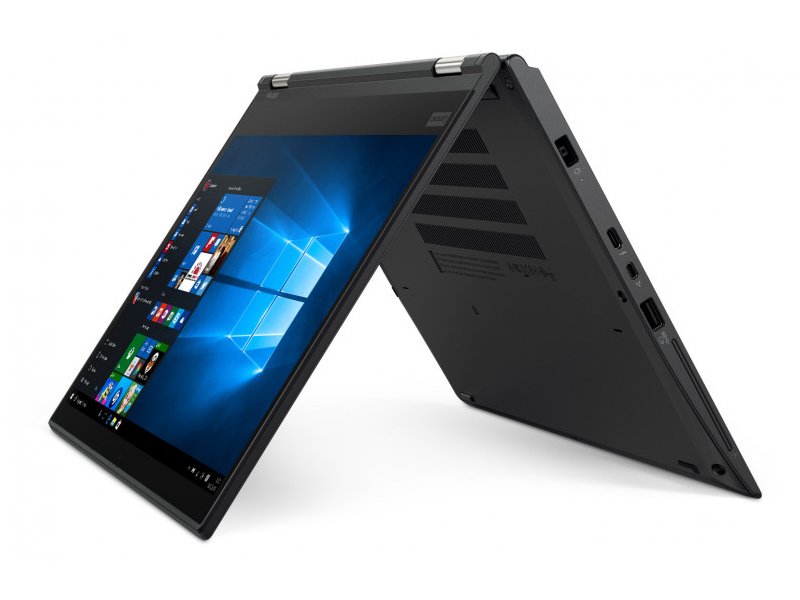
Kısa inceleme: Lenovo ThinkPad X380 Yoga (i7-8550U, FHD) dönüştürülebilir
| SD Card Reader | |
| average JPG Copy Test (av. of 3 runs) | |
| Sınıf ortalaması Convertible (28.1 - 197, n=23, son 2 yıl) | |
| Lenovo ThinkPad Yoga 370-20JJS00100 (Toshiba Exceria Pro M401) | |
| Lenovo ThinkPad X380 Yoga 20LJS02W00 (Toshiba Exceria Pro SDXC 64 GB UHS-II) | |
| maximum AS SSD Seq Read Test (1GB) | |
| Sınıf ortalaması Convertible (28.9 - 254, n=22, son 2 yıl) | |
| Lenovo ThinkPad X380 Yoga 20LJS02W00 (Toshiba Exceria Pro SDXC 64 GB UHS-II) | |
| Lenovo ThinkPad Yoga 370-20JJS00100 (Toshiba Exceria Pro M401) | |
| |||||||||||||||||||||||||
Aydınlatma: 84 %
Batarya modunda parlaklık: 314 cd/m²
Kontrast: 1963:1 (Siyah: 0.16 cd/m²)
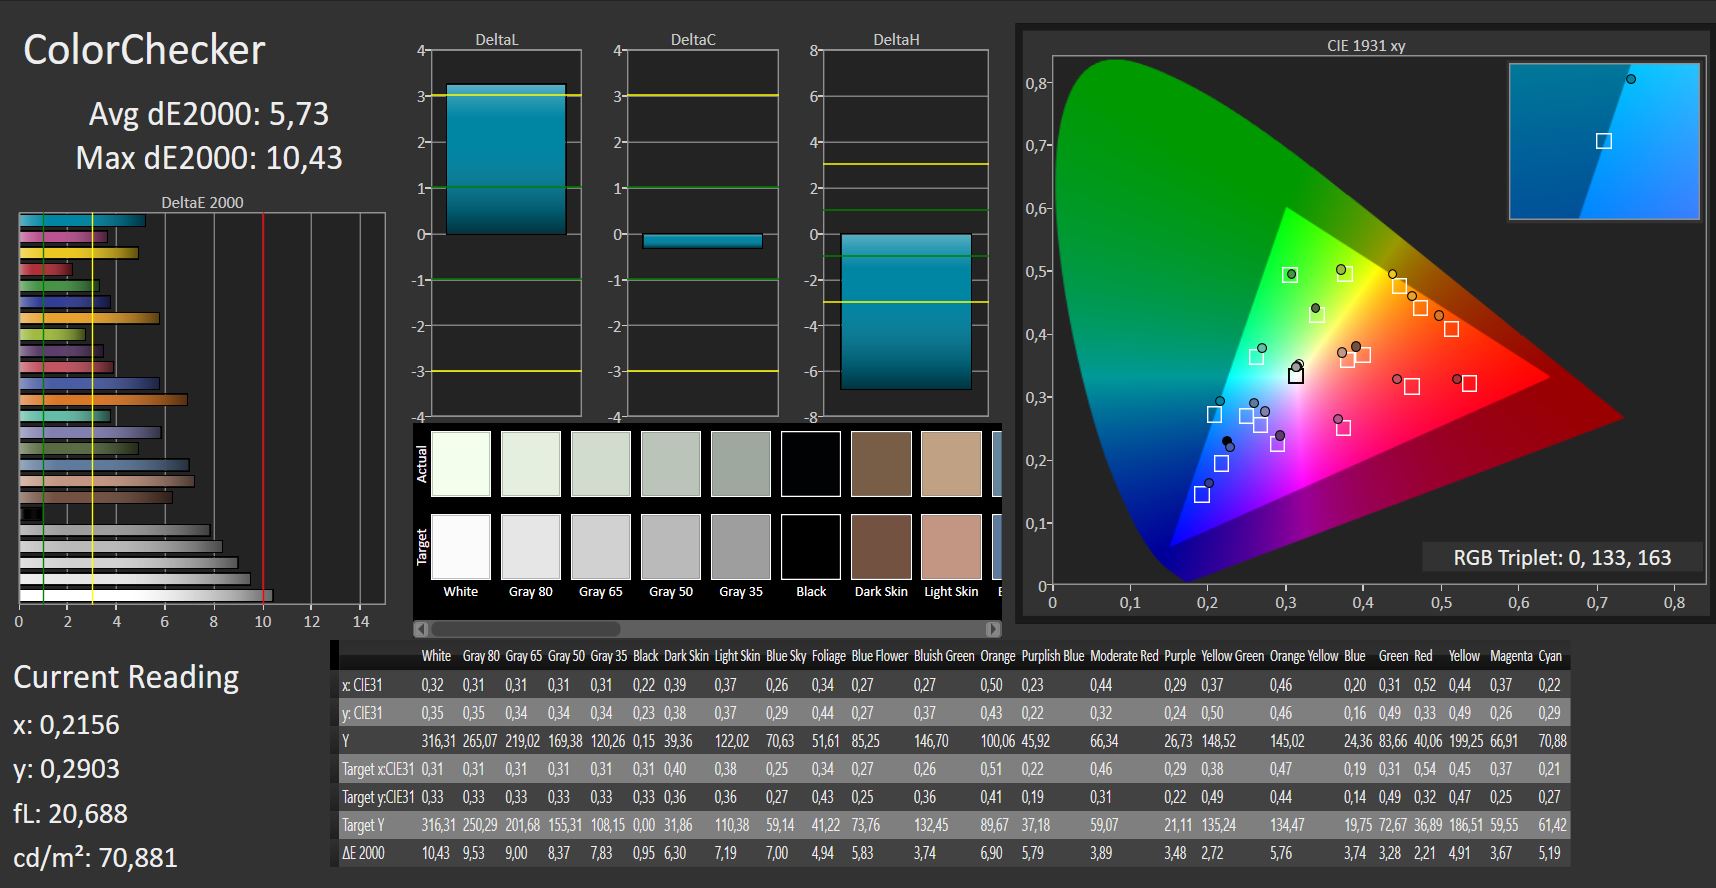
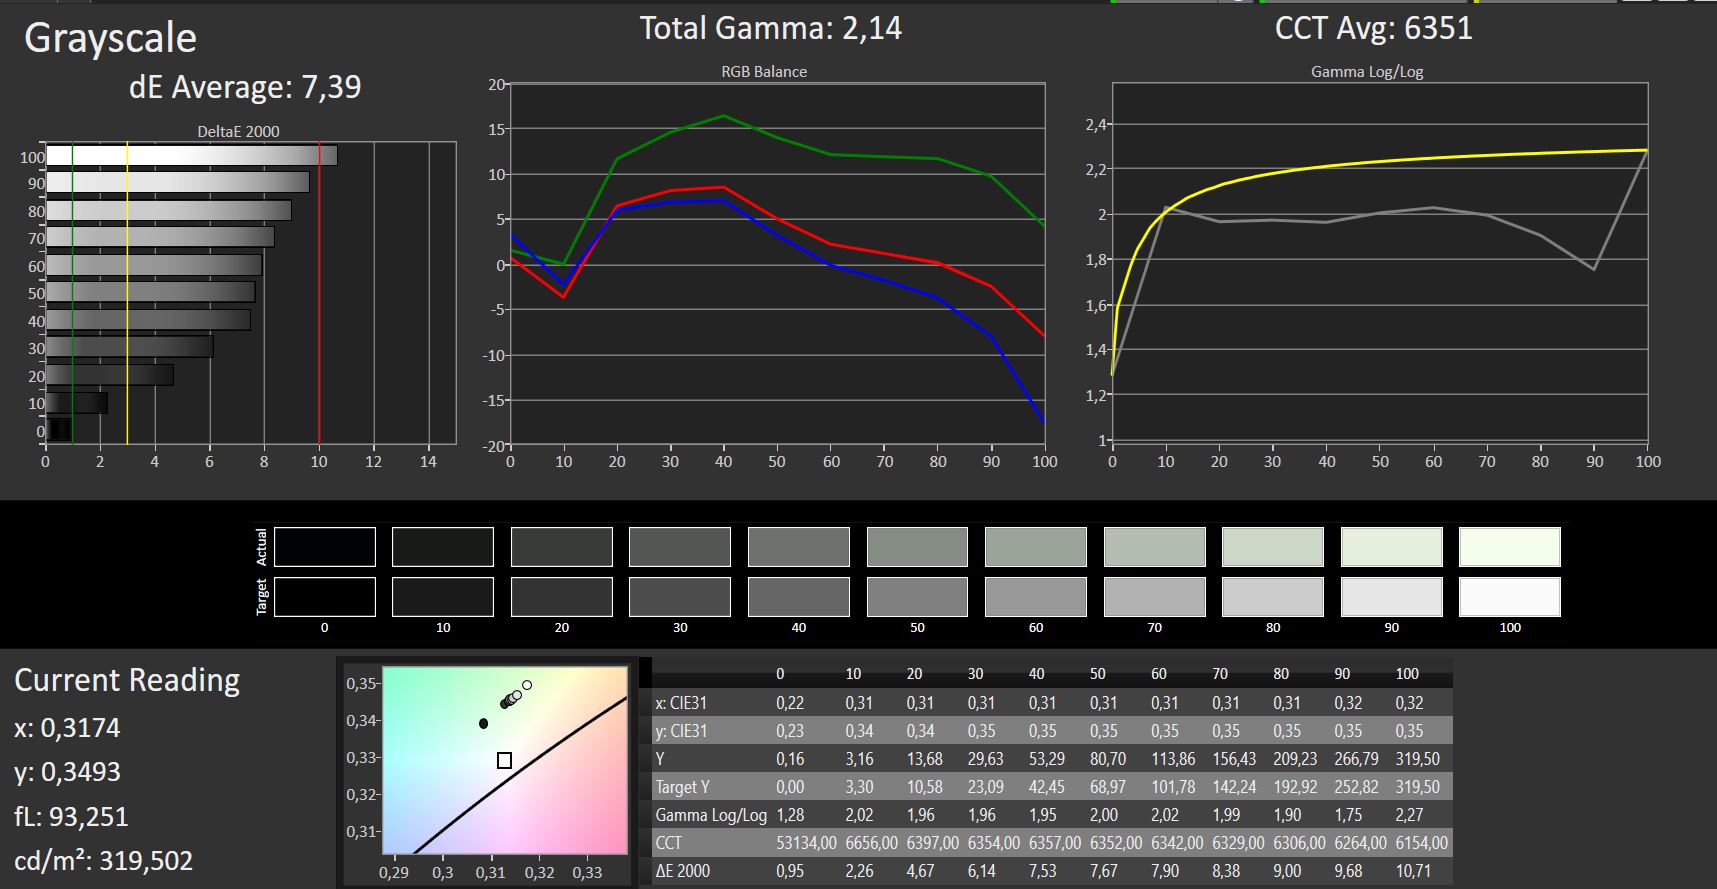
ΔE ColorChecker Calman: 5.73 | ∀{0.5-29.43 Ø4.73}
ΔE Greyscale Calman: 7.39 | ∀{0.09-98 Ø4.97}
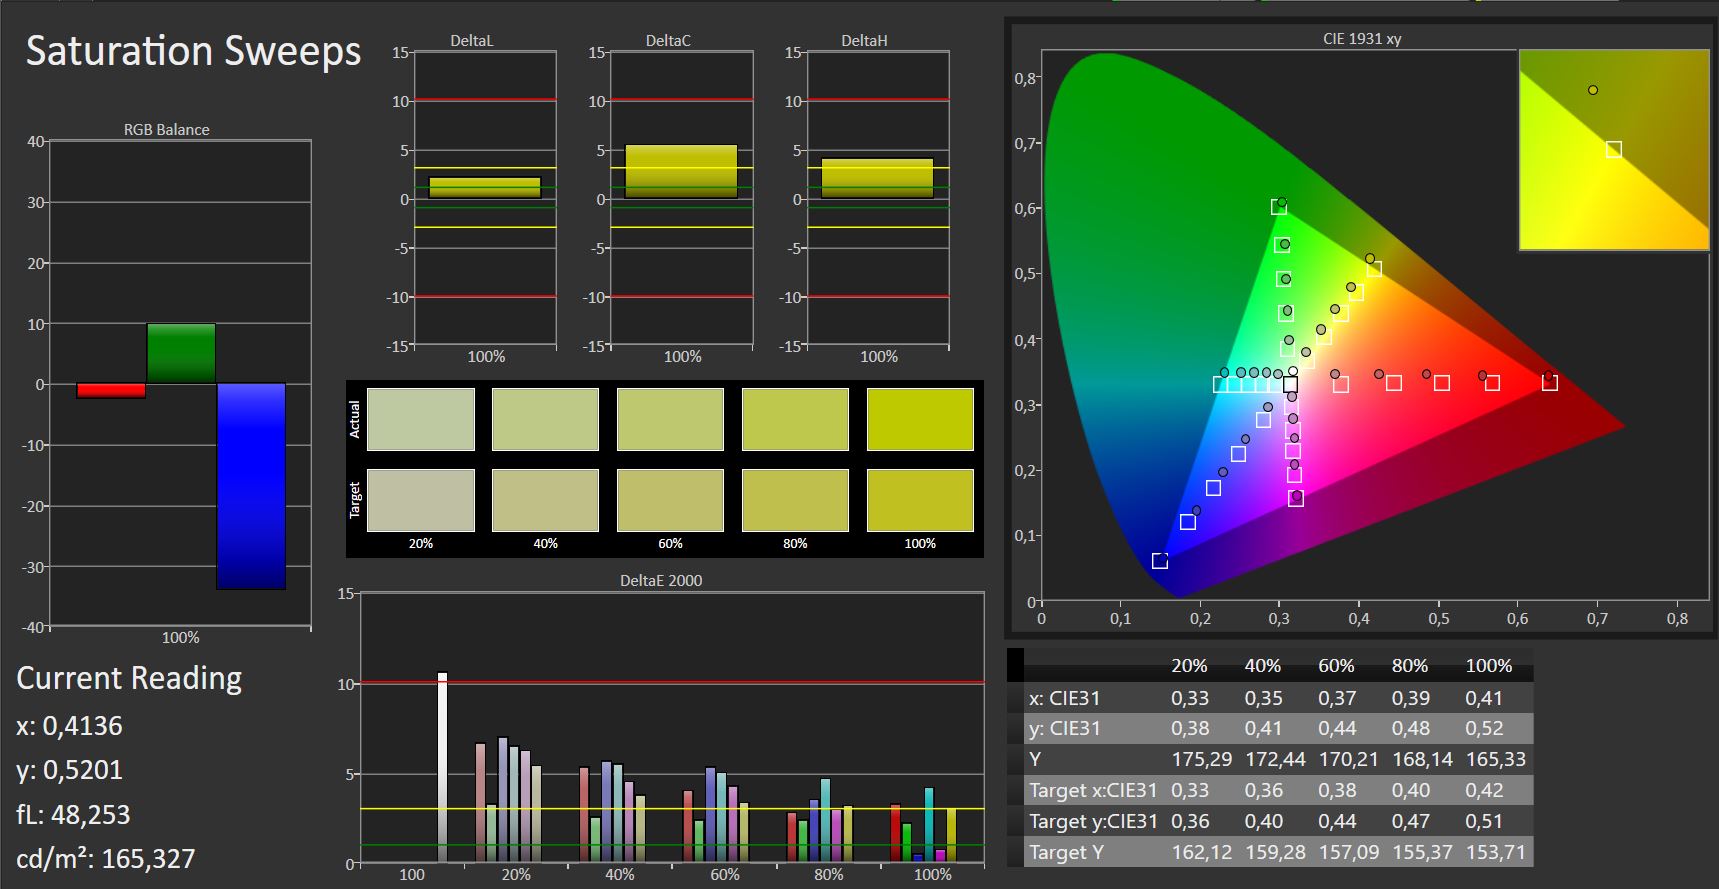
96% sRGB (Argyll 1.6.3 3D)
61% AdobeRGB 1998 (Argyll 1.6.3 3D)
67.8% AdobeRGB 1998 (Argyll 3D)
95.8% sRGB (Argyll 3D)
65.9% Display P3 (Argyll 3D)
Gamma: 2.14
CCT: 6351 K
| Lenovo ThinkPad X380 Yoga 20LJS02W00 IPS, 1920x1080, 13.3" | Lenovo ThinkPad Yoga 370-20JJS00100 IPS LED, 1920x1080, 13.3" | Dell XPS 13 9365-4537 2-in-1 IPS, 3200x1800, 13.3" | HP EliteBook x360 1030 G2 IPS, 1920x1080, 13.3" | |
|---|---|---|---|---|
| Display | 3% | -3% | -4% | |
| Display P3 Coverage (%) | 65.9 | 67.9 3% | 64.4 -2% | 65.5 -1% |
| sRGB Coverage (%) | 95.8 | 97.3 2% | 92.9 -3% | 88.8 -7% |
| AdobeRGB 1998 Coverage (%) | 67.8 | 69.9 3% | 66.1 -3% | 64.9 -4% |
| Response Times | 2% | 4% | -2% | |
| Response Time Grey 50% / Grey 80% * (ms) | 50 ? | 42 ? 16% | 48 ? 4% | 55.2 ? -10% |
| Response Time Black / White * (ms) | 29 ? | 32.8 ? -13% | 28 ? 3% | 27.2 ? 6% |
| PWM Frequency (Hz) | 1000 ? | 217.4 ? | ||
| Screen | -6% | 12% | -11% | |
| Brightness middle (cd/m²) | 314 | 374 19% | 348 11% | 262 -17% |
| Brightness (cd/m²) | 302 | 356 18% | 306 1% | 256 -15% |
| Brightness Distribution (%) | 84 | 87 4% | 78 -7% | 83 -1% |
| Black Level * (cd/m²) | 0.16 | 0.33 -106% | 0.2 -25% | 0.25 -56% |
| Contrast (:1) | 1963 | 1133 -42% | 1740 -11% | 1048 -47% |
| Colorchecker dE 2000 * | 5.73 | 4.7 18% | 2.79 51% | 5.13 10% |
| Colorchecker dE 2000 max. * | 10.43 | 9.5 9% | 5.53 47% | 9.46 9% |
| Greyscale dE 2000 * | 7.39 | 6.5 12% | 3.47 53% | 6.23 16% |
| Gamma | 2.14 103% | 2.19 100% | 2.54 87% | 2.45 90% |
| CCT | 6351 102% | 7086 92% | 6564 99% | 6413 101% |
| Color Space (Percent of AdobeRGB 1998) (%) | 61 | 63.1 3% | 60 -2% | 57.84 -5% |
| Color Space (Percent of sRGB) (%) | 96 | 97.2 1% | 93 -3% | 88.57 -8% |
| Toplam Ortalama (Program / Ayarlar) | -0% /
-4% | 4% /
8% | -6% /
-9% |
* ... daha küçük daha iyidir
Ekran Titremesi / PWM (Darbe Genişliği Modülasyonu)
| Ekran titriyor / PWM algılandı | 1000 Hz | ≤ 90 % parlaklık ayarı | 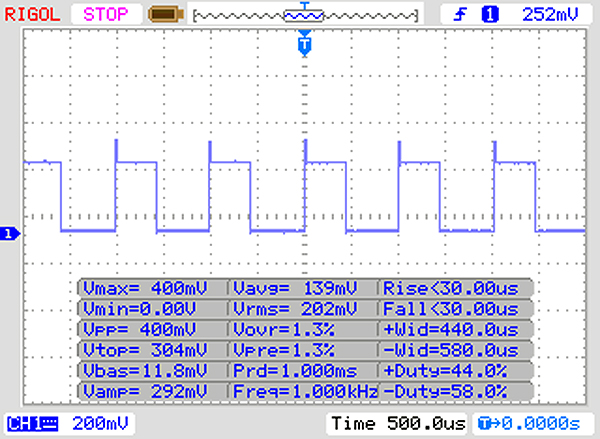 |
Ekran arka ışığı 1000 Hz'de titriyor (en kötü durum, örneğin PWM kullanılması) 90 % ve altındaki parlaklık ayarında titreme algılandı. Bu parlaklık ayarının üzerinde titreme veya PWM olmamalıdır. 1000 Hz frekansı oldukça yüksektir, bu nedenle PWM'ye duyarlı çoğu kullanıcı herhangi bir titremeyi fark etmemelidir. Karşılaştırıldığında: Test edilen tüm cihazların %52 %'si ekranı karartmak için PWM kullanmıyor. PWM tespit edilirse, ortalama 7798 (minimum: 5 - maksimum: 343500) Hz ölçüldü. | |||
Yanıt Sürelerini Görüntüle
| ↔ Tepki Süresi Siyahtan Beyaza | ||
|---|---|---|
| 29 ms ... yükseliş ↗ ve sonbahar↘ birleşimi | ↗ 15 ms yükseliş | 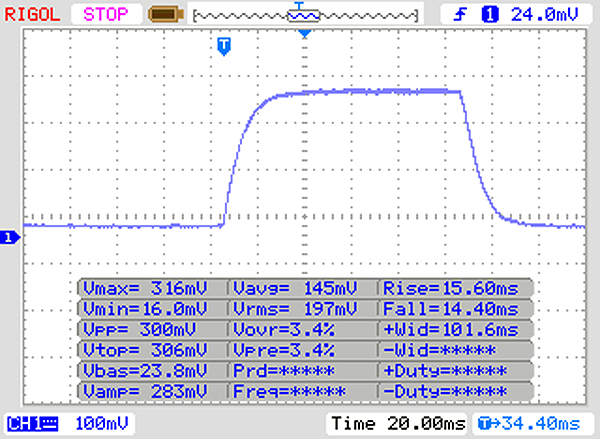 |
| ↘ 14 ms sonbahar | ||
| Ekran, testlerimizde nispeten yavaş yanıt oranları gösteriyor ve oyuncular için çok yavaş olabilir. Karşılaştırıldığında, test edilen tüm cihazlar 0.1 (minimum) ile 240 (maksimum) ms arasında değişir. » Tüm cihazların 77 %'si daha iyi. Bu, ölçülen yanıt süresinin test edilen tüm cihazların ortalamasından (19.9 ms) daha kötü olduğu anlamına gelir. | ||
| ↔ Tepki Süresi %50 Griden %80 Griye | ||
| 50 ms ... yükseliş ↗ ve sonbahar↘ birleşimi | ↗ 24 ms yükseliş | 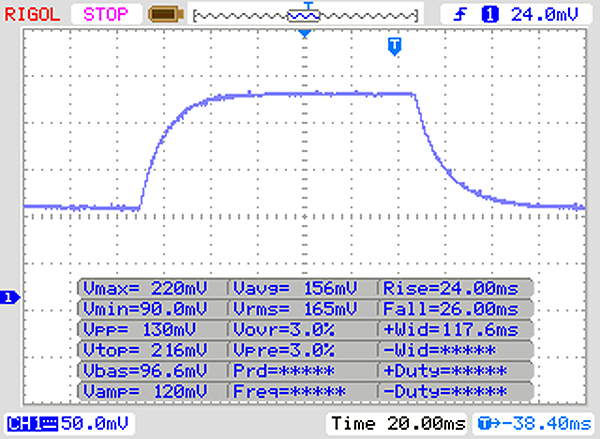 |
| ↘ 26 ms sonbahar | ||
| Ekran, testlerimizde yavaş yanıt oranları gösteriyor ve oyuncular için yetersiz olacaktır. Karşılaştırıldığında, test edilen tüm cihazlar 0.165 (minimum) ile 636 (maksimum) ms arasında değişir. » Tüm cihazların 86 %'si daha iyi. Bu, ölçülen yanıt süresinin test edilen tüm cihazların ortalamasından (31.1 ms) daha kötü olduğu anlamına gelir. | ||
| Geekbench 3 | |
| 32 Bit Multi-Core Score | |
| Ortalama Intel Core i7-8550U (8918 - 14144, n=12) | |
| Lenovo ThinkPad X380 Yoga 20LJS02W00 | |
| Dell XPS 13 9365-4537 2-in-1 | |
| 32 Bit Single-Core Score | |
| Lenovo ThinkPad X380 Yoga 20LJS02W00 | |
| Ortalama Intel Core i7-8550U (2471 - 4020, n=12) | |
| Dell XPS 13 9365-4537 2-in-1 | |
| JetStream 1.1 - 1.1 Total | |
| Acer Spin 5 SP515-51GN-80A3 (Edge 41.16299.15.0) | |
| Lenovo ThinkPad X380 Yoga 20LJS02W00 (Ede 41) | |
| Ortalama Intel Core i7-8550U (141.9 - 288, n=61) | |
| HP EliteBook x360 1030 G2 (Edge 38.14393.0.0) | |
| HP Spectre x360 13t-ae000 | |
| Lenovo ThinkPad Yoga 370-20JJS00100 (Edge) | |
| Dell XPS 13 9365-4537 2-in-1 (Edge 40) | |
| PCMark 7 Score | 5898 puan | |
| PCMark 8 Home Score Accelerated v2 | 3687 puan | |
| PCMark 8 Creative Score Accelerated v2 | 4788 puan | |
| PCMark 8 Work Score Accelerated v2 | 4656 puan | |
| PCMark 10 Score | 3632 puan | |
Yardım | ||

| Lenovo ThinkPad X380 Yoga 20LJS02W00 Samsung SSD PM981 MZVLB512HAJQ | Lenovo ThinkPad Yoga 370-20JJS00100 Toshiba NVMe THNSF5512GPUK | Dell XPS 13 9365-4537 2-in-1 Toshiba NVMe THNSN5256GPUK | HP EliteBook x360 1030 G2 Sandisk SD8TN8U-256G-1006 | Ortalama Samsung SSD PM981 MZVLB512HAJQ | |
|---|---|---|---|---|---|
| CrystalDiskMark 3.0 | -41% | -53% | -63% | -9% | |
| Read Seq (MB/s) | 2486 | 1070 -57% | 1159 -53% | 467.1 -81% | 2002 ? -19% |
| Write Seq (MB/s) | 1341 | 484.5 -64% | 324.1 -76% | 443.6 -67% | 1656 ? 23% |
| Read 512 (MB/s) | 1788 | 680 -62% | 528 -70% | 312.3 -83% | 1213 ? -32% |
| Write 512 (MB/s) | 1885 | 483.1 -74% | 373.7 -80% | 372.5 -80% | 1641 ? -13% |
| Read 4k (MB/s) | 62.3 | 30.55 -51% | 29.26 -53% | 29.43 -53% | 61.4 ? -1% |
| Write 4k (MB/s) | 145.6 | 127.3 -13% | 108.3 -26% | 56.5 -61% | 131.3 ? -10% |
| Read 4k QD32 (MB/s) | 385.5 | 460.8 20% | 335.9 -13% | 311.3 -19% | 407 ? 6% |
| Write 4k QD32 (MB/s) | 535 | 414.5 -23% | 234.1 -56% | 225.2 -58% | 402 ? -25% |
| 3DMark 06 Standard Score | 8282 puan | |
| 3DMark 11 Performance | 1801 puan | |
| 3DMark Cloud Gate Standard Score | 5821 puan | |
| 3DMark Fire Strike Score | 786 puan | |
Yardım | ||
| düşük | orta | yüksek | ultra | |
|---|---|---|---|---|
| Tomb Raider (2013) | 85.8 | 43.3 | 28.2 | 12.5 |
| BioShock Infinite (2013) | 62.9 | 32.4 | 26.7 | 9.3 |
| Rise of the Tomb Raider (2016) | 15.5 | 9.5 | 4.9 | 3.1 |
Ses yüksekliği
| Boşta |
| 30.4 / 30.4 / 30.4 dB |
| Çalışırken |
| 34.2 / 35.2 dB |
 | ||
30 dB sessiz 40 dB(A) duyulabilirlik 50 dB(A) gürültülü |
||
min: | ||
| Lenovo ThinkPad X380 Yoga 20LJS02W00 i5-8550U, UHD Graphics 620 | Lenovo ThinkPad Yoga 370-20JJS00100 i5-7200U, HD Graphics 620 | HP EliteBook x360 1030 G2 i5-7300U, HD Graphics 620 | |
|---|---|---|---|
| Noise | 2% | 3% | |
| kapalı / ortam * (dB) | 30.4 | 28.6 6% | 29 5% |
| Idle Minimum * (dB) | 30.4 | 28.6 6% | 29 5% |
| Idle Average * (dB) | 30.4 | 28.6 6% | 29 5% |
| Idle Maximum * (dB) | 30.4 | 31.2 -3% | 29 5% |
| Load Average * (dB) | 34.2 | 33.7 1% | 33.6 2% |
| Load Maximum * (dB) | 35.2 | 36.7 -4% | 35.8 -2% |
* ... daha küçük daha iyidir
(±) Üst taraftaki maksimum sıcaklık, 35.4 °C / 96 F ortalamasına kıyasla 40.2 °C / 104 F'dir. , Convertible sınıfı için 19.6 ile 60 °C arasında değişir.
(-) Alt kısım, 36.9 °C / 98 F ortalamasına kıyasla maksimum 46 °C / 115 F'ye kadar ısınır
(+) Boşta kullanımda, üst tarafın ortalama sıcaklığı 24.3 °C / 76 F olup, cihazın 30.3 °C / 87 F.
(+) Avuç içi dayanakları ve dokunmatik yüzey, maksimum 29.7 °C / 85.5 F ile cilt sıcaklığından daha soğuktur ve bu nedenle dokunulduğunda soğuktur.
(±) Benzer cihazların avuç içi dayanağı alanının ortalama sıcaklığı 28 °C / 82.4 F (-1.7 °C / -3.1 F) idi.
| Lenovo ThinkPad X380 Yoga 20LJS02W00 i5-8550U, UHD Graphics 620 | Lenovo ThinkPad Yoga 370-20JJS00100 i5-7200U, HD Graphics 620 | Dell XPS 13 9365-4537 2-in-1 i5-7Y54, HD Graphics 615 | HP EliteBook x360 1030 G2 i5-7300U, HD Graphics 620 | |
|---|---|---|---|---|
| Heat | -9% | 4% | 5% | |
| Maximum Upper Side * (°C) | 40.2 | 42 -4% | 43.1 -7% | 36.1 10% |
| Maximum Bottom * (°C) | 46 | 48 -4% | 41.7 9% | 36.7 20% |
| Idle Upper Side * (°C) | 25.2 | 28 -11% | 23.8 6% | 26.8 -6% |
| Idle Bottom * (°C) | 25.8 | 29.7 -15% | 23.7 8% | 26.5 -3% |
* ... daha küçük daha iyidir
Lenovo ThinkPad X380 Yoga 20LJS02W00 ses analizi
(-) | hoparlörler çok yüksek ses çıkarmıyor (69.6 dB)
Bas 100 - 315Hz
(-) | neredeyse hiç bas yok - ortalama olarak medyandan 29.7% daha düşük
(±) | Bas doğrusallığı ortalamadır (8.9% delta - önceki frekans)
Ortalar 400 - 2000 Hz
(+) | dengeli ortalar - medyandan yalnızca 3.5% uzakta
(±) | Ortaların doğrusallığı ortalamadır (10.2% delta - önceki frekans)
Yüksekler 2 - 16 kHz
(±) | daha yüksek en yüksekler - ortalama olarak medyandan 5.1% daha yüksek
(±) | Yükseklerin doğrusallığı ortalamadır (7.3% delta - önceki frekans)
Toplam 100 - 16.000 Hz
(-) | genel ses doğrusal değildir (30.7% ortancaya göre fark)
Aynı sınıfla karşılaştırıldığında
» Bu sınıftaki tüm test edilen cihazların %89%'si daha iyi, 2% benzer, 9% daha kötüydü
» En iyisinin deltası 6% idi, ortalama 20% idi, en kötüsü 57% idi
Test edilen tüm cihazlarla karşılaştırıldığında
» Test edilen tüm cihazların %89'si daha iyi, 3 benzer, % 8 daha kötüydü
» En iyisinin deltası 4% idi, ortalama 24% idi, en kötüsü 134% idi
Apple MacBook 12 (Early 2016) 1.1 GHz ses analizi
(+) | hoparlörler nispeten yüksek sesle çalabilir (83.6 dB)
Bas 100 - 315Hz
(±) | azaltılmış bas - ortalama olarak medyandan 11.3% daha düşük
(±) | Bas doğrusallığı ortalamadır (14.2% delta - önceki frekans)
Ortalar 400 - 2000 Hz
(+) | dengeli ortalar - medyandan yalnızca 2.4% uzakta
(+) | orta frekanslar doğrusaldır (5.5% deltadan önceki frekansa)
Yüksekler 2 - 16 kHz
(+) | dengeli yüksekler - medyandan yalnızca 2% uzakta
(+) | yüksekler doğrusaldır (4.5% deltadan önceki frekansa)
Toplam 100 - 16.000 Hz
(+) | genel ses doğrusaldır (10.2% ortancaya göre fark)
Aynı sınıfla karşılaştırıldığında
» Bu sınıftaki tüm test edilen cihazların %7%'si daha iyi, 2% benzer, 91% daha kötüydü
» En iyisinin deltası 5% idi, ortalama 18% idi, en kötüsü 53% idi
Test edilen tüm cihazlarla karşılaştırıldığında
» Test edilen tüm cihazların %5'si daha iyi, 1 benzer, % 94 daha kötüydü
» En iyisinin deltası 4% idi, ortalama 24% idi, en kötüsü 134% idi
| Kapalı / Bekleme modu | |
| Boşta | |
| Çalışırken |
|
Key:
min: | |
| Lenovo ThinkPad X380 Yoga 20LJS02W00 i5-8550U, UHD Graphics 620 | Lenovo ThinkPad Yoga 370-20JJS00100 i5-7200U, HD Graphics 620 | Dell XPS 13 9365-4537 2-in-1 i5-7Y54, HD Graphics 615 | HP EliteBook x360 1030 G2 i5-7300U, HD Graphics 620 | |
|---|---|---|---|---|
| Power Consumption | -7% | -49% | 2% | |
| Idle Minimum * (Watt) | 4 | 3.6 10% | 8.2 -105% | 3.2 20% |
| Idle Average * (Watt) | 4.9 | 7.2 -47% | 10.8 -120% | 5.5 -12% |
| Idle Maximum * (Watt) | 6.9 | 8.4 -22% | 12.7 -84% | 6.5 6% |
| Load Average * (Watt) | 36 | 29.9 17% | 22.6 37% | 29.7 17% |
| Load Maximum * (Watt) | 34.4 | 32.2 6% | 24.6 28% | 41.3 -20% |
* ... daha küçük daha iyidir
| Lenovo ThinkPad X380 Yoga 20LJS02W00 i5-8550U, UHD Graphics 620, 51 Wh | Lenovo ThinkPad Yoga 370-20JJS00100 i5-7200U, HD Graphics 620, 51 Wh | Dell XPS 13 9365-4537 2-in-1 i5-7Y54, HD Graphics 615, 46 Wh | HP EliteBook x360 1030 G2 i5-7300U, HD Graphics 620, 57 Wh | |
|---|---|---|---|---|
| Pil Çalışma Süresi | -4% | -20% | 33% | |
| Reader / Idle (h) | 20.8 | 19.4 -7% | 23.1 11% | |
| H.264 (h) | 9.2 | 9.6 4% | 11 20% | |
| WiFi v1.3 (h) | 8.5 | 8.1 -5% | 6.8 -20% | 10.5 24% |
| Load (h) | 2.3 | 2.1 -9% | 4.1 78% |
Artılar
Eksiler
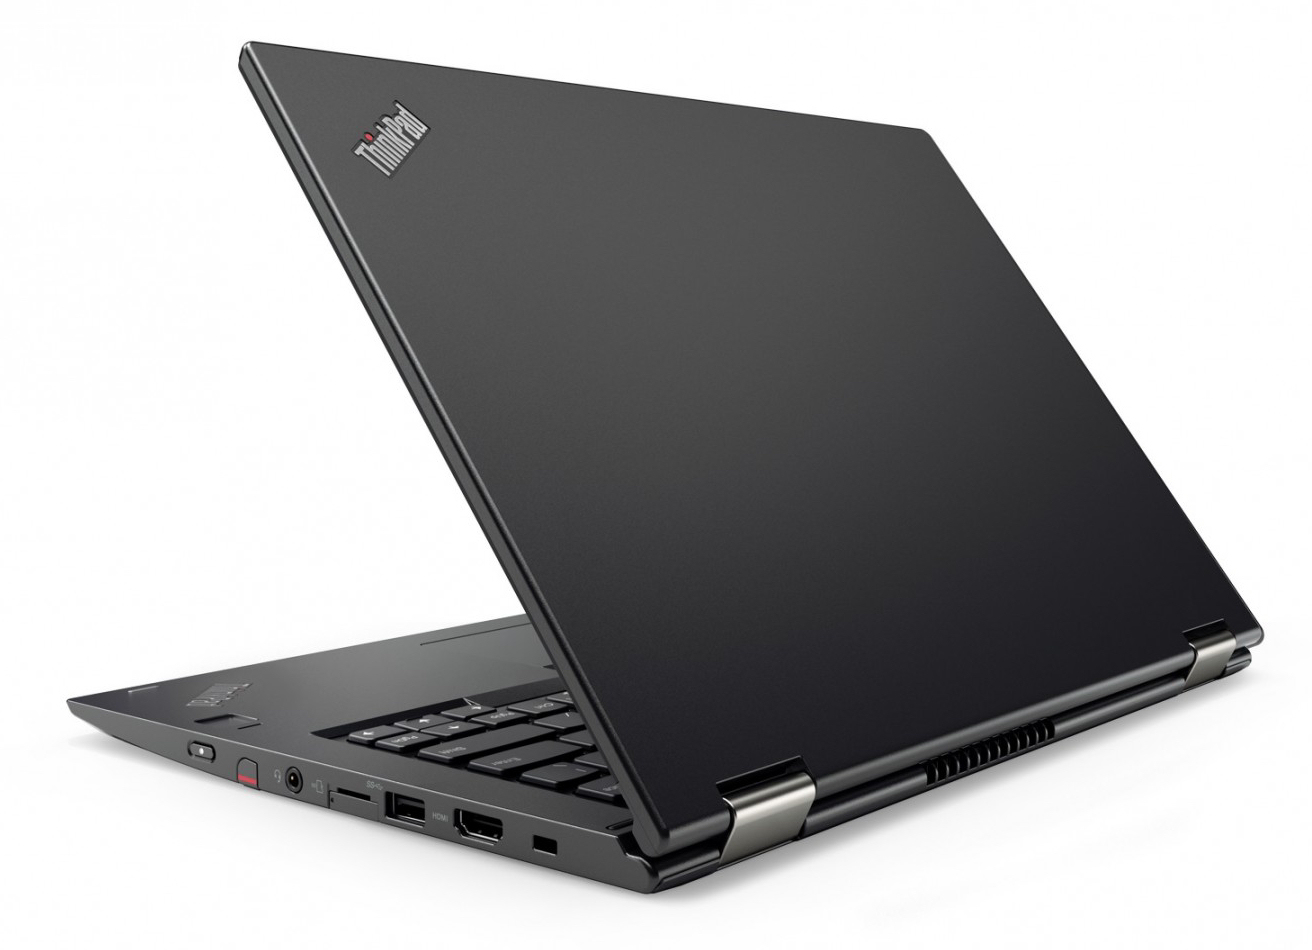
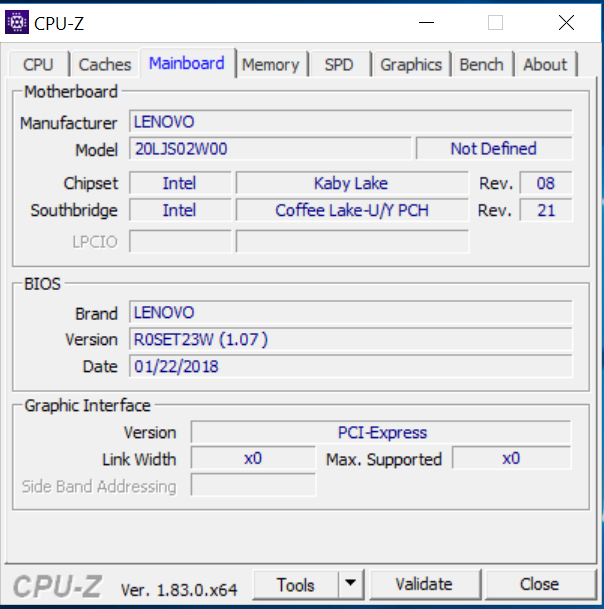
ThinkPad Yoga 370 modeline kıyasla yeni ThinkPad X380 Yoga modeline çok büyük değişiklikler yok. Yeni isminin dışında tek farklılık yeni quad-core ULV Intel işlemci.
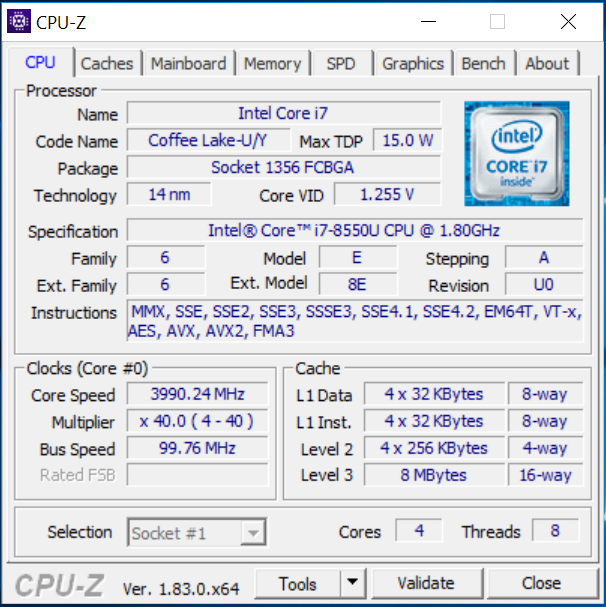
Dahili Core i7-8550U işlemci ofis ve gündelik internet gezintisi için fazlasıyla yeterli. Turbo Boost özelliğini ise sadece kısa süreliğine sürdürebiliyor.
Genel olarak Lenovo ThinkPad X380 Yoga başarılı olarak tanımlanabilir. Tek yıllık garantii, LTE özelliğinin olmayışı gibi noktalar bu fiyat aralığındaki bir cihazda görülmemesi gereken şeyler.
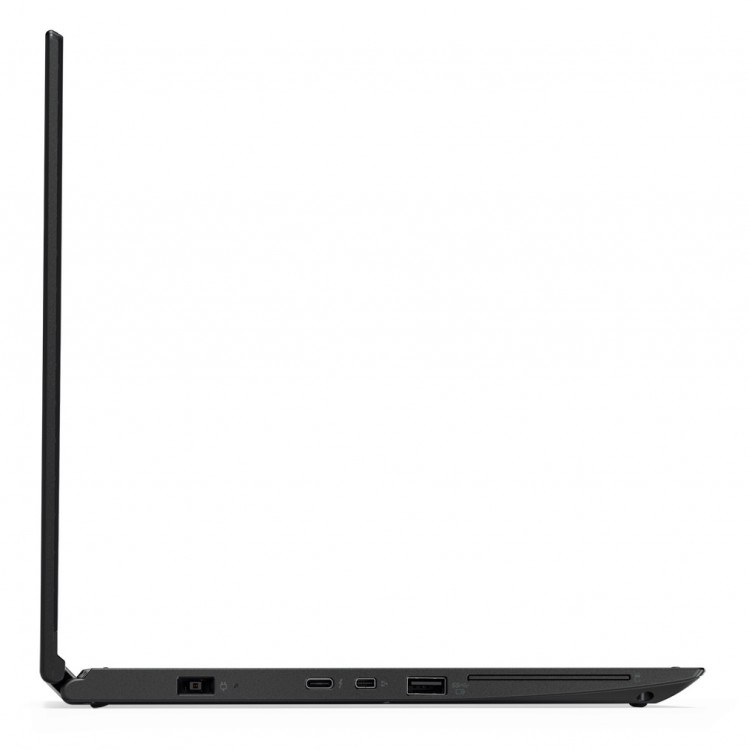
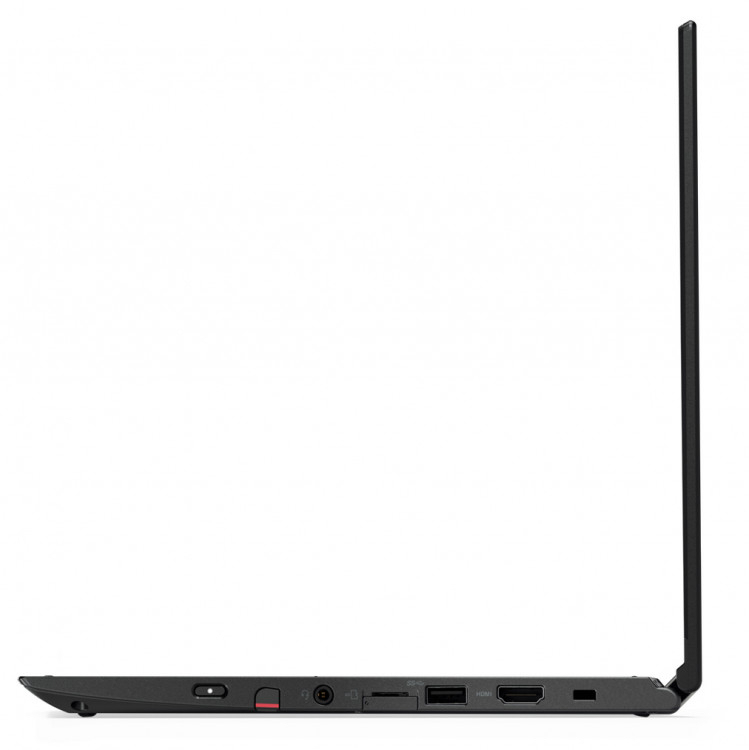
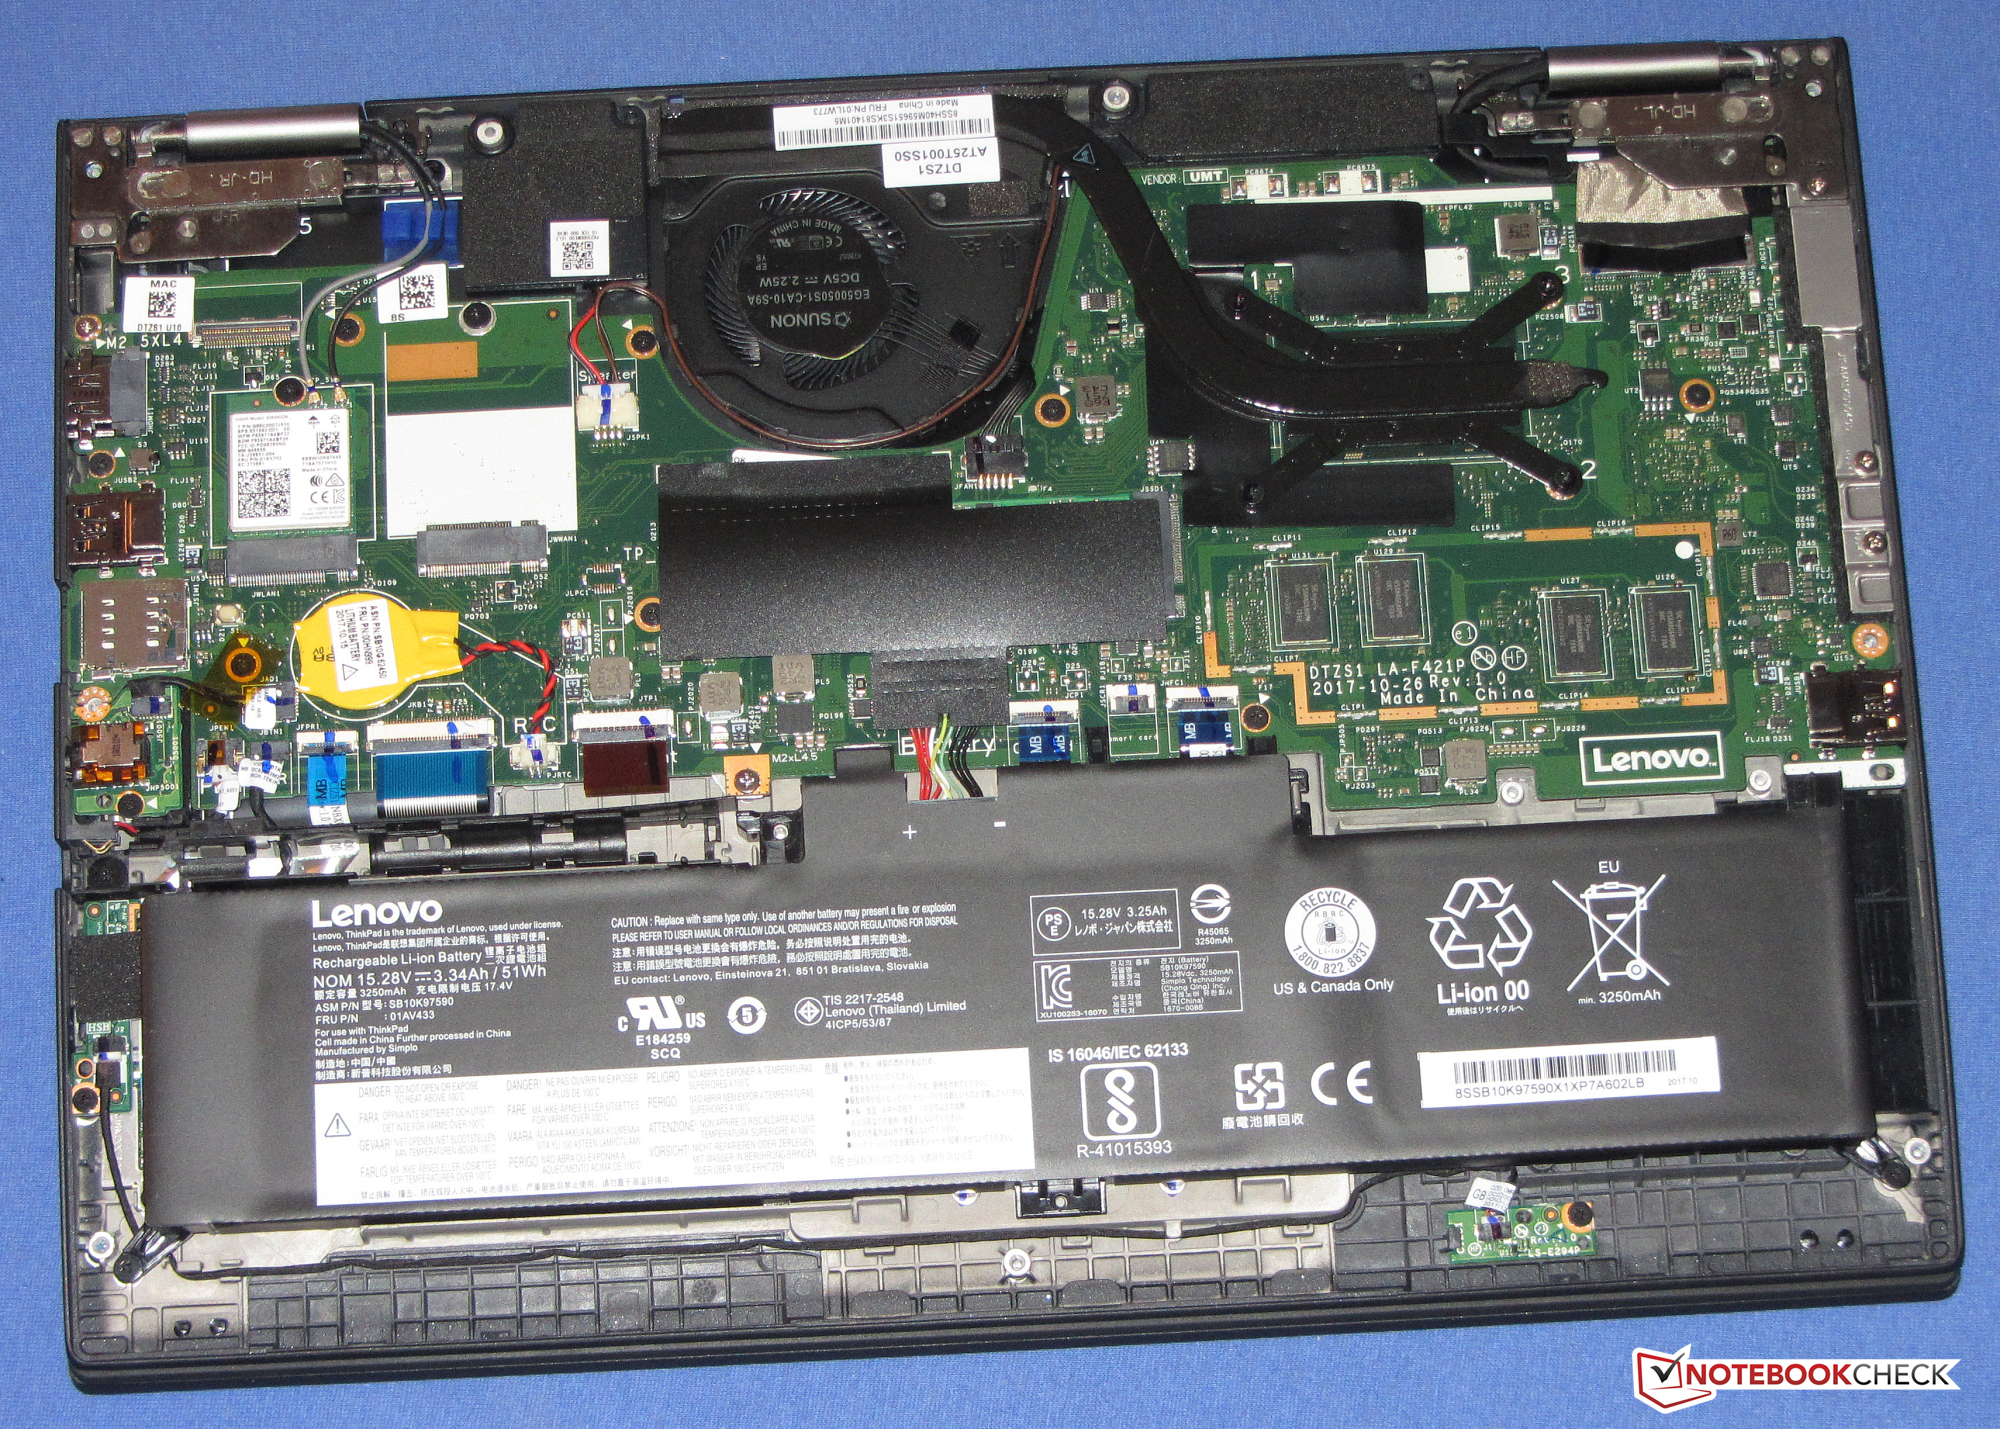
Çok hızlı NVMe SSD sayesinde sistem çok hızlı cevap veriyor. SSD değişimi yapmak da mümkün, bunun için öncelikle kasayı açmak gerekli. Bu işlem oldukça klay. Kasa açılında LTE modem slotuna da erişim mümkün. SIM kart slotu sunulmuş. Ancak LTE modem kullanımı imkansız çünkü cihaz üzerinde WWAN anteni yok.
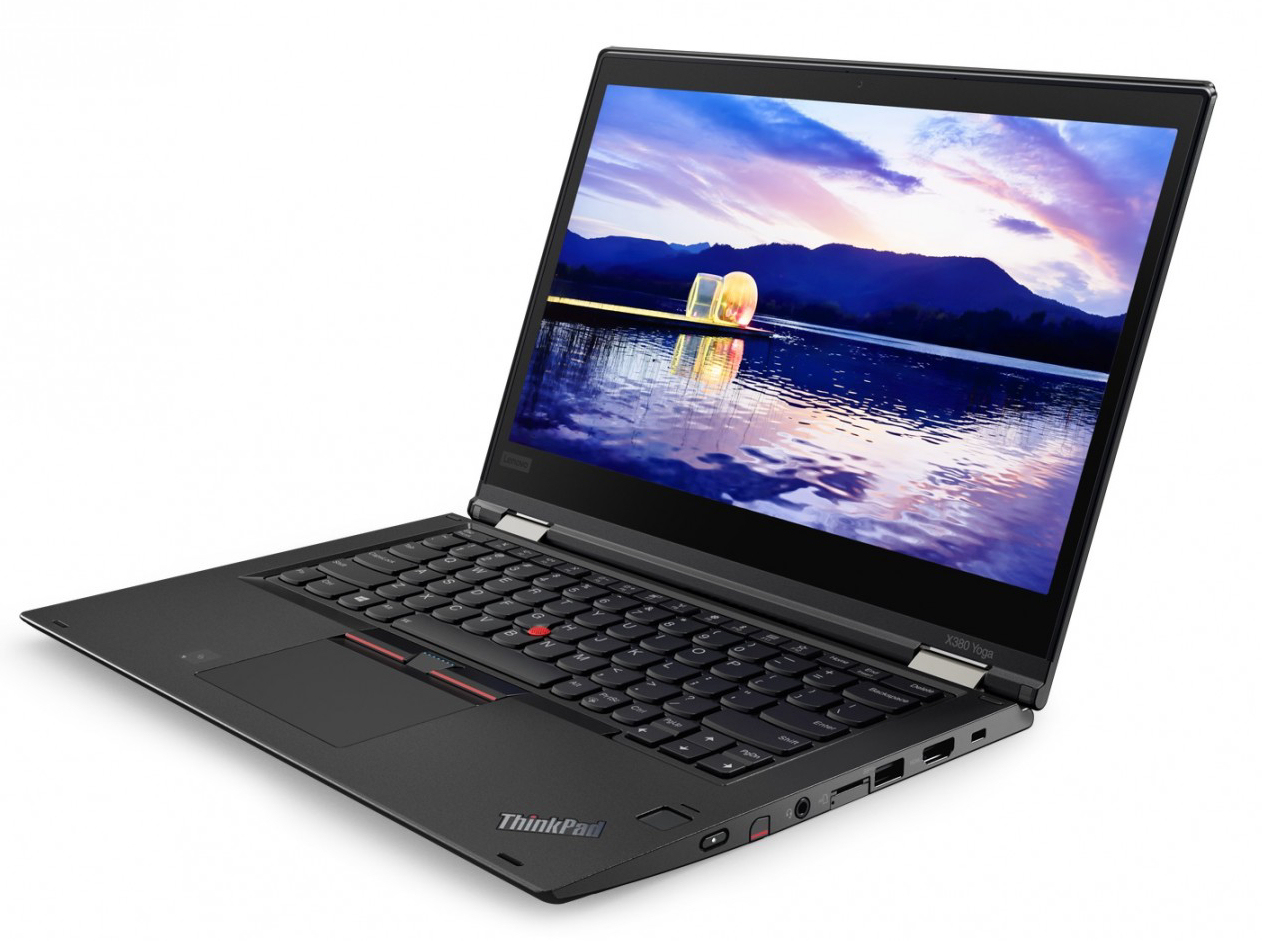
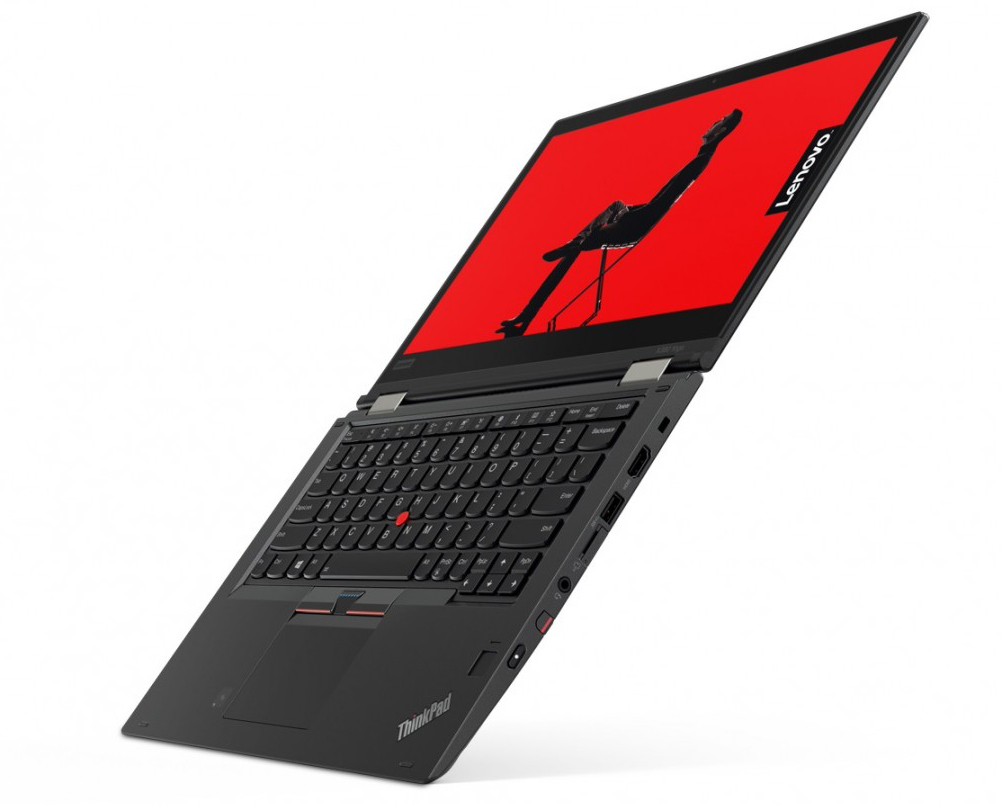
Aydınlatmalı klavye iyi bir özellik. ThinkPad Yoga 370 modelinde tanıdığımız için eleştirecek bir şey bulamıyoruz. İyi batarya ömründen tekrar bahsetmek gerek. IPS tabanlı dokunmatik ekran çok iyi bakış açıları, kontrast ve yüksek parlaklık sunuyor.
Lenovo ThinkPad X380 Yoga 20LJS02W00
- 03/09/2018 v6 (old)
Sascha Mölck