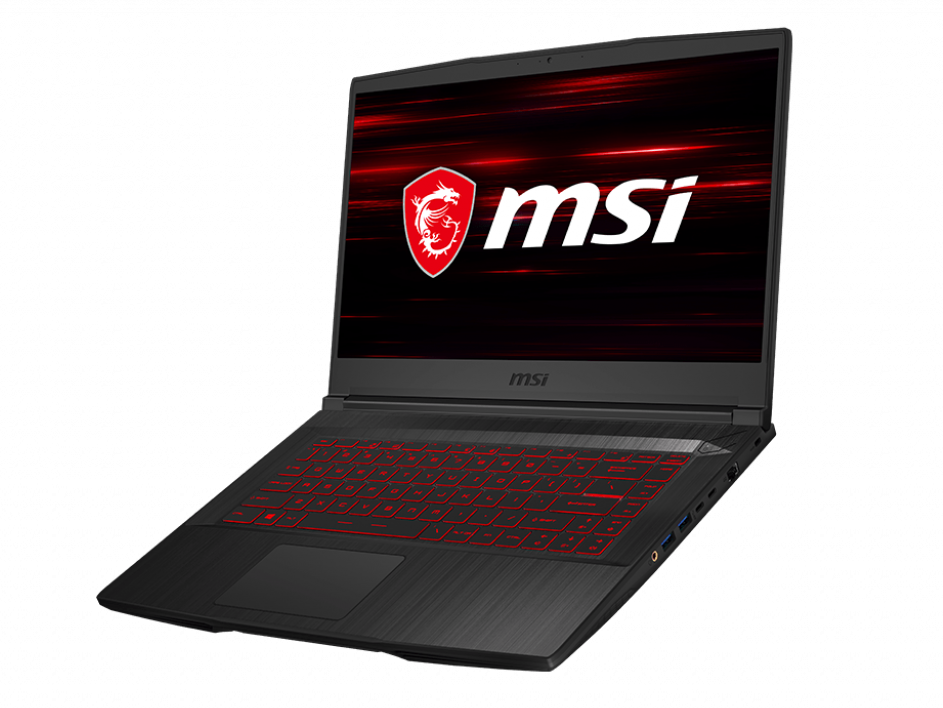
Kısa inceleme: MSI GF65 9SD Laptop
Giriş seviyesi MSI GF65, geçen yılki GF63 için bir güncellemedir. GP serisi ve GL serisinin yanı sıra GF serisi, sıkı bütçeli tüketiciler için MSI'nin en ucuz oyun dizüstü bilgisayarlarına ev sahipliği yapıyor. SKU'lar Core i5-9300H'den Core i7-9750H CPU'ya, 1080p 60 Hz, 120 Hz veya 144 Hz ekrana ve 64 GB'a kadar DDR4 RAM'e kadar uzanıyor. GeForce GTX 1660 Ti GPU ve 1080p çözünürlük tüm konfigürasyonlarda şimdilik sabit kalıyor. Görsel olarak, GF65, GF63 ile klavyeleri, klavyeleri, portları ve hatta boyutlarıyla aynı. Bu nedenle, GF63 hakkındaki mevcut incelememize göz atmanızı öneririz. Benzer kasa tasarımlarına rağmen, GF65 anakartında aşağıda ayrıntılara varacağımız bazı önemli iç yükseltmeler var. MSI GF65'in rakipleri, 15.6-inç HP Pavilion 15 Oyun, Lenovo Legion Y540, Asus TUF FX505, Acer Nitro 5 ve Dell G3 ve G5 serisi. Bizim GF65 9SD test birimi şu anda CUKUSA.com sitesinde 950 $ USD karşılığında bulunabilir. Daha fazla MSI incelemesi: MSI WP65MSI GS65MSI GE75MSI GL65MSI GP65
Derecelendirme | Tarih | Modeli | Ağırlık | Yükseklik | Boyut | Çözünürlük | Fiyat |
|---|---|---|---|---|---|---|---|
| 78.8 % v7 (old) | 10/2019 | MSI GF65 9SD i7-9750H, GeForce GTX 1660 Ti Mobile | 1.9 kg | 21.7 mm | 15.60" | 1920x1080 | |
| 80.4 % v6 (old) | 08/2019 | Asus TUF FX505DT-EB73 R7 3750H, GeForce GTX 1650 Mobile | 2.2 kg | 26.8 mm | 15.60" | 1920x1080 | |
| 82.3 % v7 (old) | Dell G7 7590 i7-9750H, GeForce RTX 2060 Mobile | 2.5 kg | 19.9 mm | 15.60" | 1920x1080 | ||
| 82.3 % v7 (old) | 08/2019 | Lenovo Legion Y540-15IRH-81SX00B2GE i7-9750H, GeForce GTX 1660 Ti Mobile | 2.2 kg | 26 mm | 15.60" | 1920x1080 |
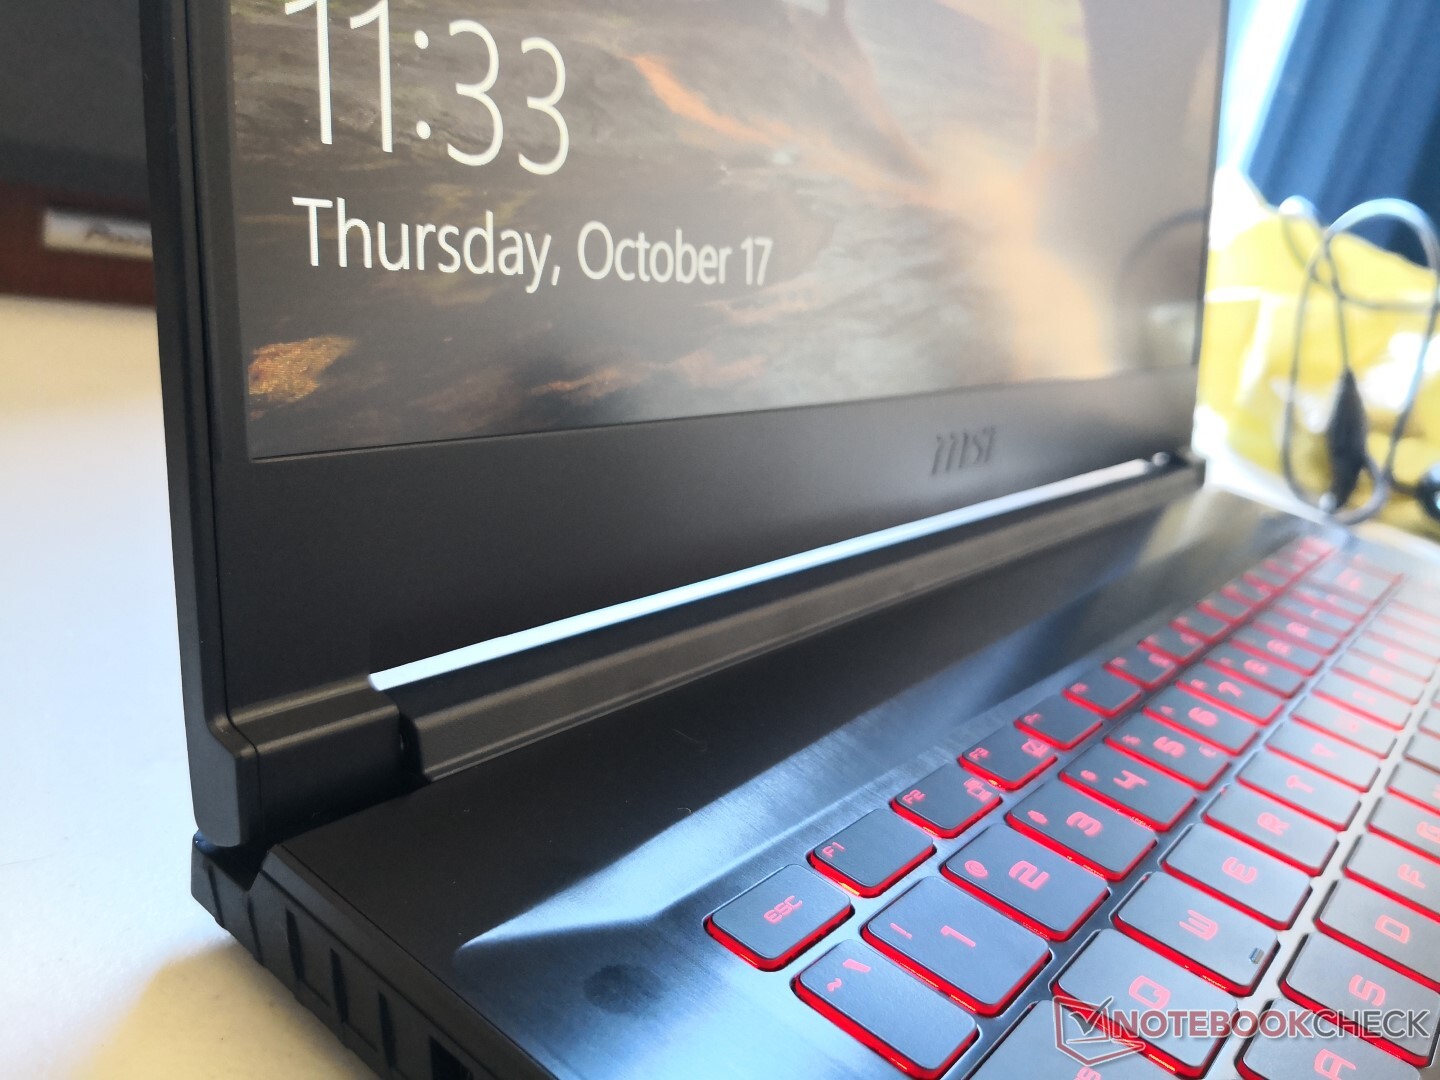
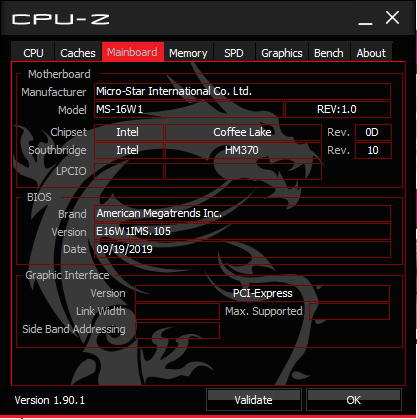
Durum
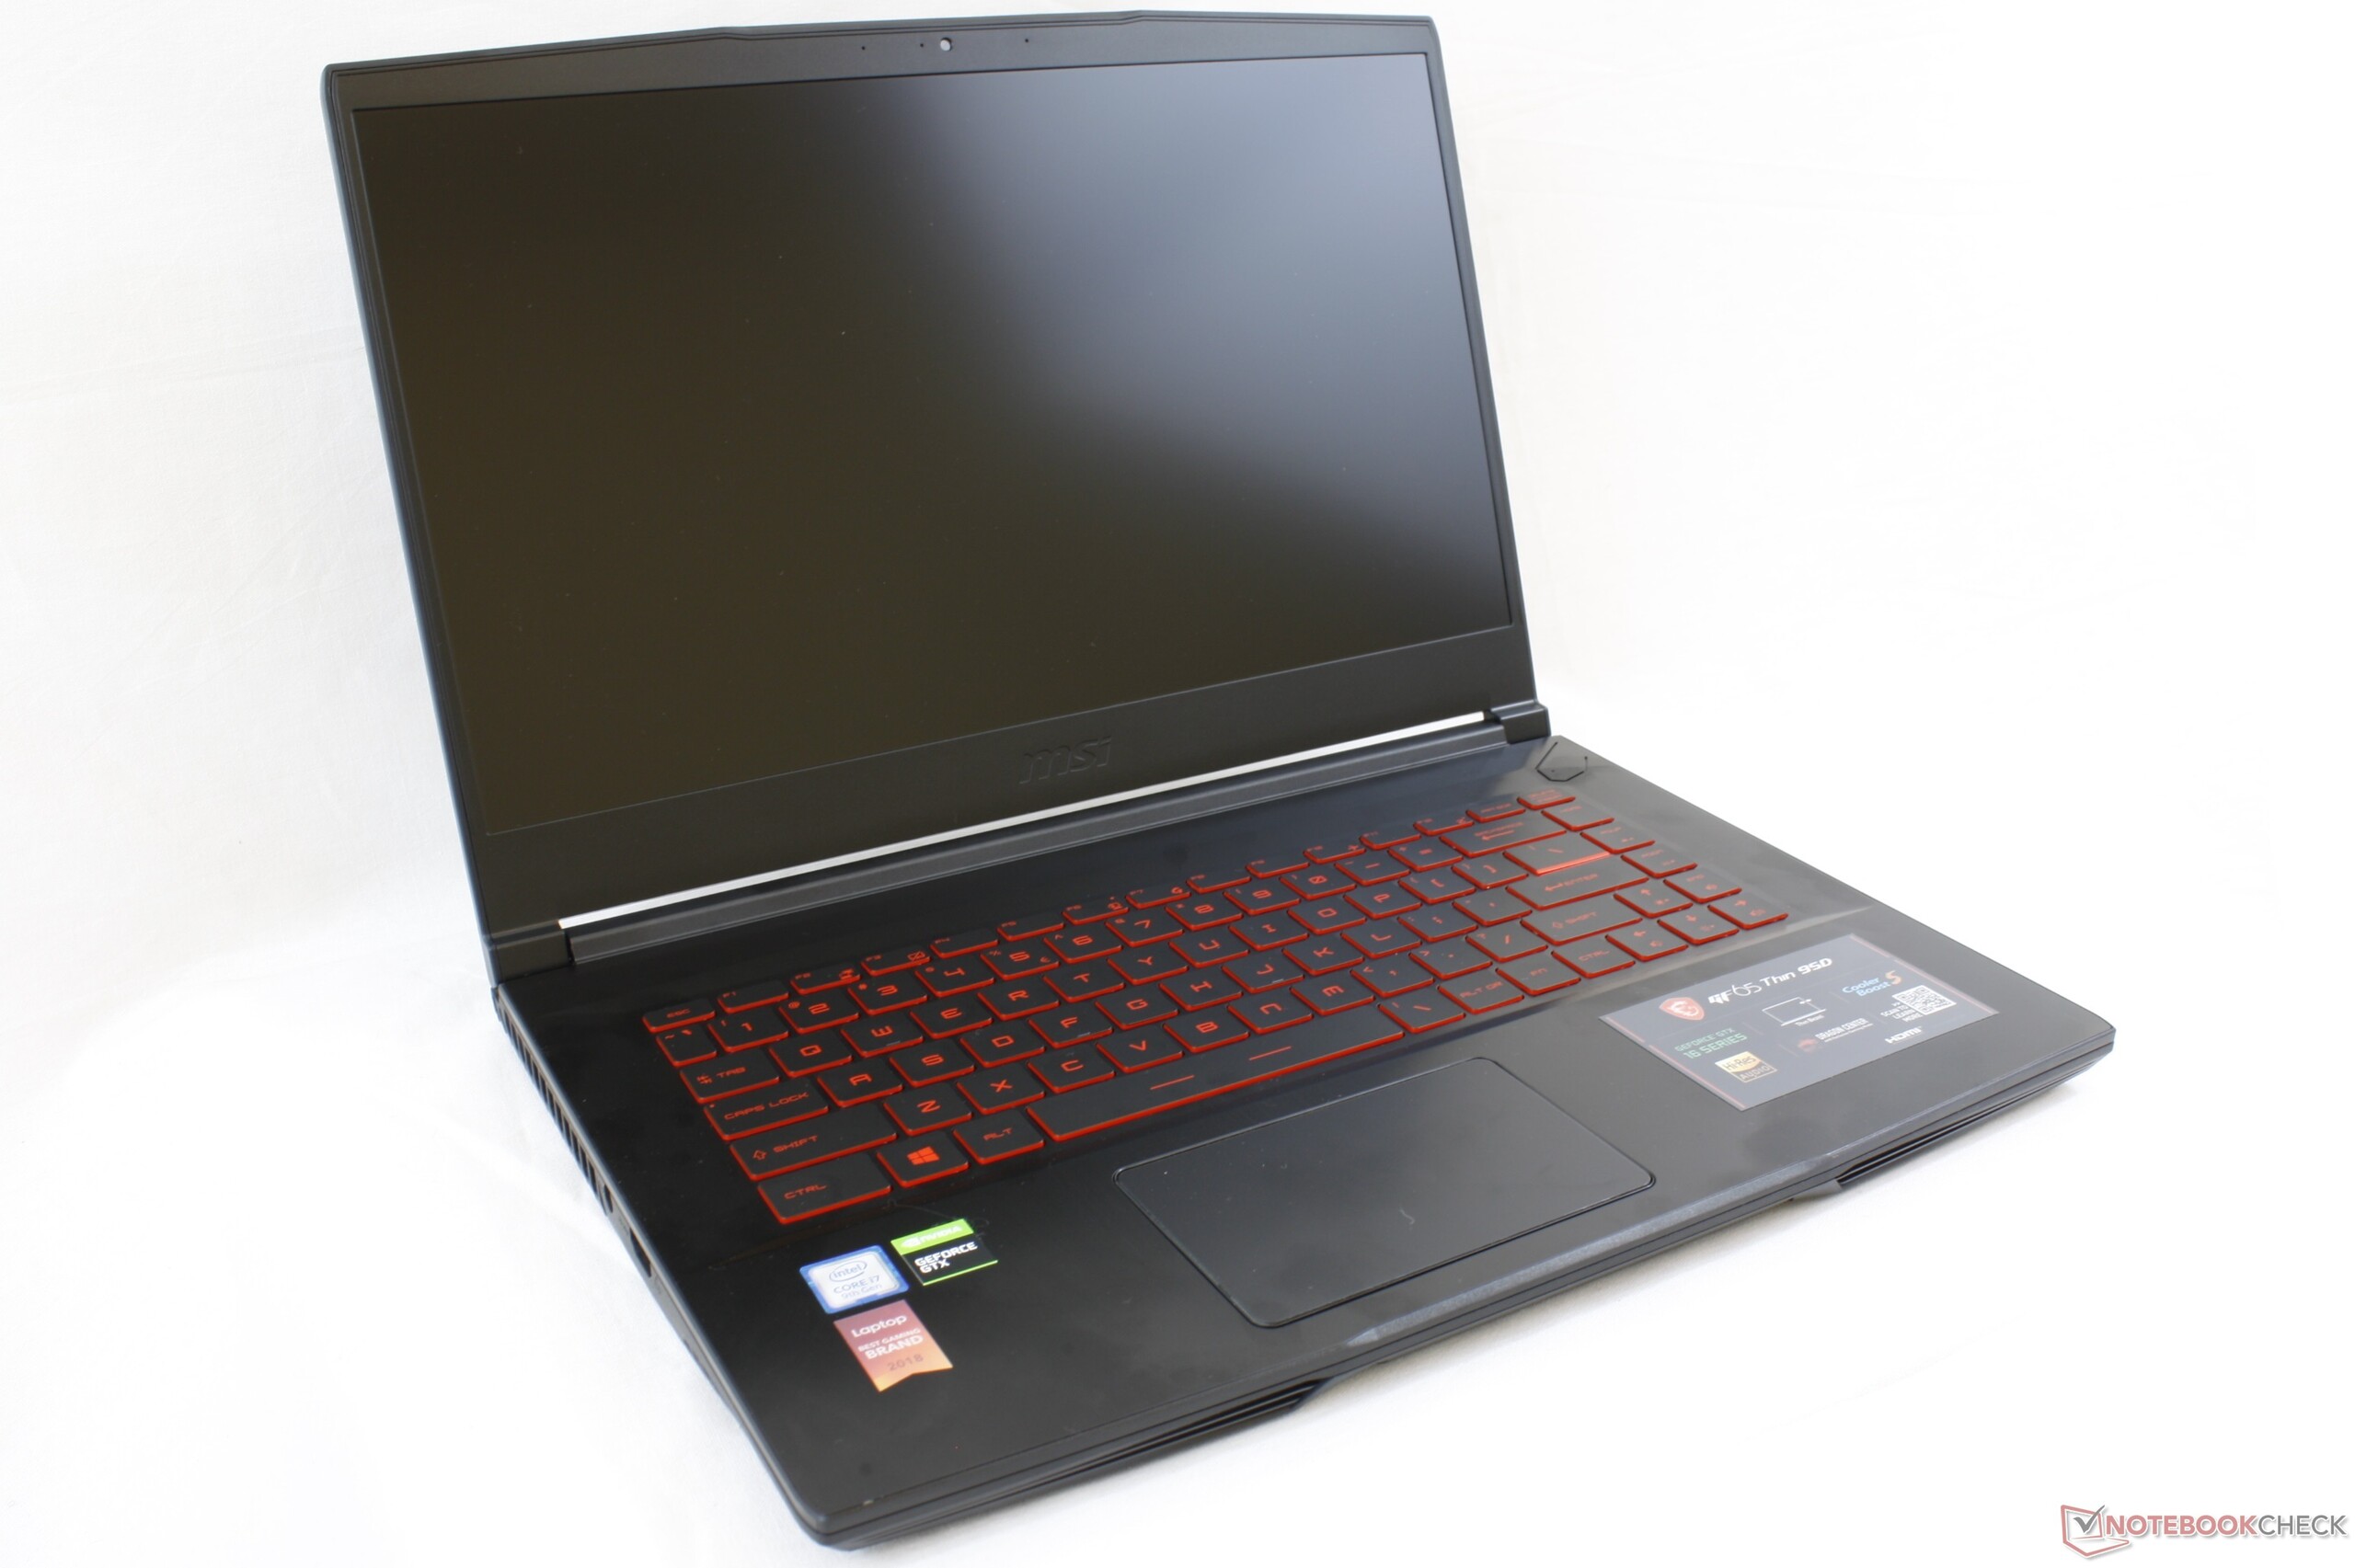
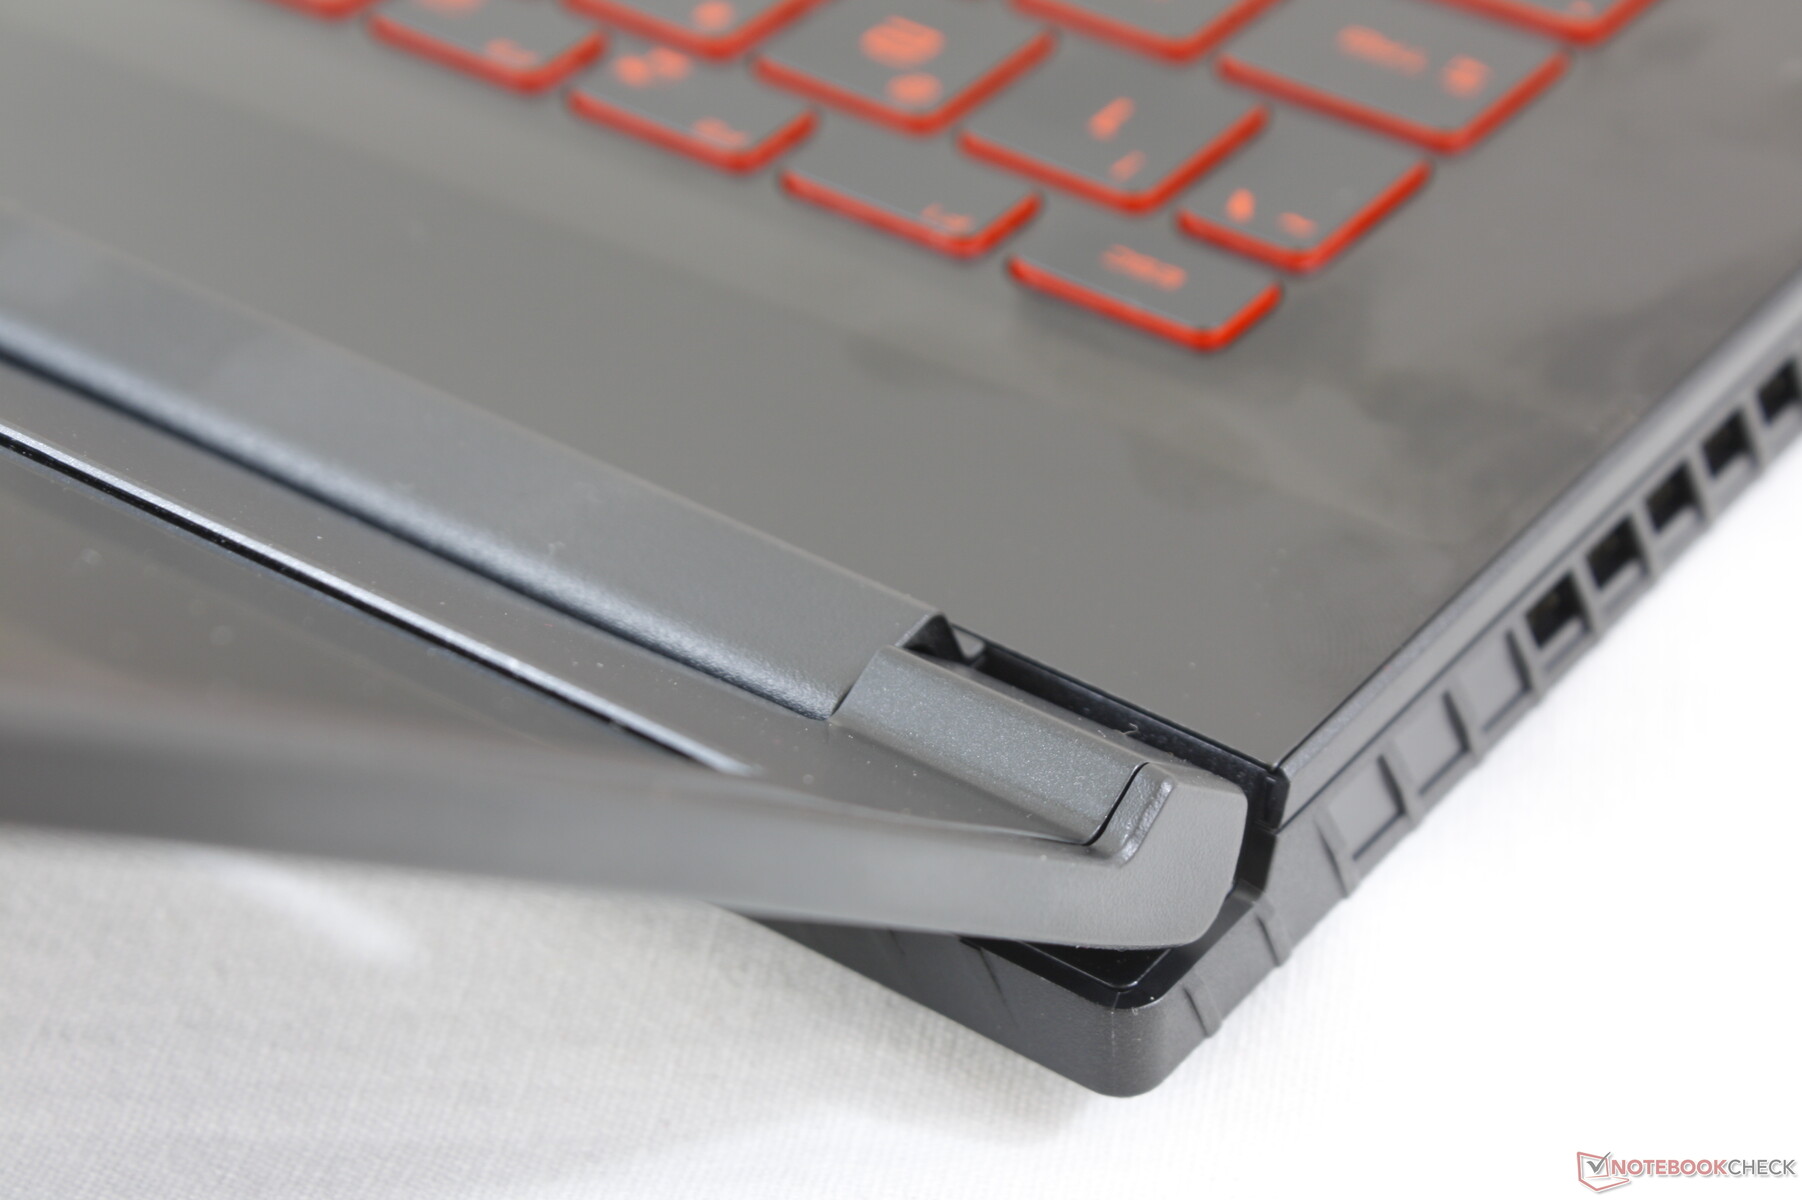
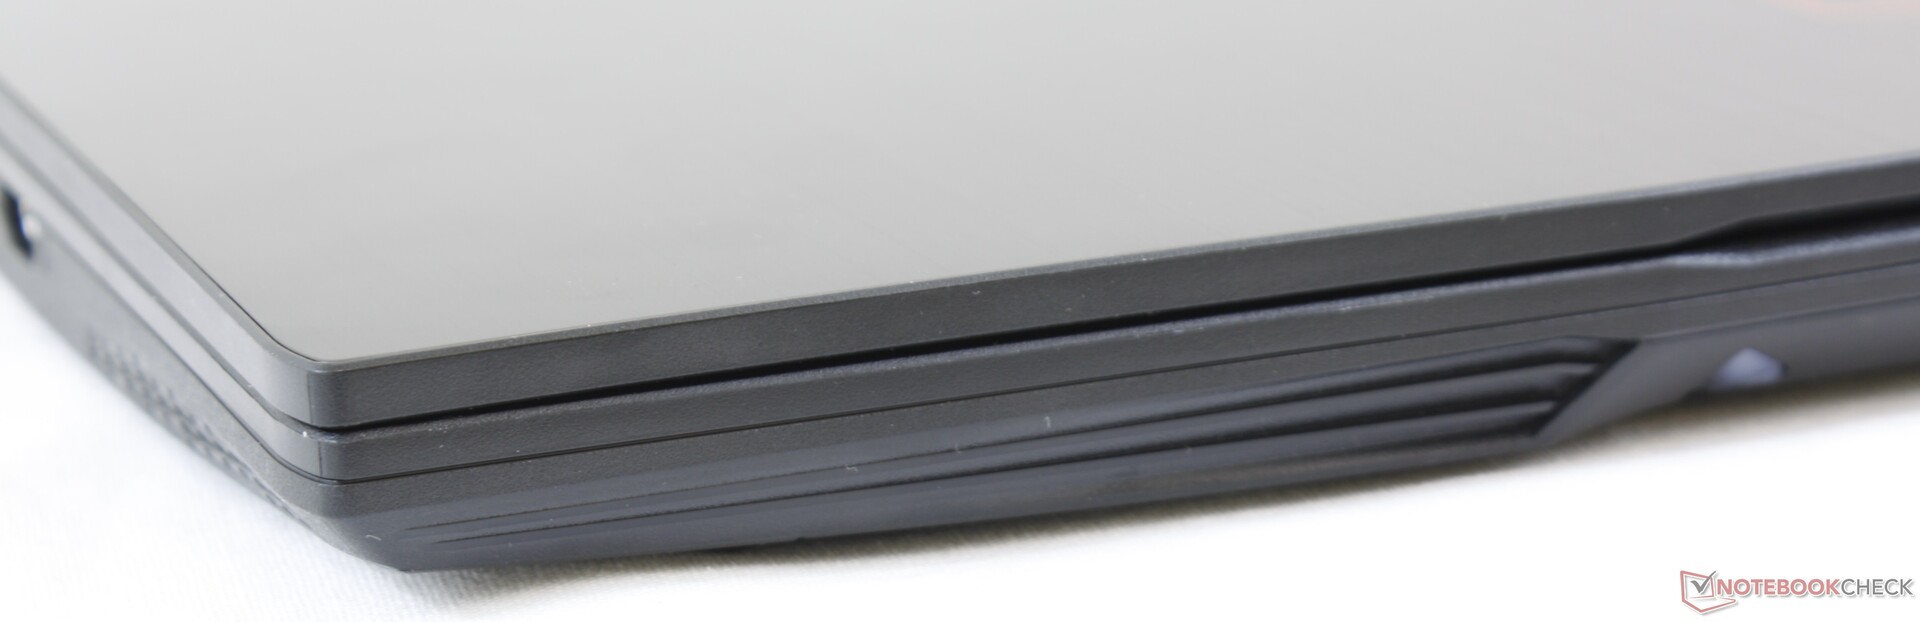
Yukarıda belirtildiği gibi, GF63 kasası ancak bir yaşında olduğundan, kasa GF63 ile aynı kalır. Tasarım, daha önce üst seviye GS serisine özel olduğu için MSI'nin bütçe GP serisine dar çerçeveler koymak için dikkat çekicidir. Ek olarak, MSI sistemi, Legion Y540 veya Asus TUF FX505DT ile karşılaştırıldığında birkaç yüz gram daha hafif olan giriş seviyesi oyun dizüstü bilgisayarlarından biridir. Kasanın farklı olmasına rağmen WP65 iş istasyonuyla neredeyse aynı olduğunu söylemeye değer iç kısımlar, farklı alt plaka tasarımları ve yeniden düzenlenmiş bağlantı noktaları.
Bağlantı
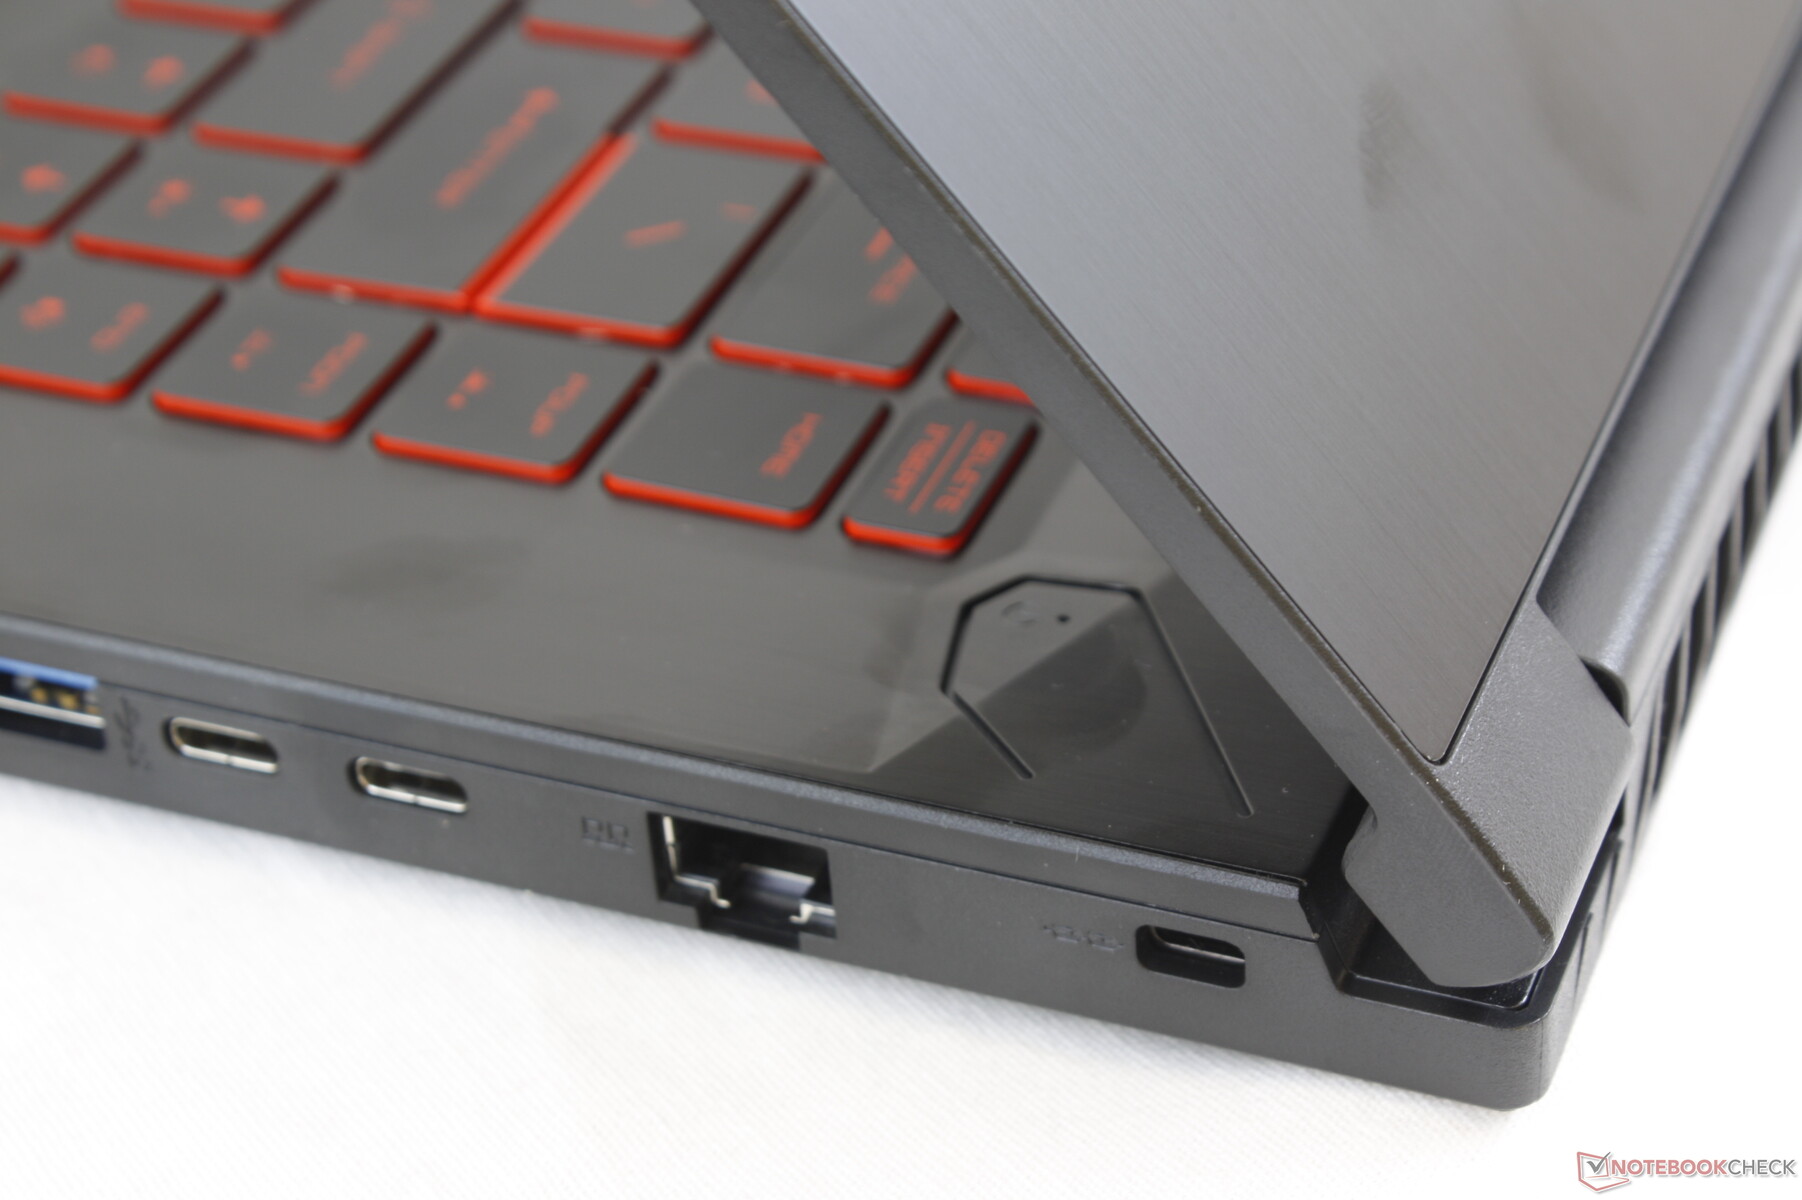
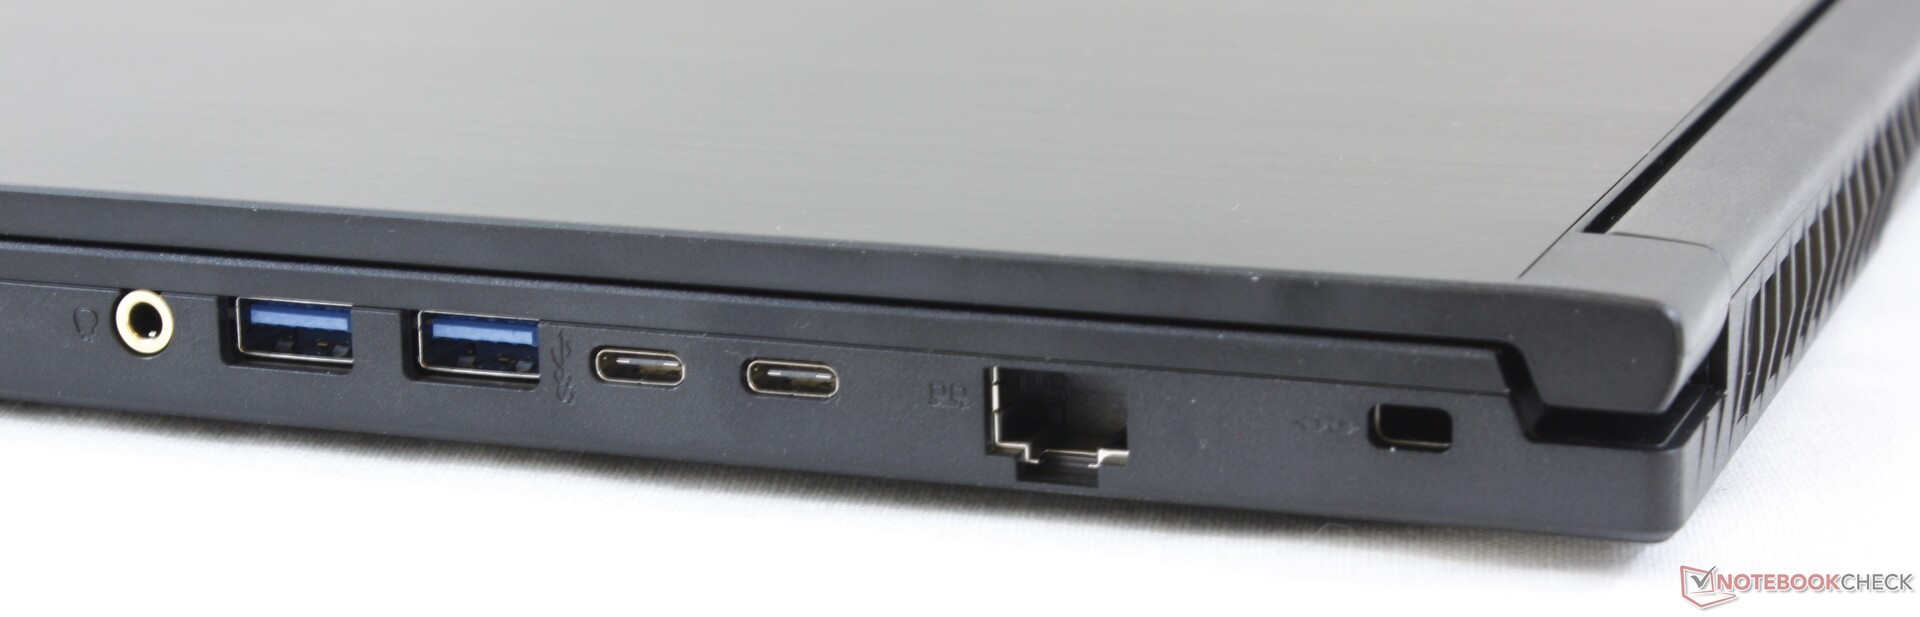
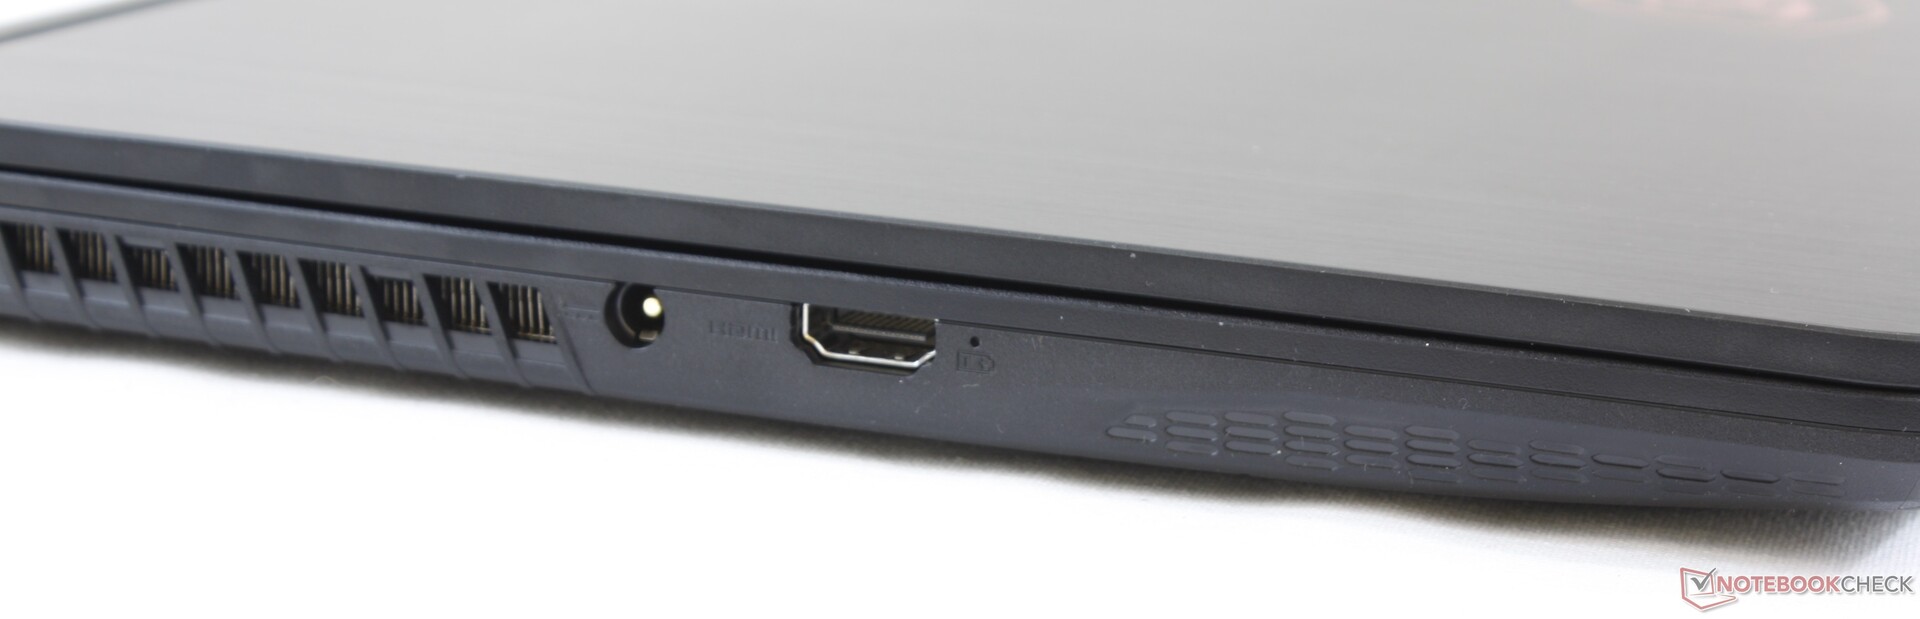
Bağlantı noktası seçenekleri bir bütçe oyun dizüstü bilgisayarı için uygun olsa da, bağlantı noktalarının konumu sorgulanabilir. Sol kenar boyunca USB bağlantı noktası yoktur ve bağlantı noktalarının çoğu, kabloların değerli masa alanlarını kaplayabileceği ön kenara çok yakındır. Örneğin, HDMI bağlantı noktası, dizüstü bilgisayarın önüne arkadan daha yakındır. . Parlak tarafı, hiçbiri arka tarafta olmadığından tüm bağlantı noktalarına ulaşmak kolaydır.
İletişim
WLAN, geçen yıl GF63'te Bluetooth 4.2'li 1x1 Intel 9462'den Bluetooth 5'li daha modern 2x2 Intel 9560'a yükseltildi. Desteklemek için bir 802.11ac ağınız varsa, aktarım hızları 4x'e kadar daha hızlı olabilir. Sunucu kurulumumuzdaki bir hatadan dolayı aktarım hızları normalden düşük, ancak başka türlü bağlantı sorunu yaşamadık.
| Networking | |
| iperf3 transmit AX12 | |
| Aorus 15-SA | |
| Lenovo Legion Y540-15IRH-81SX00B2GE | |
| Asus TUF FX505DT-EB73 | |
| MSI GF63 8RC | |
| MSI GF65 9SD | |
| iperf3 receive AX12 | |
| Aorus 15-SA | |
| MSI GF65 9SD | |
| Lenovo Legion Y540-15IRH-81SX00B2GE | |
| Asus TUF FX505DT-EB73 | |
| MSI GF63 8RC | |
Bakım
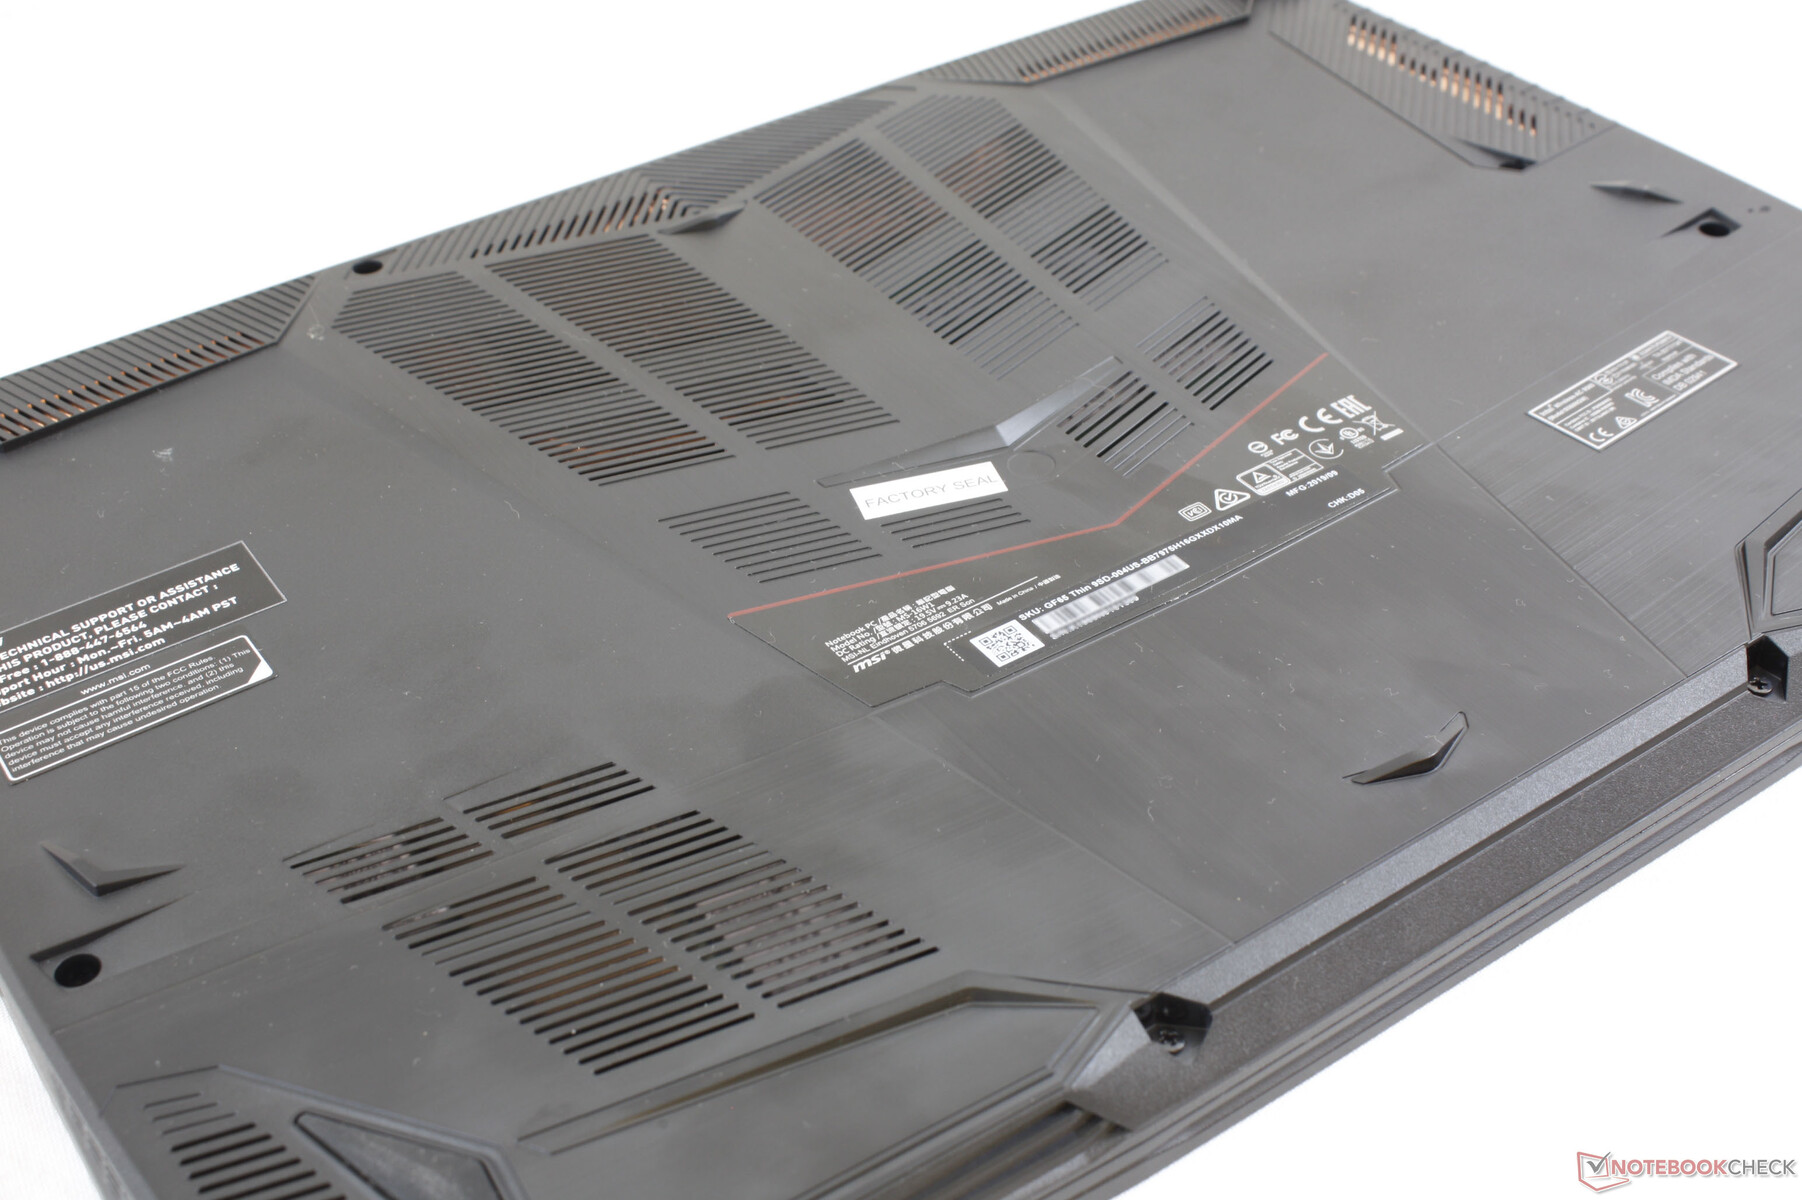
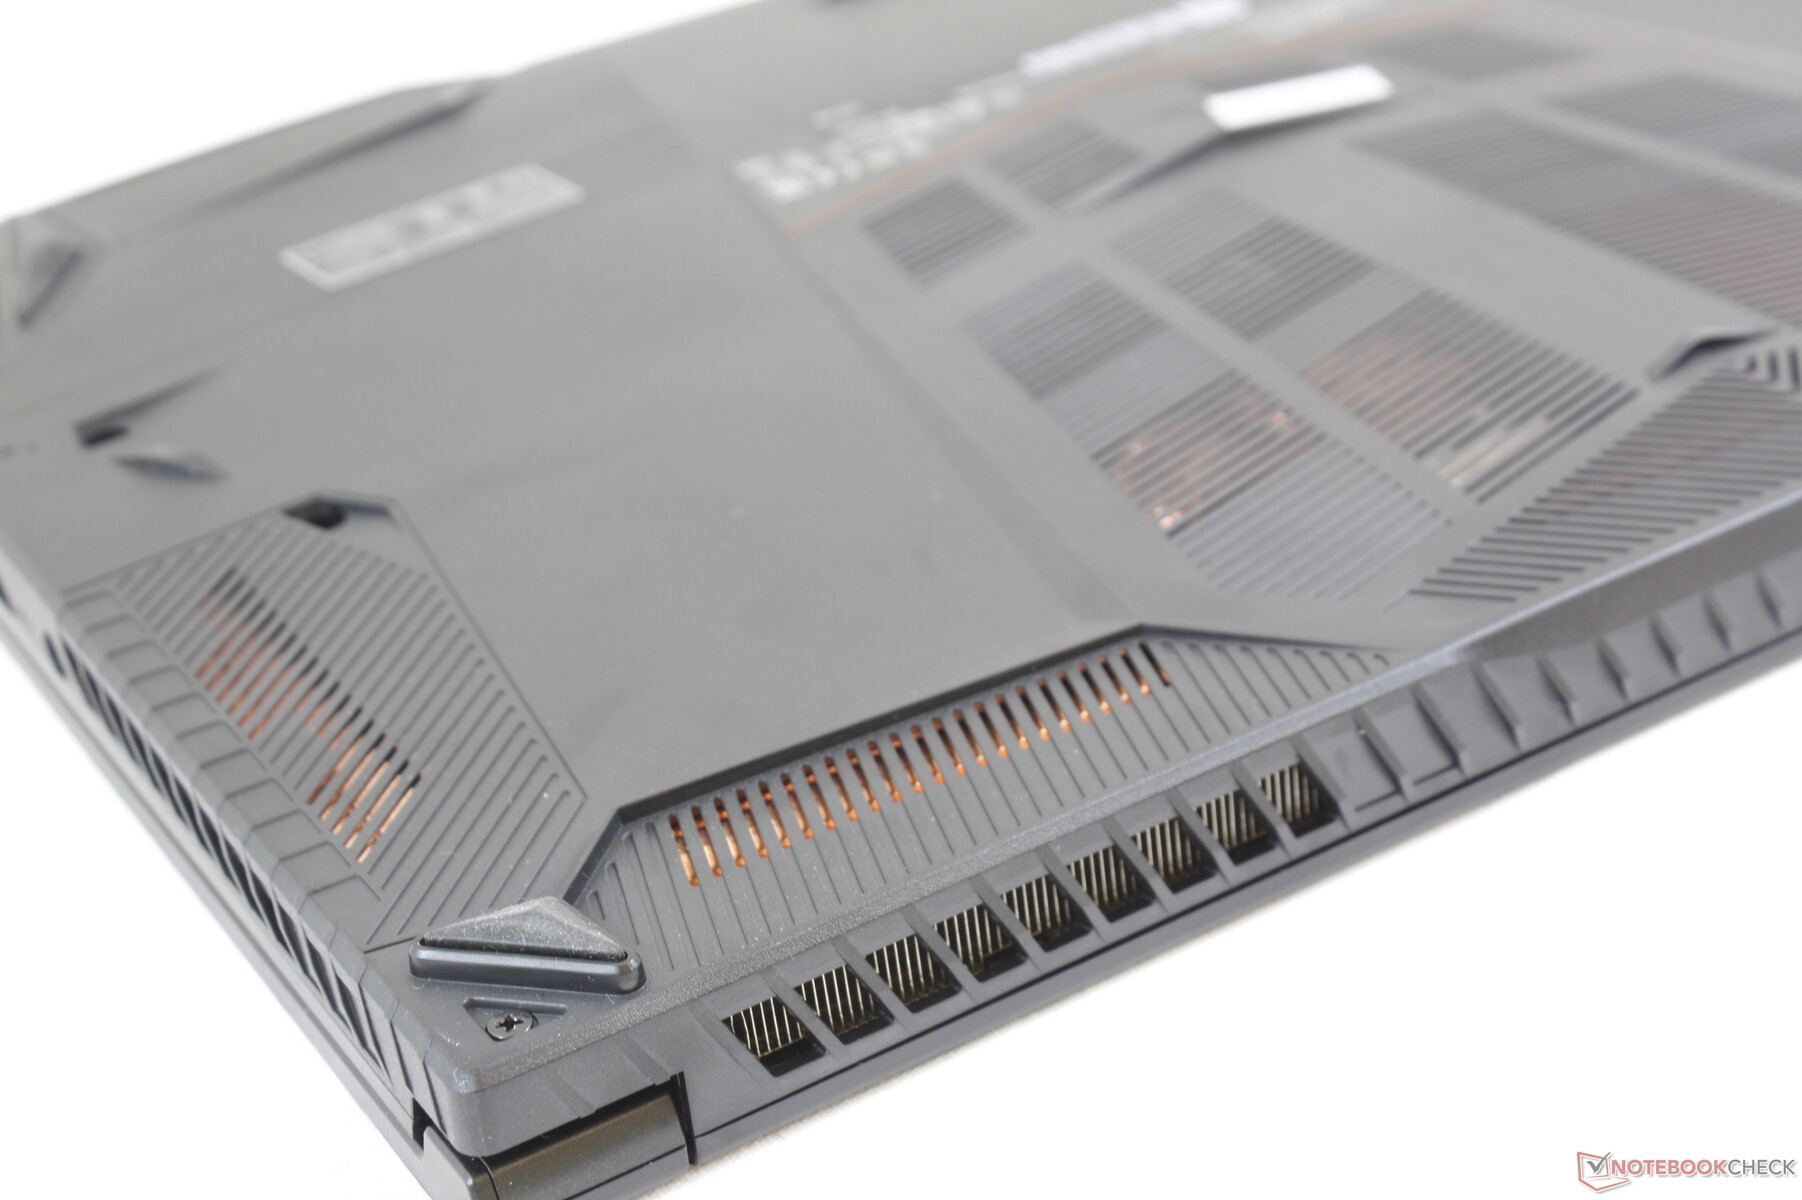
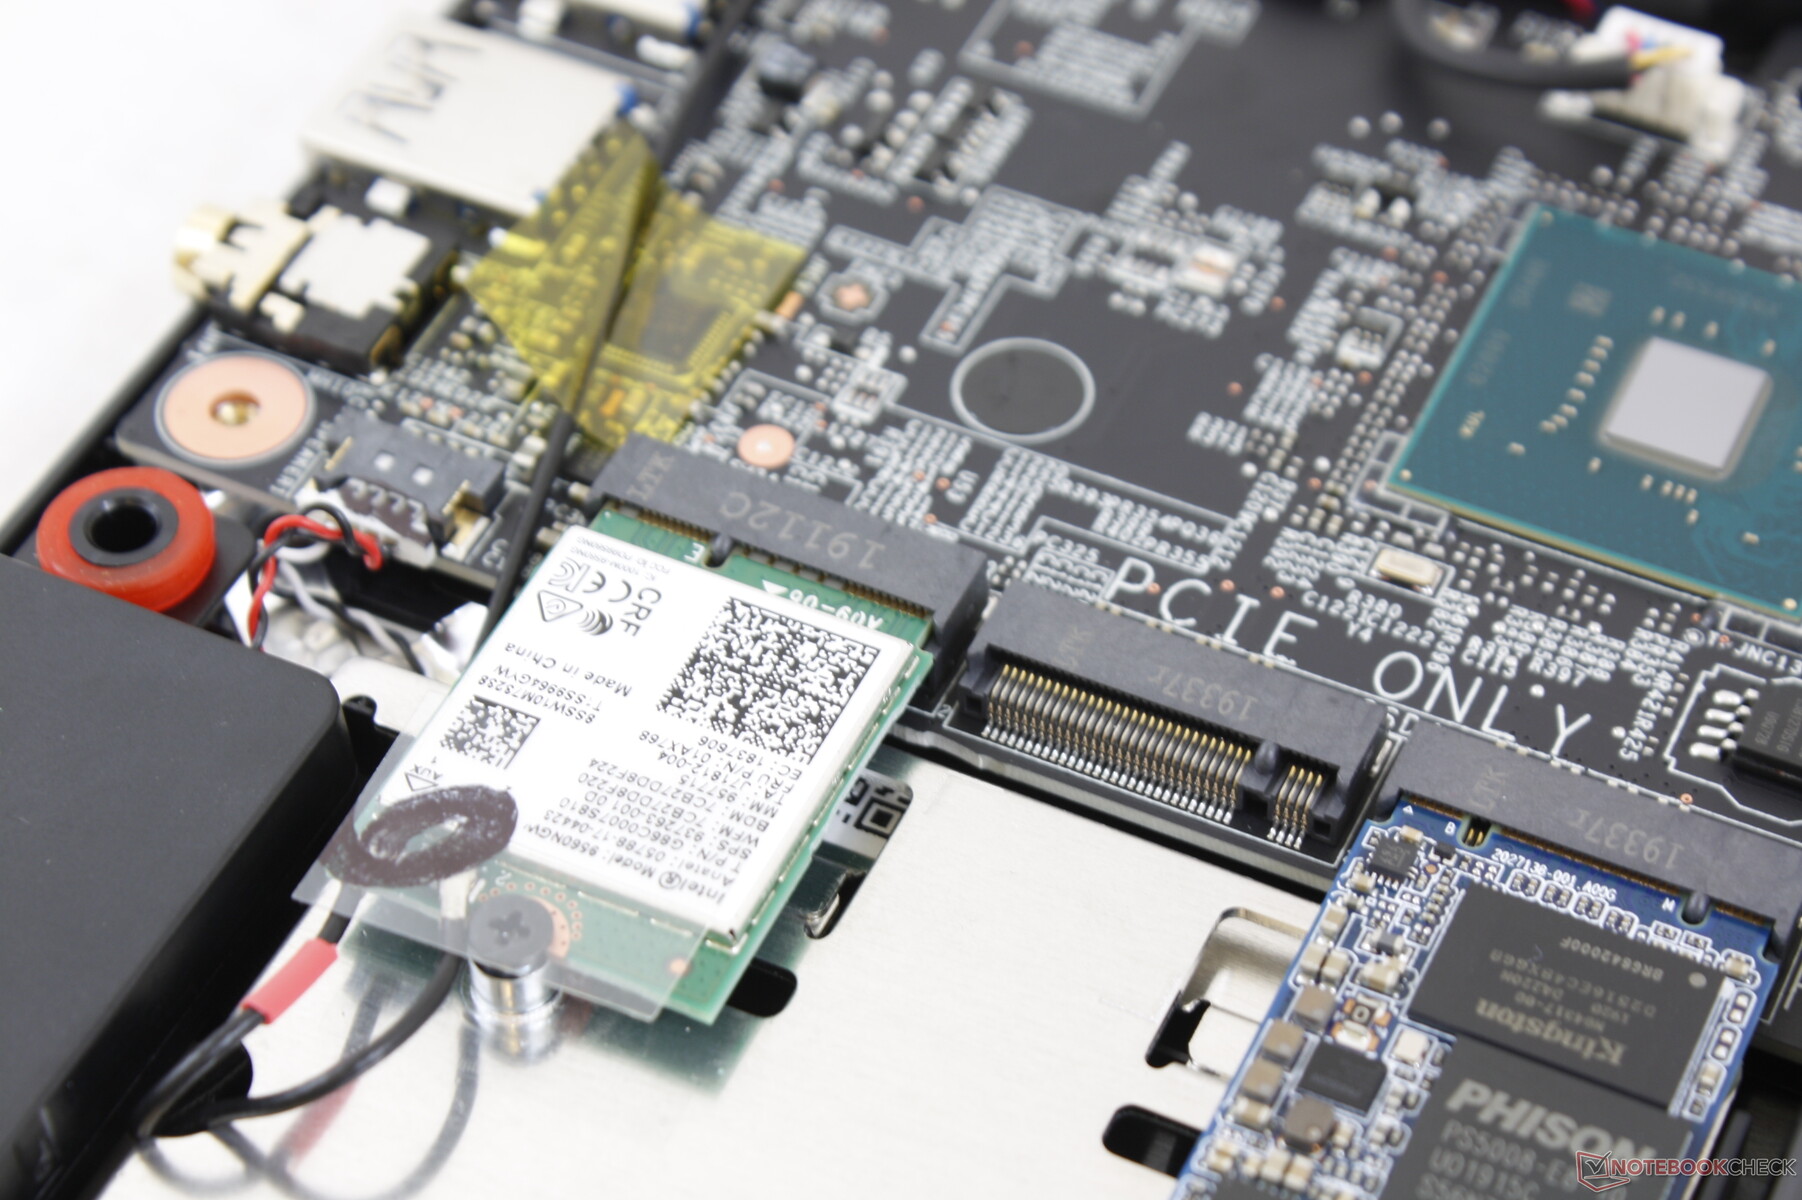
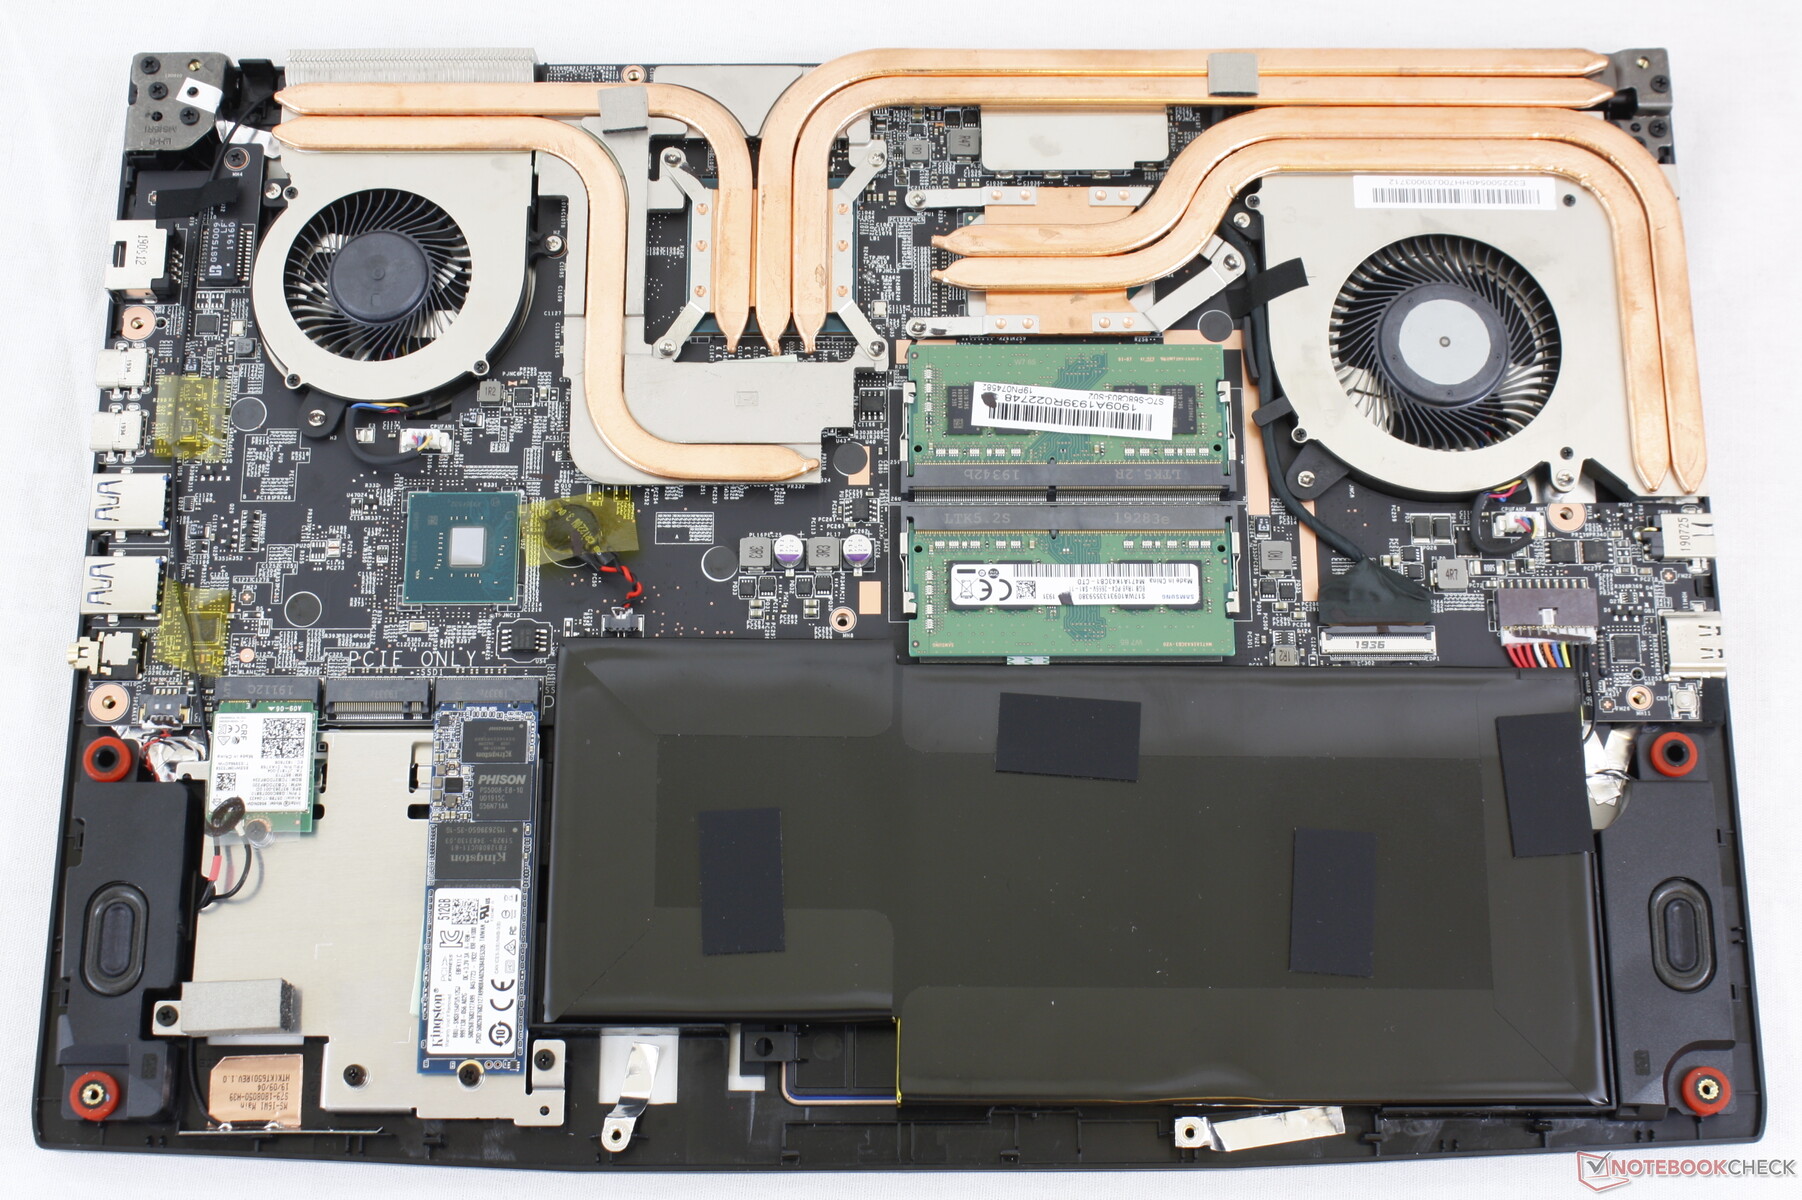
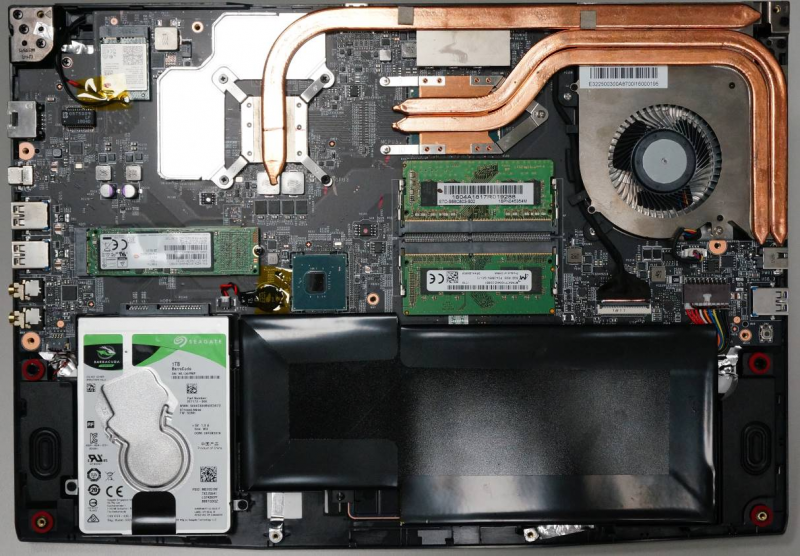
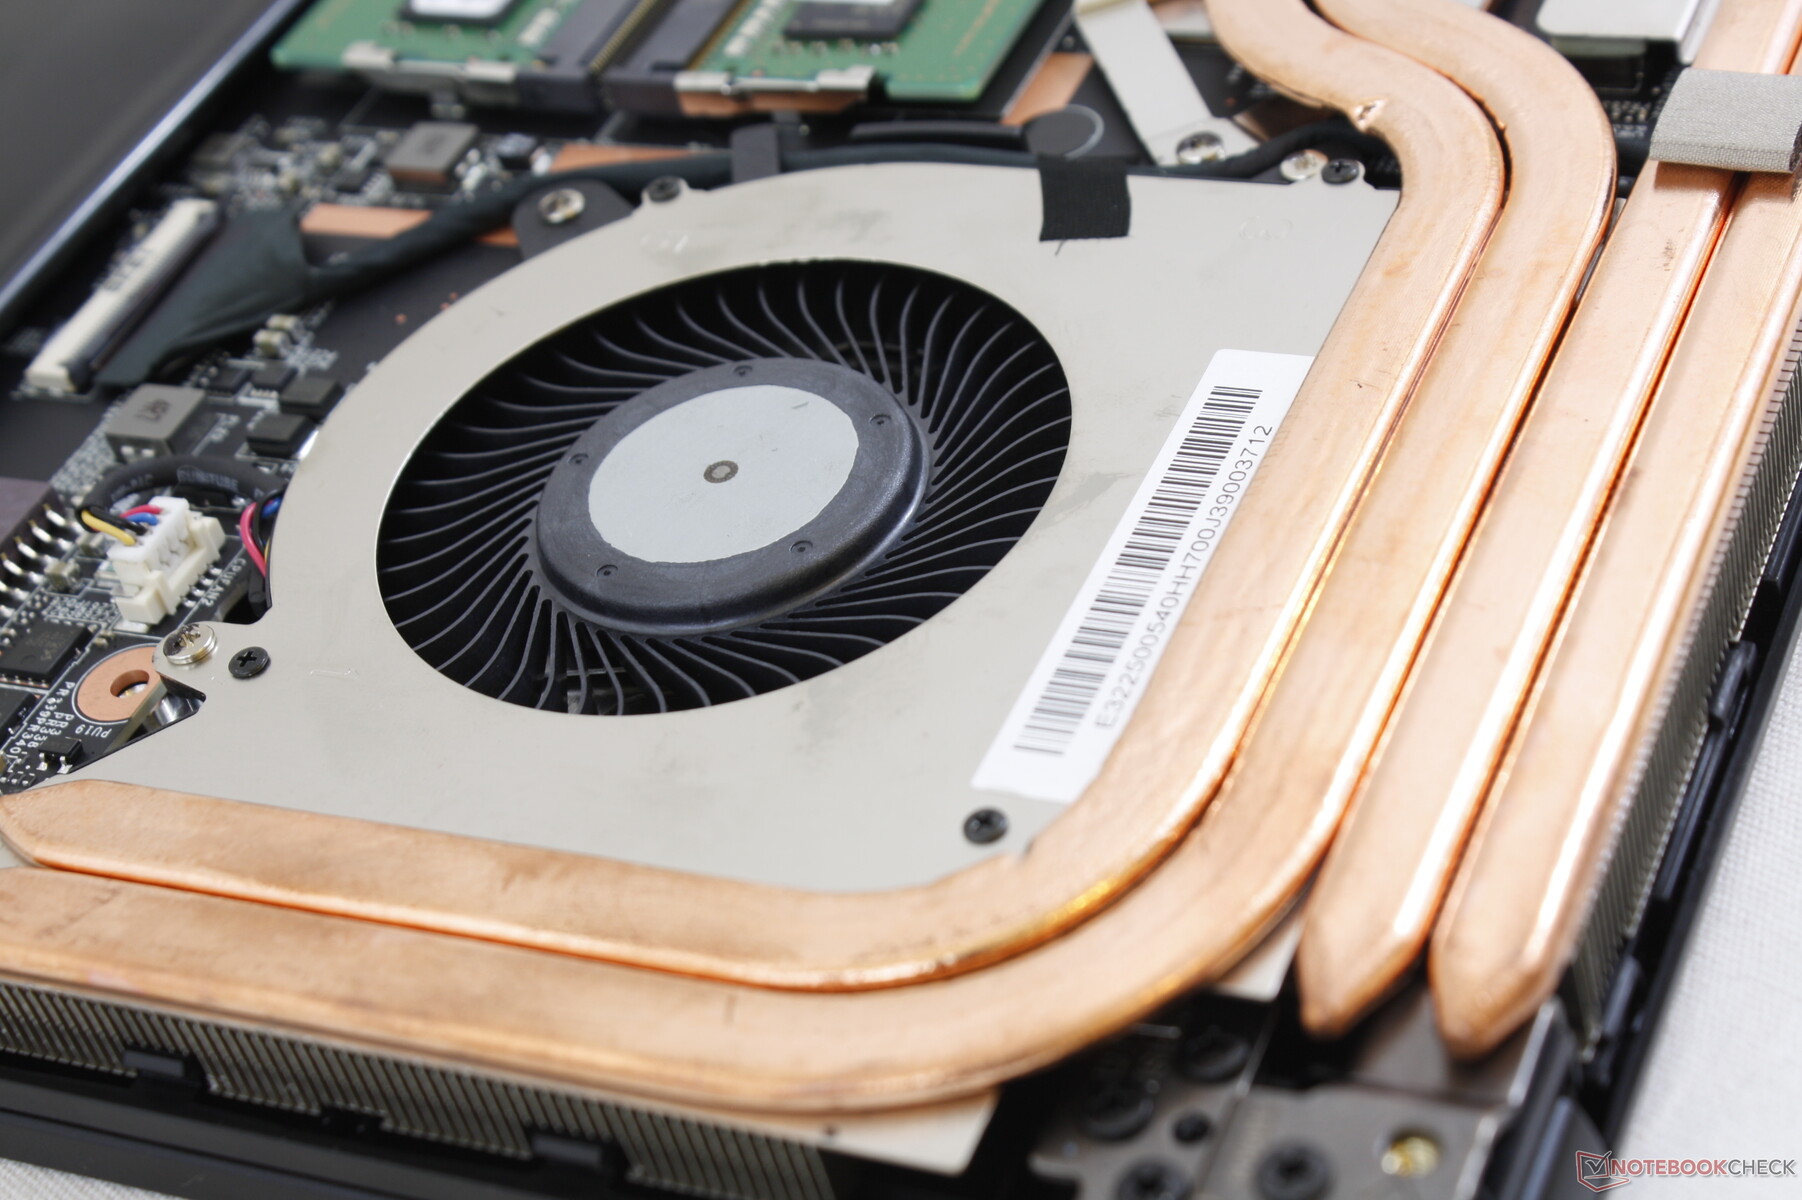
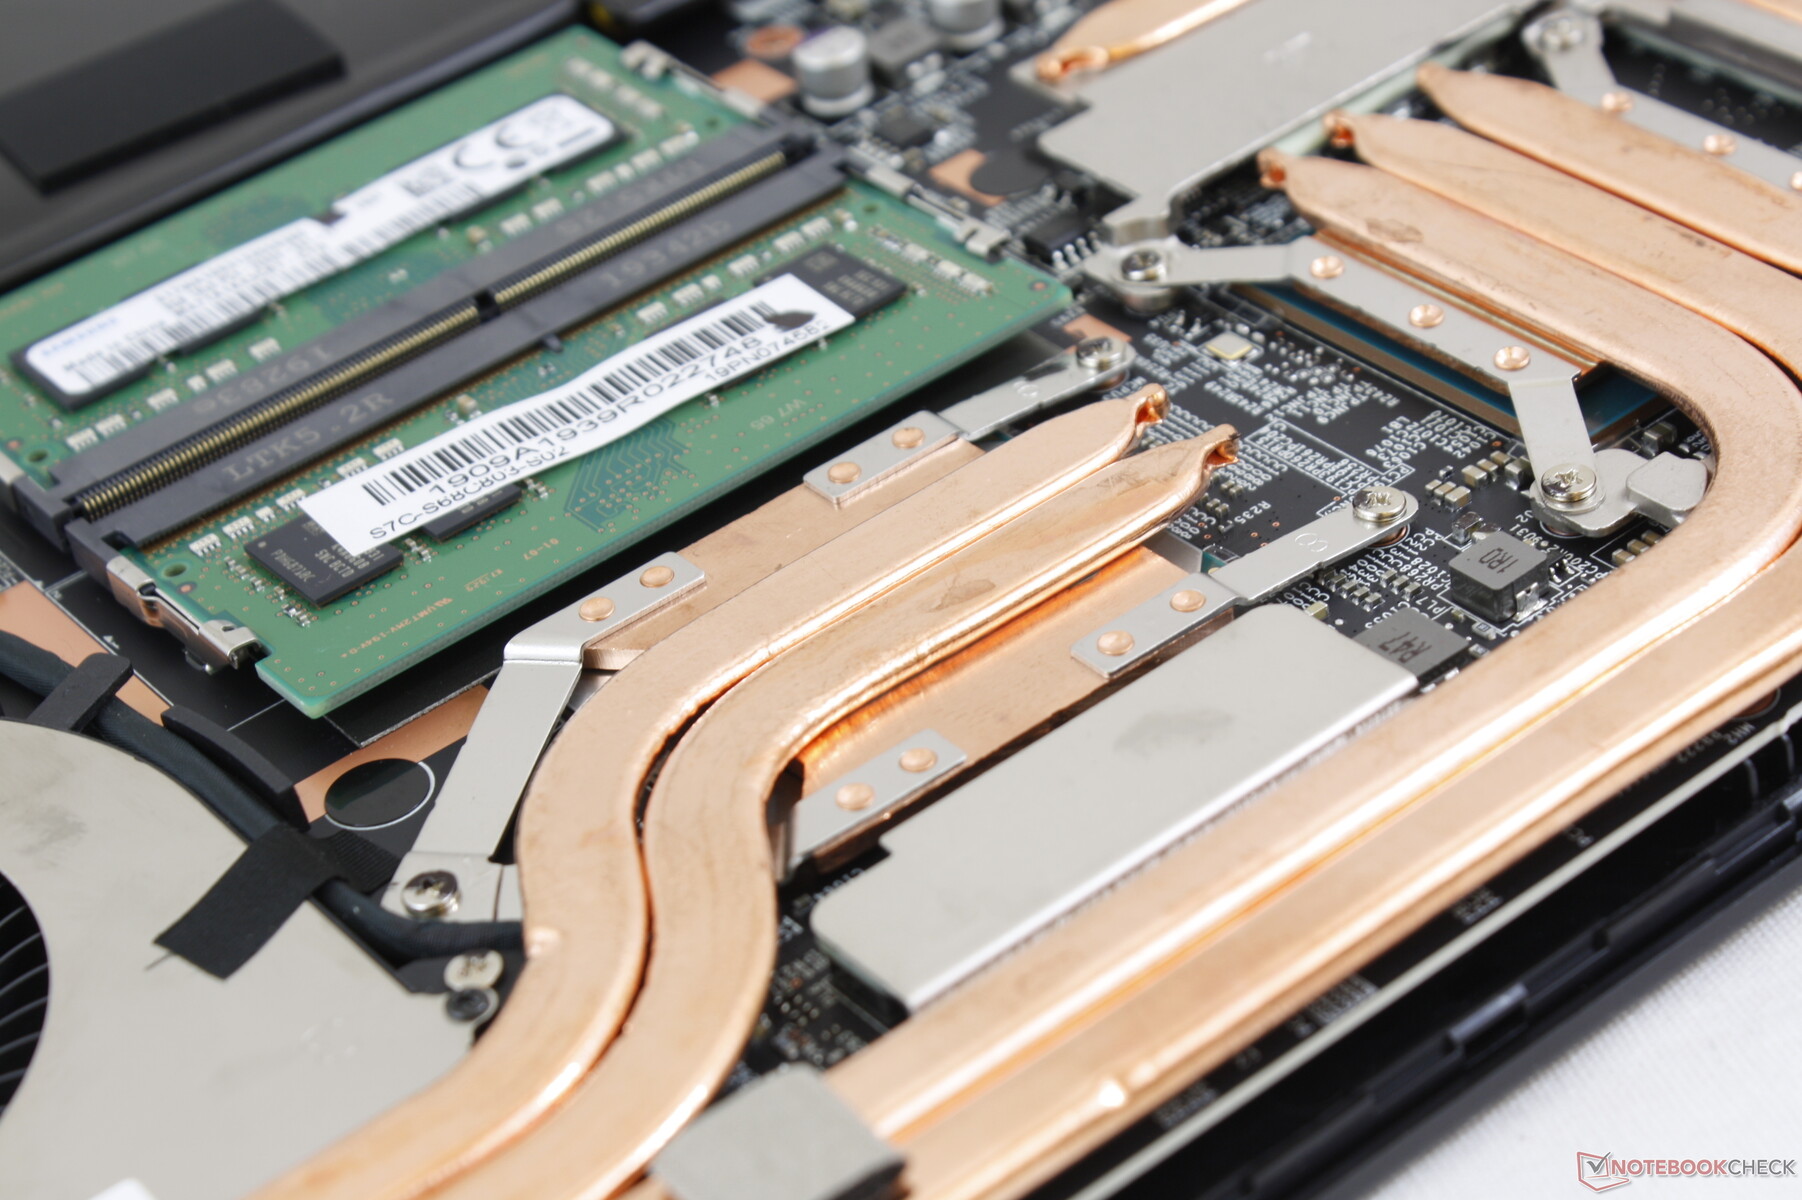
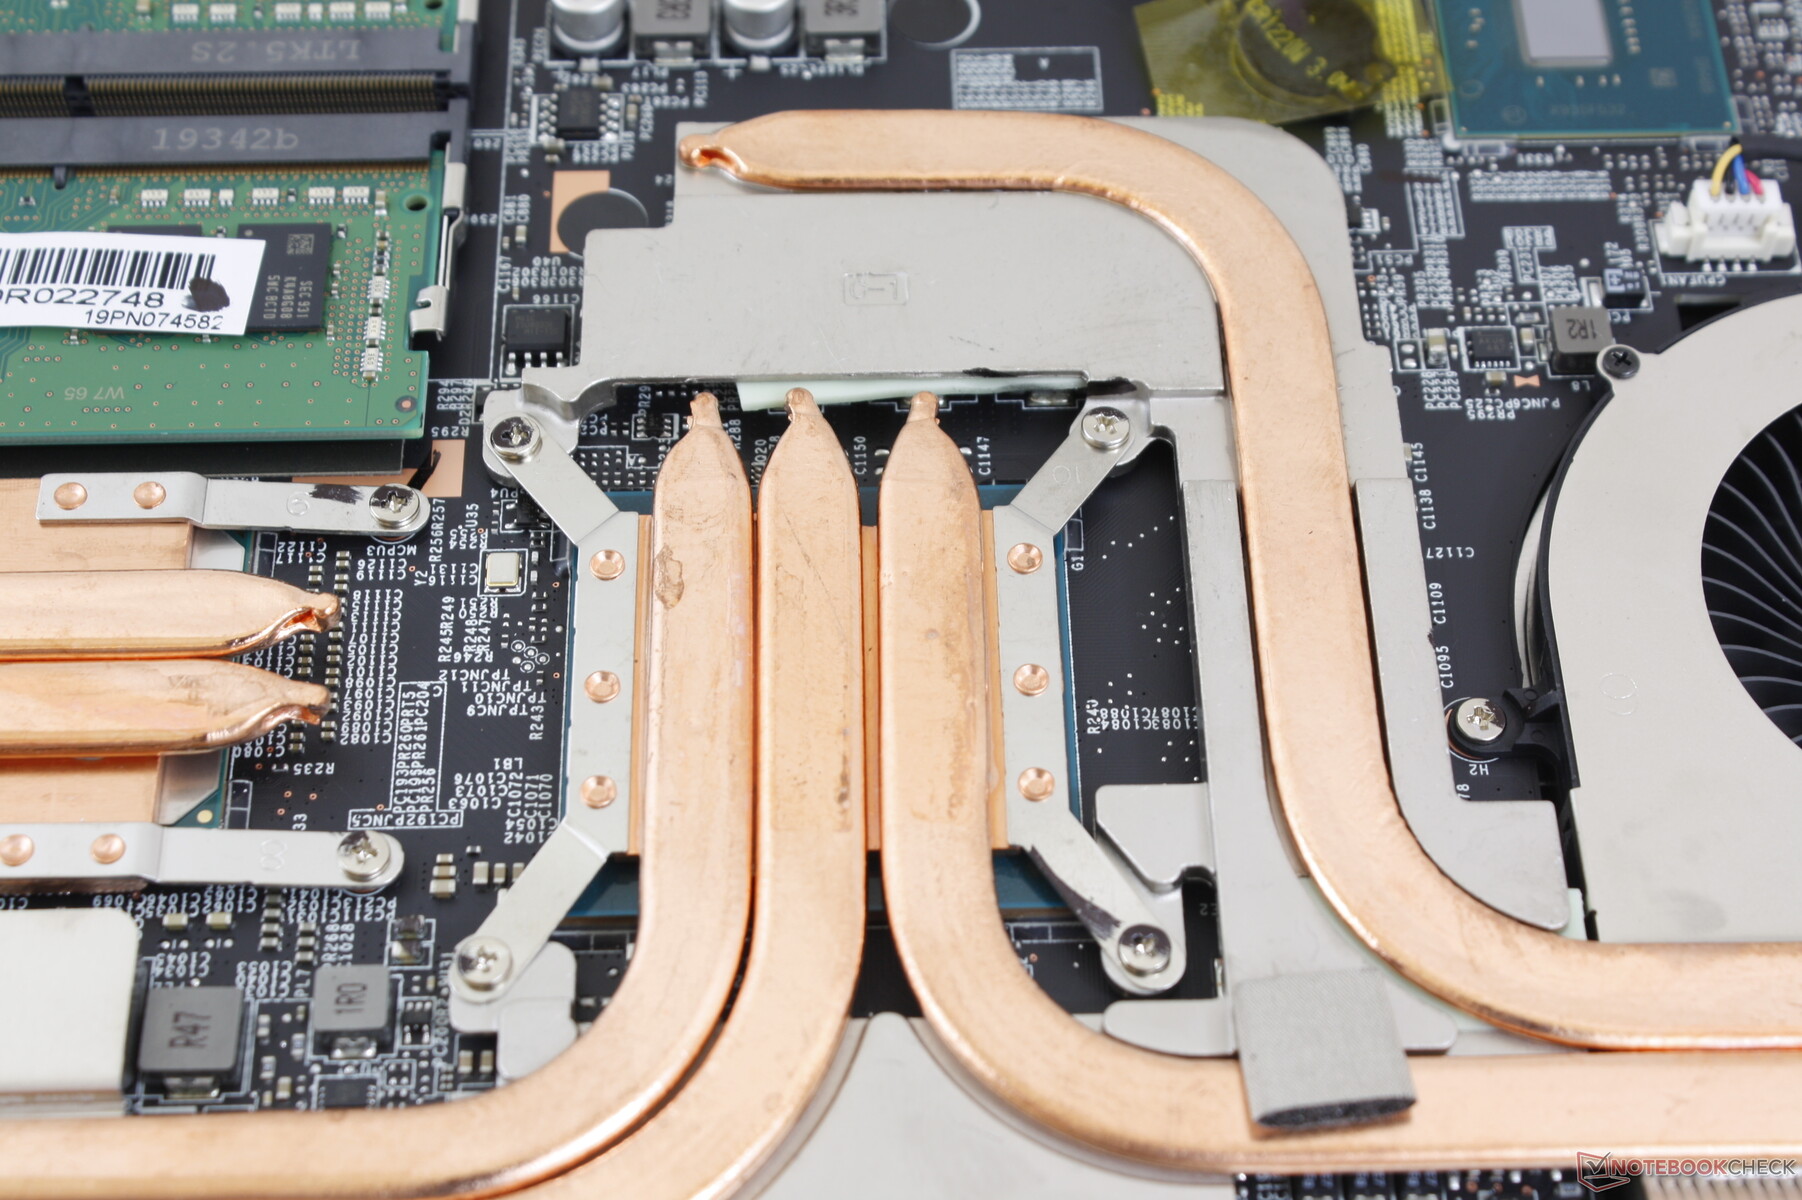
Alt panelin çıkarılması için bir Philips tornavida ve keskin bir kenar gerekir. 3,5 mm'lik krikonun etrafına çok sıkıca bağlı olduğundan, bu alanın çevresine dikkat edilmelidir. MSI, daha hızlı Turing GPU için daha fazla bakır ısı borusu eklemek için aşağıdaki karşılaştırma çekimlerimizde gösterildiği gibi WLAN modülünü yeniden yerleştirmek zorunda kaldı. Makineye herhangi bir şekilde servis vermek istiyorsanız, bir Fabrika Mühür etiketinin yırtılması gerektiğini unutmayın.
Aksesuarlar ve Garanti
Kutudaki normal kılavuzlardan başka hiçbir ekstralar yoktur ve standart bir yıllık sınırlı garanti uygulanır. Satın alma işleminizi çevrimiçi olarak MSI ile kaydetmek, bir garanti uzatmasını ücretsiz olarak verebilir.
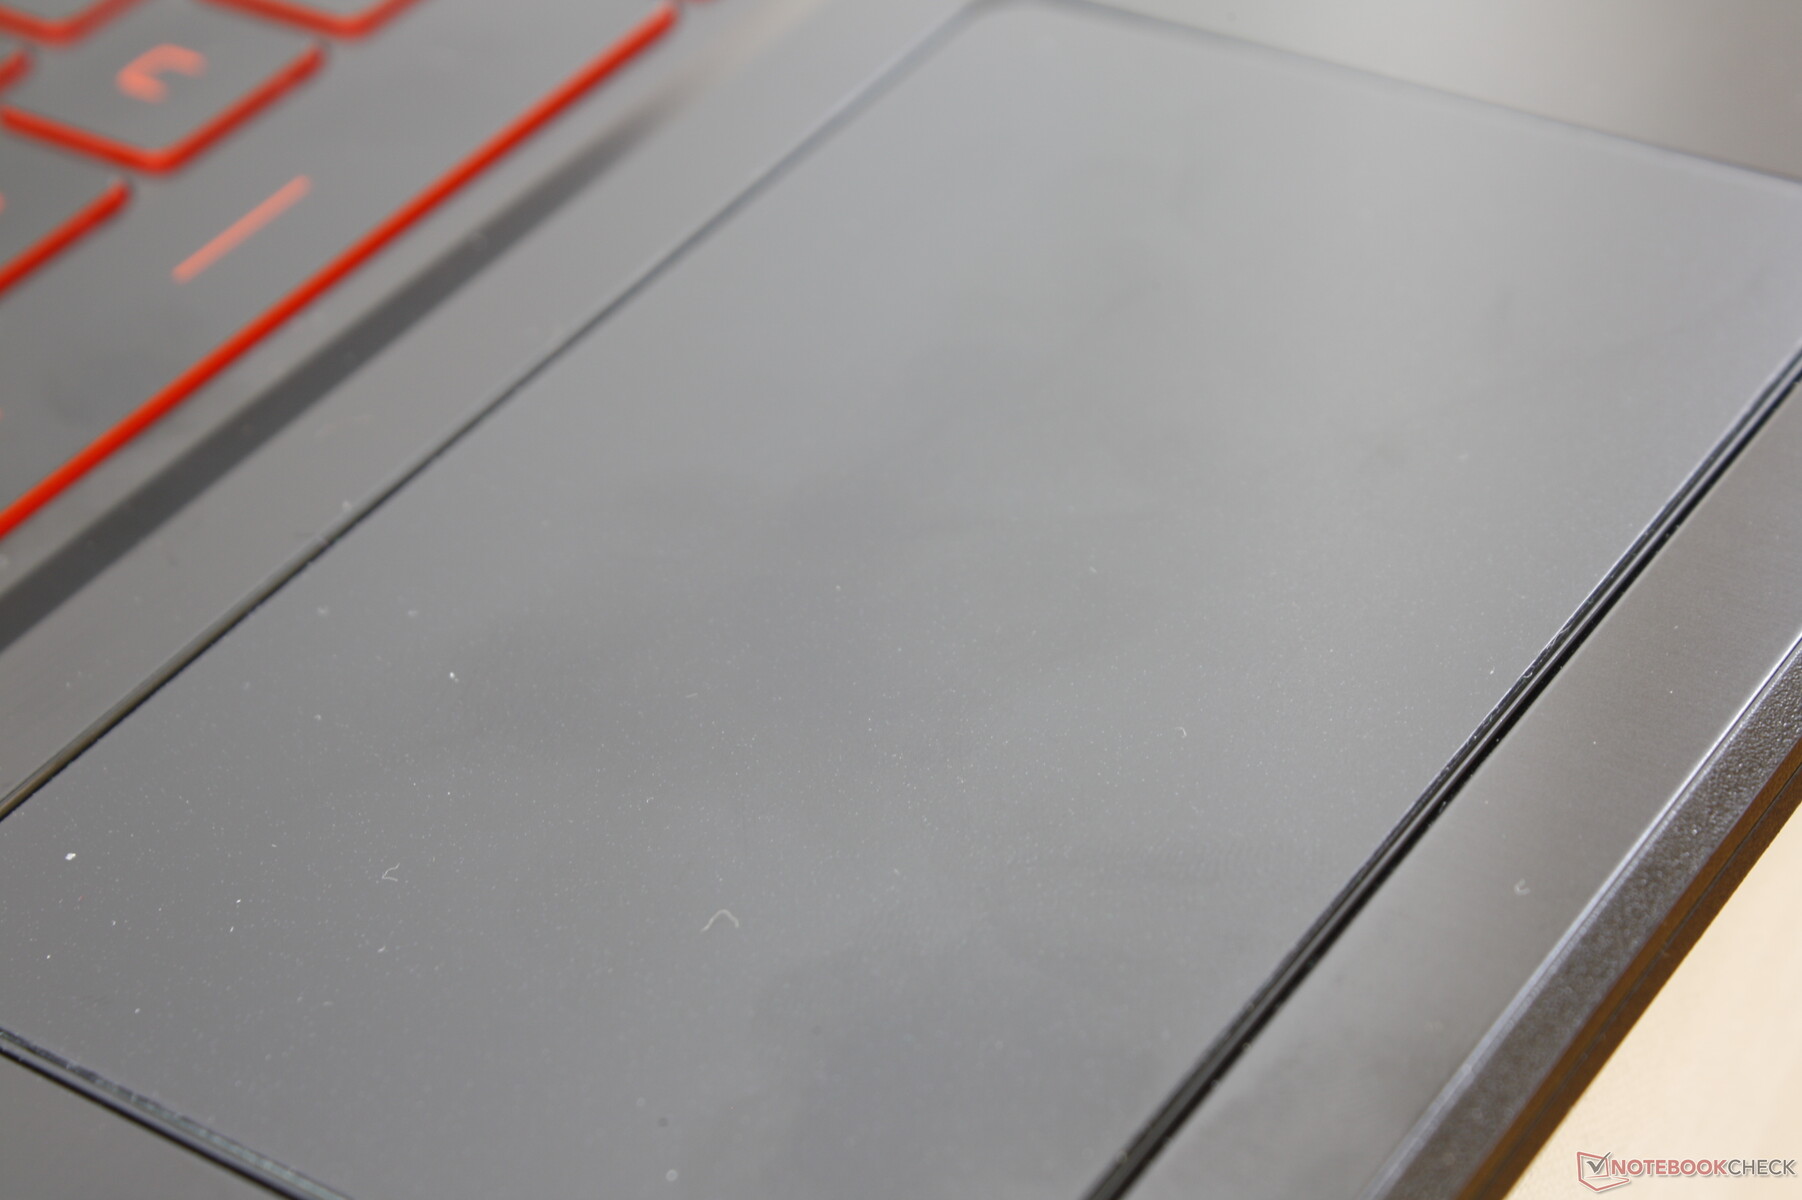
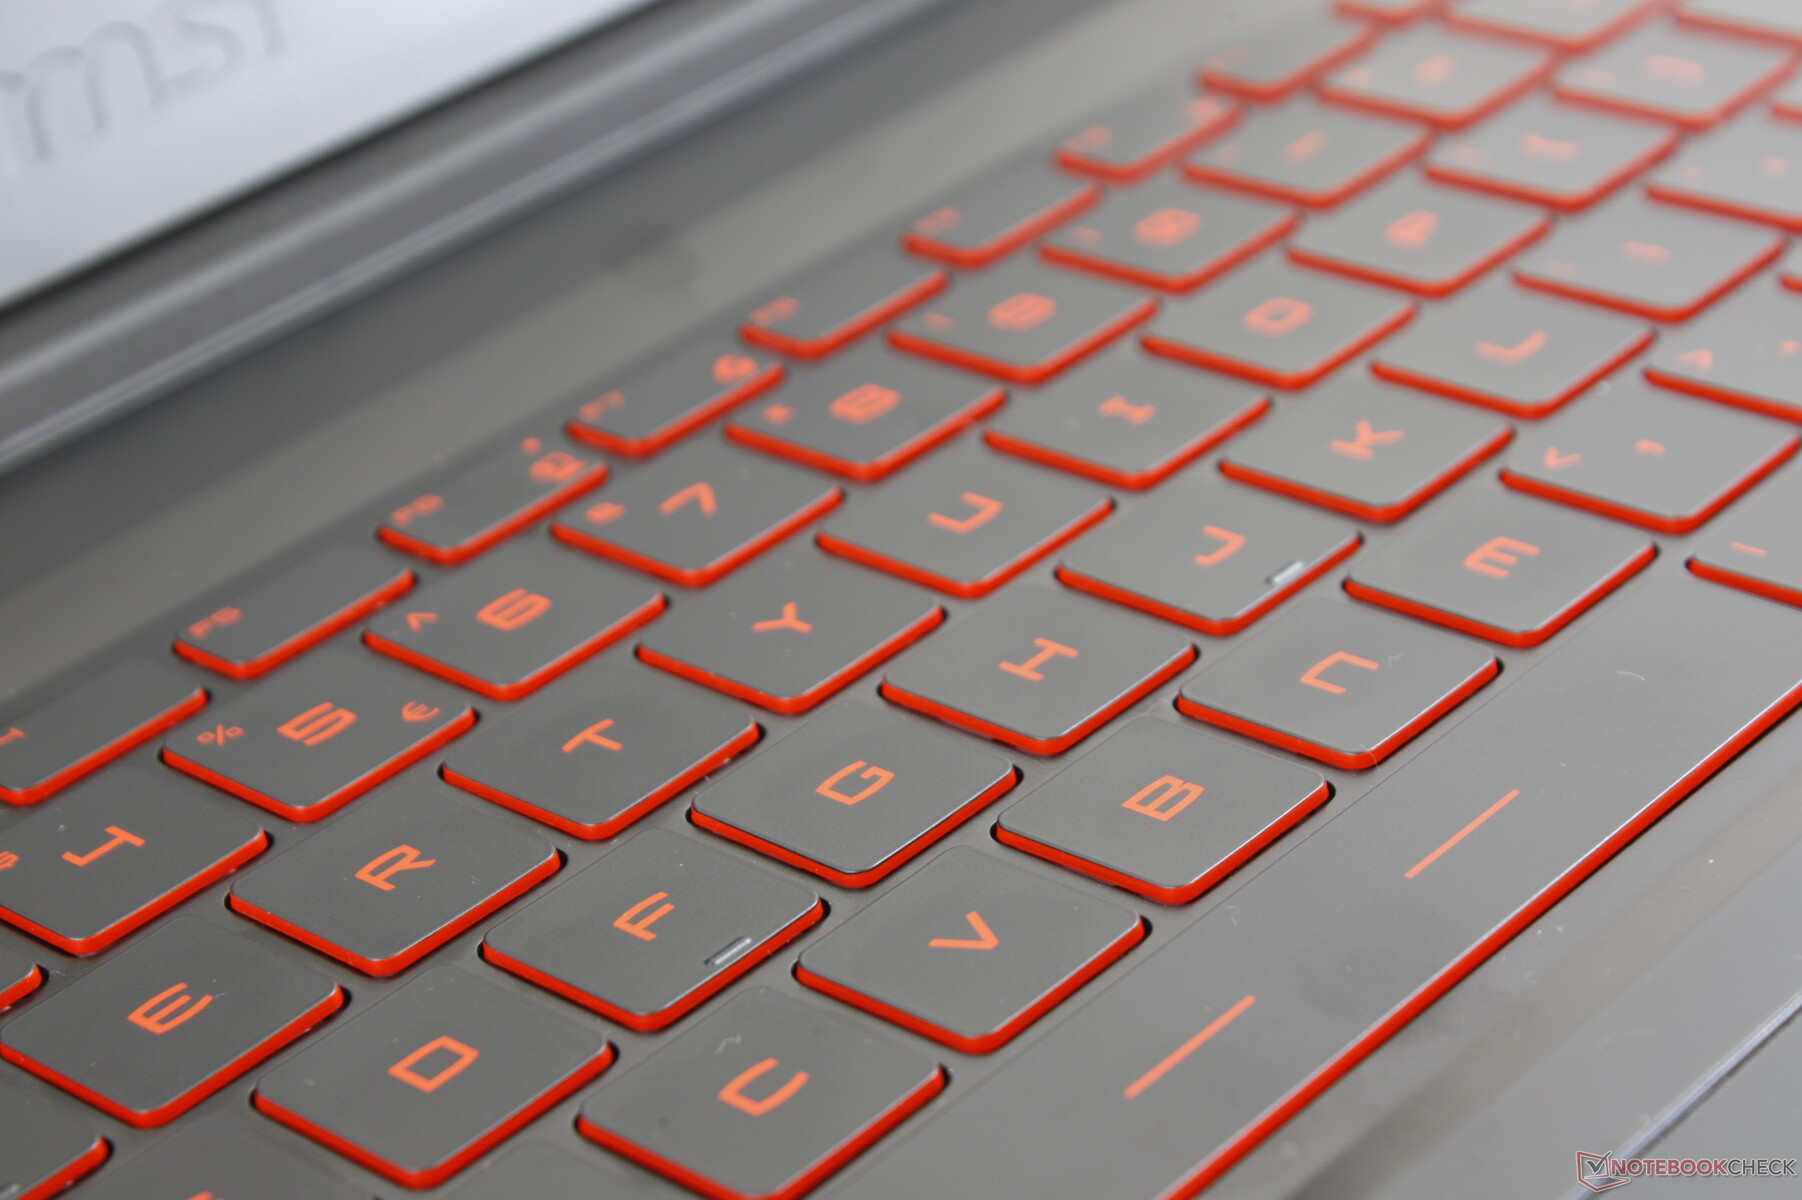
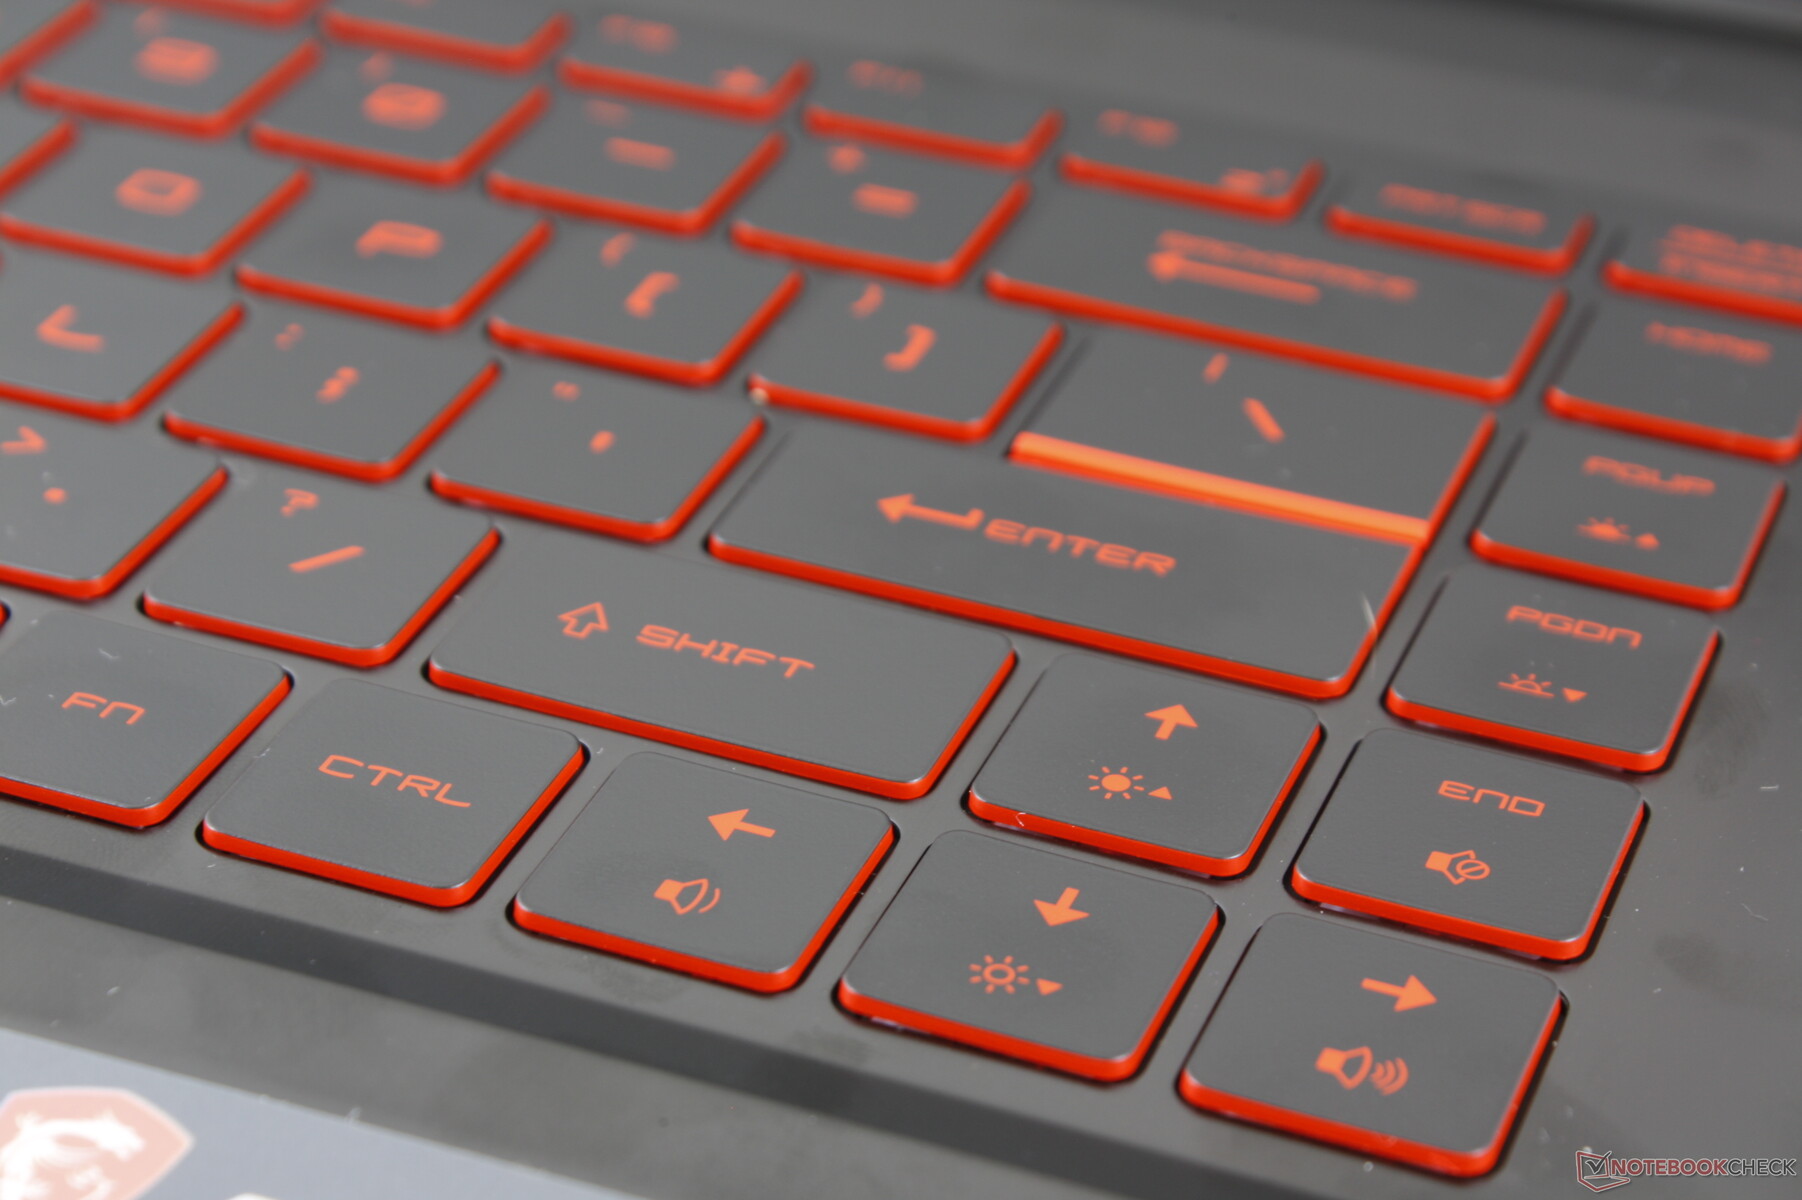
Giriş cihazları
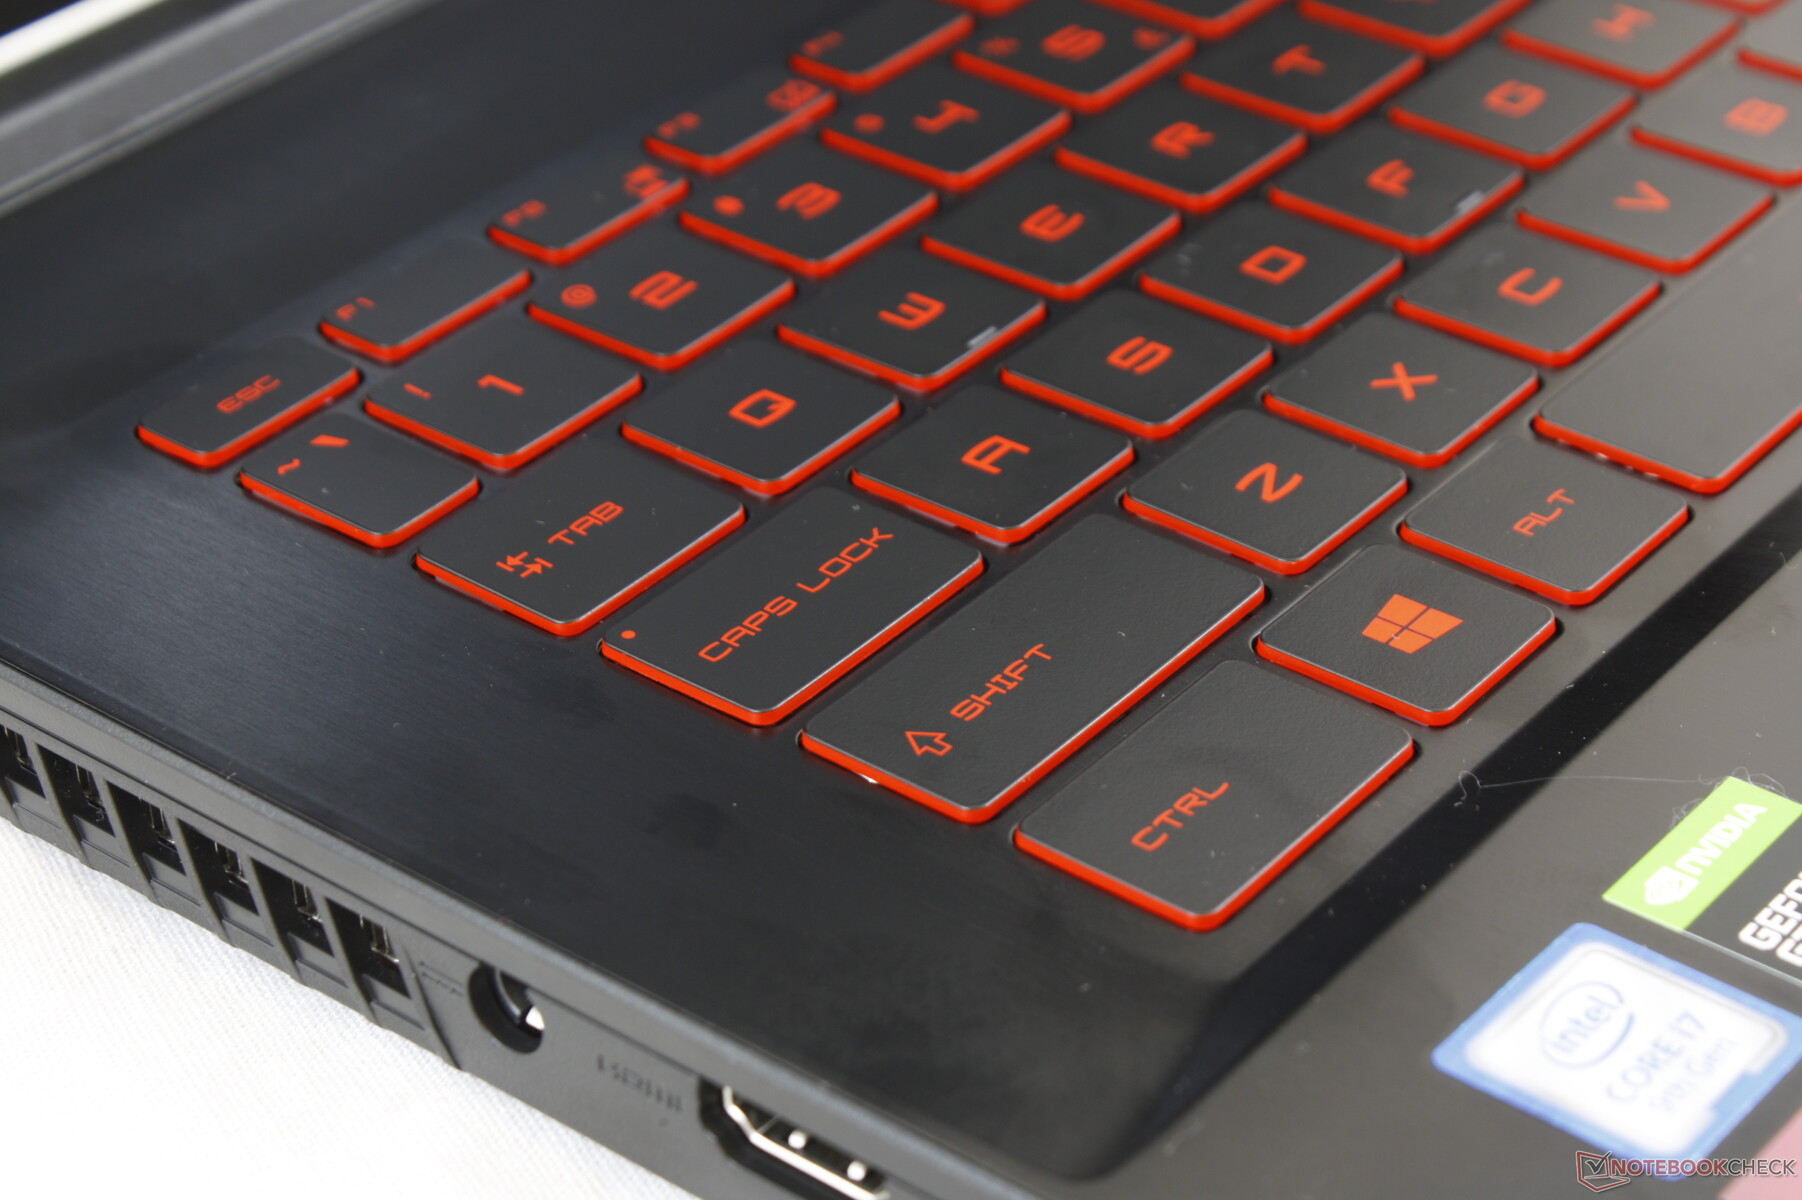
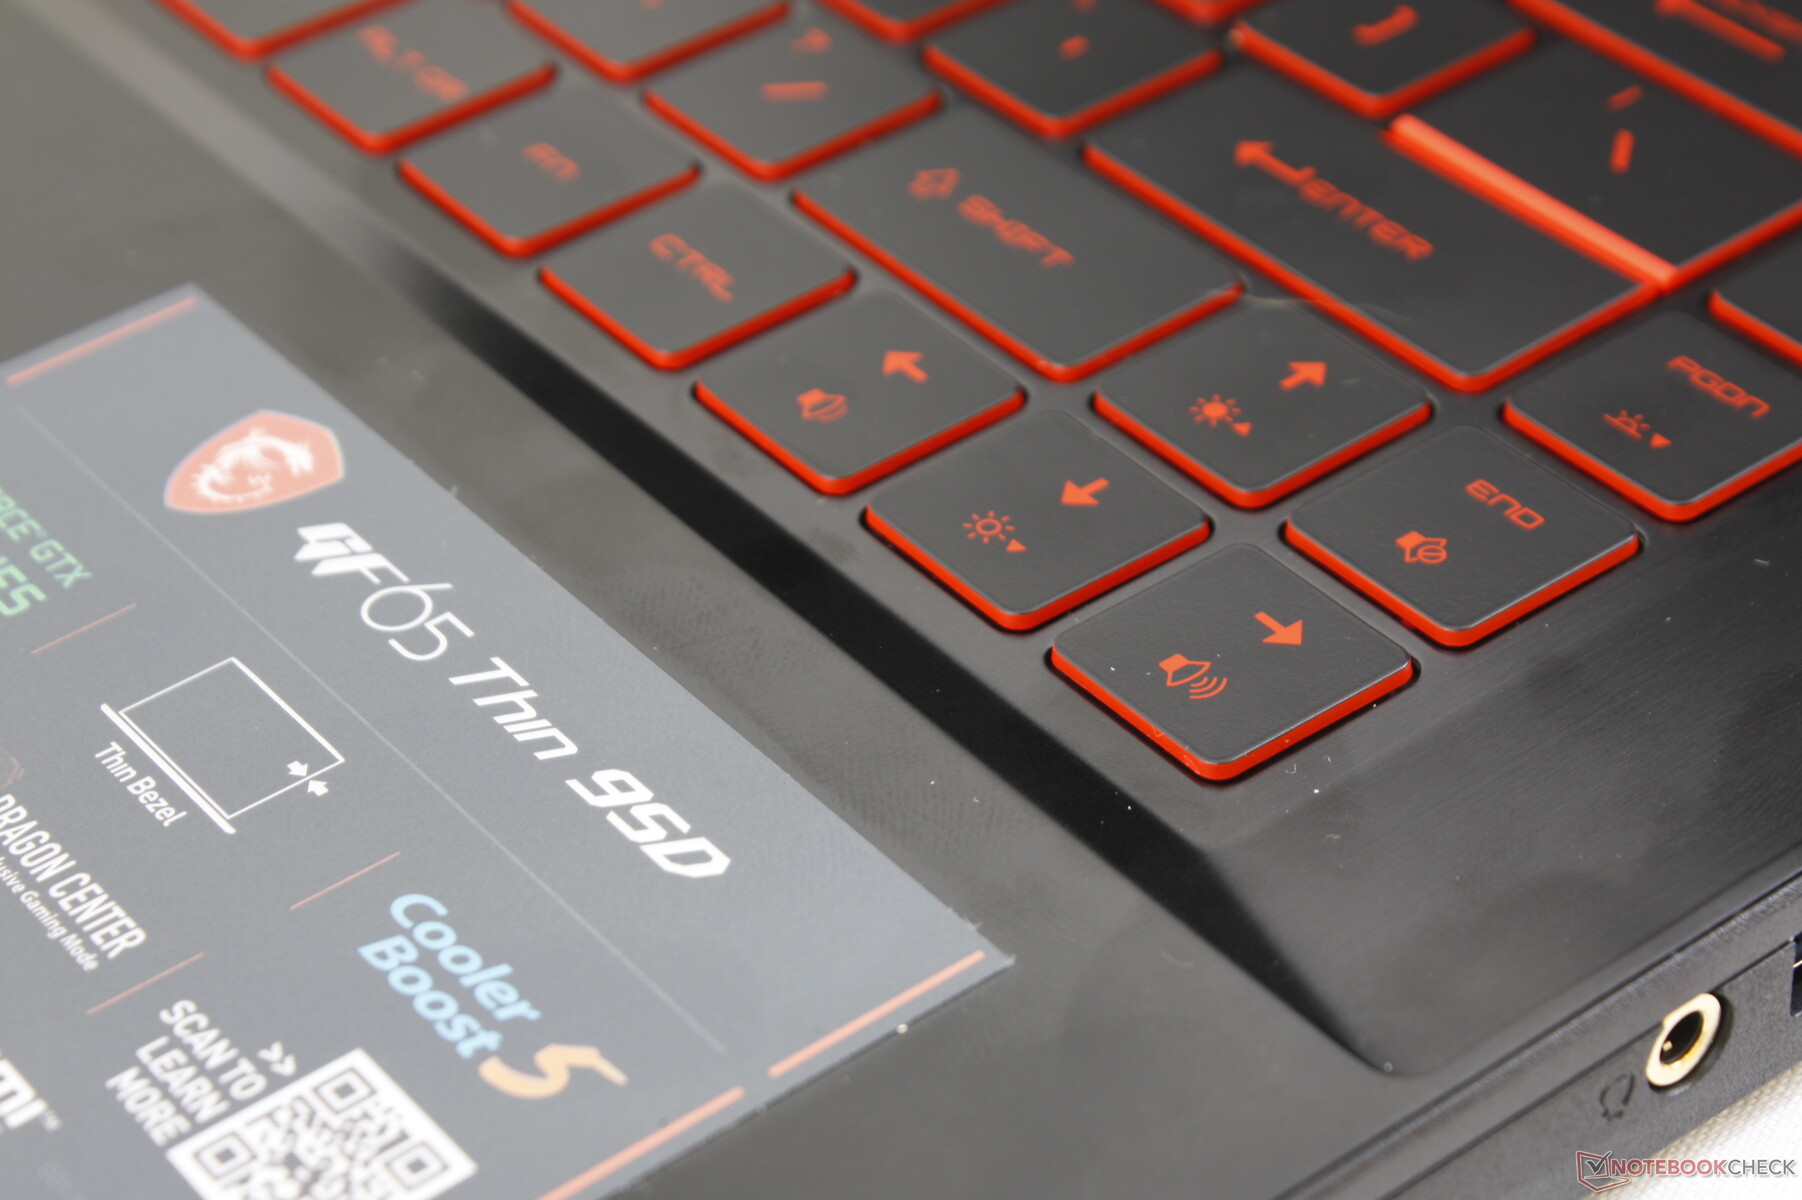
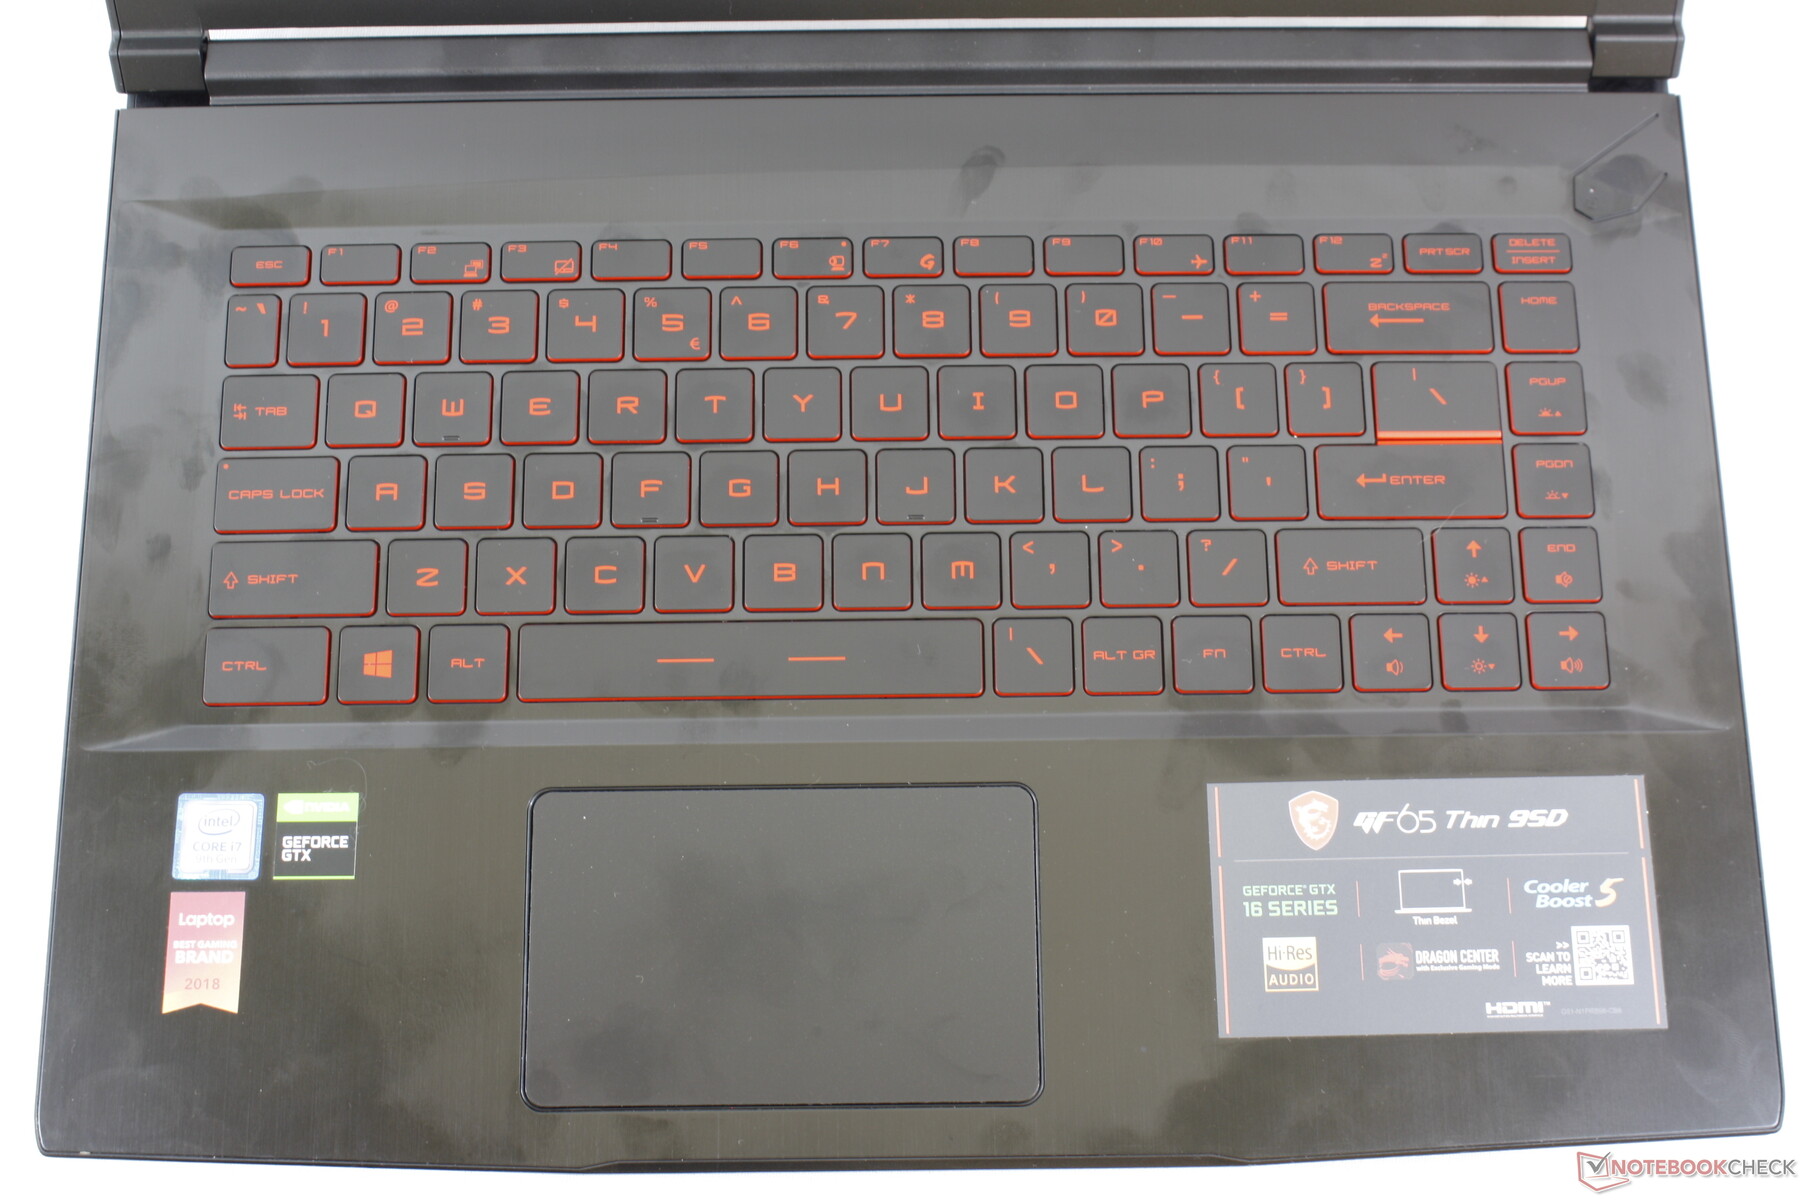
Klavye ve Dokunmatik Yüzey Klavye ve tıklama paneli (10,6 x 6,5 cm) hem GF63 hem de WP65 ile aynıdır ve bu nedenle daha fazla bilgi için ilgili incelemelerimize bakalım. Kısacası GF serisi, daha sığ ve daha Ultrabook benzeri bir yazma deneyimi için GS, GE ve GT modelleri gibi çoğu üst seviye MSI dizüstü bilgisayarda bulunan SteelSeries klavyelerini düşürüyor. Tek bölgeli arka ışık, tüm kilit semboller için üç aydınlatma seviyesi sunar.
Görüntüle
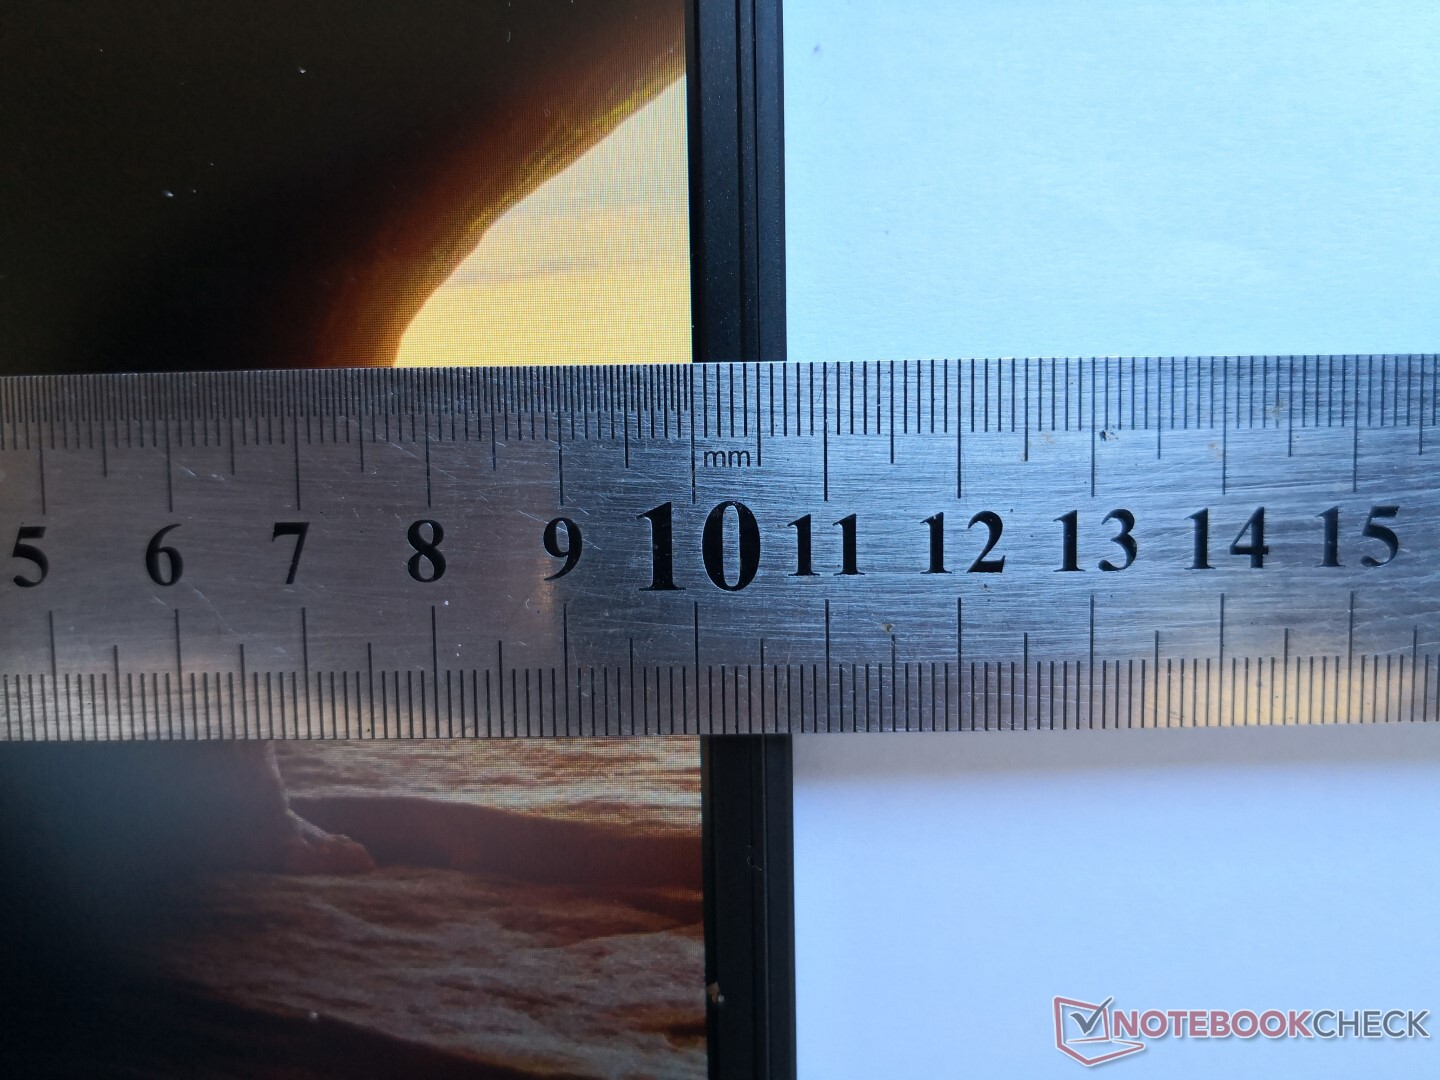
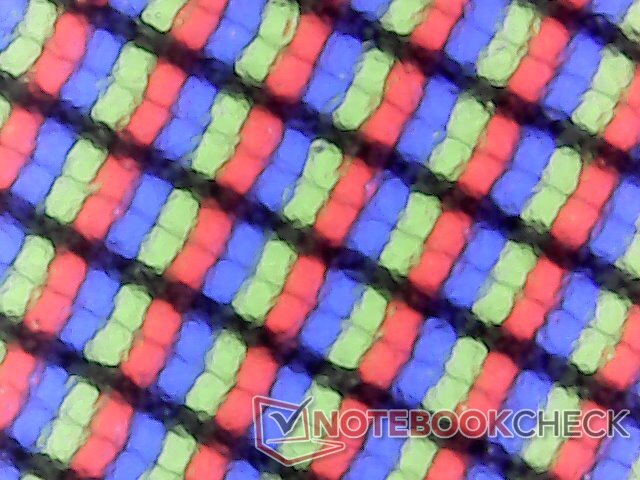
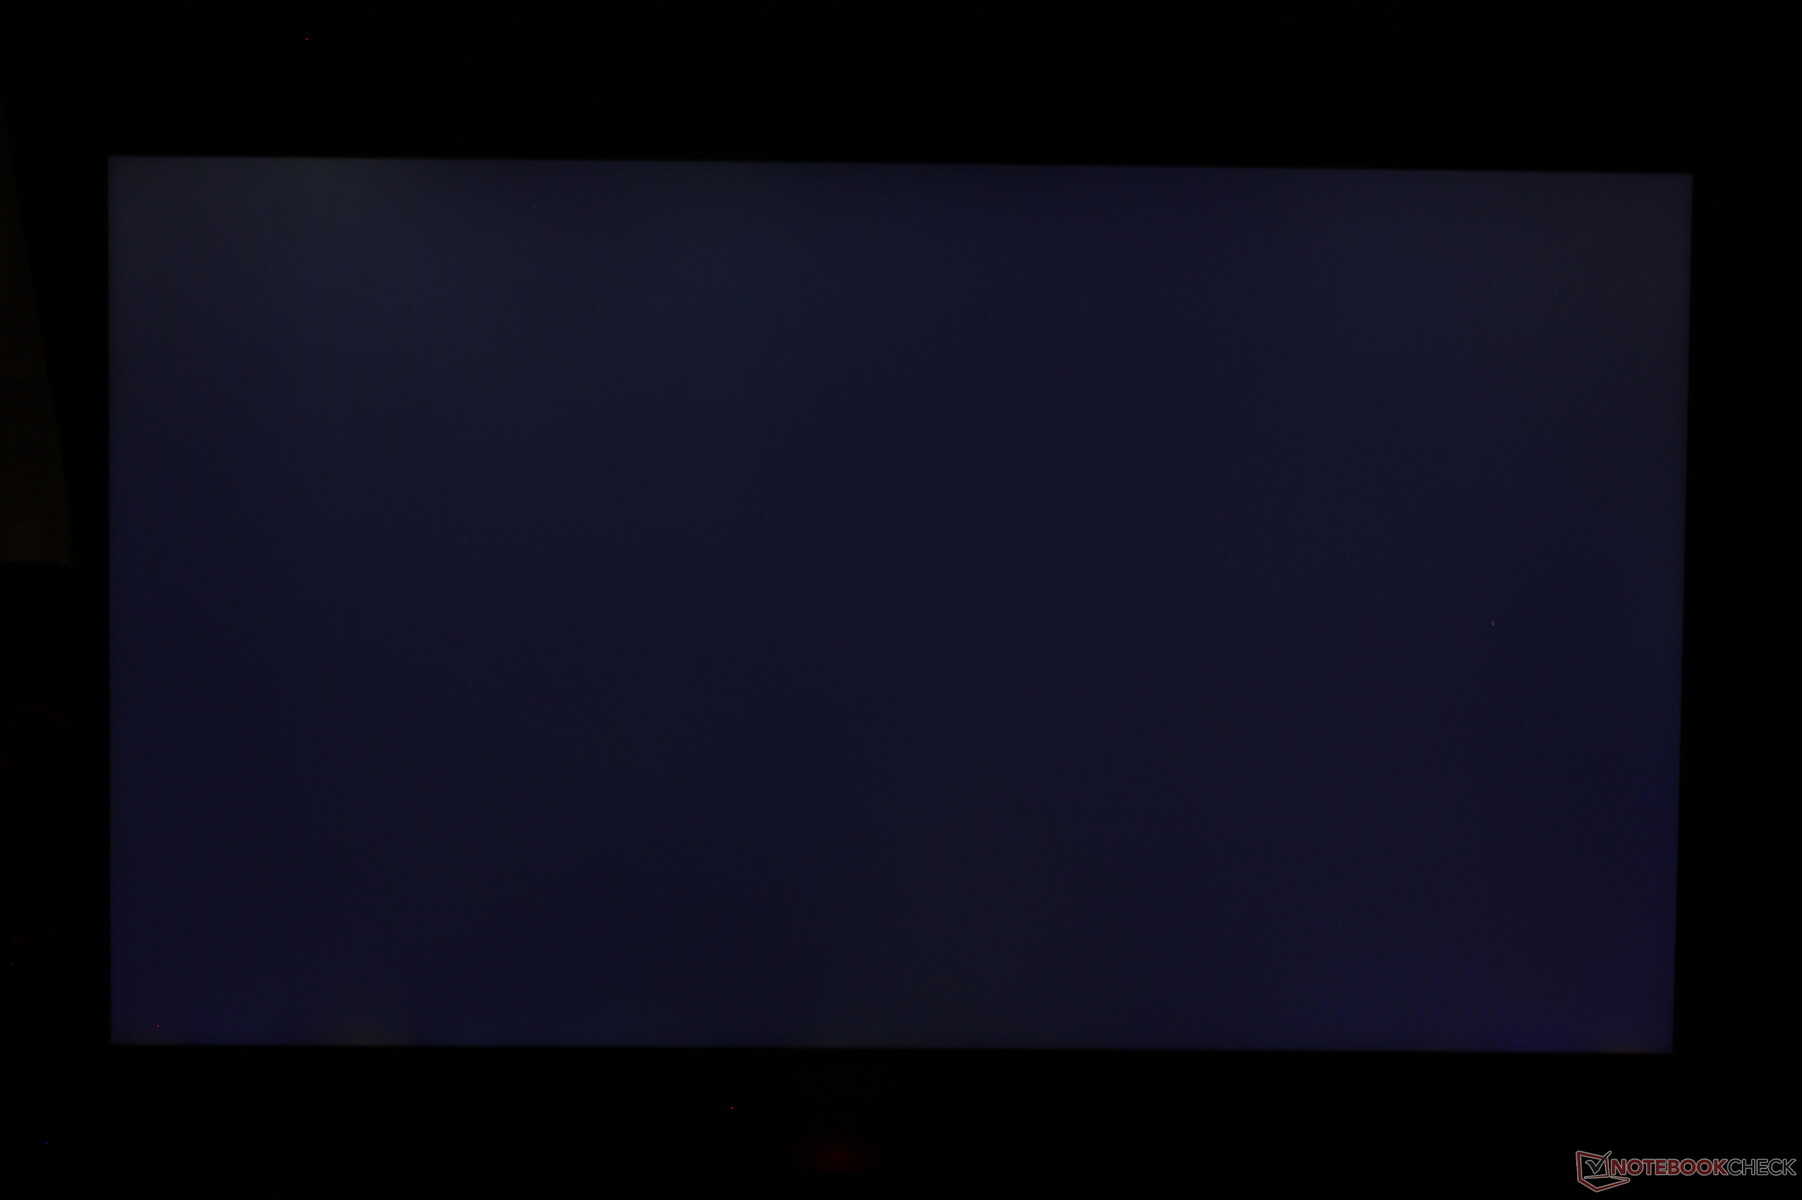
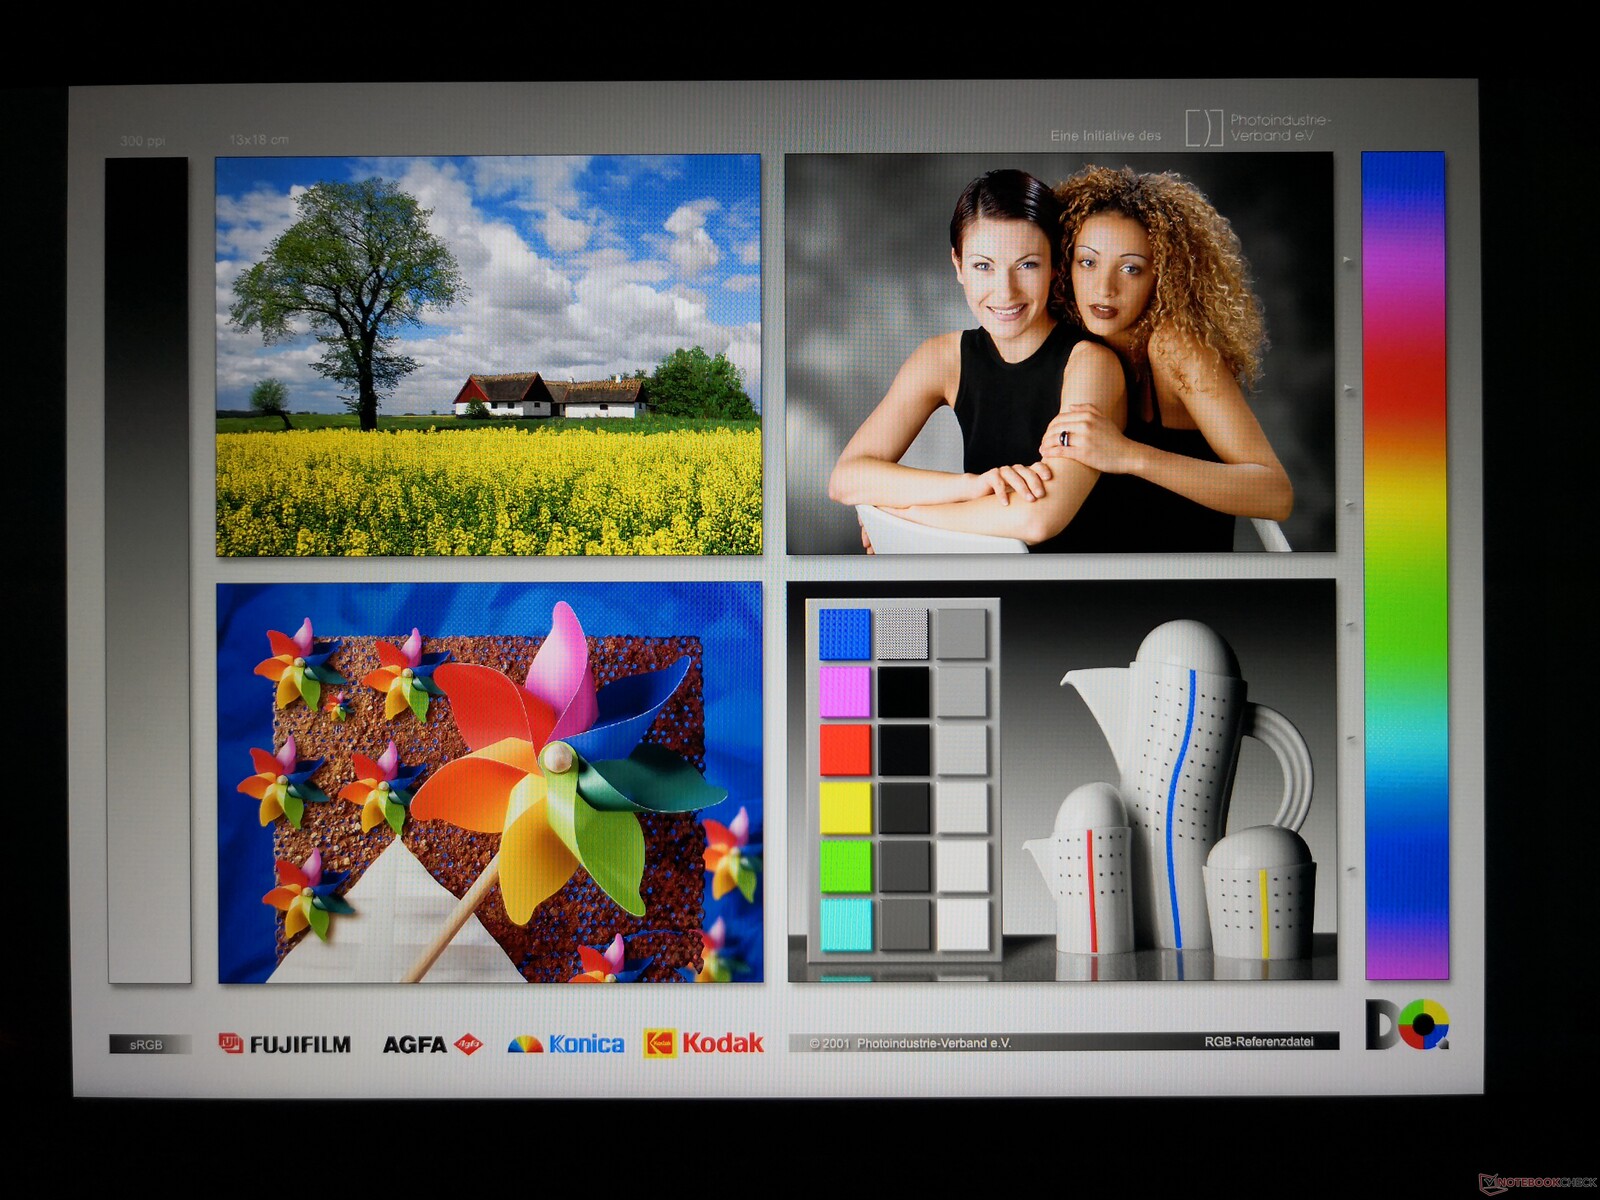
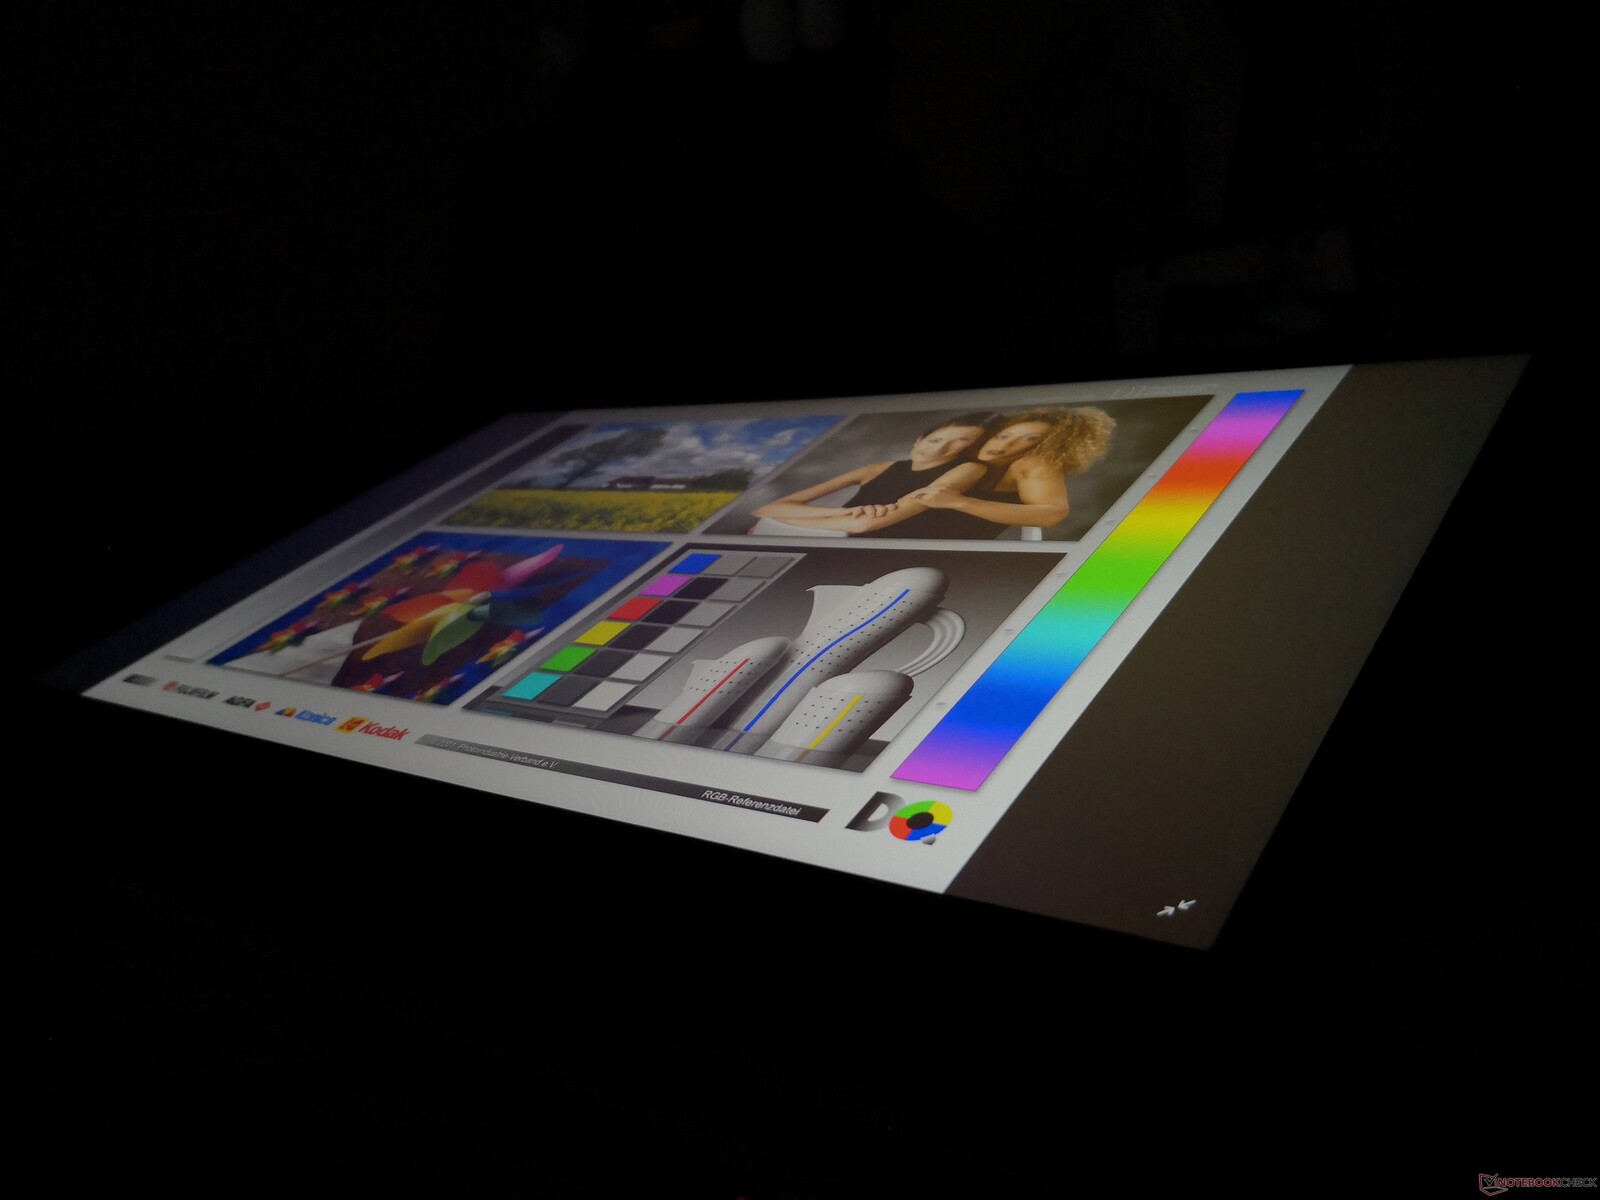
Test ünitemiz 120 Hz 1080p IPS ekran seçeneğiyle donatılmıştır. Buradaki AU Optronics B156HAN13.0 paneli, MSI'nin GL65'te aralarında çok benzer bir görsel deneyim için kullandığıla aynıdır. GE63'te geçen yıl test ettiğimiz 60 Hz AU Optronics panelinden bir yükseltme, ancak ortalama tepki süreleri, ortalama parlaklık, dar gam ve düzgün kontrast oranı gibi diğer çekirdek özellikler, karşılaştırmada gösterildiği gibi oldukça benzer. Aşağıdaki tablo. Işık-orta düzensiz arka ışık kanaması ünitemizde var, ancak pratikte farkına varmak neyse ki zor. Ekran, çoğu mat panelde olduğu gibi yalnızca biraz grenlidir.
| |||||||||||||||||||||||||
Aydınlatma: 90 %
Batarya modunda parlaklık: 258.5 cd/m²
Kontrast: 923:1 (Siyah: 0.28 cd/m²)
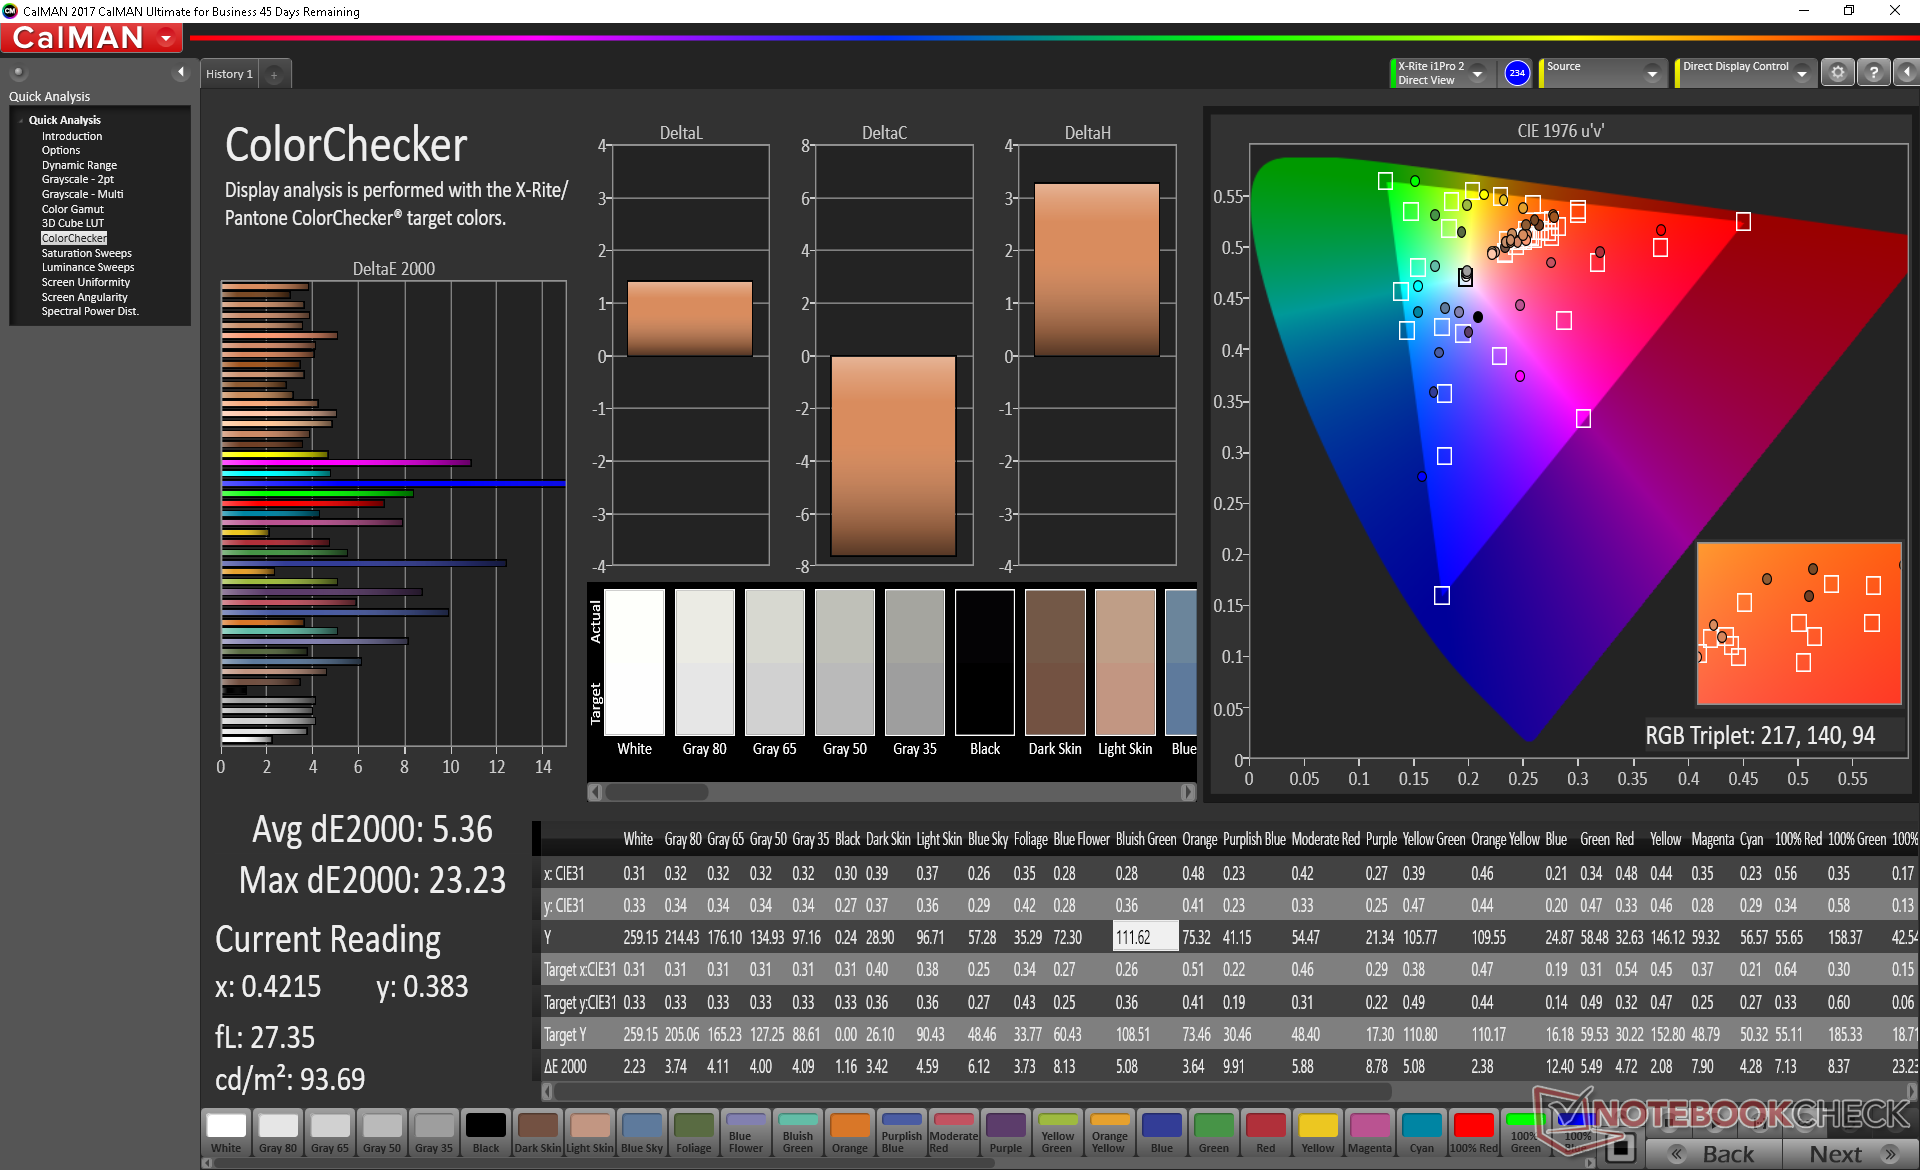
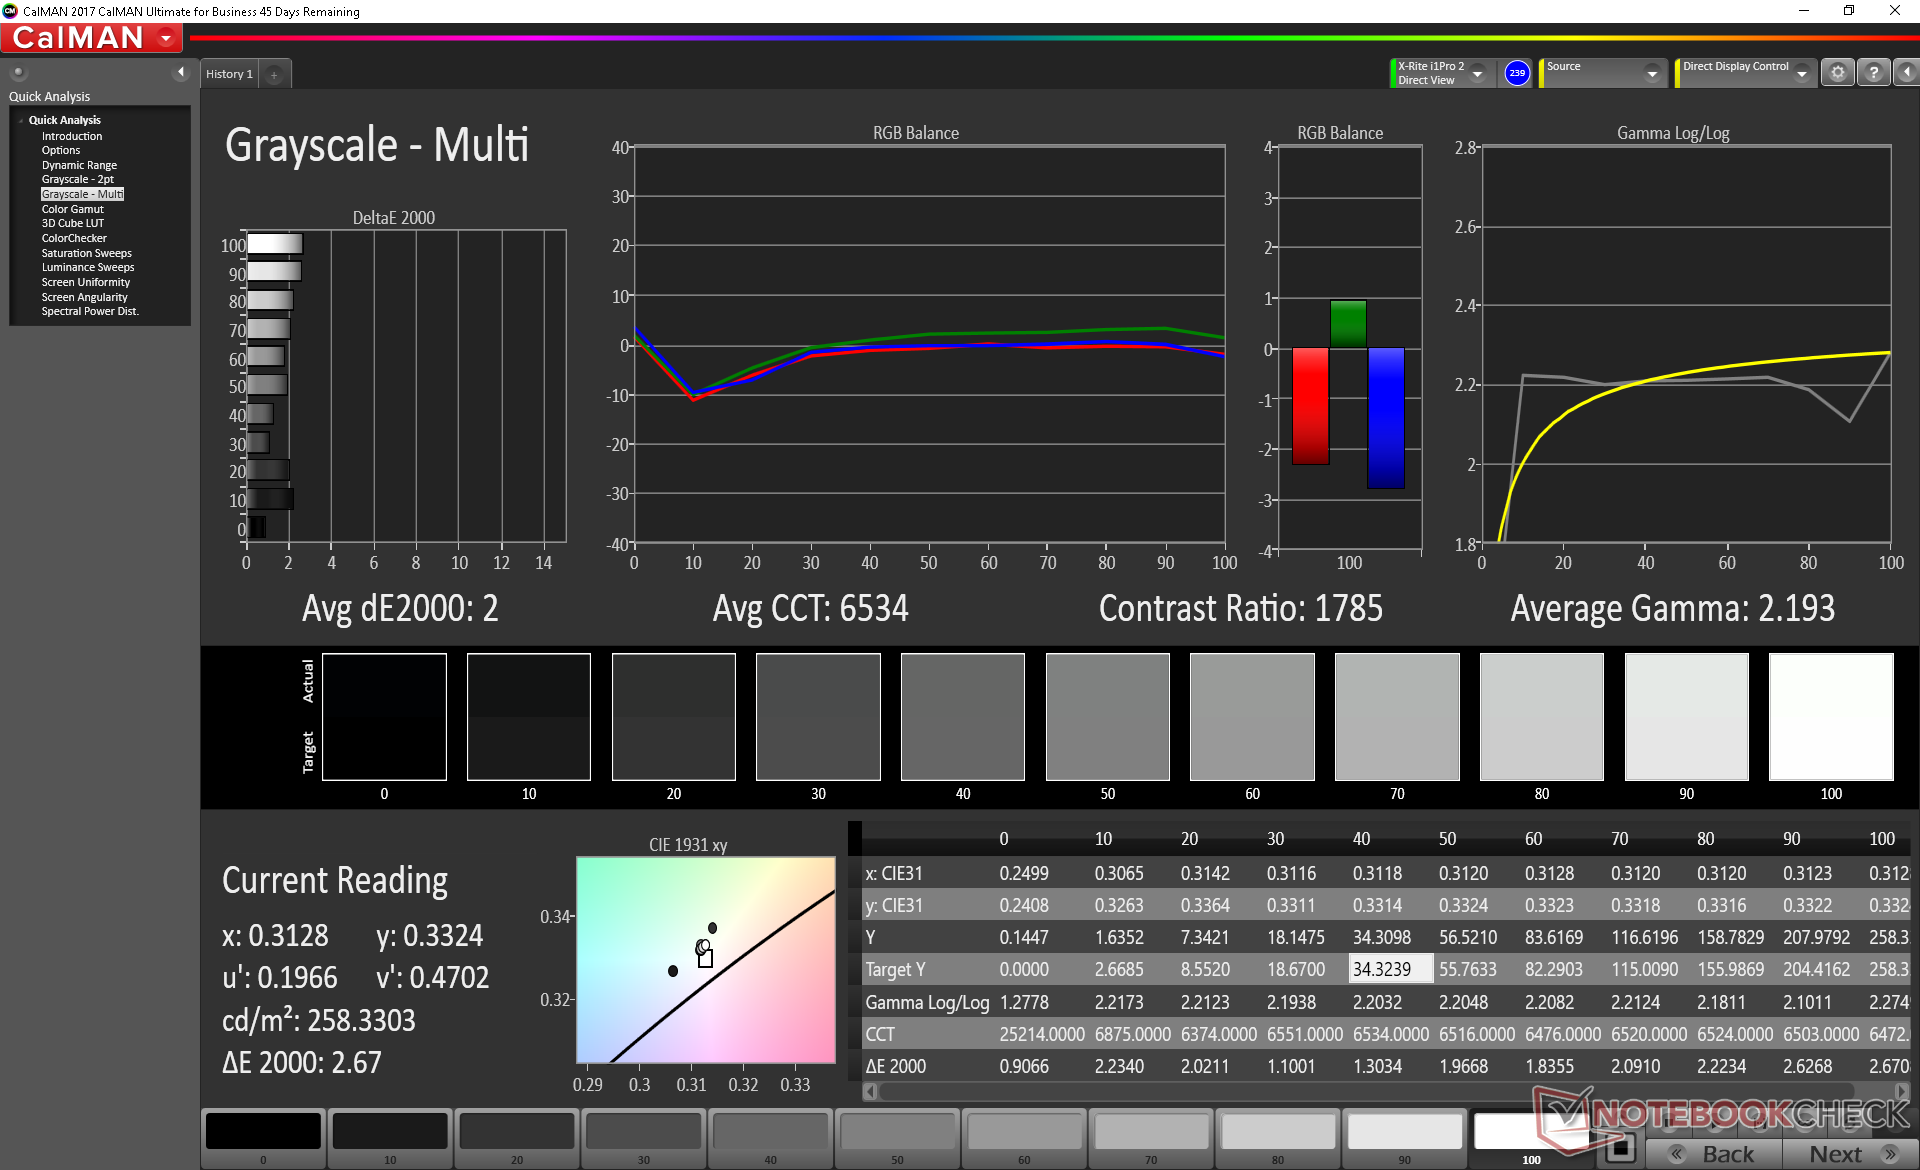
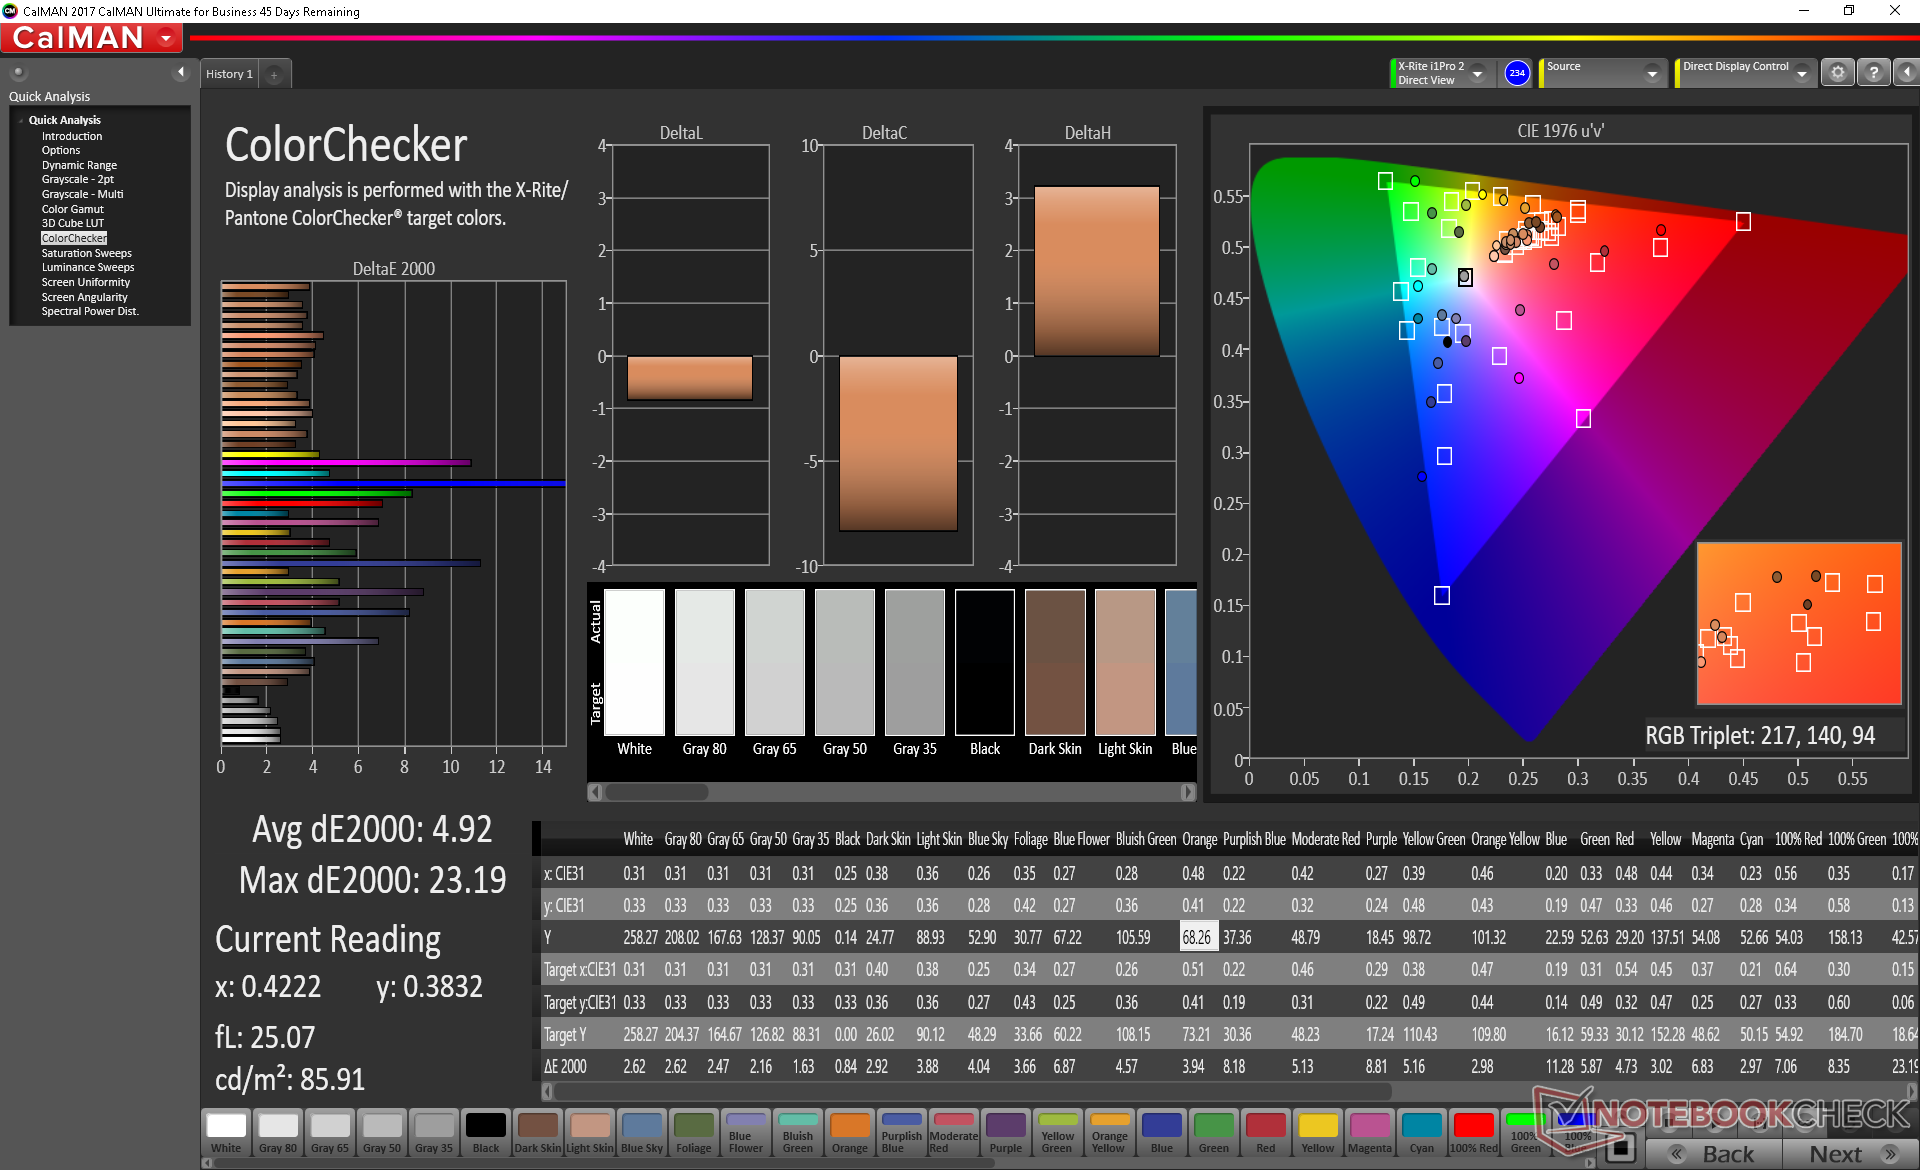
ΔE ColorChecker Calman: 5.36 | ∀{0.5-29.43 Ø4.71}
calibrated: 4.92
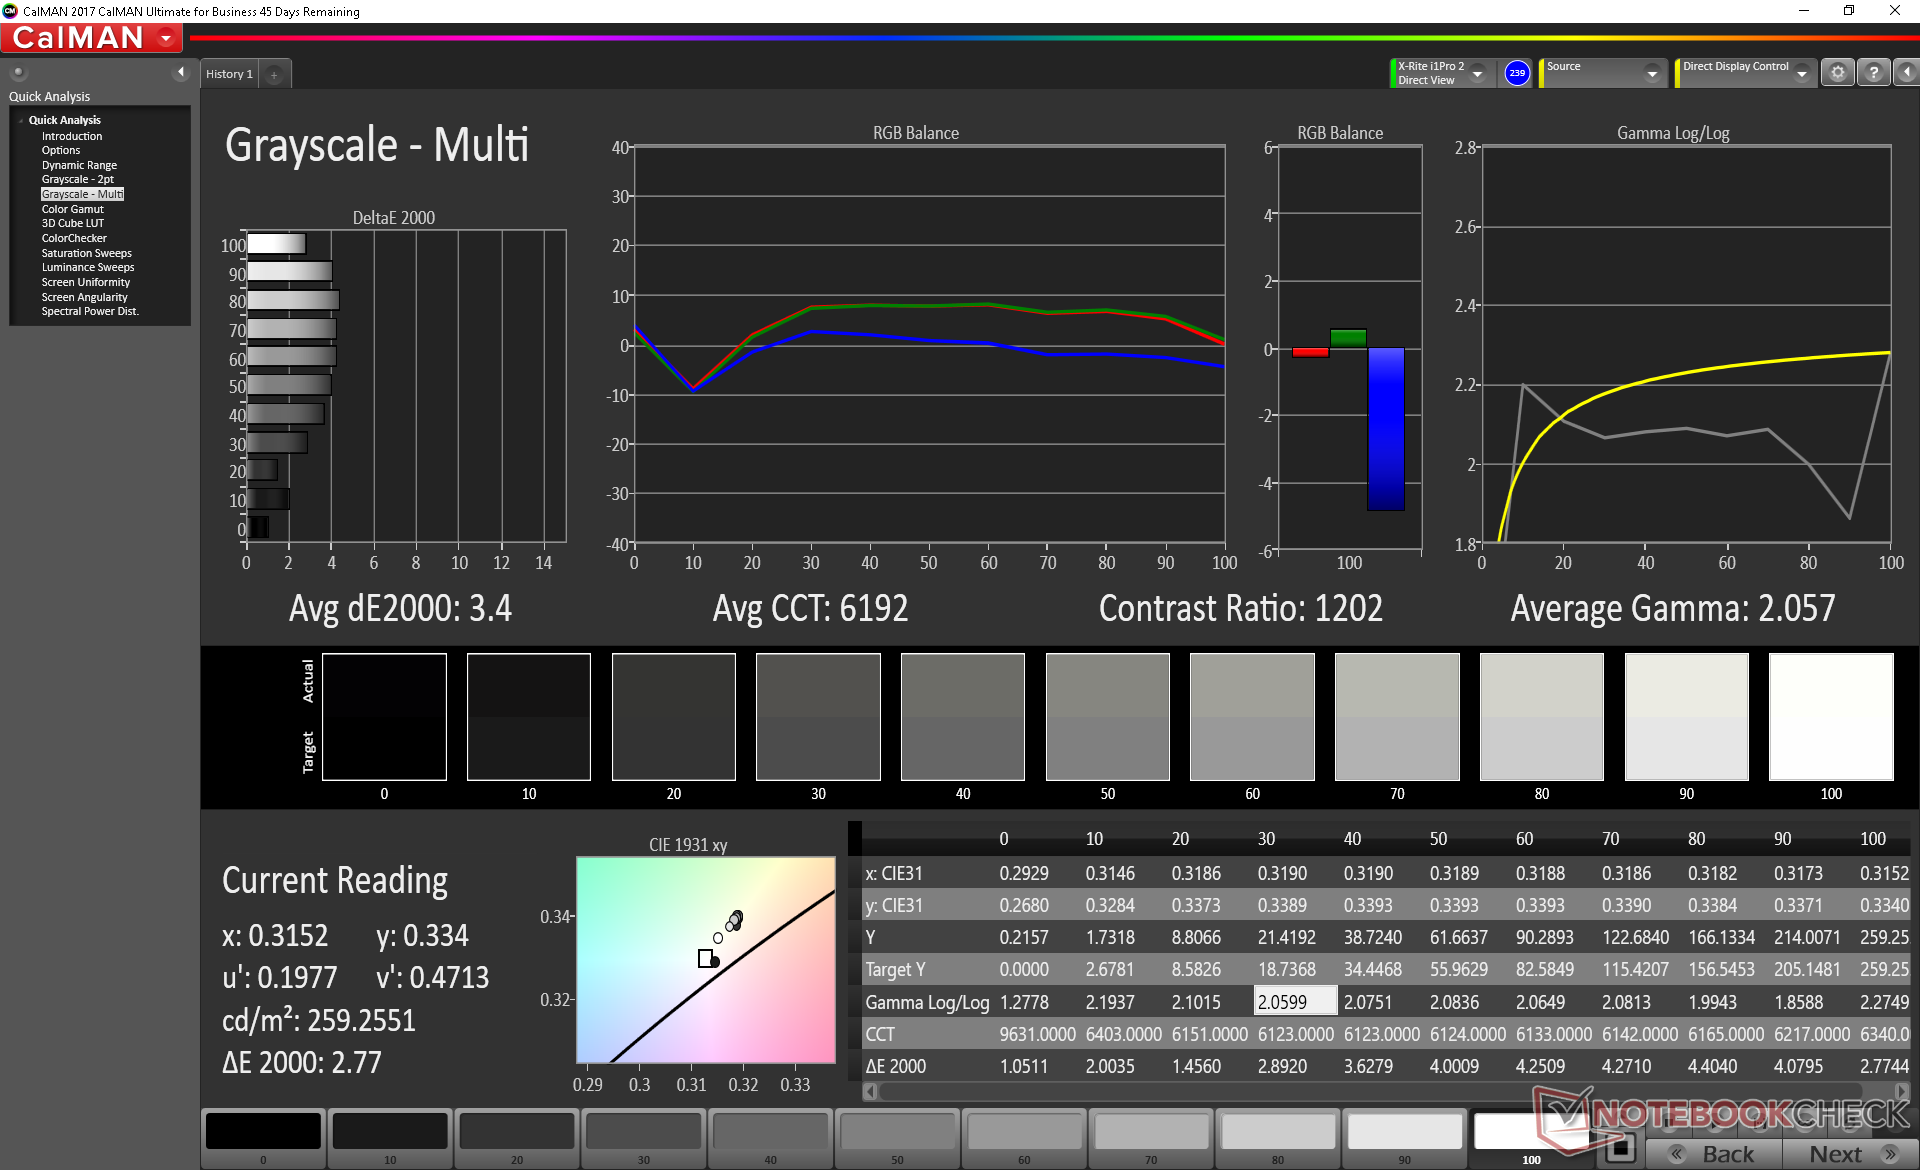
ΔE Greyscale Calman: 3.4 | ∀{0.09-98 Ø4.96}
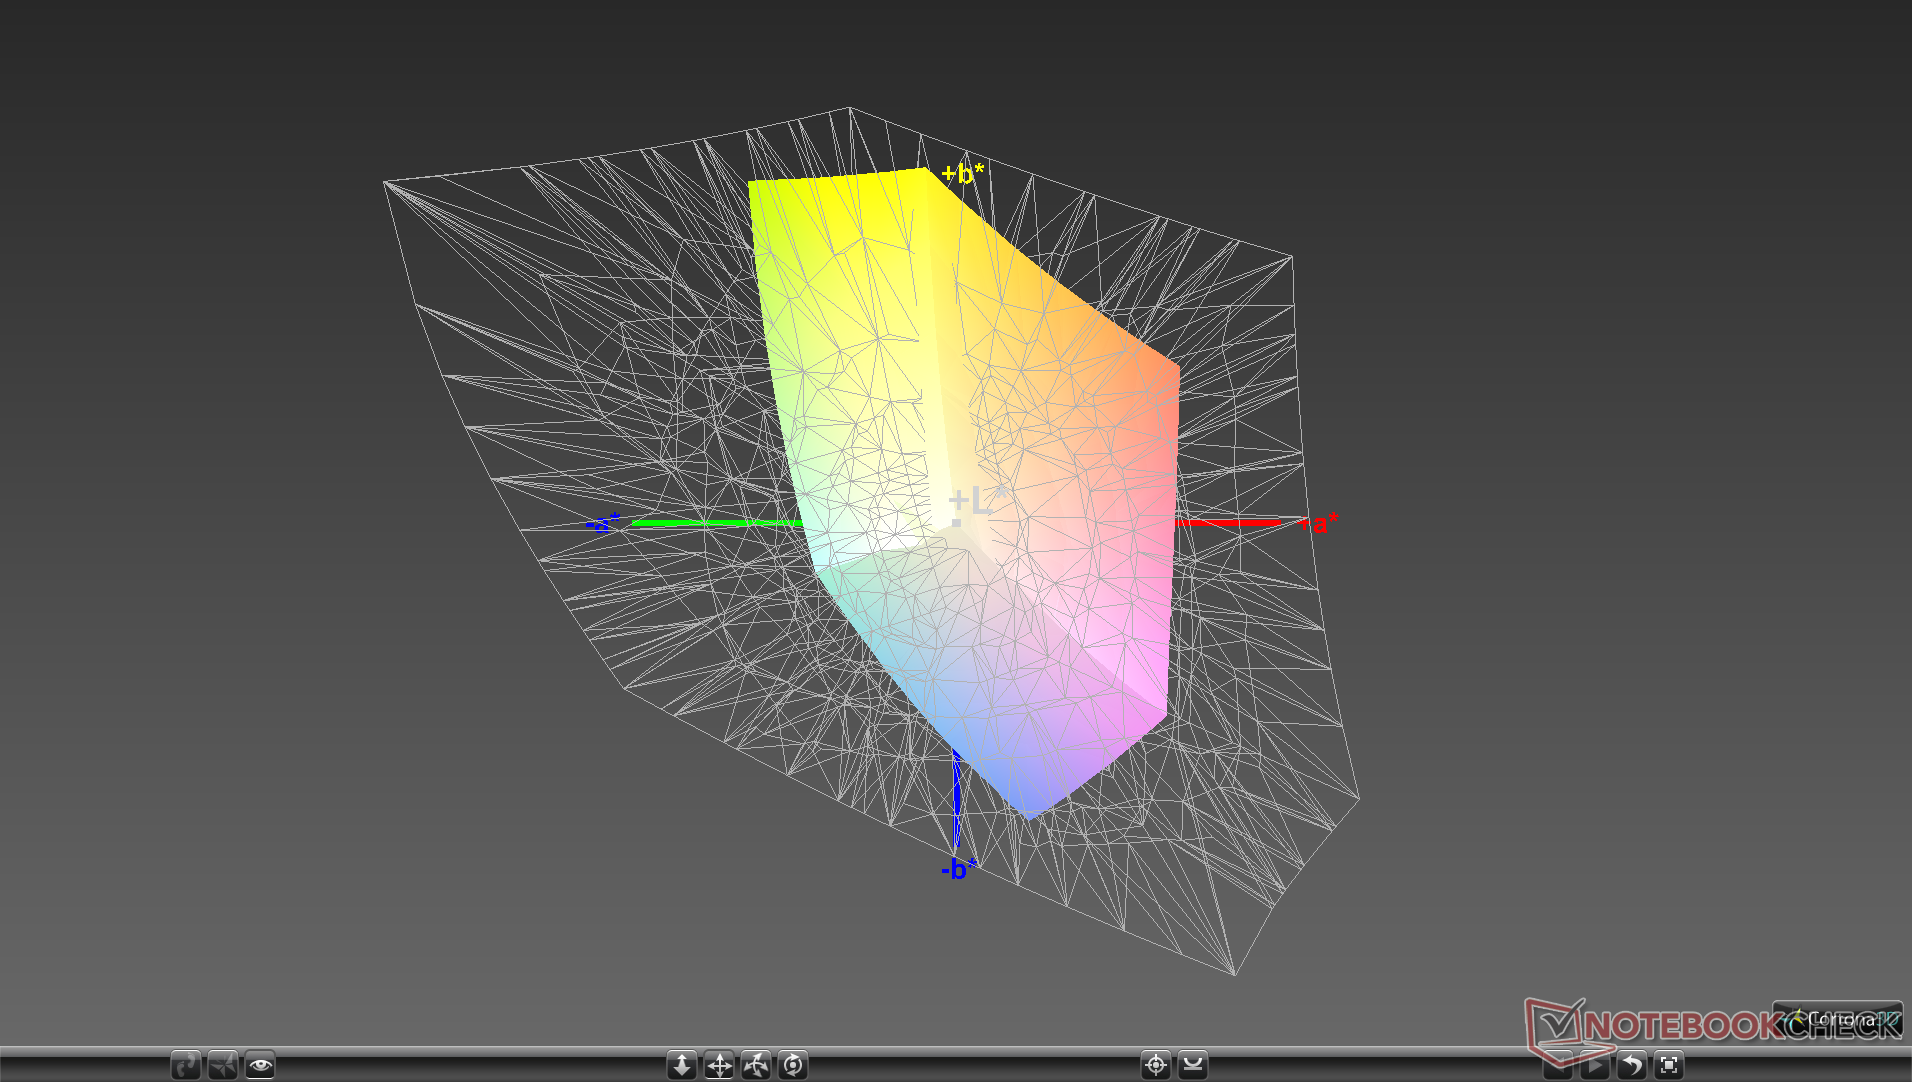
53.8% sRGB (Argyll 1.6.3 3D)
34.2% AdobeRGB 1998 (Argyll 1.6.3 3D)
37.26% AdobeRGB 1998 (Argyll 3D)
54.1% sRGB (Argyll 3D)
36.06% Display P3 (Argyll 3D)
Gamma: 2.06
CCT: 6192 K
| MSI GF65 9SD AU Optronics B156HAN13.0, IPS, 15.6", 1920x1080 | MSI GF63 8RC AU Optronics B156HAN02.1, IPS, 15.6", 1920x1080 | Asus TUF FX505DT-EB73 Panda LM156LF-GL, IPS, 15.6", 1920x1080 | Aorus 15-SA LG Philips LP156WFG-SPB2 (LGD05E8), IPS, 15.6", 1920x1080 | Dell G7 7590 AU Optronics B156HAN, IPS, 15.6", 1920x1080 | Lenovo Legion Y540-15IRH-81SX00B2GE BOE 084D, IPS, 15.6", 1920x1080 | |
|---|---|---|---|---|---|---|
| Display | 9% | 10% | 76% | 73% | 74% | |
| Display P3 Coverage (%) | 36.06 | 39.43 9% | 39.56 10% | 64.3 78% | 64.4 79% | 63.6 76% |
| sRGB Coverage (%) | 54.1 | 59.3 10% | 59.5 10% | 93.6 73% | 90 66% | 91.7 70% |
| AdobeRGB 1998 Coverage (%) | 37.26 | 40.73 9% | 40.91 10% | 65.6 76% | 65.3 75% | 65.2 75% |
| Response Times | 0% | 3% | 53% | 58% | 64% | |
| Response Time Grey 50% / Grey 80% * (ms) | 35.2 ? | 33.2 ? 6% | 30.4 ? 14% | 15.6 ? 56% | 14 ? 60% | 8.8 ? 75% |
| Response Time Black / White * (ms) | 25.6 ? | 27.2 ? -6% | 27.6 ? -8% | 12.8 ? 50% | 11.2 ? 56% | 12 ? 53% |
| PWM Frequency (Hz) | ||||||
| Screen | -3% | -2% | 30% | -3% | 29% | |
| Brightness middle (cd/m²) | 258.5 | 266.6 3% | 286.2 11% | 266 3% | 330.5 28% | 299 16% |
| Brightness (cd/m²) | 254 | 257 1% | 267 5% | 254 0% | 324 28% | 290 14% |
| Brightness Distribution (%) | 90 | 89 -1% | 84 -7% | 90 0% | 91 1% | 89 -1% |
| Black Level * (cd/m²) | 0.28 | 0.29 -4% | 0.33 -18% | 0.28 -0% | 0.71 -154% | 0.29 -4% |
| Contrast (:1) | 923 | 919 0% | 867 -6% | 950 3% | 465 -50% | 1031 12% |
| Colorchecker dE 2000 * | 5.36 | 5.93 -11% | 5.45 -2% | 3.11 42% | 5.33 1% | 3.7 31% |
| Colorchecker dE 2000 max. * | 23.23 | 16.28 30% | 18.08 22% | 5.84 75% | 11.08 52% | 7 70% |
| Colorchecker dE 2000 calibrated * | 4.92 | 3.6 27% | 4.47 9% | 1.37 72% | 3.63 26% | 2 59% |
| Greyscale dE 2000 * | 3.4 | 6.8 -100% | 5.3 -56% | 3.94 -16% | 6.7 -97% | 4.1 -21% |
| Gamma | 2.06 107% | 2.43 91% | 2.1 105% | 2.53 87% | 2.24 98% | 2.19 100% |
| CCT | 6192 105% | 7192 90% | 7679 85% | 6210 105% | 8035 81% | 7166 91% |
| Color Space (Percent of AdobeRGB 1998) (%) | 34.2 | 37.6 10% | 37.6 10% | 60 75% | 58.3 70% | 59.3 73% |
| Color Space (Percent of sRGB) (%) | 53.8 | 59.3 10% | 59.1 10% | 93 73% | 89.5 66% | 91.5 70% |
| Toplam Ortalama (Program / Ayarlar) | 2% /
-0% | 4% /
1% | 53% /
41% | 43% /
19% | 56% /
42% |
* ... daha küçük daha iyidir
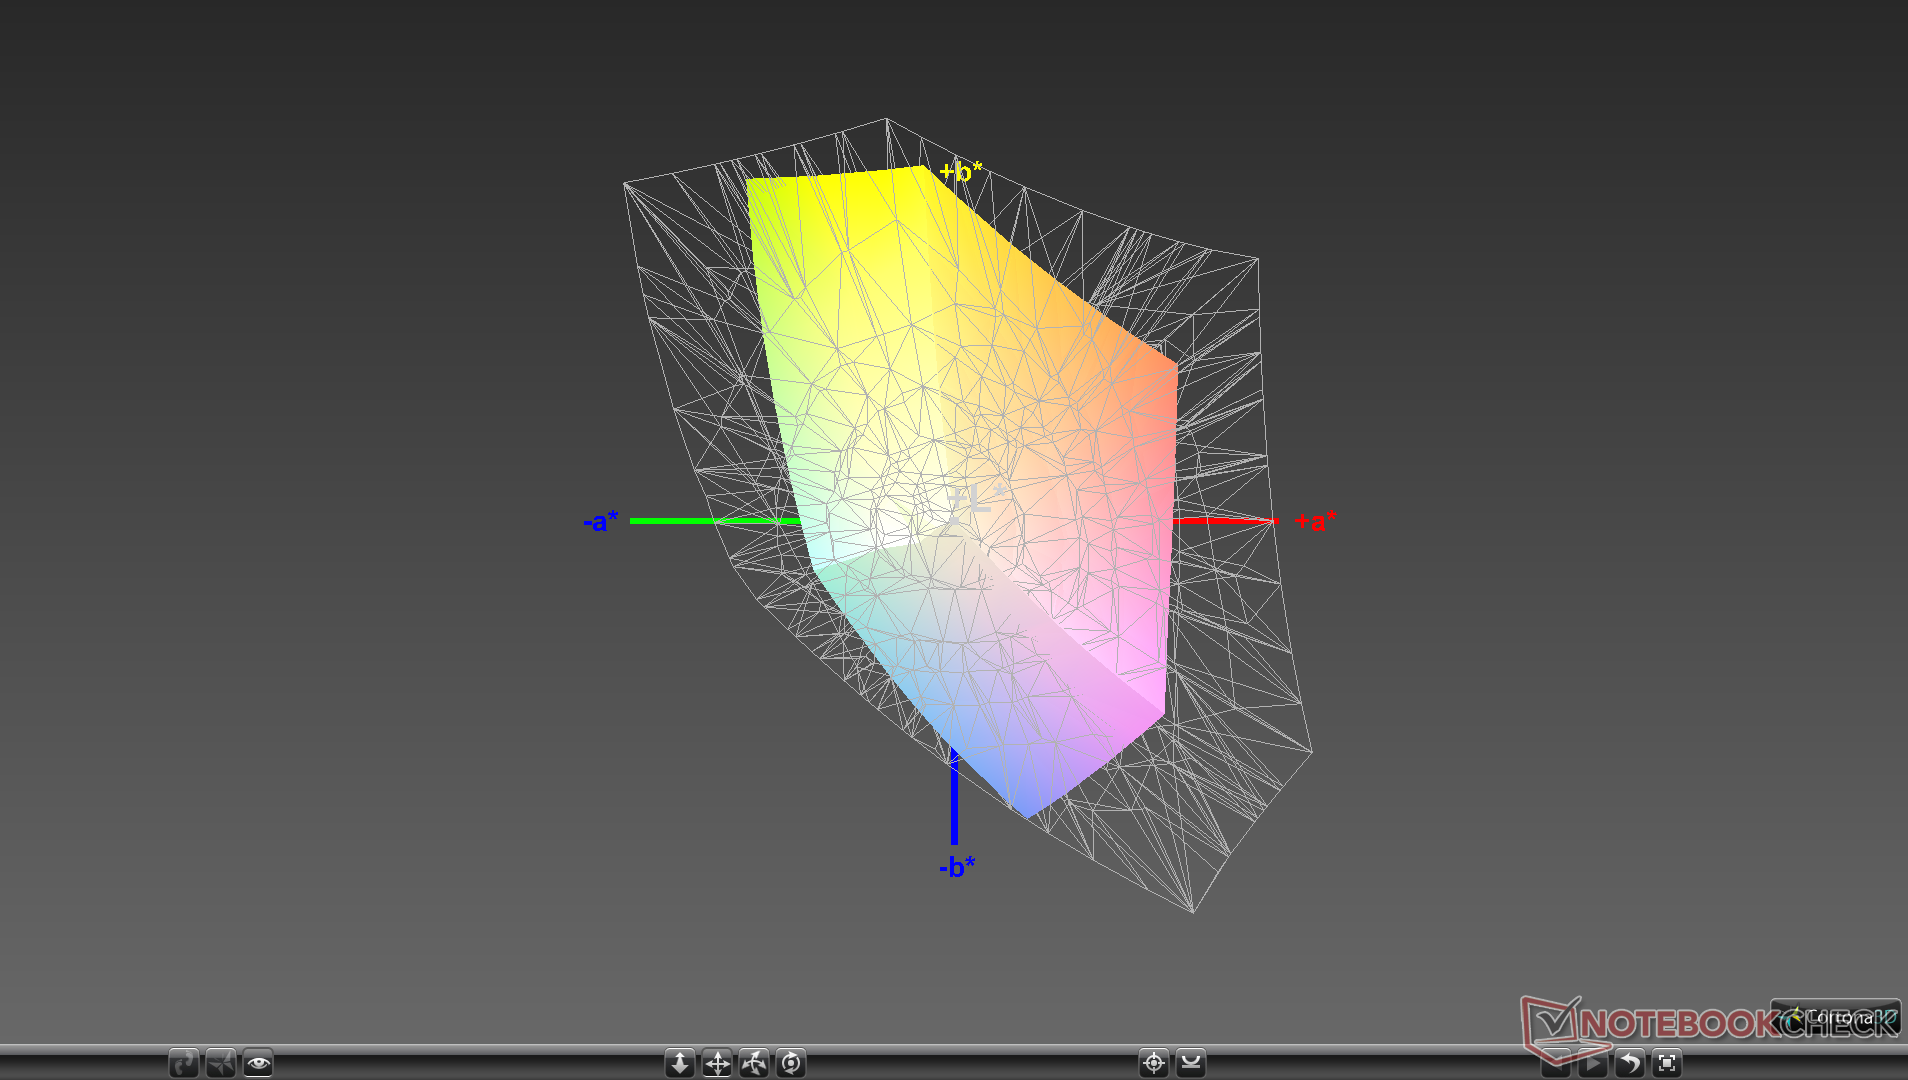
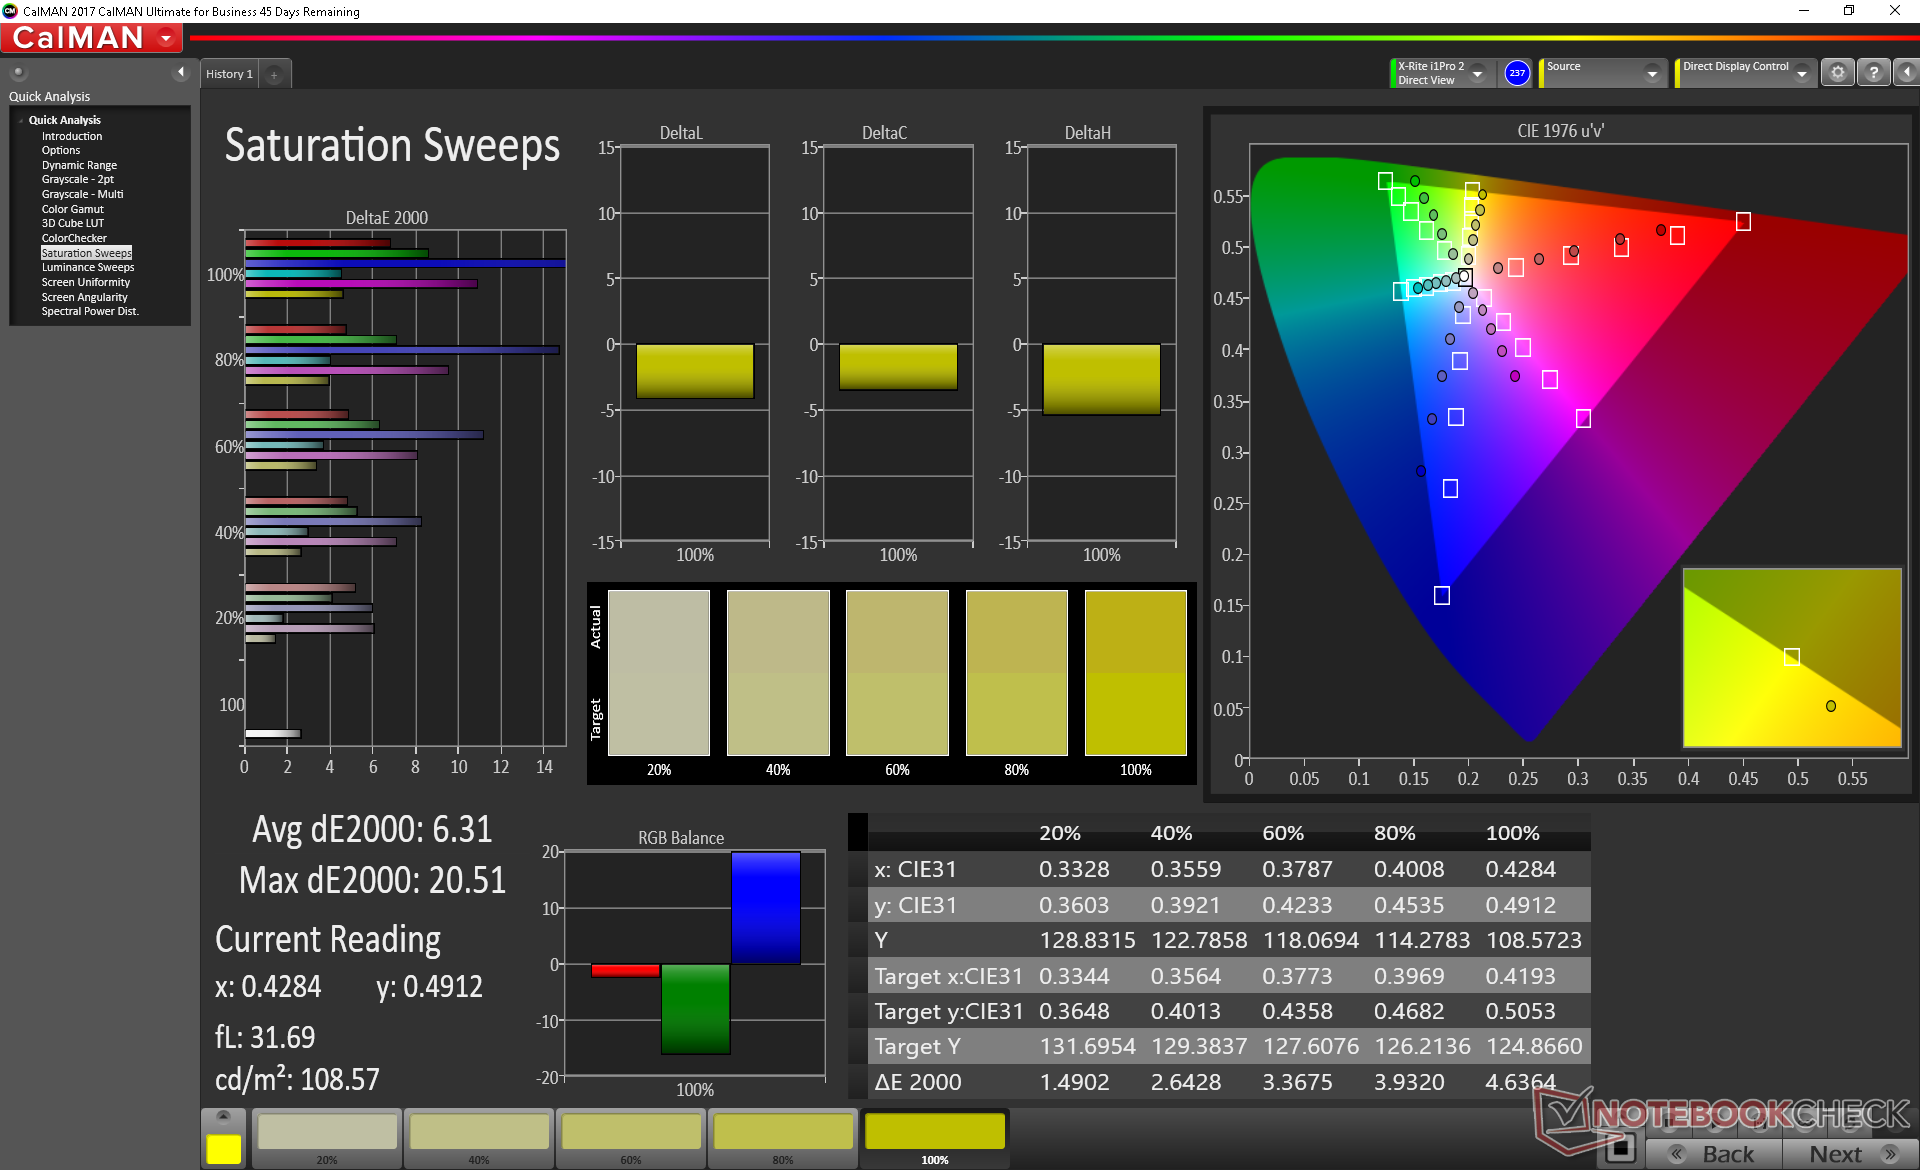
Renk alanı, sırasıyla Aorus 15, Dell G7 15 7590 veya MSI'nin kendi GS serisi gibi daha pahalı dizüstü bilgisayarlarda>% 90 sRGB ile karşılaştırıldığında, sırasıyla sRGB ve AdobeRGB'nin yalnızca yüzde 54'ü ve yüzde 34'ü ile sınırlı. Bu, herhangi bir profesyonel grafik çalışması için kullanılacak laptop değildir.
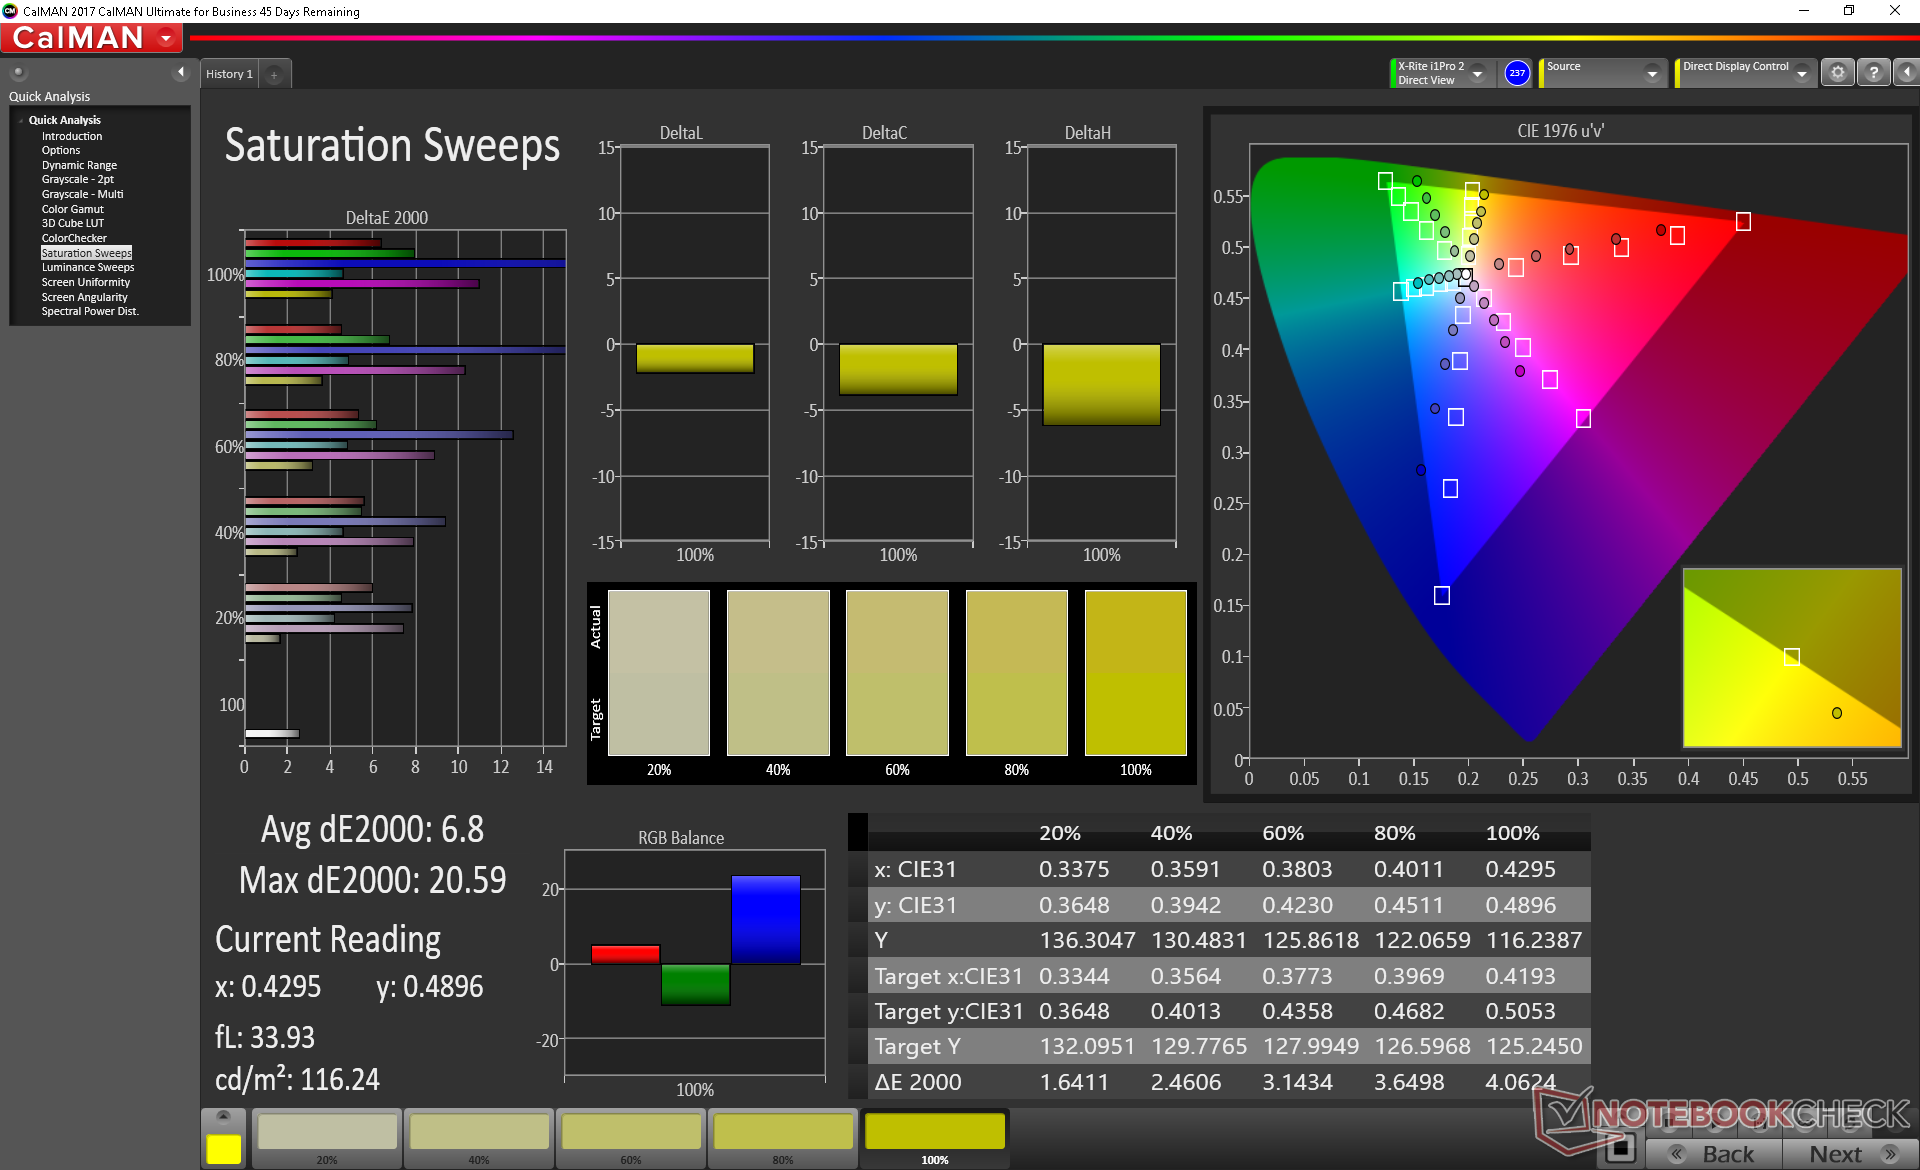
Bir X-Rite renkölçerle yapılan diğer ölçümler, renk sıcaklığının genellikle çok fazla olduğu eski bütçeli MSI dizüstü bilgisayarların aksine beklenenden daha sıcak bir renk sıcaklığı göstermektedir. Bir son kullanıcı kalibrasyonu bunu ele alır ve işlemdeki gri tonlamayı hafifçe iyileştirir. Bununla birlikte, renk doğruluğu yukarıda belirtilen sınırlı renk alanı nedeniyle zayıf kalır. Özellikle mavi, sığ görünmektedir ve en çok birincil ve ikincil renklerin dışında temsil edilmektedir.
Yanıt Sürelerini Görüntüle
| ↔ Tepki Süresi Siyahtan Beyaza | ||
|---|---|---|
| 25.6 ms ... yükseliş ↗ ve sonbahar↘ birleşimi | ↗ 12.4 ms yükseliş | 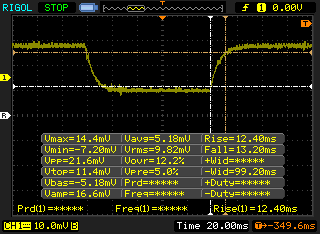 |
| ↘ 13.2 ms sonbahar | ||
| Ekran, testlerimizde nispeten yavaş yanıt oranları gösteriyor ve oyuncular için çok yavaş olabilir. Karşılaştırıldığında, test edilen tüm cihazlar 0.1 (minimum) ile 240 (maksimum) ms arasında değişir. » Tüm cihazların 61 %'si daha iyi. Bu, ölçülen yanıt süresinin test edilen tüm cihazların ortalamasından (19.8 ms) daha kötü olduğu anlamına gelir. | ||
| ↔ Tepki Süresi %50 Griden %80 Griye | ||
| 35.2 ms ... yükseliş ↗ ve sonbahar↘ birleşimi | ↗ 18 ms yükseliş | 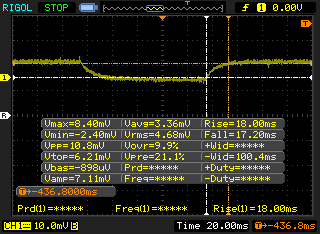 |
| ↘ 17.2 ms sonbahar | ||
| Ekran, testlerimizde yavaş yanıt oranları gösteriyor ve oyuncular için yetersiz olacaktır. Karşılaştırıldığında, test edilen tüm cihazlar 0.165 (minimum) ile 636 (maksimum) ms arasında değişir. » Tüm cihazların 49 %'si daha iyi. Bu, ölçülen yanıt süresinin test edilen tüm cihazların ortalamasından (31 ms) daha kötü olduğu anlamına gelir. | ||
Ekran Titremesi / PWM (Darbe Genişliği Modülasyonu)
| Ekran titriyor / PWM algılanmadı | 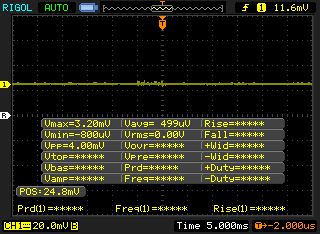 | ||
Karşılaştırıldığında: Test edilen tüm cihazların %52 %'si ekranı karartmak için PWM kullanmıyor. PWM tespit edilirse, ortalama 7757 (minimum: 5 - maksimum: 343500) Hz ölçüldü. | |||
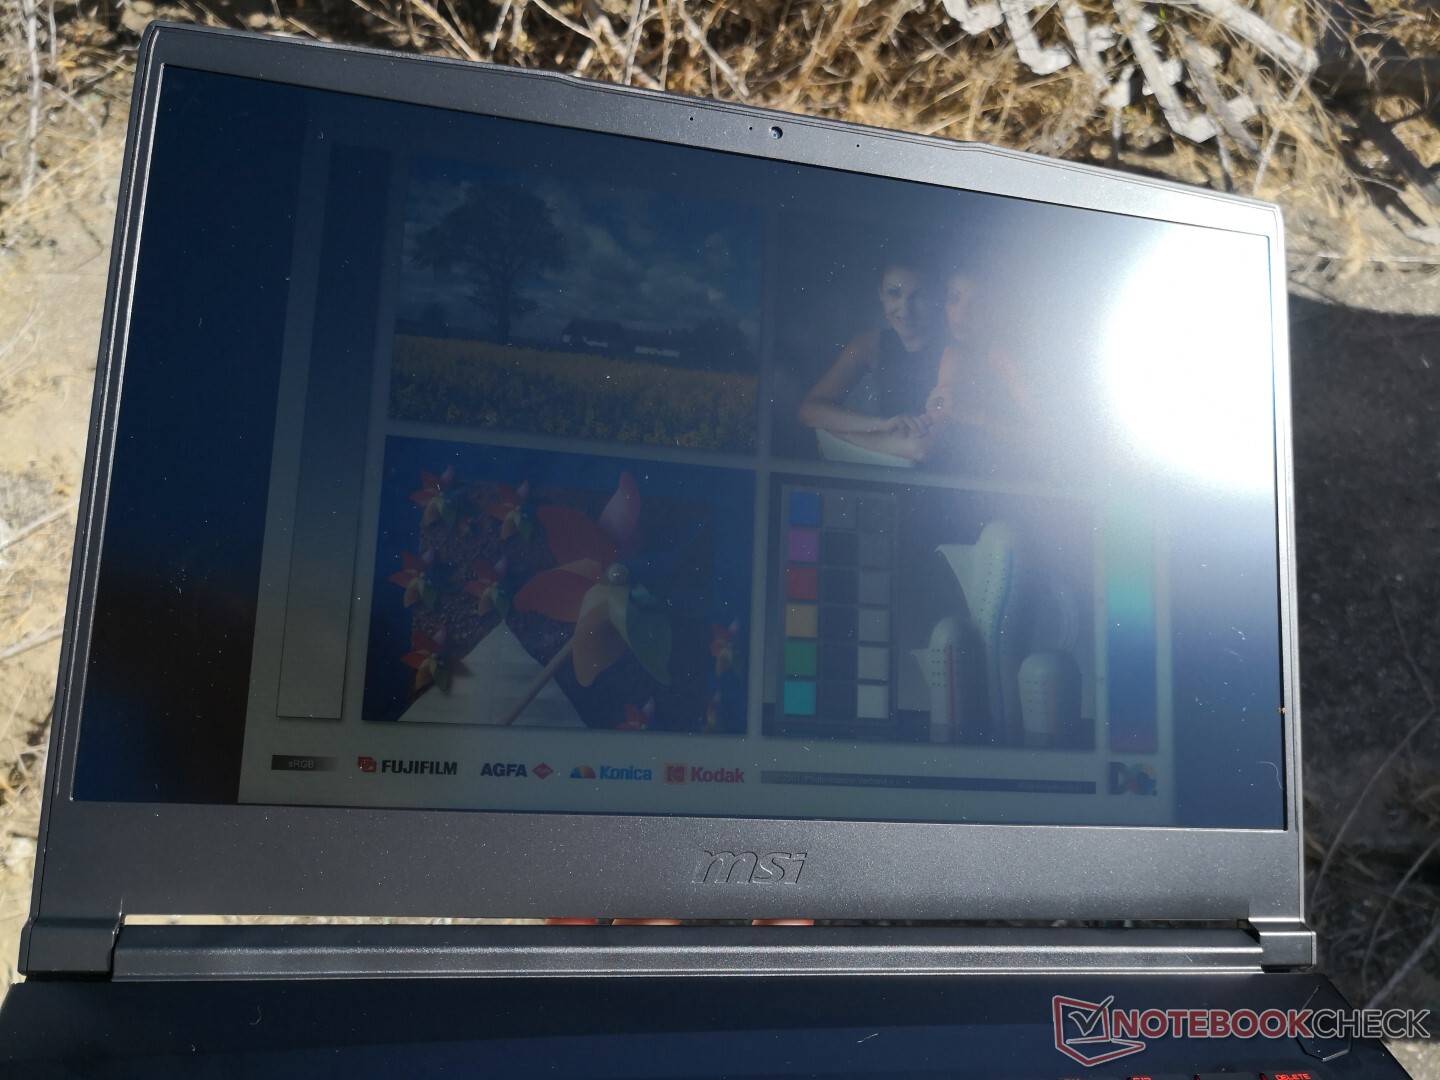
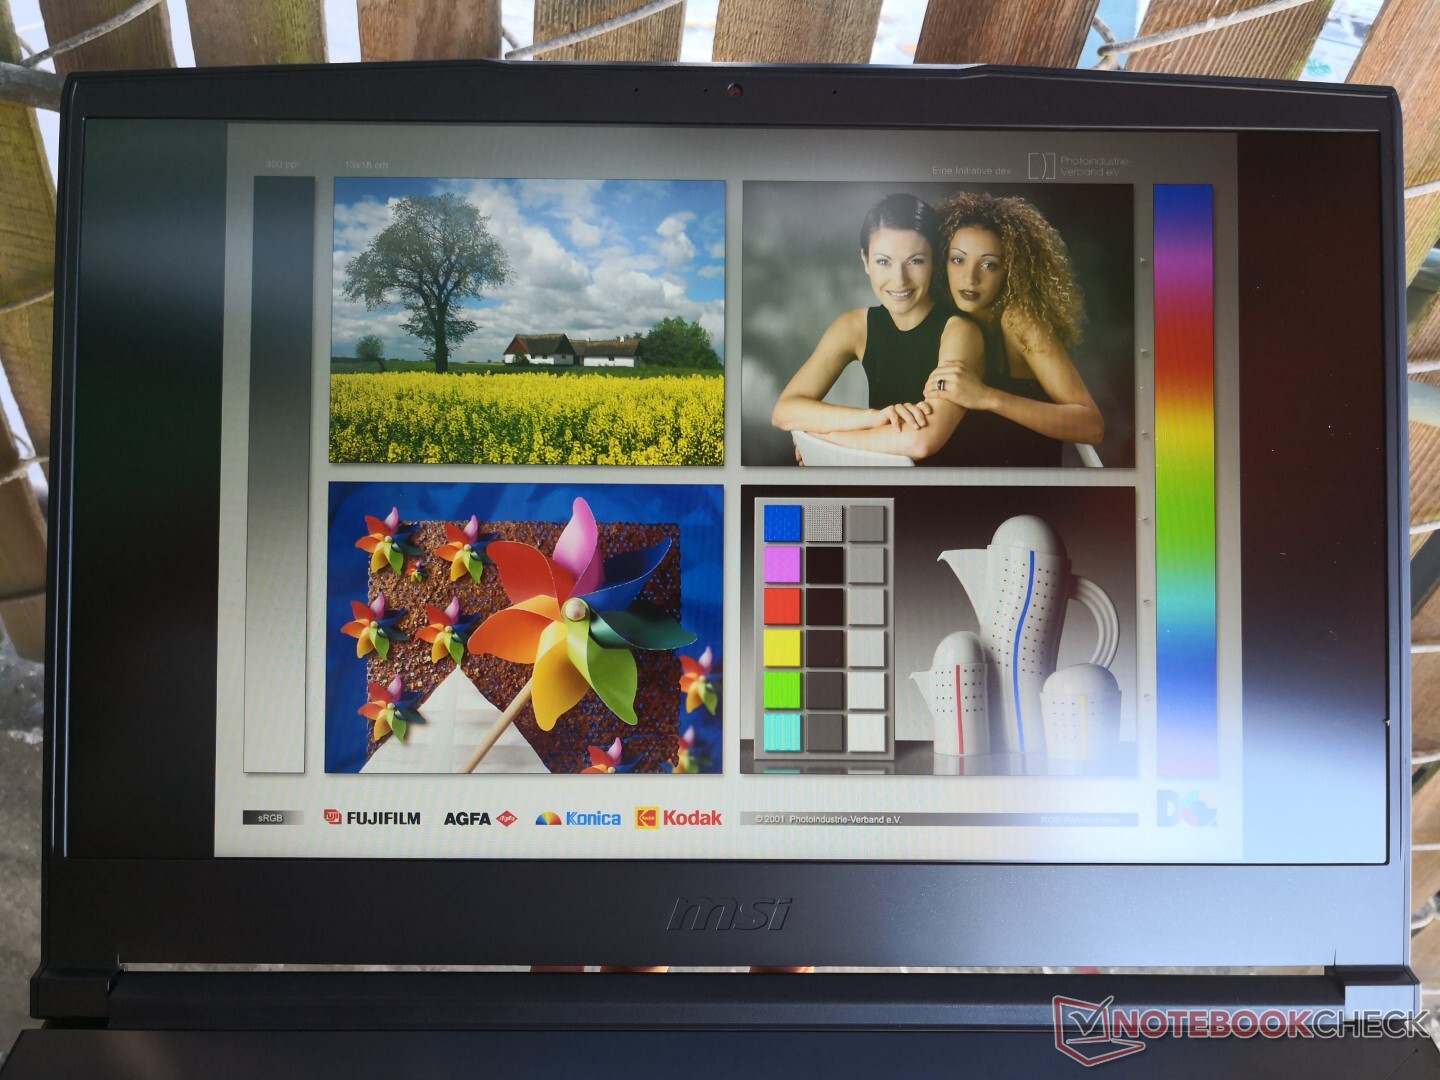
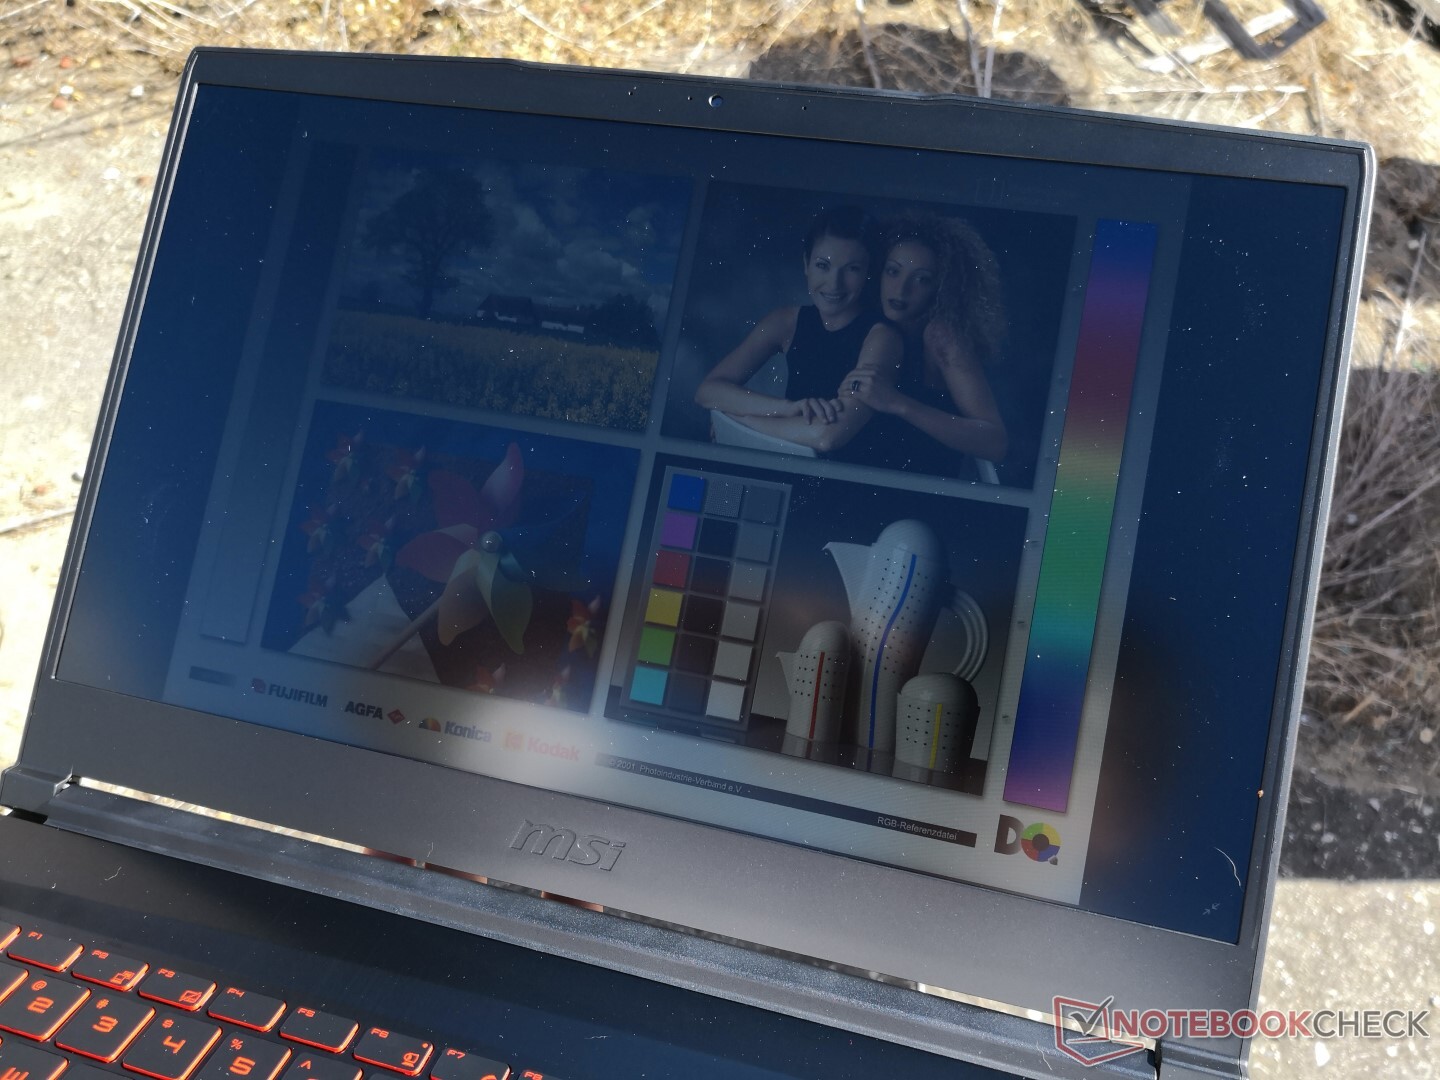
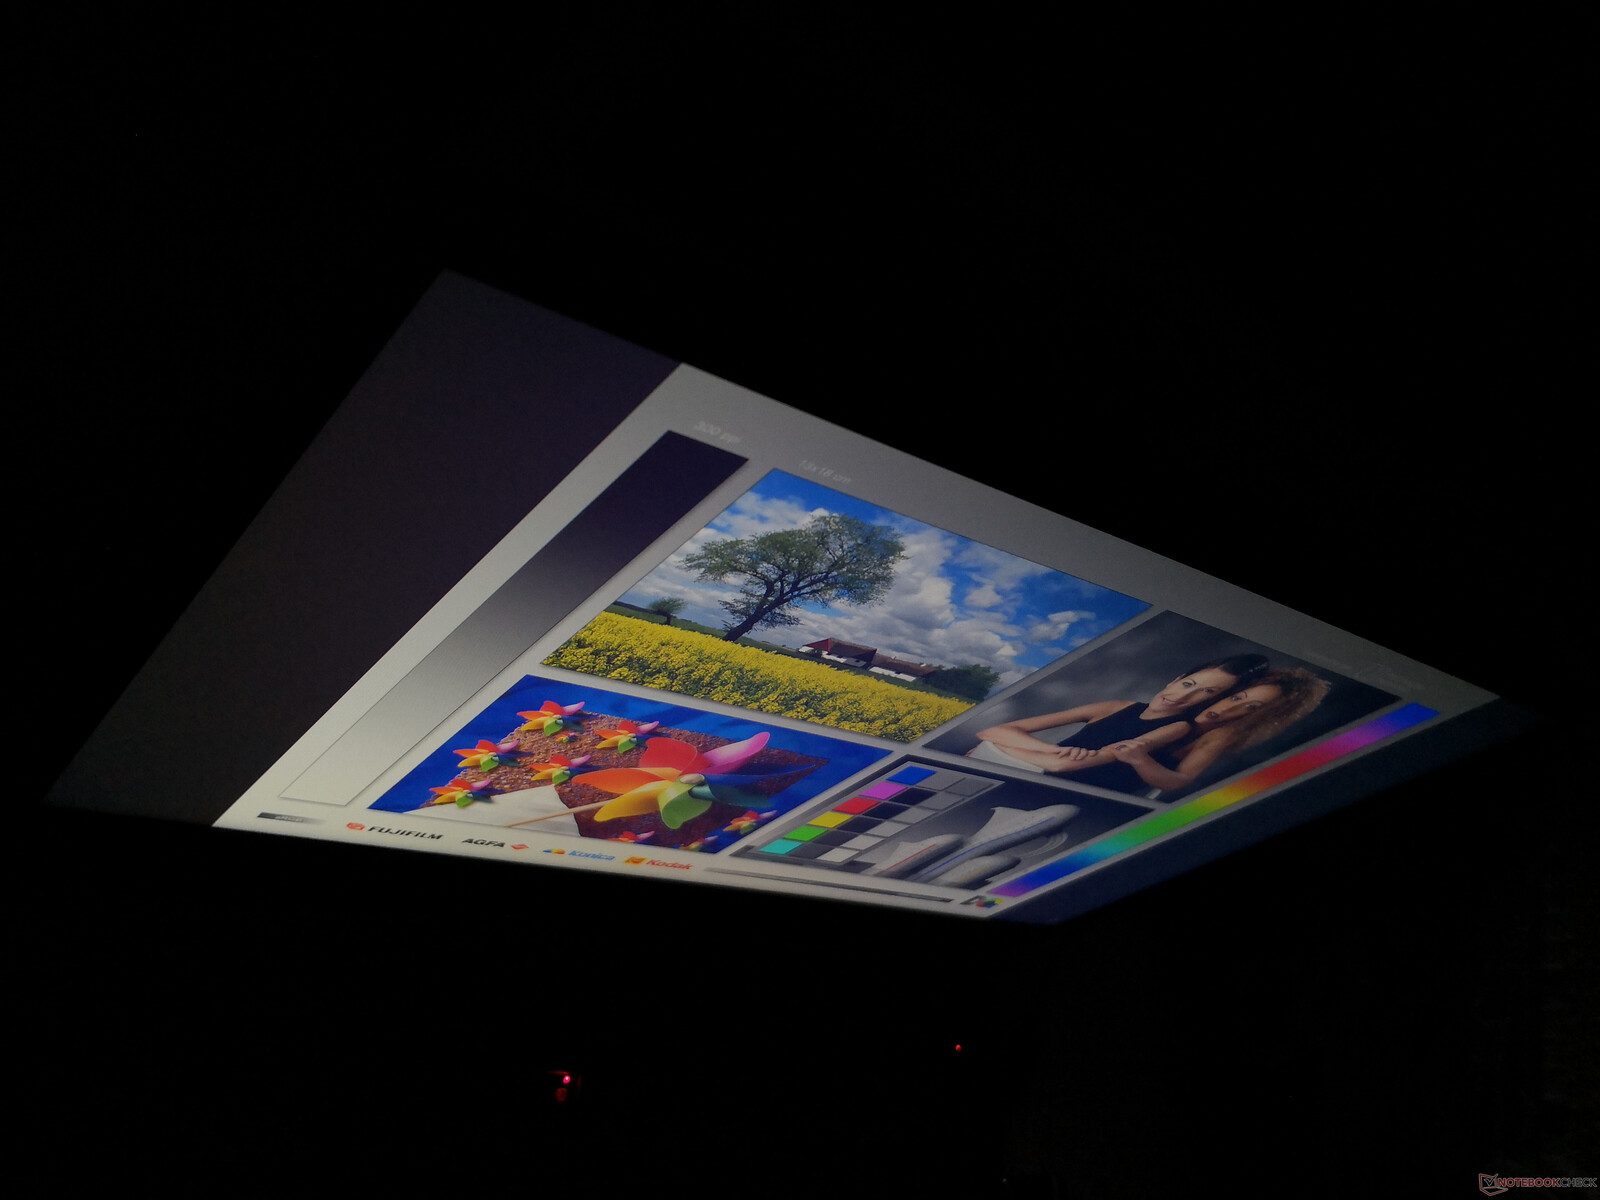
Dış mekan görüşü, GF63 ile aynıdır, çünkü parlaklık seviyeleri ve kontrast oranları karşılaştırılabilir. Başka bir deyişle, gölgede olsa bile çok fazla şaşıma, renkleri silmeyi ve bazı parlamaları bekleyin. Görüş açıları, yalnızca anormal derecede aşırı açılardan bakılıyorsa, kontrast ve renklerdeki normal değişikliklerle geniş.
Verim
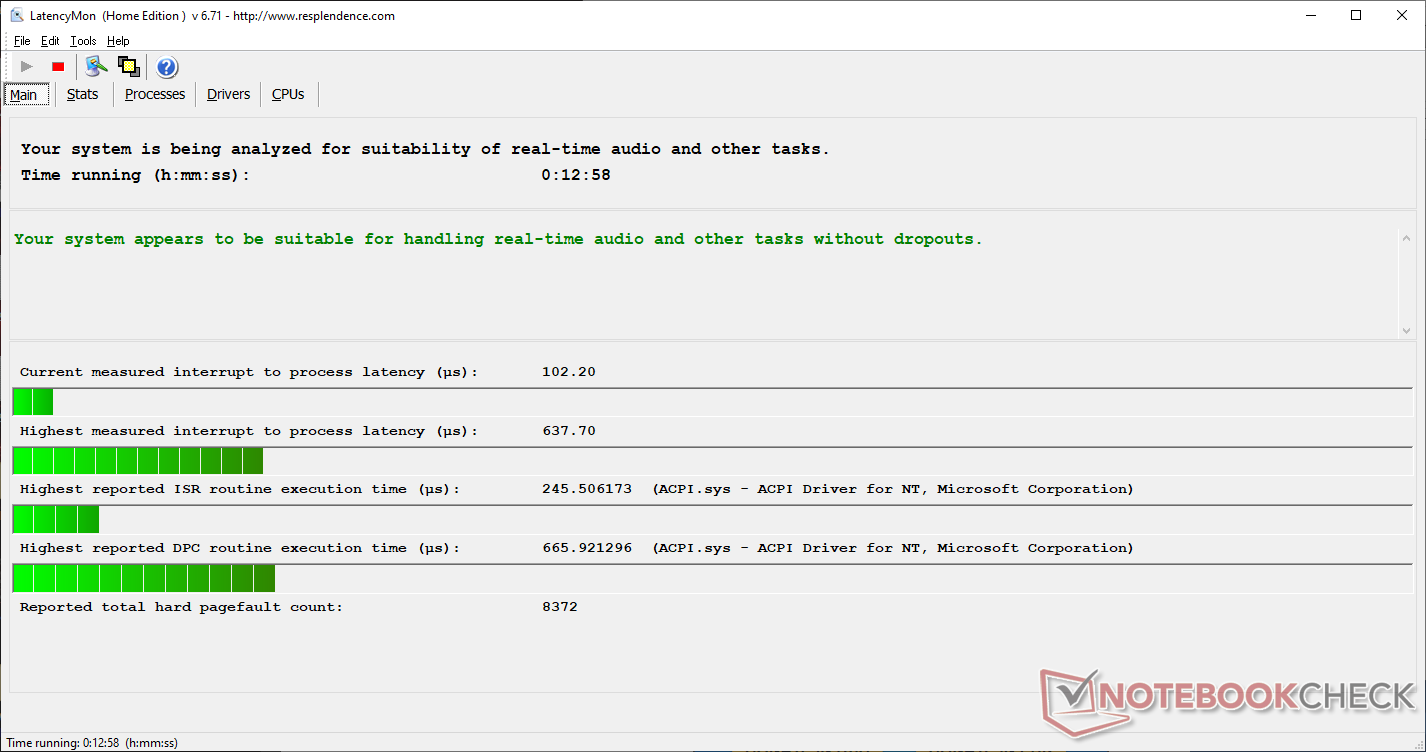
Hexa çekirdekli Core i7-9750H CPU ve GTX 1660 Ti GPU, orta seviye oyun özellikleri ve çoğu bütçe oyun dizüstü bilgisayarının taşıdığı Core i5-9300H ve GTX 1650'den büyük bir adım. MSI GE75 gibi meraklısı alternatifler daha da hızlı octa çekirdekli Core i9-9880H ve GeForce RTX seçeneklerini bile taşıyabilir.Optimus, G-Sync SKU'larını otomatik olarak dışlamak için standart olarak gelir. LatencyMon, MSI WP65'te keşfettiğimiz gibi hiçbir DPC gecikme sorunu göstermiyor.
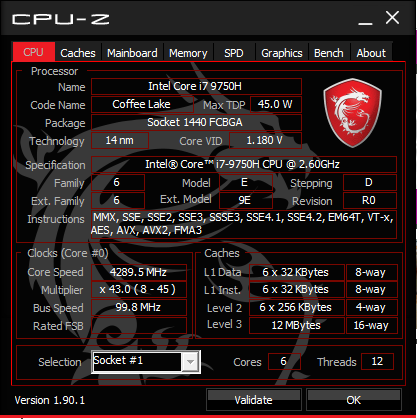
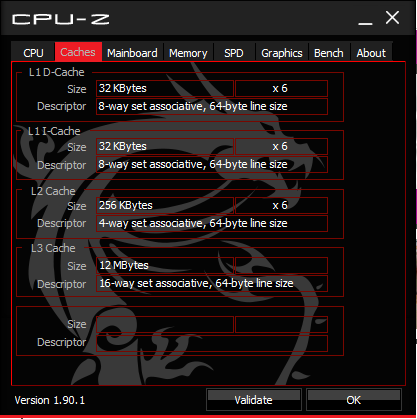
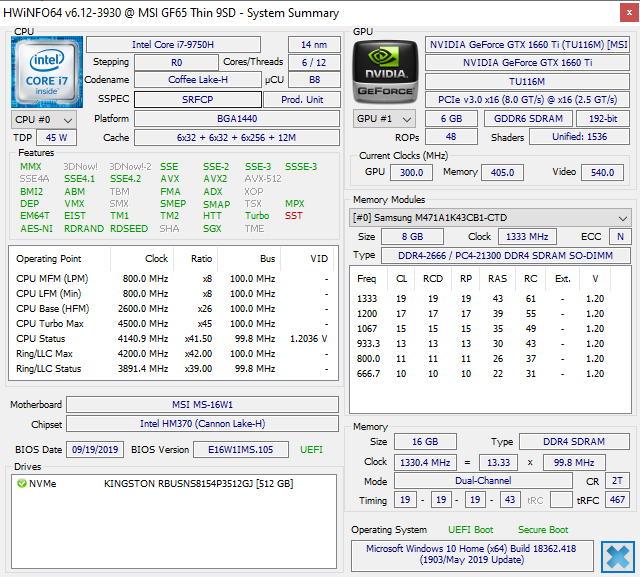
İşlemci
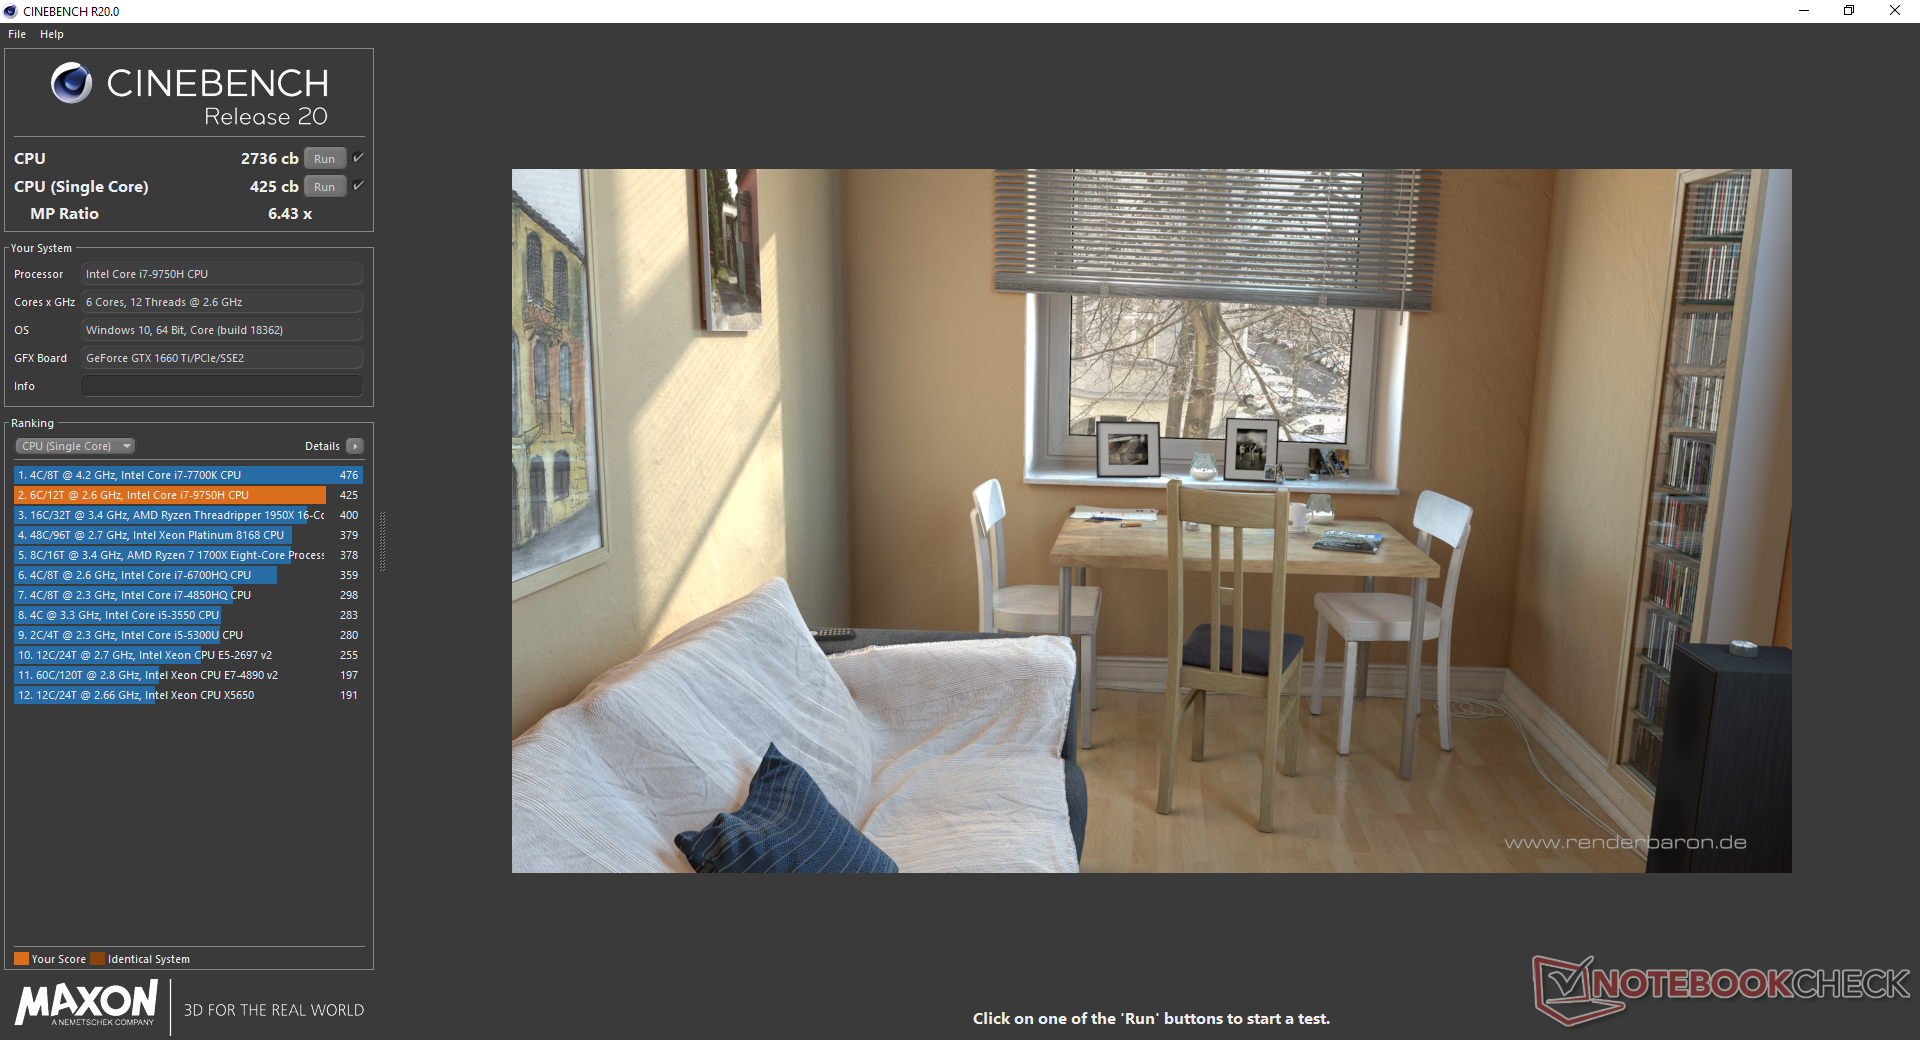
CPU performansı temel olarak aynı Core i7-9750H CPU ile donatılmış MSI GL65 9SEK ile aynıdır. Maksimum Turbo Boost'un kısa ömürlü olduğunu göstermek için bir döngüde CineBench R15 Multi-Thread çalışırken performans yaklaşık% 10 düşer. Core i7-8750H’den yükseltme yapan kullanıcılar çok fazla bir fark görmeyecek, ancak Core i7-7700HQ, i5-8300H, i5-9300H veya Ryzen 7 3750H gibi dört çekirdekli işlemcilerden yükseltme gözle görülür iyileştirmeler getirecek. Daha fazla teknik bilgi ve kıyaslama karşılaştırmaları için Core i7-9750H üzerine özel sayfa.
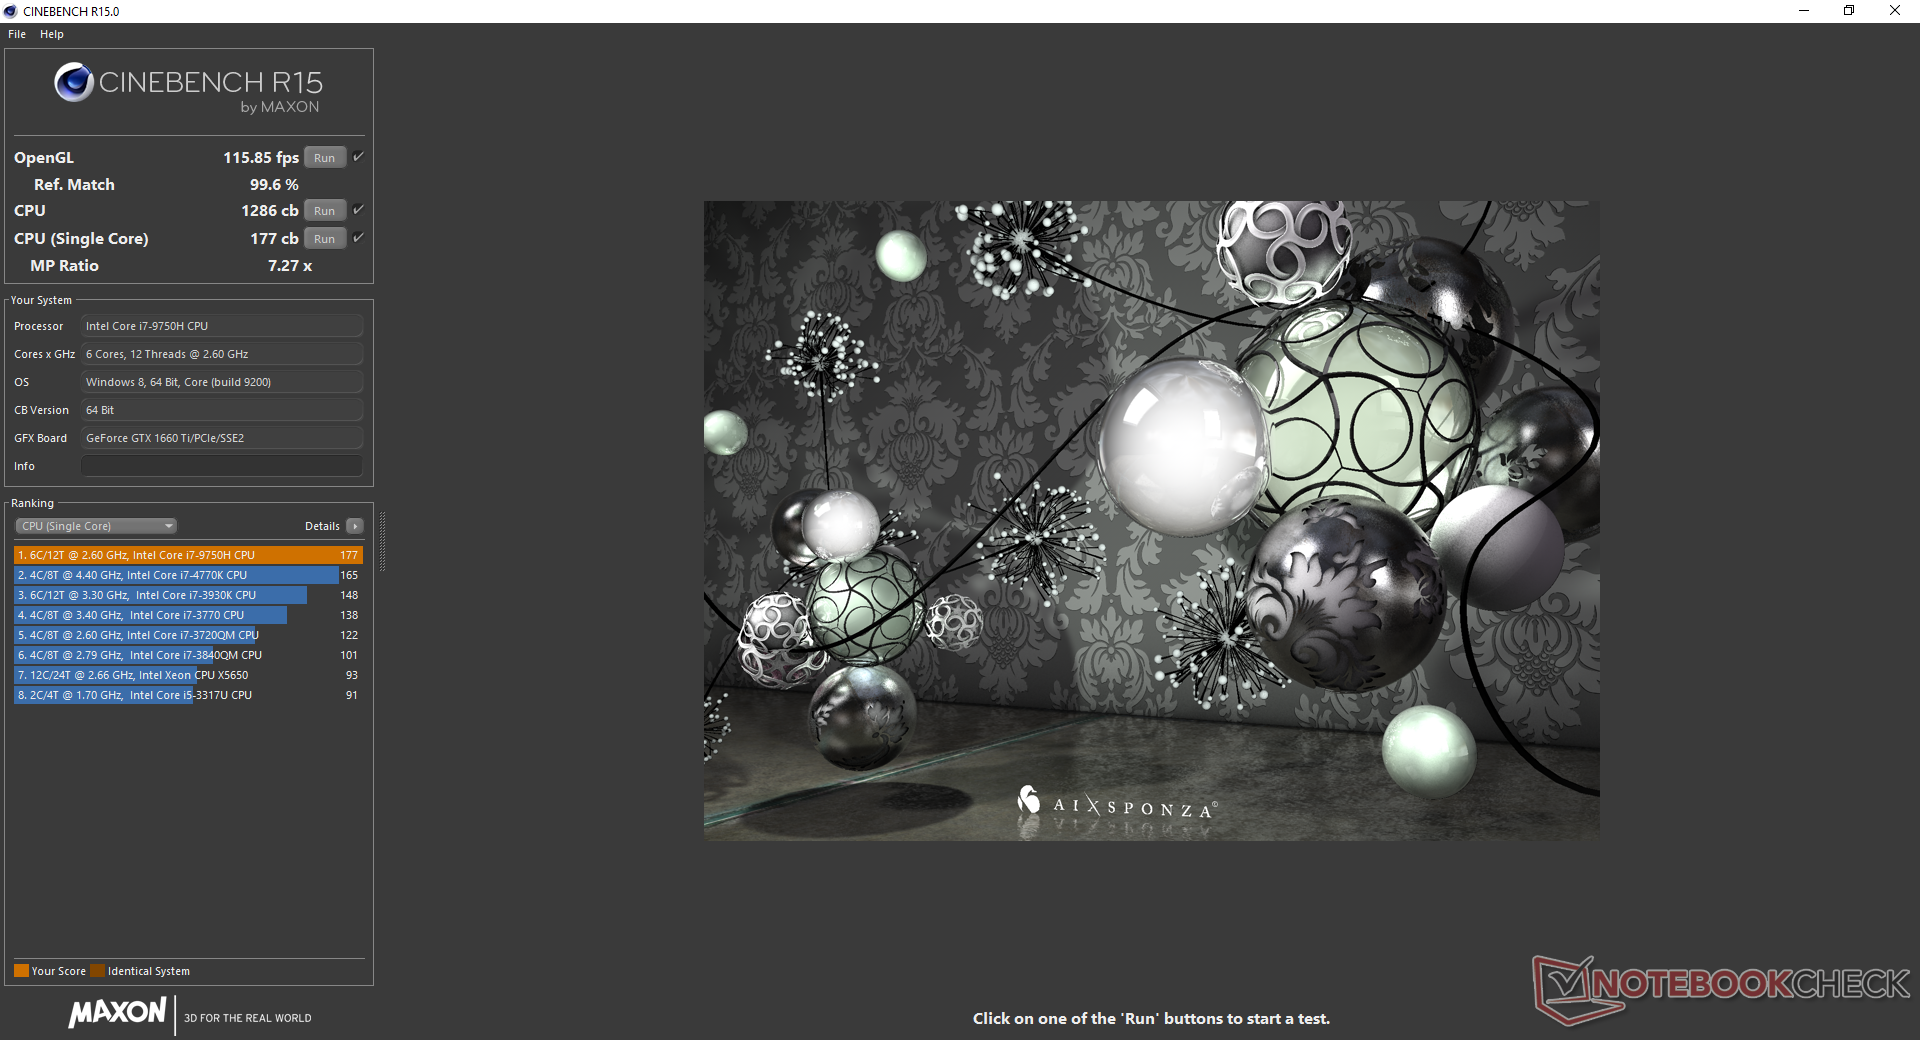
| Cinebench R15 | |
| CPU Single 64Bit | |
| MSI GT76 Titan DT 9SG | |
| MSI GT75 8RG-090 Titan | |
| MSI GE75 9SG | |
| Ortalama Intel Core i7-9750H (170 - 194, n=82) | |
| MSI GF65 9SD | |
| MSI GE75 8SG Raider | |
| Dell XPS 13 7390 2-in-1 Core i7 | |
| Dell G3 3590 | |
| MSI GV62 8RE-016US | |
| MSI GF62VR 7RF-877 | |
| Asus ROG Zephyrus G15 GA502DU | |
| CPU Multi 64Bit | |
| MSI GT76 Titan DT 9SG | |
| MSI GE75 9SG | |
| MSI GT75 8RG-090 Titan | |
| MSI GF65 9SD | |
| Ortalama Intel Core i7-9750H (952 - 1306, n=85) | |
| MSI GE75 8SG Raider | |
| Dell XPS 13 7390 2-in-1 Core i7 | |
| MSI GV62 8RE-016US | |
| Asus ROG Zephyrus G15 GA502DU | |
| Dell G3 3590 | |
| MSI GF62VR 7RF-877 | |
| Cinebench R11.5 | |
| CPU Single 64Bit | |
| MSI GT75 8RG-090 Titan | |
| Dell XPS 13 7390 2-in-1 Core i7 | |
| MSI GE75 9SG | |
| Ortalama Intel Core i7-9750H (1.96 - 2.19, n=10) | |
| MSI GV62 8RE-016US | |
| MSI GF62VR 7RF-877 | |
| Asus ROG Zephyrus G15 GA502DU | |
| CPU Multi 64Bit | |
| MSI GE75 9SG | |
| MSI GT75 8RG-090 Titan | |
| Ortalama Intel Core i7-9750H (11.3 - 14.1, n=10) | |
| Dell XPS 13 7390 2-in-1 Core i7 | |
| Asus ROG Zephyrus G15 GA502DU | |
| MSI GF62VR 7RF-877 | |
| MSI GV62 8RE-016US | |
| Cinebench R10 | |
| Rendering Multiple CPUs 32Bit | |
| MSI GE75 9SG | |
| Ortalama Intel Core i7-9750H (28251 - 36304, n=13) | |
| Dell XPS 13 7390 2-in-1 Core i7 | |
| MSI GF62VR 7RF-877 | |
| MSI GV62 8RE-016US | |
| Asus ROG Zephyrus G15 GA502DU | |
| Rendering Single 32Bit | |
| Dell XPS 13 7390 2-in-1 Core i7 | |
| MSI GE75 9SG | |
| Ortalama Intel Core i7-9750H (6659 - 7214, n=13) | |
| MSI GV62 8RE-016US | |
| MSI GF62VR 7RF-877 | |
| Asus ROG Zephyrus G15 GA502DU | |
| wPrime 2.10 - 1024m | |
| Dell XPS 13 7390 2-in-1 Core i7 | |
| MSI GF62VR 7RF-877 | |
| MSI GV62 8RE-016US | |
| Asus ROG Zephyrus G15 GA502DU | |
| Ortalama Intel Core i7-9750H (n=1) | |
| MSI GE75 9SG | |
* ... daha küçük daha iyidir
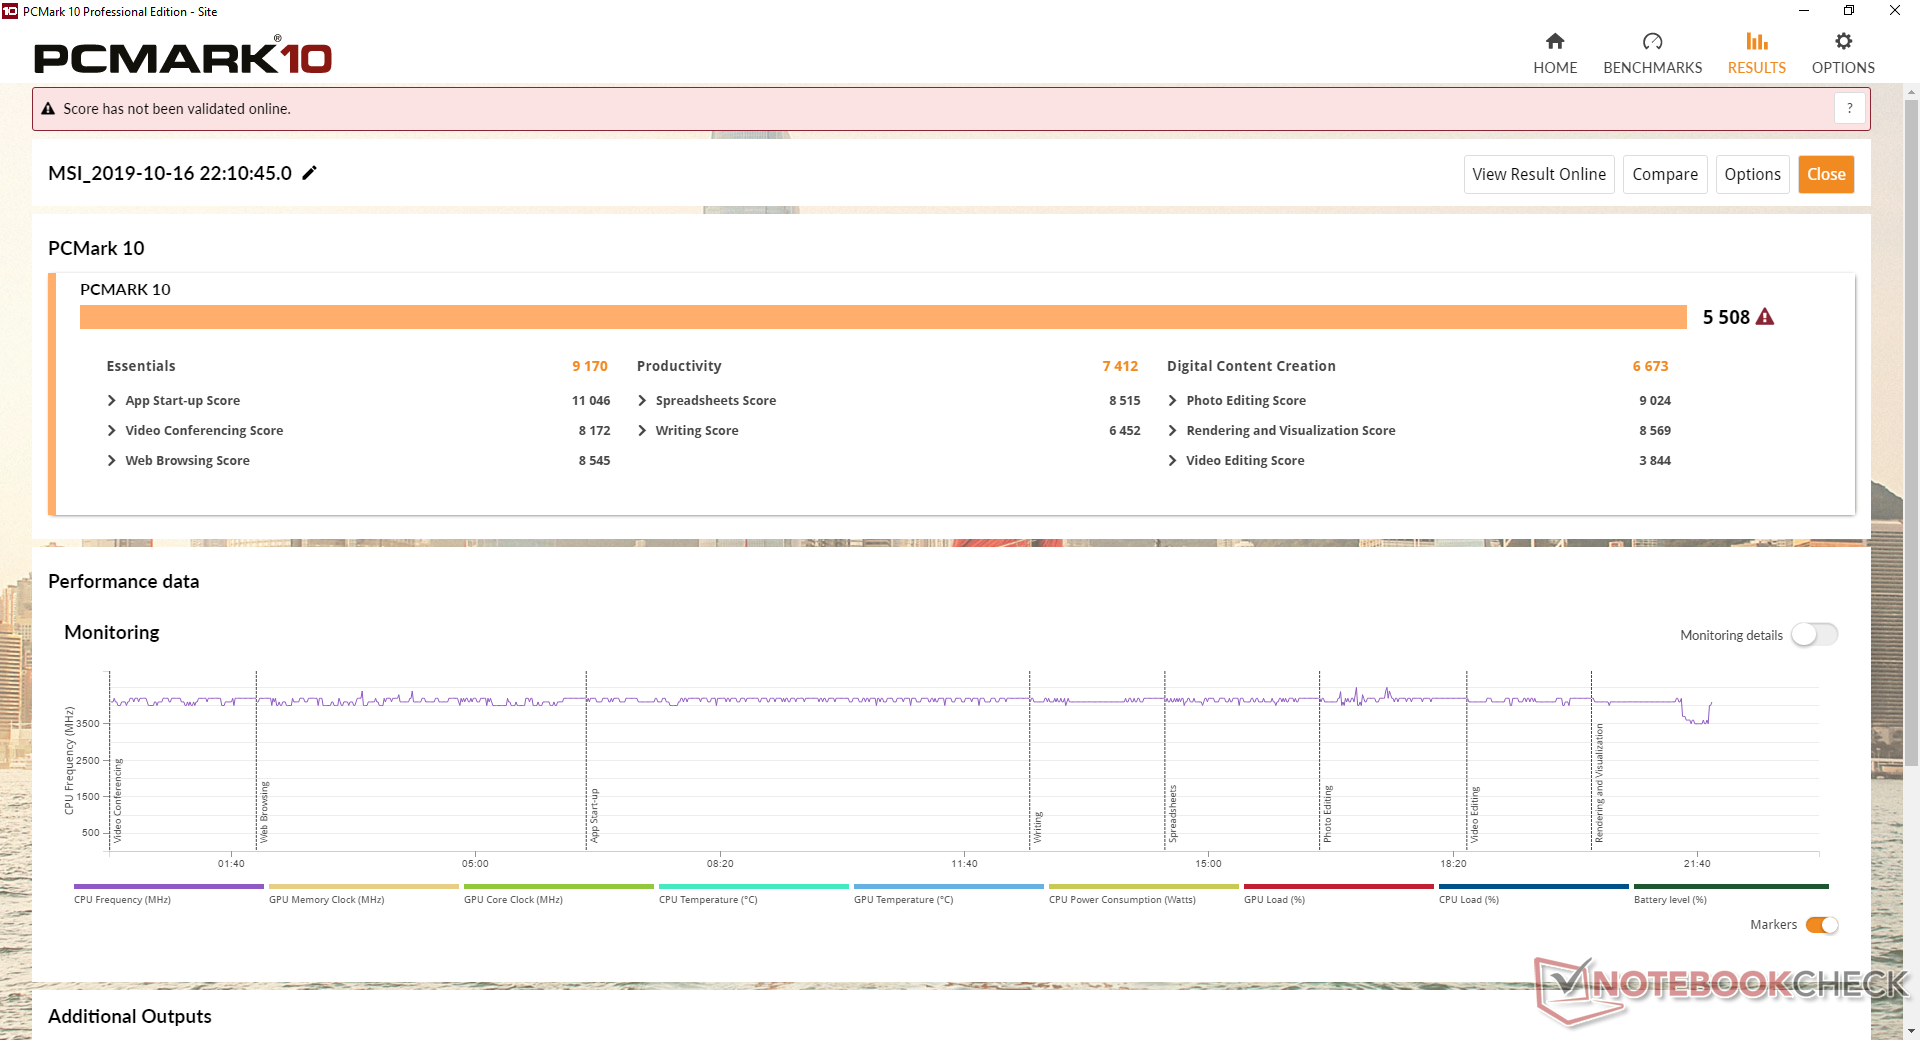
Sistem performansı
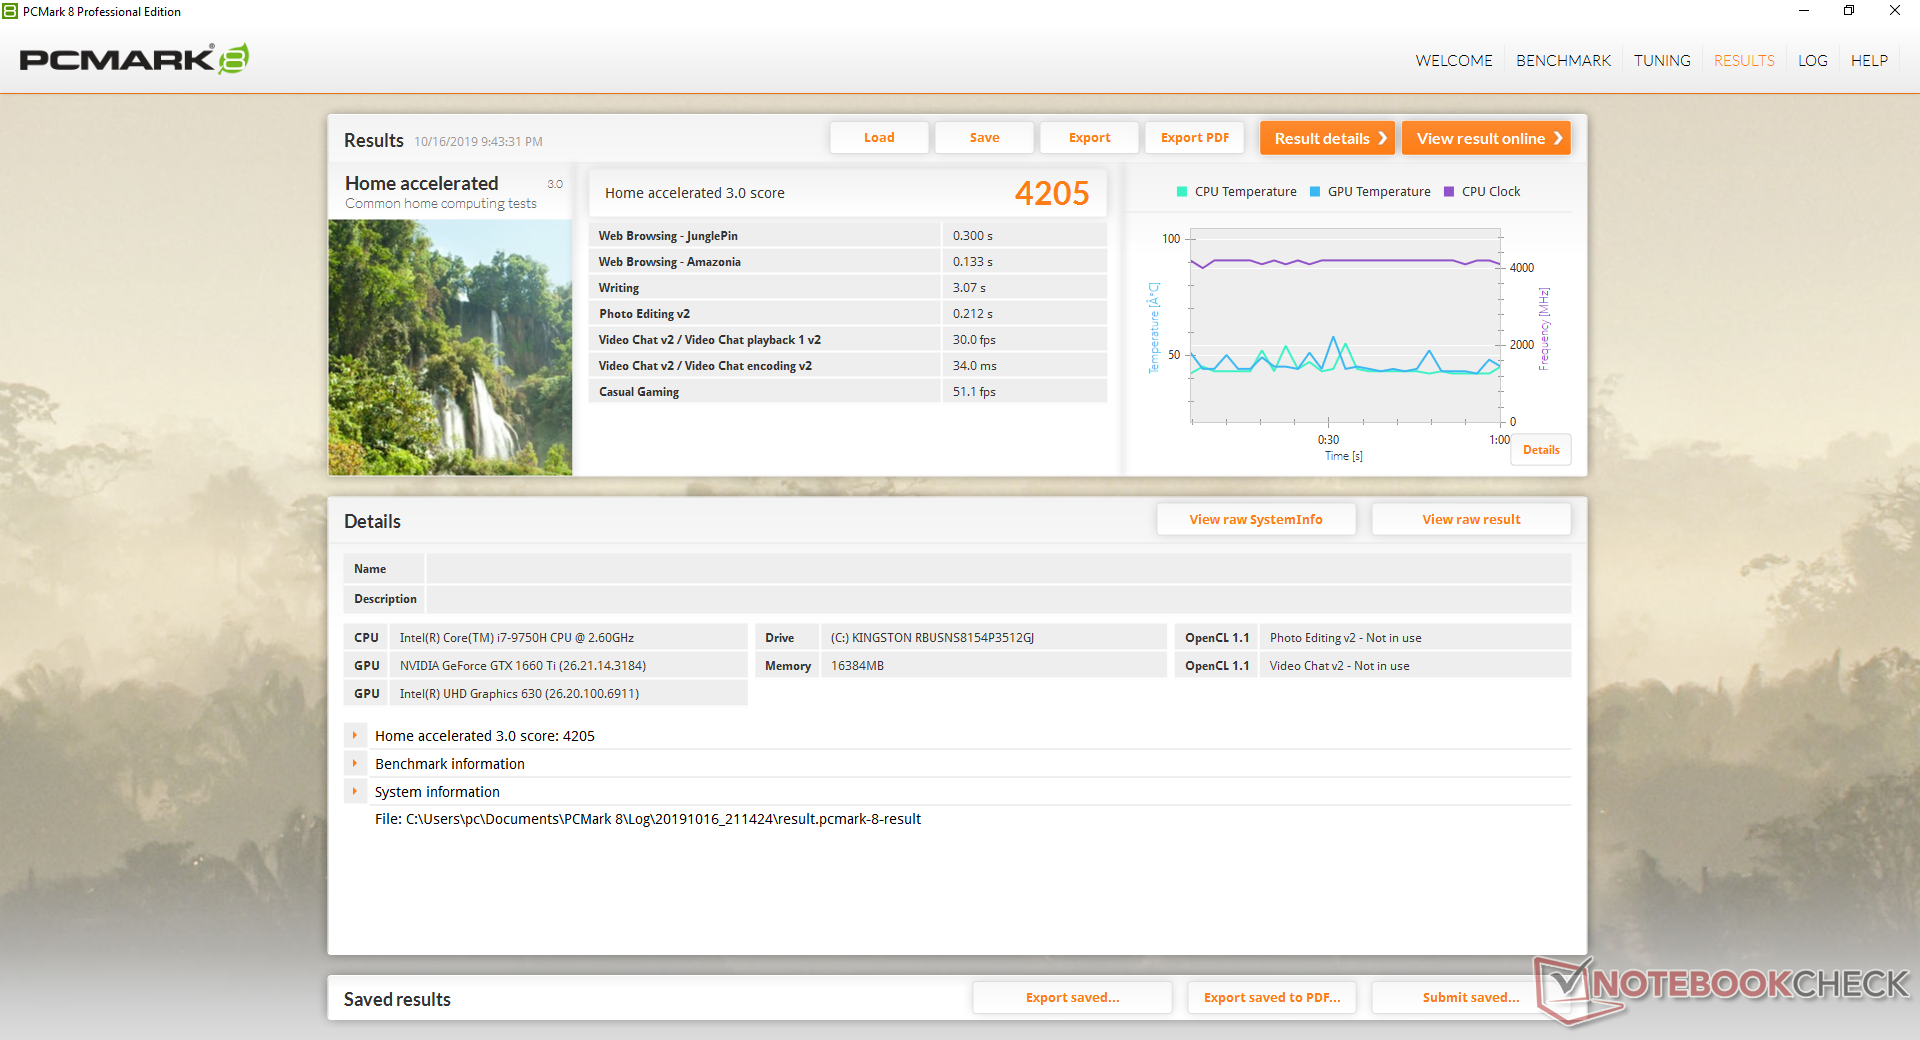
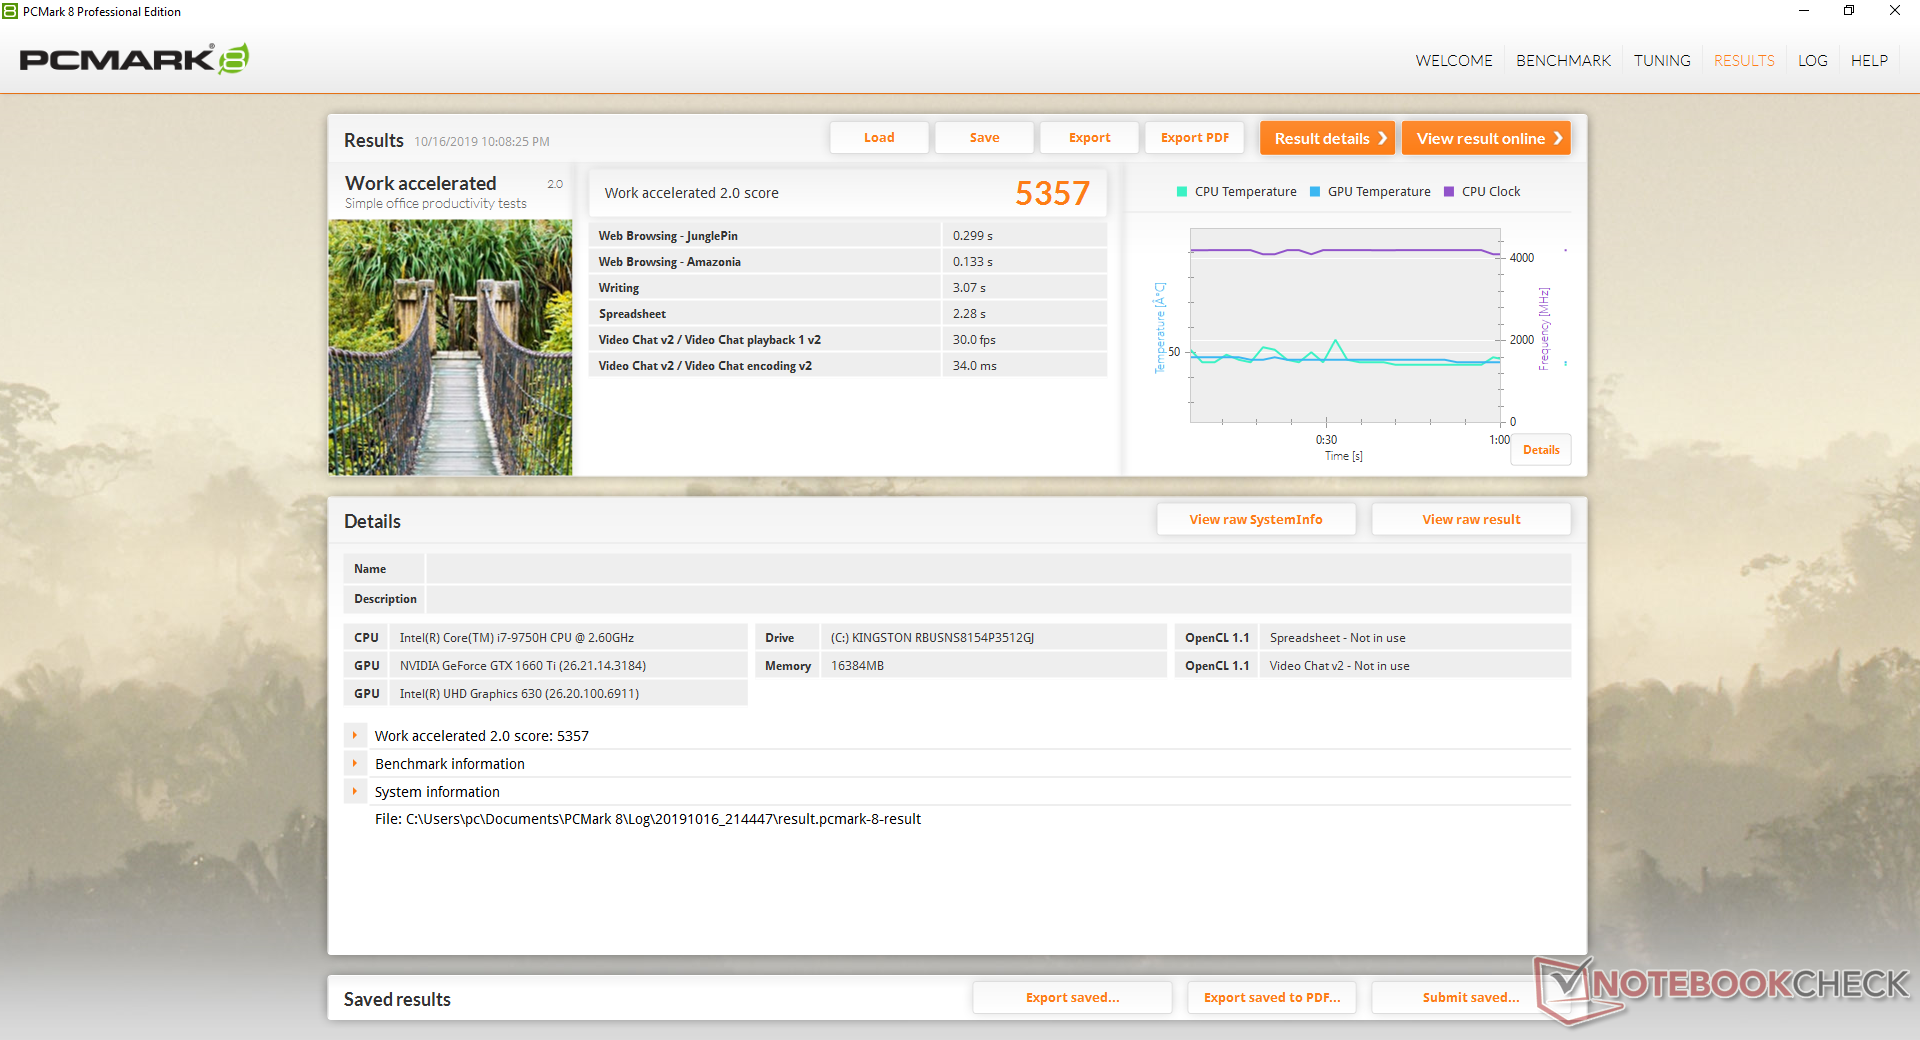
PCMark benchmarkları Dell G7 15 7590 ile neredeyse aynıdır ve daha yavaş Ryzen 5 3550H CPU ve GTX 1650 grafik kartıyla Asus TUF FX705'in sürekli önündedir. Daha eski olan MSI GF63, daha yavaş olan birincil HDD'sinden dolayı çok geride kaldı. Test ünitesi ile birlikte herhangi bir yazılım veya donanım sorunu yaşamadık. İlk açılışta normal Norton Anti-Virus ve MSI açılır pencerelerine hazır olun.
| PCMark 8 | |
| Home Score Accelerated v2 | |
| Aorus 15-SA | |
| Ortalama Intel Core i7-9750H, NVIDIA GeForce GTX 1660 Ti Mobile (4074 - 5217, n=11) | |
| Lenovo Legion Y540-15IRH-81SX00B2GE | |
| Dell G7 7590 | |
| MSI GF65 9SD | |
| Asus TUF FX505DT-EB73 | |
| MSI GF63 8RC | |
| Work Score Accelerated v2 | |
| Aorus 15-SA | |
| Dell G7 7590 | |
| Ortalama Intel Core i7-9750H, NVIDIA GeForce GTX 1660 Ti Mobile (5041 - 5913, n=12) | |
| MSI GF65 9SD | |
| Lenovo Legion Y540-15IRH-81SX00B2GE | |
| Asus TUF FX505DT-EB73 | |
| MSI GF63 8RC | |
| PCMark 8 Home Score Accelerated v2 | 4205 puan | |
| PCMark 8 Work Score Accelerated v2 | 5357 puan | |
| PCMark 10 Score | 5508 puan | |
Yardım | ||
Depolama aygıtları
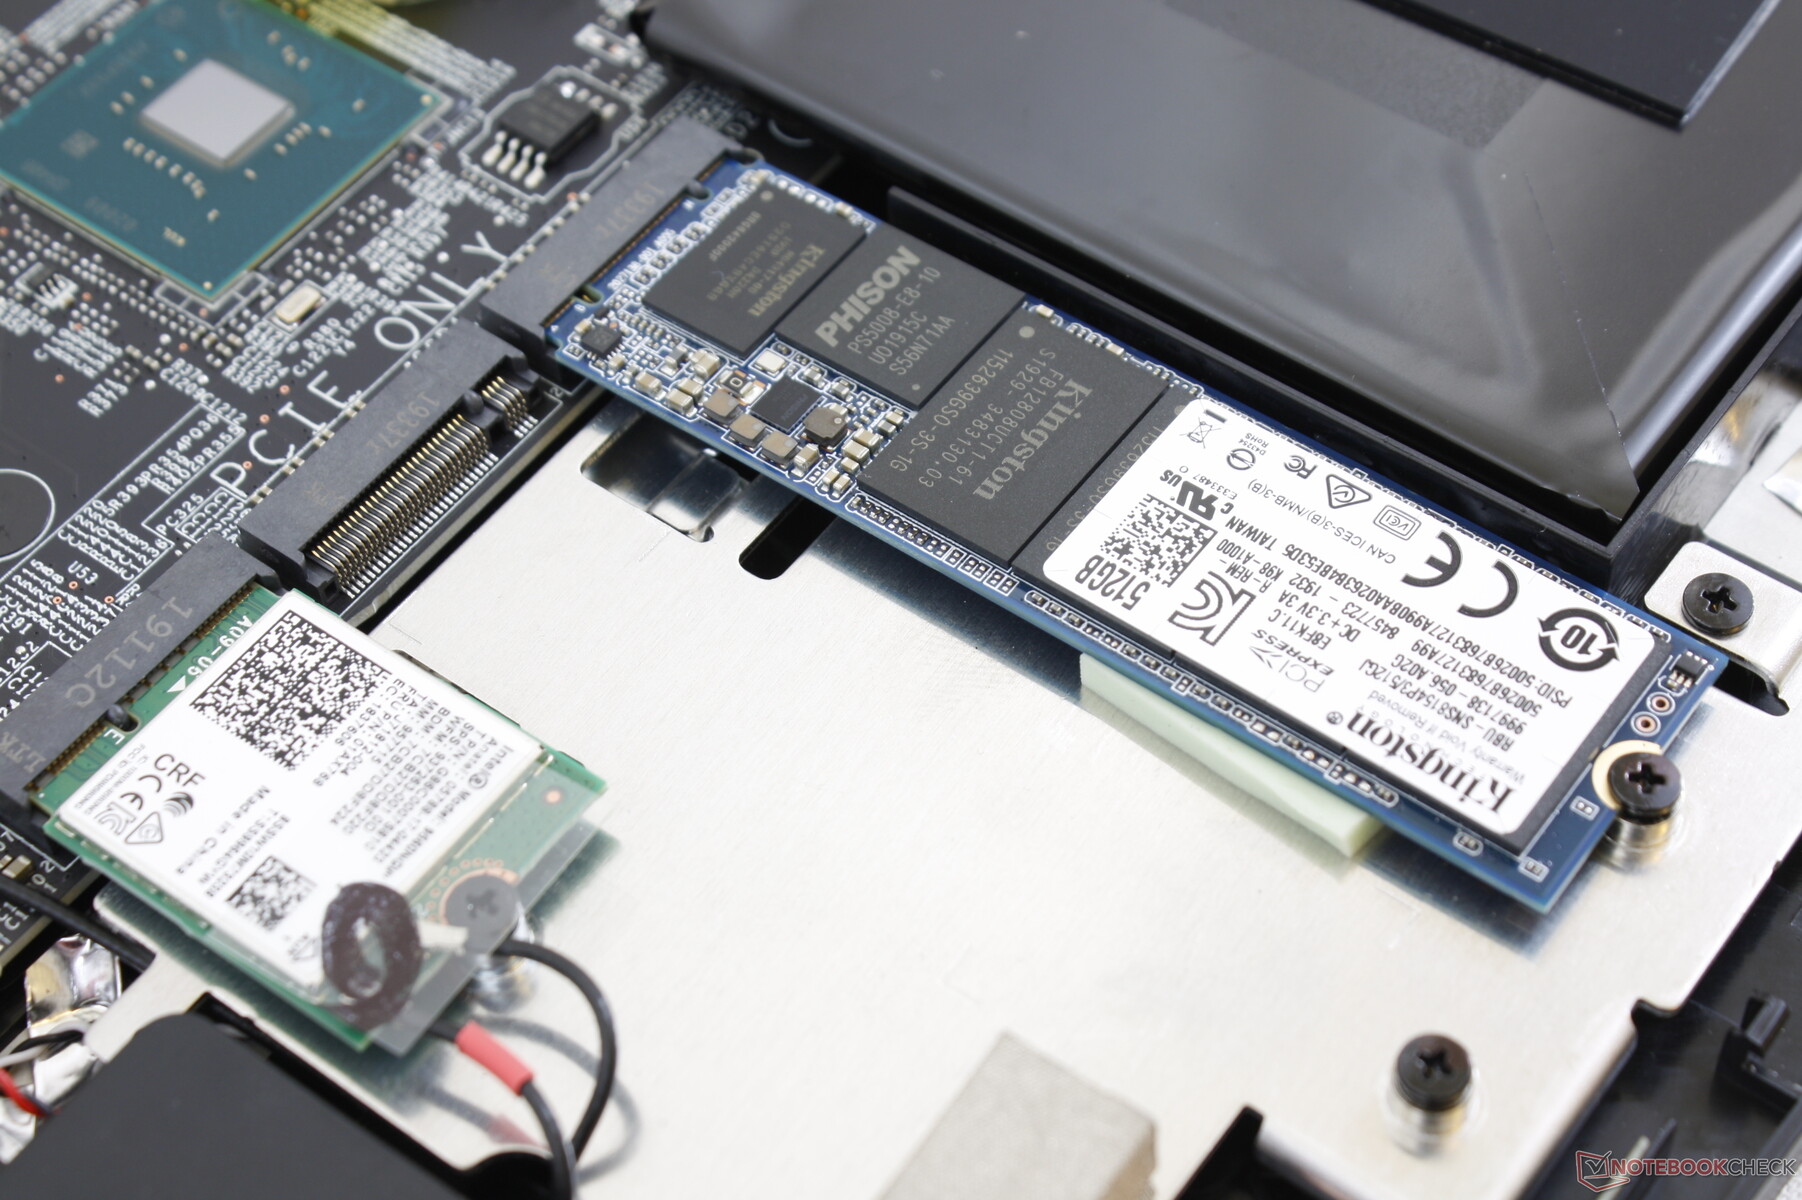
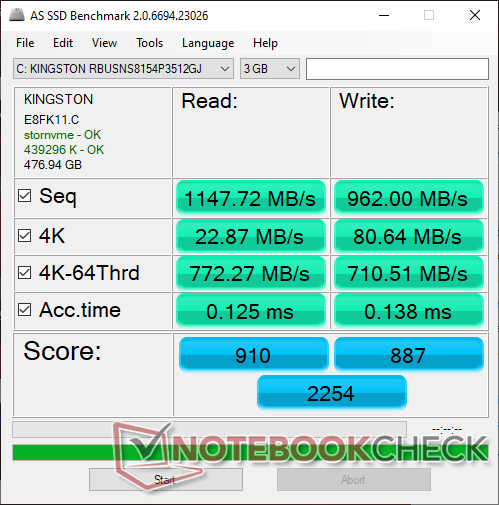
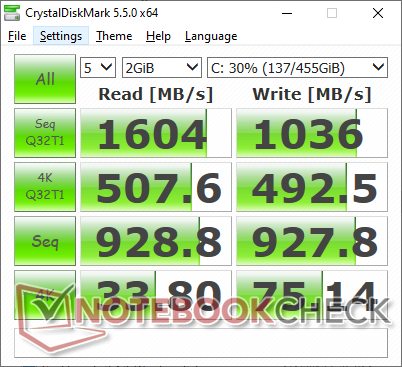
İki adet M.2 NVMe PCIe yuvası, 2,5 inç SATA III seçeneği olmadan kullanılabilir. Test ünitemizdeki 512 GB Kingston RBUSNS8154P3512GJ SSD, her biri yaklaşık 1000 MB / sn'lik sıralı okuma ve yazma oranlarına sahip bir bütçe NVMe sürücüsüdür. Samsung PM981 veya Intel 760p gibi Pricier NVMe sürücüleri sıralı okuma ve / veya yazma oranlarının iki katından fazlasını sunabilir. Sistemin, satıcıya bağlı olarak farklı SSD'ler ve dolayısıyla farklı depolama performansları ile geleceğini unutmayın.
| MSI GF65 9SD Kingston RBUSNS8154P3512GJ | Asus TUF FX505DT-EB73 Intel SSD 660p SSDPEKNW512G8 | Aorus 15-SA Intel SSD 760p SSDPEKKW512G8 | Dell G7 7590 Toshiba BG3 KBG30ZMS256G | Lenovo Legion Y540-15IRH-81SX00B2GE WDC PC SN720 SDAPNTW-512G | |
|---|---|---|---|---|---|
| AS SSD | 7% | 50% | -52% | 92% | |
| Seq Read (MB/s) | 1148 | 1019 -11% | 2601 127% | 1013 -12% | 2927 155% |
| Seq Write (MB/s) | 962 | 889 -8% | 1507 57% | 203.8 -79% | 2149 123% |
| 4K Read (MB/s) | 22.87 | 48.22 111% | 56.3 146% | 29.57 29% | 42.43 86% |
| 4K Write (MB/s) | 80.6 | 115.5 43% | 110.3 37% | 71.4 -11% | 147.1 83% |
| 4K-64 Read (MB/s) | 772 | 321.5 -58% | 877 14% | 332.1 -57% | 1286 67% |
| 4K-64 Write (MB/s) | 711 | 787 11% | 914 29% | 152.9 -78% | 1432 101% |
| Access Time Read * (ms) | 0.125 | 0.065 48% | 0.05 60% | 0.183 -46% | 0.065 48% |
| Access Time Write * (ms) | 0.138 | 0.047 66% | 0.034 75% | 0.248 -80% | 0.026 81% |
| Score Read (Points) | 910 | 472 -48% | 1193 31% | 463 -49% | 1621 78% |
| Score Write (Points) | 887 | 992 12% | 1175 32% | 245 -72% | 1794 102% |
| Score Total (Points) | 2254 | 1717 -24% | 2938 30% | 913 -59% | 4208 87% |
| Copy ISO MB/s (MB/s) | 1103 | 942 -15% | 2104 91% | 263.6 -76% | |
| Copy Program MB/s (MB/s) | 537 | 444.5 -17% | 387.7 -28% | 213.8 -60% | |
| Copy Game MB/s (MB/s) | 997 | 867 -13% | 1021 2% | 188 -81% |
* ... daha küçük daha iyidir

GPU Performansı
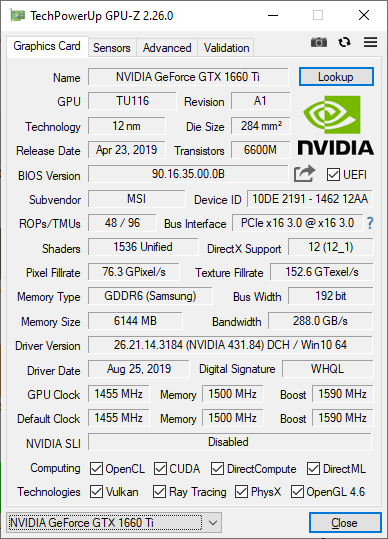
GeForce GTX 1660 Ti, veri tabanımızdaki ortalama GTX 1660 Ti'nin yüzde 1'i içerisinde olmasını beklediğimiz yerde çalışıyor. Masaüstü GTX 1660 Ti ile karşılaştırıldığında, mobil versiyonumuz sadece yüzde 2 ila 7 yavaştır. Genel performans, DLSS veya ışın izleme özelliklerini hariç tuttuğunuzda mobil RTX 2060'a çok yakındır. Daha fazla teknik bilgi ve kıyaslama karşılaştırması için mobil GTX 1660 Ti'deki özel sayfamıza bakın. Witcher 3'ü boşa vurmak, oyun sırasında kesintiye uğrayan herhangi bir arka plan aktivitesi ya da büyük boğulma sorunları olmadığını bildiren tekrarlayan bir çerçeve dalı göstermez.
| 3DMark | |
| 1280x720 Cloud Gate Standard Graphics | |
| MSI GT75VR 7RF-012 Titan Pro | |
| MSI GF65 9SD | |
| MSI GS63VR 7RG-005 | |
| Ortalama NVIDIA GeForce GTX 1660 Ti Mobile (59839 - 104780, n=18) | |
| Zotac GeForce GTX 1660 Ti 6 GB | |
| MSI GP72VR 7RFX | |
| MSI GL73 8SE-010US | |
| MSI GE75 8SF | |
| MSI GF75 Thin 9SC | |
| Asus TUF FX705GE-EW096T | |
| Asus ROG Zephyrus G15 GA502DU | |
| Asus FX504GD | |
| 1920x1080 Fire Strike Graphics | |
| MSI GT75VR 7RF-012 Titan Pro | |
| MSI GE75 8SF | |
| Zotac GeForce GTX 1660 Ti 6 GB | |
| MSI GL73 8SE-010US | |
| MSI GF65 9SD | |
| Ortalama NVIDIA GeForce GTX 1660 Ti Mobile (14186 - 16488, n=24) | |
| MSI GS63VR 7RG-005 | |
| Asus ROG Zephyrus G15 GA502DU | |
| MSI GP72VR 7RFX | |
| MSI GF75 Thin 9SC | |
| Asus TUF FX705GE-EW096T | |
| Asus FX504GD | |
| 2560x1440 Time Spy Graphics | |
| MSI GE75 8SF | |
| MSI GT75VR 7RF-012 Titan Pro | |
| Zotac GeForce GTX 1660 Ti 6 GB | |
| MSI GL73 8SE-010US | |
| MSI GF65 9SD | |
| Ortalama NVIDIA GeForce GTX 1660 Ti Mobile (5335 - 6123, n=22) | |
| Asus ROG Zephyrus G15 GA502DU | |
| MSI GS63VR 7RG-005 | |
| MSI GP72VR 7RFX | |
| MSI GF75 Thin 9SC | |
| Asus TUF FX705GE-EW096T | |
| Asus FX504GD | |
| 3DMark 11 | |
| 1280x720 Performance GPU | |
| MSI GT75VR 7RF-012 Titan Pro | |
| MSI GE75 8SF | |
| Zotac GeForce GTX 1660 Ti 6 GB | |
| MSI GF65 9SD | |
| MSI GL73 8SE-010US | |
| Ortalama NVIDIA GeForce GTX 1660 Ti Mobile (18610 - 22670, n=24) | |
| MSI GS63VR 7RG-005 | |
| Asus ROG Zephyrus G15 GA502DU | |
| MSI GP72VR 7RFX | |
| MSI GF75 Thin 9SC | |
| Asus TUF FX705GE-EW096T | |
| Asus FX504GD | |
| 1280x720 Performance Combined | |
| Zotac GeForce GTX 1660 Ti 6 GB | |
| MSI GF65 9SD | |
| Ortalama NVIDIA GeForce GTX 1660 Ti Mobile (9500 - 13311, n=23) | |
| MSI GF75 Thin 9SC | |
| MSI GT75VR 7RF-012 Titan Pro | |
| MSI GL73 8SE-010US | |
| MSI GE75 8SF | |
| Asus TUF FX705GE-EW096T | |
| MSI GS63VR 7RG-005 | |
| MSI GP72VR 7RFX | |
| Asus FX504GD | |
| Asus ROG Zephyrus G15 GA502DU | |
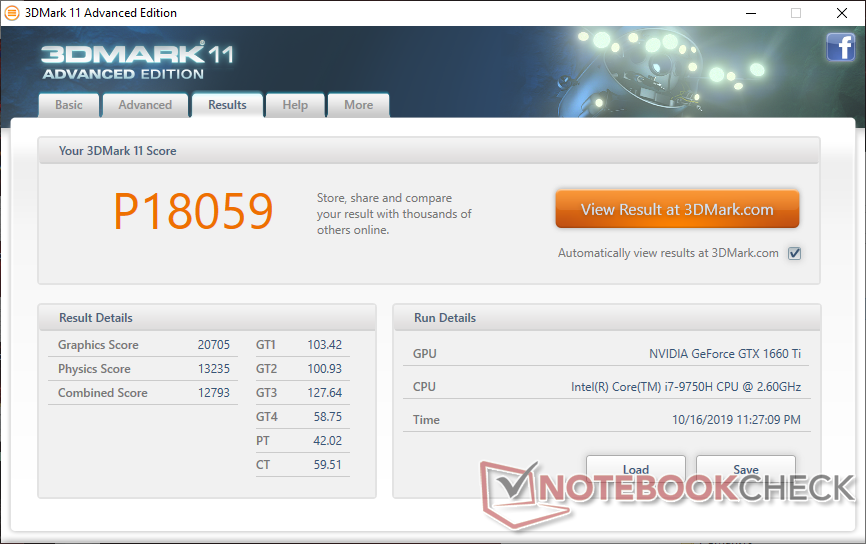
| 3DMark 11 Performance | 18059 puan | |
| 3DMark Cloud Gate Standard Score | 36975 puan | |
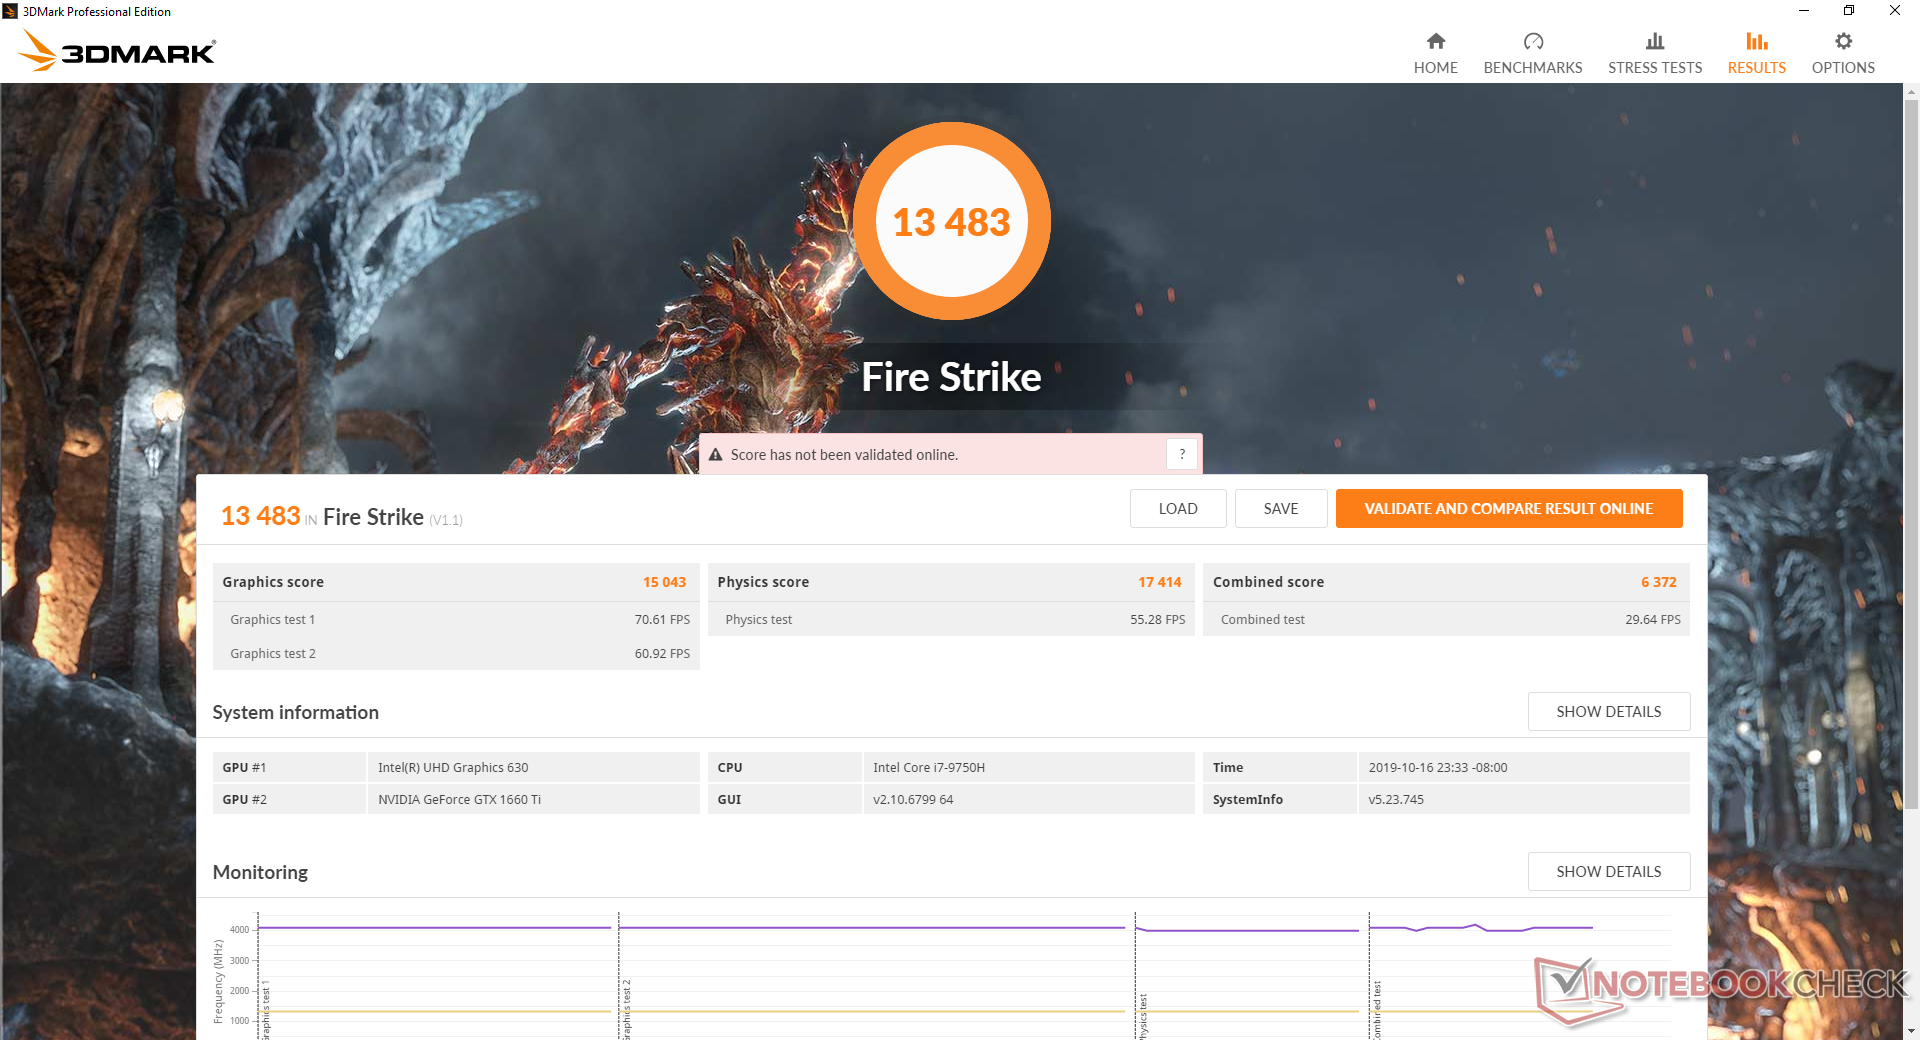
| 3DMark Fire Strike Score | 13483 puan | |
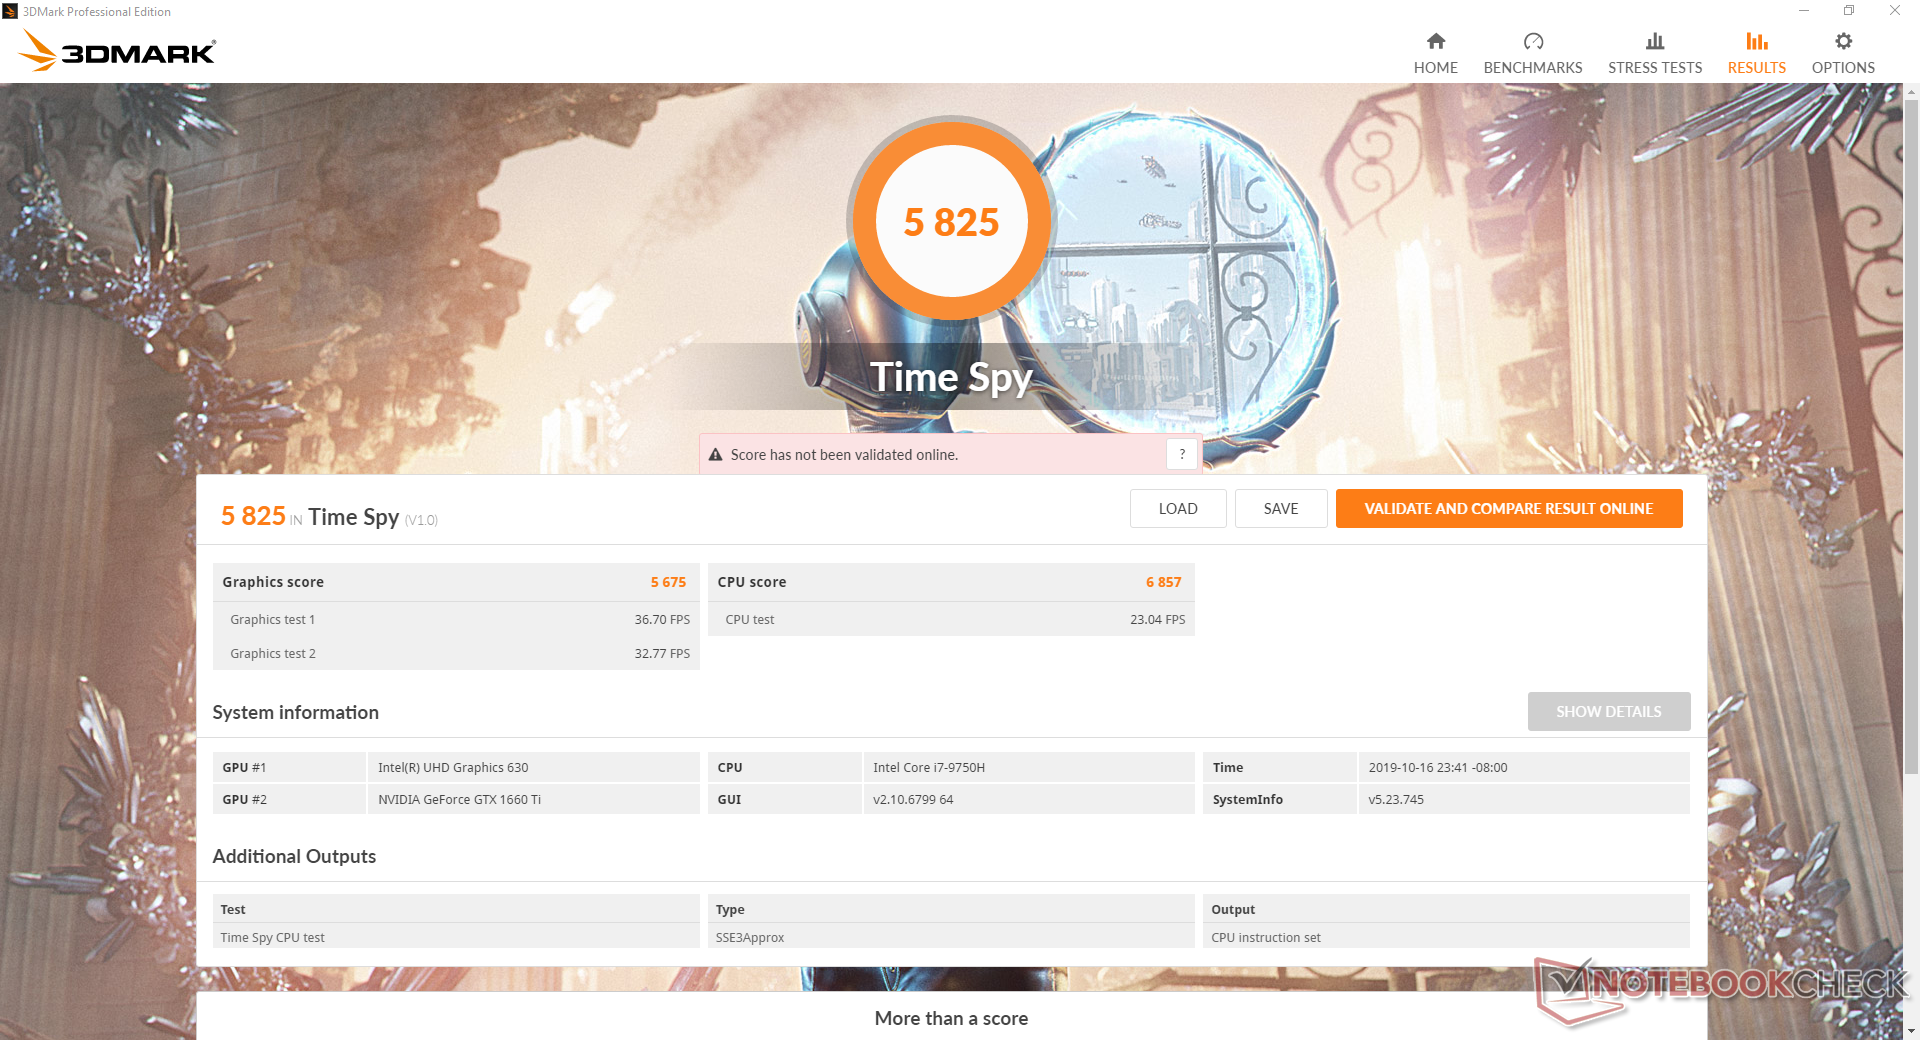
| 3DMark Time Spy Score | 5825 puan | |
Yardım | ||
| The Witcher 3 - 1920x1080 Ultra Graphics & Postprocessing (HBAO+) | |
| MSI GT76 Titan DT 9SG | |
| MSI P65 Creator 9SF-657 | |
| MSI GT75VR 7RF-012 Titan Pro | |
| MSI GE75 8SF | |
| Dell G7 7590 | |
| Zotac GeForce GTX 1660 Ti 6 GB | |
| MSI GF65 9SD | |
| Ortalama NVIDIA GeForce GTX 1660 Ti Mobile (51.6 - 65.1, n=21) | |
| MSI GL73 8SE-010US | |
| Lenovo Legion Y540-15IRH-81SX00B2GE | |
| MSI GS63VR 7RG-005 | |
| Asus ROG Zephyrus G15 GA502DU | |
| MSI GF75 8RD-001 | |
| MSI GF62VR 7RF-877 | |
| MSI GF75 Thin 9SC | |
| MSI GF63 8RC | |
| Dell XPS 13 7390 2-in-1 Core i7 | |
| Shadow of the Tomb Raider - 1920x1080 Highest Preset AA:T | |
| Zotac GeForce GTX 1660 Ti 6 GB | |
| Dell G7 7590 | |
| Ortalama NVIDIA GeForce GTX 1660 Ti Mobile (62 - 73, n=8) | |
| MSI GL73 8SE-010US | |
| MSI GF65 9SD | |
| Asus ROG Zephyrus G15 GA502DU | |
| MSI GF75 Thin 9SC | |
| düşük | orta | yüksek | ultra | |
|---|---|---|---|---|
| BioShock Infinite (2013) | 317.1 | 264 | 250.9 | 128.6 |
| The Witcher 3 (2015) | 287.9 | 191.6 | 116 | 60.6 |
| Shadow of the Tomb Raider (2018) | 135 | 81 | 72 | 64 |
Emisyonları
Sistem Gürültüsü
GTX 1660 Ti, GTX 1050'den daha zorlu olduğundan MSI, GF63 ile karşılaştırıldığında daha fazla ısı borusu ve ilave bir fan içerecek şekilde soğutma çözümünü yükseltti. Fan gürültüsü, 28.7 dB (A) arka plana karşı 33 dB (A) seviyesinin hemen hemen üzerinde Enerji Tasarrufu ayarlanmış olsa bile, her zaman mevcuttur. Neyse ki, fanlar göz kamaştırırken veya sinir bozucu olurken akışını etkilemiyor. Oyun oynarken, fan gürültüsü daha az güçlü GF63'ten belirgin şekilde daha yüksek sesle olmak üzere 49.5 dB (A) 'ya yükseliyor. Soğutucu Artırma modunun (yani, Maksimum fan modu) etkinleştirilmesi fan sesini sabit bir 59.5 dB (A) ile çarpacaktır.

| MSI GF65 9SD GeForce GTX 1660 Ti Mobile, i7-9750H, Kingston RBUSNS8154P3512GJ | MSI GF63 8RC GeForce GTX 1050 Mobile, i5-8300H, Seagate BarraCuda Pro Compute 1TB ST1000LM049 | Lenovo Legion Y540-15IRH-81SX00B2GE GeForce GTX 1660 Ti Mobile, i7-9750H, WDC PC SN720 SDAPNTW-512G | Dell G7 7590 GeForce RTX 2060 Mobile, i7-9750H, Toshiba BG3 KBG30ZMS256G | Aorus 15-SA GeForce GTX 1660 Ti Mobile, i7-9750H, Intel SSD 760p SSDPEKKW512G8 | Asus ROG Zephyrus G15 GA502DU GeForce GTX 1660 Ti Max-Q, R7 3750H, Intel SSD 660p SSDPEKNW512G8 | |
|---|---|---|---|---|---|---|
| Noise | 6% | 12% | 5% | -7% | 3% | |
| kapalı / ortam * (dB) | 28.7 | 28 2% | 29.3 -2% | 28.4 1% | 29 -1% | 28 2% |
| Idle Minimum * (dB) | 33.3 | 33.8 -2% | 29.3 12% | 29.5 11% | 32 4% | 29.4 12% |
| Idle Average * (dB) | 33.9 | 34 -0% | 29.3 14% | 29.6 13% | 35 -3% | 31.9 6% |
| Idle Maximum * (dB) | 33.9 | 34.2 -1% | 29.3 14% | 29.6 13% | 41 -21% | 33 3% |
| Load Average * (dB) | 41 | 37.3 9% | 35.7 13% | 45 -10% | 54 -32% | 41.2 -0% |
| Witcher 3 ultra * (dB) | 49.5 | 43.4 12% | 44.2 11% | 51.5 -4% | 52 -5% | 53.8 -9% |
| Load Maximum * (dB) | 59.5 | 46 23% | 45.6 23% | 53 11% | 56 6% | 55.7 6% |
* ... daha küçük daha iyidir
Ses yüksekliği
| Boşta |
| 33.3 / 33.9 / 33.9 dB |
| Çalışırken |
| 41 / 59.5 dB |
 | ||
30 dB sessiz 40 dB(A) duyulabilirlik 50 dB(A) gürültülü |
||
min: | ||
Sıcaklık
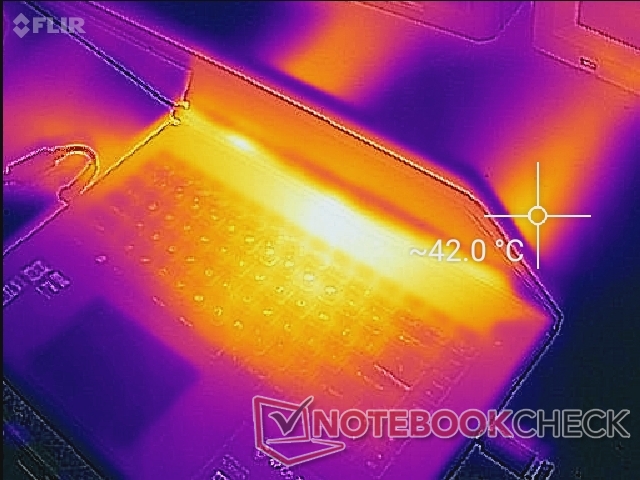
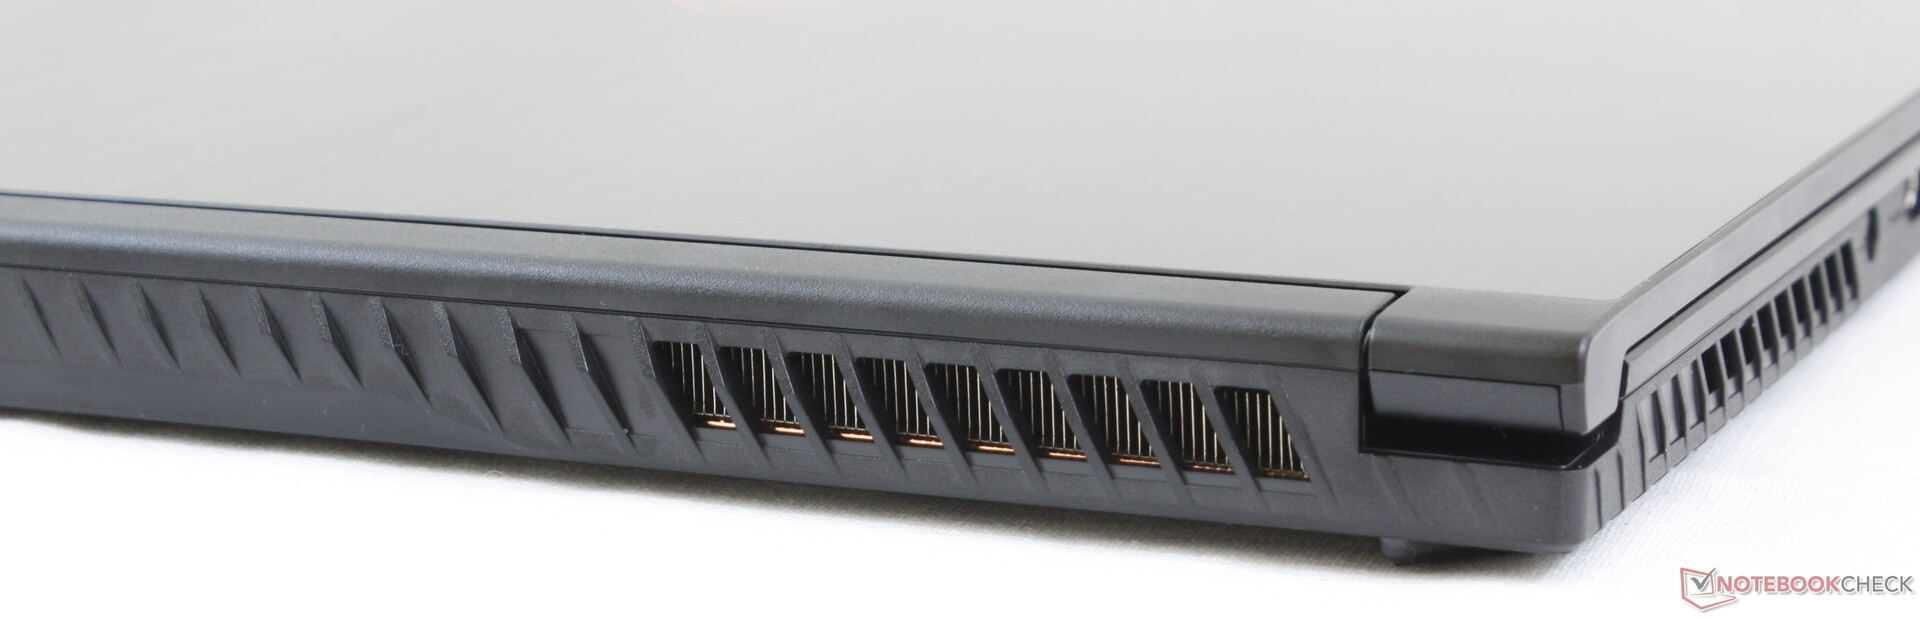
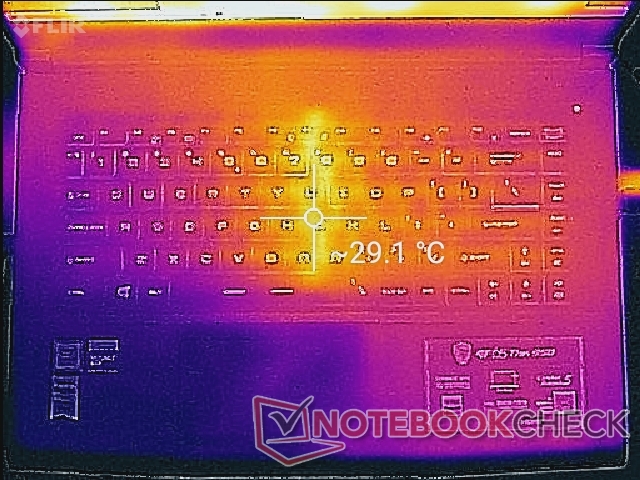
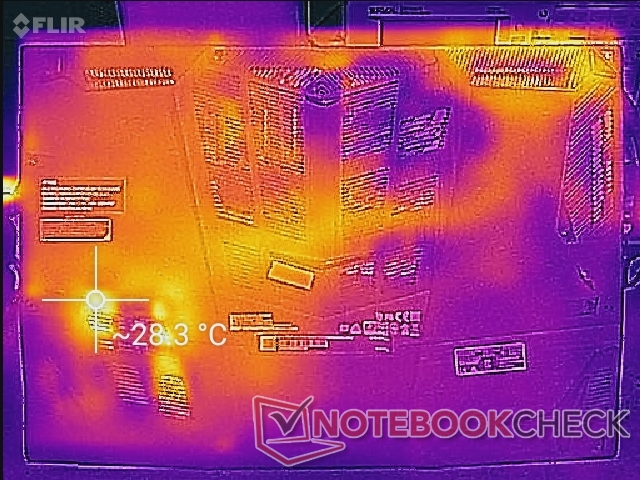
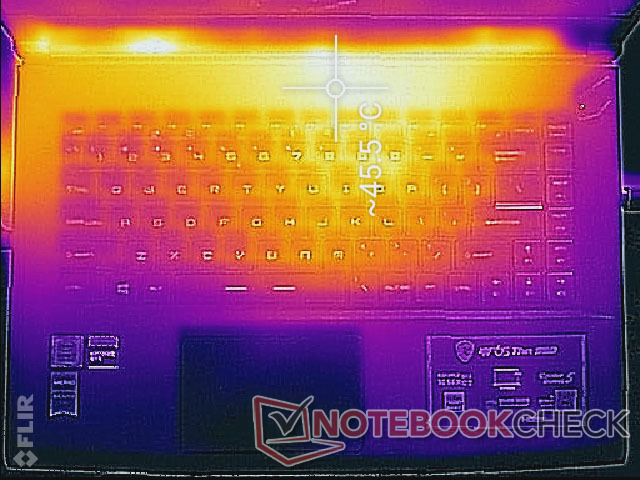
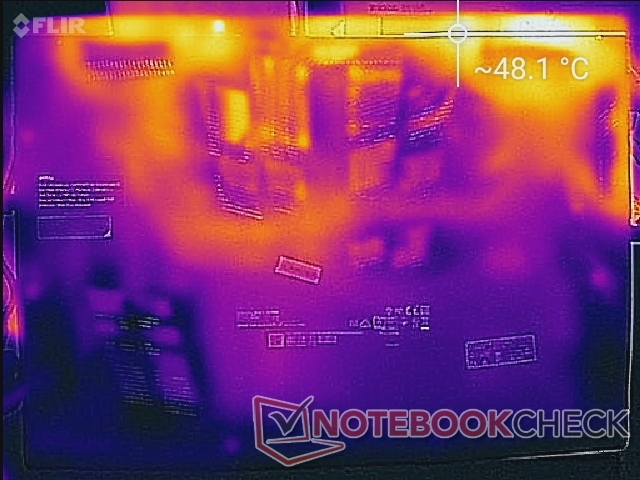
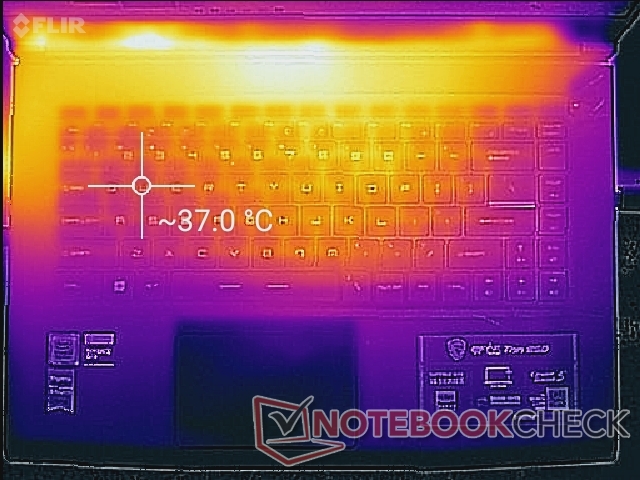
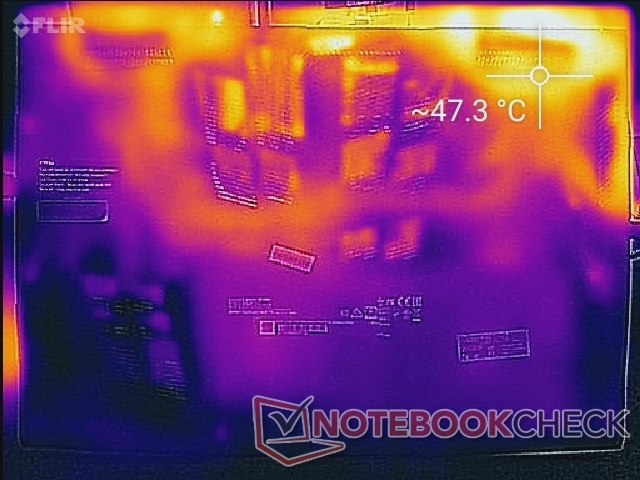
Ortalama 30 C'nin altında rölantide iken yüzey sıcaklıkları, klavye merkezi aşağıdaki sıcaklık haritalarında gösterildiği gibi yaklaşık 29 C'de en sıcak olanıdır. Oyun oynarken, etkin nokta, parmakların dokunma ihtimalinin düşük olduğu klavye tuşlarının üst sırasına geçer. WASD anahtarları 37 C kadar sıcak olabilir, avuç içi yükü ne olursa olsun soğuk kalır. Alt panel bakır ısı borularını açığa çıkaran çok sayıda ızgaraya sahiptir. Bu nedenle, bu alanlar yüksek işlem yükleri altındayken çok ısınabilir ve bu nedenle bu açıklıkları engellememek önemlidir.
(-) Üst taraftaki maksimum sıcaklık, 40.4 °C / 105 F ortalamasına kıyasla 52.8 °C / 127 F'dir. , Gaming sınıfı için 21.2 ile 68.8 °C arasında değişir.
(-) Alt kısım, 43.2 °C / 110 F ortalamasına kıyasla maksimum 53 °C / 127 F'ye kadar ısınır
(+) Boşta kullanımda, üst tarafın ortalama sıcaklığı 26.5 °C / 80 F olup, cihazın 33.9 °C / 93 F.
(±) The Witcher 3 oynarken, üst tarafın ortalama sıcaklığı 33.4 °C / 92 F olup, cihazın 33.9 °C / 93 F.
(+) Avuç içi dayanakları ve dokunmatik yüzey, maksimum 26.2 °C / 79.2 F ile cilt sıcaklığından daha soğuktur ve bu nedenle dokunulduğunda soğuktur.
(+) Benzer cihazların avuç içi dayanağı alanının ortalama sıcaklığı 28.8 °C / 83.8 F (+2.6 °C / 4.6 F) idi.
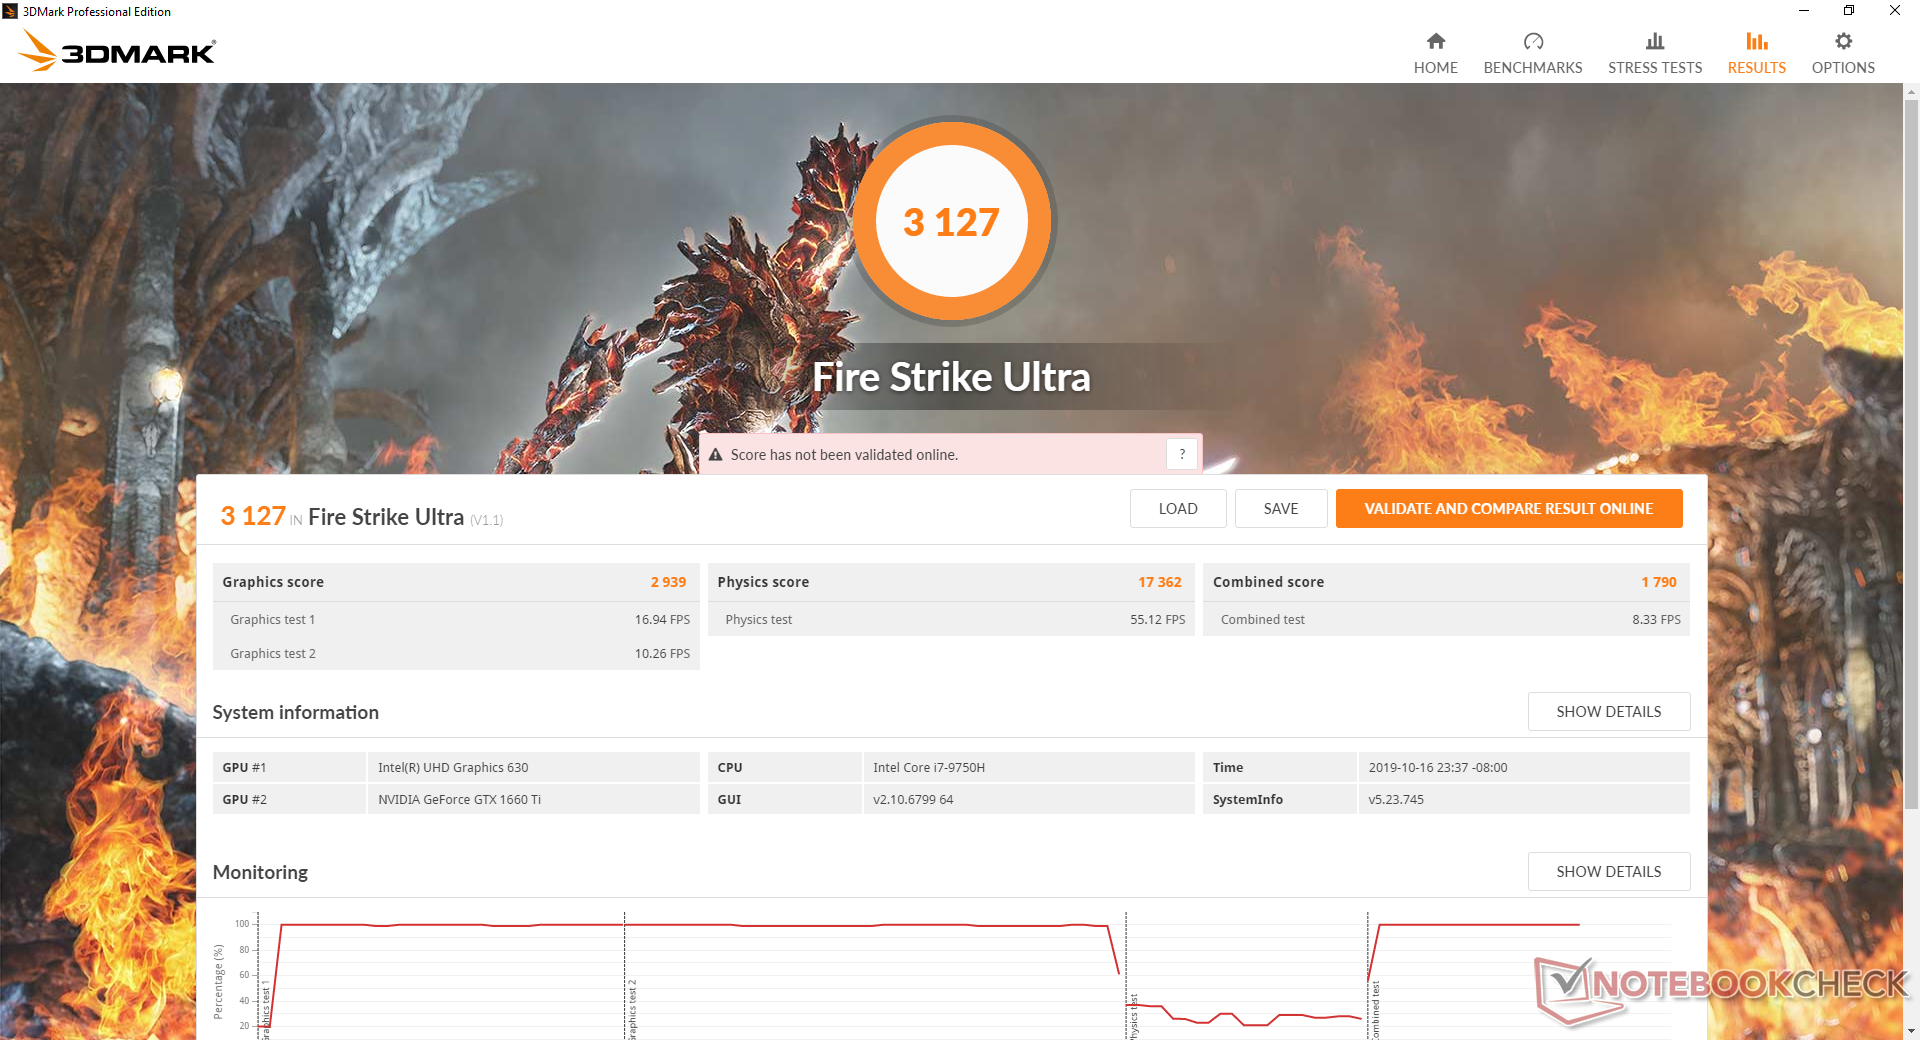
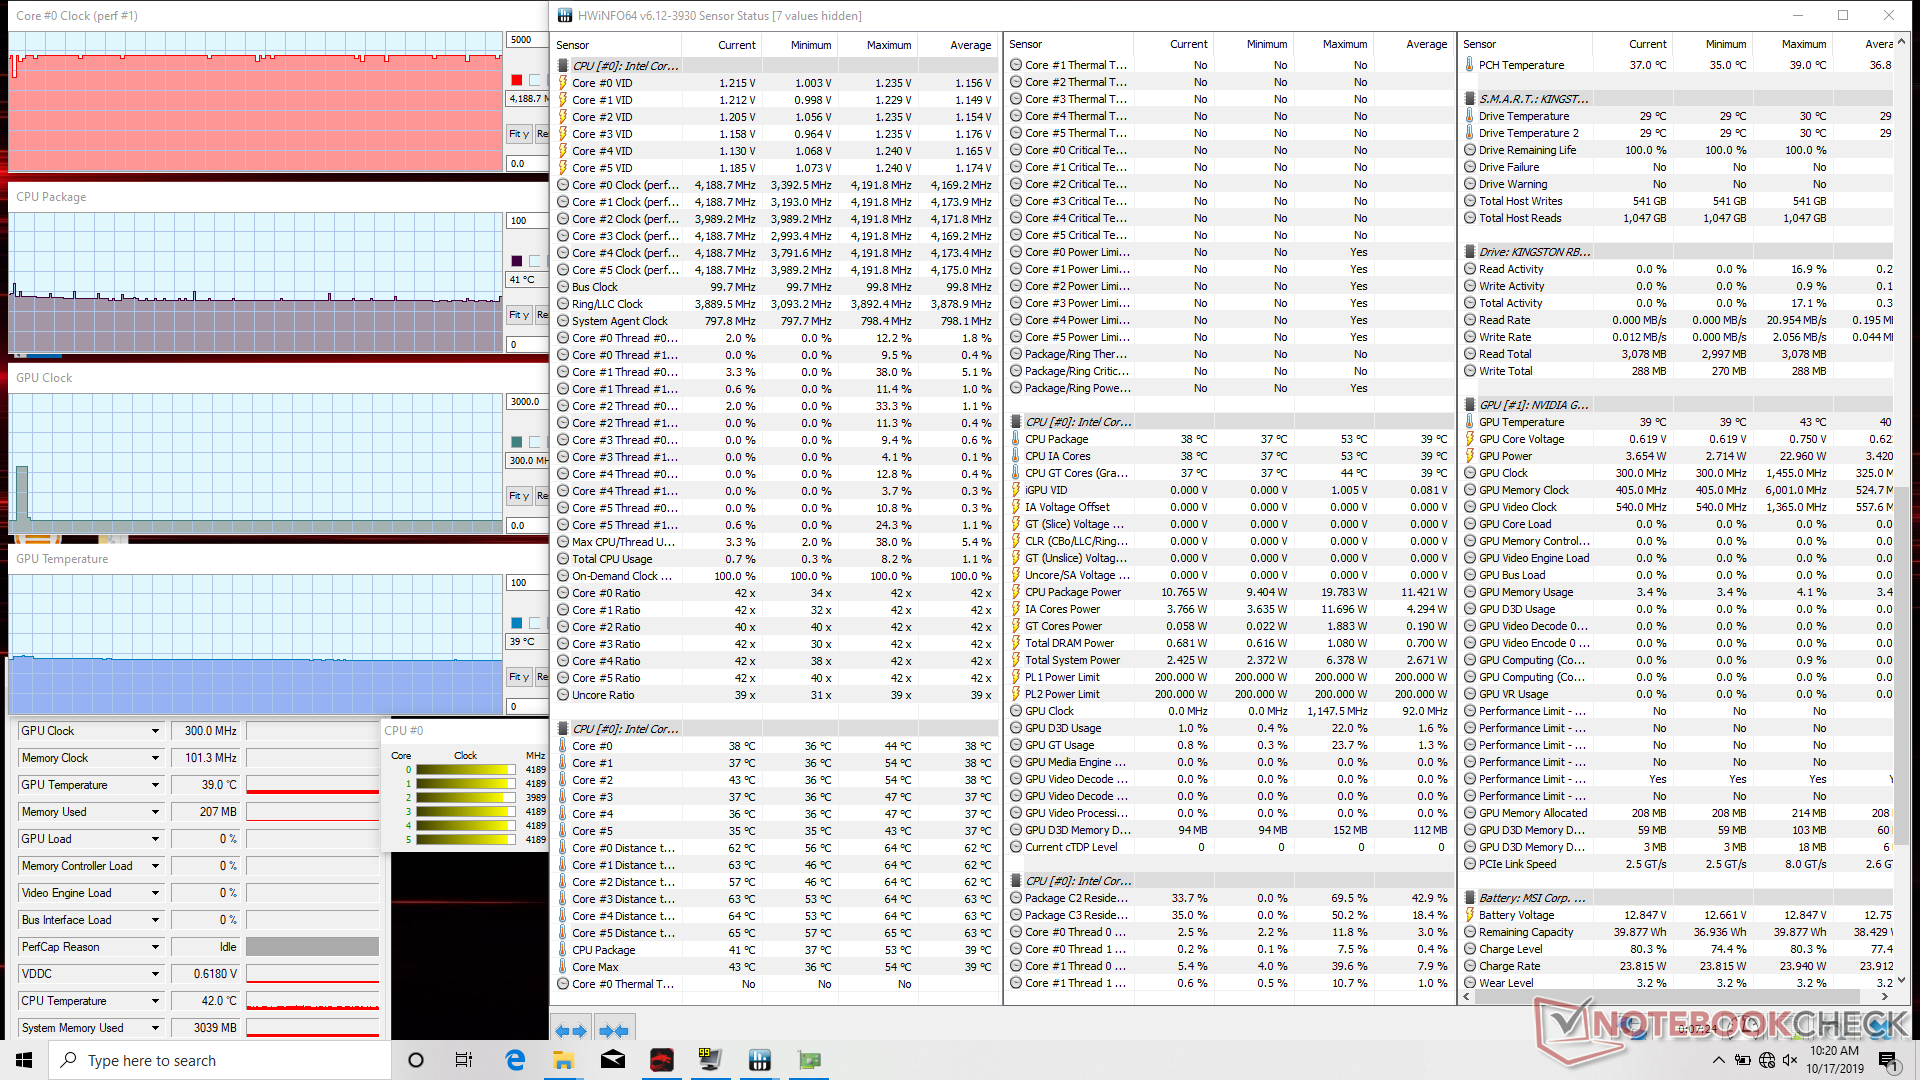
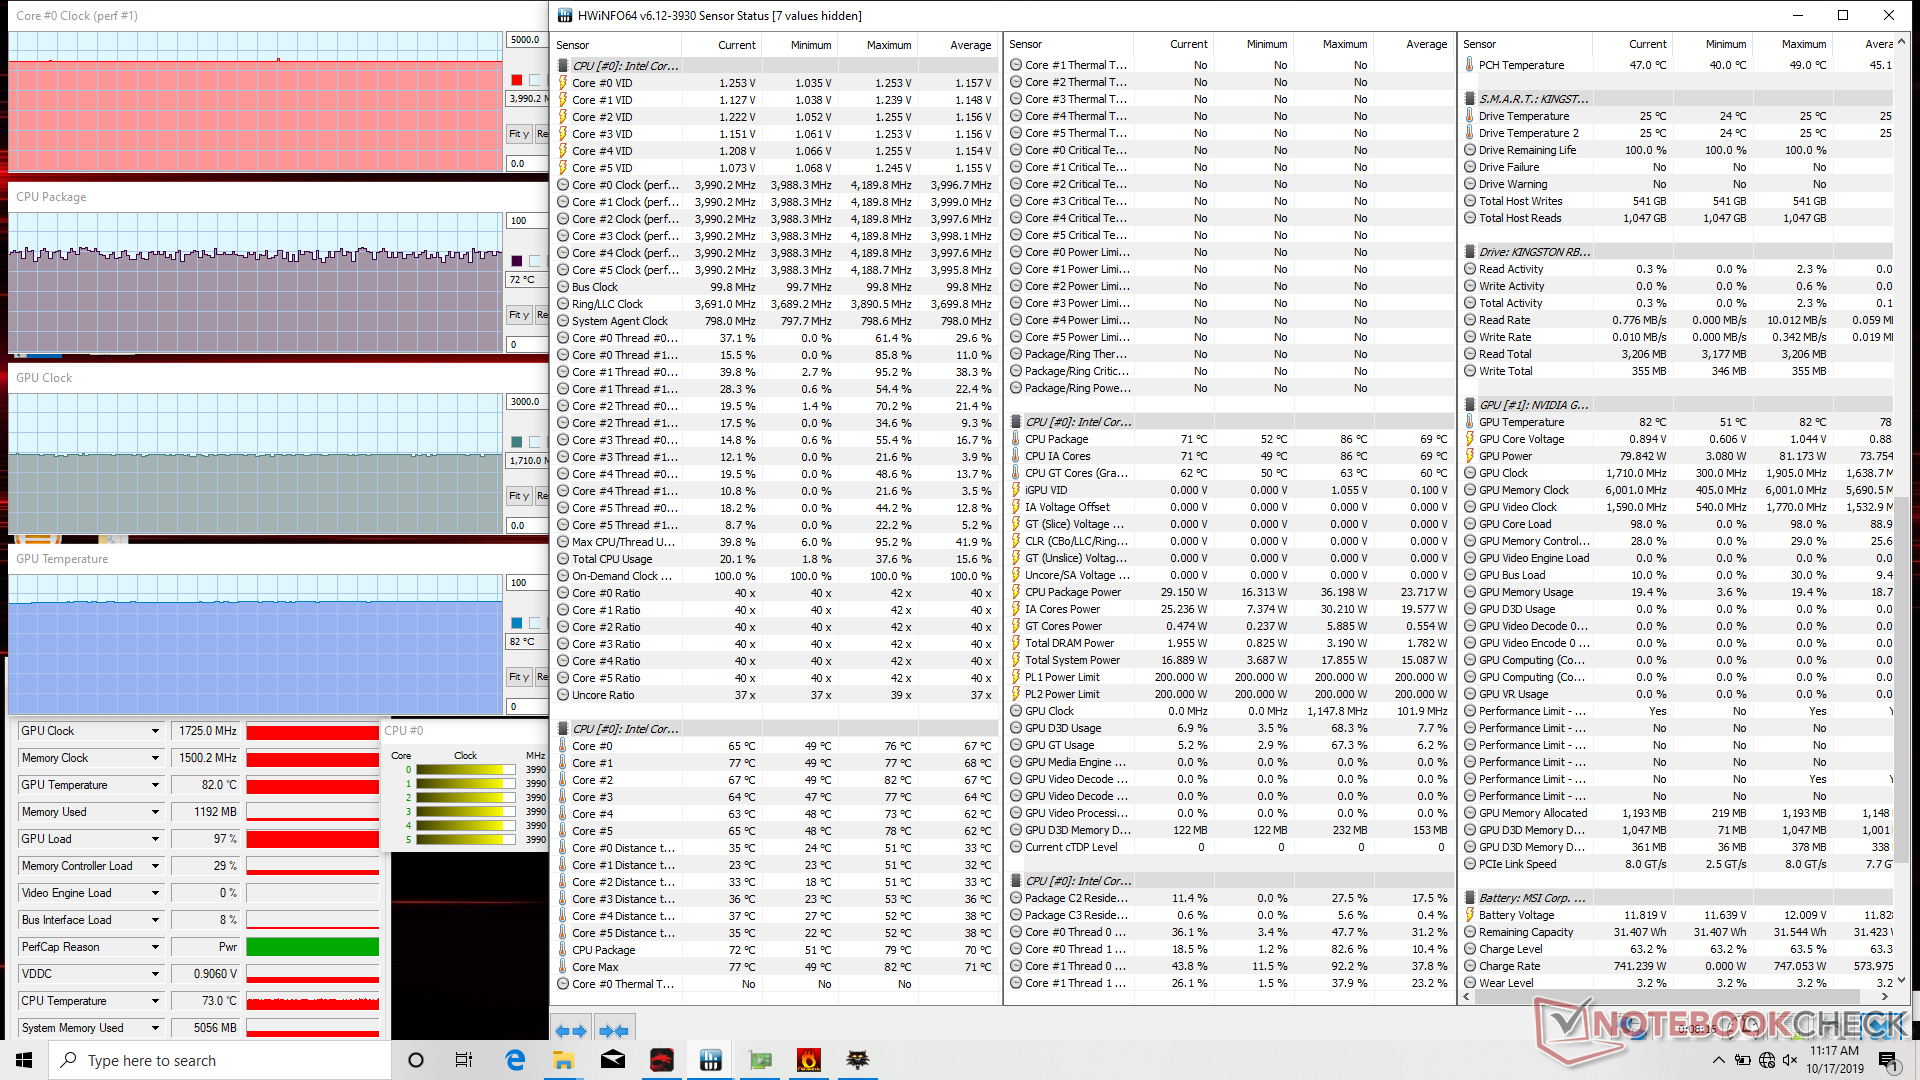
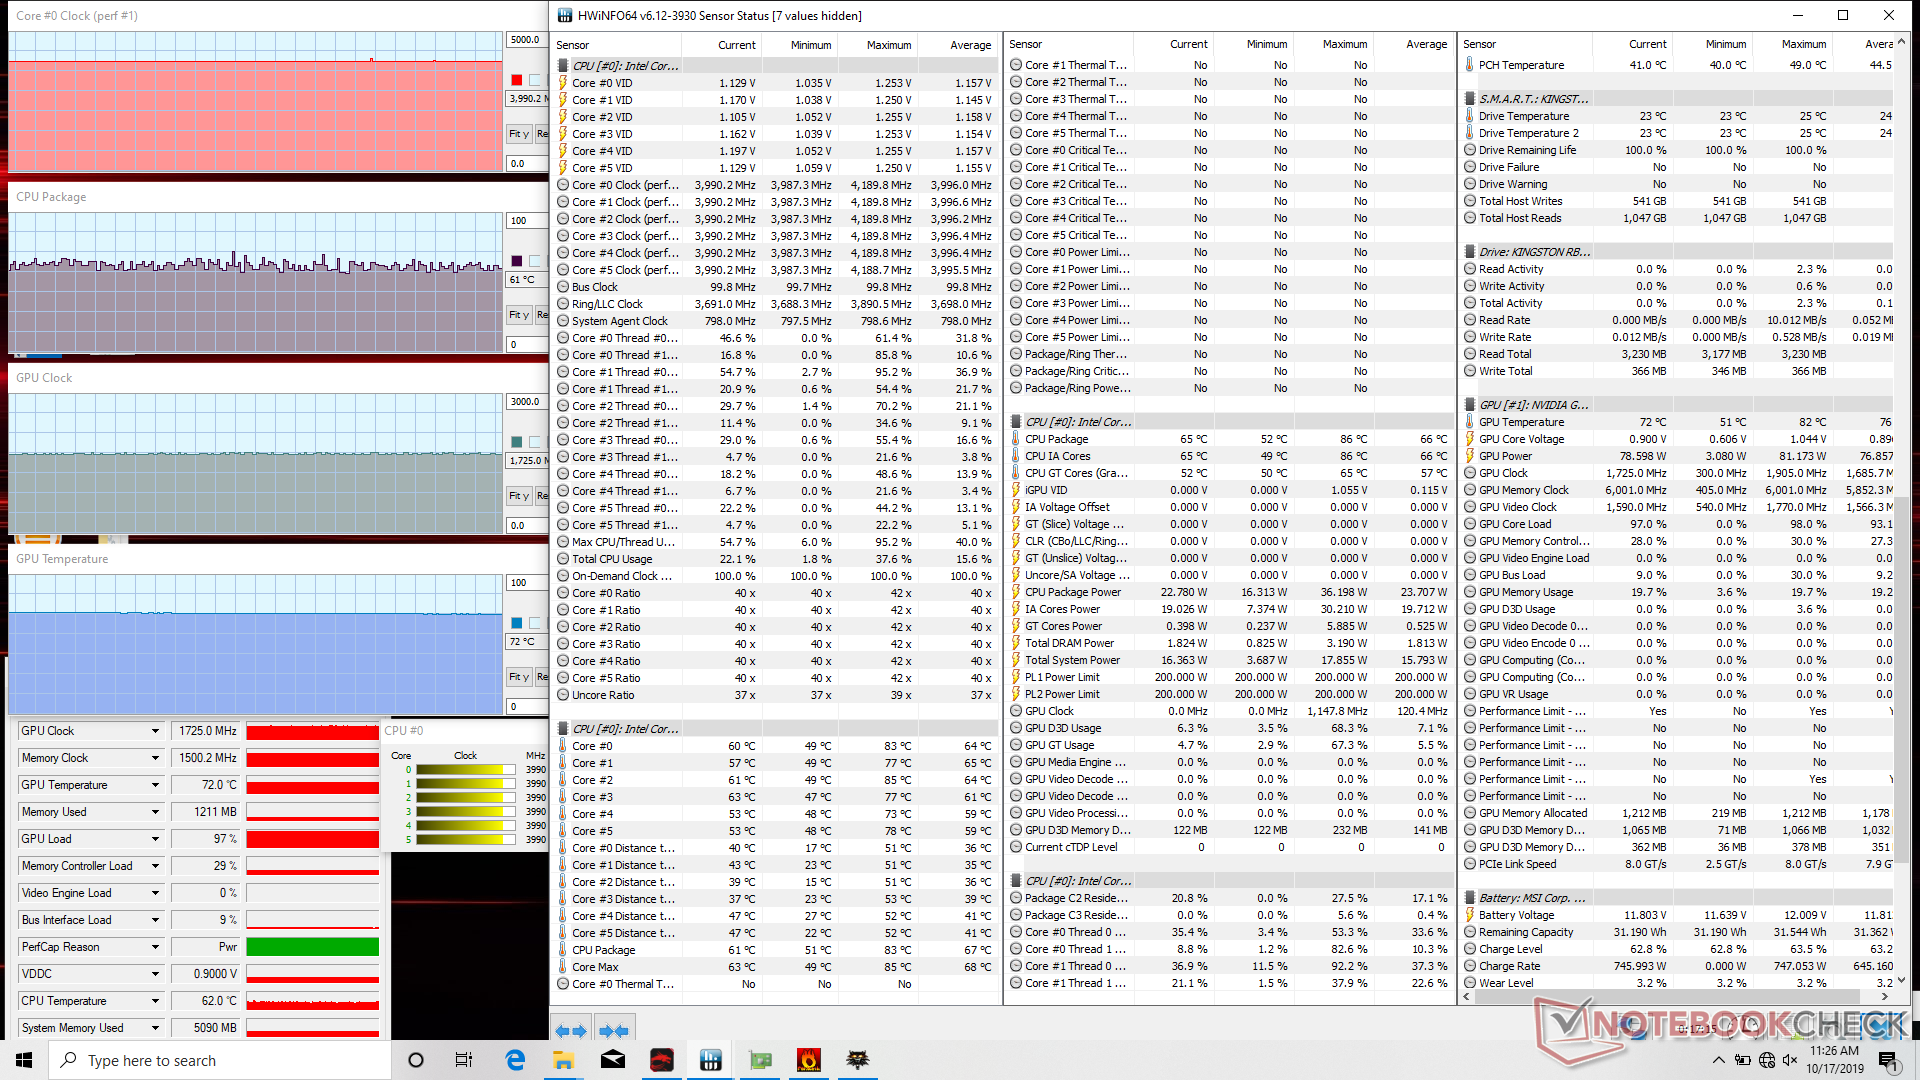
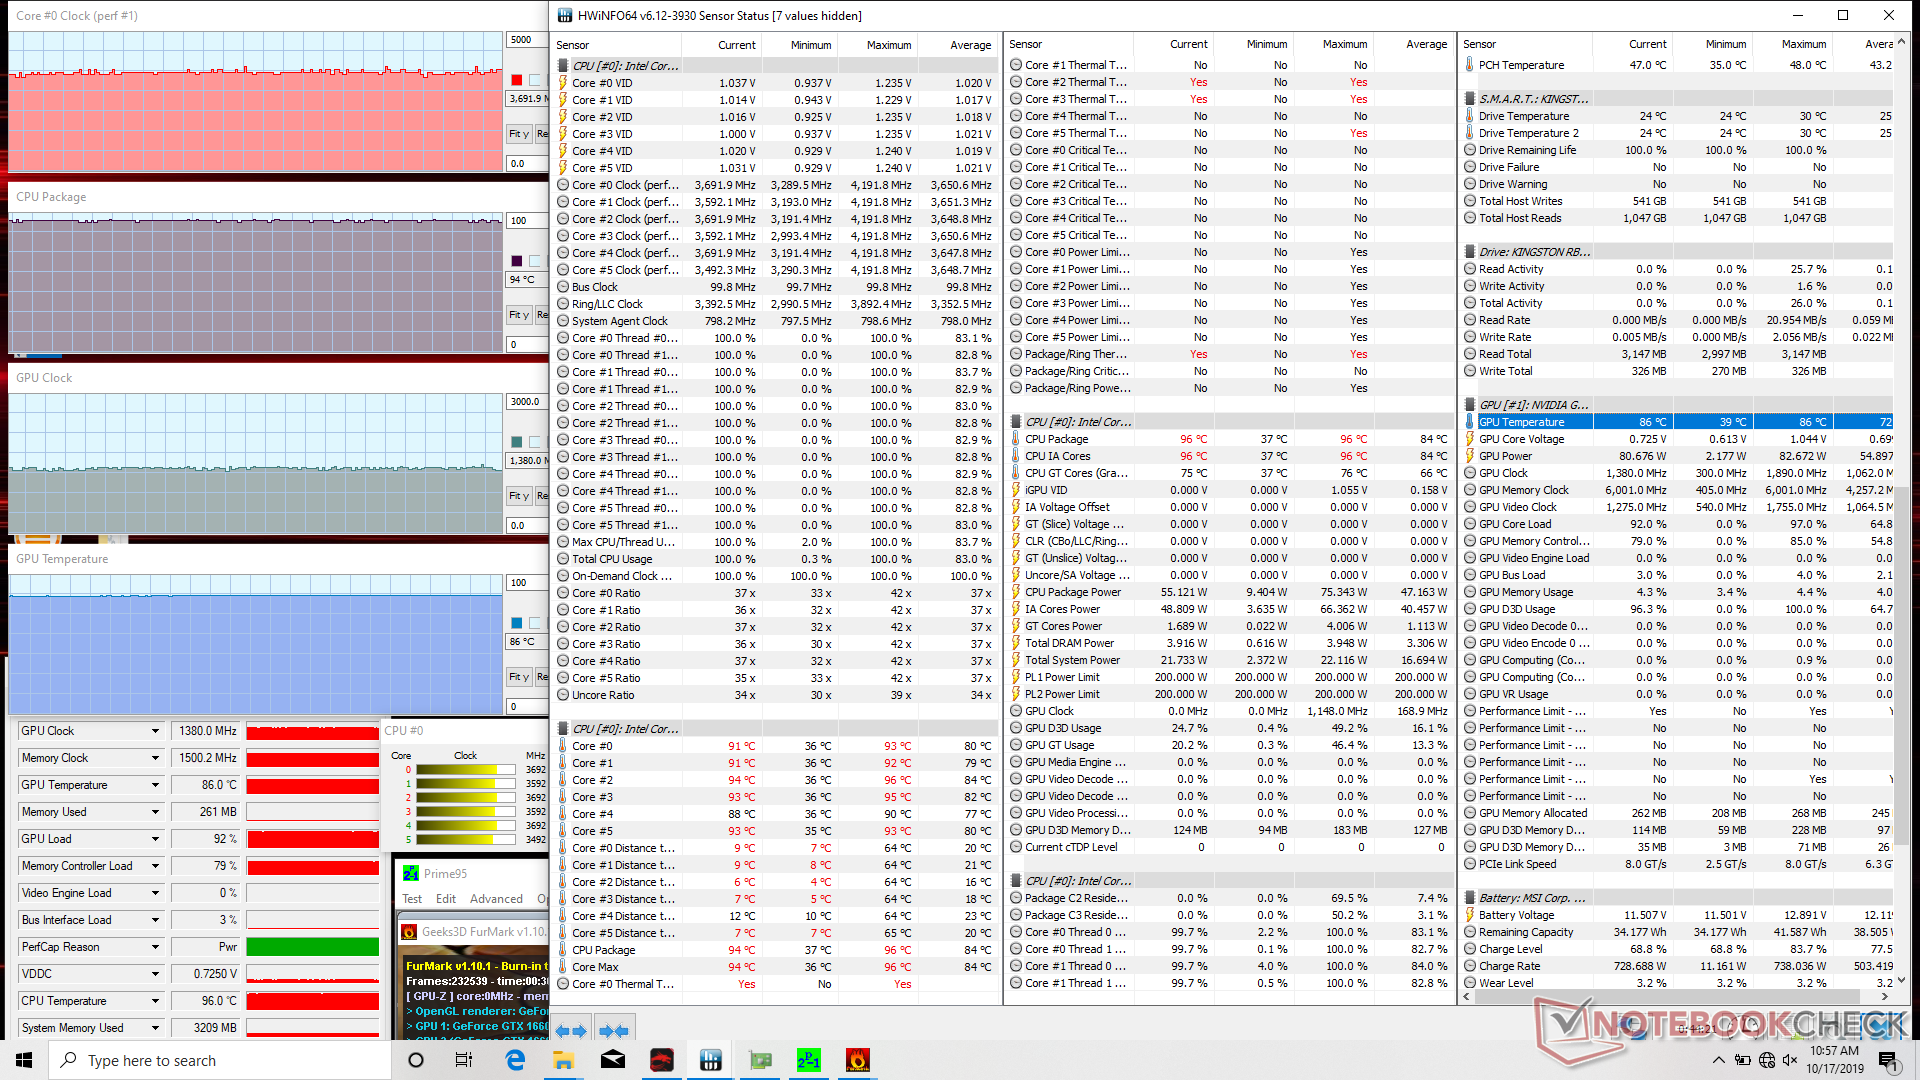
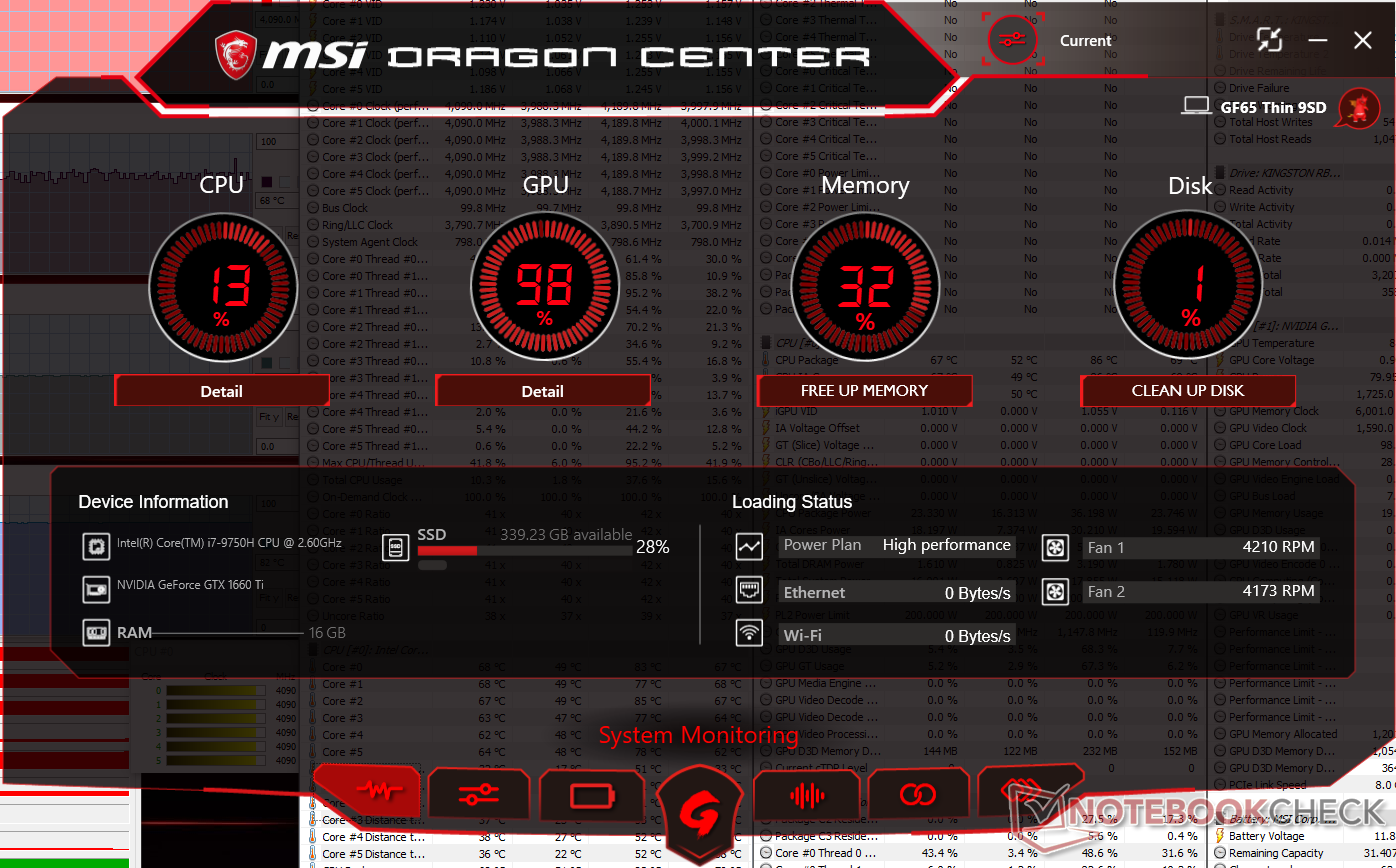
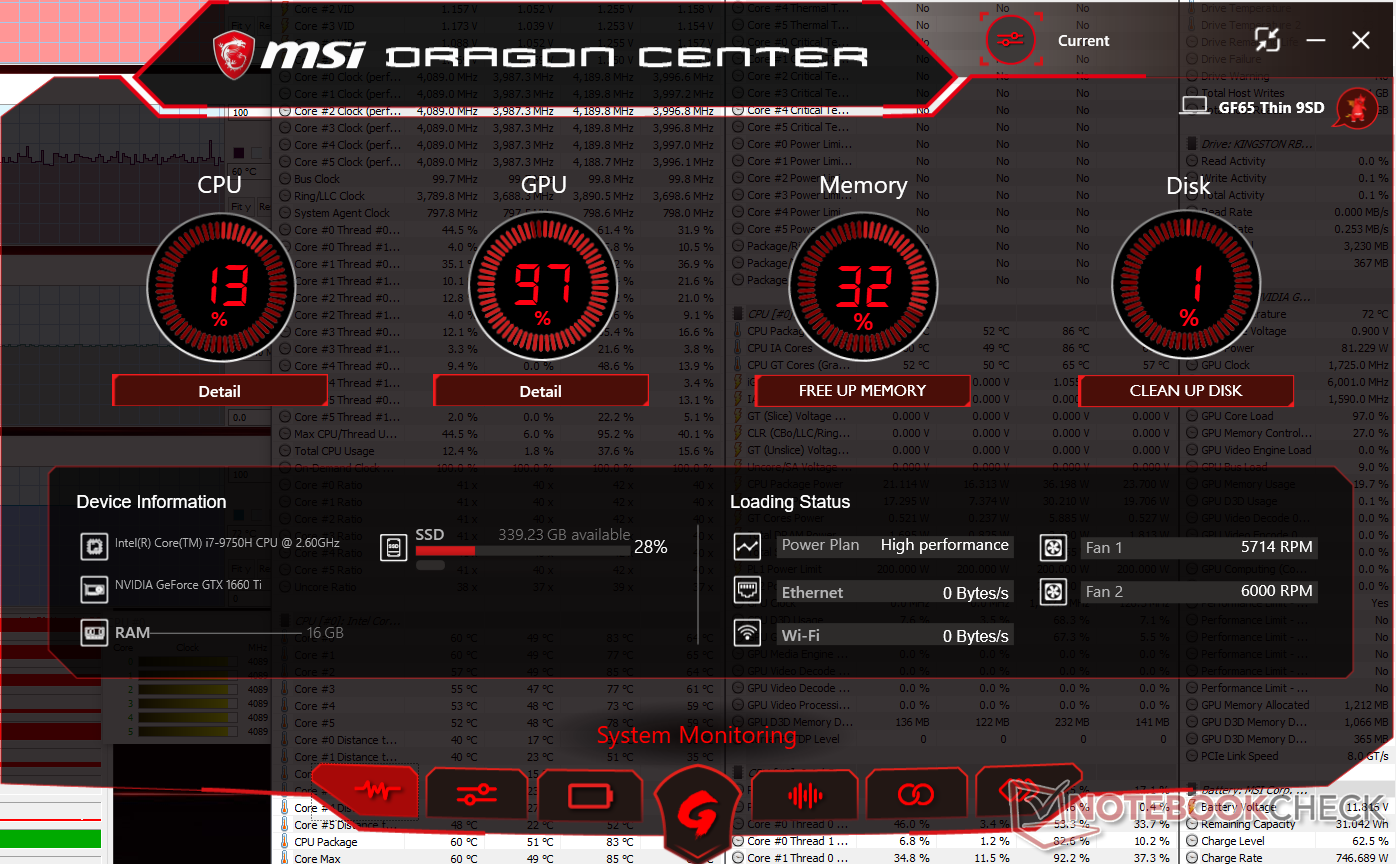
Stres testi
Potansiyel kısıtlama veya kararlılık sorunlarını tespit etmek için sistemi sentetik strese maruz bırakıyoruz. Prime95'i çalıştırırken, CPU saat hızı çekirdek sıcaklığı 95 C'ye ulaşana kadar yaklaşık 30 saniye boyunca 4.0 GHz'e yükselecektir. Bundan sonra, saat hızı ~ 86 C'lik bir çekirdek sıcaklığını korumak için 3.5 GHz aralığına düşer. FurMark aynı anda, Otomatik fan modu devreye girdiğinde sırasıyla 94 C ve 86 C sabit CPU ve GPU sıcaklıklarına neden olacaktır. Witcher 3 çalışırken aşağıdaki tabloda gösterildiği gibi daha düşük sıcaklıklar daha düşüktür. Soğutucu Artırma fan modu (yani Turbo fan) etkinse, çekirdek sıcaklığı daha yüksek fan gürültüsü pahasına 10 dereceye kadar düşebilir. Soğutucu Yükseltme modundayken performansın önemli ölçüde artmayacağına dikkat edin, Soğutucu Yükseltme, performans kontrolü yerine esas olarak sıcaklık kontrolü içindir. Pil gücünde çalıştırma performansı sınırlayacaktır. Akülerle yapılan bir Yangın Saldırısı koşusu, şebeke elektriğindeki 17414 ve 15043 puanlarına göre sırasıyla 11928 ve 3738 puanlık Fizik ve Grafik puanları döndürür.
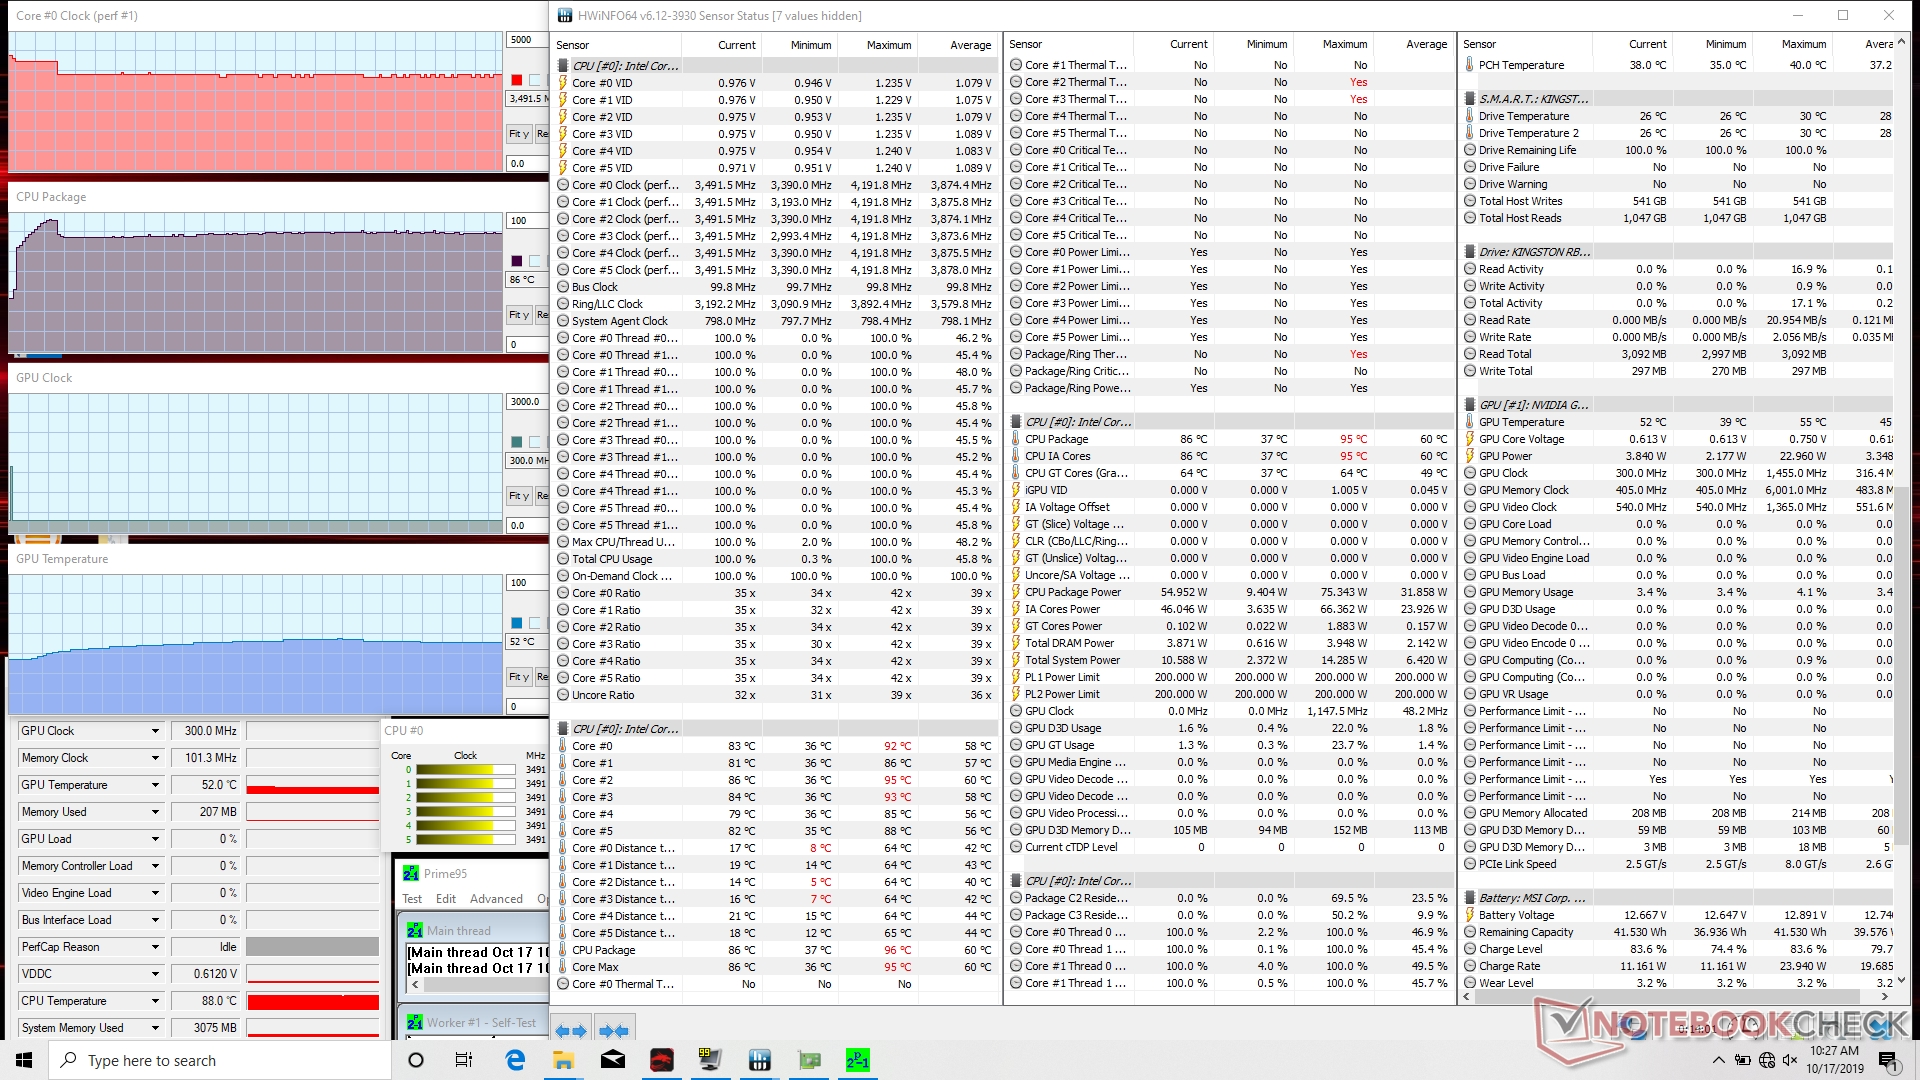
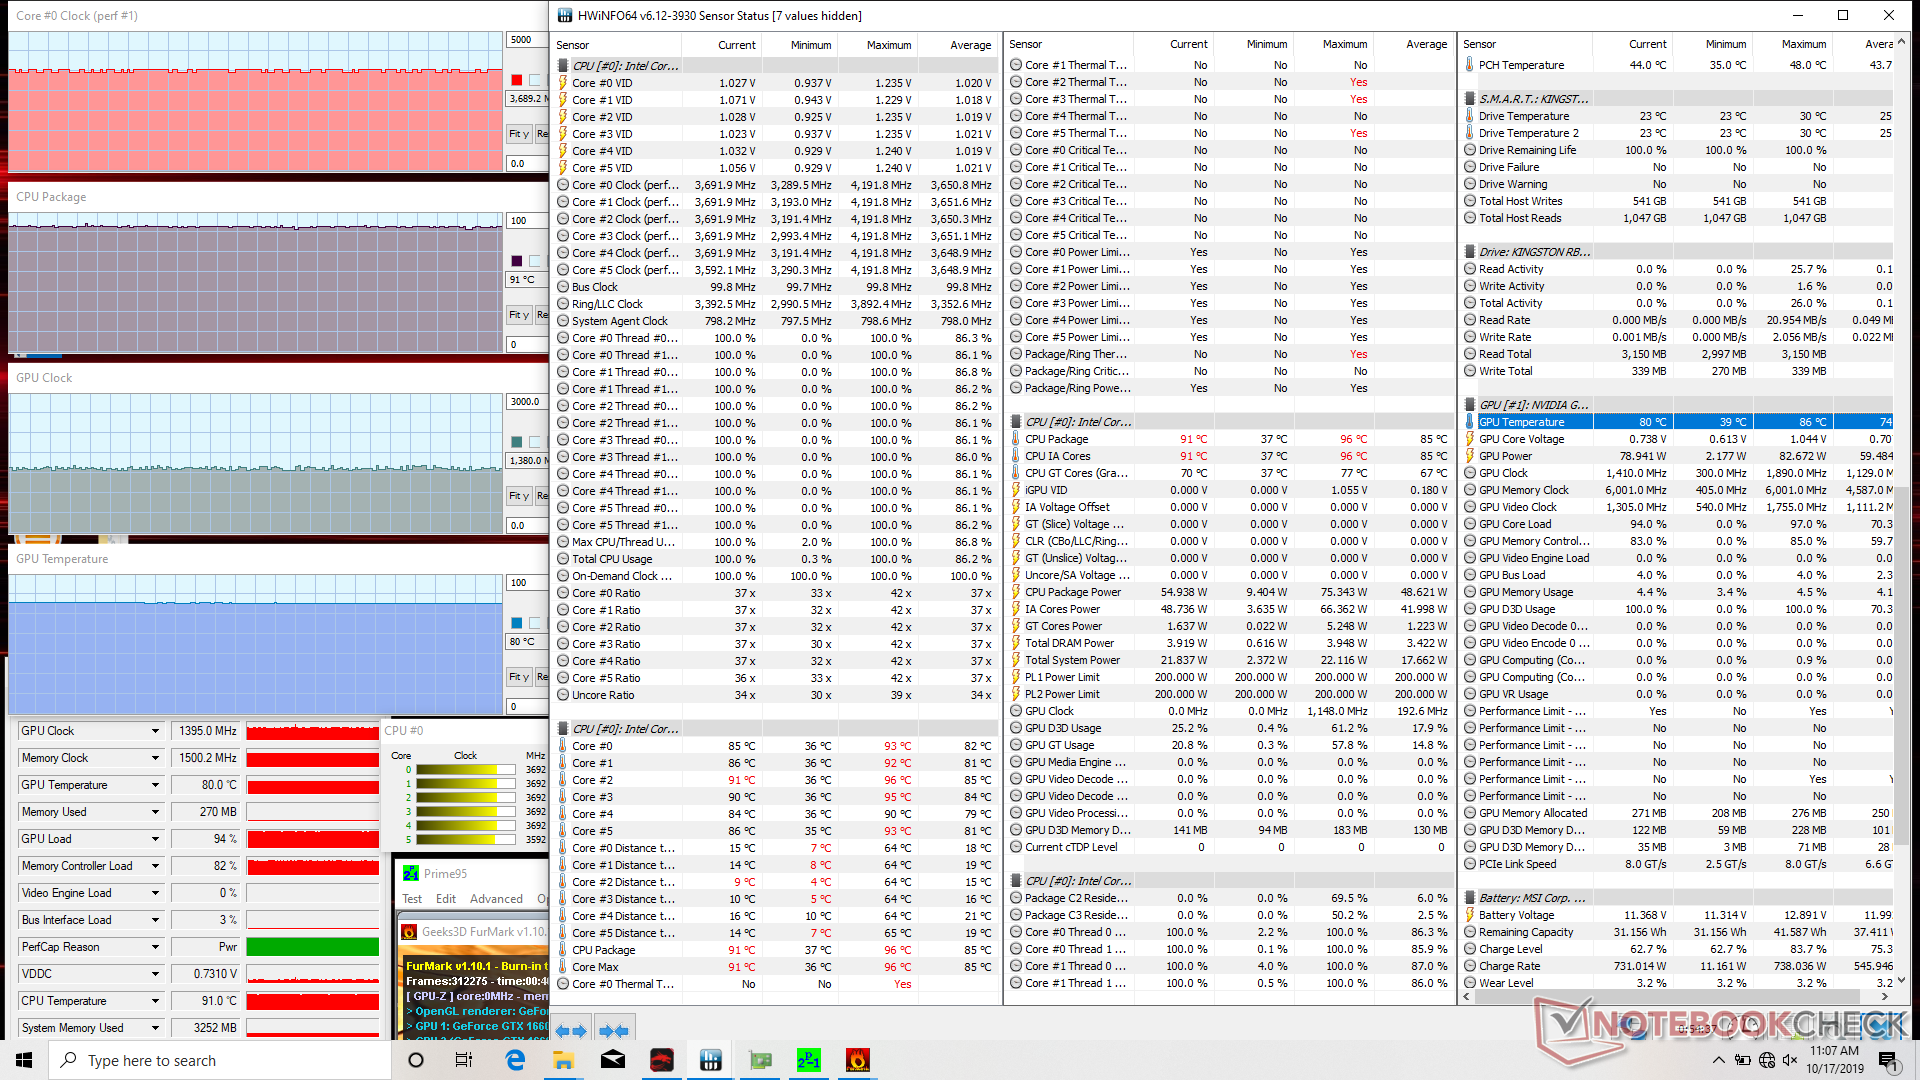
| CPU Clock (GHz) | GPU Clock (MHz) | Average CPU Temperature (°C) | Average GPU Temperature (°C) | |
| System Idle | -- | -- | 40 | 39 |
| Prime95 Stress | 3.4 - 3.5 | -- | 86 | 52 |
| Prime95 + FurMark Stress (Auto fan) | 3.5 - 3.7 | 1380 | 94 | 86 |
| Prime95 + FurMark Stress (Cooler Boost fan) | 3.6 - 3.7 | 1395 | 91 | 80 |
| Witcher 3 Stress (Auto fan) | 4.0 | 1725 | ~72 | 82 |
| Witcher 3 Stress (Cooler Boost fan) | 4.0 | 1725 | ~61 | 72 |
Hoparlörler
2x2 W stereo hoparlörler, aşağıdaki pembe gürültü grafiğiyle gösterildiği gibi dengeli bir ses deneyimi sunar. Diğer ucuz dizüstü bilgisayarların çoğundaki pembe gürültü grafikleri bir tepeye daha çok benzese de, GF65 grafiği, yuvarlanma yaklaşık 250 Hz'de başlamadan önce daha doğrusal görünüyor. Maksimum ses, avuç içi dayanağının dokunulduğunda hafifçe titremesine neden olur.


MSI GF65 9SD ses analizi
(+) | hoparlörler nispeten yüksek sesle çalabilir (84.6 dB)
Bas 100 - 315Hz
(-) | neredeyse hiç bas yok - ortalama olarak medyandan 19.5% daha düşük
(-) | bas doğrusal değildir (15.4% delta ile önceki frekans)
Ortalar 400 - 2000 Hz
(+) | dengeli ortalar - medyandan yalnızca 1.9% uzakta
(+) | orta frekanslar doğrusaldır (5.8% deltadan önceki frekansa)
Yüksekler 2 - 16 kHz
(+) | dengeli yüksekler - medyandan yalnızca 2.5% uzakta
(±) | Yükseklerin doğrusallığı ortalamadır (10.5% delta - önceki frekans)
Toplam 100 - 16.000 Hz
(±) | Genel sesin doğrusallığı ortalamadır (17.4% ortancaya göre fark)
Aynı sınıfla karşılaştırıldığında
» Bu sınıftaki tüm test edilen cihazların %48%'si daha iyi, 12% benzer, 40% daha kötüydü
» En iyisinin deltası 6% idi, ortalama 18% idi, en kötüsü 132% idi
Test edilen tüm cihazlarla karşılaştırıldığında
» Test edilen tüm cihazların %33'si daha iyi, 8 benzer, % 58 daha kötüydü
» En iyisinin deltası 4% idi, ortalama 23% idi, en kötüsü 134% idi
Apple MacBook 12 (Early 2016) 1.1 GHz ses analizi
(+) | hoparlörler nispeten yüksek sesle çalabilir (83.6 dB)
Bas 100 - 315Hz
(±) | azaltılmış bas - ortalama olarak medyandan 11.3% daha düşük
(±) | Bas doğrusallığı ortalamadır (14.2% delta - önceki frekans)
Ortalar 400 - 2000 Hz
(+) | dengeli ortalar - medyandan yalnızca 2.4% uzakta
(+) | orta frekanslar doğrusaldır (5.5% deltadan önceki frekansa)
Yüksekler 2 - 16 kHz
(+) | dengeli yüksekler - medyandan yalnızca 2% uzakta
(+) | yüksekler doğrusaldır (4.5% deltadan önceki frekansa)
Toplam 100 - 16.000 Hz
(+) | genel ses doğrusaldır (10.2% ortancaya göre fark)
Aynı sınıfla karşılaştırıldığında
» Bu sınıftaki tüm test edilen cihazların %7%'si daha iyi, 2% benzer, 90% daha kötüydü
» En iyisinin deltası 5% idi, ortalama 18% idi, en kötüsü 53% idi
Test edilen tüm cihazlarla karşılaştırıldığında
» Test edilen tüm cihazların %5'si daha iyi, 1 benzer, % 94 daha kötüydü
» En iyisinin deltası 4% idi, ortalama 23% idi, en kötüsü 134% idi
Enerji yönetimi
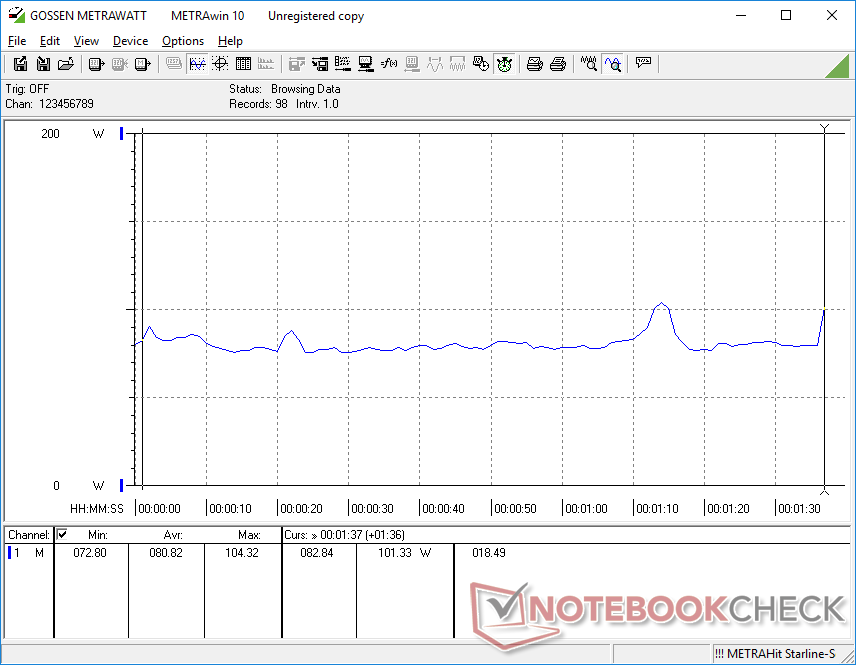
Güç tüketimi
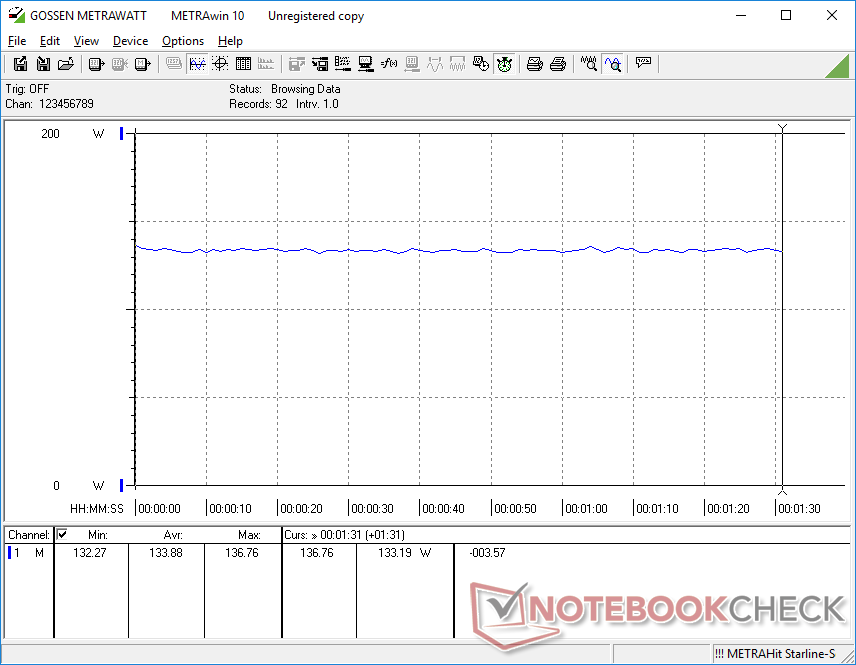
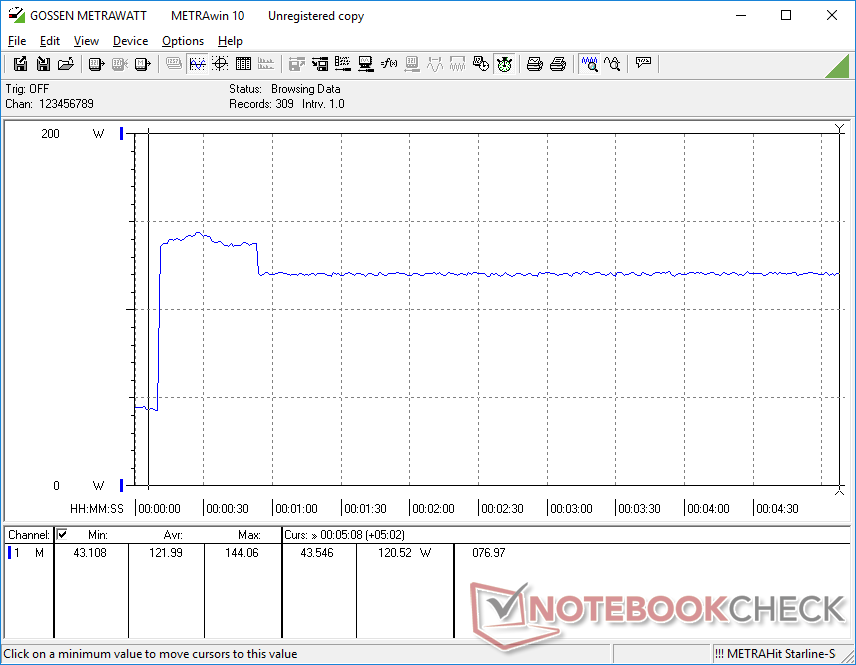
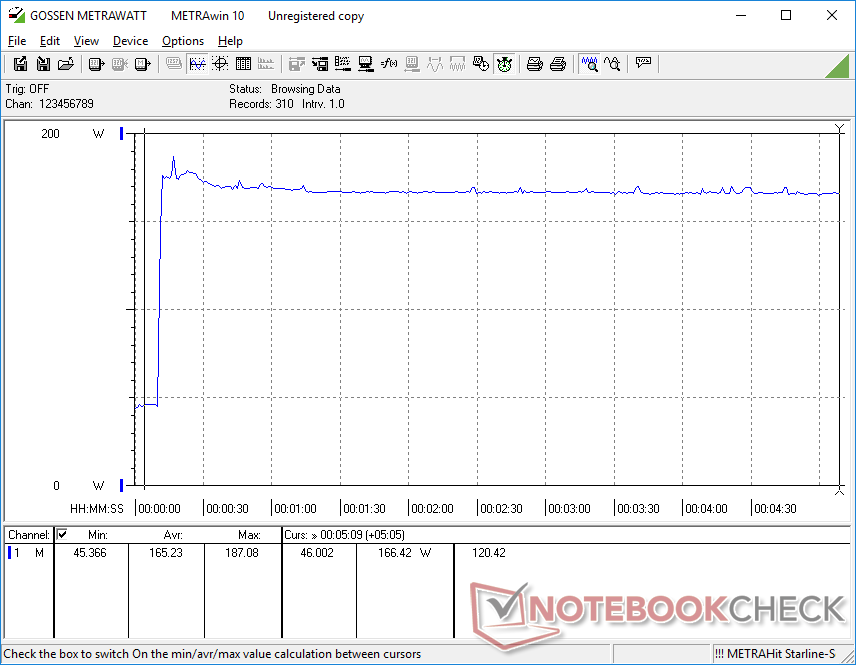
Masaüstünde rölanti, parlaklığa ve güç profiline bağlı olarak 9 W ile 22 W arasında bir yerde talep eder. Witcher 3'ü çalıştırırken, GTX 1050 grafiklerine sahip eski GF63'teki sadece 93 W ile karşılaştırıldığında tüketim yaklaşık 134 W'ta sabit kalıyor. Yüzde 44'lük bir artış, GTX 1050'den GTX 1660 Ti'ye atlarken grafik beygir gücündeki yüzde 130 ila 260'lık artışa göre ödenmesi gereken küçük bir fiyattır. boyutlu (~ 15.3 x 7.5 x 3 cm) 180 W AC adaptör. CPU ve GPU'nun her biri yüzde 100 kullanımdaysa, şarj oranı yavaşlamaya başlayacaktır.
| Kapalı / Bekleme modu | |
| Boşta | |
| Çalışırken |
|
Key:
min: | |
| MSI GF65 9SD i7-9750H, GeForce GTX 1660 Ti Mobile, Kingston RBUSNS8154P3512GJ, IPS, 1920x1080, 15.6" | Asus ROG Zephyrus G15 GA502DU R7 3750H, GeForce GTX 1660 Ti Max-Q, Intel SSD 660p SSDPEKNW512G8, IPS, 1920x1080, 15.6" | MSI GF63 8RC i5-8300H, GeForce GTX 1050 Mobile, Seagate BarraCuda Pro Compute 1TB ST1000LM049, IPS, 1920x1080, 15.6" | Aorus 15-SA i7-9750H, GeForce GTX 1660 Ti Mobile, Intel SSD 760p SSDPEKKW512G8, IPS, 1920x1080, 15.6" | Dell G7 7590 i7-9750H, GeForce RTX 2060 Mobile, Toshiba BG3 KBG30ZMS256G, IPS, 1920x1080, 15.6" | Lenovo Legion Y7000P-1060 i7-8750H, GeForce GTX 1060 Mobile, Samsung SSD PM981 MZVLB256HAHQ, IPS, 1920x1080, 15.6" | |
|---|---|---|---|---|---|---|
| Power Consumption | 6% | 29% | -38% | -35% | 14% | |
| Idle Minimum * (Watt) | 9.5 | 7.4 22% | 5.4 43% | 20 -111% | 11.2 -18% | 4.9 48% |
| Idle Average * (Watt) | 12.4 | 8.6 31% | 10.4 16% | 23 -85% | 16.3 -31% | 8.1 35% |
| Idle Maximum * (Watt) | 22 | 39.1 -78% | 10.5 52% | 29 -32% | 46.2 -110% | 16.5 25% |
| Load Average * (Watt) | 80.8 | 65.9 18% | 84.7 -5% | 87 -8% | 123.3 -53% | 109.2 -35% |
| Witcher 3 ultra * (Watt) | 133.9 | 106.9 20% | 92.7 31% | 136 -2% | 135.6 -1% | 124.6 7% |
| Load Maximum * (Watt) | 187.1 | 141.3 24% | 119.9 36% | 173 8% | 181.5 3% | 175.2 6% |
* ... daha küçük daha iyidir
Pil ömrü
Pil kapasitesi, 51 Wh'deki son nesil GF63 ile aynı kalır. Bu nedenle çalışma süreleri, neredeyse 5 saatlik gerçek dünya WLAN kullanımında neredeyse aynıdır. Boştan tam kapasiteye şarj edilmesi normalde 2 ila 2.5 saatte biraz daha uzun sürüyor.
| MSI GF65 9SD i7-9750H, GeForce GTX 1660 Ti Mobile, 51 Wh | Asus ROG Zephyrus G15 GA502DU R7 3750H, GeForce GTX 1660 Ti Max-Q, 76 Wh | MSI GF63 8RC i5-8300H, GeForce GTX 1050 Mobile, 51 Wh | Lenovo Legion Y540-15IRH-81SX00B2GE i7-9750H, GeForce GTX 1660 Ti Mobile, 57 Wh | Dell G7 7590 i7-9750H, GeForce RTX 2060 Mobile, 60 Wh | Aorus 15-SA i7-9750H, GeForce GTX 1660 Ti Mobile, 62 Wh | |
|---|---|---|---|---|---|---|
| Pil Çalışma Süresi | 57% | 8% | -53% | -10% | -45% | |
| WiFi v1.3 (h) | 5.1 | 8 57% | 5.5 8% | 2.4 -53% | 4.6 -10% | 2.8 -45% |
| Reader / Idle (h) | 15.3 | 9.5 | 4 | 11.1 | 3.5 | |
| Load (h) | 2.1 | 0.9 | 1.3 | 1.8 | 2 |
Artılar
Eksiler
Karar

Eski GF63'ten en dikkat çekici yükseltme GF65'teki GTX 1660 Ti GPU’dur. GF63, GTX 1660 Ti'den yaklaşık yüzde 50 daha yavaş grafik performansı sunan GTX 1050 Ti ile sınırlıdır. Oyun oynamadaki fark maddi olacaktır. GPU takasından başka, GF65 daha fazla güç tüketen GPU'yu barındırmak için kaputun altında ilave M.2 yuvaları, 120/144 Hz ekran seçenekleri, fanlar ve bakır ısı boruları kullanır. Ortalama batarya ömrü, ortalama siyah-beyaz tepki süreleri, bütçe kasası, mükemmel hoparlörler ve orta derecede zor servis kolaylığı dahil olmak üzere hemen hemen her şey aynıdır. Bununla birlikte, önemli bir değişiklik, fan gürültüsüdür çünkü GF65 oyun oynarken selefinden daha yüksek olacaktır. Özellikle daha yavaş GTX 1060 dizüstü bilgisayarların piyasaya sürüldüğünü düşündüğünüzde, MSI GF65 GTX 1660 Ti'den 1000 $ 'ın altında çok fazla oyun gücü elde edersiniz. daha yüksek fiyatlarla. Yüksek fan gürültüsü, orta düzeyde gölgelenme ve sıra dışı port konumlandırma ile başa çıkmak zorunda kalacaksınız.
MSI GF65 9SD
- 05/15/2020 v7 (old)
Allen Ngo
Price comparison
