Kısa inceleme: Razer Blade Stealth (i7-7500U) Notebook

| Networking | |
| iperf Server (receive) TCP 1 m | |
| Dell XPS 13 2016 9350 (FHD, i7-6560U) | |
| Apple MacBook 12 (Early 2016) 1.1 GHz | |
| Razer Blade Stealth QHD i7-7500U (sim) | |
| Medion Akoya S3409-MD60234 (jseb) | |
| Acer Aspire S 13 S5-371-71QZ | |
| iperf Client (transmit) TCP 1 m | |
| Dell XPS 13 2016 9350 (FHD, i7-6560U) | |
| Medion Akoya S3409-MD60234 (jseb) | |
| Razer Blade Stealth QHD i7-7500U (sim) | |
| Apple MacBook 12 (Early 2016) 1.1 GHz | |
| Acer Aspire S 13 S5-371-71QZ | |
| |||||||||||||||||||||||||
Aydınlatma: 88 %
Kontrast: 893:1 (Siyah: 0.45 cd/m²)
ΔE ColorChecker Calman: 3.6 | ∀{0.5-29.43 Ø4.73}
ΔE Greyscale Calman: 4.3 | ∀{0.09-98 Ø4.97}
95.7% sRGB (Argyll 1.6.3 3D)
62.3% AdobeRGB 1998 (Argyll 1.6.3 3D)
69.9% AdobeRGB 1998 (Argyll 3D)
95.8% sRGB (Argyll 3D)
68.7% Display P3 (Argyll 3D)
Gamma: 2.1
CCT: 6572 K
| Razer Blade Stealth QHD i7-7500U 2560x1440, 12.5" | Razer Blade Stealth UHD i7-6500U 3840x2160, 12.5" | Dell XPS 13 9360 QHD+ i5 3200x1800, 13.3" | Lenovo IdeaPad 710S-13ISK 1920x1080, 13.3" | Asus Zenbook UX305UA-FC040T 1920x1080, 13.3" | Acer Aspire S 13 S5-371-71QZ 1920x1080, 13.3" | |
|---|---|---|---|---|---|---|
| Display | 22% | -5% | -1% | -4% | ||
| Display P3 Coverage (%) | 68.7 | 83.7 22% | 64.6 -6% | 66.4 -3% | 65.1 -5% | |
| sRGB Coverage (%) | 95.8 | 99.2 4% | 91.6 -4% | 97.5 2% | 92.8 -3% | |
| AdobeRGB 1998 Coverage (%) | 69.9 | 97.2 39% | 66.5 -5% | 68.4 -2% | 66.3 -5% | |
| Response Times | -43% | 12% | -7% | 24% | -12% | |
| Response Time Grey 50% / Grey 80% * (ms) | 37 ? | 63.2 ? -71% | 31 ? 16% | 52.4 ? -42% | 25 ? 32% | 50 ? -35% |
| Response Time Black / White * (ms) | 33.4 ? | 38 ? -14% | 31.2 ? 7% | 23.6 ? 29% | 28 ? 16% | 29.6 ? 11% |
| PWM Frequency (Hz) | 200 ? | 220 ? | 50 ? | |||
| Screen | 16% | 10% | -13% | -24% | -5% | |
| Brightness middle (cd/m²) | 402 | 415 3% | 444 10% | 344 -14% | 358 -11% | 375 -7% |
| Brightness (cd/m²) | 382 | 399 4% | 393 3% | 326 -15% | 351 -8% | 358 -6% |
| Brightness Distribution (%) | 88 | 93 6% | 82 -7% | 87 -1% | 86 -2% | 87 -1% |
| Black Level * (cd/m²) | 0.45 | 0.309 31% | 0.33 27% | 0.36 20% | 0.4 11% | 0.39 13% |
| Contrast (:1) | 893 | 1343 50% | 1345 51% | 956 7% | 895 0% | 962 8% |
| Colorchecker dE 2000 * | 3.6 | 3.78 -5% | 4 -11% | 6.09 -69% | 5.96 -66% | 4.6 -28% |
| Colorchecker dE 2000 max. * | 7.5 | 7.2 4% | 7.7 -3% | 10 -33% | 10.99 -47% | 8.8 -17% |
| Greyscale dE 2000 * | 4.3 | 3.38 21% | 2.83 34% | 5.36 -25% | 8.93 -108% | 4 7% |
| Gamma | 2.1 105% | 2.23 99% | 2.05 107% | 2.01 109% | 2.28 96% | 2.34 94% |
| CCT | 6572 99% | 7329 89% | 6963 93% | 7230 90% | 6548 99% | 7304 89% |
| Color Space (Percent of AdobeRGB 1998) (%) | 62.3 | 85.1 37% | 59.3 -5% | 62.25 0% | 60 -4% | 57.9 -7% |
| Color Space (Percent of sRGB) (%) | 95.7 | 99.3 4% | 91.4 -4% | 97.54 2% | 93 -3% | 88.7 -7% |
| Toplam Ortalama (Program / Ayarlar) | -2% /
9% | 6% /
7% | -7% /
-10% | -1% /
-14% | -9% /
-6% |
* ... daha küçük daha iyidir
Yanıt Sürelerini Görüntüle
| ↔ Tepki Süresi Siyahtan Beyaza | ||
|---|---|---|
| 33.4 ms ... yükseliş ↗ ve sonbahar↘ birleşimi | ↗ 13.2 ms yükseliş | 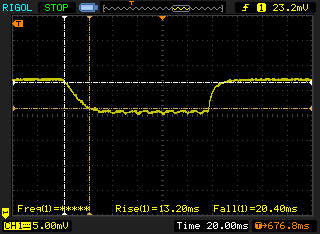 |
| ↘ 20.2 ms sonbahar | ||
| Ekran, testlerimizde yavaş yanıt oranları gösteriyor ve oyuncular için yetersiz olacaktır. Karşılaştırıldığında, test edilen tüm cihazlar 0.1 (minimum) ile 240 (maksimum) ms arasında değişir. » Tüm cihazların 90 %'si daha iyi. Bu, ölçülen yanıt süresinin test edilen tüm cihazların ortalamasından (19.9 ms) daha kötü olduğu anlamına gelir. | ||
| ↔ Tepki Süresi %50 Griden %80 Griye | ||
| 37 ms ... yükseliş ↗ ve sonbahar↘ birleşimi | ↗ 19 ms yükseliş | 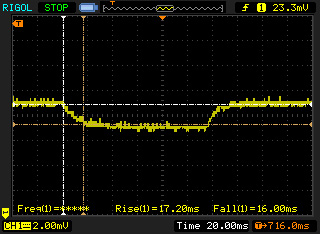 |
| ↘ 18 ms sonbahar | ||
| Ekran, testlerimizde yavaş yanıt oranları gösteriyor ve oyuncular için yetersiz olacaktır. Karşılaştırıldığında, test edilen tüm cihazlar 0.165 (minimum) ile 636 (maksimum) ms arasında değişir. » Tüm cihazların 53 %'si daha iyi. Bu, ölçülen yanıt süresinin test edilen tüm cihazların ortalamasından (31.1 ms) daha kötü olduğu anlamına gelir. | ||
Ekran Titremesi / PWM (Darbe Genişliği Modülasyonu)
| Ekran titriyor / PWM algılandı | 200 Hz | ≤ 30 % parlaklık ayarı | 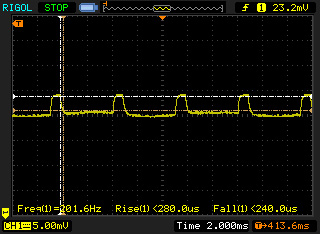 |
Ekran arka ışığı 200 Hz'de titriyor (en kötü durum, örneğin PWM kullanılması) 30 % ve altındaki parlaklık ayarında titreme algılandı. Bu parlaklık ayarının üzerinde titreme veya PWM olmamalıdır. 200 Hz frekansı nispeten düşüktür, bu nedenle hassas kullanıcılar belirtilen parlaklık ayarında ve altında muhtemelen titremeyi fark edecek ve göz yorgunluğu yaşayacaktır. Karşılaştırıldığında: Test edilen tüm cihazların %52 %'si ekranı karartmak için PWM kullanmıyor. PWM tespit edilirse, ortalama 7784 (minimum: 5 - maksimum: 343500) Hz ölçüldü. | |||
| PCMark 8 - Home Score Accelerated v2 | |
| Lenovo IdeaPad 710S-13ISK | |
| Dell XPS 13 2016 9350 (FHD, i7-6560U) | |
| Acer Aspire S 13 S5-371-71QZ | |
| Razer Blade Stealth QHD i7-7500U | |
| Asus Zenbook UX305UA-FC040T | |
| Medion Akoya S3409-MD60234 | |
| Razer Blade Stealth UHD i7-6500U | |
| Dell XPS 13 9360 QHD+ i5 | |
| Apple MacBook 12 (Early 2016) 1.1 GHz | |
| PCMark 8 Home Score Accelerated v2 | 3362 puan | |
Yardım | ||
| Razer Blade Stealth QHD i7-7500U Samsung PM951 NVMe MZVLV256 | Dell XPS 13 2016 9350 (FHD, i7-6560U) Samsung PM951 NVMe MZ-VLV256D | Asus Zenbook UX305UA-FC040T SK Hynix Canvas SC300 512GB M.2 (HFS512G39MND) | Acer Aspire S 13 S5-371-71QZ LiteOn CV1-8B512 | Lenovo IdeaPad 710S-13ISK Samsung PM951 NVMe MZVLV256 | Dell XPS 13 2016 9350 (FHD, i7-6560U) Samsung SSD SM951 512 GB MZHPV512HDGL | |
|---|---|---|---|---|---|---|
| CrystalDiskMark 3.0 | -9% | -27% | -23% | -1% | 115% | |
| Read Seq (MB/s) | 1178 | 1131 -4% | 469.1 -60% | 502 -57% | 1193 1% | 1502 28% |
| Write Seq (MB/s) | 305.4 | 311.4 2% | 412.1 35% | 418.9 37% | 309.6 1% | 1547 407% |
| Read 512 (MB/s) | 638 | 685 7% | 301.6 -53% | 341.3 -47% | 613 -4% | 1020 60% |
| Write 512 (MB/s) | 305.7 | 276.3 -10% | 327.1 7% | 389.7 27% | 311 2% | 1480 384% |
| Read 4k (MB/s) | 38.54 | 39.63 3% | 28.08 -27% | 29.69 -23% | 42.43 10% | 52 35% |
| Write 4k (MB/s) | 153.4 | 133.9 -13% | 71.9 -53% | 86.8 -43% | 144.9 -6% | 139.5 -9% |
| Read 4k QD32 (MB/s) | 614 | 399.7 -35% | 262 -57% | 301.3 -51% | 549 -11% | 467.1 -24% |
| Write 4k QD32 (MB/s) | 302.7 | 245.6 -19% | 274.7 -9% | 211.2 -30% | 311.3 3% | 409.5 35% |

| 3DMark 11 Performance | 1801 puan | |
| 3DMark Cloud Gate Standard Score | 6538 puan | |
| 3DMark Fire Strike Score | 918 puan | |
Yardım | ||
| düşük | orta | yüksek | ultra | |
|---|---|---|---|---|
| Sims 4 (2014) | 182 | 56.4 | 27.6 | 18.3 |
| The Witcher 3 (2015) | 13.92 | |||
| World of Warships (2015) | 72.9 | 47.78 | 23.63 | |
| Rise of the Tomb Raider (2016) | 20.2 | 12.7 |
Ses yüksekliği
| Boşta |
| 31 / 31 / 31 dB |
| Çalışırken |
| 35 / 40.5 dB |
 | ||
30 dB sessiz 40 dB(A) duyulabilirlik 50 dB(A) gürültülü |
||
min: | ||
Razer Blade Stealth QHD i7-7500U ses analizi
(-) | hoparlörler çok yüksek ses çıkarmıyor (40.5 dB)
Analysis not possible as maximum curve is missing or too high
(-) Üst taraftaki maksimum sıcaklık, 34.3 °C / 94 F ortalamasına kıyasla 46.7 °C / 116 F'dir. , Office sınıfı için 21.2 ile 62.5 °C arasında değişir.
(-) Alt kısım, 36.8 °C / 98 F ortalamasına kıyasla maksimum 51.3 °C / 124 F'ye kadar ısınır
(+) Boşta kullanımda, üst tarafın ortalama sıcaklığı 29.5 °C / 85 F olup, cihazın 29.5 °C / 85 F.
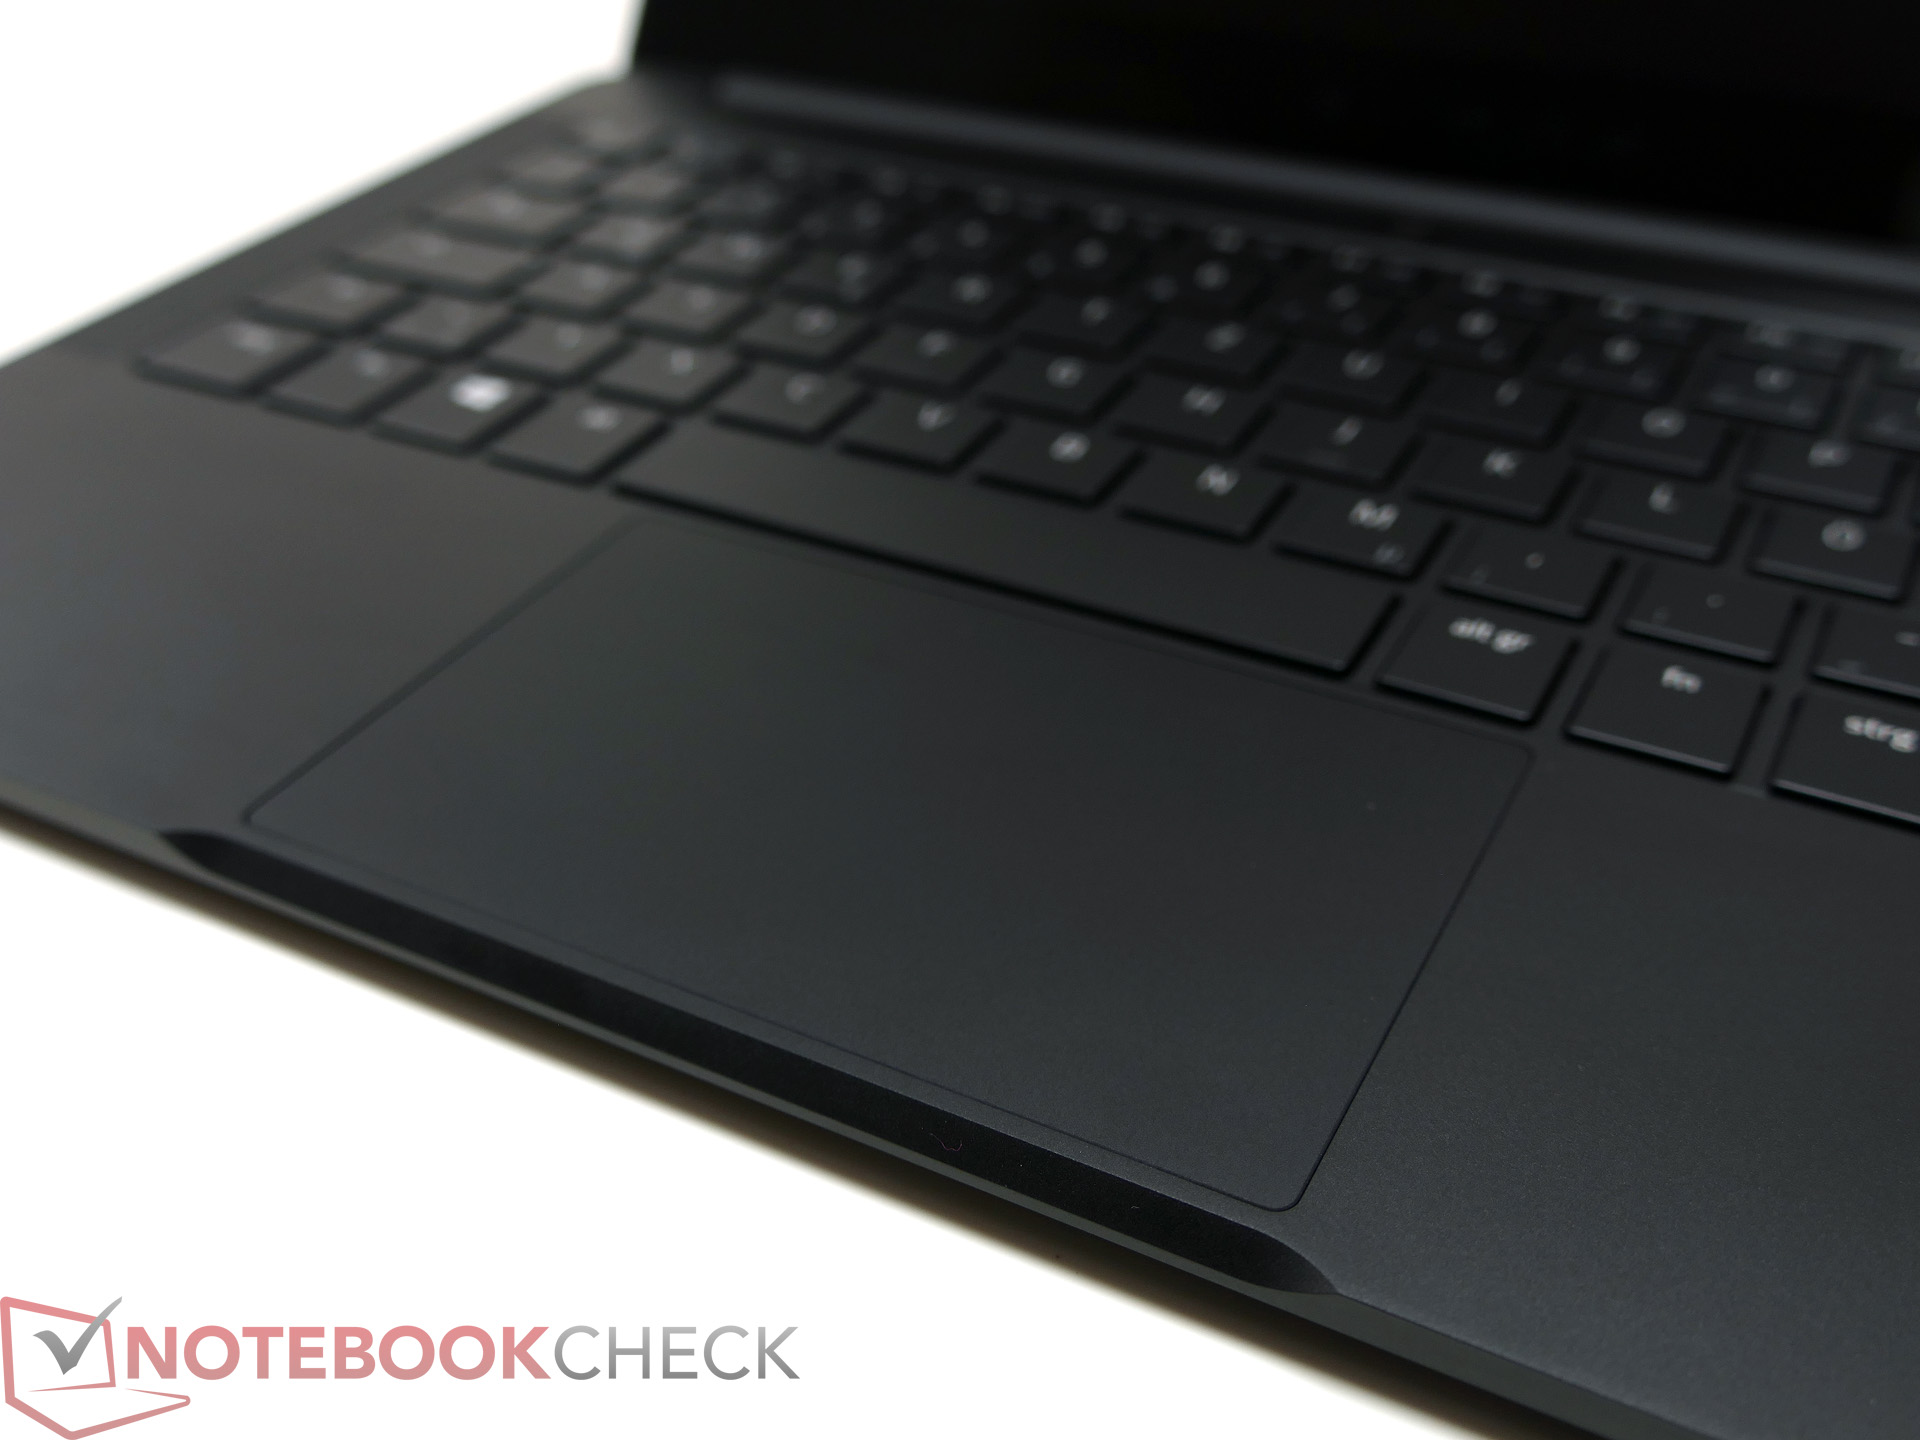
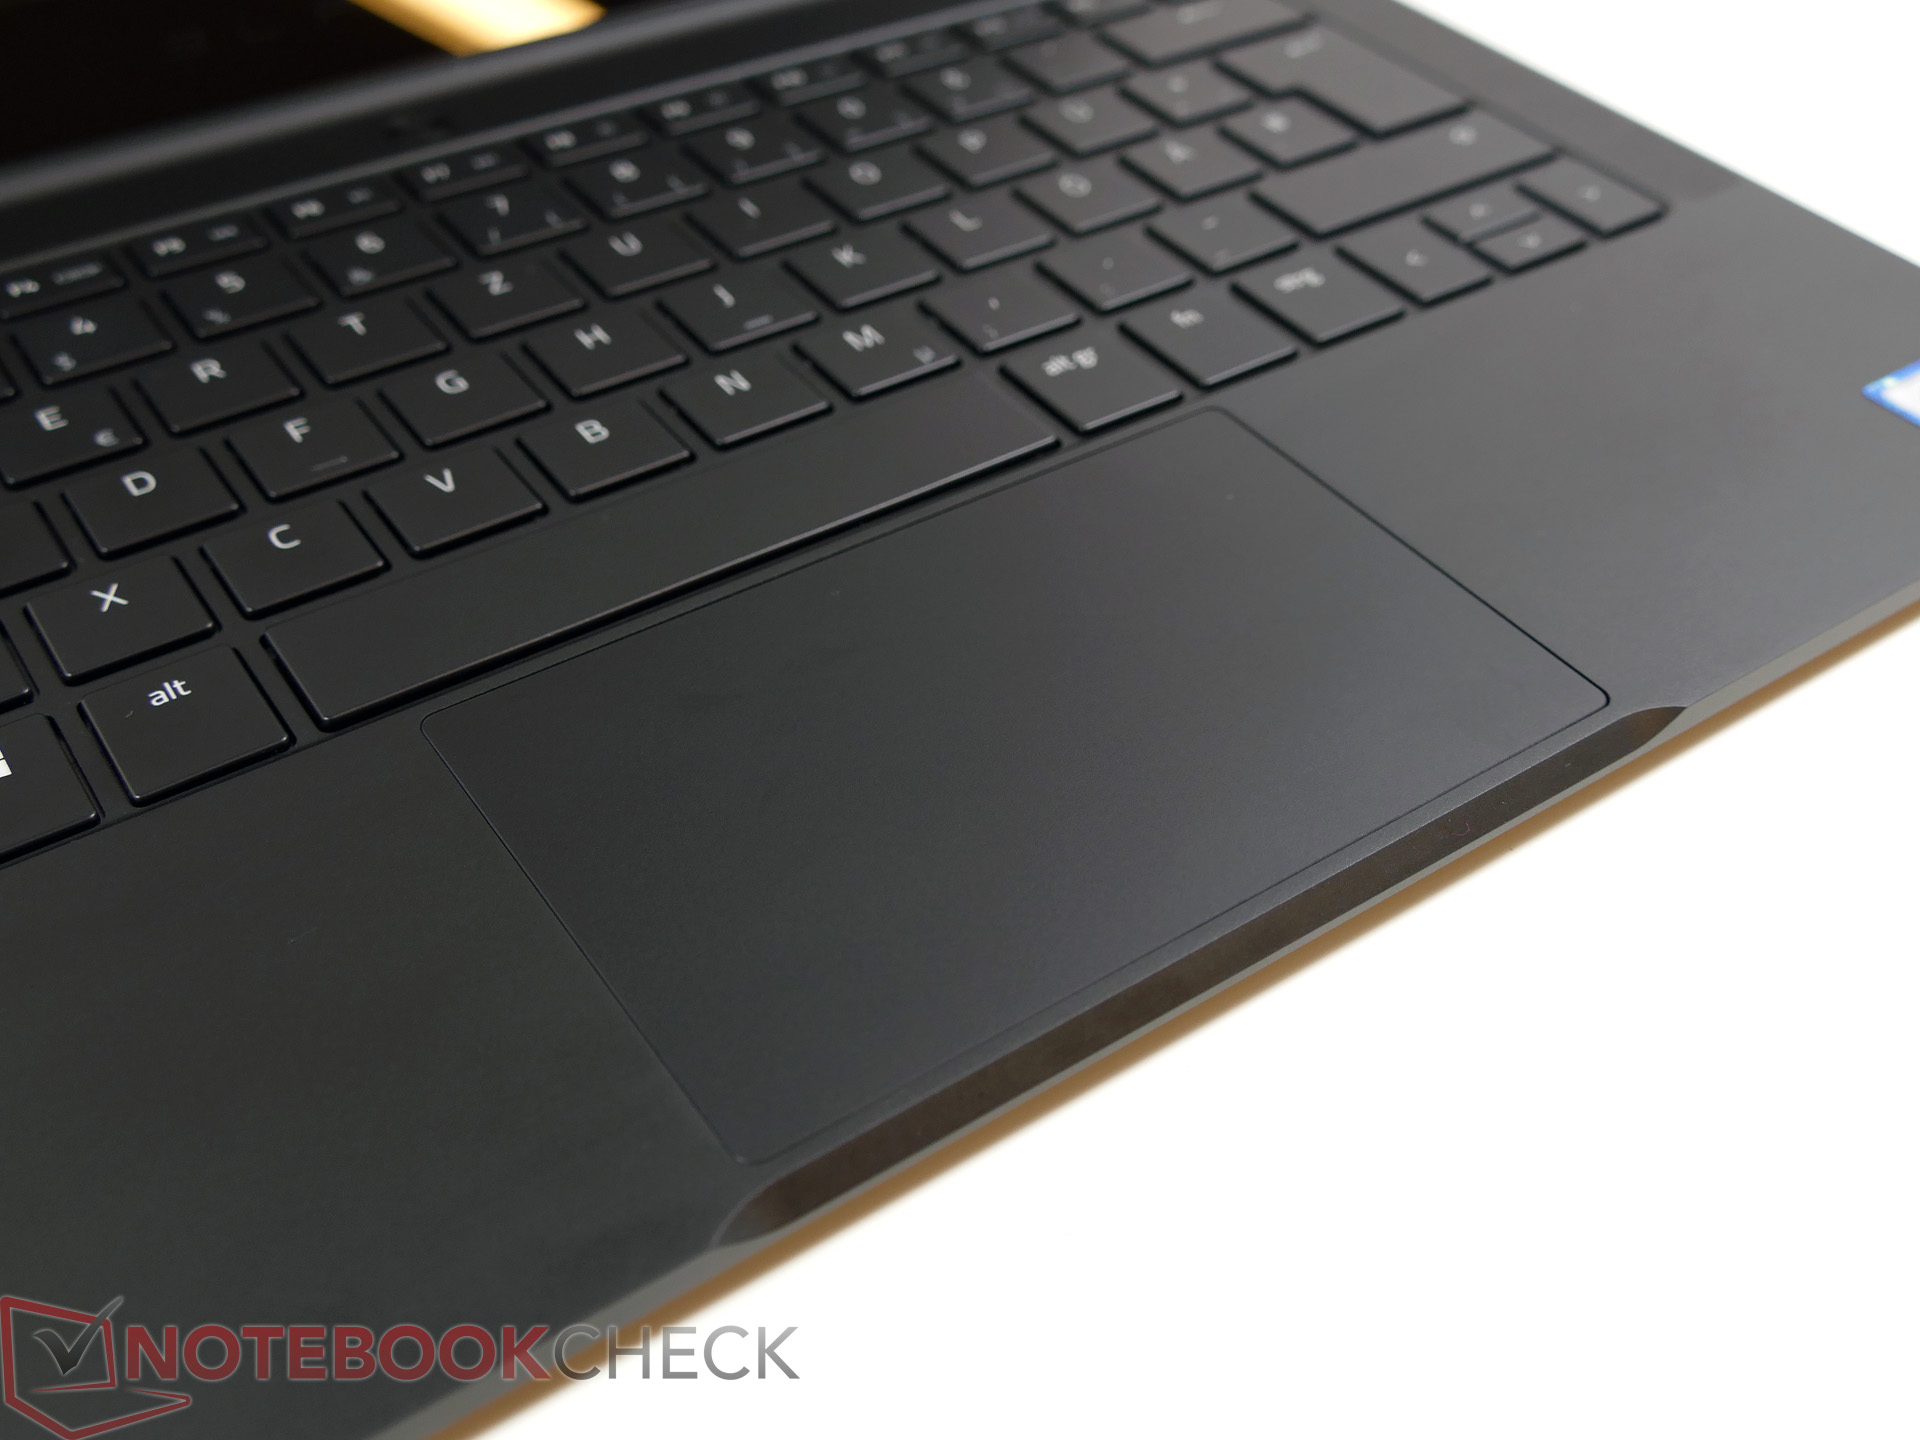
(+) Avuç içi dayanakları ve dokunmatik yüzey maksimum (33.4 °C / 92.1 F) cilt sıcaklığına ulaşıyor ve bu nedenle sıcak değil.
(-) Benzer cihazların avuç içi dayanağı alanının ortalama sıcaklığı 27.5 °C / 81.5 F (-5.9 °C / -10.6 F) idi.
Razer Blade Stealth QHD i7-7500U ses analizi
(±) | hoparlör ses yüksekliği ortalama ama iyi (80.6 dB)
Bas 100 - 315Hz
(±) | azaltılmış bas - ortalama olarak medyandan 8% daha düşük
(±) | Bas doğrusallığı ortalamadır (13.9% delta - önceki frekans)
Ortalar 400 - 2000 Hz
(±) | daha yüksek ortalar - ortalama olarak medyandan 5.4% daha yüksek
(±) | Ortaların doğrusallığı ortalamadır (7.5% delta - önceki frekans)
Yüksekler 2 - 16 kHz
(+) | dengeli yüksekler - medyandan yalnızca 3.6% uzakta
(+) | yüksekler doğrusaldır (5.7% deltadan önceki frekansa)
Toplam 100 - 16.000 Hz
(+) | genel ses doğrusaldır (14% ortancaya göre fark)
Aynı sınıfla karşılaştırıldığında
» Bu sınıftaki tüm test edilen cihazların %9%'si daha iyi, 4% benzer, 87% daha kötüydü
» En iyisinin deltası 7% idi, ortalama 21% idi, en kötüsü 53% idi
Test edilen tüm cihazlarla karşılaştırıldığında
» Test edilen tüm cihazların %16'si daha iyi, 4 benzer, % 80 daha kötüydü
» En iyisinin deltası 4% idi, ortalama 24% idi, en kötüsü 134% idi
Apple MacBook 12 (Early 2016) 1.1 GHz ses analizi
(+) | hoparlörler nispeten yüksek sesle çalabilir (83.6 dB)
Bas 100 - 315Hz
(±) | azaltılmış bas - ortalama olarak medyandan 11.3% daha düşük
(±) | Bas doğrusallığı ortalamadır (14.2% delta - önceki frekans)
Ortalar 400 - 2000 Hz
(+) | dengeli ortalar - medyandan yalnızca 2.4% uzakta
(+) | orta frekanslar doğrusaldır (5.5% deltadan önceki frekansa)
Yüksekler 2 - 16 kHz
(+) | dengeli yüksekler - medyandan yalnızca 2% uzakta
(+) | yüksekler doğrusaldır (4.5% deltadan önceki frekansa)
Toplam 100 - 16.000 Hz
(+) | genel ses doğrusaldır (10.2% ortancaya göre fark)
Aynı sınıfla karşılaştırıldığında
» Bu sınıftaki tüm test edilen cihazların %7%'si daha iyi, 2% benzer, 91% daha kötüydü
» En iyisinin deltası 5% idi, ortalama 18% idi, en kötüsü 53% idi
Test edilen tüm cihazlarla karşılaştırıldığında
» Test edilen tüm cihazların %5'si daha iyi, 1 benzer, % 94 daha kötüydü
» En iyisinin deltası 4% idi, ortalama 24% idi, en kötüsü 134% idi
| Kapalı / Bekleme modu | |
| Boşta | |
| Çalışırken |
|
Key:
min: | |
| Razer Blade Stealth QHD i7-7500U i7-7500U, HD Graphics 620, Samsung PM951 NVMe MZVLV256, , 2560x1440, 12.5" | Razer Blade Stealth UHD i7-6500U 6500U, HD Graphics 520, Samsung PM951 NVMe MZ-VLV256D, IPS IGZO, 3840x2160, 12.5" | Dell XPS 13 9360 QHD+ i5 i5-7200U, HD Graphics 620, Toshiba NVMe THNSN5256GPUK, , 3200x1800, 13.3" | Lenovo IdeaPad 710S-13ISK 6560U, Iris Graphics 540, Samsung PM951 NVMe MZVLV256, IPS, 1920x1080, 13.3" | Asus Zenbook UX305UA-FC040T 6500U, HD Graphics 520, SK Hynix Canvas SC300 512GB M.2 (HFS512G39MND), IPS, 1920x1080, 13.3" | Acer Aspire S 13 S5-371-71QZ 6500U, HD Graphics 520, LiteOn CV1-8B512, IPS, 1920x1080, 13.3" | |
|---|---|---|---|---|---|---|
| Power Consumption | -60% | 18% | 3% | 18% | 10% | |
| Idle Minimum * (Watt) | 4.4 | 9 -105% | 3.7 16% | 3.3 25% | 3.2 27% | 4.1 7% |
| Idle Average * (Watt) | 5.8 | 12.8 -121% | 6.1 -5% | 7.4 -28% | 6.5 -12% | 6.7 -16% |
| Idle Maximum * (Watt) | 8.6 | 16.8 -95% | 6.5 24% | 8.2 5% | 6.7 22% | 7.4 14% |
| Load Average * (Watt) | 35.2 | 35.7 -1% | 29.5 16% | 36.5 -4% | 30.6 13% | 32.4 8% |
| Load Maximum * (Watt) | 52 | 39.3 24% | 33 37% | 43.7 16% | 31 40% | 32.4 38% |
* ... daha küçük daha iyidir
| Razer Blade Stealth QHD i7-7500U i7-7500U, HD Graphics 620, 53.6 Wh | Razer Blade Stealth UHD i7-6500U 6500U, HD Graphics 520, 45 Wh | Dell XPS 13 9360 QHD+ i5 i5-7200U, HD Graphics 620, 60 Wh | Lenovo IdeaPad 710S-13ISK 6560U, Iris Graphics 540, 46 Wh | Asus Zenbook UX305UA-FC040T 6500U, HD Graphics 520, 56 Wh | Acer Aspire S 13 S5-371-71QZ 6500U, HD Graphics 520, 45 Wh | Medion Akoya S3409-MD60234 i7-7500U, HD Graphics 620, 45 Wh | Dell XPS 13 2016 9350 (FHD, i7-6560U) 6560U, Iris Graphics 540, 56 Wh | |
|---|---|---|---|---|---|---|---|---|
| Pil Çalışma Süresi | -43% | 17% | -11% | 33% | 5% | -23% | 12% | |
| Reader / Idle (h) | 13.6 | 7.3 -46% | 13.5 -1% | 23.8 75% | 17.1 26% | 12 -12% | 15.7 15% | |
| WiFi v1.3 (h) | 8.3 | 3.8 -54% | 8.8 6% | 7 -16% | 9.4 13% | 7.9 -5% | 4.6 -45% | 7.3 -12% |
| Load (h) | 1.8 | 1.3 -28% | 2.3 28% | 1.5 -17% | 2 11% | 1.7 -6% | 1.6 -11% | 2.4 33% |
| H.264 (h) | 9.1 | 8.1 | 9.1 | 4.1 |
Artılar
Eksiler

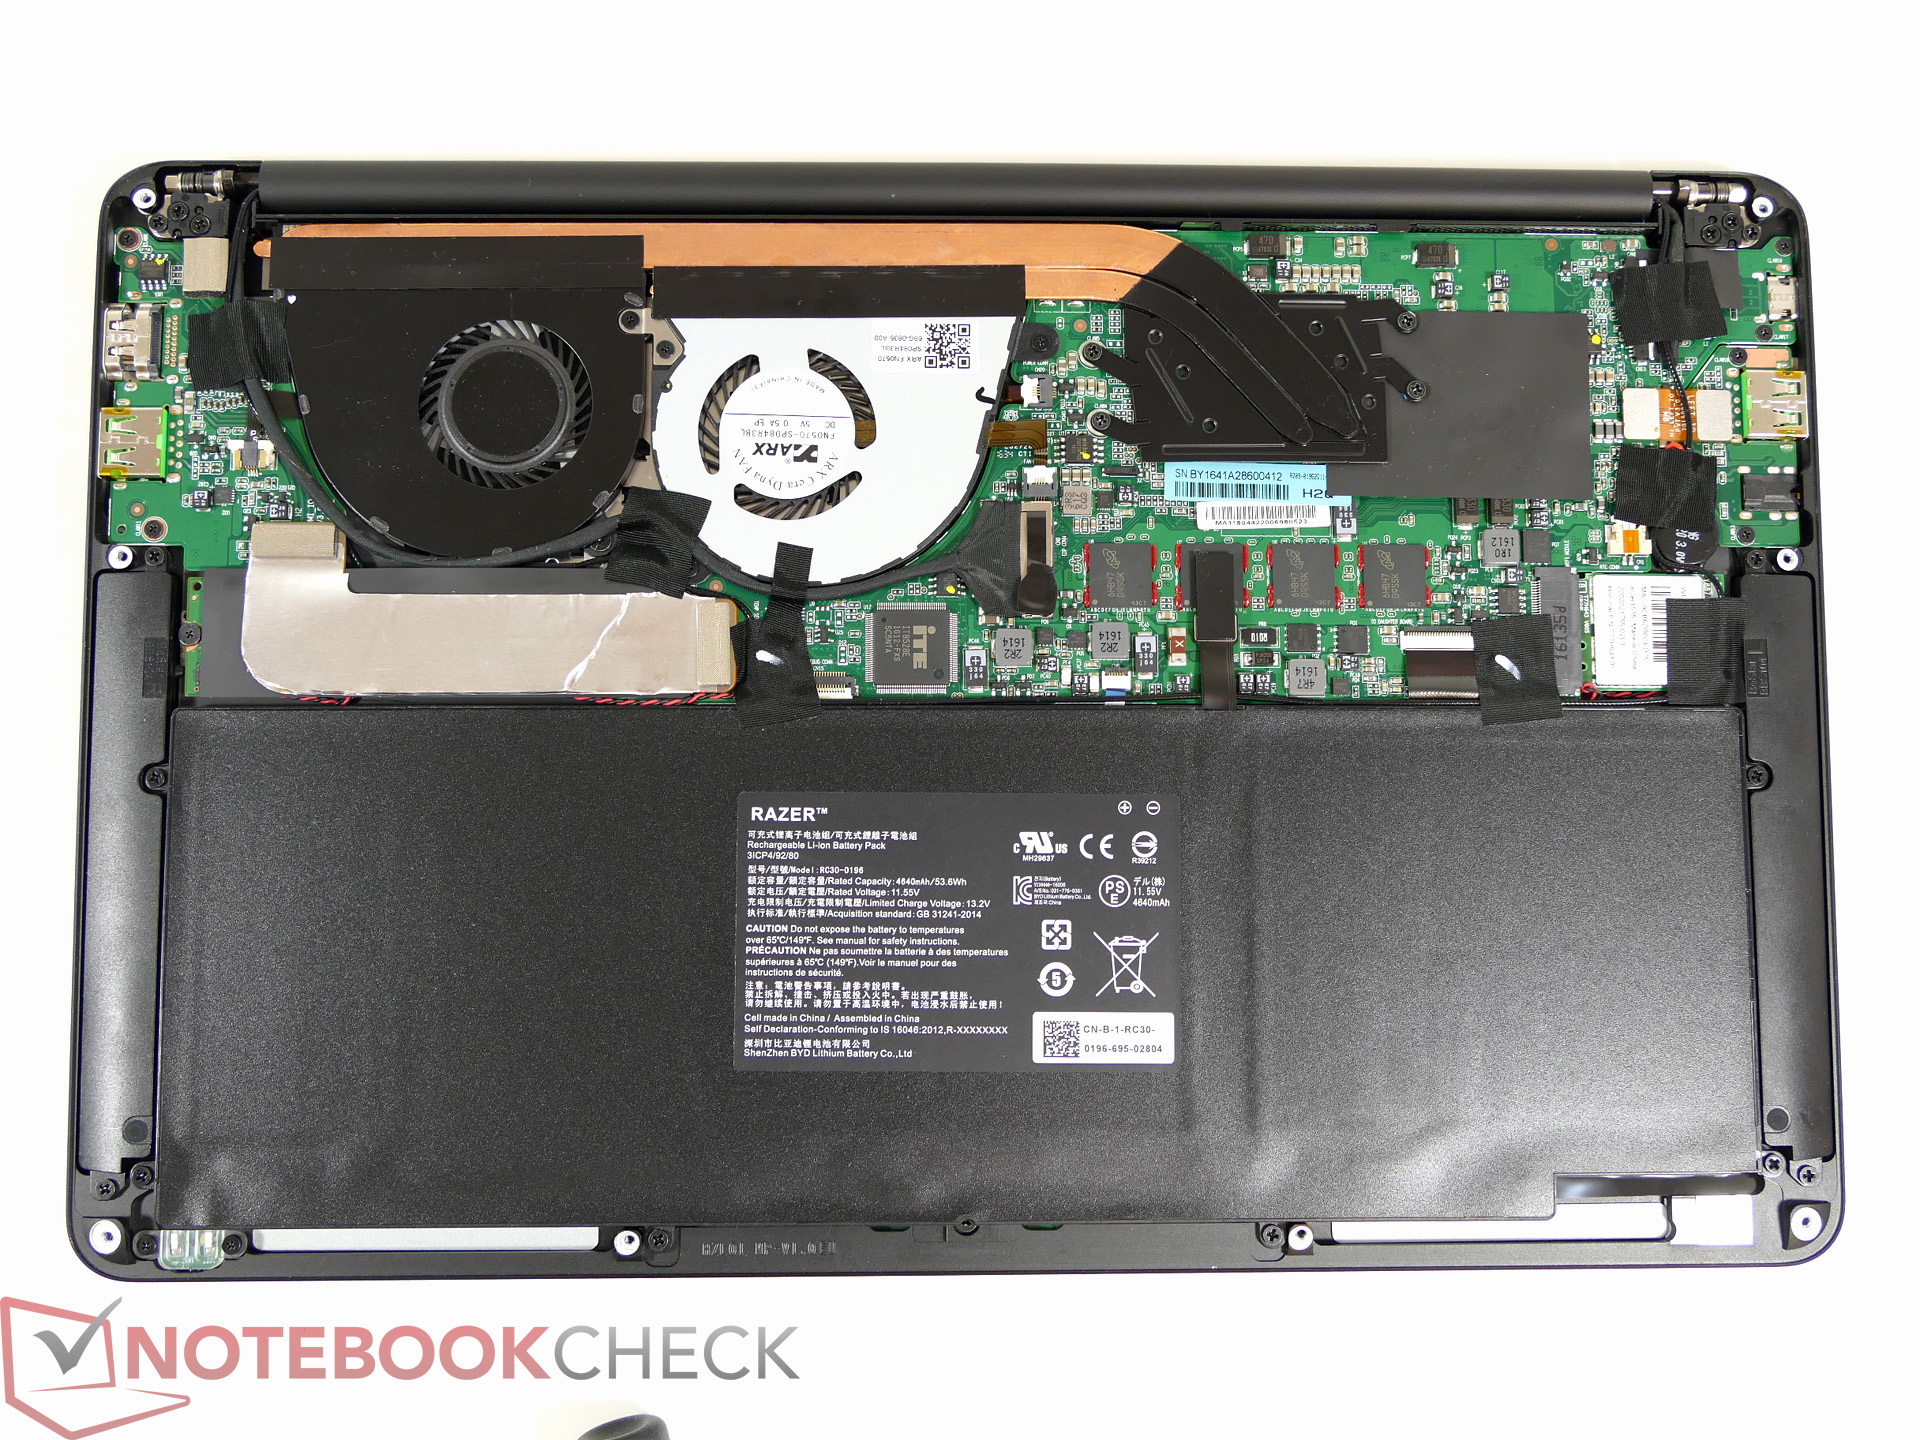
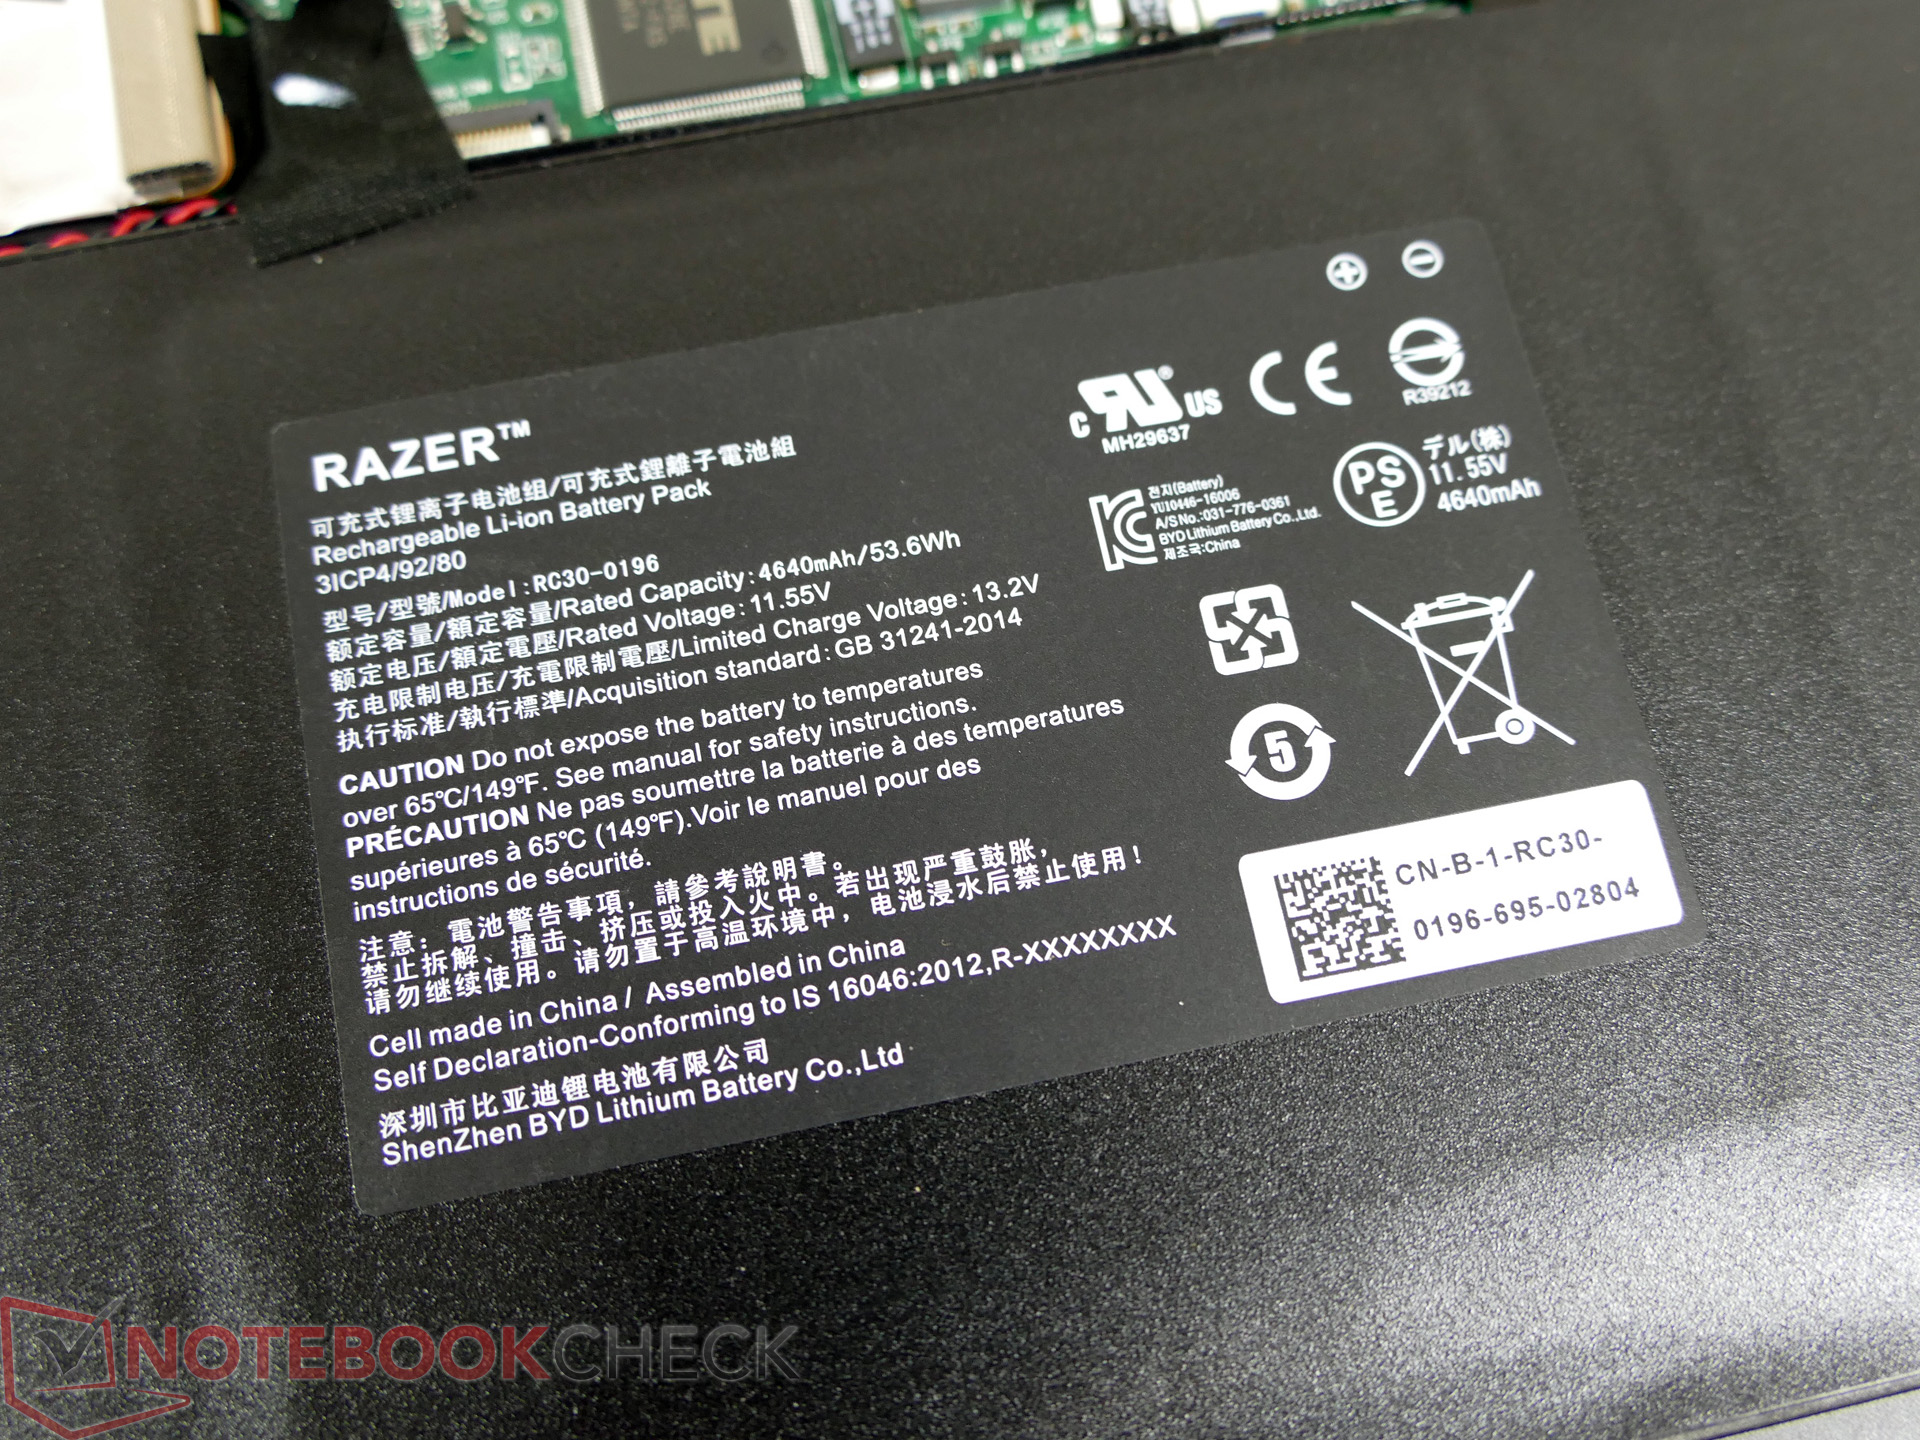
Yeni Blade Stealth modeli ile Razer en çok gol yediği ortalama batarya ömrü sorununu çözebilmiş. 8-13 saatliki kullanım süresi ile cihaz prizlerden uzak tüm bir iş gününü çıkarabilr durumda.
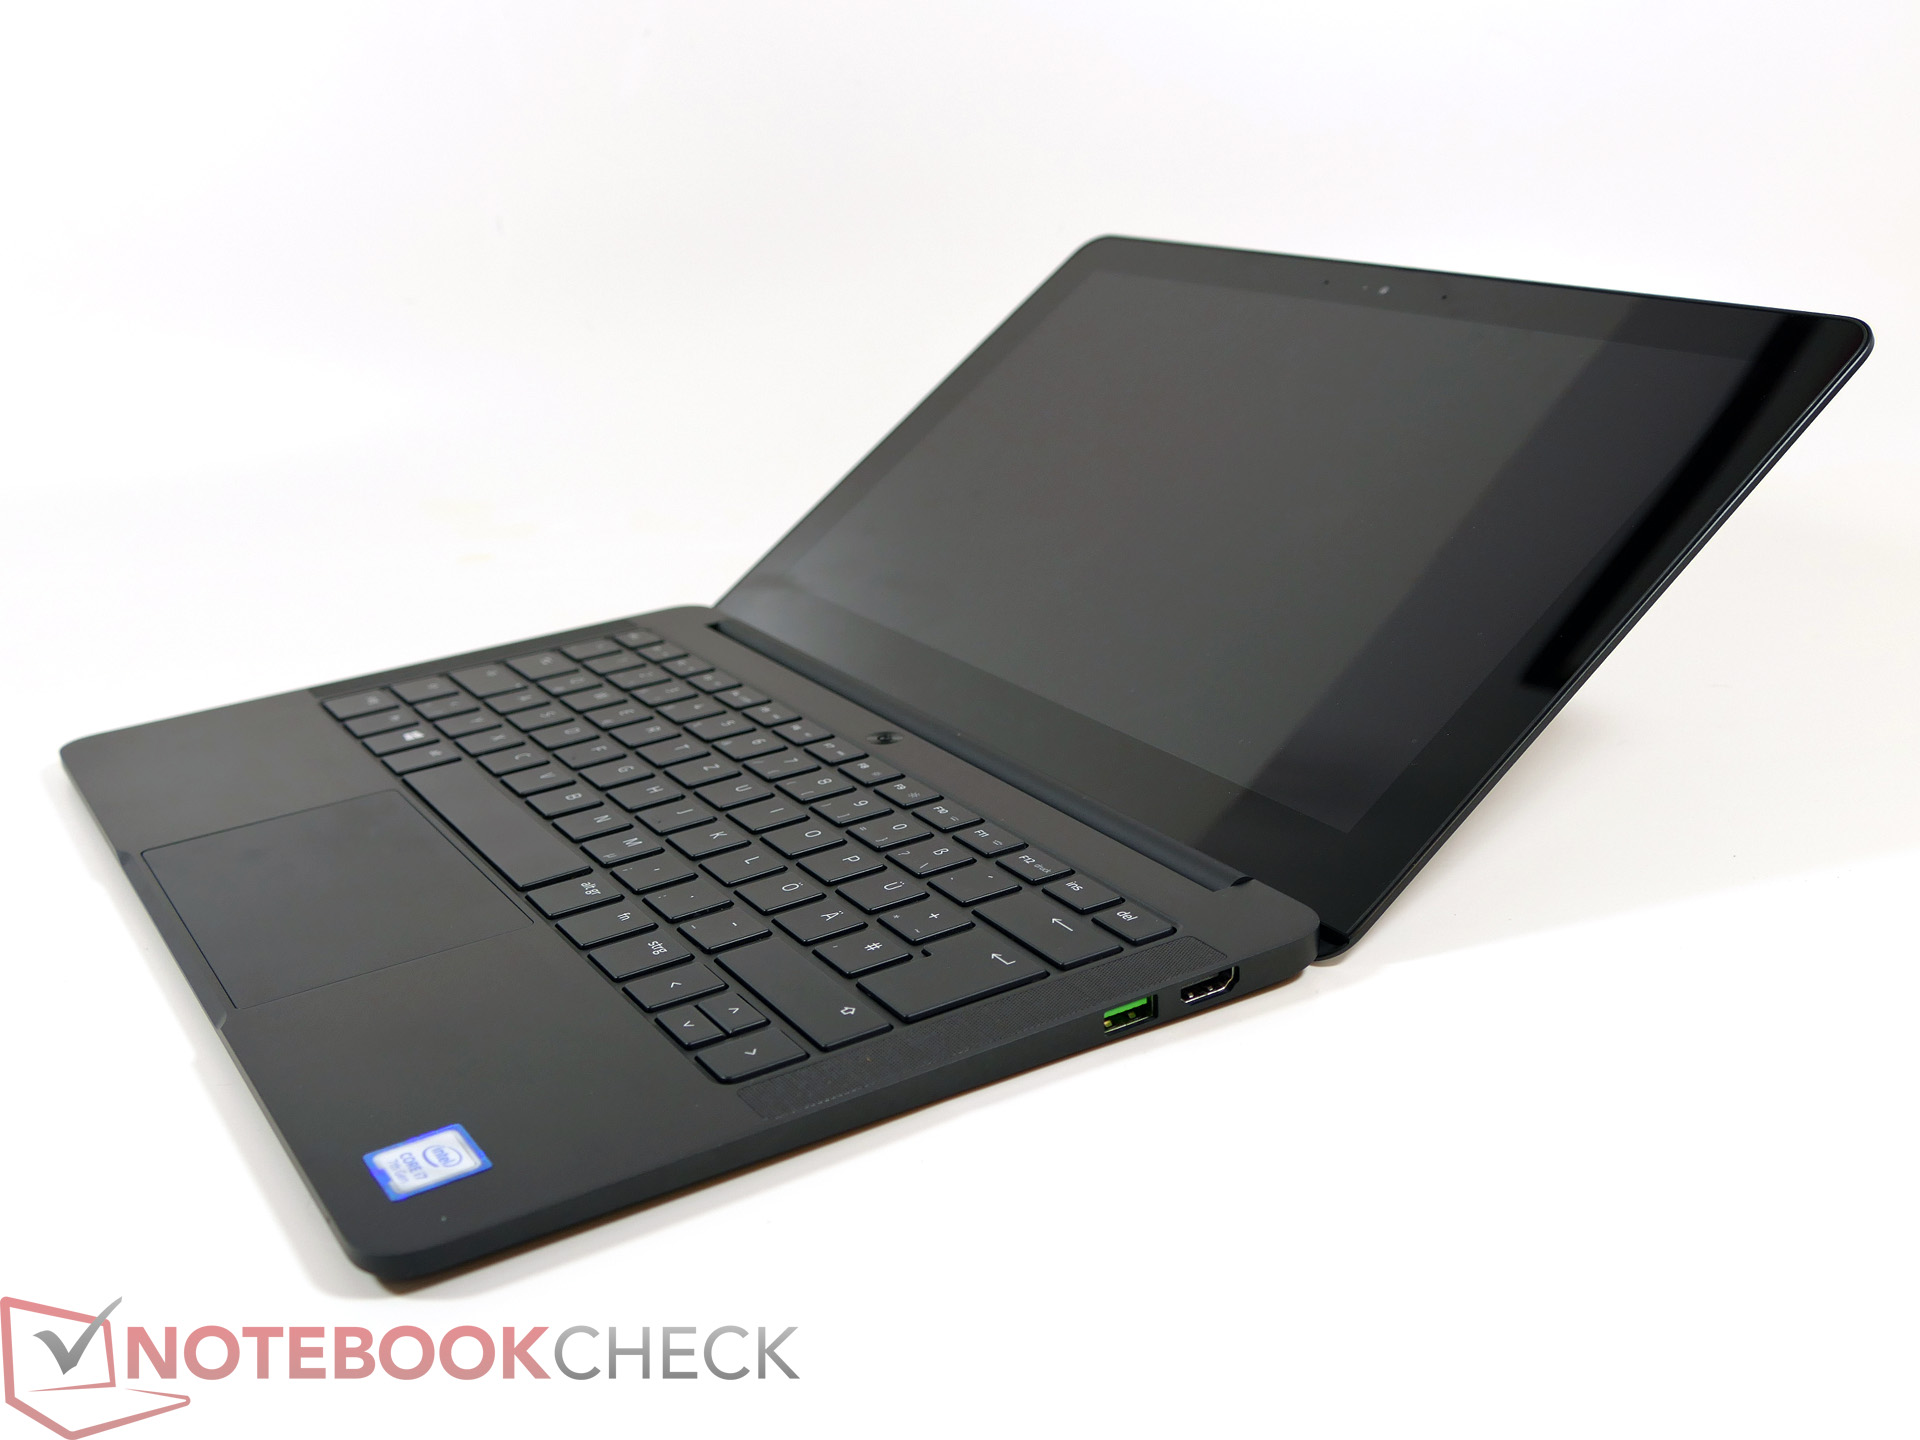
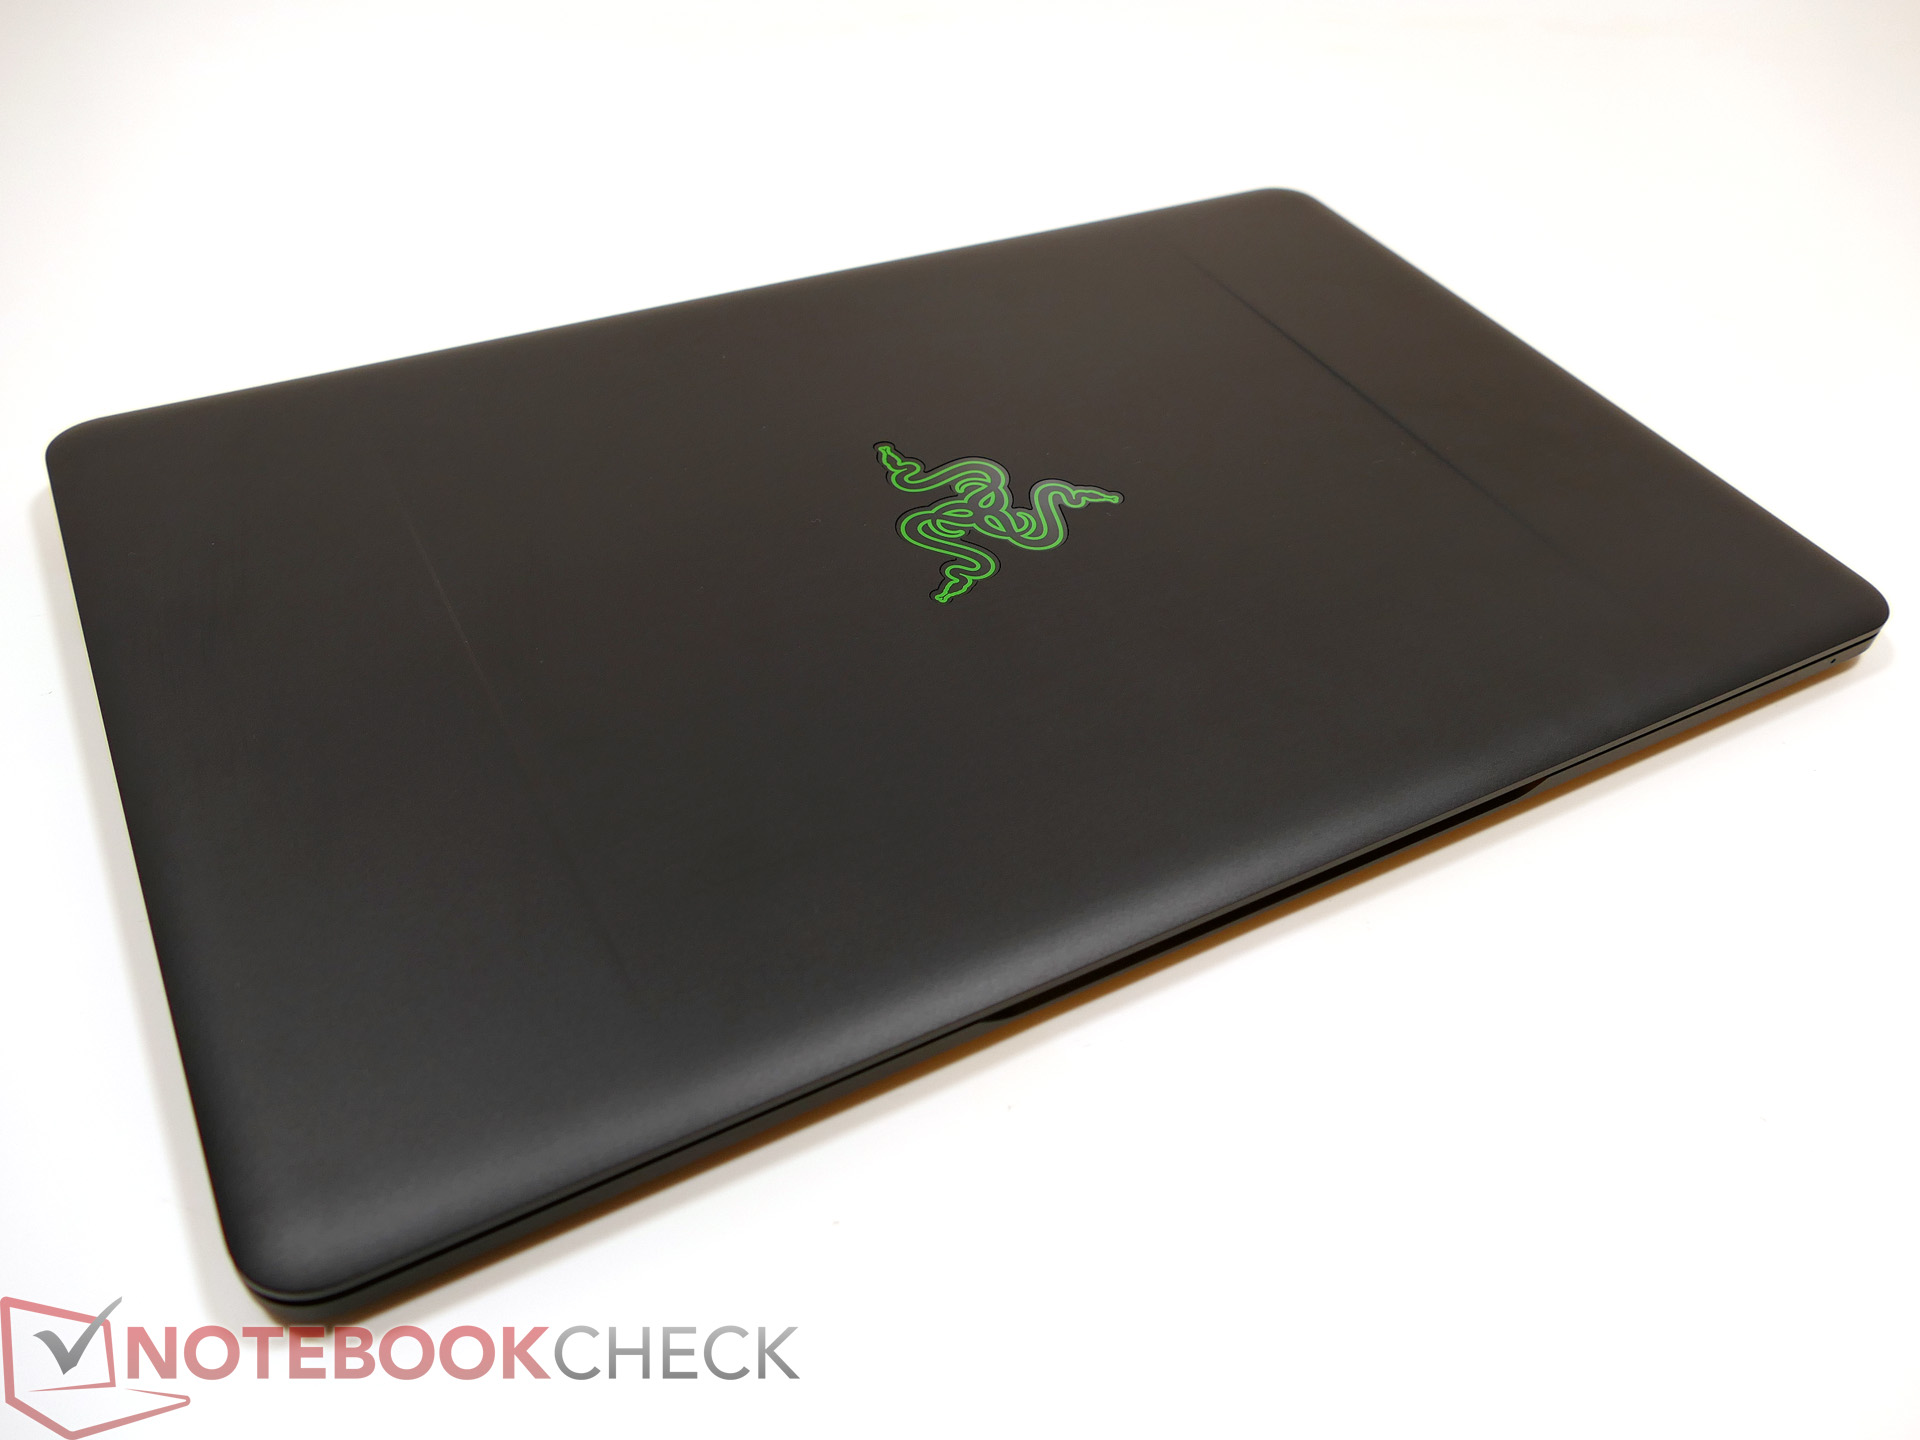
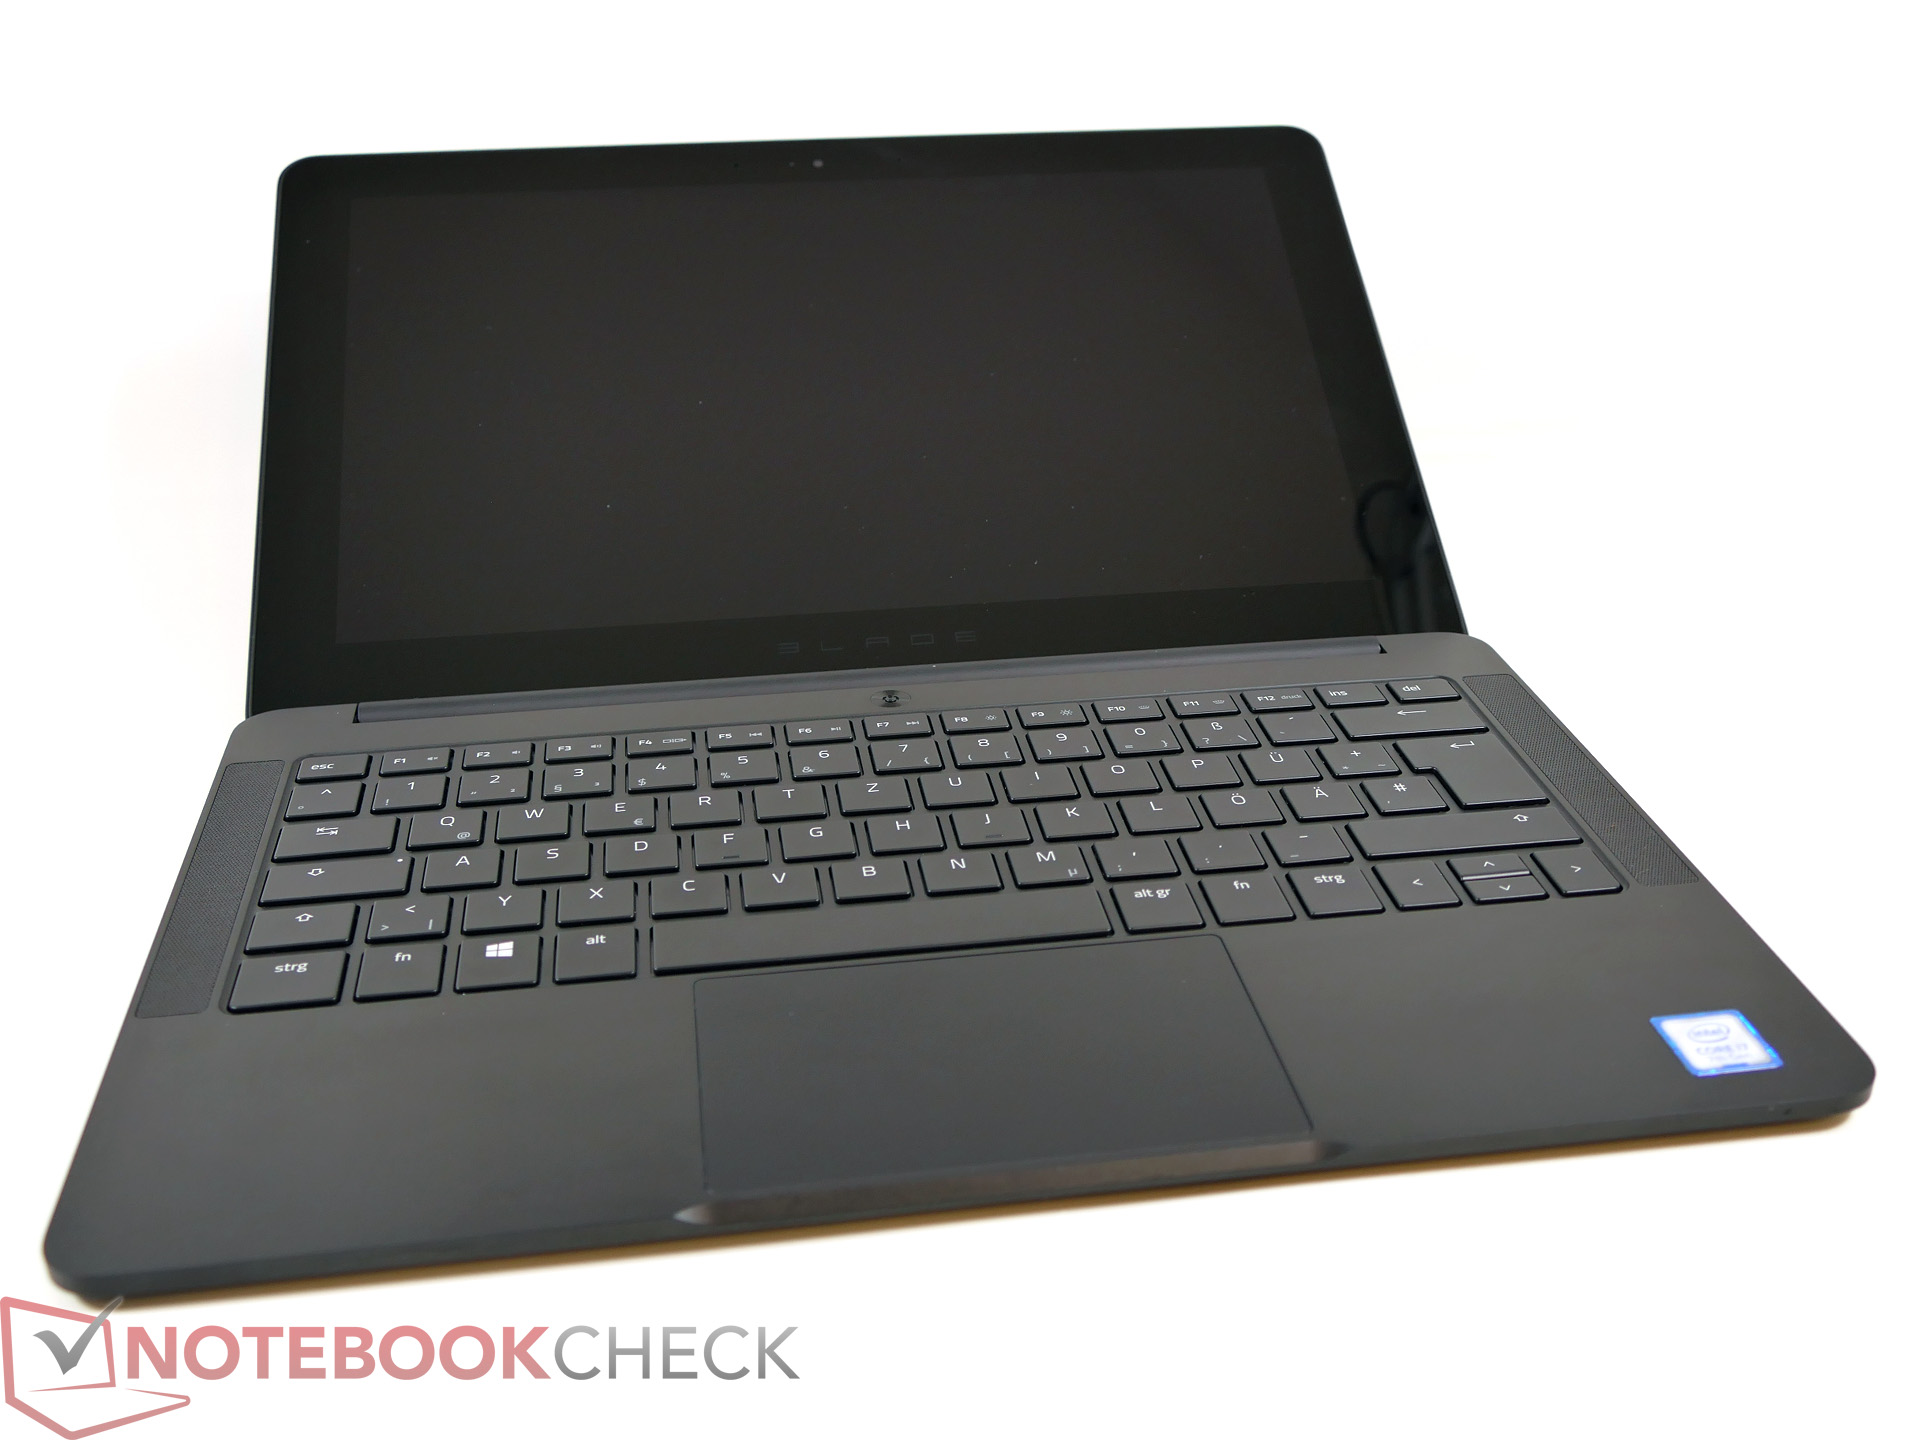
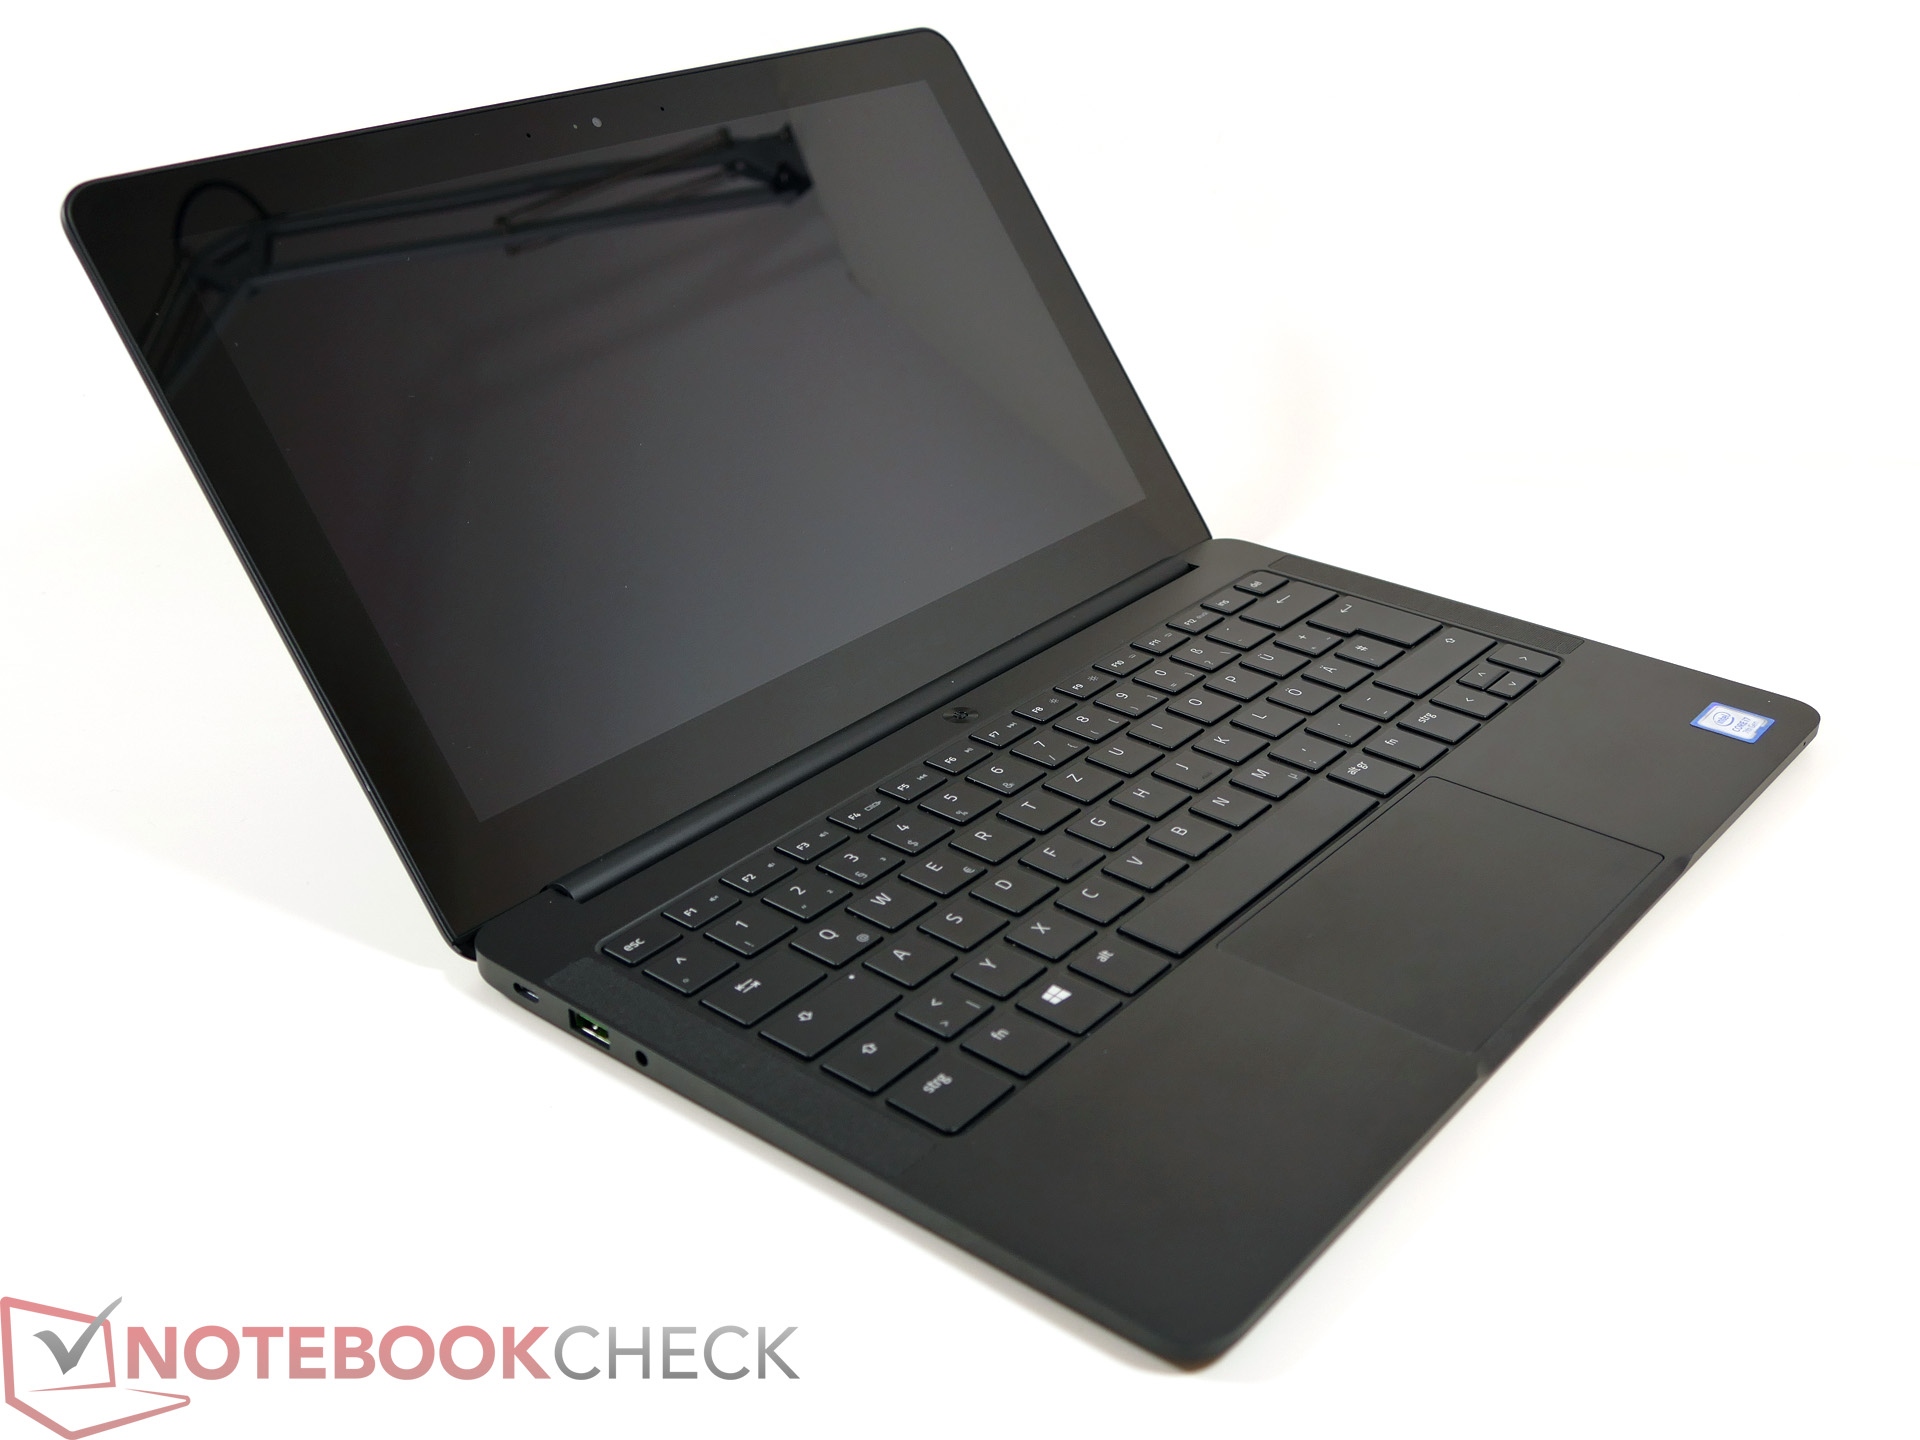
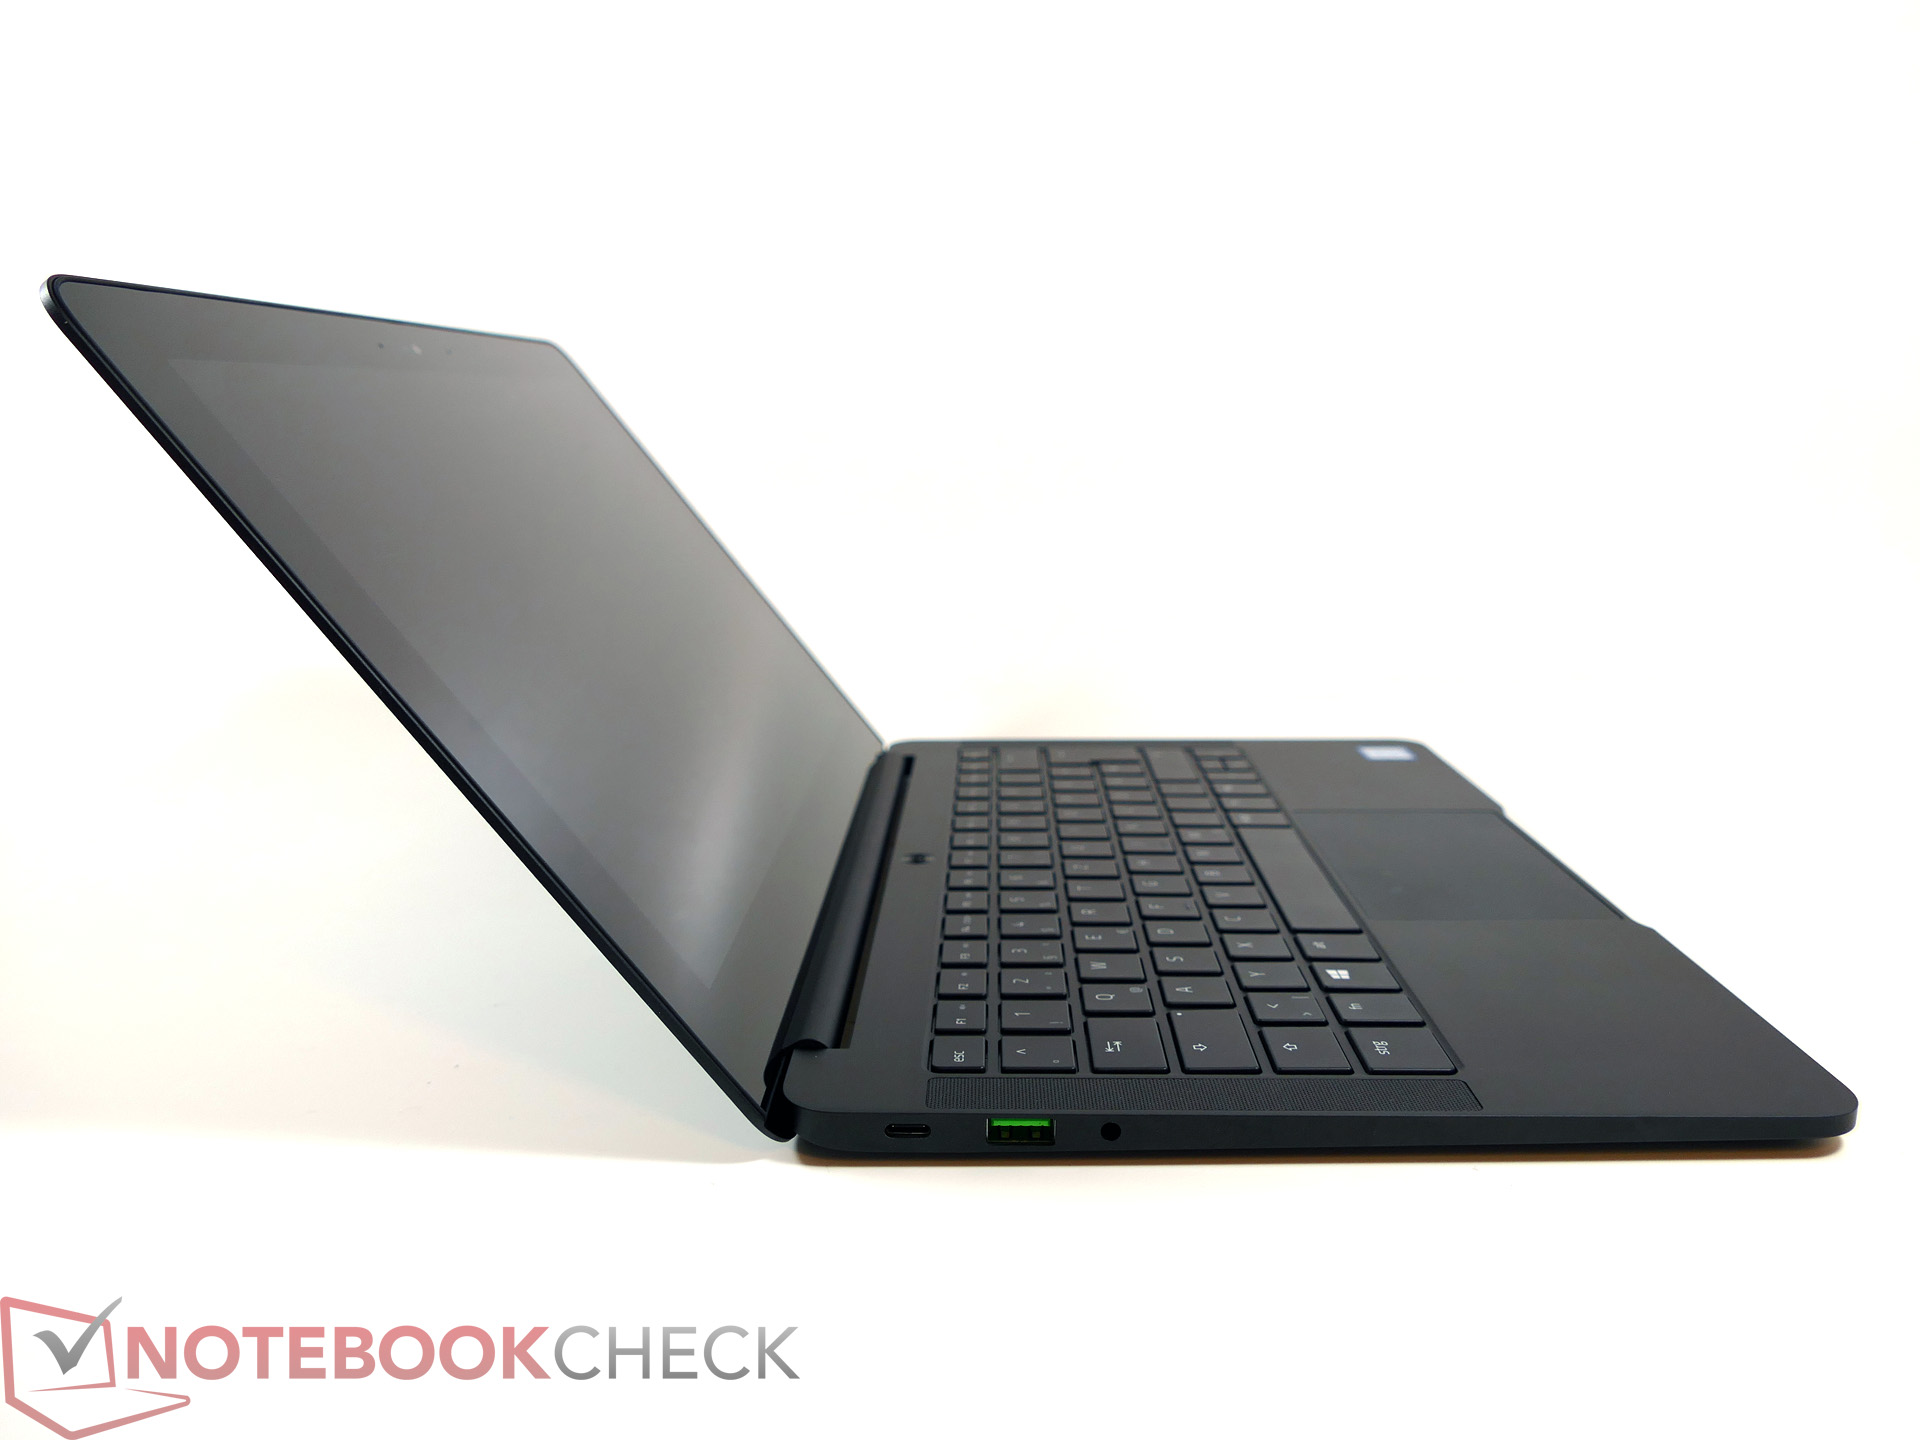
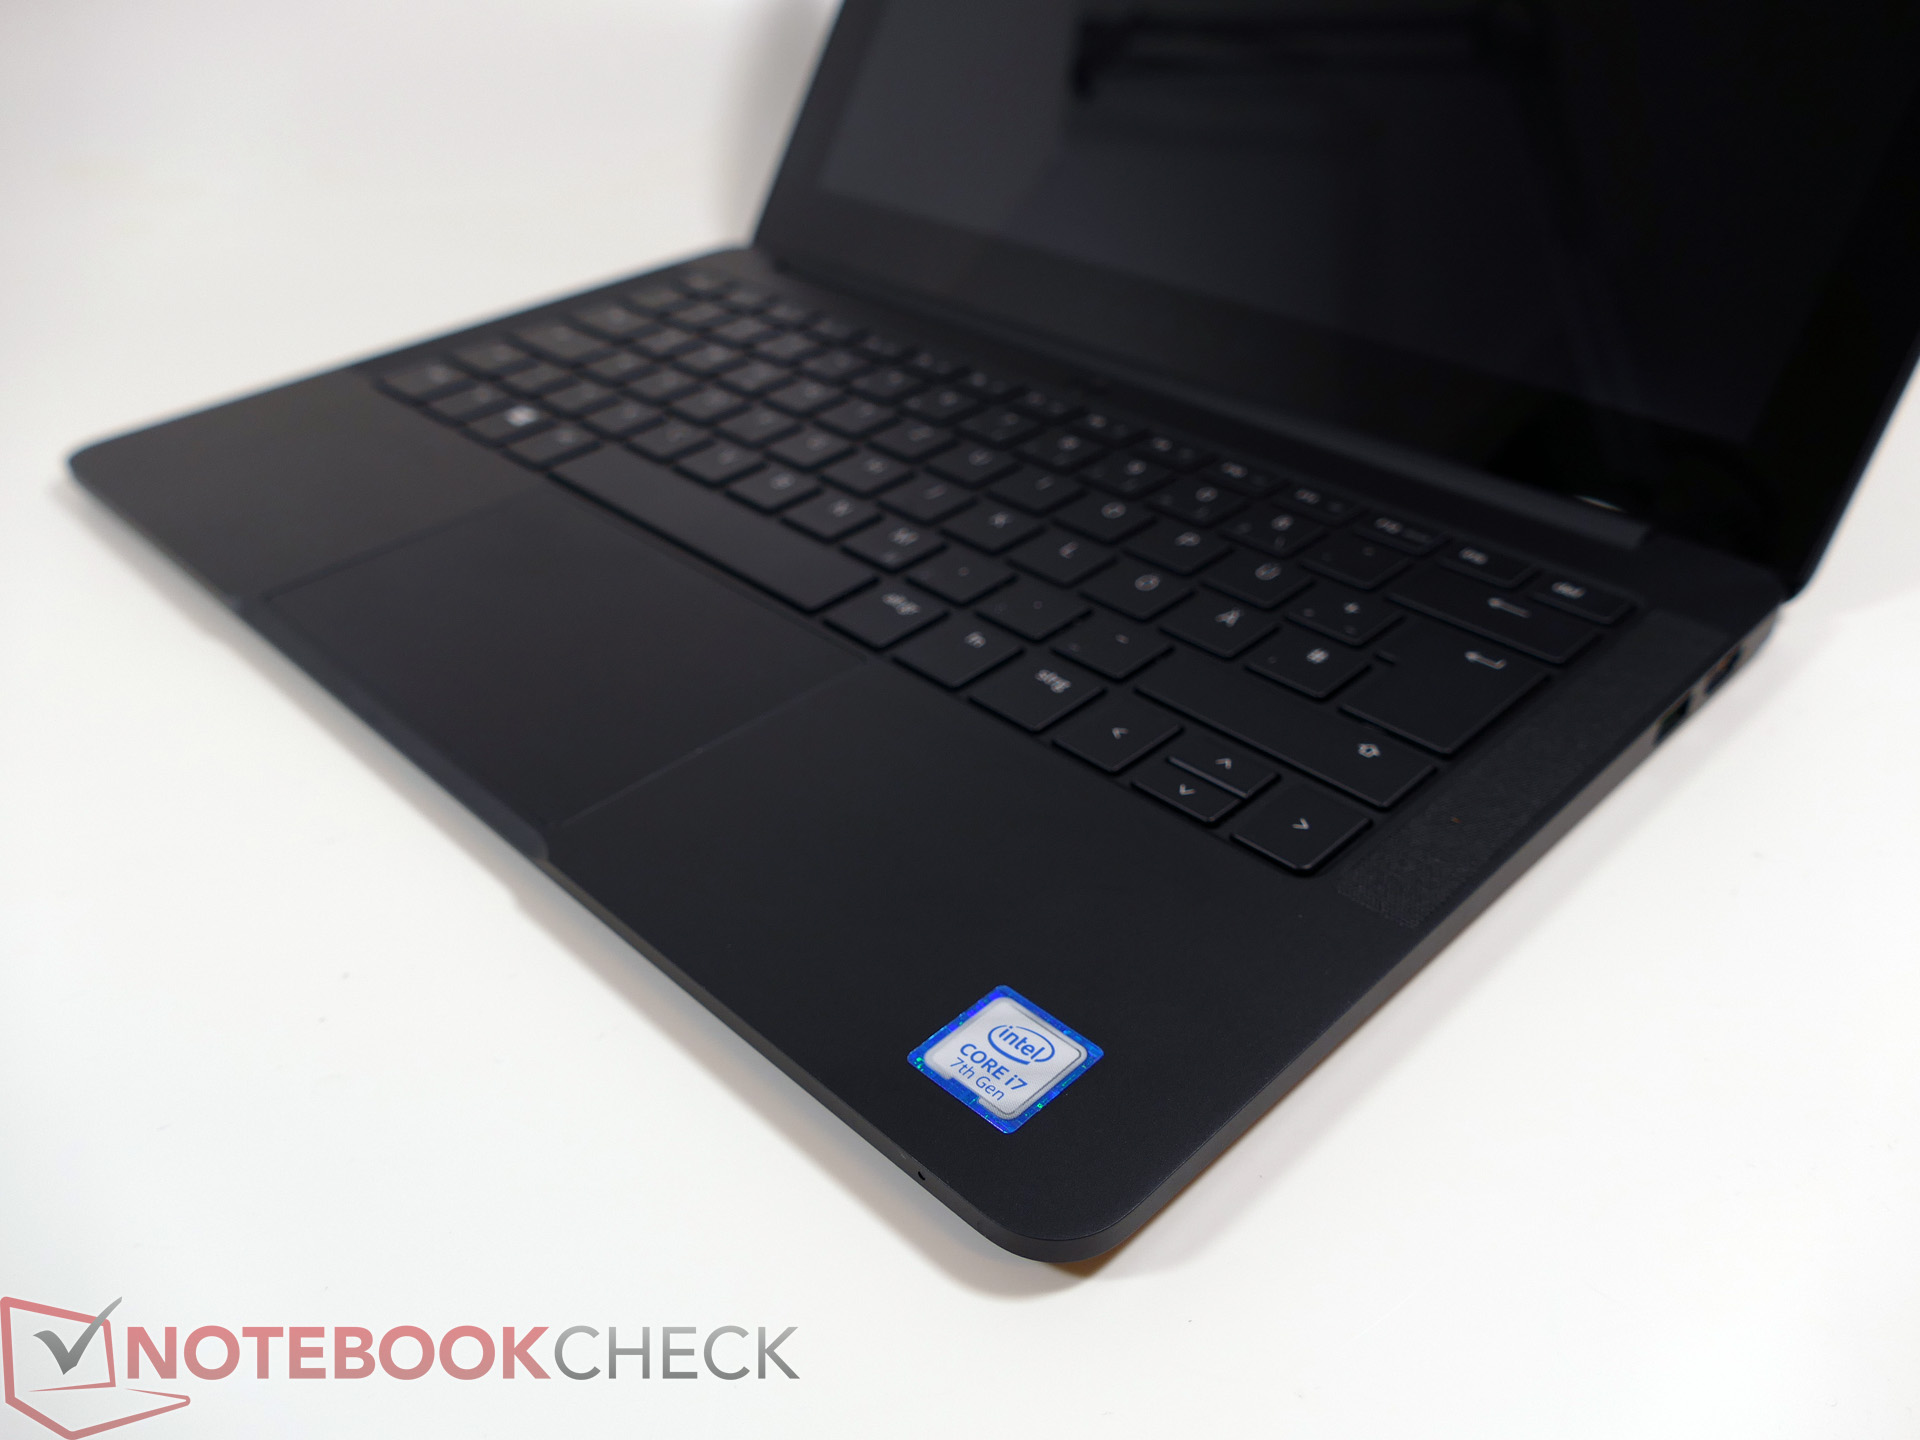
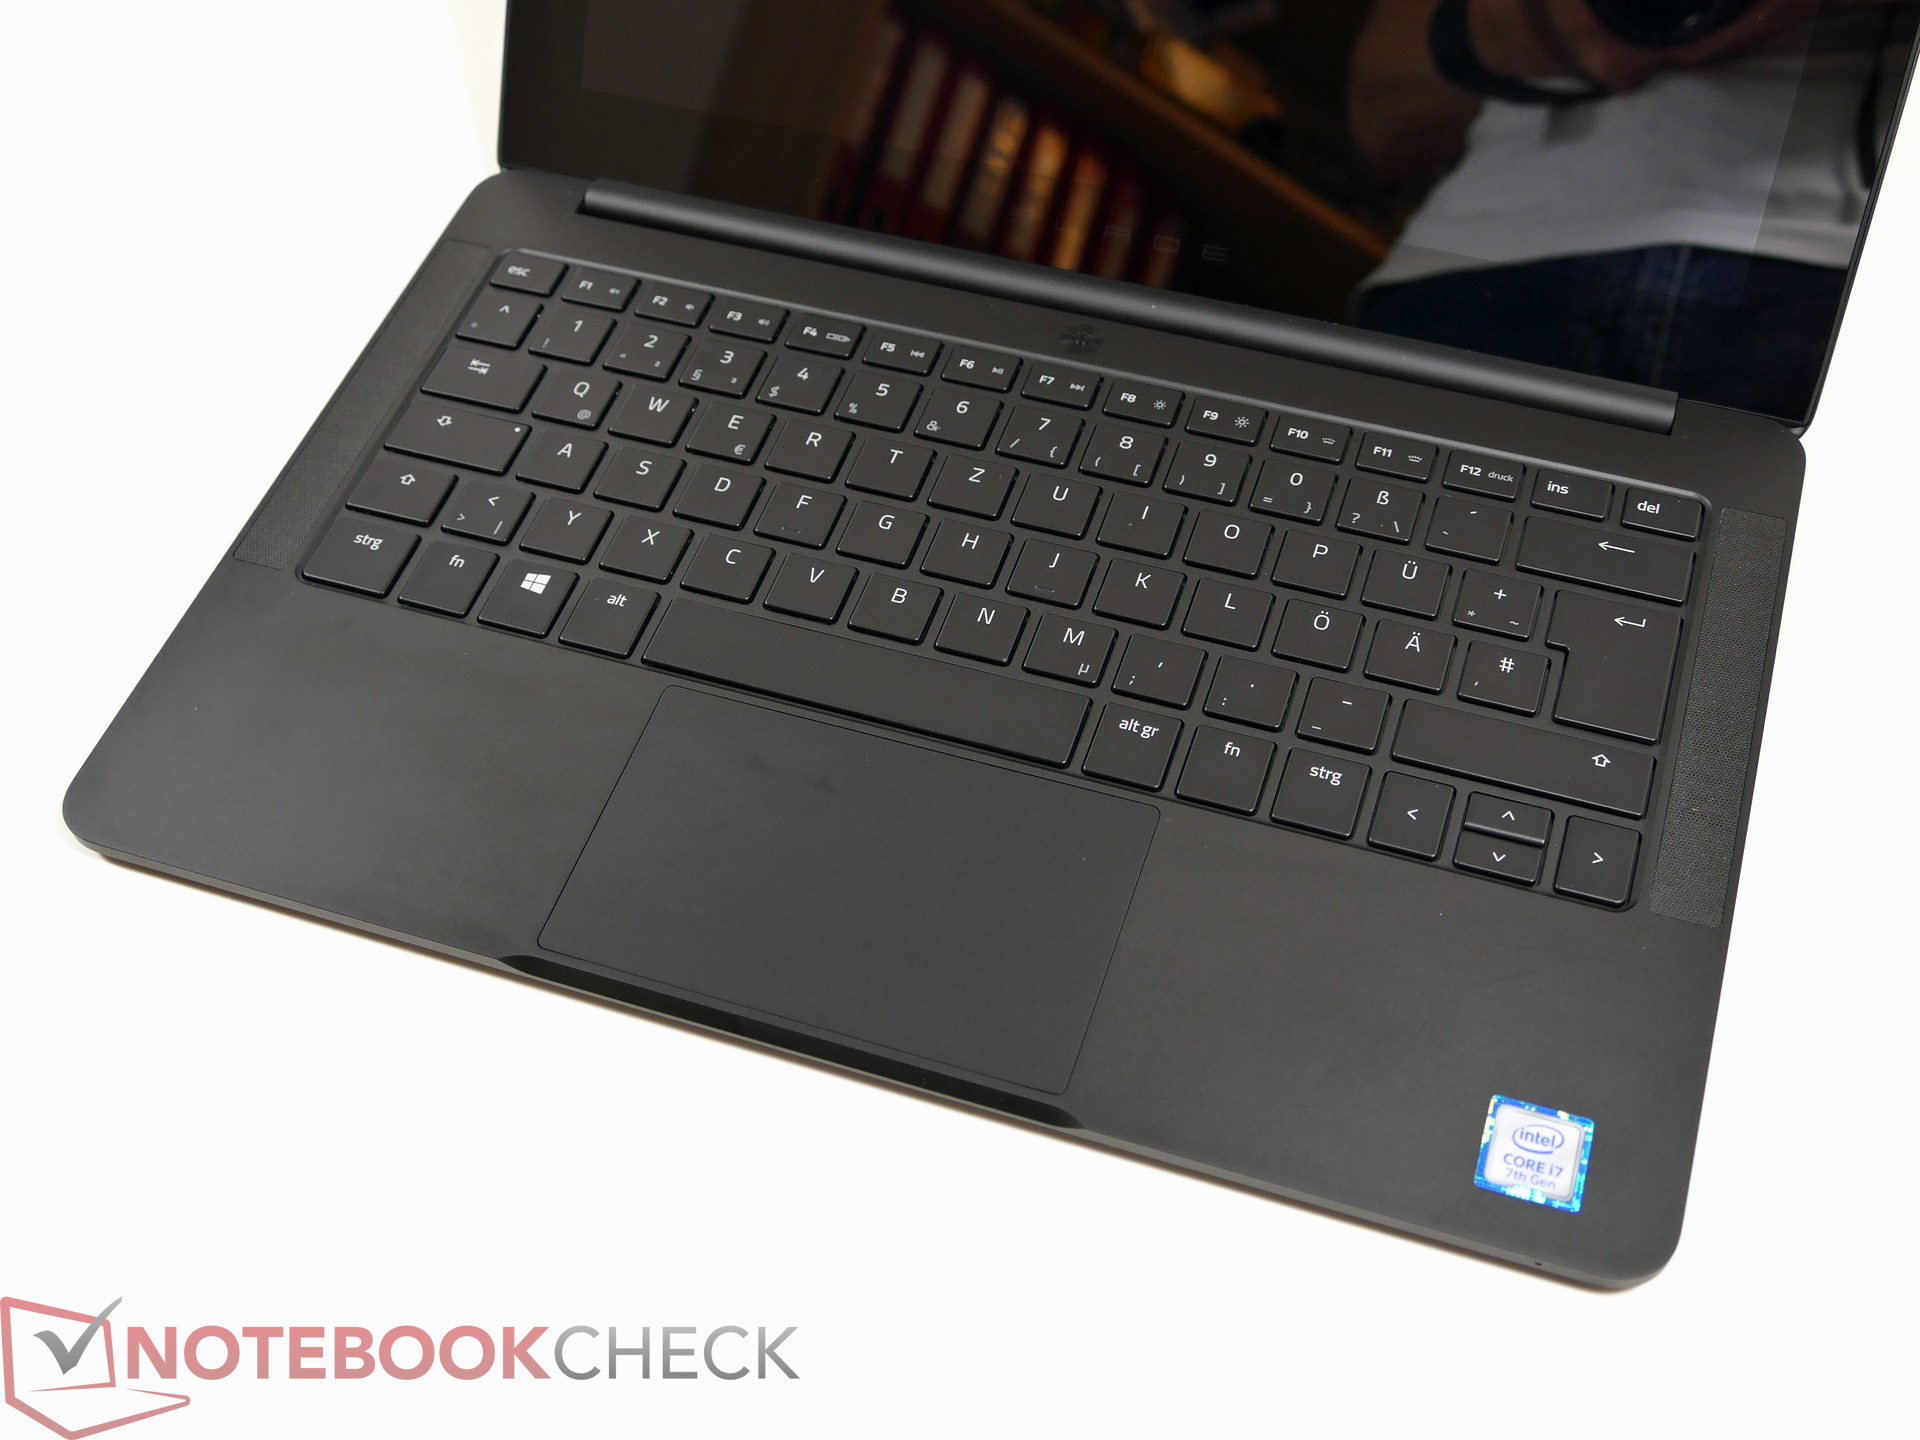
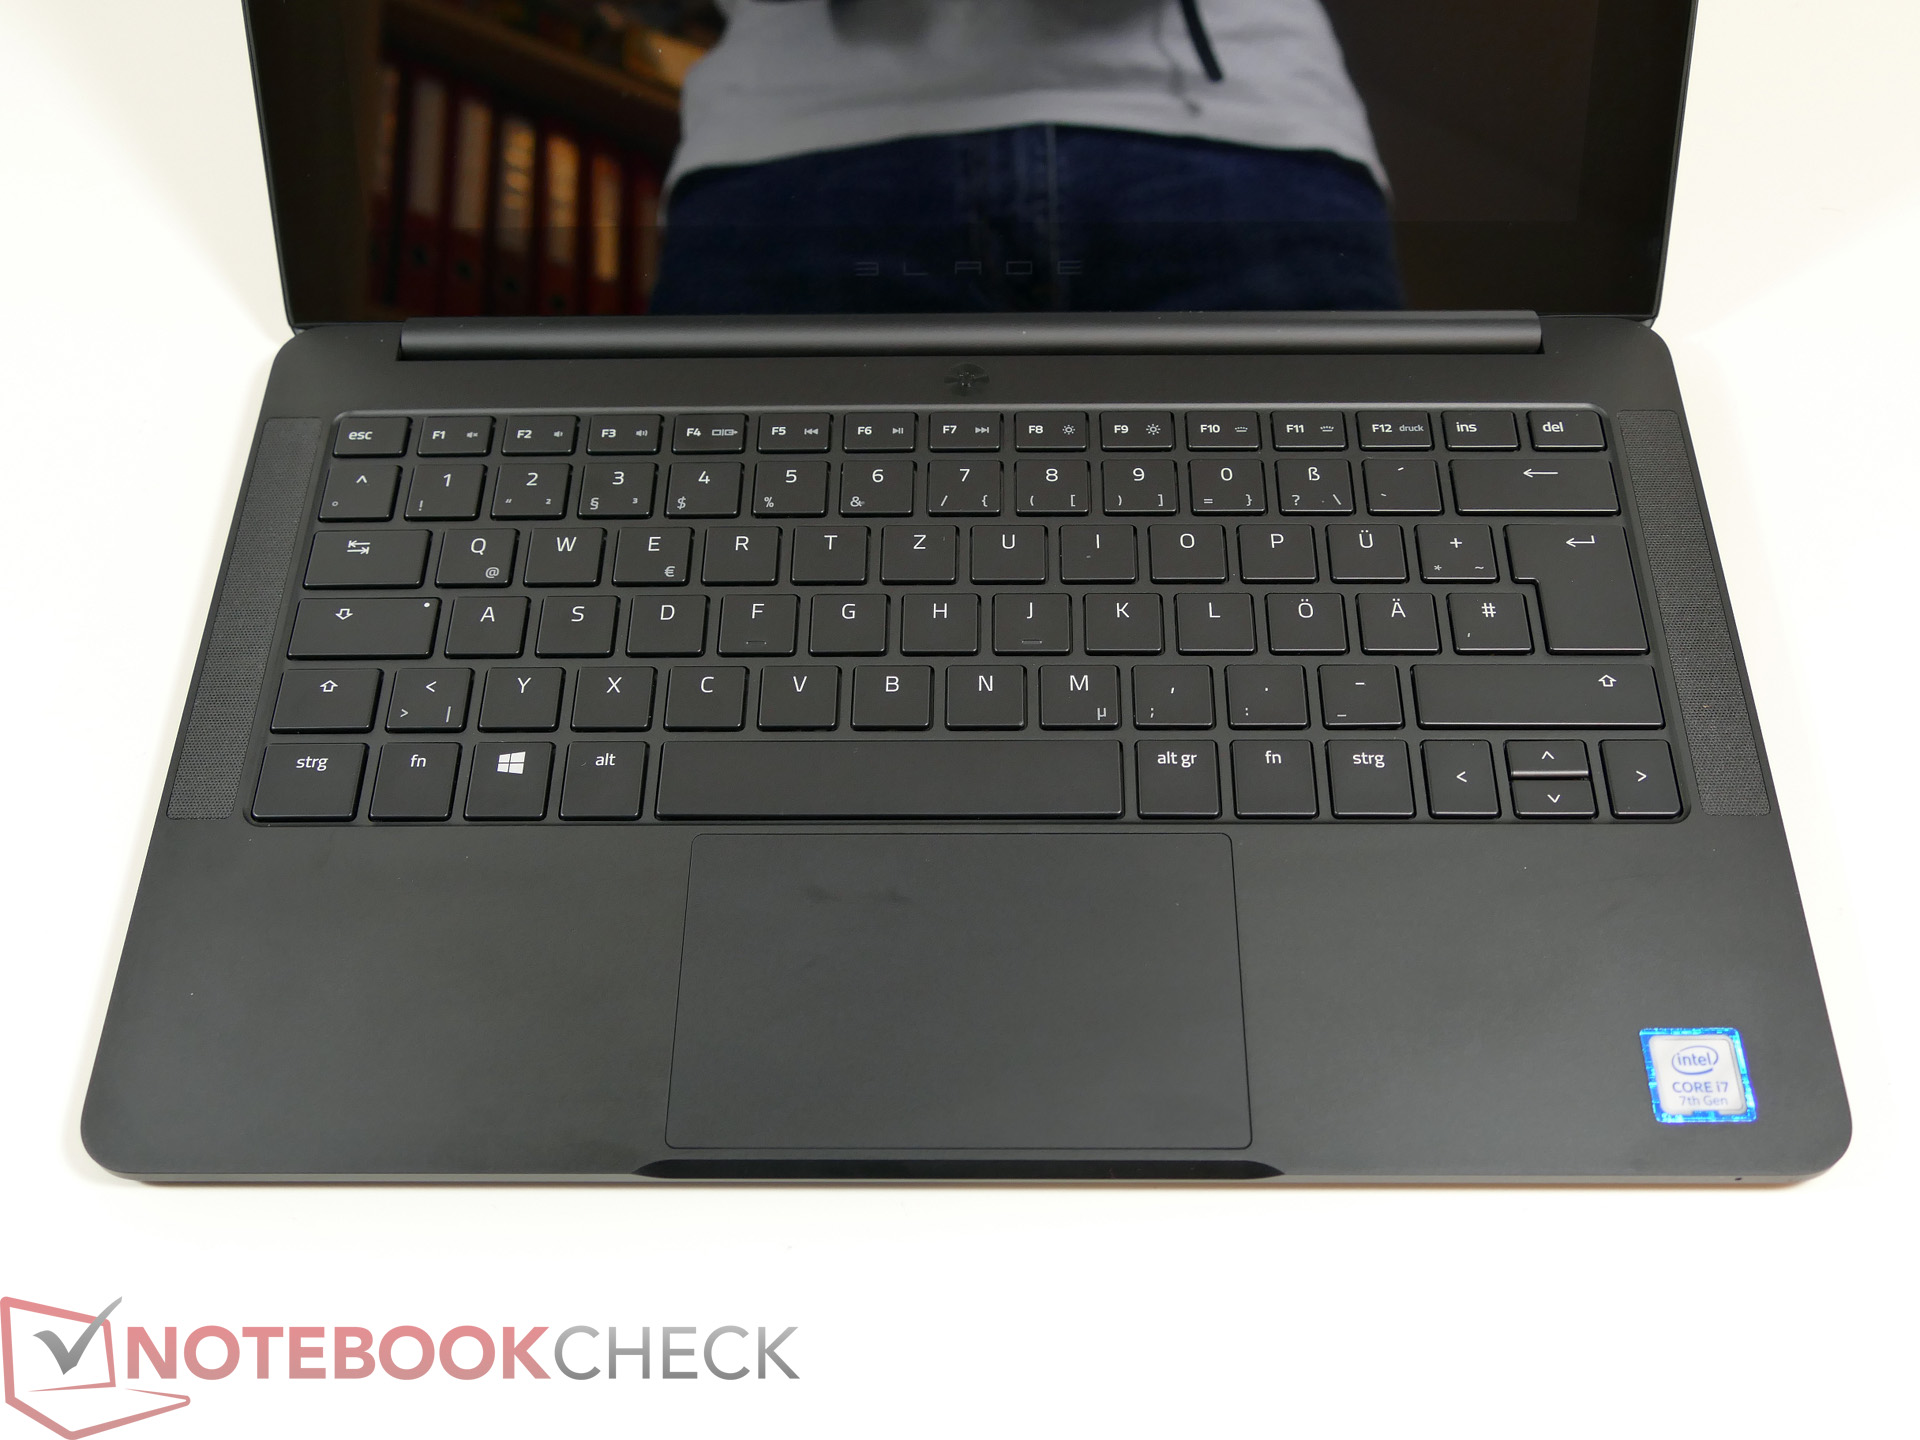
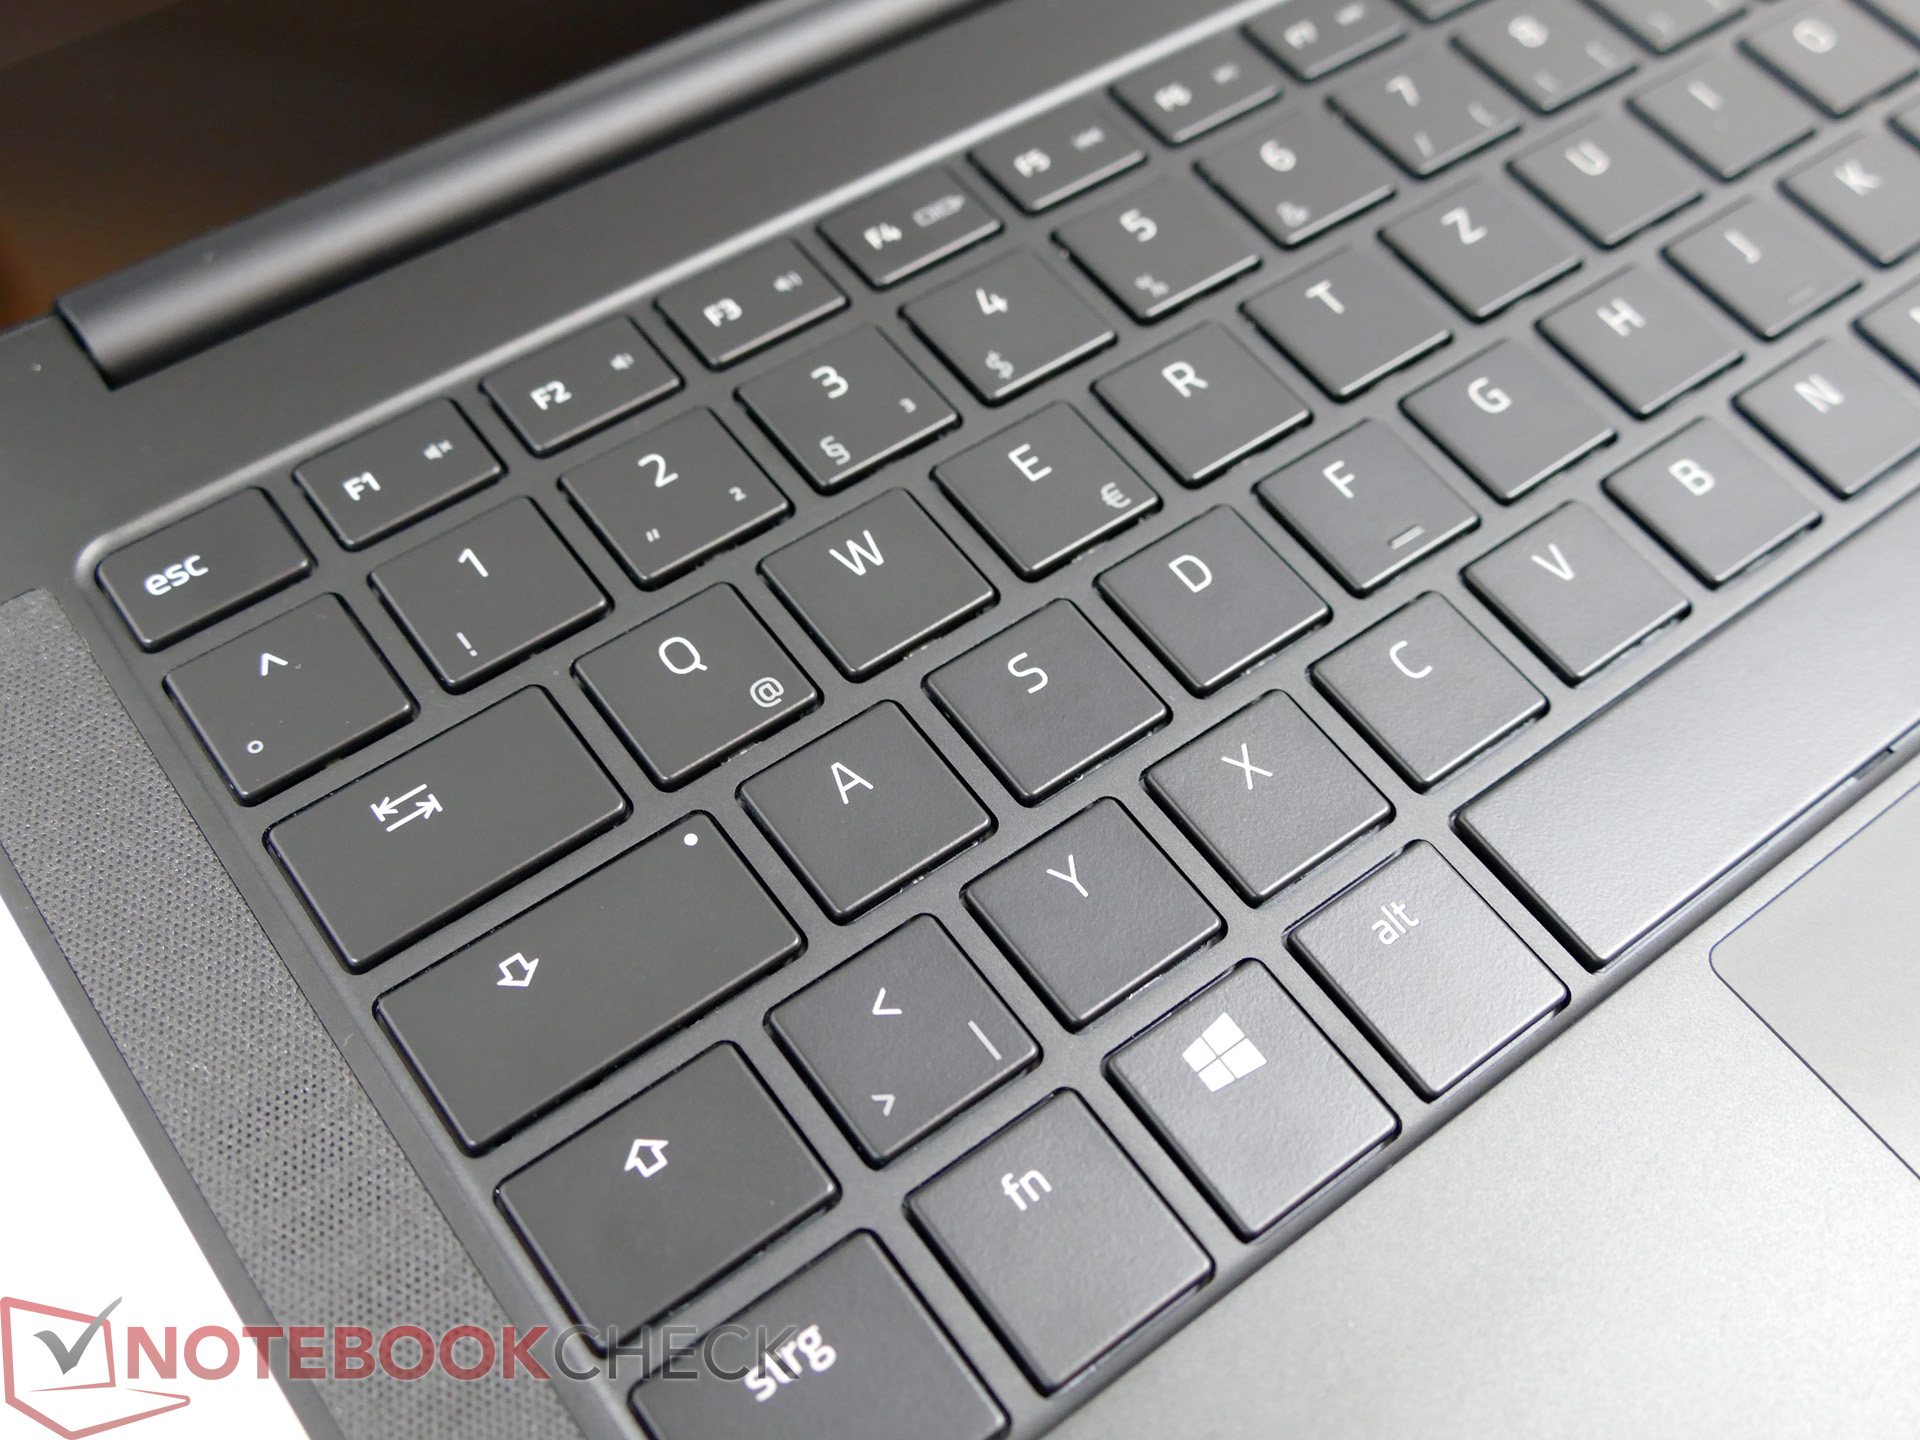
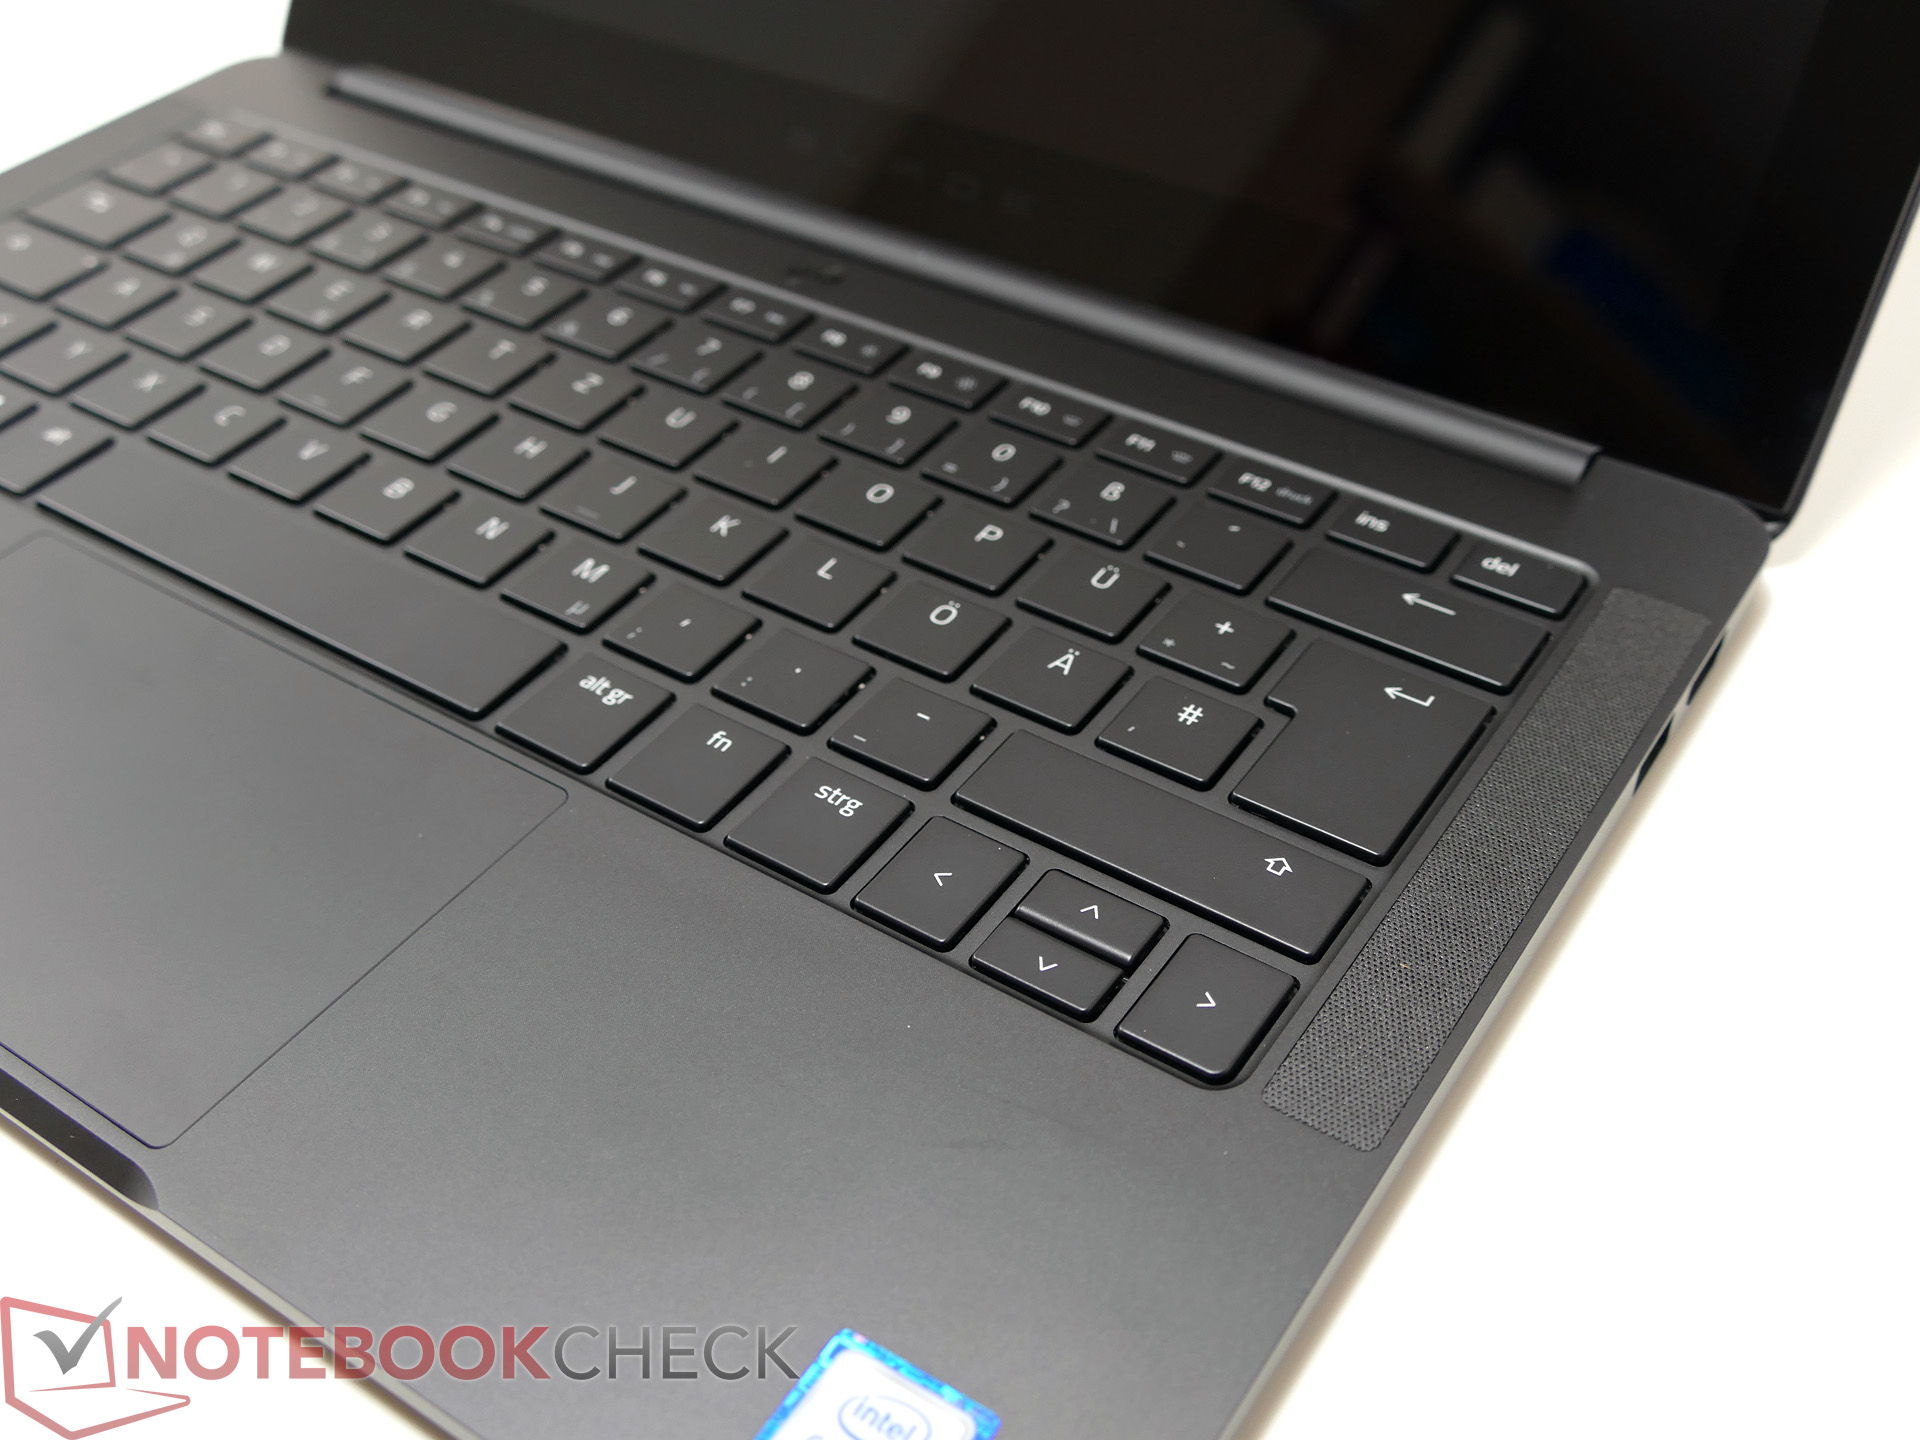
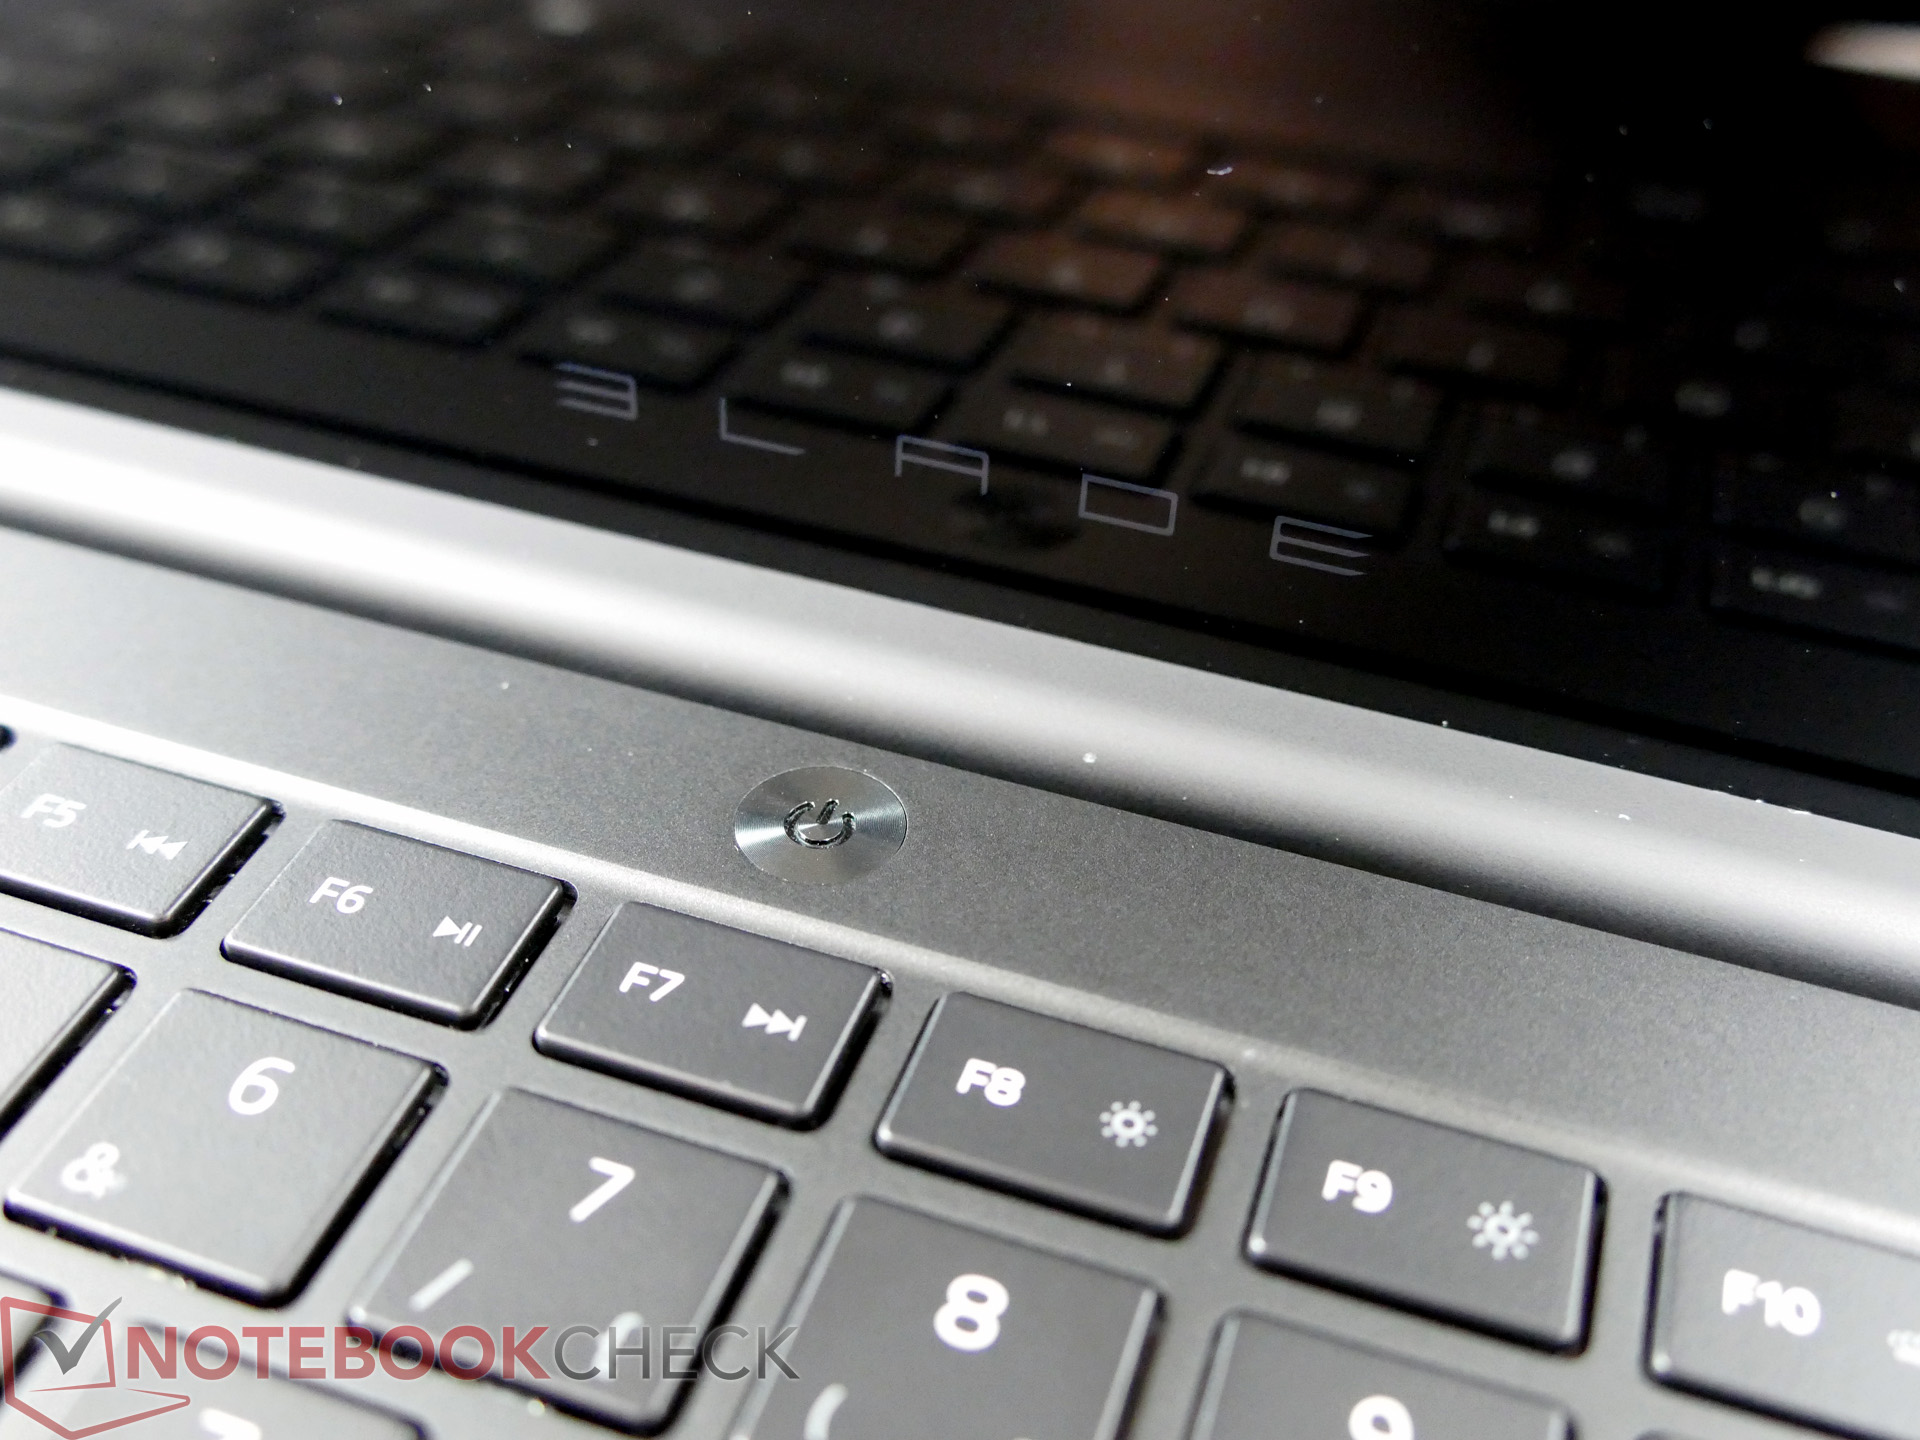
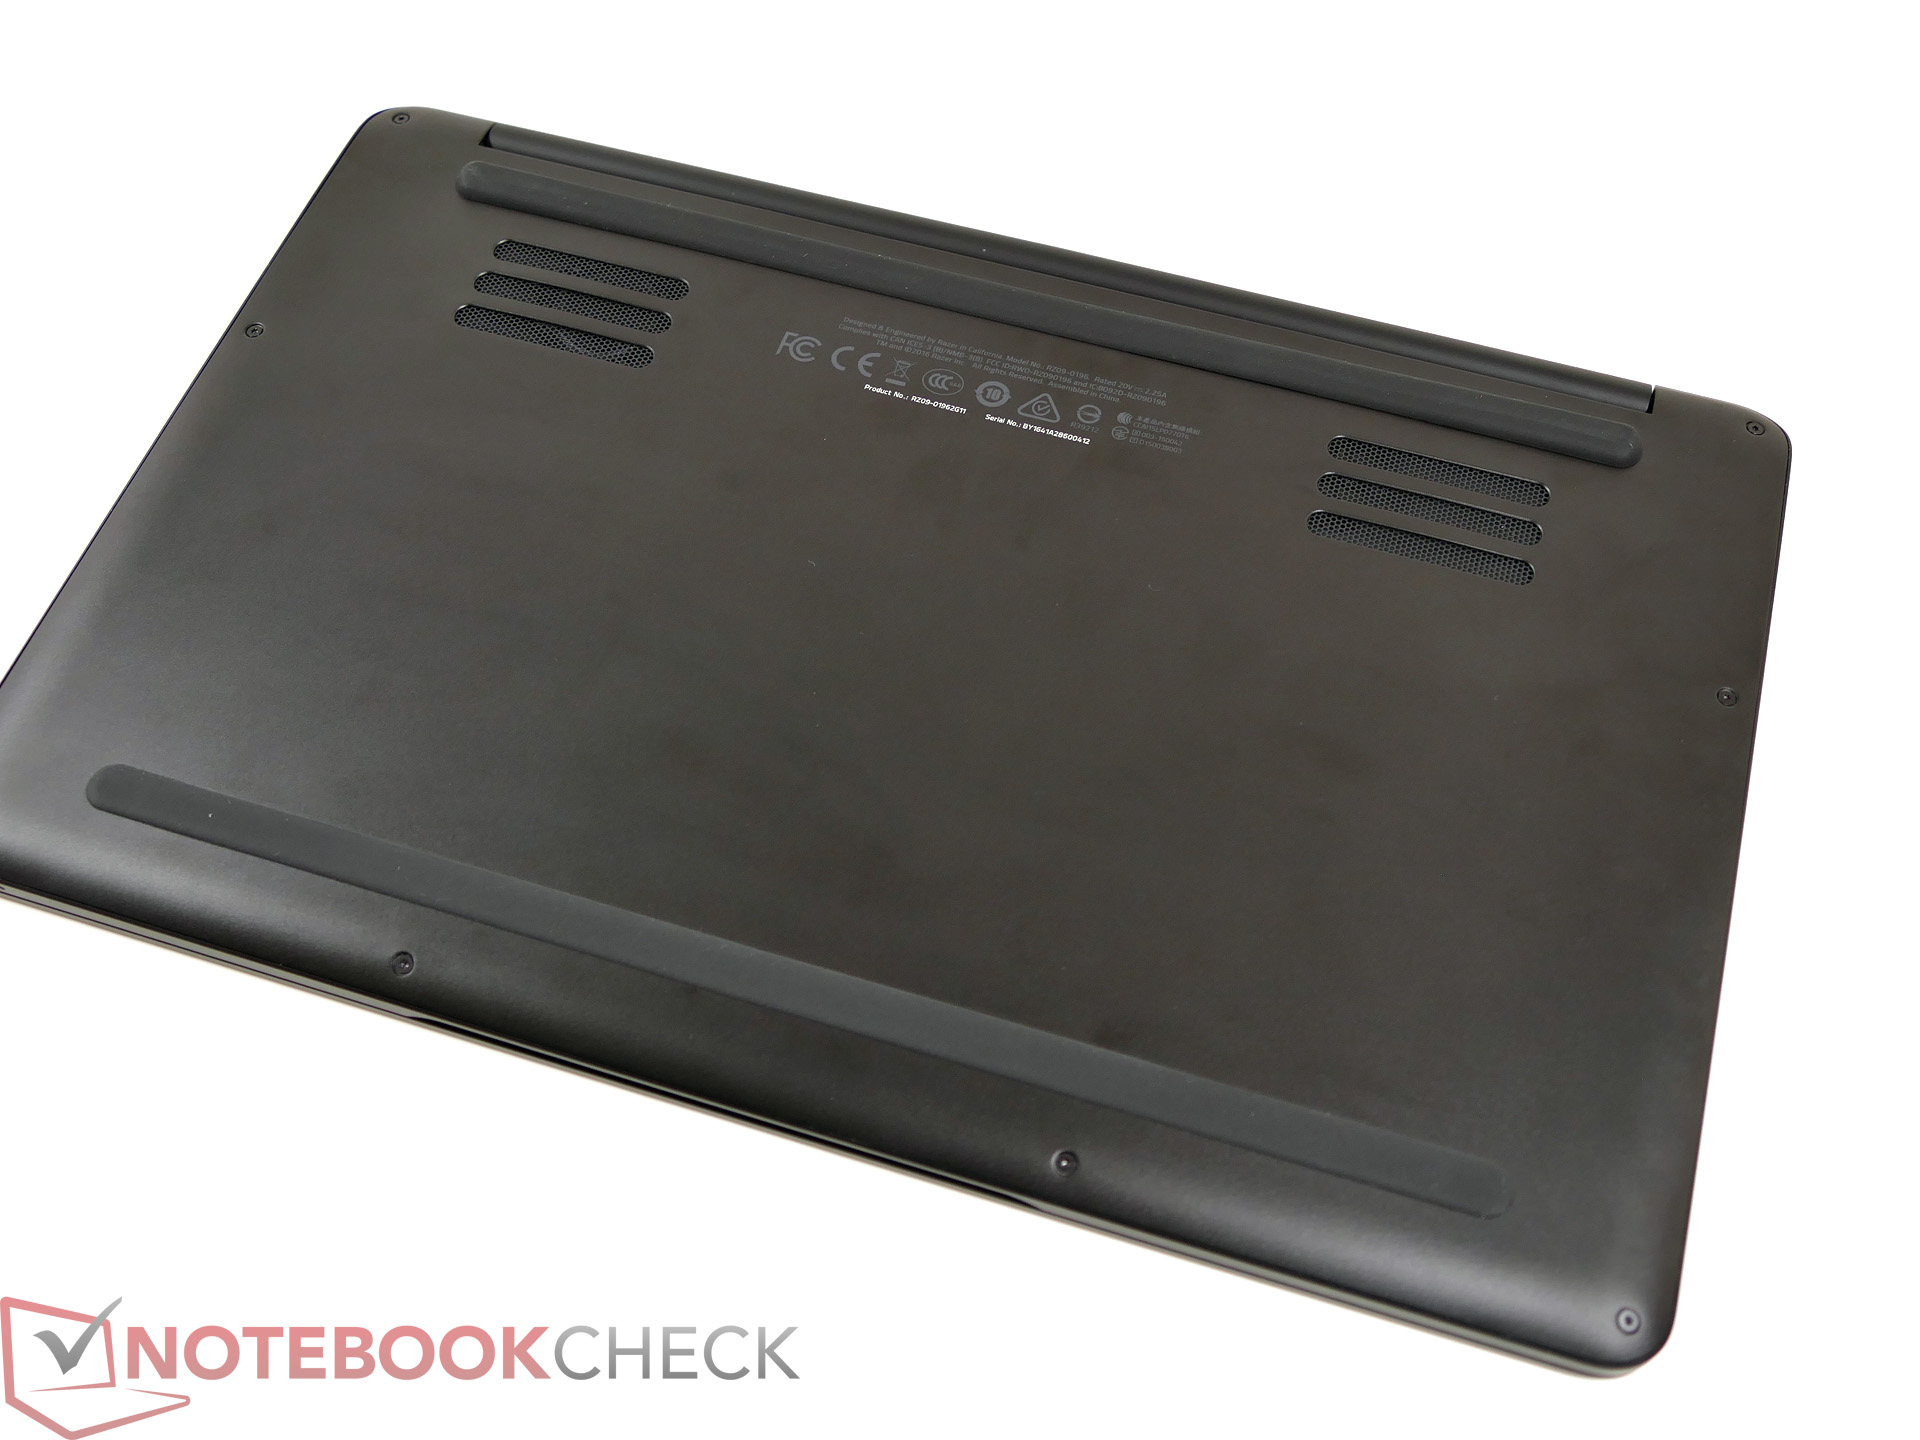
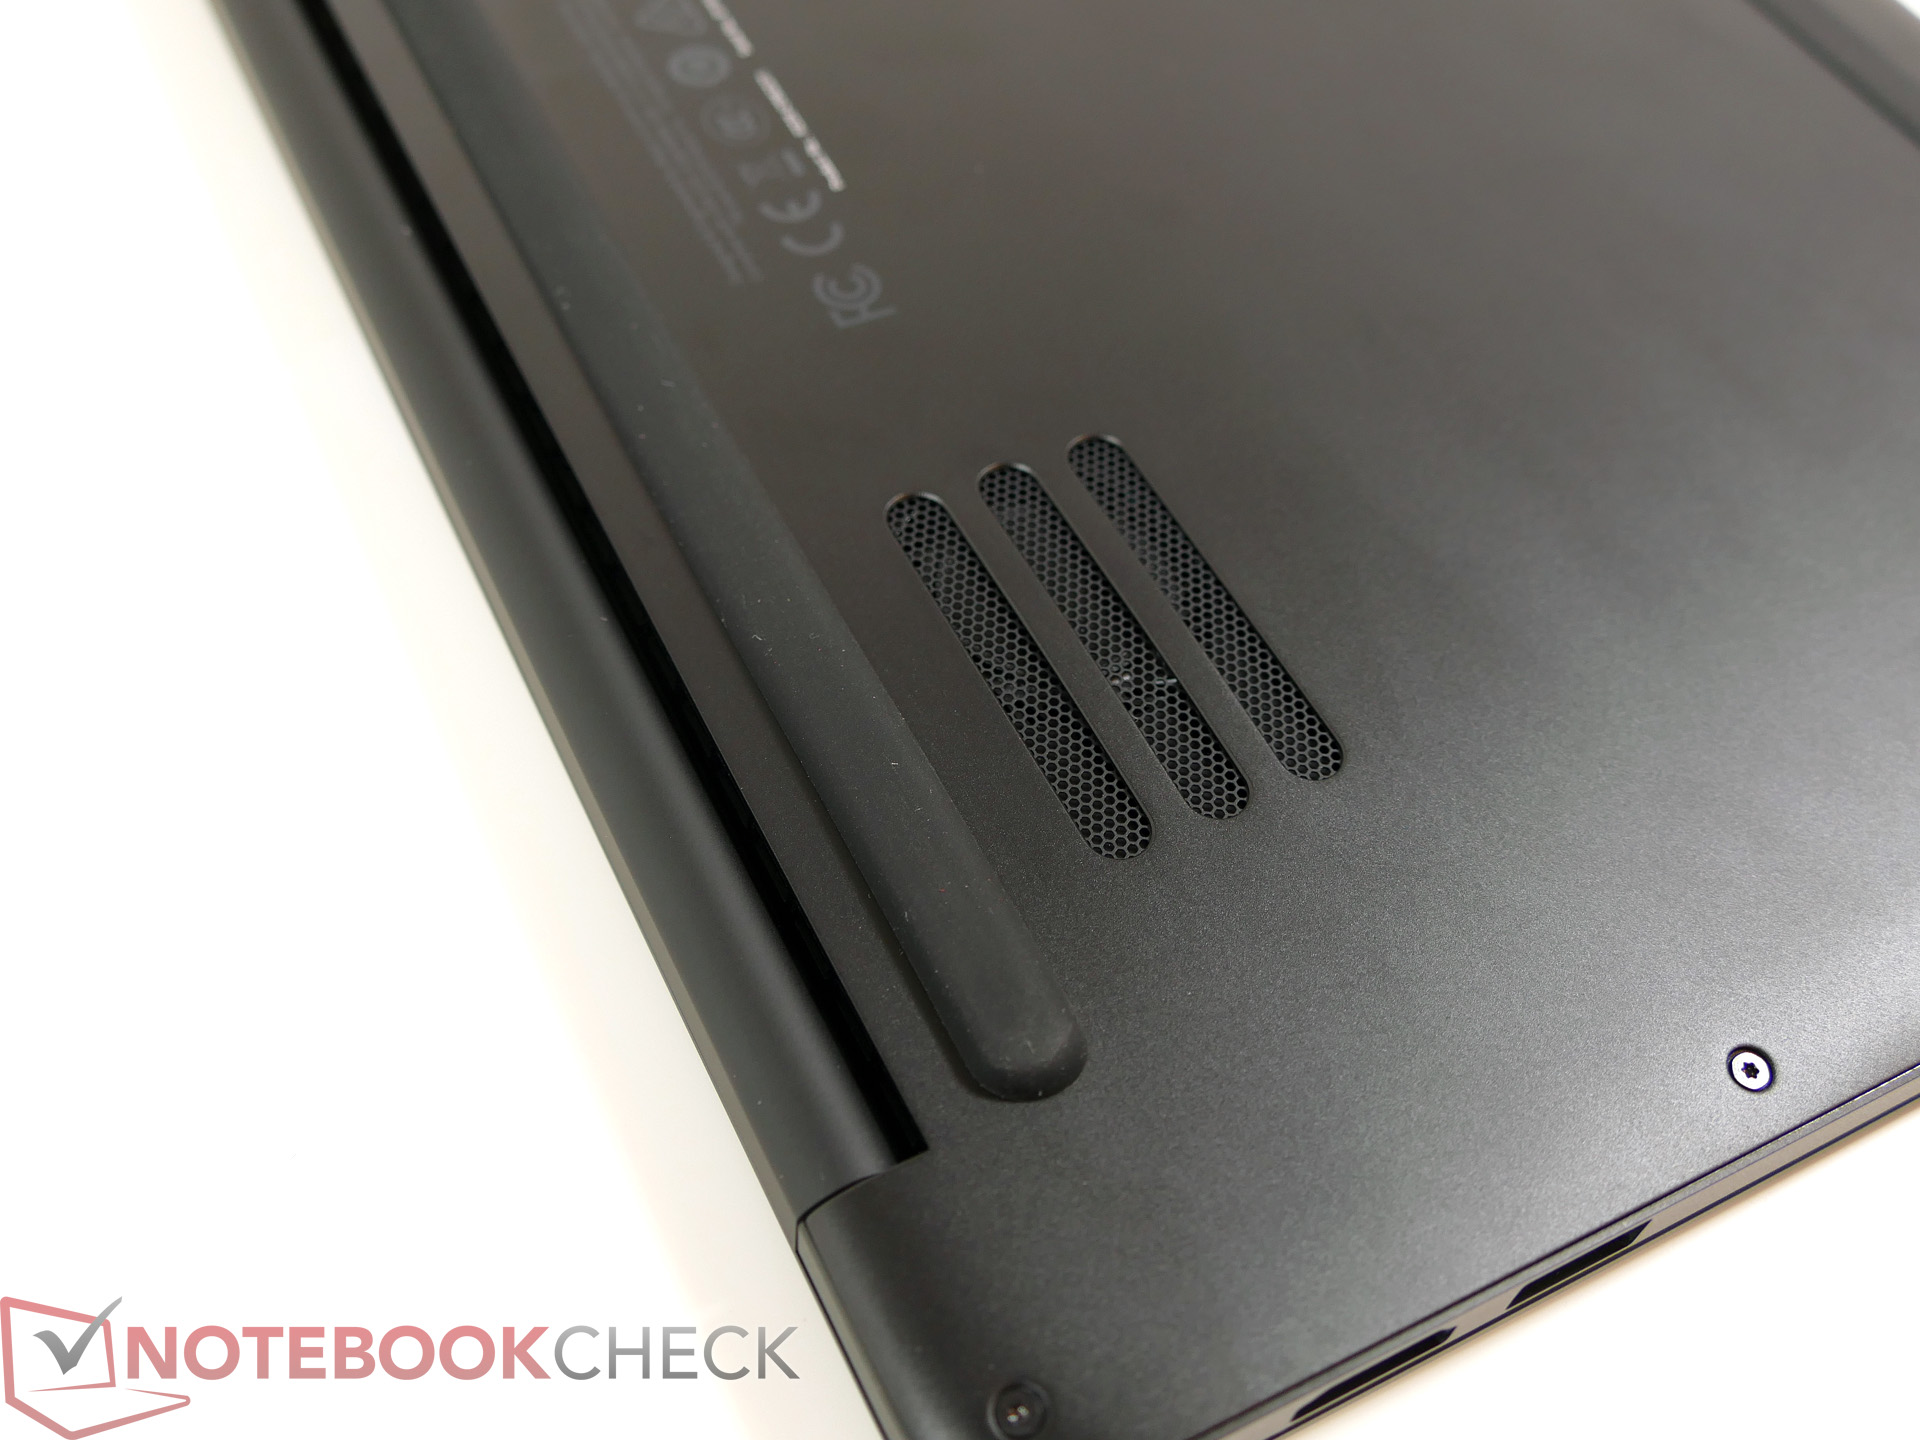
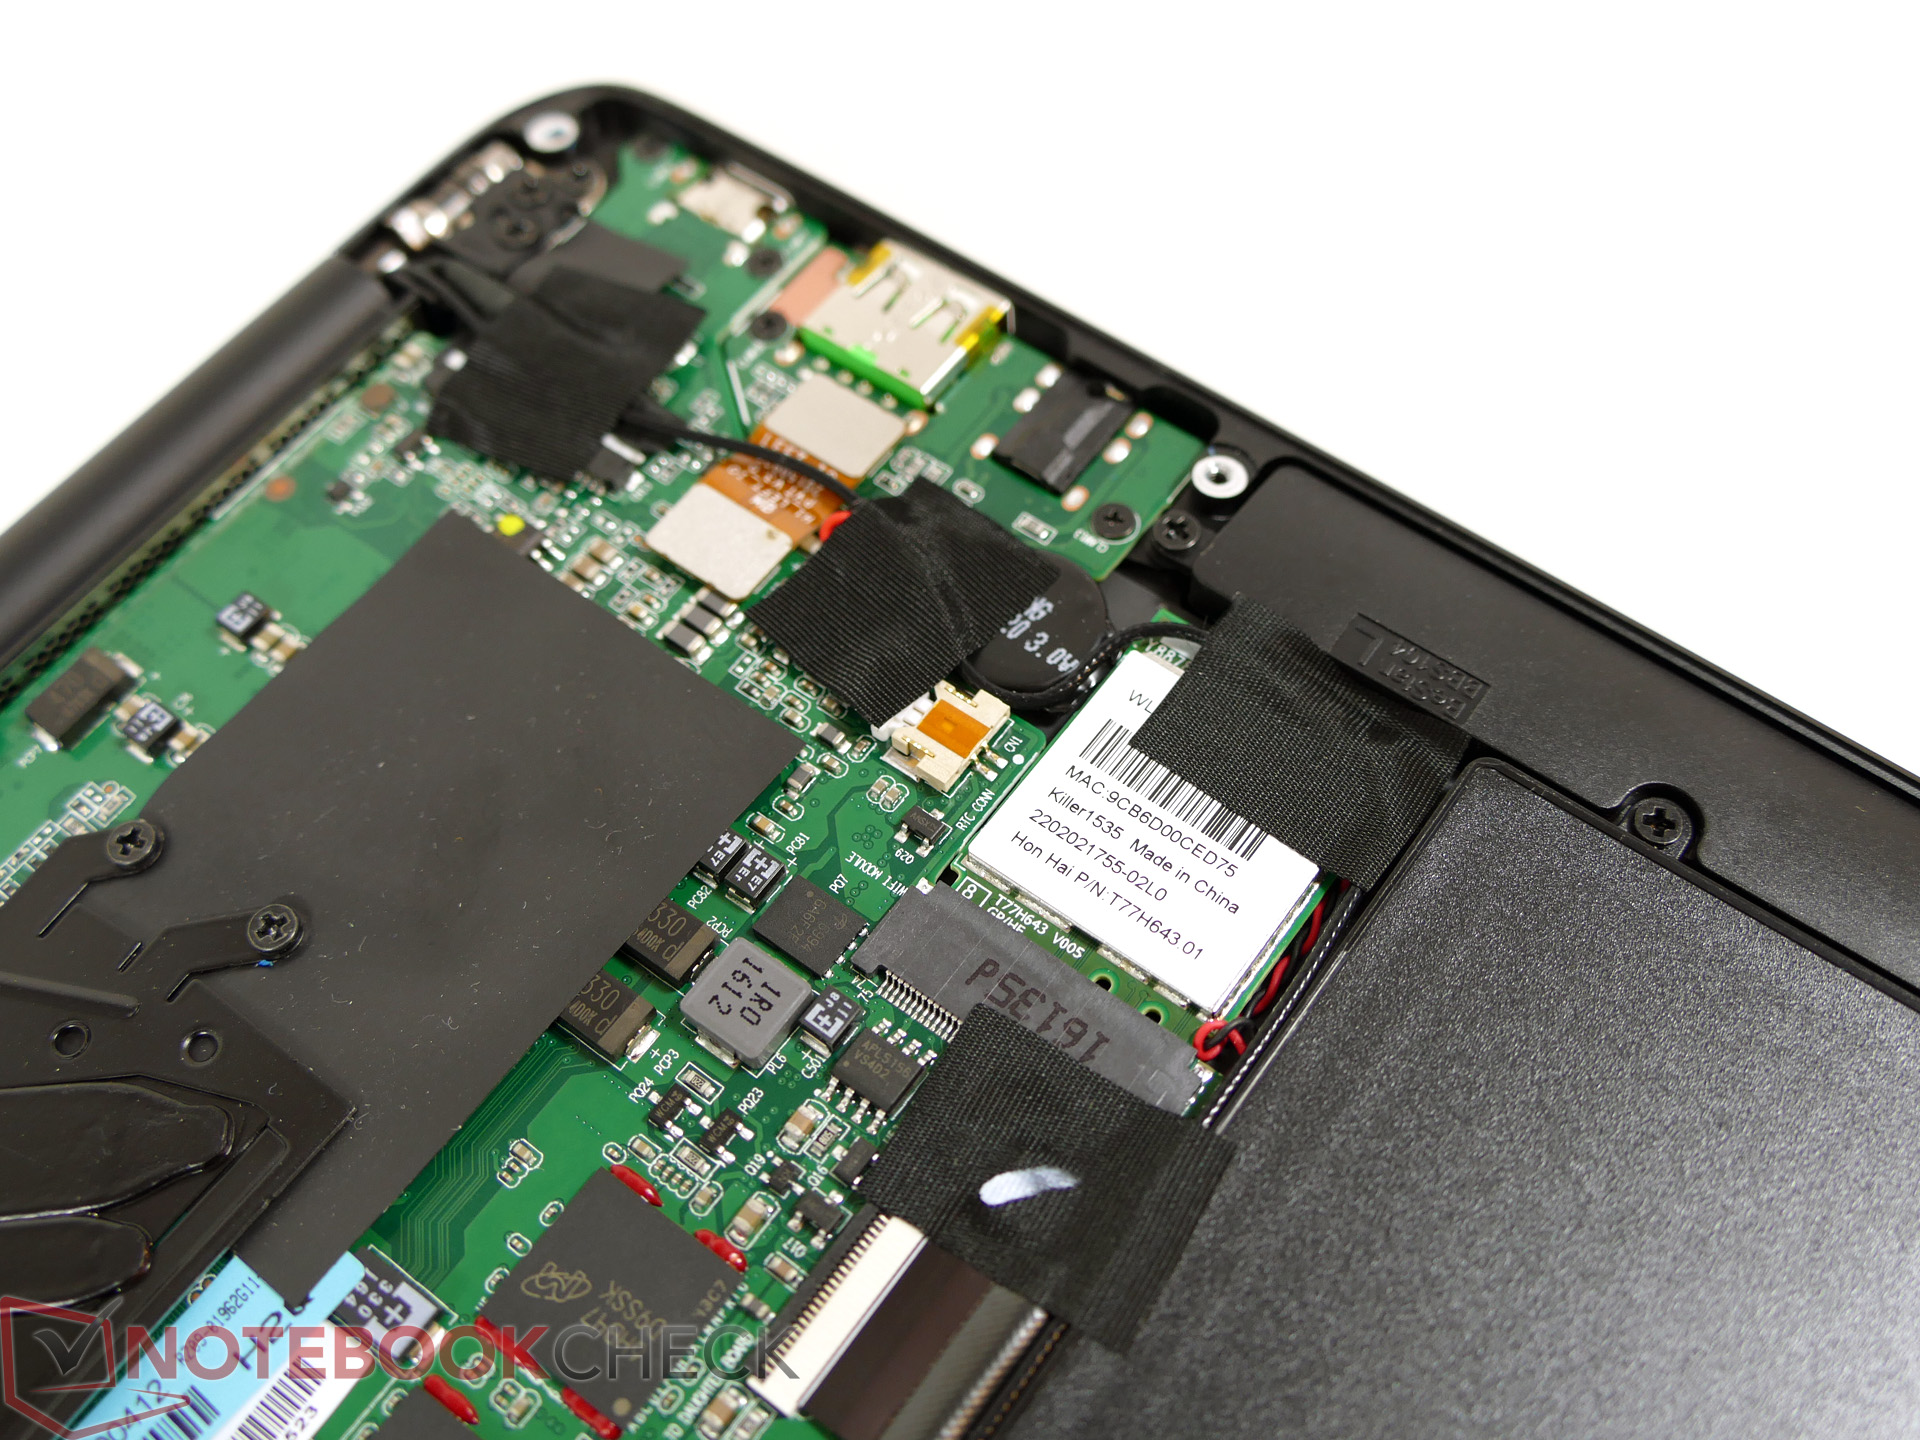
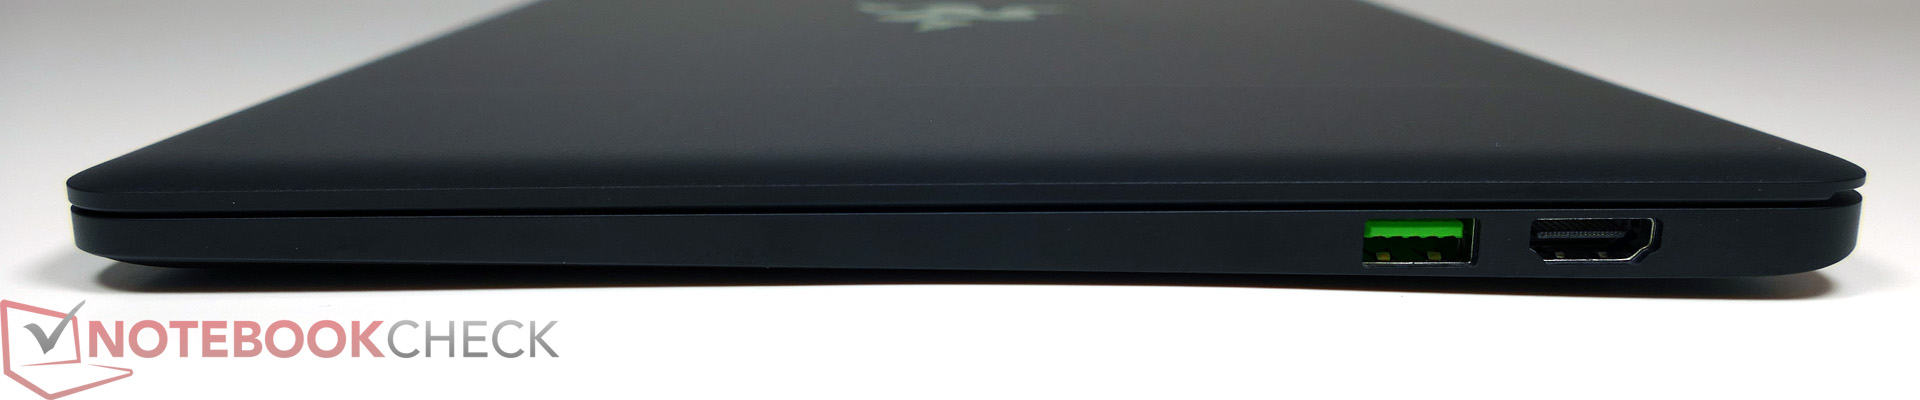
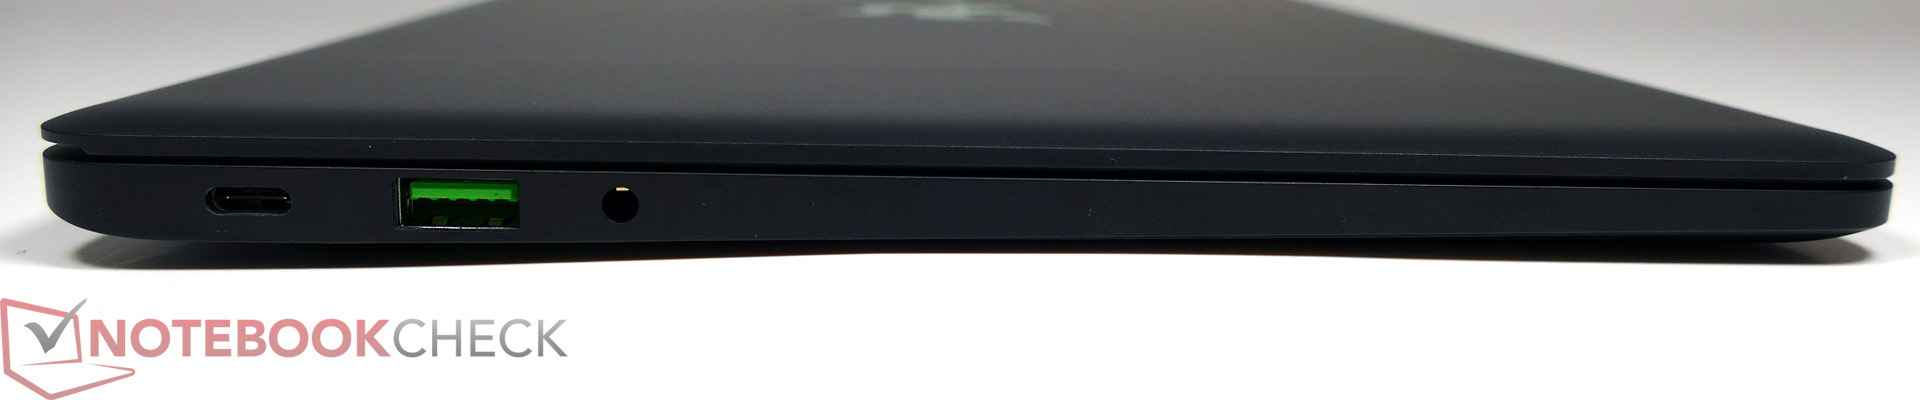
Kasa değişmemiş. Tasarım tamamen Apple'ın MacBook modelleriyle kıyaslanabilir olması için yapım ve his noktalarına değinilerek geliştirilmiş. Mat siyah yüzeyin parmak izlerini bu kadar çekmesi ise kötü olmuş.
Kaby Lake işlemci ve daha uzun süreli bataryası ile Blade Stealth diğer subnotebooklar ile kıyaslandığında kendini ön planda tutmasını biliyor. Razer Core eGPU heyecan verici bir seçenek, ancak olmasaydı da Blade Stealth kendi başına başarılı bir model.
Cihazımızda QHD+ ekran bulunuyor. Ekran neredeyse 4K versiyonu kadar iyi. Özellikle 12.5 inçlik boyutu düşünüldüğünde. Bu ekran çoğu durum içni daha iyi bir seçenek olabilir. Daha düşük ekran çözünürlüklü modeller de hem daha ucuz hem de batarya kullanımına pozitif etkileri mevcut.
Sunulan performans da etkileyici. İşlemci test sonuçları uzun süreli kullanım altında bile iyi. Blade Stealth, Razer Core ile iyi çalışacaktır ve karşımızda iyi bir oyun sistemi olabilir. Daha fazlası sonraki incelemelerimizde.
Yazının orjinali için tıklayın.
Razer Blade Stealth QHD i7-7500U
- 10/25/2016 v5.1 (old)
J. Simon Leitner
Price comparison