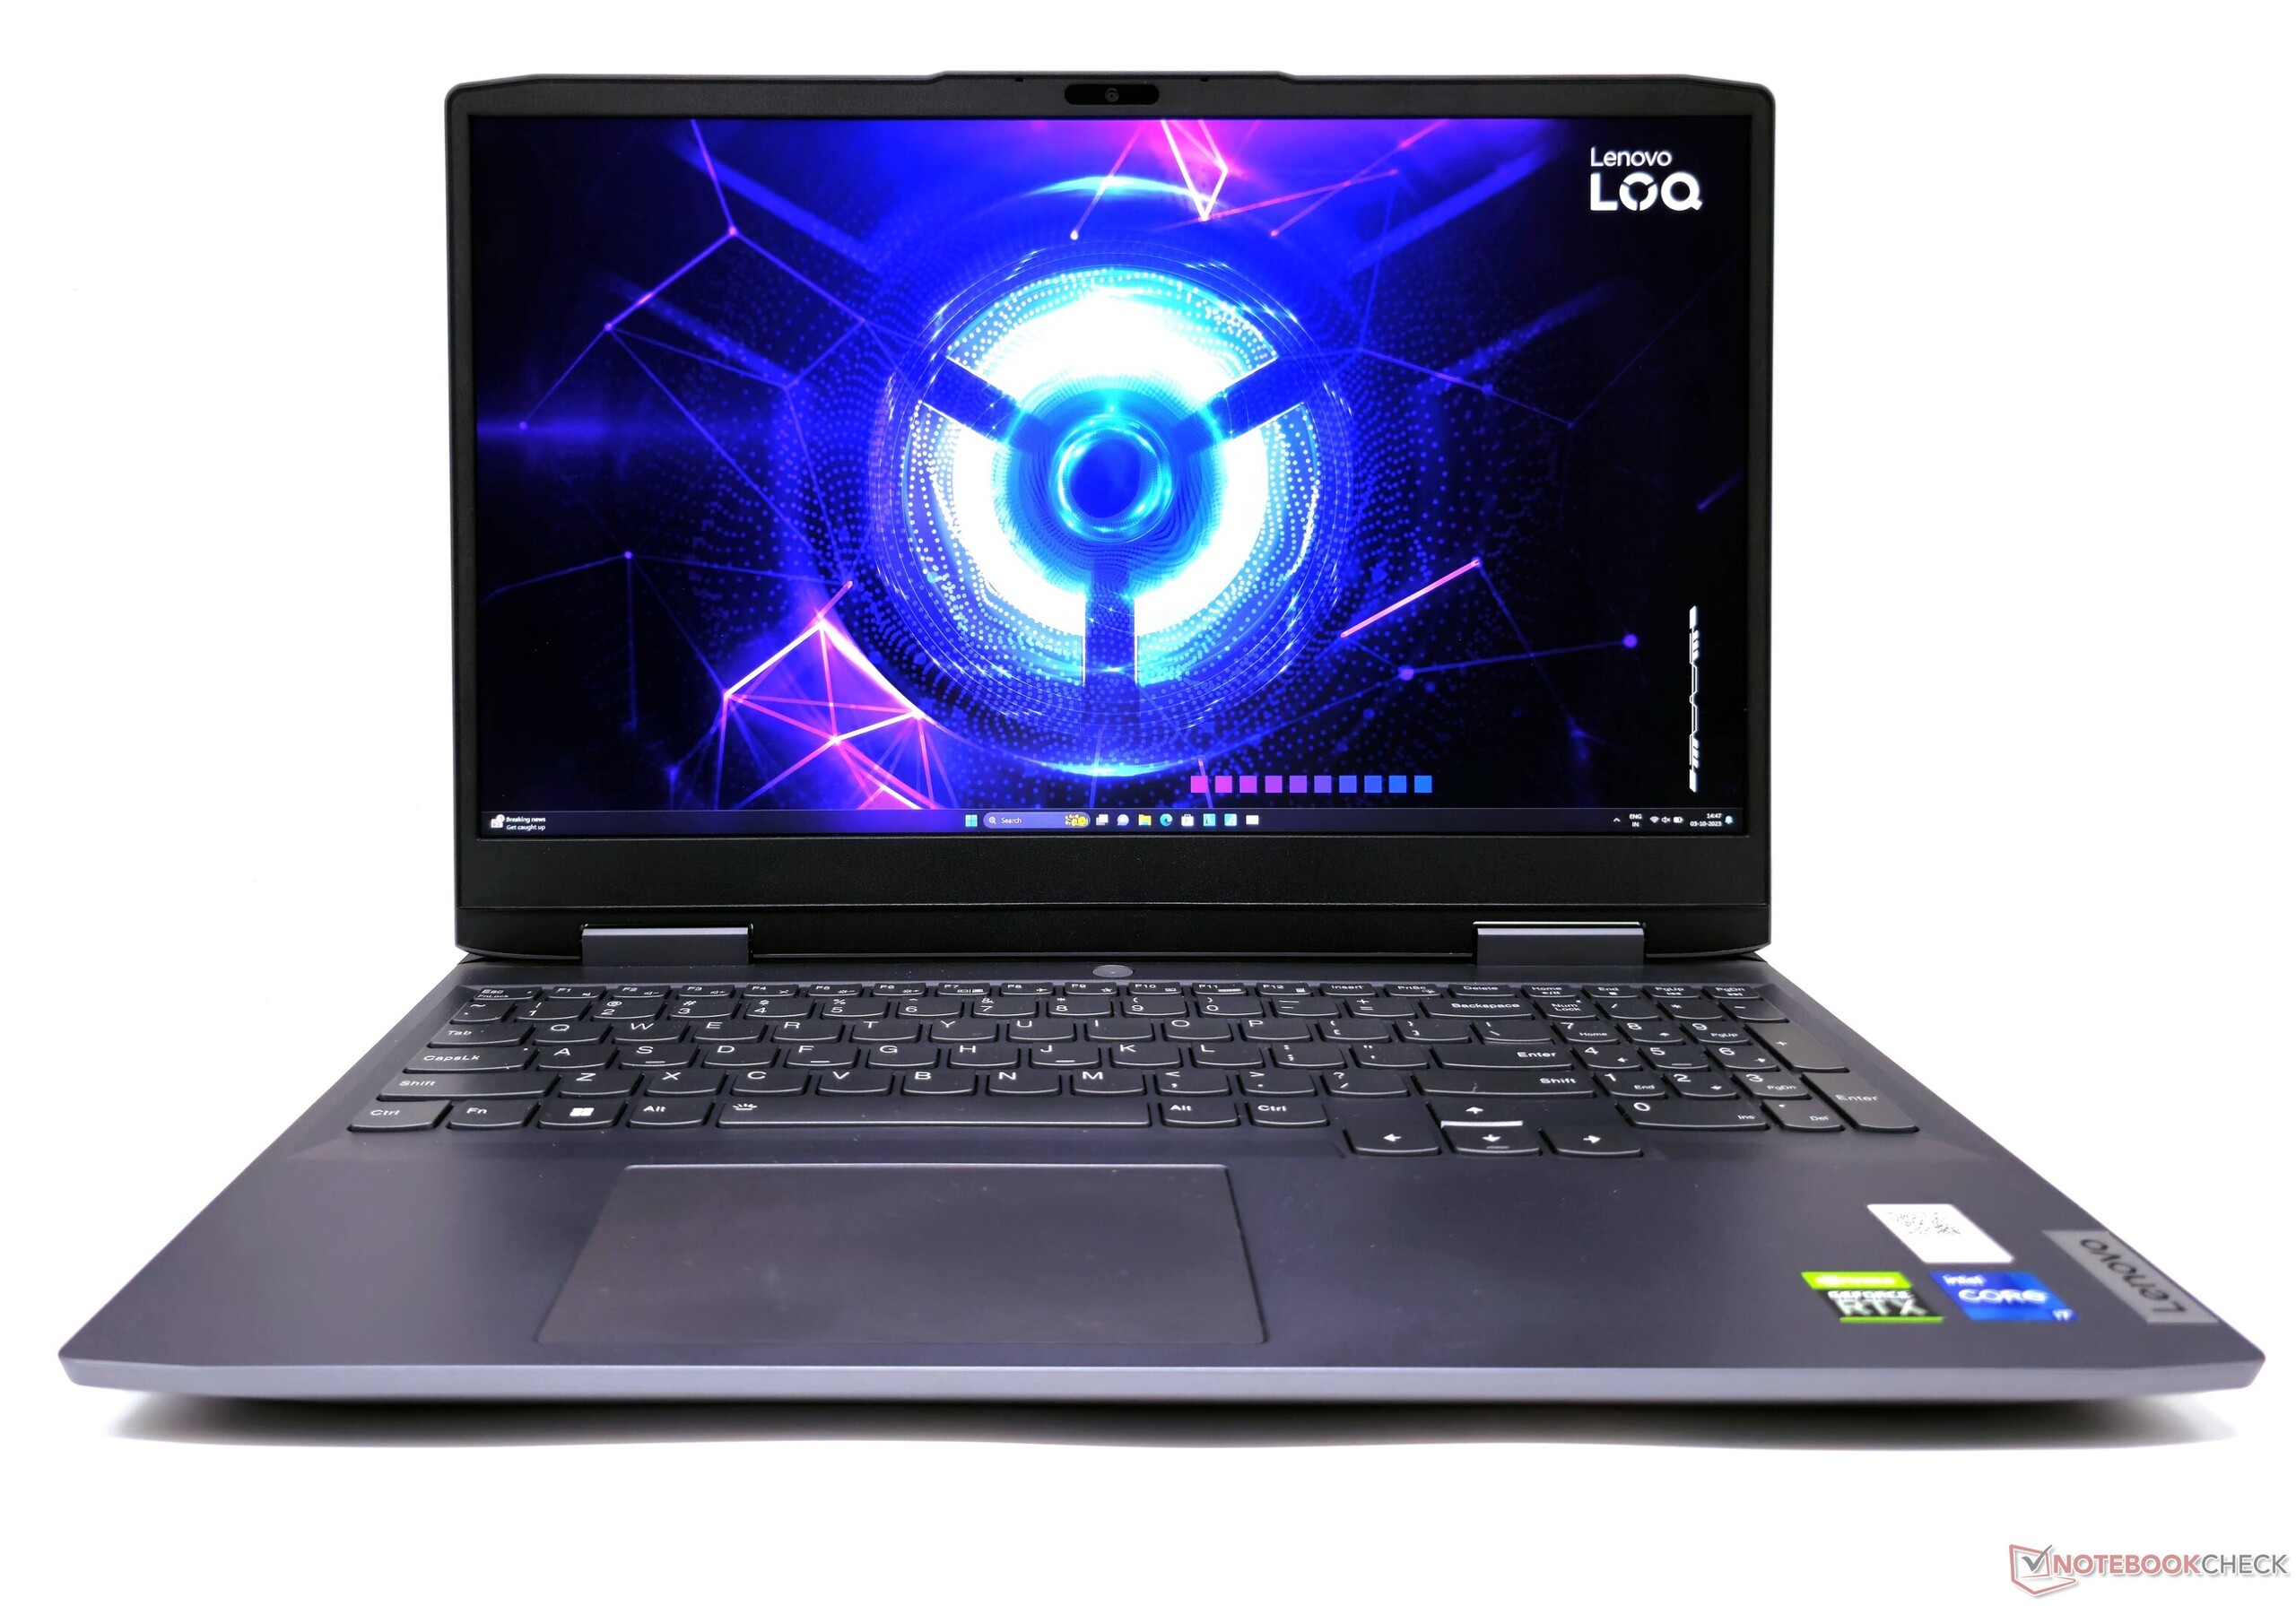
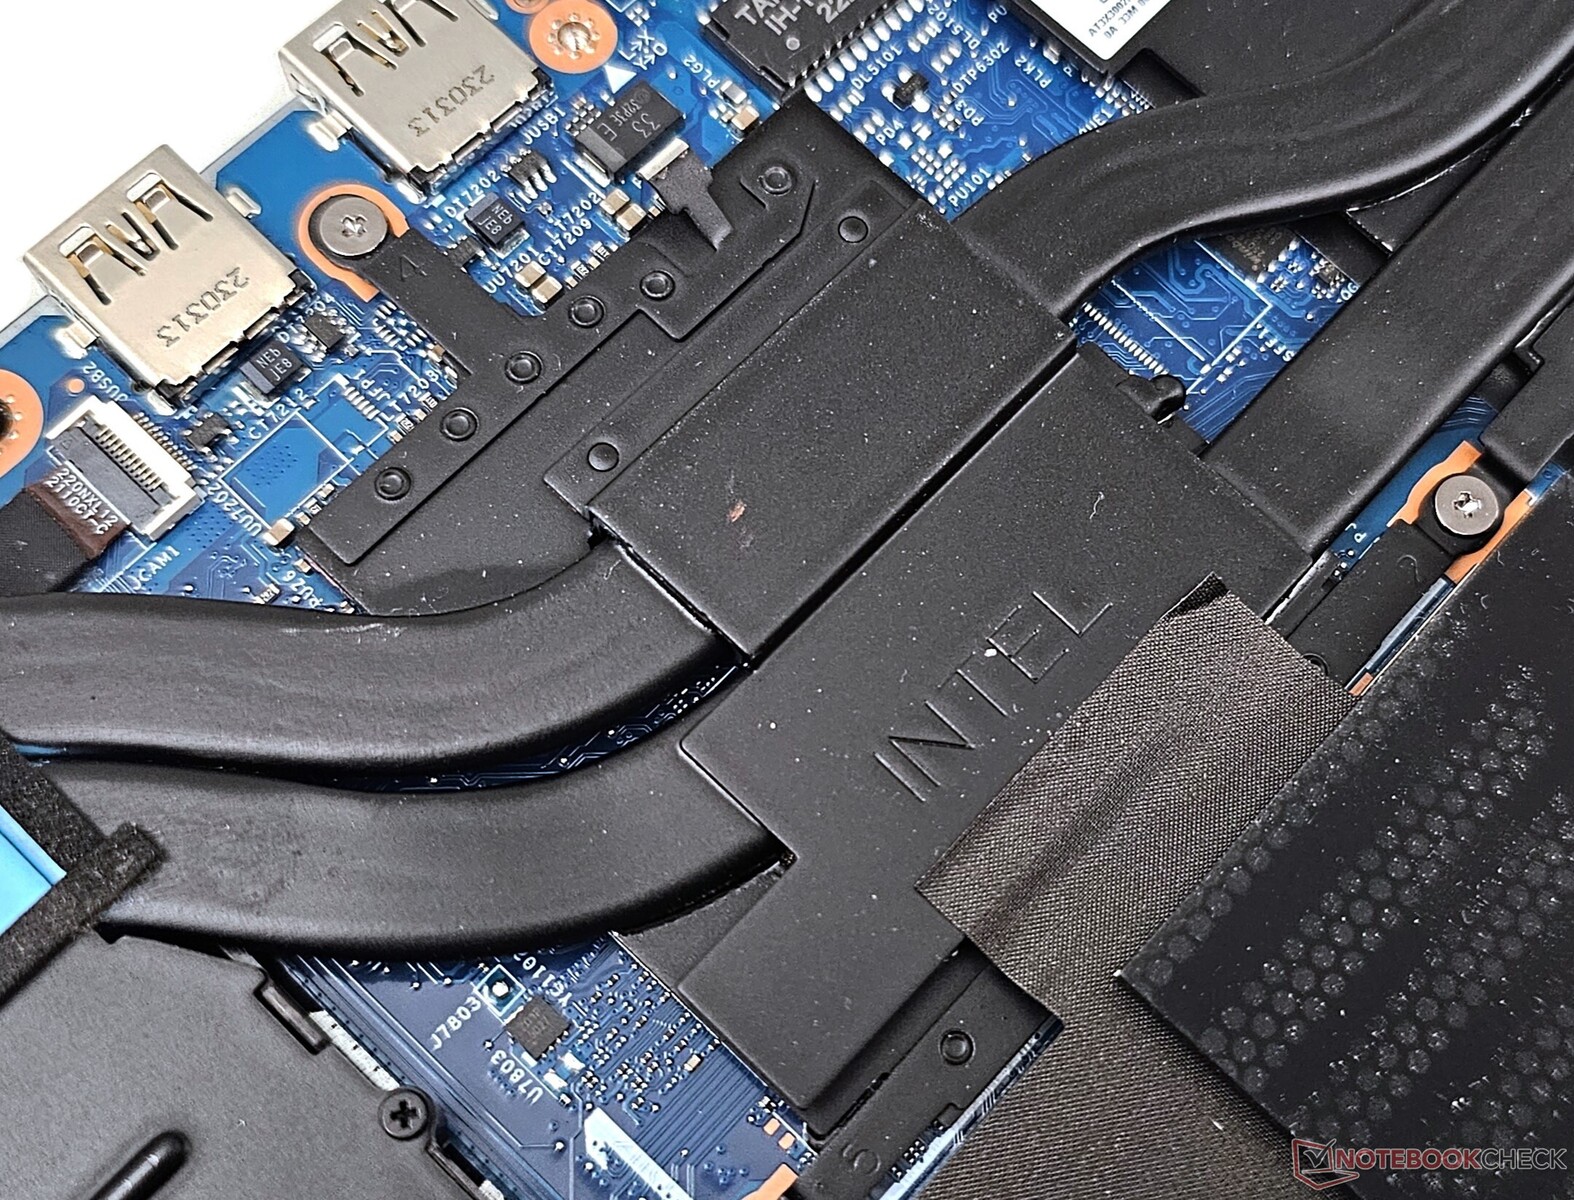
Lenovo LOQ 15 Core i7 İncelemesi: Intel - AMD ikilemini ortaya çıkaran uygun fiyatlı Legion alternatifi

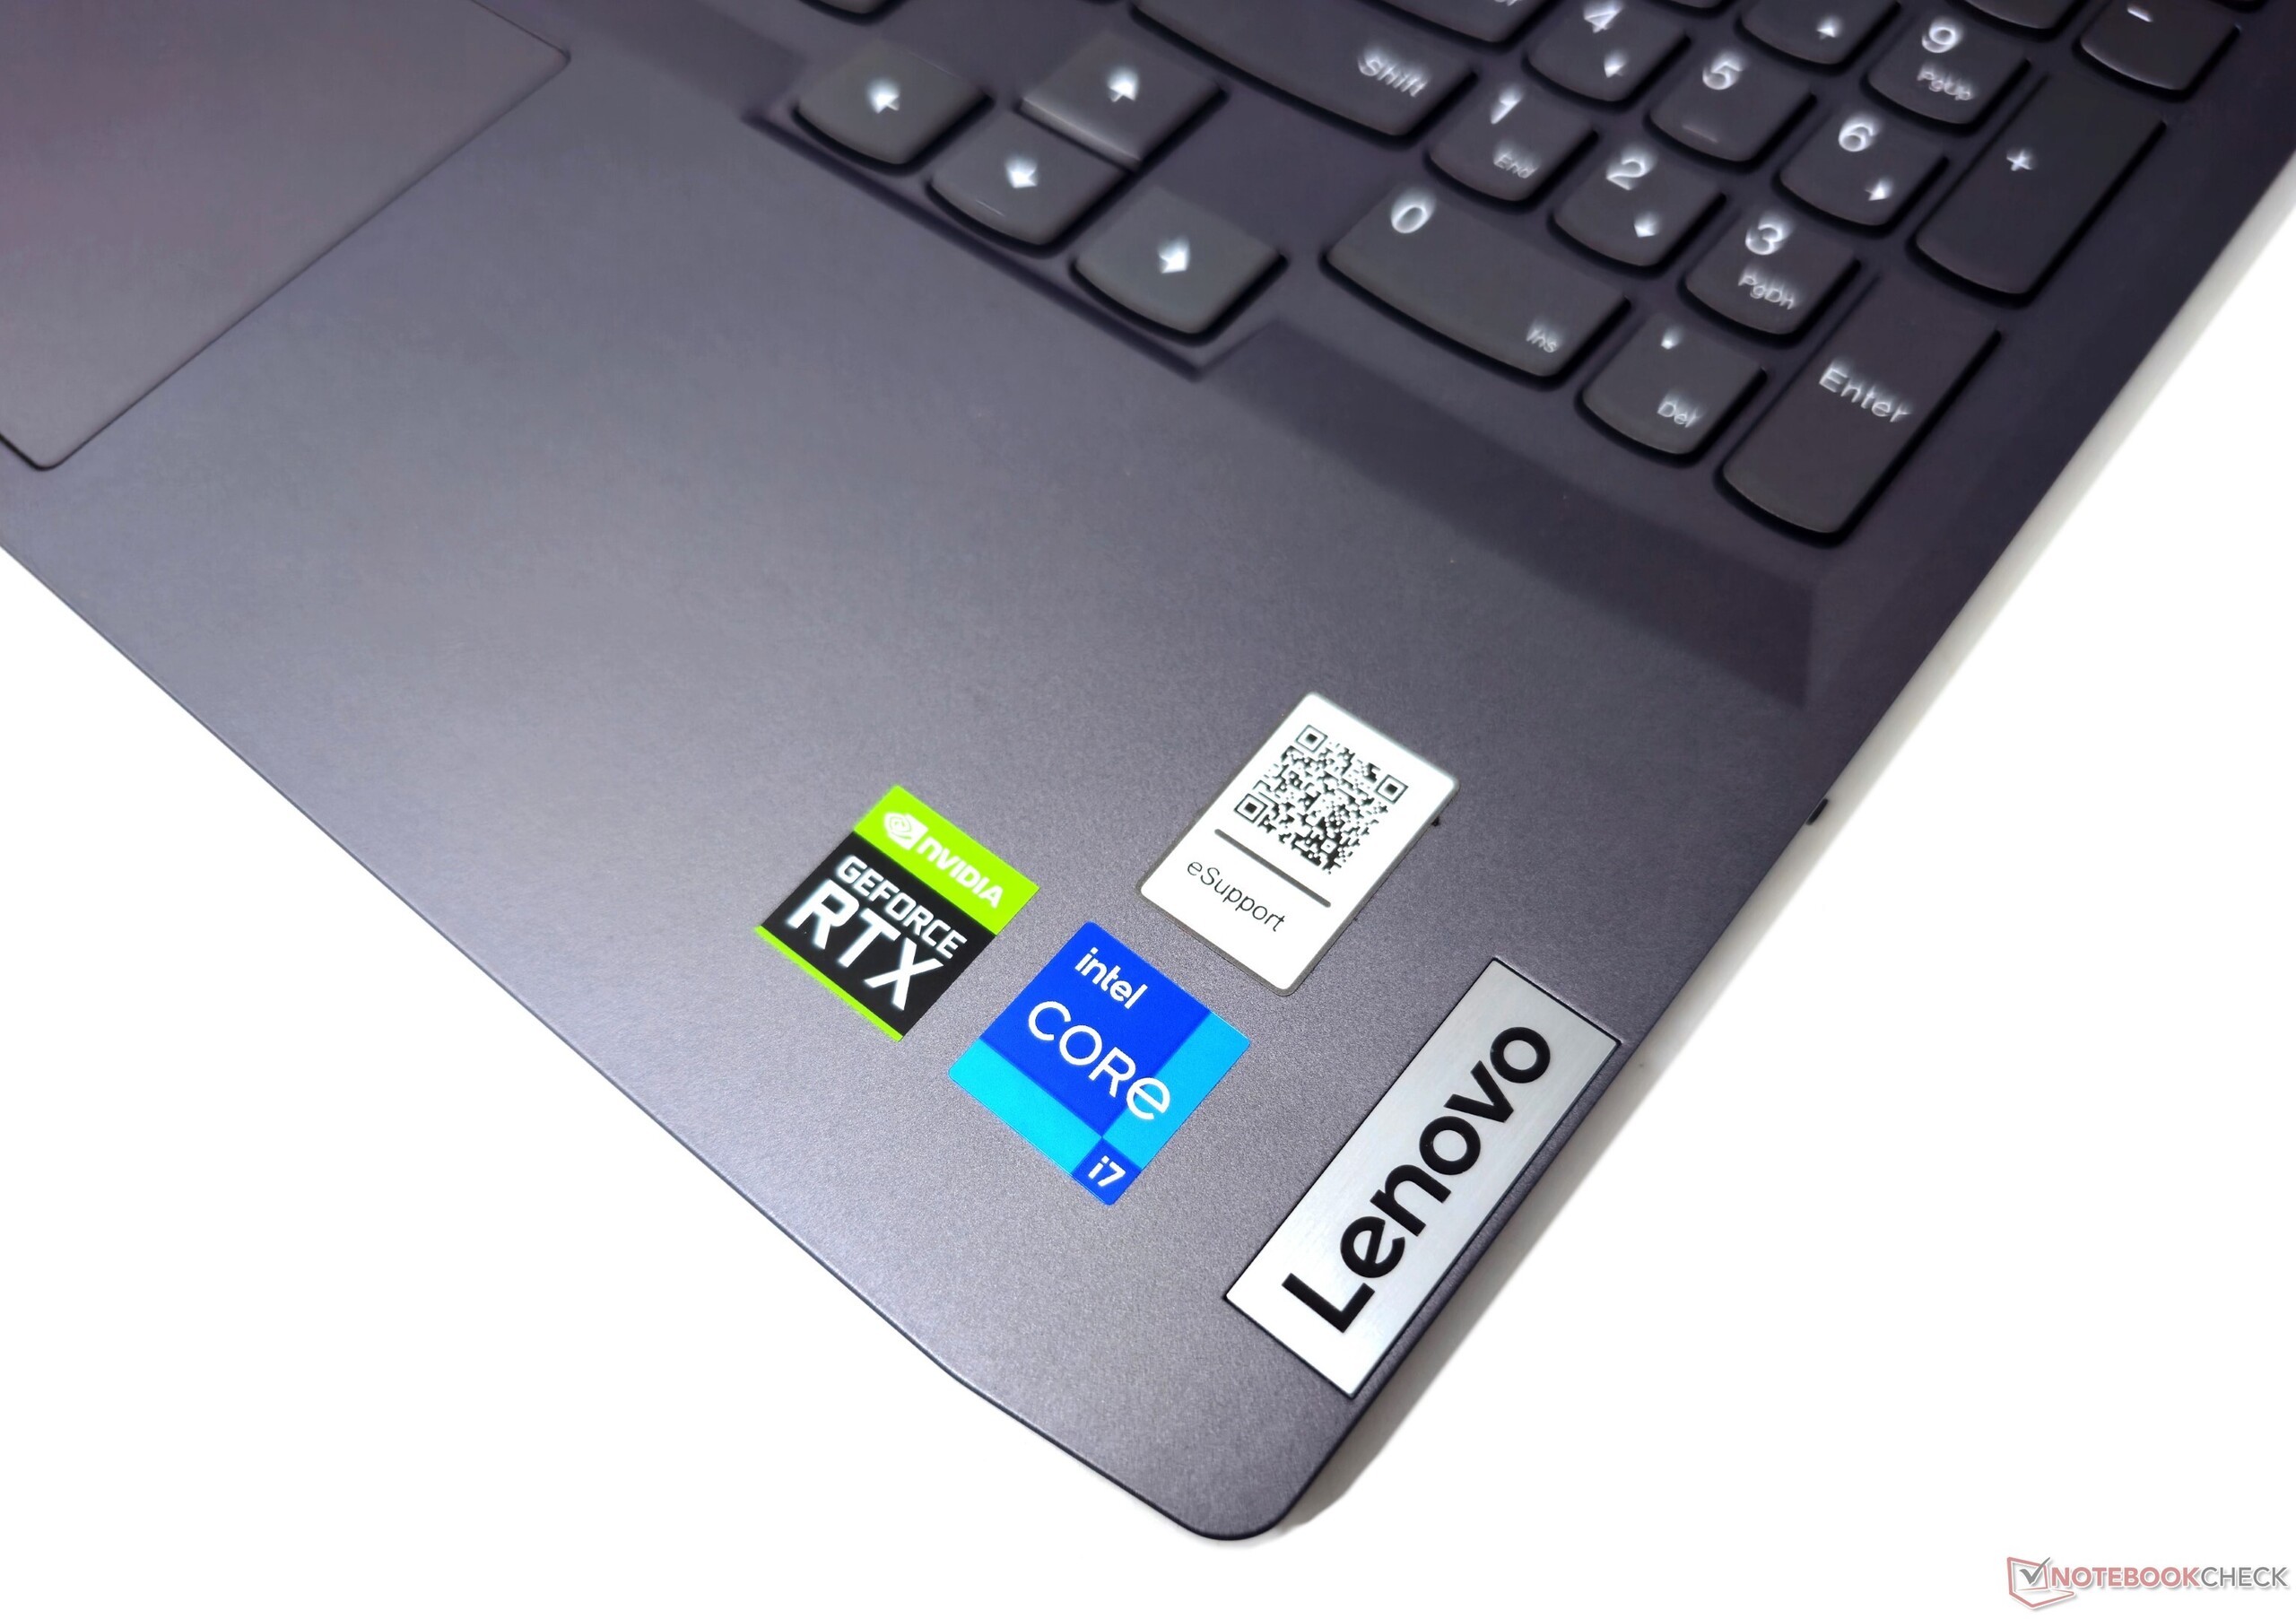
Lenovo LOQ serisi, Dell G Serisi, HP Victus, Asus TUF, MSI Katana ve Acer Nitro serilerine benzer şekilde bütçeye uygun, giriş seviyesi oyuncuları hedefliyor. Kısa süre önce LOQ 15APH8'i birAMD Ryzen 7 7840HSveNvidia RTX 4050 Dizüstü Bilgisayar GPU'su. Bu LOQ 16IRH8 aynı şekilde Intel ve Nvidia silikonlarını birleştirerek bir Core i7-13620H ile RTX 4060 grafikler.
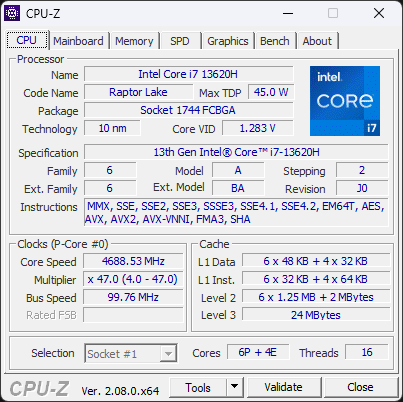
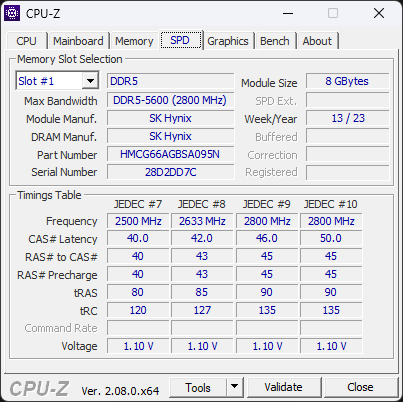
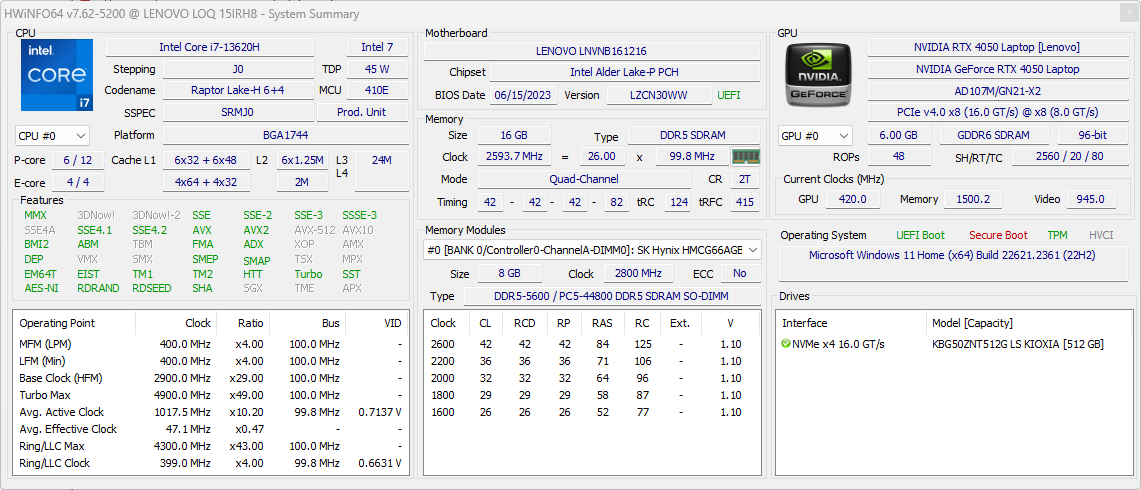
Şu anda laboratuvarlarımızda Core i7-13620H ve RTX 4050 ile güçlendirilmiş 15 inç LOQ 15IRH8 bulunuyor. Test modelimiz ayrıca 16 GB DDR5-5200 bellek, 512 GB PCIe Gen4 NVMe SSD ve 165 Hz QHD G-Sync ekran ile donatılmış olarak geldi.
Bu üst orta seviye yapılandırma Hindistan'da ₹1,01,988 (1,224 ABD Doları) fiyatla satılırken 1080p 144Hz varyantı ₹97,790 (1,050 ABD Doları) fiyatla alınabilir.
Karşılaştırmalı olarak olası rakipler
Derecelendirme | Tarih | Modeli | Ağırlık | Yükseklik | Boyut | Çözünürlük | Fiyat |
|---|---|---|---|---|---|---|---|
| 85.9 % v7 (old) | 10/2023 | Lenovo LOQ 15IRH8 Core i7 i7-13620H, GeForce RTX 4050 Laptop GPU | 2.4 kg | 25.2 mm | 15.60" | 2560x1440 | |
| 87.3 % v7 (old) | 09/2023 | Lenovo LOQ 16IRH8 i7-13620H, GeForce RTX 4060 Laptop GPU | 2.7 kg | 25.9 mm | 16.00" | 2560x1600 | |
| 85.7 % v7 (old) | 09/2023 | Lenovo LOQ 15APH8 R7 7840HS, GeForce RTX 4050 Laptop GPU | 2.5 kg | 25.2 mm | 15.60" | 1920x1080 | |
| 82.1 % v7 (old) | 06/2023 | MSI Katana 17 B13VFK i7-13620H, GeForce RTX 4060 Laptop GPU | 2.8 kg | 25.2 mm | 17.30" | 1920x1080 | |
| 89 % v7 (old) | Lenovo Legion Pro 5 16ARX8 (R5 7645HX, RTX 4050) R5 7645HX, GeForce RTX 4050 Laptop GPU | 2.5 kg | 27.3 mm | 16.00" | 2560x1600 | ||
| 85.1 % v7 (old) | 09/2023 | HP Victus 16-r0077ng i7-13700H, GeForce RTX 4070 Laptop GPU | 2.4 kg | 24 mm | 16.10" | 1920x1080 | |
| 84.2 % v7 (old) | 07/2023 | Dell G15 5530 i7-13650HX, GeForce RTX 4060 Laptop GPU | 3 kg | 26.95 mm | 15.60" | 1920x1080 | |
| 86.9 % v7 (old) | 06/2023 | Asus TUF Gaming A16 FA617XS R9 7940HS, Radeon RX 7600S | 2.2 kg | 22.1 mm | 16.00" | 1920x1200 |
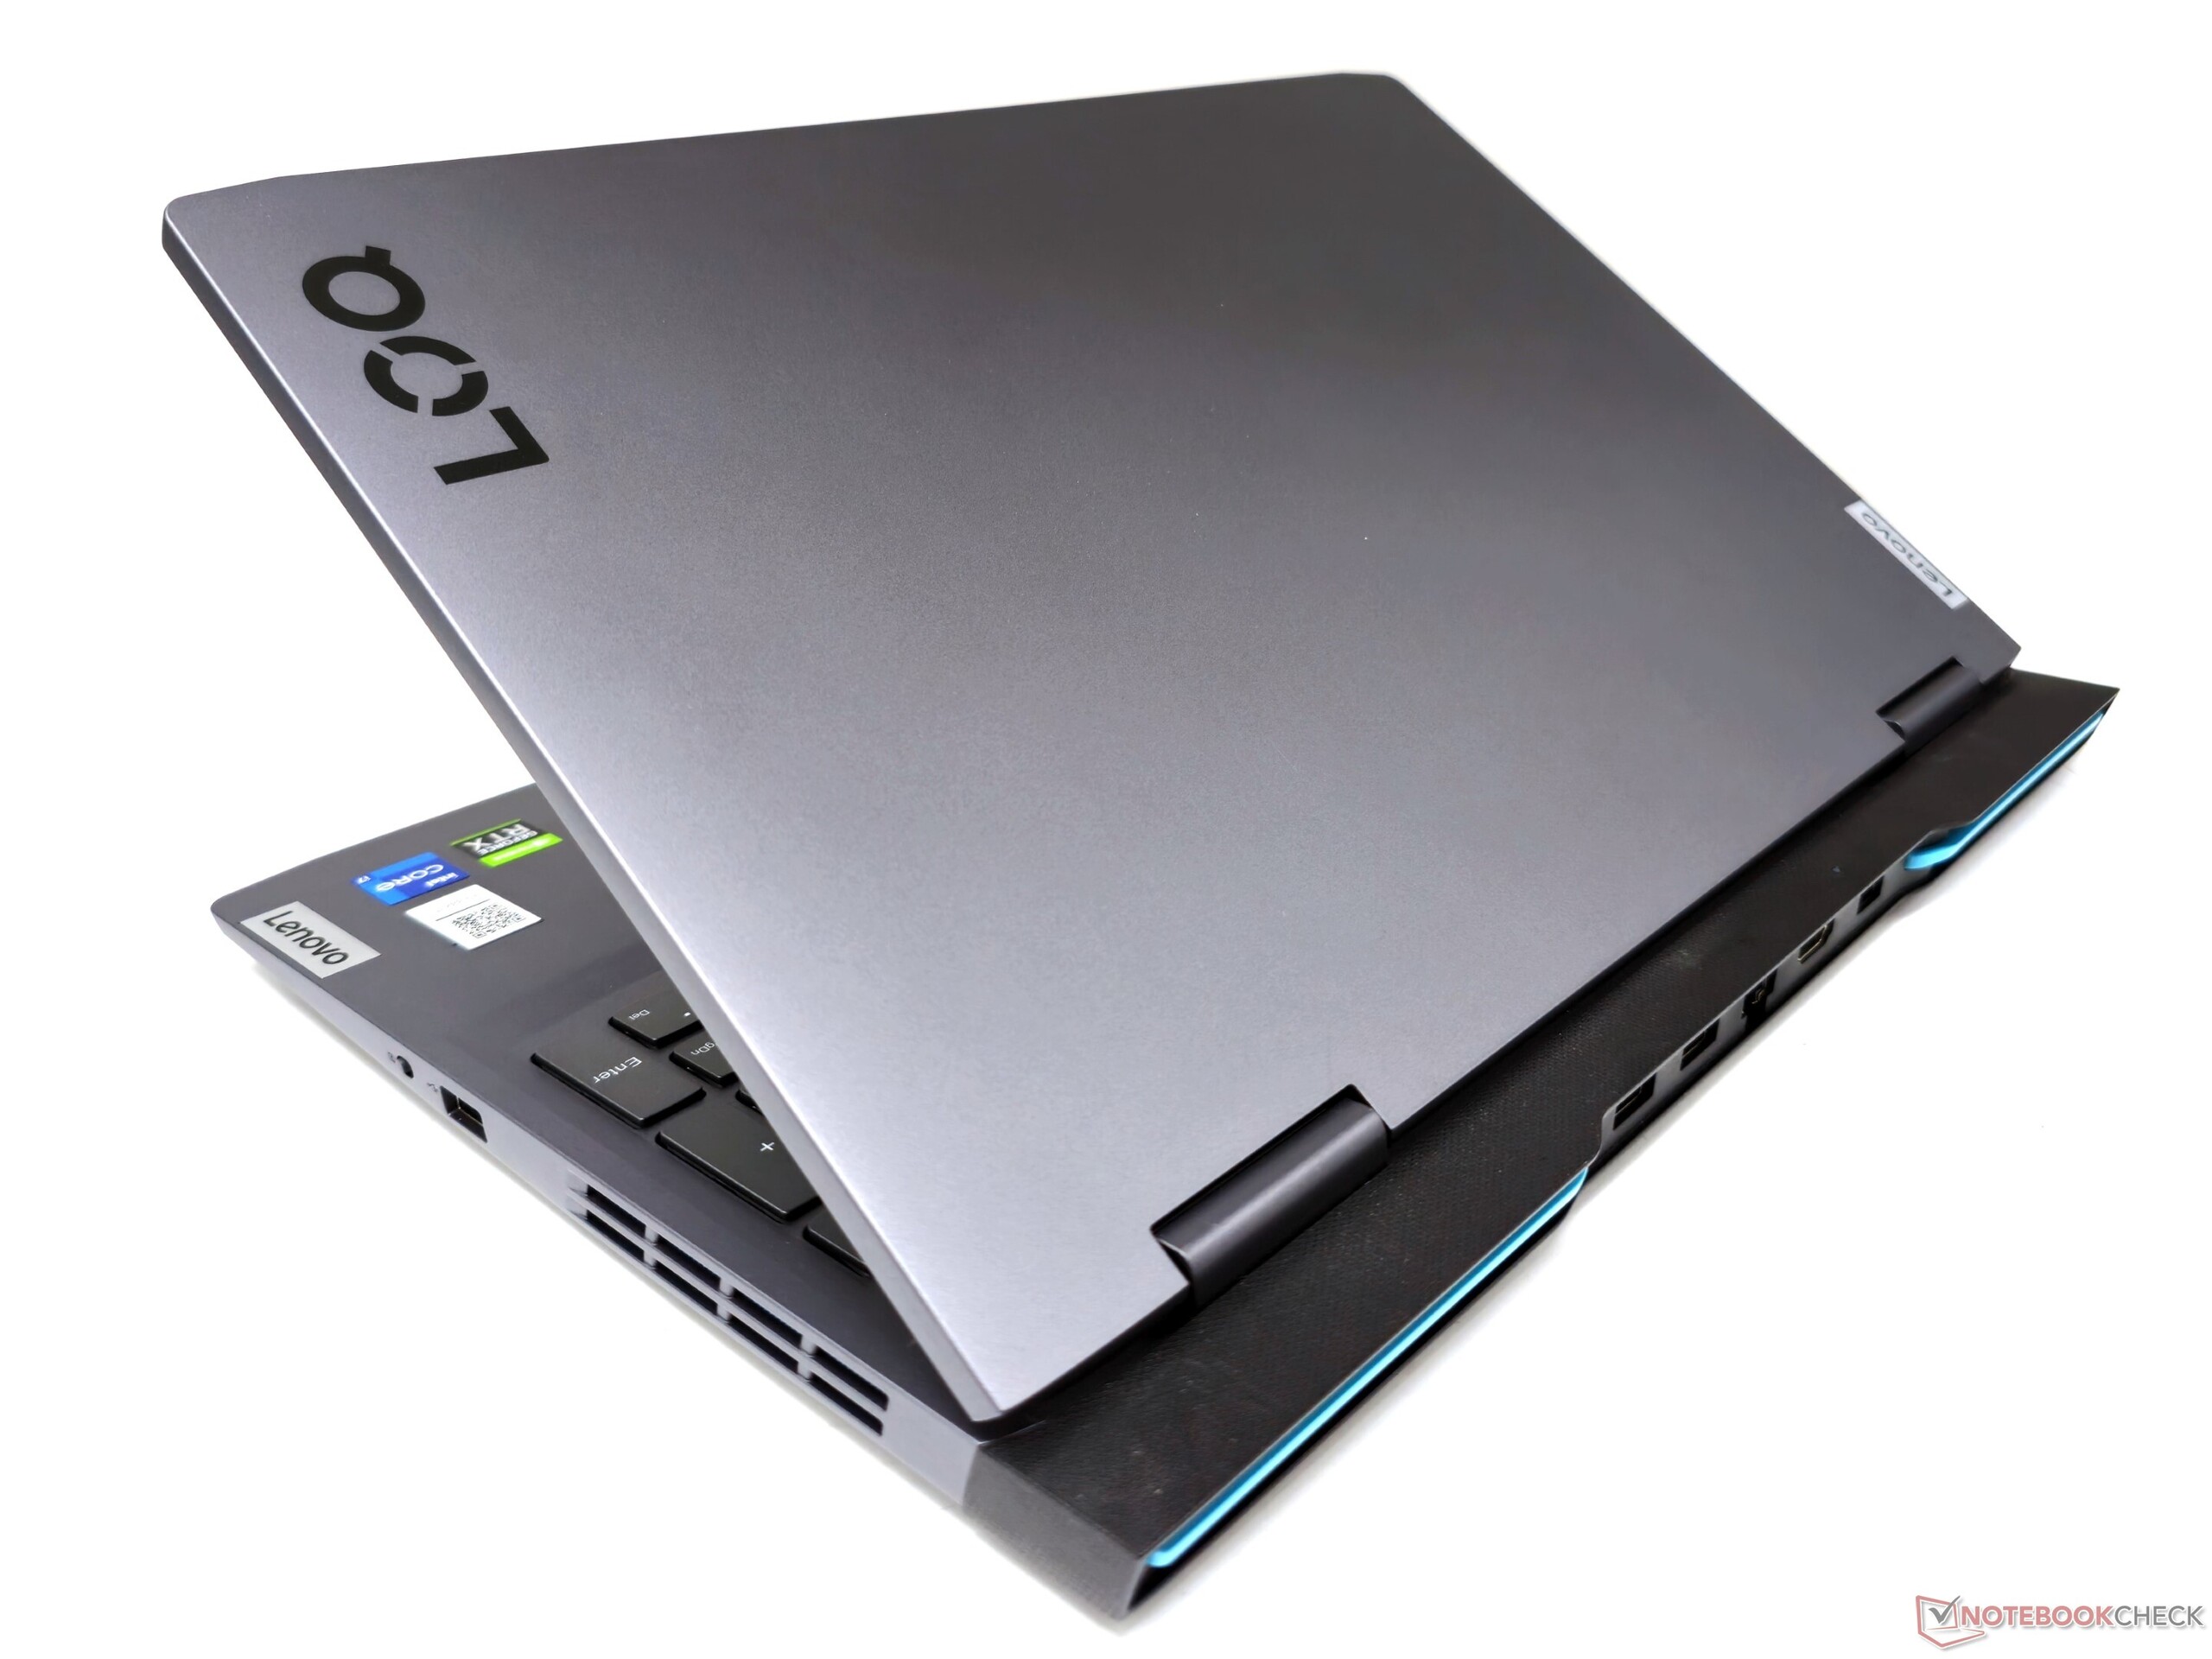
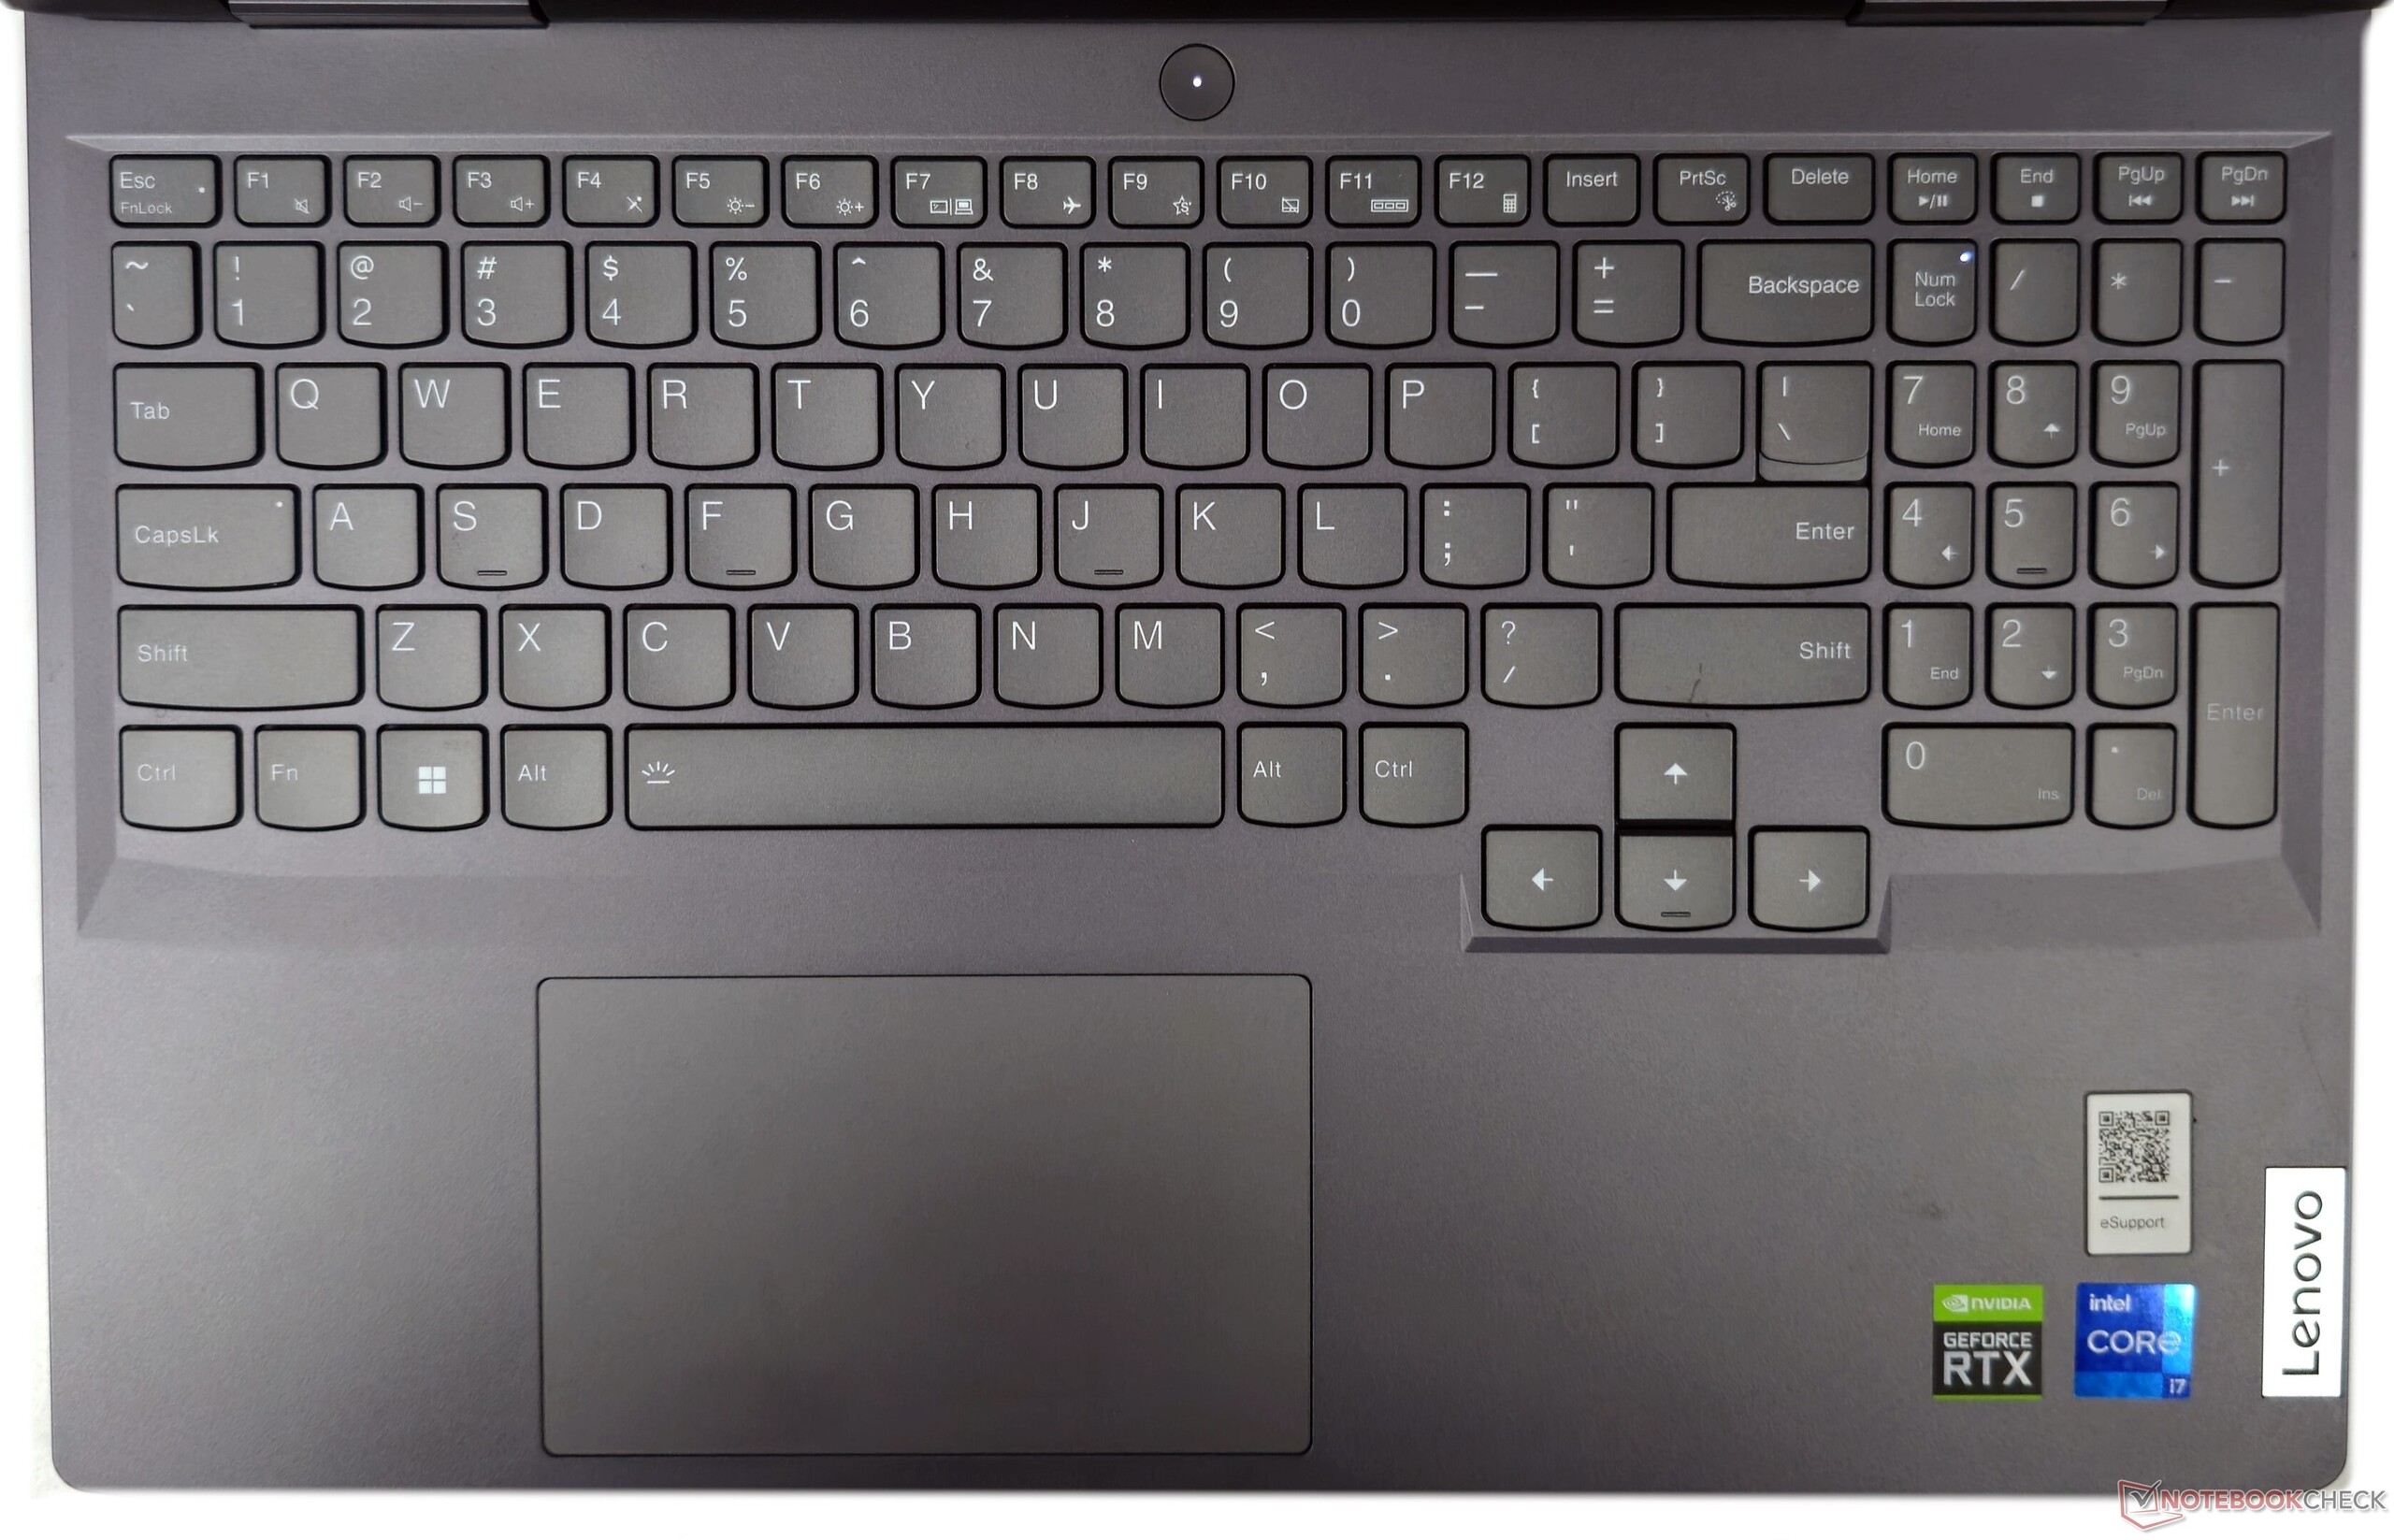
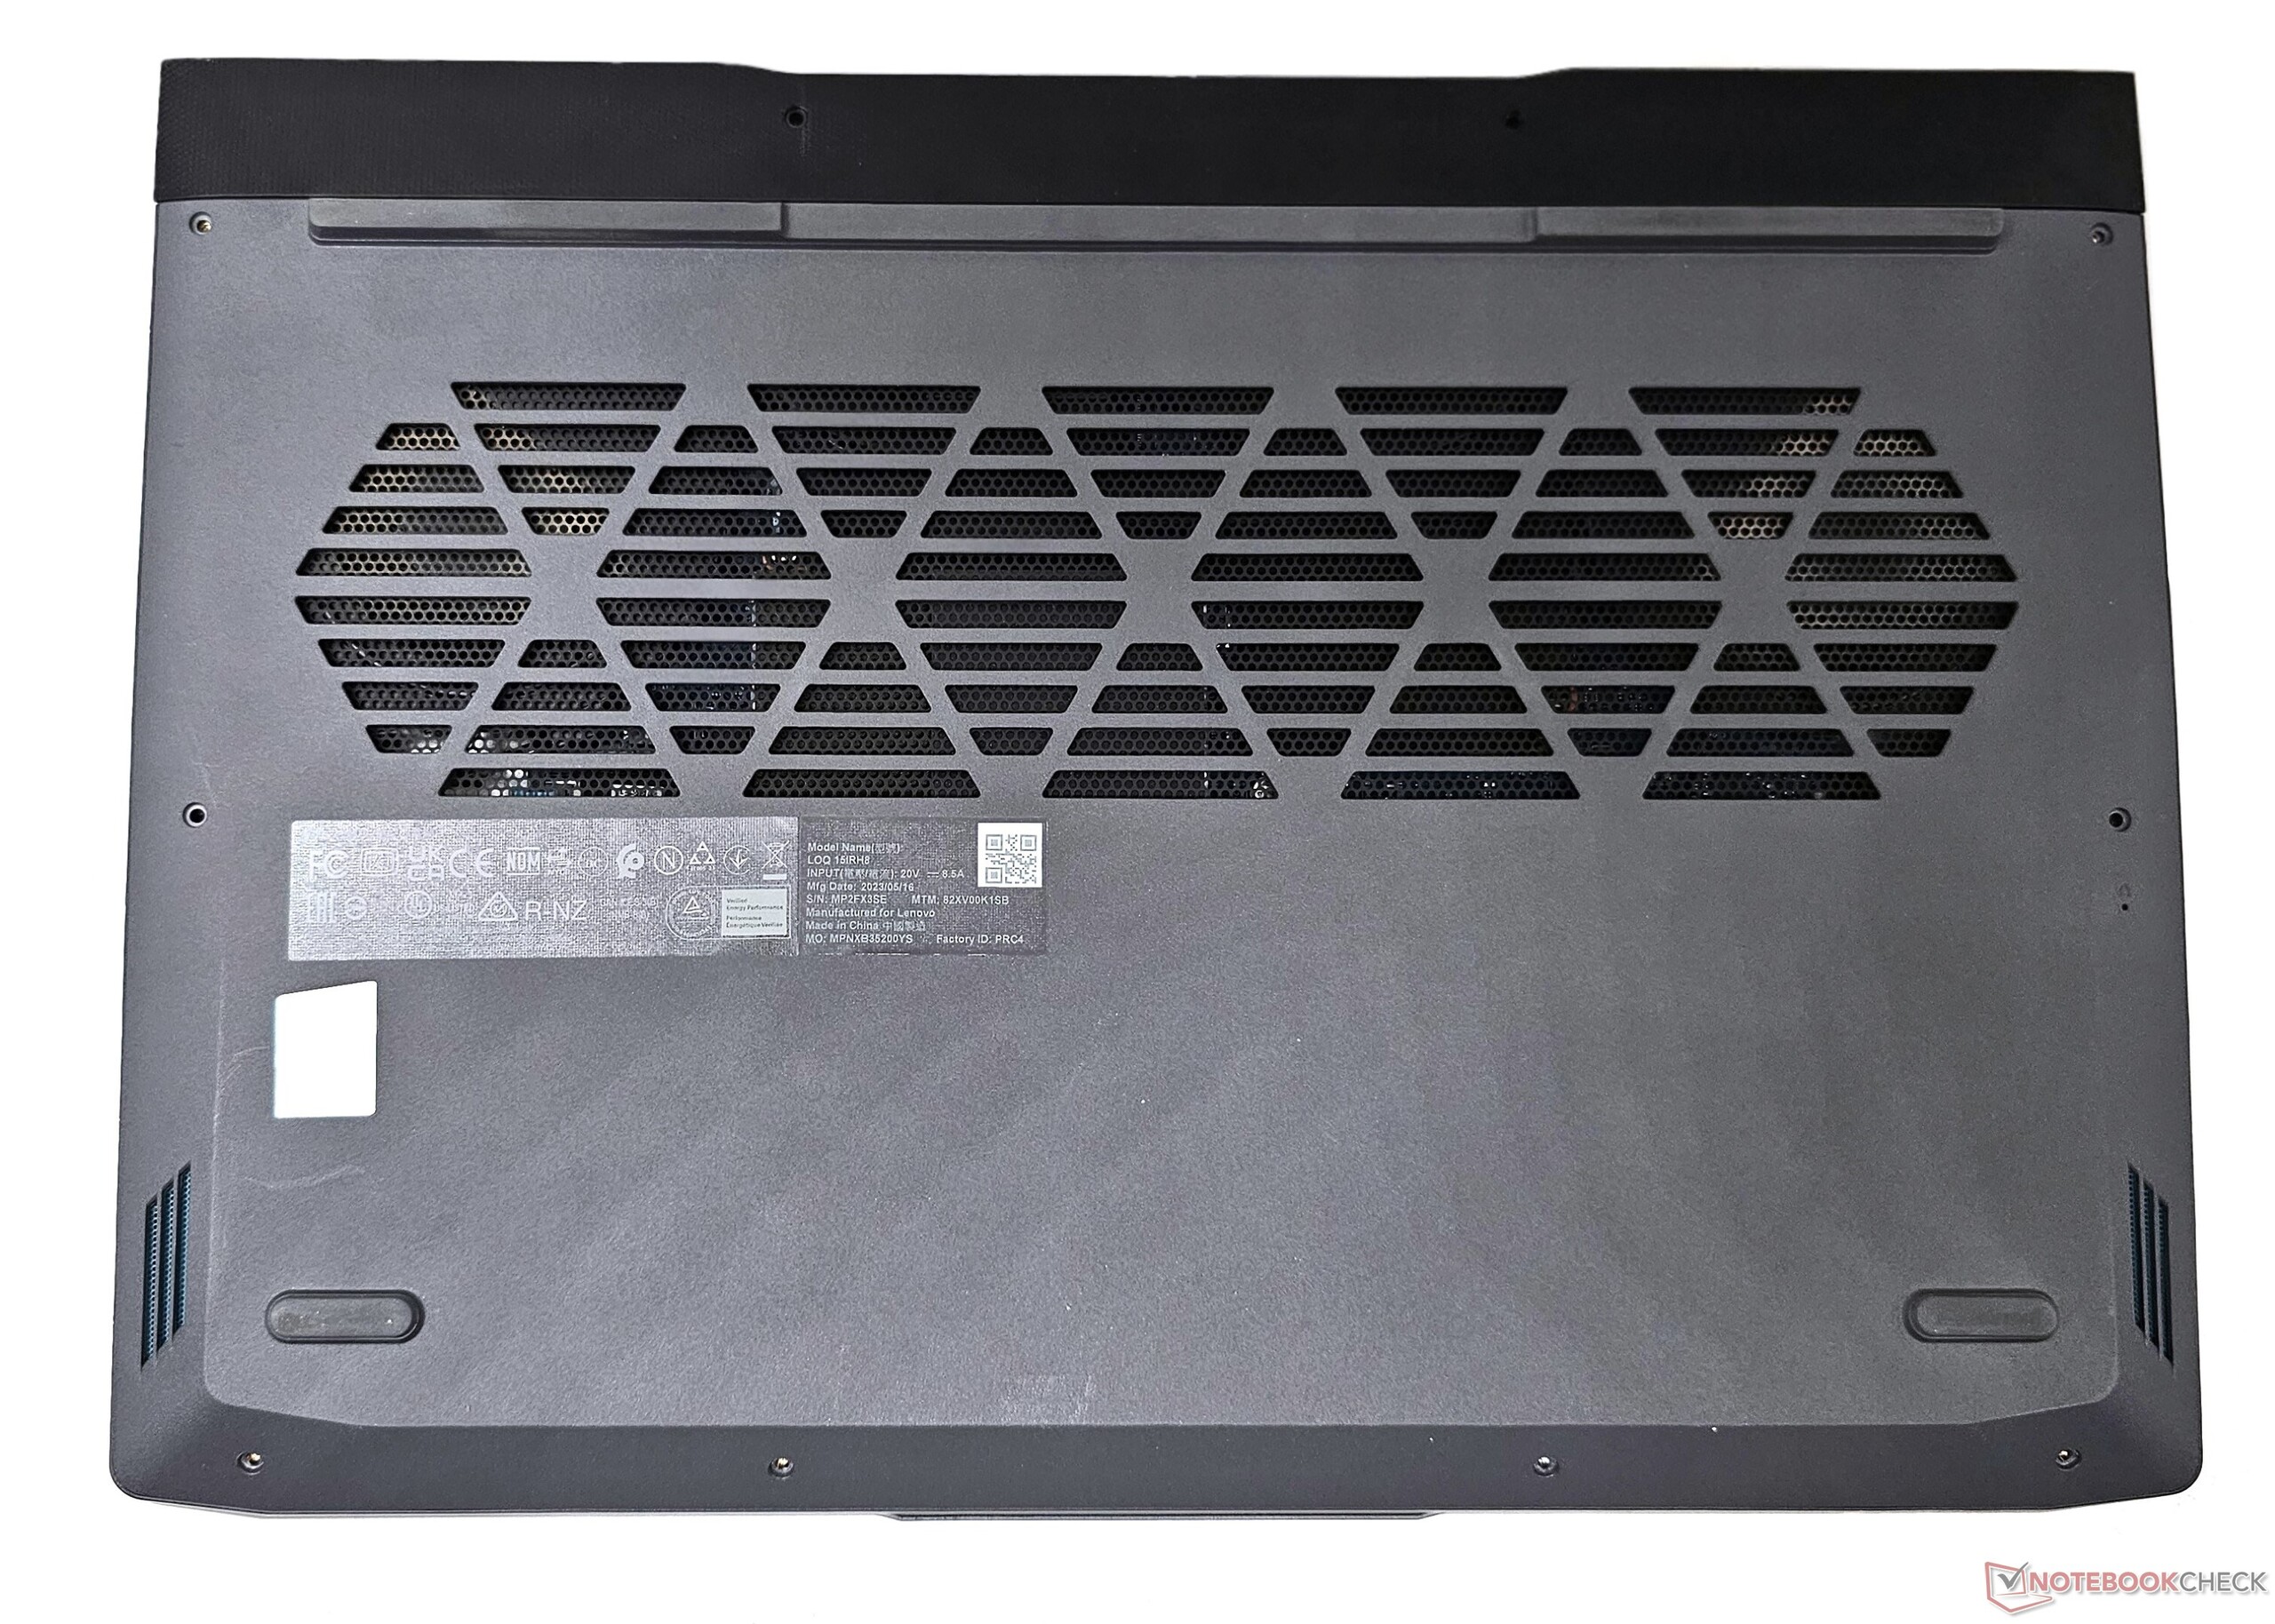
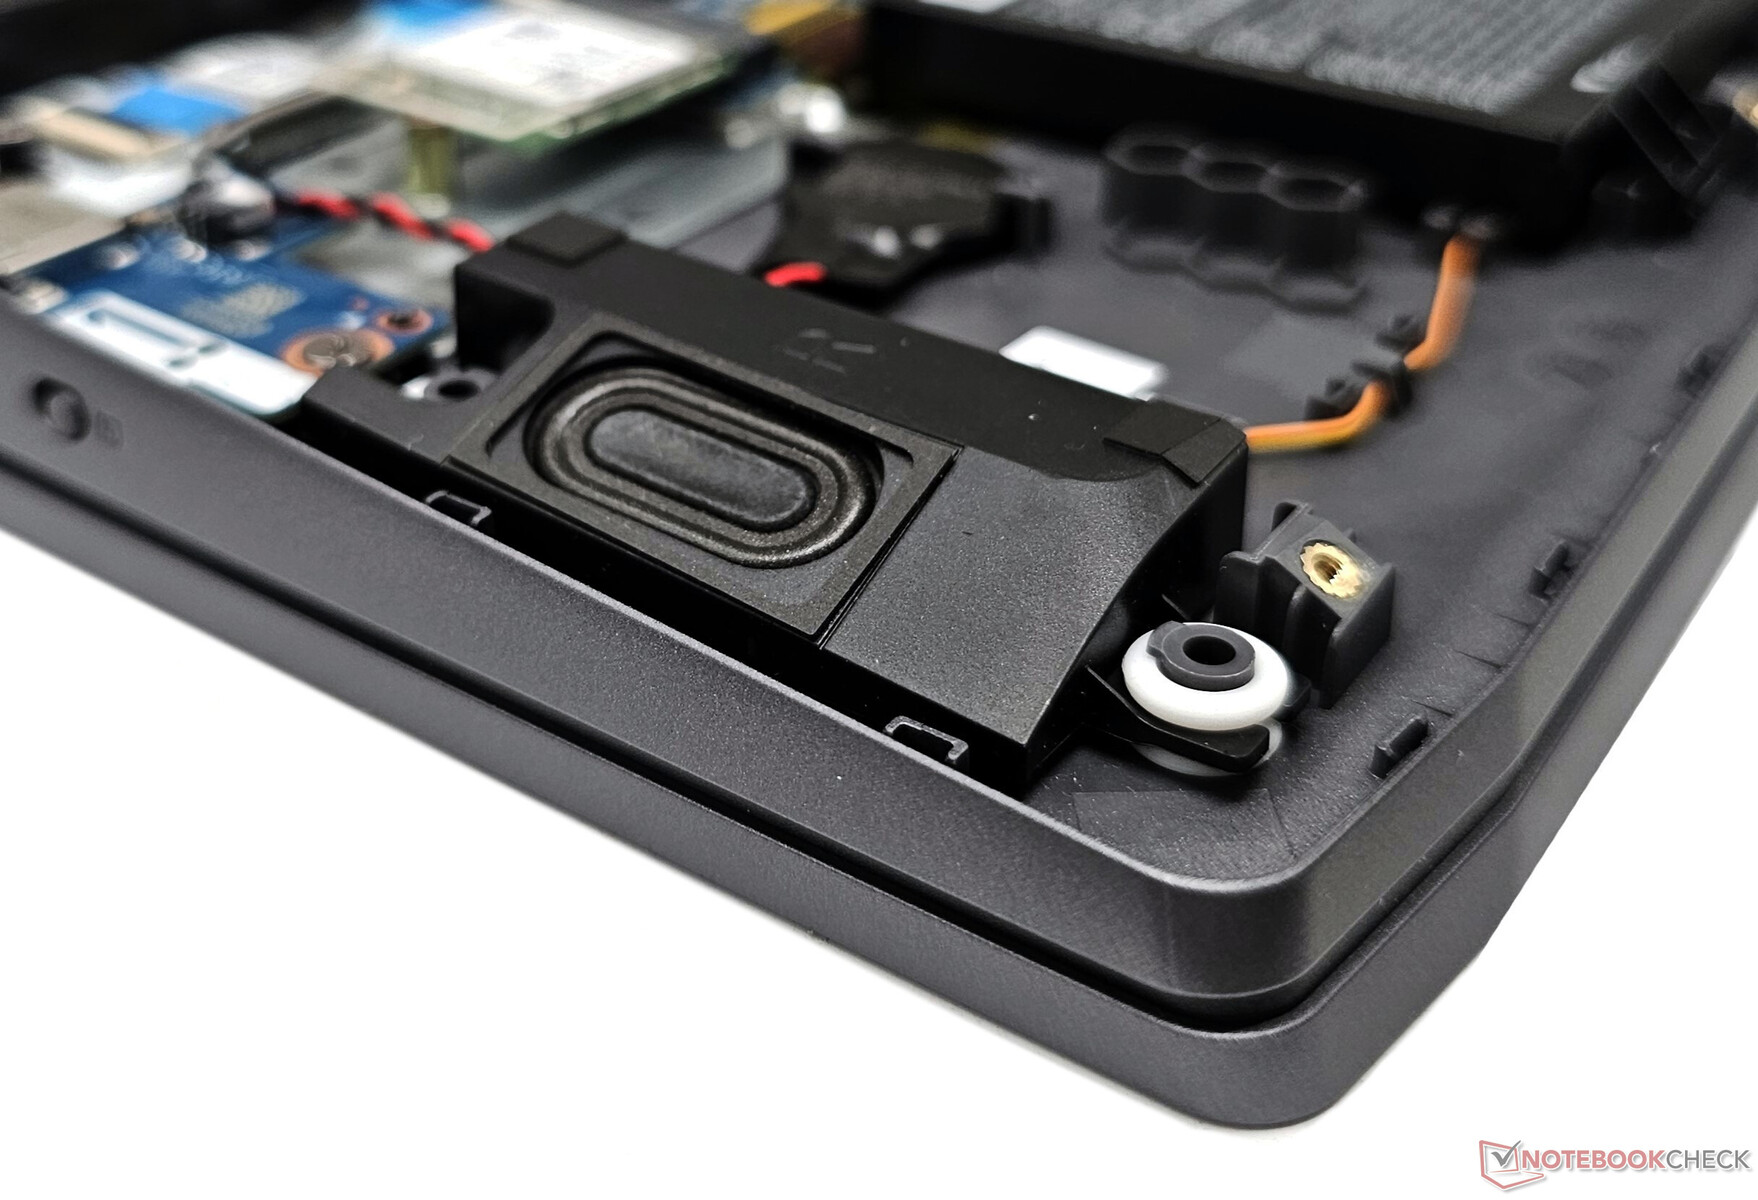
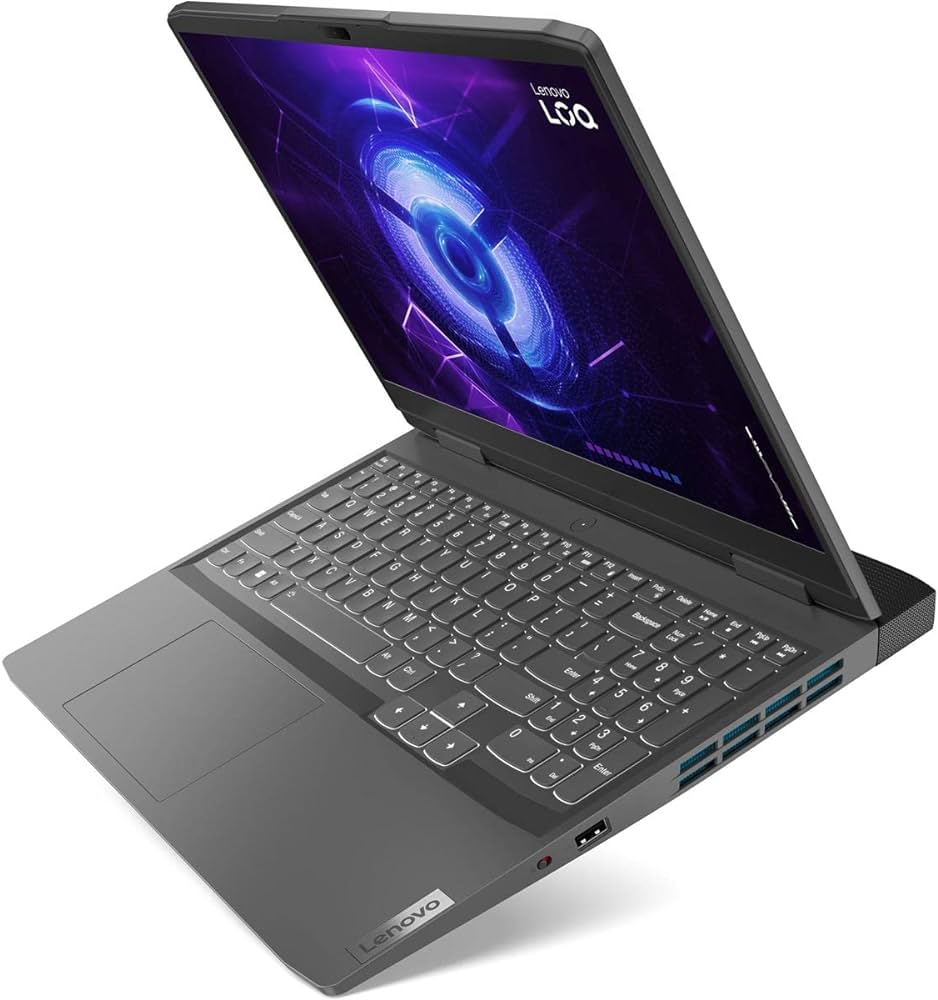
Kasa ve Giriş aygıtları: AMD varyantı ile aynı plastik yapı
Lenovo LOQ 15IRH8'in kasası, bakımı ve giriş aygıtları hakkında daha fazla bilgi için lütfen LOQ 15APH8 incelemesi- Bu özellikler Lenovo'nun Intel ve AMD tabanlı LOQ dizüstü bilgisayarları arasında aynıdır.
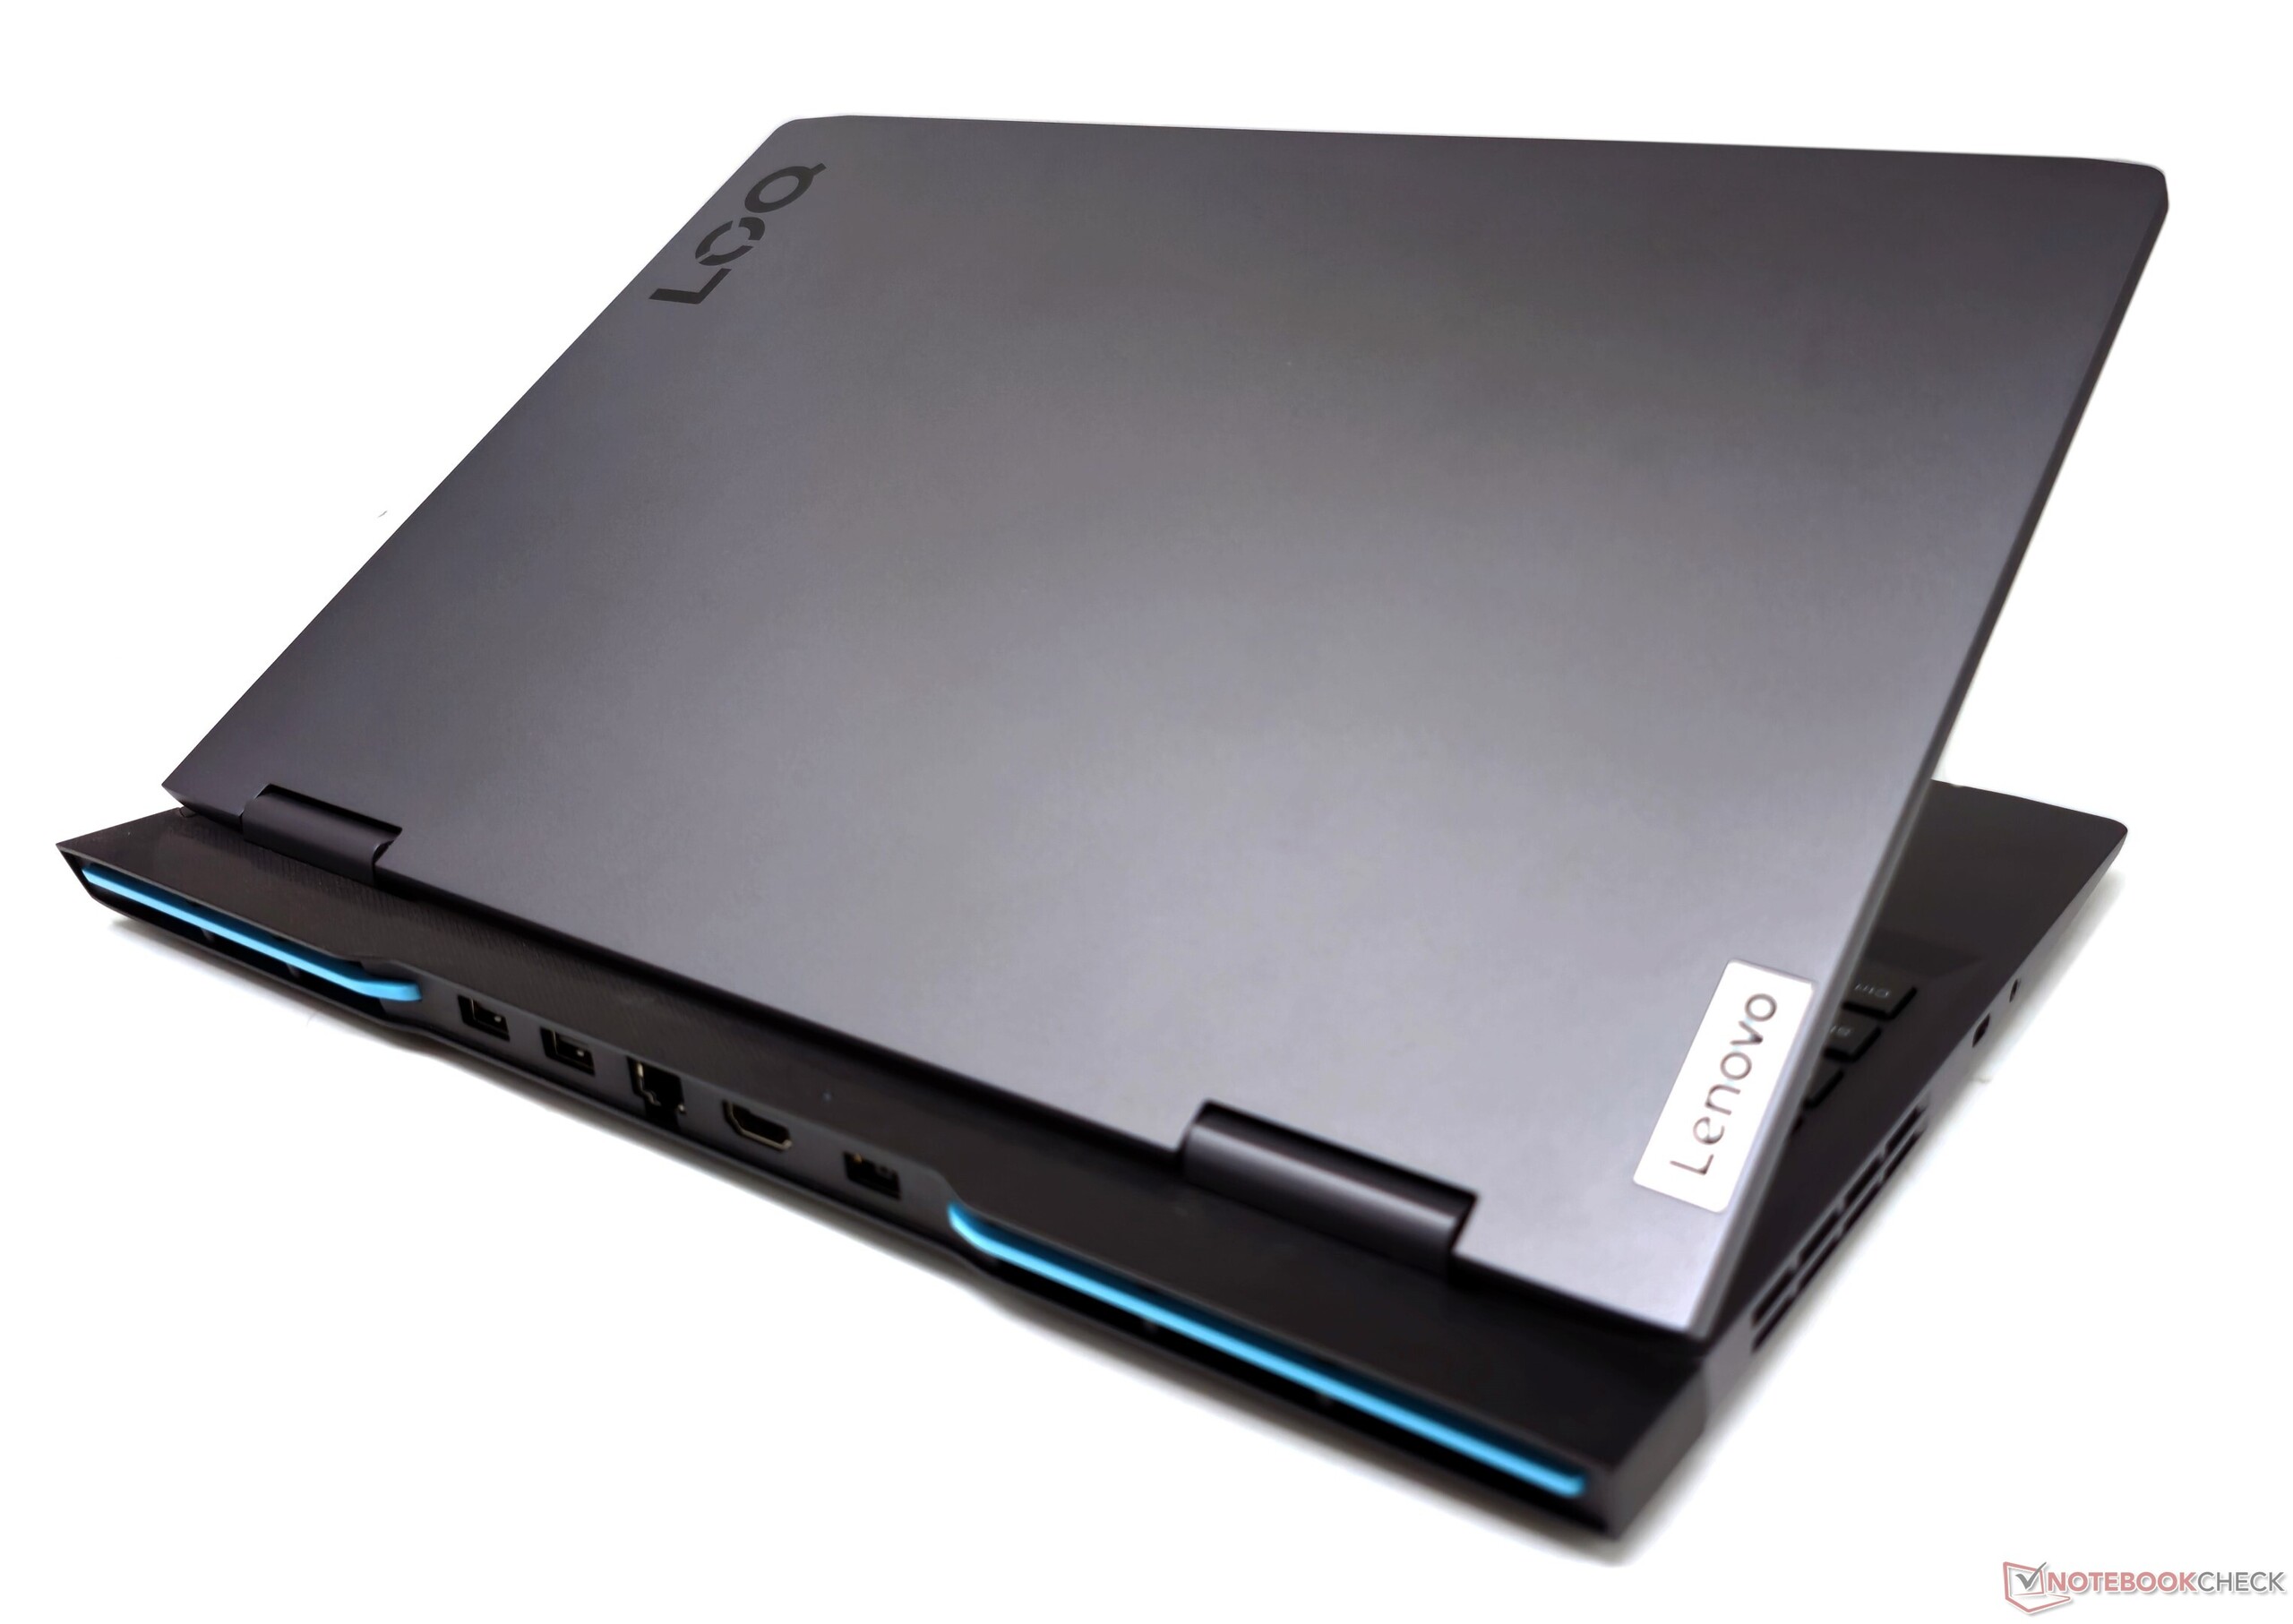
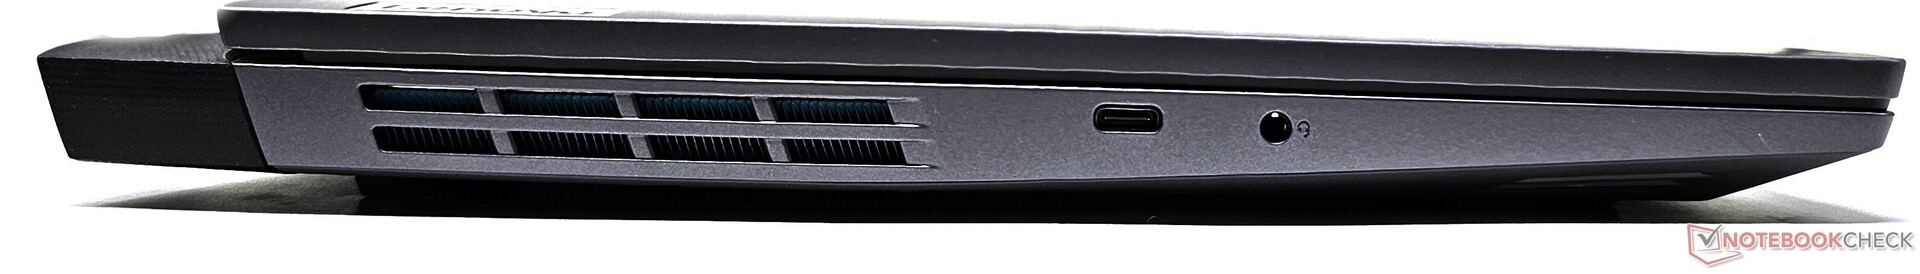
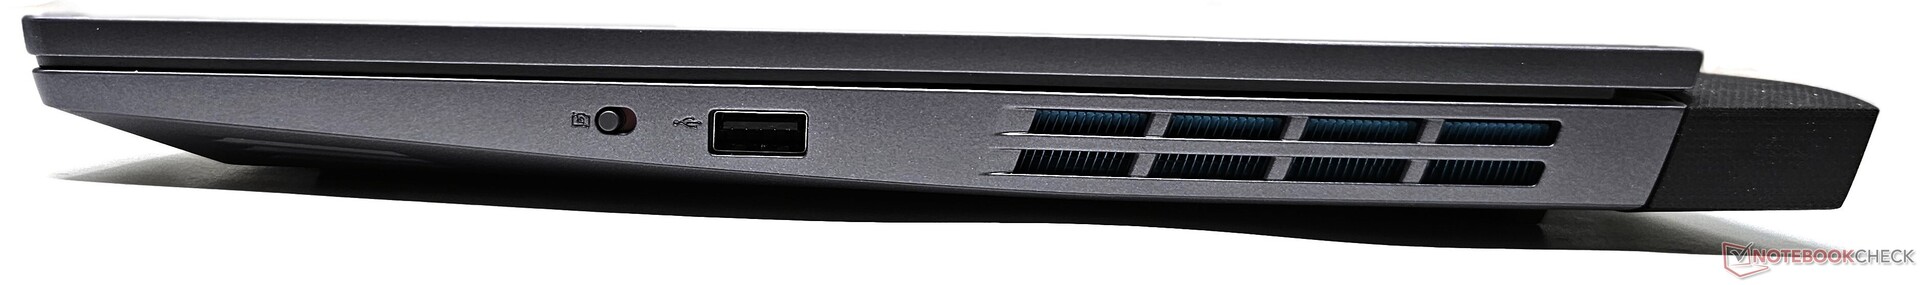
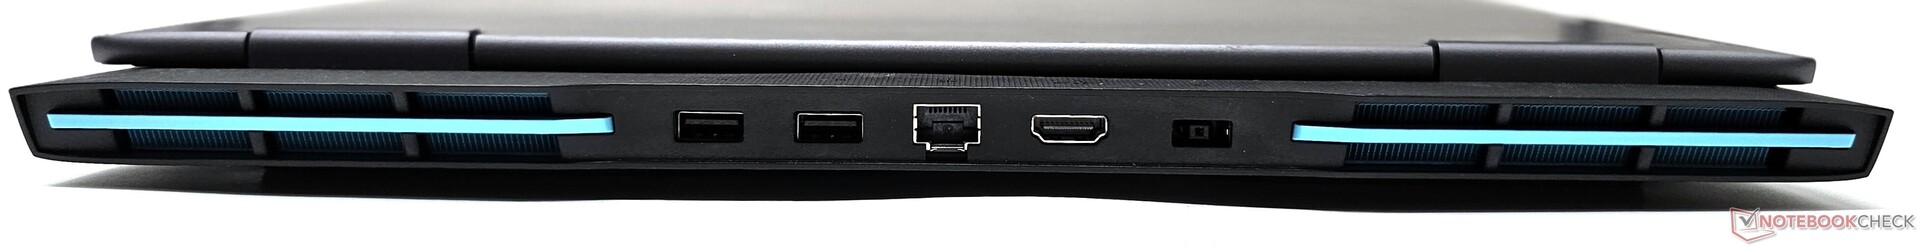
Bağlanabilirlik: 140 W USB-C güç dağıtımı ancak Thunderbolt 4 yok
Port seçimi ve yerleşimi Intel tabanlı LOQ 16 ile tamamen aynıdır. LOQ 15APH8'in diğer USB 3.2 portları arasında bir USB 2.0 portu kullanmasının aksine, Intel varyantları USB 3.2 bağlantısını tamamen standartlaştırır.
Lenovo'ya göre, tek USB 3.2 Gen2 Type-C bağlantı noktası 140 W güç dağıtımı kapasitesine sahip. USB4 ya da Thunderbolt 4 seçeneği bulunmuyor.
İletişim
Kablosuz performansı bir Realtek Wi-Fi 6 modülü için beklenen çizgide. Referans Asus ROG Rapture GT-AXE11000 yönlendiricimizle test edildiğinde hem gönderme hem de alma testleri istikrarlı bir verim gösterdi.
| Networking / iperf3 transmit AXE11000 | |
| Lenovo Legion Pro 5 16ARX8 (R5 7645HX, RTX 4050) | |
| Dell G15 5530 | |
| MSI Katana 17 B13VFK | |
| Sınıf ortalaması Gaming (560 - 1862, n=88, son 2 yıl) | |
| Lenovo LOQ 15IRH8 Core i7 | |
| Lenovo LOQ 15APH8 | |
| Ortalama Realtek RTL8852BE (536 - 943, n=71) | |
| Asus TUF Gaming A16 FA617XS | |
| Lenovo LOQ 16IRH8 | |
| HP Victus 16-r0077ng | |
| Networking / iperf3 receive AXE11000 | |
| MSI Katana 17 B13VFK | |
| Lenovo Legion Pro 5 16ARX8 (R5 7645HX, RTX 4050) | |
| Dell G15 5530 | |
| Sınıf ortalaması Gaming (680 - 1745, n=88, son 2 yıl) | |
| Lenovo LOQ 15IRH8 Core i7 | |
| Asus TUF Gaming A16 FA617XS | |
| Ortalama Realtek RTL8852BE (455 - 985, n=72) | |
| Lenovo LOQ 16IRH8 | |
| Lenovo LOQ 15APH8 | |
| HP Victus 16-r0077ng | |
Web kamerası
1080p web kamerası beyaz hariç tüm renklerde yüksek sapmalar gösteriyor. Görüntü kalitesi, iyi ortam ışığında görüntülü görüşmeler için hala kullanılabilir durumdadır. Cihazın sağ tarafında elektronik bir kamera deklanşör anahtarı bulunmaktadır.


Garanti
Hindistan'da Lenovo, LOQ 15 için standart bir yıllık yerinde garanti sunuyor. Alıcılar ayrıca doğrudan Lenovo'dan çeşitli garanti yükseltme ve kaza sonucu hasar koruma seçeneklerini tercih edebilirler.
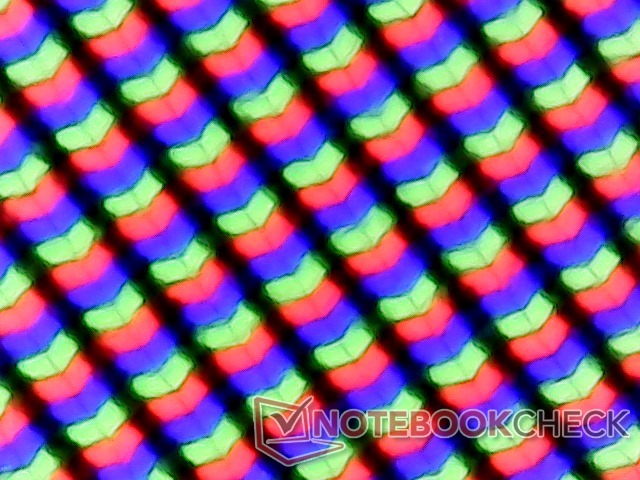
Ekran: 165 Hz QHD G-Sync panel önemli bir yükseltme seçeneği sunuyor
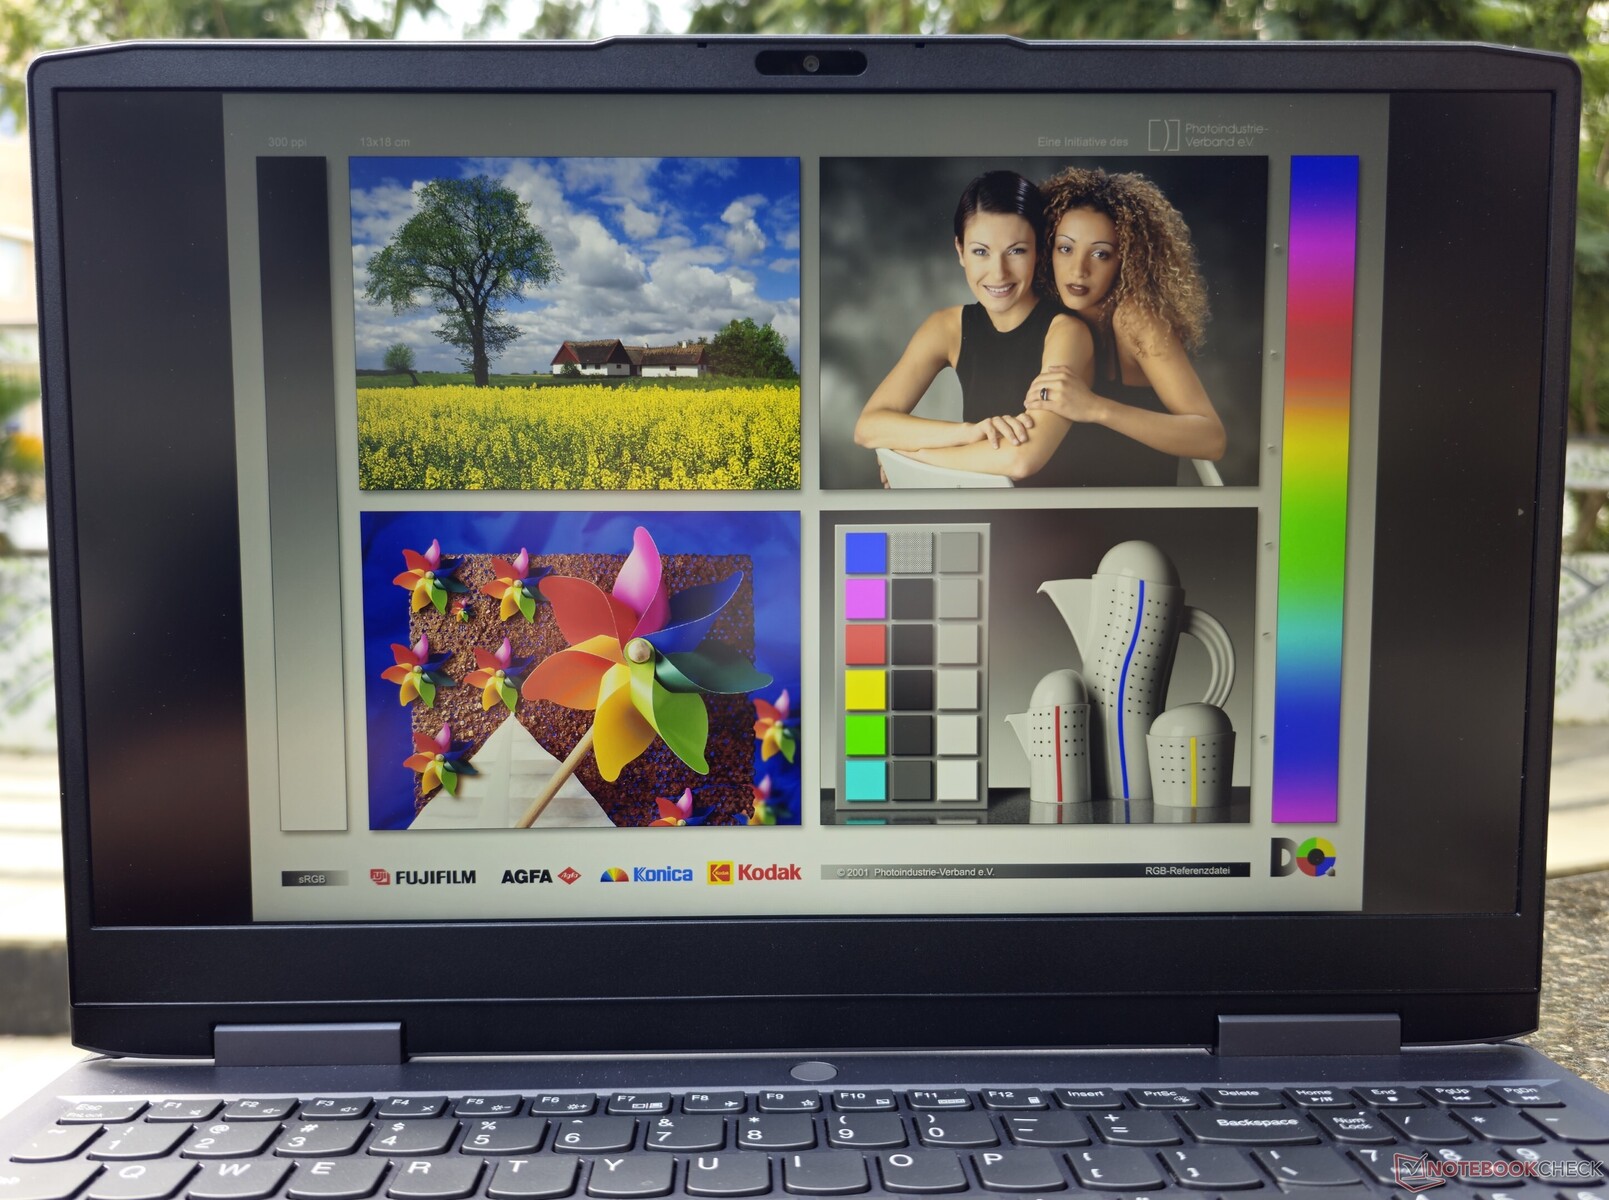
LOQ 15 ünitemiz 165 Hz yenileme hızına sahip bir BOE QHD panel ile donatılmış olarak geldi. Panel, ayrı GPU modunda Nvidia G-Sync'i destekliyor. Lenovo parlaklığı 350 nit olarak derecelendiriyor, ancak ekranın en parlak noktasında 383 nite kadar kaydettik.
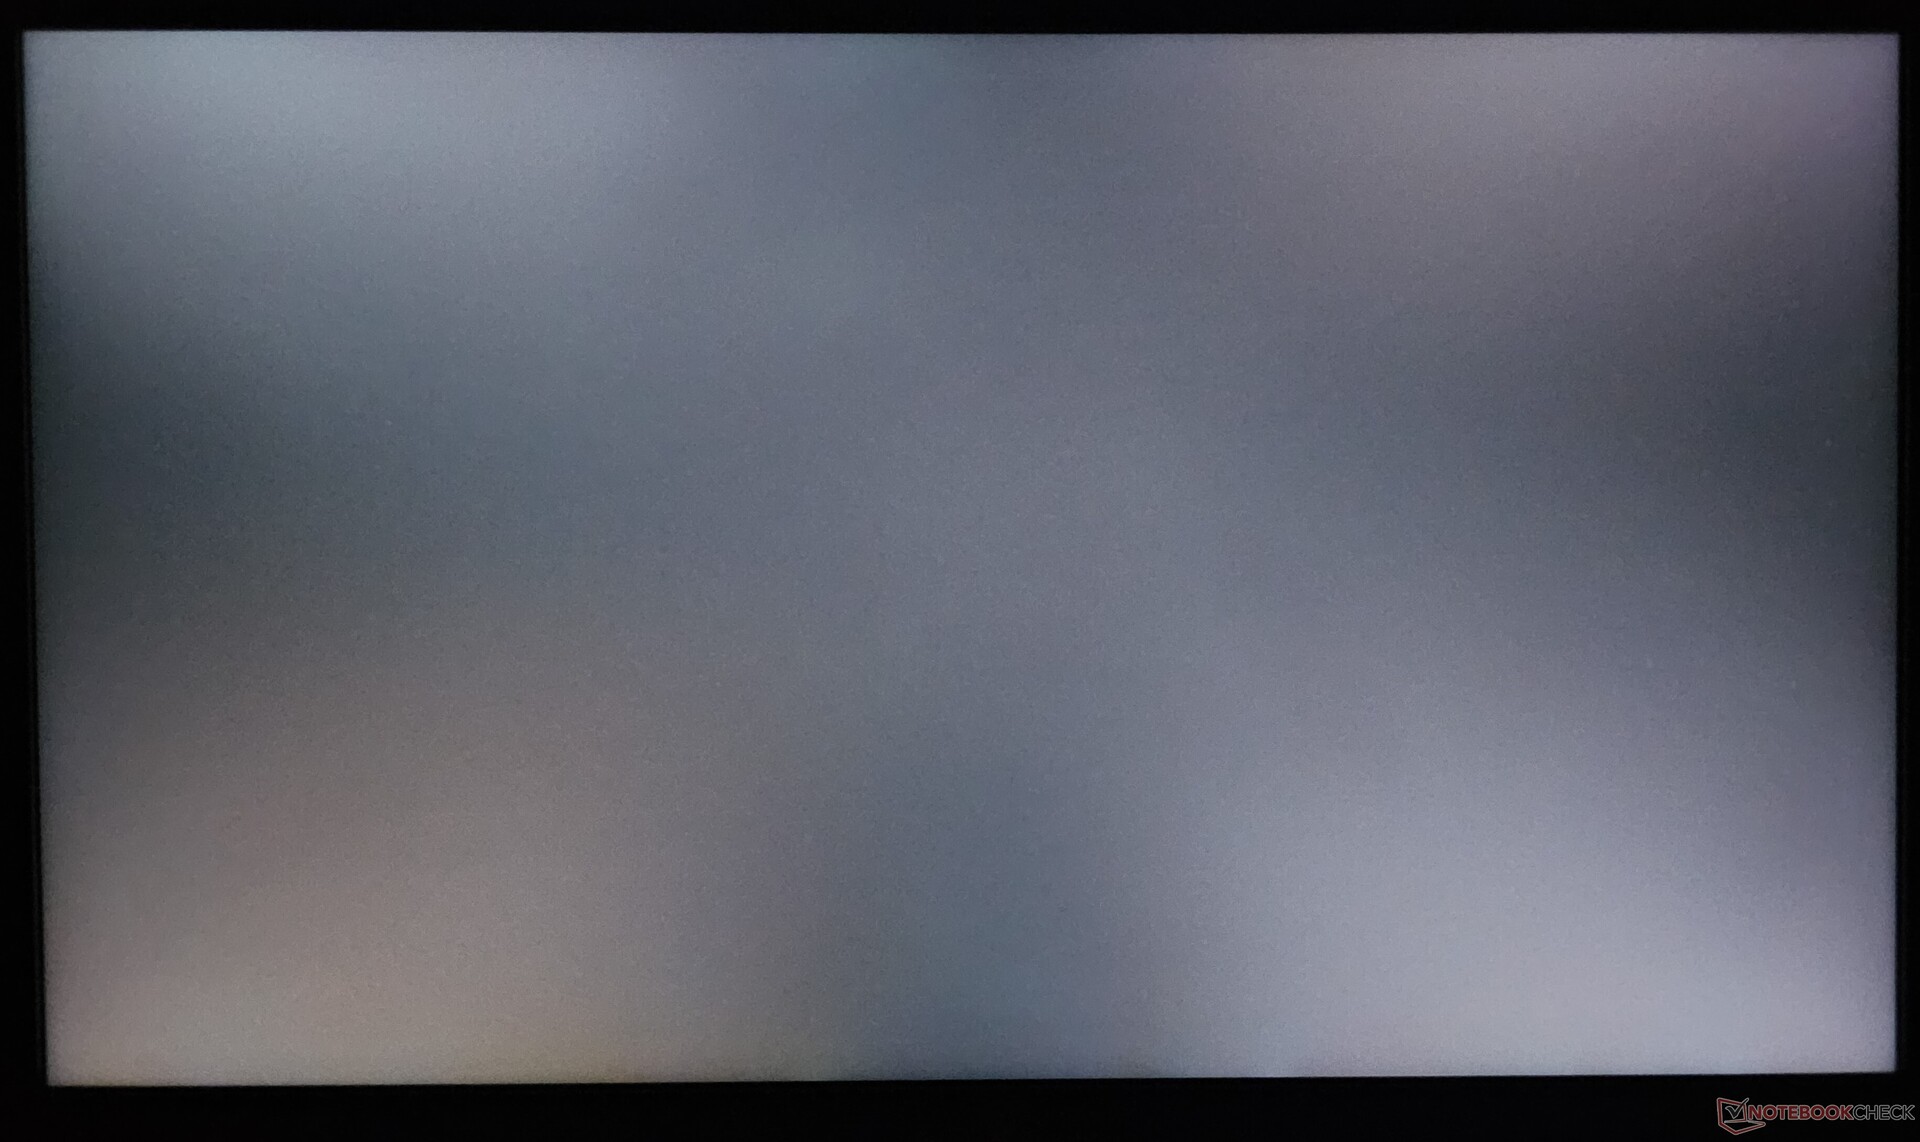
Köşelerde arka ışık sızması var, ancak genel parlaklık homojenliği %90'da iyi. Siyah seviyeleri ve kontrast oranı, LOQ 16IRH8'deki AUO yapımı QHD+ panelden daha iyi performans gösteriyor.
| |||||||||||||||||||||||||
Aydınlatma: 90 %
Batarya modunda parlaklık: 372 cd/m²
Kontrast: 1130:1 (Siyah: 0.33 cd/m²)
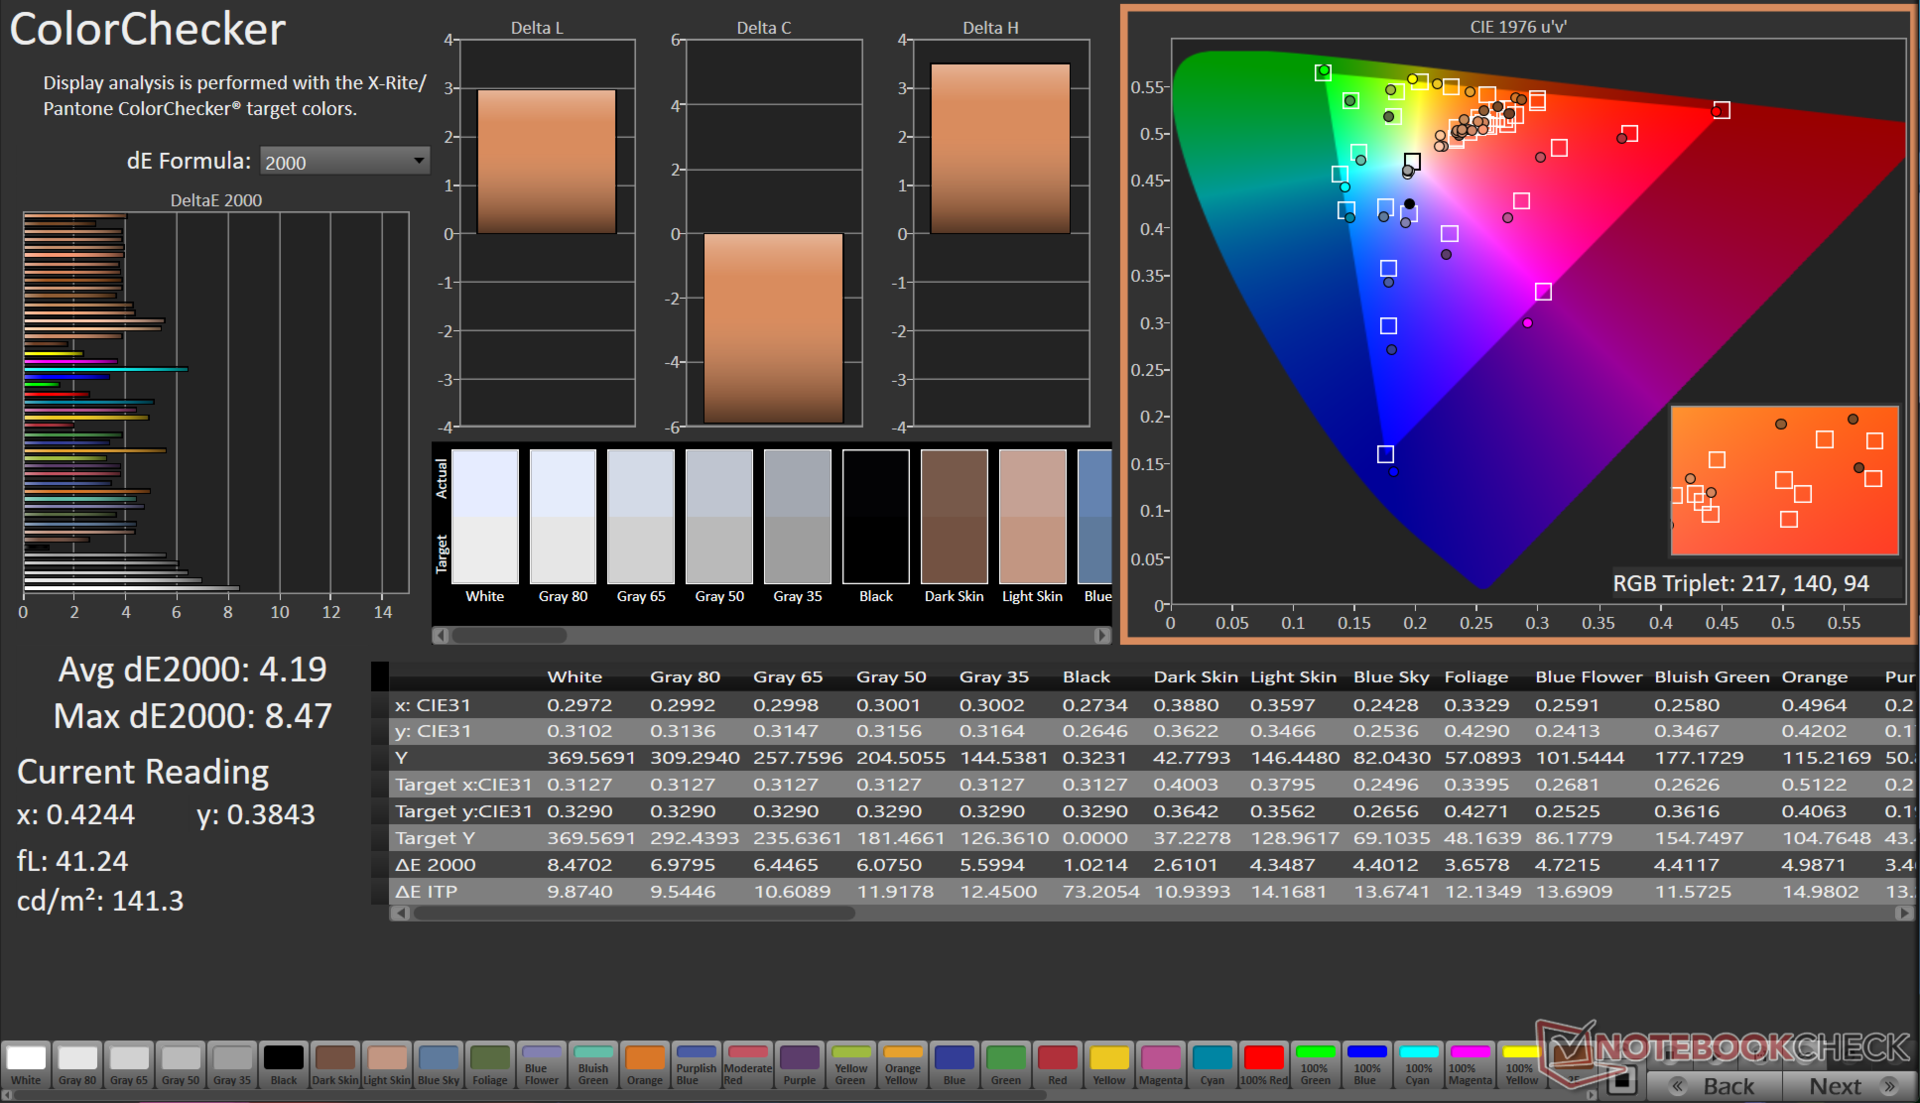
ΔE ColorChecker Calman: 4.19 | ∀{0.5-29.43 Ø4.71}
calibrated: 1.07
ΔE Greyscale Calman: 5 | ∀{0.09-98 Ø4.96}
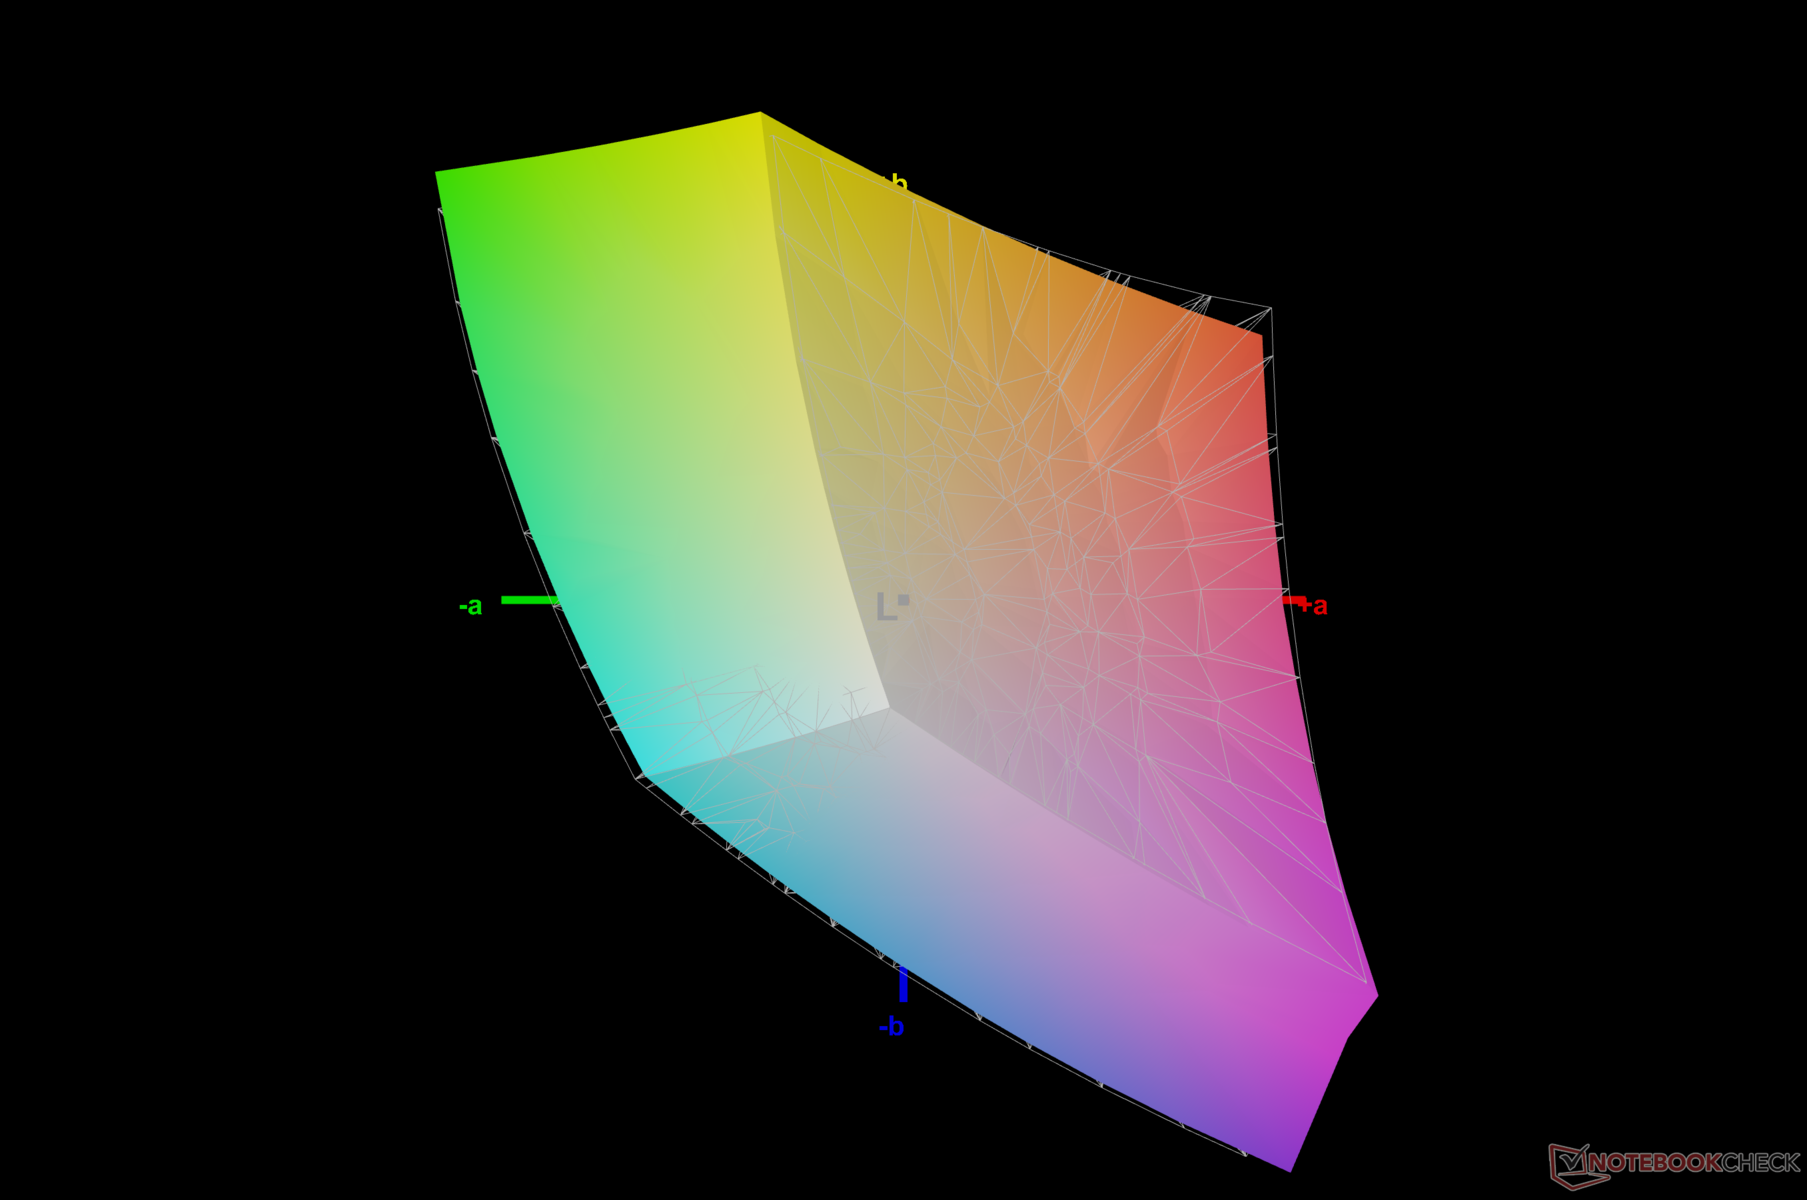
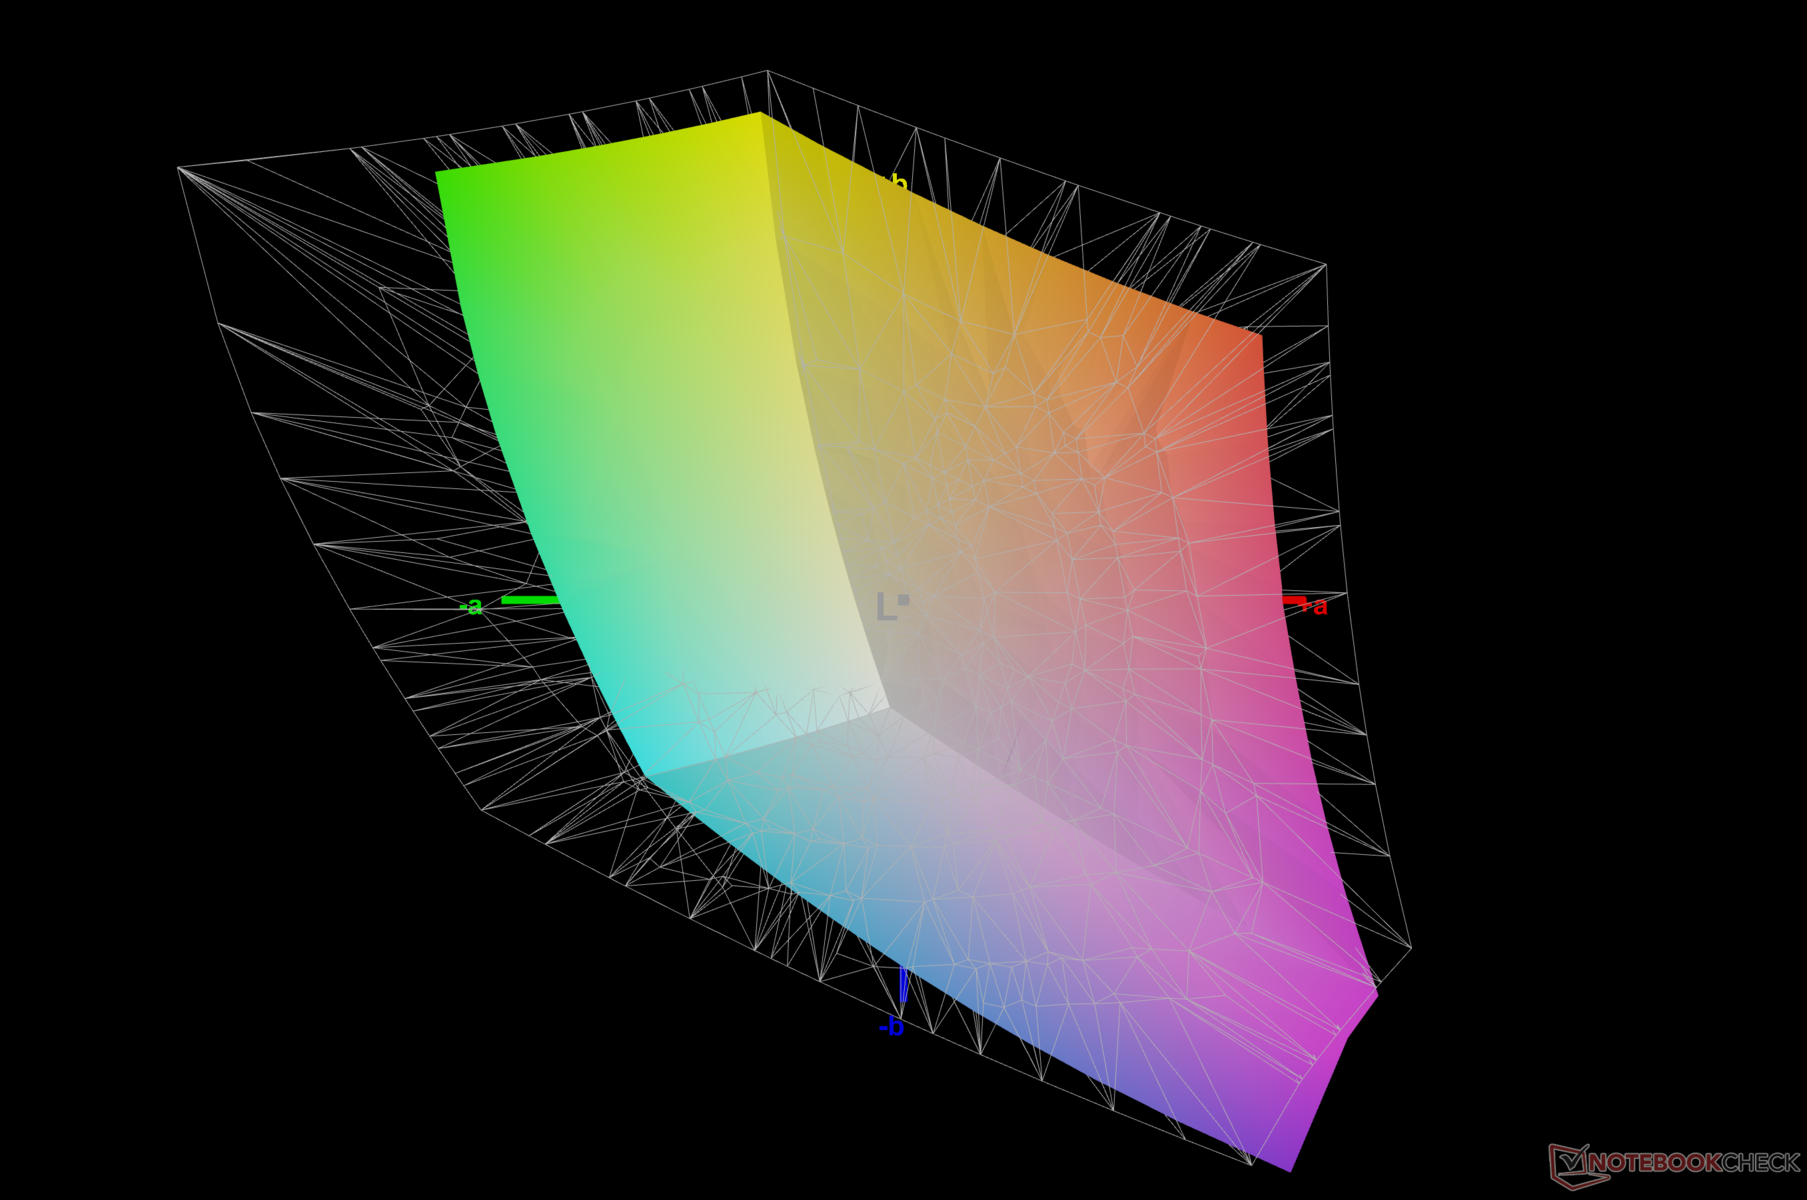
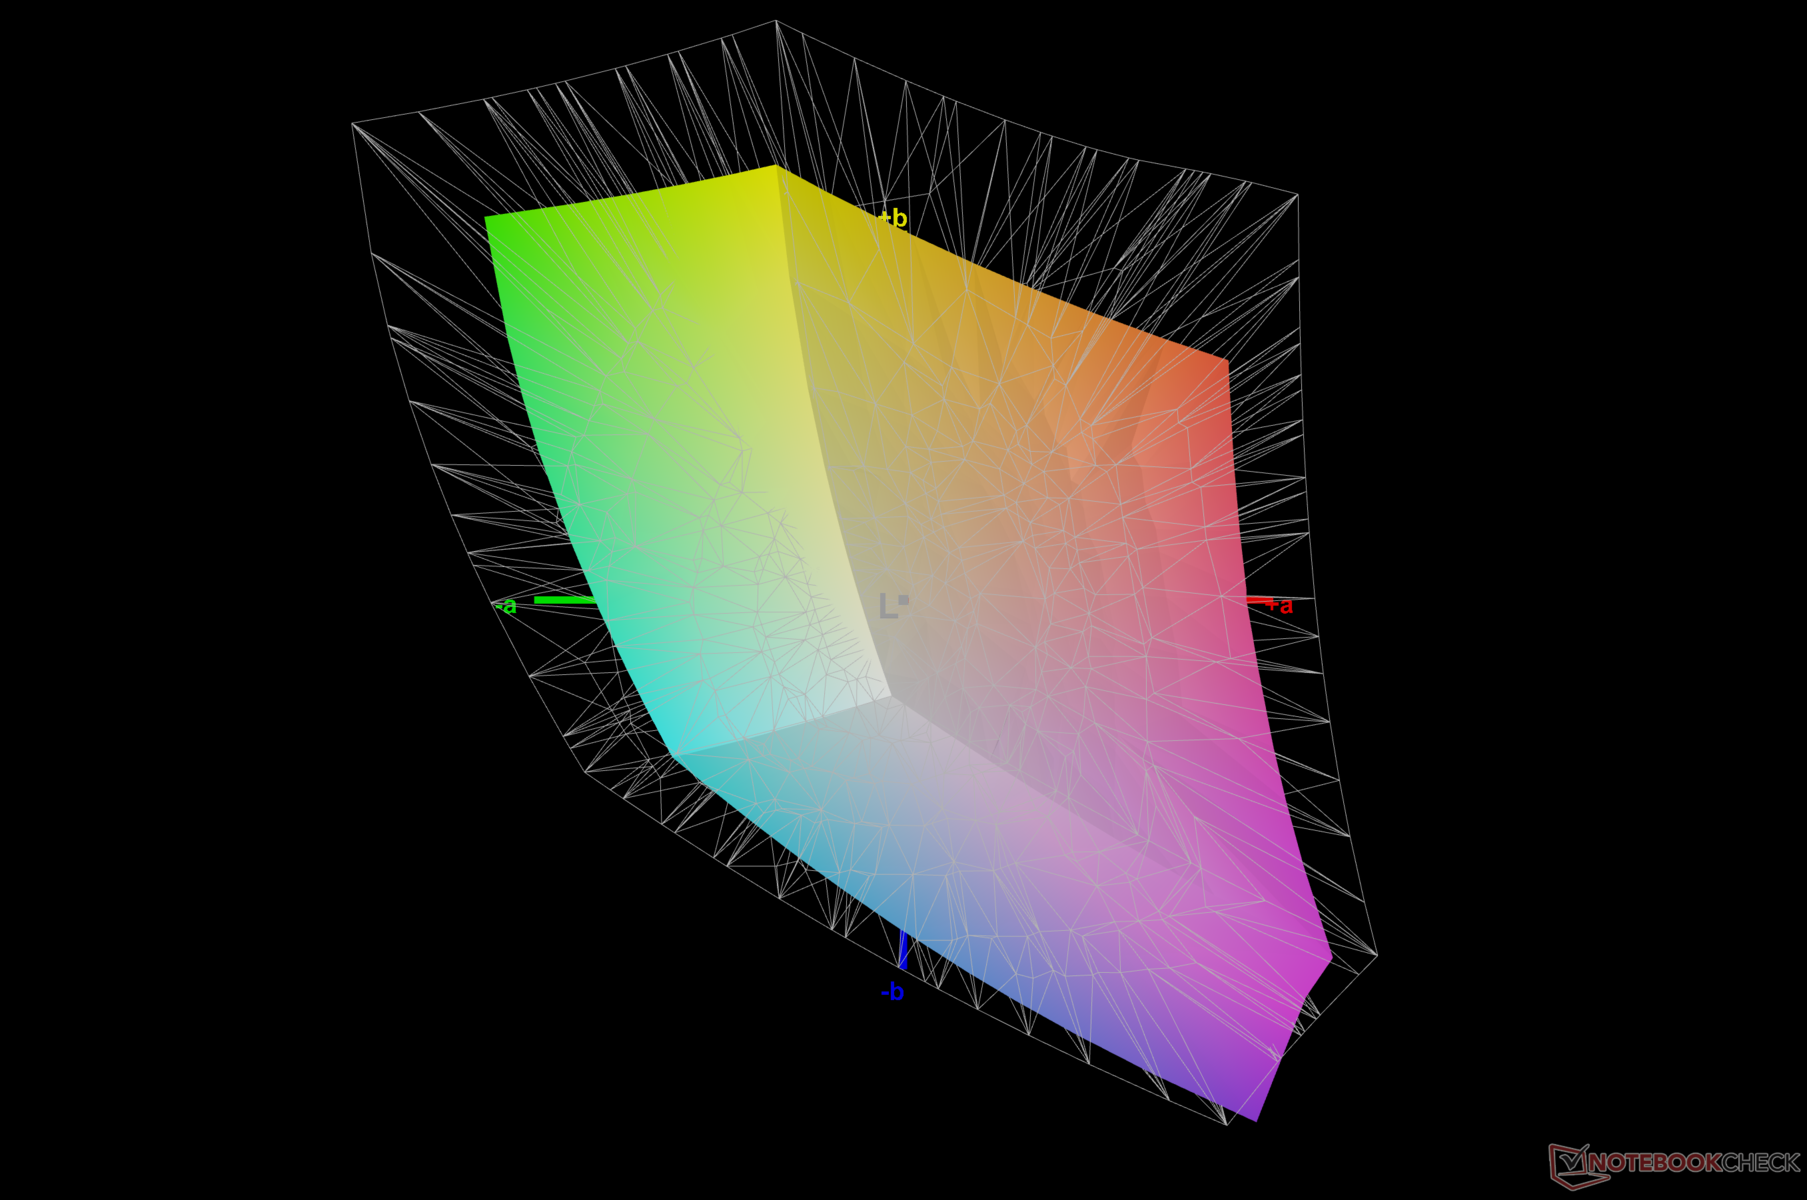
67.7% AdobeRGB 1998 (Argyll 3D)
96.6% sRGB (Argyll 3D)
66.3% Display P3 (Argyll 3D)
Gamma: 1.93
CCT: 7520 K
| Lenovo LOQ 15IRH8 Core i7 BOE CQ NE156QHM-NY4, IPS, 2560x1440, 15.6" | Lenovo LOQ 16IRH8 AUOC1A5 (B160QAN03.L), IPS, 2560x1600, 16" | Lenovo LOQ 15APH8 BOE NJ NE156FHM-NX3, IPS, 1920x1080, 15.6" | MSI Katana 17 B13VFK B173HAN04.9, IPS LED, 1920x1080, 17.3" | Lenovo Legion Pro 5 16ARX8 (R5 7645HX, RTX 4050) CSOT T3 MNG007DA2-2, IPS, 2560x1600, 16" | HP Victus 16-r0077ng CMN162D, IPS, 1920x1080, 16.1" | Dell G15 5530 AUO B156HAN, IPS, 1920x1080, 15.6" | Asus TUF Gaming A16 FA617XS BOE NE160WUM-NX2, IPS, 1920x1200, 16" | |
|---|---|---|---|---|---|---|---|---|
| Display | 5% | -39% | -38% | 6% | 1% | 7% | 3% | |
| Display P3 Coverage (%) | 66.3 | 70.5 6% | 40.2 -39% | 40.8 -38% | 71.6 8% | 66.7 1% | 73.1 10% | 69.3 5% |
| sRGB Coverage (%) | 96.6 | 98.9 2% | 60.2 -38% | 61 -37% | 99.8 3% | 98 1% | 98.4 2% | 97.3 1% |
| AdobeRGB 1998 Coverage (%) | 67.7 | 72.6 7% | 41.5 -39% | 42.2 -38% | 72.9 8% | 69 2% | 74.4 10% | 70.7 4% |
| Response Times | -16% | -473% | -385% | -51% | -82% | 34% | -116% | |
| Response Time Grey 50% / Grey 80% * (ms) | 5 ? | 7.2 ? -44% | 42.7 ? -754% | 33 ? -560% | 12 ? -140% | 13.3 ? -166% | 3.39 ? 32% | 15.6 ? -212% |
| Response Time Black / White * (ms) | 8.41 ? | 7.4 ? 12% | 24.5 ? -191% | 26 ? -209% | 5.2 ? 38% | 8.2 ? 2% | 5.35 ? 36% | 10 ? -19% |
| PWM Frequency (Hz) | 21620 ? | |||||||
| Screen | 17% | -17% | -46% | 20% | 23% | -5% | 20% | |
| Brightness middle (cd/m²) | 373 | 407 9% | 346.2 -7% | 267 -28% | 543 46% | 308 -17% | 320 -14% | 301 -19% |
| Brightness (cd/m²) | 365 | 369 1% | 329 -10% | 256 -30% | 516 41% | 285 -22% | 316 -13% | 294 -19% |
| Brightness Distribution (%) | 90 | 85 -6% | 81 -10% | 93 3% | 87 -3% | 85 -6% | 94 4% | 94 4% |
| Black Level * (cd/m²) | 0.33 | 0.45 -36% | 0.31 6% | 0.21 36% | 0.58 -76% | 0.25 24% | 0.21 36% | 0.21 36% |
| Contrast (:1) | 1130 | 904 -20% | 1117 -1% | 1271 12% | 936 -17% | 1232 9% | 1524 35% | 1433 27% |
| Colorchecker dE 2000 * | 4.19 | 1.43 66% | 4.19 -0% | 4.7 -12% | 1.35 68% | 1.3 69% | 4.55 -9% | 1.79 57% |
| Colorchecker dE 2000 max. * | 8.47 | 3.58 58% | 19.19 -127% | 20.4 -141% | 3.22 62% | 2.76 67% | 9.83 -16% | 3.48 59% |
| Colorchecker dE 2000 calibrated * | 1.07 | 1.07 -0% | 1.66 -55% | 4.5 -321% | 1.31 -22% | 0.92 14% | 1.51 -41% | 1.2 -12% |
| Greyscale dE 2000 * | 5 | 1.13 77% | 2.6 48% | 1.5 70% | 1.03 79% | 1.7 66% | 6.2 -24% | 2.5 50% |
| Gamma | 1.93 114% | 2.5 88% | 2.19 100% | 2.12 104% | 2.38 92% | 2.167 102% | 2.07 106% | 2.265 97% |
| CCT | 7520 86% | 6526 100% | 6749 96% | 6552 99% | 6452 101% | 6767 96% | 6479 100% | 6157 106% |
| Toplam Ortalama (Program / Ayarlar) | 2% /
9% | -176% /
-87% | -156% /
-92% | -8% /
7% | -19% /
3% | 12% /
3% | -31% /
-3% |
* ... daha küçük daha iyidir
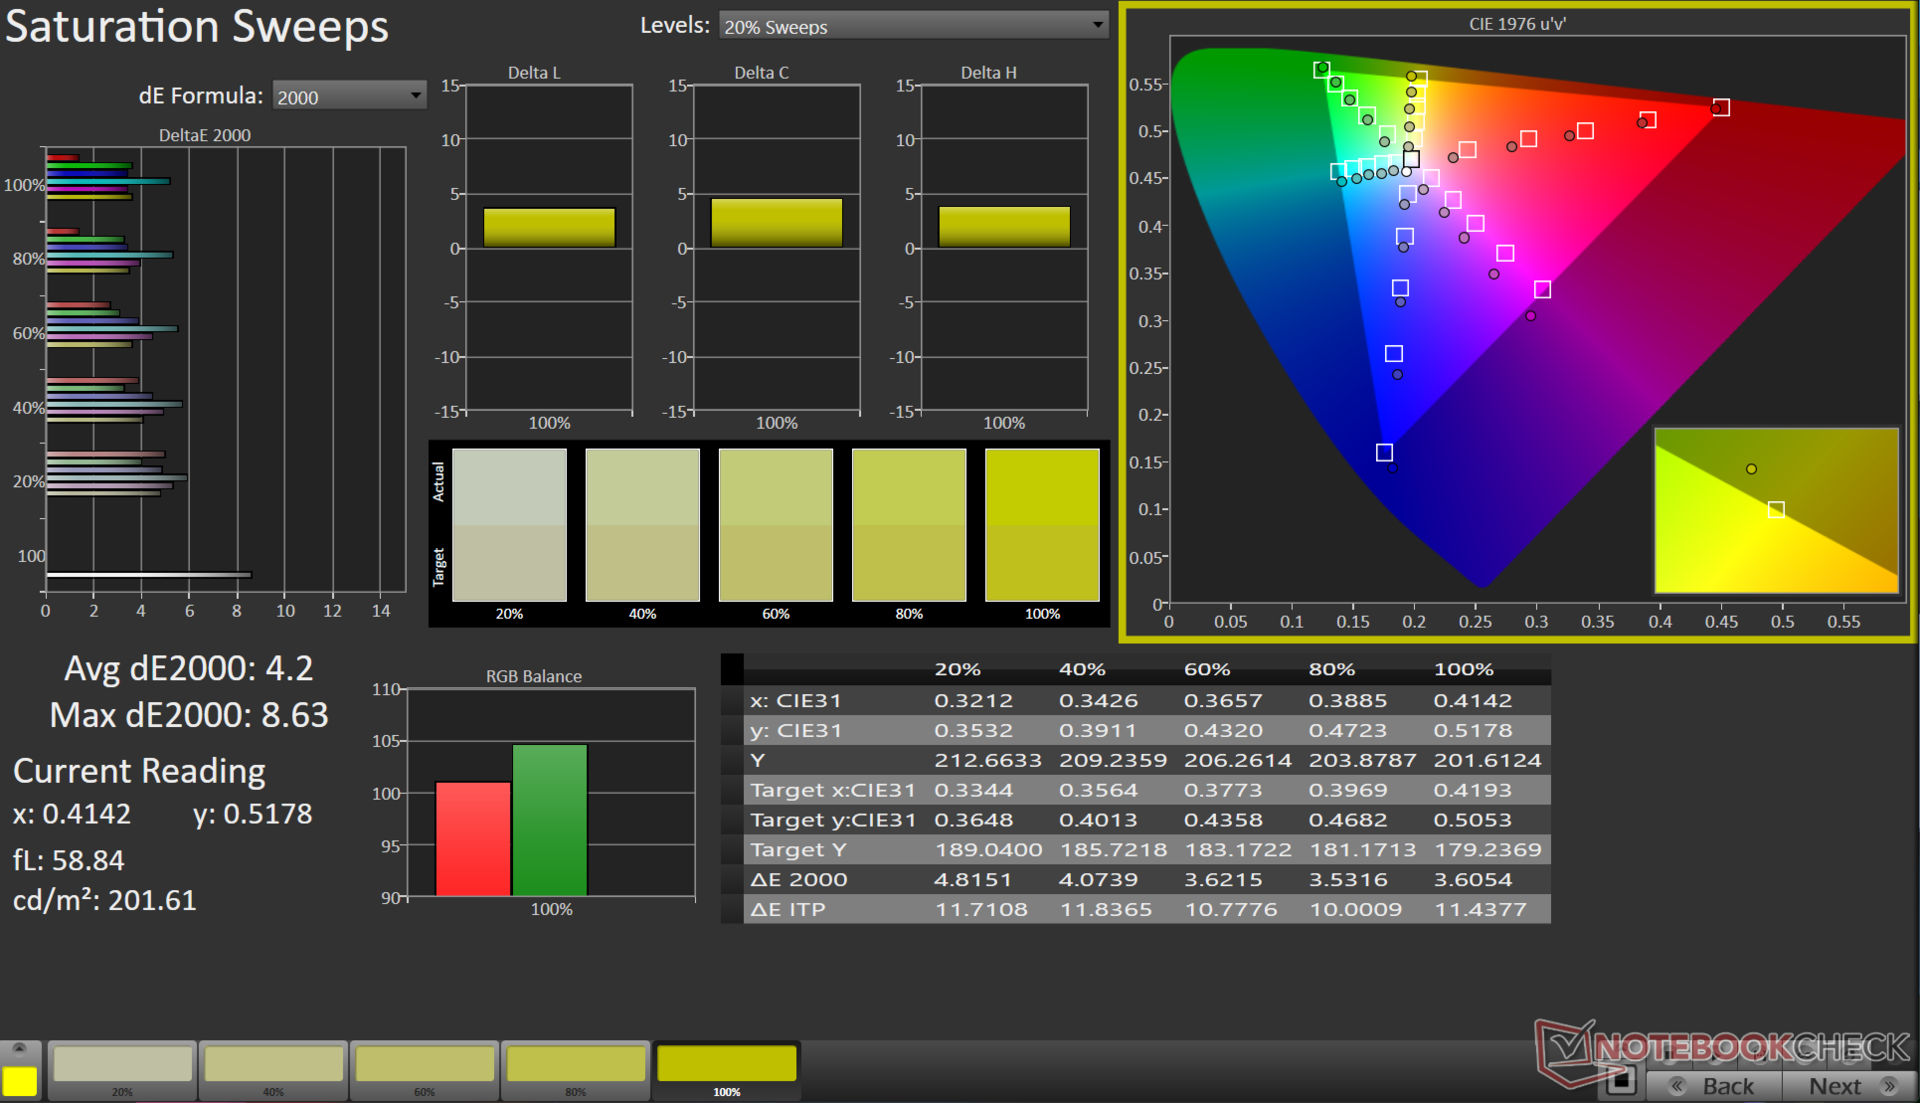
Ekran, sRGB renk gamının yaklaşık %97'sini kapsar ve bu da çoğu oyun ve web içeriği için yeterince iyi olmalıdır. Bununla birlikte, Adobe RGB ve Display P3 kapsamı yalnızca vasattır.
Bununla birlikte, LOQ 15IRH8'in QHD paneli, AMD destekli LOQ 15APH8'deki 1080p 144 Hz panele kıyasla çok daha iyi renk özelliklerine sahiptir.
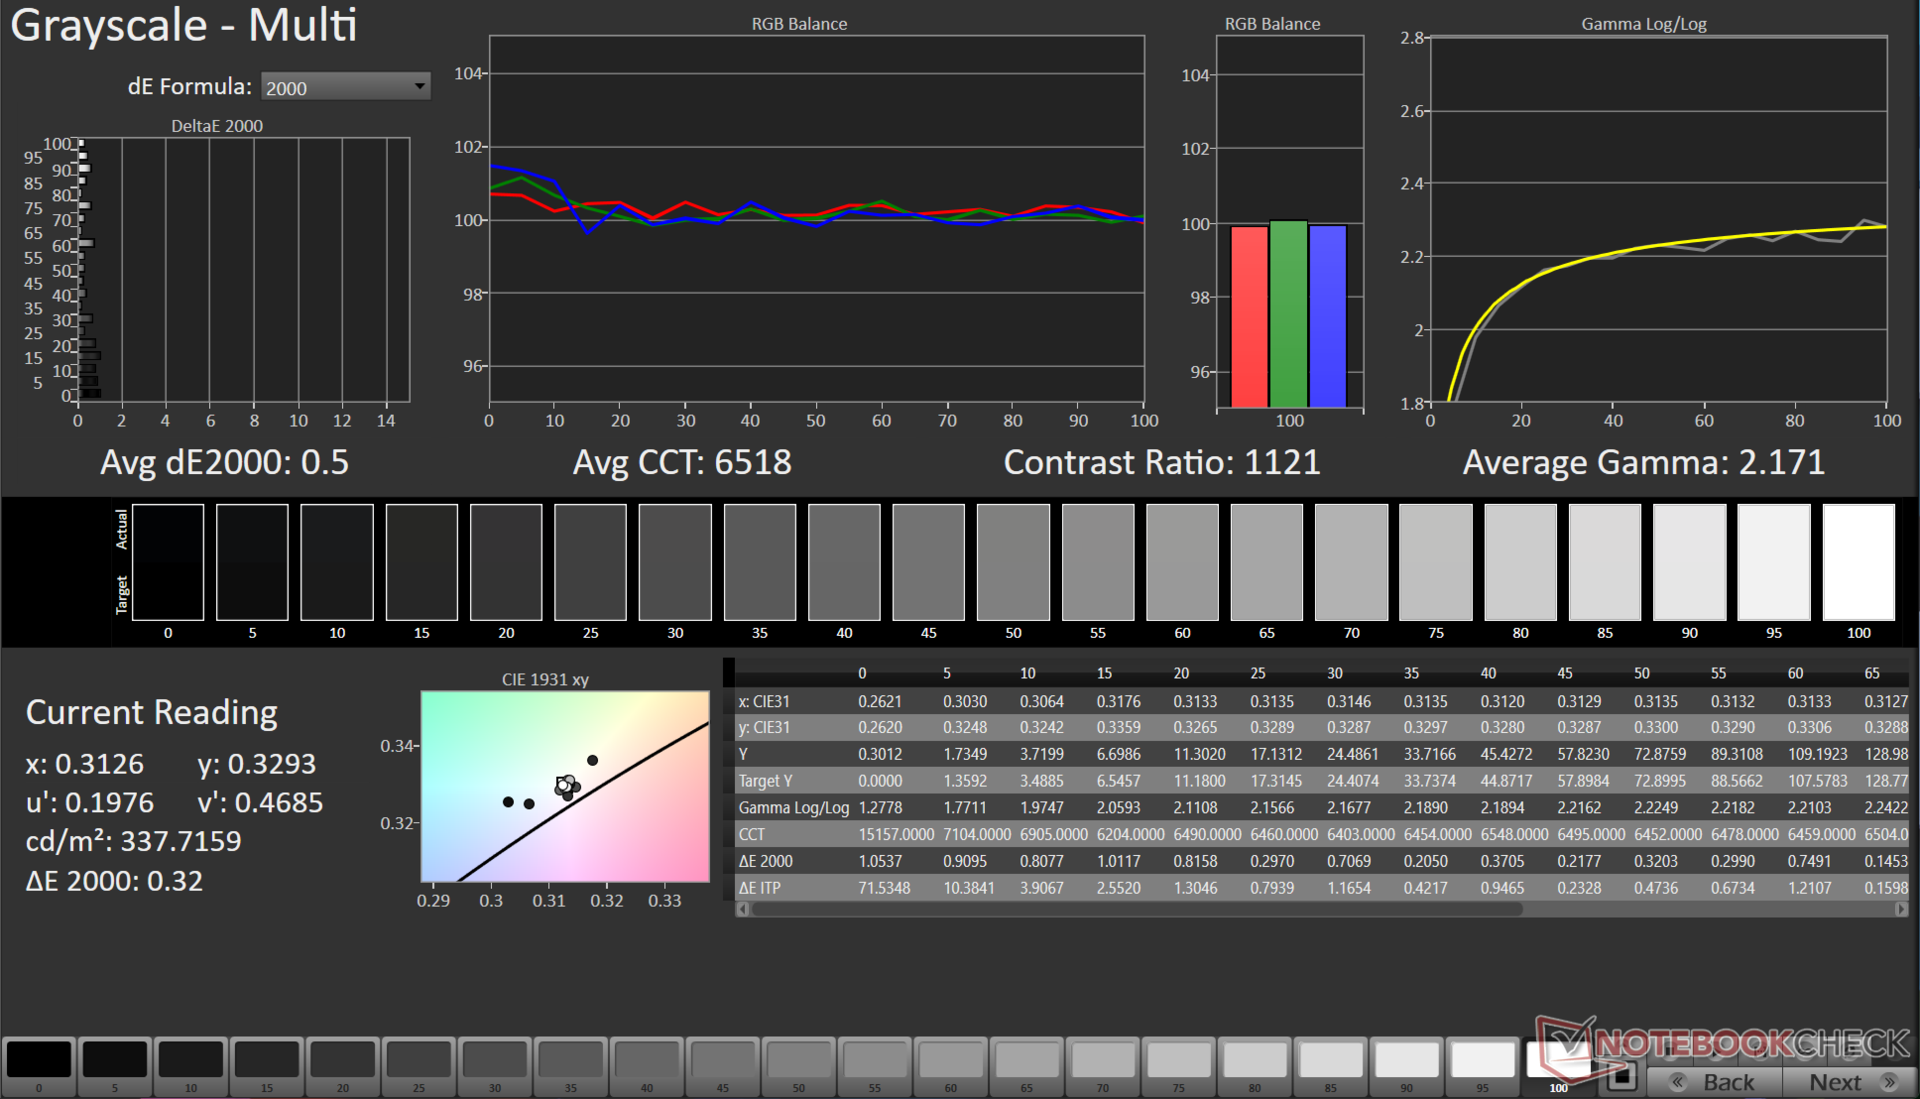
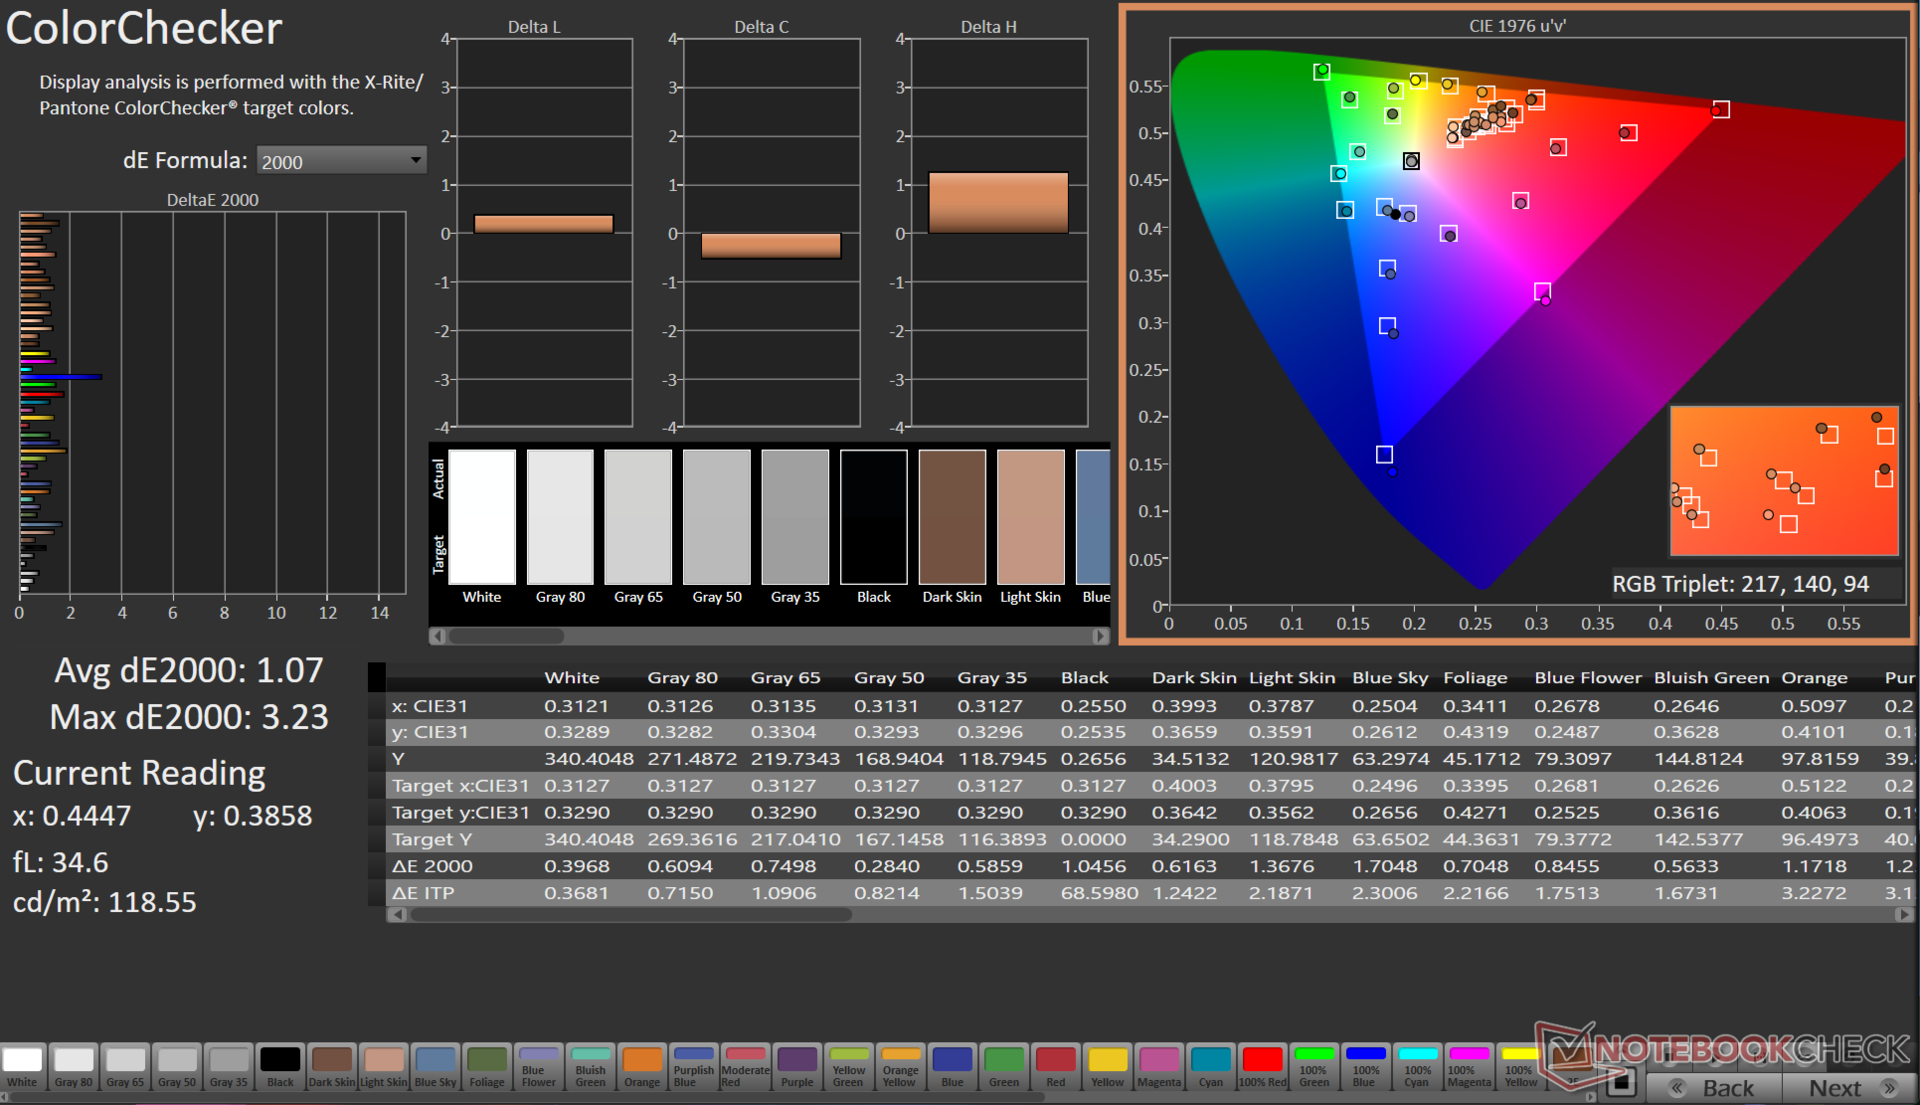
Kullanıma hazır renkler büyük sapmalar gösteriyor, ancak X-Rite i1Basic Pro 3 spektrofotometre ve Portrait Displays'in Calman Ultimate yazılımını kullanan kalibrasyon rutinimiz Gri Tonlama ve ColorChecker Delta E değerlerinde önemli gelişmeler gösteriyor.
Panel, spektrumun %100 Mavi kısmını doğru bir şekilde yeniden üretmekte hala sorun yaşıyor.
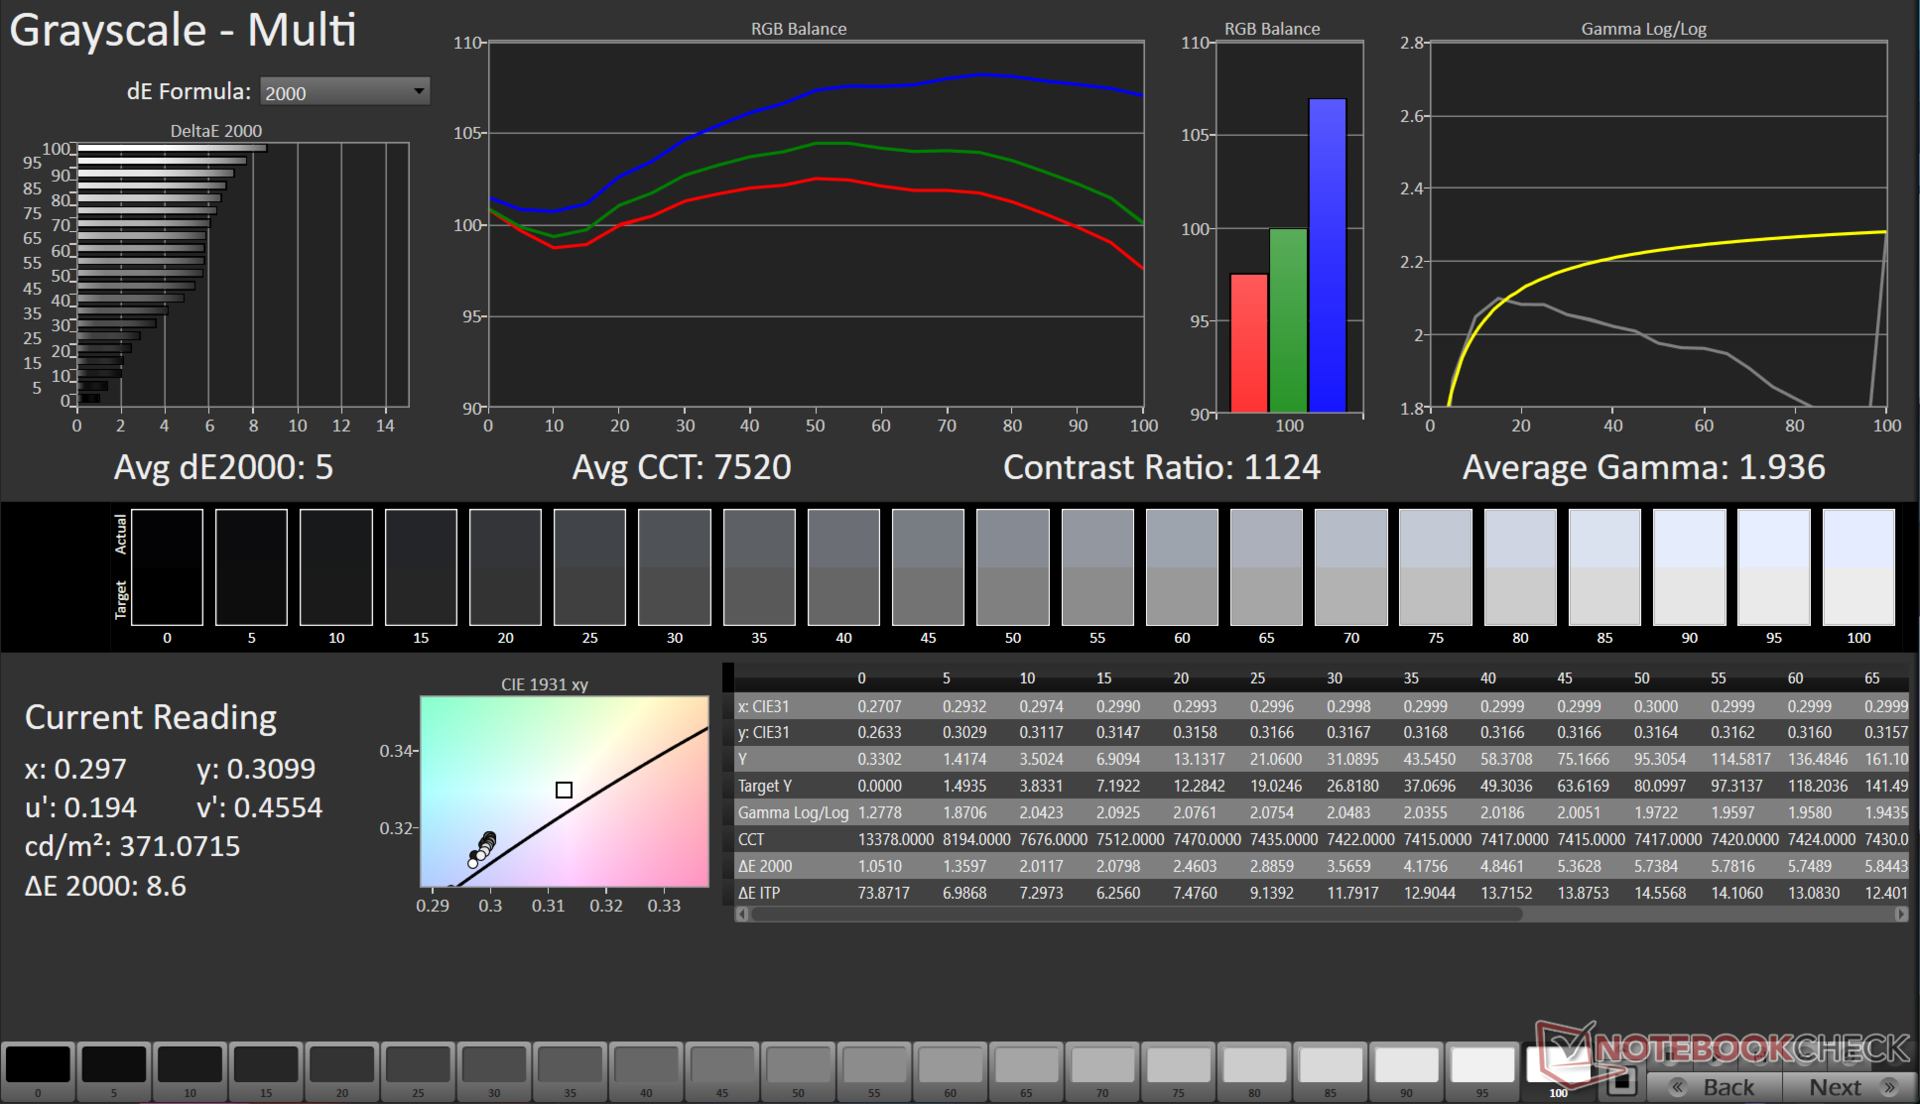
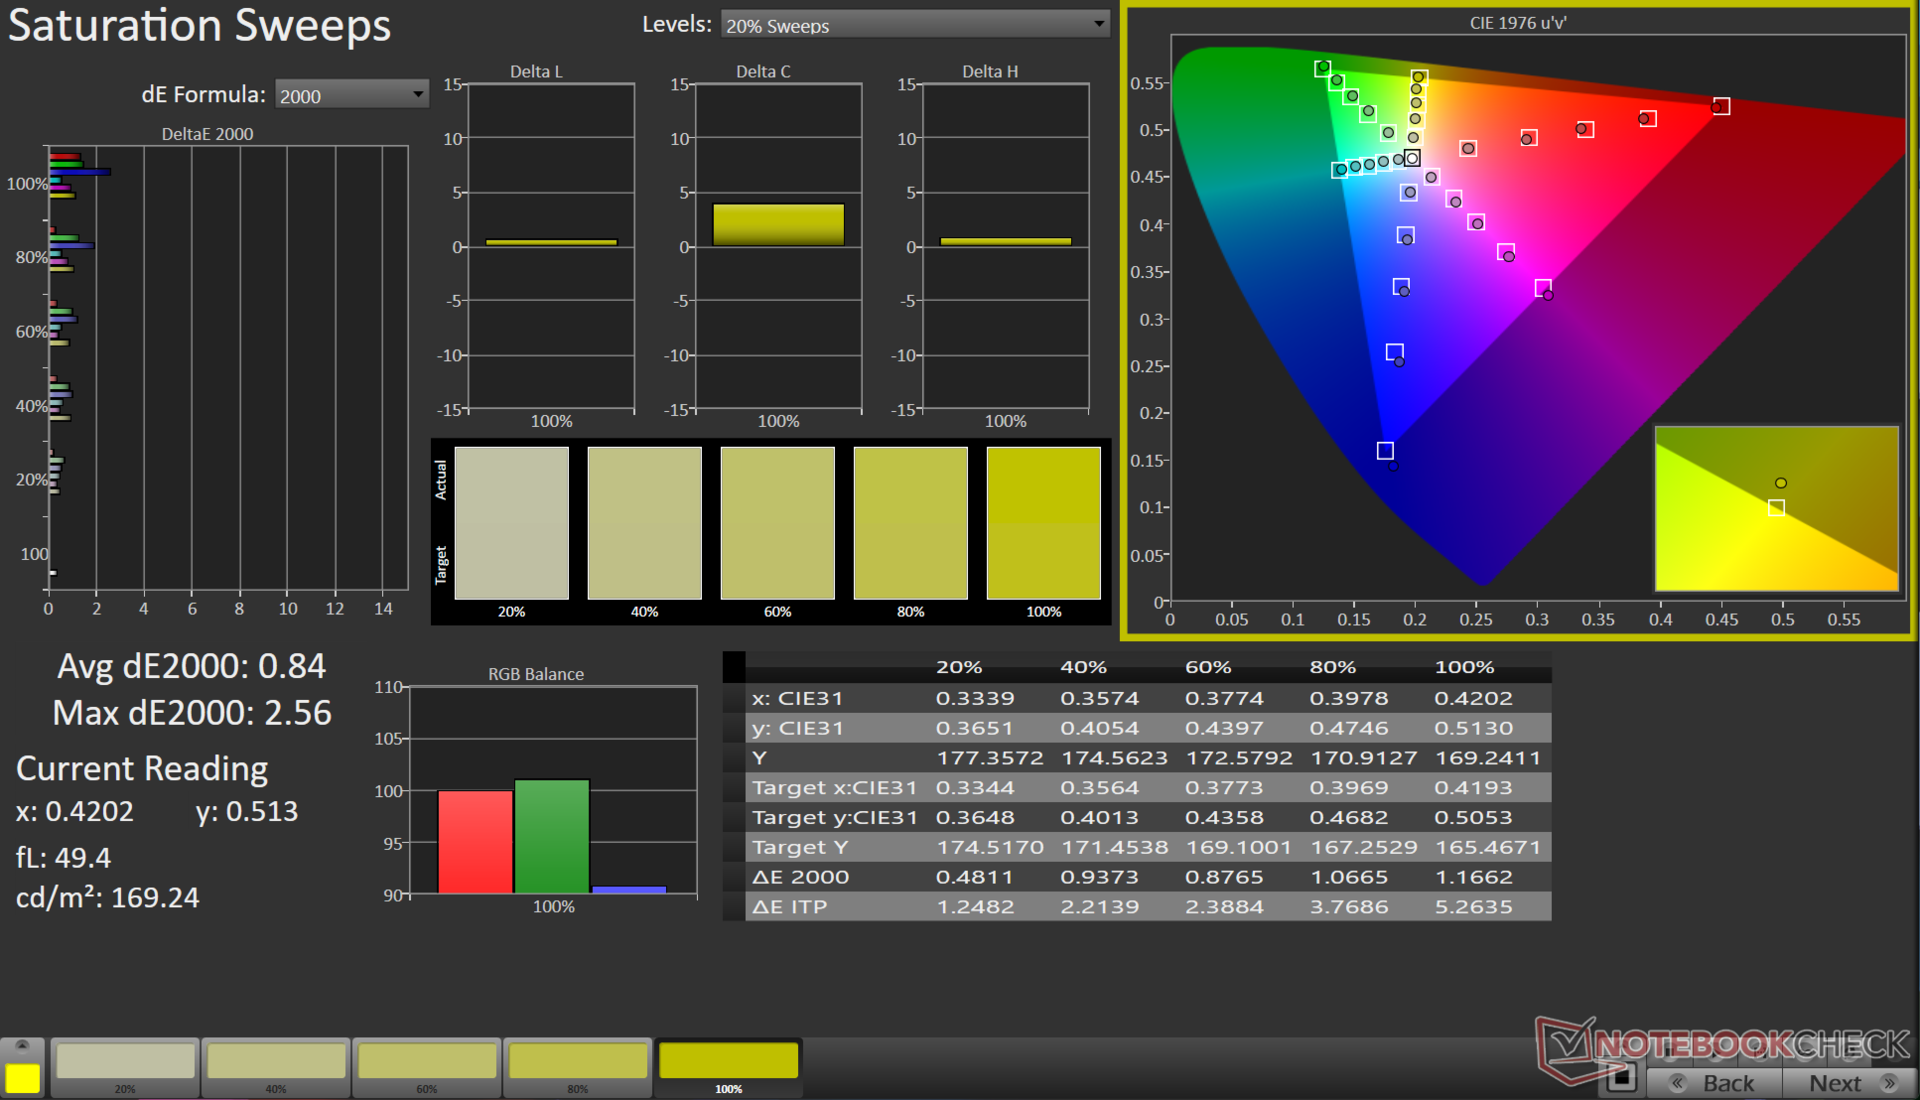
Kalibre edilmiş ICC dosyamızı yukarıdaki bağlantıdan indirebilirsiniz.
Yanıt Sürelerini Görüntüle
| ↔ Tepki Süresi Siyahtan Beyaza | ||
|---|---|---|
| 8.41 ms ... yükseliş ↗ ve sonbahar↘ birleşimi | ↗ 3.96 ms yükseliş | 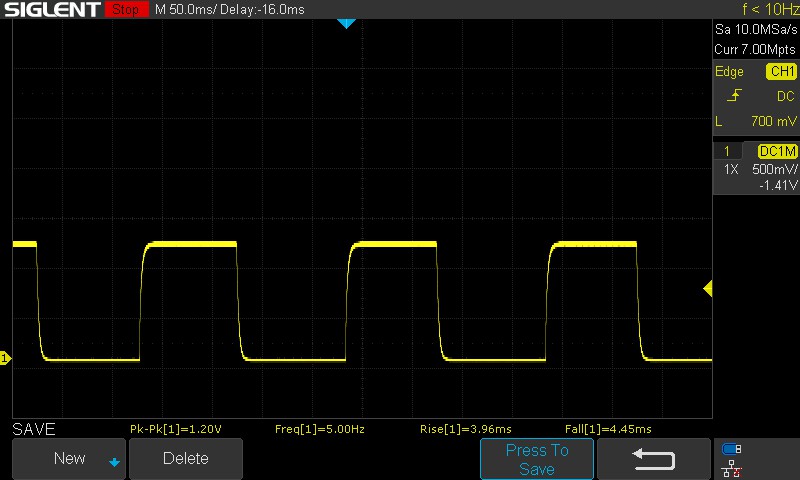 |
| ↘ 4.45 ms sonbahar | ||
| Ekran, testlerimizde hızlı yanıt oranları gösteriyor ve oyun oynamaya uygun olmalı. Karşılaştırıldığında, test edilen tüm cihazlar 0.1 (minimum) ile 240 (maksimum) ms arasında değişir. » Tüm cihazların 24 %'si daha iyi. Bu, ölçülen yanıt süresinin test edilen tüm cihazların ortalamasından (19.8 ms) daha iyi olduğu anlamına gelir. | ||
| ↔ Tepki Süresi %50 Griden %80 Griye | ||
| 5 ms ... yükseliş ↗ ve sonbahar↘ birleşimi | ↗ 2.16 ms yükseliş | 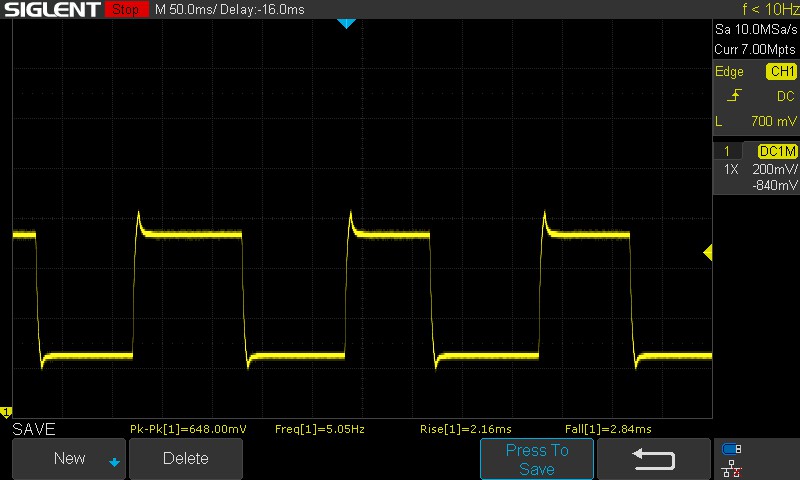 |
| ↘ 2.84 ms sonbahar | ||
| Ekran, testlerimizde çok hızlı yanıt oranları gösteriyor ve hızlı oyun oynamaya çok uygun olmalı. Karşılaştırıldığında, test edilen tüm cihazlar 0.165 (minimum) ile 636 (maksimum) ms arasında değişir. » Tüm cihazların 17 %'si daha iyi. Bu, ölçülen yanıt süresinin test edilen tüm cihazların ortalamasından (31 ms) daha iyi olduğu anlamına gelir. | ||
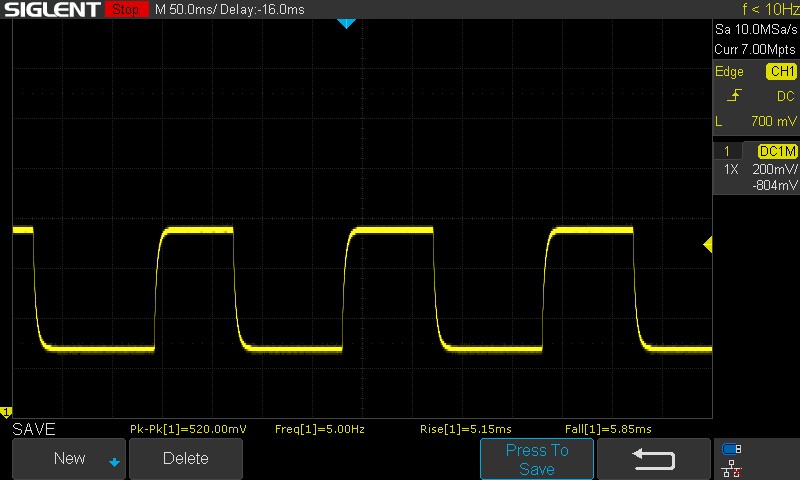
Tepki süreleri, LOQ 15APH8'deki 1080p panele göre büyük bir gelişme. Panel, varsayılan olarak 5 ms'lik hızlı %50 griden %80 griye geçişlere yardımcı olan overdrive kullanıyor. Lenovo Vantage uygulamasından overdrive'ın devre dışı bırakılması, %50 griden %80 griye birleşik tepki süresini 11 ms'ye çıkarıyor.
Panel, test edilen tüm parlaklık seviyelerinde PWM titremesi göstermez. Daha fazla bilgi için makalemize bakın "PWM neden bu kadar baş ağrısıdır?" ve ayrıca bizim PWM Sıralama Tablosu i̇ncelenen tüm cihazlarda ölçülen PWM karşılaştırması için.
Ekran Titremesi / PWM (Darbe Genişliği Modülasyonu)
| Ekran titriyor / PWM algılanmadı | ≤ 100 % parlaklık ayarı | 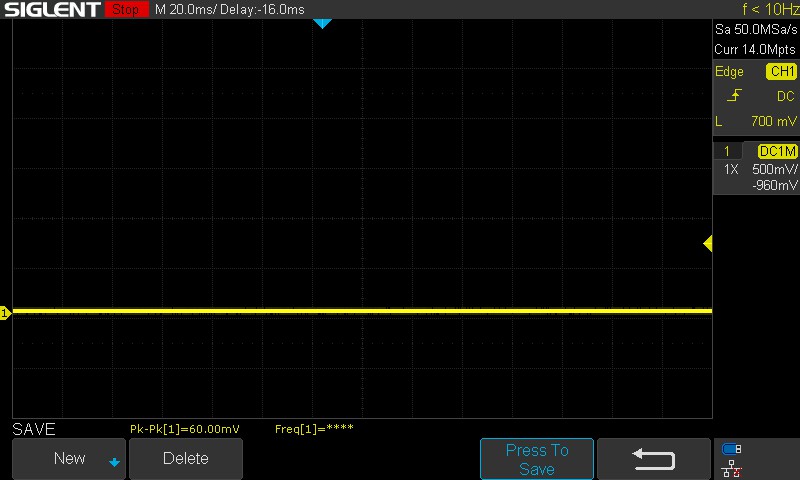 | |
Karşılaştırıldığında: Test edilen tüm cihazların %52 %'si ekranı karartmak için PWM kullanmıyor. PWM tespit edilirse, ortalama 7757 (minimum: 5 - maksimum: 343500) Hz ölçüldü. | |||
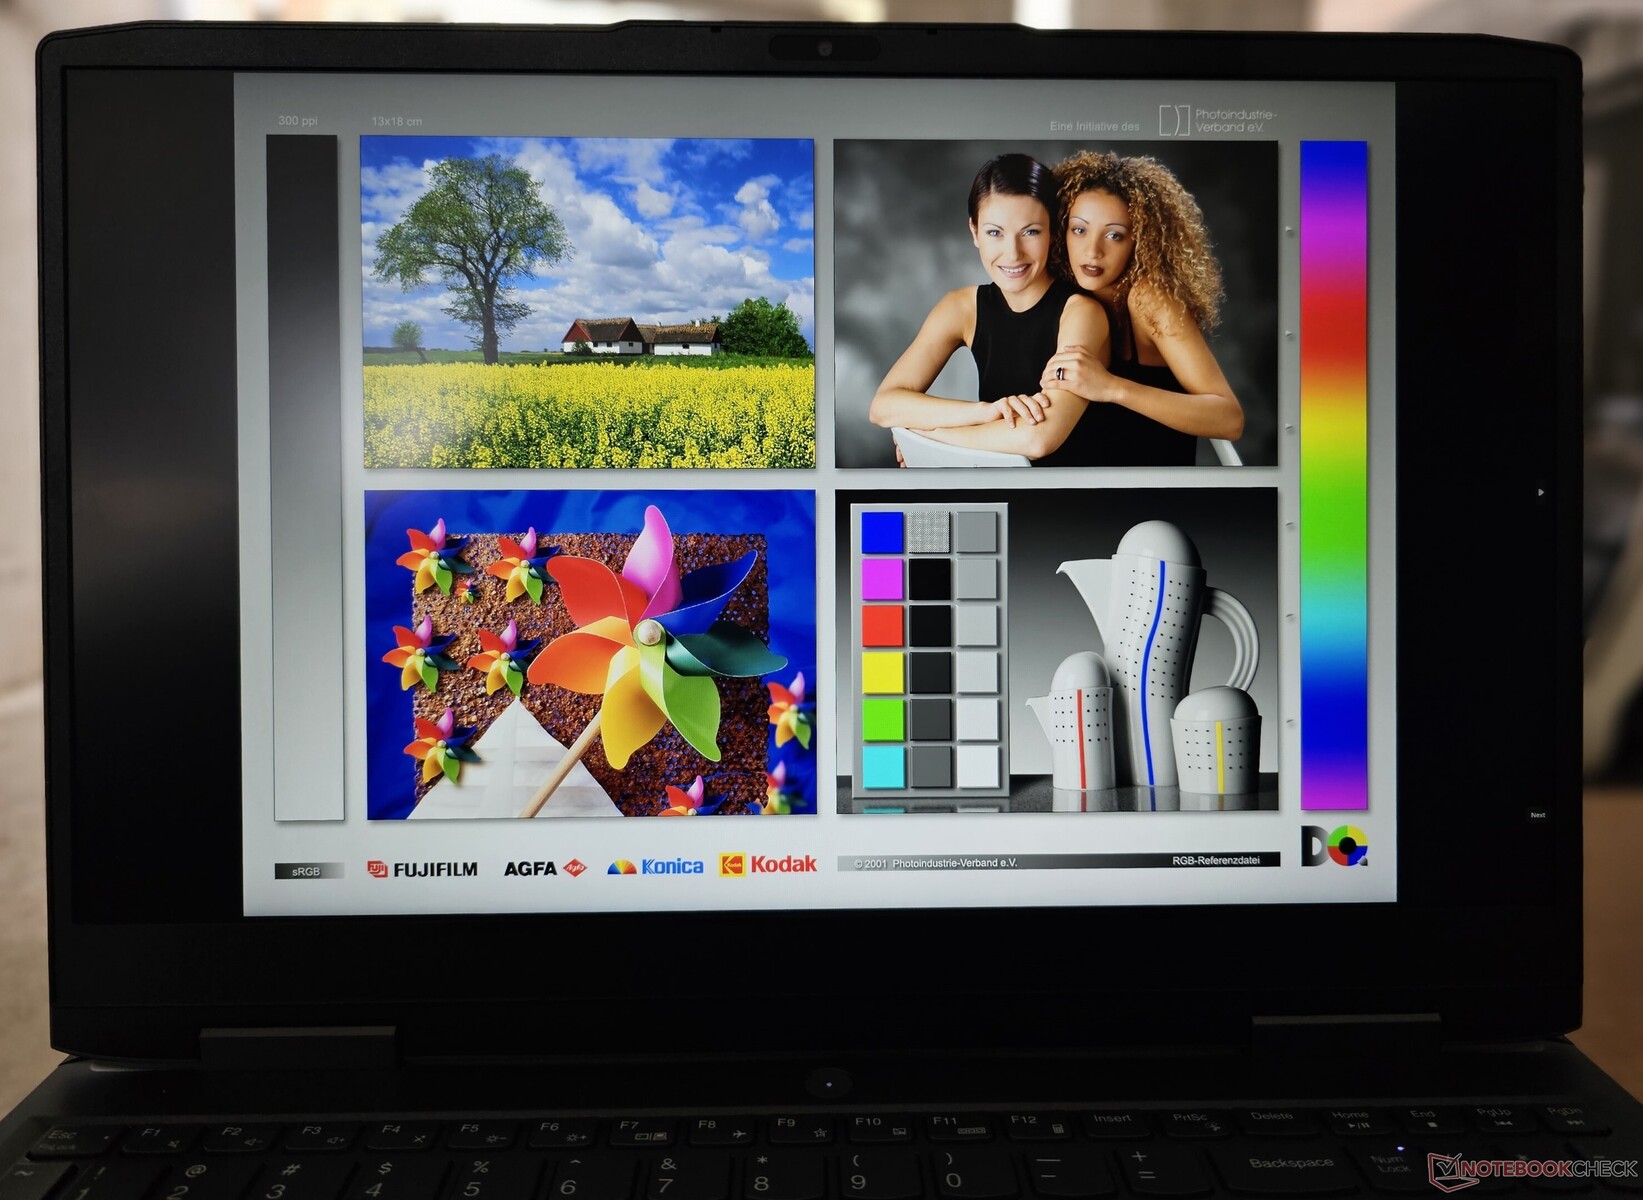
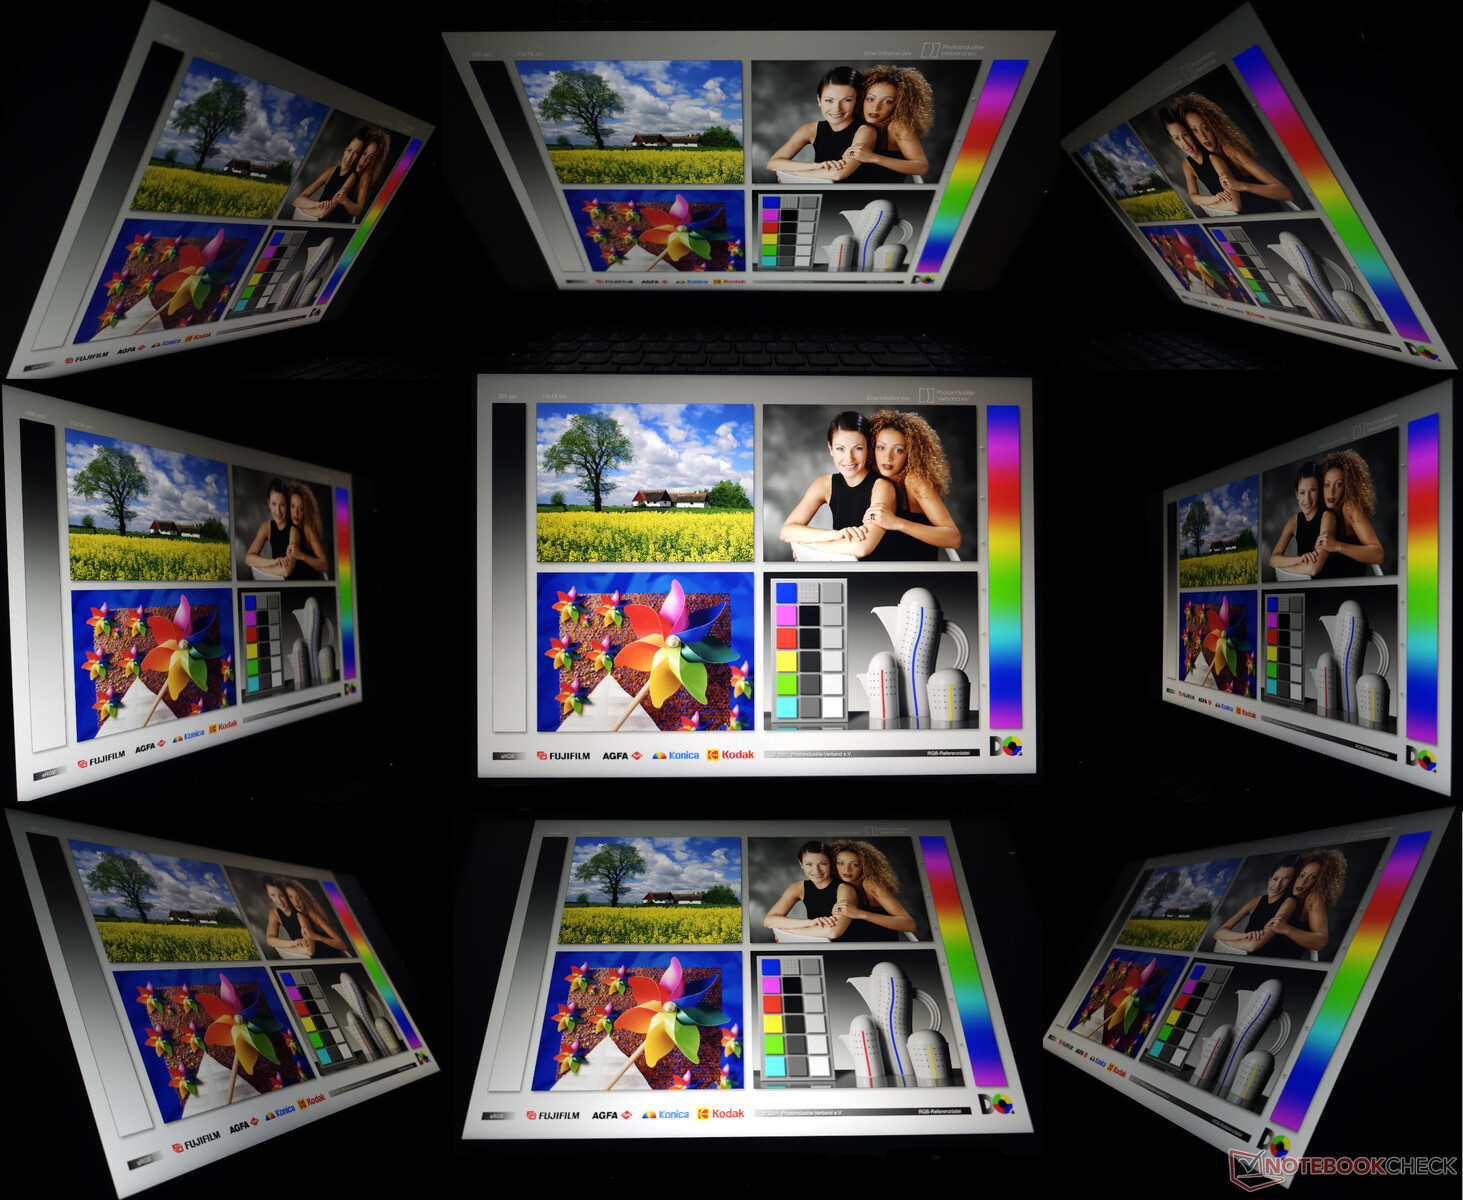
Dış mekan görünürlüğü genel kullanım için iyidir, ancak özellikle parlak güneşli günler 350 nit panel için bunaltıcı olabilir. Görüntüleme açıları, uç noktalarda minimum parlaklık ve renk kaybı ile nispeten sabittir.
Performans: Core i7-13620H istikrarlı bir performans sergilemekte zorlanıyor
Hindistan'da Lenovo, hem Intel hem de AMD işlemcilerle birden fazla LOQ 15 yapılandırma seçeneği sunuyor. Intel tabanlı modeller aşağıdakiler arasında bir seçim sunar Core i5-12450H ve Core i7-13620H CPU'lar, AMD varyantlarında ise Ryzen 5 7640HS veya Ryzen 7 7840HSparçalar. Grafikler için, müşteriler dizüstü bilgisayar versiyonlarını seçebilir RTX 2050, RTX 3050, RTX 4050veya RTX 4060 GPU'lar.
Lenovo, ABD pazarı için LOQ 15'i şu seçeneklerden biriyle yapılandırıyor Core i7-13700H rTX 4050 ile eşleştirilmiş veya Core i5-13420H rTX 2050 ile birlikte.
Test Koşulları
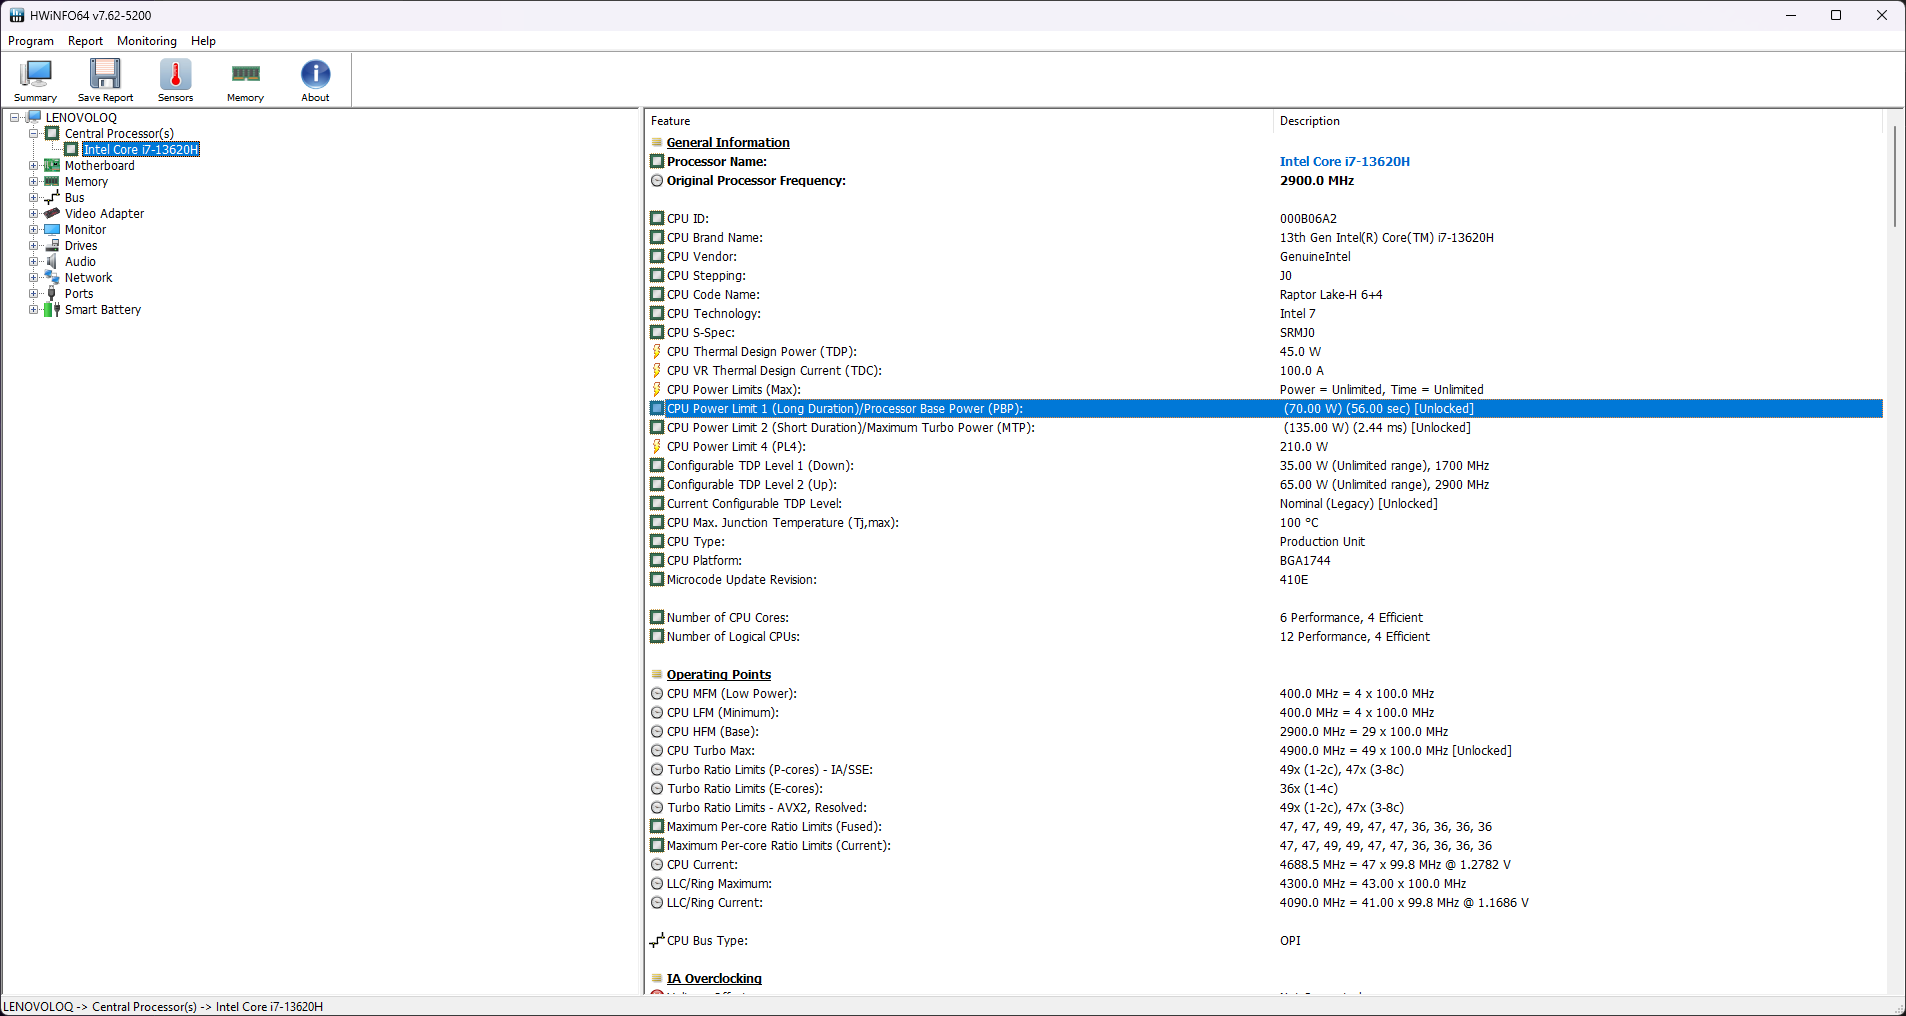
Lenovo Vantage, LOQ 15'in güç profillerini, RGB efektlerini ve diğer özelliklerini kolayca değiştirmeyi sağlar. Uygulama ayrıca deneyimli kullanıcıların kendi CPU güç limitlerini, sürelerini, GPU TDP'lerini, GPU'dan CPU'ya Dinamik Yükseltme ve sıcaklık limitlerini istedikleri gibi ayarlamalarına olanak tanır.
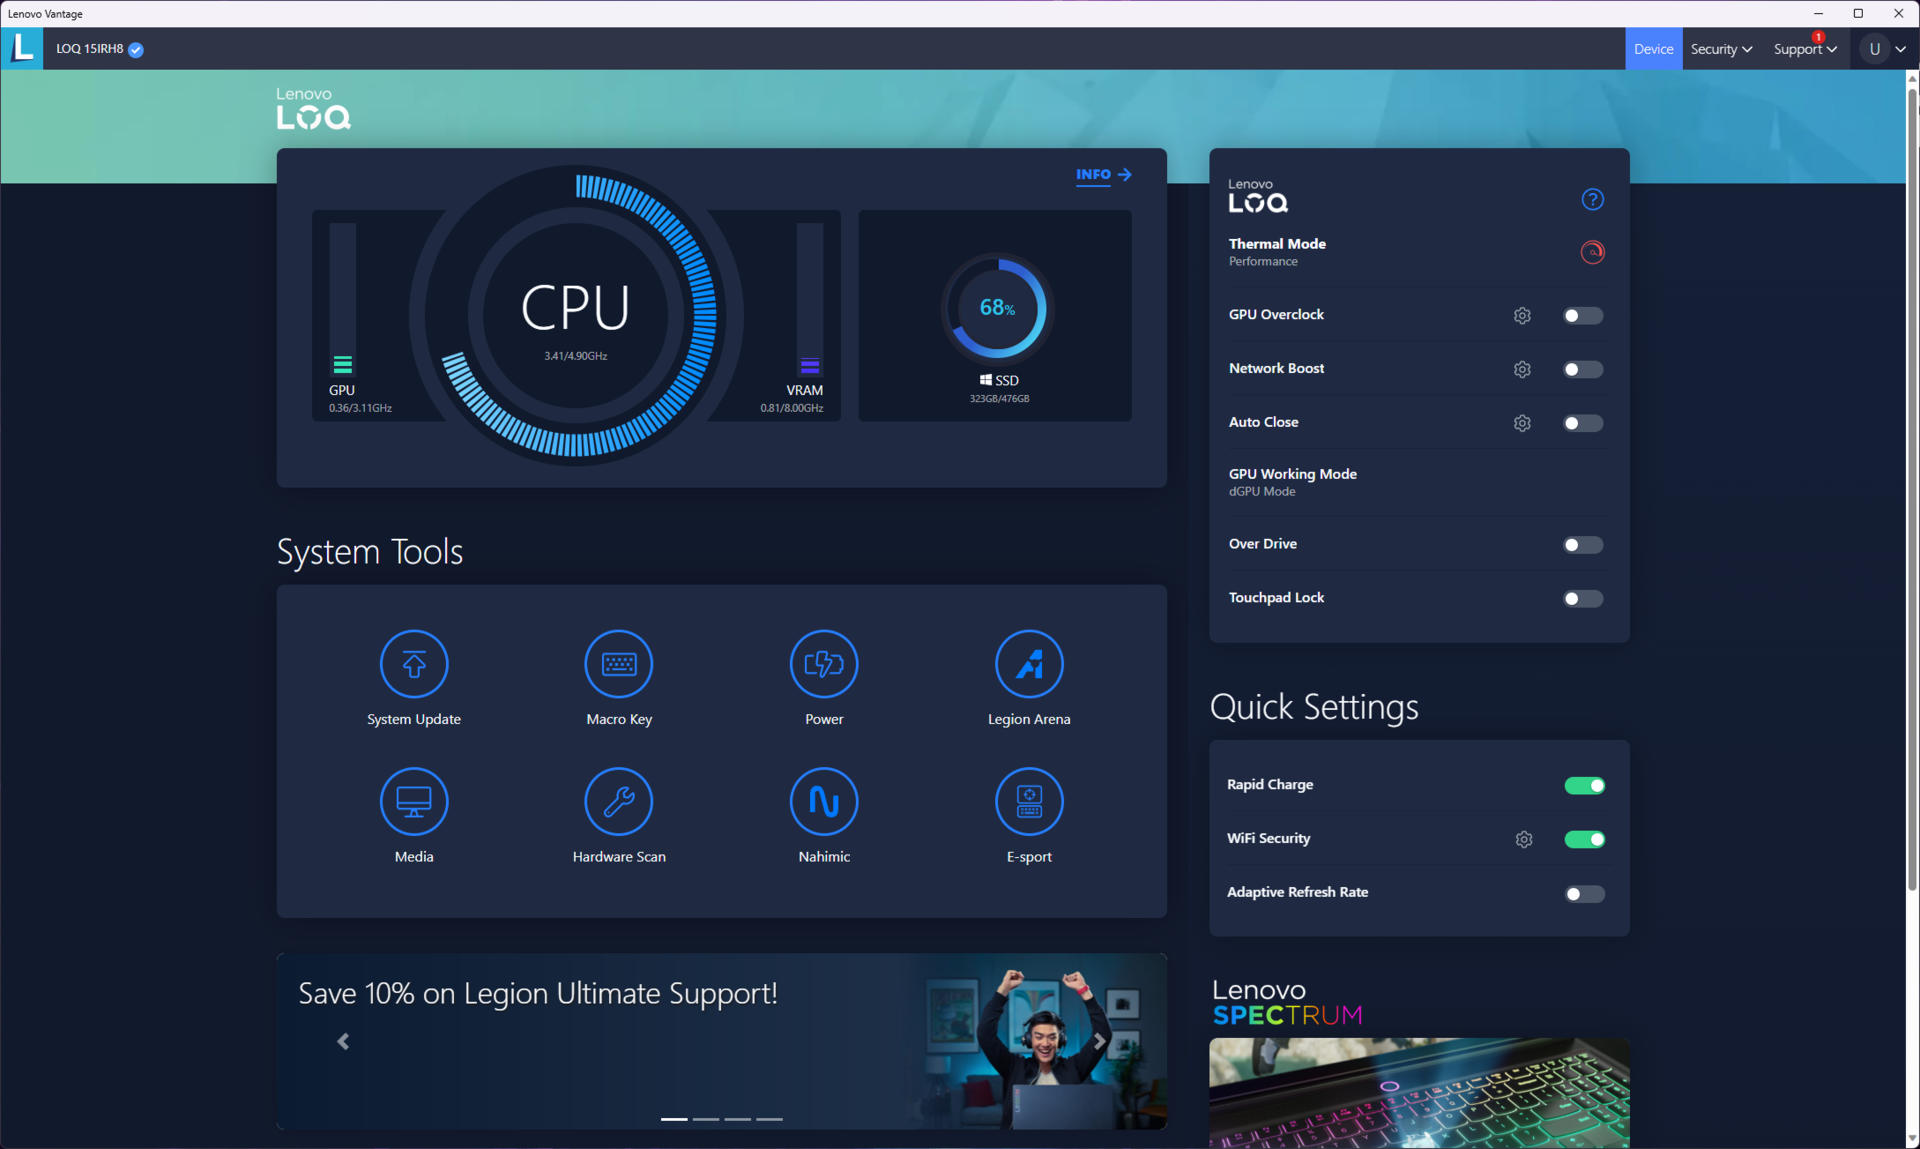
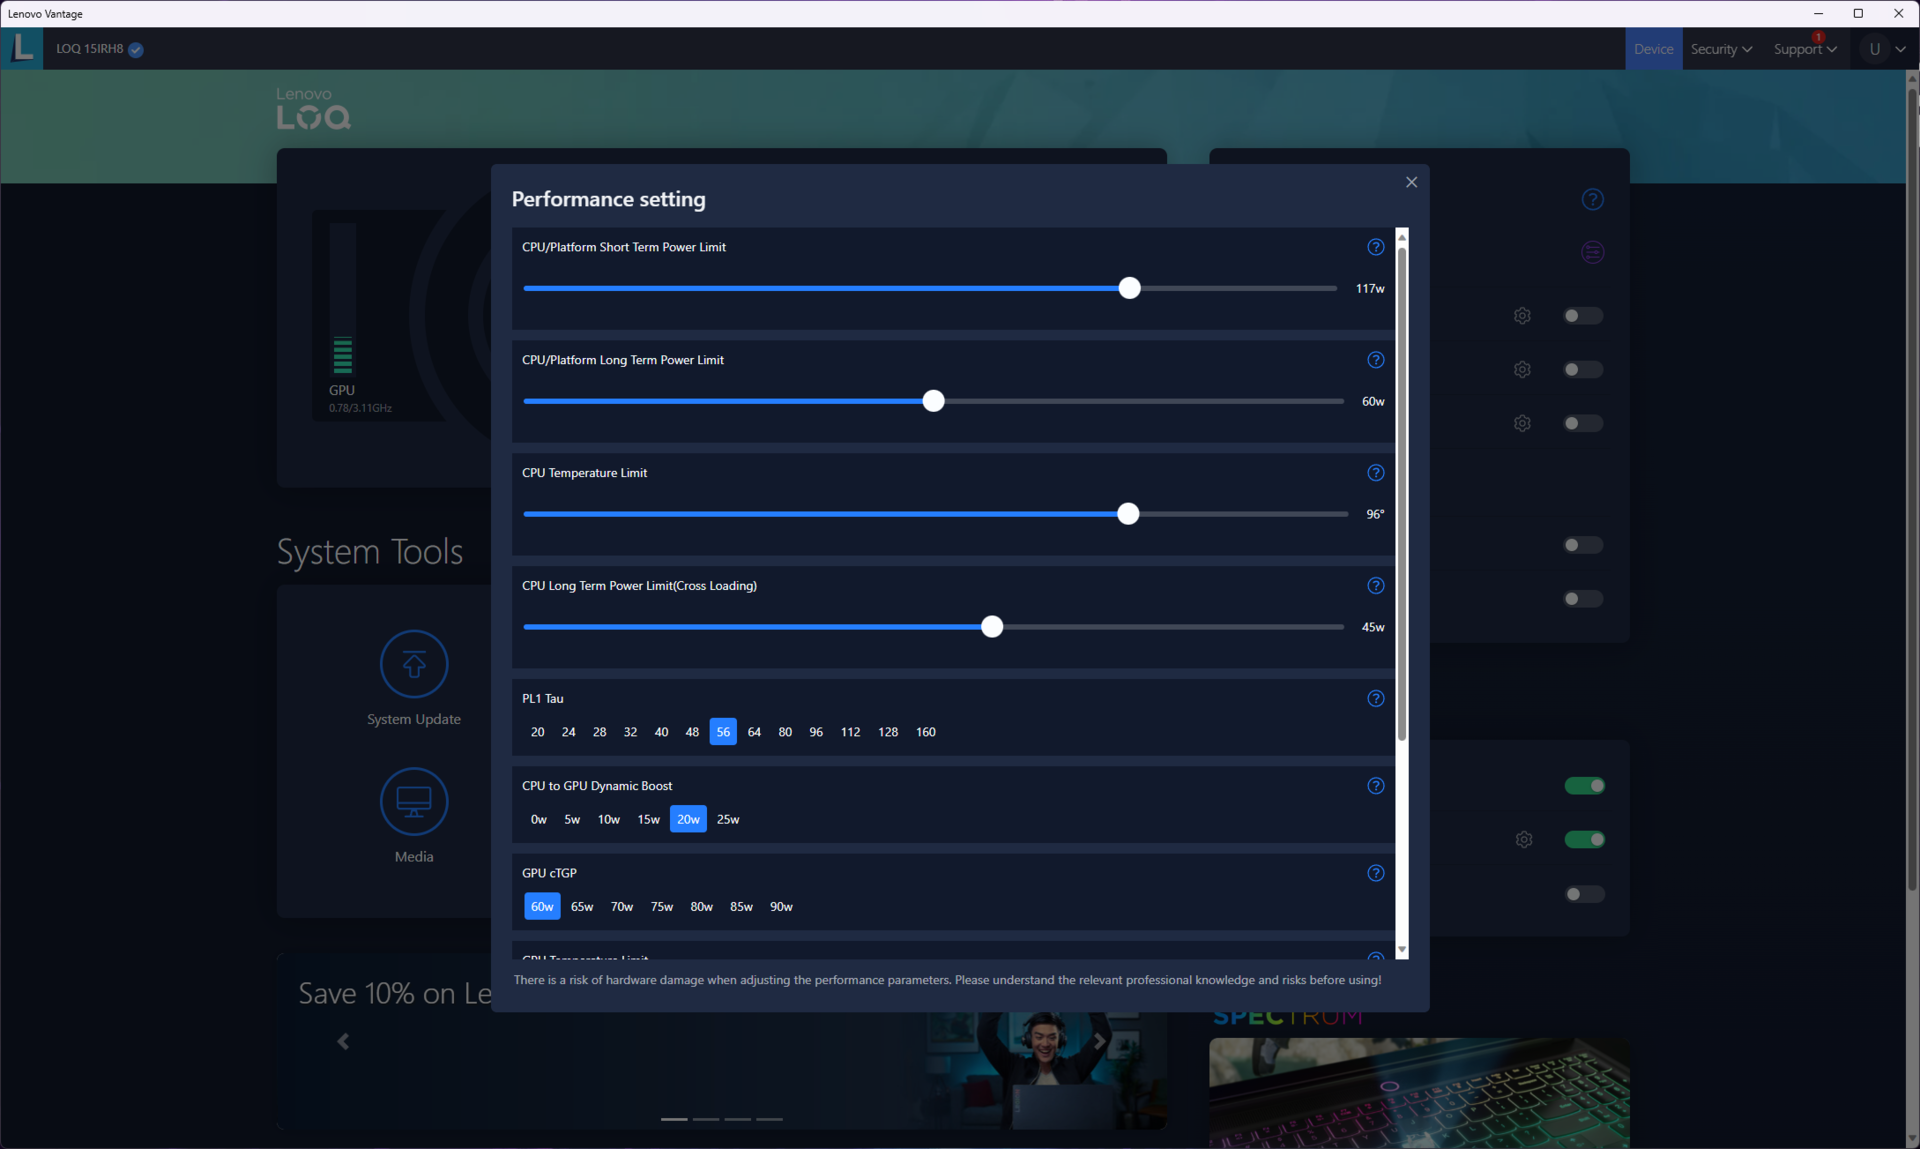
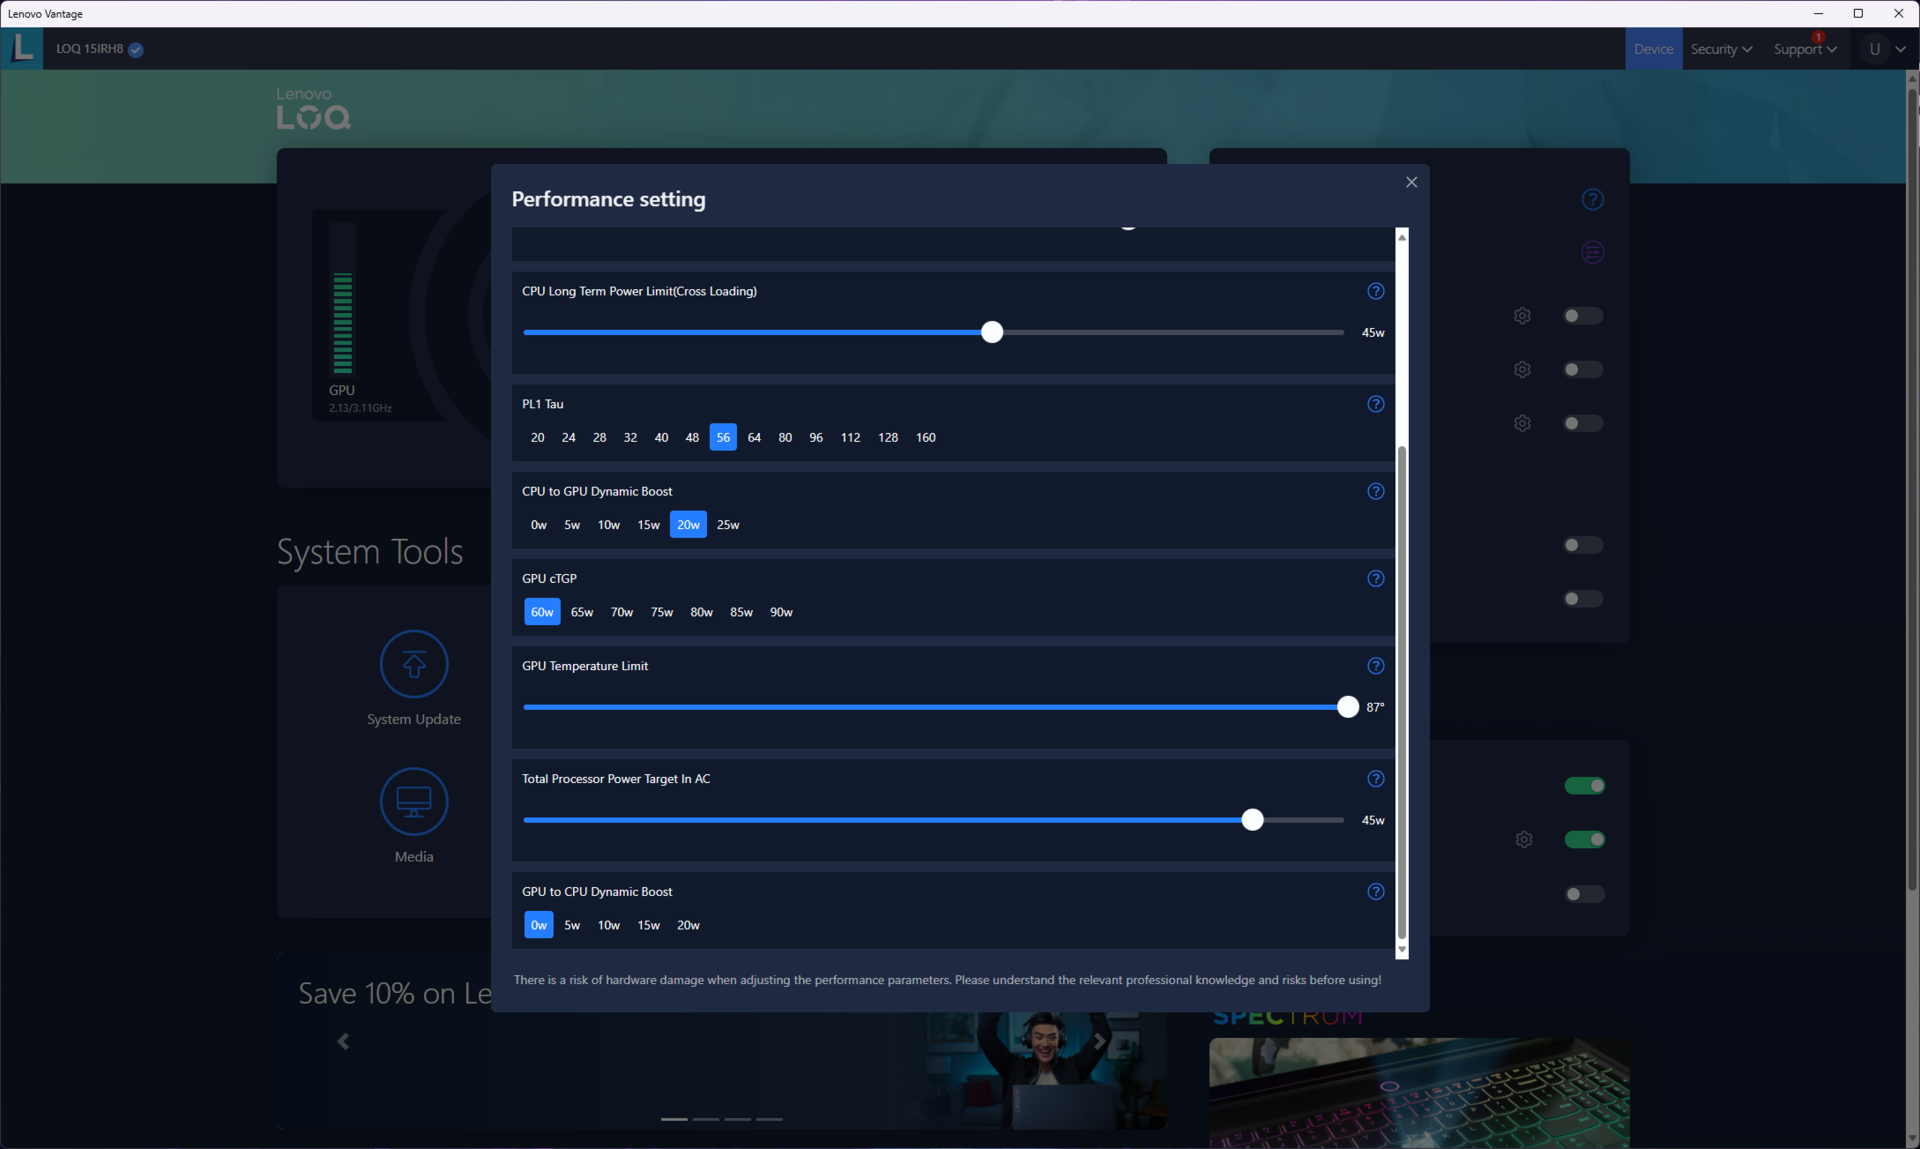
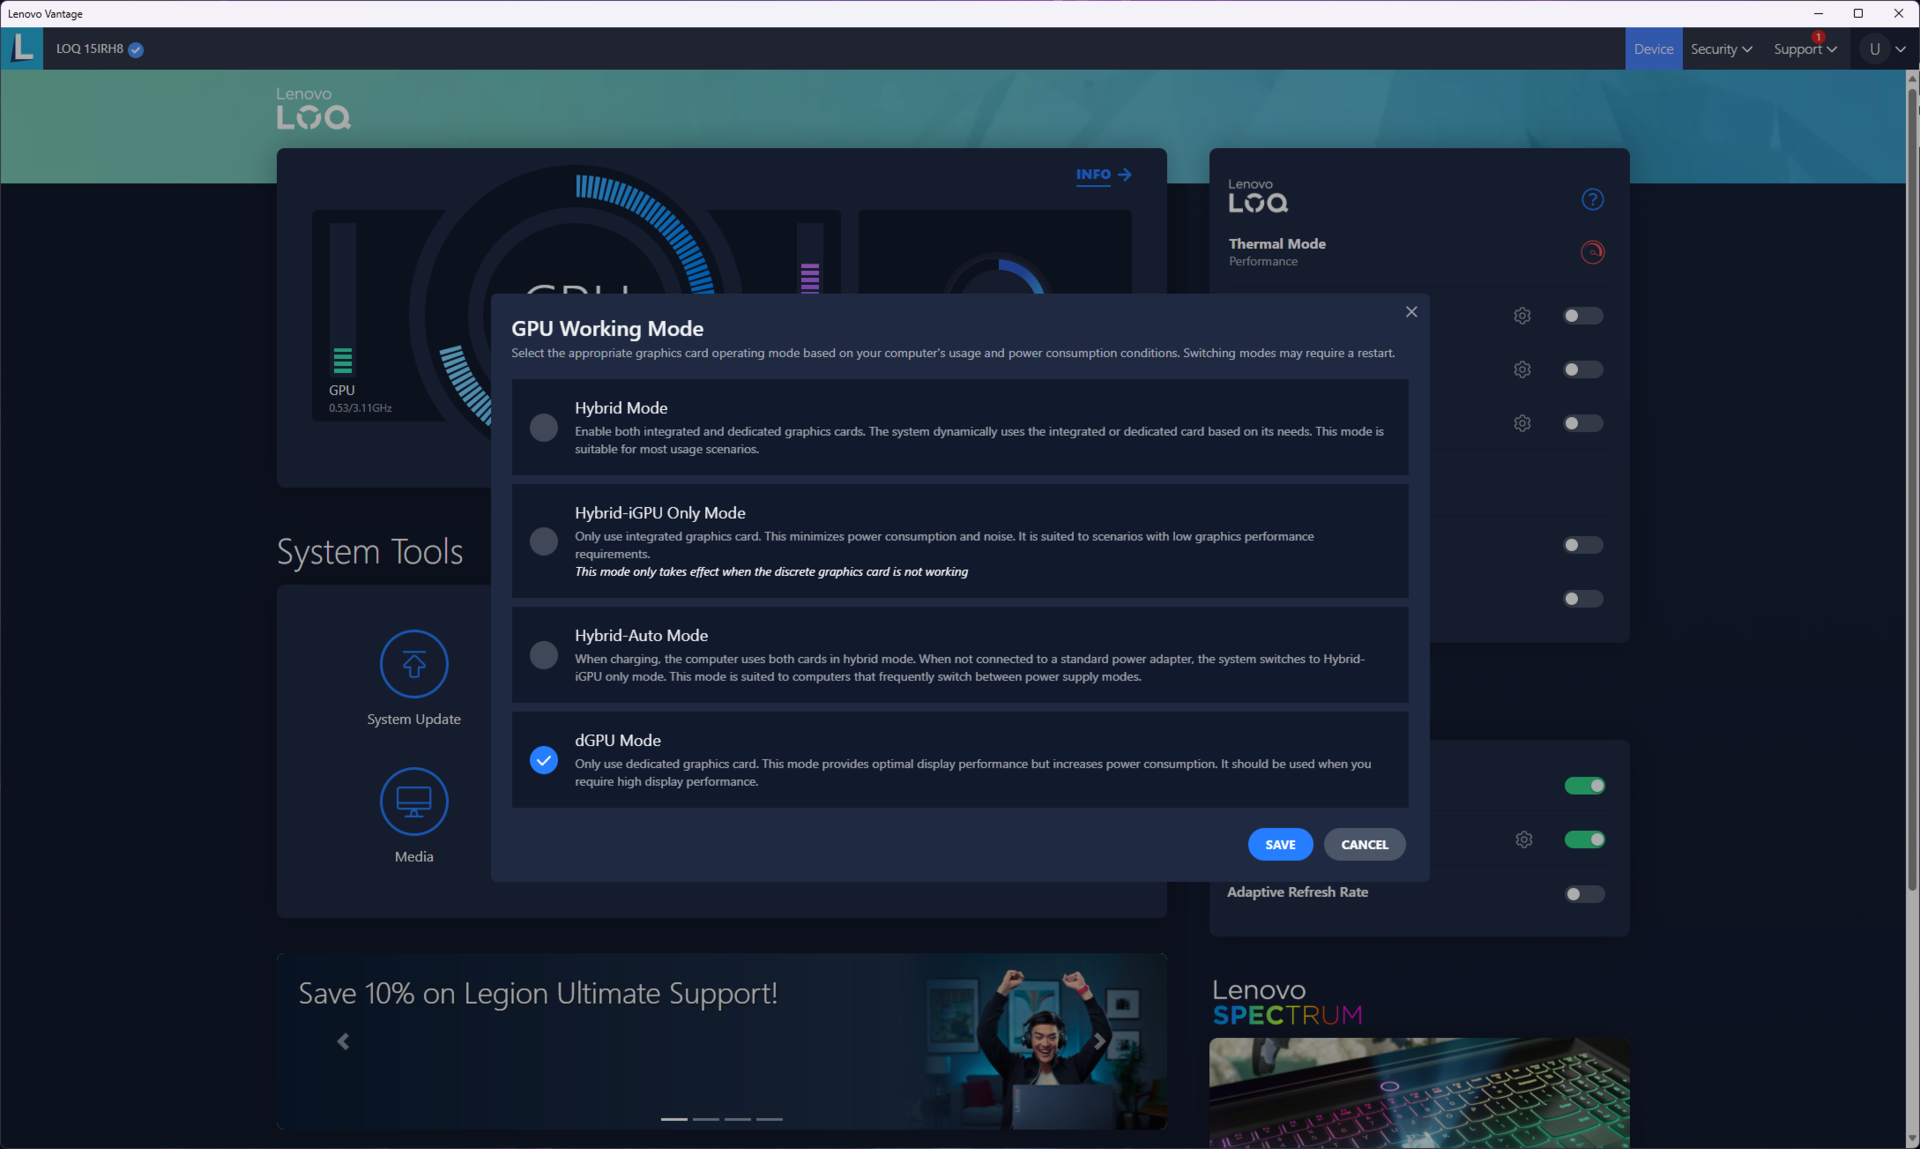
Aşağıdaki tablo, varsayılan güç profillerinin işlemcinin PL1 ve PL2'sini nasıl etkilediğini göstermektedir. Testlerimiz için Performans profilini kullandık ve Core i7-13620H ve RTX 4050'nin kaslarını tam olarak kullanabilmesi için dGPU modunu devreye soktuk. Pil testleri, GPU Hibrit moduna ayarlıyken Sessiz profilde çalıştırıldı.
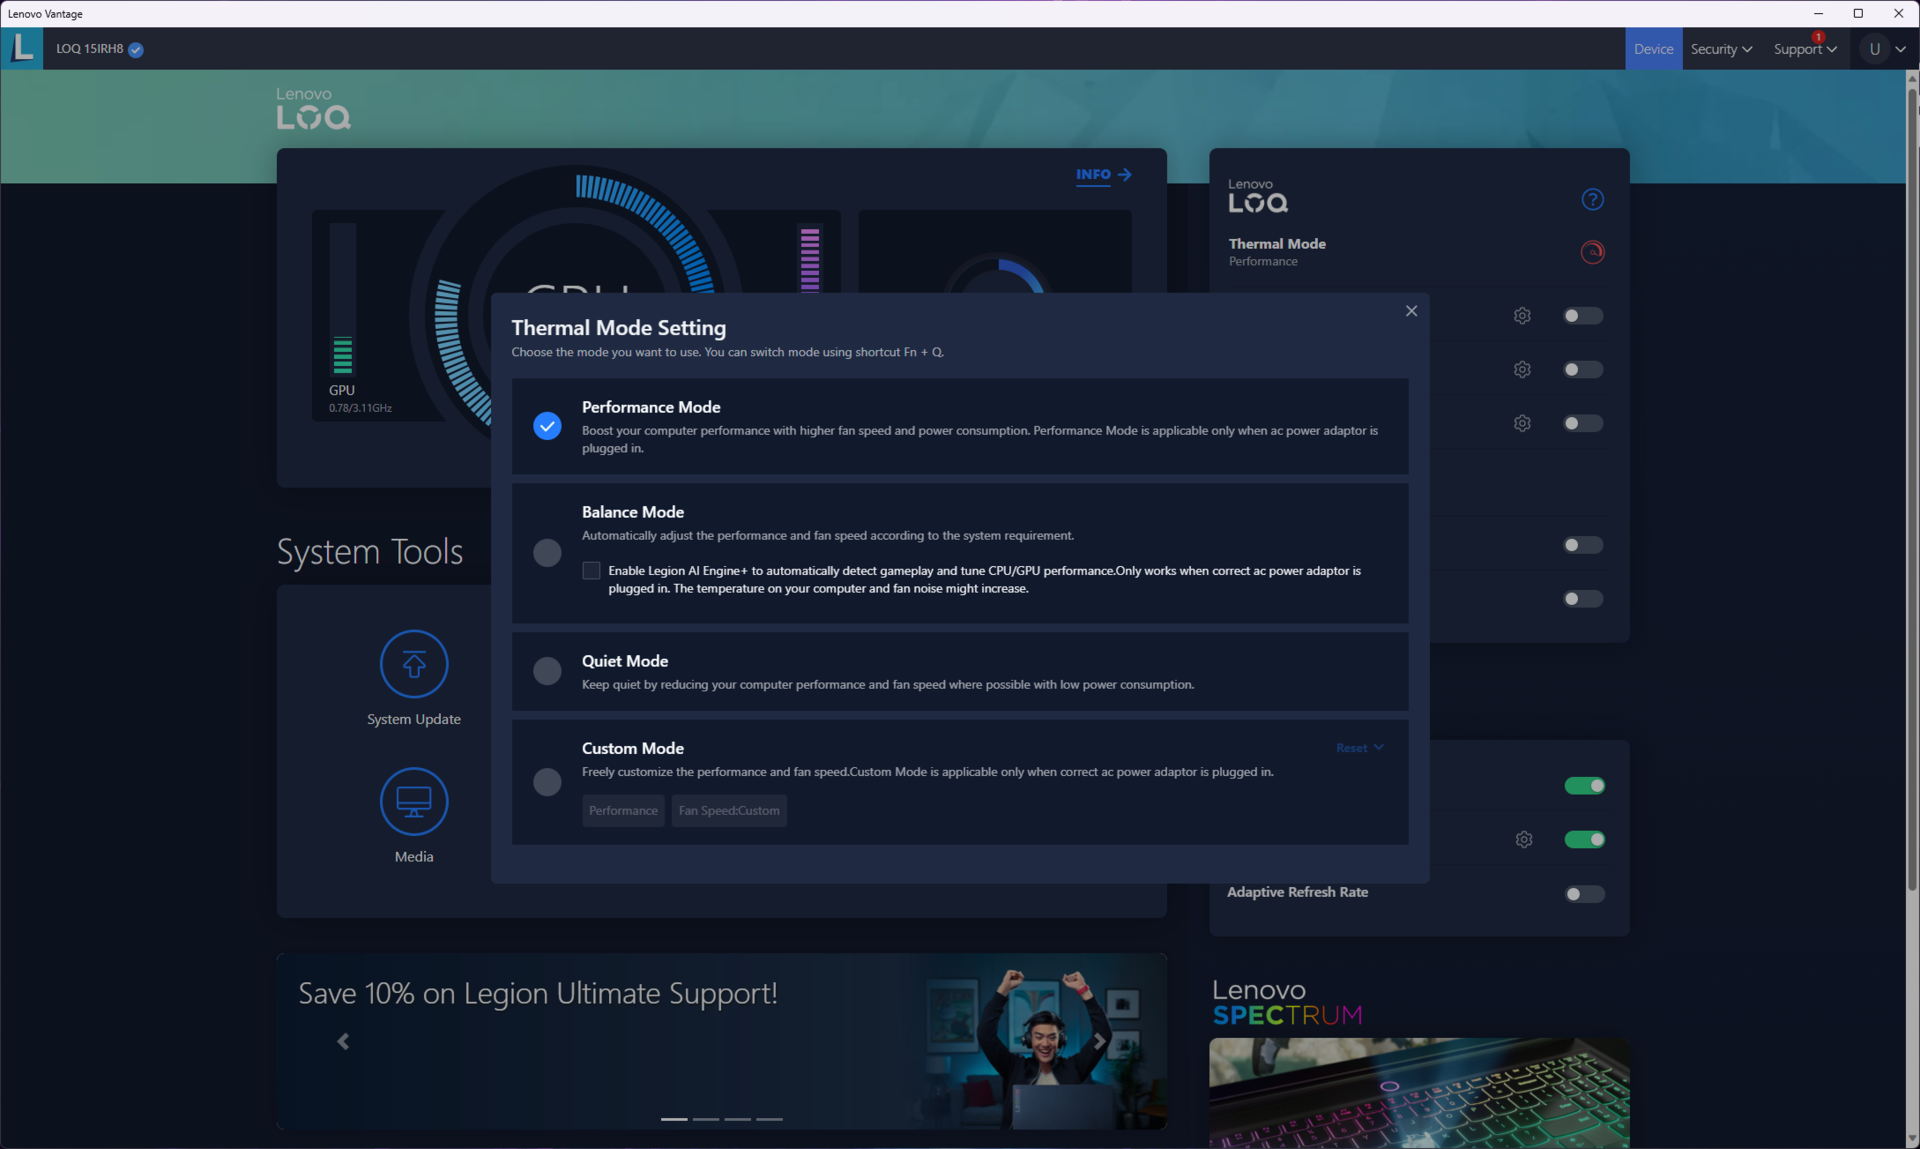
| Performans modu | PL1 (PBP) / Tau | PL2 (MTP) / Tau | PL4 | Cinebench R15 Çoklu skor | Cinebench R15 Çoklu skor (30 döngü) |
|---|---|---|---|---|---|
| Sessiz | 45 W / 56 sn | 55 W / 2,44 ms | 210 W | 1.879 (-%17,98) | 1.412 (-%26,34) |
| Denge | 60 W / 56 sn | 117 W / 2,44 ms | 210 W | 2.178 (-%4,93) | 1.657 (-%13,56) |
| Performans | 70 W / 56 sn | 135 W / 2,44 ms | 210 W | 2.291 (%100) | 1.917 (%100) |
İşlemci
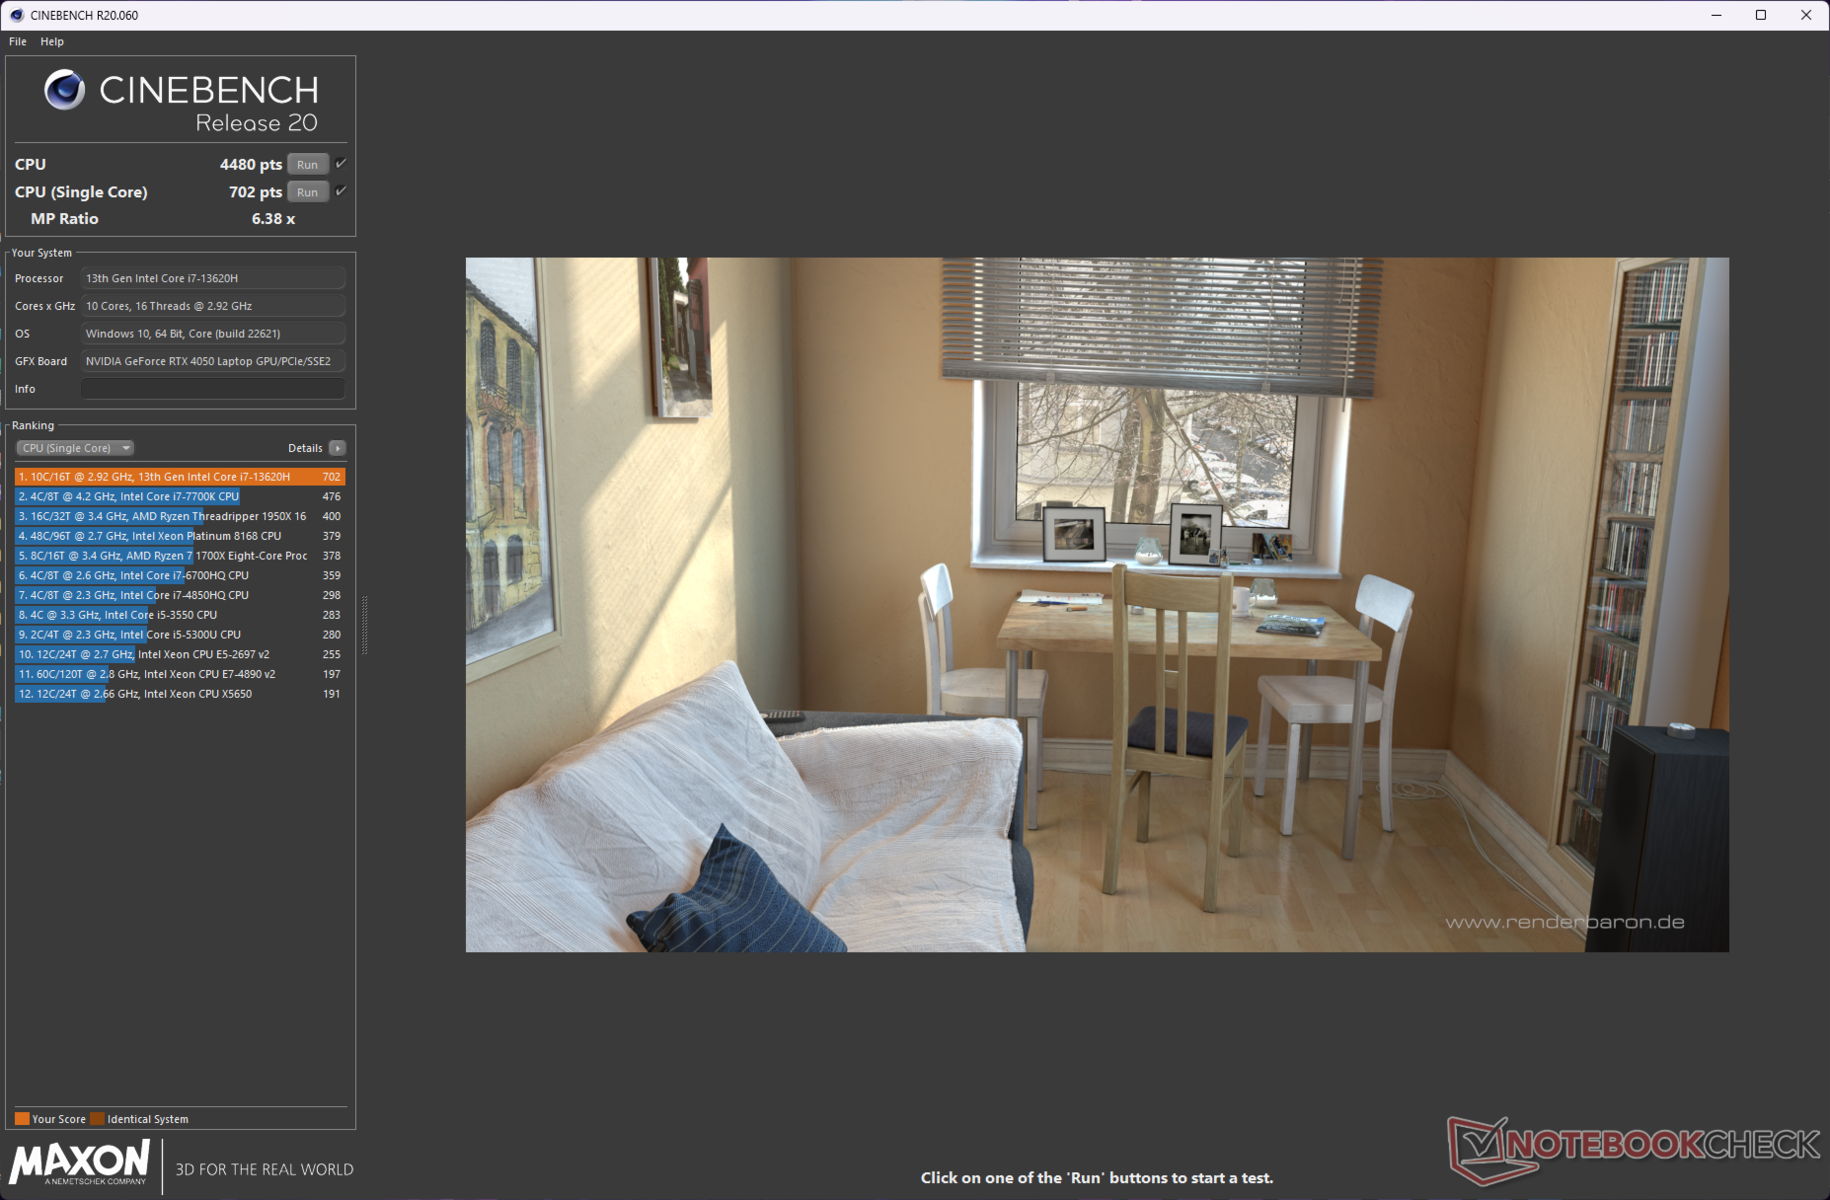
LOQ 15IRH8'in Core i7-13620H'si, aynı iş parçacığı sayılarına sahip olmasına rağmen Cinebench çoklu çekirdek testlerinde Ryzen 7 7840HS destekli LOQ 15APH8'in %16 kadar gerisinde kalıyor. Ancak Geekbench çoklu çekirdekte rollerin tersine döndüğünü görüyoruz. Intel çipi ayrıca çoğu tek çekirdekli kıyaslamada da iyi bir performans sergiliyor.
LOQ 15IRH8'in kasası ve soğutması, Cinebench R15 çok çekirdekli döngü testini düzgün bir şekilde sürdürmekte zorlanıyor gibi görünüyor. Core i7-13620H, LOQ 16IRH8'de daha iyi bir yuva buluyor ve işlemcinin performansı çok istikrarlı.
Cinebench R15 Multi Loop
Cinebench R23: Multi Core | Single Core
Cinebench R20: CPU (Multi Core) | CPU (Single Core)
Cinebench R15: CPU Multi 64Bit | CPU Single 64Bit
Blender: v2.79 BMW27 CPU
7-Zip 18.03: 7z b 4 | 7z b 4 -mmt1
Geekbench 5.5: Multi-Core | Single-Core
HWBOT x265 Benchmark v2.2: 4k Preset
LibreOffice : 20 Documents To PDF
R Benchmark 2.5: Overall mean
| CPU Performance rating | |
| Sınıf ortalaması Gaming | |
| Dell G15 5530 | |
| Asus TUF Gaming A16 FA617XS | |
| Lenovo LOQ 15APH8 | |
| Lenovo LOQ 16IRH8 | |
| Lenovo Legion Pro 5 16ARX8 (R5 7645HX, RTX 4050) | |
| Lenovo LOQ 15IRH8 Core i7 | |
| MSI Katana 17 B13VFK | |
| Ortalama Intel Core i7-13620H | |
| HP Victus 16-r0077ng | |
| Cinebench R23 / Multi Core | |
| Sınıf ortalaması Gaming (10488 - 42661, n=107, son 2 yıl) | |
| Dell G15 5530 | |
| Lenovo LOQ 15APH8 | |
| Asus TUF Gaming A16 FA617XS | |
| MSI Katana 17 B13VFK | |
| HP Victus 16-r0077ng | |
| Lenovo LOQ 16IRH8 | |
| Lenovo LOQ 15IRH8 Core i7 | |
| Ortalama Intel Core i7-13620H (10819 - 15496, n=7) | |
| Lenovo Legion Pro 5 16ARX8 (R5 7645HX, RTX 4050) | |
| Cinebench R23 / Single Core | |
| Sınıf ortalaması Gaming (1166 - 2415, n=107, son 2 yıl) | |
| Lenovo LOQ 16IRH8 | |
| Lenovo LOQ 15IRH8 Core i7 | |
| Dell G15 5530 | |
| Ortalama Intel Core i7-13620H (1716 - 1871, n=7) | |
| Lenovo Legion Pro 5 16ARX8 (R5 7645HX, RTX 4050) | |
| MSI Katana 17 B13VFK | |
| Asus TUF Gaming A16 FA617XS | |
| Lenovo LOQ 15APH8 | |
| HP Victus 16-r0077ng | |
| Cinebench R20 / CPU (Multi Core) | |
| Sınıf ortalaması Gaming (4029 - 16433, n=106, son 2 yıl) | |
| Dell G15 5530 | |
| Lenovo LOQ 15APH8 | |
| Asus TUF Gaming A16 FA617XS | |
| MSI Katana 17 B13VFK | |
| HP Victus 16-r0077ng | |
| Lenovo LOQ 15IRH8 Core i7 | |
| Lenovo LOQ 16IRH8 | |
| Lenovo Legion Pro 5 16ARX8 (R5 7645HX, RTX 4050) | |
| Ortalama Intel Core i7-13620H (4214 - 5905, n=7) | |
| Cinebench R20 / CPU (Single Core) | |
| Sınıf ortalaması Gaming (442 - 913, n=106, son 2 yıl) | |
| Lenovo LOQ 15IRH8 Core i7 | |
| Dell G15 5530 | |
| Lenovo LOQ 16IRH8 | |
| Asus TUF Gaming A16 FA617XS | |
| Lenovo Legion Pro 5 16ARX8 (R5 7645HX, RTX 4050) | |
| Ortalama Intel Core i7-13620H (657 - 719, n=7) | |
| Lenovo LOQ 15APH8 | |
| MSI Katana 17 B13VFK | |
| HP Victus 16-r0077ng | |
| Cinebench R15 / CPU Multi 64Bit | |
| Sınıf ortalaması Gaming (1578 - 6330, n=105, son 2 yıl) | |
| Dell G15 5530 | |
| Lenovo LOQ 15APH8 | |
| Asus TUF Gaming A16 FA617XS | |
| Lenovo LOQ 16IRH8 | |
| MSI Katana 17 B13VFK | |
| HP Victus 16-r0077ng | |
| Lenovo LOQ 15IRH8 Core i7 | |
| Lenovo Legion Pro 5 16ARX8 (R5 7645HX, RTX 4050) | |
| Ortalama Intel Core i7-13620H (1681 - 2492, n=7) | |
| Cinebench R15 / CPU Single 64Bit | |
| Sınıf ortalaması Gaming (188.8 - 350, n=106, son 2 yıl) | |
| Lenovo Legion Pro 5 16ARX8 (R5 7645HX, RTX 4050) | |
| Asus TUF Gaming A16 FA617XS | |
| Lenovo LOQ 15APH8 | |
| Dell G15 5530 | |
| Lenovo LOQ 16IRH8 | |
| Lenovo LOQ 15IRH8 Core i7 | |
| Ortalama Intel Core i7-13620H (250 - 269, n=7) | |
| MSI Katana 17 B13VFK | |
| HP Victus 16-r0077ng | |
| Blender / v2.79 BMW27 CPU | |
| Lenovo LOQ 15IRH8 Core i7 | |
| Ortalama Intel Core i7-13620H (215 - 297, n=7) | |
| Lenovo Legion Pro 5 16ARX8 (R5 7645HX, RTX 4050) | |
| Lenovo LOQ 16IRH8 | |
| MSI Katana 17 B13VFK | |
| HP Victus 16-r0077ng | |
| Asus TUF Gaming A16 FA617XS | |
| Lenovo LOQ 15APH8 | |
| Dell G15 5530 | |
| Sınıf ortalaması Gaming (79 - 330, n=104, son 2 yıl) | |
| 7-Zip 18.03 / 7z b 4 | |
| Sınıf ortalaması Gaming (33491 - 148086, n=105, son 2 yıl) | |
| Dell G15 5530 | |
| Asus TUF Gaming A16 FA617XS | |
| HP Victus 16-r0077ng | |
| MSI Katana 17 B13VFK | |
| Lenovo Legion Pro 5 16ARX8 (R5 7645HX, RTX 4050) | |
| Lenovo LOQ 15APH8 | |
| Lenovo LOQ 16IRH8 | |
| Lenovo LOQ 15IRH8 Core i7 | |
| Ortalama Intel Core i7-13620H (45092 - 62324, n=7) | |
| 7-Zip 18.03 / 7z b 4 -mmt1 | |
| Lenovo Legion Pro 5 16ARX8 (R5 7645HX, RTX 4050) | |
| Asus TUF Gaming A16 FA617XS | |
| Sınıf ortalaması Gaming (4199 - 7436, n=105, son 2 yıl) | |
| Lenovo LOQ 15APH8 | |
| Ortalama Intel Core i7-13620H (5648 - 6326, n=7) | |
| Lenovo LOQ 15IRH8 Core i7 | |
| Lenovo LOQ 16IRH8 | |
| Dell G15 5530 | |
| MSI Katana 17 B13VFK | |
| HP Victus 16-r0077ng | |
| Geekbench 5.5 / Multi-Core | |
| Sınıf ortalaması Gaming (6460 - 28263, n=105, son 2 yıl) | |
| Dell G15 5530 | |
| Lenovo LOQ 16IRH8 | |
| Asus TUF Gaming A16 FA617XS | |
| HP Victus 16-r0077ng | |
| Lenovo LOQ 15IRH8 Core i7 | |
| MSI Katana 17 B13VFK | |
| Ortalama Intel Core i7-13620H (8112 - 12223, n=7) | |
| Lenovo Legion Pro 5 16ARX8 (R5 7645HX, RTX 4050) | |
| Lenovo LOQ 15APH8 | |
| Geekbench 5.5 / Single-Core | |
| Sınıf ortalaması Gaming (986 - 2474, n=105, son 2 yıl) | |
| Asus TUF Gaming A16 FA617XS | |
| Lenovo Legion Pro 5 16ARX8 (R5 7645HX, RTX 4050) | |
| Lenovo LOQ 15IRH8 Core i7 | |
| Dell G15 5530 | |
| Lenovo LOQ 15APH8 | |
| Lenovo LOQ 16IRH8 | |
| Ortalama Intel Core i7-13620H (1703 - 1865, n=7) | |
| MSI Katana 17 B13VFK | |
| HP Victus 16-r0077ng | |
| HWBOT x265 Benchmark v2.2 / 4k Preset | |
| Sınıf ortalaması Gaming (11.5 - 44.4, n=105, son 2 yıl) | |
| Dell G15 5530 | |
| Asus TUF Gaming A16 FA617XS | |
| Lenovo Legion Pro 5 16ARX8 (R5 7645HX, RTX 4050) | |
| Lenovo LOQ 15APH8 | |
| MSI Katana 17 B13VFK | |
| Lenovo LOQ 16IRH8 | |
| Lenovo LOQ 15IRH8 Core i7 | |
| HP Victus 16-r0077ng | |
| Ortalama Intel Core i7-13620H (12.2 - 17.7, n=7) | |
| LibreOffice / 20 Documents To PDF | |
| HP Victus 16-r0077ng | |
| MSI Katana 17 B13VFK | |
| Lenovo Legion Pro 5 16ARX8 (R5 7645HX, RTX 4050) | |
| Ortalama Intel Core i7-13620H (41.5 - 78.9, n=7) | |
| Sınıf ortalaması Gaming (33.2 - 88.8, n=105, son 2 yıl) | |
| Dell G15 5530 | |
| Lenovo LOQ 16IRH8 | |
| Lenovo LOQ 15IRH8 Core i7 | |
| Asus TUF Gaming A16 FA617XS | |
| Lenovo LOQ 15APH8 | |
| R Benchmark 2.5 / Overall mean | |
| HP Victus 16-r0077ng | |
| Ortalama Intel Core i7-13620H (0.4438 - 0.4762, n=7) | |
| Lenovo LOQ 15IRH8 Core i7 | |
| Lenovo LOQ 15APH8 | |
| Lenovo LOQ 16IRH8 | |
| MSI Katana 17 B13VFK | |
| Lenovo Legion Pro 5 16ARX8 (R5 7645HX, RTX 4050) | |
| Sınıf ortalaması Gaming (0.3439 - 0.759, n=106, son 2 yıl) | |
| Dell G15 5530 | |
| Asus TUF Gaming A16 FA617XS | |
* ... daha küçük daha iyidir
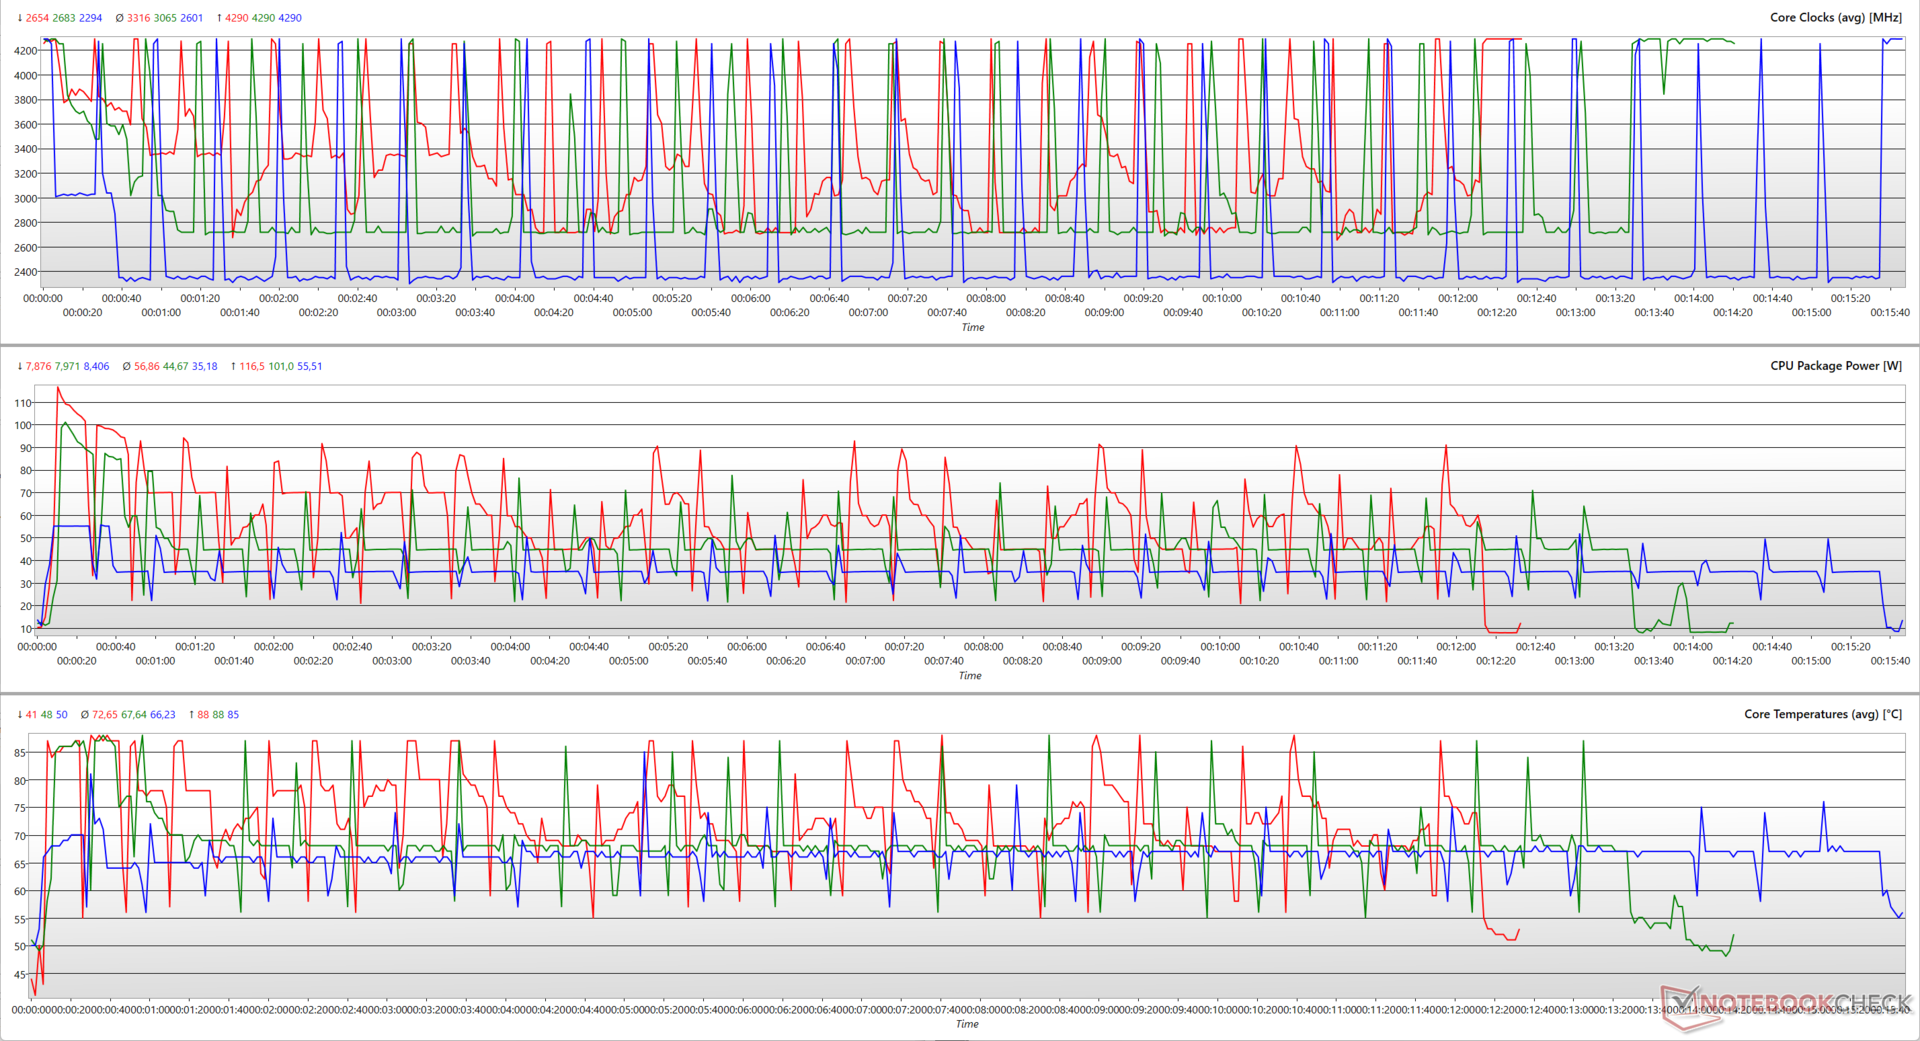
Cinebench R15 çok çekirdekli döngü testinin analizi, dahili güç profillerinin çeşitli CPU parametrelerini nasıl etkilediğini göstermektedir.
Performans modunun işlemcinin 135 W PL2'ye kadar kullanmasına izin vermesi gerekirken, yalnızca 116,5 W'da maksimuma ulaştığını görüyoruz. Denge modu da mümkün olandan daha az paket gücü ile idare ediyor gibi görünüyor (101 W'a karşı 117 W), ancak burada Performansa kıyasla daha istikrarlı bir çalışma görüyoruz.
LOQ 15IRH8'in soğutma sistemi, güç sınırı 116 W'ı aştığında zorlanıyor olabilir, bu da bu kıyaslamadaki zayıf sürdürülebilir performansı açıklıyor.
Cinebench R20 çoklu çekirdek skorları pil gücüyle %23 düşerken, tek çekirdek performansı sadece küçük bir darbe alıyor.
AIDA64: FP32 Ray-Trace | FPU Julia | CPU SHA3 | CPU Queen | FPU SinJulia | FPU Mandel | CPU AES | CPU ZLib | FP64 Ray-Trace | CPU PhotoWorxx
| Performance rating | |
| Sınıf ortalaması Gaming | |
| Asus TUF Gaming A16 FA617XS | |
| Lenovo LOQ 15APH8 | |
| Dell G15 5530 | |
| Lenovo Legion Pro 5 16ARX8 (R5 7645HX, RTX 4050) | |
| HP Victus 16-r0077ng | |
| MSI Katana 17 B13VFK | |
| Lenovo LOQ 16IRH8 | |
| Lenovo LOQ 15IRH8 Core i7 | |
| Ortalama Intel Core i7-13620H | |
| AIDA64 / FP32 Ray-Trace | |
| Sınıf ortalaması Gaming (10227 - 85542, n=105, son 2 yıl) | |
| Lenovo LOQ 15APH8 | |
| Asus TUF Gaming A16 FA617XS | |
| Lenovo Legion Pro 5 16ARX8 (R5 7645HX, RTX 4050) | |
| Dell G15 5530 | |
| HP Victus 16-r0077ng | |
| MSI Katana 17 B13VFK | |
| Lenovo LOQ 16IRH8 | |
| Ortalama Intel Core i7-13620H (10779 - 13601, n=7) | |
| Lenovo LOQ 15IRH8 Core i7 | |
| AIDA64 / FPU Julia | |
| Sınıf ortalaması Gaming (51376 - 238426, n=105, son 2 yıl) | |
| Lenovo LOQ 15APH8 | |
| Asus TUF Gaming A16 FA617XS | |
| Lenovo Legion Pro 5 16ARX8 (R5 7645HX, RTX 4050) | |
| Dell G15 5530 | |
| HP Victus 16-r0077ng | |
| MSI Katana 17 B13VFK | |
| Lenovo LOQ 16IRH8 | |
| Lenovo LOQ 15IRH8 Core i7 | |
| Ortalama Intel Core i7-13620H (54287 - 67187, n=7) | |
| AIDA64 / CPU SHA3 | |
| Sınıf ortalaması Gaming (2180 - 10115, n=105, son 2 yıl) | |
| Lenovo LOQ 15APH8 | |
| Asus TUF Gaming A16 FA617XS | |
| Dell G15 5530 | |
| Lenovo Legion Pro 5 16ARX8 (R5 7645HX, RTX 4050) | |
| HP Victus 16-r0077ng | |
| MSI Katana 17 B13VFK | |
| Lenovo LOQ 16IRH8 | |
| Ortalama Intel Core i7-13620H (2327 - 2773, n=7) | |
| Lenovo LOQ 15IRH8 Core i7 | |
| AIDA64 / CPU Queen | |
| Asus TUF Gaming A16 FA617XS | |
| Lenovo LOQ 15APH8 | |
| Sınıf ortalaması Gaming (49785 - 173351, n=90, son 2 yıl) | |
| Dell G15 5530 | |
| Lenovo Legion Pro 5 16ARX8 (R5 7645HX, RTX 4050) | |
| HP Victus 16-r0077ng | |
| Lenovo LOQ 15IRH8 Core i7 | |
| Lenovo LOQ 16IRH8 | |
| MSI Katana 17 B13VFK | |
| Ortalama Intel Core i7-13620H (66885 - 78867, n=7) | |
| AIDA64 / FPU SinJulia | |
| Asus TUF Gaming A16 FA617XS | |
| Lenovo LOQ 15APH8 | |
| Sınıf ortalaması Gaming (4424 - 33636, n=105, son 2 yıl) | |
| Lenovo Legion Pro 5 16ARX8 (R5 7645HX, RTX 4050) | |
| Dell G15 5530 | |
| HP Victus 16-r0077ng | |
| MSI Katana 17 B13VFK | |
| Lenovo LOQ 16IRH8 | |
| Ortalama Intel Core i7-13620H (6737 - 8421, n=7) | |
| Lenovo LOQ 15IRH8 Core i7 | |
| AIDA64 / FPU Mandel | |
| Sınıf ortalaması Gaming (25115 - 128721, n=105, son 2 yıl) | |
| Lenovo LOQ 15APH8 | |
| Asus TUF Gaming A16 FA617XS | |
| Lenovo Legion Pro 5 16ARX8 (R5 7645HX, RTX 4050) | |
| Dell G15 5530 | |
| HP Victus 16-r0077ng | |
| MSI Katana 17 B13VFK | |
| Lenovo LOQ 16IRH8 | |
| Lenovo LOQ 15IRH8 Core i7 | |
| Ortalama Intel Core i7-13620H (27242 - 32787, n=7) | |
| AIDA64 / CPU AES | |
| Sınıf ortalaması Gaming (39258 - 247074, n=105, son 2 yıl) | |
| Asus TUF Gaming A16 FA617XS | |
| Dell G15 5530 | |
| Lenovo LOQ 15APH8 | |
| HP Victus 16-r0077ng | |
| Ortalama Intel Core i7-13620H (48646 - 85895, n=7) | |
| MSI Katana 17 B13VFK | |
| Lenovo LOQ 16IRH8 | |
| Lenovo Legion Pro 5 16ARX8 (R5 7645HX, RTX 4050) | |
| Lenovo LOQ 15IRH8 Core i7 | |
| AIDA64 / CPU ZLib | |
| Sınıf ortalaması Gaming (574 - 2531, n=105, son 2 yıl) | |
| Dell G15 5530 | |
| Lenovo LOQ 15APH8 | |
| Asus TUF Gaming A16 FA617XS | |
| HP Victus 16-r0077ng | |
| Lenovo Legion Pro 5 16ARX8 (R5 7645HX, RTX 4050) | |
| Lenovo LOQ 16IRH8 | |
| MSI Katana 17 B13VFK | |
| Ortalama Intel Core i7-13620H (688 - 835, n=7) | |
| Lenovo LOQ 15IRH8 Core i7 | |
| AIDA64 / FP64 Ray-Trace | |
| Sınıf ortalaması Gaming (5509 - 45446, n=105, son 2 yıl) | |
| Lenovo LOQ 15APH8 | |
| Asus TUF Gaming A16 FA617XS | |
| Lenovo Legion Pro 5 16ARX8 (R5 7645HX, RTX 4050) | |
| Dell G15 5530 | |
| HP Victus 16-r0077ng | |
| MSI Katana 17 B13VFK | |
| Lenovo LOQ 16IRH8 | |
| Ortalama Intel Core i7-13620H (5919 - 7364, n=7) | |
| Lenovo LOQ 15IRH8 Core i7 | |
| AIDA64 / CPU PhotoWorxx | |
| Sınıf ortalaması Gaming (12271 - 89891, n=105, son 2 yıl) | |
| HP Victus 16-r0077ng | |
| Dell G15 5530 | |
| MSI Katana 17 B13VFK | |
| Lenovo LOQ 15IRH8 Core i7 | |
| Lenovo LOQ 16IRH8 | |
| Asus TUF Gaming A16 FA617XS | |
| Lenovo Legion Pro 5 16ARX8 (R5 7645HX, RTX 4050) | |
| Ortalama Intel Core i7-13620H (19421 - 34544, n=7) | |
| Lenovo LOQ 15APH8 | |
Bize özel olanlara göz atın Intel Core i7-13620H sayfasında daha fazla bilgi ve performans karşılaştırmaları bulabilirsiniz.
Sistem Performansı
LOQ 15IRH8, AMD tabanlı LOQ 15APH8 kuzenine genel CrossMark'ta %19 fark atıyor, ancak bu iki cihaz PCMark'ta neredeyse eşit. Üretkenlik veya oyun görevleri sırasında günlük sistem performansında hiçbir aksaklık gözlemlemedik.
CrossMark: Overall | Productivity | Creativity | Responsiveness
AIDA64: Memory Copy | Memory Read | Memory Write | Memory Latency
| PCMark 10 / Score | |
| Sınıf ortalaması Gaming (5828 - 12414, n=93, son 2 yıl) | |
| Lenovo Legion Pro 5 16ARX8 (R5 7645HX, RTX 4050) | |
| Asus TUF Gaming A16 FA617XS | |
| Lenovo LOQ 15APH8 | |
| Lenovo LOQ 15IRH8 Core i7 | |
| Ortalama Intel Core i7-13620H, NVIDIA GeForce RTX 4050 Laptop GPU (n=1) | |
| MSI Katana 17 B13VFK | |
| HP Victus 16-r0077ng | |
| Dell G15 5530 | |
| Lenovo LOQ 16IRH8 | |
| PCMark 10 / Essentials | |
| Lenovo Legion Pro 5 16ARX8 (R5 7645HX, RTX 4050) | |
| Dell G15 5530 | |
| Lenovo LOQ 15IRH8 Core i7 | |
| Ortalama Intel Core i7-13620H, NVIDIA GeForce RTX 4050 Laptop GPU (n=1) | |
| Asus TUF Gaming A16 FA617XS | |
| MSI Katana 17 B13VFK | |
| HP Victus 16-r0077ng | |
| Sınıf ortalaması Gaming (8810 - 11935, n=97, son 2 yıl) | |
| Lenovo LOQ 15APH8 | |
| Lenovo LOQ 16IRH8 | |
| PCMark 10 / Productivity | |
| Sınıf ortalaması Gaming (6845 - 25323, n=95, son 2 yıl) | |
| Lenovo Legion Pro 5 16ARX8 (R5 7645HX, RTX 4050) | |
| Asus TUF Gaming A16 FA617XS | |
| Dell G15 5530 | |
| Lenovo LOQ 15APH8 | |
| Lenovo LOQ 15IRH8 Core i7 | |
| Ortalama Intel Core i7-13620H, NVIDIA GeForce RTX 4050 Laptop GPU (n=1) | |
| MSI Katana 17 B13VFK | |
| HP Victus 16-r0077ng | |
| Lenovo LOQ 16IRH8 | |
| PCMark 10 / Digital Content Creation | |
| Sınıf ortalaması Gaming (7602 - 19954, n=95, son 2 yıl) | |
| Asus TUF Gaming A16 FA617XS | |
| Lenovo LOQ 15APH8 | |
| Lenovo LOQ 15IRH8 Core i7 | |
| Ortalama Intel Core i7-13620H, NVIDIA GeForce RTX 4050 Laptop GPU (n=1) | |
| Lenovo Legion Pro 5 16ARX8 (R5 7645HX, RTX 4050) | |
| HP Victus 16-r0077ng | |
| MSI Katana 17 B13VFK | |
| Lenovo LOQ 16IRH8 | |
| Dell G15 5530 | |
| CrossMark / Overall | |
| Sınıf ortalaması Gaming (1366 - 2409, n=94, son 2 yıl) | |
| Lenovo LOQ 16IRH8 | |
| Lenovo Legion Pro 5 16ARX8 (R5 7645HX, RTX 4050) | |
| Lenovo LOQ 15IRH8 Core i7 | |
| Ortalama Intel Core i7-13620H, NVIDIA GeForce RTX 4050 Laptop GPU (n=1) | |
| MSI Katana 17 B13VFK | |
| Dell G15 5530 | |
| Asus TUF Gaming A16 FA617XS | |
| Lenovo LOQ 15APH8 | |
| CrossMark / Productivity | |
| Lenovo Legion Pro 5 16ARX8 (R5 7645HX, RTX 4050) | |
| Lenovo LOQ 16IRH8 | |
| Sınıf ortalaması Gaming (1386 - 2254, n=94, son 2 yıl) | |
| Lenovo LOQ 15IRH8 Core i7 | |
| Ortalama Intel Core i7-13620H, NVIDIA GeForce RTX 4050 Laptop GPU (n=1) | |
| MSI Katana 17 B13VFK | |
| Dell G15 5530 | |
| Asus TUF Gaming A16 FA617XS | |
| Lenovo LOQ 15APH8 | |
| CrossMark / Creativity | |
| Sınıf ortalaması Gaming (1343 - 2786, n=94, son 2 yıl) | |
| Dell G15 5530 | |
| Lenovo LOQ 16IRH8 | |
| Lenovo Legion Pro 5 16ARX8 (R5 7645HX, RTX 4050) | |
| MSI Katana 17 B13VFK | |
| Lenovo LOQ 15IRH8 Core i7 | |
| Ortalama Intel Core i7-13620H, NVIDIA GeForce RTX 4050 Laptop GPU (n=1) | |
| Asus TUF Gaming A16 FA617XS | |
| Lenovo LOQ 15APH8 | |
| CrossMark / Responsiveness | |
| Lenovo LOQ 16IRH8 | |
| Lenovo Legion Pro 5 16ARX8 (R5 7645HX, RTX 4050) | |
| Lenovo LOQ 15IRH8 Core i7 | |
| Ortalama Intel Core i7-13620H, NVIDIA GeForce RTX 4050 Laptop GPU (n=1) | |
| MSI Katana 17 B13VFK | |
| Sınıf ortalaması Gaming (1226 - 2334, n=94, son 2 yıl) | |
| Dell G15 5530 | |
| Asus TUF Gaming A16 FA617XS | |
| Lenovo LOQ 15APH8 | |
| AIDA64 / Memory Copy | |
| Sınıf ortalaması Gaming (21750 - 129946, n=105, son 2 yıl) | |
| HP Victus 16-r0077ng | |
| Asus TUF Gaming A16 FA617XS | |
| Dell G15 5530 | |
| Lenovo LOQ 15IRH8 Core i7 | |
| Ortalama Intel Core i7-13620H, NVIDIA GeForce RTX 4050 Laptop GPU (n=1) | |
| Lenovo LOQ 16IRH8 | |
| MSI Katana 17 B13VFK | |
| Lenovo Legion Pro 5 16ARX8 (R5 7645HX, RTX 4050) | |
| Lenovo LOQ 15APH8 | |
| AIDA64 / Memory Read | |
| Sınıf ortalaması Gaming (22956 - 118858, n=105, son 2 yıl) | |
| HP Victus 16-r0077ng | |
| Dell G15 5530 | |
| Lenovo LOQ 16IRH8 | |
| Lenovo LOQ 15IRH8 Core i7 | |
| Ortalama Intel Core i7-13620H, NVIDIA GeForce RTX 4050 Laptop GPU (n=1) | |
| MSI Katana 17 B13VFK | |
| Asus TUF Gaming A16 FA617XS | |
| Lenovo Legion Pro 5 16ARX8 (R5 7645HX, RTX 4050) | |
| Lenovo LOQ 15APH8 | |
| AIDA64 / Memory Write | |
| Sınıf ortalaması Gaming (22297 - 135096, n=105, son 2 yıl) | |
| Asus TUF Gaming A16 FA617XS | |
| HP Victus 16-r0077ng | |
| Dell G15 5530 | |
| Lenovo LOQ 15IRH8 Core i7 | |
| Ortalama Intel Core i7-13620H, NVIDIA GeForce RTX 4050 Laptop GPU (n=1) | |
| Lenovo LOQ 16IRH8 | |
| Lenovo Legion Pro 5 16ARX8 (R5 7645HX, RTX 4050) | |
| MSI Katana 17 B13VFK | |
| Lenovo LOQ 15APH8 | |
| AIDA64 / Memory Latency | |
| Lenovo LOQ 15IRH8 Core i7 | |
| Ortalama Intel Core i7-13620H, NVIDIA GeForce RTX 4050 Laptop GPU (n=1) | |
| Lenovo LOQ 16IRH8 | |
| Sınıf ortalaması Gaming (75.3 - 259, n=105, son 2 yıl) | |
| MSI Katana 17 B13VFK | |
| Lenovo LOQ 15APH8 | |
| HP Victus 16-r0077ng | |
| Dell G15 5530 | |
| Asus TUF Gaming A16 FA617XS | |
| Lenovo Legion Pro 5 16ARX8 (R5 7645HX, RTX 4050) | |
* ... daha küçük daha iyidir
| PCMark 8 Home Score Accelerated v2 | 5795 puan | |
| PCMark 8 Work Score Accelerated v2 | 6177 puan | |
| PCMark 10 Score | 7656 puan | |
Yardım | ||
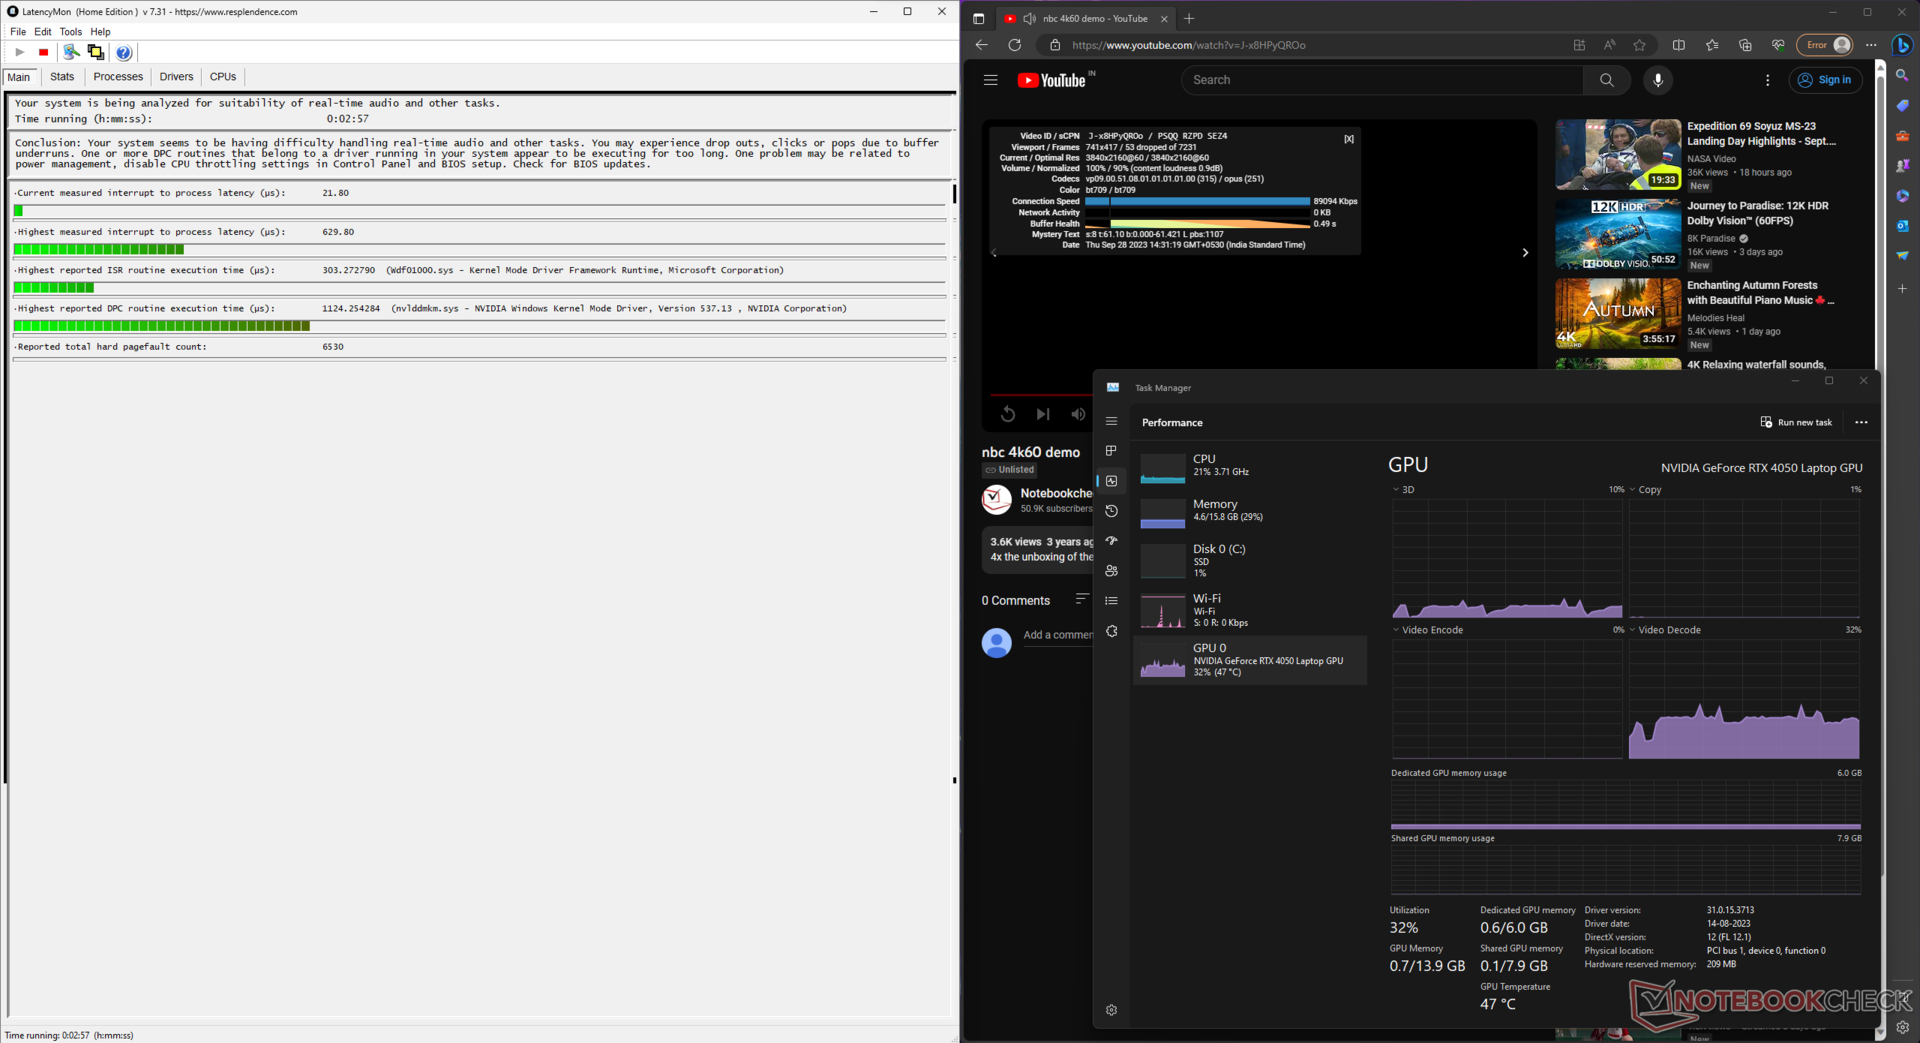
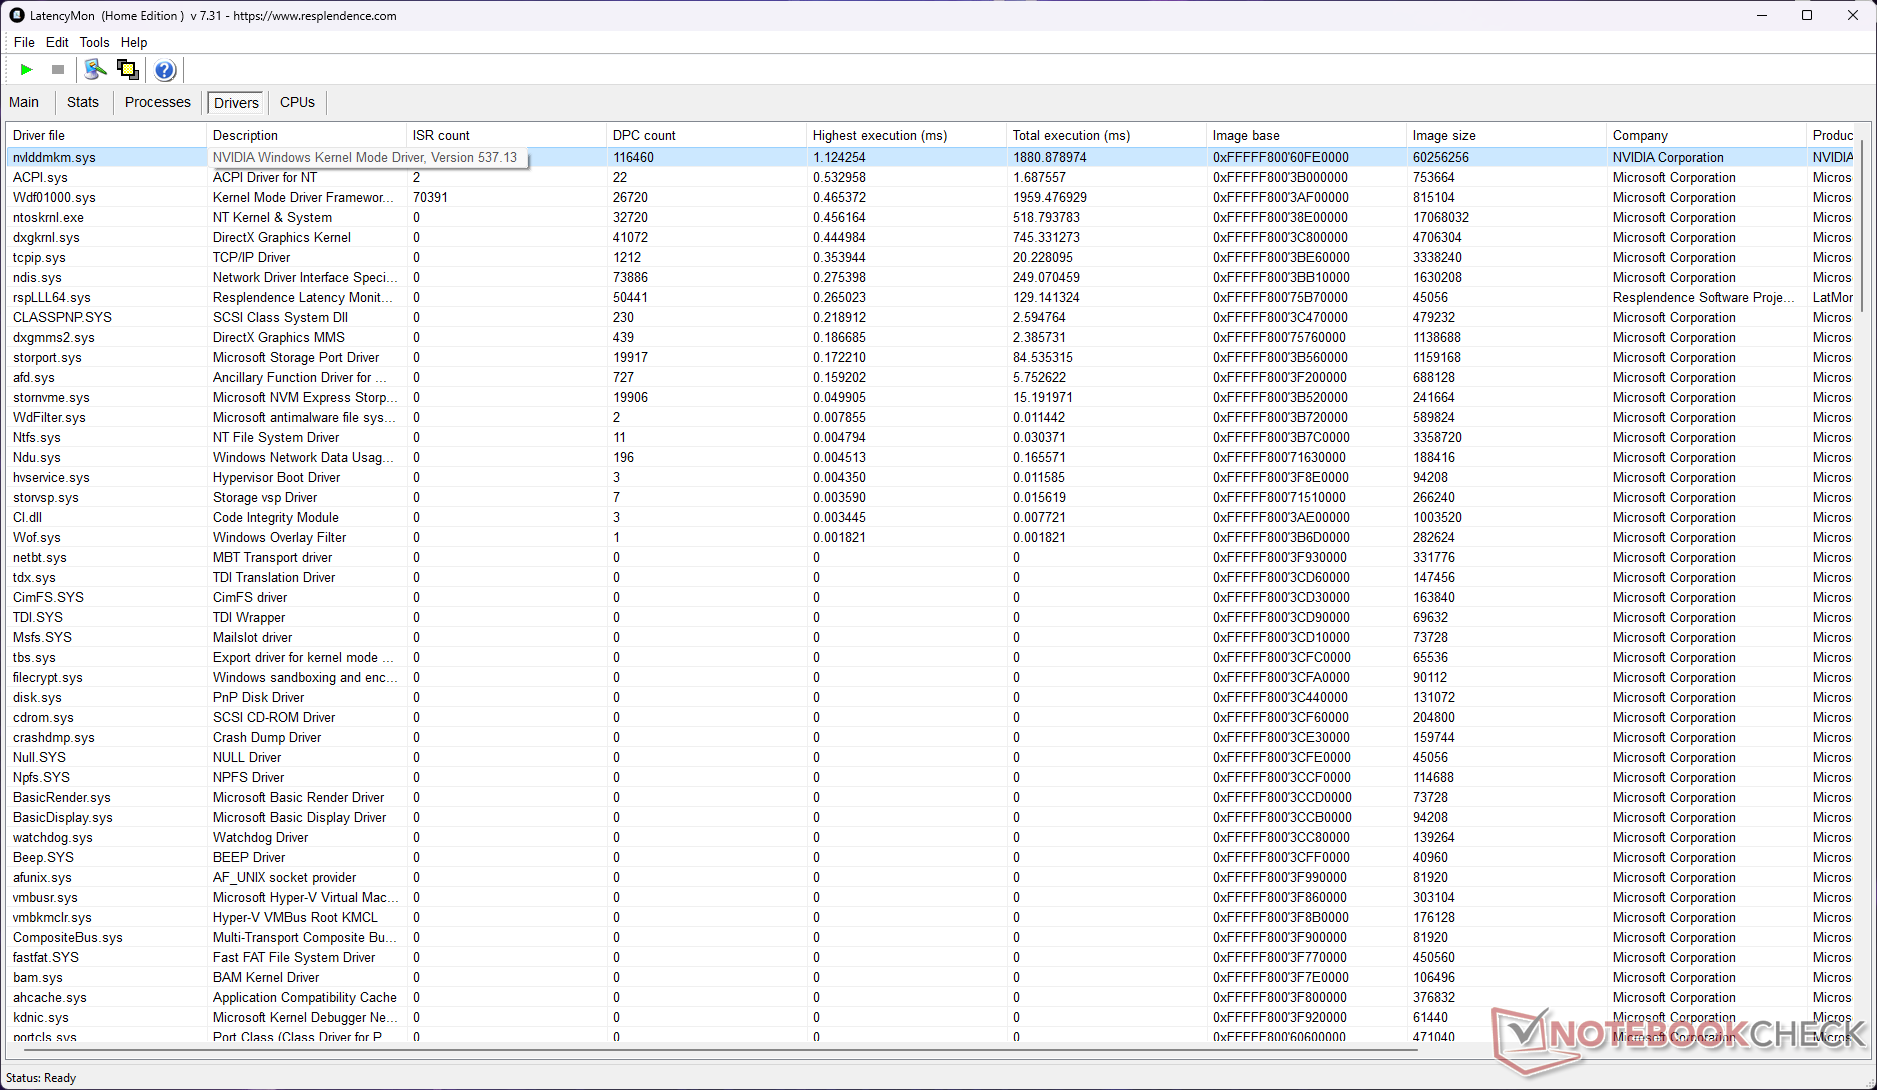
DPC Gecikme Süresi
DPC gecikmesi biraz daha yüksek, ancak LOQ 15 Core i7 testteki benzerlerine kıyasla çok daha iyi durumda.
| DPC Latencies / LatencyMon - interrupt to process latency (max), Web, Youtube, Prime95 | |
| Dell G15 5530 | |
| MSI Katana 17 B13VFK | |
| HP Victus 16-r0077ng | |
| Lenovo LOQ 15APH8 | |
| Lenovo LOQ 16IRH8 | |
| Asus TUF Gaming A16 FA617XS | |
| Lenovo Legion Pro 5 16ARX8 (R5 7645HX, RTX 4050) | |
| Lenovo LOQ 15IRH8 Core i7 | |
* ... daha küçük daha iyidir
Bizim DPC Gecikme Sıralaması sayfası, incelenen cihazlarda ölçülen gecikme süresine genel bir bakış sunar.
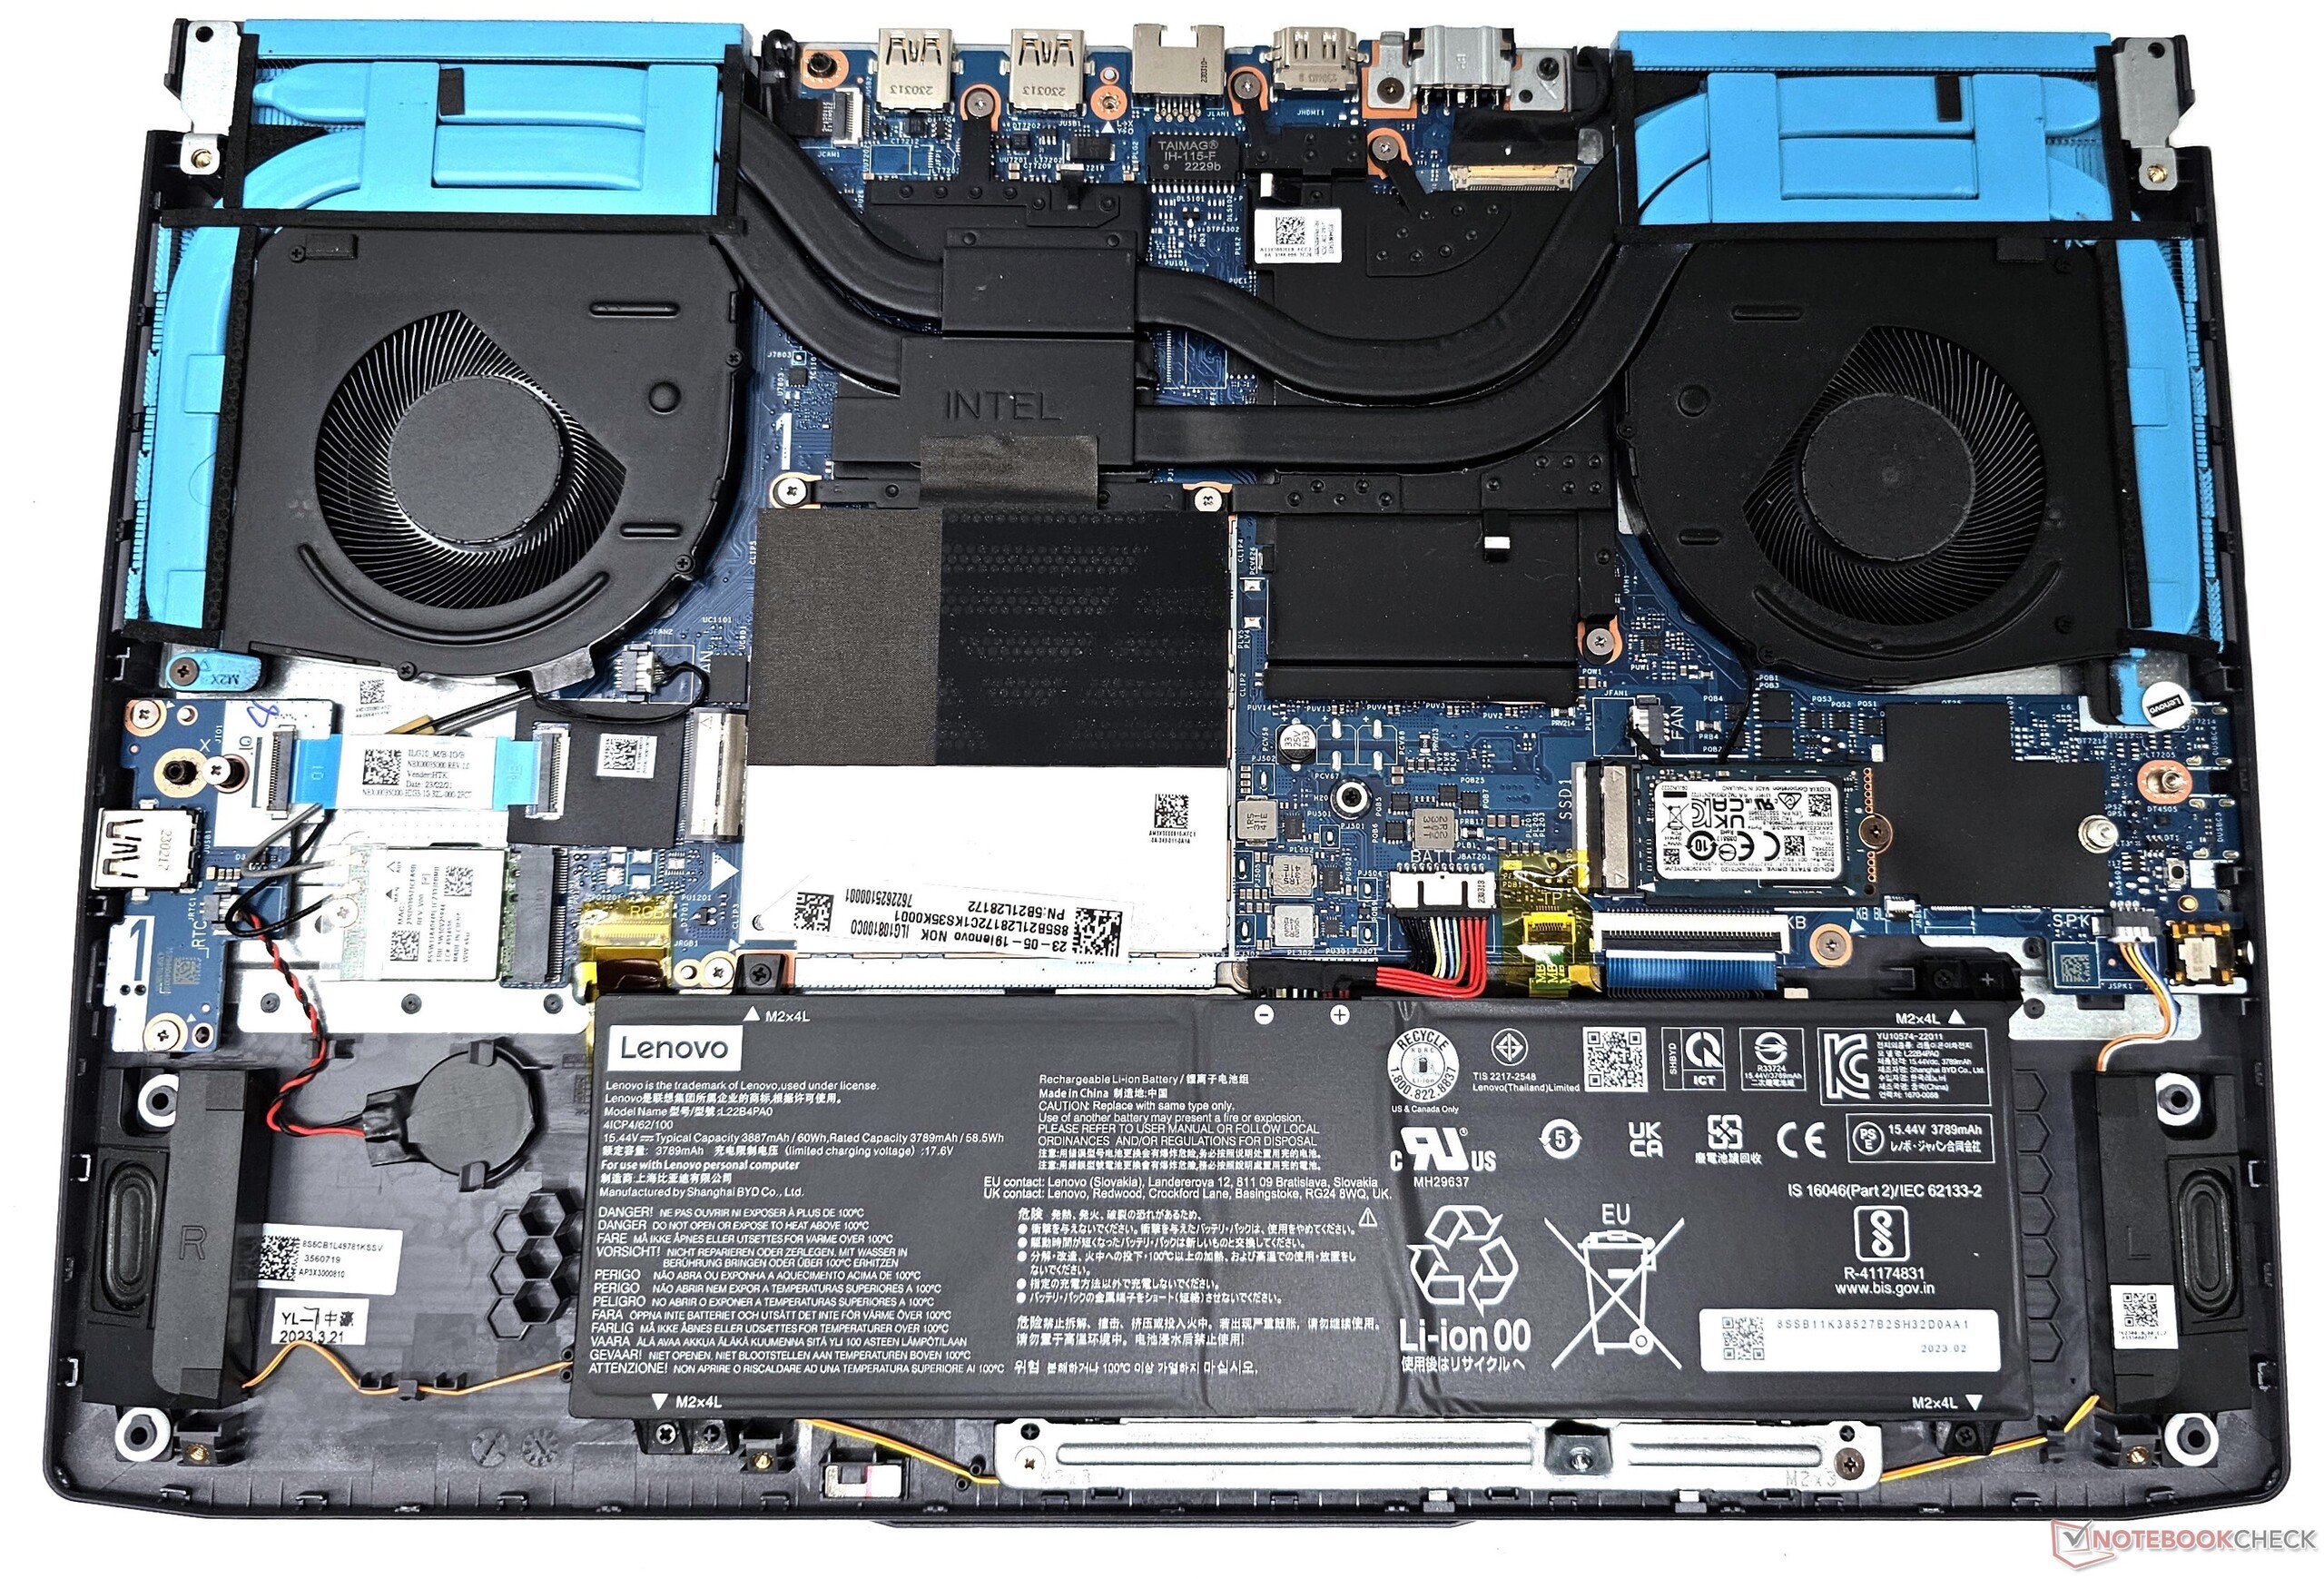
Depolama Cihazları
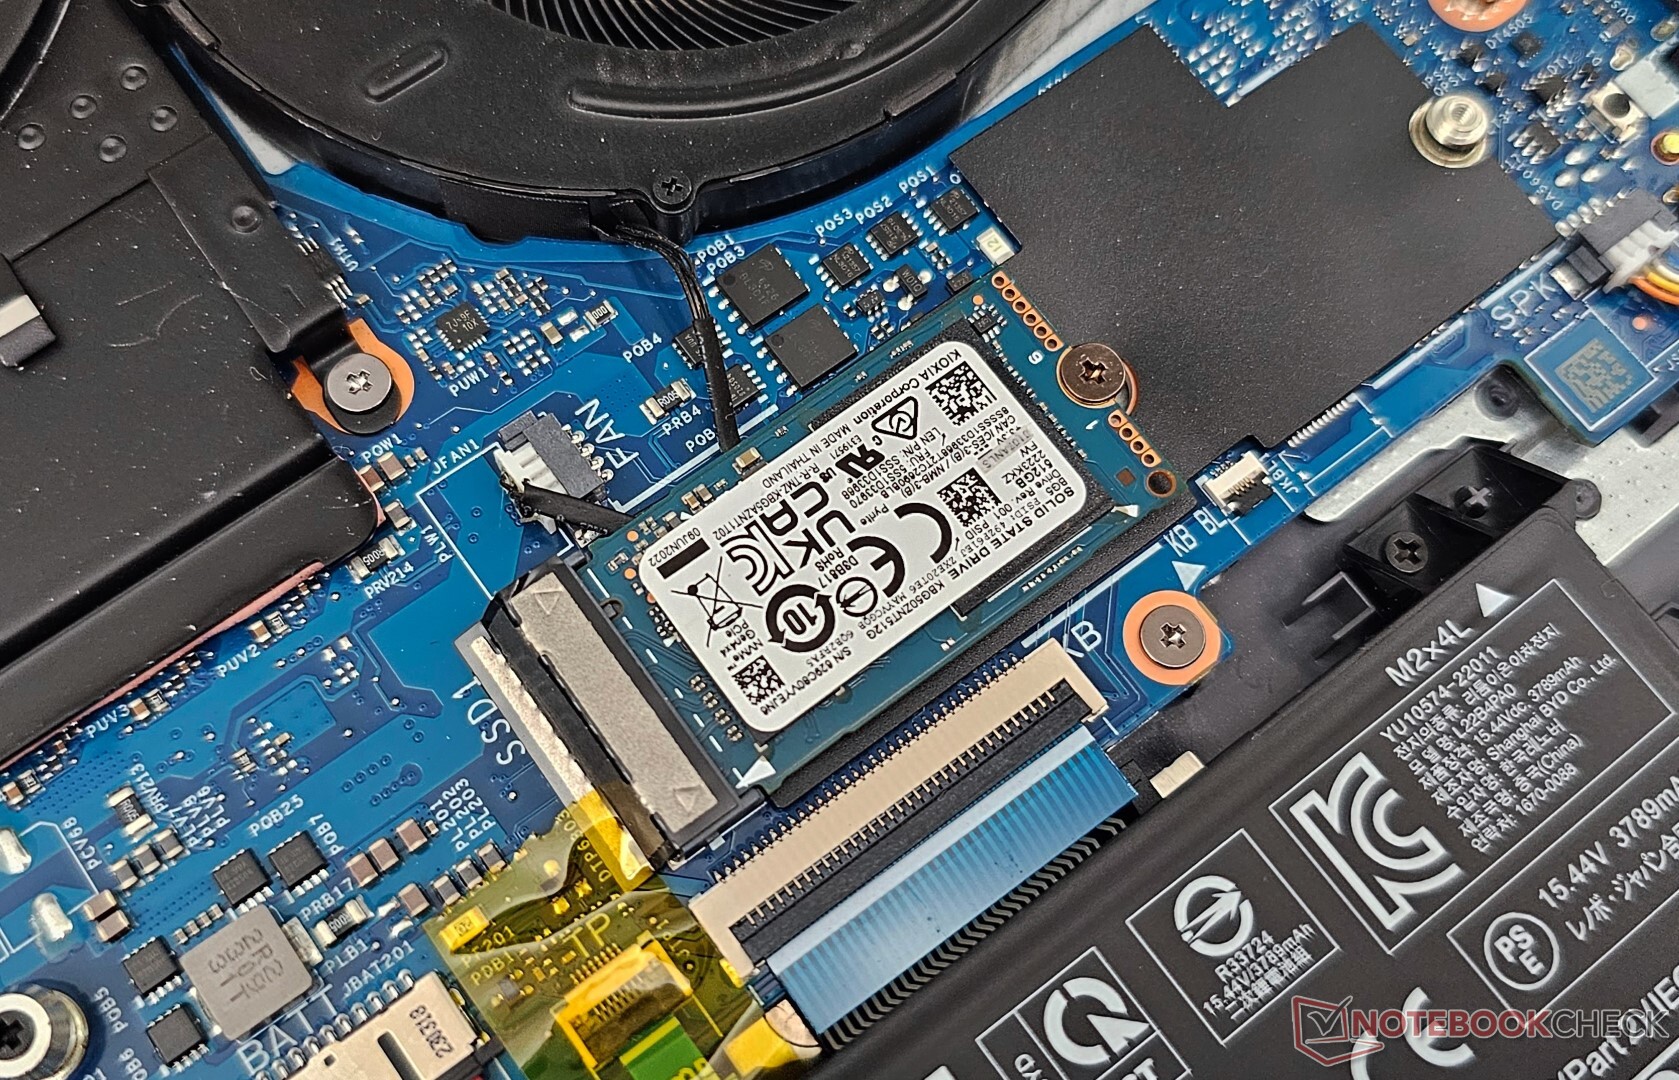
LOQ 15IRH8 ünitemiz, Kioxia 512 GB M.2 2230 PCIe Gen4 NVMe SSD ile donatılmıştır. Gerekirse bunu daha büyük kapasiteli bir M.2280 sürücü ile değiştirebilirsiniz. Ayrıca depolama genişletmesi için boş bir M.2 2280 yuvası da mevcuttur.
Genel sürücü performansı, Kioxia'da bulunan 1 TB sürücünün gerisinde kalıyor HP Victus 16. SSD aynı zamanda tutarlı bir okuma hızı sağlamakta da zorlanmaktadır çünkü 8 kuyruk derinliğinde DiskSpd okuma döngüsü testimizde 25. çalıştırmadan sonra performans düşüşleri görmekteyiz.

| Drive Performance rating - Percent | |
| Lenovo Legion Pro 5 16ARX8 (R5 7645HX, RTX 4050) | |
| Sınıf ortalaması Gaming | |
| MSI Katana 17 B13VFK | |
| HP Victus 16-r0077ng | |
| Lenovo LOQ 15IRH8 Core i7 | |
| Ortalama Kioxia BG5 KBG50ZNT512G | |
| Lenovo LOQ 16IRH8 | |
| Asus TUF Gaming A16 FA617XS | |
| Dell G15 5530 | |
| Lenovo LOQ 15APH8 | |
* ... daha küçük daha iyidir
Disk Throttling: DiskSpd Read Loop, Queue Depth 8
Daha fazla bilgi ve performans karşılaştırmaları için HDD ve SSD karşılaştırmaları sayfa.
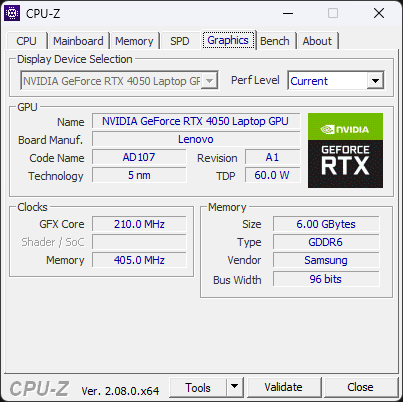
GPU Performansı
LOQ 15IRH8'deki RTX 4050 Dizüstü Bilgisayar GPU'su 95 W TGP olarak derecelendirilmiştir, ancak stres sırasında daha fazla güç kullanmak için boşluğa sahiptir. LOQ 15APH8'deki aynı GPU'nun kümülatif 3DMark testlerinde yaklaşık %6 daha hızlı olduğunu görüyoruz.
İlginç bir şekilde, bu 95 W RTX 4050, LOQ 15APH8'deki 140 W'lık varyantın sadece bir fiske gerisinde Lenovo Legion Pro 5. Ancak, Blender CUDA kıyaslamasında bu açığı kapatıyor.
| 3DMark Performance rating - Percent | |
| Sınıf ortalaması Gaming | |
| HP Victus 16-r0077ng | |
| Dell G15 5530 | |
| MSI Katana 17 B13VFK | |
| Lenovo LOQ 16IRH8 | |
| Asus TUF Gaming A16 FA617XS | |
| Lenovo LOQ 15APH8 | |
| Lenovo Legion Pro 5 16ARX8 (R5 7645HX, RTX 4050) | |
| Lenovo LOQ 15IRH8 Core i7 | |
| Ortalama NVIDIA GeForce RTX 4050 Laptop GPU | |
| 3DMark 11 - 1280x720 Performance GPU | |
| Sınıf ortalaması Gaming (21841 - 80022, n=104, son 2 yıl) | |
| HP Victus 16-r0077ng | |
| Dell G15 5530 | |
| MSI Katana 17 B13VFK | |
| Lenovo LOQ 16IRH8 | |
| Asus TUF Gaming A16 FA617XS | |
| Lenovo LOQ 15APH8 | |
| Lenovo Legion Pro 5 16ARX8 (R5 7645HX, RTX 4050) | |
| Lenovo LOQ 15IRH8 Core i7 | |
| Ortalama NVIDIA GeForce RTX 4050 Laptop GPU (13339 - 32642, n=41) | |
| 3DMark | |
| 1920x1080 Fire Strike Graphics | |
| Sınıf ortalaması Gaming (12242 - 62849, n=115, son 2 yıl) | |
| HP Victus 16-r0077ng | |
| MSI Katana 17 B13VFK | |
| Dell G15 5530 | |
| Asus TUF Gaming A16 FA617XS | |
| Lenovo LOQ 16IRH8 | |
| Lenovo Legion Pro 5 16ARX8 (R5 7645HX, RTX 4050) | |
| Lenovo LOQ 15APH8 | |
| Lenovo LOQ 15IRH8 Core i7 | |
| Ortalama NVIDIA GeForce RTX 4050 Laptop GPU (13591 - 24007, n=41) | |
| 2560x1440 Time Spy Graphics | |
| Sınıf ortalaması Gaming (5012 - 26212, n=115, son 2 yıl) | |
| HP Victus 16-r0077ng | |
| Dell G15 5530 | |
| Lenovo LOQ 16IRH8 | |
| MSI Katana 17 B13VFK | |
| Asus TUF Gaming A16 FA617XS | |
| Lenovo LOQ 15APH8 | |
| Lenovo Legion Pro 5 16ARX8 (R5 7645HX, RTX 4050) | |
| Lenovo LOQ 15IRH8 Core i7 | |
| Ortalama NVIDIA GeForce RTX 4050 Laptop GPU (5107 - 9040, n=41) | |
| 3DMark 11 Performance | 27474 puan | |
| 3DMark Ice Storm Standard Score | 229274 puan | |
| 3DMark Cloud Gate Standard Score | 49040 puan | |
| 3DMark Fire Strike Score | 19230 puan | |
| 3DMark Fire Strike Extreme Score | 9873 puan | |
| 3DMark Time Spy Score | 8701 puan | |
Yardım | ||
| Blender / v3.3 Classroom OPTIX/RTX | |
| Ortalama NVIDIA GeForce RTX 4050 Laptop GPU (25 - 37, n=40) | |
| Lenovo Legion Pro 5 16ARX8 (R5 7645HX, RTX 4050) | |
| Lenovo LOQ 15IRH8 Core i7 | |
| MSI Katana 17 B13VFK | |
| Lenovo LOQ 15APH8 | |
| HP Victus 16-r0077ng | |
| Lenovo LOQ 16IRH8 | |
| Dell G15 5530 | |
| Sınıf ortalaması Gaming (9 - 32, n=106, son 2 yıl) | |
| Blender / v3.3 Classroom CUDA | |
| Ortalama NVIDIA GeForce RTX 4050 Laptop GPU (47 - 68, n=39) | |
| Lenovo LOQ 15IRH8 Core i7 | |
| Lenovo LOQ 15APH8 | |
| Lenovo Legion Pro 5 16ARX8 (R5 7645HX, RTX 4050) | |
| MSI Katana 17 B13VFK | |
| Lenovo LOQ 16IRH8 | |
| Dell G15 5530 | |
| HP Victus 16-r0077ng | |
| Sınıf ortalaması Gaming (15 - 228, n=106, son 2 yıl) | |
| Blender / v3.3 Classroom CPU | |
| Lenovo LOQ 15IRH8 Core i7 | |
| Ortalama NVIDIA GeForce RTX 4050 Laptop GPU (243 - 907, n=40) | |
| Lenovo LOQ 16IRH8 | |
| HP Victus 16-r0077ng | |
| Lenovo Legion Pro 5 16ARX8 (R5 7645HX, RTX 4050) | |
| MSI Katana 17 B13VFK | |
| Asus TUF Gaming A16 FA617XS | |
| Lenovo LOQ 15APH8 | |
| Dell G15 5530 | |
| Sınıf ortalaması Gaming (122 - 565, n=102, son 2 yıl) | |
* ... daha küçük daha iyidir
Oyun Performansı
Benzer eğilimler oyun kıyaslamalarında da görülüyor. LOQ 15'in 95 W RTX 4050'si ve Legion Pro 5'teki 140 W RTX 4050, kümülatif 1080p Ultra oyun testlerinde neredeyse aynı gösteriyi ortaya koydu, ancak ikincisinin daha yüksek watt gücü, QHD Ultra'da algılanabilir liderlik sağlıyor.
LOQ 15IRH8 esasen bir 1080p Ultra oyun makinesidir. Biraz daha eski oyunlarda QHD Ultra'da oynanabilir kare hızlarına ulaşılabilir. QHD veya 4K'da daha fazla kare elde etmek isteyen oyuncular, oyuna bağlı olarak AMD FSR, Nvidia DLSS veya Intel XeSS gibi yükseltme teknolojilerinden kaçınılmaz olarak yararlanmak zorunda kalacaklar.
| Performance rating - Percent | |
| Sınıf ortalaması Gaming | |
| MSI Katana 17 B13VFK | |
| Lenovo LOQ 16IRH8 | |
| Dell G15 5530 | |
| HP Victus 16-r0077ng | |
| Lenovo Legion Pro 5 16ARX8 (R5 7645HX, RTX 4050) | |
| Lenovo LOQ 15IRH8 Core i7 | |
| Lenovo LOQ 15APH8 | |
| Asus TUF Gaming A16 FA617XS | |
| The Witcher 3 - 1920x1080 Ultra Graphics & Postprocessing (HBAO+) | |
| Sınıf ortalaması Gaming (104.7 - 240, n=7, son 2 yıl) | |
| HP Victus 16-r0077ng | |
| MSI Katana 17 B13VFK | |
| Dell G15 5530 | |
| Lenovo LOQ 16IRH8 | |
| Asus TUF Gaming A16 FA617XS | |
| Lenovo Legion Pro 5 16ARX8 (R5 7645HX, RTX 4050) | |
| Lenovo LOQ 15IRH8 Core i7 | |
| Lenovo LOQ 15APH8 | |
| GTA V - 1920x1080 Highest AA:4xMSAA + FX AF:16x | |
| Sınıf ortalaması Gaming (48.3 - 186.9, n=94, son 2 yıl) | |
| Lenovo LOQ 16IRH8 | |
| HP Victus 16-r0077ng | |
| MSI Katana 17 B13VFK | |
| Dell G15 5530 | |
| Lenovo Legion Pro 5 16ARX8 (R5 7645HX, RTX 4050) | |
| Lenovo LOQ 15IRH8 Core i7 | |
| Asus TUF Gaming A16 FA617XS | |
| Lenovo LOQ 15APH8 | |
| Final Fantasy XV Benchmark - 1920x1080 High Quality | |
| Sınıf ortalaması Gaming (41 - 215, n=95, son 2 yıl) | |
| HP Victus 16-r0077ng | |
| Lenovo LOQ 16IRH8 | |
| Dell G15 5530 | |
| MSI Katana 17 B13VFK | |
| Lenovo Legion Pro 5 16ARX8 (R5 7645HX, RTX 4050) | |
| Lenovo LOQ 15APH8 | |
| Asus TUF Gaming A16 FA617XS | |
| Lenovo LOQ 15IRH8 Core i7 | |
| Strange Brigade - 1920x1080 ultra AA:ultra AF:16 | |
| Sınıf ortalaması Gaming (76.3 - 458, n=87, son 2 yıl) | |
| HP Victus 16-r0077ng | |
| Dell G15 5530 | |
| Lenovo LOQ 16IRH8 | |
| MSI Katana 17 B13VFK | |
| Asus TUF Gaming A16 FA617XS | |
| Lenovo LOQ 15APH8 | |
| Lenovo Legion Pro 5 16ARX8 (R5 7645HX, RTX 4050) | |
| Lenovo LOQ 15IRH8 Core i7 | |
| Dota 2 Reborn - 1920x1080 ultra (3/3) best looking | |
| Lenovo Legion Pro 5 16ARX8 (R5 7645HX, RTX 4050) | |
| Lenovo LOQ 15IRH8 Core i7 | |
| MSI Katana 17 B13VFK | |
| Sınıf ortalaması Gaming (84.8 - 248, n=107, son 2 yıl) | |
| Lenovo LOQ 16IRH8 | |
| Dell G15 5530 | |
| HP Victus 16-r0077ng | |
| Lenovo LOQ 15APH8 | |
| Asus TUF Gaming A16 FA617XS | |
| X-Plane 11.11 - 1920x1080 high (fps_test=3) | |
| MSI Katana 17 B13VFK | |
| Dell G15 5530 | |
| Lenovo LOQ 15IRH8 Core i7 | |
| Lenovo Legion Pro 5 16ARX8 (R5 7645HX, RTX 4050) | |
| Lenovo LOQ 16IRH8 | |
| Sınıf ortalaması Gaming (55.5 - 143.5, n=109, son 2 yıl) | |
| HP Victus 16-r0077ng | |
| Lenovo LOQ 15APH8 | |
| Asus TUF Gaming A16 FA617XS | |
| The Witcher 3 - 2560x1440 Ultra Graphics & Postprocessing (HBAO+) | |
| Sınıf ortalaması Gaming (130 - 199.1, n=5, son 2 yıl) | |
| Lenovo LOQ 16IRH8 | |
| Lenovo LOQ 15IRH8 Core i7 | |
| Ortalama NVIDIA GeForce RTX 4050 Laptop GPU (39 - 61.3, n=8) | |
| Far Cry 5 | |
| 1920x1080 Ultra Preset AA:T | |
| Dell G15 5530 | |
| MSI Katana 17 B13VFK | |
| Lenovo LOQ 16IRH8 | |
| Lenovo LOQ 15IRH8 Core i7 | |
| Lenovo Legion Pro 5 16ARX8 (R5 7645HX, RTX 4050) | |
| Sınıf ortalaması Gaming (70 - 151, n=6, son 2 yıl) | |
| Asus TUF Gaming A16 FA617XS | |
| Ortalama NVIDIA GeForce RTX 4050 Laptop GPU (50 - 127, n=24) | |
| 2560x1440 Ultra Preset AA:T | |
| Sınıf ortalaması Gaming (93 - 149, n=5, son 2 yıl) | |
| Lenovo LOQ 16IRH8 | |
| MSI Katana 17 B13VFK | |
| Lenovo Legion Pro 5 16ARX8 (R5 7645HX, RTX 4050) | |
| Lenovo LOQ 15IRH8 Core i7 | |
| Ortalama NVIDIA GeForce RTX 4050 Laptop GPU (47 - 88, n=14) | |
| Cyberpunk 2077 1.6 | |
| 1920x1080 Ultra Preset | |
| Dell G15 5530 | |
| MSI Katana 17 B13VFK | |
| Lenovo LOQ 15APH8 | |
| Lenovo LOQ 15IRH8 Core i7 | |
| Ortalama NVIDIA GeForce RTX 4050 Laptop GPU (44.4 - 79.4, n=14) | |
| 2560x1440 Ultra Preset | |
| MSI Katana 17 B13VFK | |
| Lenovo LOQ 15IRH8 Core i7 | |
| Ortalama NVIDIA GeForce RTX 4050 Laptop GPU (27.2 - 43.1, n=10) | |
| 1920x1080 Ray Tracing Ultra Preset (DLSS off) | |
| Dell G15 5530 | |
| Ortalama NVIDIA GeForce RTX 4050 Laptop GPU (15.8 - 65.6, n=5) | |
| MSI Katana 17 B13VFK | |
| Lenovo LOQ 15IRH8 Core i7 | |
| F1 22 | |
| 1920x1080 Ultra High Preset AA:T AF:16x | |
| Sınıf ortalaması Gaming (40.1 - 121.2, n=4, son 2 yıl) | |
| Dell G15 5530 | |
| MSI Katana 17 B13VFK | |
| Lenovo LOQ 15IRH8 Core i7 | |
| Asus TUF Gaming A16 FA617XS | |
| Ortalama NVIDIA GeForce RTX 4050 Laptop GPU (10.9 - 56.4, n=24) | |
| 2560x1440 Ultra High Preset AA:T AF:16x | |
| Sınıf ortalaması Gaming (42 - 77.8, n=3, son 2 yıl) | |
| MSI Katana 17 B13VFK | |
| Lenovo LOQ 15IRH8 Core i7 | |
| Ortalama NVIDIA GeForce RTX 4050 Laptop GPU (6.58 - 34, n=14) | |
| F1 23 | |
| 1920x1080 Ultra High Preset AA:T AF:16x | |
| Lenovo Legion Pro 5 16ARX8 (R5 7645HX, RTX 4050) | |
| Lenovo LOQ 15IRH8 Core i7 | |
| Ortalama NVIDIA GeForce RTX 4050 Laptop GPU (25.7 - 60.8, n=14) | |
| 2560x1440 Ultra High Preset AA:T AF:16x | |
| Lenovo Legion Pro 5 16ARX8 (R5 7645HX, RTX 4050) | |
| Lenovo LOQ 15IRH8 Core i7 | |
| Ortalama NVIDIA GeForce RTX 4050 Laptop GPU (16.7 - 40.8, n=11) | |
Witcher 3 FPS Tablosu
LOQ 15'in CPU sürdürülebilir performansı (veya eksikliği) kaşları kaldırırken, dizüstü bilgisayarın soğutması, The Witcher 3 adresinde 1080p Ultra'da nispeten sabit kare hızlarının kanıtladığı gibi RTX 4050 Dizüstü Bilgisayar GPU'su için yeterli görünüyor.
| düşük | orta | yüksek | ultra | QHD | |
|---|---|---|---|---|---|
| GTA V (2015) | 185.9 | 179.7 | 168.9 | 93.2 | 66 |
| The Witcher 3 (2015) | 390 | 286 | 167.6 | 85.6 | 61.3 |
| Dota 2 Reborn (2015) | 196.3 | 178.3 | 171.1 | 162.2 | |
| Final Fantasy XV Benchmark (2018) | 192.9 | 121.2 | 84 | 60.9 | |
| X-Plane 11.11 (2018) | 159.9 | 139.8 | 110.2 | ||
| Far Cry 5 (2018) | 156 | 135 | 128 | 121 | 83 |
| Strange Brigade (2018) | 475 | 211 | 171.8 | 149.2 | 95.5 |
| Cyberpunk 2077 1.6 (2022) | 103.3 | 85.5 | 72.9 | 67.8 | 41 |
| F1 22 (2022) | 233 | 224 | 172.3 | 55 | 33.9 |
| F1 23 (2023) | 228 | 222 | 158.4 | 44.1 | 34.1 |
Emisyonlar: Yük altında yüksek yüzey sıcaklıkları
Sistem Gürültüsü
LOQ 15IRH8'in boşta çalışma sırasındaki fan gürültüsü, LOQ 15 AMD varyantında gördüğümüze büyük ölçüde benziyor, ancak ikincisinin fanları tam yük altında yaklaşık% 7 daha yüksek. Lenovo, aşağıdaki tablodan da görülebileceği gibi, seçilen güç profiline bağlı olarak fan gürültü seviyelerini belirli eşiklerin altında sınırlandırmıştır.
Performans modu yük altında 50 dB(A) sınırının hemen altında kalıyor. Sessiz mod CPU performansında önemli bir düşüşe neden olsa da, oyun oynamak Performans profiline göre nispeten daha uygun olacaktır.
Ses yüksekliği
| Boşta |
| 29.03 / 29.03 / 29.03 dB |
| Çalışırken |
| 48.7 / 48.7 dB |
 | ||
30 dB sessiz 40 dB(A) duyulabilirlik 50 dB(A) gürültülü |
||
min: | ||
| Performans modu | Rölanti dB(A) | Yük ortalama dB(A) | Yük maksimum dB(A) | Witcher 3 1080p Ultra dB(A) |
|---|---|---|---|---|
| Sessiz | 25.28 | 33.09 | 36.07 | 36.69 / 78 fps |
| Denge | 25.28 | 40.40 | 45.15 | 45.42 / 83 fps |
| Performans | 29.03 | 48.72 | 48.71 | 48.52 / 85 fps |
| Lenovo LOQ 15IRH8 Core i7 i7-13620H, GeForce RTX 4050 Laptop GPU | Lenovo LOQ 16IRH8 i7-13620H, GeForce RTX 4060 Laptop GPU | Lenovo LOQ 15APH8 R7 7840HS, GeForce RTX 4050 Laptop GPU | MSI Katana 17 B13VFK i7-13620H, GeForce RTX 4060 Laptop GPU | Lenovo Legion Pro 5 16ARX8 (R5 7645HX, RTX 4050) R5 7645HX, GeForce RTX 4050 Laptop GPU | HP Victus 16-r0077ng i7-13700H, GeForce RTX 4070 Laptop GPU | Dell G15 5530 i7-13650HX, GeForce RTX 4060 Laptop GPU | Asus TUF Gaming A16 FA617XS R9 7940HS, Radeon RX 7600S | |
|---|---|---|---|---|---|---|---|---|
| Noise | 3% | 9% | -6% | 14% | 2% | 12% | 3% | |
| kapalı / ortam * (dB) | 23.69 | 23 3% | 23.1 2% | 24.5 -3% | 23 3% | 25 -6% | 20.41 14% | 25 -6% |
| Idle Minimum * (dB) | 29.03 | 23 21% | 23.1 20% | 24.5 16% | 23 21% | 28 4% | 26.85 8% | 25 14% |
| Idle Average * (dB) | 29.03 | 23 21% | 23.1 20% | 24.5 16% | 23 21% | 29 -0% | 26.85 8% | 26 10% |
| Idle Maximum * (dB) | 29.03 | 27.66 5% | 25.2 13% | 40 -38% | 24.42 16% | 30 -3% | 26.85 8% | 28 4% |
| Load Average * (dB) | 48.7 | 53.62 -10% | 44.3 9% | 48.3 1% | 34.94 28% | 43 12% | 27.65 43% | 43 12% |
| Witcher 3 ultra * (dB) | 48.5 | 53.5 -10% | 45.8 6% | 56 -15% | 43.79 10% | 46 5% | 47.9 1% | 51 -5% |
| Load Maximum * (dB) | 48.7 | 53.5 -10% | 52 -7% | 59.1 -21% | 50 -3% | 48 1% | 47.86 2% | 53 -9% |
* ... daha küçük daha iyidir
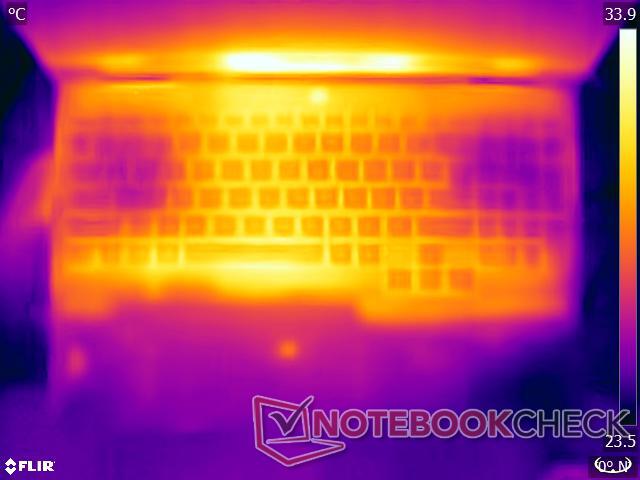
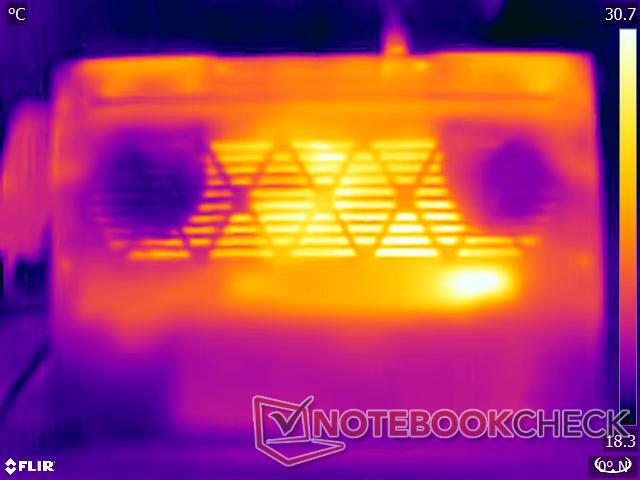
Sıcaklık
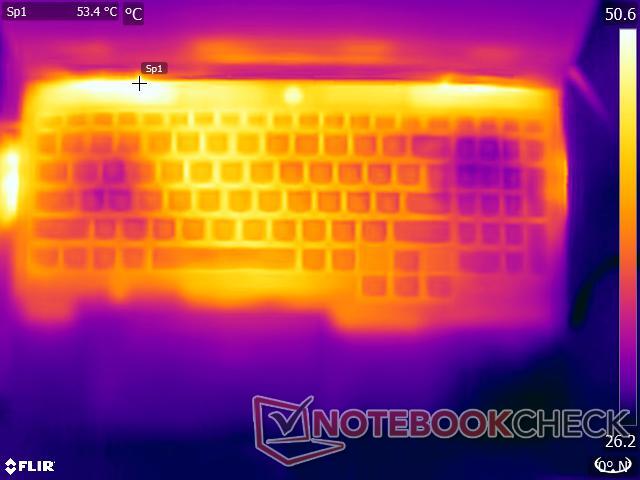
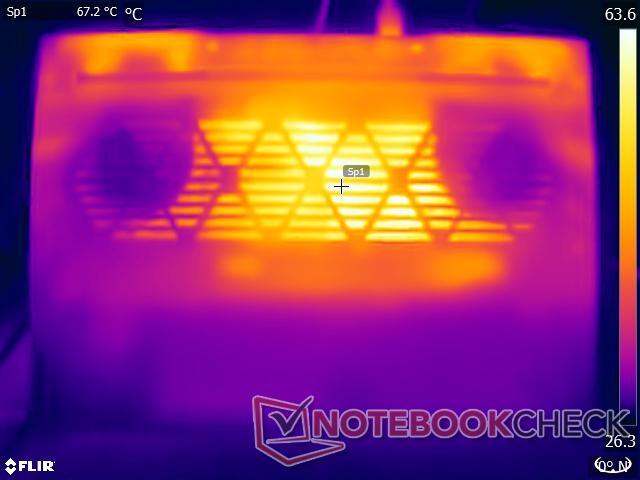
Performans profilinde stres yaparken yüzey sıcaklıkları, özellikle kasanın alt tarafı oldukça ısınabilir. Stres testlerimiz aşırı senaryoları temsil etse de, bu cihazı hafif kullanım dışında herhangi bir şey için kucağınızda kullanmanızı önermiyoruz.
(-) Üst taraftaki maksimum sıcaklık, 40.4 °C / 105 F ortalamasına kıyasla 46.4 °C / 116 F'dir. , Gaming sınıfı için 21.2 ile 68.8 °C arasında değişir.
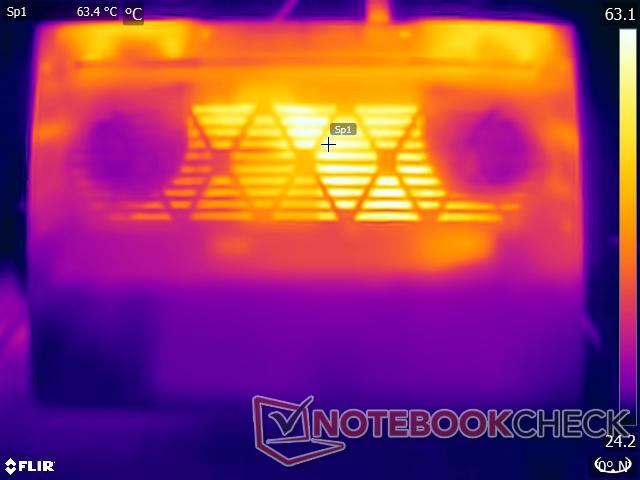
(-) Alt kısım, 43.2 °C / 110 F ortalamasına kıyasla maksimum 59.2 °C / 139 F'ye kadar ısınır
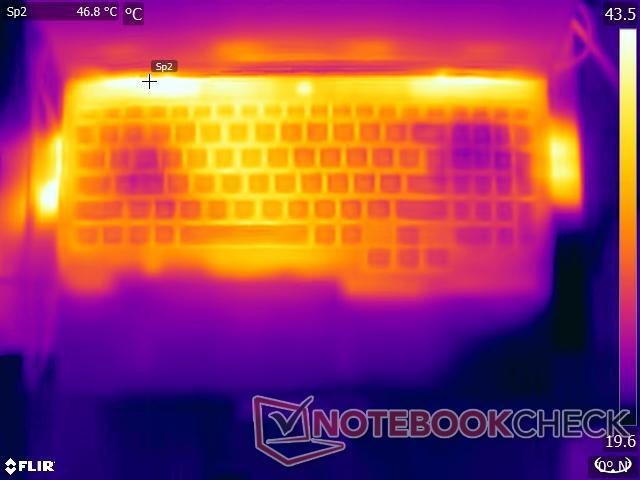
(±) Boşta kullanımda, üst tarafın ortalama sıcaklığı 32.7 °C / 91 F olup, cihazın 33.9 °C / 93 F.
(-) The Witcher 3 oynarken, üst tarafın ortalama sıcaklığı 39.4 °C / 103 F olup, cihazın 33.9 °C / 93 F.
(+) Avuç içi dayanakları ve dokunmatik yüzey maksimum (34 °C / 93.2 F) cilt sıcaklığına ulaşıyor ve bu nedenle sıcak değil.
(-) Benzer cihazların avuç içi dayanağı alanının ortalama sıcaklığı 28.8 °C / 83.8 F (-5.2 °C / -9.4 F) idi.
| Lenovo LOQ 15IRH8 Core i7 Intel Core i7-13620H, NVIDIA GeForce RTX 4050 Laptop GPU | Lenovo LOQ 16IRH8 Intel Core i7-13620H, NVIDIA GeForce RTX 4060 Laptop GPU | Lenovo LOQ 15APH8 AMD Ryzen 7 7840HS, NVIDIA GeForce RTX 4050 Laptop GPU | MSI Katana 17 B13VFK Intel Core i7-13620H, NVIDIA GeForce RTX 4060 Laptop GPU | Lenovo Legion Pro 5 16ARX8 (R5 7645HX, RTX 4050) AMD Ryzen 5 7645HX, NVIDIA GeForce RTX 4050 Laptop GPU | HP Victus 16-r0077ng Intel Core i7-13700H, NVIDIA GeForce RTX 4070 Laptop GPU | Dell G15 5530 Intel Core i7-13650HX, NVIDIA GeForce RTX 4060 Laptop GPU | Asus TUF Gaming A16 FA617XS AMD Ryzen 9 7940HS, AMD Radeon RX 7600S | |
|---|---|---|---|---|---|---|---|---|
| Heat | 10% | 13% | 11% | 1% | 3% | -3% | 9% | |
| Maximum Upper Side * (°C) | 46.4 | 48 -3% | 44.4 4% | 41.6 10% | 45 3% | 51 -10% | 54 -16% | 53 -14% |
| Maximum Bottom * (°C) | 59.2 | 59 -0% | 52 12% | 43.1 27% | 54 9% | 54 9% | 62.2 -5% | 48 19% |
| Idle Upper Side * (°C) | 34.4 | 28 19% | 28 19% | 32 7% | 36 -5% | 37 -8% | 33.4 3% | 30 13% |
| Idle Bottom * (°C) | 36.2 | 28 23% | 29.6 18% | 35.8 1% | 38 -5% | 29 20% | 33.4 8% | 30 17% |
* ... daha küçük daha iyidir
Stres Testi
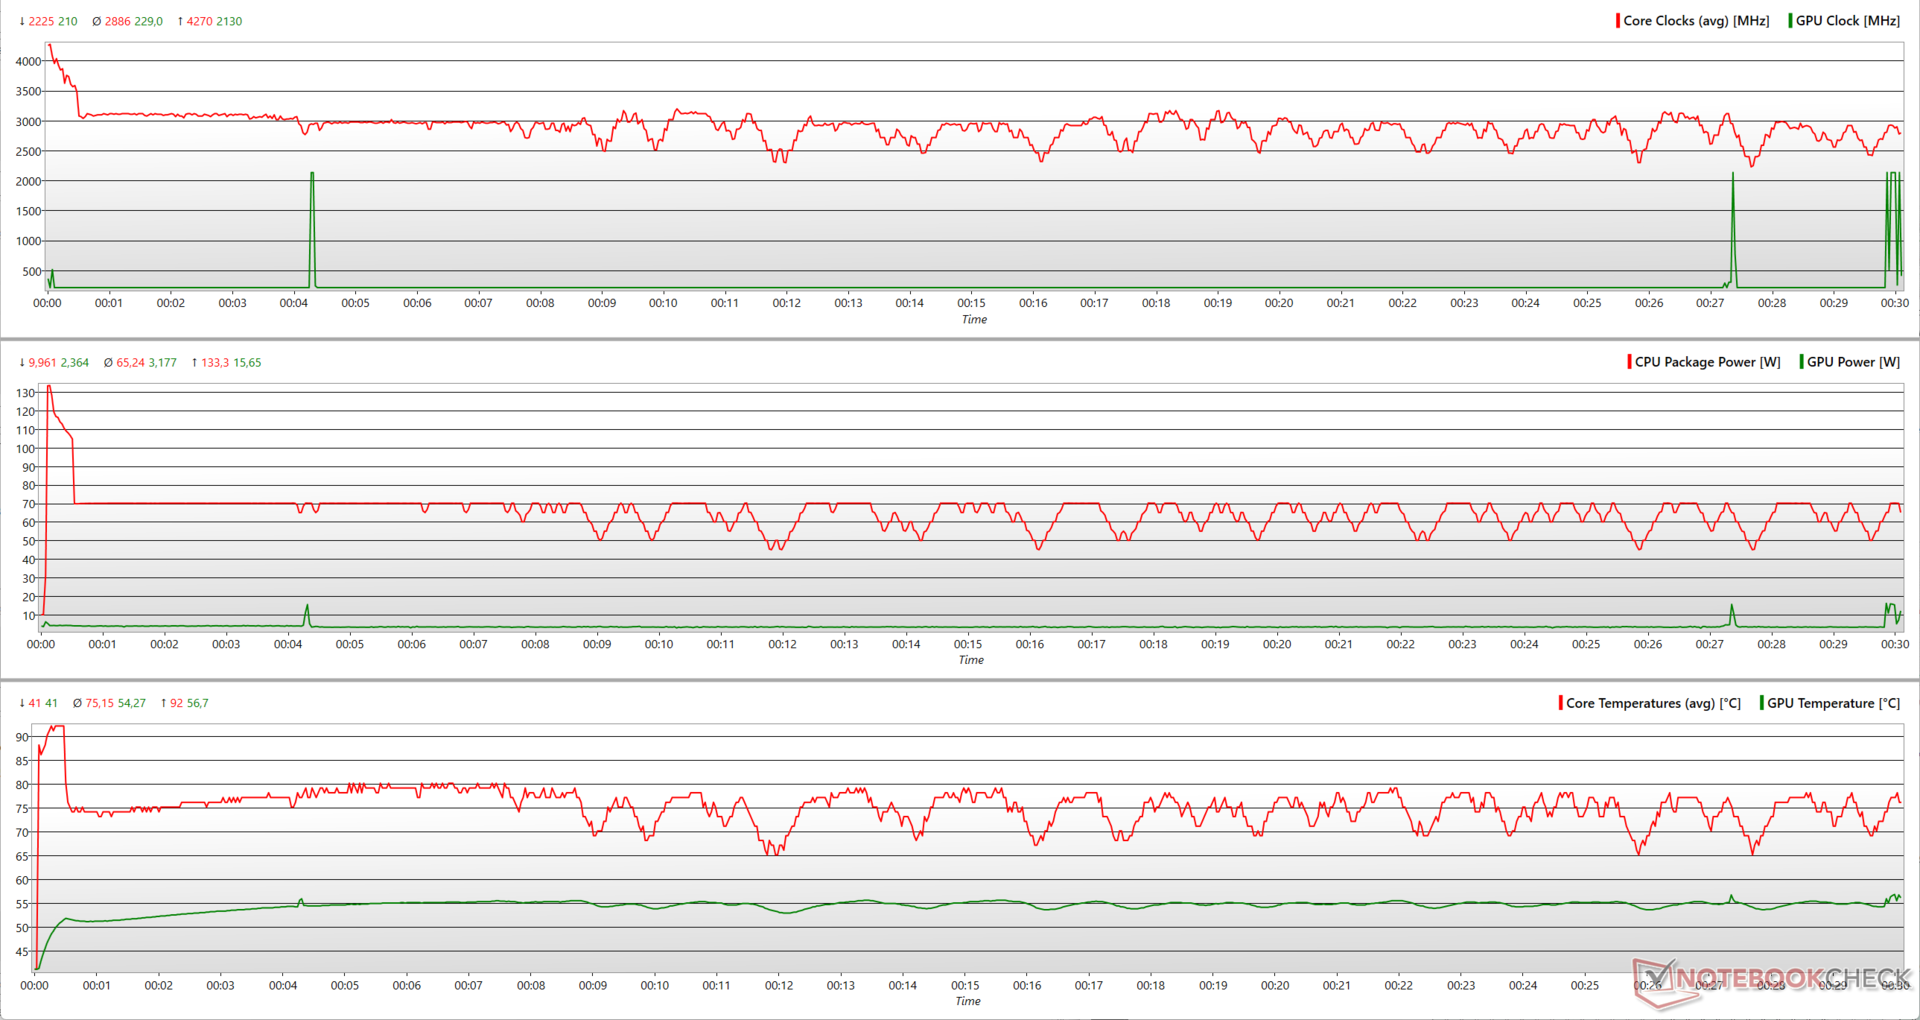
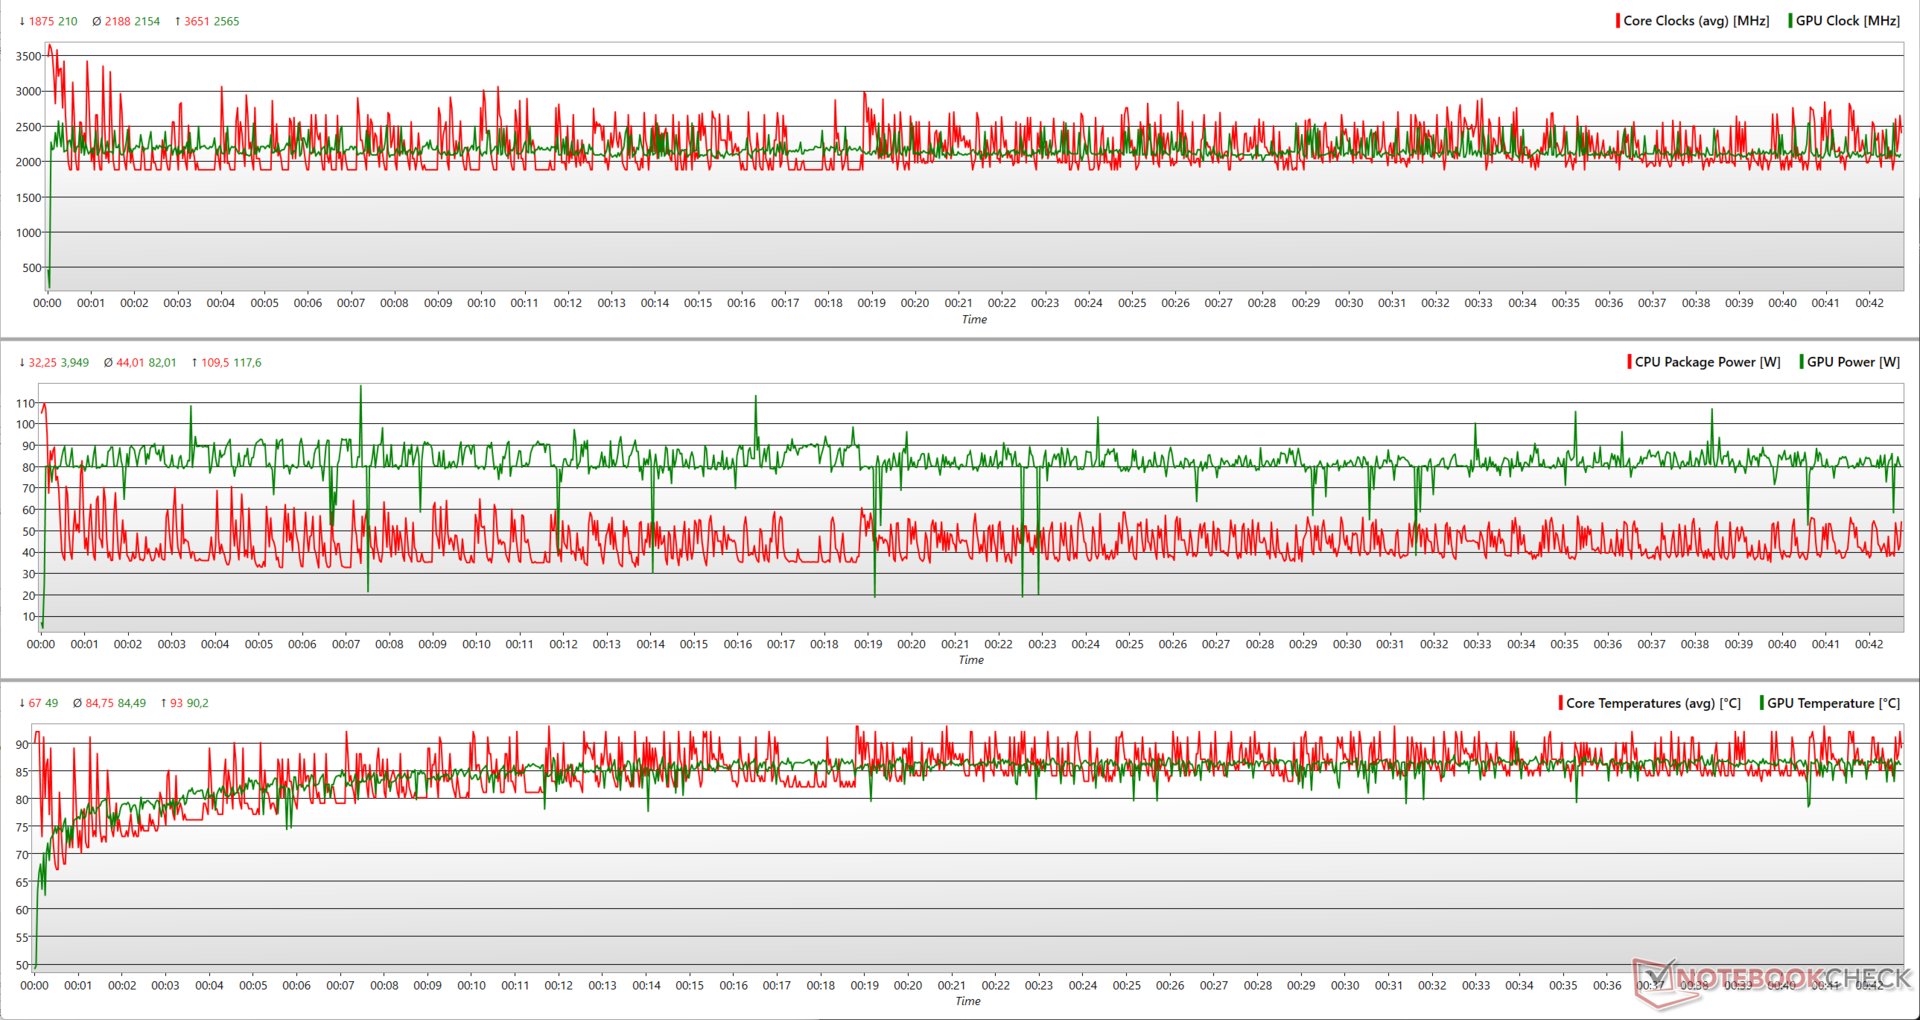
Daha önce Cinebench R15 çok çekirdekli döngü testinde gördüğümüzün aksine, LOQ 15'i Prime95 yerinde büyük FFT'lerle zorladığımızda Core i7-13620H'nin sonunda 4,27 GHz maksimum saat ile 133 W'a ulaşabildiğini görüyoruz. Ancak, işlemci sonunda ortalama 65 W paket gücüne yerleştiği için bu kısa ömürlüdür.
Birleştirilmiş Prime95 ve FurMark stresi, RTX 4050'nin maksimum 2,565 MHz saat ile 117 W'a kadar kullanabileceğini göstermektedir. Core i7-13620H, RTX 4050 ile termal ve güç boşluğunu paylaşmak zorunda olduğu için 3,6 GHz'lik bir tepe artışıyla mücadele etmek zorundadır.
| Stres Testi | CPU Saati (GHz) | GPU Saati (MHz) | Ortalama CPU Sıcaklığı (°C) | Ortalama GPU Sıcaklığı (°C) |
| Sistem Boşta | 4,3 | 210 | 37 | 38,4 |
| Prime95 | 4,8 | 210 | 75 | 54,2 |
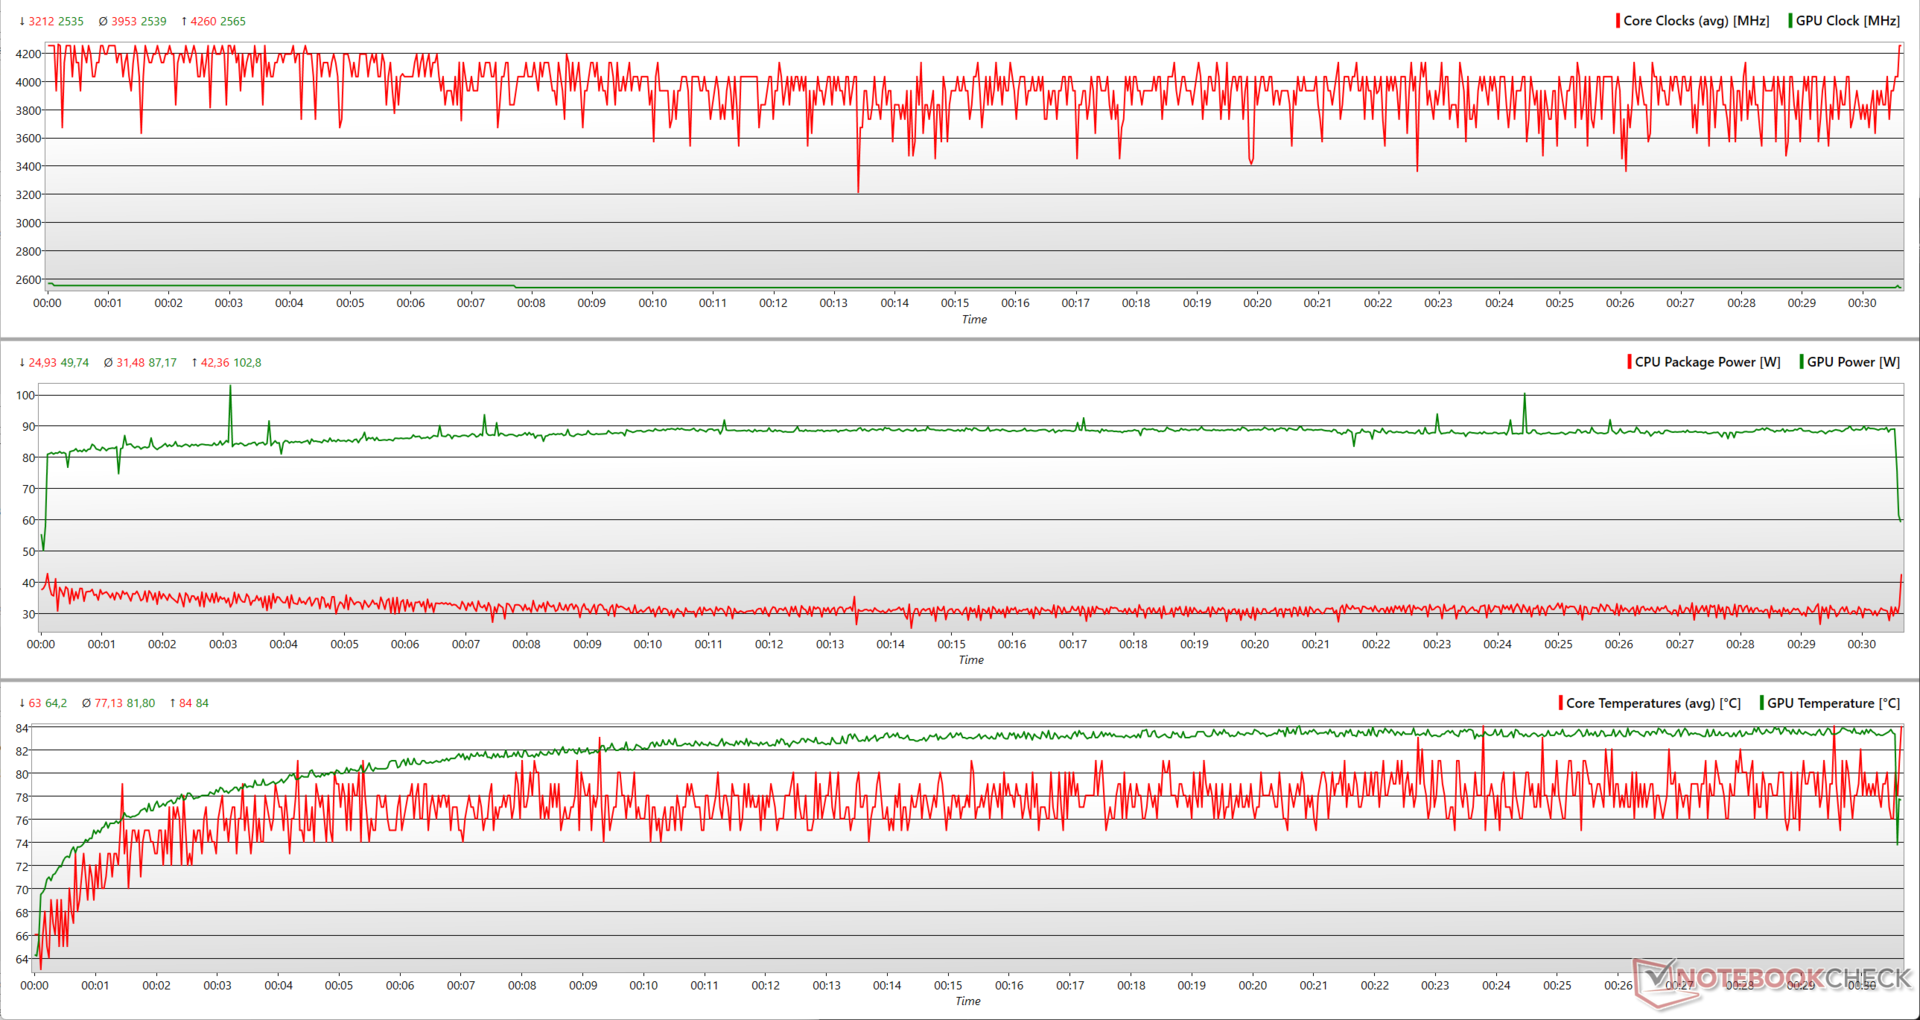
| Prime95 + FurMark | 3.2 | 2,220 | 77 | 79.7 |
| Witcher 3 1080p Ultra | 4,8 | 2.535 | 76 | 80,5 |
The Witcher 3 1080p Ultra stres testinde, RTX 4050 aynı 2.565 MHz saate ulaşabiliyor, ancak 103 W'lık çok daha düşük bir maksimum TGP'de. Bu, Core i7-13620H'nin 4,26 GHz'lik maksimum destek için 42 W'a kadar kullanması için biraz nefes alma alanı sağlıyor.
Konuşmacılar
LOQ 15IRH8'in hoparlörleri iyi bir ses yüksekliğine sahip. Baslar çok derin değil, ancak orta ve yüksek sesler yeterince üretiliyor. Kullanıcılar kablolu hoparlörler veya Bluetooth 5.2 ile daha iyi bir ses çıkışı elde edebilirler.
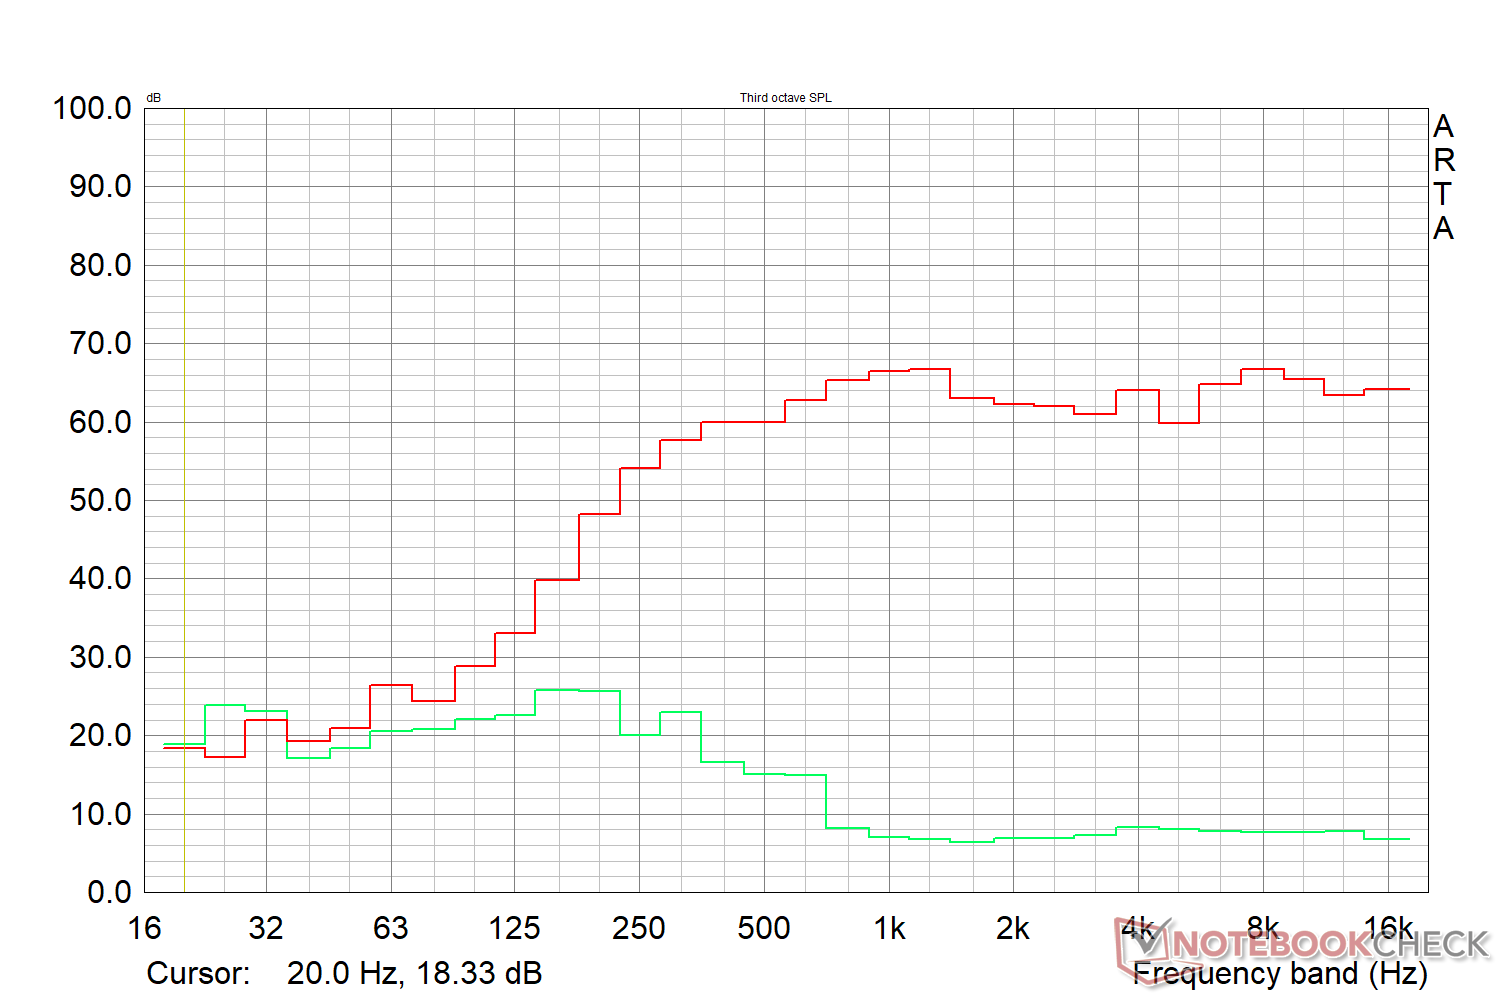
Lenovo LOQ 15IRH8 Core i7 ses analizi
(±) | hoparlör ses yüksekliği ortalama ama iyi (75.9 dB)
Bas 100 - 315Hz
(-) | neredeyse hiç bas yok - ortalama olarak medyandan 18.6% daha düşük
(±) | Bas doğrusallığı ortalamadır (10.2% delta - önceki frekans)
Ortalar 400 - 2000 Hz
(+) | dengeli ortalar - medyandan yalnızca 2.2% uzakta
(+) | orta frekanslar doğrusaldır (3.1% deltadan önceki frekansa)
Yüksekler 2 - 16 kHz
(+) | dengeli yüksekler - medyandan yalnızca 2.3% uzakta
(+) | yüksekler doğrusaldır (4.4% deltadan önceki frekansa)
Toplam 100 - 16.000 Hz
(+) | genel ses doğrusaldır (13.7% ortancaya göre fark)
Aynı sınıfla karşılaştırıldığında
» Bu sınıftaki tüm test edilen cihazların %21%'si daha iyi, 7% benzer, 72% daha kötüydü
» En iyisinin deltası 6% idi, ortalama 18% idi, en kötüsü 132% idi
Test edilen tüm cihazlarla karşılaştırıldığında
» Test edilen tüm cihazların %15'si daha iyi, 4 benzer, % 81 daha kötüydü
» En iyisinin deltası 4% idi, ortalama 23% idi, en kötüsü 134% idi
Apple MacBook Pro 16 2021 M1 Pro ses analizi
(+) | hoparlörler nispeten yüksek sesle çalabilir (84.7 dB)
Bas 100 - 315Hz
(+) | iyi bas - medyandan yalnızca 3.8% uzakta
(+) | bas doğrusaldır (5.2% delta ile önceki frekans)
Ortalar 400 - 2000 Hz
(+) | dengeli ortalar - medyandan yalnızca 1.3% uzakta
(+) | orta frekanslar doğrusaldır (2.1% deltadan önceki frekansa)
Yüksekler 2 - 16 kHz
(+) | dengeli yüksekler - medyandan yalnızca 1.9% uzakta
(+) | yüksekler doğrusaldır (2.7% deltadan önceki frekansa)
Toplam 100 - 16.000 Hz
(+) | genel ses doğrusaldır (4.6% ortancaya göre fark)
Aynı sınıfla karşılaştırıldığında
» Bu sınıftaki tüm test edilen cihazların %0%'si daha iyi, 0% benzer, 100% daha kötüydü
» En iyisinin deltası 5% idi, ortalama 17% idi, en kötüsü 45% idi
Test edilen tüm cihazlarla karşılaştırıldığında
» Test edilen tüm cihazların %0'si daha iyi, 0 benzer, % 100 daha kötüydü
» En iyisinin deltası 4% idi, ortalama 23% idi, en kötüsü 134% idi
Enerji Yönetimi: AMD varyantı daha ekonomik görünüyor
Güç Tüketimi
Yük altında güç tüketimi genel olarak rakiplerine kıyasla daha düşüktür. Ekran farklılıklarına rağmen, Ryzen 7 7840HS ile çalışan LOQ 15APH8, Intel tabanlı LOQ 15IRH8 ünitemize göre genel güç tüketiminde yaklaşık %18 daha ekonomiktir.
Tamamı AMD Asus TUF Gaming A16 genel olarak en tutumlu olanıdır, ancak yük tüketimi LOQ 15IRH8 ile karşılaştırılabilir aralıktadır. Maksimum yük altında güç tüketimi, tedarik edilen şarj cihazının 170 W değerini aşıyor.
| Kapalı / Bekleme modu | |
| Boşta | |
| Çalışırken |
|
Key:
min: | |
| Lenovo LOQ 15IRH8 Core i7 i7-13620H, GeForce RTX 4050 Laptop GPU, IPS, 2560x1440, 15.6" | Lenovo LOQ 16IRH8 i7-13620H, GeForce RTX 4060 Laptop GPU, IPS, 2560x1600, 16" | Lenovo LOQ 15APH8 R7 7840HS, GeForce RTX 4050 Laptop GPU, IPS, 1920x1080, 15.6" | MSI Katana 17 B13VFK i7-13620H, GeForce RTX 4060 Laptop GPU, IPS LED, 1920x1080, 17.3" | Lenovo Legion Pro 5 16ARX8 (R5 7645HX, RTX 4050) R5 7645HX, GeForce RTX 4050 Laptop GPU, IPS, 2560x1600, 16" | HP Victus 16-r0077ng i7-13700H, GeForce RTX 4070 Laptop GPU, IPS, 1920x1080, 16.1" | Dell G15 5530 i7-13650HX, GeForce RTX 4060 Laptop GPU, IPS, 1920x1080, 15.6" | Asus TUF Gaming A16 FA617XS R9 7940HS, Radeon RX 7600S, IPS, 1920x1200, 16" | Ortalama NVIDIA GeForce RTX 4050 Laptop GPU | Sınıf ortalaması Gaming | |
|---|---|---|---|---|---|---|---|---|---|---|
| Power Consumption | 6% | 18% | 19% | 15% | 20% | 12% | 31% | 25% | 2% | |
| Idle Minimum * (Watt) | 18.52 | 17.2 7% | 15 19% | 12.2 34% | 13 30% | 8 57% | 8.4 55% | 7 62% | 9.95 ? 46% | 13 ? 30% |
| Idle Average * (Watt) | 22.54 | 19.3 14% | 17.7 21% | 14.9 34% | 17.4 23% | 13 42% | 14.98 34% | 10 56% | 15.8 ? 30% | 19 ? 16% |
| Idle Maximum * (Watt) | 29.79 | 21.2 29% | 21.5 28% | 15.8 47% | 21.8 27% | 22 26% | 15.56 48% | 15 50% | 20.1 ? 33% | 24.6 ? 17% |
| Load Average * (Watt) | 94.5 | 90 5% | 73.5 22% | 85.22 10% | 96.4 -2% | 86 9% | 96.8 -2% | 86 9% | 88 ? 7% | 110.7 ? -17% |
| Witcher 3 ultra * (Watt) | 154.4 | 168 -9% | 138.6 10% | 151.1 2% | 125 19% | 141.8 8% | 186 -20% | 160.6 -4% | ||
| Load Maximum * (Watt) | 190.4 | 211 -11% | 176.5 7% | 212.8 -12% | 204 -7% | 233 -22% | 271.42 -43% | 172 10% | 176.3 ? 7% | 259 ? -36% |
* ... daha küçük daha iyidir
Power Consumption: The Witcher 3 / Stress test
Power Consumption: External Monitor
Pil Ömrü
Pil çalışma süreleri LOQ 16IRH8 ile gözlemlediklerimize benzer. LOQ 15APH8'in güç tüketimi kazanımları, LOQ 15IRH8'e kıyasla %25 daha uzun pil ömrü anlamına geliyor.
Birlikte verilen 170 W güç adaptörü, Lenovo Vantage uygulamasında etkinleştirilebilen Rapid Charge hızlı şarjı destekliyor. Bu, cihazın yaklaşık 45 dakika içinde sıfırdan %100'e şarj edilmesini sağlar.
| Lenovo LOQ 15IRH8 Core i7 i7-13620H, GeForce RTX 4050 Laptop GPU, 60 Wh | Lenovo LOQ 16IRH8 i7-13620H, GeForce RTX 4060 Laptop GPU, 80 Wh | Lenovo LOQ 15APH8 R7 7840HS, GeForce RTX 4050 Laptop GPU, 60 Wh | MSI Katana 17 B13VFK i7-13620H, GeForce RTX 4060 Laptop GPU, 53.5 Wh | Lenovo Legion Pro 5 16ARX8 (R5 7645HX, RTX 4050) R5 7645HX, GeForce RTX 4050 Laptop GPU, 80 Wh | HP Victus 16-r0077ng i7-13700H, GeForce RTX 4070 Laptop GPU, 83 Wh | Dell G15 5530 i7-13650HX, GeForce RTX 4060 Laptop GPU, 86 Wh | Asus TUF Gaming A16 FA617XS R9 7940HS, Radeon RX 7600S, 90 Wh | Sınıf ortalaması Gaming | |
|---|---|---|---|---|---|---|---|---|---|
| Pil Çalışma Süresi | 6% | 25% | -51% | -8% | 20% | 11% | 107% | 29% | |
| H.264 (h) | 6.1 | 6.4 5% | 5.4 -11% | 6.8 11% | 12.4 103% | 8.32 ? 36% | |||
| WiFi v1.3 (h) | 5.9 | 6.3 7% | 7.4 25% | 2.9 -51% | 5.6 -5% | 7.1 20% | 6.5 10% | 12.4 110% | 7.11 ? 21% |
| Load (h) | 1.5 | 1.1 | 1 | 0.8 | 0.9 | 1.502 ? | |||
| Reader / Idle (h) | 9.8 | 20.3 | 8.27 ? | ||||||
| Witcher 3 ultra (h) | 0.8 | 0.8 |
Artılar
Eksiler
Karar: Bütçeyi sarsmayan 1080p Ultra oyun deneyimi
LOQ 15 Core i7, düşük maliyetine rağmen 165 Hz QHD G-Sync ekrana ve 1080p web kamerasına sahiptir. QHD panel, özellikle FHD 144 Hz seçeneğine göre önemli ölçüde iyileştirilmiş renk ve tepki süreleri ile etkileyicidir.
Yapı kalitesi anlaşılabilir bir şekilde bol plastikten muzdarip. LOQ 15IRH8'in Core i7-13620H'sinin, AMD Ryzen 7 7840HS tabanlı modellerde gördüğümüzün aksine performansını sürdürmekte zorlanması daha da endişe verici LOQ 15APH8 ya da hatta LOQ 16IRH8.
Bununla birlikte, Intel i7-13620H işlemci ve nominal TGP'sinden daha fazlasını kullanabilen RTX 4050 grafikler sayesinde performans, akıcı 1080p oyun için yeterlidir.
Lenovo LOQ 15 Core i7 çoğu kutuyu işaretler ve 1.200 ABD Doları veya ₹ 1.00.00 işareti civarında yetenekli bir 1080p oyun dizüstü bilgisayarı arıyorsanız yüksek bir değerlendirmeyi hak eder. Bununla birlikte, yapı kalitesi ve ısı emisyonları açısından beklentilerin ölçülü olması gerekir."
Intel tabanlı LOQ 15'in hayal kırıklığına uğrattığı bir diğer alan da ısı emisyonlarıdır. Buna karşılık, fan gürültüsü seviyeleri yönetilebilir ve düşük güç profillerinde bile 1080p'de yeterince oyun oynamak mümkündür.
Intel ve AMD destekli LOQ 15 SKU'ları arasında seçim yapmak önceliklere bağlıdır. Intel versiyonu 1080p'de daha iyi oyun performansı ve yük altında daha düşük fan gürültüsü sağlıyor. Ancak AMD varyantı genel CPU performansında daha avantajlı, daha soğuk çalışıyor, daha güç tasarruflu ve daha iyi pil ömrüne sahip.
Bununla birlikte, hem LOQ 15 varyantları hem de LOQ 15'e kıyasla güçlü bir değer sunmaktadır Legion Pro 5 16. Dizüstü bilgisayarlar gibi HP Victus 16 ve MSI Katana 17 listelerde belirgin bir şekilde daha iyi ücret alıyor, ancak fiyatları LOQ 15'e göre sunulan donanımla iyi ölçeklenmiyor gibi görünüyor.
Fiyat ve Bulunabilirlik
LOQ 15 Core i7, FHD 144 Hz varyantı için ₹97,790'dan başlıyor ve doğrudan Lenovo India adresinden satın alınabiliyor. Web sitesi şu anda test edilen QHD varyantının kullanılabilirliğini listelemiyor.
Amazon Hindistan'ın stoklarında şu anda ₹2,25,766'da listelenen Core i7-13700H ve RTX 4060'a sahip LOQ 16IRH8 dışında çoğu LOQ 15 varyantı bulunmuyor.
Lenovo ABD ayrıca çeşitli Nvidia GPU seçeneklerine sahip bir dizi Intel 13. nesil LOQ 15'e sahip. Best Buy, Core i5-13420H ve RTX 3050 grafiklerle güçlendirilmiş bir LOQ 15'i 650 ABD Doları karşılığında sunuyor. Amazon ABD 'de RTX 4050'li bir model 1.227 ABD dolarına satılıyor. RTX 4050'li bir Ryzen 7 7840HS seçeneği de Best Buy 'da 1.240 ABD Doları karşılığında mevcuttur.
Lenovo LOQ 15IRH8 Core i7
- 10/13/2023 v7 (old)
Vaidyanathan Subramaniam
Şeffaflık
İncelenecek cihazların seçimi editör ekibimiz tarafından yapılır. Test örneği, bu incelemenin amacı doğrultusunda üretici veya perakendeci tarafından yazara ödünç olarak sağlanmıştır. Borç verenin bu inceleme üzerinde herhangi bir etkisi olmadığı gibi, üretici de yayınlanmadan önce bu incelemenin bir kopyasını almamıştır. Bu incelemeyi yayınlama zorunluluğu yoktu. Bağımsız bir medya şirketi olarak Notebookcheck, üreticilerin, perakendecilerin veya yayıncıların otoritesine tabi değildir.
Notebookcheck bu şekilde test yapıyor
Notebookcheck, tüm sonuçların karşılaştırılabilir olmasını sağlamak için her yıl yüzlerce dizüstü bilgisayarı ve akıllı telefonu standart prosedürler kullanarak bağımsız olarak inceliyor. Yaklaşık 20 yıldır test yöntemlerimizi sürekli olarak geliştirdik ve bu süreçte endüstri standartlarını belirledik. Test laboratuvarlarımızda deneyimli teknisyenler ve editörler tarafından yüksek kaliteli ölçüm ekipmanları kullanılmaktadır. Bu testler çok aşamalı bir doğrulama sürecini içerir. Karmaşık derecelendirme sistemimiz, nesnelliği koruyan yüzlerce sağlam temellere dayanan ölçüm ve kıyaslamaya dayanmaktadır.Price comparison

