Lenovo LOQ 15 incelemesi: RTX 4060'lı FHD oyun dizüstü bilgisayarı yaklaşık 1.000 ABD Doları
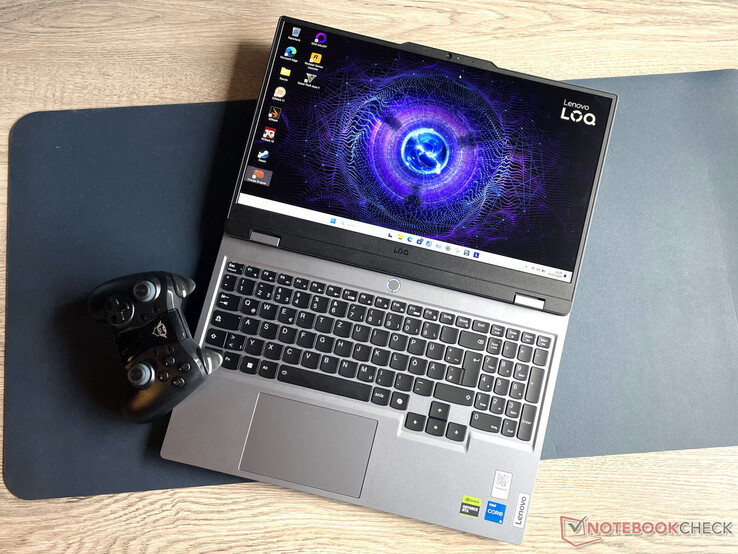
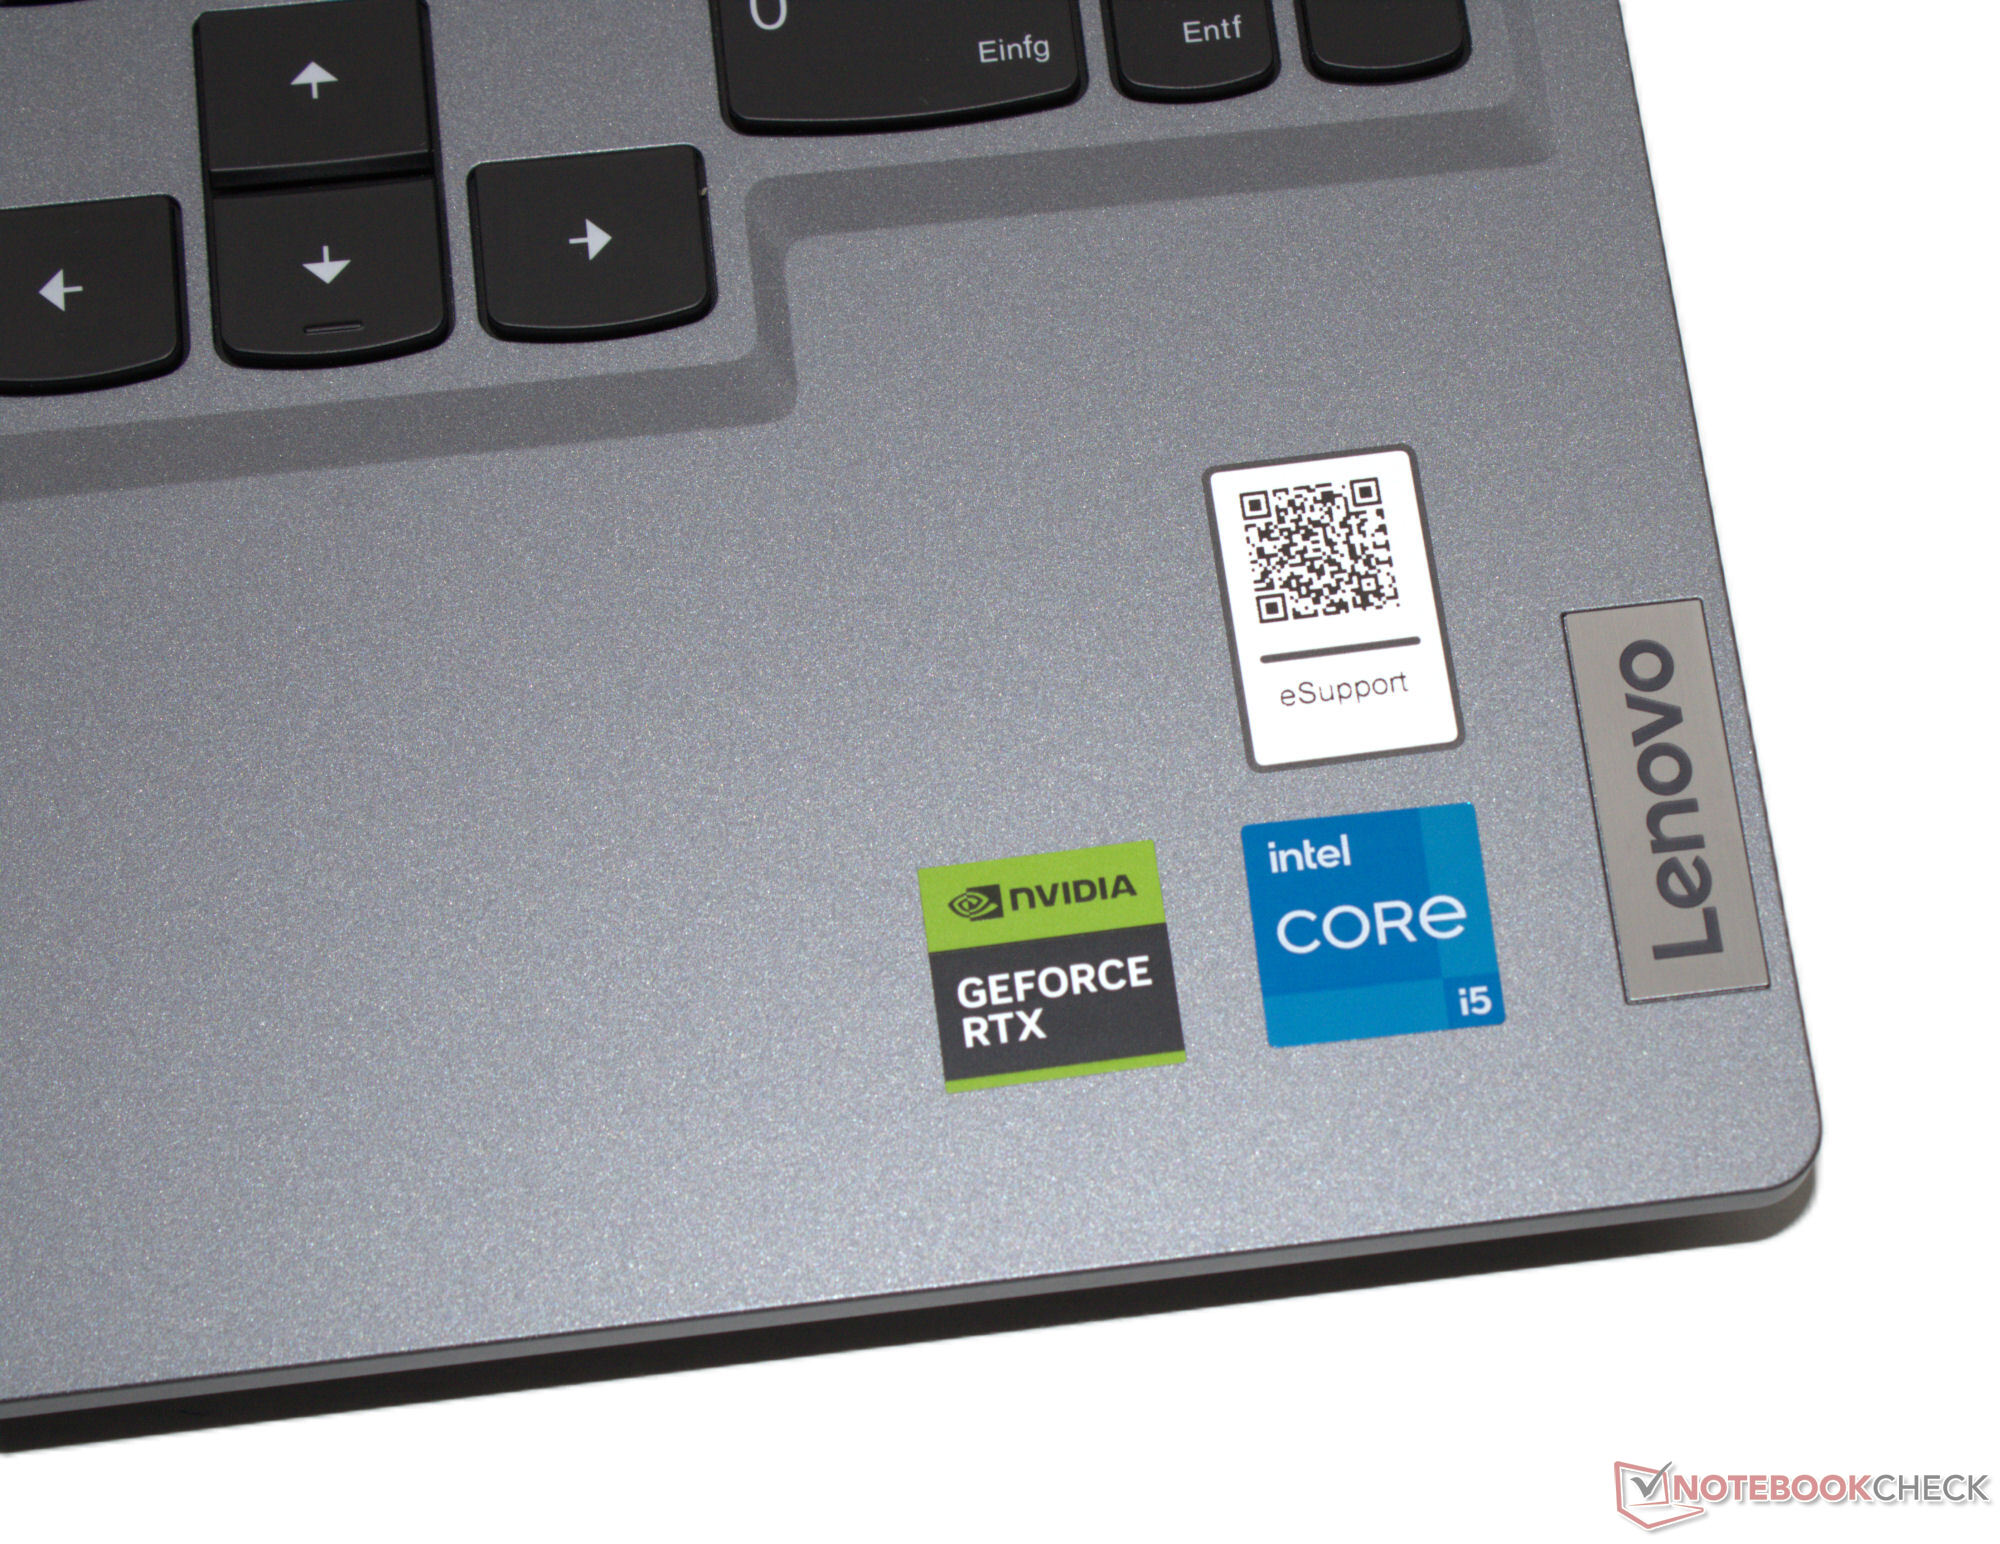
Lenovo'nun kataloğunda LOQ serisi ekonomik oyun dizüstü bilgisayarlarından oluşuyor. Mevcut test cihazı bu kategoriye sorunsuz bir şekilde uymaktadır: Üretici, Core i5 işlemci, GeForce RTX 4060, 16 GB RAM ve 1 TB SSD'den oluşan bu paket için 1.000 ABD dolarının biraz üzerinde (Windows olmadan) veya 1.300 ABD doları (Windows 11 ile) talep ediyor. Dizüstü bilgisayarın fiyat etiketi, plastik bir kasaya, nispeten düşük pil kapasitesine ve Thunderbolt 4 veya USB 4'e sahip olmamasına neden oluyor. Rakipleri arasında şu gibi cihazlar var Gigabyte G6X 9KG (2024), Dell G16, XMG Core 15 (M24) ya da HP Victus 16 (2024).
Lenovo LOQ 15IRX9'un kasası, daha önce test ettiğimiz kardeş modelleriyle aynı şekilde üretilmemiştir (Ryzen 7/RTX 4050, Core i7/RTX 4050).
Karşılaştırmalı olarak olası rakipler
Derecelendirme | Sürüm | Tarih | Modeli | Ağırlık | Yükseklik | Boyut | Çözünürlük | Fiyat |
|---|---|---|---|---|---|---|---|---|
| 79 % | v8 | 07/2024 | Lenovo LOQ 15IRX9 i5-13450HX, GeForce RTX 4060 Laptop GPU | 2.4 kg | 23.9 mm | 15.60" | 1920x1080 | |
| 83.7 % | v8 | 06/2024 | Schenker XMG Core 15 (M24) R7 8845HS, GeForce RTX 4060 Laptop GPU | 2.1 kg | 21.9 mm | 15.30" | 2560x1600 | |
| 83.2 % v7 (old) | v7 (old) | 03/2024 | Gigabyte G6X 9KG (2024) i7-13650HX, GeForce RTX 4060 Laptop GPU | 2.6 kg | 25.1 mm | 16.00" | 1920x1200 | |
| 84.3 % v7 (old) | v7 (old) | 05/2024 | HP Victus 16 (2024) i7-14700HX, GeForce RTX 4060 Laptop GPU | 2.4 kg | 23.9 mm | 16.10" | 1920x1080 | |
| 85.5 % v7 (old) | v7 (old) | 02/2024 | Dell G16, i7-13650HX, RTX 4060 i7-13650HX, GeForce RTX 4060 Laptop GPU | 2.8 kg | 25.65 mm | 16.00" | 2560x1600 |
Lütfen dikkat: Derecelendirme sistemimizi yakın zamanda güncelledik ve 8. sürümün sonuçları 7. sürümün sonuçlarıyla karşılaştırılabilir değildir. Daha fazla bilgi için burada .
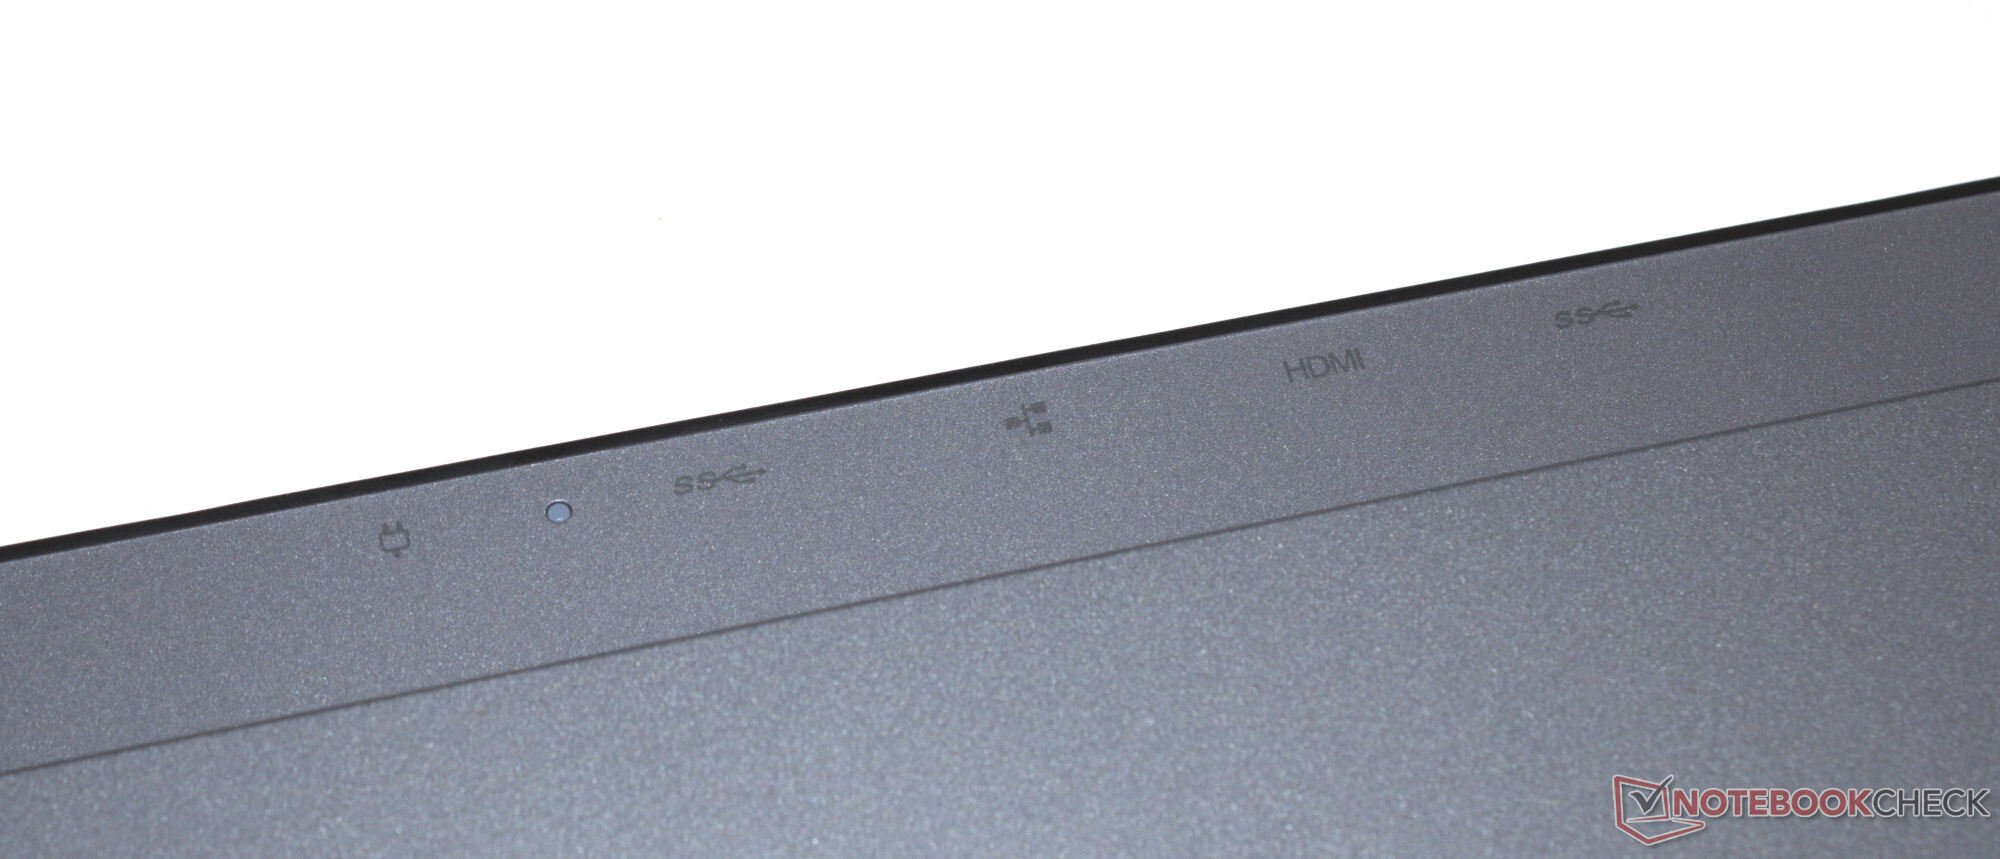
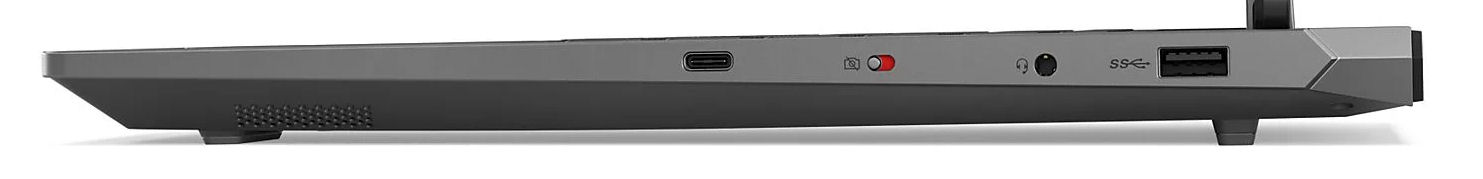
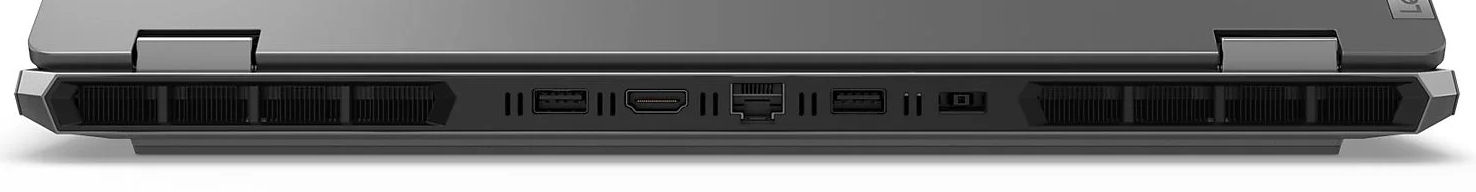
Kasa ve bağlantı - USB 4'süz ancak Power Delivery özellikli LOQ
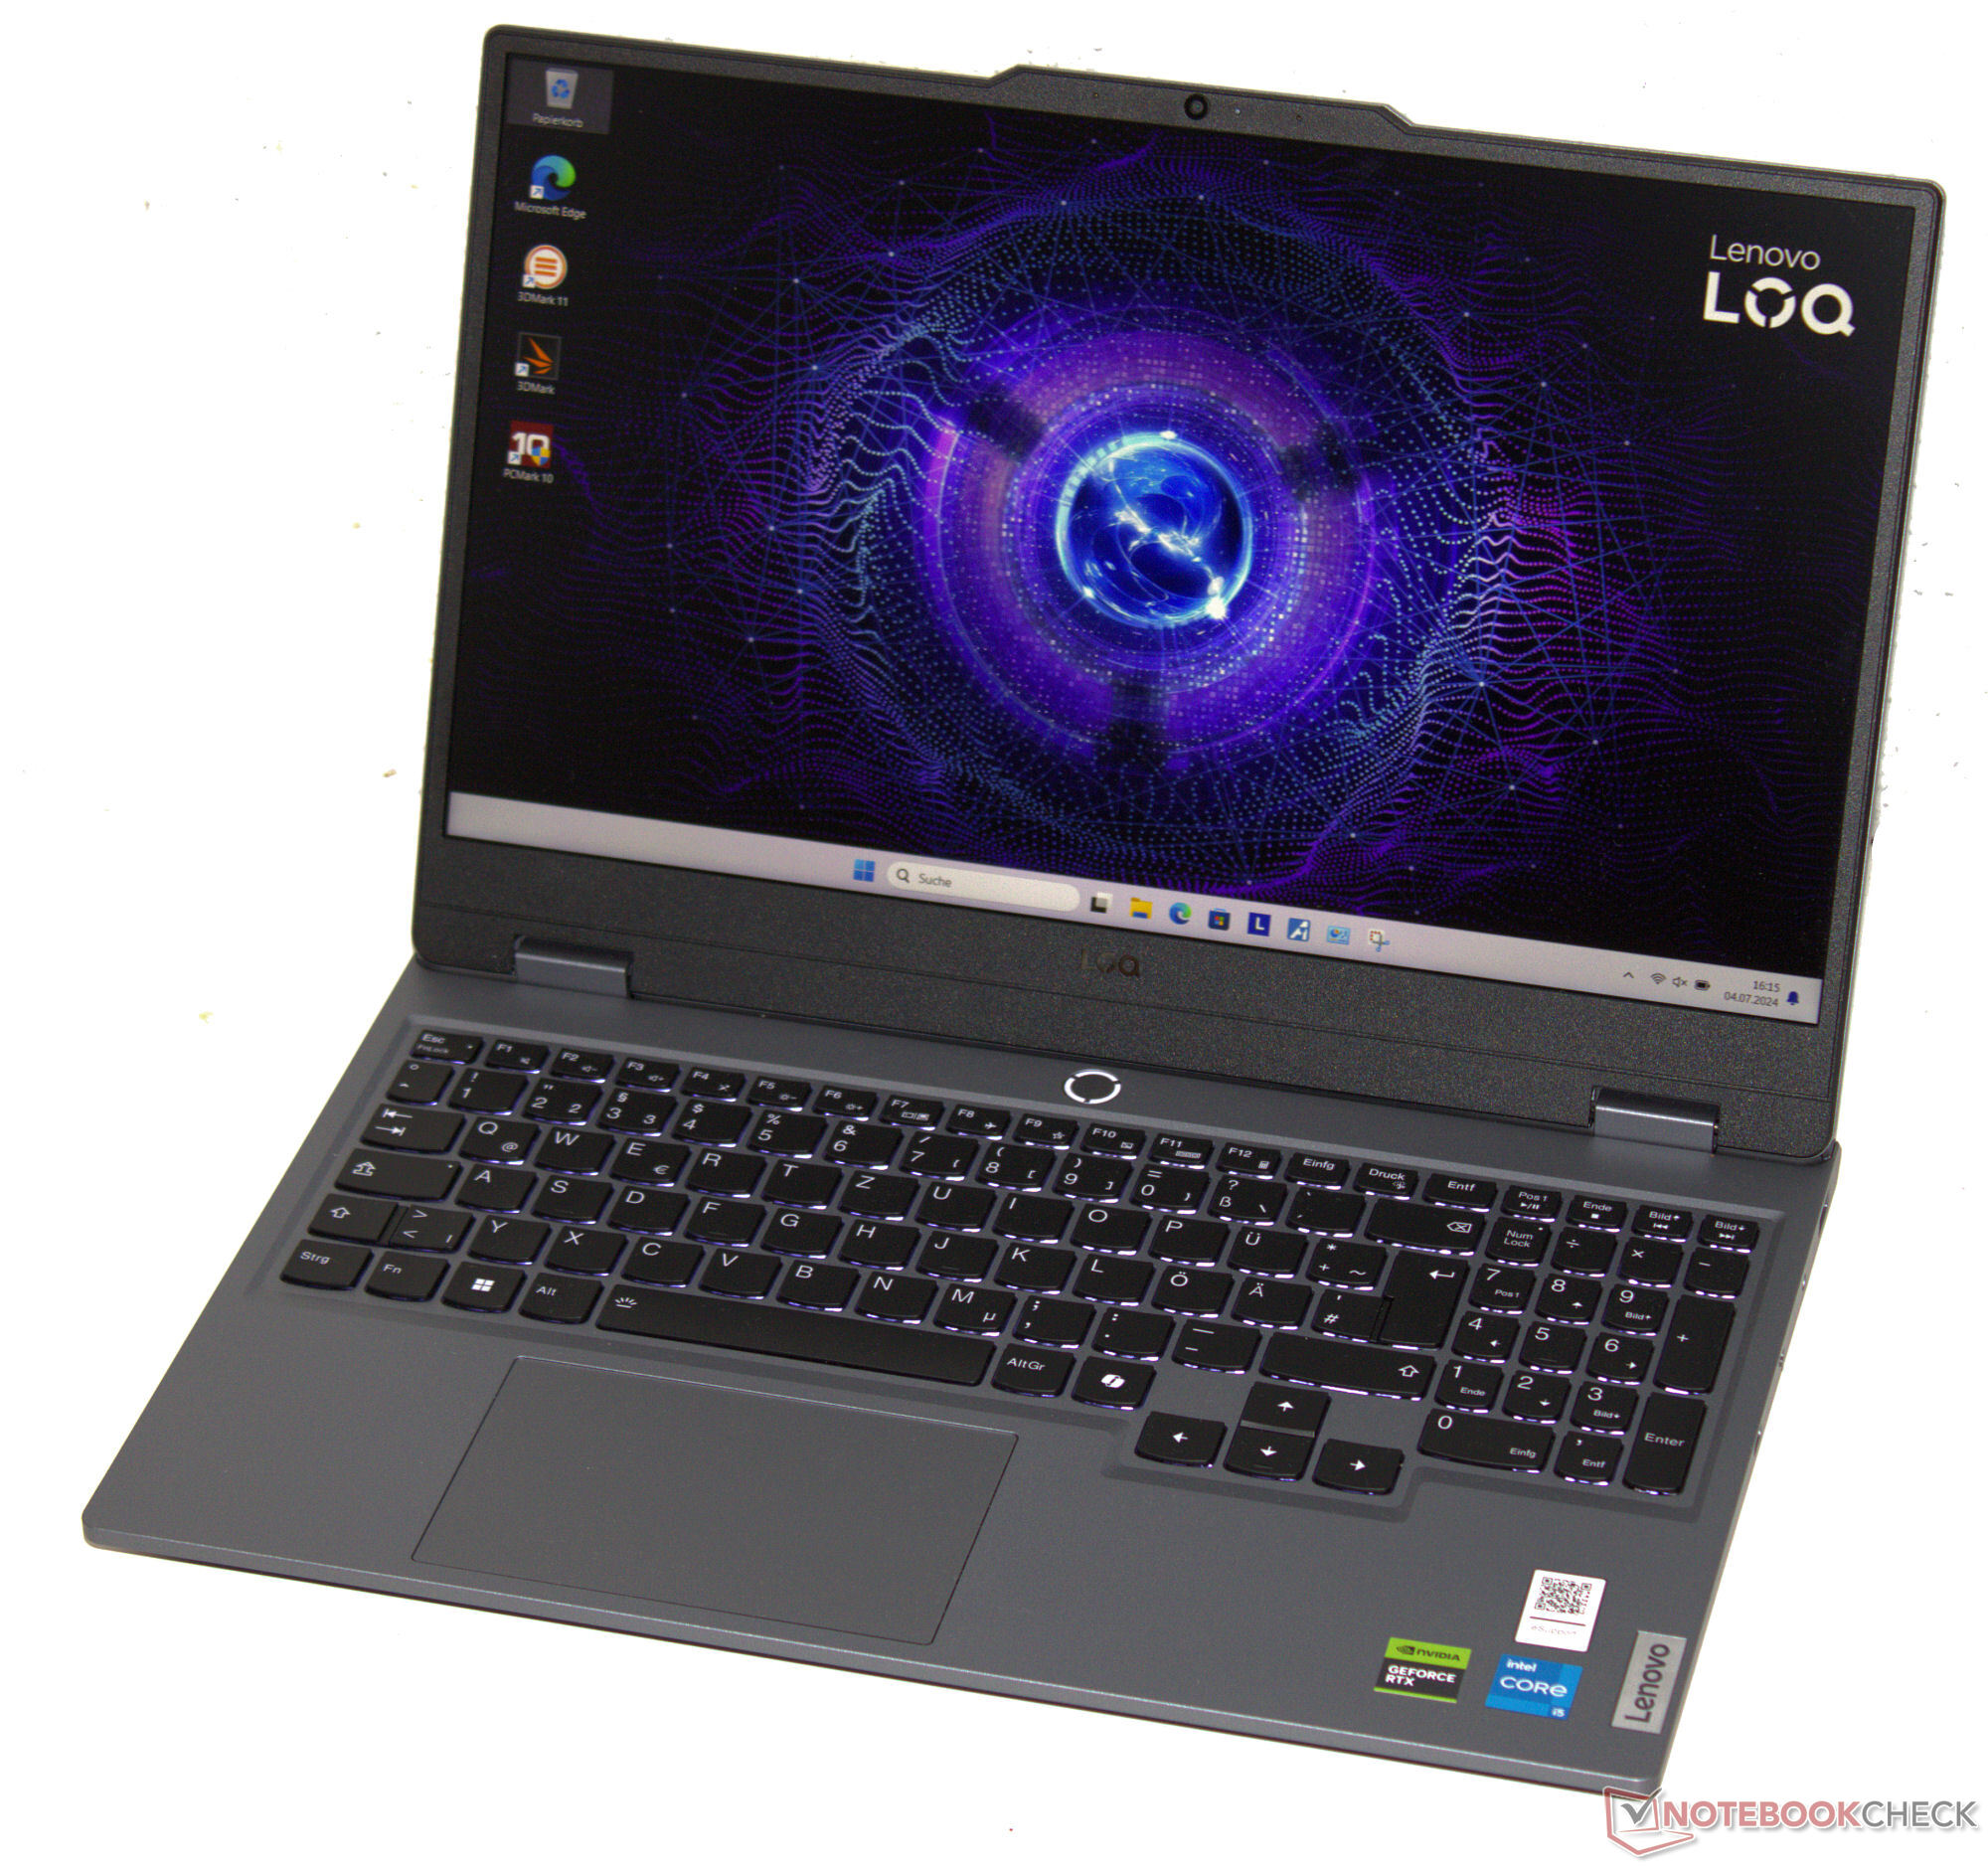
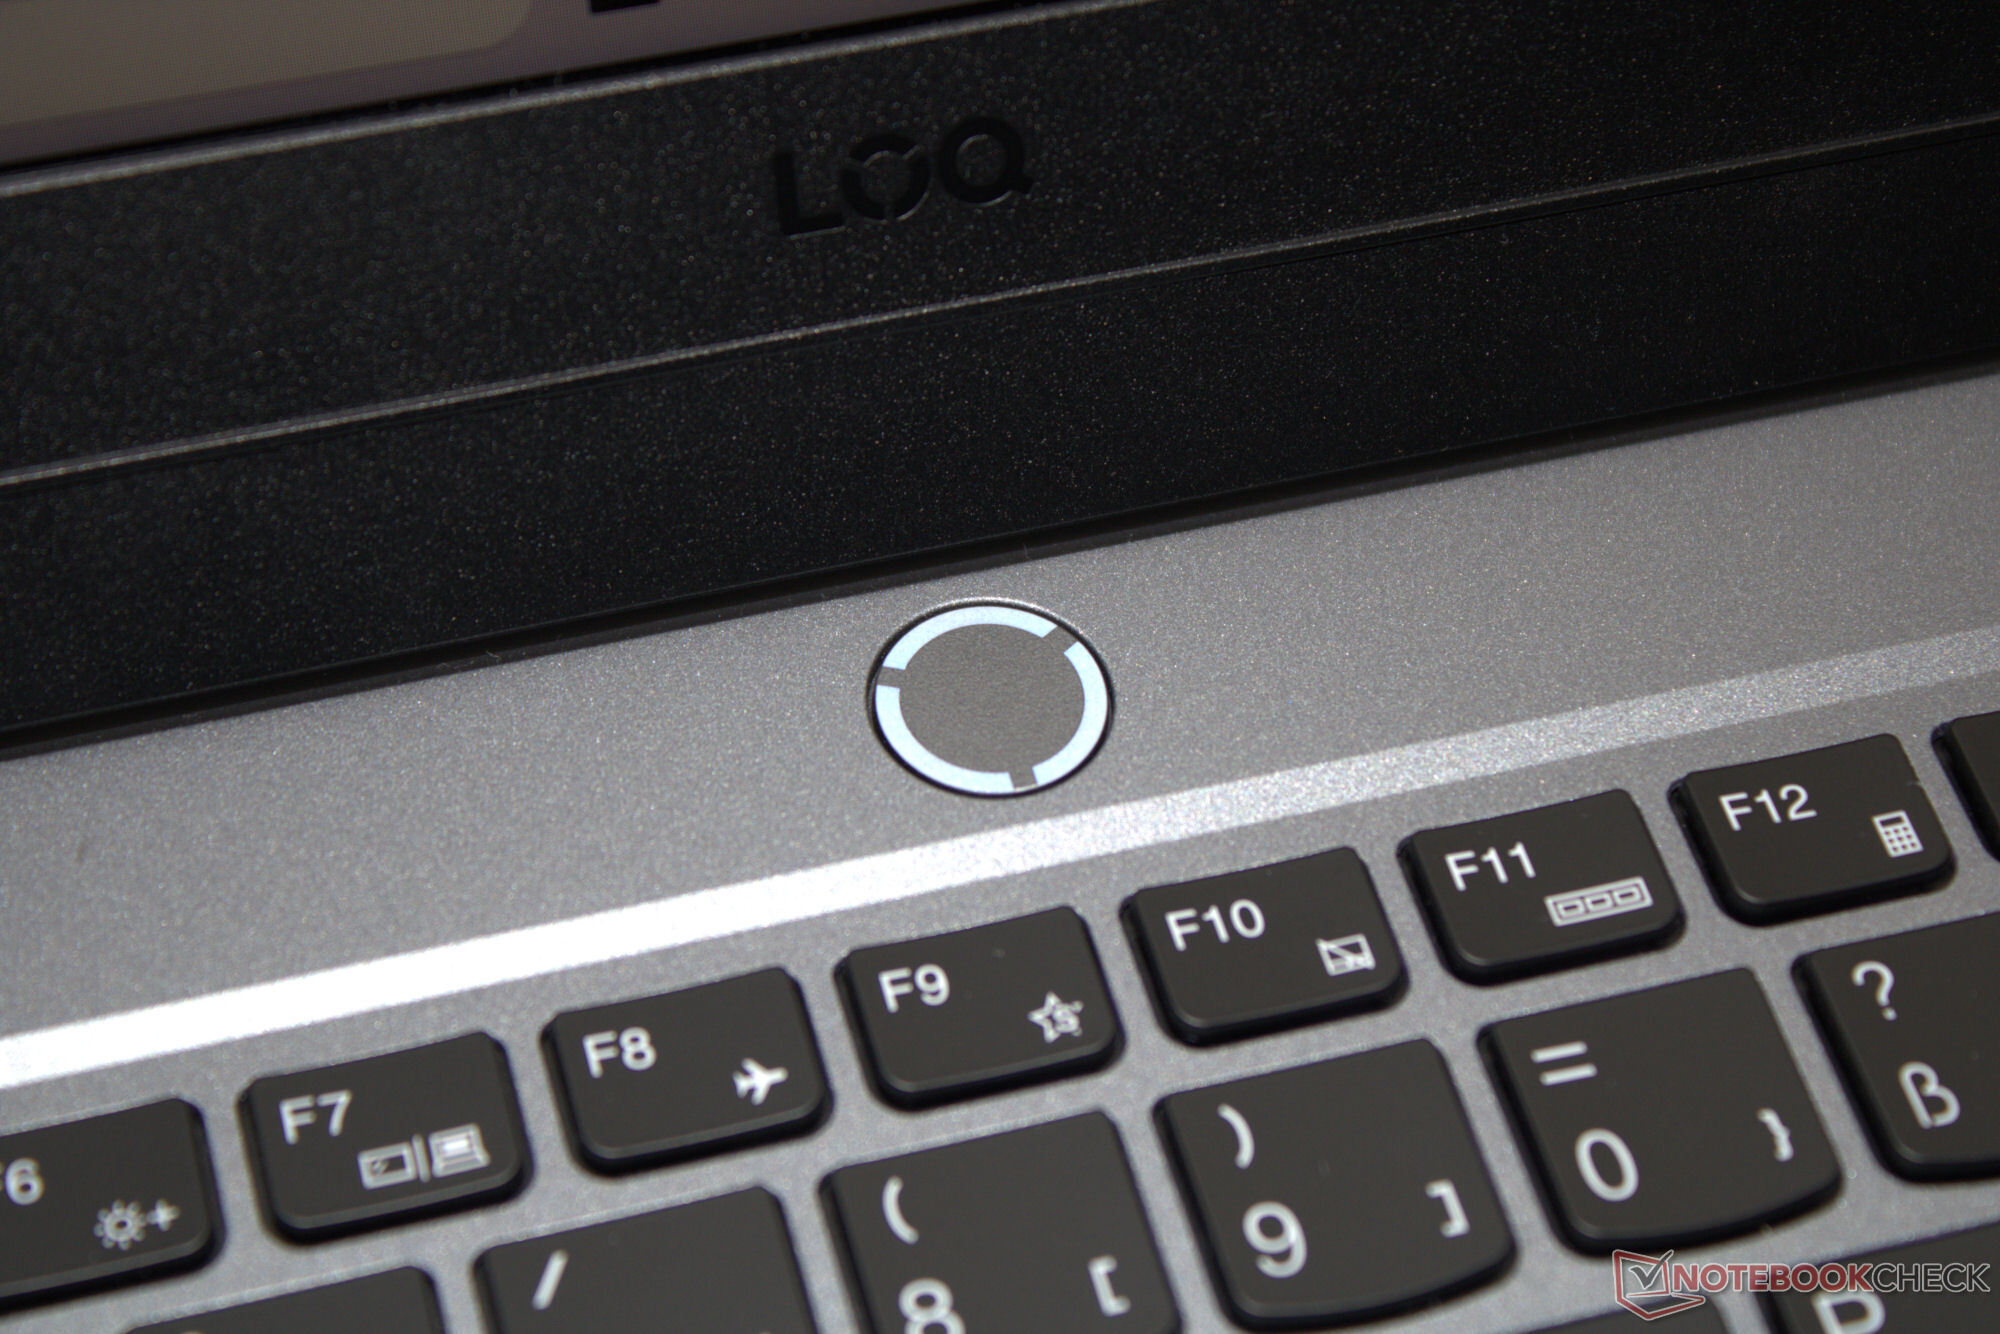
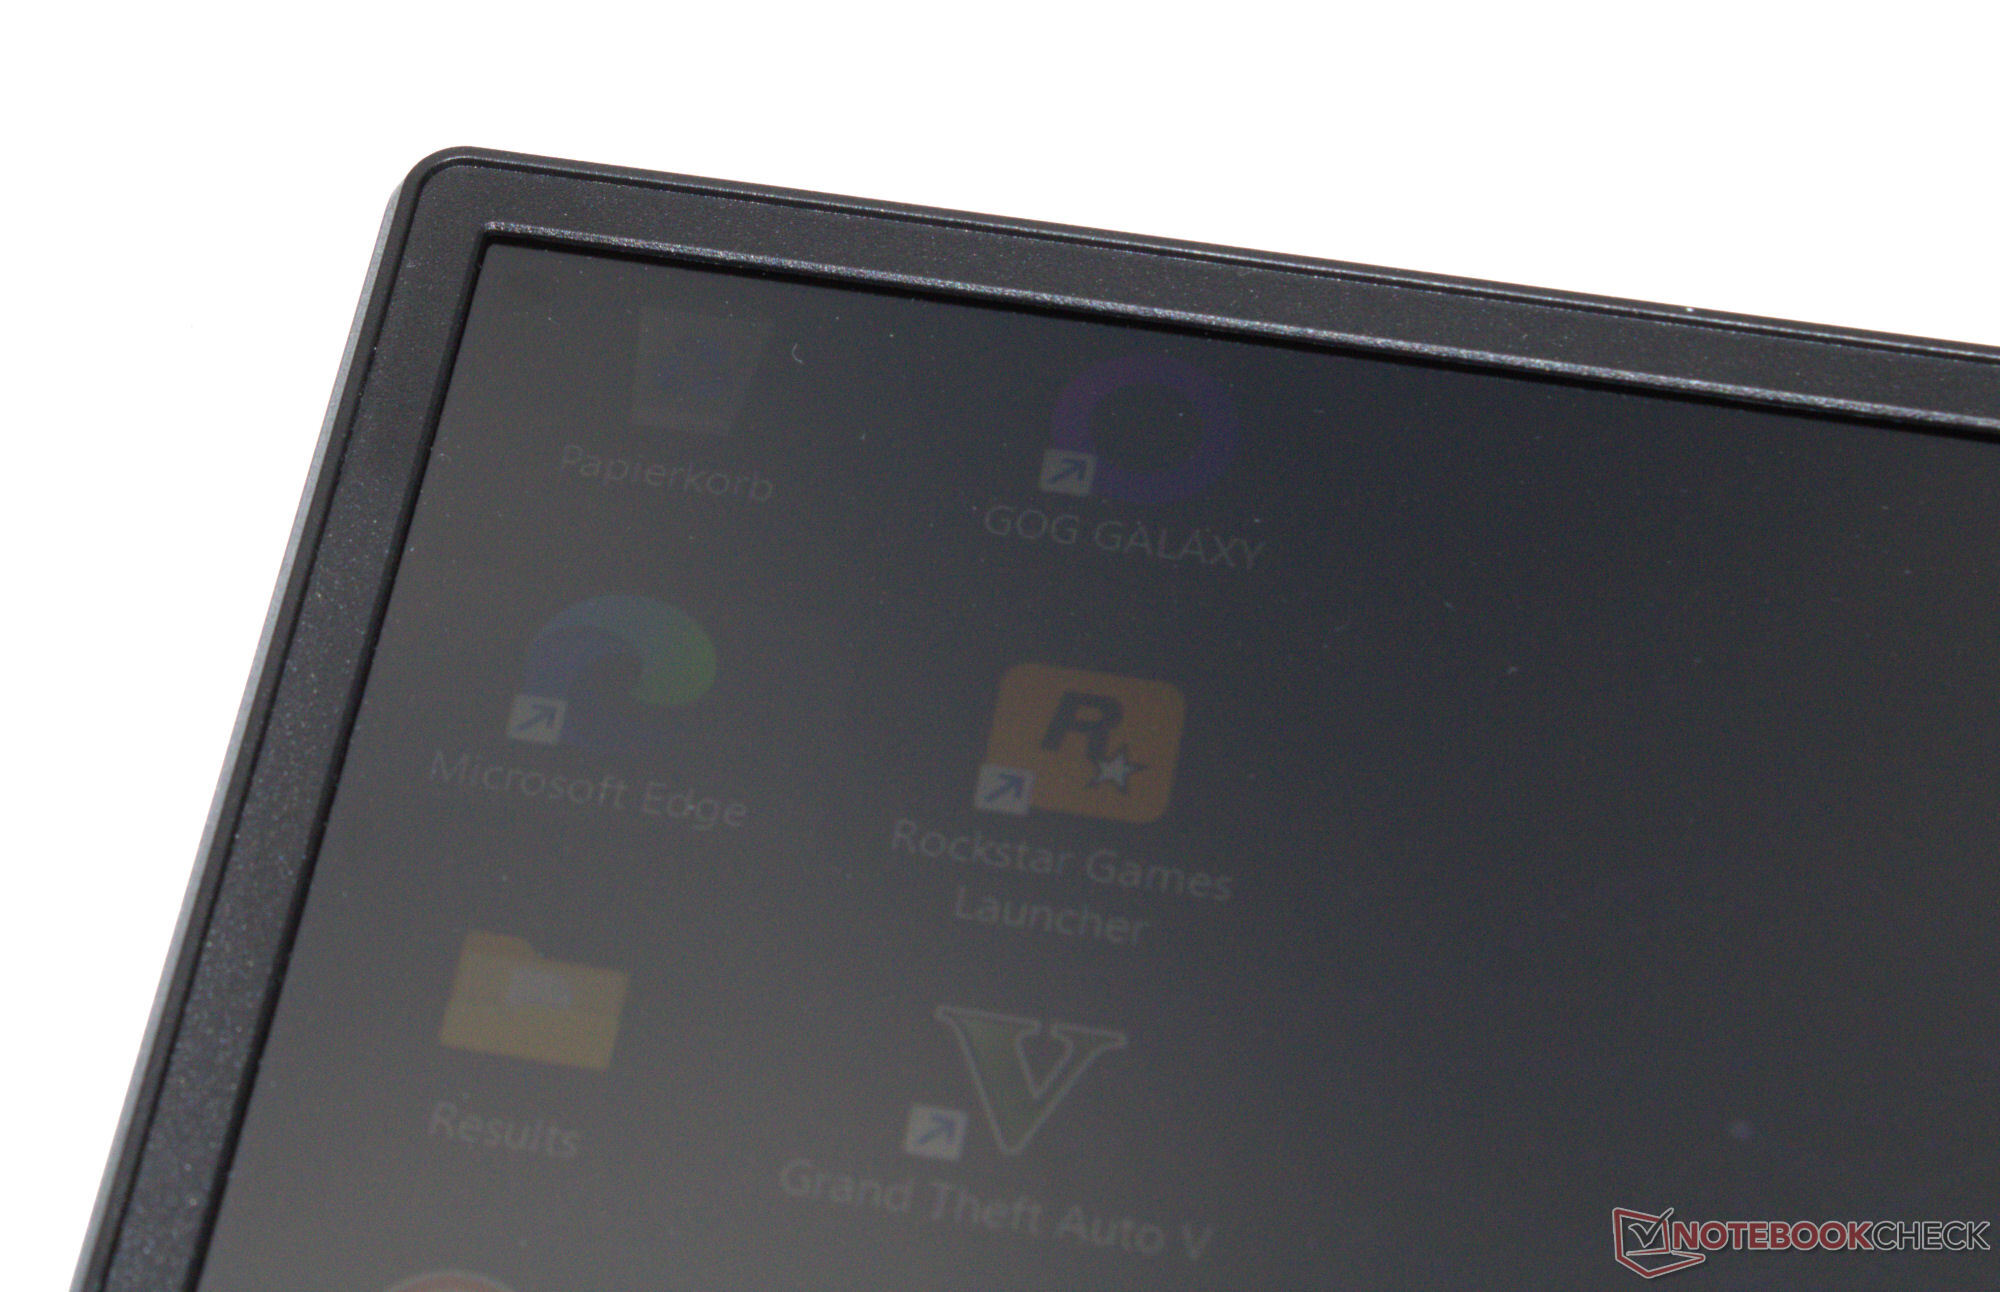
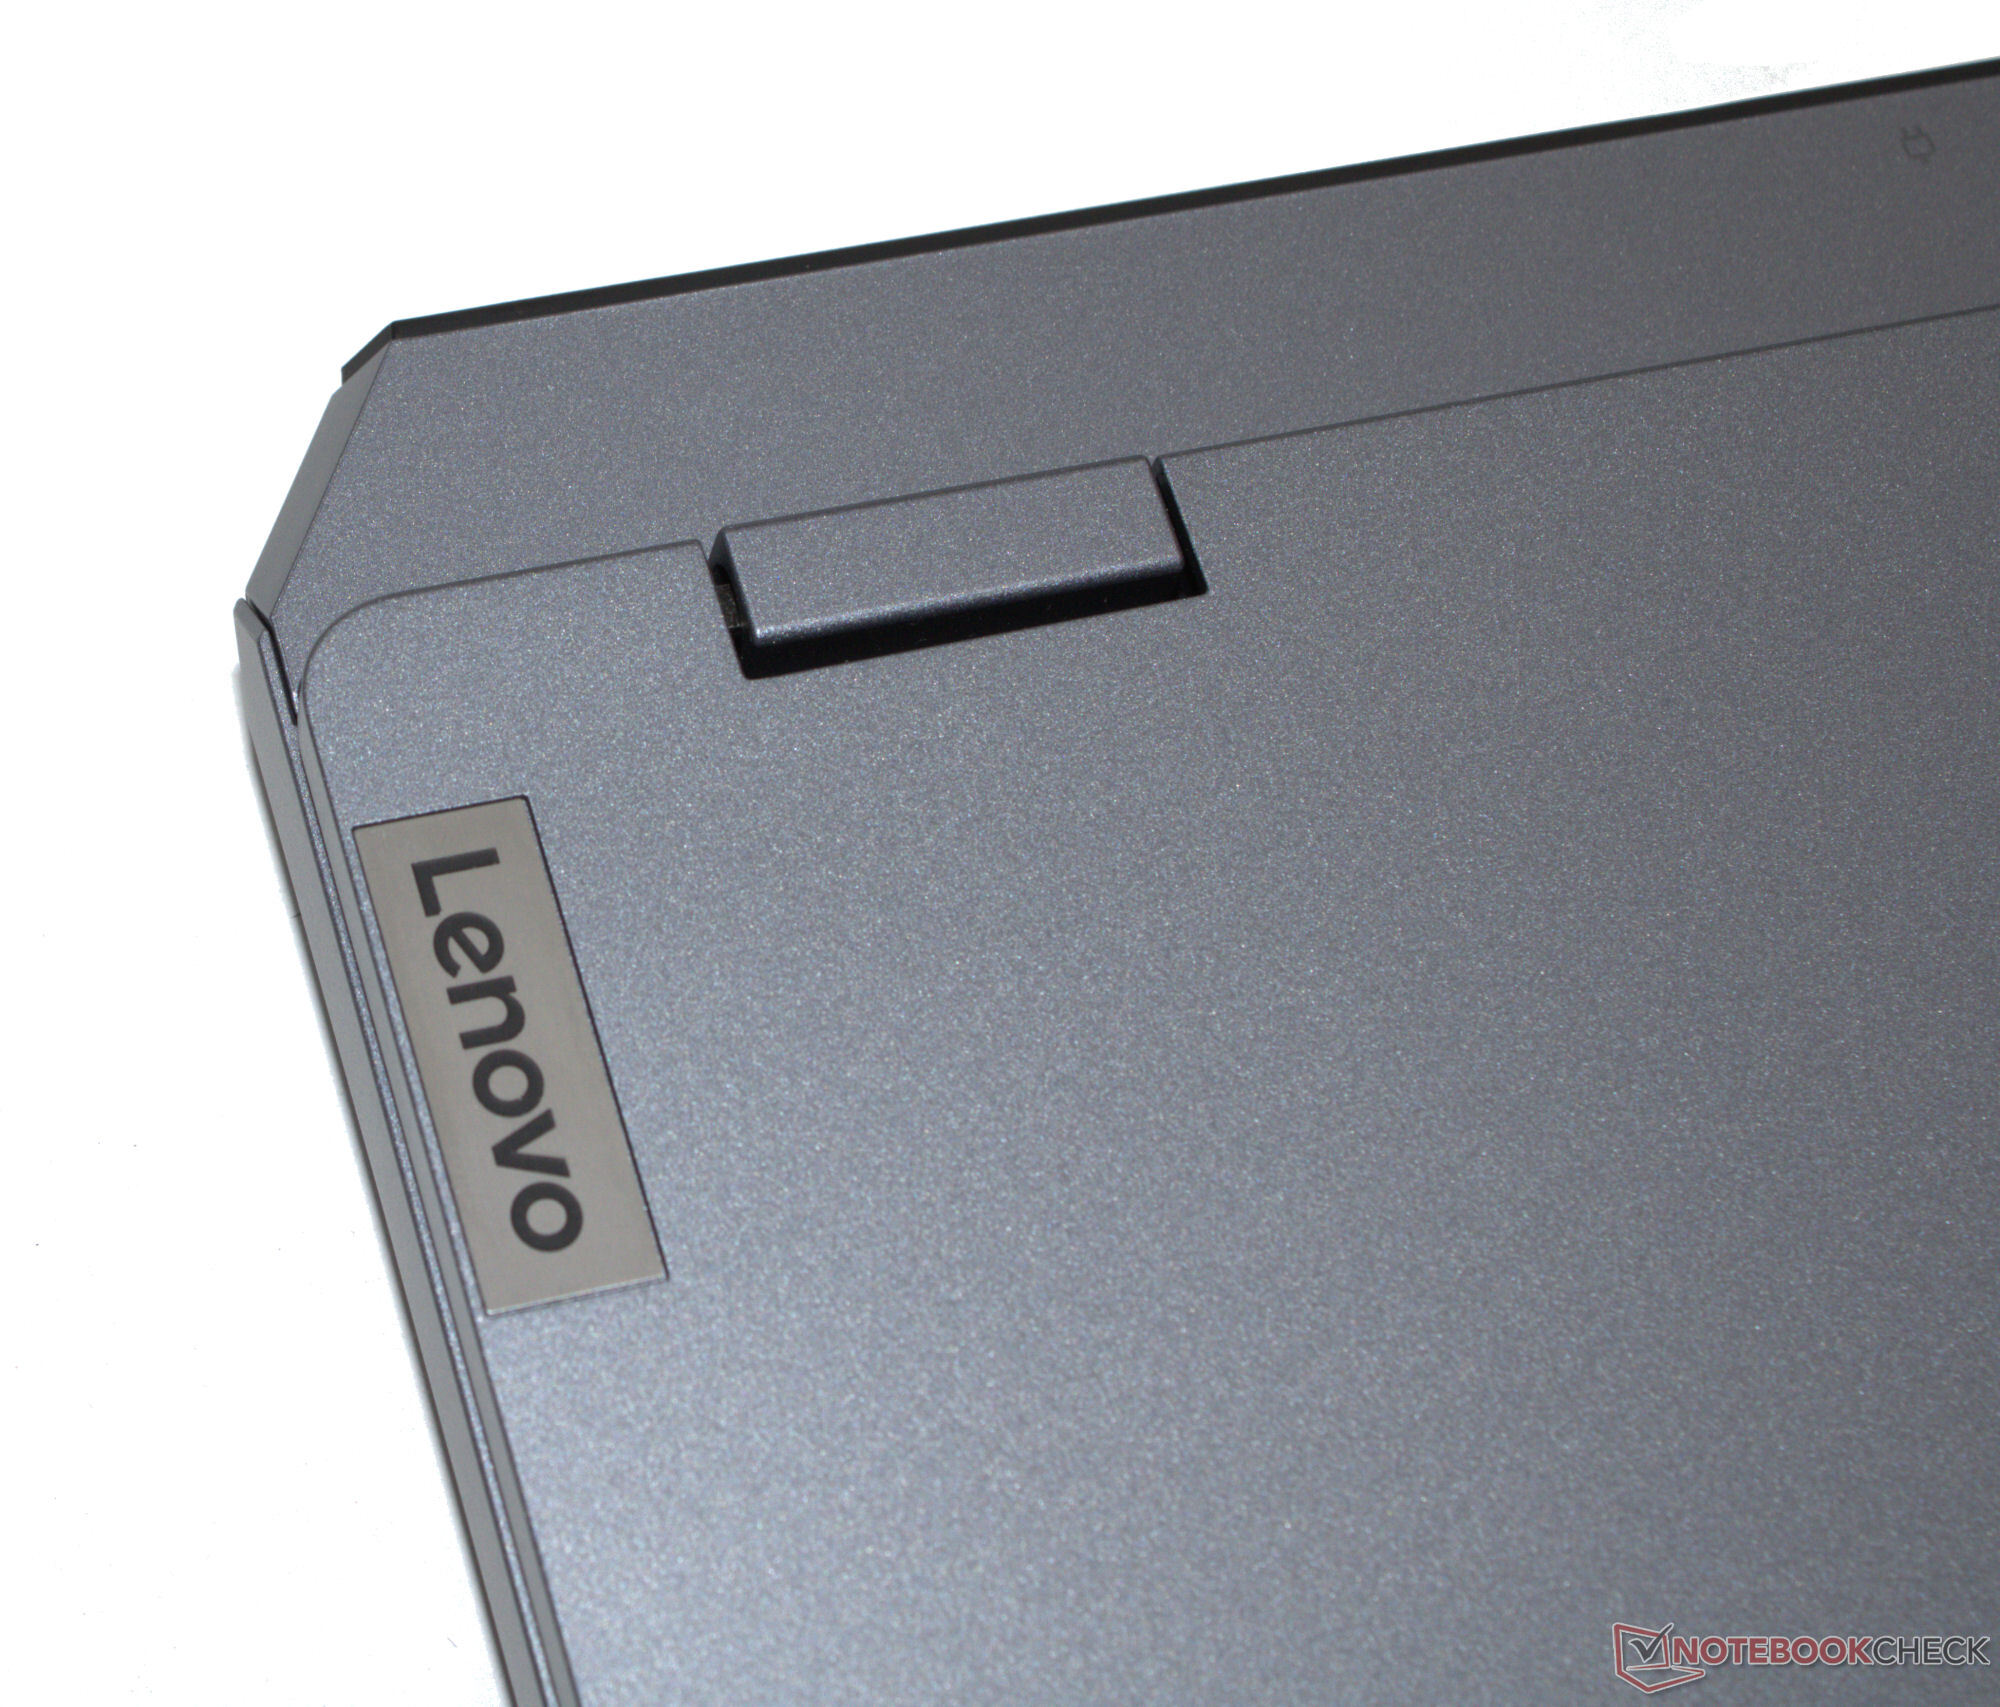
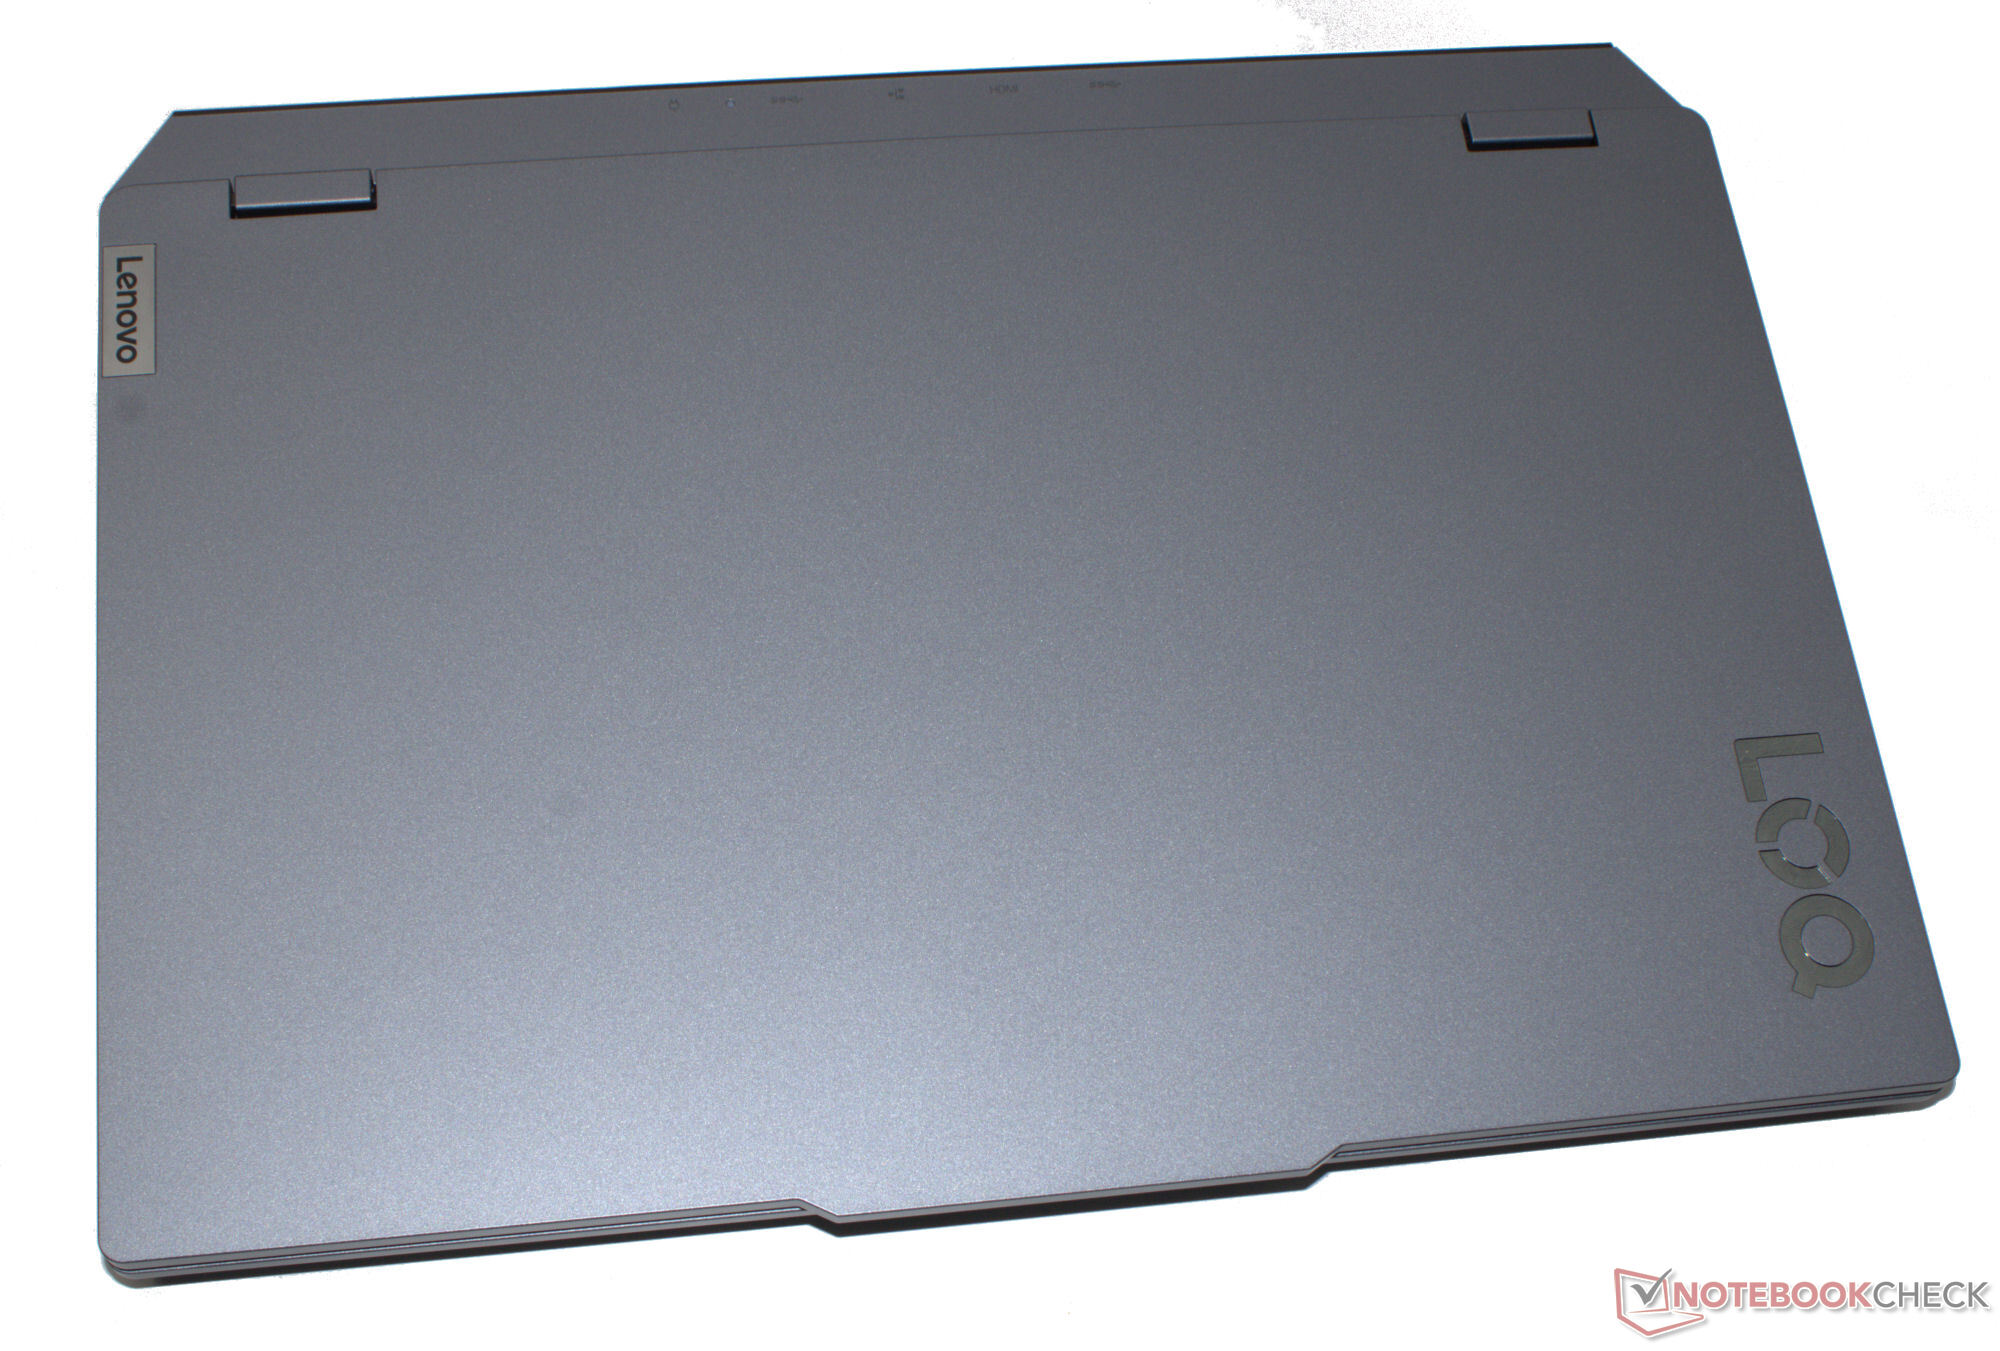
Dizüstü bilgisayarın donanımı, genel olarak oldukça şık görünen mat-gri (Luna Gri) plastik bir kasanın içine yerleştirilmiştir. Kapak ve ana ünite çok az bükülebilir, ancak bu yine de kabul edilebilir. Sağlamlığı gayet iyi. Kapak 180 dereceye kadar maksimum açılma açısına izin veriyor. Oyun dizüstü bilgisayarları için tipik olan LED şeritleri bu modelde görülmüyor.
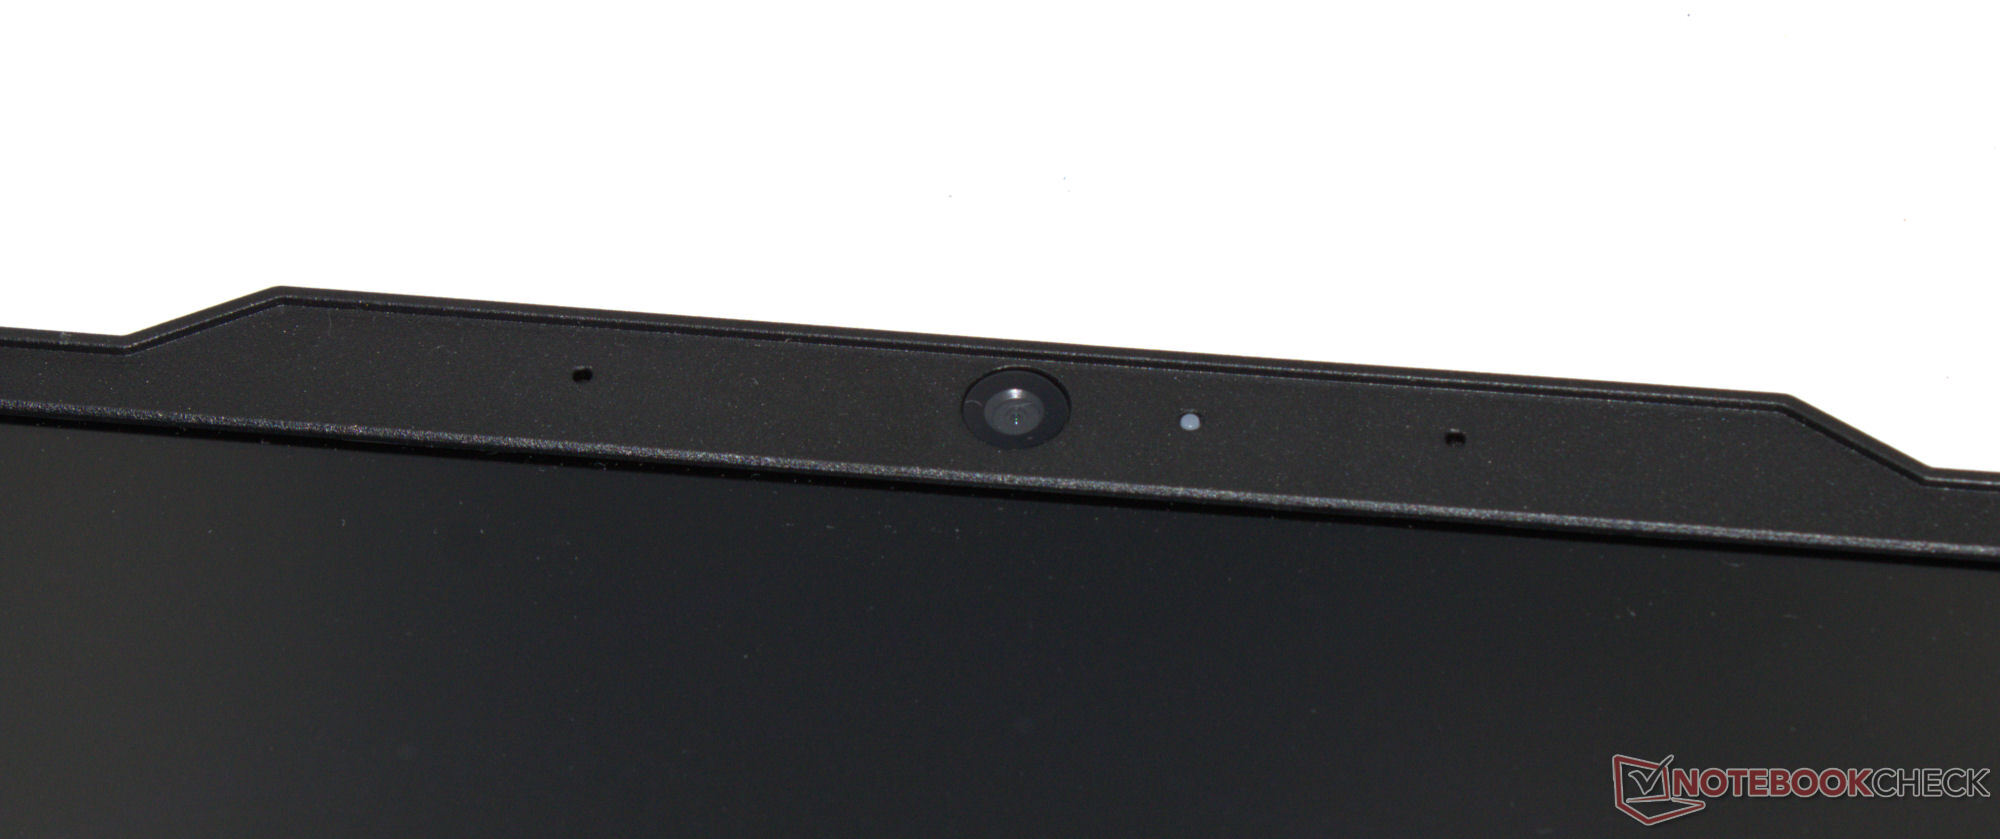
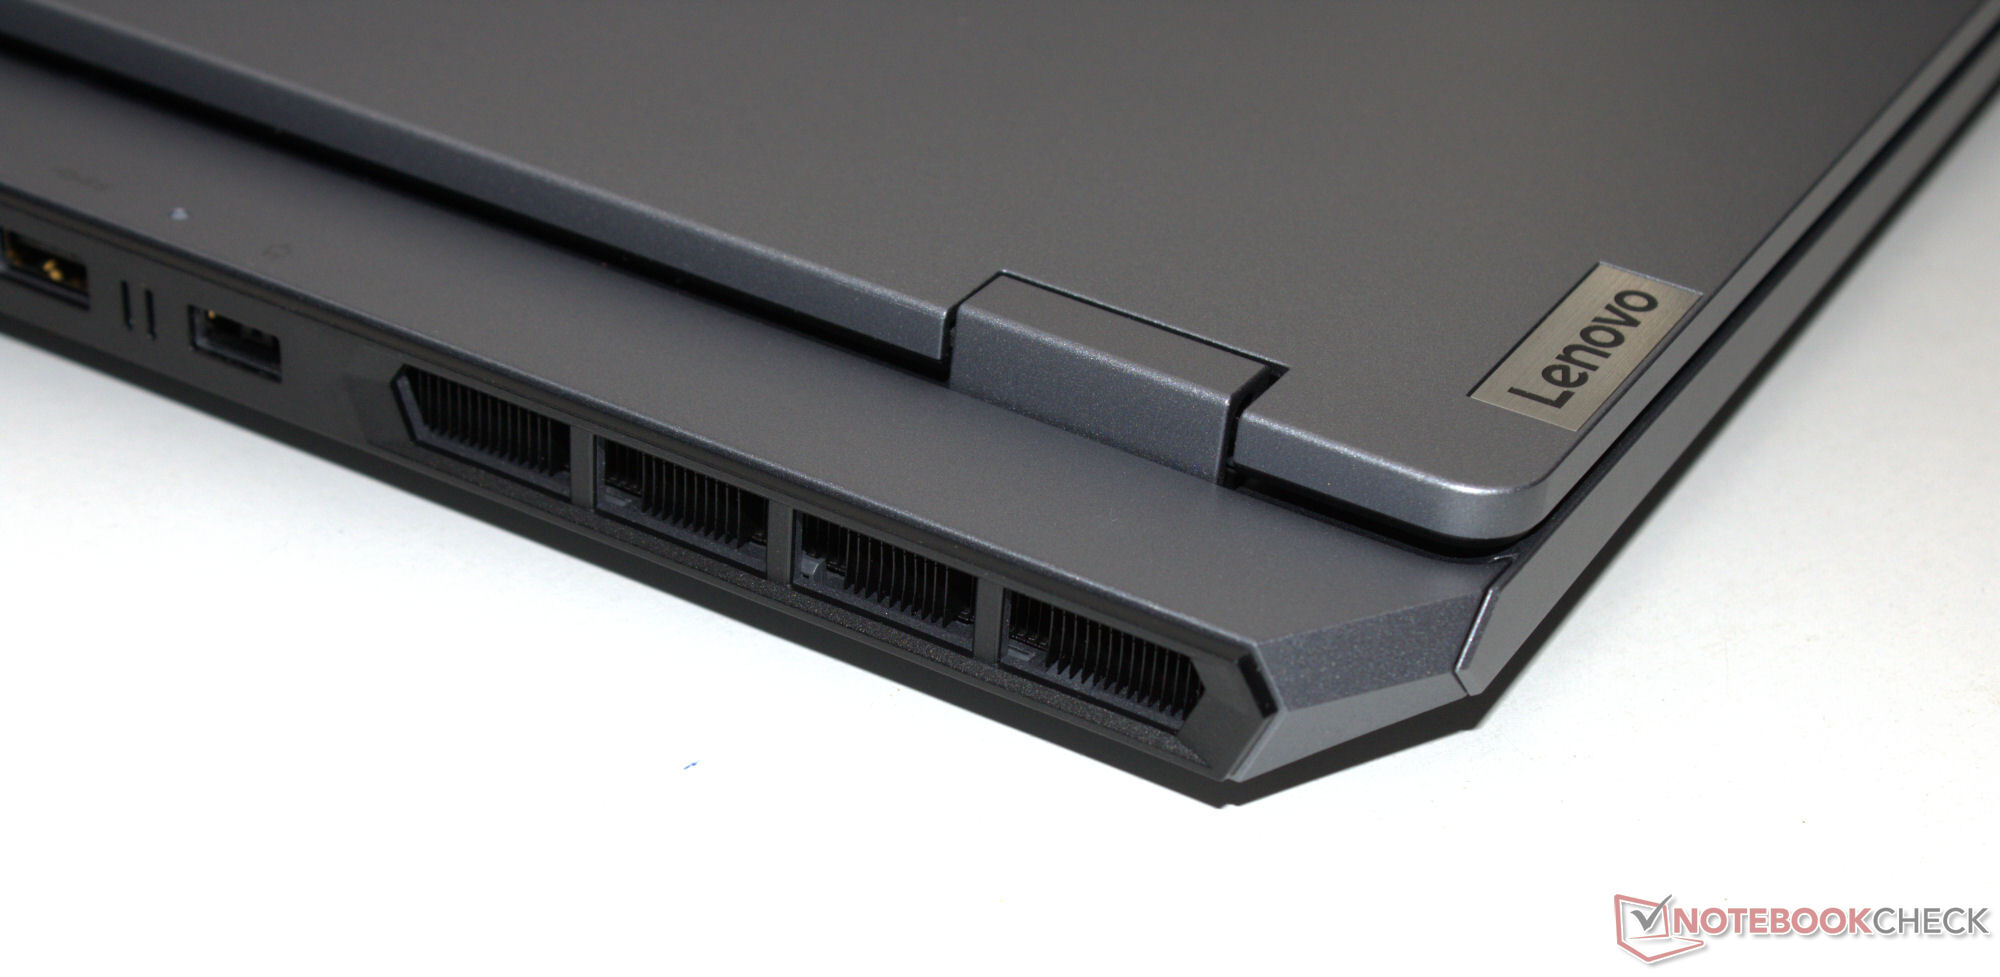
Üç USB-A bağlantısının (USB 3.2 Gen 1) yanı sıra bir USB-C bağlantı noktası (USB 3.2 Gen 2) çoğu kullanıcı için yeterli olacaktır. İkincisi Güç Dağıtımı ve Ekran ALT modunu destekler. Dizüstü bilgisayarın toplamda iki video çıkışı vardır (1x HDMI, 1x DP). Web kamerası (2,1 MP, açma/kapama düğmeli) ortalama sonuçlar veriyor. Lenovo bir SD kart okuyucuyu gerekli görmemiş.
Ölçtüğümüz WiFi veri hızları sağlam, ancak günümüzde mümkün olanın gerisinde kalıyor. Lenovo dizüstü bilgisayarın Realtek WiFi 6 çipi (RTL8852BE), birçok rakibinde bulunan Intel çipleriyle aynı hızlara ulaşamıyor.


Sürdürülebilirlik
Dizüstü bilgisayar ve güç kaynağı birer plastik torba içinde paketlenirken, LOQ taşıma sırasında köpük eklerle korunmaktadır. Kullanılan plastik türleri üretici tarafından adlandırılmıştır. Bir kağıt kapak güç kaynağını çizilmekten korur. Tüm bunlar karton bir kutunun içine yerleştirilmiştir - etiketlemeye göre, kullanılan ahşap sürdürülebilir ormancılıktan kaynaklanmaktadır.
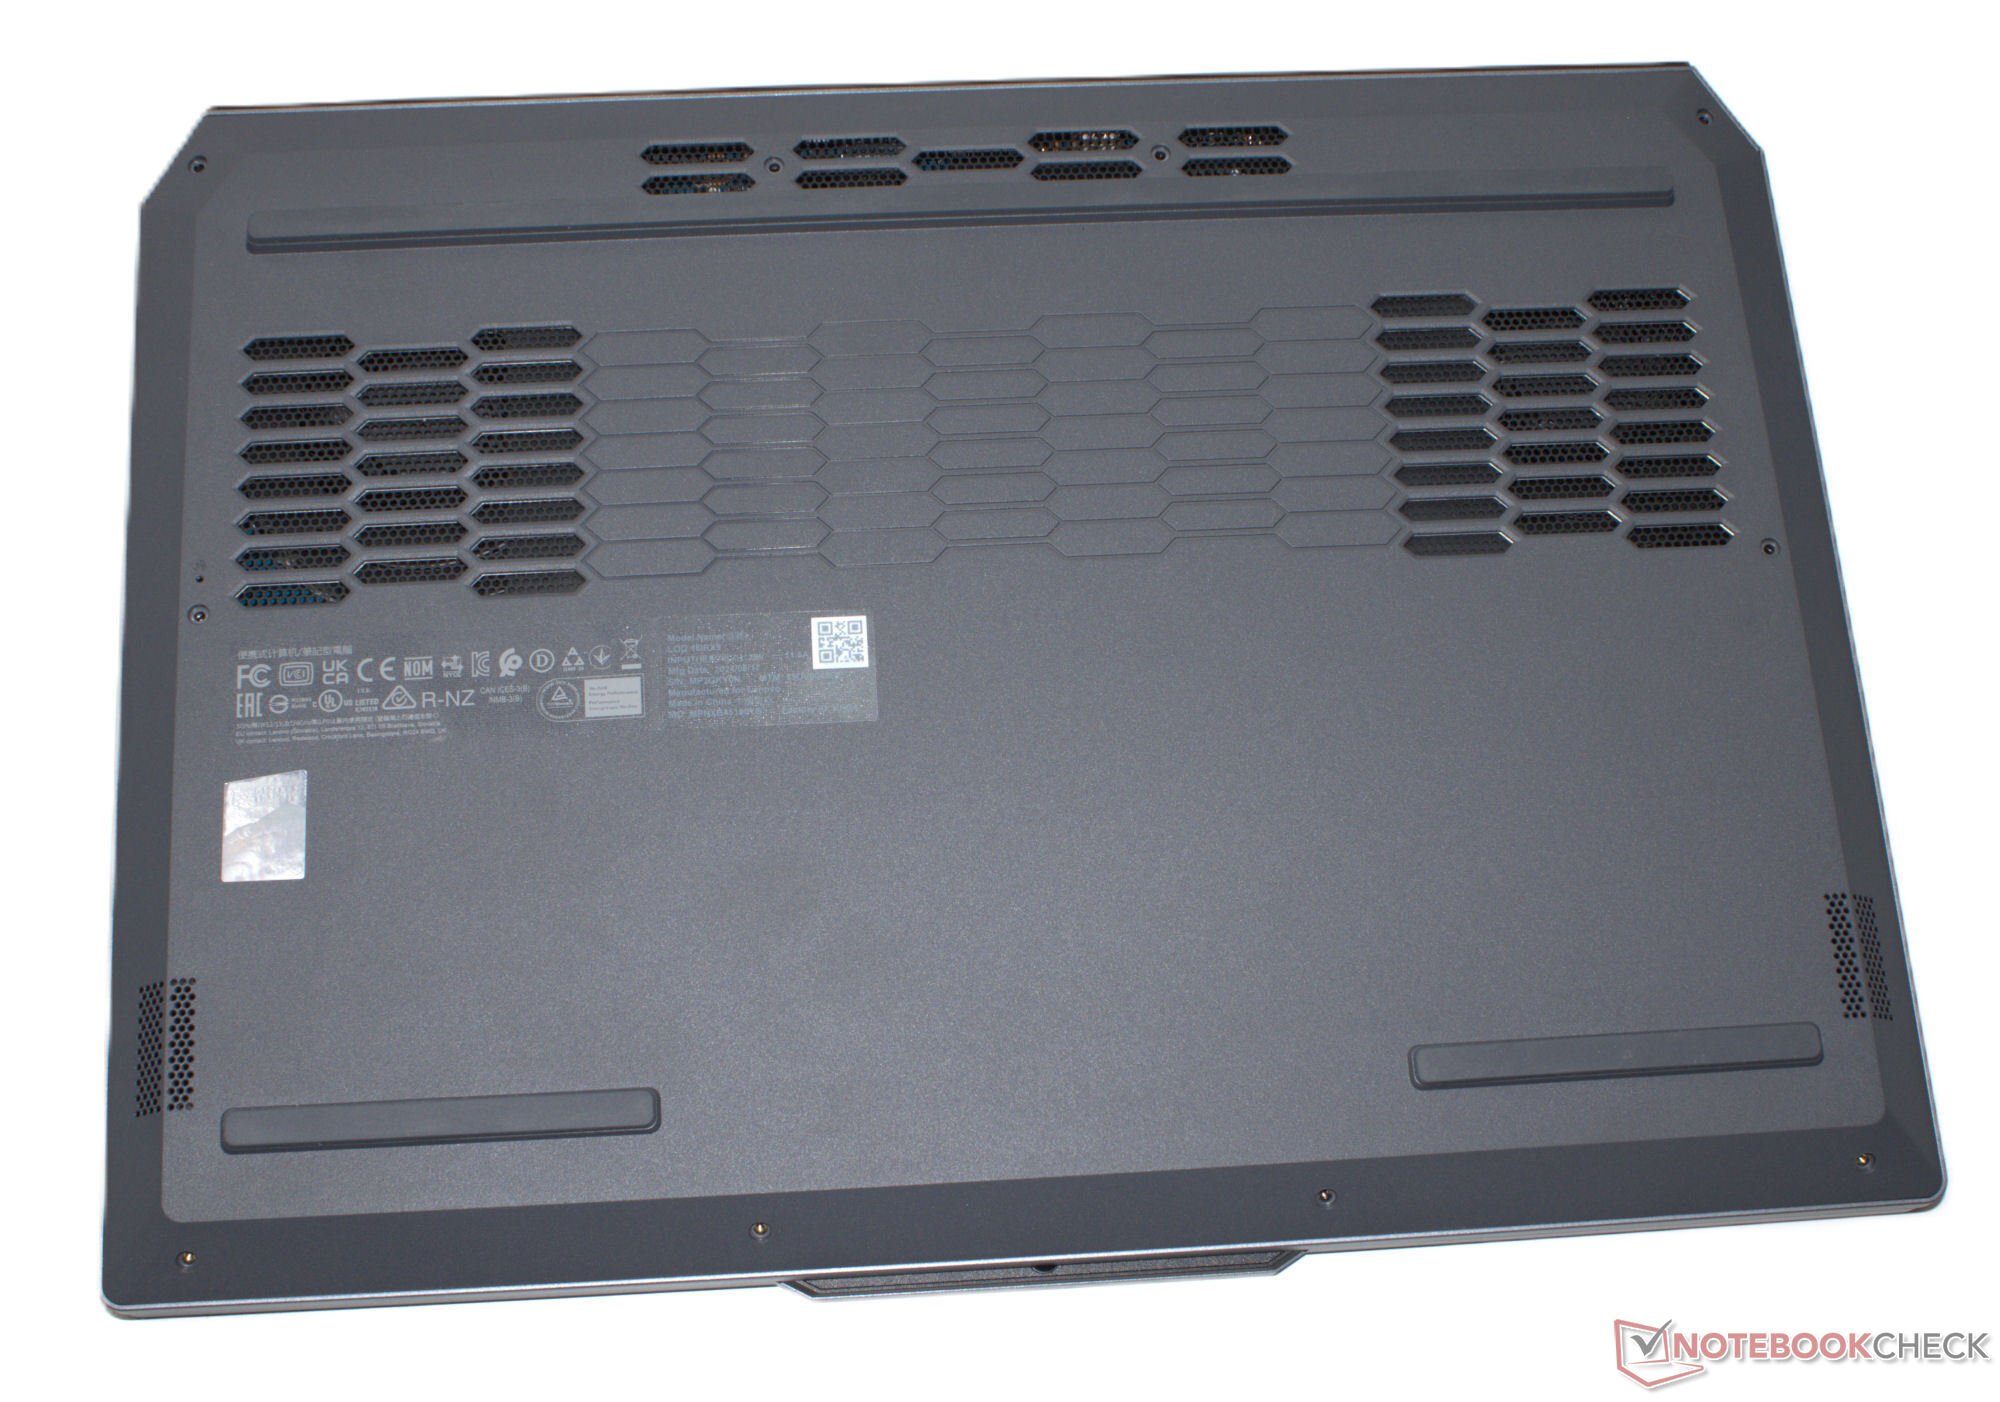
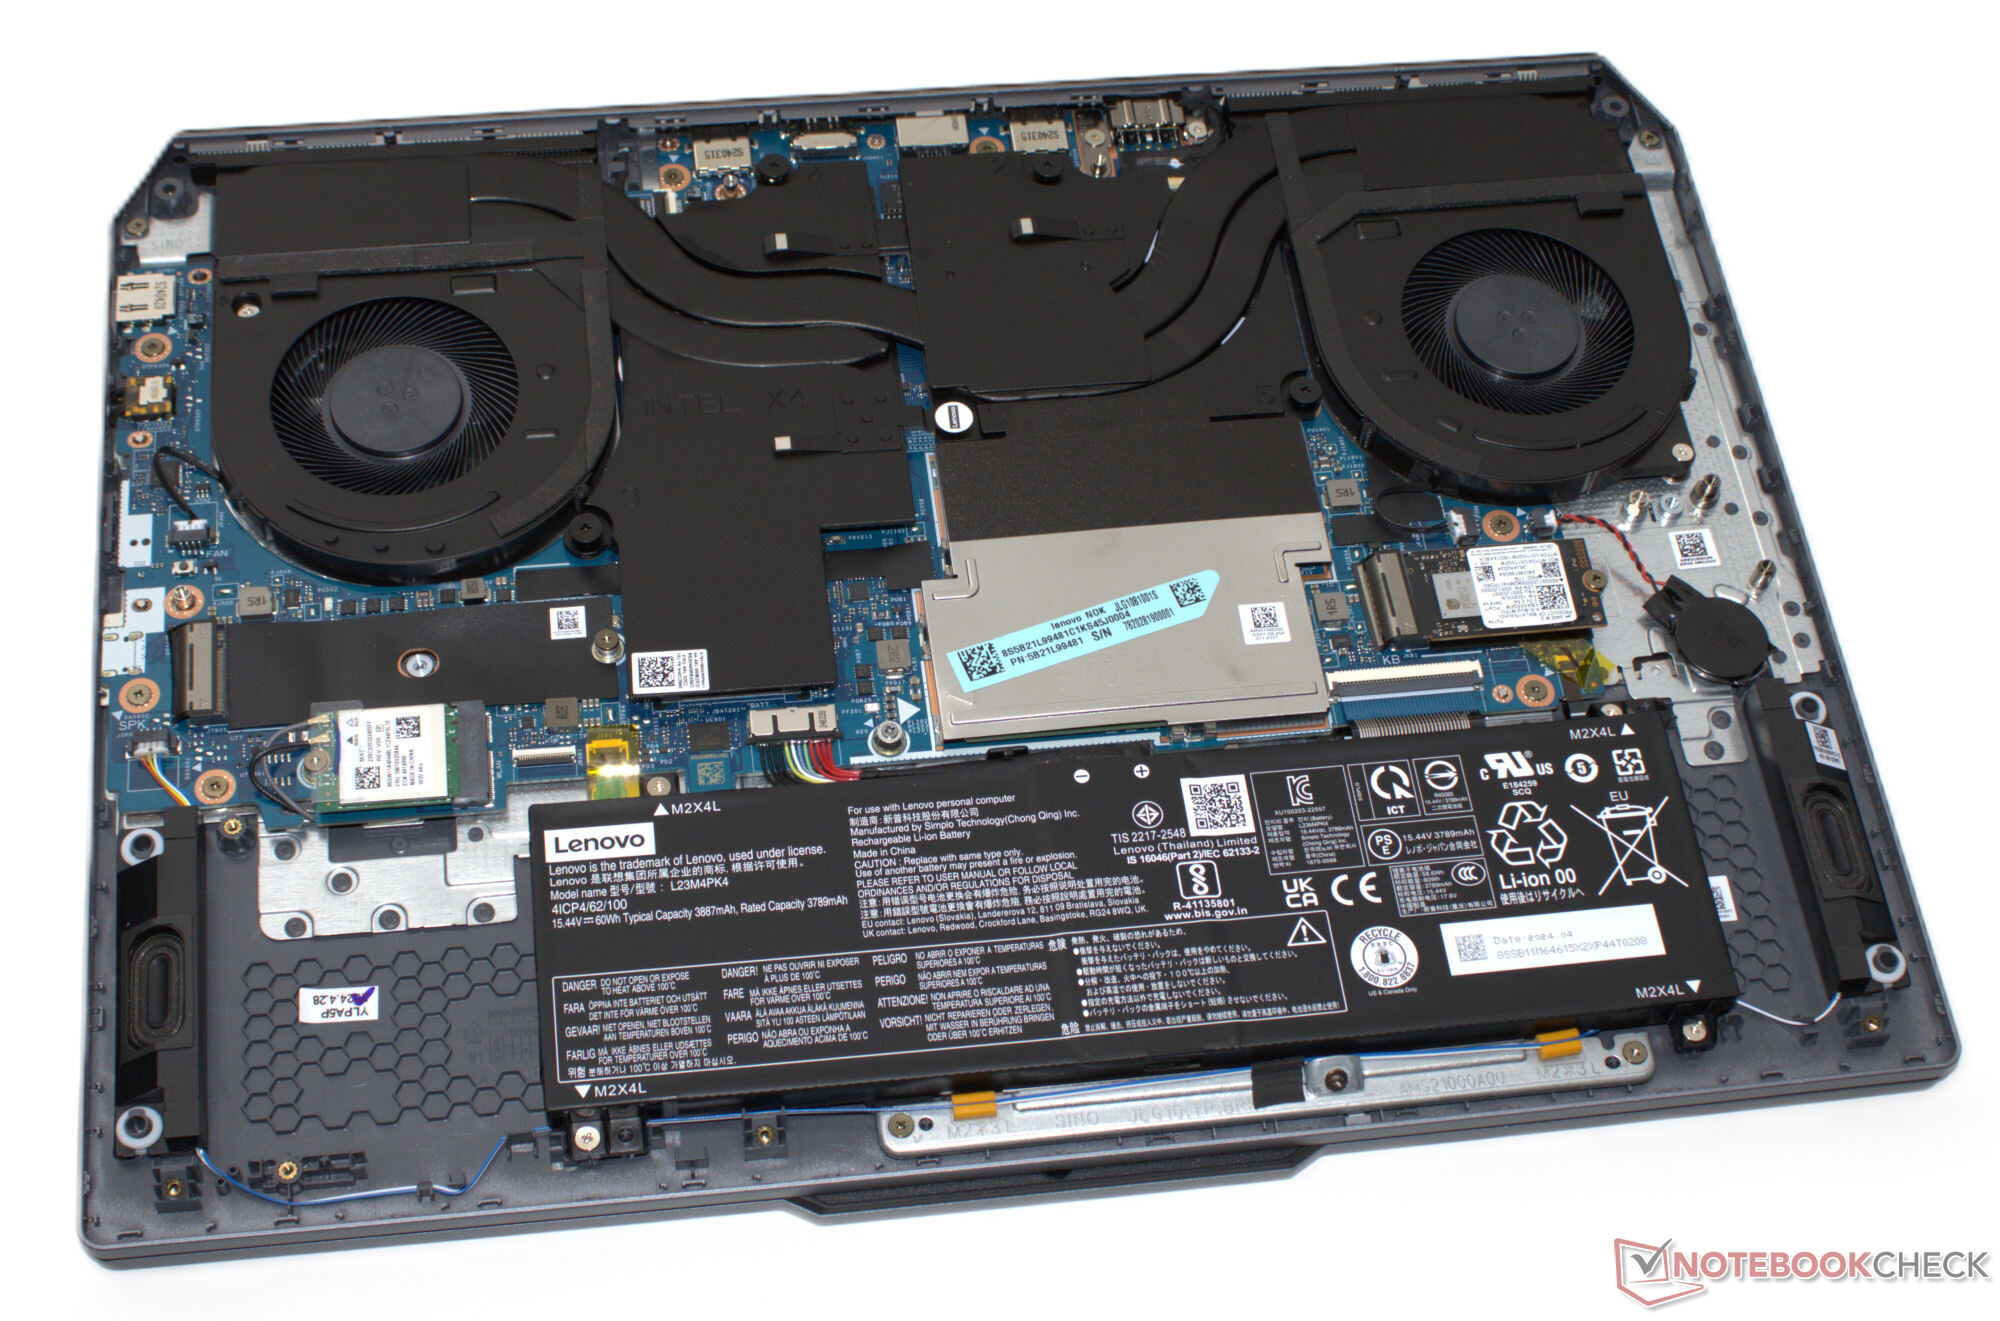
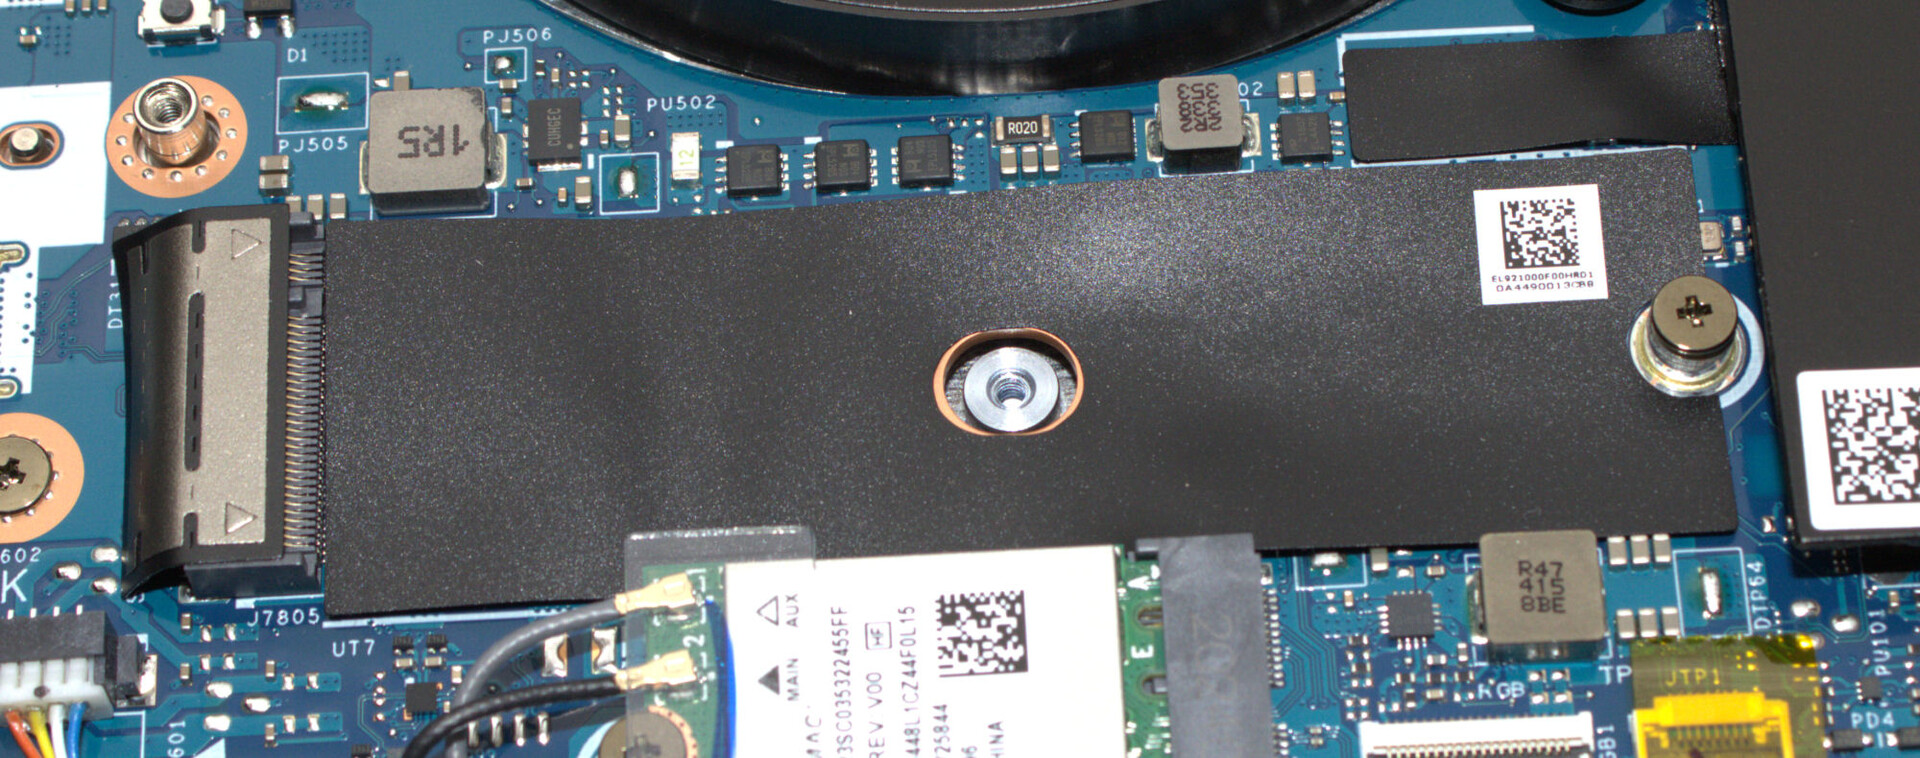
Cihazı tamir etmek oldukça kolay olmalı: Alt plaka sorunsuz bir şekilde çıkarılabiliyor ve bu sayede tüm donanıma erişim sağlanabiliyor. Kasanın içinde yapıştırılmış herhangi bir parçaya rastlamadık. İşletim sistemi olarak Windows 11 kullanıldığından, yazılım güncellemeleri önümüzdeki yıllar için garanti edilmelidir. Lenovo'nun desteği 31 Aralık 2029'da sona eriyor.
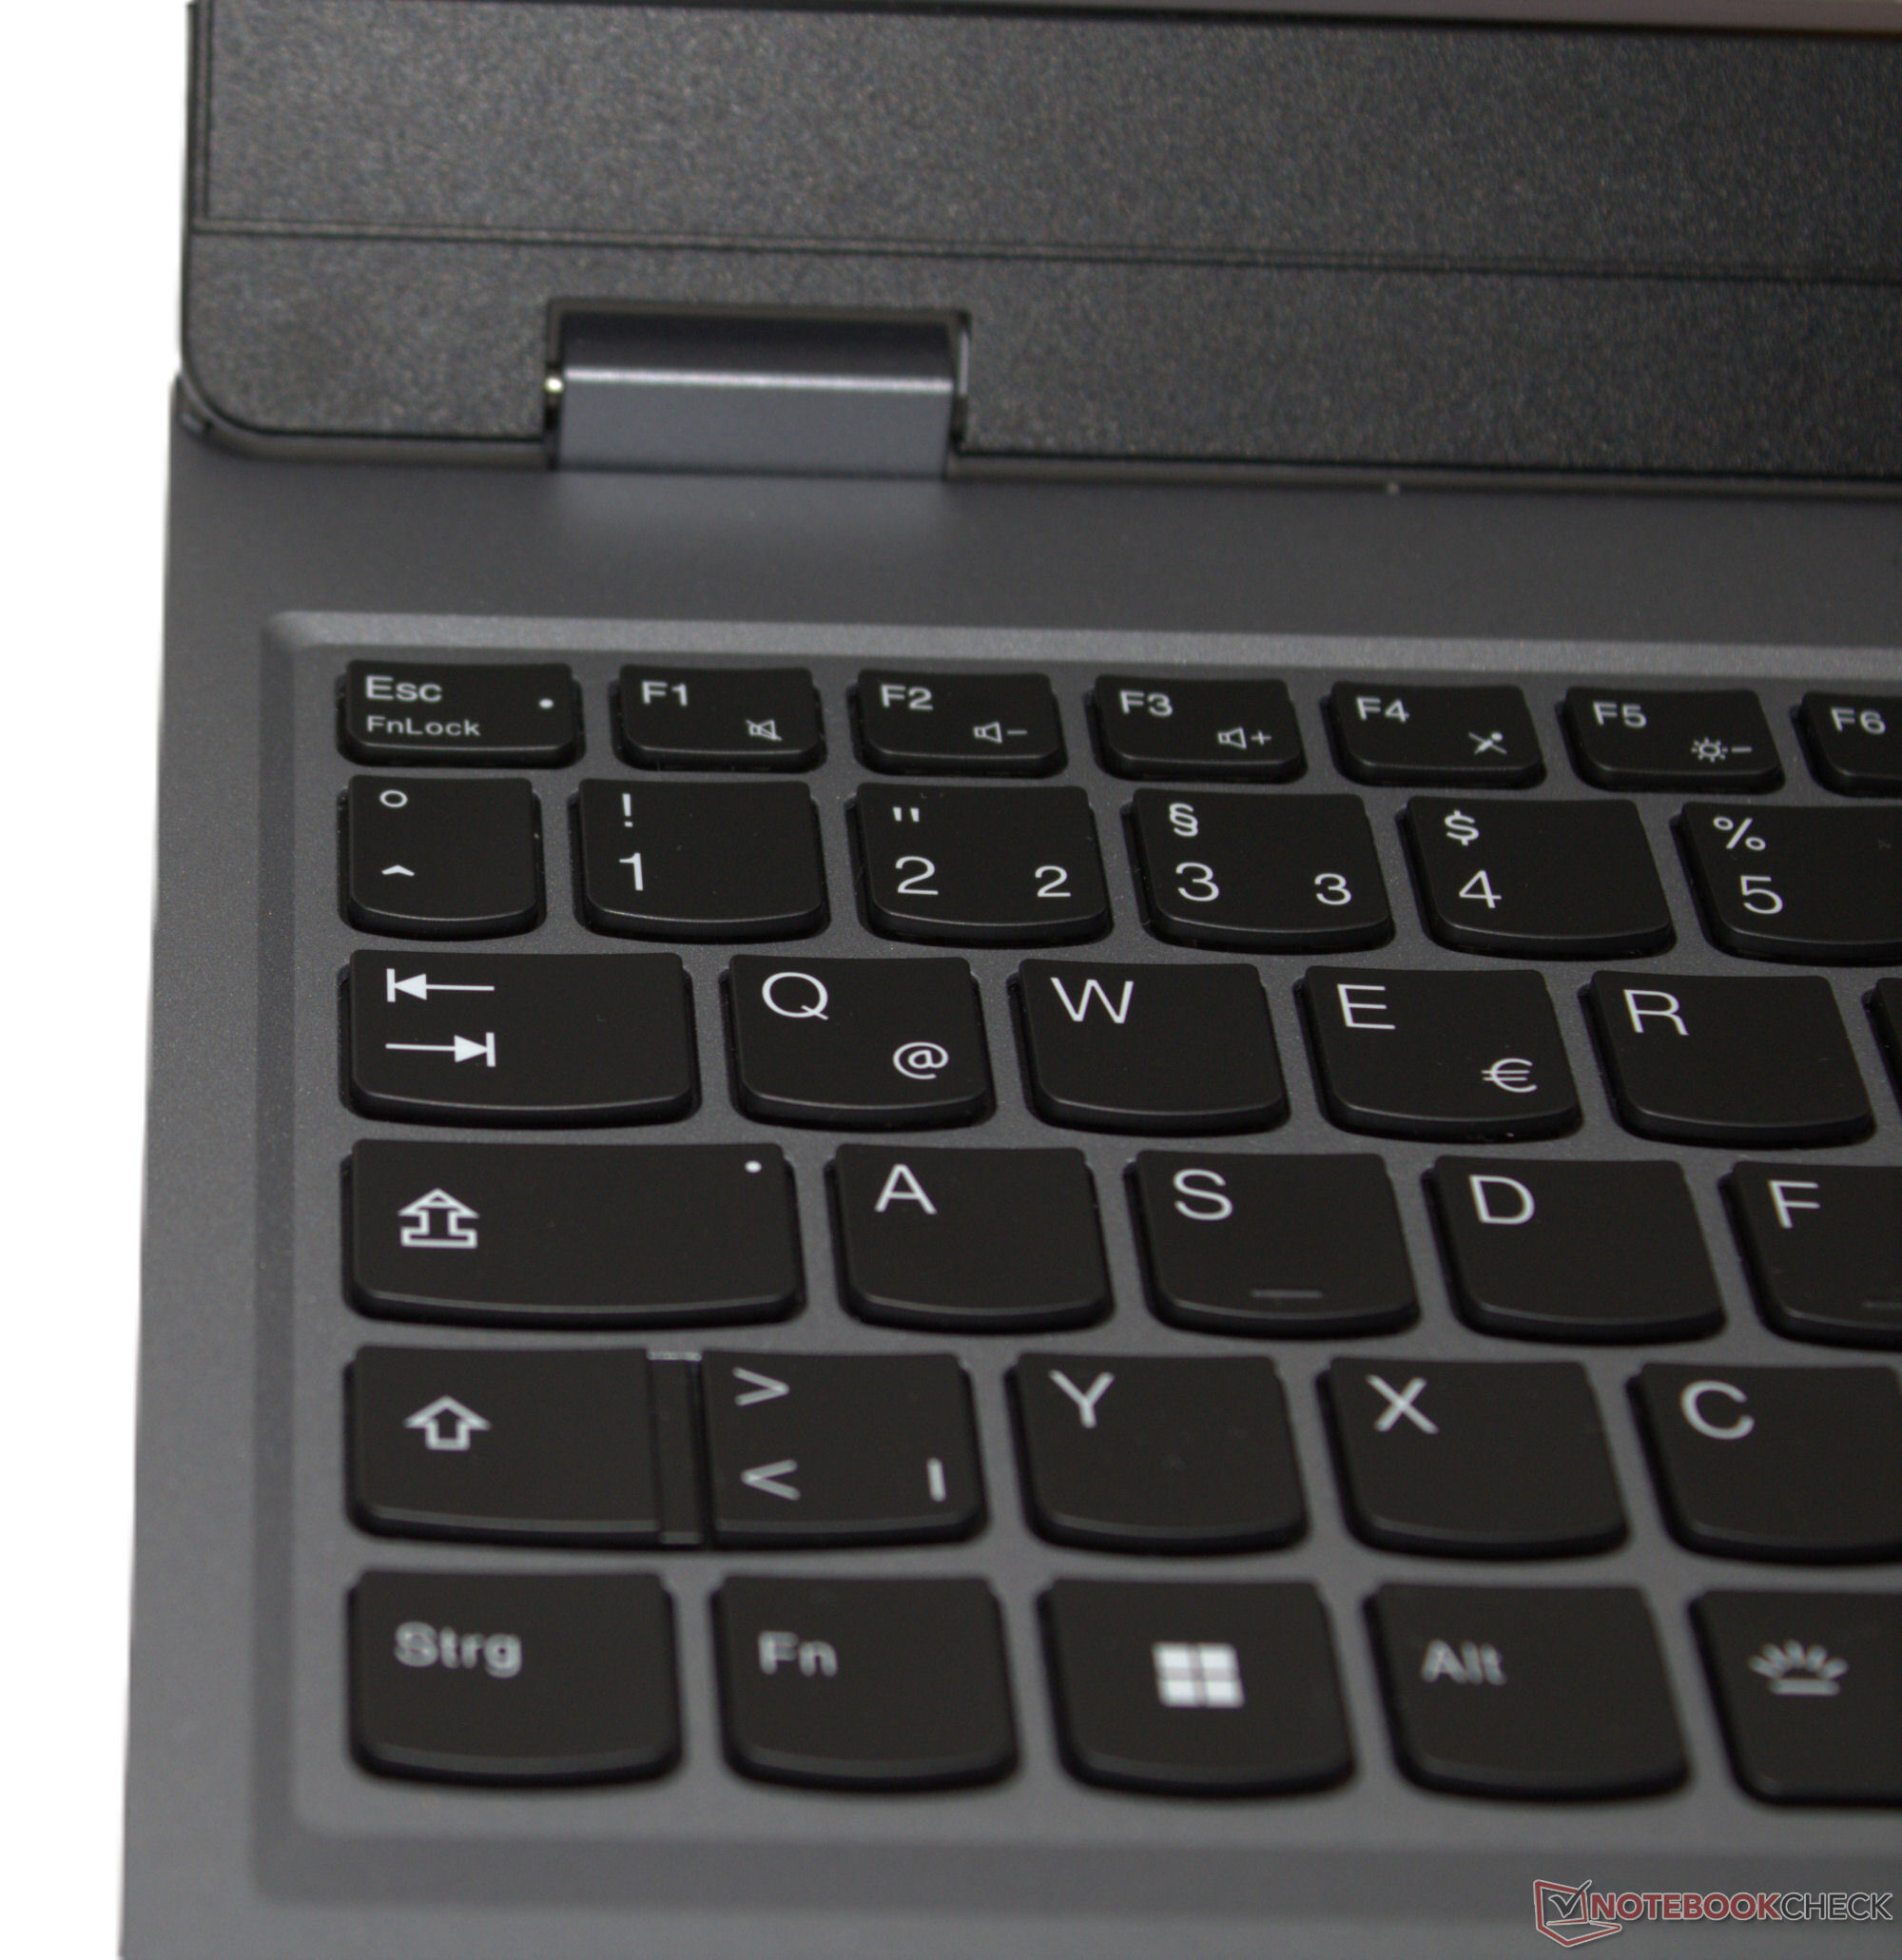
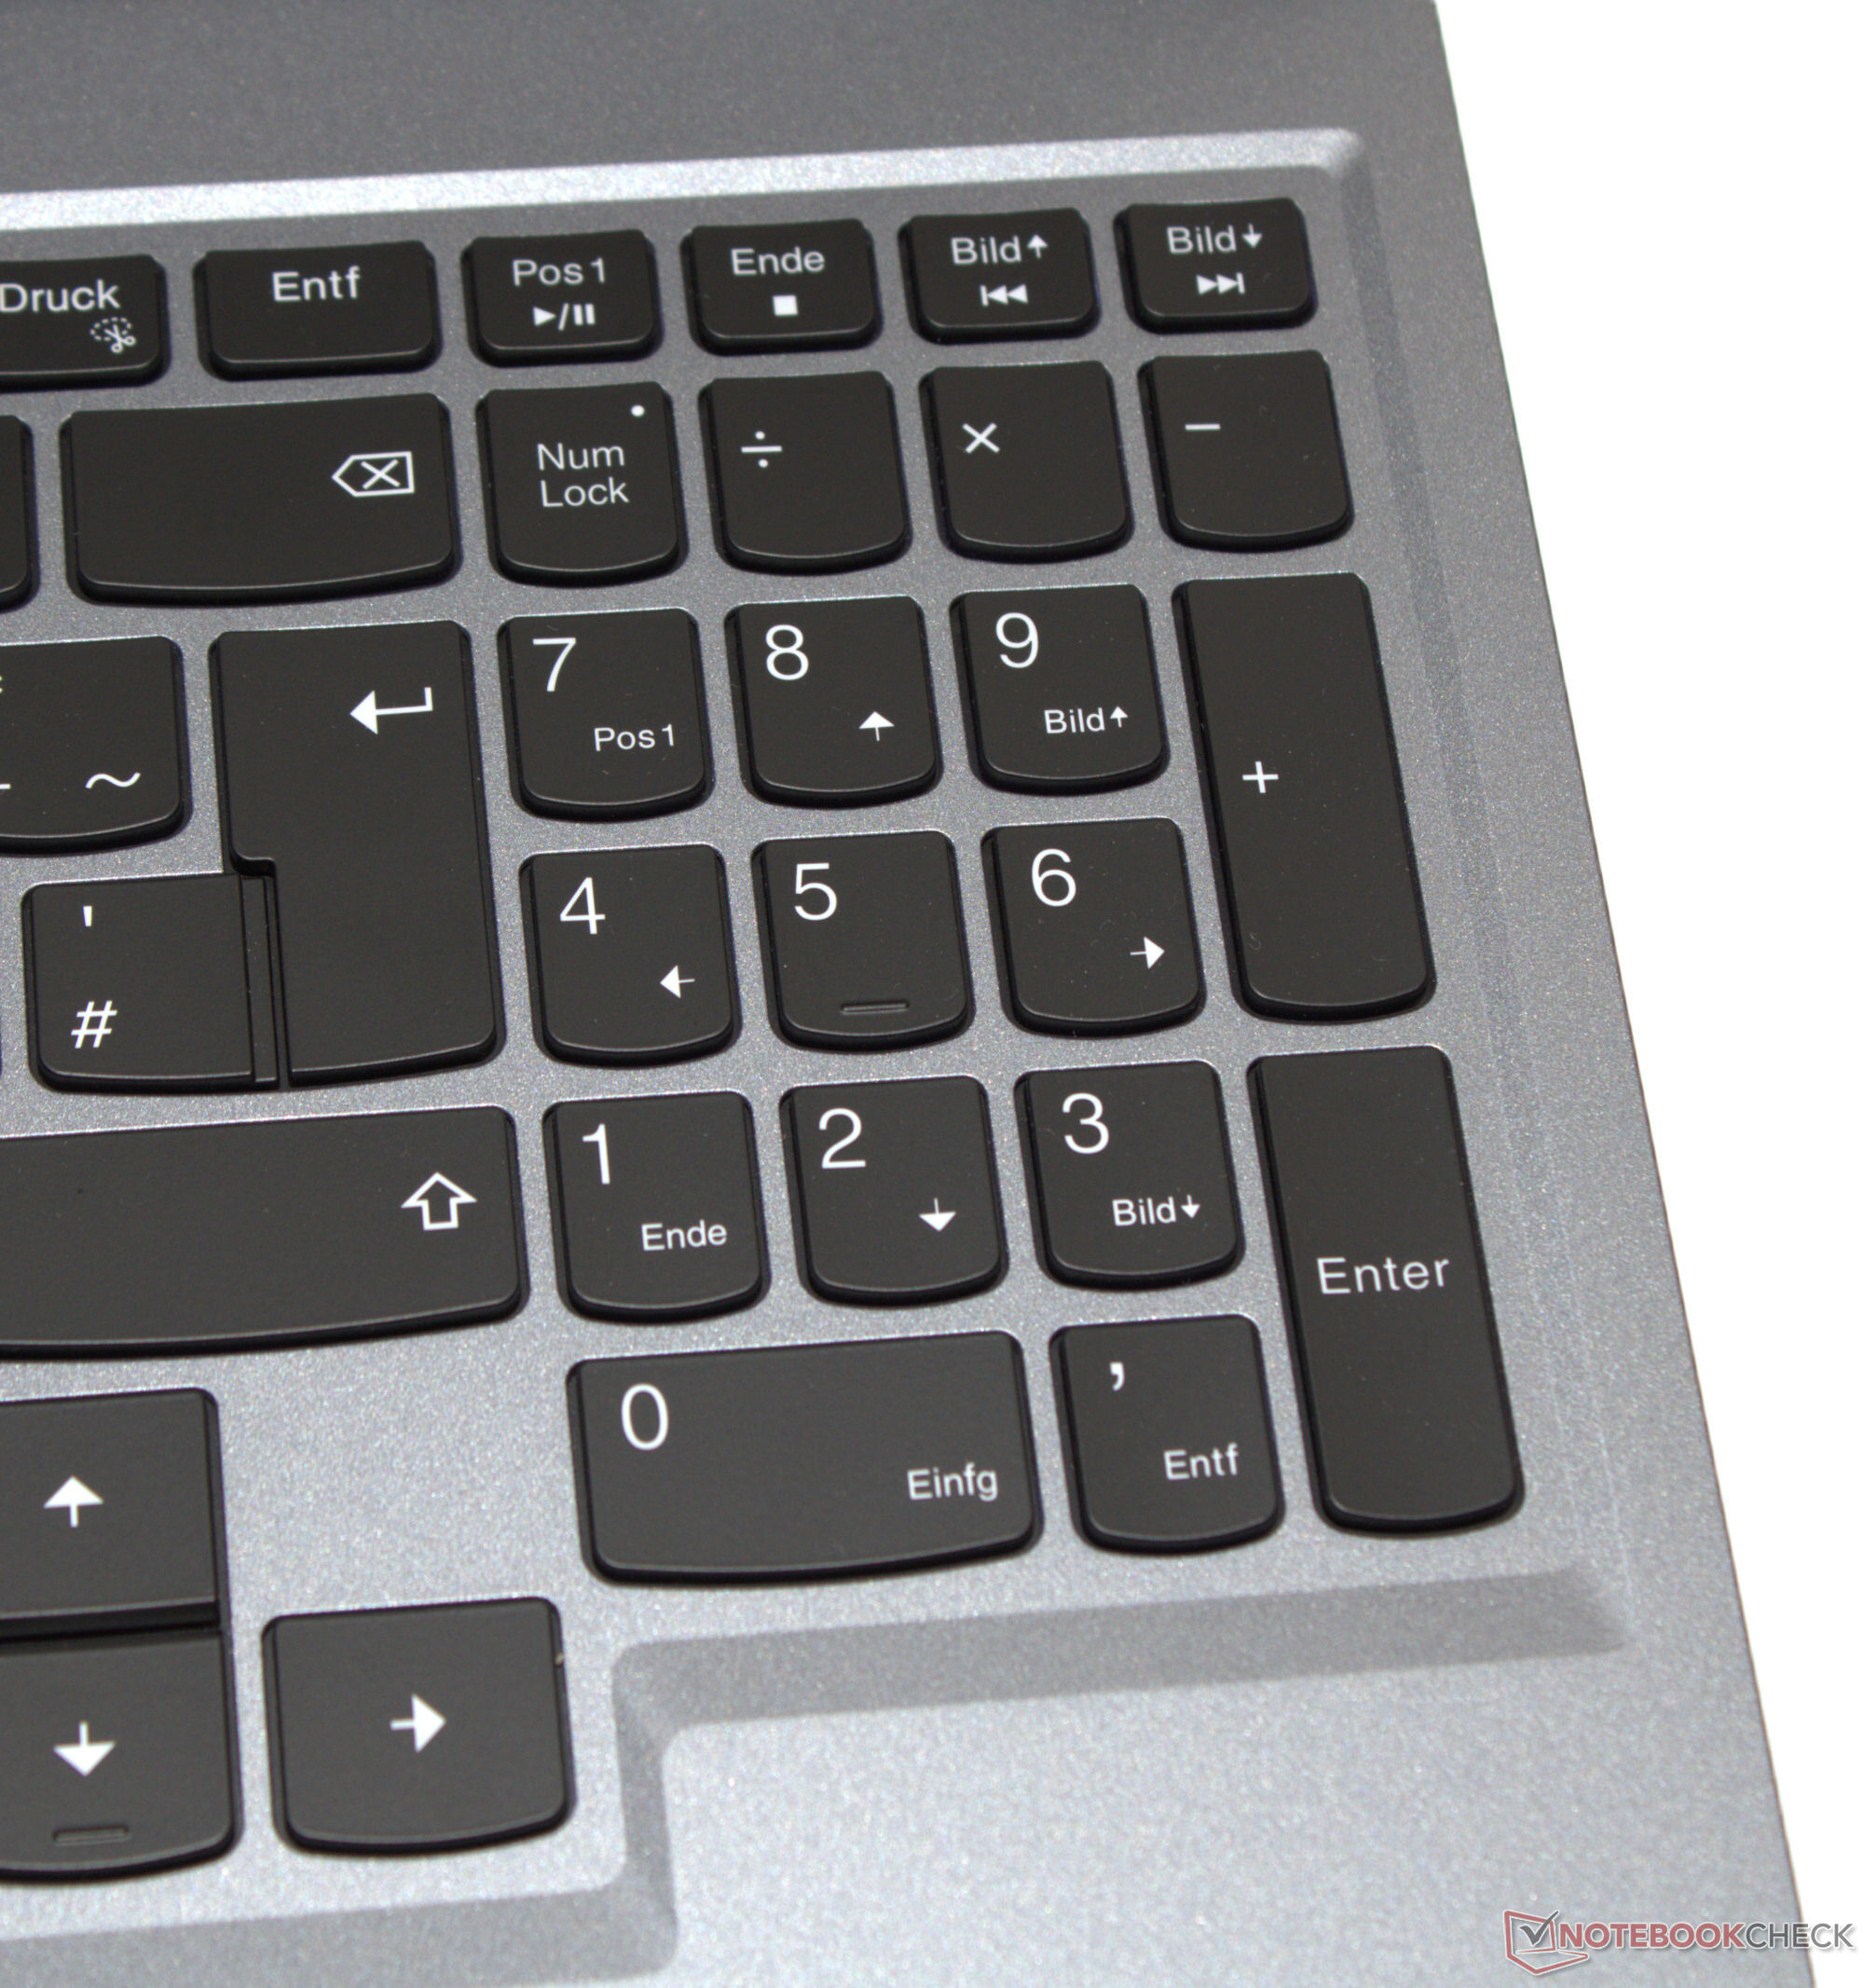
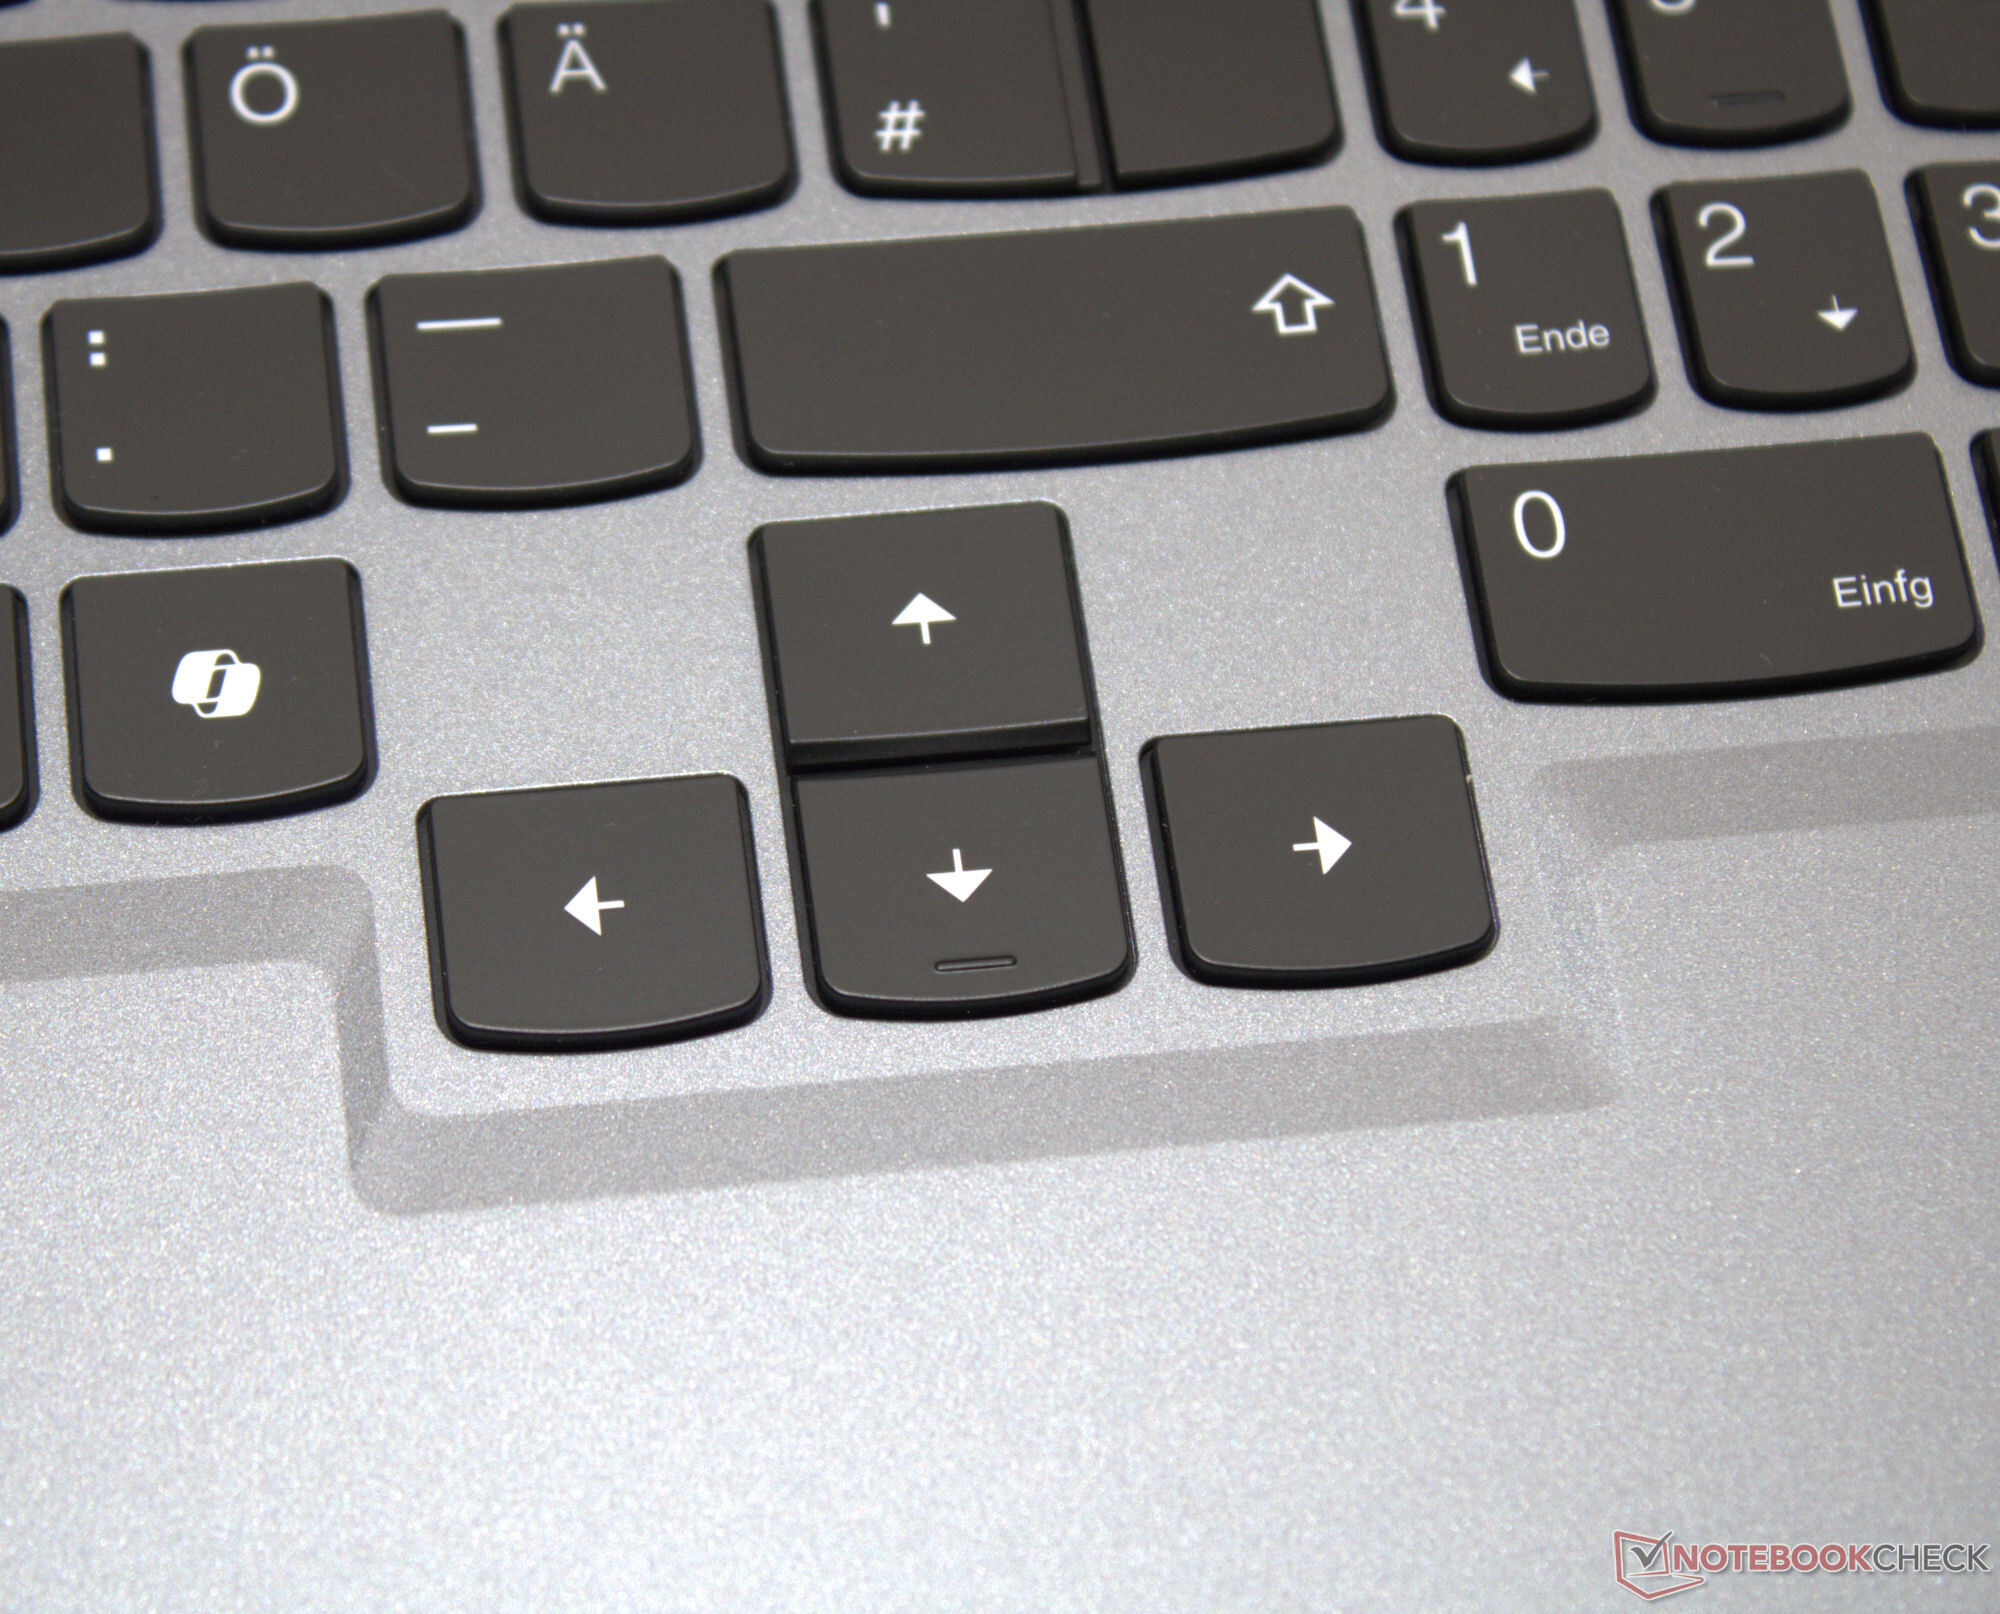
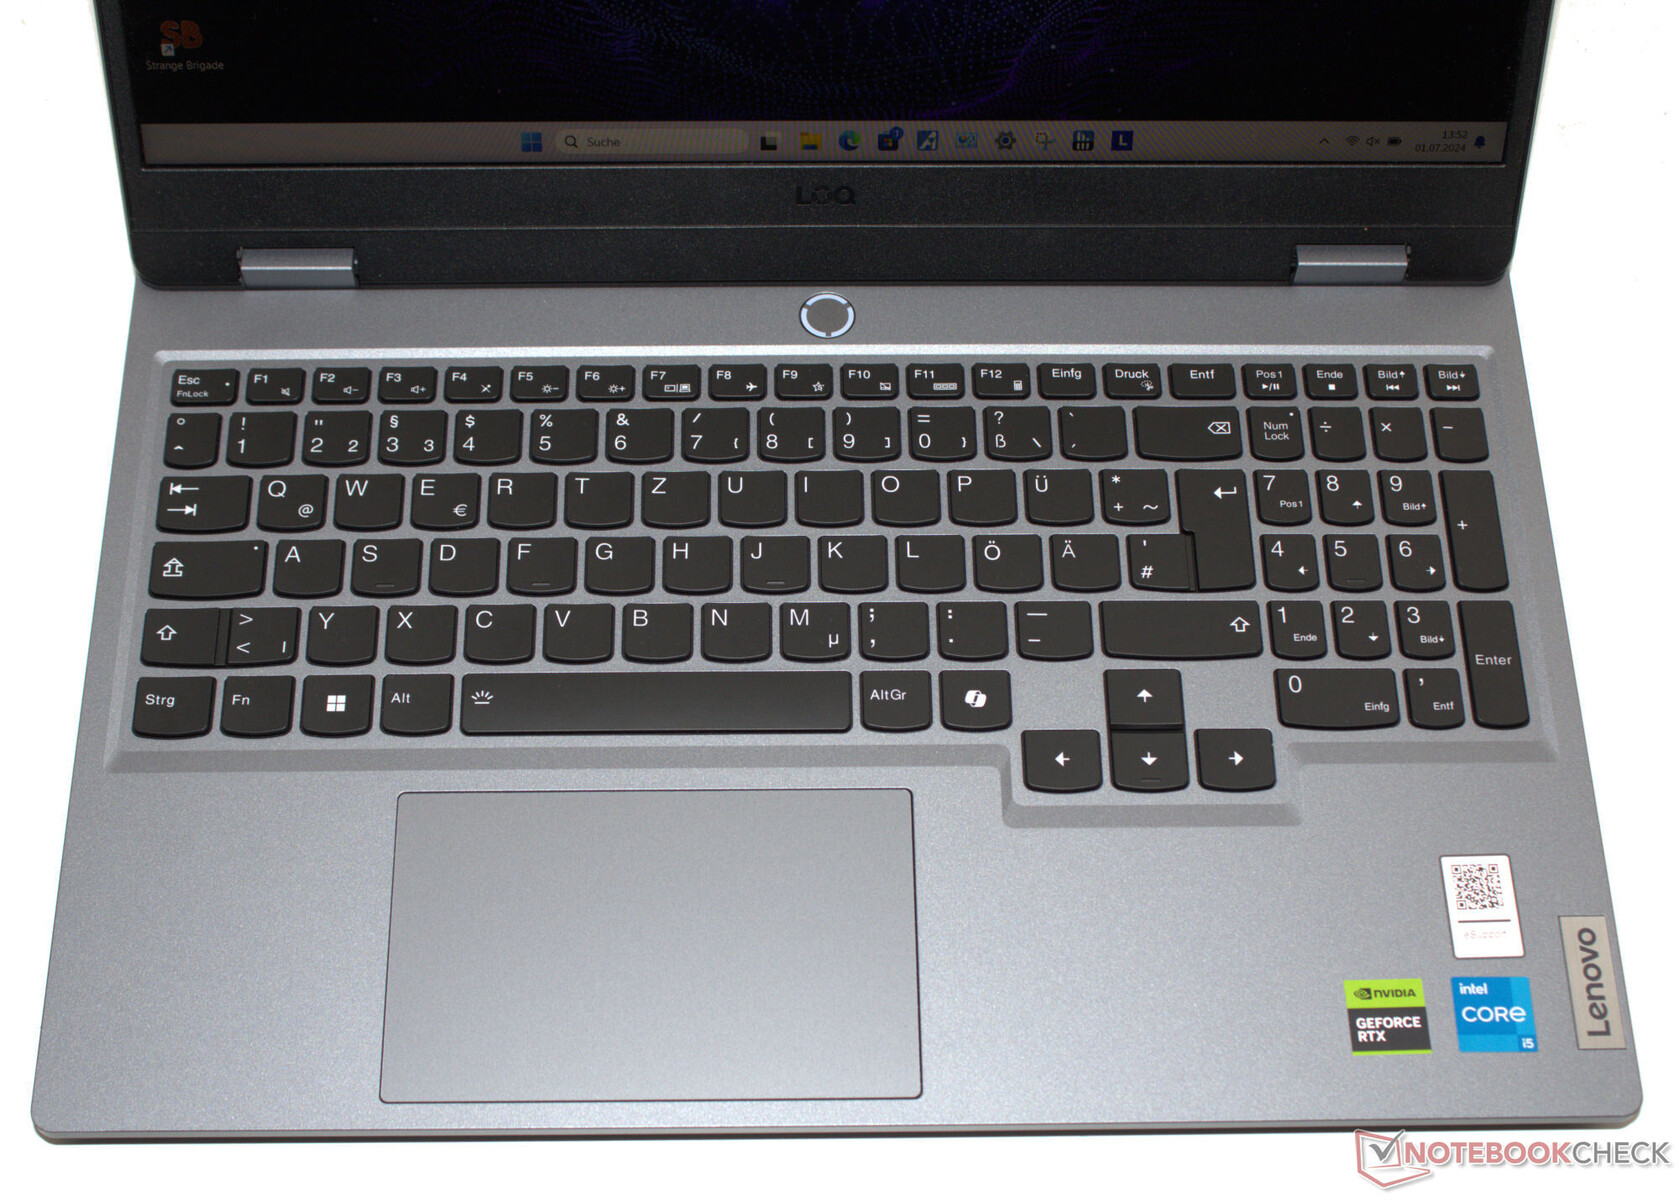
Giriş aygıtları - Lenovo dizüstü bilgisayarda büyük ok tuşları bulunur
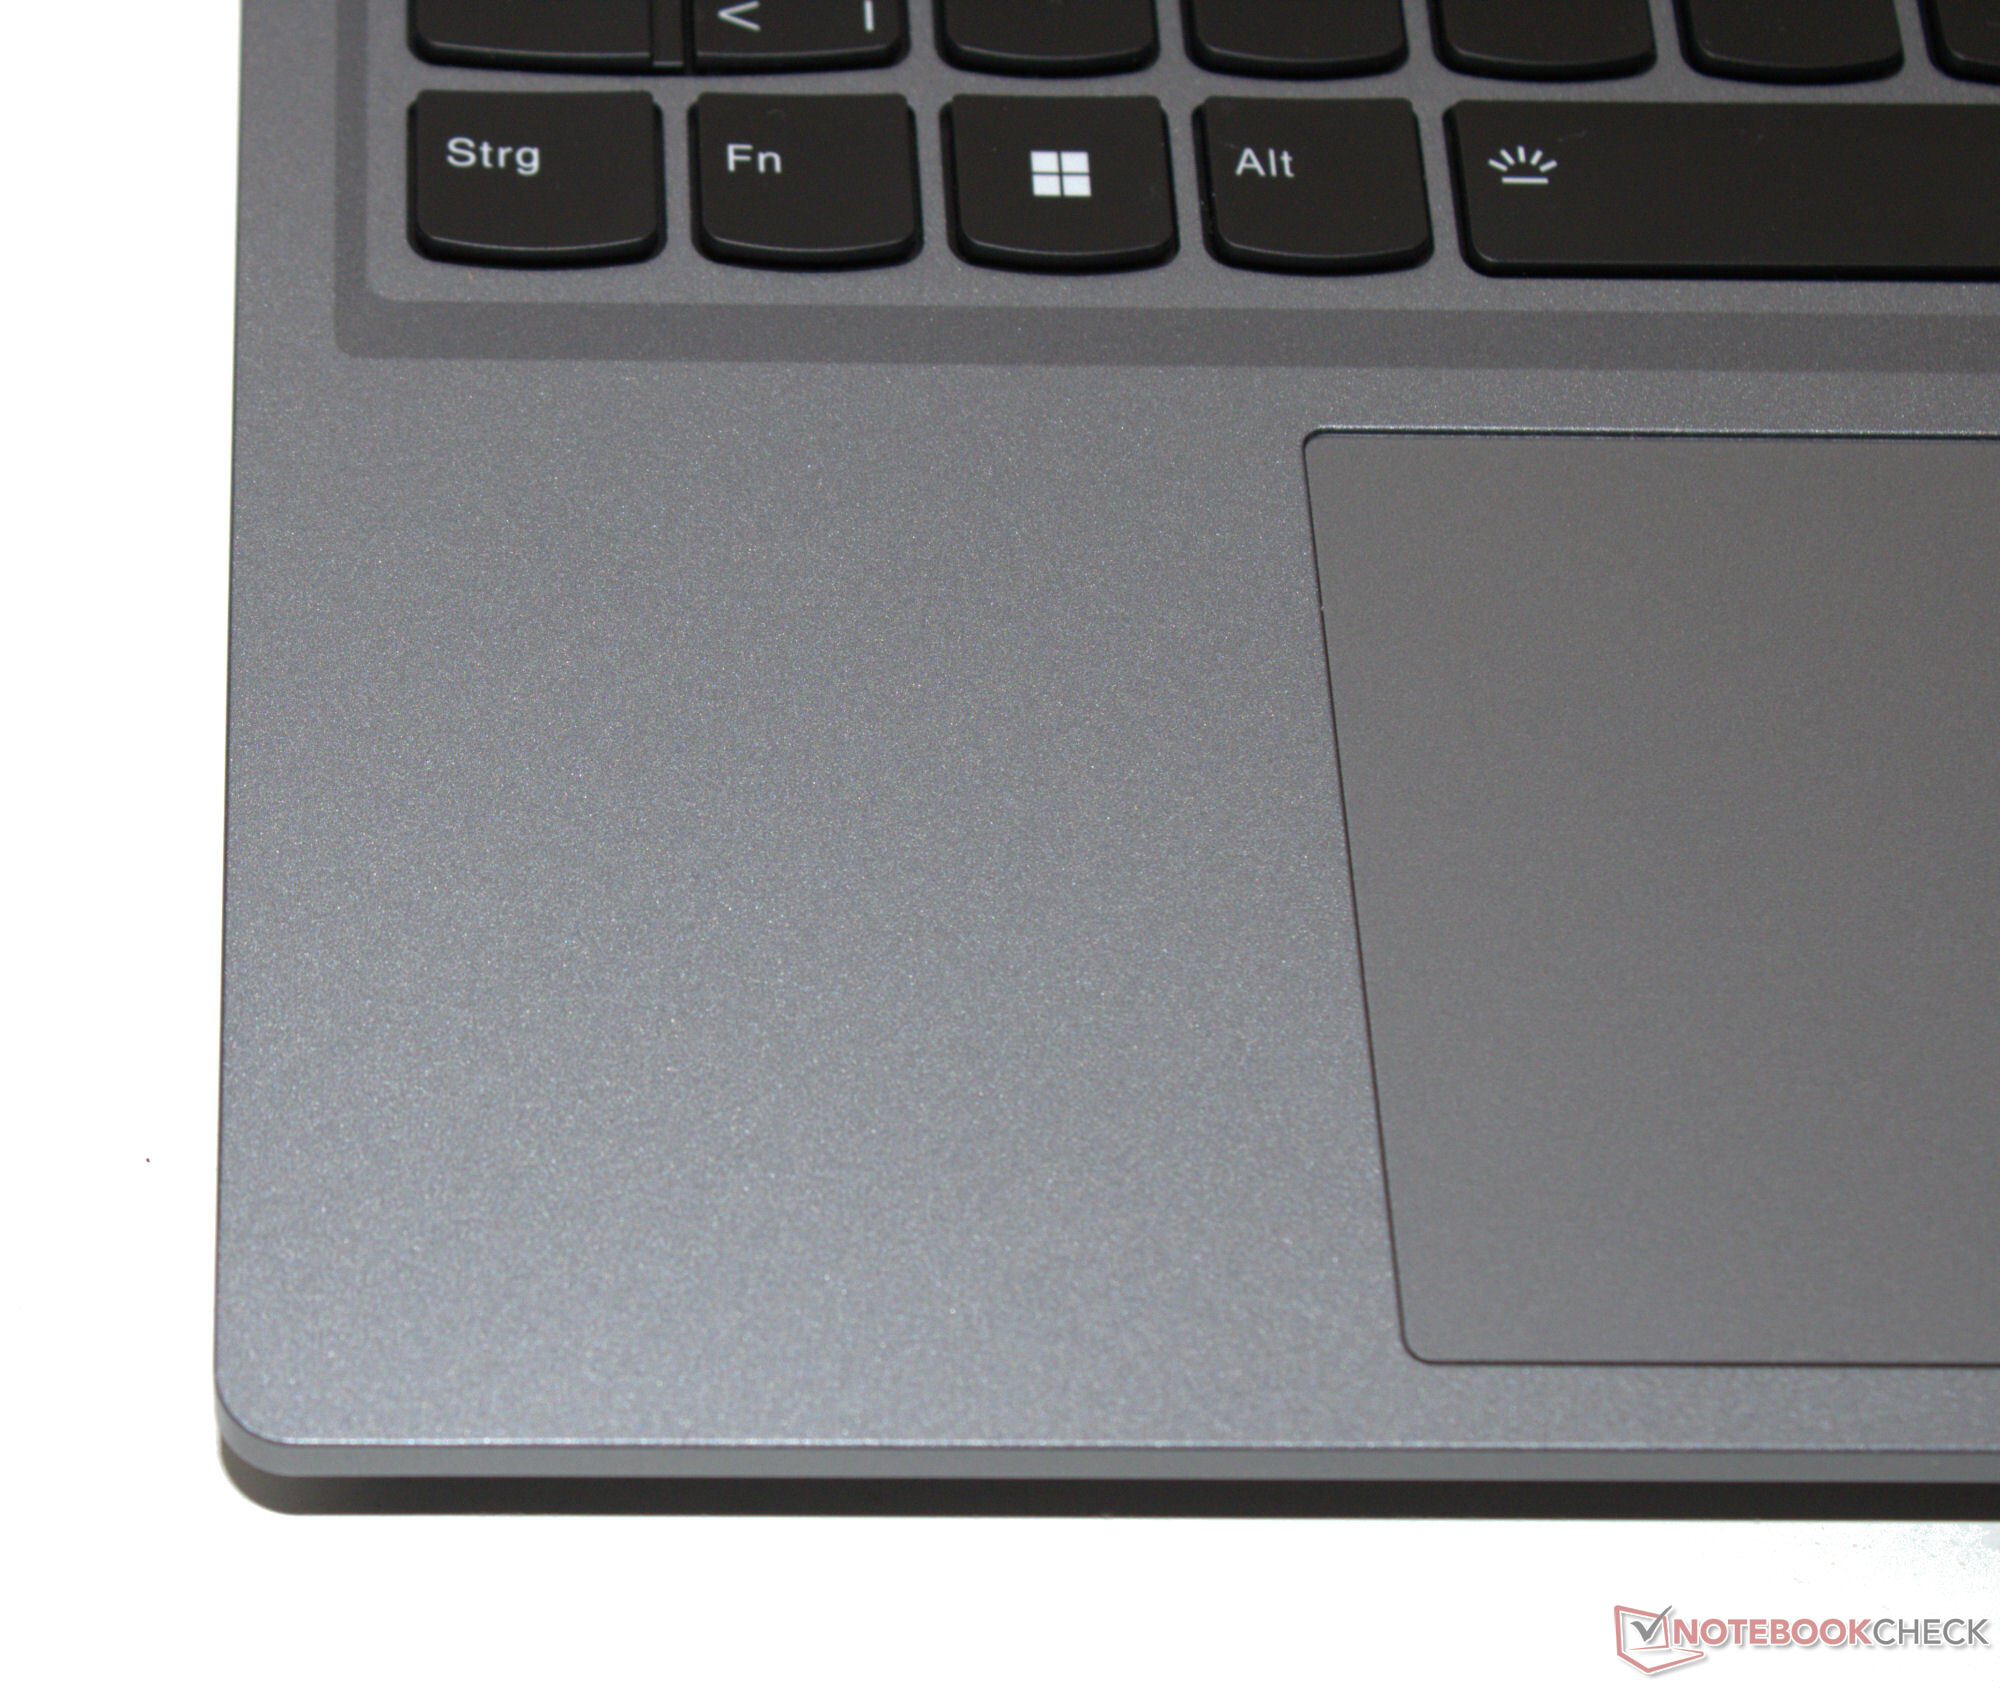
Beyaz arka aydınlatmalı chiclet klavye, dizüstü bilgisayarın tüm genişliği boyunca uzanır; ayrıca sayısal bir tuş takımına sahiptir. Tuşların şekli ve düzeni Lenovo'nun bilindik düzenine uygun. İçbükey tuşlar hoş bir direnç ve net bir basınç noktası sunuyor. Klavye yazarken hafifçe eğiliyor, ancak bu bir sorun değil. Olumlu bir özellik: Ofset, tam boyutlu ok tuşlarının kullanımı rahat. Kısa bir kaldırma ve net basınç noktasına sahip çoklu dokunmatik tıklama yüzeyi (yaklaşık 12 x 7,5 cm) fare yerine kullanılabiliyor.
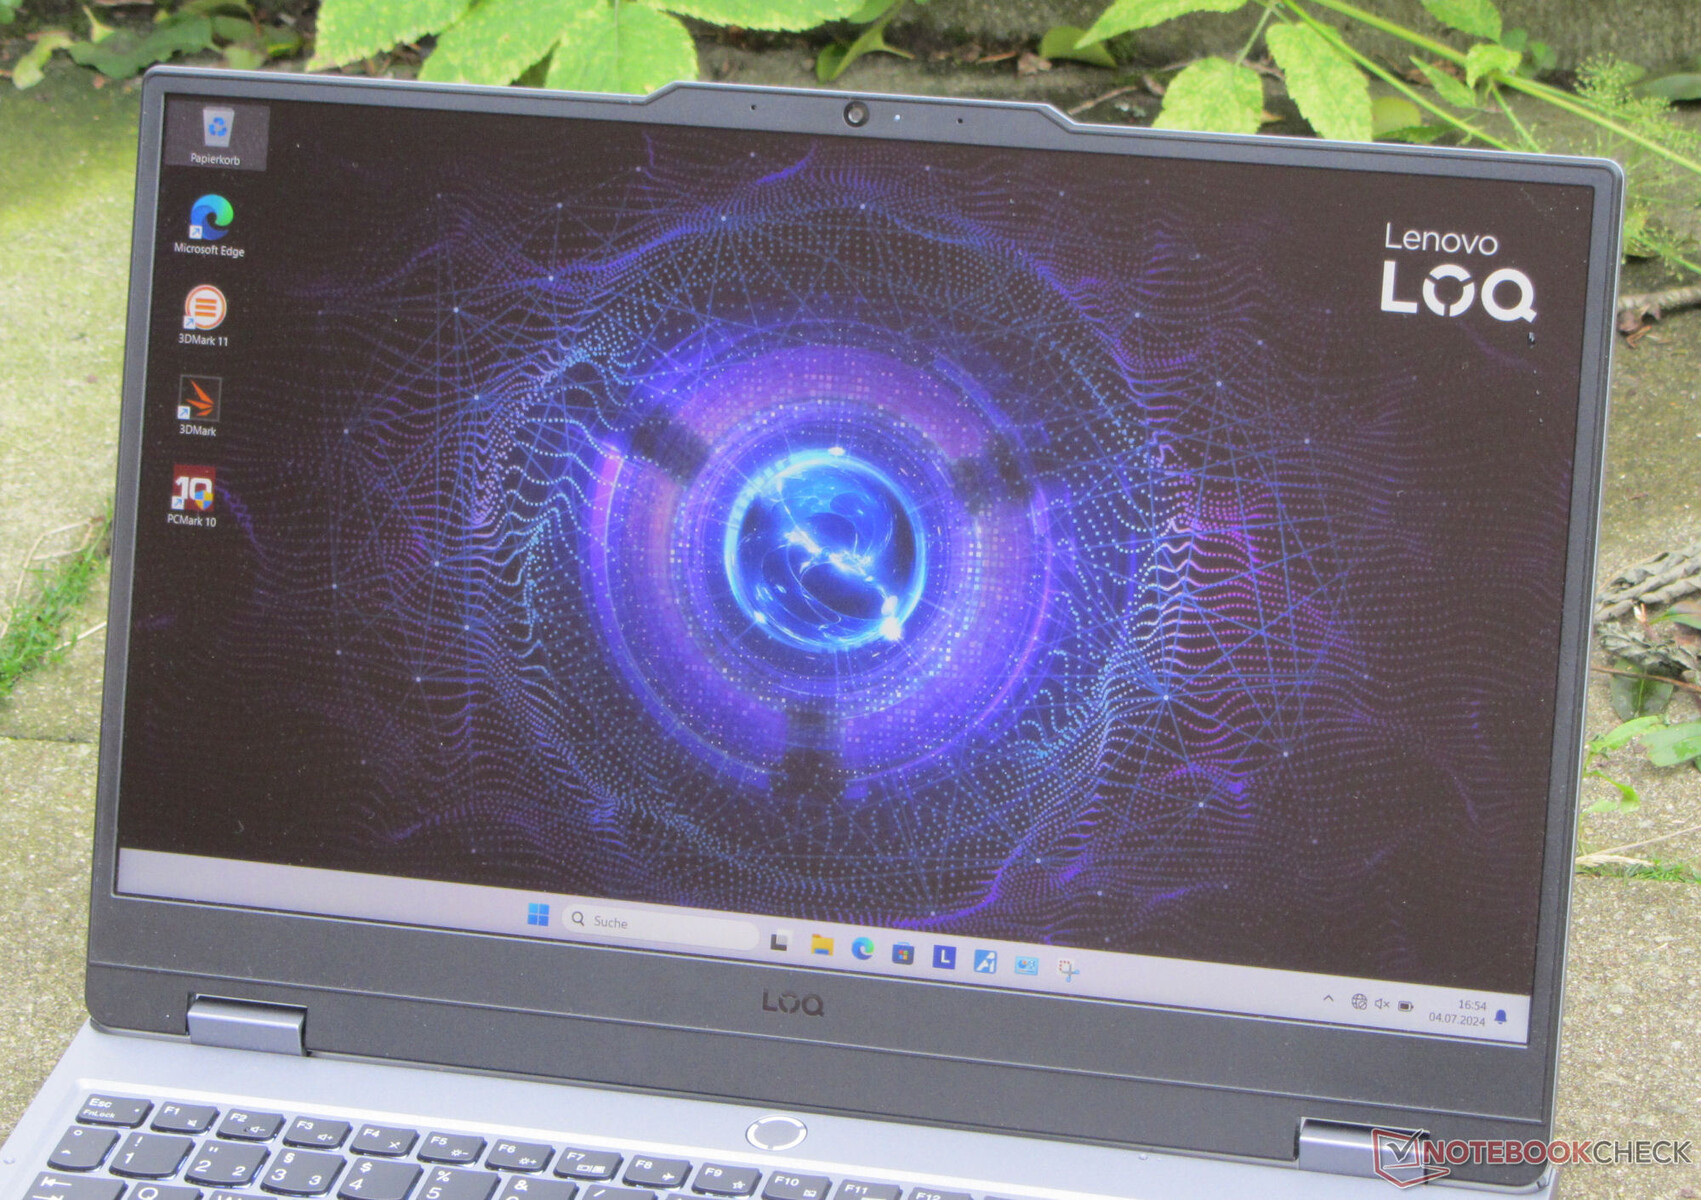
Ekran - IPS yerleşik
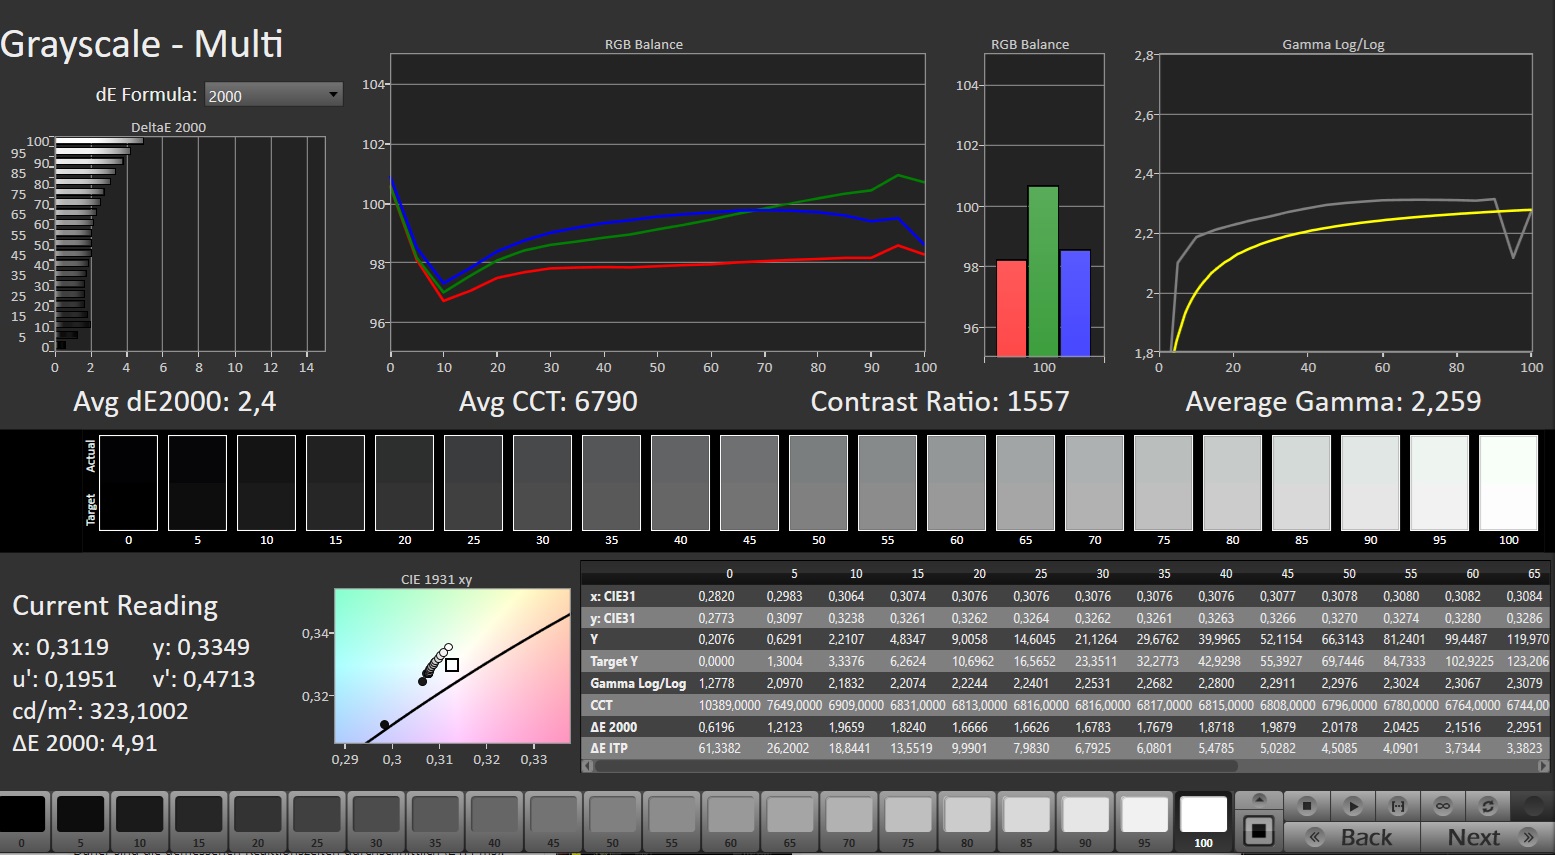
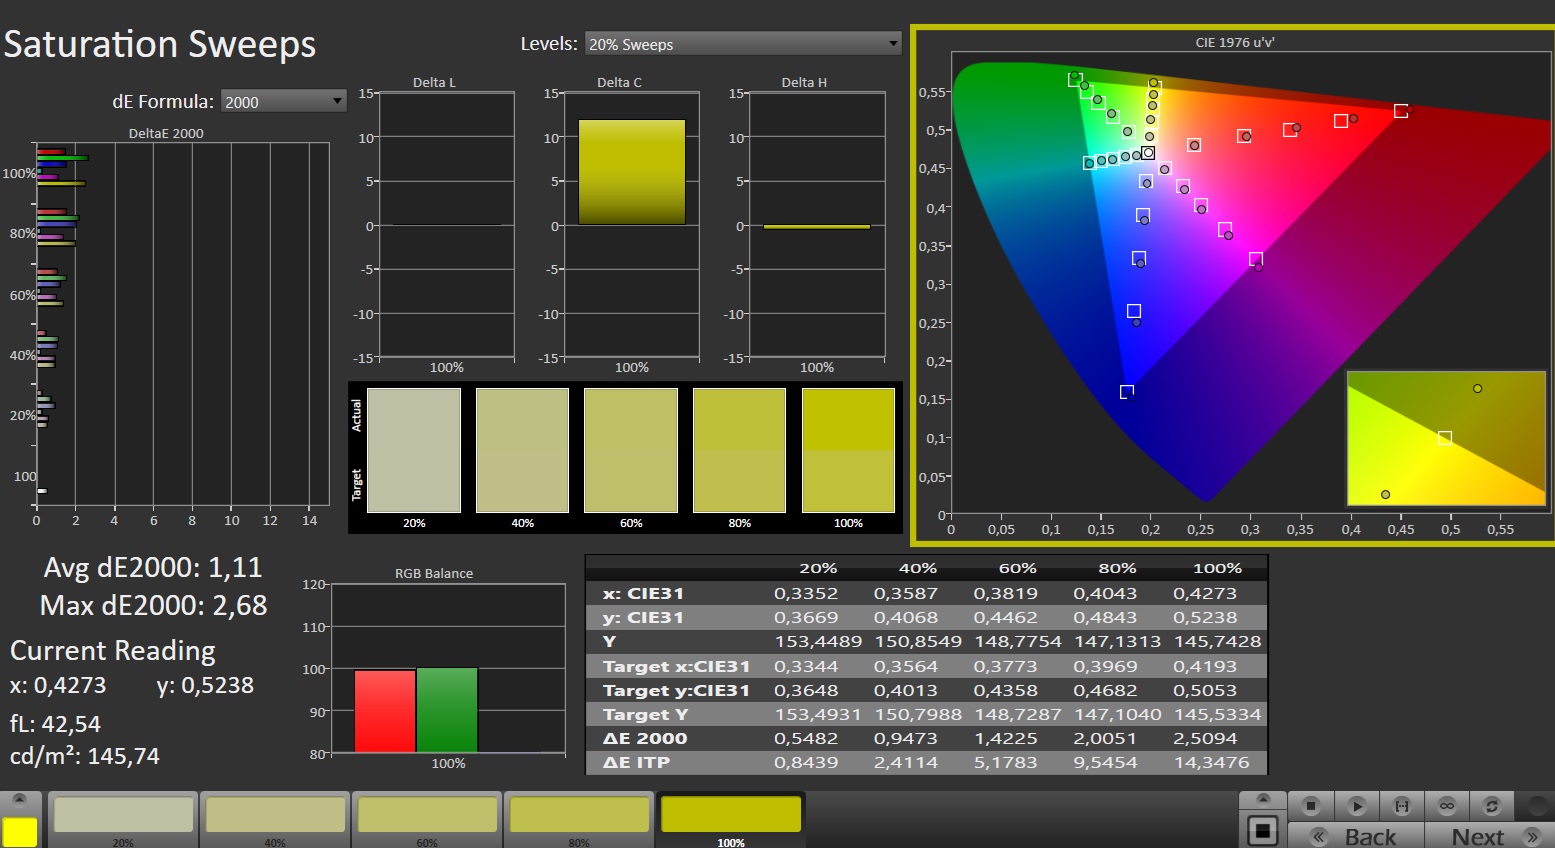
Lenovo, LOQ'yu G-Sync desteği de dahil olmak üzere 16:9 en boy oranına sahip görüş açısına dayanıklı 144 Hz panel (FHD, IPS) ile donattı. İyi kontrastlar, biraz düşük maksimum parlaklık ile dengeleniyor. Genel olarak, ekran iç mekan kullanımı için tasarlanmıştır, ancak uygun hava koşullarında dış mekandan da okunabilir. Testimizde PWM titremesi tespit edilmedi.

| |||||||||||||||||||||||||
Aydınlatma: 88 %
Batarya modunda parlaklık: 306 cd/m²
Kontrast: 1457:1 (Siyah: 0.21 cd/m²)
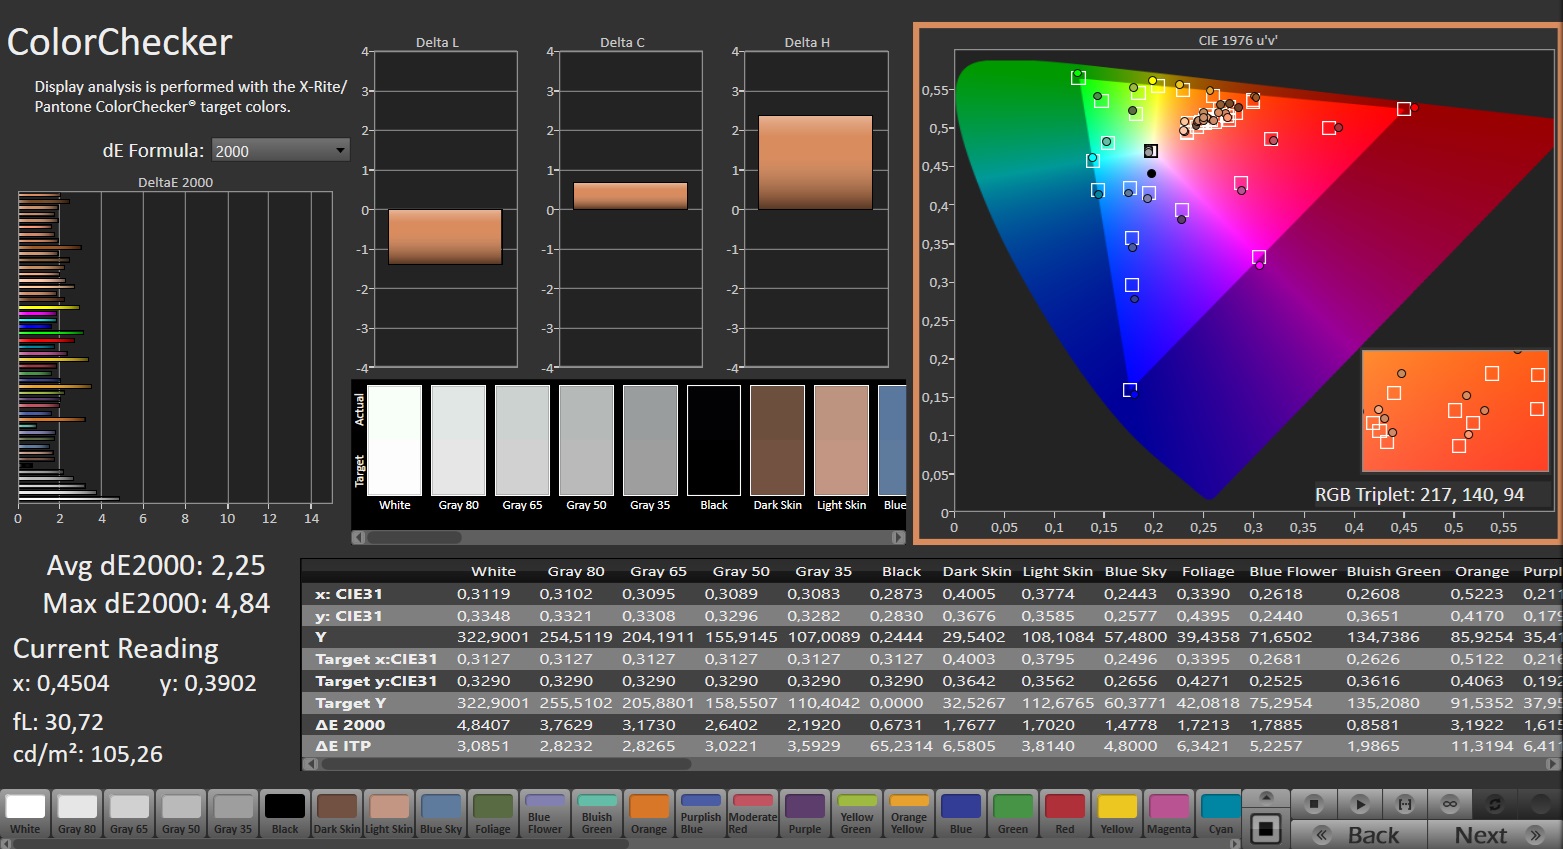
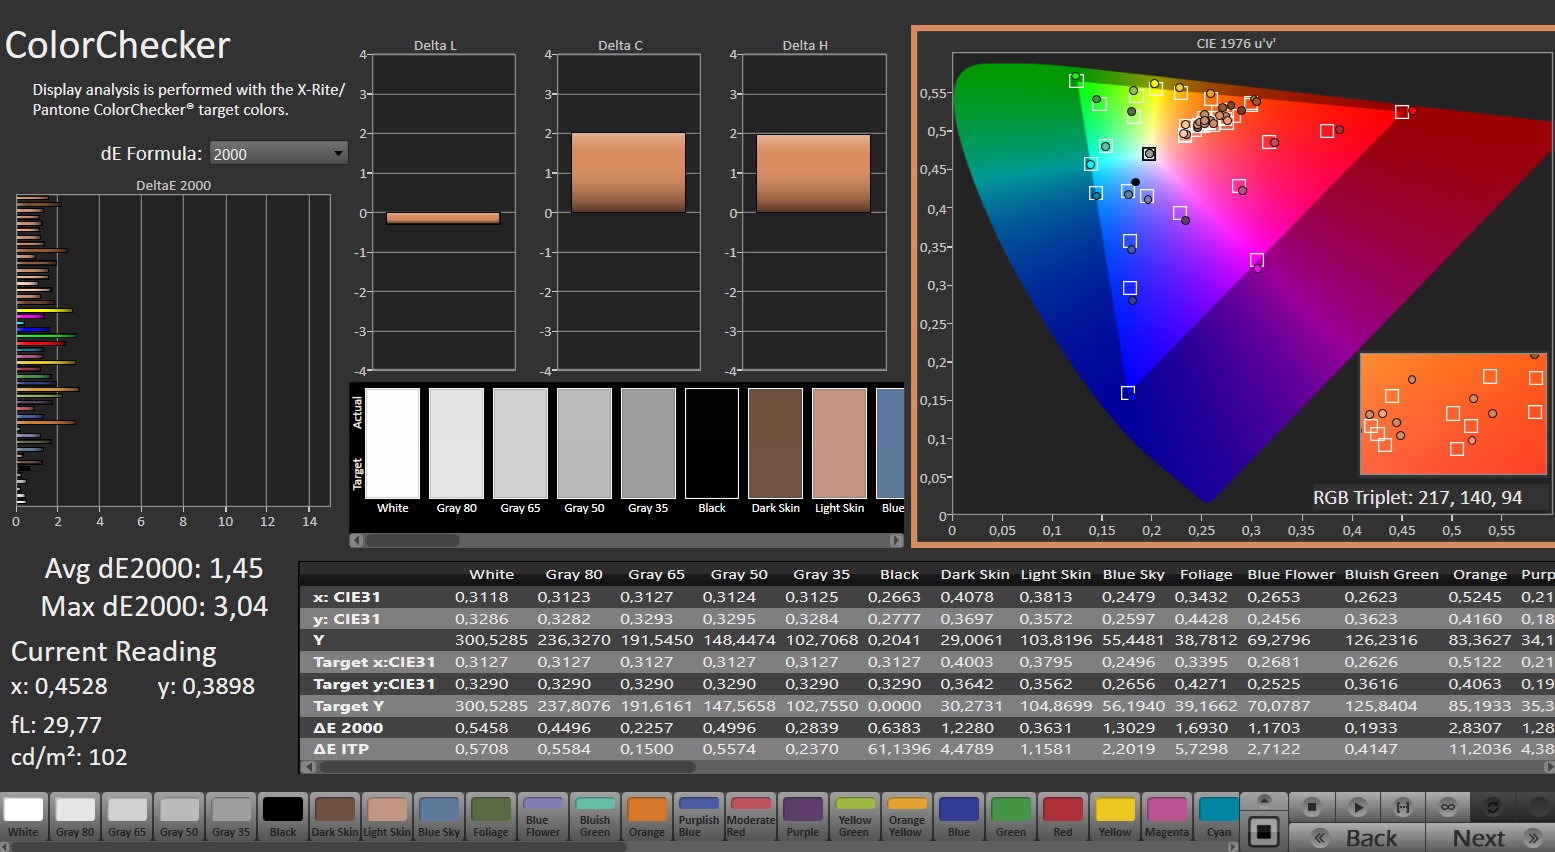
ΔE ColorChecker Calman: 2.25 | ∀{0.5-29.43 Ø4.71}
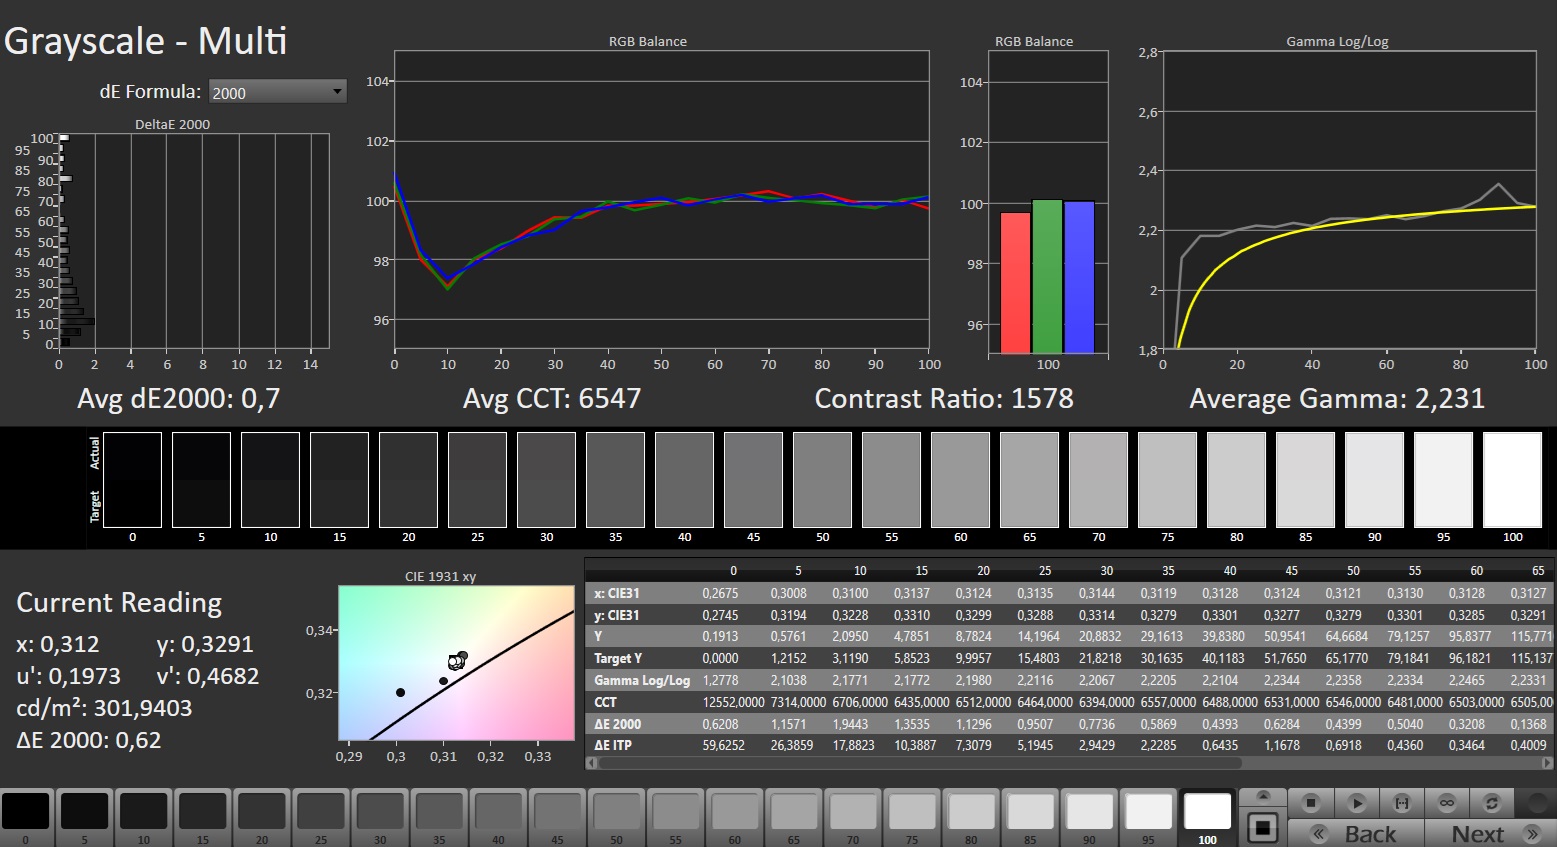
calibrated: 1.45
ΔE Greyscale Calman: 2.4 | ∀{0.09-98 Ø4.96}
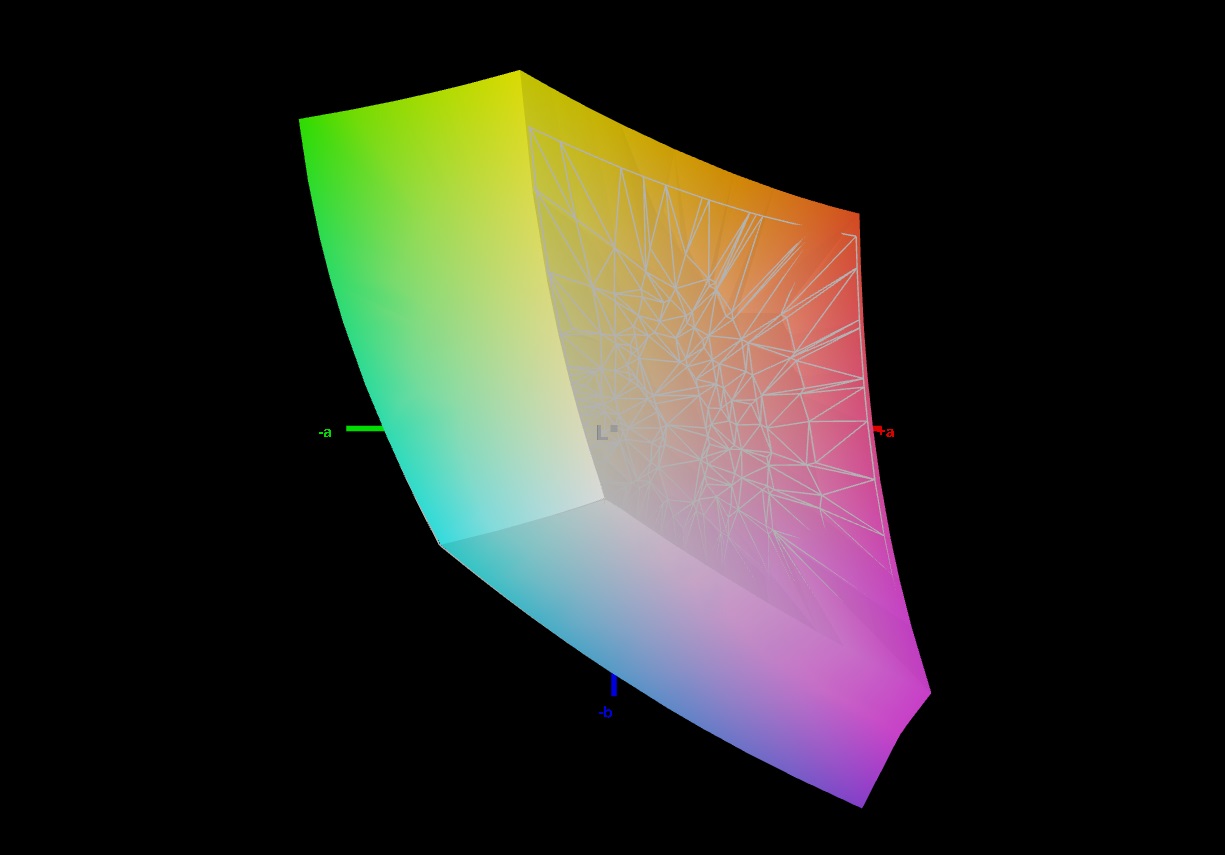
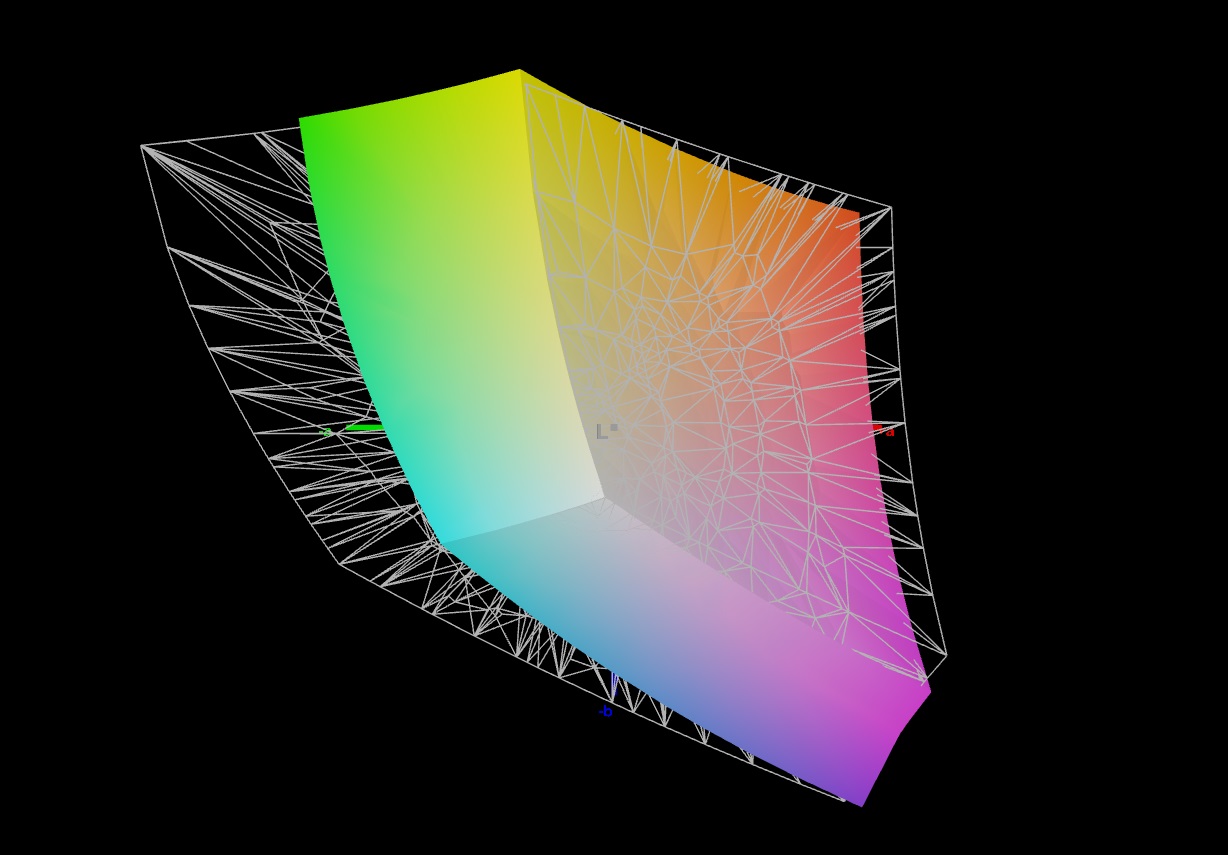
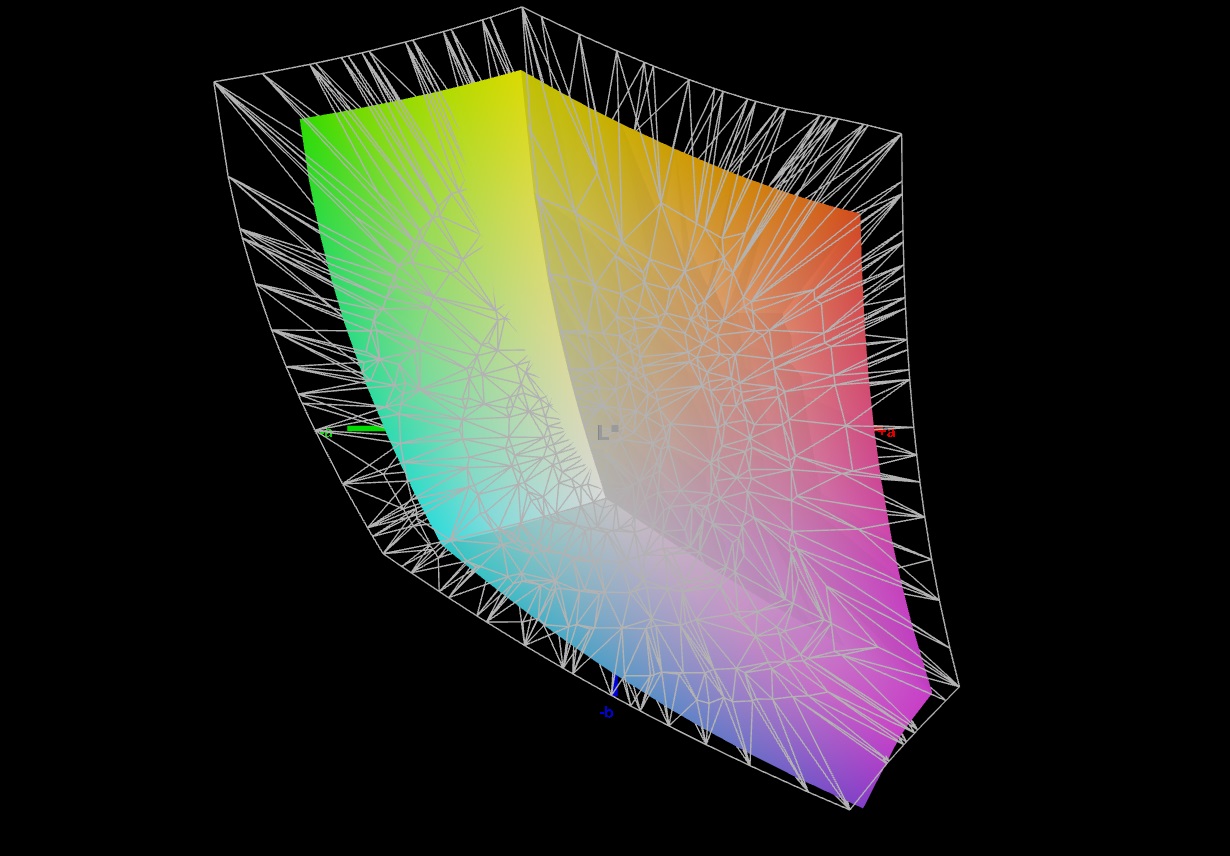
72.6% AdobeRGB 1998 (Argyll 3D)
99.1% sRGB (Argyll 3D)
73.7% Display P3 (Argyll 3D)
Gamma: 2.259
CCT: 6790 K
| Lenovo LOQ 15IRX9 BOE NJ NE156FHM-NX9, IPS, 1920x1080, 15.6" | Schenker XMG Core 15 (M24) BOE NJ NE153QDM-NZ1 (BOE0C8E), IPS, 2560x1600, 15.3" | Gigabyte G6X 9KG (2024) BOE NE160WUM-NX6, IPS, 1920x1200, 16" | HP Victus 16 (2024) Chi Mei CMN163E, IPS, 1920x1080, 16.1" | Dell G16, i7-13650HX, RTX 4060 Chi Mei CMN161D (160GME), IPS, 2560x1600, 16" | |
|---|---|---|---|---|---|
| Display | 1% | -40% | -41% | -5% | |
| Display P3 Coverage (%) | 73.7 | 73.2 -1% | 41.8 -43% | 41.3 -44% | 67.5 -8% |
| sRGB Coverage (%) | 99.1 | 100 1% | 62.4 -37% | 61.7 -38% | 98.5 -1% |
| AdobeRGB 1998 Coverage (%) | 72.6 | 74.6 3% | 43.3 -40% | 42.7 -41% | 69.3 -5% |
| Response Times | 68% | 4% | 25% | 68% | |
| Response Time Grey 50% / Grey 80% * (ms) | 42.2 ? | 9.6 ? 77% | 40.5 ? 4% | 28.6 ? 32% | 7.6 ? 82% |
| Response Time Black / White * (ms) | 22.6 ? | 9.2 ? 59% | 21.6 ? 4% | 18.7 ? 17% | 10.4 ? 54% |
| PWM Frequency (Hz) | |||||
| Screen | 6% | -68% | -78% | -15% | |
| Brightness middle (cd/m²) | 306 | 635 108% | 353 15% | 287 -6% | 369 21% |
| Brightness (cd/m²) | 287 | 604 110% | 318 11% | 288 0% | 344 20% |
| Brightness Distribution (%) | 88 | 91 3% | 81 -8% | 86 -2% | 89 1% |
| Black Level * (cd/m²) | 0.21 | 0.64 -205% | 0.21 -0% | 0.19 10% | 0.26 -24% |
| Contrast (:1) | 1457 | 992 -32% | 1681 15% | 1511 4% | 1419 -3% |
| Colorchecker dE 2000 * | 2.25 | 1.89 16% | 5.21 -132% | 5.46 -143% | 3.04 -35% |
| Colorchecker dE 2000 max. * | 4.84 | 3.14 35% | 19.95 -312% | 20.36 -321% | 5.56 -15% |
| Colorchecker dE 2000 calibrated * | 1.45 | 1.14 21% | 3.61 -149% | 3.52 -143% | 2.35 -62% |
| Greyscale dE 2000 * | 2.4 | 2.53 -5% | 3.6 -50% | 4.8 -100% | 3.38 -41% |
| Gamma | 2.259 97% | 2.36 93% | 2.367 93% | 2.108 104% | 2.47 89% |
| CCT | 6790 96% | 6434 101% | 7138 91% | 6442 101% | 6040 108% |
| Toplam Ortalama (Program / Ayarlar) | 25% /
14% | -35% /
-52% | -31% /
-55% | 16% /
-1% |
* ... daha küçük daha iyidir
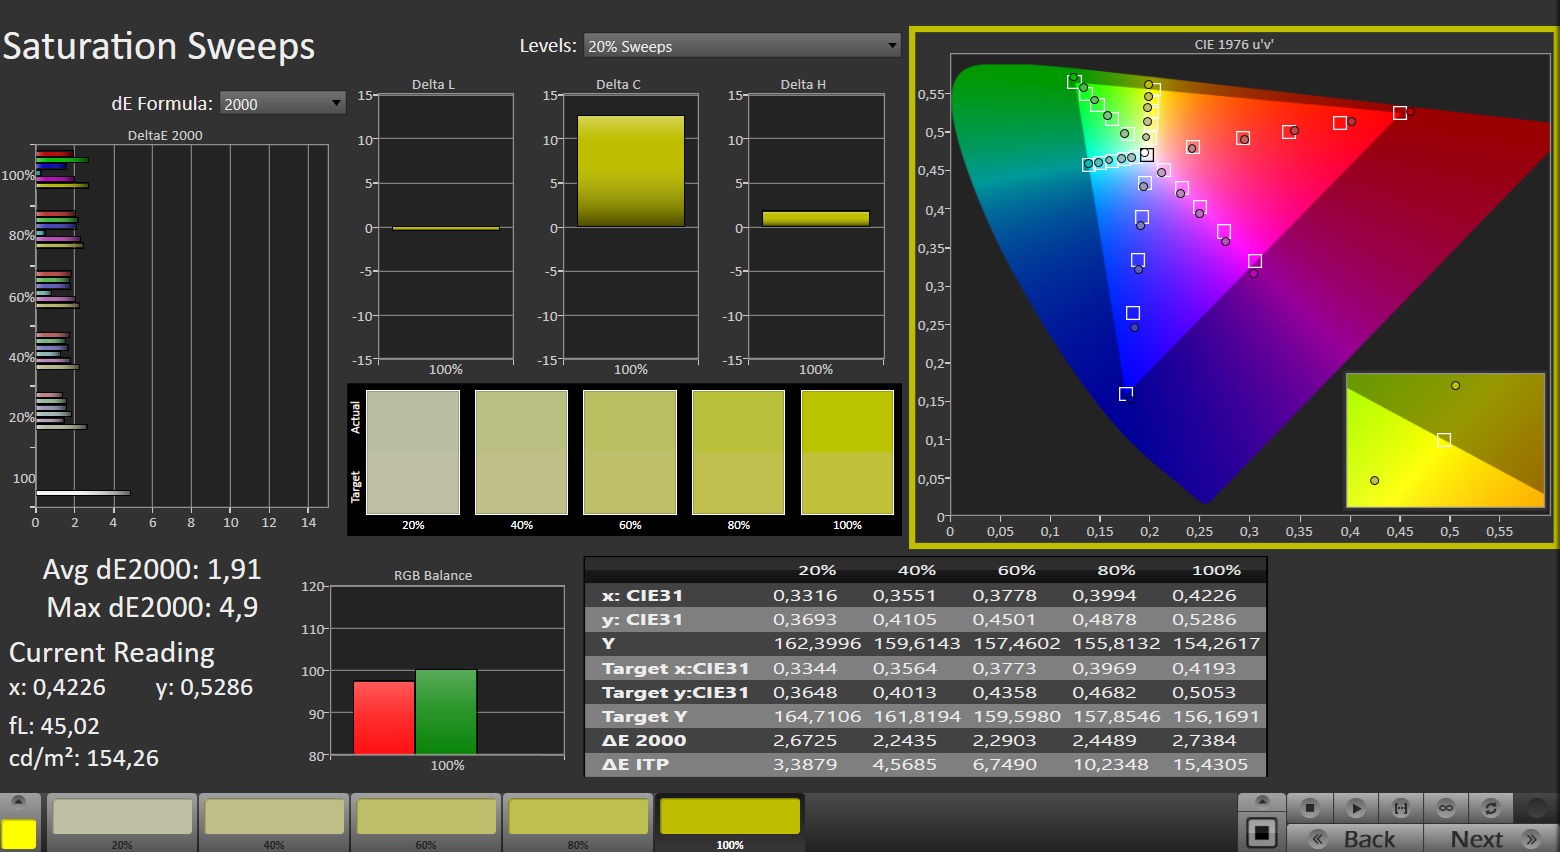
Kutudan çıkar çıkmaz, ekran iyi kalibre edilmiştir: Yaklaşık 2,25 sapma ile hedef değer (DeltaE < 3) karşılanmıştır. Ekranın kalibre edilmesi sapmaları 1,45'e düşürür ve daha dengeli gri tonlar sağlar. Panel, sRGB alanının neredeyse tamamını gösterebilir, ancak AdobeRGB ve DCI P3 alanlarını gösteremez.
Yanıt Sürelerini Görüntüle
| ↔ Tepki Süresi Siyahtan Beyaza | ||
|---|---|---|
| 22.6 ms ... yükseliş ↗ ve sonbahar↘ birleşimi | ↗ 11.2 ms yükseliş | 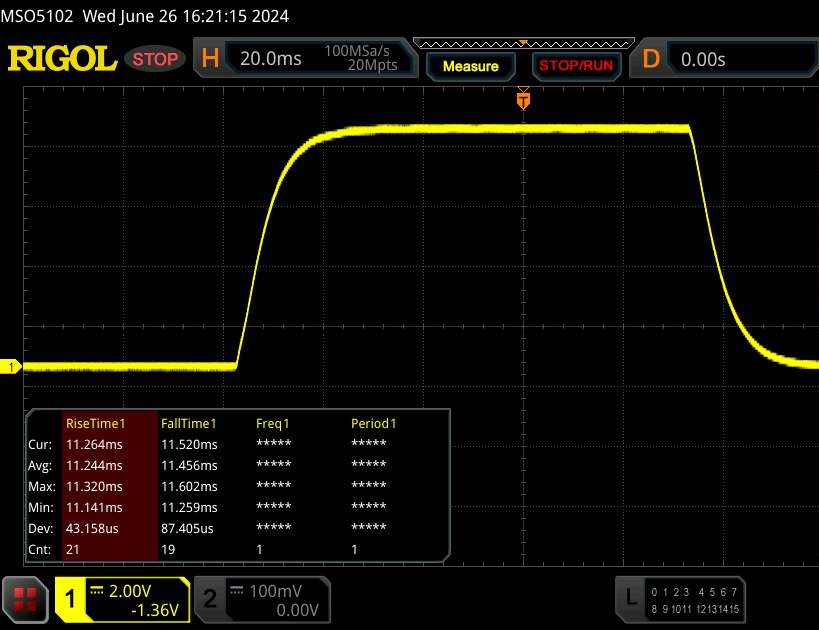 |
| ↘ 11.4 ms sonbahar | ||
| Ekran, testlerimizde iyi yanıt oranları gösteriyor ancak rekabetçi oyuncular için çok yavaş olabilir. Karşılaştırıldığında, test edilen tüm cihazlar 0.1 (minimum) ile 240 (maksimum) ms arasında değişir. » Tüm cihazların 51 %'si daha iyi. Bu, ölçülen yanıt süresinin test edilen tüm cihazların ortalamasından (19.8 ms) daha kötü olduğu anlamına gelir. | ||
| ↔ Tepki Süresi %50 Griden %80 Griye | ||
| 42.2 ms ... yükseliş ↗ ve sonbahar↘ birleşimi | ↗ 19.1 ms yükseliş | 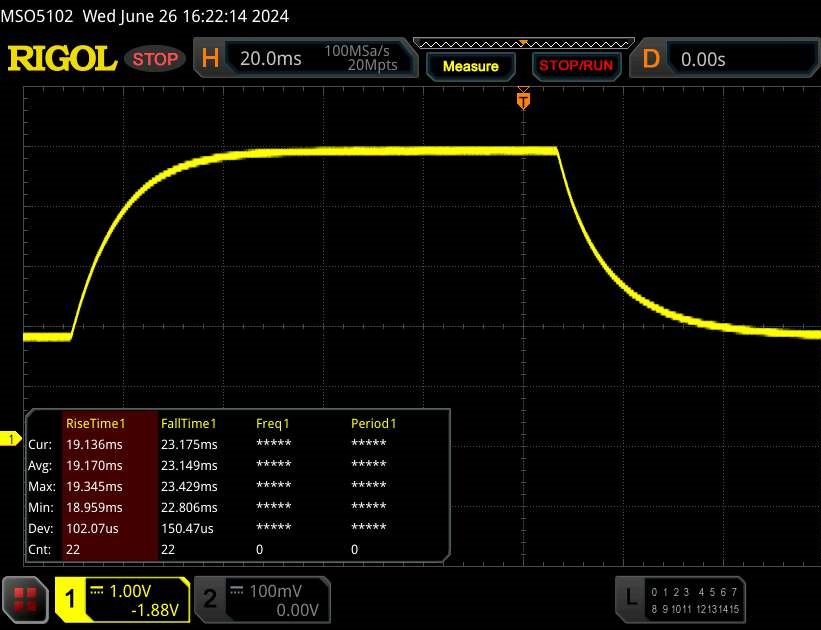 |
| ↘ 23.1 ms sonbahar | ||
| Ekran, testlerimizde yavaş yanıt oranları gösteriyor ve oyuncular için yetersiz olacaktır. Karşılaştırıldığında, test edilen tüm cihazlar 0.165 (minimum) ile 636 (maksimum) ms arasında değişir. » Tüm cihazların 70 %'si daha iyi. Bu, ölçülen yanıt süresinin test edilen tüm cihazların ortalamasından (30.9 ms) daha kötü olduğu anlamına gelir. | ||
Ekran Titremesi / PWM (Darbe Genişliği Modülasyonu)
| Ekran titriyor / PWM algılanmadı | 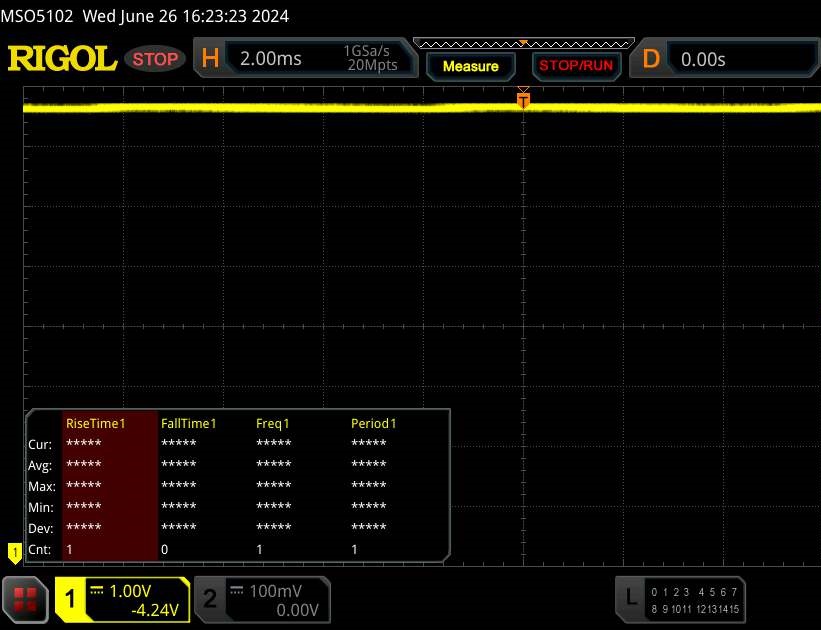 | ||
Karşılaştırıldığında: Test edilen tüm cihazların %52 %'si ekranı karartmak için PWM kullanmıyor. PWM tespit edilirse, ortalama 7748 (minimum: 5 - maksimum: 343500) Hz ölçüldü. | |||
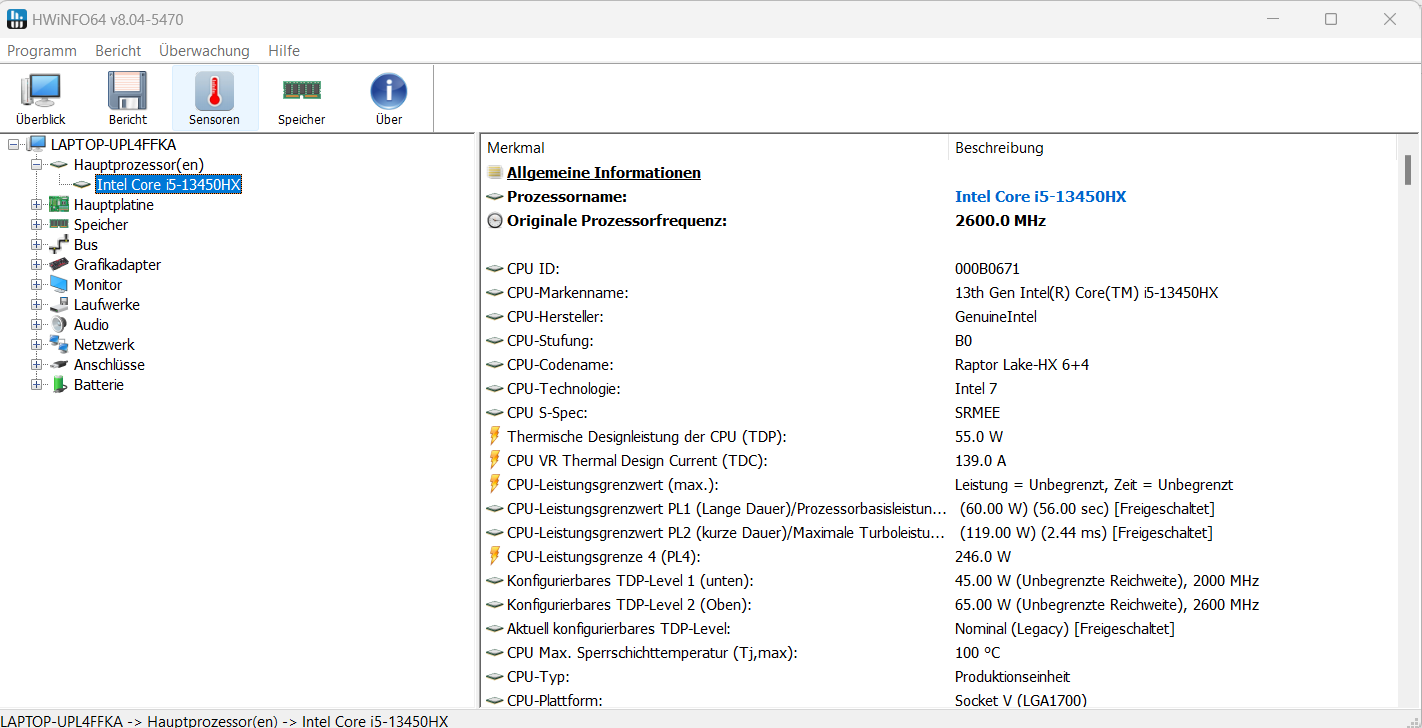
Performans - Raptor Lake ve Ada Lovelace dizüstü bilgisayara güç veriyor
LOQ modelleri giriş seviyesi oyun dizüstü bilgisayarlarıdır. Lenovo, AMD APU'ların yanı sıra Intel CPU'larla da çeşitli farklı yapılandırmalar sunuyor. Raptor Lake ve Ada Lovelace Core i5-13450HX ve GeForce RTX 4060 şeklinde mevcut test cihazına güç veriyor. Yaklaşık 1.300 ABD Doları (Windows 11 ile) veya 1.000 ABD Dolarının biraz üzerinde (Windows olmadan) alınabilir.
Test koşulları
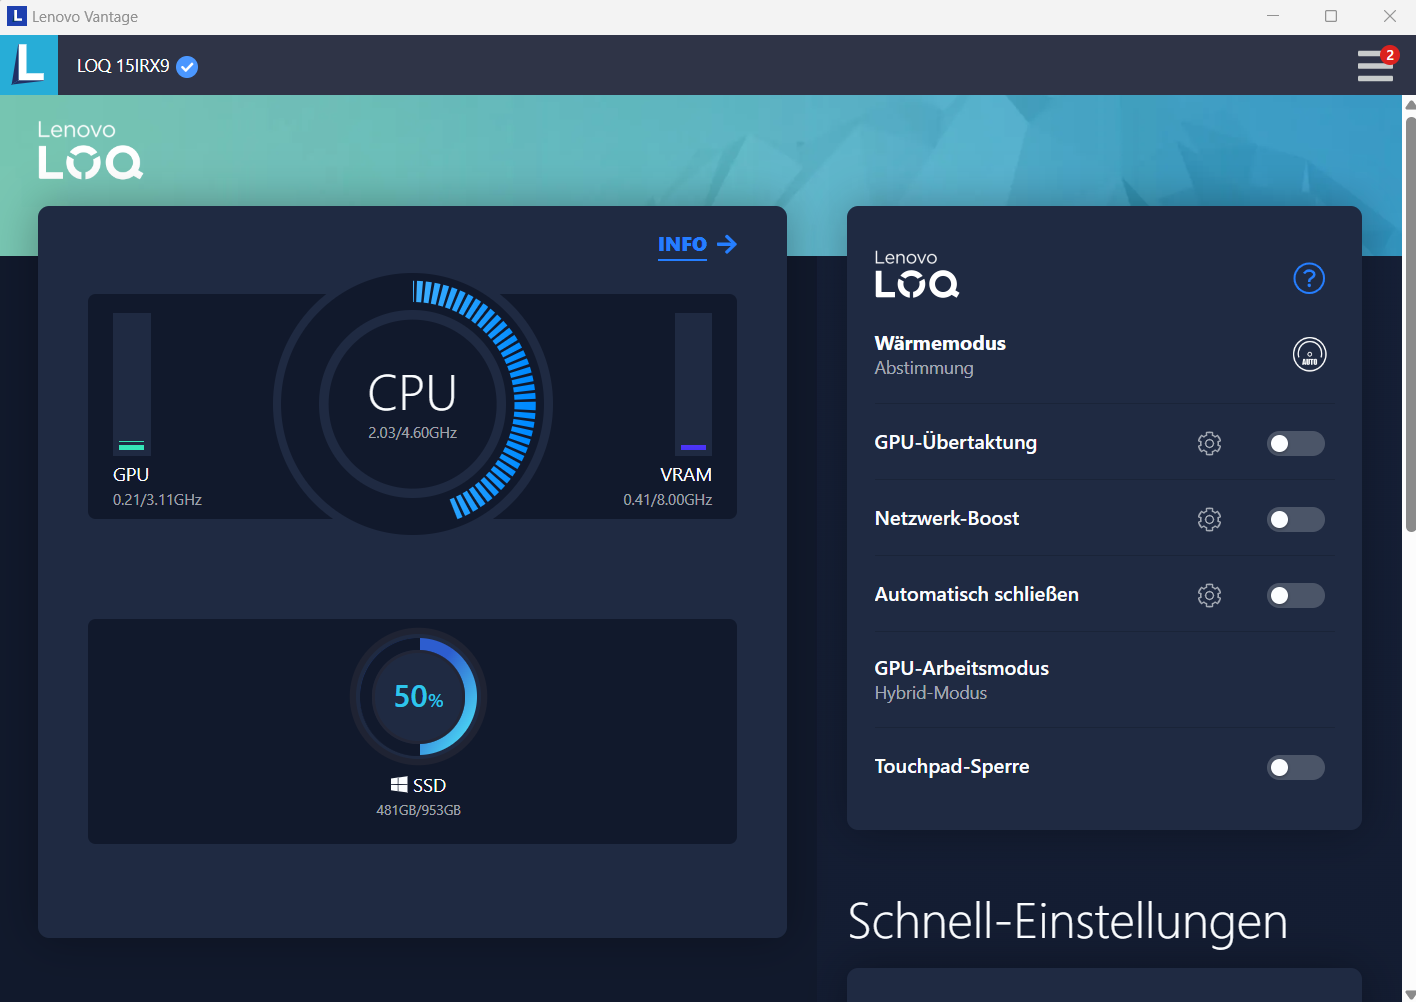
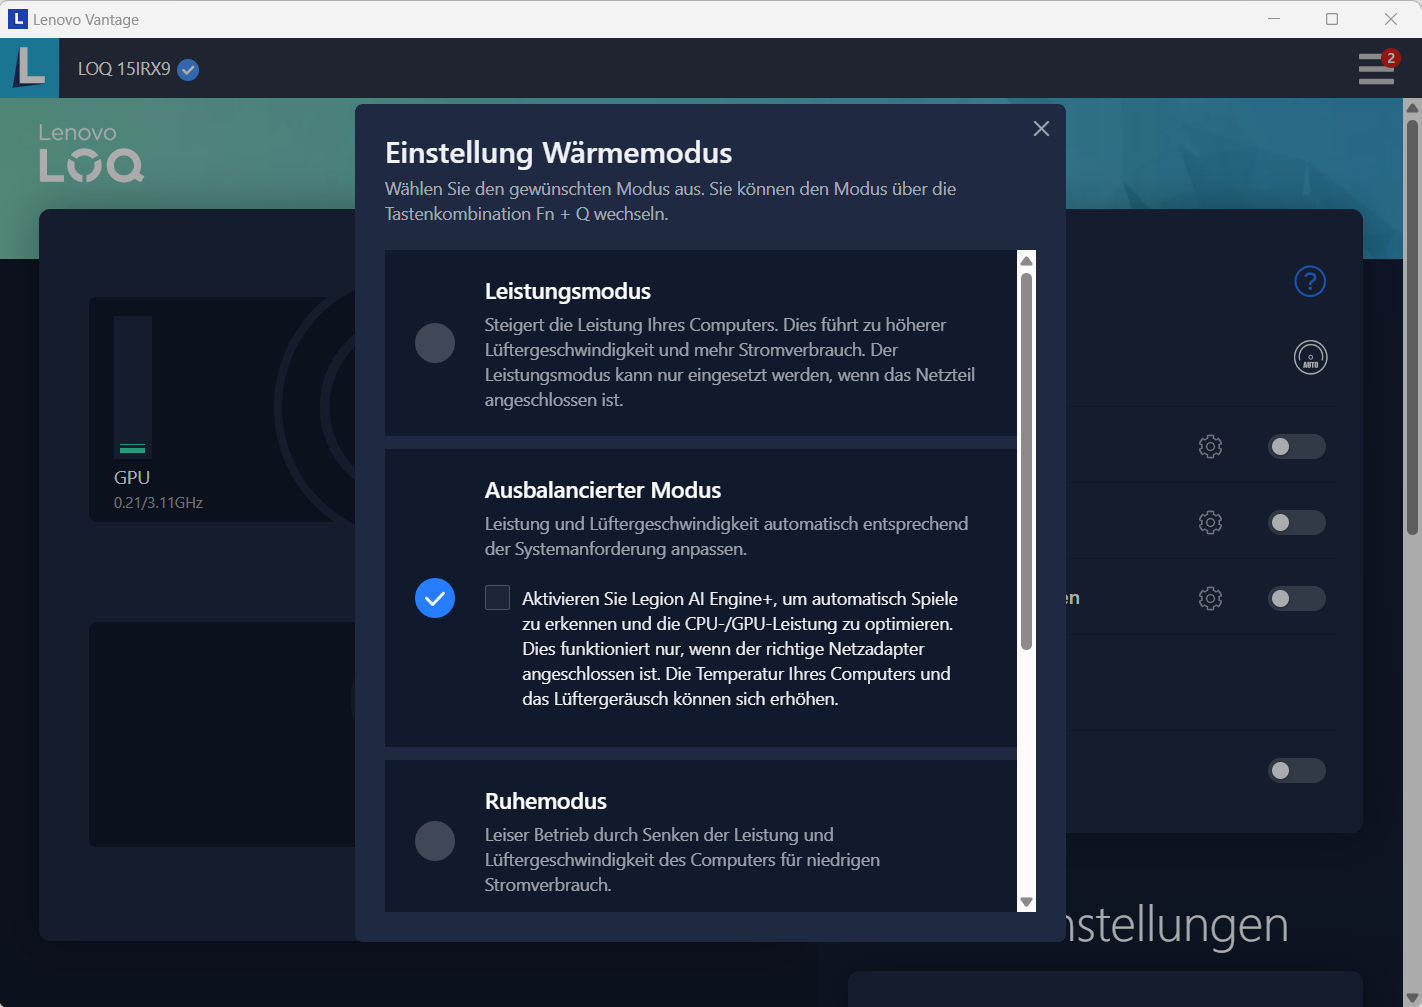
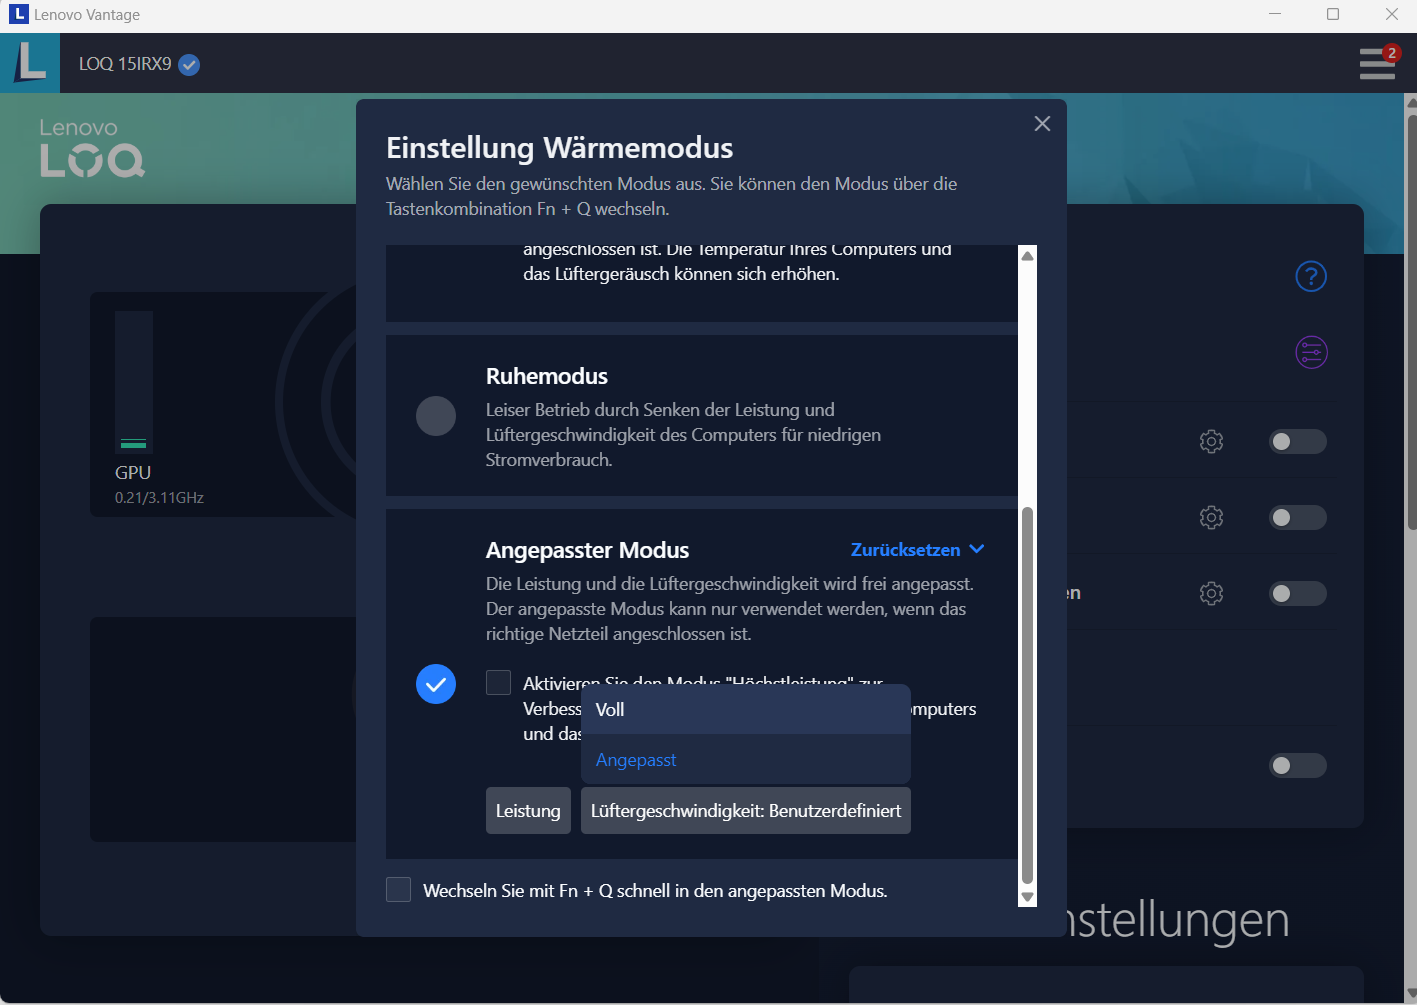
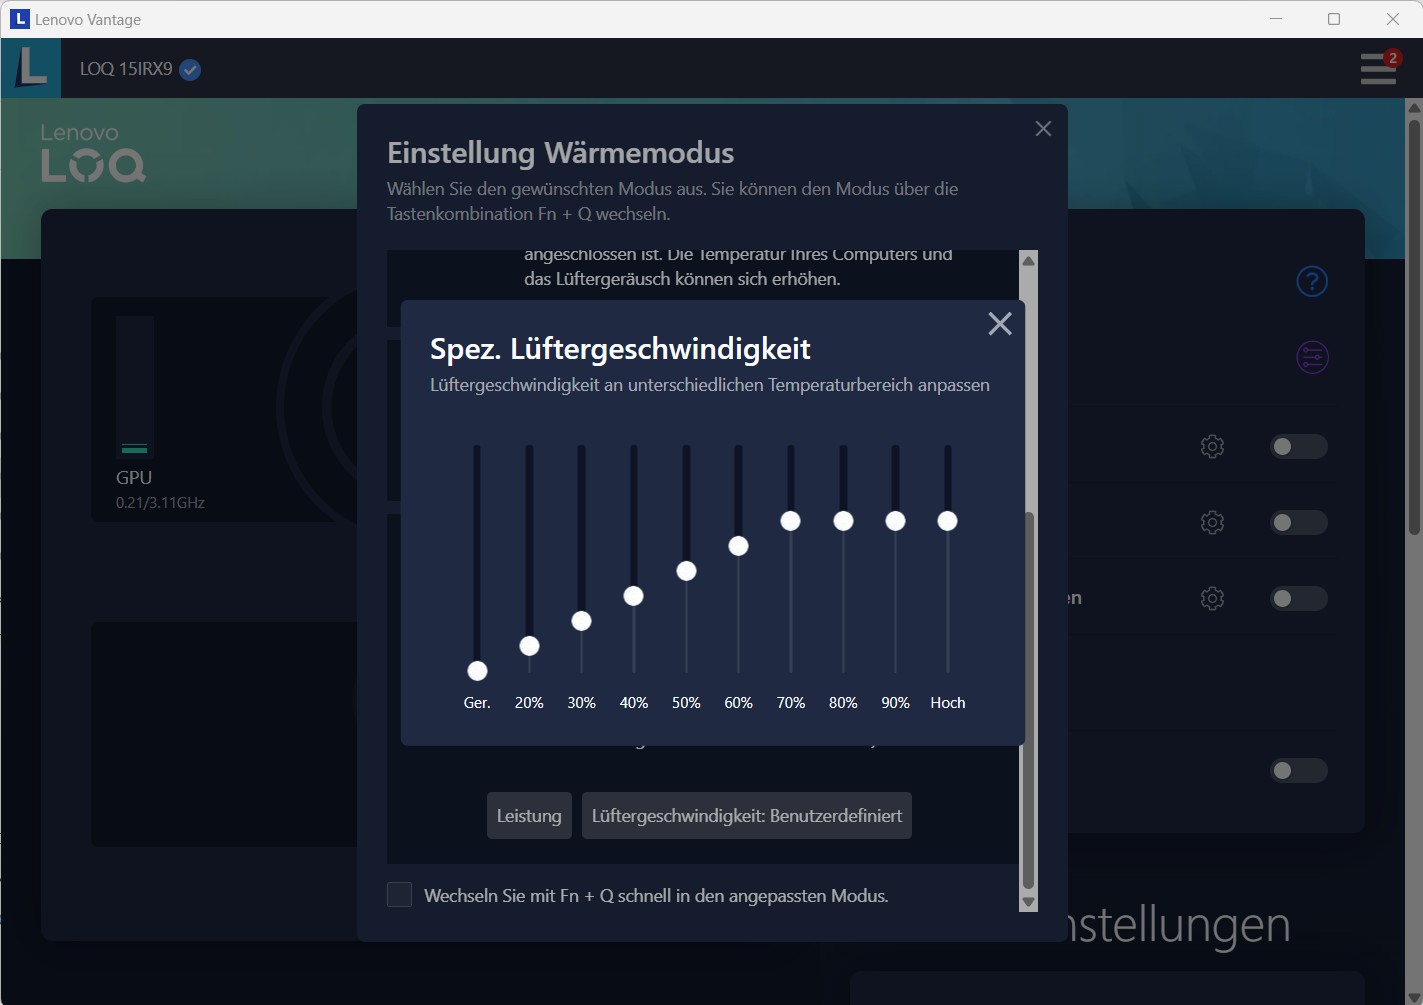
Dizüstü bilgisayar, "Fn" + "Q" tuş kombinasyonu kullanılarak arasında geçiş yapılabilen, üreticiye özel üç performans modu (tabloya bakın) sunuyor. Biz dengeli (kıyaslamalar) ve sessiz (pil testi) modlarını kullandık.
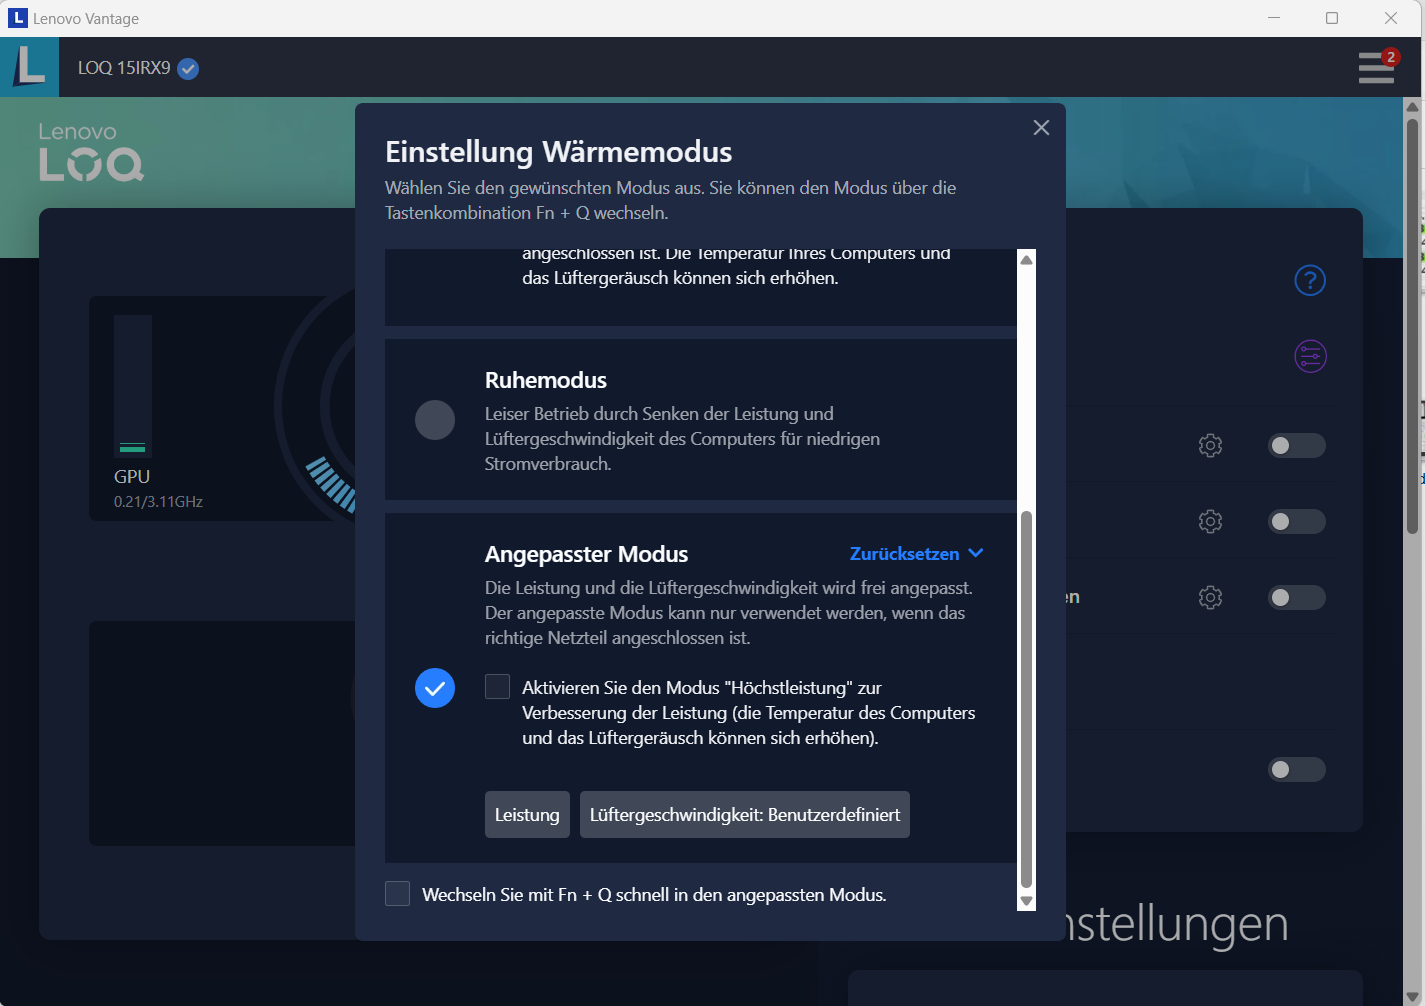
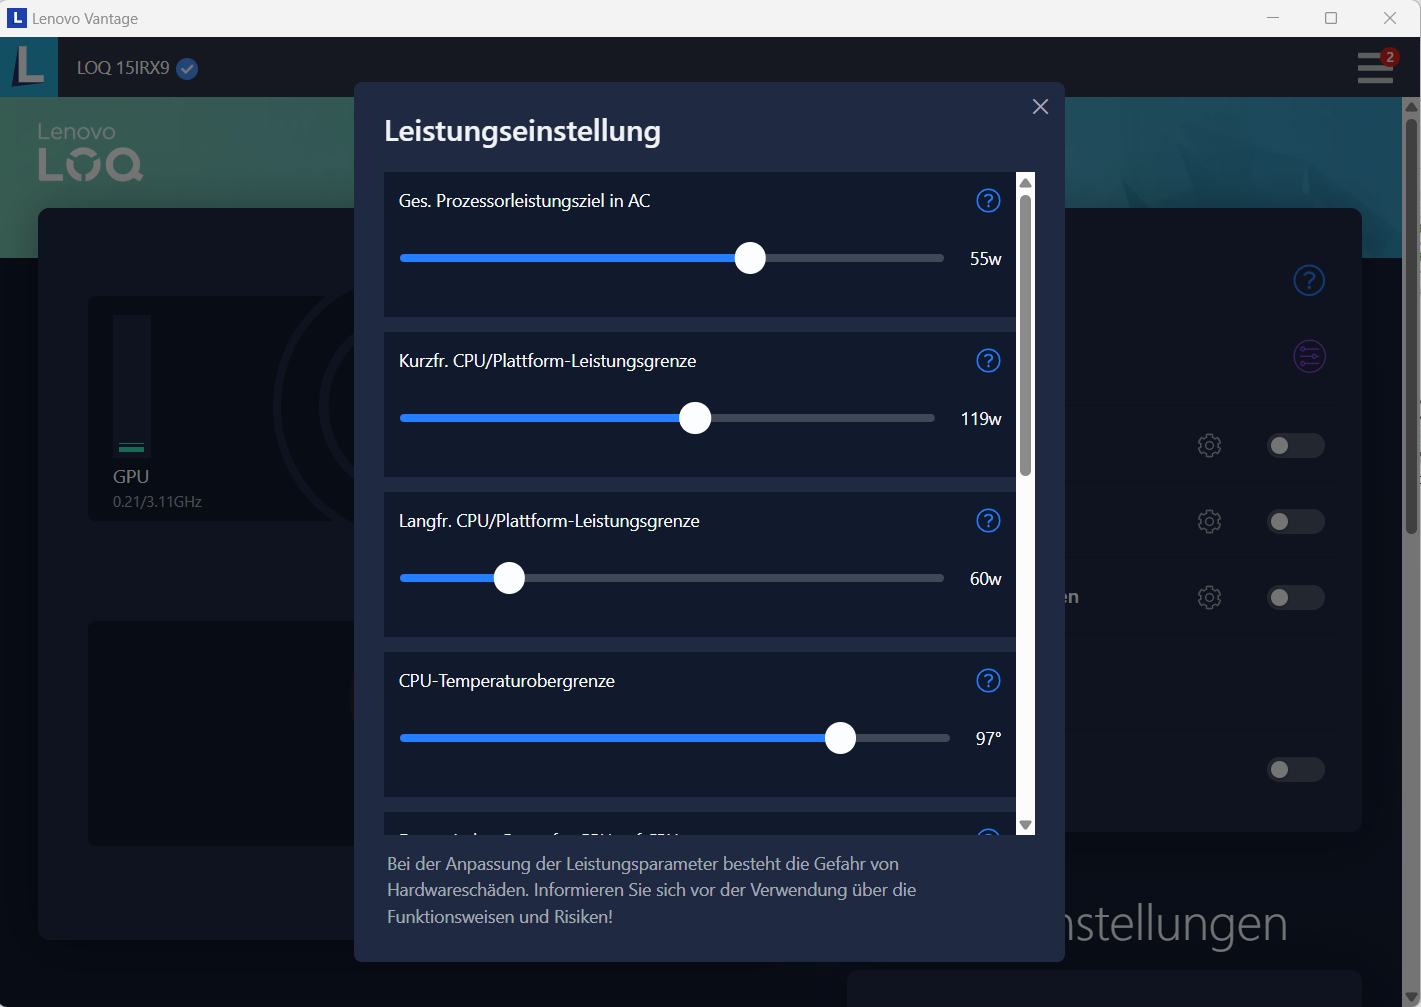
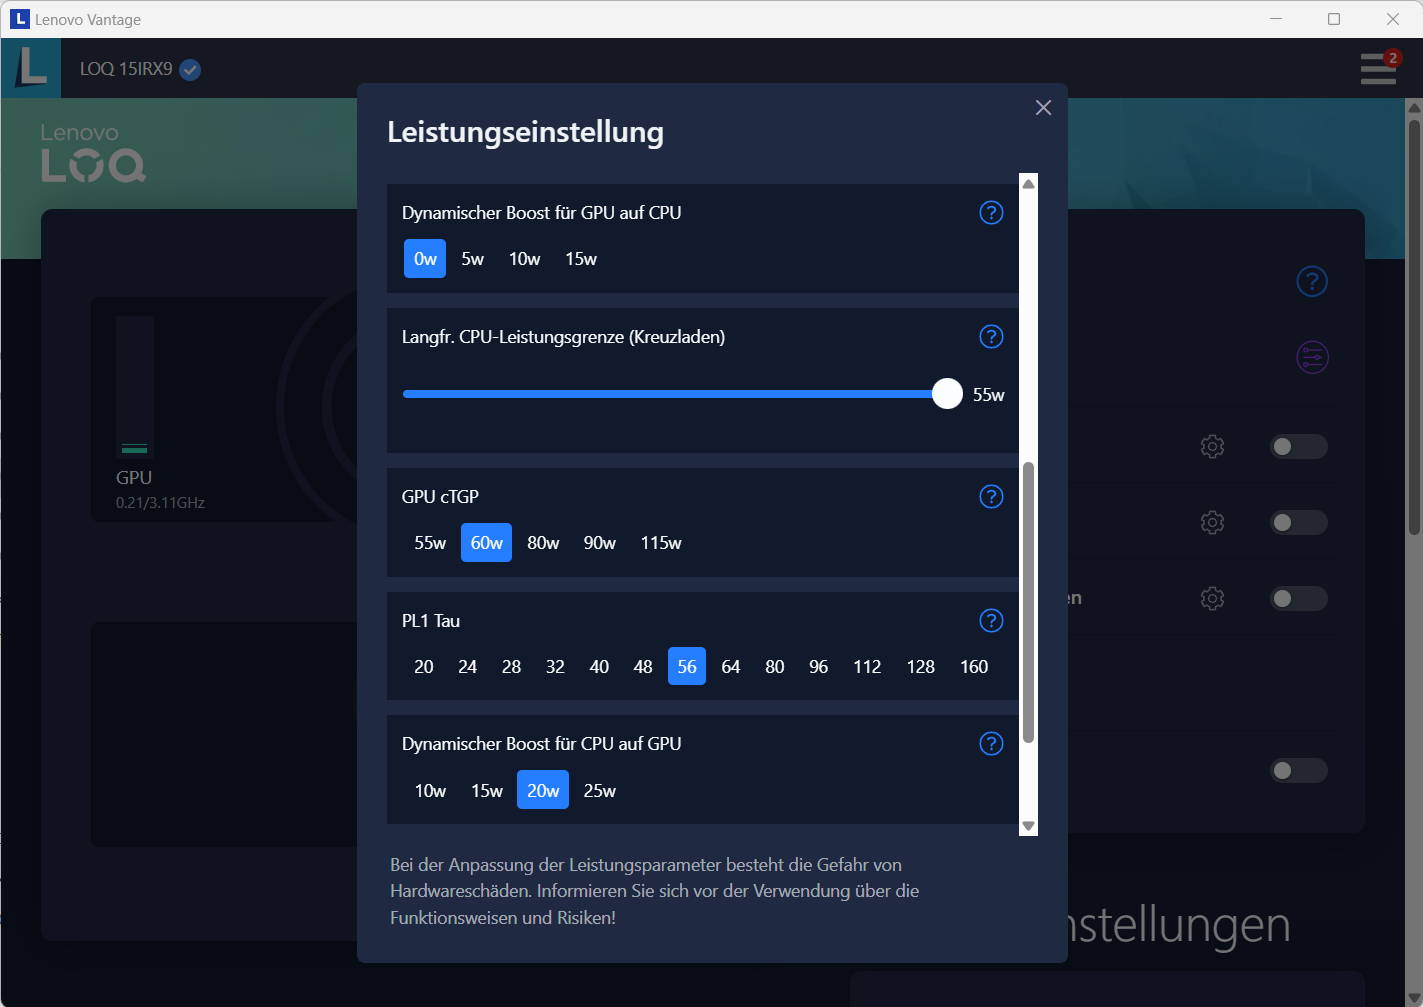
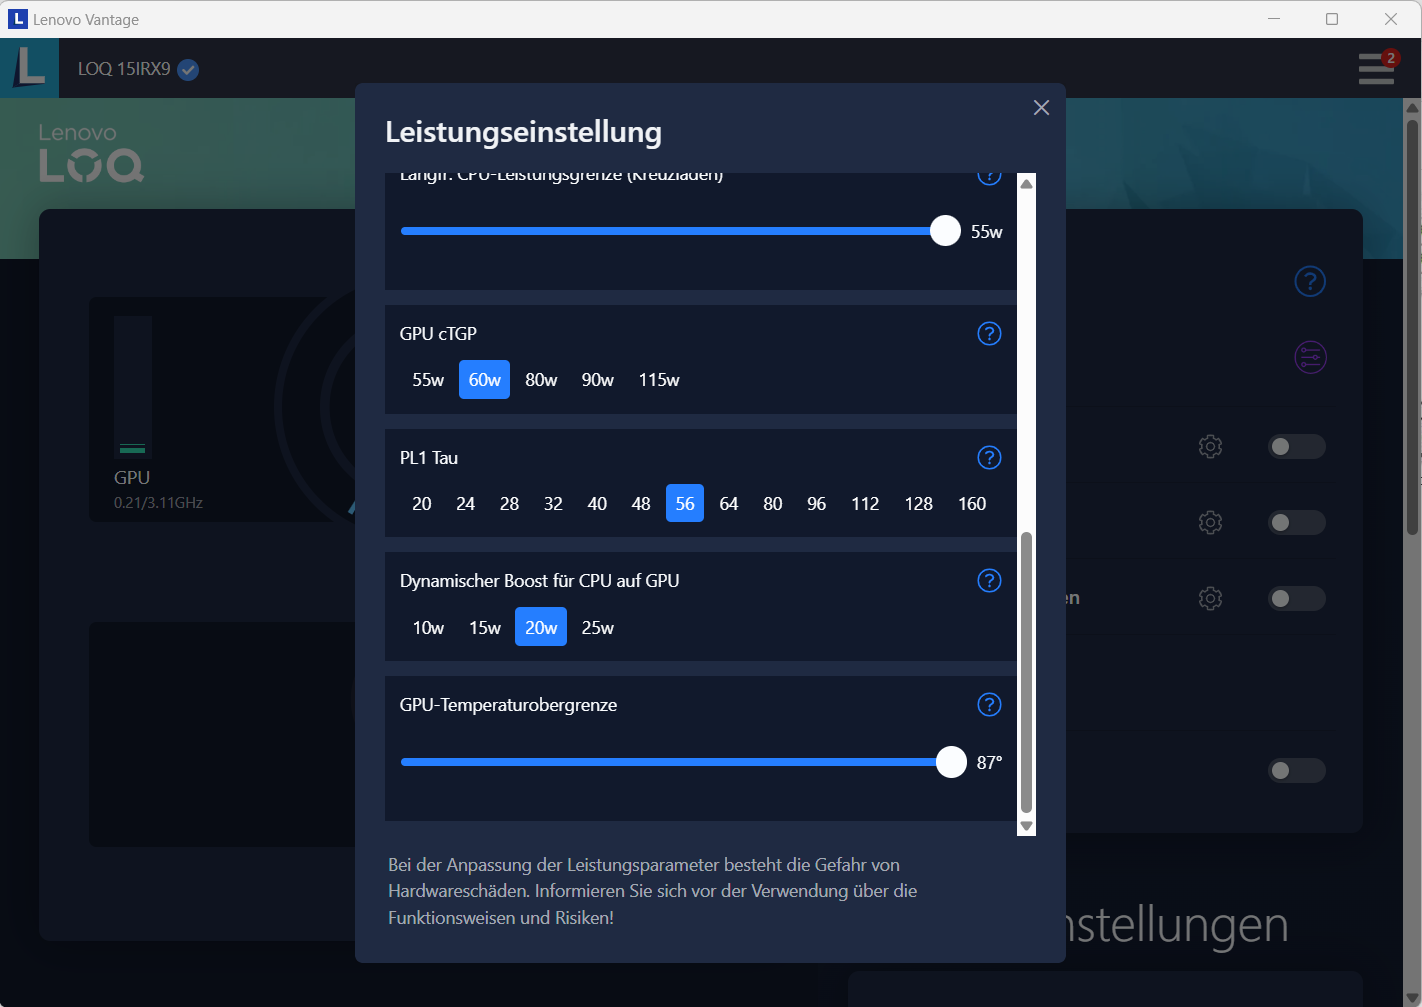
Lenovo Vantage (dizüstü bilgisayarın kontrol merkezi) aracılığıyla dördüncü bir mod (özelleştirilmiş) seçilebilir. Bu, işlemcinin (Güç Sınırı) veya GPU'nun (TGP, Dynamic Boost, sıcaklık sınırı) performans ayarlarının ve fan hızının ayrı ayrı ayarlanmasını sağlar. GPU ve grafik belleğini profilden bağımsız olarak overclock etmek de mümkündür.
| Performans modu | Dengeli mod | Sessiz mod | |
|---|---|---|---|
| Güç Sınırı 1 (HWInfo) | 90 watt | 60 watt | 55 watt |
| Güç Sınırı 2 (HWInfo) | 162 watt | 119 watt | 65 watt |
| Gürültü (CP 2077 Phantom Liberty) | 54 dB(A) | 48 dB(A) | 39 dB(A) |
| Performans (CP 2077 Phantom Liberty) | 70 fps | 66 fps | 52 fps |
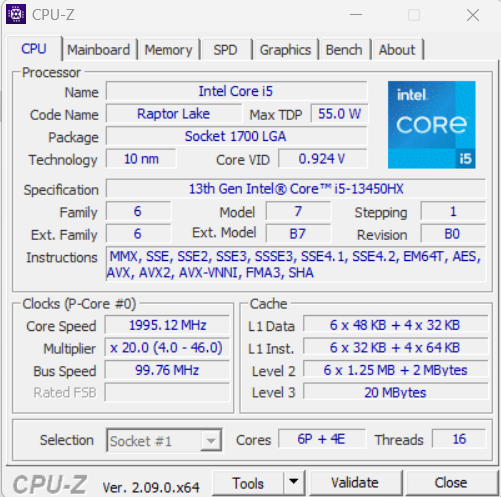
İşlemci
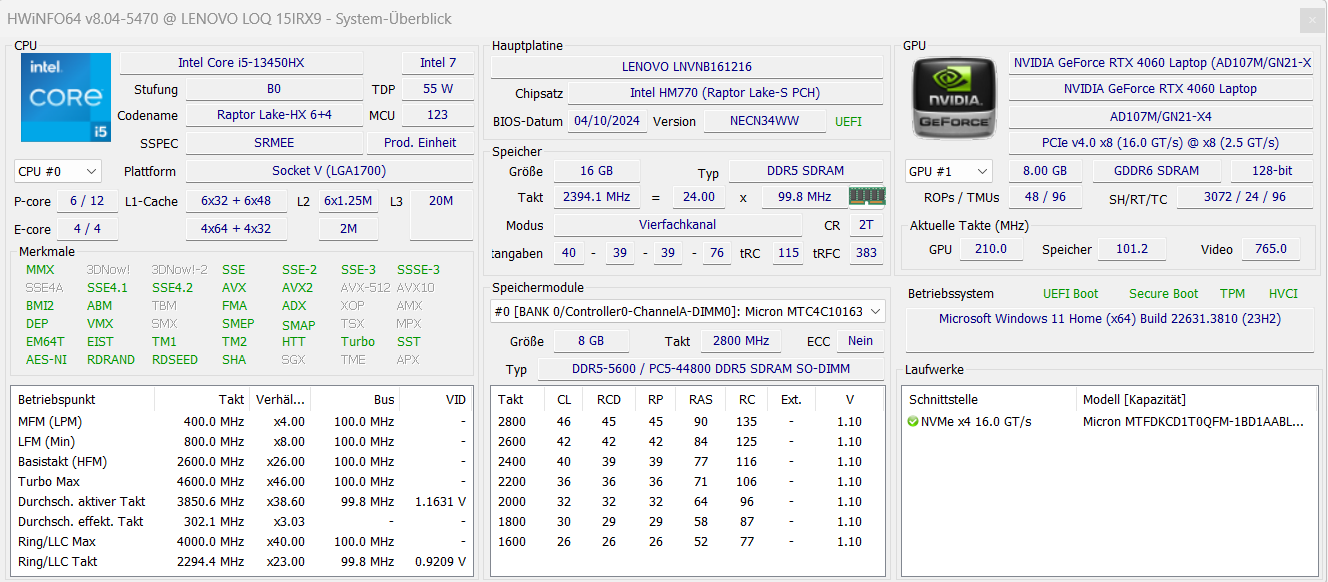
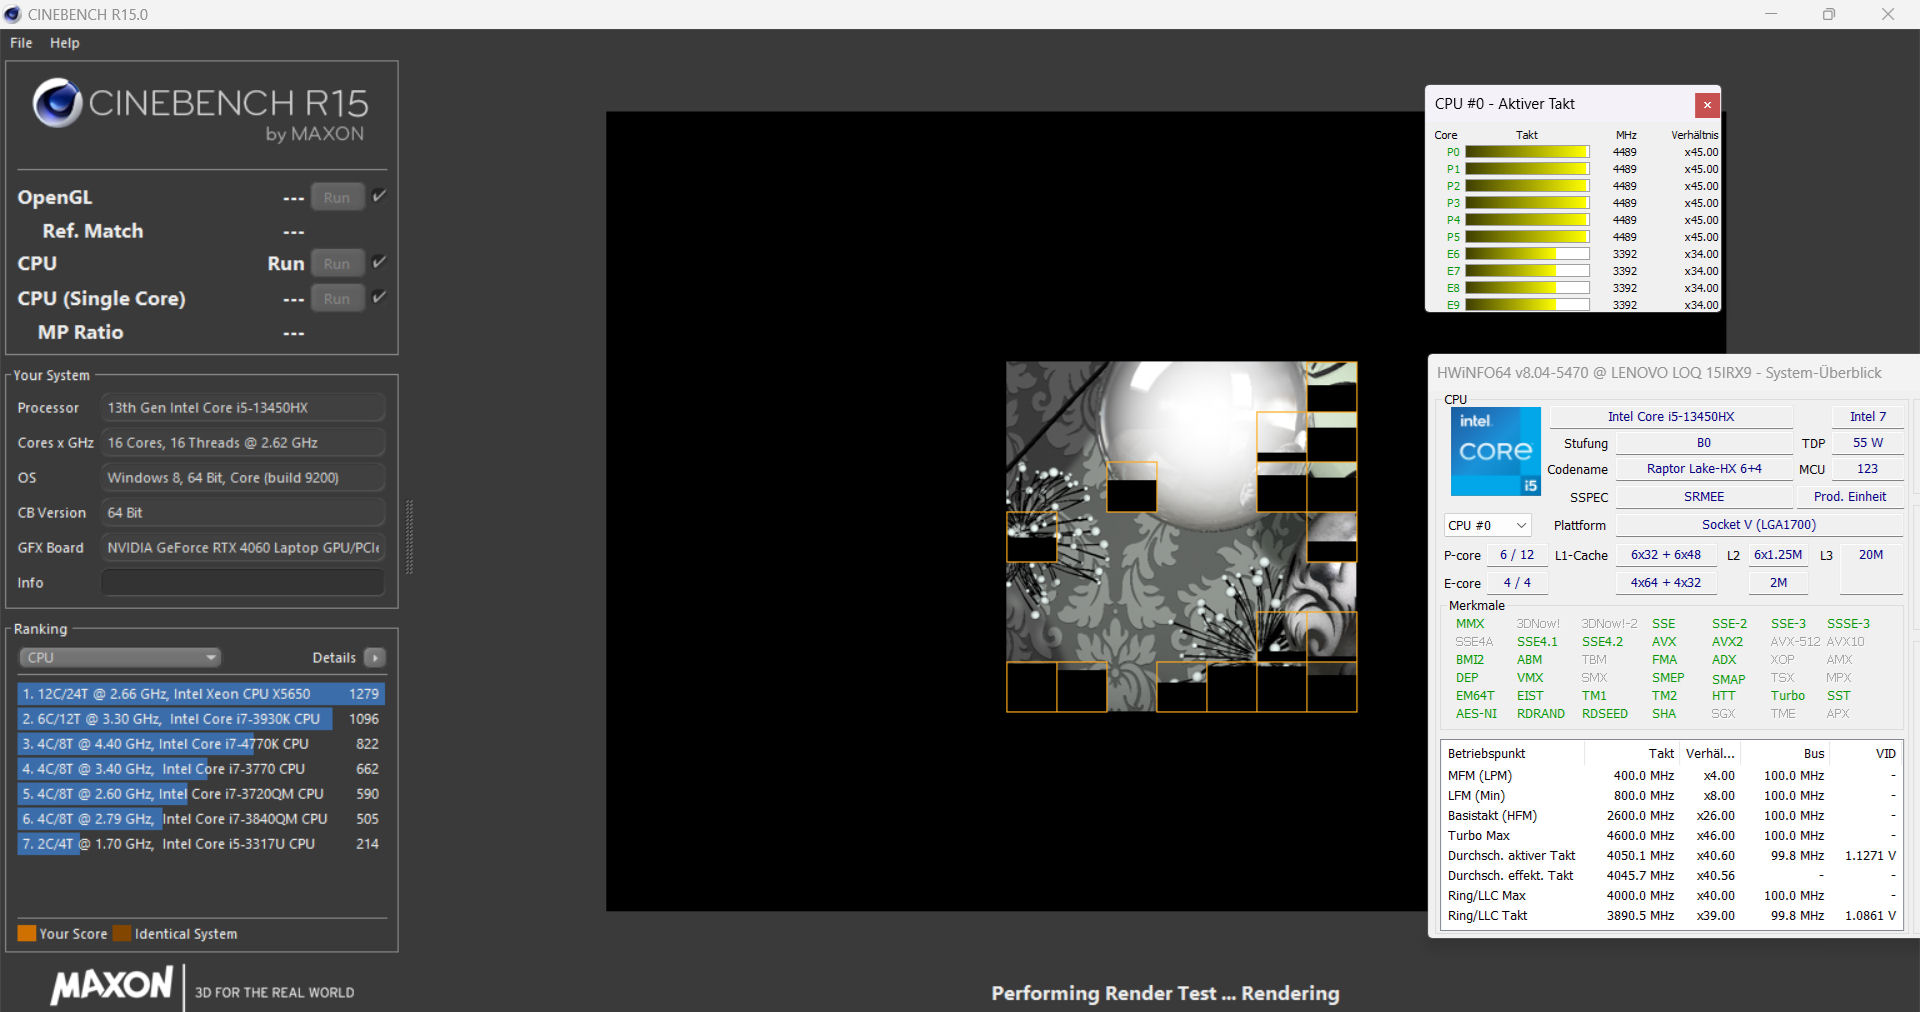
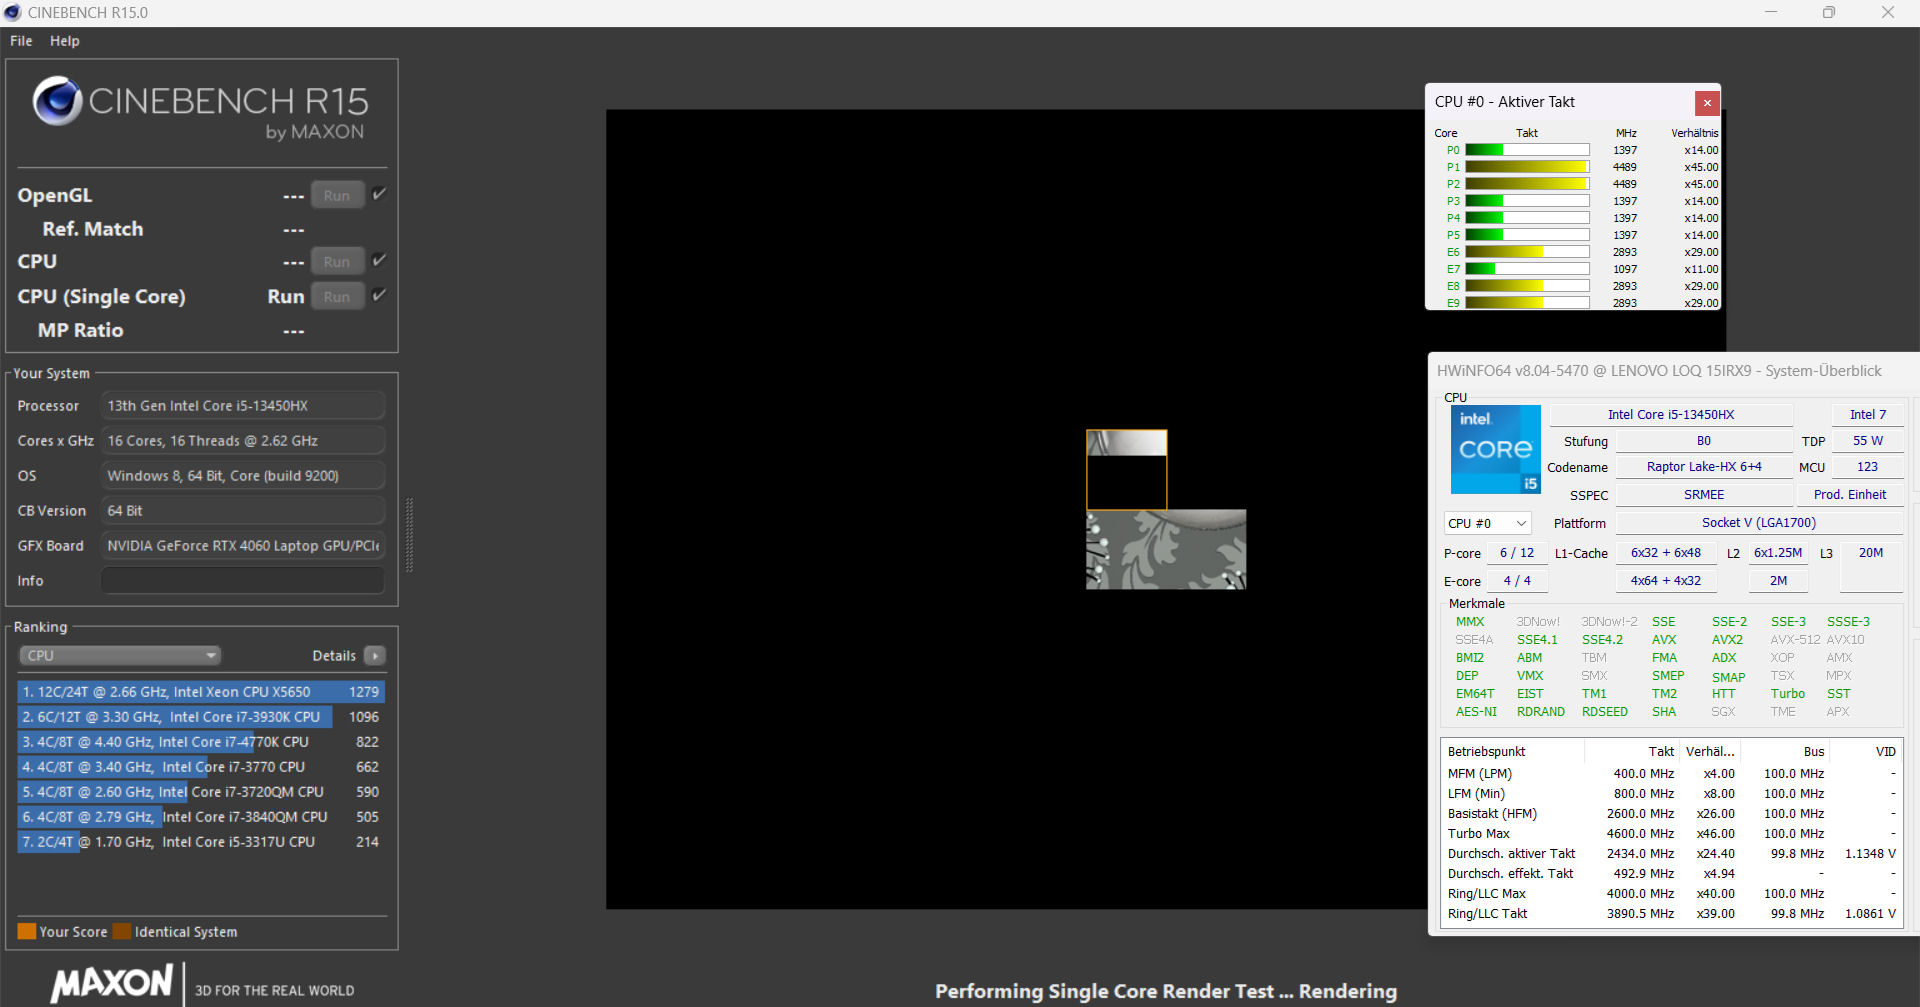
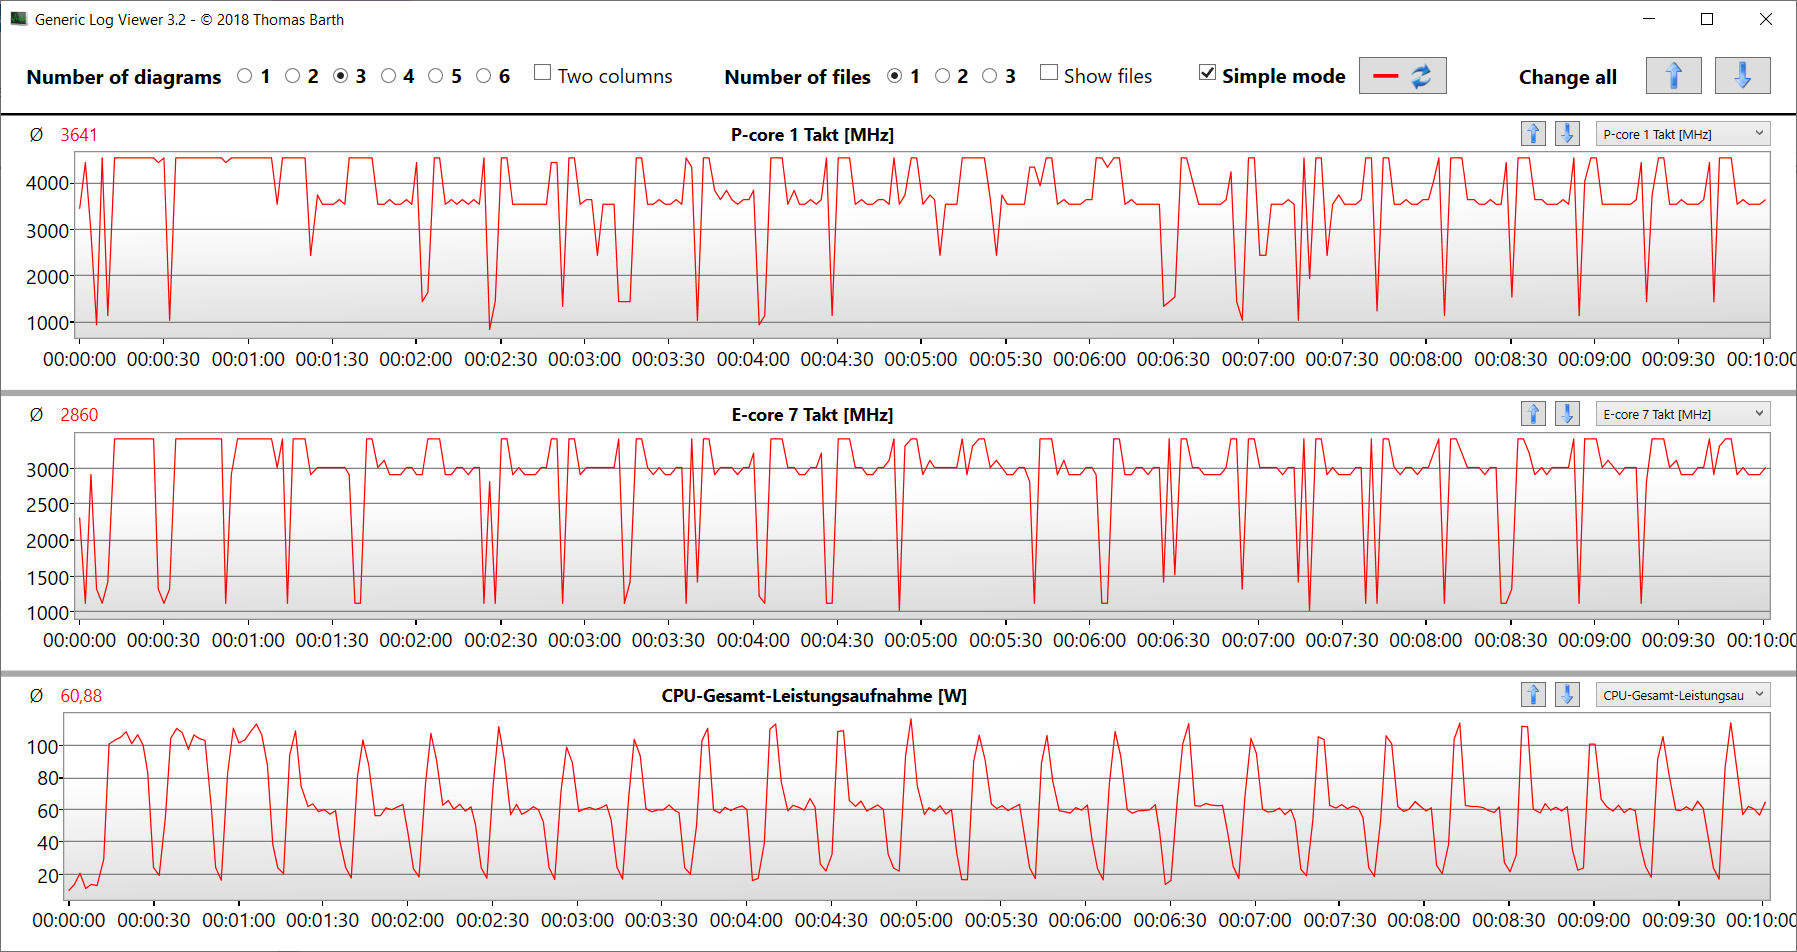
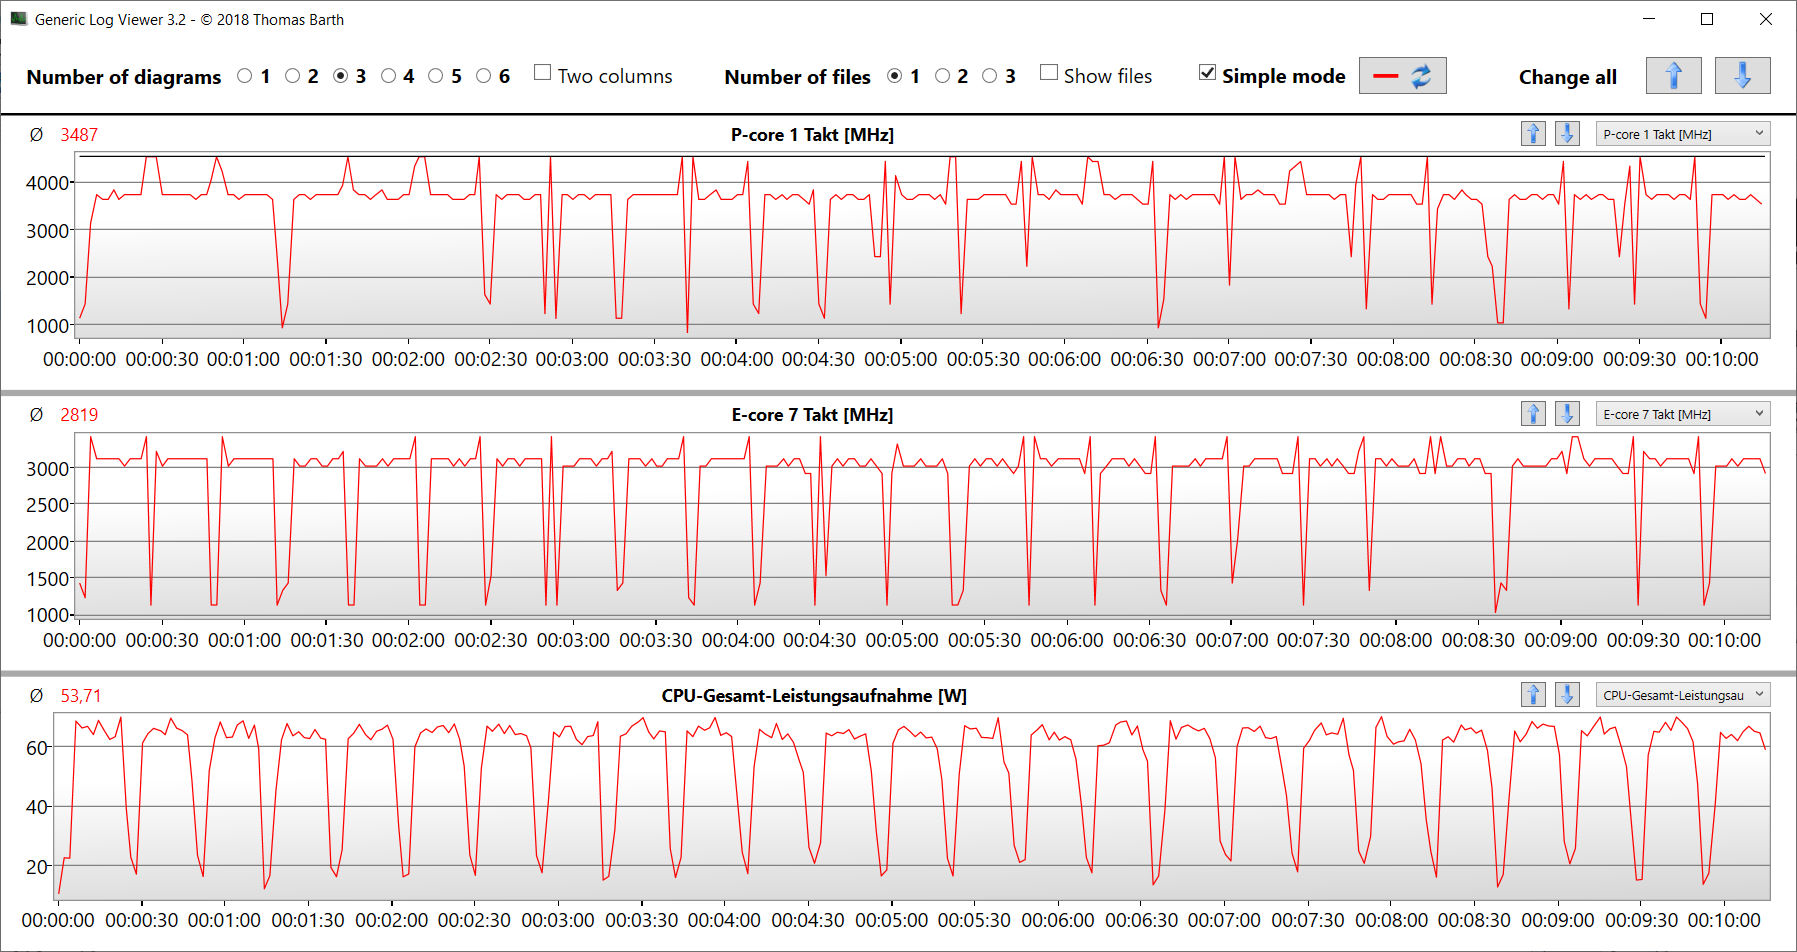
Bu Core i5-13450HX'in (Raptor Lake) 10 CPU çekirdeği (6P + 4E = 16 iş parçacığı) 4,6 GHz (P) ve 3,4 GHz (E) maksimum saat hızlarına ulaşmıştır. Sürekli çoklu iş parçacığı yükü (CB15 Döngüsü), saat hızının ilk çalıştırmadan dördüncü çalıştırmaya(dengeli mod) kadar düşmesine neden oldu. Sonrasında ise sabit kalmıştır. Performans modu saat hızını sürekli olarak yüksek bir seviyede tutuyor.
Kıyaslama sonuçları beklediğimiz gibiydi (dengeli mod) ve performans modu (çok küçük) bir avantajla sonuçlandı. Karşılaştırma alanında Core i5, en az sayıda bilgi işlem çekirdeğine sahip olduğu için en kötüsünü yaptı. CPU, ekonomik bir oyuncu için uygun bir seçimdir.
Cinebench R15 Multi continuous test
| CPU Performance rating - Percent | |
| Sınıf ortalaması Gaming | |
| HP Victus 16 (2024) | |
| Schenker XMG Core 15 (M24) | |
| Dell G16, i7-13650HX, RTX 4060 | |
| Gigabyte G6X 9KG (2024) | |
| Lenovo LOQ 15IRX9 | |
| Ortalama Intel Core i5-13450HX | |
| Lenovo LOQ 15IRX9 | |
| Cinebench R23 | |
| Multi Core | |
| Sınıf ortalaması Gaming (10488 - 42661, n=108, son 2 yıl) | |
| HP Victus 16 (2024) | |
| Dell G16, i7-13650HX, RTX 4060 | |
| Gigabyte G6X 9KG (2024) | |
| Schenker XMG Core 15 (M24) | |
| Lenovo LOQ 15IRX9 (Leistungsmodus) | |
| Ortalama Intel Core i5-13450HX (16575 - 17234, n=3) | |
| Lenovo LOQ 15IRX9 | |
| Single Core | |
| Sınıf ortalaması Gaming (1166 - 2415, n=108, son 2 yıl) | |
| Dell G16, i7-13650HX, RTX 4060 | |
| Gigabyte G6X 9KG (2024) | |
| Schenker XMG Core 15 (M24) | |
| Lenovo LOQ 15IRX9 (Leistungsmodus) | |
| Ortalama Intel Core i5-13450HX (1710 - 1766, n=3) | |
| Lenovo LOQ 15IRX9 | |
| HP Victus 16 (2024) | |
| Cinebench R20 | |
| CPU (Multi Core) | |
| Sınıf ortalaması Gaming (4029 - 16433, n=107, son 2 yıl) | |
| HP Victus 16 (2024) | |
| Dell G16, i7-13650HX, RTX 4060 | |
| Gigabyte G6X 9KG (2024) | |
| Schenker XMG Core 15 (M24) | |
| Lenovo LOQ 15IRX9 (Leistungsmodus) | |
| Ortalama Intel Core i5-13450HX (6489 - 6595, n=3) | |
| Lenovo LOQ 15IRX9 | |
| CPU (Single Core) | |
| Sınıf ortalaması Gaming (442 - 913, n=107, son 2 yıl) | |
| Dell G16, i7-13650HX, RTX 4060 | |
| Gigabyte G6X 9KG (2024) | |
| Schenker XMG Core 15 (M24) | |
| Lenovo LOQ 15IRX9 (Leistungsmodus) | |
| Ortalama Intel Core i5-13450HX (652 - 680, n=3) | |
| Lenovo LOQ 15IRX9 | |
| HP Victus 16 (2024) | |
| Cinebench R15 | |
| CPU Multi 64Bit | |
| Sınıf ortalaması Gaming (1578 - 6330, n=106, son 2 yıl) | |
| HP Victus 16 (2024) | |
| Dell G16, i7-13650HX, RTX 4060 | |
| Schenker XMG Core 15 (M24) | |
| Gigabyte G6X 9KG (2024) | |
| Lenovo LOQ 15IRX9 (Leistungsmodus) | |
| Lenovo LOQ 15IRX9 | |
| Ortalama Intel Core i5-13450HX (2427 - 2505, n=3) | |
| CPU Single 64Bit | |
| Sınıf ortalaması Gaming (188.8 - 350, n=107, son 2 yıl) | |
| Schenker XMG Core 15 (M24) | |
| Dell G16, i7-13650HX, RTX 4060 | |
| Gigabyte G6X 9KG (2024) | |
| Lenovo LOQ 15IRX9 (Leistungsmodus) | |
| Ortalama Intel Core i5-13450HX (239 - 251, n=3) | |
| Lenovo LOQ 15IRX9 | |
| HP Victus 16 (2024) | |
| Blender - v2.79 BMW27 CPU | |
| Lenovo LOQ 15IRX9 | |
| Gigabyte G6X 9KG (2024) | |
| Ortalama Intel Core i5-13450HX (196 - 229, n=3) | |
| Lenovo LOQ 15IRX9 (Leistungsmodus) | |
| Schenker XMG Core 15 (M24) | |
| HP Victus 16 (2024) | |
| Dell G16, i7-13650HX, RTX 4060 | |
| Sınıf ortalaması Gaming (79 - 330, n=105, son 2 yıl) | |
| 7-Zip 18.03 | |
| 7z b 4 | |
| Sınıf ortalaması Gaming (33491 - 148086, n=106, son 2 yıl) | |
| HP Victus 16 (2024) | |
| Dell G16, i7-13650HX, RTX 4060 | |
| Schenker XMG Core 15 (M24) | |
| Gigabyte G6X 9KG (2024) | |
| Lenovo LOQ 15IRX9 (Leistungsmodus) | |
| Ortalama Intel Core i5-13450HX (59026 - 62204, n=3) | |
| Lenovo LOQ 15IRX9 | |
| 7z b 4 -mmt1 | |
| Schenker XMG Core 15 (M24) | |
| Sınıf ortalaması Gaming (4199 - 7436, n=106, son 2 yıl) | |
| Dell G16, i7-13650HX, RTX 4060 | |
| Gigabyte G6X 9KG (2024) | |
| HP Victus 16 (2024) | |
| Lenovo LOQ 15IRX9 (Leistungsmodus) | |
| Ortalama Intel Core i5-13450HX (5370 - 5576, n=3) | |
| Lenovo LOQ 15IRX9 | |
| Geekbench 6.7 | |
| Multi-Core | |
| Sınıf ortalaması Gaming (6625 - 22850, n=107, son 2 yıl) | |
| HP Victus 16 (2024) (6.2.1) | |
| Schenker XMG Core 15 (M24) (6.2.1) | |
| Dell G16, i7-13650HX, RTX 4060 (6.2.1) | |
| Gigabyte G6X 9KG (2024) (6.2.1) | |
| Lenovo LOQ 15IRX9 (6.2.1, Leistungsmodus) | |
| Ortalama Intel Core i5-13450HX (12619 - 12799, n=3) | |
| Lenovo LOQ 15IRX9 (6.2.1) | |
| Single-Core | |
| Sınıf ortalaması Gaming (1490 - 3259, n=107, son 2 yıl) | |
| Schenker XMG Core 15 (M24) (6.2.1) | |
| Dell G16, i7-13650HX, RTX 4060 (6.2.1) | |
| Gigabyte G6X 9KG (2024) (6.2.1) | |
| Lenovo LOQ 15IRX9 (6.2.1, Leistungsmodus) | |
| Ortalama Intel Core i5-13450HX (2381 - 2448, n=3) | |
| Lenovo LOQ 15IRX9 (6.2.1) | |
| HP Victus 16 (2024) (6.2.1) | |
| Geekbench 5.5 | |
| Multi-Core | |
| Sınıf ortalaması Gaming (6460 - 28263, n=106, son 2 yıl) | |
| HP Victus 16 (2024) | |
| Gigabyte G6X 9KG (2024) | |
| Schenker XMG Core 15 (M24) | |
| Dell G16, i7-13650HX, RTX 4060 | |
| Lenovo LOQ 15IRX9 | |
| Ortalama Intel Core i5-13450HX (11973 - 12022, n=3) | |
| Lenovo LOQ 15IRX9 (Leistungsmodus) | |
| Single-Core | |
| Sınıf ortalaması Gaming (986 - 2474, n=106, son 2 yıl) | |
| Schenker XMG Core 15 (M24) | |
| Dell G16, i7-13650HX, RTX 4060 | |
| Gigabyte G6X 9KG (2024) | |
| Lenovo LOQ 15IRX9 (Leistungsmodus) | |
| Ortalama Intel Core i5-13450HX (1696 - 1763, n=3) | |
| HP Victus 16 (2024) | |
| Lenovo LOQ 15IRX9 | |
| HWBOT x265 Benchmark v2.2 - 4k Preset | |
| Sınıf ortalaması Gaming (11.5 - 44.4, n=106, son 2 yıl) | |
| Schenker XMG Core 15 (M24) | |
| HP Victus 16 (2024) | |
| Lenovo LOQ 15IRX9 (Leistungsmodus) | |
| Dell G16, i7-13650HX, RTX 4060 | |
| Gigabyte G6X 9KG (2024) | |
| Ortalama Intel Core i5-13450HX (16.9 - 20.5, n=3) | |
| Lenovo LOQ 15IRX9 | |
| LibreOffice - 20 Documents To PDF | |
| Ortalama Intel Core i5-13450HX (49.5 - 96.6, n=3) | |
| Lenovo LOQ 15IRX9 (6.3.4.2) | |
| HP Victus 16 (2024) (6.3.4.2) | |
| Dell G16, i7-13650HX, RTX 4060 (6.3.4.2) | |
| Sınıf ortalaması Gaming (33.2 - 88.8, n=106, son 2 yıl) | |
| Lenovo LOQ 15IRX9 (6.3.4.2, Leistungsmodus) | |
| Schenker XMG Core 15 (M24) (6.3.4.2) | |
| Gigabyte G6X 9KG (2024) (6.3.4.2) | |
| R Benchmark 2.5 - Overall mean | |
| HP Victus 16 (2024) | |
| Lenovo LOQ 15IRX9 | |
| Ortalama Intel Core i5-13450HX (0.4582 - 0.4838, n=3) | |
| Lenovo LOQ 15IRX9 (Leistungsmodus) | |
| Gigabyte G6X 9KG (2024) | |
| Schenker XMG Core 15 (M24) | |
| Sınıf ortalaması Gaming (0.3439 - 0.759, n=107, son 2 yıl) | |
| Dell G16, i7-13650HX, RTX 4060 | |
| Dell G16, i7-13650HX, RTX 4060 | |
* ... daha küçük daha iyidir
AIDA64: FP32 Ray-Trace | FPU Julia | CPU SHA3 | CPU Queen | FPU SinJulia | FPU Mandel | CPU AES | CPU ZLib | FP64 Ray-Trace | CPU PhotoWorxx
| Performance rating | |
| Sınıf ortalaması Gaming | |
| Schenker XMG Core 15 (M24) | |
| Dell G16, i7-13650HX, RTX 4060 | |
| HP Victus 16 (2024) | |
| Lenovo LOQ 15IRX9 | |
| Ortalama Intel Core i5-13450HX | |
| Gigabyte G6X 9KG (2024) | |
| Lenovo LOQ 15IRX9 | |
| AIDA64 / FP32 Ray-Trace | |
| Sınıf ortalaması Gaming (10227 - 85542, n=106, son 2 yıl) | |
| Schenker XMG Core 15 (M24) (v6.92.6600) | |
| Dell G16, i7-13650HX, RTX 4060 (v6.92.6600) | |
| Lenovo LOQ 15IRX9 (v6.92.6600, Leistungsmodus) | |
| HP Victus 16 (2024) (v6.92.6600) | |
| Ortalama Intel Core i5-13450HX (13747 - 17767, n=3) | |
| Lenovo LOQ 15IRX9 (v6.92.6600) | |
| Gigabyte G6X 9KG (2024) (v6.92.6600) | |
| AIDA64 / FPU Julia | |
| Sınıf ortalaması Gaming (51376 - 372155, n=106, son 2 yıl) | |
| Schenker XMG Core 15 (M24) (v6.92.6600) | |
| Dell G16, i7-13650HX, RTX 4060 (v6.92.6600) | |
| HP Victus 16 (2024) (v6.92.6600) | |
| Lenovo LOQ 15IRX9 (v6.92.6600, Leistungsmodus) | |
| Ortalama Intel Core i5-13450HX (71834 - 83862, n=3) | |
| Lenovo LOQ 15IRX9 (v6.92.6600) | |
| Gigabyte G6X 9KG (2024) (v6.92.6600) | |
| AIDA64 / CPU SHA3 | |
| Sınıf ortalaması Gaming (2180 - 10115, n=106, son 2 yıl) | |
| Schenker XMG Core 15 (M24) (v6.92.6600) | |
| Dell G16, i7-13650HX, RTX 4060 (v6.92.6600) | |
| HP Victus 16 (2024) (v6.92.6600) | |
| Lenovo LOQ 15IRX9 (v6.92.6600) | |
| Lenovo LOQ 15IRX9 (v6.92.6600, Leistungsmodus) | |
| Ortalama Intel Core i5-13450HX (3519 - 3530, n=3) | |
| Gigabyte G6X 9KG (2024) (v6.92.6600) | |
| AIDA64 / CPU Queen | |
| HP Victus 16 (2024) (v6.92.6600) | |
| Schenker XMG Core 15 (M24) (v6.92.6600) | |
| Sınıf ortalaması Gaming (49785 - 173351, n=90, son 2 yıl) | |
| Gigabyte G6X 9KG (2024) (v6.92.6600) | |
| Dell G16, i7-13650HX, RTX 4060 (v6.92.6600) | |
| Lenovo LOQ 15IRX9 (v6.92.6600) | |
| Ortalama Intel Core i5-13450HX (85888 - 86148, n=3) | |
| Lenovo LOQ 15IRX9 (v6.92.6600, Leistungsmodus) | |
| AIDA64 / FPU SinJulia | |
| Schenker XMG Core 15 (M24) (v6.92.6600) | |
| Sınıf ortalaması Gaming (4424 - 33636, n=106, son 2 yıl) | |
| HP Victus 16 (2024) (v6.92.6600) | |
| Dell G16, i7-13650HX, RTX 4060 (v6.92.6600) | |
| Lenovo LOQ 15IRX9 (v6.92.6600, Leistungsmodus) | |
| Lenovo LOQ 15IRX9 (v6.92.6600) | |
| Ortalama Intel Core i5-13450HX (9325 - 9354, n=3) | |
| Gigabyte G6X 9KG (2024) (v6.92.6600) | |
| AIDA64 / FPU Mandel | |
| Sınıf ortalaması Gaming (25115 - 196829, n=106, son 2 yıl) | |
| Schenker XMG Core 15 (M24) (v6.92.6600) | |
| Dell G16, i7-13650HX, RTX 4060 (v6.92.6600) | |
| Lenovo LOQ 15IRX9 (v6.92.6600, Leistungsmodus) | |
| HP Victus 16 (2024) (v6.92.6600) | |
| Ortalama Intel Core i5-13450HX (34956 - 42825, n=3) | |
| Lenovo LOQ 15IRX9 (v6.92.6600) | |
| Gigabyte G6X 9KG (2024) (v6.92.6600) | |
| AIDA64 / CPU AES | |
| Sınıf ortalaması Gaming (39258 - 247074, n=106, son 2 yıl) | |
| Schenker XMG Core 15 (M24) (v6.92.6600) | |
| Dell G16, i7-13650HX, RTX 4060 (v6.92.6600) | |
| HP Victus 16 (2024) (v6.92.6600) | |
| Ortalama Intel Core i5-13450HX (70296 - 70680, n=3) | |
| Lenovo LOQ 15IRX9 (v6.92.6600) | |
| Lenovo LOQ 15IRX9 (v6.92.6600, Leistungsmodus) | |
| Gigabyte G6X 9KG (2024) (v6.92.6600) | |
| AIDA64 / CPU ZLib | |
| Sınıf ortalaması Gaming (574 - 2531, n=106, son 2 yıl) | |
| Dell G16, i7-13650HX, RTX 4060 (v6.92.6600) | |
| HP Victus 16 (2024) (v6.92.6600) | |
| Gigabyte G6X 9KG (2024) (v6.92.6600) | |
| Lenovo LOQ 15IRX9 (v6.92.6600) | |
| Ortalama Intel Core i5-13450HX (977 - 1002, n=3) | |
| Lenovo LOQ 15IRX9 (v6.92.6600, Leistungsmodus) | |
| Schenker XMG Core 15 (M24) (v6.92.6600) | |
| AIDA64 / FP64 Ray-Trace | |
| Sınıf ortalaması Gaming (5509 - 45446, n=106, son 2 yıl) | |
| Schenker XMG Core 15 (M24) (v6.92.6600) | |
| Dell G16, i7-13650HX, RTX 4060 (v6.92.6600) | |
| Lenovo LOQ 15IRX9 (v6.92.6600, Leistungsmodus) | |
| HP Victus 16 (2024) (v6.92.6600) | |
| Ortalama Intel Core i5-13450HX (7428 - 9561, n=3) | |
| Lenovo LOQ 15IRX9 (v6.92.6600) | |
| Gigabyte G6X 9KG (2024) (v6.92.6600) | |
| AIDA64 / CPU PhotoWorxx | |
| Sınıf ortalaması Gaming (12271 - 89891, n=106, son 2 yıl) | |
| Schenker XMG Core 15 (M24) (v6.92.6600) | |
| HP Victus 16 (2024) (v6.92.6600) | |
| Gigabyte G6X 9KG (2024) (v6.92.6600) | |
| Lenovo LOQ 15IRX9 (v6.92.6600) | |
| Lenovo LOQ 15IRX9 (v6.92.6600, Leistungsmodus) | |
| Ortalama Intel Core i5-13450HX (36014 - 36764, n=3) | |
| Dell G16, i7-13650HX, RTX 4060 (v6.92.6600) | |
Sistem performansı
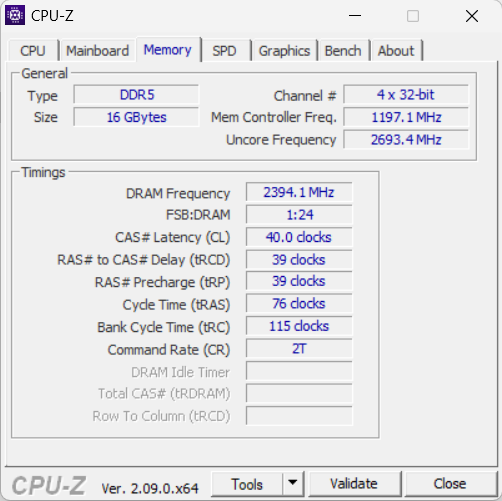
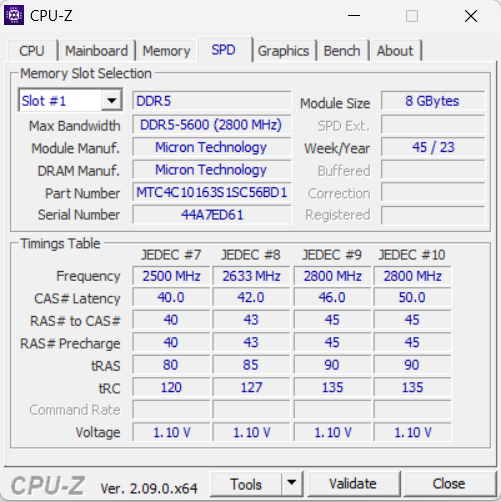
Sorunsuz çalışan sistem performans açısından eksik değil: bilgisayar oyun, render ve yayın işlemlerini sorunsuz bir şekilde gerçekleştiriyor. RAM'in aktarım hızları DDR5-5600 RAM için beklendiği gibi.

CrossMark: Overall | Productivity | Creativity | Responsiveness
WebXPRT 3: Overall
WebXPRT 4: Overall
Mozilla Kraken 1.1: Total
| PCMark 10 / Score | |
| Schenker XMG Core 15 (M24) | |
| Sınıf ortalaması Gaming (5828 - 12414, n=94, son 2 yıl) | |
| Gigabyte G6X 9KG (2024) | |
| HP Victus 16 (2024) | |
| Dell G16, i7-13650HX, RTX 4060 | |
| Lenovo LOQ 15IRX9 | |
| Ortalama Intel Core i5-13450HX, NVIDIA GeForce RTX 4060 Laptop GPU (n=1) | |
| PCMark 10 / Essentials | |
| HP Victus 16 (2024) | |
| Sınıf ortalaması Gaming (8810 - 11935, n=98, son 2 yıl) | |
| Gigabyte G6X 9KG (2024) | |
| Schenker XMG Core 15 (M24) | |
| Dell G16, i7-13650HX, RTX 4060 | |
| Lenovo LOQ 15IRX9 | |
| Ortalama Intel Core i5-13450HX, NVIDIA GeForce RTX 4060 Laptop GPU (n=1) | |
| PCMark 10 / Productivity | |
| Schenker XMG Core 15 (M24) | |
| Sınıf ortalaması Gaming (6845 - 25323, n=96, son 2 yıl) | |
| Gigabyte G6X 9KG (2024) | |
| Dell G16, i7-13650HX, RTX 4060 | |
| HP Victus 16 (2024) | |
| Lenovo LOQ 15IRX9 | |
| Ortalama Intel Core i5-13450HX, NVIDIA GeForce RTX 4060 Laptop GPU (n=1) | |
| PCMark 10 / Digital Content Creation | |
| Sınıf ortalaması Gaming (7602 - 19954, n=96, son 2 yıl) | |
| Schenker XMG Core 15 (M24) | |
| Dell G16, i7-13650HX, RTX 4060 | |
| Gigabyte G6X 9KG (2024) | |
| Lenovo LOQ 15IRX9 | |
| Ortalama Intel Core i5-13450HX, NVIDIA GeForce RTX 4060 Laptop GPU (n=1) | |
| HP Victus 16 (2024) | |
| CrossMark / Overall | |
| Sınıf ortalaması Gaming (1366 - 2409, n=95, son 2 yıl) | |
| Gigabyte G6X 9KG (2024) | |
| HP Victus 16 (2024) | |
| Schenker XMG Core 15 (M24) | |
| Dell G16, i7-13650HX, RTX 4060 | |
| Lenovo LOQ 15IRX9 | |
| Ortalama Intel Core i5-13450HX, NVIDIA GeForce RTX 4060 Laptop GPU (n=1) | |
| CrossMark / Productivity | |
| Gigabyte G6X 9KG (2024) | |
| Sınıf ortalaması Gaming (1386 - 2254, n=95, son 2 yıl) | |
| Schenker XMG Core 15 (M24) | |
| HP Victus 16 (2024) | |
| Dell G16, i7-13650HX, RTX 4060 | |
| Lenovo LOQ 15IRX9 | |
| Ortalama Intel Core i5-13450HX, NVIDIA GeForce RTX 4060 Laptop GPU (n=1) | |
| CrossMark / Creativity | |
| Sınıf ortalaması Gaming (1343 - 2786, n=95, son 2 yıl) | |
| HP Victus 16 (2024) | |
| Schenker XMG Core 15 (M24) | |
| Gigabyte G6X 9KG (2024) | |
| Dell G16, i7-13650HX, RTX 4060 | |
| Lenovo LOQ 15IRX9 | |
| Ortalama Intel Core i5-13450HX, NVIDIA GeForce RTX 4060 Laptop GPU (n=1) | |
| CrossMark / Responsiveness | |
| Gigabyte G6X 9KG (2024) | |
| HP Victus 16 (2024) | |
| Lenovo LOQ 15IRX9 | |
| Ortalama Intel Core i5-13450HX, NVIDIA GeForce RTX 4060 Laptop GPU (n=1) | |
| Sınıf ortalaması Gaming (1226 - 2334, n=95, son 2 yıl) | |
| Dell G16, i7-13650HX, RTX 4060 | |
| Schenker XMG Core 15 (M24) | |
| WebXPRT 3 / Overall | |
| Sınıf ortalaması Gaming (220 - 532, n=99, son 2 yıl) | |
| Schenker XMG Core 15 (M24) (Chrome 82) | |
| Gigabyte G6X 9KG (2024) (Chrome 82) | |
| HP Victus 16 (2024) (Chrome 82) | |
| Dell G16, i7-13650HX, RTX 4060 (Chrome 82) | |
| Lenovo LOQ 15IRX9 (Chrome 82) | |
| Ortalama Intel Core i5-13450HX, NVIDIA GeForce RTX 4060 Laptop GPU (n=1) | |
| WebXPRT 4 / Overall | |
| Sınıf ortalaması Gaming (165 - 354, n=99, son 2 yıl) | |
| Schenker XMG Core 15 (M24) (Chrome 105.0.0.0) | |
| Gigabyte G6X 9KG (2024) (Chrome 105.0.0.0) | |
| HP Victus 16 (2024) (Chrome 105.0.0.0) | |
| Lenovo LOQ 15IRX9 (Chrome 105.0.0.0) | |
| Ortalama Intel Core i5-13450HX, NVIDIA GeForce RTX 4060 Laptop GPU (n=1) | |
| Mozilla Kraken 1.1 / Total | |
| Lenovo LOQ 15IRX9 (Chrome 82) | |
| Ortalama Intel Core i5-13450HX, NVIDIA GeForce RTX 4060 Laptop GPU (n=1) | |
| HP Victus 16 (2024) (Chrome 82) | |
| Gigabyte G6X 9KG (2024) (Chrome 82) | |
| Dell G16, i7-13650HX, RTX 4060 (Chrome 82) | |
| Schenker XMG Core 15 (M24) (Chrome 82) | |
| Sınıf ortalaması Gaming (391 - 590, n=101, son 2 yıl) | |
* ... daha küçük daha iyidir
| PCMark 10 Score | 6929 puan | |
Yardım | ||
| AIDA64 / Memory Copy | |
| Sınıf ortalaması Gaming (21750 - 129946, n=106, son 2 yıl) | |
| Schenker XMG Core 15 (M24) (v6.92.6600) | |
| HP Victus 16 (2024) (v6.92.6600) | |
| Gigabyte G6X 9KG (2024) (v6.92.6600) | |
| Dell G16, i7-13650HX, RTX 4060 (v6.92.6600) | |
| Ortalama Intel Core i5-13450HX (58673 - 58861, n=3) | |
| Lenovo LOQ 15IRX9 (v6.92.6600) | |
| AIDA64 / Memory Read | |
| HP Victus 16 (2024) (v6.92.6600) | |
| Sınıf ortalaması Gaming (22956 - 118858, n=106, son 2 yıl) | |
| Gigabyte G6X 9KG (2024) (v6.92.6600) | |
| Lenovo LOQ 15IRX9 (v6.92.6600) | |
| Ortalama Intel Core i5-13450HX (66626 - 69024, n=3) | |
| Dell G16, i7-13650HX, RTX 4060 (v6.92.6600) | |
| Schenker XMG Core 15 (M24) (v6.92.6600) | |
| AIDA64 / Memory Write | |
| Schenker XMG Core 15 (M24) (v6.92.6600) | |
| Sınıf ortalaması Gaming (22297 - 135096, n=106, son 2 yıl) | |
| HP Victus 16 (2024) (v6.92.6600) | |
| Gigabyte G6X 9KG (2024) (v6.92.6600) | |
| Lenovo LOQ 15IRX9 (v6.92.6600) | |
| Ortalama Intel Core i5-13450HX (58540 - 60196, n=3) | |
| Dell G16, i7-13650HX, RTX 4060 (v6.92.6600) | |
| AIDA64 / Memory Latency | |
| Sınıf ortalaması Gaming (75.3 - 259, n=106, son 2 yıl) | |
| HP Victus 16 (2024) (v6.92.6600) | |
| Lenovo LOQ 15IRX9 (v6.92.6600) | |
| Ortalama Intel Core i5-13450HX (90 - 94.2, n=3) | |
| Dell G16, i7-13650HX, RTX 4060 (v6.92.6600) | |
| Gigabyte G6X 9KG (2024) (v6.92.6600) | |
| Schenker XMG Core 15 (M24) (v6.92.6600) | |
* ... daha küçük daha iyidir
DPC gecikme süreleri
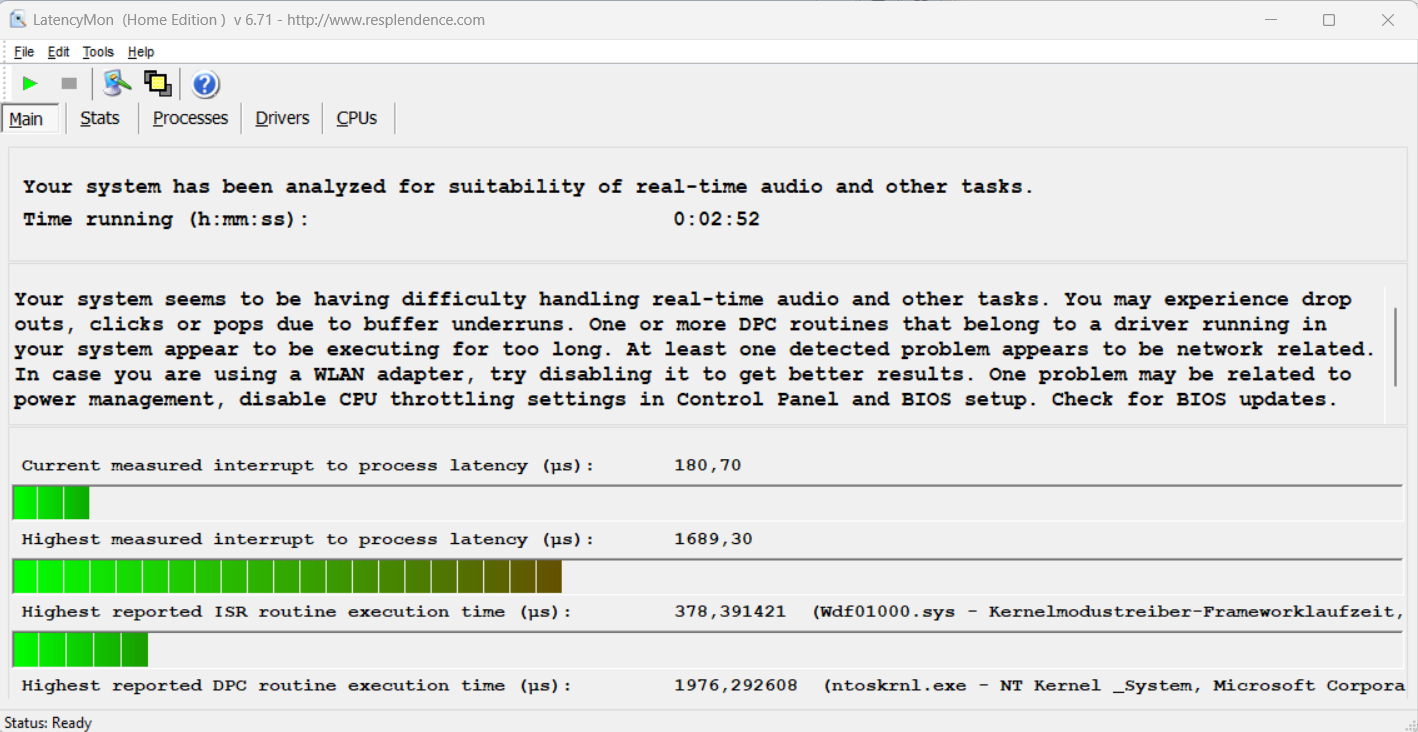
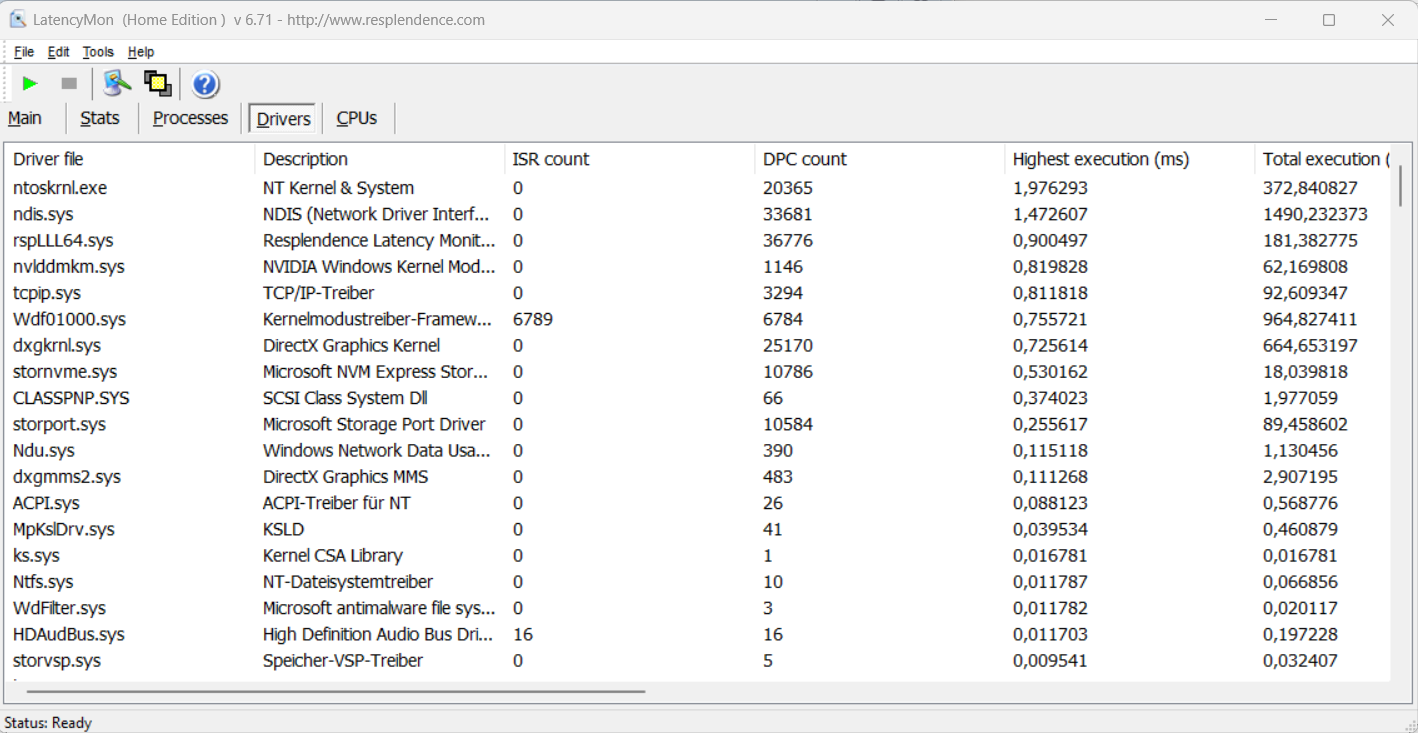
Standartlaştırılmış gecikme testi (web'de gezinme, 4k video oynatma, Prime95 yüksek yük) bazı anormallikler ortaya çıkardı. Sistem gerçek zamanlı video ve ses düzenleme için uygun görünmüyor. Gelecekteki yazılım güncellemeleri iyileştirmelere ve hatta kötüleşmelere yol açabilir.
| DPC Latencies / LatencyMon - interrupt to process latency (max), Web, Youtube, Prime95 | |
| Gigabyte G6X 9KG (2024) | |
| Lenovo LOQ 15IRX9 | |
| Schenker XMG Core 15 (M24) | |
| Dell G16, i7-13650HX, RTX 4060 | |
| HP Victus 16 (2024) | |
* ... daha küçük daha iyidir
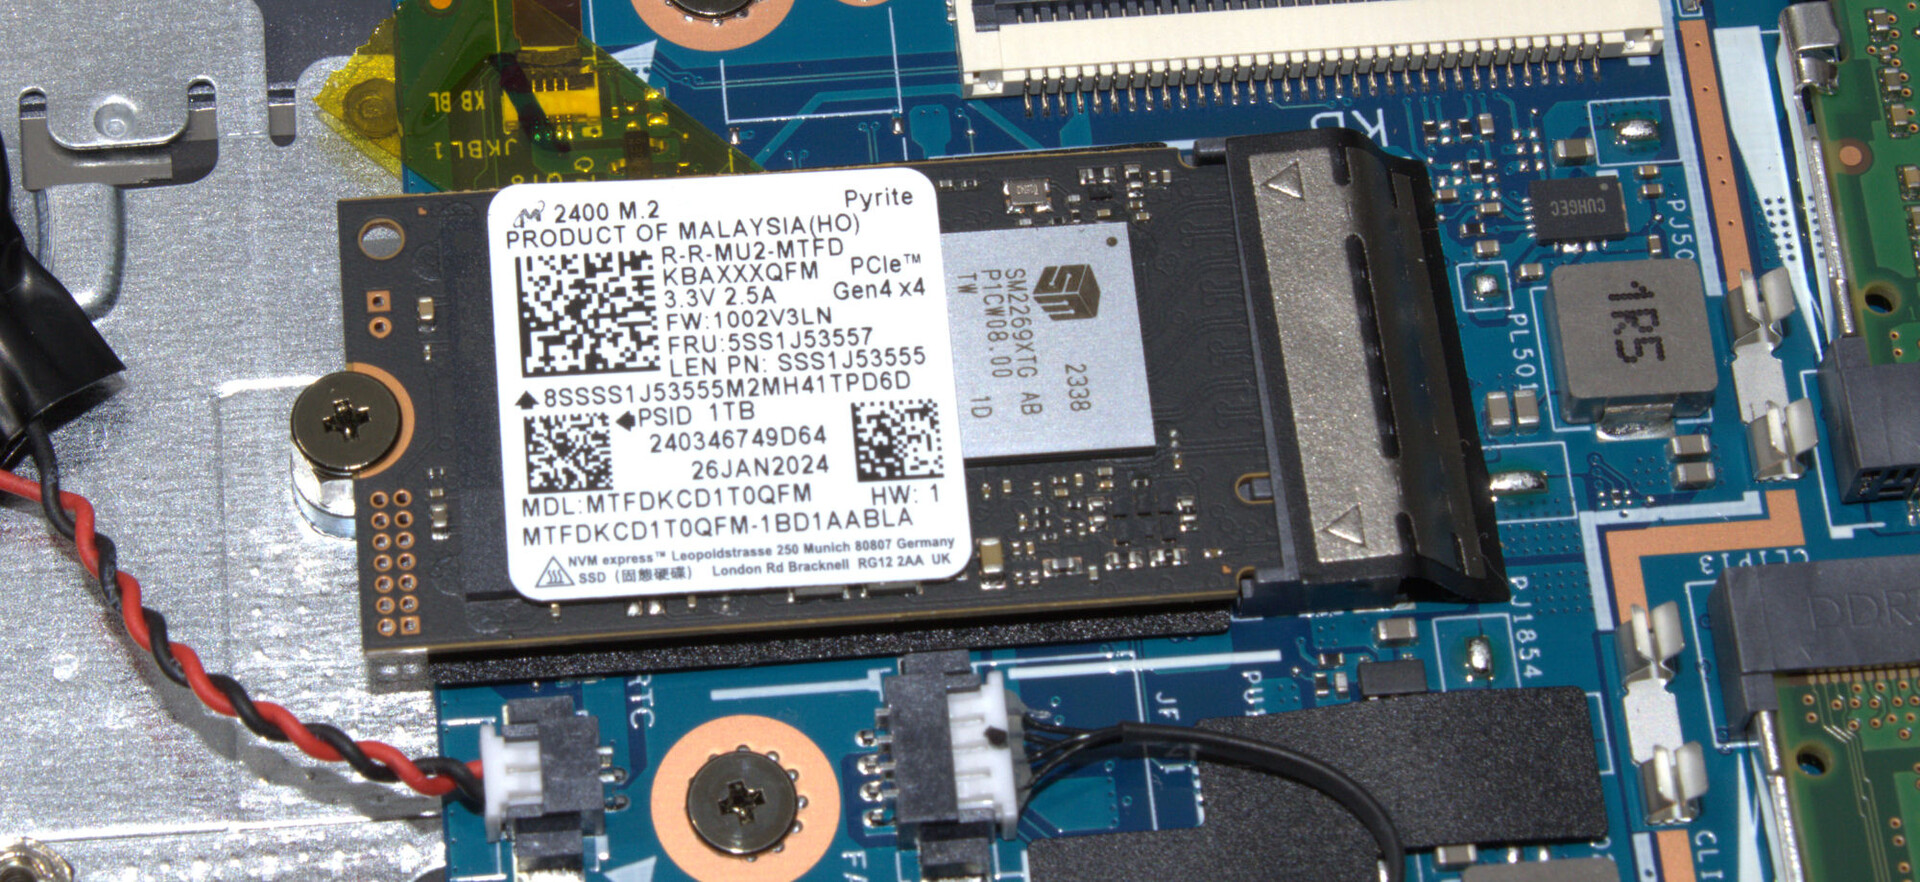
Depolama cihazları
LOQ, toplam iki PCIe 4 SSD (M.2 2280 veya M.2 2242) için alana sahiptir. Test cihazımızdaki Micron SSD (1 TB, M.2 2242) iyi veri hızları sunmaktadır, ancak sınıfının en iyisi SSD modellerinden biri olarak sınıflandırılamaz. DiskSpd döngüsünün ilerleyen aşamalarında, termal kaynaklı bazı kısılmalar gözlemledik.

* ... daha küçük daha iyidir
Reading continuous performance: DiskSpd Read Loop, Queue Depth 8
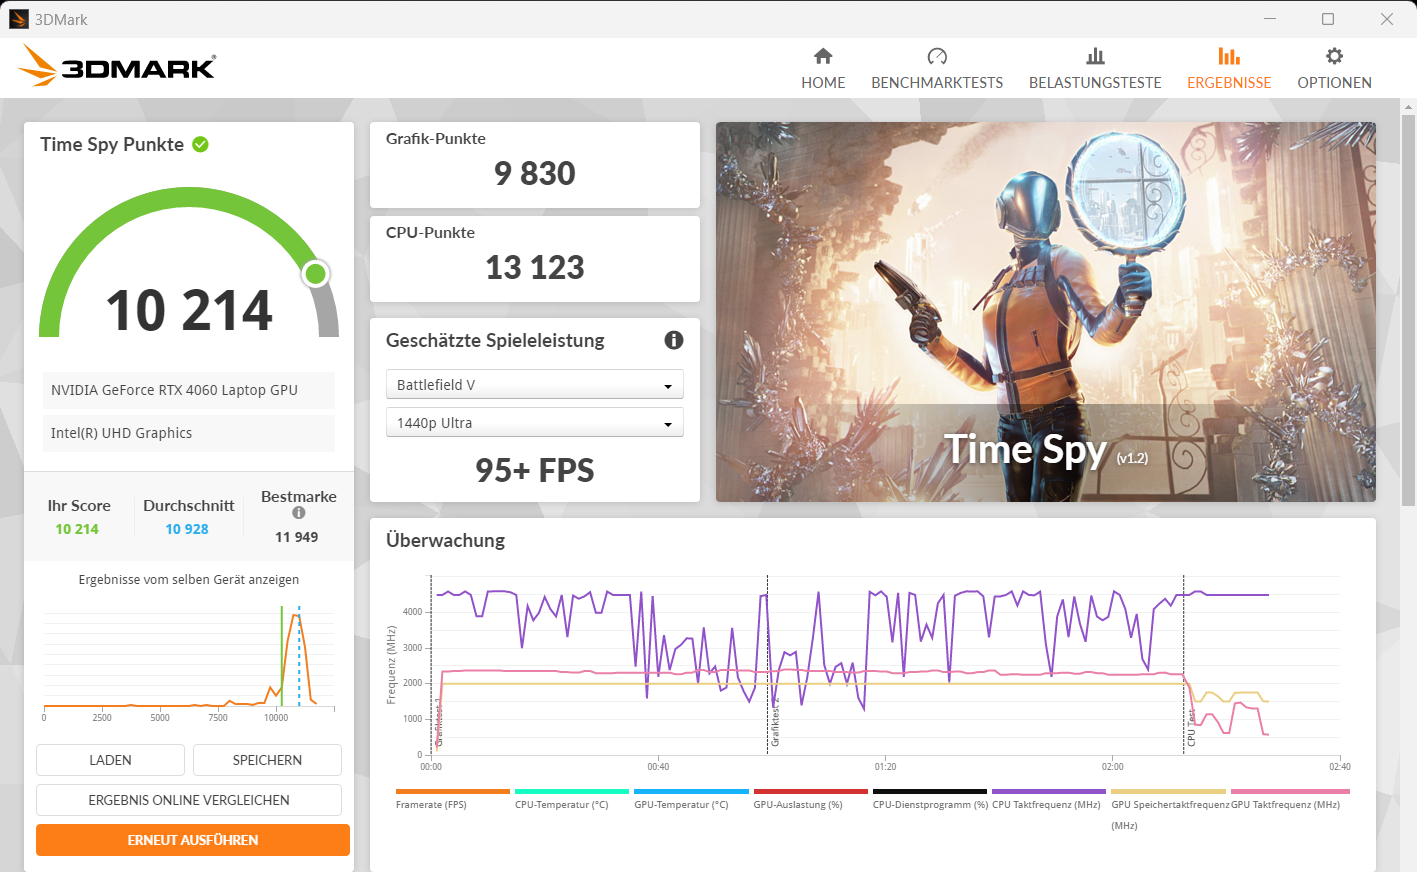
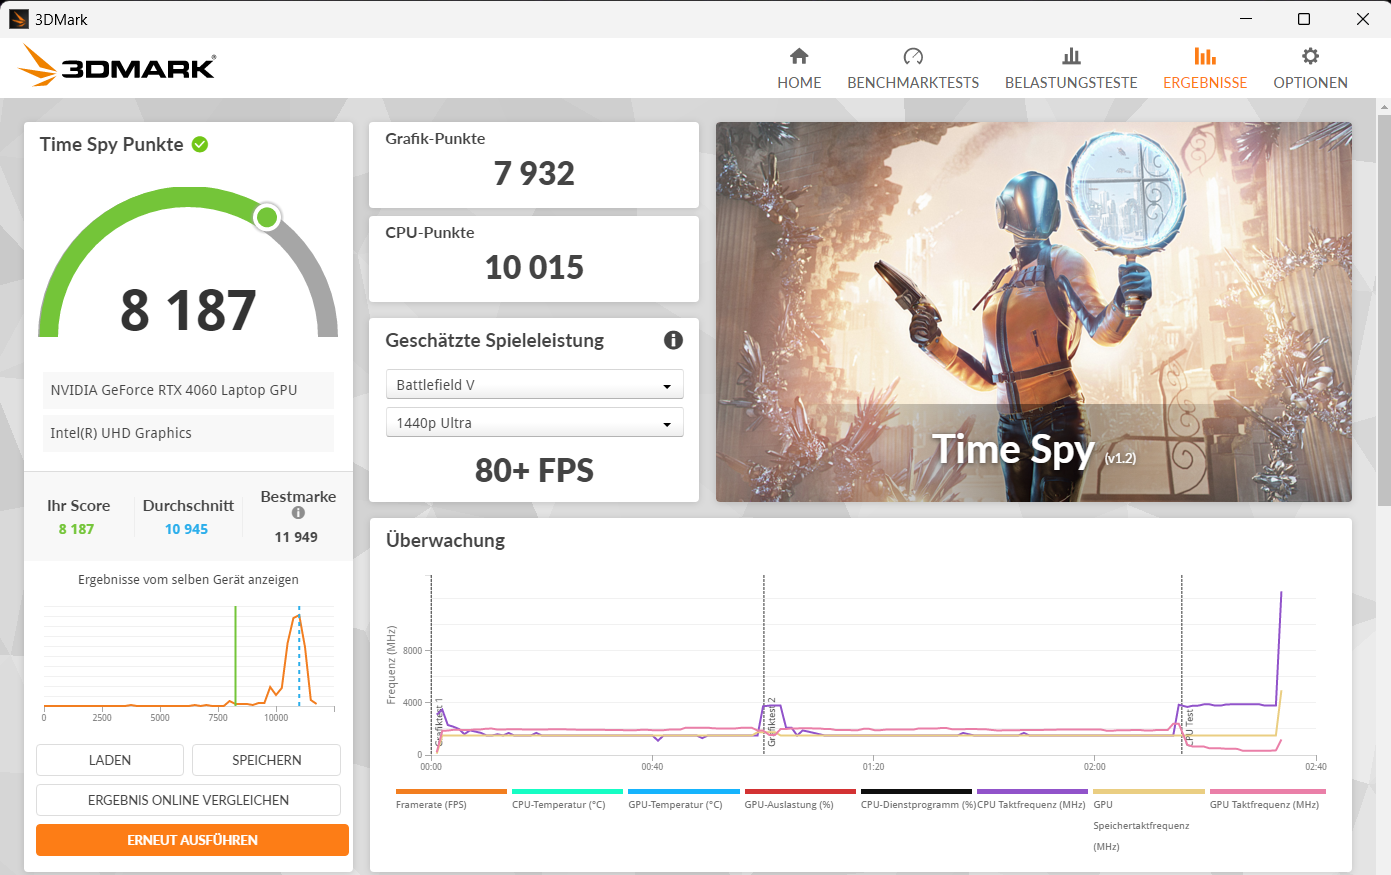
Grafik kartı
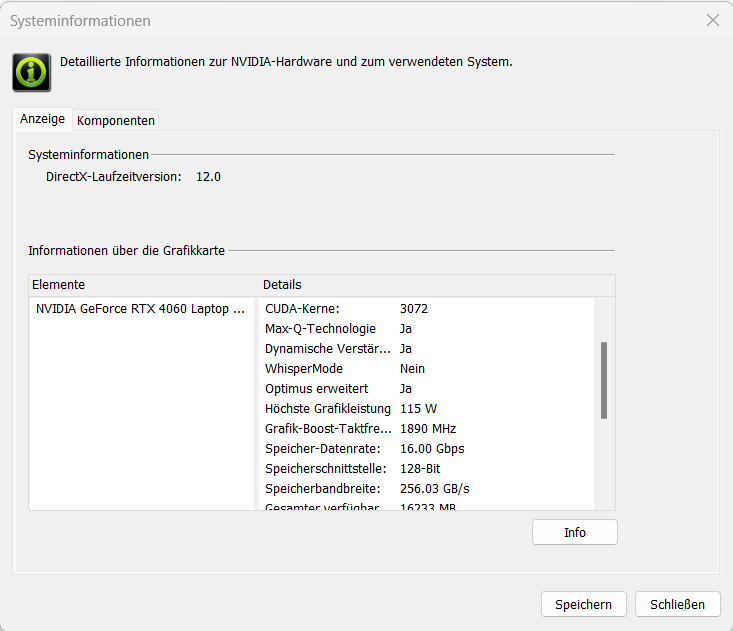
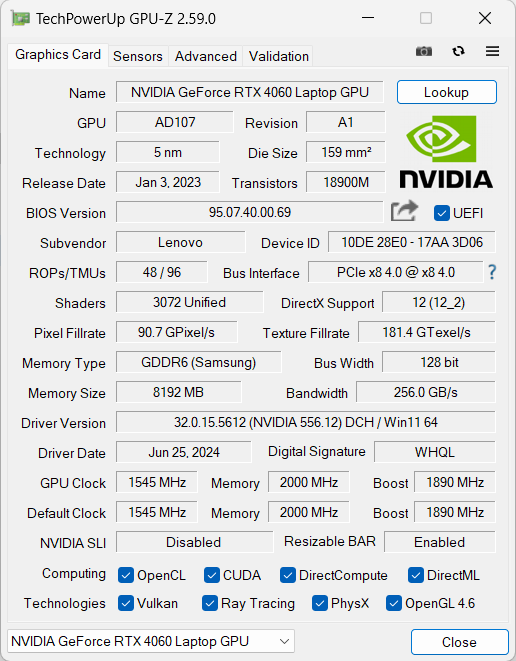
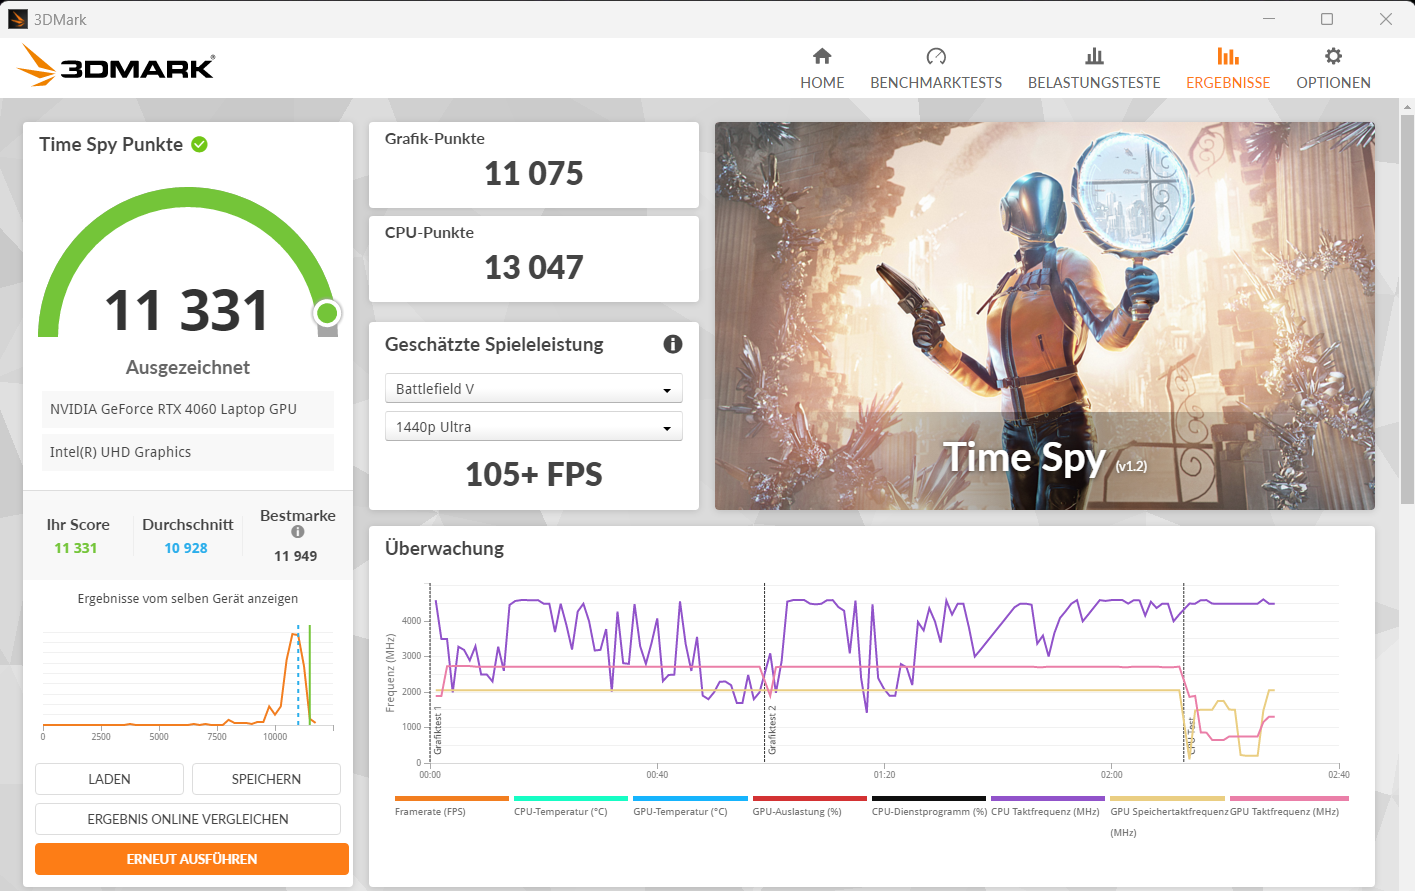
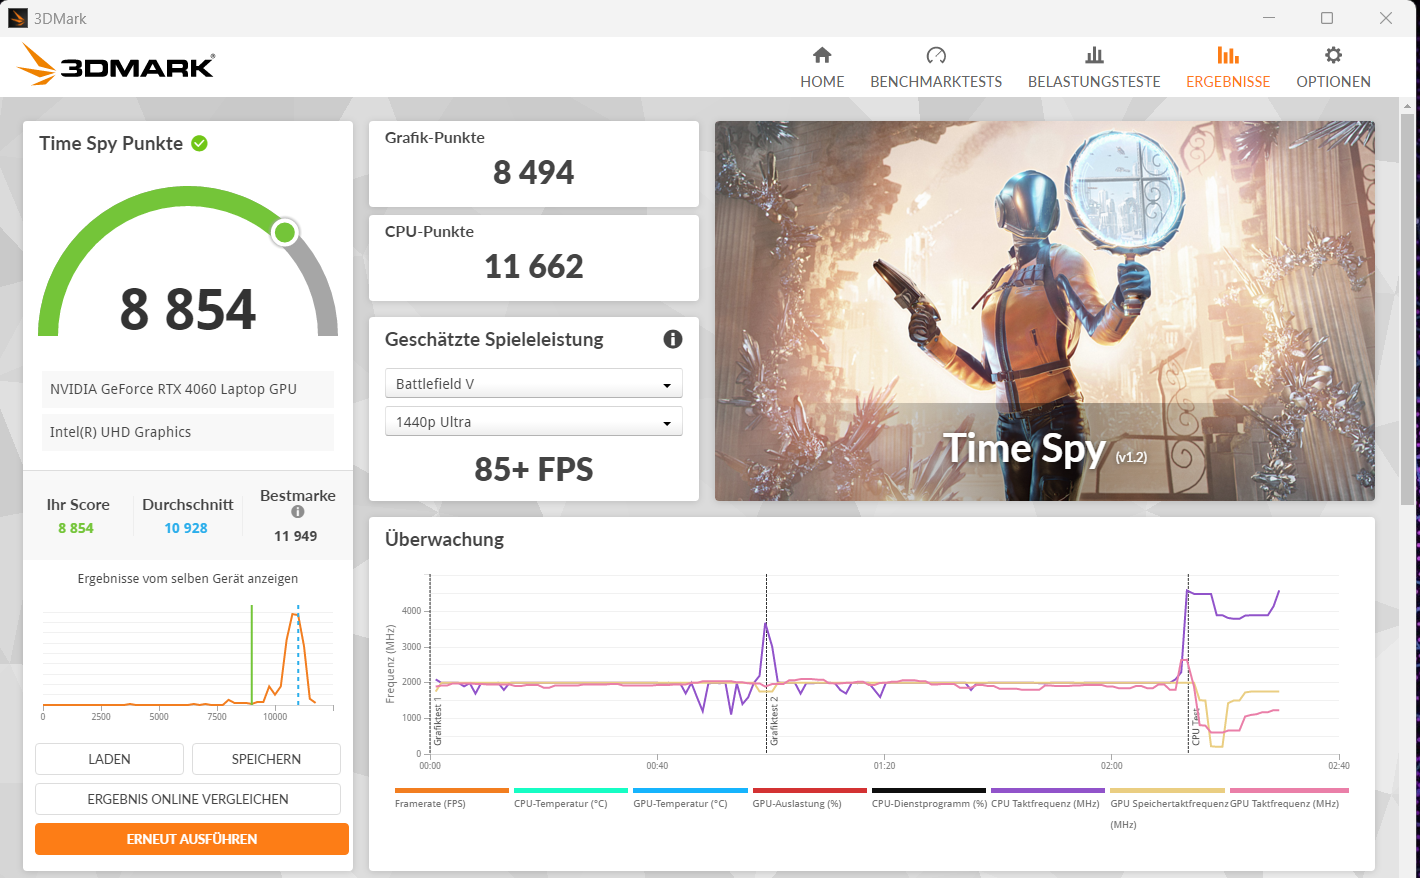
Bu GeForce RTX 4060 (3.072 gölgelendirici, 128 bit veri yolu, 8 GB GDDR6, 115 watt) Nvidia'nın mevcut mobil GPU serisinin orta seviyesini temsil ediyor. Yüksek ila maksimum ayarlarda FHD oyun oynamaya izin verir. Kıyaslama sonuçları ve kare hızları RTX-4060 ortalamasıyla(dengeli mod) kabaca eşittir. Performans modu daha iyi değerlerle sonuçlandı. DGPU ve Optimus arasında geçiş yapmak yeniden başlatma gerektirmez: Gelişmiş Optimus desteklenmektedir.
| 3DMark Performance rating - Percent | |
| Sınıf ortalaması Gaming | |
| Schenker XMG Core 15 (M24) | |
| Lenovo LOQ 15IRX9 | |
| Dell G16, i7-13650HX, RTX 4060 | |
| Lenovo LOQ 15IRX9 | |
| Gigabyte G6X 9KG (2024) | |
| HP Victus 16 (2024) | |
| Ortalama NVIDIA GeForce RTX 4060 Laptop GPU | |
| 3DMark 11 - 1280x720 Performance GPU | |
| Sınıf ortalaması Gaming (21841 - 80022, n=105, son 2 yıl) | |
| Schenker XMG Core 15 (M24) | |
| Lenovo LOQ 15IRX9 (Leistungsmodus) | |
| Dell G16, i7-13650HX, RTX 4060 | |
| Lenovo LOQ 15IRX9 | |
| Gigabyte G6X 9KG (2024) | |
| HP Victus 16 (2024) | |
| Ortalama NVIDIA GeForce RTX 4060 Laptop GPU (28136 - 38912, n=57) | |
| 3DMark | |
| 1920x1080 Fire Strike Graphics | |
| Sınıf ortalaması Gaming (12242 - 62849, n=116, son 2 yıl) | |
| Schenker XMG Core 15 (M24) | |
| Lenovo LOQ 15IRX9 (Leistungsmodus) | |
| Lenovo LOQ 15IRX9 | |
| Gigabyte G6X 9KG (2024) | |
| Dell G16, i7-13650HX, RTX 4060 | |
| HP Victus 16 (2024) | |
| Ortalama NVIDIA GeForce RTX 4060 Laptop GPU (20533 - 29656, n=54) | |
| 2560x1440 Time Spy Graphics | |
| Sınıf ortalaması Gaming (5012 - 26212, n=116, son 2 yıl) | |
| Schenker XMG Core 15 (M24) | |
| Lenovo LOQ 15IRX9 (Leistungsmodus) | |
| Dell G16, i7-13650HX, RTX 4060 | |
| Ortalama NVIDIA GeForce RTX 4060 Laptop GPU (7484 - 11451, n=56) | |
| HP Victus 16 (2024) | |
| Gigabyte G6X 9KG (2024) | |
| Lenovo LOQ 15IRX9 | |
| 3DMark 11 Performance | 30755 puan | |
| 3DMark Fire Strike Score | 22788 puan | |
| 3DMark Time Spy Score | 10214 puan | |
| 3DMark Steel Nomad Score | 2143 puan | |
Yardım | ||
| Blender | |
| v3.3 Classroom OPTIX/RTX | |
| Lenovo LOQ 15IRX9 (3.3.3) | |
| Dell G16, i7-13650HX, RTX 4060 (3.3.3) | |
| Ortalama NVIDIA GeForce RTX 4060 Laptop GPU (19 - 28, n=53) | |
| HP Victus 16 (2024) (3.3.3) | |
| Lenovo LOQ 15IRX9 (3.3.3, Leistungsmodus) | |
| Gigabyte G6X 9KG (2024) (3.3.3) | |
| Schenker XMG Core 15 (M24) (3.3.3) | |
| Sınıf ortalaması Gaming (9 - 32, n=107, son 2 yıl) | |
| v3.3 Classroom CUDA | |
| Dell G16, i7-13650HX, RTX 4060 (3.3.3) | |
| Lenovo LOQ 15IRX9 (3.3.3) | |
| Ortalama NVIDIA GeForce RTX 4060 Laptop GPU (39 - 53, n=53) | |
| Lenovo LOQ 15IRX9 (3.3.3, Leistungsmodus) | |
| HP Victus 16 (2024) (3.3.3) | |
| Gigabyte G6X 9KG (2024) (3.3.3) | |
| Schenker XMG Core 15 (M24) (3.3.3) | |
| Sınıf ortalaması Gaming (15 - 228, n=107, son 2 yıl) | |
| v3.3 Classroom CPU | |
| Gigabyte G6X 9KG (2024) (3.3.3) | |
| Lenovo LOQ 15IRX9 (3.3.3) | |
| Lenovo LOQ 15IRX9 (3.3.3, Leistungsmodus) | |
| HP Victus 16 (2024) (3.3.3) | |
| Ortalama NVIDIA GeForce RTX 4060 Laptop GPU (189 - 452, n=53) | |
| Schenker XMG Core 15 (M24) (3.3.3) | |
| Dell G16, i7-13650HX, RTX 4060 (3.3.3) | |
| Sınıf ortalaması Gaming (122 - 565, n=103, son 2 yıl) | |
| Geekbench 5.5 | |
| OpenCL Score | |
| Sınıf ortalaması Gaming (80702 - 277970, n=102, son 2 yıl) | |
| Schenker XMG Core 15 (M24) | |
| Lenovo LOQ 15IRX9 (Leistungsmodus) | |
| Lenovo LOQ 15IRX9 | |
| Gigabyte G6X 9KG (2024) | |
| Dell G16, i7-13650HX, RTX 4060 | |
| HP Victus 16 (2024) | |
| Ortalama NVIDIA GeForce RTX 4060 Laptop GPU (5039 - 112238, n=53) | |
| Vulkan Score 5.5 | |
| Sınıf ortalaması Gaming (18857 - 246759, n=76, son 2 yıl) | |
| Schenker XMG Core 15 (M24) | |
| Lenovo LOQ 15IRX9 (Leistungsmodus) | |
| Lenovo LOQ 15IRX9 | |
| Ortalama NVIDIA GeForce RTX 4060 Laptop GPU (46347 - 87612, n=30) | |
| HP Victus 16 (2024) | |
| Gigabyte G6X 9KG (2024) | |
| Geekbench 6.7 | |
| GPU OpenCL | |
| Sınıf ortalaması Gaming (67235 - 253130, n=104, son 2 yıl) | |
| Gigabyte G6X 9KG (2024) (6.2.1) | |
| Schenker XMG Core 15 (M24) (6.2.1) | |
| HP Victus 16 (2024) (6.2.1) | |
| Dell G16, i7-13650HX, RTX 4060 (6.2.1) | |
| Lenovo LOQ 15IRX9 (6.2.1, Leistungsmodus) | |
| Ortalama NVIDIA GeForce RTX 4060 Laptop GPU (76525 - 100831, n=39) | |
| Lenovo LOQ 15IRX9 (6.2.1) | |
| GPU Vulkan | |
| Sınıf ortalaması Gaming (7562 - 244348, n=60, son 2 yıl) | |
| Schenker XMG Core 15 (M24) (6.2.1) | |
| Lenovo LOQ 15IRX9 (6.2.1, Leistungsmodus) | |
| Gigabyte G6X 9KG (2024) (6.2.1) | |
| Lenovo LOQ 15IRX9 (6.2.1) | |
| Ortalama NVIDIA GeForce RTX 4060 Laptop GPU (75631 - 101001, n=24) | |
| HP Victus 16 (2024) (6.2.1) | |
| V-Ray 5 Benchmark | |
| GPU RTX | |
| Sınıf ortalaması Gaming (1146 - 4363, n=33, son 2 yıl) | |
| Gigabyte G6X 9KG (2024) (5.0.1) | |
| HP Victus 16 (2024) (5.0.1) | |
| Lenovo LOQ 15IRX9 (5.0.1, Leistungsmodus) | |
| Dell G16, i7-13650HX, RTX 4060 (5.0.1) | |
| Ortalama NVIDIA GeForce RTX 4060 Laptop GPU (1387 - 1817, n=28) | |
| Lenovo LOQ 15IRX9 (5.0.1) | |
| GPU CUDA | |
| Sınıf ortalaması Gaming (887 - 3288, n=33, son 2 yıl) | |
| Lenovo LOQ 15IRX9 (5.0.1, Leistungsmodus) | |
| Gigabyte G6X 9KG (2024) (5.0.1) | |
| Lenovo LOQ 15IRX9 (5.0.1) | |
| HP Victus 16 (2024) (5.0.1) | |
| Ortalama NVIDIA GeForce RTX 4060 Laptop GPU (957 - 1294, n=29) | |
| Dell G16, i7-13650HX, RTX 4060 (5.0.1) | |
| CPU | |
| Sınıf ortalaması Gaming (5864 - 30302, n=32, son 2 yıl) | |
| HP Victus 16 (2024) (5.0.1) | |
| Ortalama NVIDIA GeForce RTX 4060 Laptop GPU (8364 - 21065, n=28) | |
| Gigabyte G6X 9KG (2024) (5.0.1) | |
| Lenovo LOQ 15IRX9 (5.0.1, Leistungsmodus) | |
| Dell G16, i7-13650HX, RTX 4060 (5.0.1) | |
| Lenovo LOQ 15IRX9 (5.0.1) | |
| V-Ray Benchmark Next 4.10 | |
| GPU | |
| Sınıf ortalaması Gaming (427 - 1627, n=100, son 2 yıl) | |
| Schenker XMG Core 15 (M24) (v4.10.07 ) | |
| Gigabyte G6X 9KG (2024) (v4.10.07 ) | |
| Lenovo LOQ 15IRX9 (v4.10.07, Leistungsmodus) | |
| Ortalama NVIDIA GeForce RTX 4060 Laptop GPU (483 - 715, n=46) | |
| HP Victus 16 (2024) (v4.10.07 ) | |
| Lenovo LOQ 15IRX9 (v4.10.07 ) | |
| CPU | |
| Sınıf ortalaması Gaming (10048 - 45327, n=98, son 2 yıl) | |
| HP Victus 16 (2024) (v4.10.07 ) | |
| Ortalama NVIDIA GeForce RTX 4060 Laptop GPU (12680 - 32360, n=46) | |
| Schenker XMG Core 15 (M24) (v4.10.07 ) | |
| Gigabyte G6X 9KG (2024) (v4.10.07 ) | |
| Lenovo LOQ 15IRX9 (v4.10.07, Leistungsmodus) | |
| Lenovo LOQ 15IRX9 (v4.10.07 ) | |
* ... daha küçük daha iyidir
| Performance rating - Percent | |
| Sınıf ortalaması Gaming | |
| Schenker XMG Core 15 (M24) | |
| Dell G16, i7-13650HX, RTX 4060 | |
| Lenovo LOQ 15IRX9 | |
| Gigabyte G6X 9KG (2024) | |
| Ortalama NVIDIA GeForce RTX 4060 Laptop GPU | |
| HP Victus 16 (2024) | |
| Lenovo LOQ 15IRX9 | |
| Cyberpunk 2077 - 1920x1080 Ultra Preset (FSR off) | |
| Sınıf ortalaması Gaming (17.7 - 169.9, n=116, son 2 yıl) | |
| Schenker XMG Core 15 (M24) (2.12) | |
| Lenovo LOQ 15IRX9 (2.02, Leistungsmodus) | |
| Ortalama NVIDIA GeForce RTX 4060 Laptop GPU (56.4 - 93.1, n=31) | |
| Lenovo LOQ 15IRX9 (2.02) | |
| Dell G16, i7-13650HX, RTX 4060 (2.11) | |
| Gigabyte G6X 9KG (2024) (2.02) | |
| HP Victus 16 (2024) (2.02) | |
| GTA V - 1920x1080 Highest AA:4xMSAA + FX AF:16x | |
| Sınıf ortalaması Gaming (48.3 - 186.9, n=94, son 2 yıl) | |
| Dell G16, i7-13650HX, RTX 4060 | |
| Schenker XMG Core 15 (M24) | |
| Lenovo LOQ 15IRX9 (Leistungsmodus) | |
| Gigabyte G6X 9KG (2024) | |
| Lenovo LOQ 15IRX9 | |
| HP Victus 16 (2024) | |
| Ortalama NVIDIA GeForce RTX 4060 Laptop GPU (76.9 - 126.3, n=48) | |
| Final Fantasy XV Benchmark - 1920x1080 High Quality | |
| Sınıf ortalaması Gaming (41 - 215, n=95, son 2 yıl) | |
| Lenovo LOQ 15IRX9 (1.3, Leistungsmodus) | |
| Schenker XMG Core 15 (M24) (1.3) | |
| Dell G16, i7-13650HX, RTX 4060 (1.3) | |
| Gigabyte G6X 9KG (2024) (1.3) | |
| Lenovo LOQ 15IRX9 (1.3) | |
| HP Victus 16 (2024) (1.3) | |
| Ortalama NVIDIA GeForce RTX 4060 Laptop GPU (75.1 - 109.8, n=51) | |
| Strange Brigade - 1920x1080 ultra AA:ultra AF:16 | |
| Sınıf ortalaması Gaming (76.3 - 458, n=87, son 2 yıl) | |
| Schenker XMG Core 15 (M24) (1.47.22.14 D3D12) | |
| Dell G16, i7-13650HX, RTX 4060 (1.47.22.14 D3D12) | |
| Lenovo LOQ 15IRX9 (1.47.22.14 D3D12, Leistungsmodus) | |
| Lenovo LOQ 15IRX9 (1.47.22.14 D3D12) | |
| Gigabyte G6X 9KG (2024) (1.47.22.14 D3D12) | |
| Ortalama NVIDIA GeForce RTX 4060 Laptop GPU (135.3 - 210, n=50) | |
| HP Victus 16 (2024) (1.47.22.14 D3D12) | |
| Dota 2 Reborn - 1920x1080 ultra (3/3) best looking | |
| Sınıf ortalaması Gaming (84.8 - 252, n=108, son 2 yıl) | |
| HP Victus 16 (2024) | |
| Dell G16, i7-13650HX, RTX 4060 | |
| Ortalama NVIDIA GeForce RTX 4060 Laptop GPU (115 - 183.8, n=53) | |
| Lenovo LOQ 15IRX9 (Leistungsmodus) | |
| Gigabyte G6X 9KG (2024) | |
| Lenovo LOQ 15IRX9 | |
| Schenker XMG Core 15 (M24) | |
| X-Plane 11.11 - 1920x1080 high (fps_test=3) | |
| Dell G16, i7-13650HX, RTX 4060 | |
| Gigabyte G6X 9KG (2024) | |
| Ortalama NVIDIA GeForce RTX 4060 Laptop GPU (60.7 - 141.1, n=54) | |
| Lenovo LOQ 15IRX9 (Leistungsmodus) | |
| HP Victus 16 (2024) | |
| Sınıf ortalaması Gaming (55.5 - 148.5, n=110, son 2 yıl) | |
| Schenker XMG Core 15 (M24) | |
| Lenovo LOQ 15IRX9 | |
| Dragon's Dogma 2 - 1920x1080 High Preset | |
| Sınıf ortalaması Gaming (61.5 - 99.3, n=6, son 2 yıl) | |
| HP Victus 16 (2024) | |
| Lenovo LOQ 15IRX9 | |
| Ortalama NVIDIA GeForce RTX 4060 Laptop GPU (57.2 - 67.7, n=5) | |
| Razer Blade 14 Mid 23 | |
| F1 24 - 1920x1080 Ultra High Preset AA:T AF:16x | |
| Sınıf ortalaması Gaming (58.8 - 163.6, n=58, son 2 yıl) | |
| Ortalama NVIDIA GeForce RTX 4060 Laptop GPU (47.5 - 61.6, n=10) | |
| Razer Blade 14 Mid 23 | |
| Lenovo LOQ 15IRX9 (1122588) | |
| Counter-Strike 2 - 1920x1080 Very High Preset | |
| Sınıf ortalaması Gaming (26.2 - 275, n=5, son 2 yıl) | |
| Razer Blade 14 Mid 23 | |
| Ortalama NVIDIA GeForce RTX 4060 Laptop GPU (123.9 - 139.1, n=2) | |
| Lenovo LOQ 15IRX9 | |
| Senua's Saga Hellblade 2 - 1920x1080 High Preset | |
| Sınıf ortalaması Gaming (33.9 - 86.1, n=12, son 2 yıl) | |
| Ortalama NVIDIA GeForce RTX 4060 Laptop GPU (37.6 - 39.5, n=3) | |
| Lenovo LOQ 15IRX9 | |
| Razer Blade 14 Mid 23 | |
| Ghost of Tsushima - 1920x1080 Very High Preset AA:T | |
| Sınıf ortalaması Gaming (28.5 - 108.1, n=14, son 2 yıl) | |
| Lenovo LOQ 15IRX9 | |
| Ortalama NVIDIA GeForce RTX 4060 Laptop GPU (55.6 - 63.4, n=5) | |
| Razer Blade 14 Mid 23 | |
Cyberpunk 2077 ultra FPS diagram
| düşük | orta | yüksek | ultra | |
|---|---|---|---|---|
| GTA V (2015) | 184.4 | 181.5 | 175.5 | 112.6 |
| Dota 2 Reborn (2015) | 171.2 | 156.8 | 149.4 | 141 |
| Final Fantasy XV Benchmark (2018) | 198.9 | 138.5 | 99.9 | |
| X-Plane 11.11 (2018) | 139.6 | 118.4 | 92.2 | |
| Strange Brigade (2018) | 425 | 260 | 209 | 182.7 |
| Cyberpunk 2077 (2023) | 118.9 | 94.3 | 80.1 | 71.4 |
| Counter-Strike 2 (2023) | 195.3 | 195 | 157 | 123.9 |
| Dragon's Dogma 2 (2024) | 70.6 | 63.3 | ||
| Ghost of Tsushima (2024) | 91 | 81.7 | 74.5 | 60.6 |
| Senua's Saga Hellblade 2 (2024) | 64.1 | 53.2 | 38.4 | |
| F1 24 (2024) | 216 | 201 | 162.5 | 54.1 |
Emisyonlar ve güç - Ortalamanın altında pil ömrüne sahip Lenovo LOQ
Gürültü emisyonları
Gürültü emisyonları söz konusu olduğunda, dizüstü bilgisayar sınıfı için beklendiği gibi performans gösteriyor: Yük altında çok fazla gürültü üretiyor. Cyberpunk 2077 oynatıldığında 48 dB(A) (dengeli mod) ve 54 dB(A)(performans modu) gürültü emisyonları ortaya çıkıyor. Sessiz mod, dizüstü bilgisayarın performansından ödün vermek pahasına gürültü seviyelerini daha ılımlı değerlere düşürür. Düşük ayarlarla oyun oynamak hala mümkün olmalıdır.
Fan kontrolünün biraz yeniden ayarlanması gerekiyor: Rölantide çalışırken fanlar tekrar tekrar kısa süreliğine çalışmaya başlıyor; bu uzun vadede çok can sıkıcı bir davranış. Bazen de açıkça duyulabilir bir seviyede sürekli çalışıyorlar.
Ses yüksekliği
| Boşta |
| 26 / 34 / 36 dB |
| Çalışırken |
| 48 / 50 dB |
 | ||
30 dB sessiz 40 dB(A) duyulabilirlik 50 dB(A) gürültülü |
||
min: | ||
| Lenovo LOQ 15IRX9 GeForce RTX 4060 Laptop GPU, i5-13450HX, Micron 2400 MTFDKCD1T0QFM | Schenker XMG Core 15 (M24) GeForce RTX 4060 Laptop GPU, R7 8845HS, Samsung 990 Pro 1 TB | Gigabyte G6X 9KG (2024) GeForce RTX 4060 Laptop GPU, i7-13650HX, Gigabyte AG450E1024-SI | HP Victus 16 (2024) GeForce RTX 4060 Laptop GPU, i7-14700HX, Kioxia XG8 KXG80ZNV512G | Dell G16, i7-13650HX, RTX 4060 GeForce RTX 4060 Laptop GPU, i7-13650HX, WD PC SN740 SDDPNQD-1T00 | |
|---|---|---|---|---|---|
| Noise | 14% | -4% | 4% | 20% | |
| kapalı / ortam * (dB) | 25 | 23 8% | 26 -4% | 25 -0% | 23 8% |
| Idle Minimum * (dB) | 26 | 23 12% | 30 -15% | 28 -8% | 23 12% |
| Idle Average * (dB) | 34 | 23 32% | 32 6% | 29 15% | 23 32% |
| Idle Maximum * (dB) | 36 | 23 36% | 35 3% | 33 8% | 27.96 22% |
| Load Average * (dB) | 48 | 38.92 19% | 51 -6% | 45 6% | 27.96 42% |
| Cyberpunk 2077 ultra * (dB) | 48 | 52.06 -8% | |||
| Load Maximum * (dB) | 50 | 52.09 -4% | 54 -8% | 48 4% | 47.89 4% |
| Witcher 3 ultra * (dB) | 50.96 | 51 | 43 | 47.89 |
* ... daha küçük daha iyidir
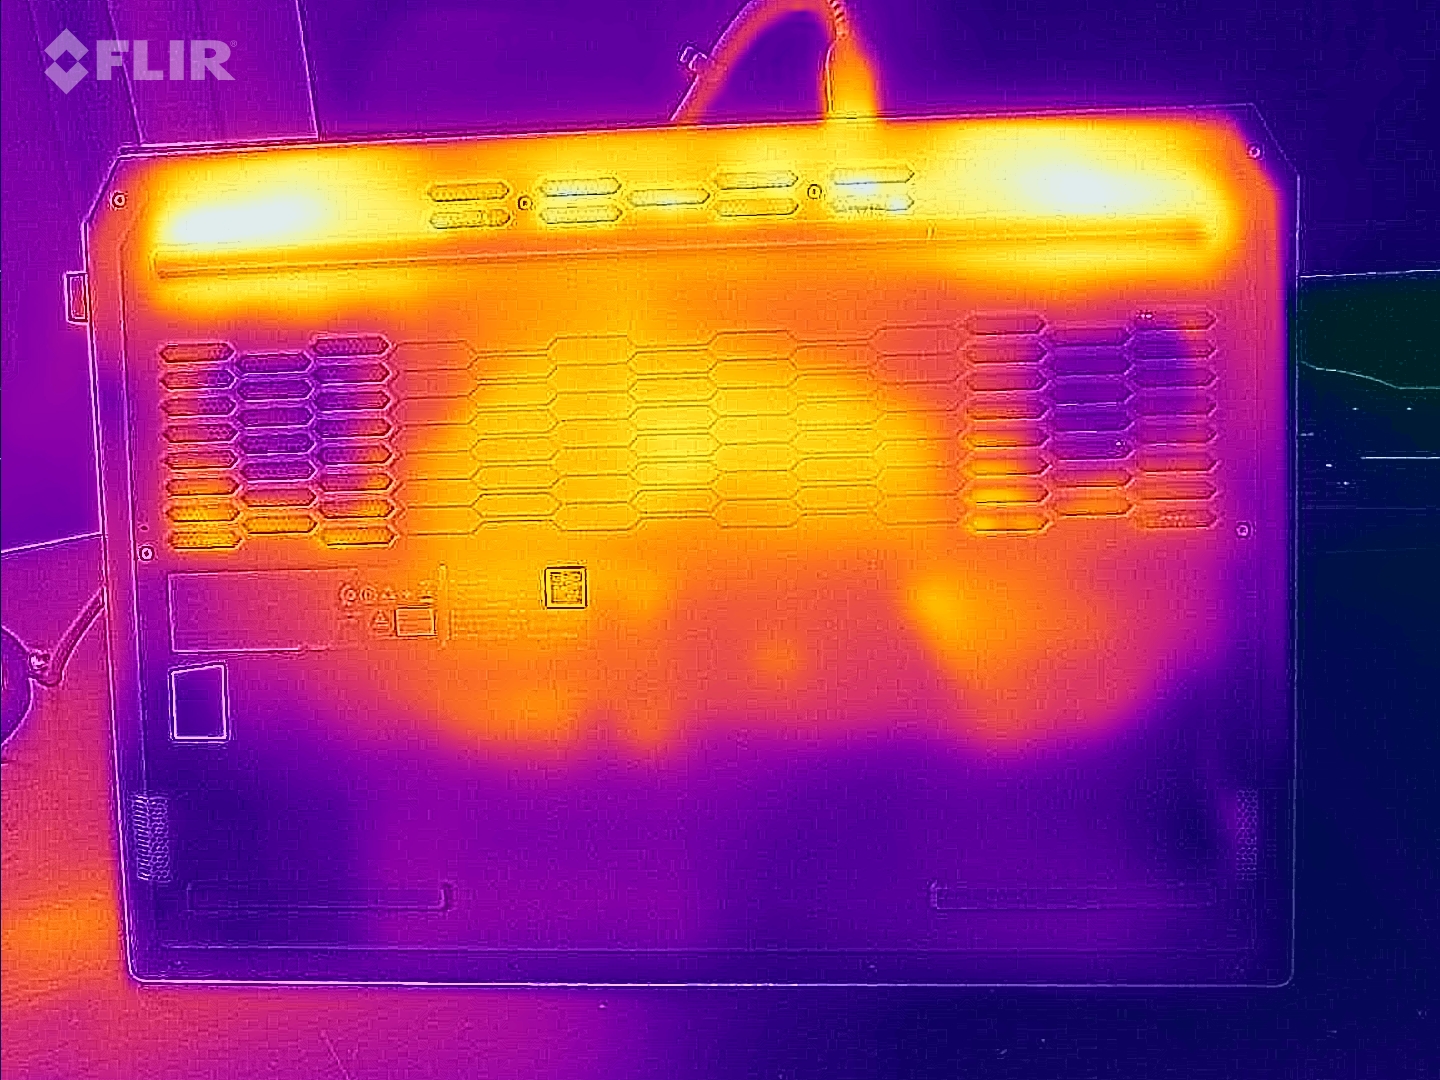
Sıcaklık
Yük altında (stres testi, Cyberpunk), dizüstü bilgisayar fark edilir derecede ısınıyor: Zaman zaman 50 derece Celcius sınırını aşıyor. Ayrıca günlük kullanım sırasında (ofis, internet) karşılaştırma cihazlarının çoğundan daha yüksek değerlere ulaşıyor. Avuç içi dayanağının sıcaklıkları yarı makul seviyede kalıyor.
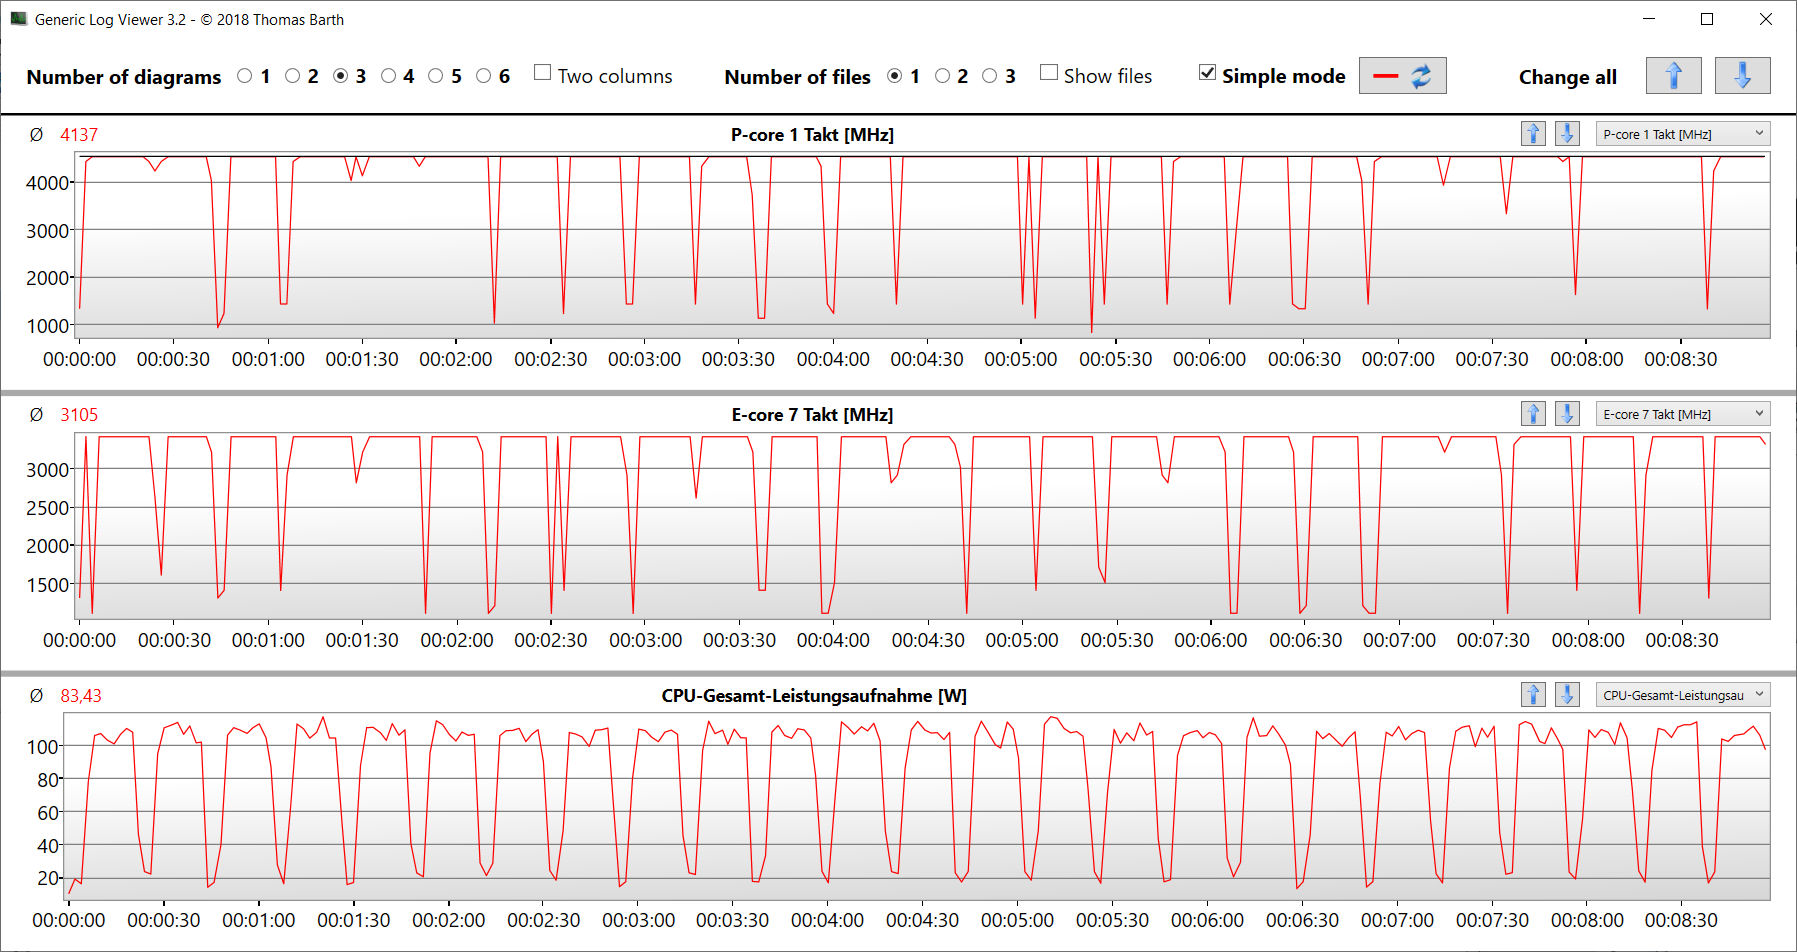
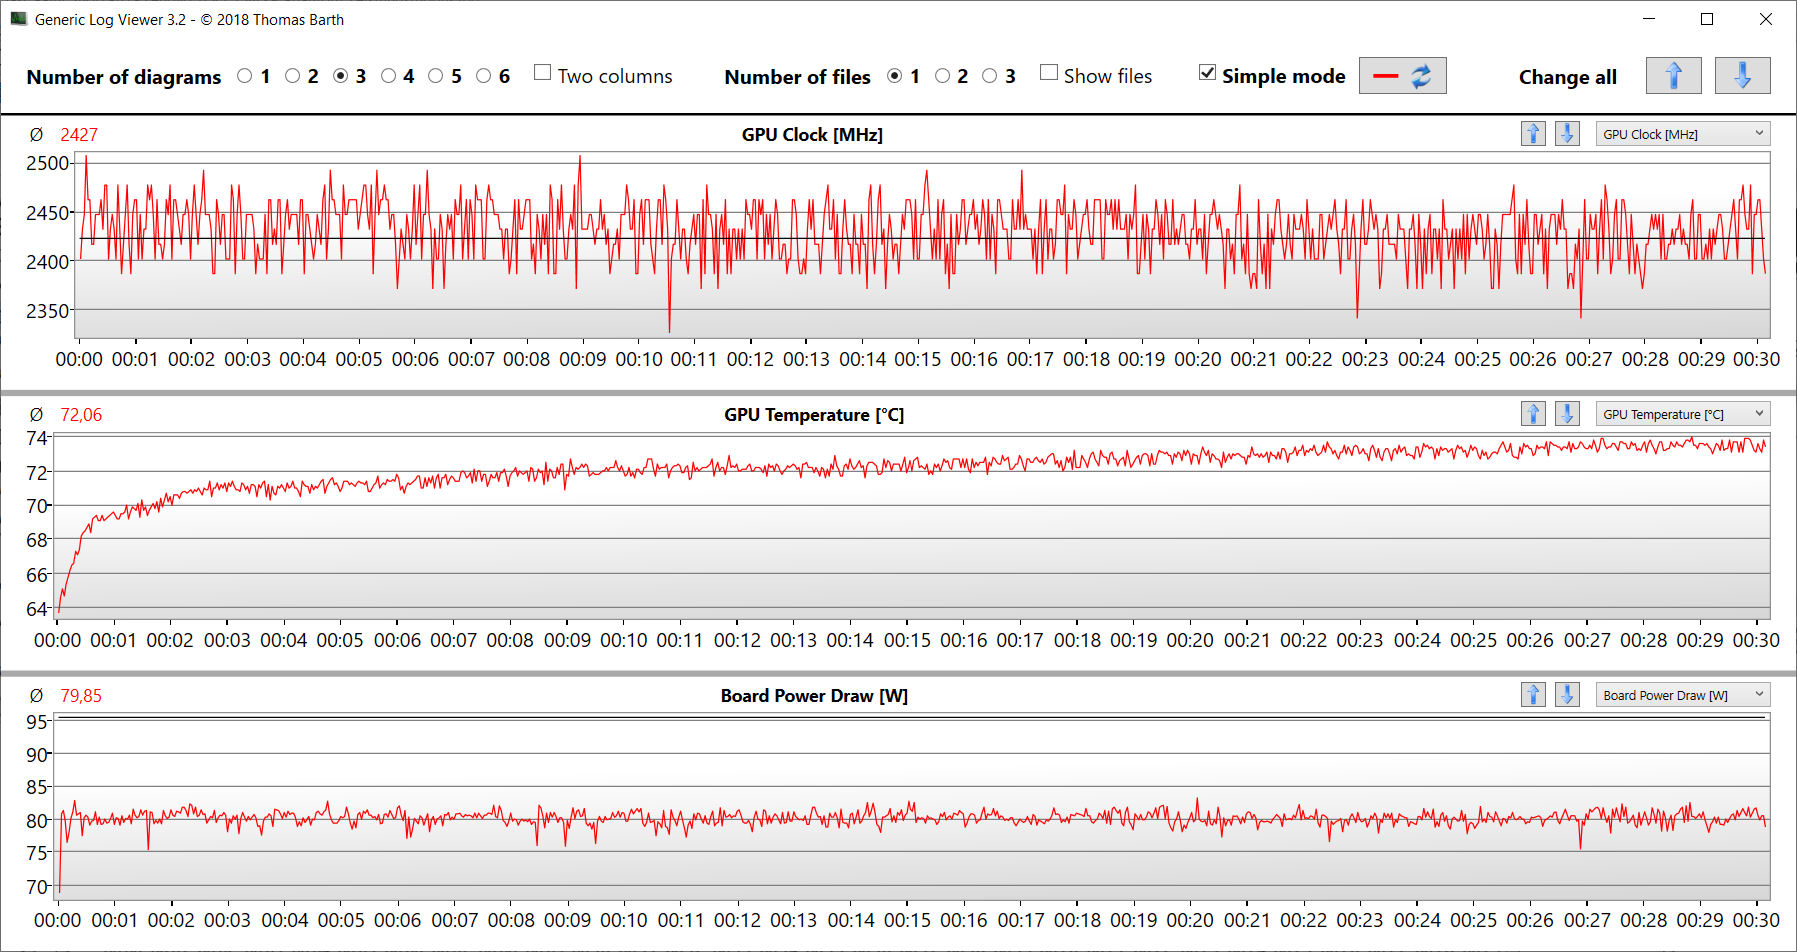
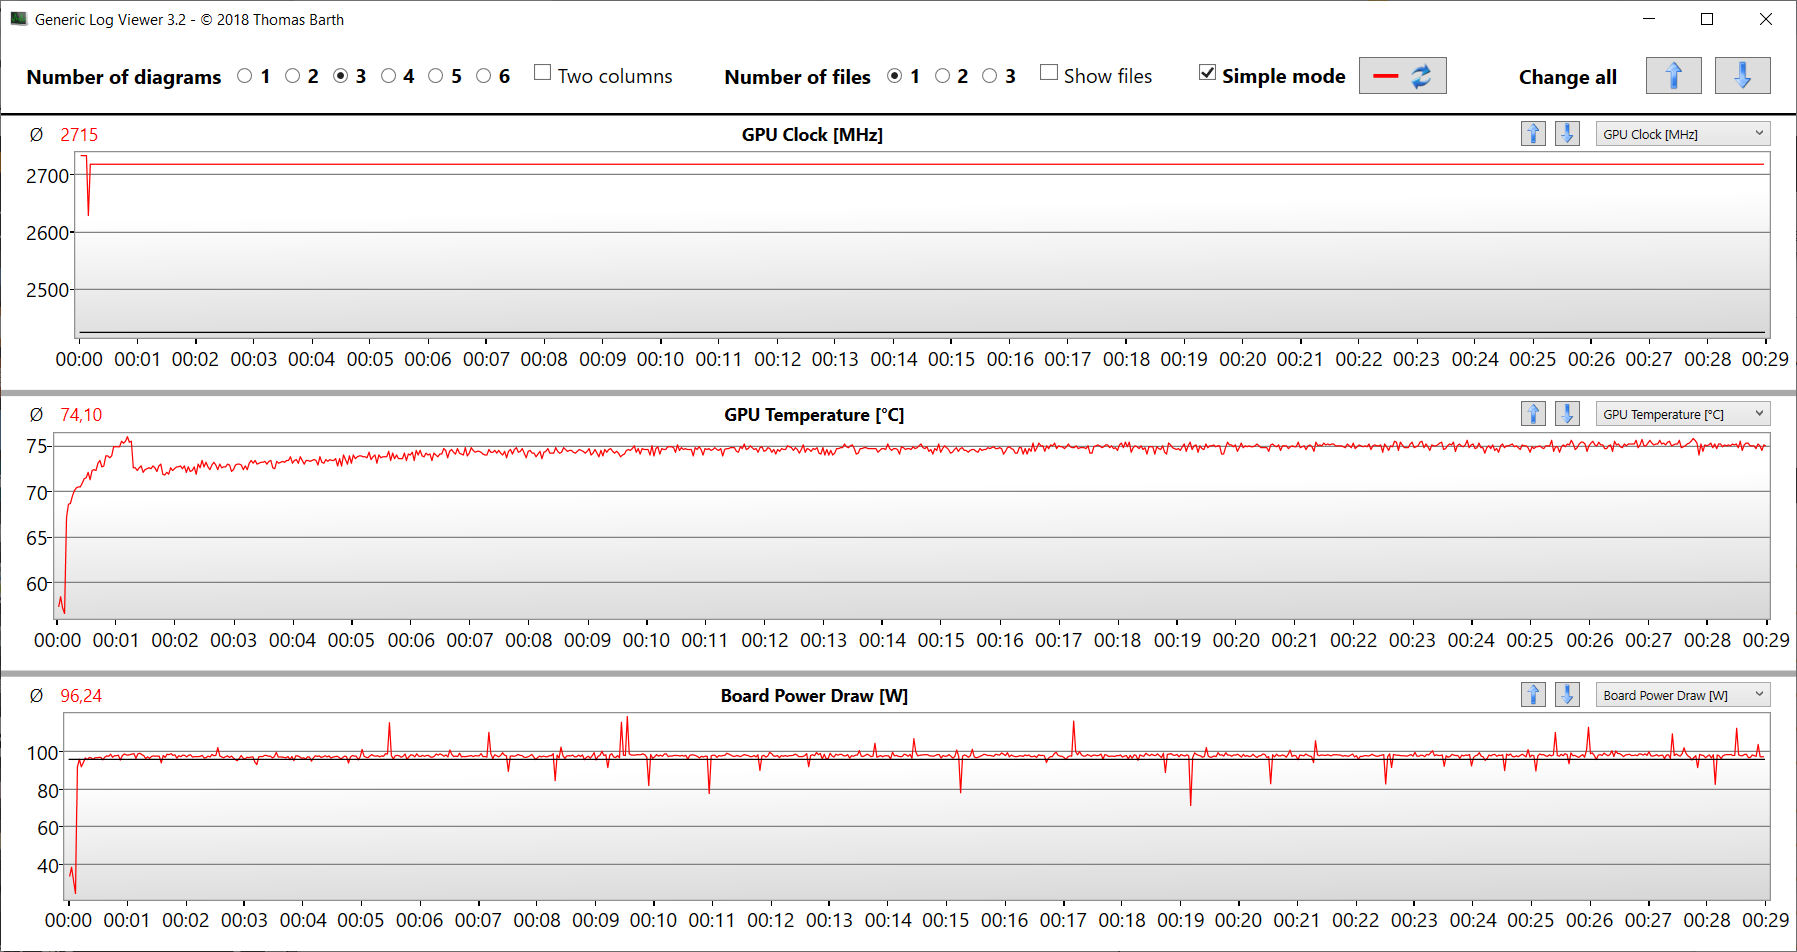
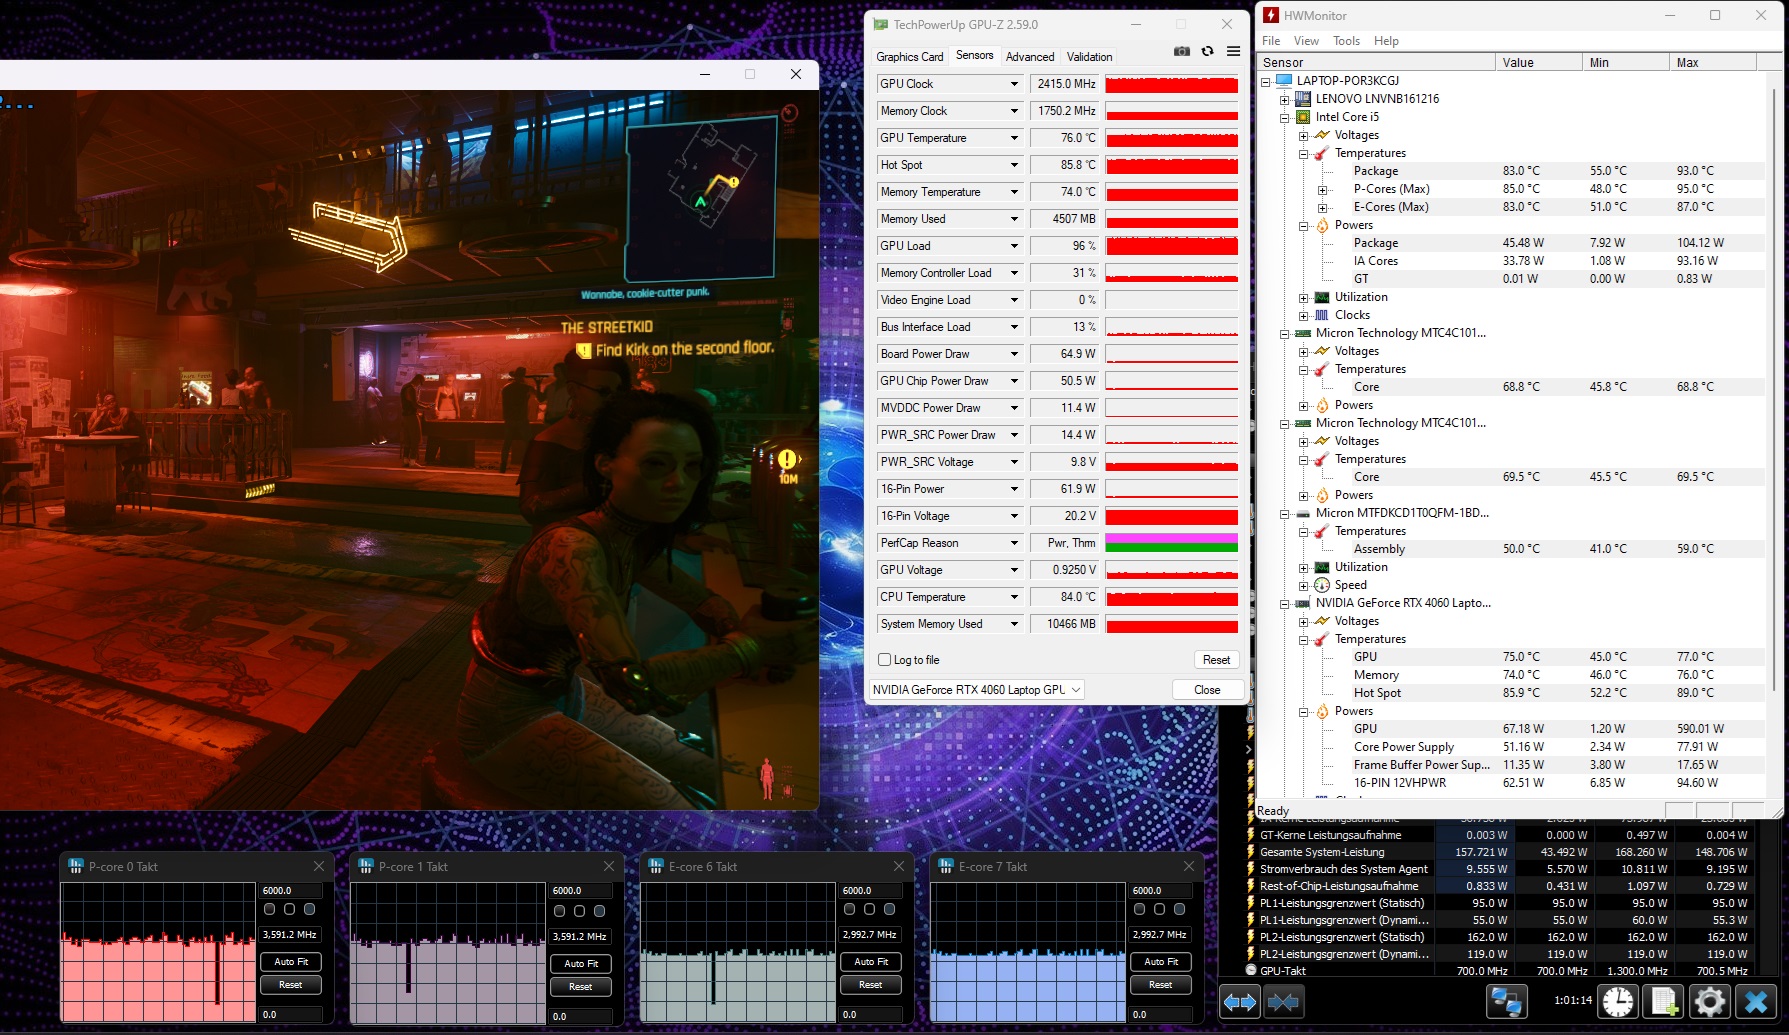
Aşırı senaryo (sürekli çalışmada Prime95 ve Furmark kullanılarak yapılan stres testi) sistemin tam yük altındaki kararlılığını kontrol ediyor. CPU yaklaşık 2,4 GHz (P) ve 2,6 GHz (E) hızında çalışırken, grafik çekirdeği 1.800 MHz civarında değerlere ulaştı.
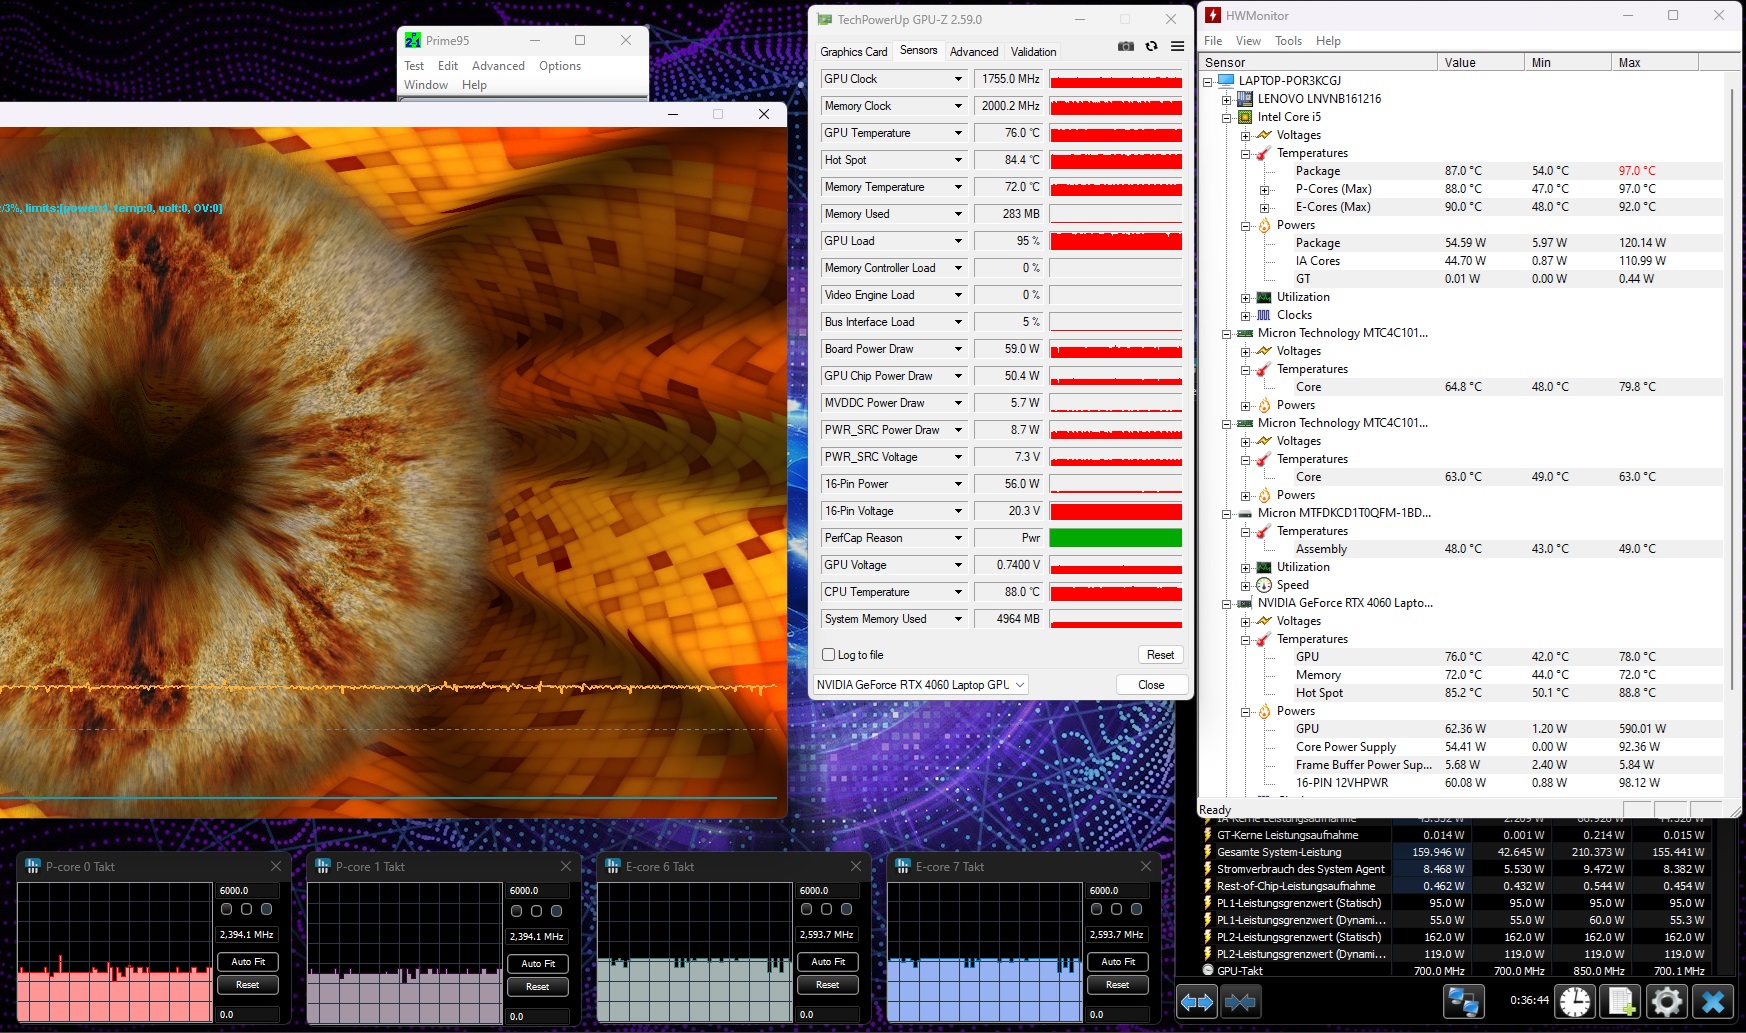
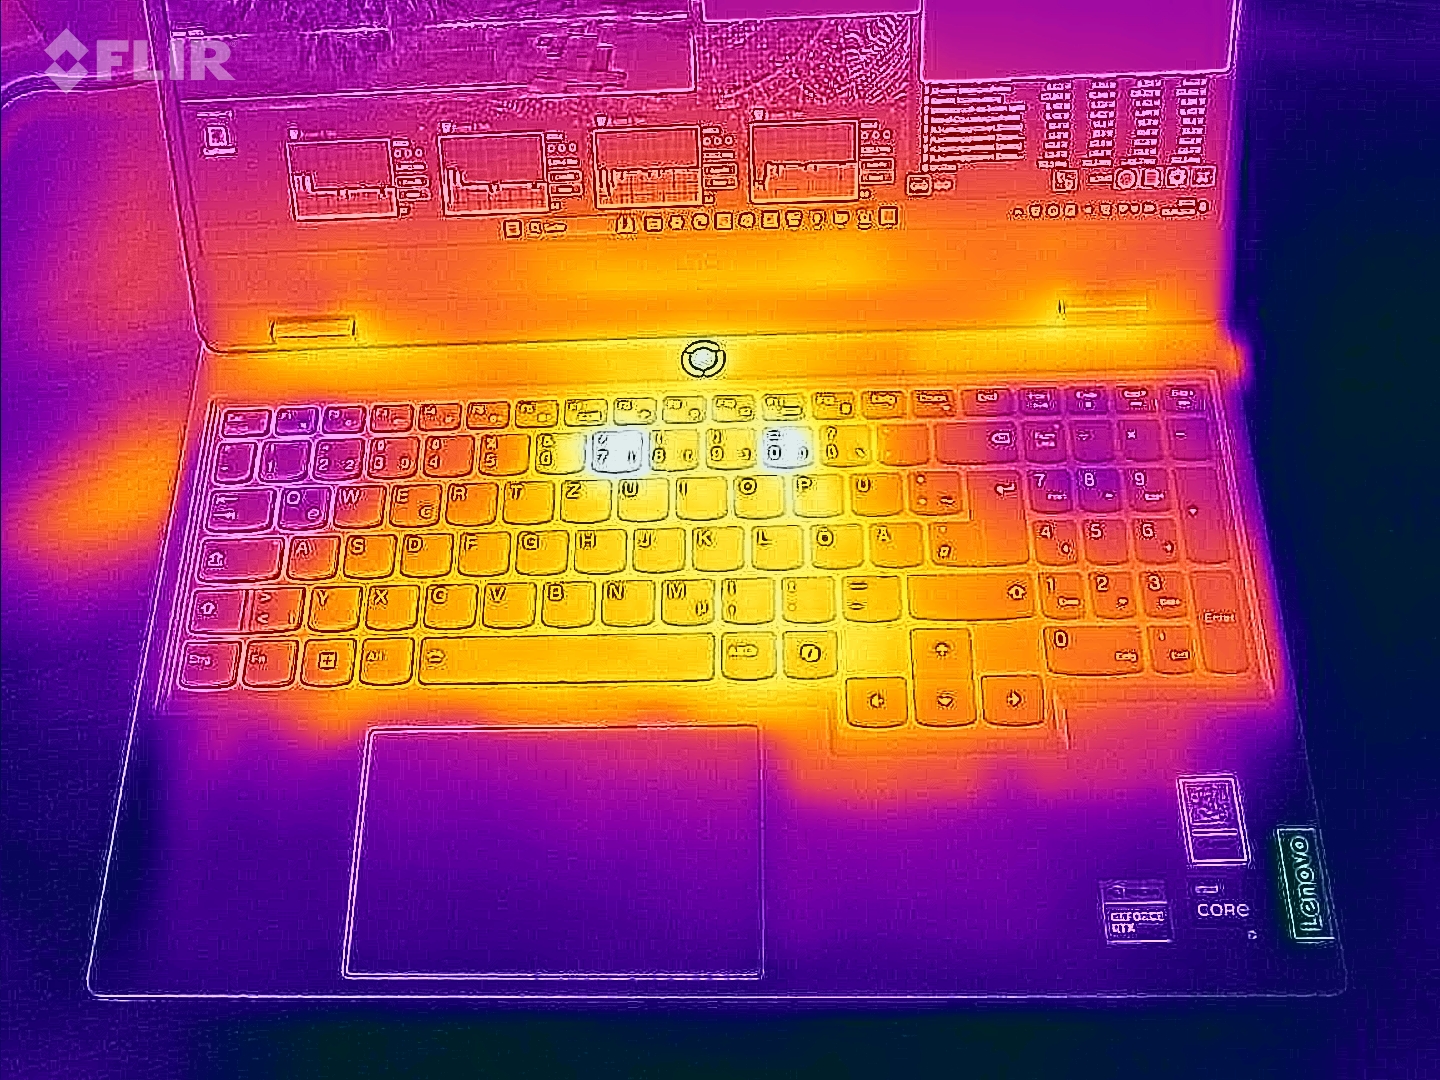
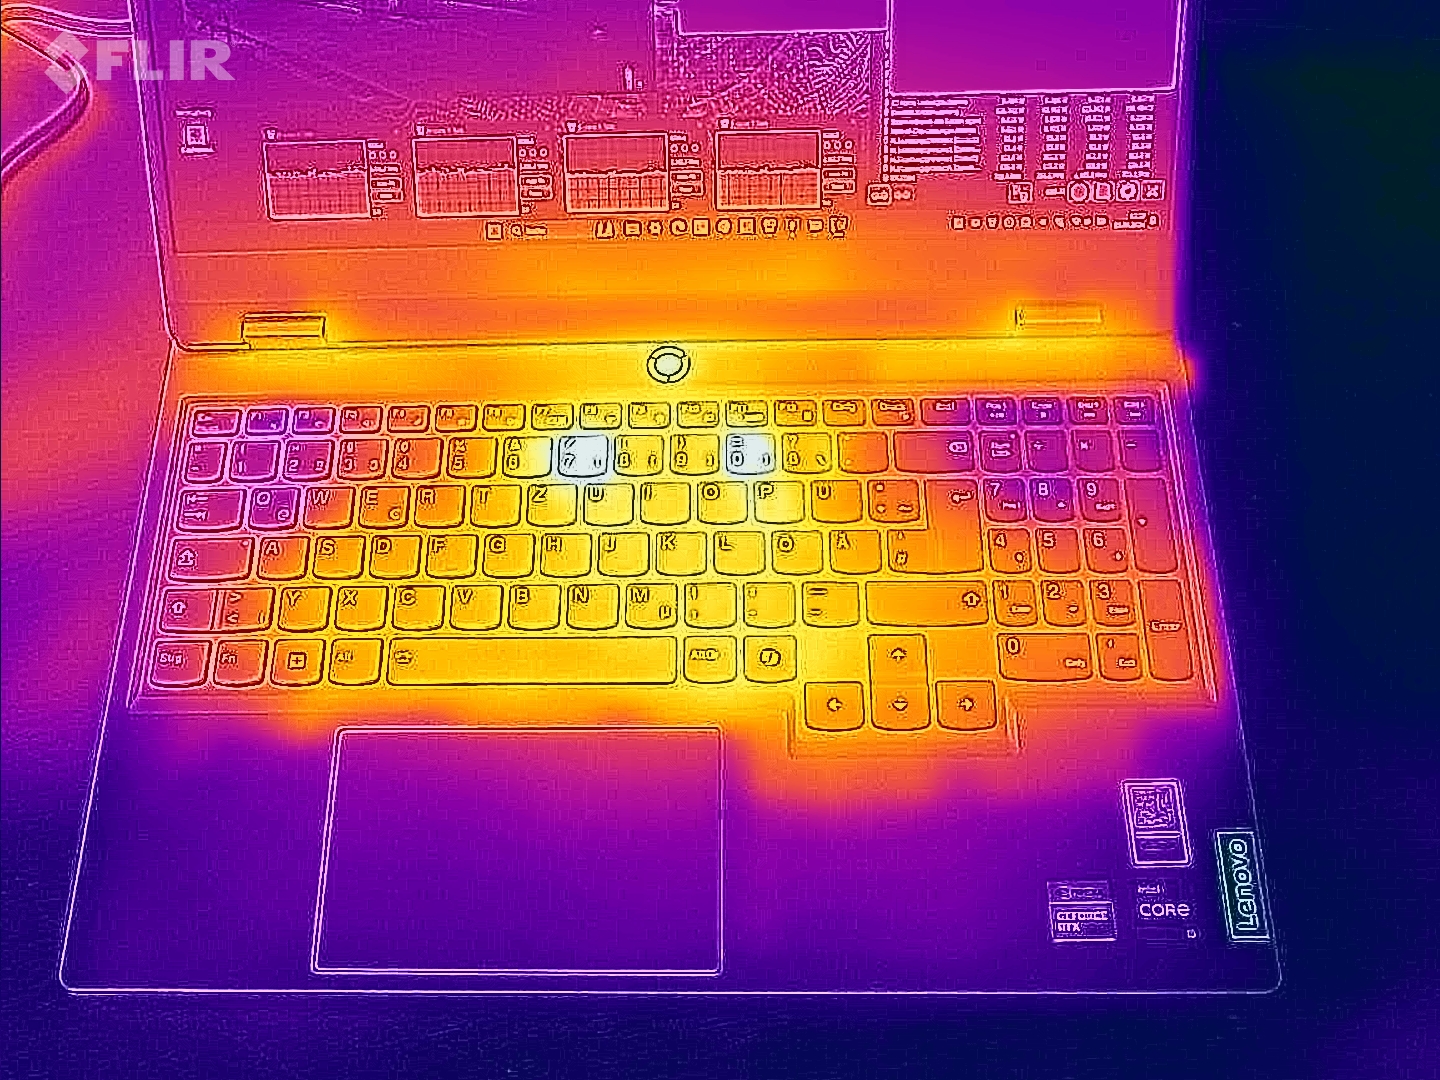
(-) Üst taraftaki maksimum sıcaklık, 40.4 °C / 105 F ortalamasına kıyasla 47 °C / 117 F'dir. , Gaming sınıfı için 21.2 ile 68.8 °C arasında değişir.
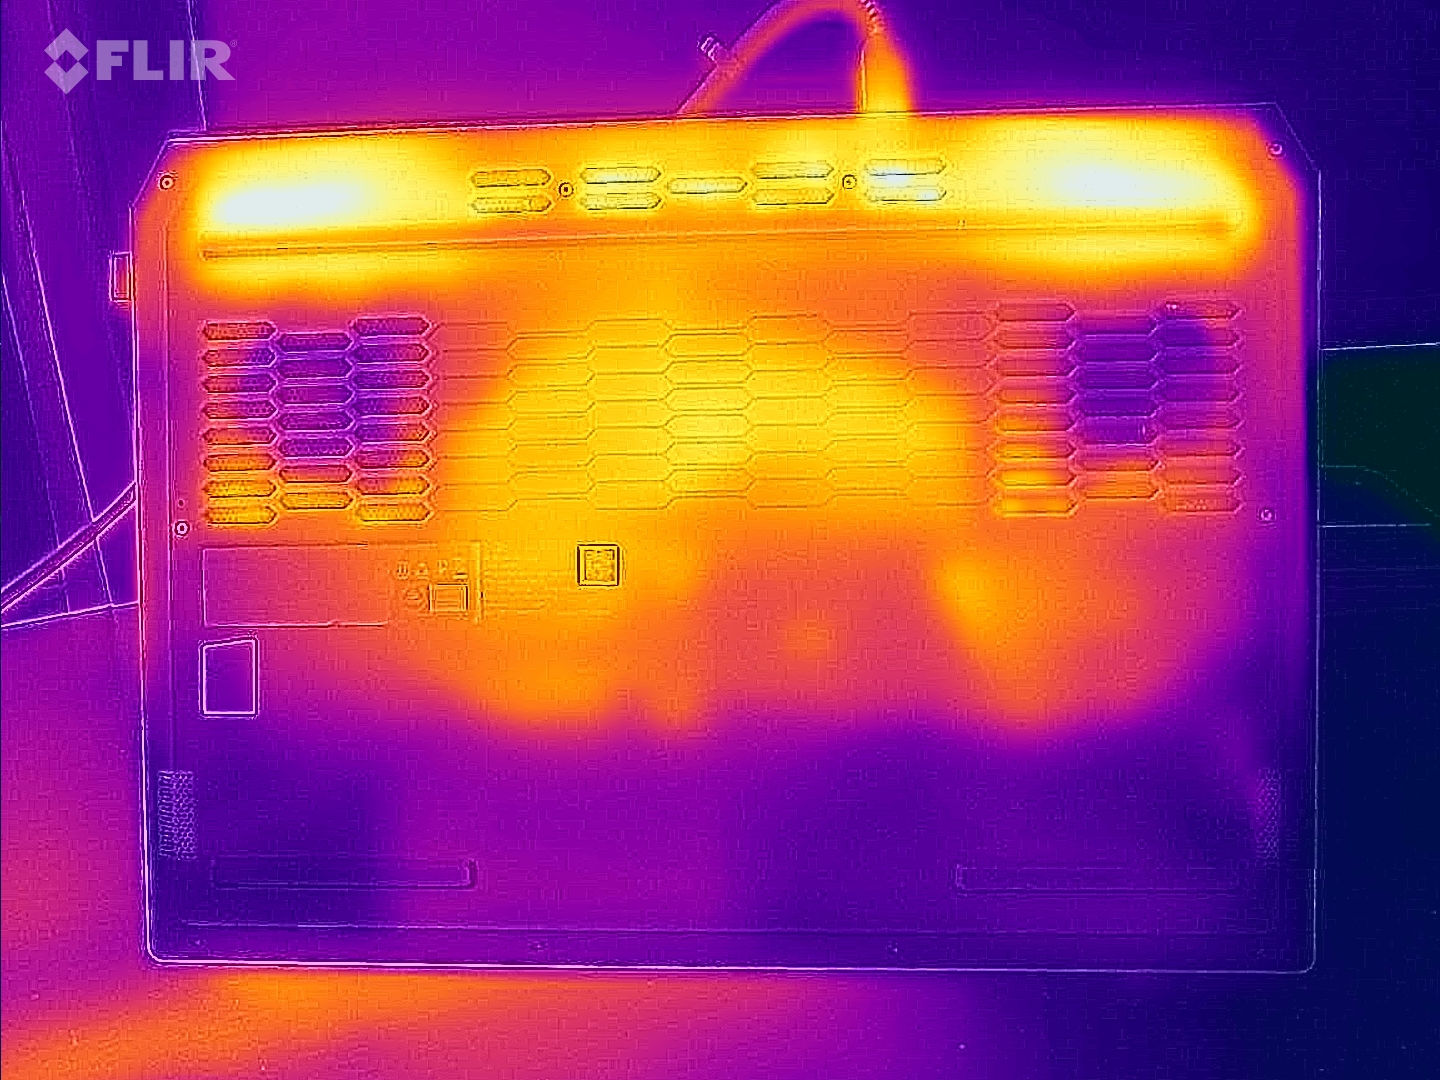
(-) Alt kısım, 43.2 °C / 110 F ortalamasına kıyasla maksimum 58 °C / 136 F'ye kadar ısınır
(+) Boşta kullanımda, üst tarafın ortalama sıcaklığı 30.2 °C / 86 F olup, cihazın 33.9 °C / 93 F.
(-) 3: The average temperature for the upper side is 41.7 °C / 107 F, compared to the average of 33.9 °C / 93 F for the class Gaming.
(±) Avuç içi dayanakları ve dokunmatik yüzey maksimum 38 °C / 100.4 F ile dokunulamayacak kadar ısınabilir.
(-) Benzer cihazların avuç içi dayanağı alanının ortalama sıcaklığı 28.8 °C / 83.8 F (-9.2 °C / -16.6 F) idi.
| Lenovo LOQ 15IRX9 Intel Core i5-13450HX, NVIDIA GeForce RTX 4060 Laptop GPU | Schenker XMG Core 15 (M24) AMD Ryzen 7 8845HS, NVIDIA GeForce RTX 4060 Laptop GPU | Gigabyte G6X 9KG (2024) Intel Core i7-13650HX, NVIDIA GeForce RTX 4060 Laptop GPU | HP Victus 16 (2024) Intel Core i7-14700HX, NVIDIA GeForce RTX 4060 Laptop GPU | Dell G16, i7-13650HX, RTX 4060 Intel Core i7-13650HX, NVIDIA GeForce RTX 4060 Laptop GPU | |
|---|---|---|---|---|---|
| Heat | -8% | 9% | 15% | -3% | |
| Maximum Upper Side * (°C) | 47 | 52 -11% | 41 13% | 50 -6% | 49 -4% |
| Maximum Bottom * (°C) | 58 | 61 -5% | 43 26% | 50 14% | 58 -0% |
| Idle Upper Side * (°C) | 32 | 35 -9% | 32 -0% | 25 22% | 35 -9% |
| Idle Bottom * (°C) | 36 | 39 -8% | 37 -3% | 26 28% | 35 3% |
* ... daha küçük daha iyidir
Konuşmacılar
Stereo hoparlörler genel olarak çok kabul edilebilir bir ses manzarası üretiyor. Yine de biraz daha fazla bas fena olmazdı.
Lenovo LOQ 15IRX9 ses analizi
(±) | hoparlör ses yüksekliği ortalama ama iyi (81 dB)
Bas 100 - 315Hz
(±) | azaltılmış bas - ortalama olarak medyandan 14.6% daha düşük
(±) | Bas doğrusallığı ortalamadır (9.6% delta - önceki frekans)
Ortalar 400 - 2000 Hz
(+) | dengeli ortalar - medyandan yalnızca 2.1% uzakta
(+) | orta frekanslar doğrusaldır (3.6% deltadan önceki frekansa)
Yüksekler 2 - 16 kHz
(±) | daha yüksek en yüksekler - ortalama olarak medyandan 5.9% daha yüksek
(±) | Yükseklerin doğrusallığı ortalamadır (8.2% delta - önceki frekans)
Toplam 100 - 16.000 Hz
(+) | genel ses doğrusaldır (14.7% ortancaya göre fark)
Aynı sınıfla karşılaştırıldığında
» Bu sınıftaki tüm test edilen cihazların %29%'si daha iyi, 7% benzer, 64% daha kötüydü
» En iyisinin deltası 6% idi, ortalama 18% idi, en kötüsü 132% idi
Test edilen tüm cihazlarla karşılaştırıldığında
» Test edilen tüm cihazların %19'si daha iyi, 4 benzer, % 77 daha kötüydü
» En iyisinin deltası 4% idi, ortalama 23% idi, en kötüsü 134% idi
Schenker XMG Core 15 (M24) ses analizi
(±) | hoparlör ses yüksekliği ortalama ama iyi (79.12 dB)
Bas 100 - 315Hz
(-) | neredeyse hiç bas yok - ortalama olarak medyandan 16.7% daha düşük
(-) | bas doğrusal değildir (15.7% delta ile önceki frekans)
Ortalar 400 - 2000 Hz
(+) | dengeli ortalar - medyandan yalnızca 4.5% uzakta
(+) | orta frekanslar doğrusaldır (4.4% deltadan önceki frekansa)
Yüksekler 2 - 16 kHz
(+) | dengeli yüksekler - medyandan yalnızca 1% uzakta
(+) | yüksekler doğrusaldır (2.7% deltadan önceki frekansa)
Toplam 100 - 16.000 Hz
(+) | genel ses doğrusaldır (13.7% ortancaya göre fark)
Aynı sınıfla karşılaştırıldığında
» Bu sınıftaki tüm test edilen cihazların %21%'si daha iyi, 7% benzer, 72% daha kötüydü
» En iyisinin deltası 6% idi, ortalama 18% idi, en kötüsü 132% idi
Test edilen tüm cihazlarla karşılaştırıldığında
» Test edilen tüm cihazların %15'si daha iyi, 4 benzer, % 81 daha kötüydü
» En iyisinin deltası 4% idi, ortalama 23% idi, en kötüsü 134% idi
Güç tüketimi
Güç tüketimi, kurulu donanım için oldukça normaldir. Cyberpunk ve stres testleri nispeten sabit güç tüketimiyle çalıştırıldı. Güç kaynağı ünitesi 230 watt ile yeterince güçlü.
| Kapalı / Bekleme modu | |
| Boşta | |
| Çalışırken |
|
Key:
min: | |
| Lenovo LOQ 15IRX9 Intel Core i5-13450HX, NVIDIA GeForce RTX 4060 Laptop GPU | Schenker XMG Core 15 (M24) AMD Ryzen 7 8845HS, NVIDIA GeForce RTX 4060 Laptop GPU | Gigabyte G6X 9KG (2024) Intel Core i7-13650HX, NVIDIA GeForce RTX 4060 Laptop GPU | HP Victus 16 (2024) Intel Core i7-14700HX, NVIDIA GeForce RTX 4060 Laptop GPU | Dell G16, i7-13650HX, RTX 4060 Intel Core i7-13650HX, NVIDIA GeForce RTX 4060 Laptop GPU | |
|---|---|---|---|---|---|
| Power Consumption | 20% | 2% | 1% | 6% | |
| Idle Minimum * (Watt) | 13 | 9.3 28% | 12 8% | 9 31% | 11 15% |
| Idle Average * (Watt) | 18 | 12.9 28% | 13 28% | 15 17% | 14.8 18% |
| Idle Maximum * (Watt) | 24 | 12.8 47% | 27 -13% | 23 4% | 16.8 30% |
| Load Average * (Watt) | 85 | 105 -24% | 123 -45% | 103.7 -22% | |
| Cyberpunk 2077 ultra * (Watt) | 155.7 | ||||
| Cyberpunk 2077 ultra external monitor * (Watt) | 150.9 | ||||
| Load Maximum * (Watt) | 232 | 286 -23% | 210 9% | 241 -4% | 255 -10% |
| Witcher 3 ultra * (Watt) | 167 | 167.8 | 143.7 | 185 |
* ... daha küçük daha iyidir
Power consumption Cyberpunk 2077 / stress test
Power consumption with external monitor
Çalışma Zamanları
15,6 inçlik cihaz, pratik WLAN testimizde (bir komut dosyası kullanarak web sitelerine erişirken yükü haritalama) 5:20 saatlik bir çalışma süresi elde etti - olağanüstü bir değer değil. Nispeten düşük pil kapasitesi (60 Wh) burada ortaya çıkıyor.
Artılar
Eksiler
Karar - Sağlam bütçeli bir oyuncu

LOQ, yüksek ila maksimum ayarlarda FHD oyun oynamaya olanak tanır - Core i5-13450HX ve GeForce RTX 4060 bunu mümkün kılmaktadır. Bunu yaparken CPU ve GPU sürekli olarak yüksek saat hızlarıyla çalışır. Bir PCIe 4 SSD (1 TB) yükleme sürelerinin kısa tutulmasını sağlar.
Lenovo'nun LOQ 15IRX9'u, bir veya iki küçük kusurdan muzdarip uygun fiyatlı bir FHD oyun dizüstü bilgisayarıdır.
Yüksek emisyonlar, dizüstü bilgisayarın performansı pahasına sessiz mod kullanılarak orta seviyelere düşürülebilir. Fan kontrolü biraz iyileştirilebilir: Rölanti modunda fanlar sürekli çalışıyor veya titreşiyor, ki bu tamamen gereksiz.
Lenovo 16:9 en boy oranına bağlı kaldığı için 16:10 ekranı boşuna arayacaksınız. Takılı 15,6 inç panel (FHD, 144 Hz, G-Sync, sRGB) gayet iyi çalışıyor, ancak biraz daha parlak olabilirdi. Dizüstü bilgisayar Thunderbolt 4 veya USB 4 sunmuyor. Yine de: USB-C bağlantı noktası (USB 3.2 Gen 2) Güç Dağıtımı ve Display ALT modunu destekliyor. Cihazın pil ömrü herhangi bir dünya rekoru kırmayacaktır.
Bir alternatif de şu olabilir Gigabyte G6X 9KG. Biraz daha güçlü bir CPU'ya, 16 inç 16:10 ekrana ve daha iyi çalışma sürelerine sahip. Renk alanı kapsamı açısından LOQ'nun gerisinde kalıyor.
Fiyat ve bulunabilirlik
Bu yazının yazıldığı sırada, Lenovo LOQ 15IRX9 yapılandırmamız Amazon üzerinden 1.279 ABD Doları karşılığında satın alınabilir.
Lütfen dikkat: Derecelendirme sistemimizi yakın zamanda güncelledik ve 8. sürümün sonuçları 7. sürümün sonuçlarıyla karşılaştırılabilir değildir. Daha fazla bilgi için burada .
Lenovo LOQ 15IRX9
- 07/08/2024 v8
Sascha Mölck
 Total Sustainability Score:
 Şeffaflık
İncelenecek cihazların seçimi editör ekibimiz tarafından yapılır. Test örneği, bu incelemenin amacı doğrultusunda üretici veya perakendeci tarafından yazara ödünç olarak sağlanmıştır. Borç verenin bu inceleme üzerinde herhangi bir etkisi olmadığı gibi, üretici de yayınlanmadan önce bu incelemenin bir kopyasını almamıştır. Bu incelemeyi yayınlama zorunluluğu yoktu. Bağımsız bir medya şirketi olarak Notebookcheck, üreticilerin, perakendecilerin veya yayıncıların otoritesine tabi değildir.
Notebookcheck bu şekilde test yapıyor
Notebookcheck, tüm sonuçların karşılaştırılabilir olmasını sağlamak için her yıl yüzlerce dizüstü bilgisayarı ve akıllı telefonu standart prosedürler kullanarak bağımsız olarak inceliyor. Yaklaşık 20 yıldır test yöntemlerimizi sürekli olarak geliştirdik ve bu süreçte endüstri standartlarını belirledik. Test laboratuvarlarımızda deneyimli teknisyenler ve editörler tarafından yüksek kaliteli ölçüm ekipmanları kullanılmaktadır. Bu testler çok aşamalı bir doğrulama sürecini içerir. Karmaşık derecelendirme sistemimiz, nesnelliği koruyan yüzlerce sağlam temellere dayanan ölçüm ve kıyaslamaya dayanmaktadır.Price comparison

