Lenovo ThinkPad E16 G1 Intel incelemesi: Core i5, AMD Ryzen 7 ile başa baş

ThinkPad E serisi, daha lüks ThinkPad T serisi veya daha keskin ThinkPad X serisinin aksine iş kullanıcıları için uygun fiyatlı modellerden oluşmaktadır. Bu yıl, mevcut 14 inç ThinkPad E14 ve 15 inç ThinkPad E15 seçeneklerini tamamlamak üzere 16 inç ThinkPad E16 ailesinin tanıtımı yapıldı. ThinkPad E16'nın Intel ya da AMD işlemcili iki versiyonu piyasaya sunuldu. Kısa süre önce ThinkPad E16 AMD Ryzen 7 versiyonunu inceledik ve şimdi de ThinkPad E16 Intel Core i5 versiyonuna göz atarak aralarındaki farkları görmenin tam zamanı.
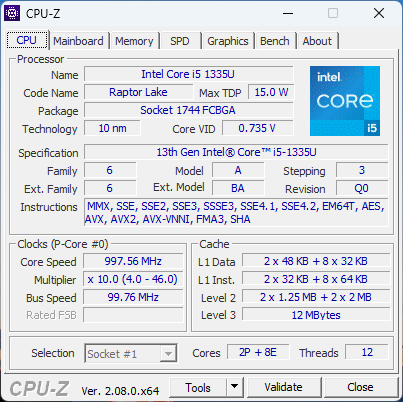
Intel'e özel inceleme ünitemiz Core i5-1335U ve 1200p dokunmatik ekrana sahip, perakende satış fiyatı yaklaşık 800 ila 900 USD olan alt uç bir konfigürasyon. Diğer konfigürasyonlar Core i7-1365U, Core i7-1360P ve hatta Core i7-13700H ile ayrı GeForce MX550 grafikler ve daha yüksek çözünürlüklü 1600p ekrana kadar çok daha yüksek fiyatlara çıkabilir. Bu seçenekler yayın sırasında henüz mevcut değildir.
ThinkPad E16'nın alternatifleri arasında Acer TravelMate P4, Samsung Galaxy Book3 Pro 16 veya LG Gram 16 gibi diğer 16 inç multimedya veya iş dizüstü bilgisayarları bulunmaktadır. Intel versiyonumuz aynı kasa tasarımını ve fiziksel özellikleri paylaştığından ThinkPad E16 G1 AMD versiyonu hakkındaki mevcut incelememize göz atmanızı öneririz.
Daha fazla Lenovo incelemesi:
Karşılaştırmalı olarak olası rakipler
Derecelendirme | Tarih | Modeli | Ağırlık | Yükseklik | Boyut | Çözünürlük | Fiyat |
|---|---|---|---|---|---|---|---|
| 85.5 % v7 (old) | 11/2023 | Lenovo ThinkPad E16 G1 Core i5-1335U i5-1335U, Iris Xe G7 80EUs | 1.8 kg | 19.85 mm | 16.00" | 1920x1200 | |
| 88.1 % v7 (old) | 12/2023 | Lenovo ThinkPad E16 G1-21JUS08X00 R7 7730U, Vega 8 | 1.8 kg | 19.85 mm | 16.00" | 2560x1600 | |
| 84.6 % v7 (old) | 09/2023 | Dell Inspiron 16 7635 2-in-1 R5 7530U, Vega 7 | 2 kg | 18.99 mm | 16.00" | 1920x1200 | |
| 86 % v7 (old) | 10/2024 | Acer TravelMate P4 TMP416-51-55KN i5-1240P, Iris Xe G7 80EUs | 1.6 kg | 18.5 mm | 16.00" | 1920x1200 | |
| 85.6 % v7 (old) | 04/2023 | Samsung Galaxy Book3 Pro 16 i5-1340P, Iris Xe G7 80EUs | 1.6 kg | 12.5 mm | 16.00" | 2880x1800 | |
| 86.6 % v7 (old) | 01/2023 | LG Gram 16Z90Q i7-1260P, Iris Xe G7 96EUs | 1.2 kg | 16.8 mm | 16.00" | 2560x1600 |
Dava
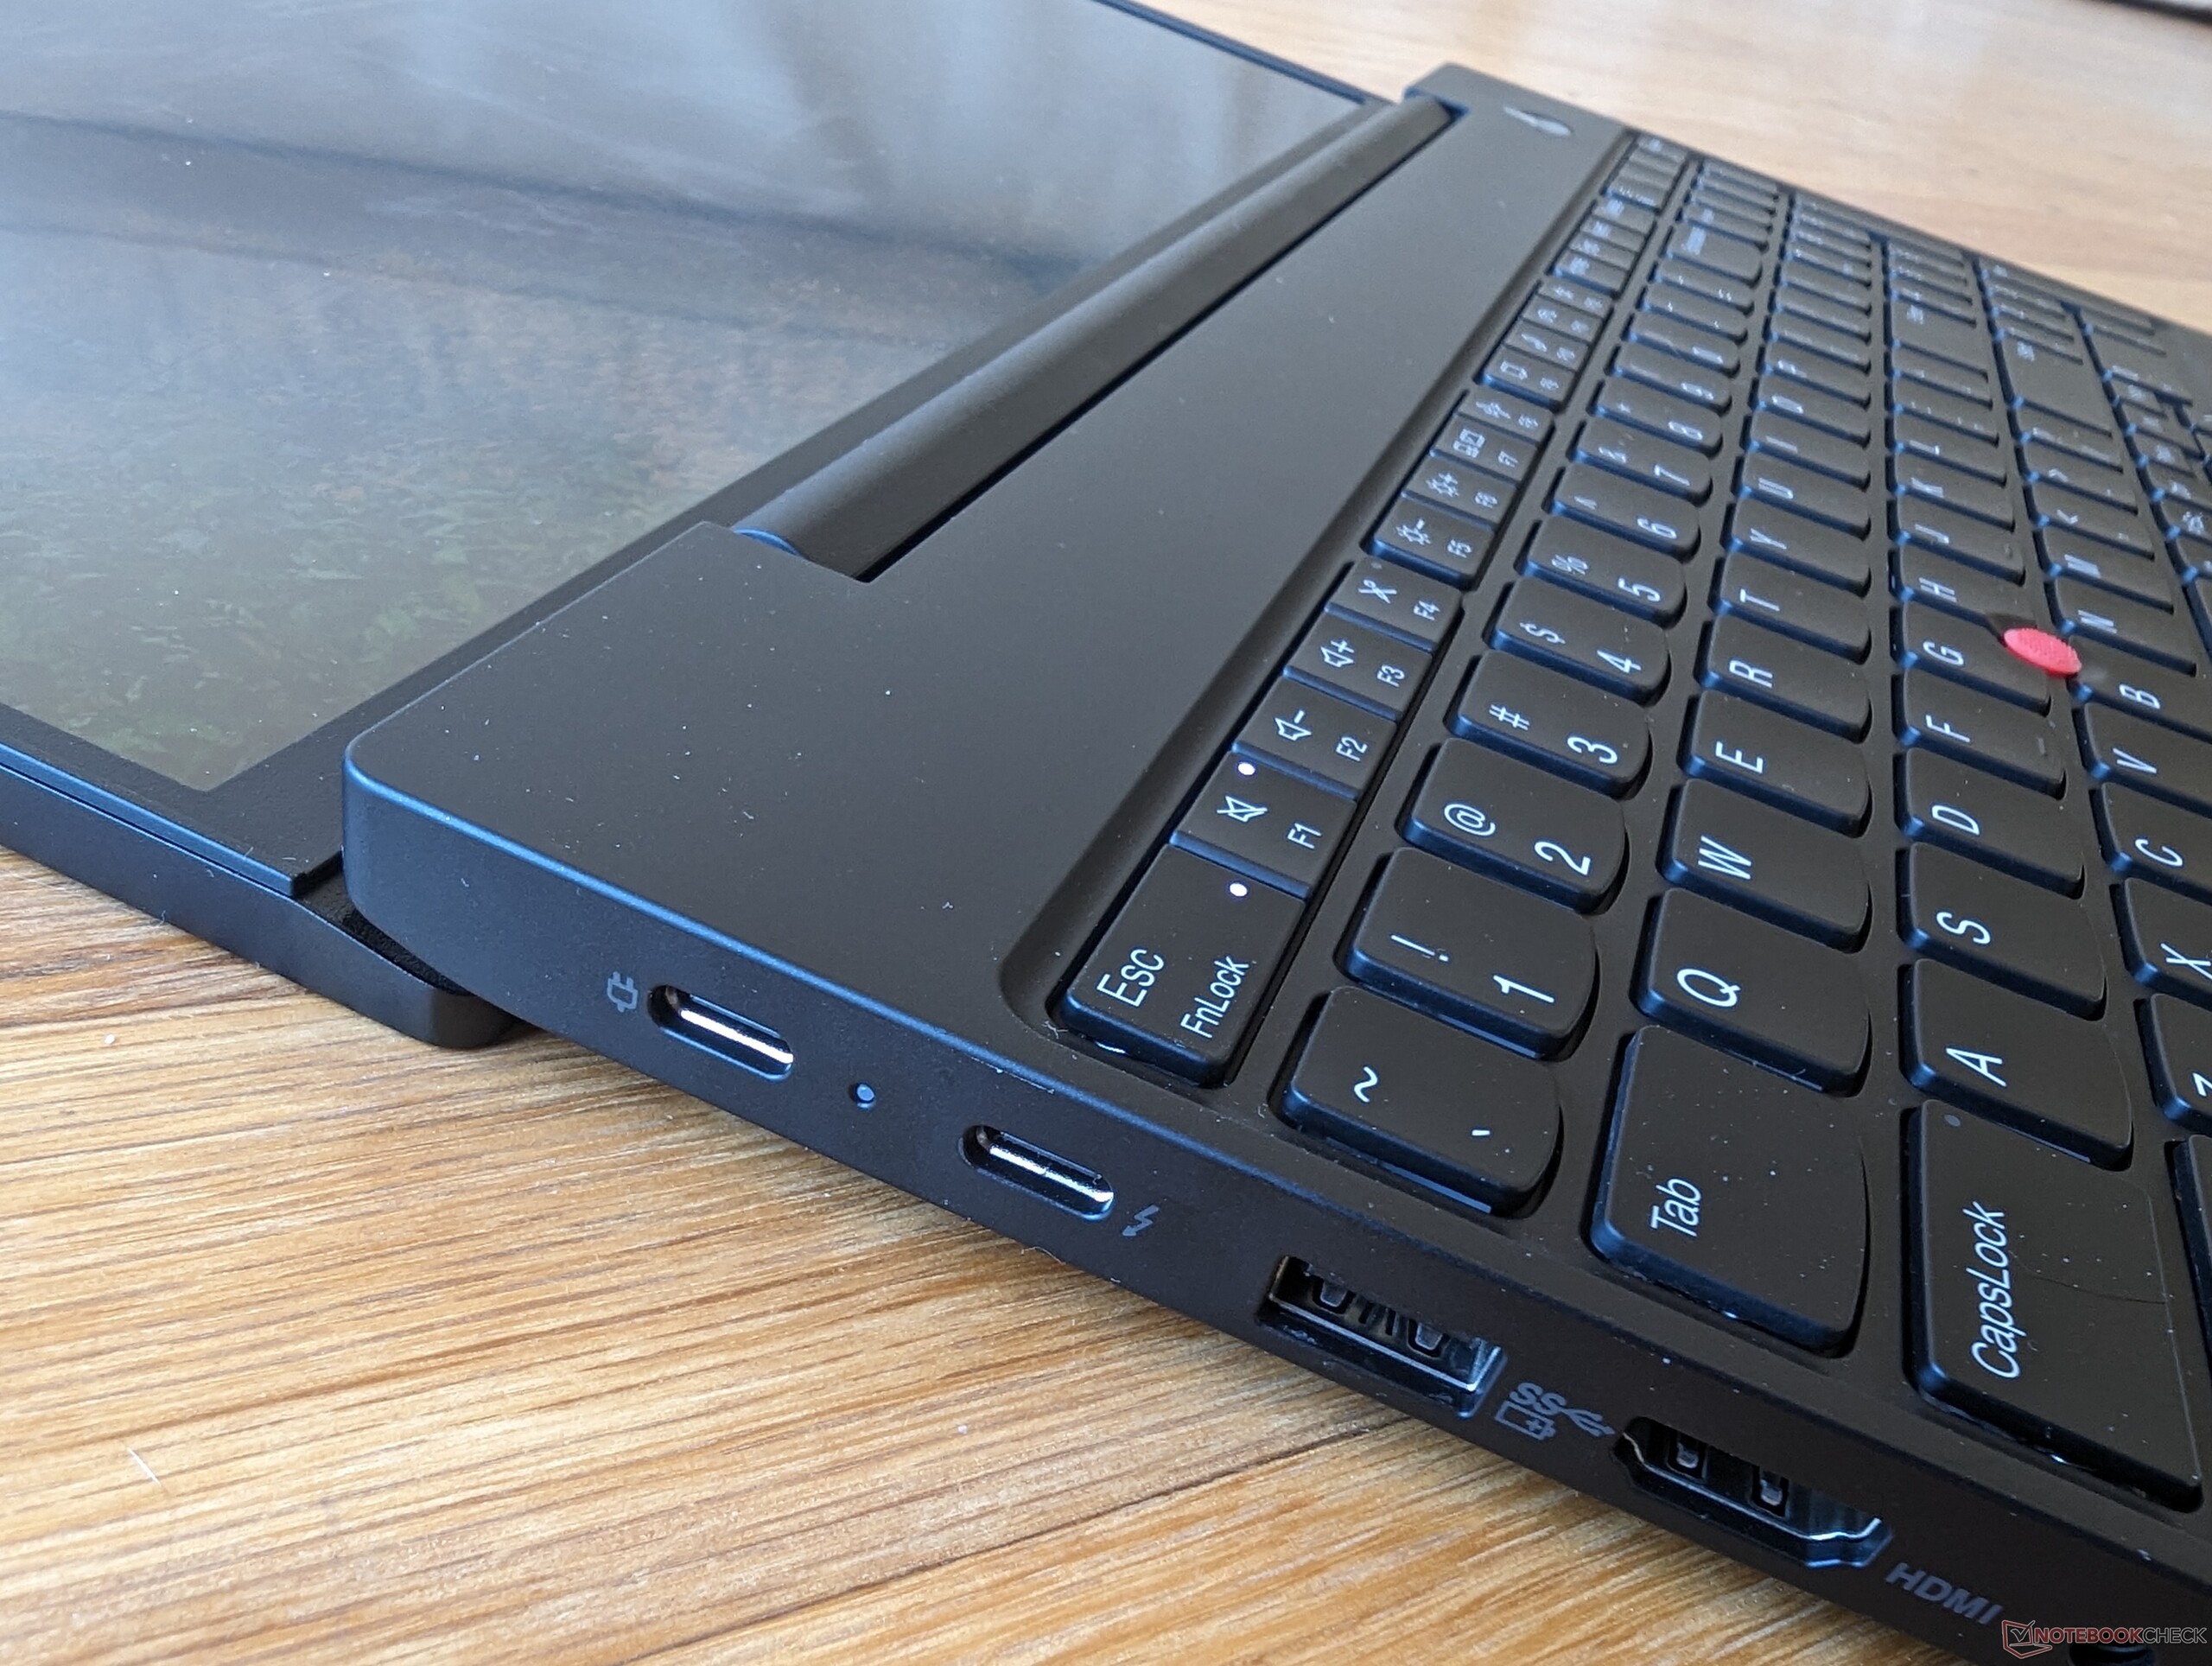
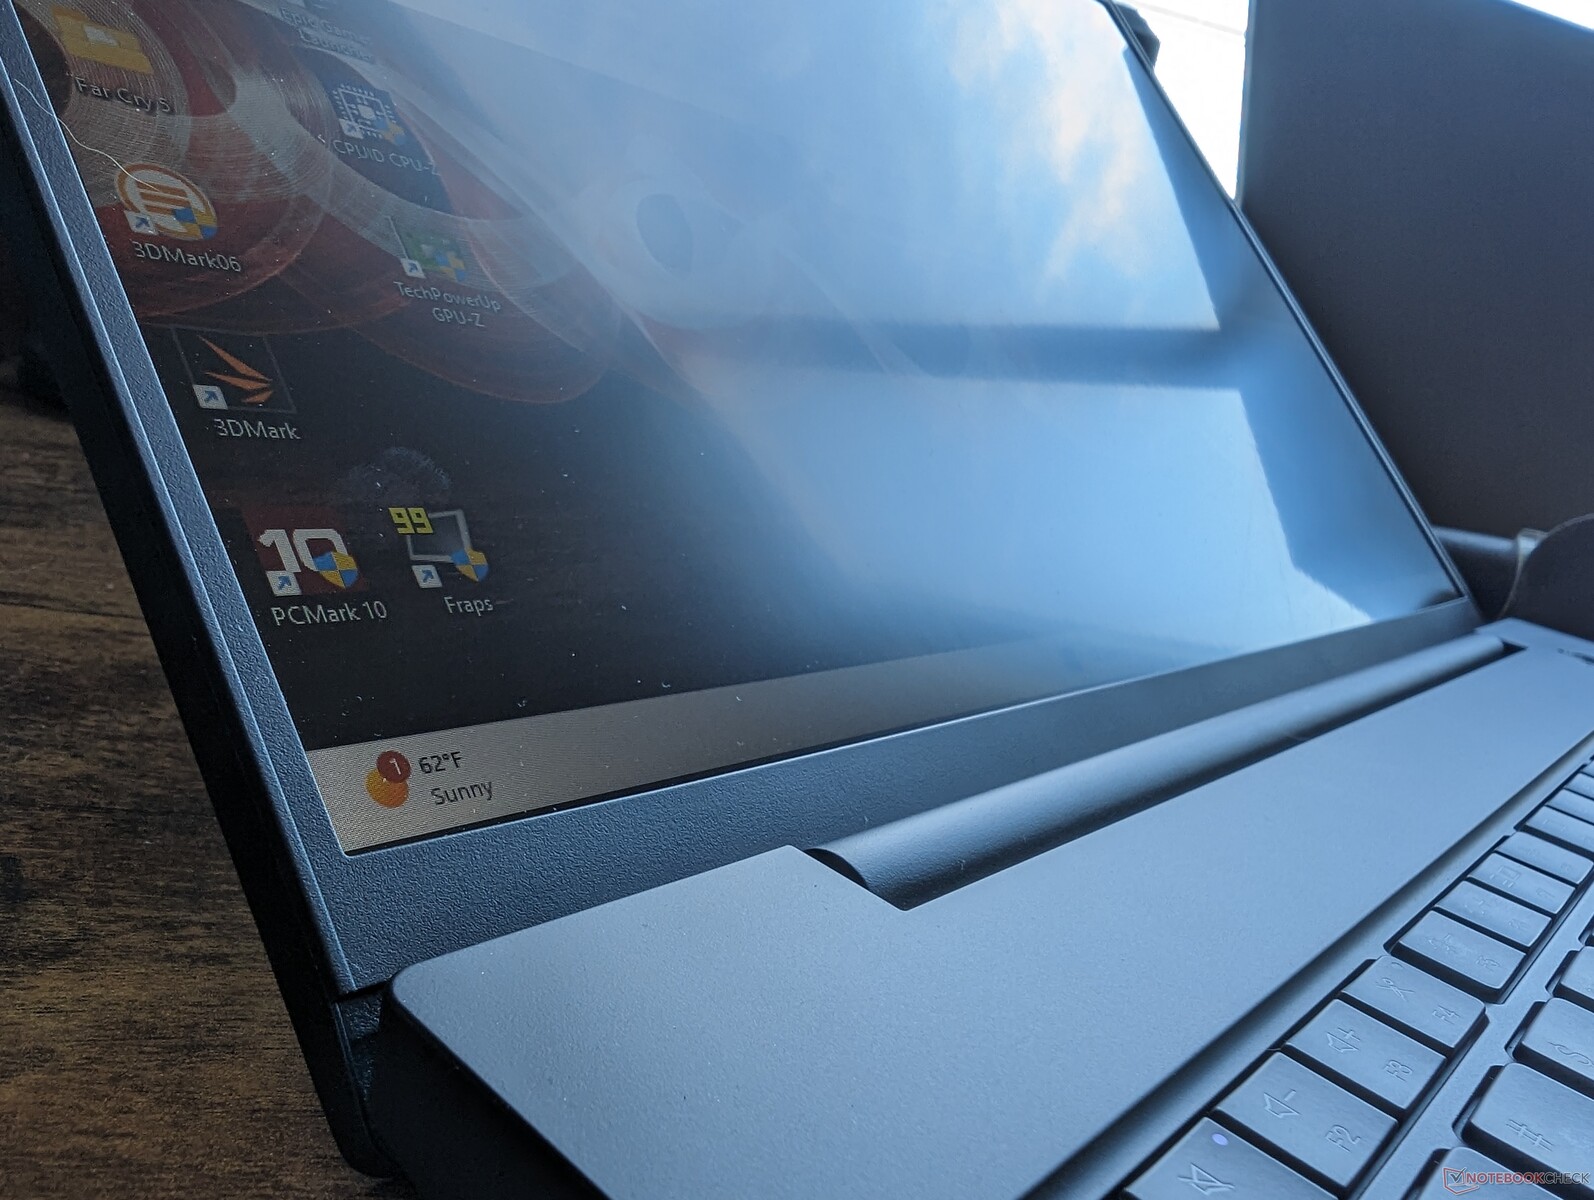
Bir Intel versiyonunu AMD versiyonundan ayırmanın en kolay yolu sol kenardaki Thunderbolt logosuna bakmaktır. Thunderbolt yalnızca Intel sürümlerinde desteklenmektedir, çünkü mevcut AMD sürümleri USB4 ile birlikte gönderilmemektedir.
İletişim
Web kamerası


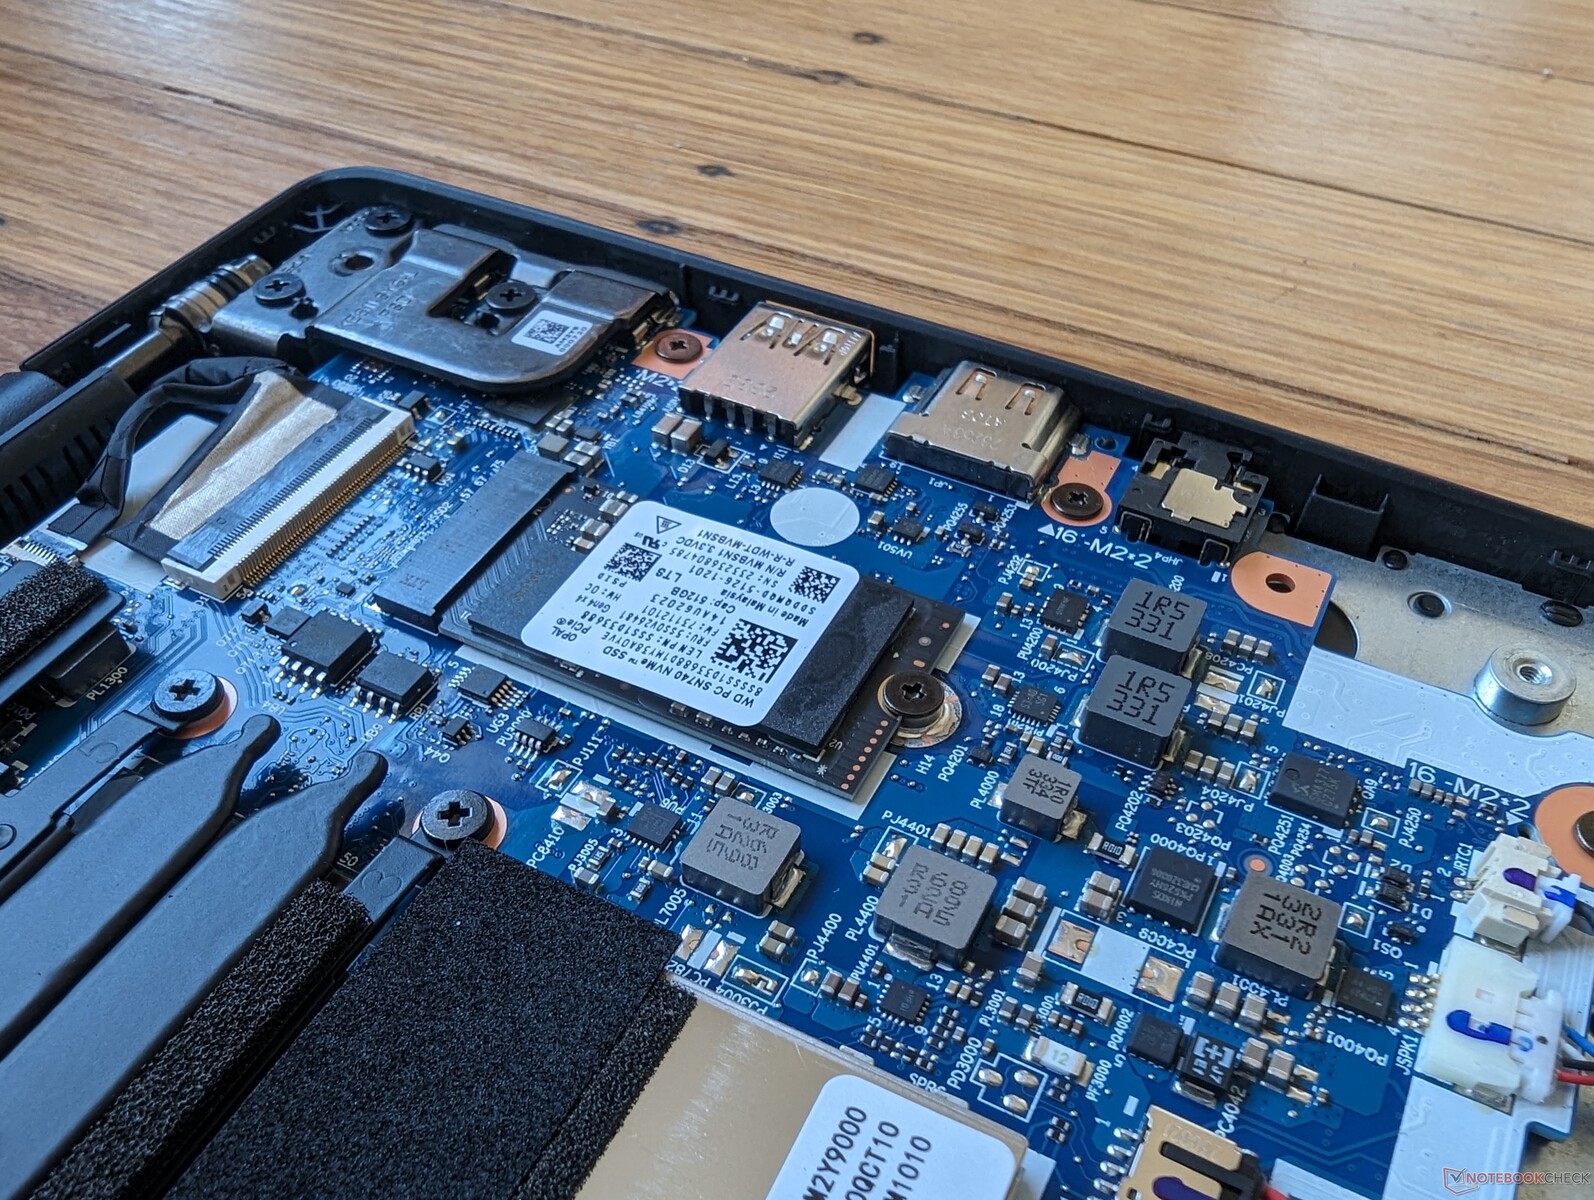
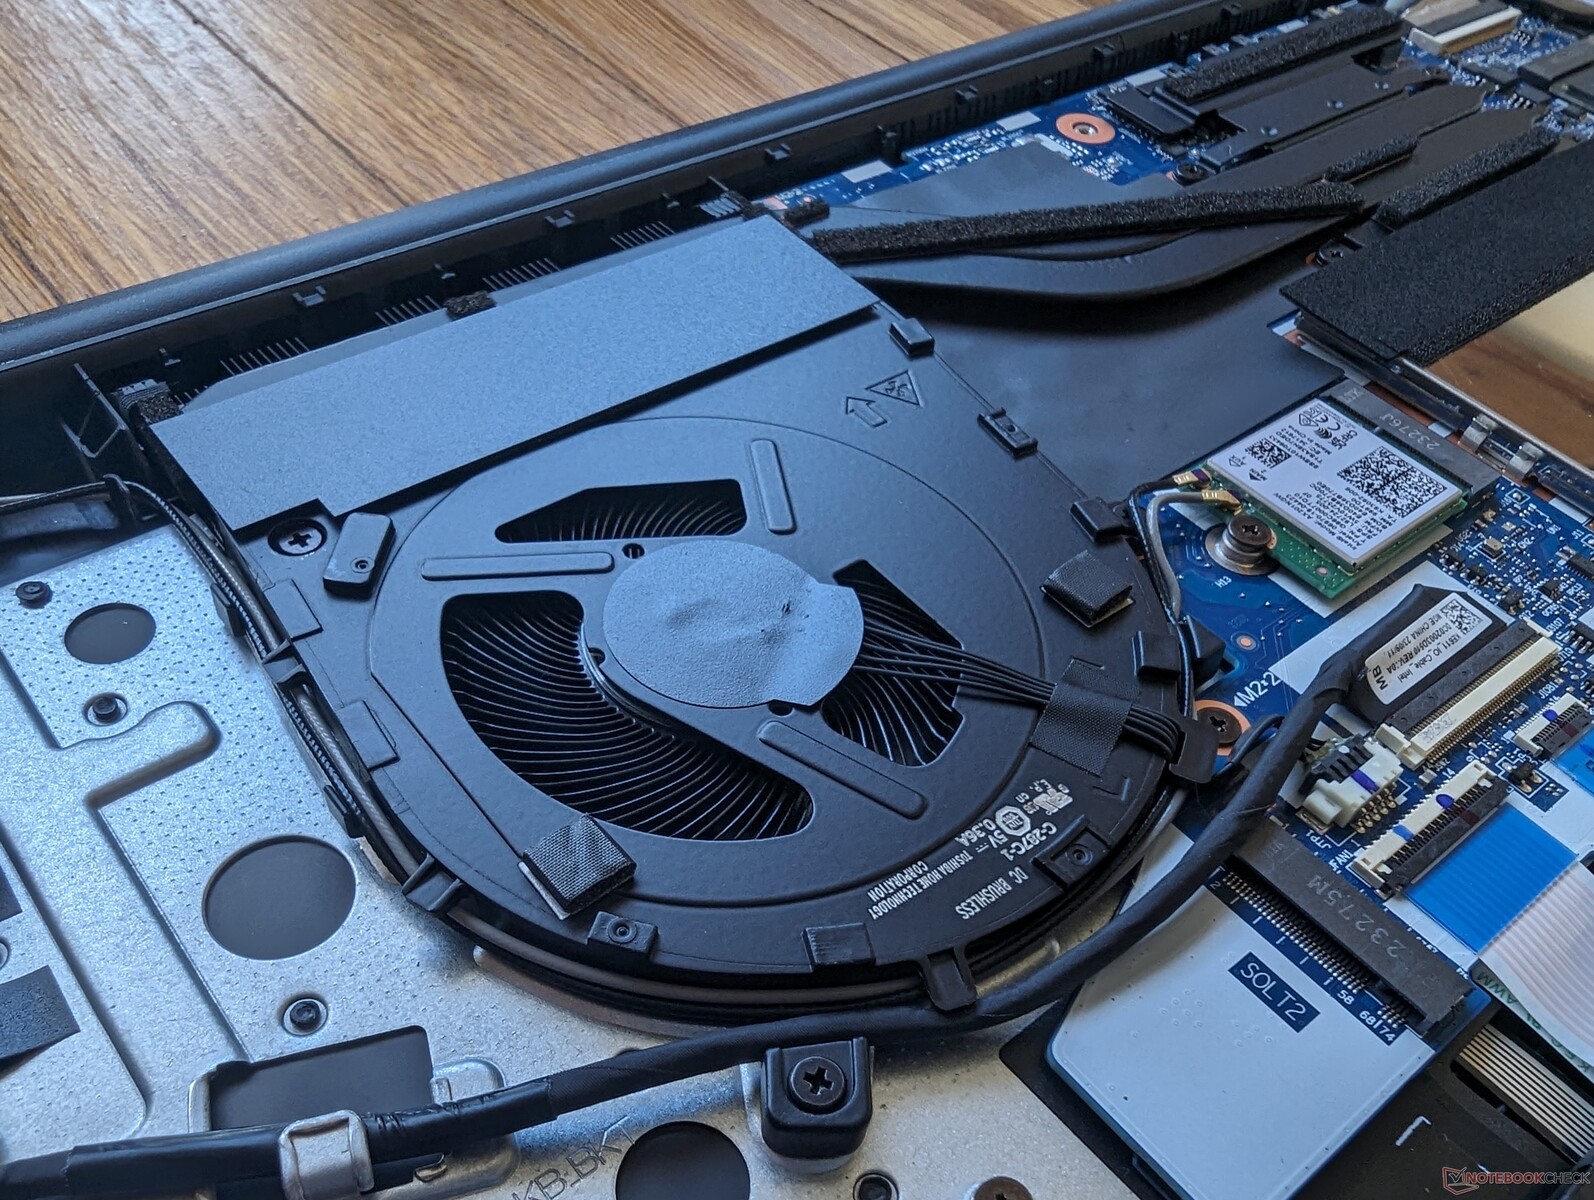
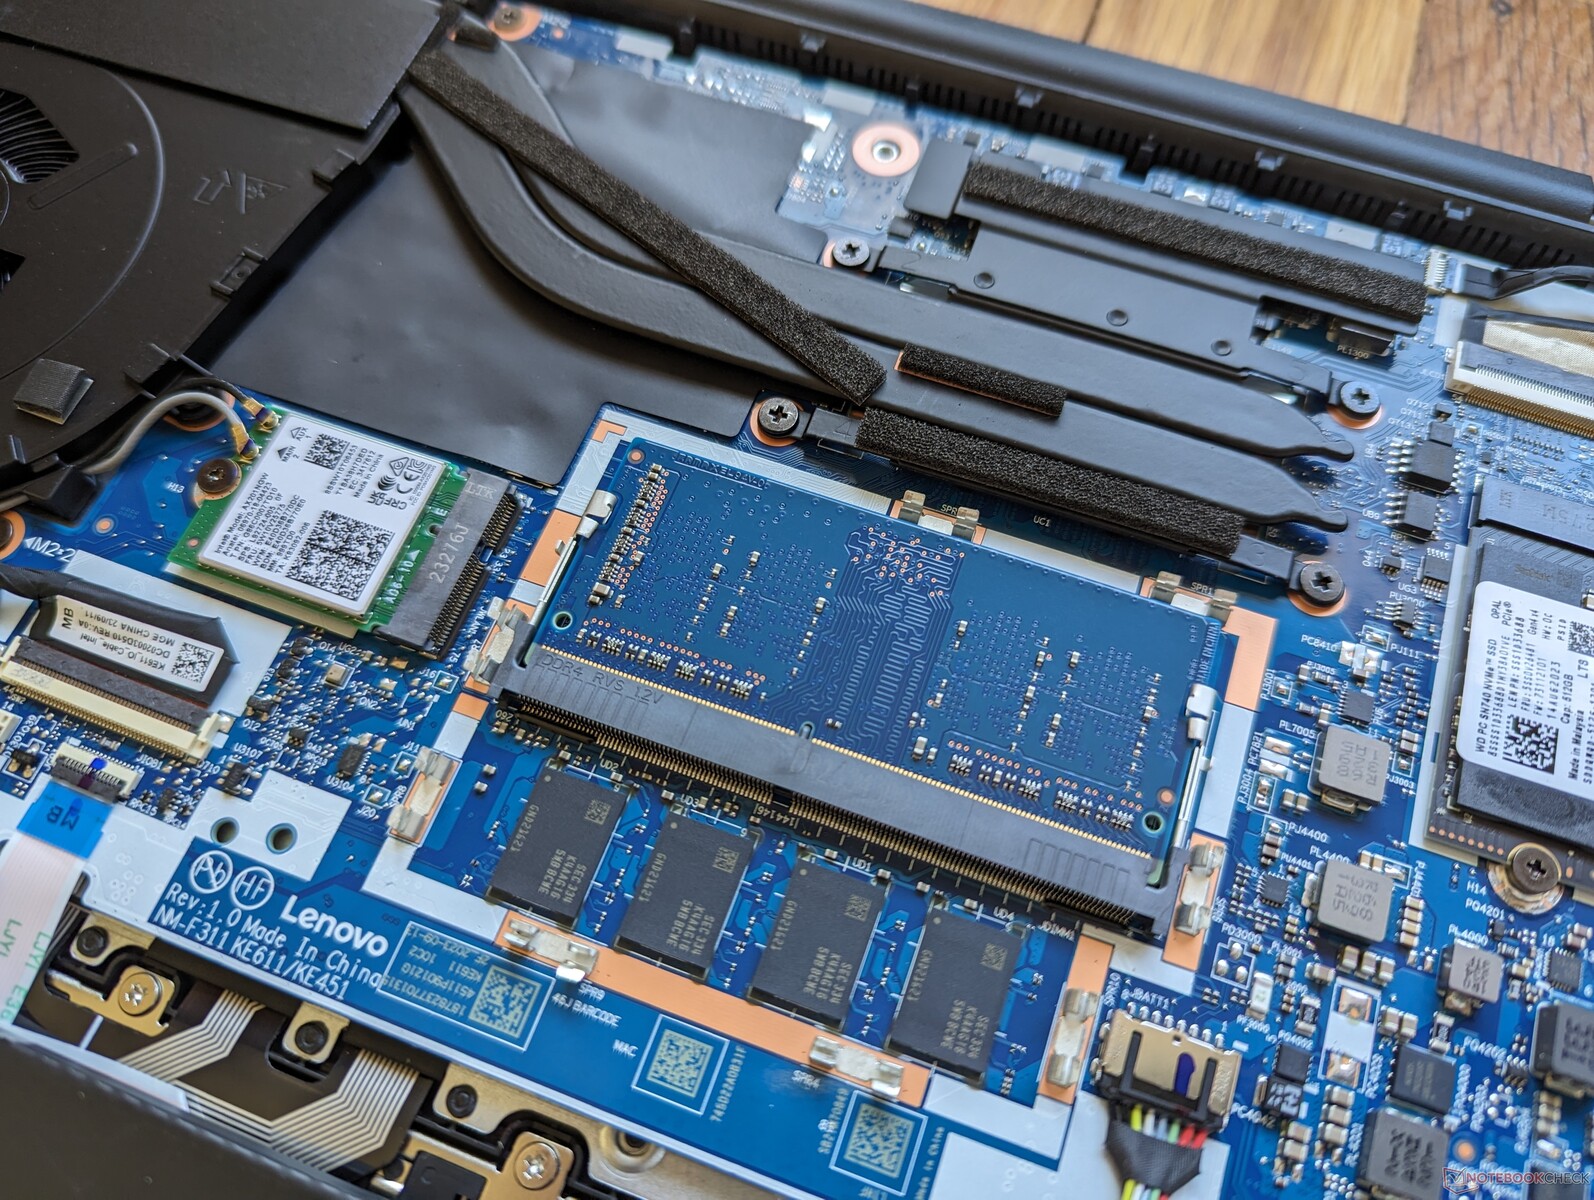
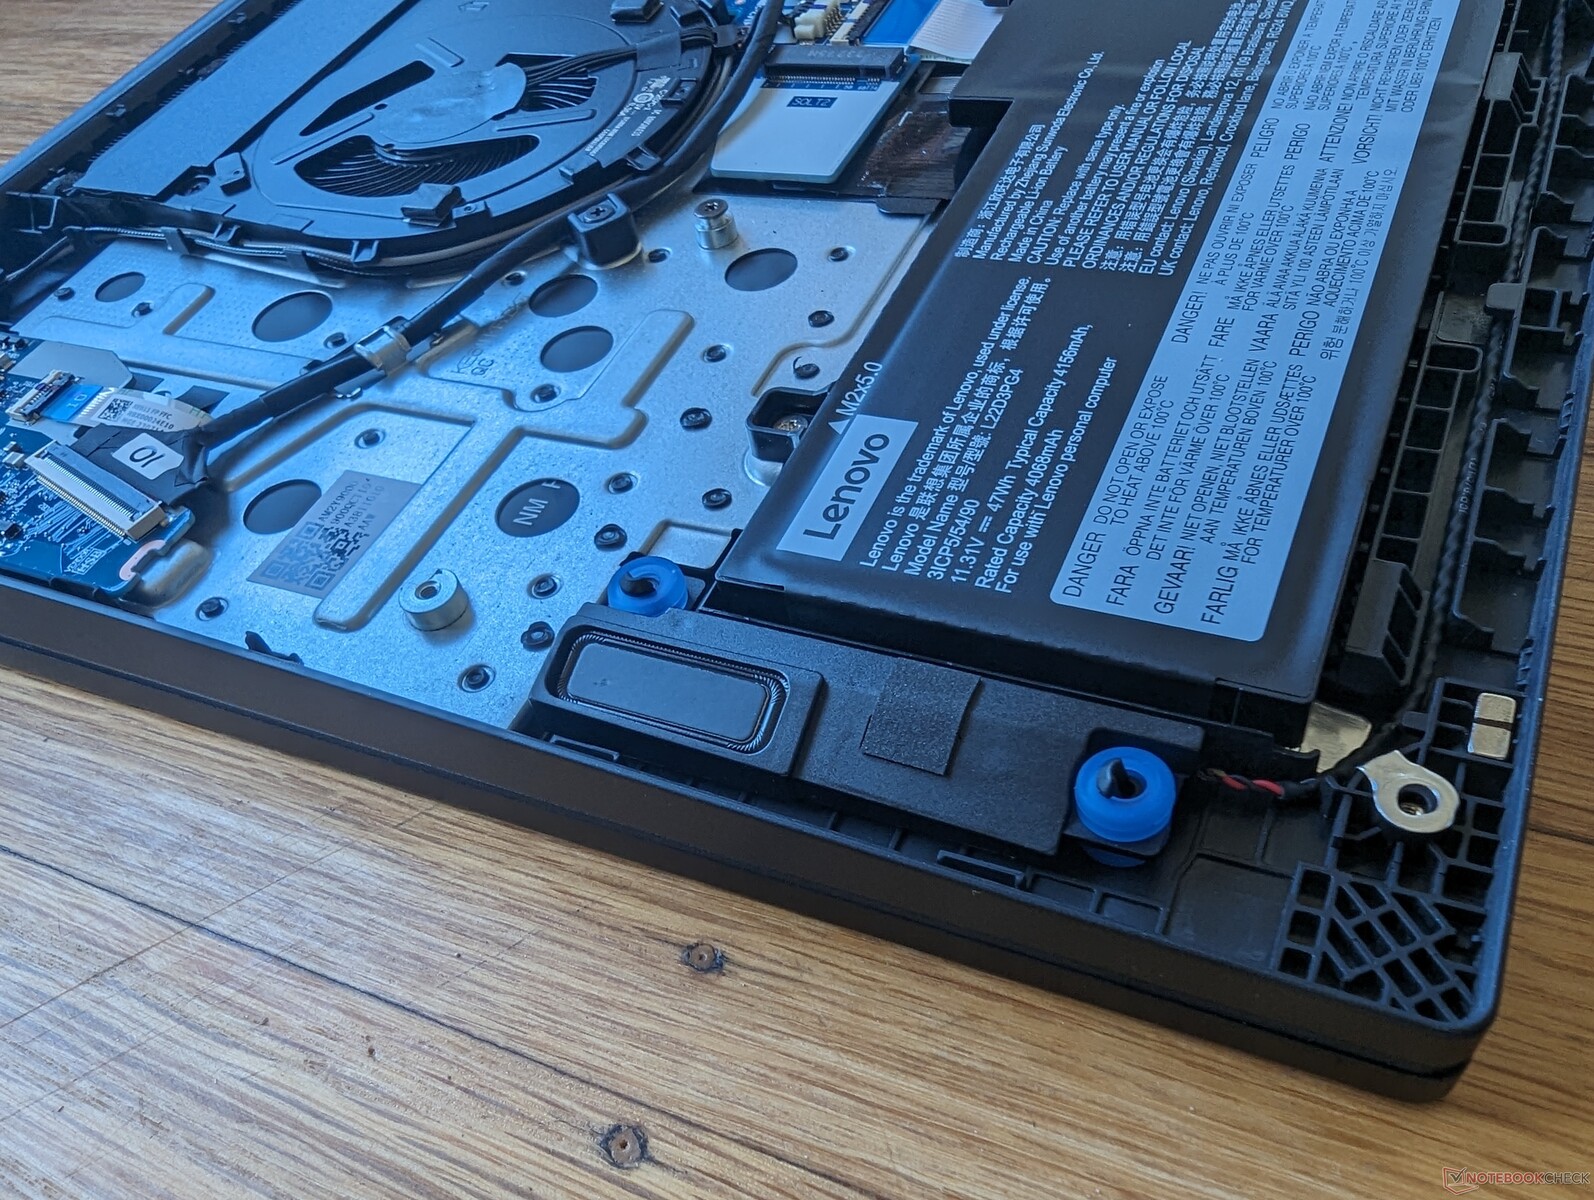
Bakım
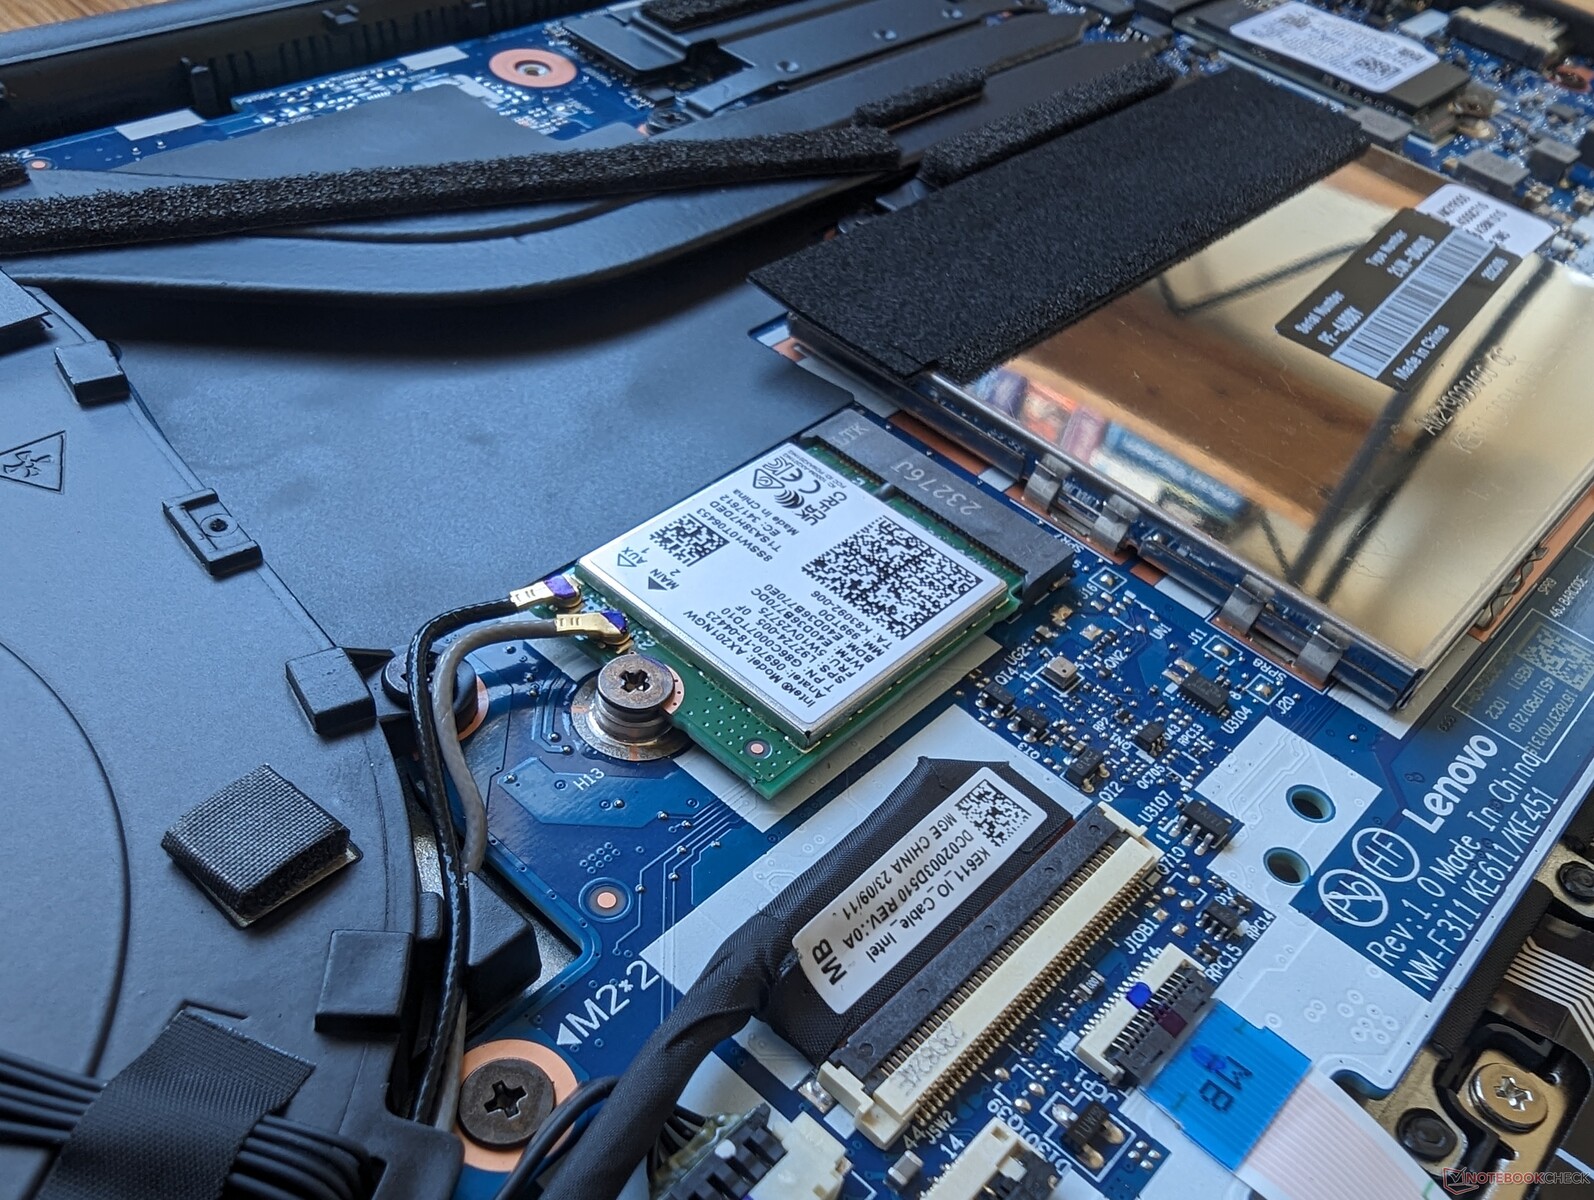
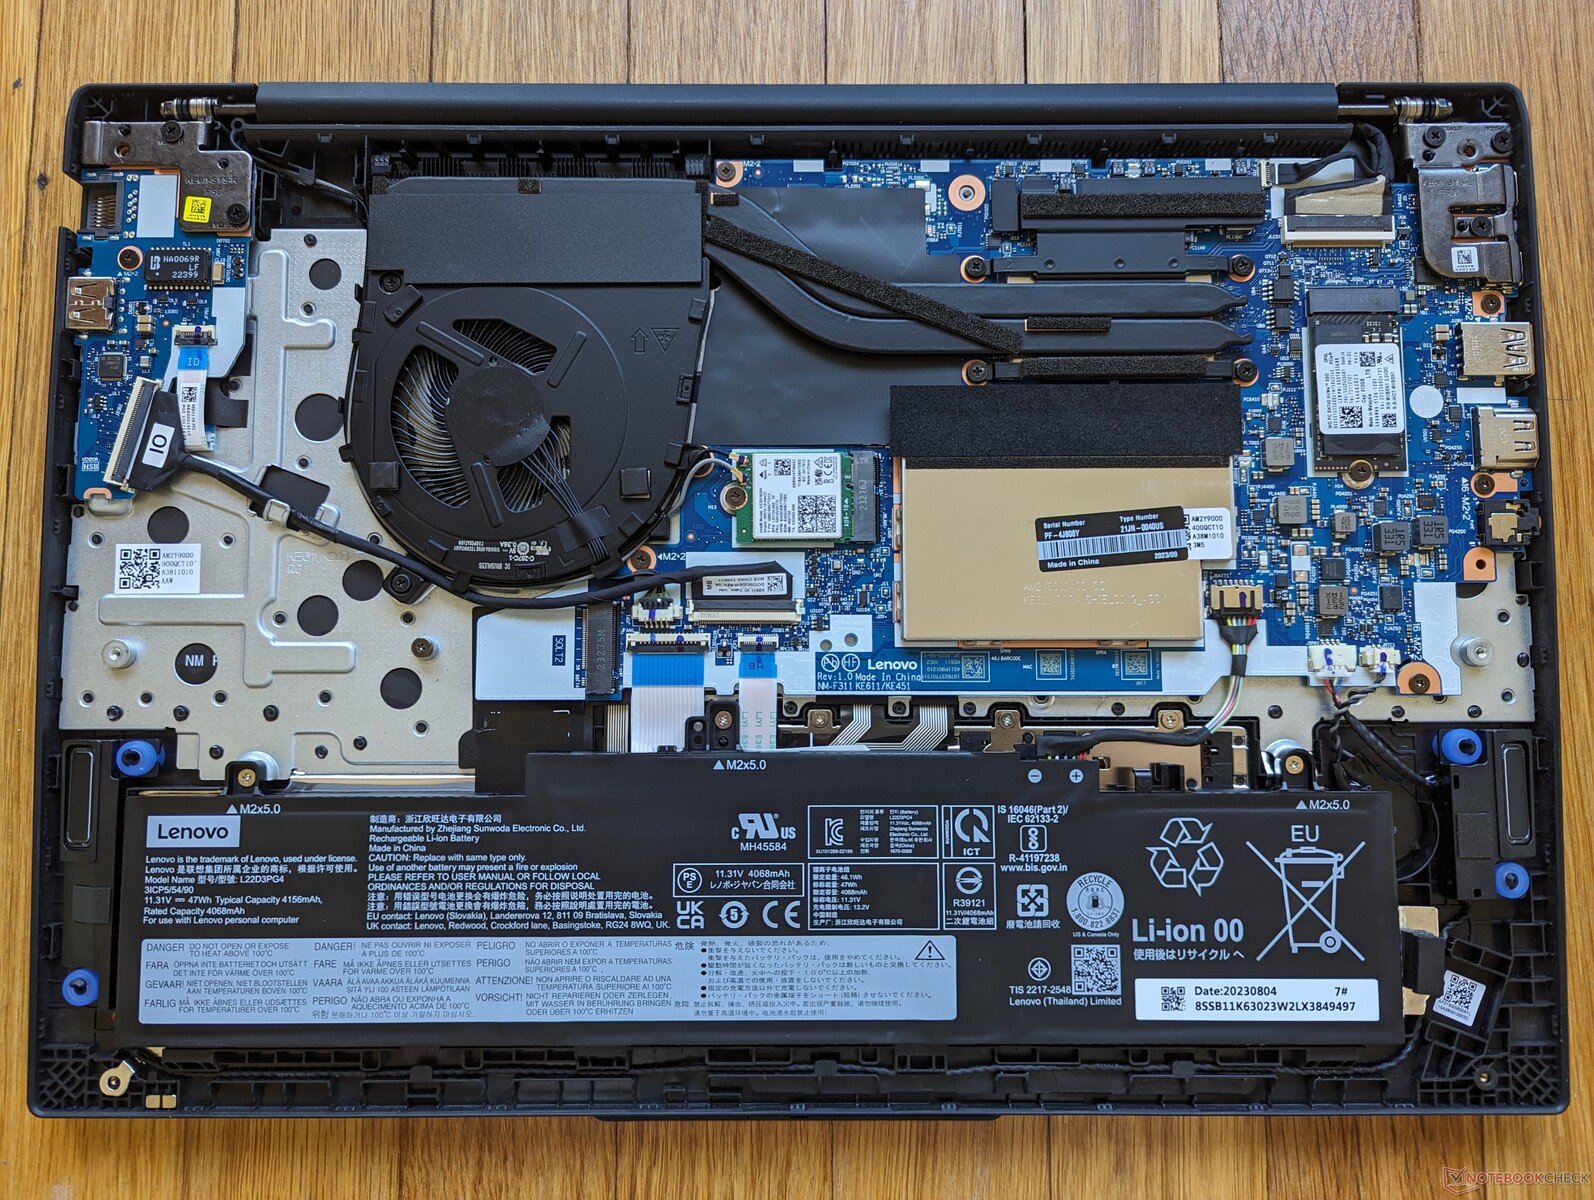
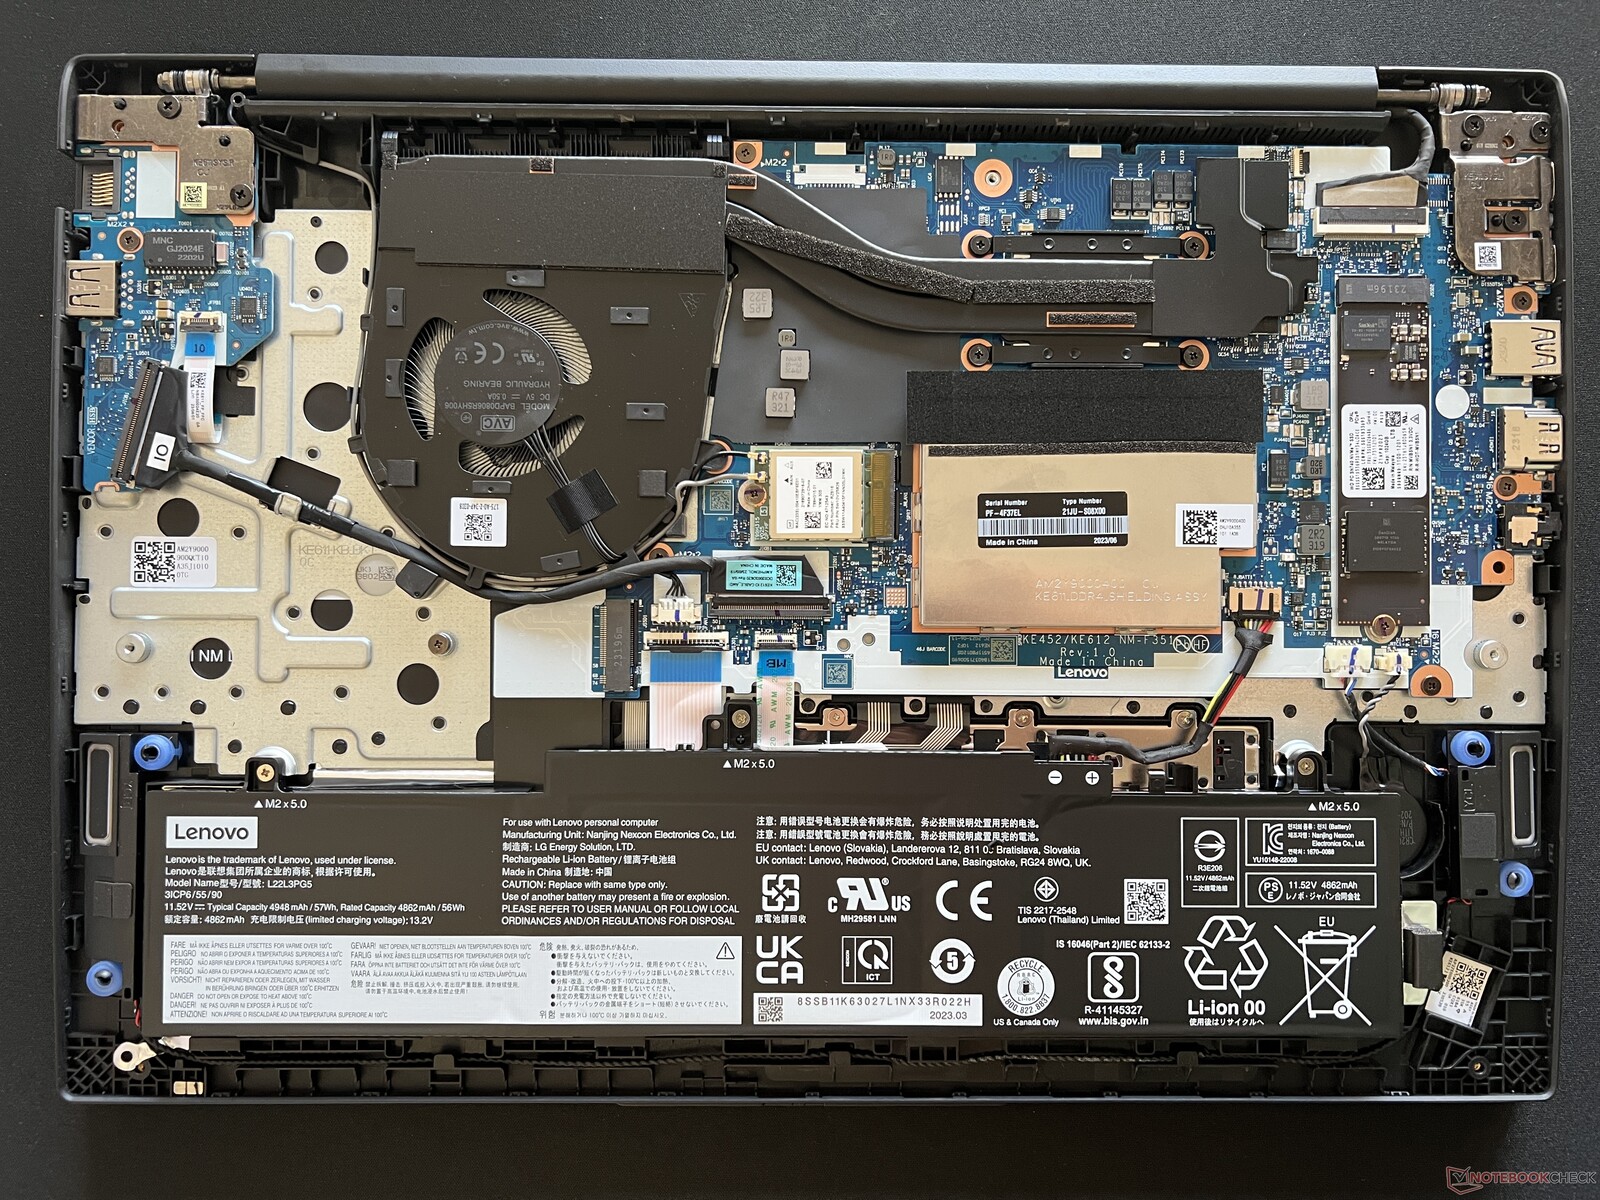
Hem Intel hem de AMD versiyonları, her biri iki adede kadar M.2 SSD'yi desteklemektedir. Ancak Intel versiyonu yalnızca 42 mm uzunluğa kadar olan sürücüleri desteklerken AMD versiyonu 80 mm'ye kadar olan bir sürücüyü destekleyebilmektedir. Bu durum, daha küçük 14 inç SSD'ler arasında gözlemlediğimize benzerdir ThinkPad E14 G5 Intel ve AMD versiyonları.
Garanti
ABD'de satın alındığında bir yıllık sınırlı üretici garantisi geçerlidir. T serisi veya X serisinden daha üst düzey ThinkPad modelleri genellikle standart olarak üç yıllık garantiyle gelir.
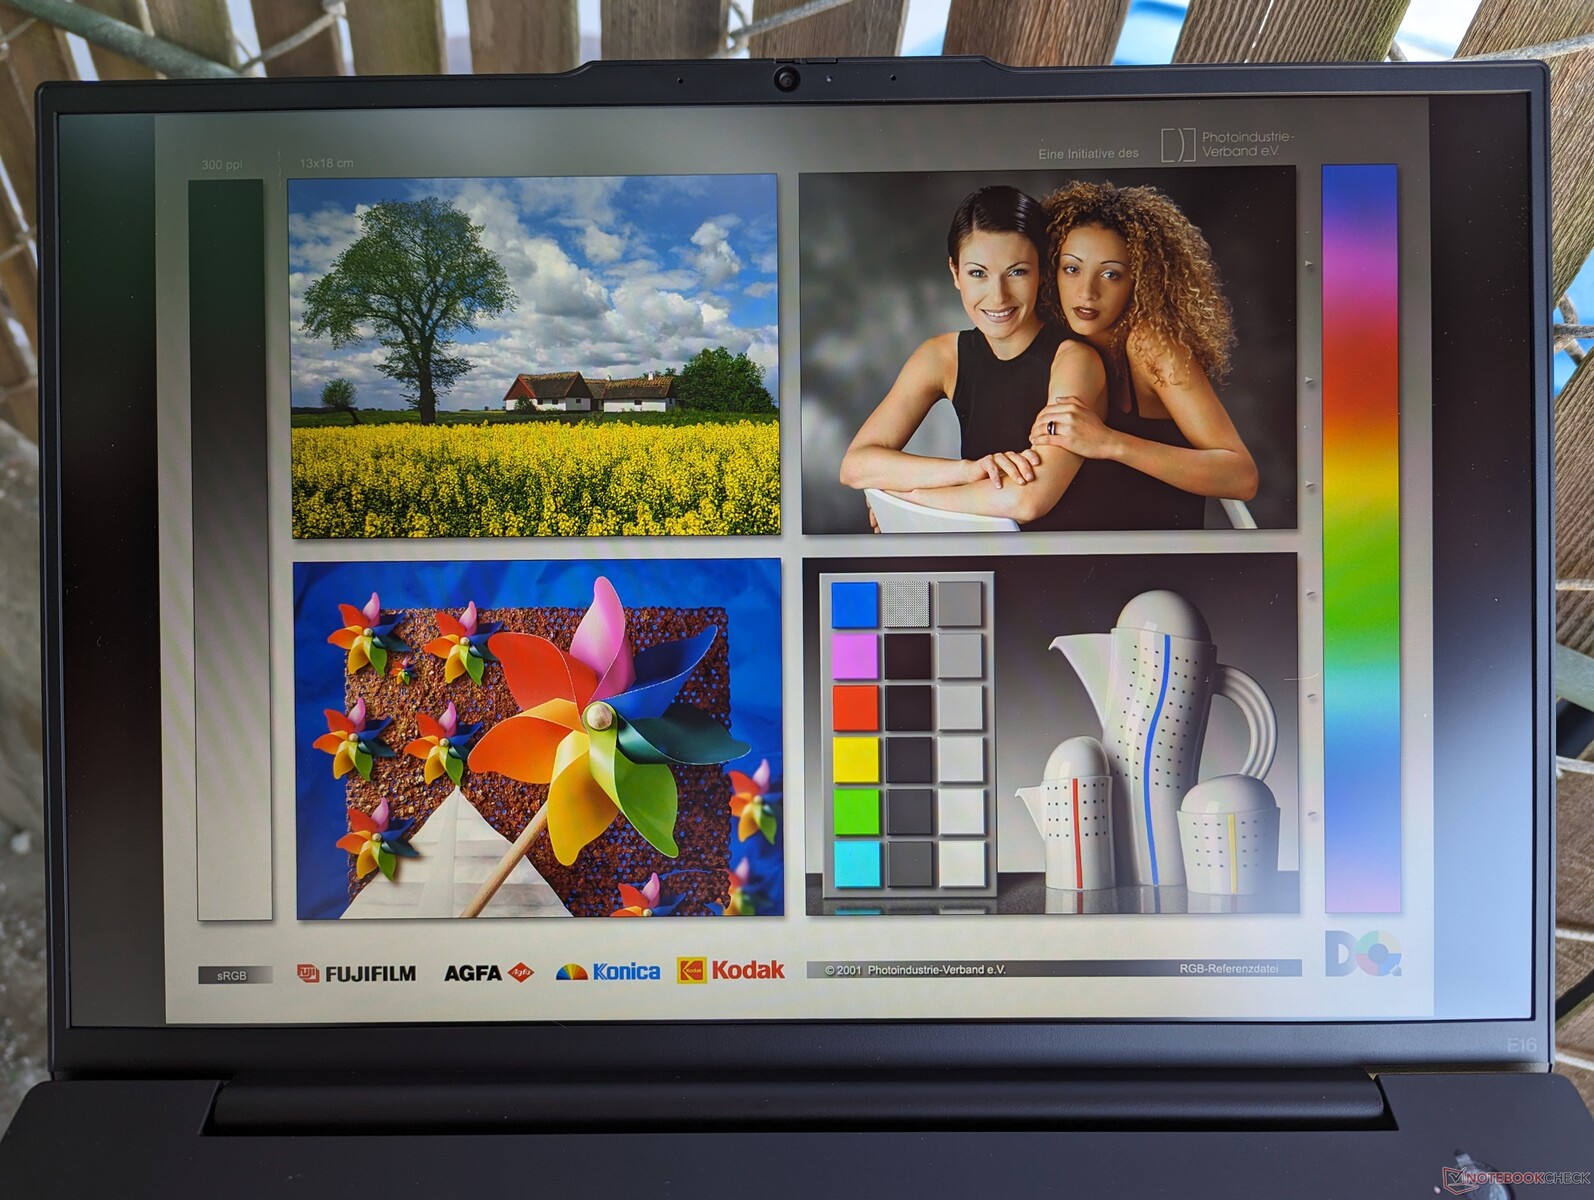
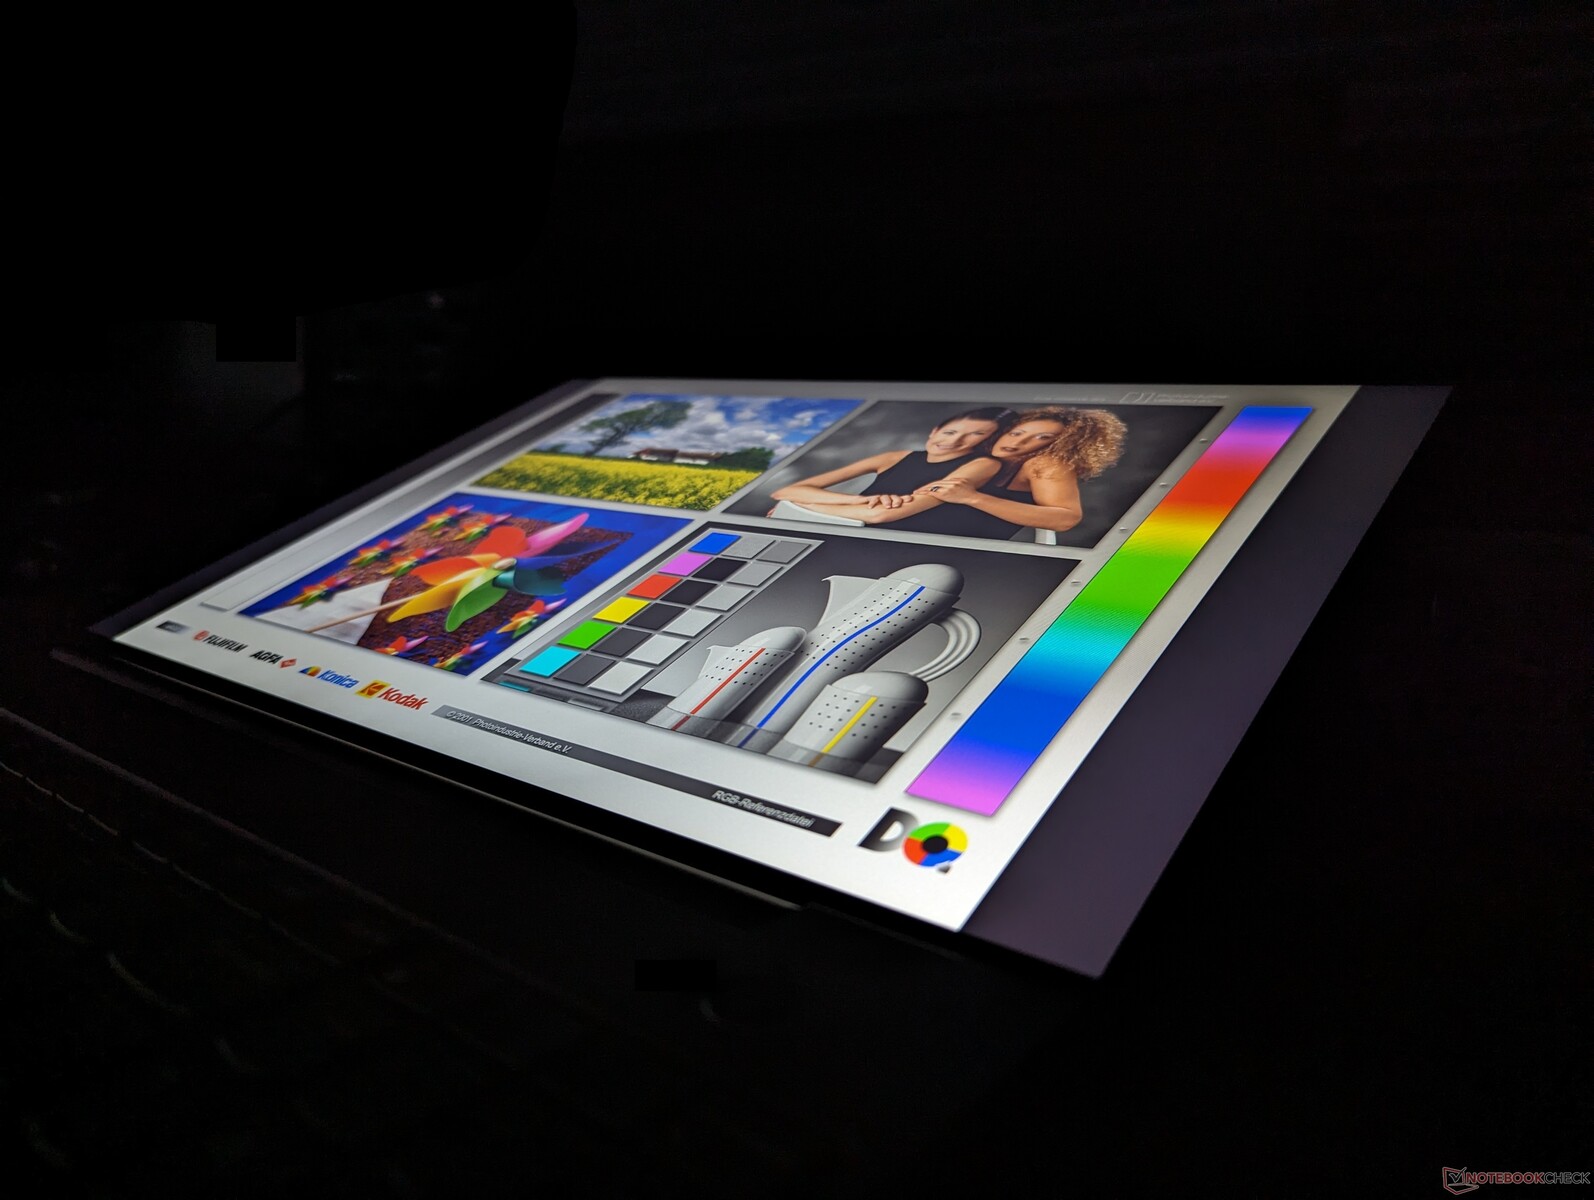
Ekran
Aşağıdaki gibi dört IPS mat seçeneği mevcuttur:
- 1200p, %60 sRGB, 300 nit, 60 Hz, dokunmatik olmayan
- 1200p, %60 sRGB, 300 nit, 60 Hz, dokunmatik
- 1200p, %100 sRGB, 300 nit, 60 Hz, dokunmatik olmayan
- 1600p, %100 sRGB, 400 nit, 60 Hz, dokunmatik olmayan
Özel Intel inceleme ünitemiz yukarıda kalın yazılmış seçenekle gelirken, AMD ünitemiz 1600p seçeneğiyle geliyor. Görüntü kalitesi Intel ve AMD ünitelerimiz arasında gece ve gündüz gibi, ikincisi daha keskin, daha canlı ve gözle görülür şekilde daha iyi bir görüntüleme deneyimi için daha hızlı tepki süreleriyle görünüyor. Dokunmatik ekran işlevselliği bir zorunluluk değilse, belirli panel seçeneğimizden kaçınmanızı öneririz.
| |||||||||||||||||||||||||
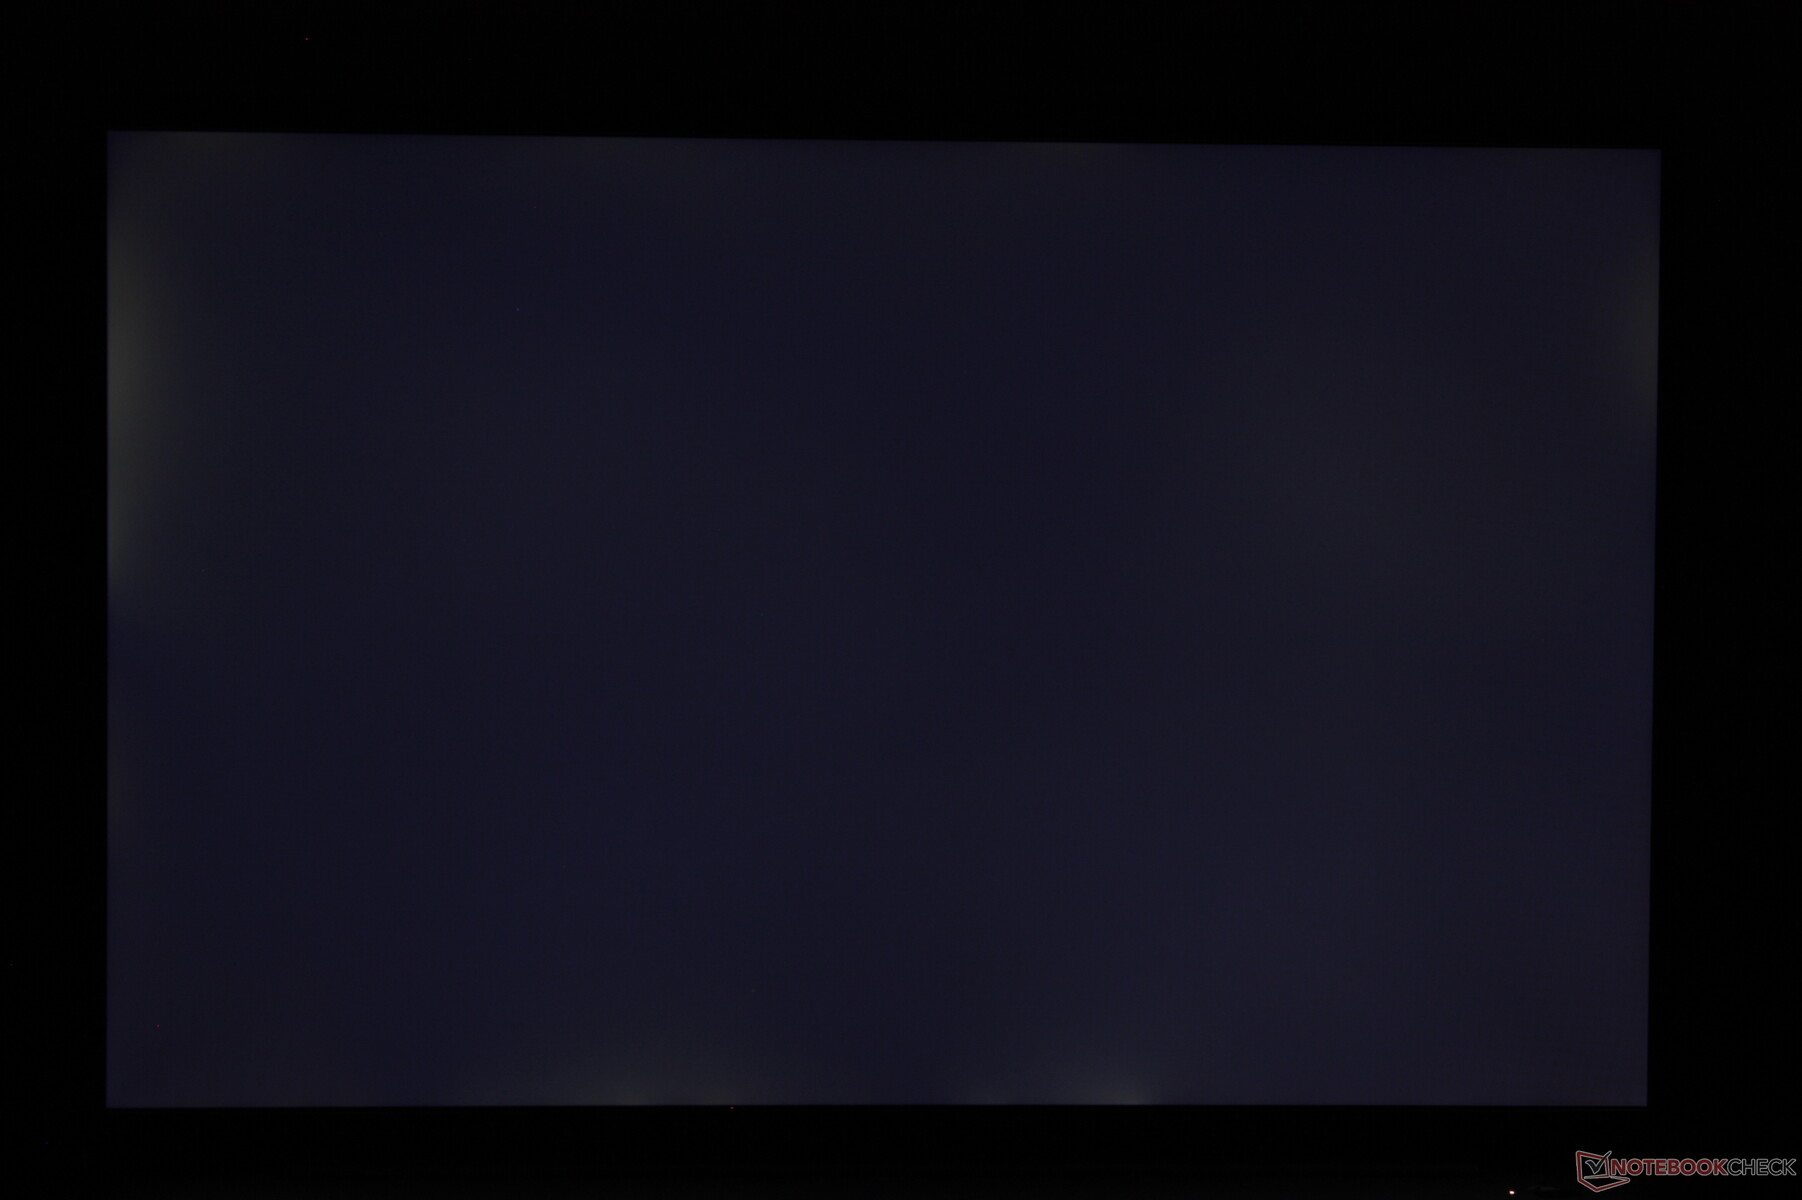
Aydınlatma: 91 %
Batarya modunda parlaklık: 318.6 cd/m²
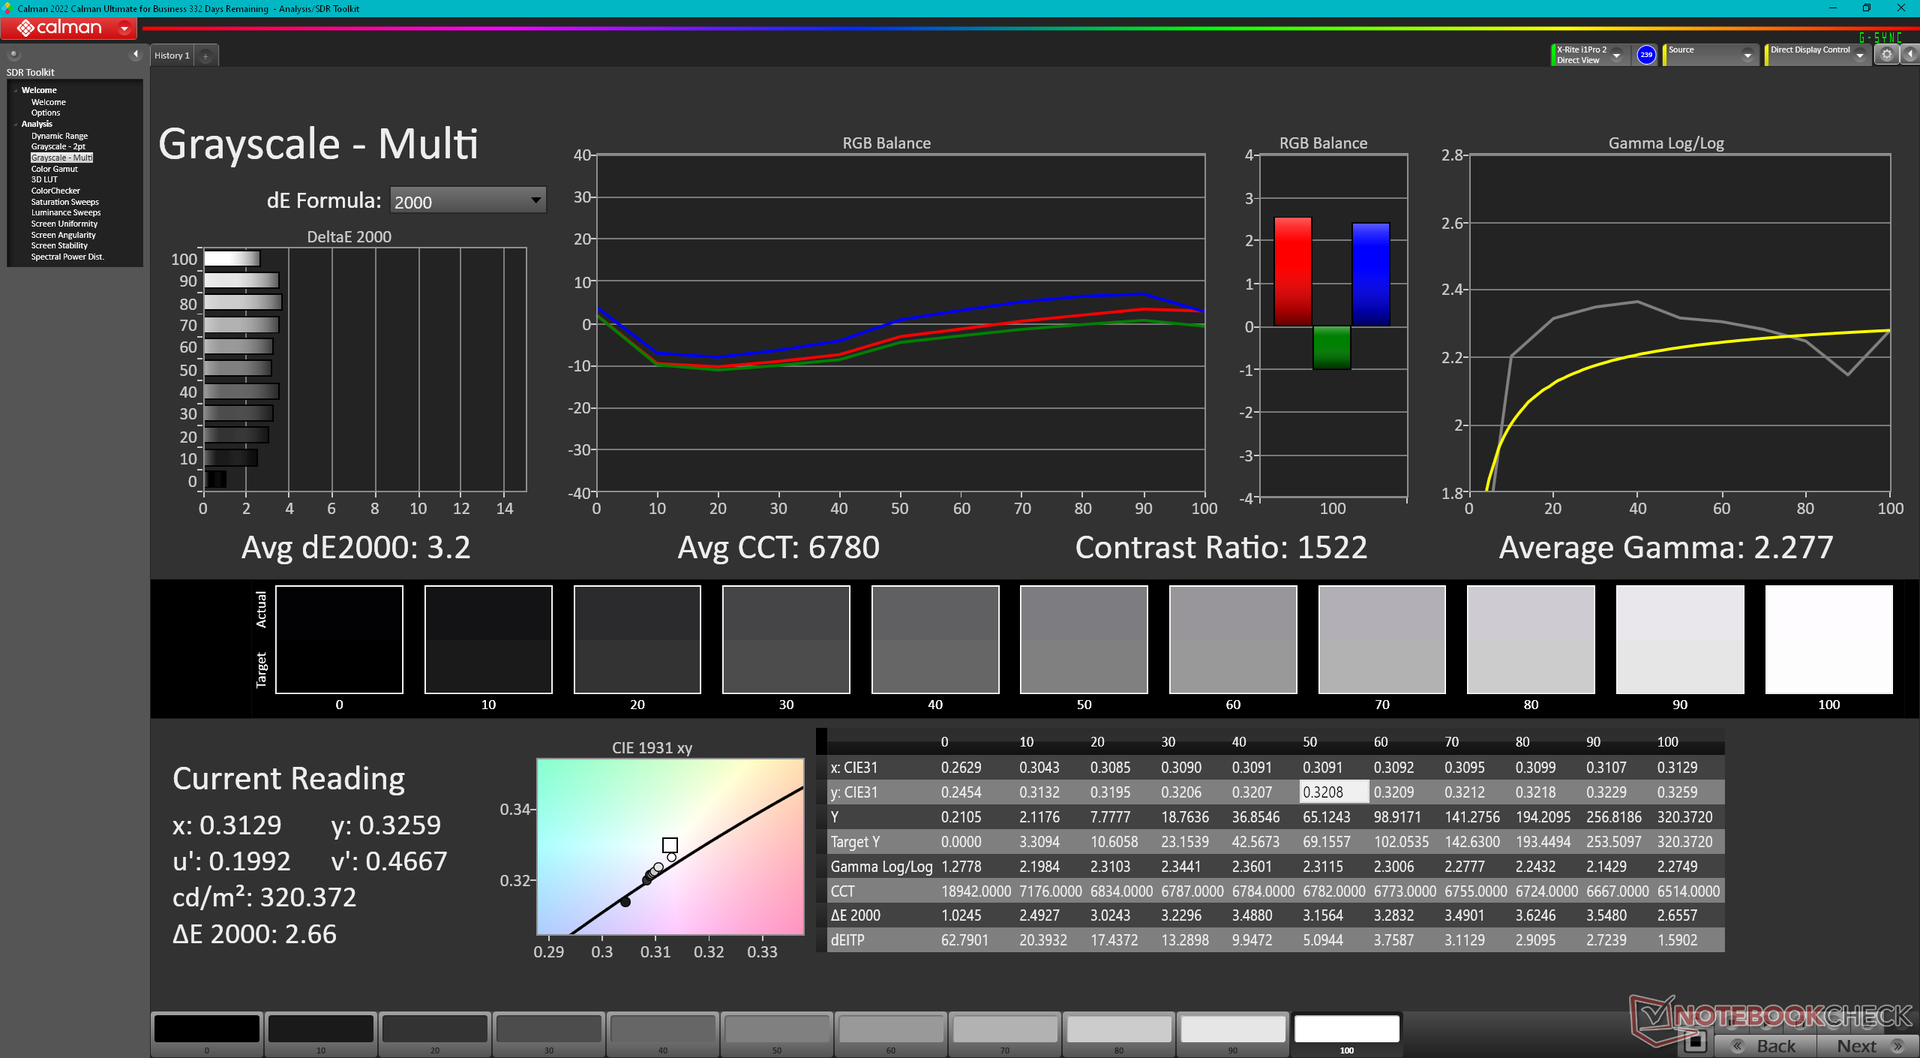
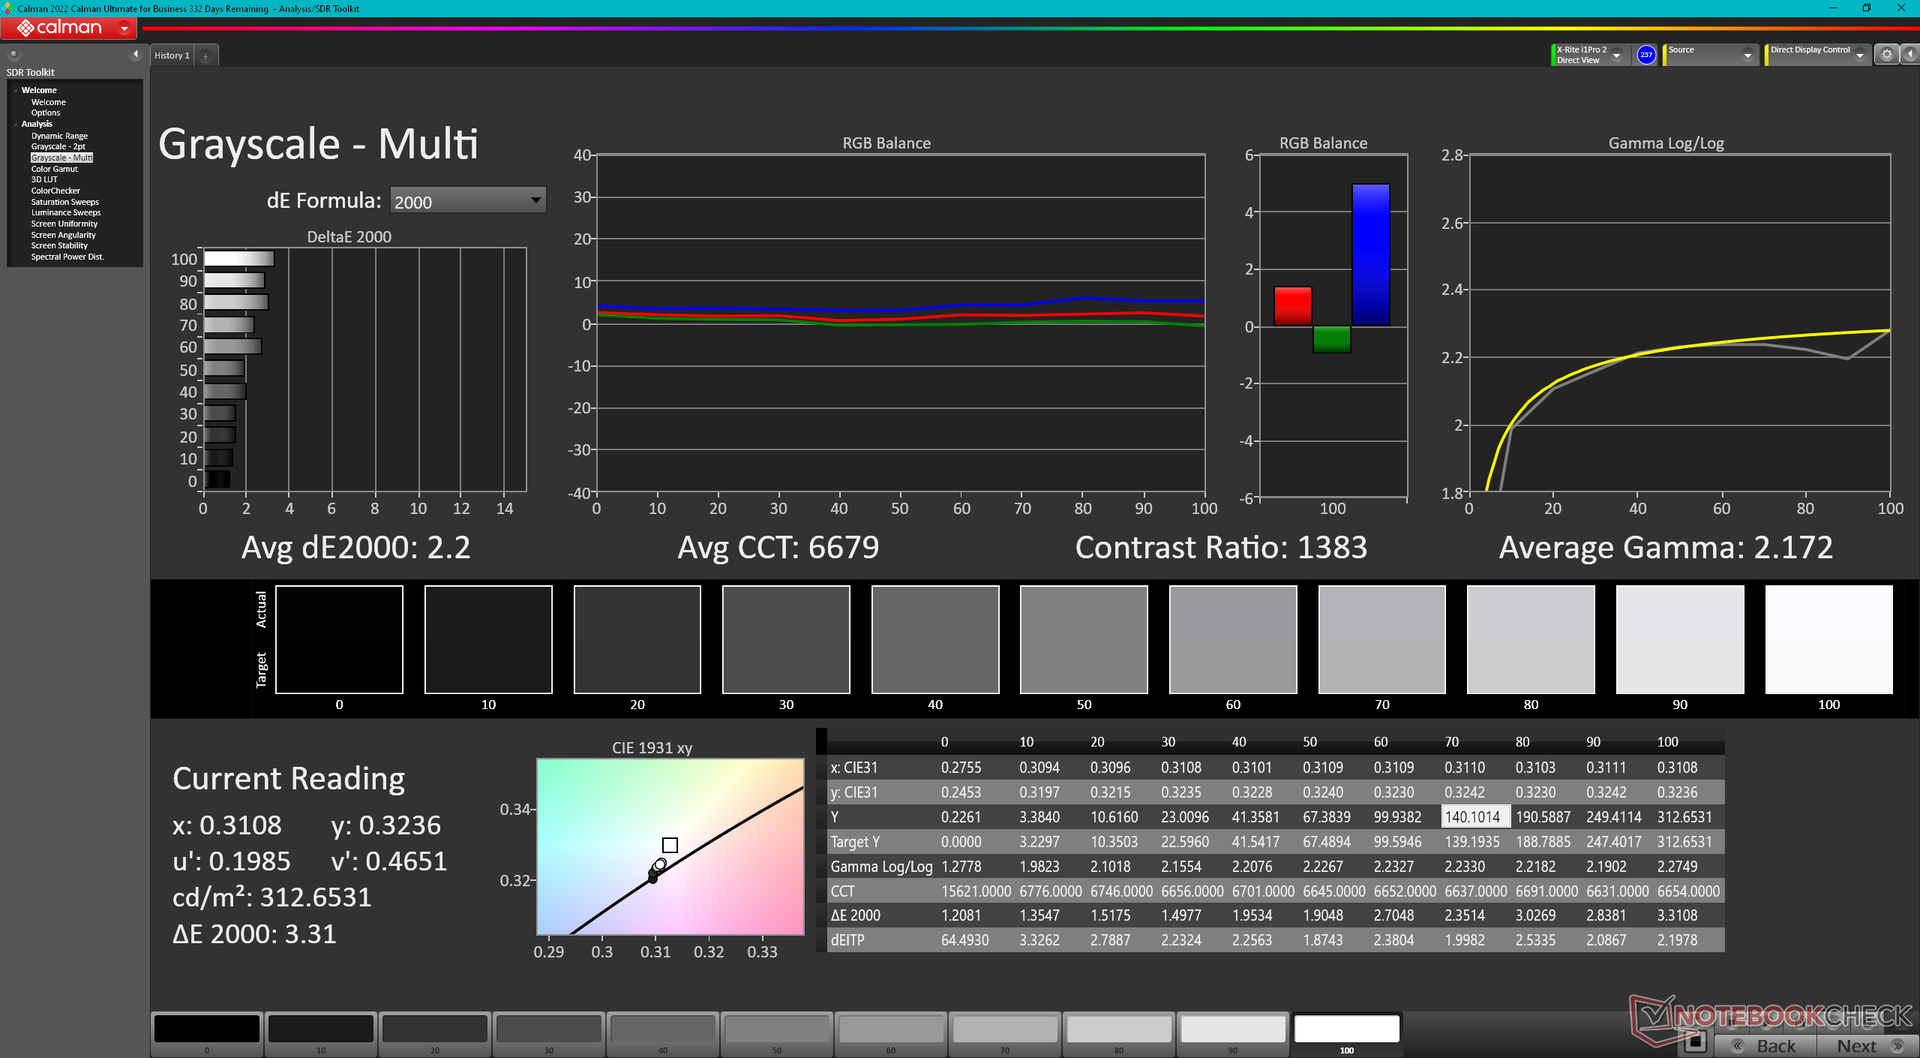
Kontrast: 1099:1 (Siyah: 0.29 cd/m²)
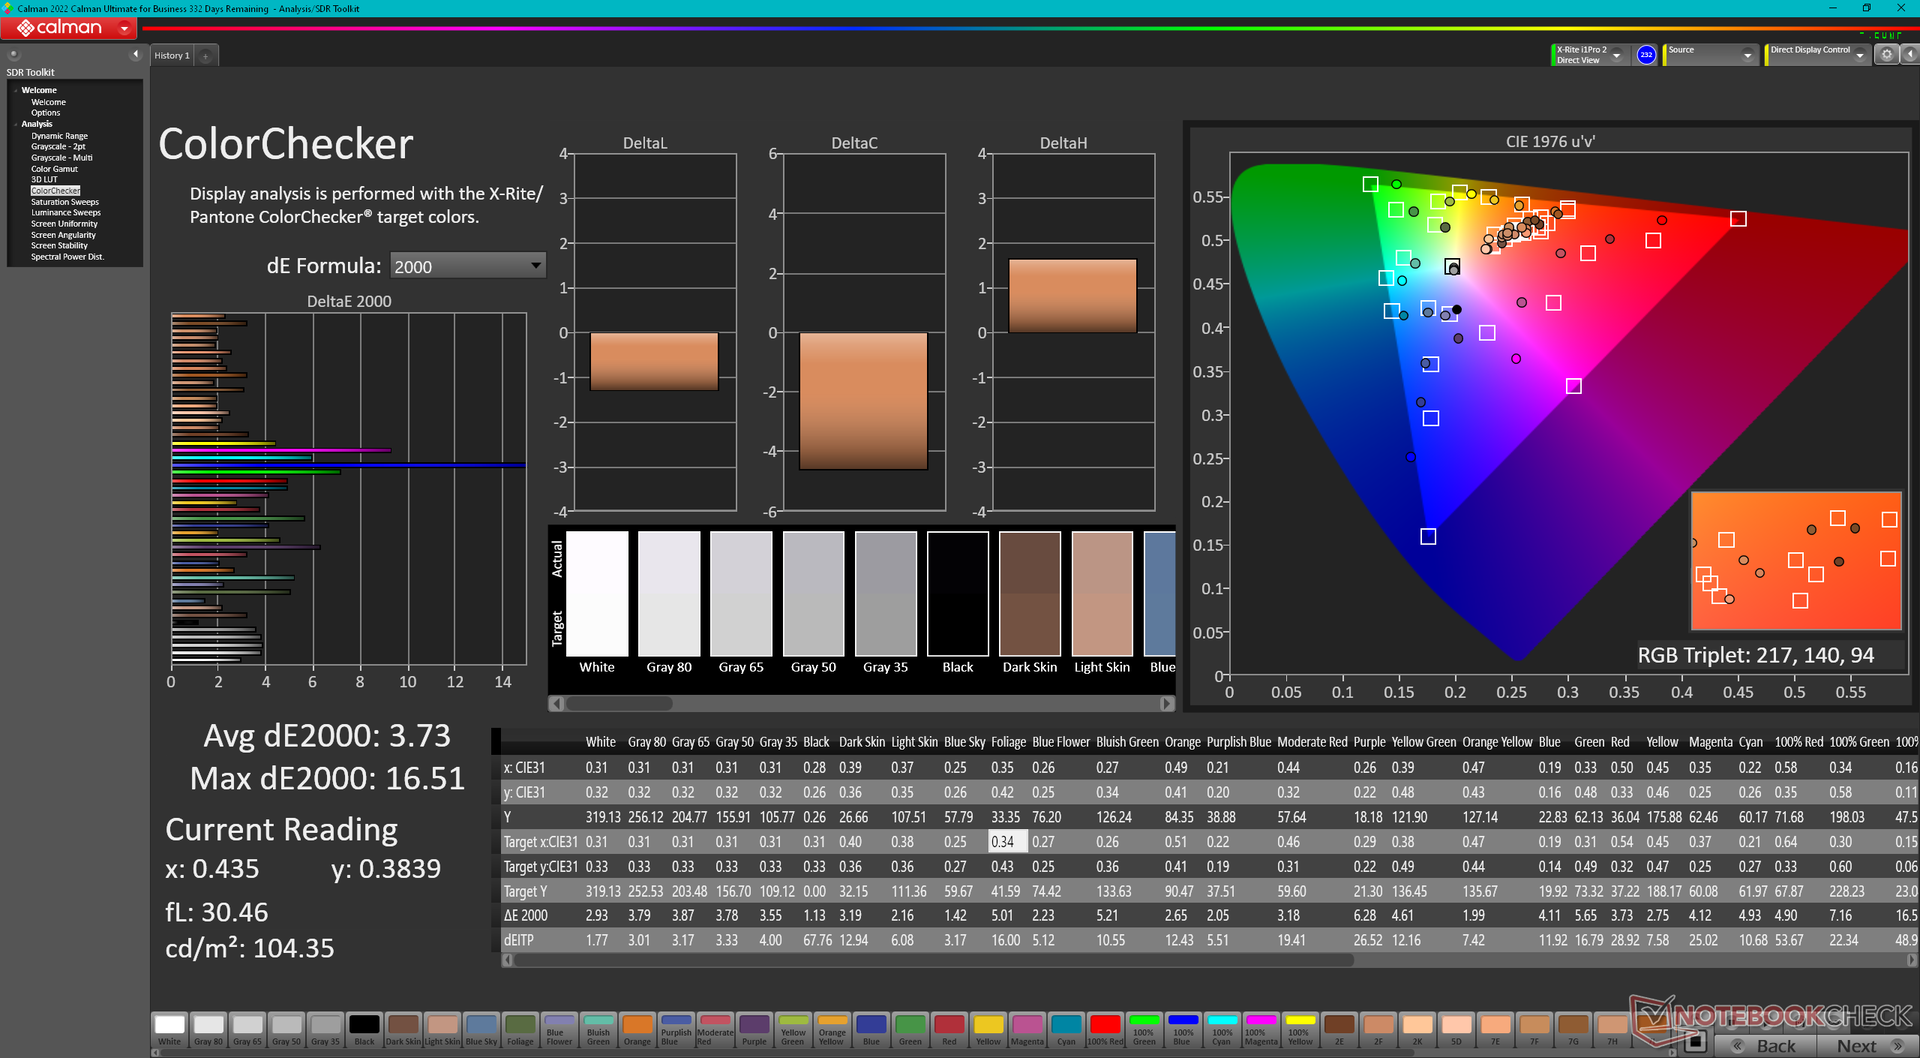
ΔE ColorChecker Calman: 3.73 | ∀{0.5-29.43 Ø4.71}
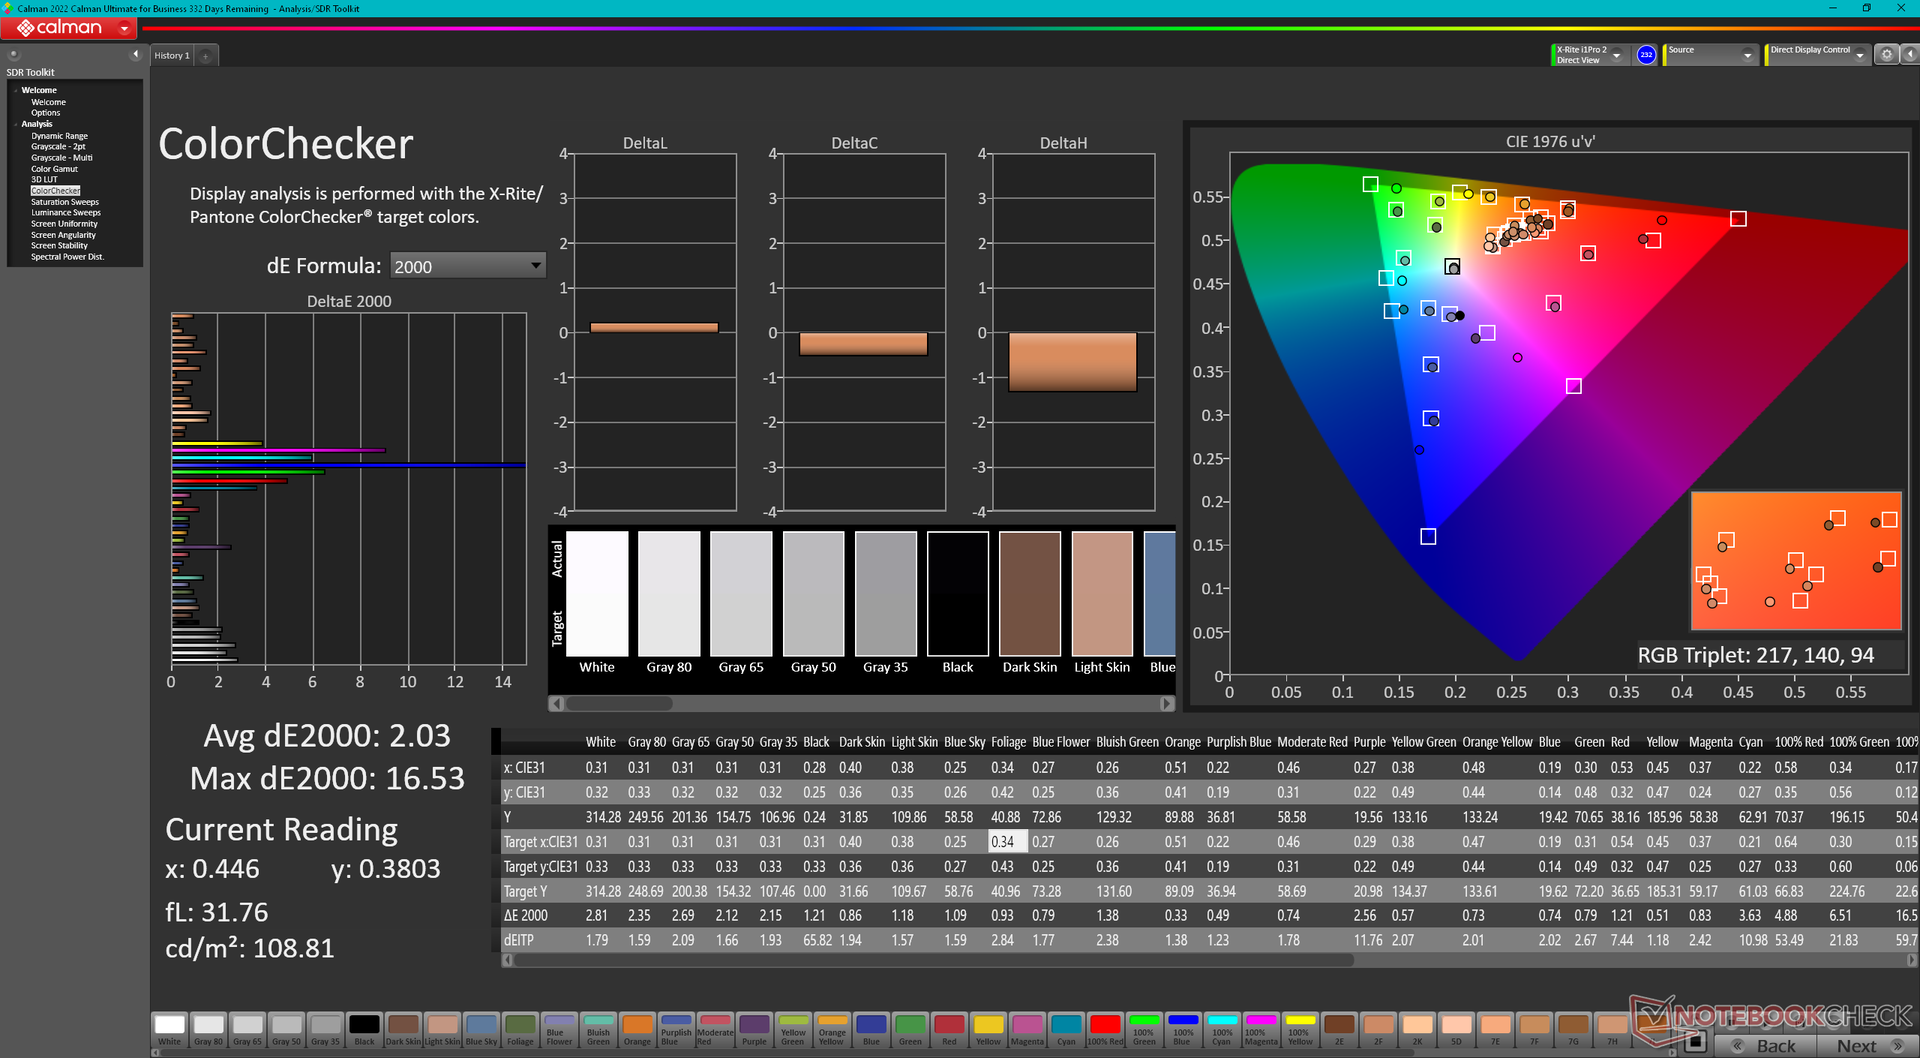
calibrated: 2.03
ΔE Greyscale Calman: 3.2 | ∀{0.09-98 Ø4.96}
43.3% AdobeRGB 1998 (Argyll 3D)
62.6% sRGB (Argyll 3D)
42% Display P3 (Argyll 3D)
Gamma: 2.28
CCT: 6780 K
| Lenovo ThinkPad E16 G1 Core i5-1335U R160NW41 R2, IPS, 1920x1200, 16" | Lenovo ThinkPad E16 G1-21JUS08X00 MNG007DA1-C, IPS, 2560x1600, 16" | Dell Inspiron 16 7635 2-in-1 Chi Mei 160JCA, IPS, 1920x1200, 16" | Acer TravelMate P4 TMP416-51-55KN BOE BOE0A32, IPS, 1920x1200, 16" | Samsung Galaxy Book3 Pro 16 Samsung ATNA60CL03-0, AMOLED, 2880x1800, 16" | LG Gram 16Z90Q LG LP160WQ1-SPB2 (LGD06EB), IPS, 2560x1600, 16" | |
|---|---|---|---|---|---|---|
| Display | 58% | 59% | -7% | 107% | 95% | |
| Display P3 Coverage (%) | 42 | 67.6 61% | 67.4 60% | 38.9 -7% | 99.7 137% | 96.8 130% |
| sRGB Coverage (%) | 62.6 | 95.3 52% | 98.2 57% | 58.1 -7% | 100 60% | 99.9 60% |
| AdobeRGB 1998 Coverage (%) | 43.3 | 70 62% | 69.5 61% | 40.2 -7% | 97 124% | 84.6 95% |
| Response Times | 30% | 38% | 62% | 95% | 16% | |
| Response Time Grey 50% / Grey 80% * (ms) | 46.4 ? | 32.4 ? 30% | 27.6 ? 41% | 20 ? 57% | 2 ? 96% | 45.7 ? 2% |
| Response Time Black / White * (ms) | 27.6 ? | 19.6 ? 29% | 18.2 ? 34% | 9 ? 67% | 2 ? 93% | 19.7 ? 29% |
| PWM Frequency (Hz) | ||||||
| Screen | 30% | 12% | -20% | 295% | 13% | |
| Brightness middle (cd/m²) | 318.6 | 404 27% | 301.3 -5% | 269 -16% | 412 29% | 366 15% |
| Brightness (cd/m²) | 302 | 389 29% | 269 -11% | 265 -12% | 412 36% | 347 15% |
| Brightness Distribution (%) | 91 | 91 0% | 79 -13% | 94 3% | 98 8% | 89 -2% |
| Black Level * (cd/m²) | 0.29 | 0.24 17% | 0.28 3% | 0.305 -5% | 0.015 95% | 0.32 -10% |
| Contrast (:1) | 1099 | 1683 53% | 1076 -2% | 882 -20% | 27467 2399% | 1144 4% |
| Colorchecker dE 2000 * | 3.73 | 2.1 44% | 3.1 17% | 4.89 -31% | 2.34 37% | 2.82 24% |
| Colorchecker dE 2000 max. * | 16.51 | 4.2 75% | 5.5 67% | 8.81 47% | 3.34 80% | 4.65 72% |
| Colorchecker dE 2000 calibrated * | 2.03 | 1.4 31% | 0.49 76% | 5.12 -152% | 2.95 -45% | 2.69 -33% |
| Greyscale dE 2000 * | 3.2 | 3.3 -3% | 3.9 -22% | 2.91 9% | 2.78 13% | 2.3 28% |
| Gamma | 2.28 96% | 2.24 98% | 2.19 100% | 2.28 96% | 2.5 88% | 1.971 112% |
| CCT | 6780 96% | 7038 92% | 6186 105% | 6920 94% | 6879 94% | 6796 96% |
| Toplam Ortalama (Program / Ayarlar) | 39% /
36% | 36% /
26% | 12% /
-5% | 166% /
226% | 41% /
31% |
* ... daha küçük daha iyidir
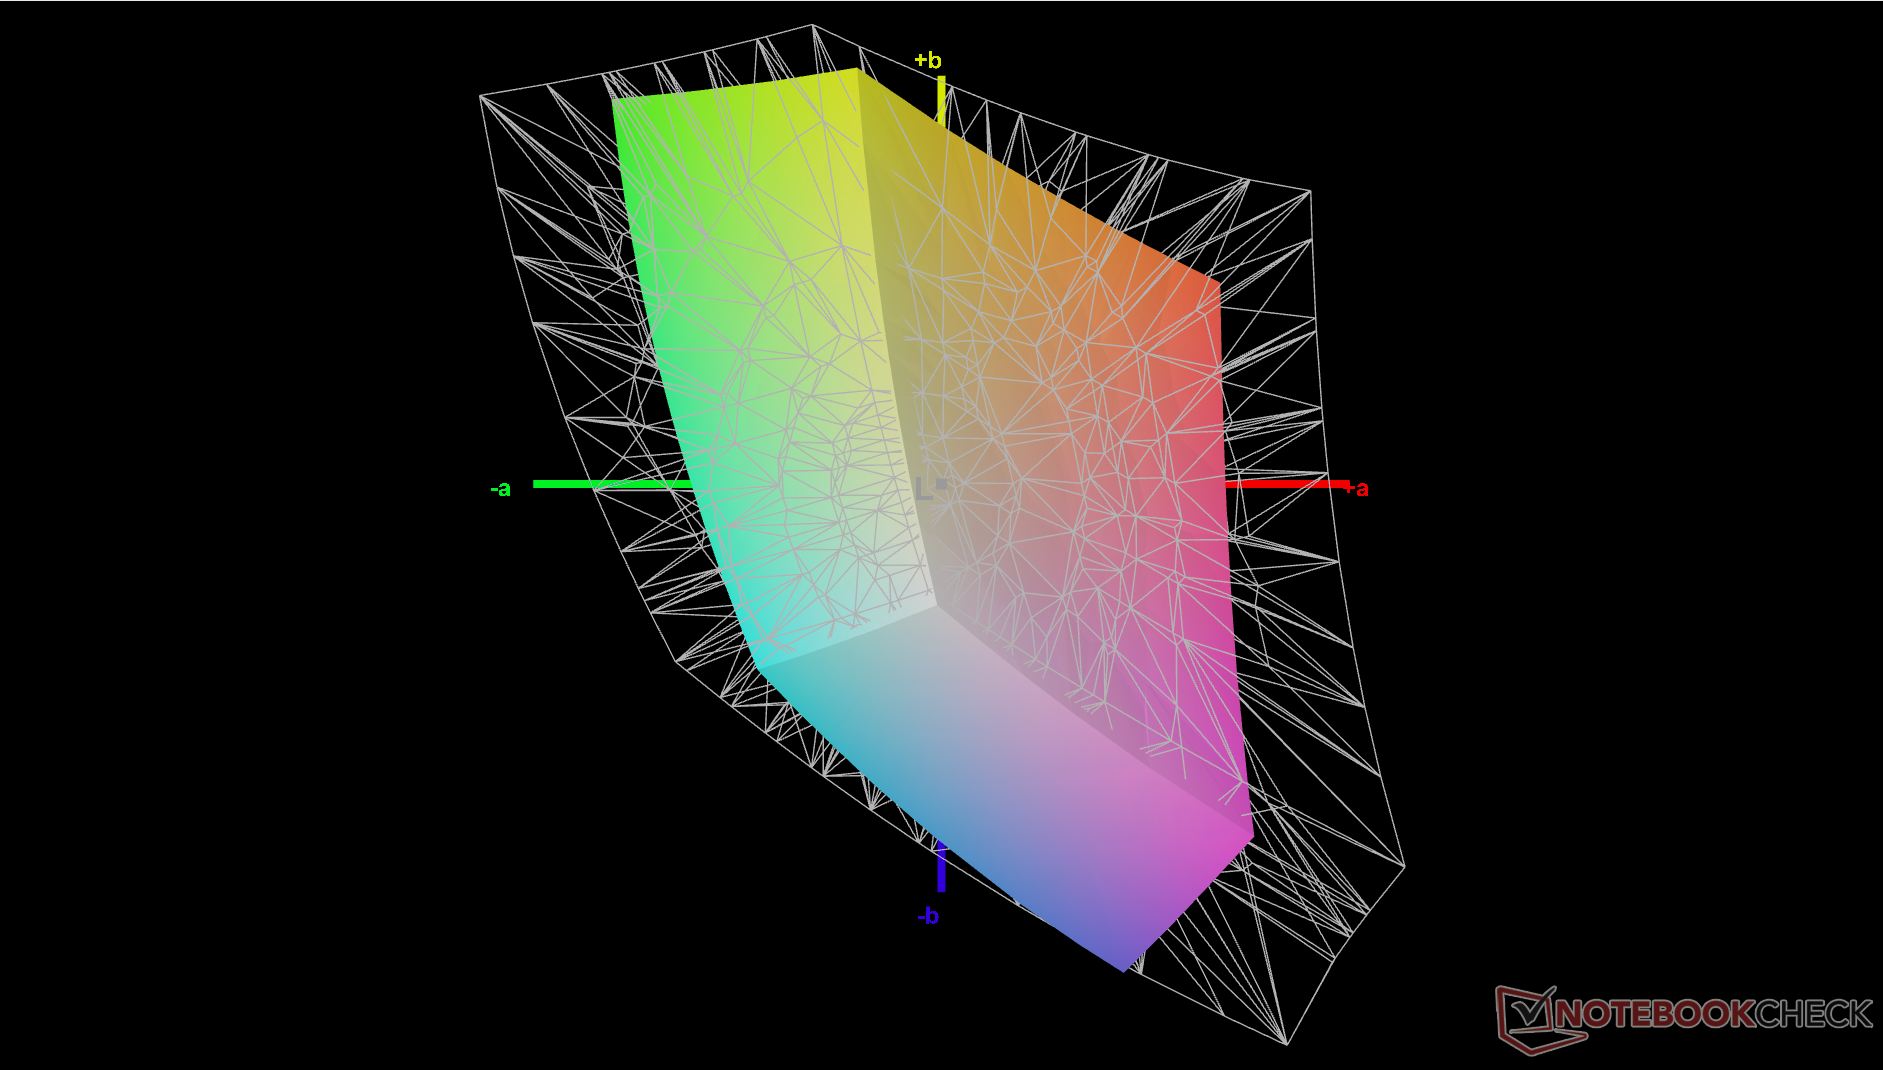
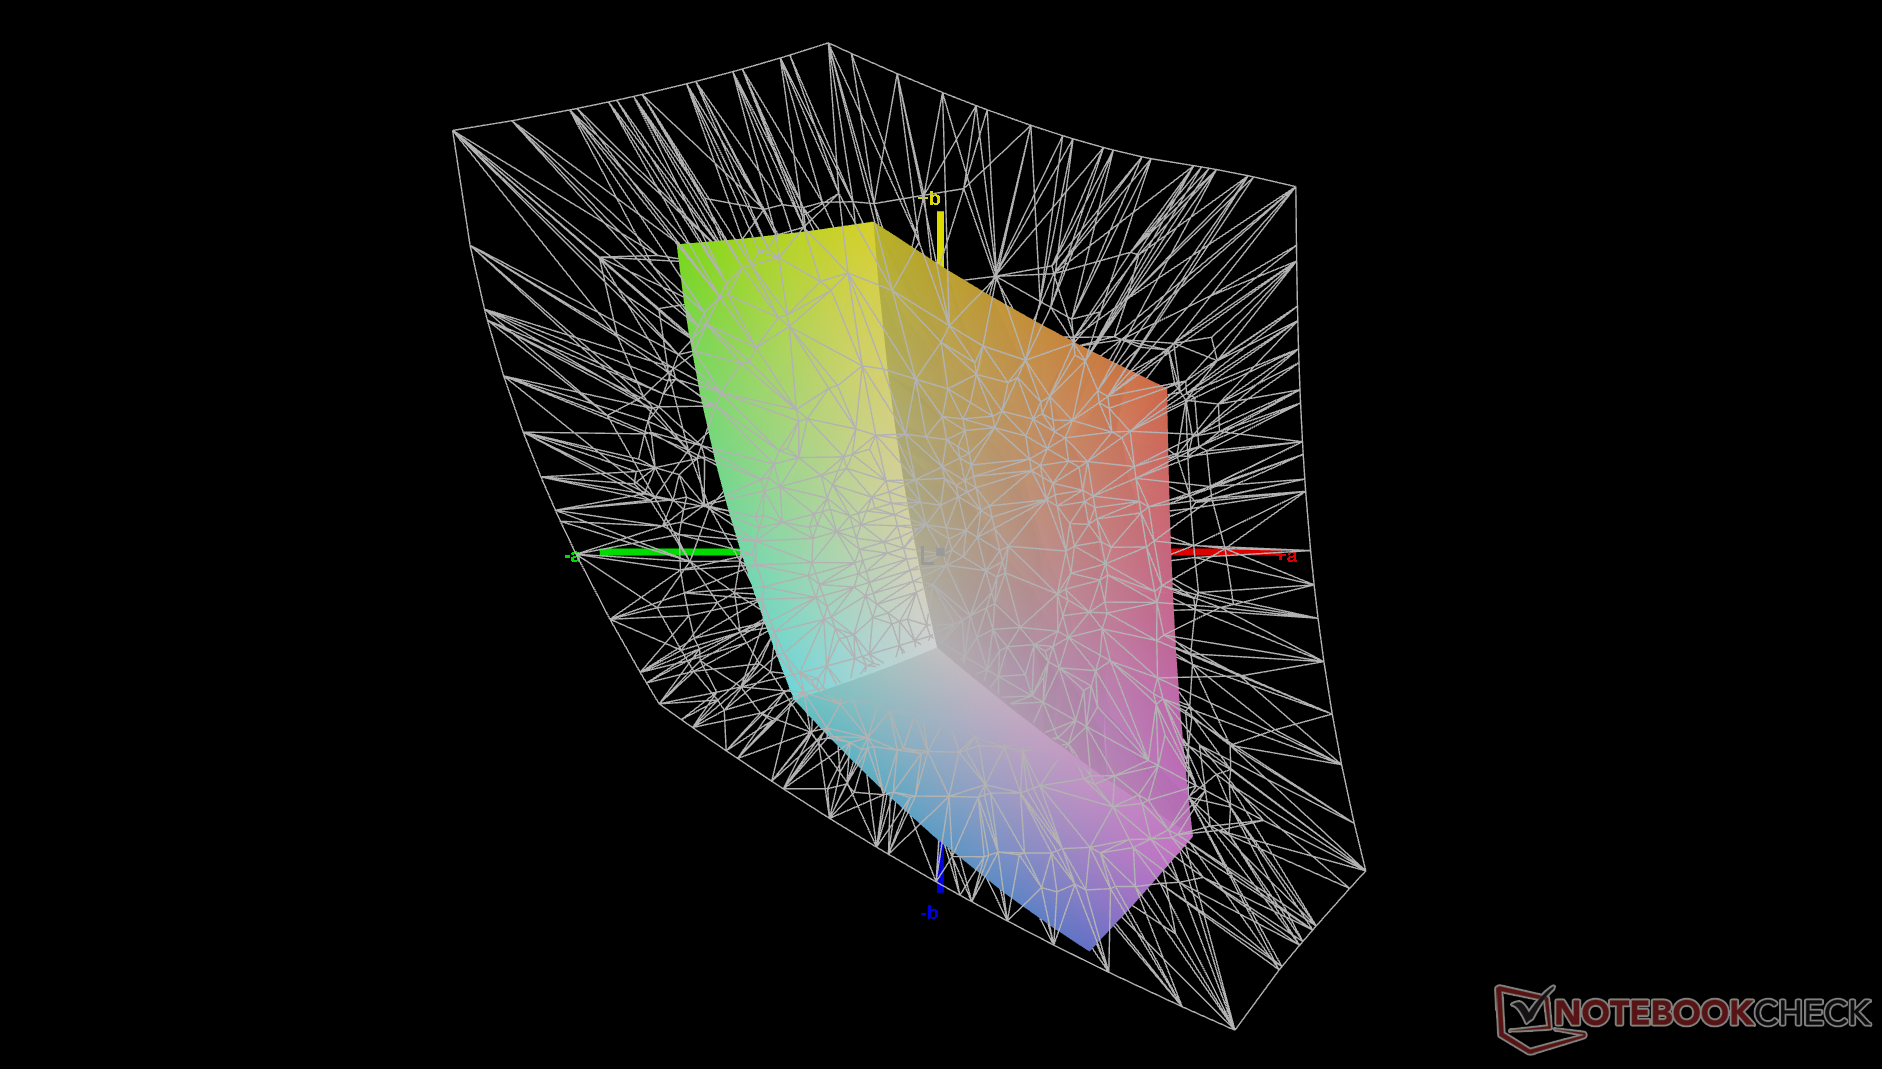
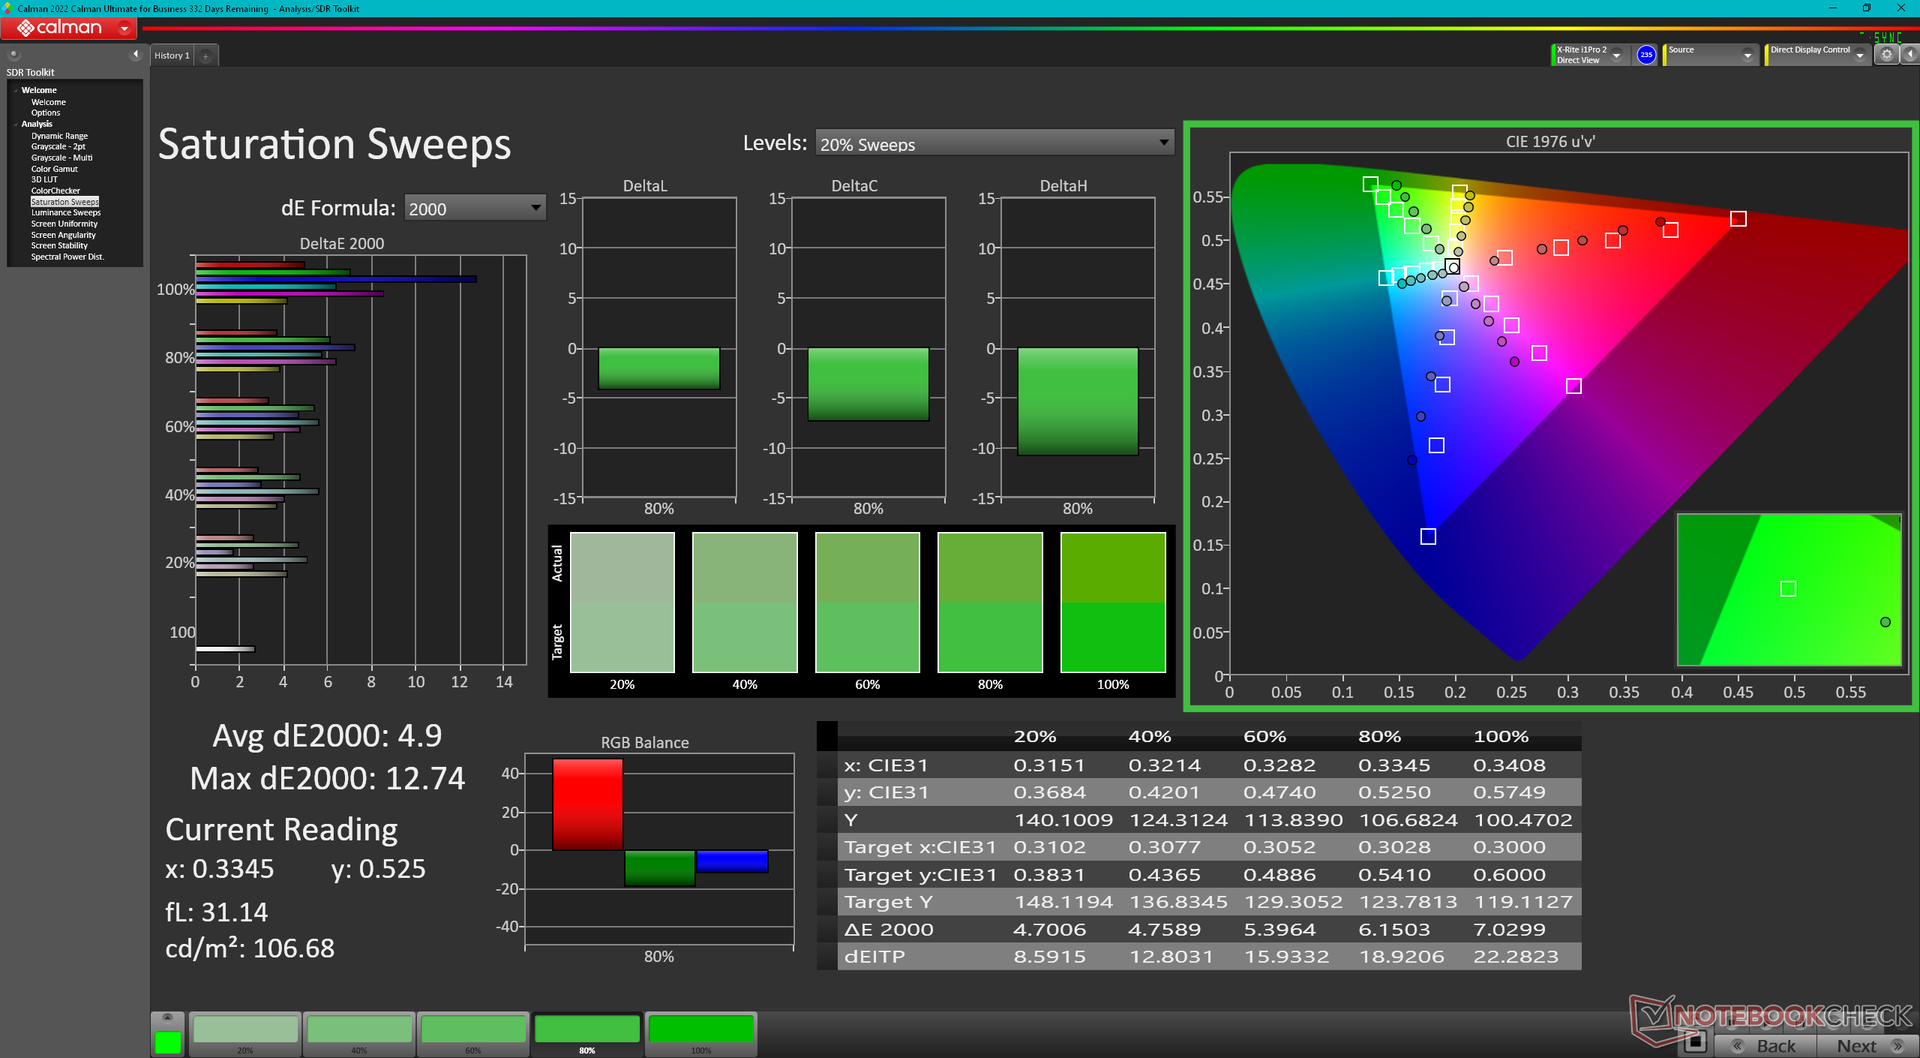
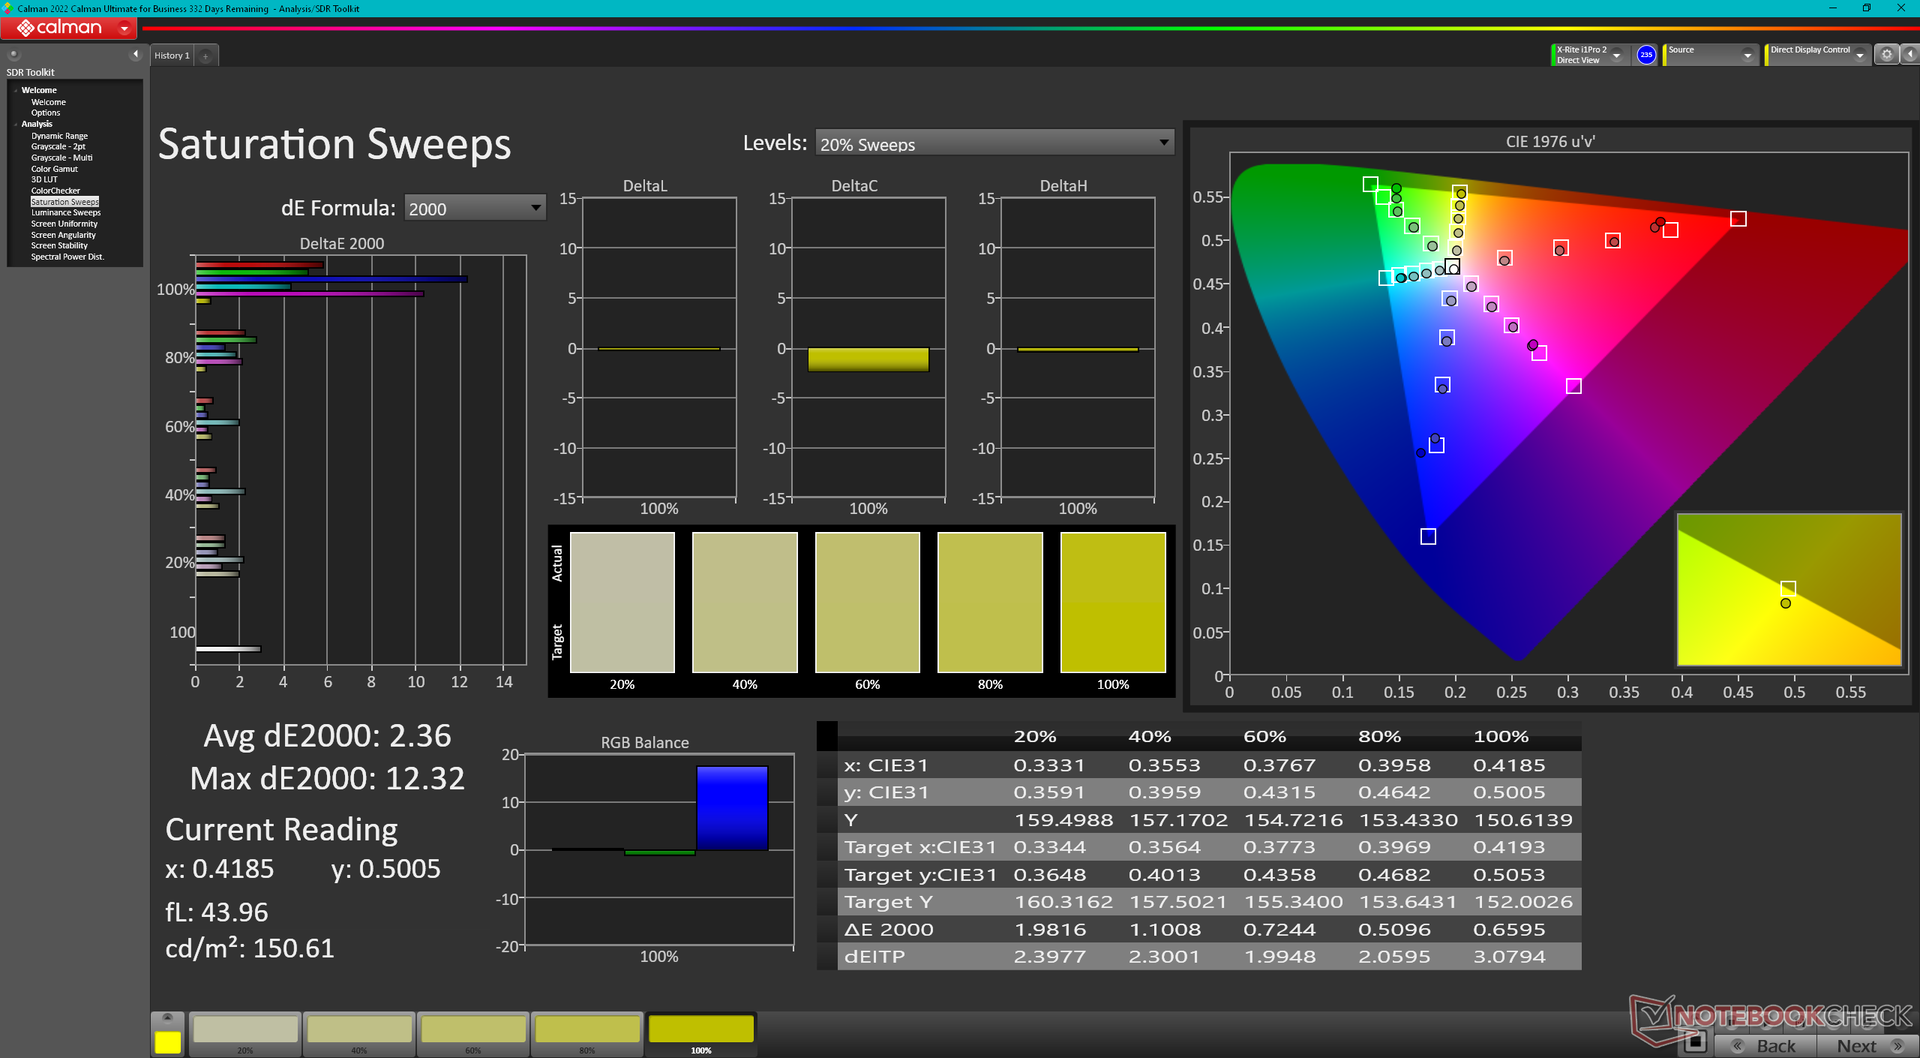
Ekranın bir X-Rite renk ölçer ile kalibre edilmesi, ortalama gri tonlama ve renk deltaE değerlerini sırasıyla 3,2 ve 3,73'ten 2,2 ve 2,03'e hafifçe iyileştirecektir. Ancak, yukarıda bahsedilen dar sRGB renk kapsamı nedeniyle ne olursa olsun renkler daha yüksek doygunluk seviyelerinde giderek daha hatalı hale gelmektedir.
Yanıt Sürelerini Görüntüle
| ↔ Tepki Süresi Siyahtan Beyaza | ||
|---|---|---|
| 27.6 ms ... yükseliş ↗ ve sonbahar↘ birleşimi | ↗ 12.9 ms yükseliş | 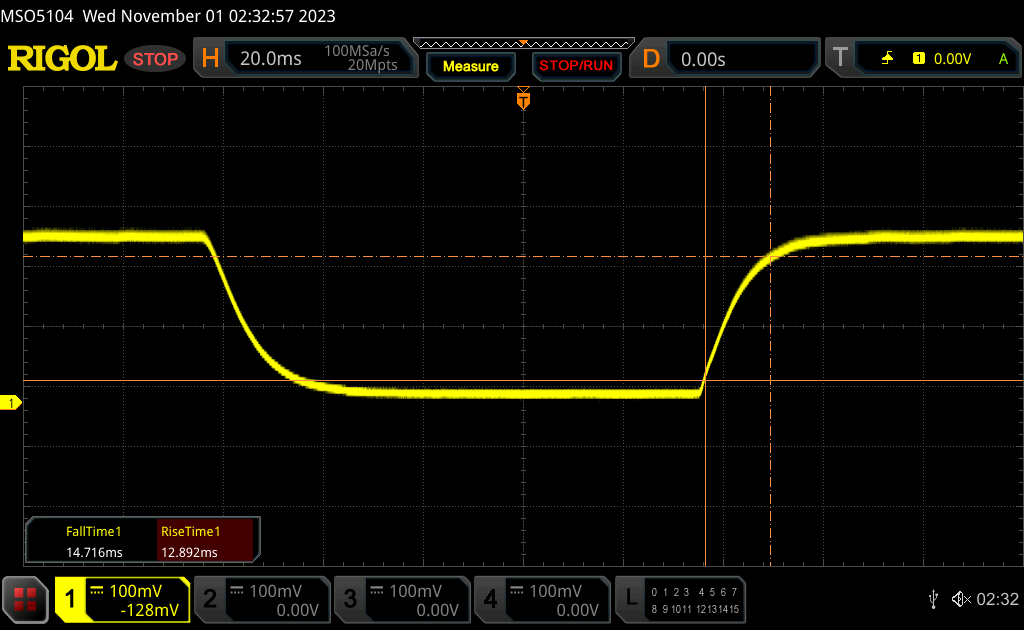 |
| ↘ 14.7 ms sonbahar | ||
| Ekran, testlerimizde nispeten yavaş yanıt oranları gösteriyor ve oyuncular için çok yavaş olabilir. Karşılaştırıldığında, test edilen tüm cihazlar 0.1 (minimum) ile 240 (maksimum) ms arasında değişir. » Tüm cihazların 70 %'si daha iyi. Bu, ölçülen yanıt süresinin test edilen tüm cihazların ortalamasından (19.8 ms) daha kötü olduğu anlamına gelir. | ||
| ↔ Tepki Süresi %50 Griden %80 Griye | ||
| 46.4 ms ... yükseliş ↗ ve sonbahar↘ birleşimi | ↗ 19.5 ms yükseliş | 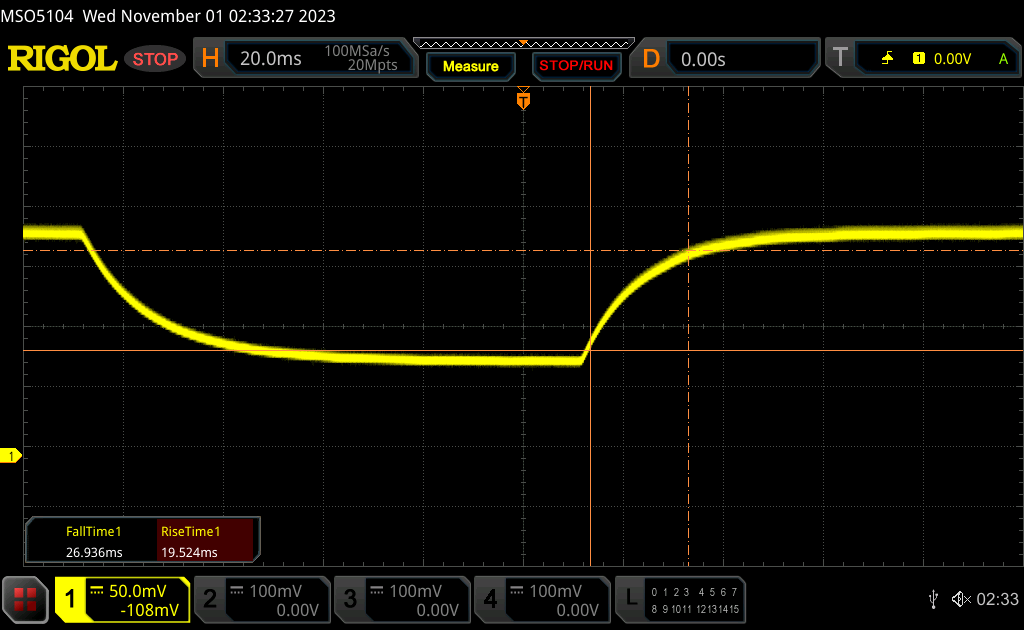 |
| ↘ 26.9 ms sonbahar | ||
| Ekran, testlerimizde yavaş yanıt oranları gösteriyor ve oyuncular için yetersiz olacaktır. Karşılaştırıldığında, test edilen tüm cihazlar 0.165 (minimum) ile 636 (maksimum) ms arasında değişir. » Tüm cihazların 80 %'si daha iyi. Bu, ölçülen yanıt süresinin test edilen tüm cihazların ortalamasından (31 ms) daha kötü olduğu anlamına gelir. | ||
Ekran Titremesi / PWM (Darbe Genişliği Modülasyonu)
| Ekran titriyor / PWM algılanmadı | 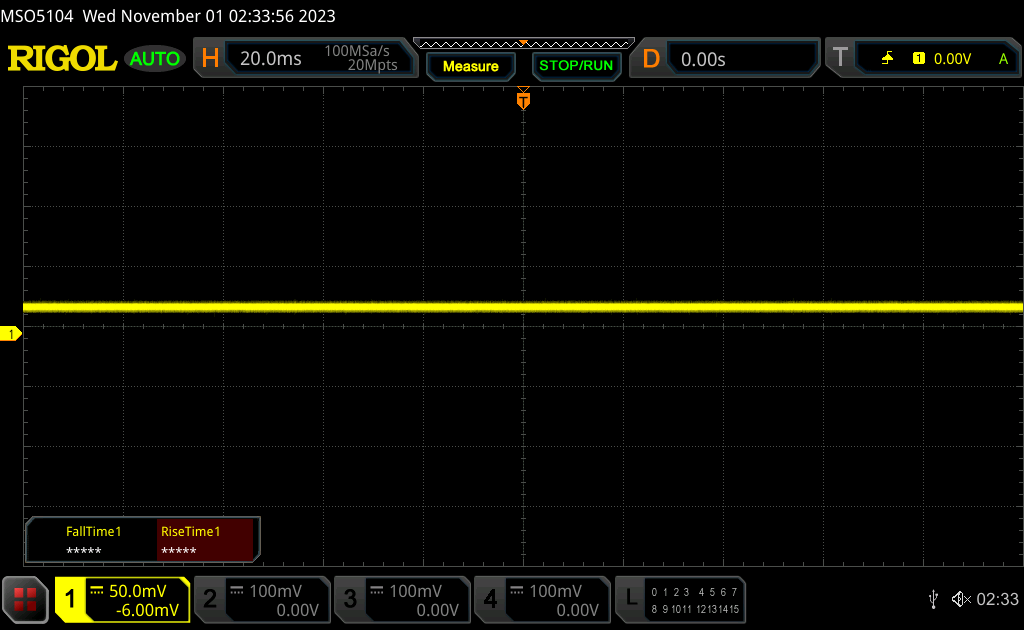 | ||
Karşılaştırıldığında: Test edilen tüm cihazların %52 %'si ekranı karartmak için PWM kullanmıyor. PWM tespit edilirse, ortalama 7757 (minimum: 5 - maksimum: 343500) Hz ölçüldü. | |||
Performans
Test Koşulları
Aşağıdaki kıyaslamaları çalıştırmadan önce Windows'u Performans moduna ayarladık. Lenovo'ya özgü özellikler ve BIOS güncellemelerinin merkezi olduğu için kullanıcılar yerleşik Vantage yazılımına aşina olmalıdır.


İşlemci
Diğer Core i5 ve Core i7 CPU'ların aksine Core i5-1335U daha pahalı bir ürüne çok daha yakın bir performans sergiliyor Core i7-1355U başlangıçta beklenenden daha yavaş. Benchmark'lar Core i5-1335U'yu Core i7-1355U'dan sadece yüzde 5 ila 10 daha yavaş olarak sıralamaktadır, yani küçük CPU performans açığını önemsemiyorsanız Core i5 konfigürasyonunu tercih ederek kendinize birkaç yüz dolar kazandırabilirsiniz. Core i7 seçeneğini seçmenin en büyük nedeni, aşağıdaki GPU Performansı bölümünde gösterildiği gibi entegre grafikleriyle ilgilidir.
Core i7 ile karşılaştırıldığında Ryzen 7 7730U versiyonunda, Intel Core i5 versiyonumuz çoklu iş parçacığı performansında yaklaşık yüzde 10 ila 15 daha yavaşken, tek iş parçacığı performansı açısından bunun tam tersi geçerlidir.
Cinebench R15 Multi Loop
Cinebench R23: Multi Core | Single Core
Cinebench R20: CPU (Multi Core) | CPU (Single Core)
Cinebench R15: CPU Multi 64Bit | CPU Single 64Bit
Blender: v2.79 BMW27 CPU
7-Zip 18.03: 7z b 4 | 7z b 4 -mmt1
Geekbench 5.5: Multi-Core | Single-Core
HWBOT x265 Benchmark v2.2: 4k Preset
LibreOffice : 20 Documents To PDF
R Benchmark 2.5: Overall mean
| HWBOT x265 Benchmark v2.2 / 4k Preset | |
| Acer Swift Edge SFE16 Ryzen 7 7840U | |
| Lenovo Yoga 7-14ARB G7 | |
| Samsung Galaxy Book3 Pro 16 | |
| Acer TravelMate P4 TMP416-51-55KN | |
| Lenovo ThinkPad E16 G1-21JUS08X00 | |
| Dell Inspiron 16 7635 2-in-1 | |
| Microsoft Surface Laptop 5 15, i7-1255U | |
| Lenovo ThinkPad T16 G2 21HH003AGE | |
| Lenovo ThinkPad E16 G1 Core i5-1335U | |
| Lenovo ThinkPad T14s G3 21BR00CDGE | |
| Ortalama Intel Core i5-1335U (6.55 - 10.7, n=11) | |
| LG Gram 16Z90Q | |
| Lenovo V17 G2 ITL-82NX00EUGE | |
| R Benchmark 2.5 / Overall mean | |
| Lenovo V17 G2 ITL-82NX00EUGE | |
| LG Gram 16Z90Q | |
| Dell Inspiron 16 7635 2-in-1 | |
| Acer TravelMate P4 TMP416-51-55KN | |
| Lenovo ThinkPad E16 G1-21JUS08X00 | |
| Ortalama Intel Core i5-1335U (0.4892 - 0.524, n=10) | |
| Lenovo Yoga 7-14ARB G7 | |
| Samsung Galaxy Book3 Pro 16 | |
| Lenovo ThinkPad T14s G3 21BR00CDGE | |
| Microsoft Surface Laptop 5 15, i7-1255U | |
| Lenovo ThinkPad T16 G2 21HH003AGE | |
| Acer Swift Edge SFE16 Ryzen 7 7840U | |
Cinebench R23: Multi Core | Single Core
Cinebench R20: CPU (Multi Core) | CPU (Single Core)
Cinebench R15: CPU Multi 64Bit | CPU Single 64Bit
Blender: v2.79 BMW27 CPU
7-Zip 18.03: 7z b 4 | 7z b 4 -mmt1
Geekbench 5.5: Multi-Core | Single-Core
HWBOT x265 Benchmark v2.2: 4k Preset
LibreOffice : 20 Documents To PDF
R Benchmark 2.5: Overall mean
* ... daha küçük daha iyidir
AIDA64: FP32 Ray-Trace | FPU Julia | CPU SHA3 | CPU Queen | FPU SinJulia | FPU Mandel | CPU AES | CPU ZLib | FP64 Ray-Trace | CPU PhotoWorxx
| Performance rating | |
| Lenovo ThinkPad E16 G1-21JUS08X00 | |
| Samsung Galaxy Book3 Pro 16 | |
| Dell Inspiron 16 7635 2-in-1 | |
| Acer TravelMate P4 TMP416-51-55KN | |
| Lenovo ThinkPad E16 G1 Core i5-1335U | |
| Ortalama Intel Core i5-1335U | |
| LG Gram 16Z90Q | |
| AIDA64 / FP32 Ray-Trace | |
| Lenovo ThinkPad E16 G1-21JUS08X00 | |
| Dell Inspiron 16 7635 2-in-1 | |
| Acer TravelMate P4 TMP416-51-55KN | |
| Samsung Galaxy Book3 Pro 16 | |
| Lenovo ThinkPad E16 G1 Core i5-1335U | |
| Ortalama Intel Core i5-1335U (5661 - 7809, n=11) | |
| LG Gram 16Z90Q | |
| AIDA64 / FPU Julia | |
| Lenovo ThinkPad E16 G1-21JUS08X00 | |
| Dell Inspiron 16 7635 2-in-1 | |
| Samsung Galaxy Book3 Pro 16 | |
| Acer TravelMate P4 TMP416-51-55KN | |
| Lenovo ThinkPad E16 G1 Core i5-1335U | |
| Ortalama Intel Core i5-1335U (29483 - 43636, n=11) | |
| LG Gram 16Z90Q | |
| AIDA64 / CPU SHA3 | |
| Samsung Galaxy Book3 Pro 16 | |
| Lenovo ThinkPad E16 G1-21JUS08X00 | |
| Acer TravelMate P4 TMP416-51-55KN | |
| Lenovo ThinkPad E16 G1 Core i5-1335U | |
| Dell Inspiron 16 7635 2-in-1 | |
| Ortalama Intel Core i5-1335U (1515 - 2278, n=11) | |
| LG Gram 16Z90Q | |
| AIDA64 / CPU Queen | |
| Lenovo ThinkPad E16 G1-21JUS08X00 | |
| Samsung Galaxy Book3 Pro 16 | |
| Acer TravelMate P4 TMP416-51-55KN | |
| LG Gram 16Z90Q | |
| Dell Inspiron 16 7635 2-in-1 | |
| Lenovo ThinkPad E16 G1 Core i5-1335U | |
| Ortalama Intel Core i5-1335U (53839 - 60992, n=11) | |
| AIDA64 / FPU SinJulia | |
| Lenovo ThinkPad E16 G1-21JUS08X00 | |
| Dell Inspiron 16 7635 2-in-1 | |
| Samsung Galaxy Book3 Pro 16 | |
| Acer TravelMate P4 TMP416-51-55KN | |
| Lenovo ThinkPad E16 G1 Core i5-1335U | |
| LG Gram 16Z90Q | |
| Ortalama Intel Core i5-1335U (3873 - 5008, n=11) | |
| AIDA64 / FPU Mandel | |
| Lenovo ThinkPad E16 G1-21JUS08X00 | |
| Dell Inspiron 16 7635 2-in-1 | |
| Samsung Galaxy Book3 Pro 16 | |
| Acer TravelMate P4 TMP416-51-55KN | |
| Lenovo ThinkPad E16 G1 Core i5-1335U | |
| Ortalama Intel Core i5-1335U (14376 - 20553, n=11) | |
| LG Gram 16Z90Q | |
| AIDA64 / CPU AES | |
| Samsung Galaxy Book3 Pro 16 | |
| Acer TravelMate P4 TMP416-51-55KN | |
| Lenovo ThinkPad E16 G1 Core i5-1335U | |
| Lenovo ThinkPad E16 G1-21JUS08X00 | |
| Ortalama Intel Core i5-1335U (31154 - 65997, n=11) | |
| Dell Inspiron 16 7635 2-in-1 | |
| LG Gram 16Z90Q | |
| AIDA64 / CPU ZLib | |
| Samsung Galaxy Book3 Pro 16 | |
| Acer TravelMate P4 TMP416-51-55KN | |
| Lenovo ThinkPad E16 G1 Core i5-1335U | |
| Lenovo ThinkPad E16 G1-21JUS08X00 | |
| Dell Inspiron 16 7635 2-in-1 | |
| Ortalama Intel Core i5-1335U (378 - 676, n=11) | |
| LG Gram 16Z90Q | |
| AIDA64 / FP64 Ray-Trace | |
| Lenovo ThinkPad E16 G1-21JUS08X00 | |
| Dell Inspiron 16 7635 2-in-1 | |
| Acer TravelMate P4 TMP416-51-55KN | |
| Samsung Galaxy Book3 Pro 16 | |
| Lenovo ThinkPad E16 G1 Core i5-1335U | |
| LG Gram 16Z90Q | |
| Ortalama Intel Core i5-1335U (2878 - 4214, n=11) | |
| AIDA64 / CPU PhotoWorxx | |
| Samsung Galaxy Book3 Pro 16 | |
| LG Gram 16Z90Q | |
| Ortalama Intel Core i5-1335U (13584 - 41123, n=11) | |
| Acer TravelMate P4 TMP416-51-55KN | |
| Lenovo ThinkPad E16 G1 Core i5-1335U | |
| Dell Inspiron 16 7635 2-in-1 | |
| Lenovo ThinkPad E16 G1-21JUS08X00 | |
Sistem Performansı
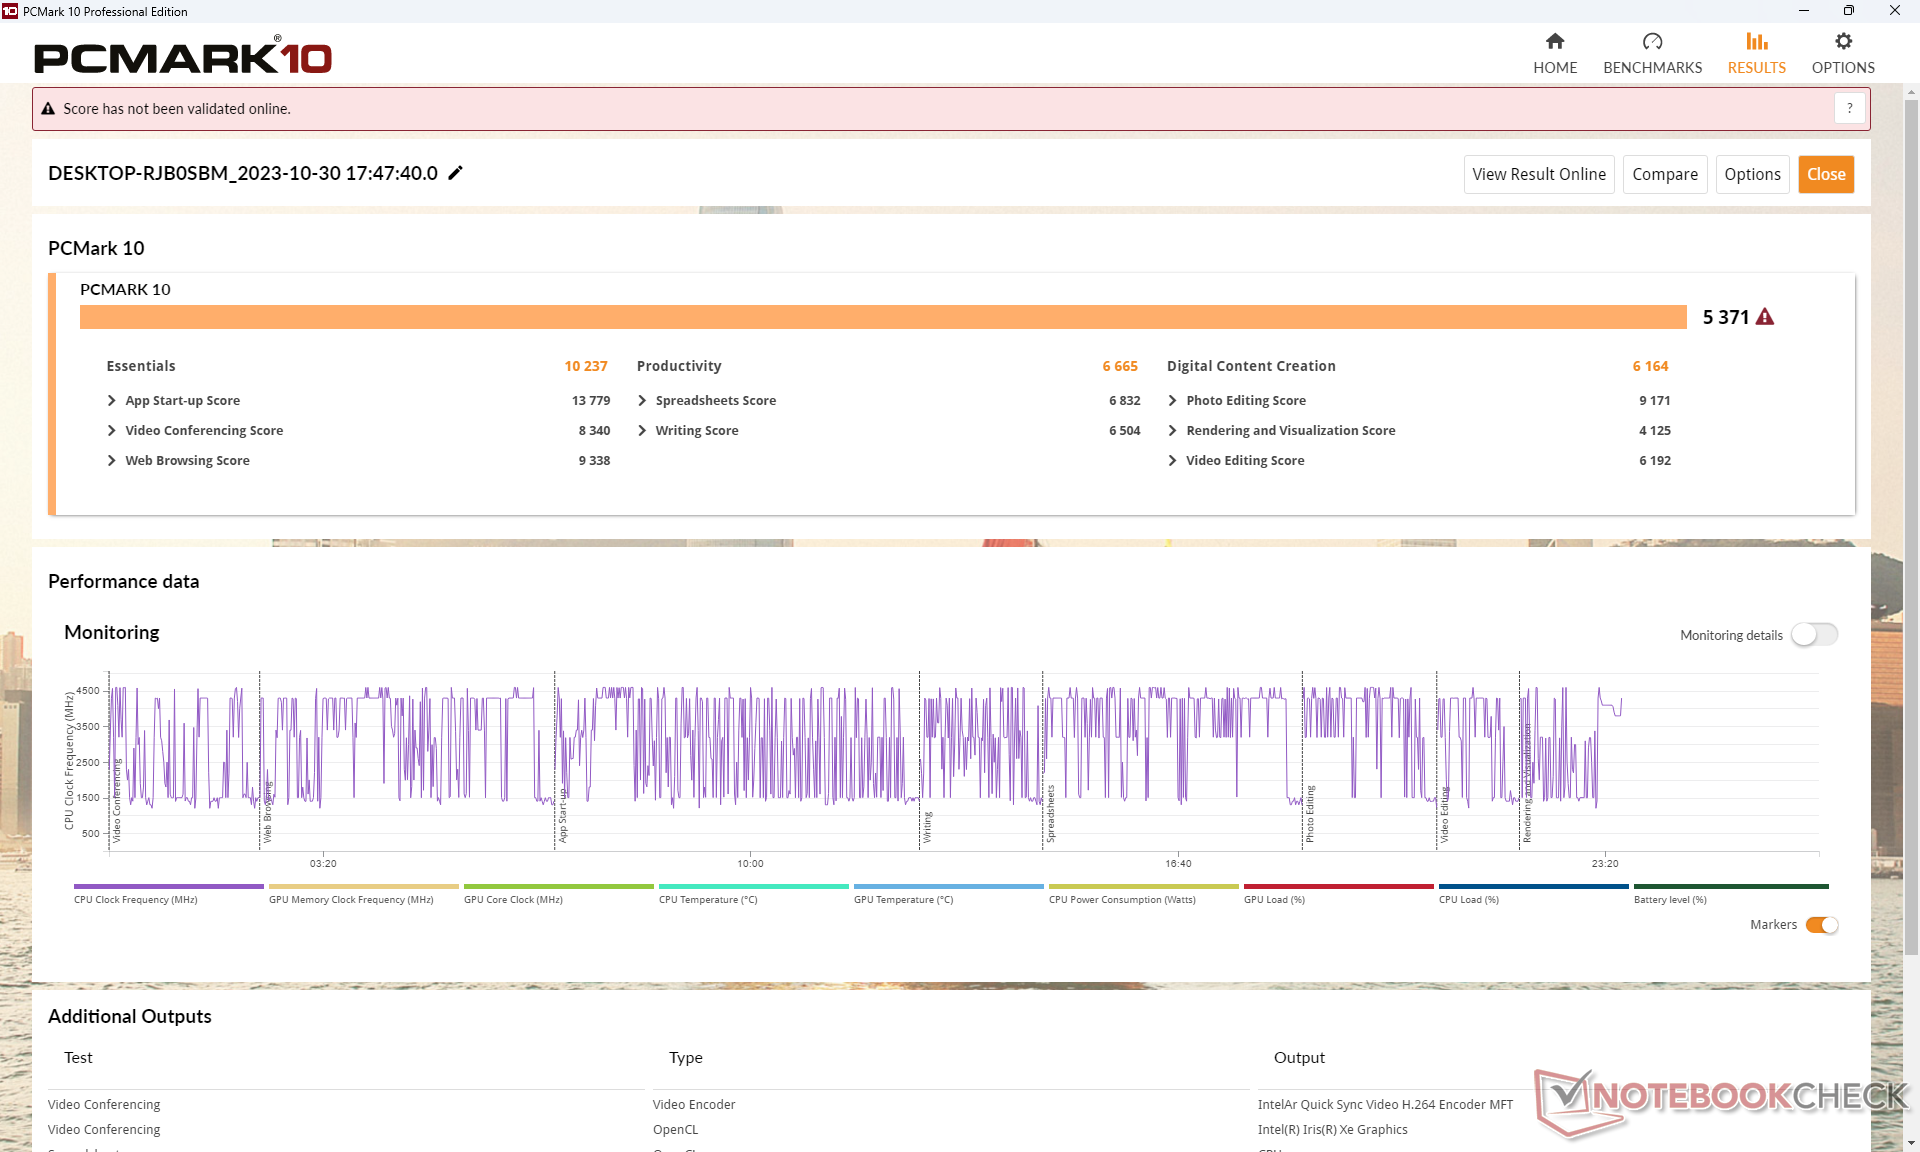
PCMark sonuçları, Ryzen 7 7730U'nun Core i5-1335U'ya göre üstün çoklu iş parçacığı performansı nedeniyle Verimlilik alt testi dışında Ryzen 7 AMD alternatifiyle başa baş.
CrossMark: Overall | Productivity | Creativity | Responsiveness
| PCMark 10 / Score | |
| Dell Inspiron 16 7635 2-in-1 | |
| Lenovo ThinkPad E16 G1-21JUS08X00 | |
| Samsung Galaxy Book3 Pro 16 | |
| Lenovo ThinkPad E16 G1 Core i5-1335U | |
| Ortalama Intel Core i5-1335U, Intel Iris Xe Graphics G7 80EUs (5068 - 5600, n=11) | |
| Acer TravelMate P4 TMP416-51-55KN | |
| LG Gram 16Z90Q | |
| PCMark 10 / Essentials | |
| Dell Inspiron 16 7635 2-in-1 | |
| Samsung Galaxy Book3 Pro 16 | |
| Lenovo ThinkPad E16 G1-21JUS08X00 | |
| Ortalama Intel Core i5-1335U, Intel Iris Xe Graphics G7 80EUs (9828 - 11912, n=11) | |
| Lenovo ThinkPad E16 G1 Core i5-1335U | |
| LG Gram 16Z90Q | |
| Acer TravelMate P4 TMP416-51-55KN | |
| PCMark 10 / Productivity | |
| Dell Inspiron 16 7635 2-in-1 | |
| Lenovo ThinkPad E16 G1-21JUS08X00 | |
| Ortalama Intel Core i5-1335U, Intel Iris Xe Graphics G7 80EUs (6196 - 7261, n=11) | |
| Acer TravelMate P4 TMP416-51-55KN | |
| Samsung Galaxy Book3 Pro 16 | |
| Lenovo ThinkPad E16 G1 Core i5-1335U | |
| LG Gram 16Z90Q | |
| PCMark 10 / Digital Content Creation | |
| Samsung Galaxy Book3 Pro 16 | |
| Acer TravelMate P4 TMP416-51-55KN | |
| Lenovo ThinkPad E16 G1 Core i5-1335U | |
| Lenovo ThinkPad E16 G1-21JUS08X00 | |
| LG Gram 16Z90Q | |
| Dell Inspiron 16 7635 2-in-1 | |
| Ortalama Intel Core i5-1335U, Intel Iris Xe Graphics G7 80EUs (5361 - 6164, n=11) | |
| CrossMark / Overall | |
| Samsung Galaxy Book3 Pro 16 | |
| Acer TravelMate P4 TMP416-51-55KN | |
| Ortalama Intel Core i5-1335U, Intel Iris Xe Graphics G7 80EUs (1339 - 1599, n=11) | |
| Lenovo ThinkPad E16 G1 Core i5-1335U | |
| Lenovo ThinkPad E16 G1-21JUS08X00 | |
| Dell Inspiron 16 7635 2-in-1 | |
| CrossMark / Productivity | |
| Samsung Galaxy Book3 Pro 16 | |
| Acer TravelMate P4 TMP416-51-55KN | |
| Ortalama Intel Core i5-1335U, Intel Iris Xe Graphics G7 80EUs (1337 - 1638, n=11) | |
| Lenovo ThinkPad E16 G1 Core i5-1335U | |
| Lenovo ThinkPad E16 G1-21JUS08X00 | |
| Dell Inspiron 16 7635 2-in-1 | |
| CrossMark / Creativity | |
| Samsung Galaxy Book3 Pro 16 | |
| Acer TravelMate P4 TMP416-51-55KN | |
| Ortalama Intel Core i5-1335U, Intel Iris Xe Graphics G7 80EUs (1315 - 1620, n=11) | |
| Lenovo ThinkPad E16 G1 Core i5-1335U | |
| Lenovo ThinkPad E16 G1-21JUS08X00 | |
| Dell Inspiron 16 7635 2-in-1 | |
| CrossMark / Responsiveness | |
| Acer TravelMate P4 TMP416-51-55KN | |
| Samsung Galaxy Book3 Pro 16 | |
| Ortalama Intel Core i5-1335U, Intel Iris Xe Graphics G7 80EUs (1023 - 1868, n=11) | |
| Lenovo ThinkPad E16 G1 Core i5-1335U | |
| Lenovo ThinkPad E16 G1-21JUS08X00 | |
| Dell Inspiron 16 7635 2-in-1 | |
| PCMark 10 Score | 5371 puan | |
Yardım | ||
| AIDA64 / Memory Copy | |
| LG Gram 16Z90Q | |
| Samsung Galaxy Book3 Pro 16 | |
| Ortalama Intel Core i5-1335U (22417 - 60884, n=11) | |
| Acer TravelMate P4 TMP416-51-55KN | |
| Dell Inspiron 16 7635 2-in-1 | |
| Lenovo ThinkPad E16 G1 Core i5-1335U | |
| Lenovo ThinkPad E16 G1-21JUS08X00 | |
| AIDA64 / Memory Read | |
| LG Gram 16Z90Q | |
| Samsung Galaxy Book3 Pro 16 | |
| Acer TravelMate P4 TMP416-51-55KN | |
| Ortalama Intel Core i5-1335U (23104 - 61555, n=11) | |
| Dell Inspiron 16 7635 2-in-1 | |
| Lenovo ThinkPad E16 G1-21JUS08X00 | |
| Lenovo ThinkPad E16 G1 Core i5-1335U | |
| AIDA64 / Memory Write | |
| Samsung Galaxy Book3 Pro 16 | |
| LG Gram 16Z90Q | |
| Ortalama Intel Core i5-1335U (22936 - 72584, n=11) | |
| Acer TravelMate P4 TMP416-51-55KN | |
| Lenovo ThinkPad E16 G1 Core i5-1335U | |
| Dell Inspiron 16 7635 2-in-1 | |
| Lenovo ThinkPad E16 G1-21JUS08X00 | |
| AIDA64 / Memory Latency | |
| Dell Inspiron 16 7635 2-in-1 | |
| LG Gram 16Z90Q | |
| Ortalama Intel Core i5-1335U (78.6 - 112.8, n=11) | |
| Samsung Galaxy Book3 Pro 16 | |
| Lenovo ThinkPad E16 G1-21JUS08X00 | |
| Lenovo ThinkPad E16 G1 Core i5-1335U | |
| Acer TravelMate P4 TMP416-51-55KN | |
* ... daha küçük daha iyidir
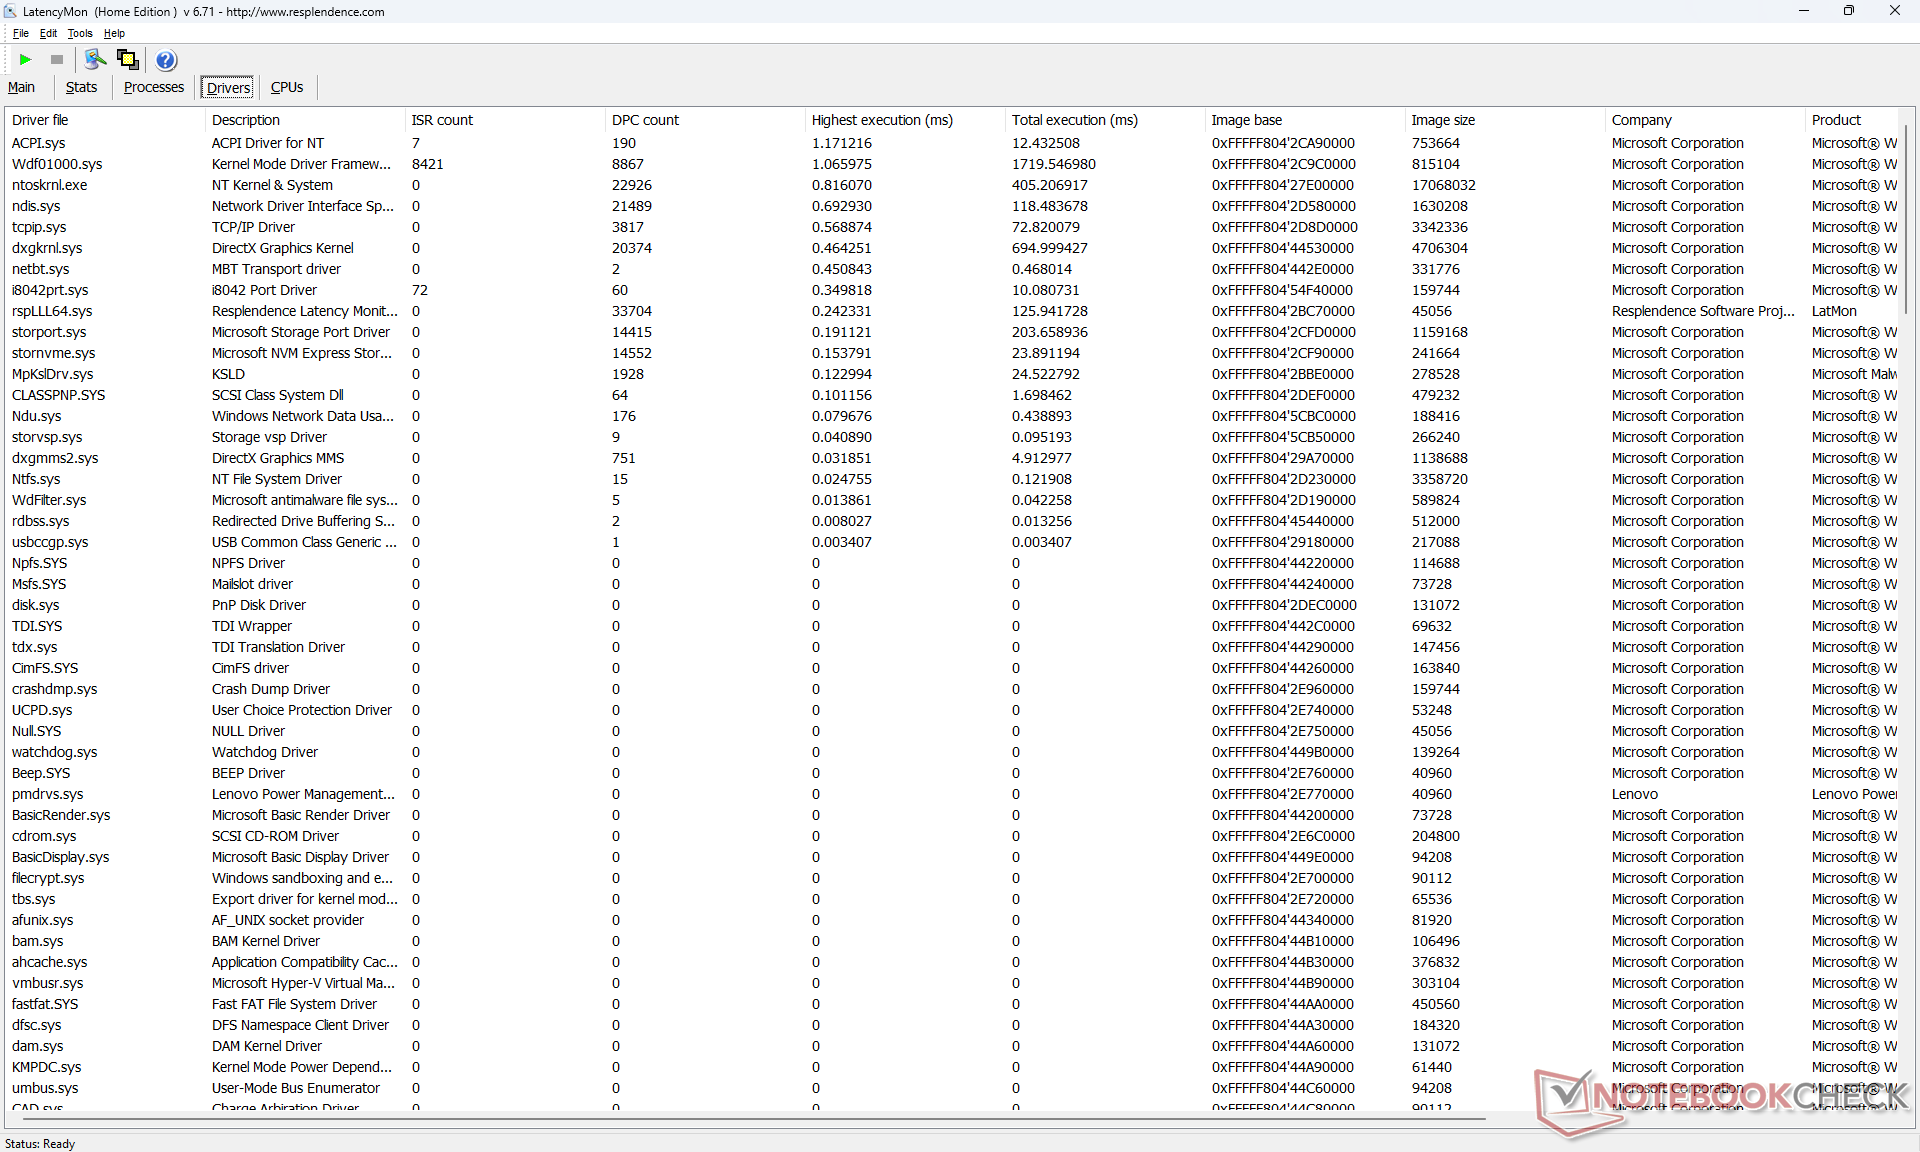
DPC Gecikme Süresi
LatencyMon, ana sayfamızın birden fazla tarayıcı sekmesini açarken yalnızca küçük DPC sorunlarını ortaya çıkarır. 60 FPS'de 4K video oynatma, kaydedilen hiçbir kare düşmesi olmadan mükemmel şekilde pürüzsüzdür.

| DPC Latencies / LatencyMon - interrupt to process latency (max), Web, Youtube, Prime95 | |
| Acer TravelMate P4 TMP416-51-55KN | |
| LG Gram 16Z90Q | |
| Lenovo ThinkPad E16 G1-21JUS08X00 | |
| Lenovo ThinkPad E16 G1 Core i5-1335U | |
| Dell Inspiron 16 7635 2-in-1 | |
| Samsung Galaxy Book3 Pro 16 | |
* ... daha küçük daha iyidir
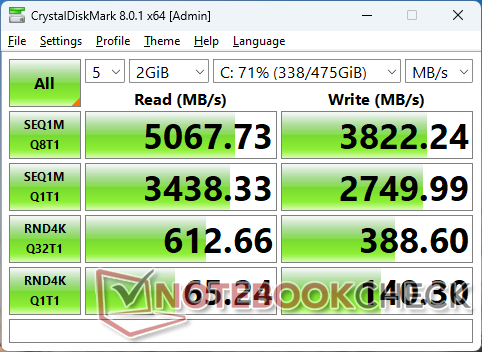
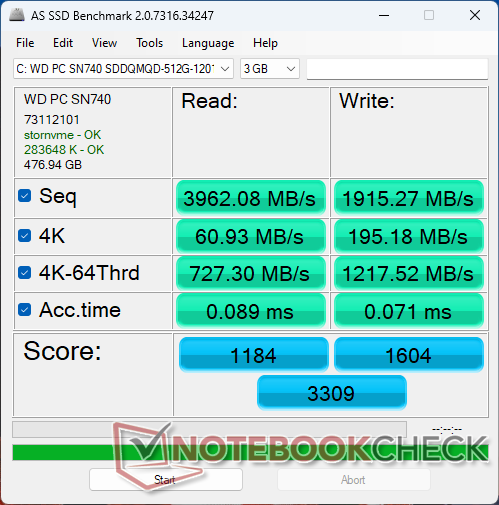
Depolama Cihazları
Test ünitemiz şunları içerir Western Digital SN740 bu orta seviye PCIe4 x4 NVMe SSD, sırasıyla 5100 MB/sn ve 3900 MB/sn'ye varan gerçek dünya sıralı okuma ve yazma hızları sunmaktadır. 2242 sürücüsü, herhangi bir termal ped veya soğutma yardımcısı olmamasına rağmen bu maksimum hızları korumakta hiçbir sorun yaşamayacaktır.

* ... daha küçük daha iyidir
Disk Throttling: DiskSpd Read Loop, Queue Depth 8
GPU Performansı
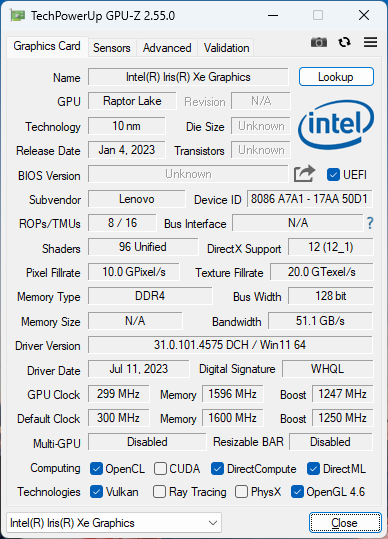
Bizim entegre Iris Xe 80 EUs biraz daha yavaş olmasa da aynı GPU'ya sahip diğer dizüstü bilgisayarlara göre olmasını beklediğimiz performansı gösteriyor. Iris Xe 96 EUs ile Core i7 yapılandırmasına yükseltme veya GeForce MX550 performansı sırasıyla yaklaşık yüzde 25 ila 30 veya yüzde 70 ila 100 oranında artıracaktır.
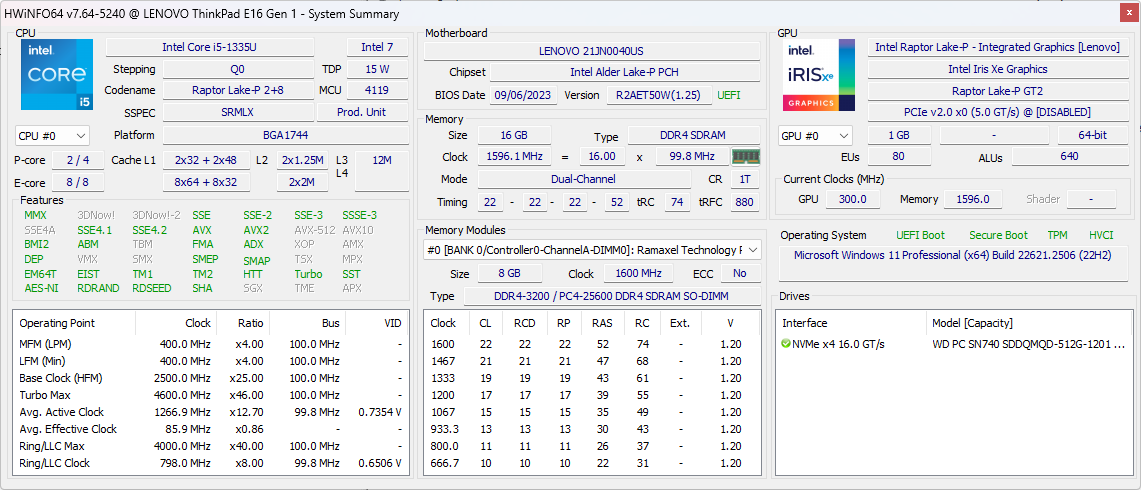
Çift kanallı RAM ile yapılandırdığınızdan emin olun, aksi takdirde iGPU performansı önemli ölçüde düşer.
| 3DMark Performance rating - Percent | |
| Acer Swift Edge SFE16 Ryzen 7 7840U -1! | |
| Lenovo Yoga 7-14ARB G7 | |
| Lenovo ThinkPad T14 G3-21AJS00400 -1! | |
| Microsoft Surface Laptop 5 15, i7-1255U -1! | |
| LG Gram 16Z90Q | |
| Lenovo ThinkPad T16 G2 21HH003AGE | |
| Lenovo V17 G2 ITL-82NX00EUGE | |
| Samsung Galaxy Book3 Pro 16 | |
| Acer TravelMate P4 TMP416-51-55KN | |
| Lenovo ThinkPad T14s G3 21BR00CDGE | |
| Dell Inspiron 16 7635 2-in-1 -1! | |
| Lenovo ThinkPad E16 G1-21JUS08X00 -1! | |
| Ortalama Intel Iris Xe Graphics G7 80EUs | |
| Lenovo ThinkPad E16 G1 Core i5-1335U | |
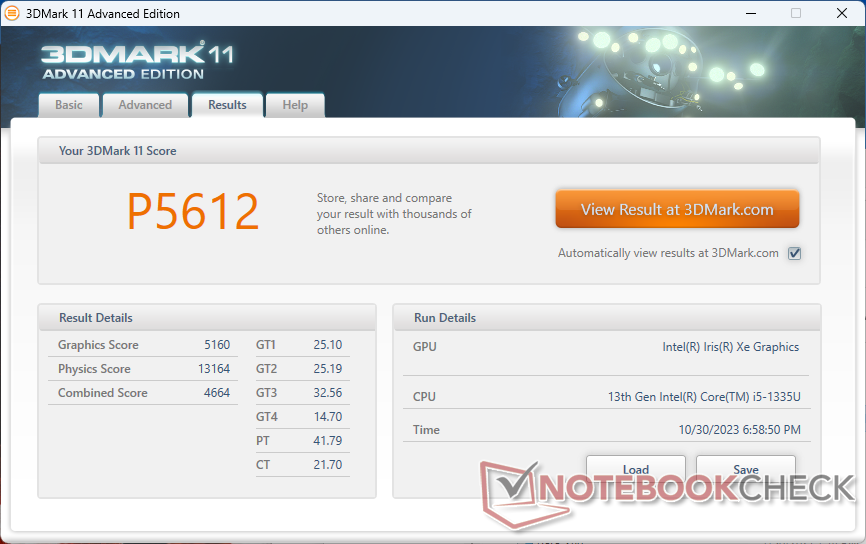
| 3DMark 11 Performance | 5612 puan | |
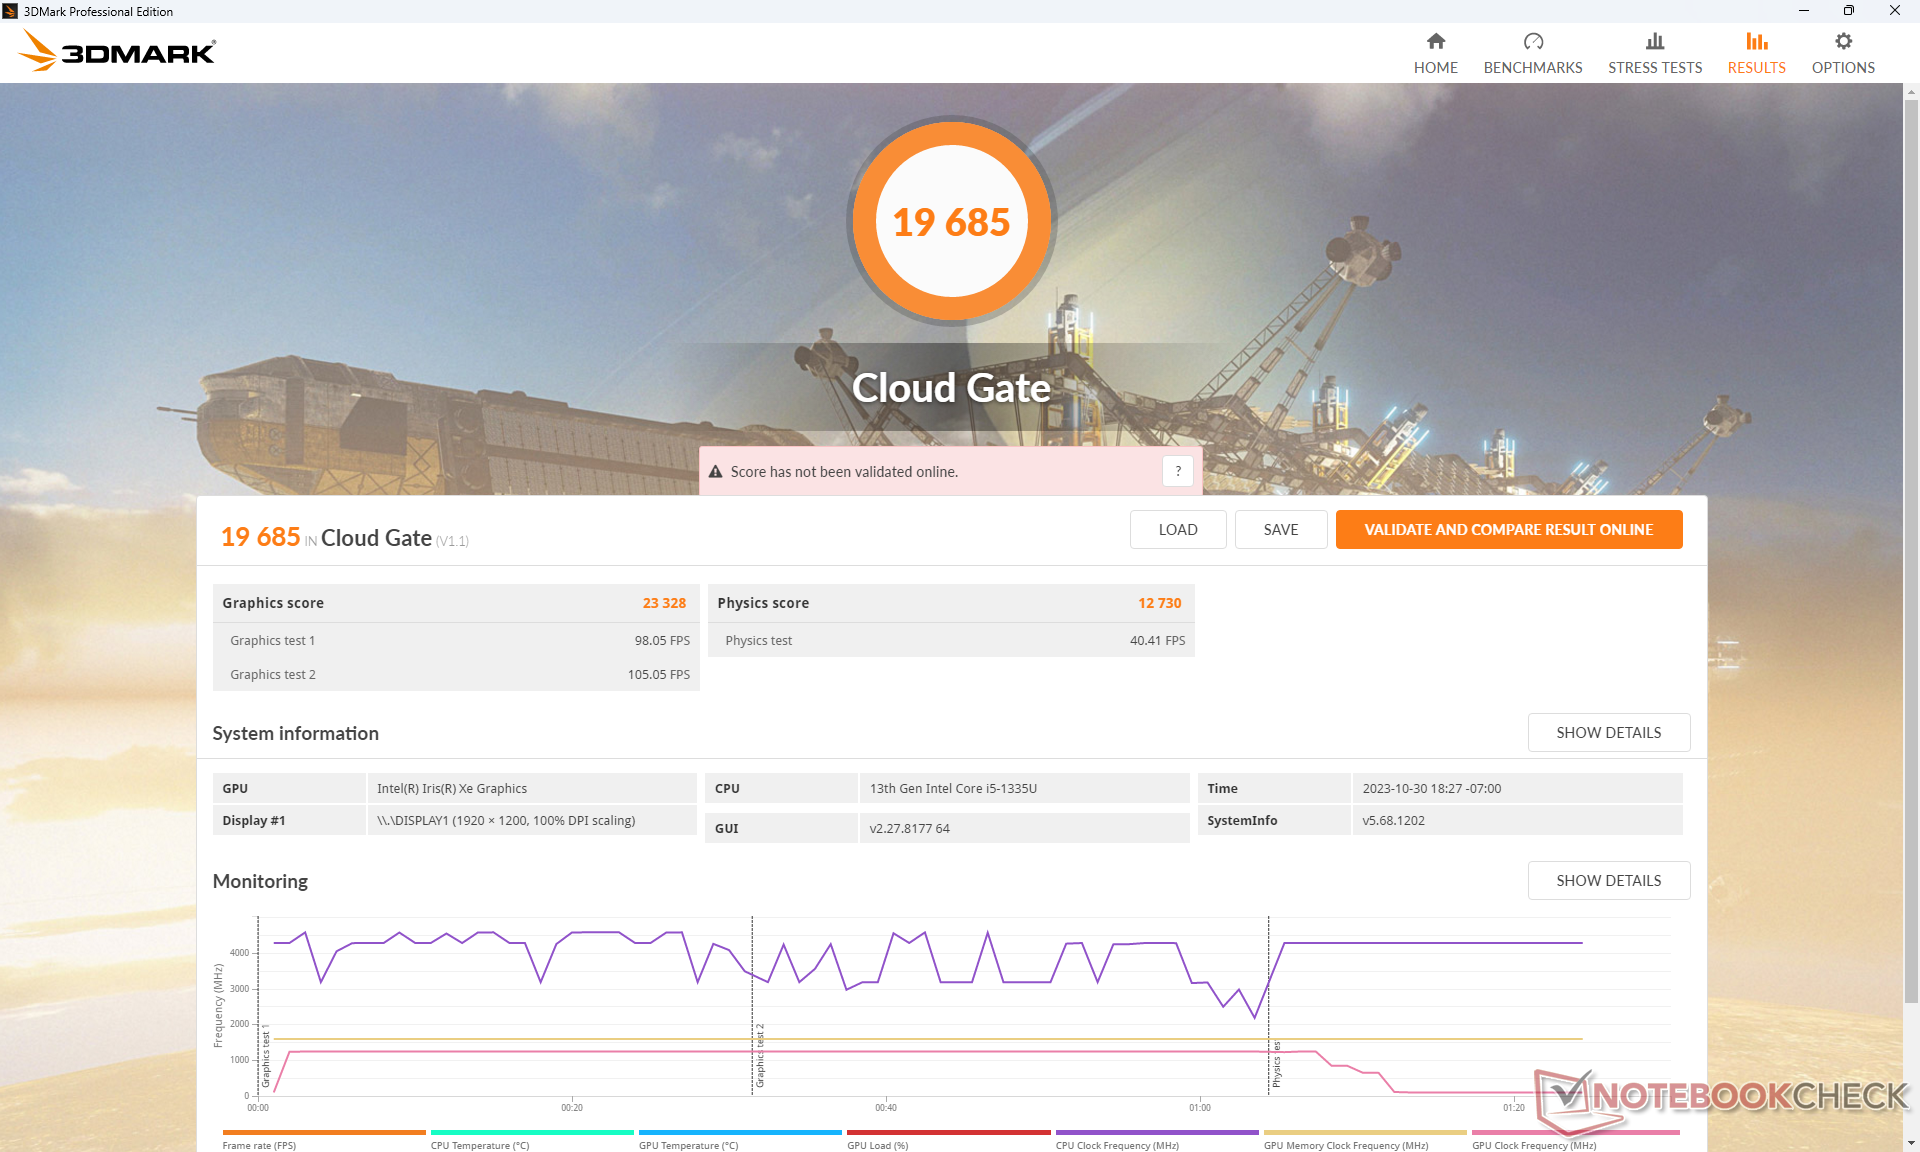
| 3DMark Cloud Gate Standard Score | 19685 puan | |
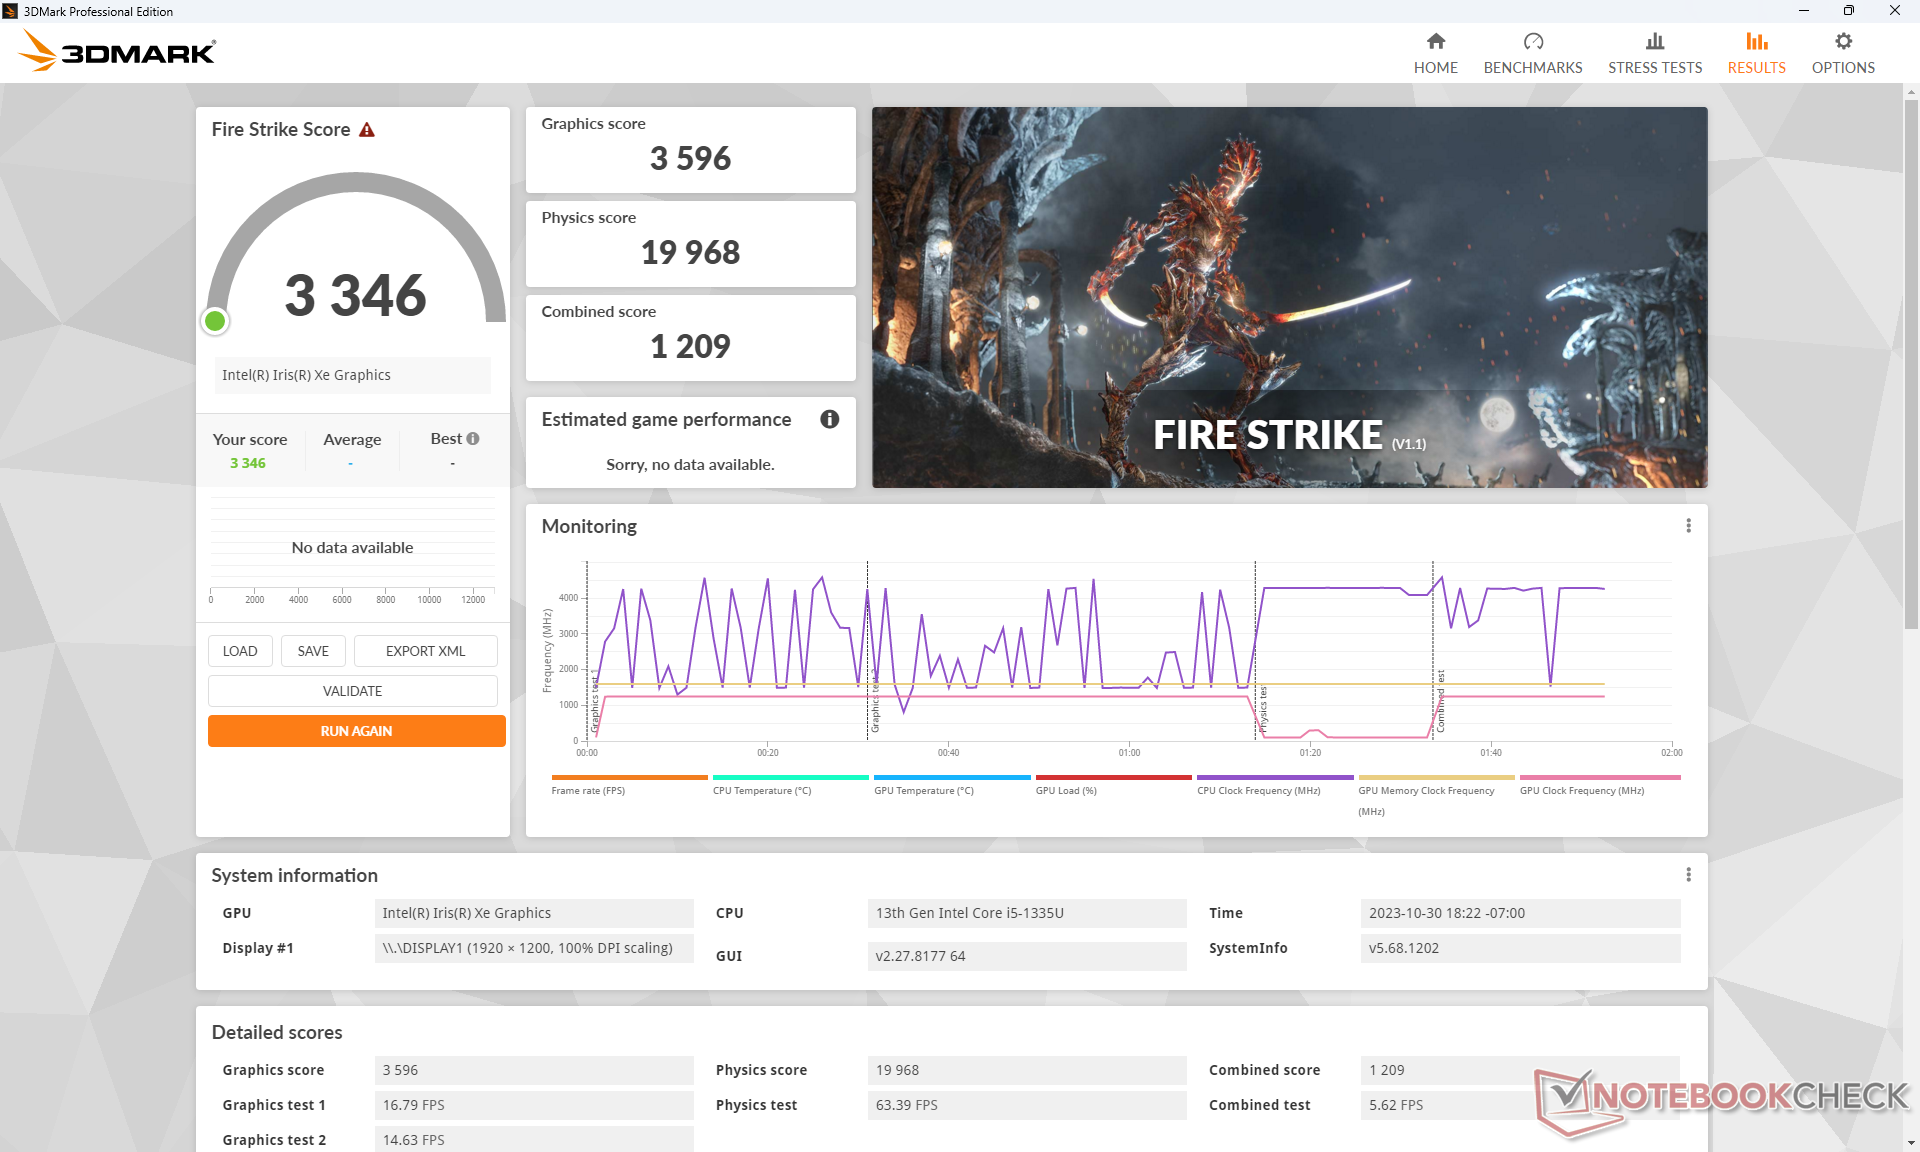
| 3DMark Fire Strike Score | 3346 puan | |
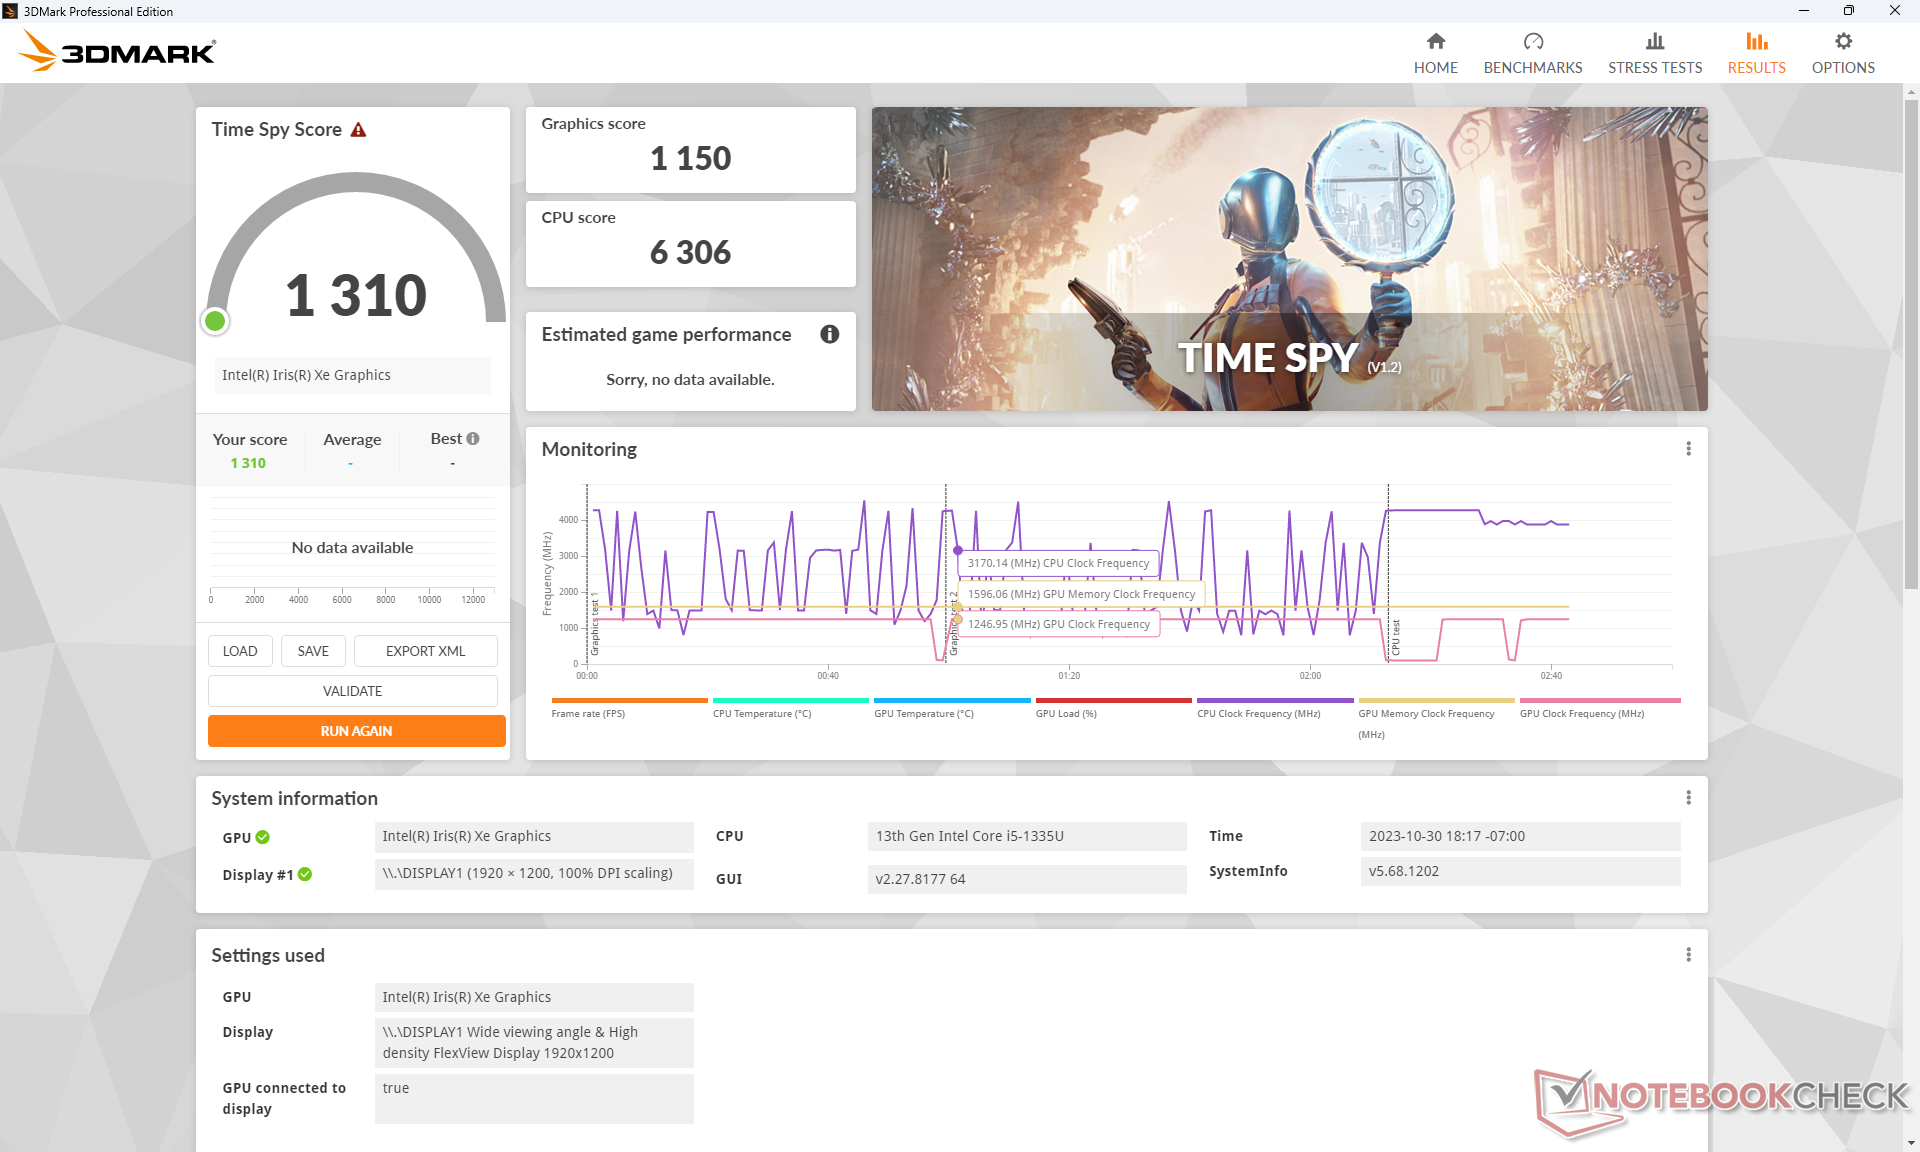
| 3DMark Time Spy Score | 1310 puan | |
Yardım | ||
* ... daha küçük daha iyidir
| Cyberpunk 2077 1.6 | |
| 1280x720 Low Preset | |
| Acer Swift Edge SFE16 Ryzen 7 7840U | |
| Dell Inspiron 16 7635 2-in-1 | |
| Dell Inspiron 16 7635 2-in-1 | |
| Ortalama Intel Iris Xe Graphics G7 80EUs (24 - 31.2, n=4) | |
| Lenovo ThinkPad E16 G1 Core i5-1335U | |
| 1920x1080 Low Preset | |
| Lenovo Yoga 7-14ARB G7 | |
| Acer Swift Edge SFE16 Ryzen 7 7840U | |
| Dell Inspiron 16 7635 2-in-1 | |
| Ortalama Intel Iris Xe Graphics G7 80EUs (9.1 - 17.8, n=7) | |
| Lenovo ThinkPad E16 G1 Core i5-1335U | |
Witcher 3 adresinde rölantide çalışırken kare hızları, testin başlangıcında arka plandaki bazı faaliyetlerin kesintiye uğradığını gösterecek şekilde oldukça düşüyordu. Neyse ki bu durum testin geri kalanında bir daha yaşanmadı.
Witcher 3 FPS Chart
| düşük | orta | yüksek | ultra | |
|---|---|---|---|---|
| GTA V (2015) | 84.5 | 68.8 | 13.2 | 5.41 |
| The Witcher 3 (2015) | 73.6 | 45.1 | 22.1 | 11.1 |
| Dota 2 Reborn (2015) | 100.7 | 75.2 | 49.2 | 45 |
| Final Fantasy XV Benchmark (2018) | 31 | 16.9 | 12.1 | |
| X-Plane 11.11 (2018) | 28.6 | 22.5 | 21 | |
| Far Cry 5 (2018) | 40 | 19 | 18 | 17 |
| Strange Brigade (2018) | 70.3 | 27.3 | 22.4 | 18.3 |
| Cyberpunk 2077 1.6 (2022) | 14.1 | |||
| Tiny Tina's Wonderlands (2022) | 20.6 | 15.3 | 10.4 | 8.1 |
| F1 22 (2022) | 32.8 | 29.1 | 21.3 | 16.5 |
Emisyonlar
Sistem Gürültüsü
Fan gürültüsü, muhtemelen Intel versiyonumuzun daha yüksek güç talepleri nedeniyle Ryzen 7 versiyonunda deneyimlediğimizden daha yüksek. AMD versiyonu, stres uygulandığında daha uzun süreler boyunca daha sessiz kalabiliyor. Örneğin 3DMark 06'yı çalıştırırken, Intel versiyonumuzdaki neredeyse 33 dB(A) ile karşılaştırıldığında, fan gürültüsü 25 dB(A)'nın biraz altında nispeten sessiz kalacaktır.
Ses yüksekliği
| Boşta |
| 24.6 / 24.6 / 24.6 dB |
| Çalışırken |
| 32.7 / 39.2 dB |
 | ||
30 dB sessiz 40 dB(A) duyulabilirlik 50 dB(A) gürültülü |
||
min: | ||
| Lenovo ThinkPad E16 G1 Core i5-1335U Iris Xe G7 80EUs, i5-1335U | Lenovo ThinkPad E16 G1-21JUS08X00 Vega 8, R7 7730U, WD PC SN740 SDDPNQD-1T00 | Dell Inspiron 16 7635 2-in-1 Vega 7, R5 7530U, Kioxia BG5 KBG50ZNS512G | Acer TravelMate P4 TMP416-51-55KN Iris Xe G7 80EUs, i5-1240P, Micron 2450 512GB MTFDKBA512TFK | Samsung Galaxy Book3 Pro 16 Iris Xe G7 80EUs, i5-1340P, WD PC SN740 256GB SDDPNQD-256G | LG Gram 16Z90Q Iris Xe G7 96EUs, i7-1260P, Samsung PM9A1 MZVL21T0HCLR | |
|---|---|---|---|---|---|---|
| Noise | 11% | -7% | -10% | -14% | -7% | |
| kapalı / ortam * (dB) | 24.6 | 22.4 9% | 23.6 4% | 25.4 -3% | 25.2 -2% | 25 -2% |
| Idle Minimum * (dB) | 24.6 | 22.4 9% | 23.6 4% | 25.4 -3% | 25.2 -2% | 26 -6% |
| Idle Average * (dB) | 24.6 | 22.4 9% | 23.6 4% | 25.4 -3% | 25.2 -2% | 27 -10% |
| Idle Maximum * (dB) | 24.6 | 23.7 4% | 23.6 4% | 25.4 -3% | 29.3 -19% | 28 -14% |
| Load Average * (dB) | 32.7 | 24.8 24% | 40.3 -23% | 43.9 -34% | 46.4 -42% | 38 -16% |
| Witcher 3 ultra * (dB) | 34.7 | 29.8 14% | 44.2 -27% | 37 -7% | ||
| Load Maximum * (dB) | 39.2 | 36.1 8% | 44.2 -13% | 43.7 -11% | 46.4 -18% | 38 3% |
* ... daha küçük daha iyidir
Sıcaklık
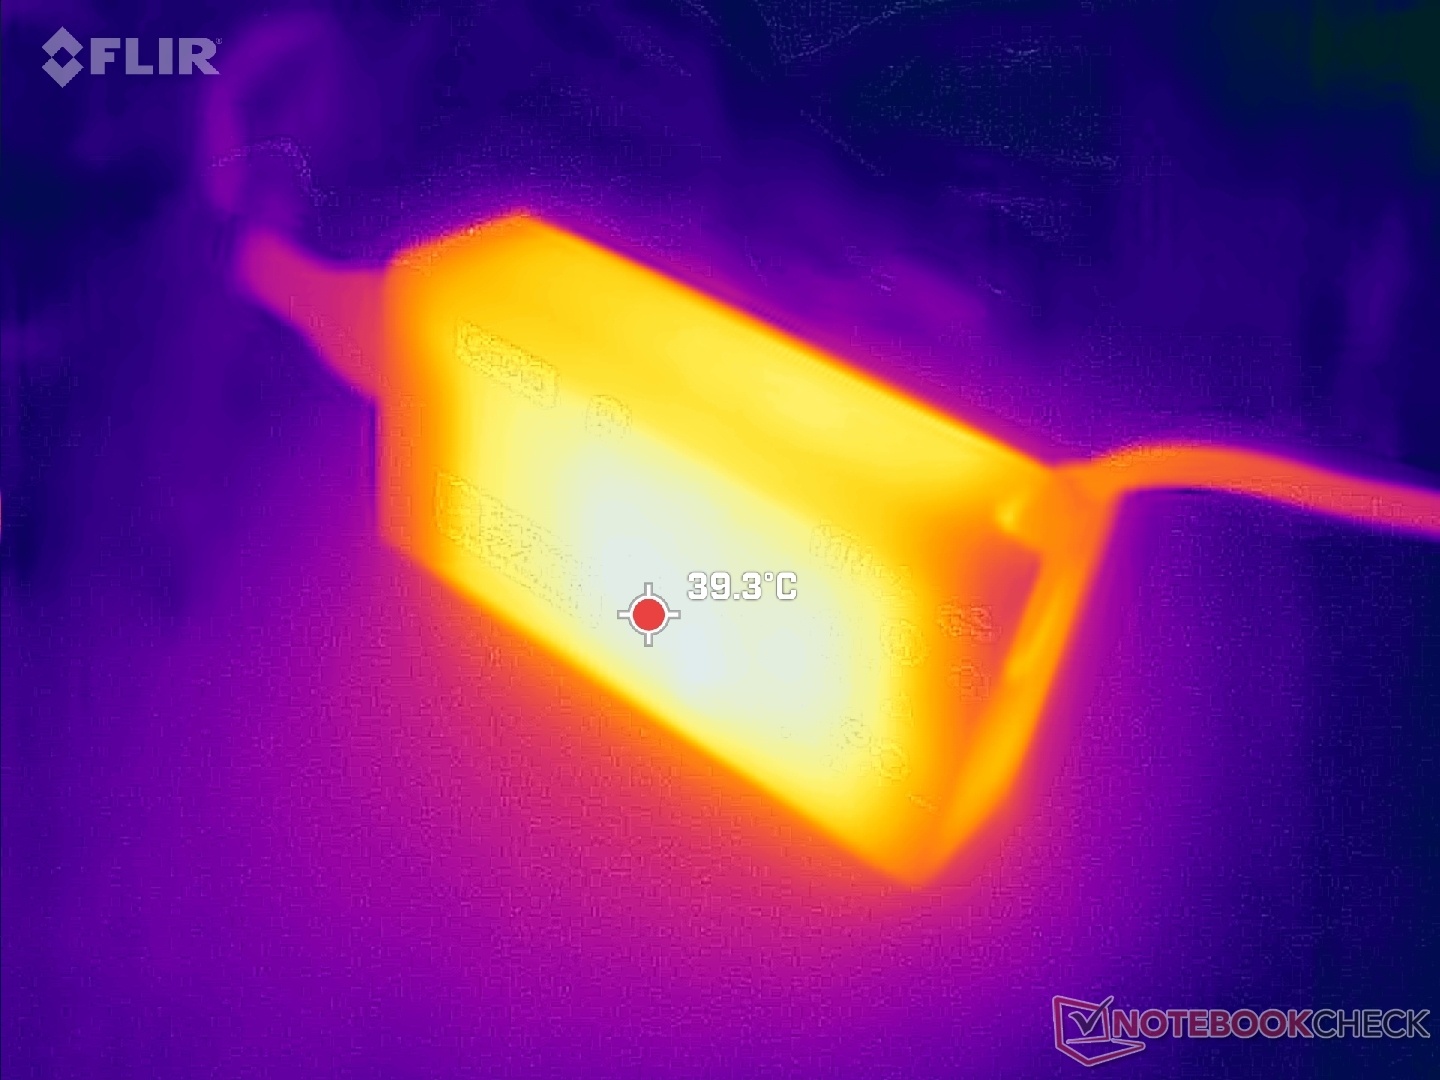
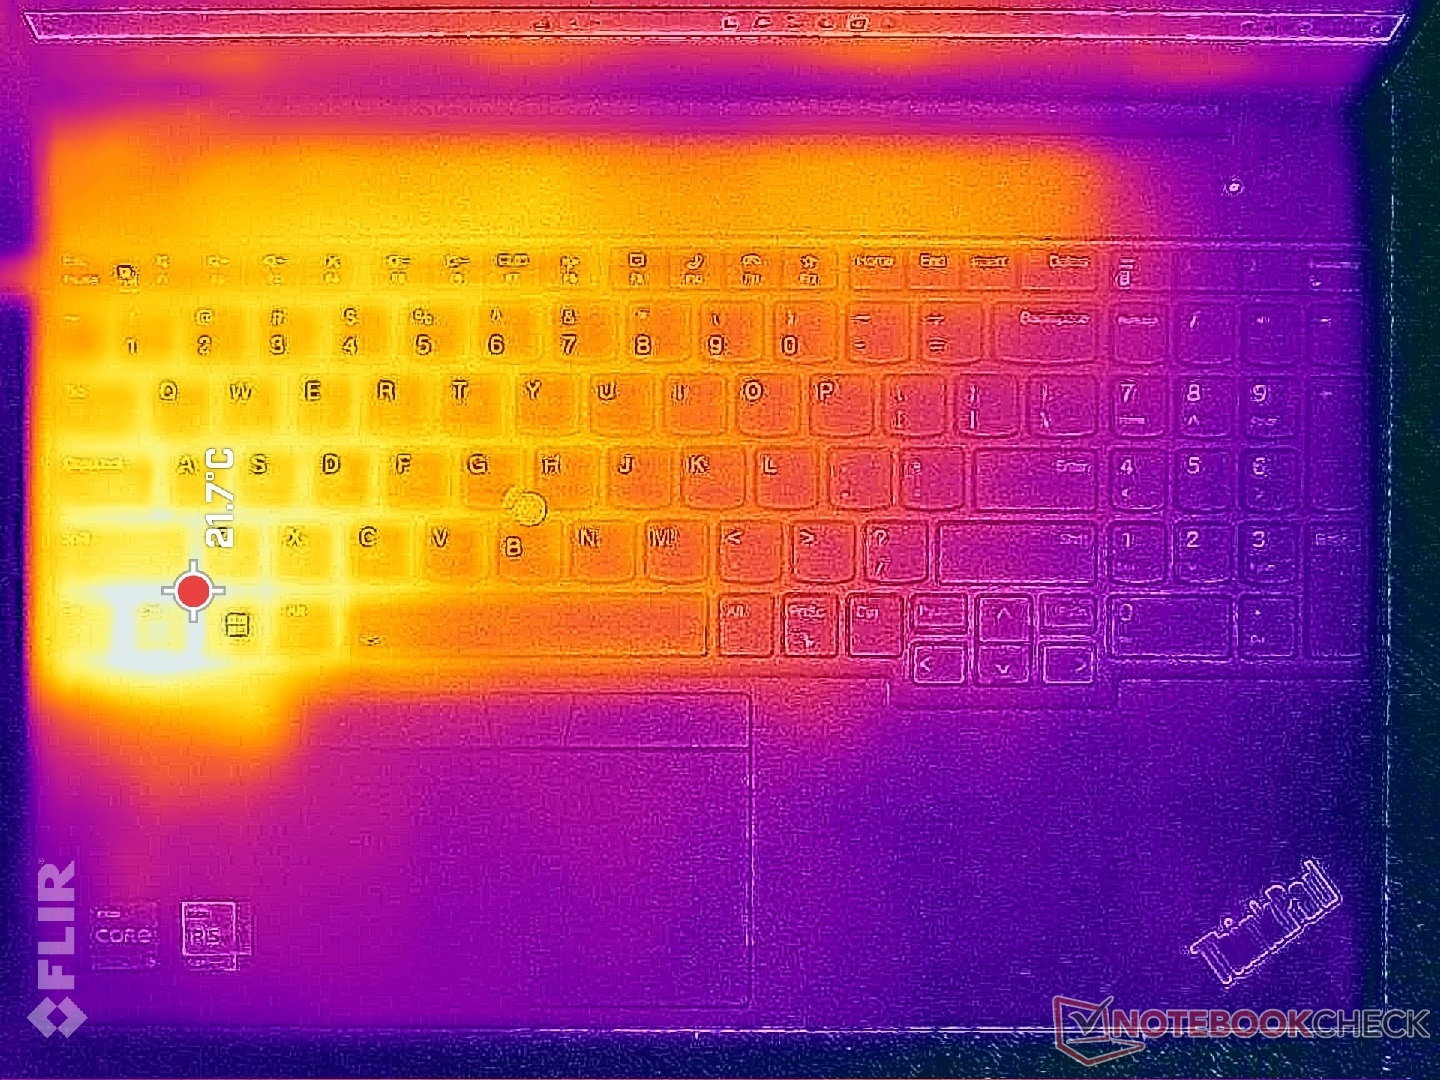
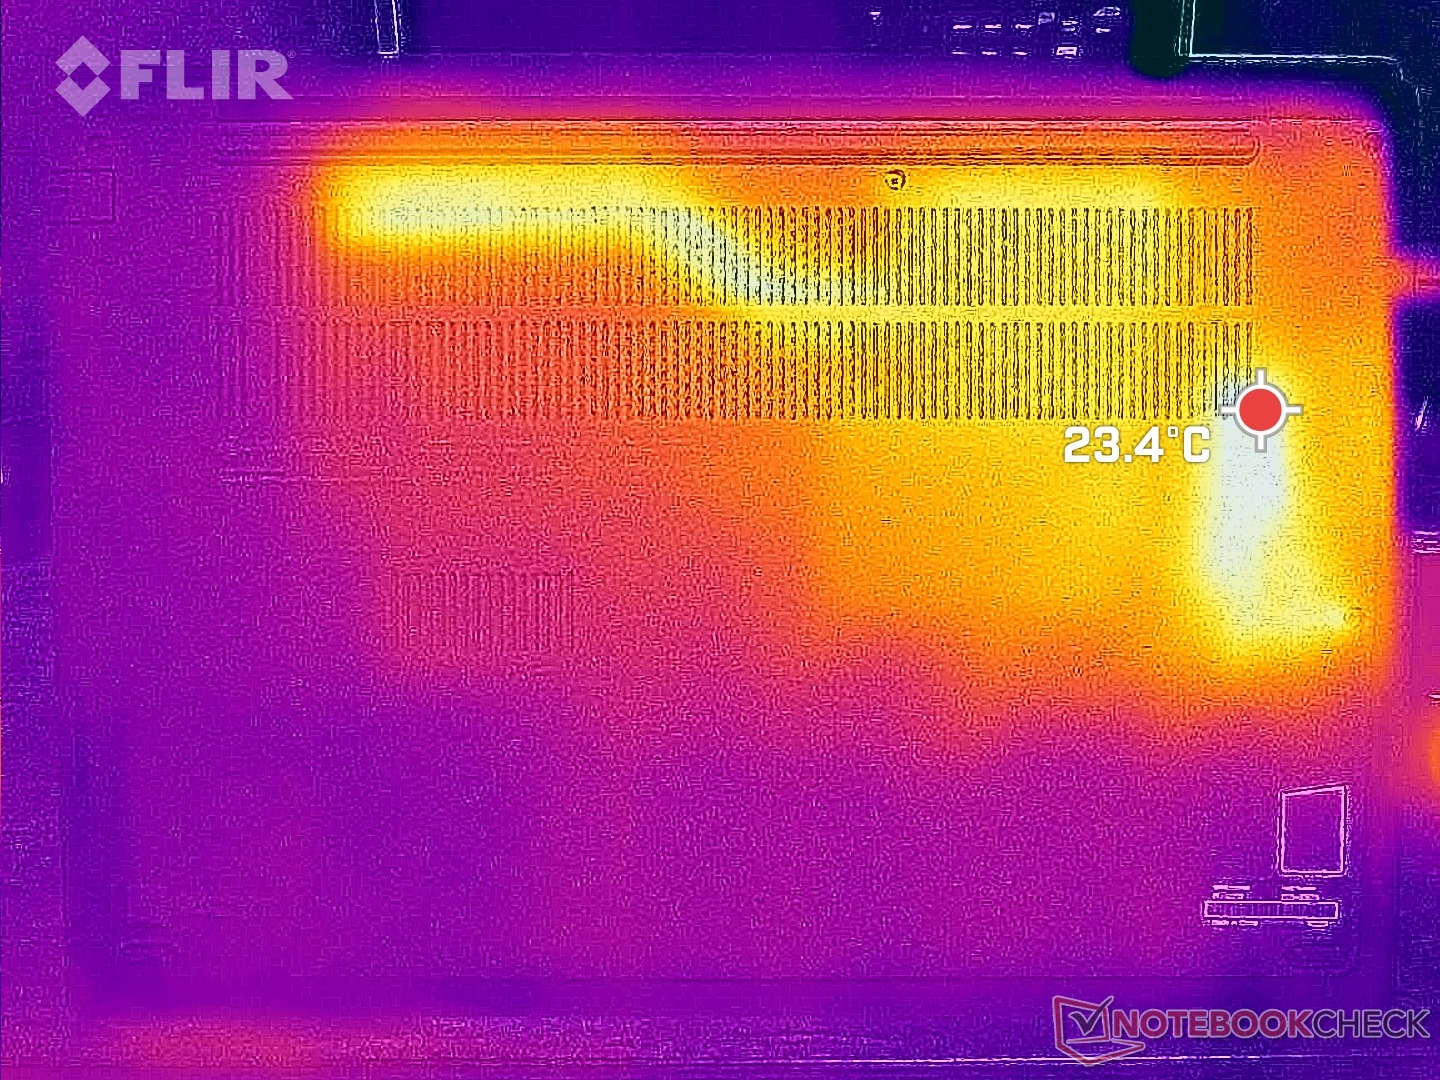
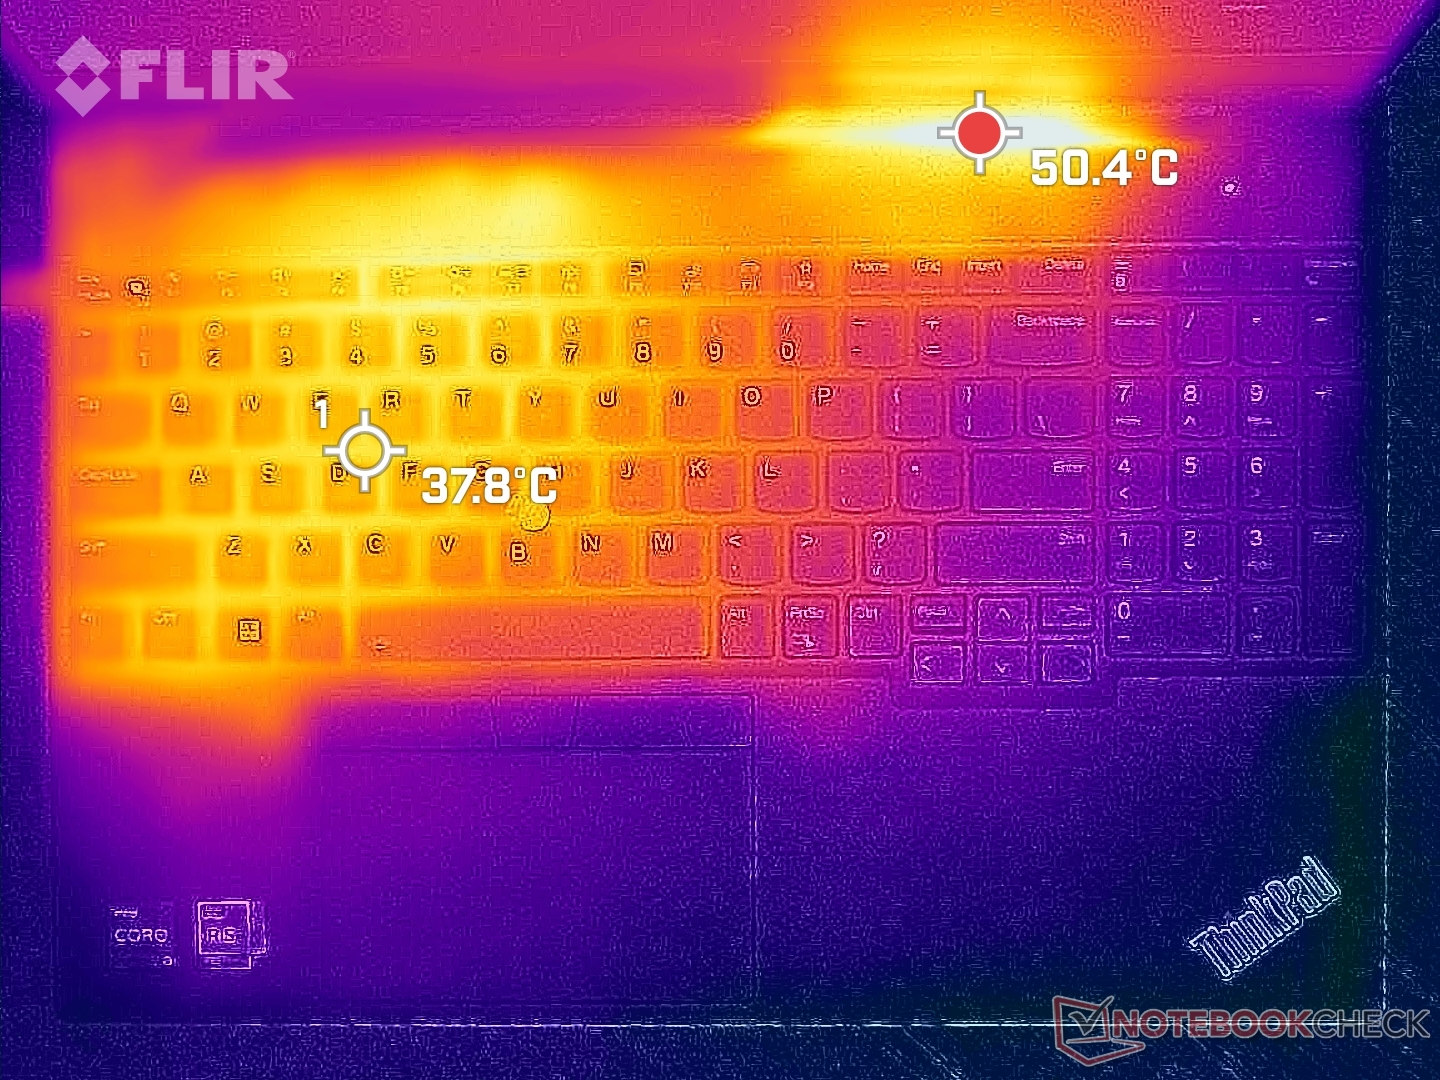
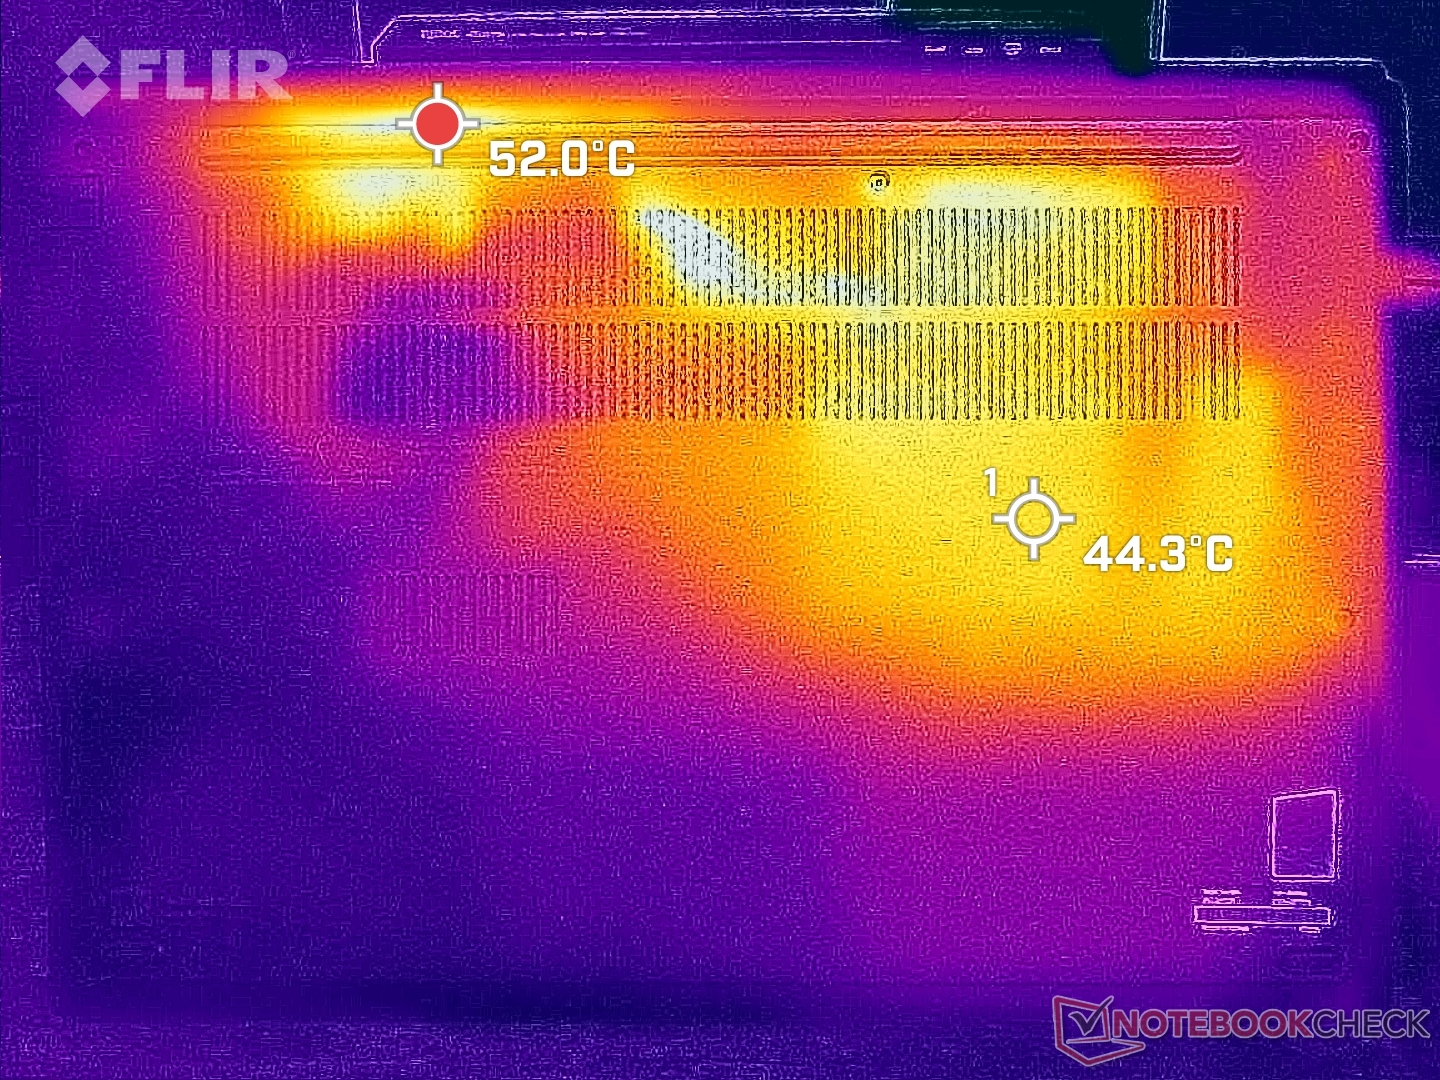
İşlemcinin ve soğutma çözümünün içerideki konumu nedeniyle yüzey sıcaklıkları dizüstü bilgisayarın sol yarısında sağa göre daha yüksektir. Aşağıdaki sıcaklık haritalarında gösterildiği gibi, zorlu yükleri çalıştırırken sıcak noktalar üst ve alt taraflarda sırasıyla 38 C ve 45 C'ye kadar ulaşabilir. Sonuçlar, belki de yukarıda bahsedilen daha yüksek sesli fan nedeniyle AMD yapılandırmasında kaydettiğimizden birkaç C derece daha soğuk. Daha sıcak ve daha soğuk çeyrekler arasındaki sıcaklık farkları dokunulduğunda fark edilebilir olsa da, kullanım sırasında rahatsız edici veya dikkat dağıtıcı değildir.
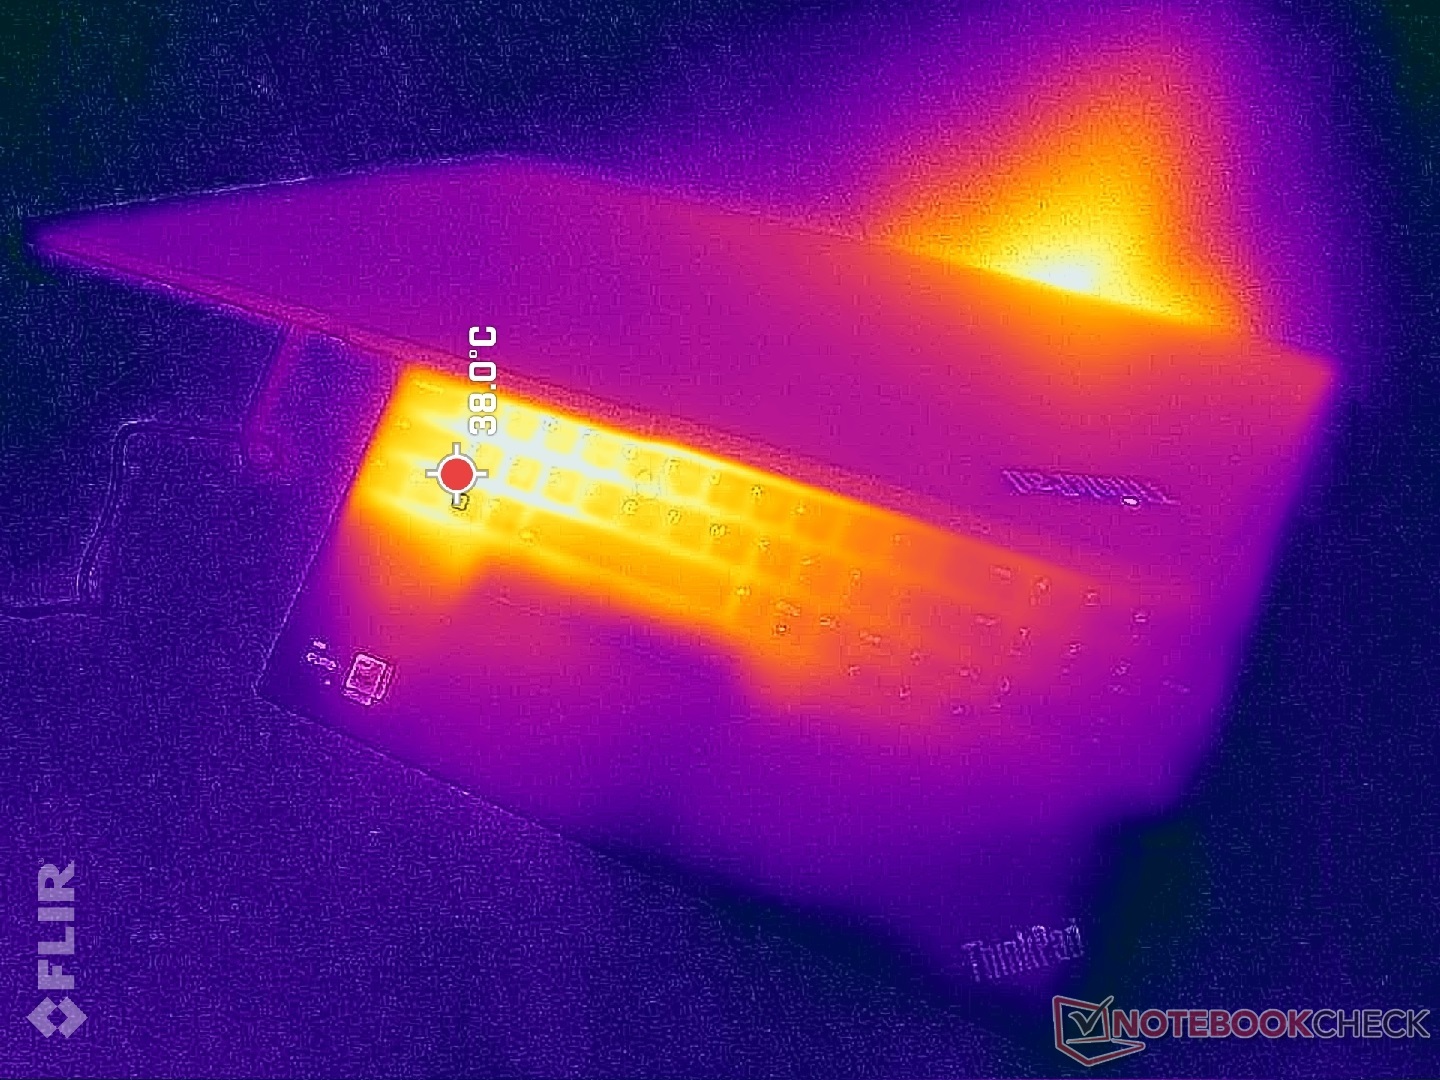
(±) Üst taraftaki maksimum sıcaklık, 34.3 °C / 94 F ortalamasına kıyasla 44 °C / 111 F'dir. , Office sınıfı için 21.2 ile 62.5 °C arasında değişir.
(-) Alt kısım, 36.8 °C / 98 F ortalamasına kıyasla maksimum 50.4 °C / 123 F'ye kadar ısınır
(+) Boşta kullanımda, üst tarafın ortalama sıcaklığı 24.3 °C / 76 F olup, cihazın 29.5 °C / 85 F.
(+) Avuç içi dayanakları ve dokunmatik yüzey, maksimum 27 °C / 80.6 F ile cilt sıcaklığından daha soğuktur ve bu nedenle dokunulduğunda soğuktur.
(±) Benzer cihazların avuç içi dayanağı alanının ortalama sıcaklığı 27.5 °C / 81.5 F (+0.5 °C / 0.9 F) idi.
| Lenovo ThinkPad E16 G1 Core i5-1335U Intel Core i5-1335U, Intel Iris Xe Graphics G7 80EUs | Lenovo ThinkPad E16 G1-21JUS08X00 AMD Ryzen 7 7730U, AMD Radeon RX Vega 8 (Ryzen 4000/5000) | Dell Inspiron 16 7635 2-in-1 AMD Ryzen 5 7530U, AMD Radeon RX Vega 7 | Acer TravelMate P4 TMP416-51-55KN Intel Core i5-1240P, Intel Iris Xe Graphics G7 80EUs | Samsung Galaxy Book3 Pro 16 Intel Core i5-1340P, Intel Iris Xe Graphics G7 80EUs | LG Gram 16Z90Q Intel Core i7-1260P, Intel Iris Xe Graphics G7 96EUs | |
|---|---|---|---|---|---|---|
| Heat | 0% | 4% | -1% | -5% | 6% | |
| Maximum Upper Side * (°C) | 44 | 46.1 -5% | 41.6 5% | 38.6 12% | 41.6 5% | 45 -2% |
| Maximum Bottom * (°C) | 50.4 | 52.2 -4% | 39 23% | 44.4 12% | 45 11% | 43 15% |
| Idle Upper Side * (°C) | 27.2 | 25.7 6% | 29.4 -8% | 28.9 -6% | 31 -14% | 26 4% |
| Idle Bottom * (°C) | 27.8 | 26.7 4% | 28.6 -3% | 34 -22% | 33.6 -21% | 26 6% |
* ... daha küçük daha iyidir
Stres Testi
Prime95'i çalıştırırken, CPU sadece ilk birkaç saniye için 4 GHz, 50 W ve 94 C'ye yükselir, ardından sürekli olarak düşer ve en yüksek Turbo Boost sürdürülemez olduğu için 2,4 GHz, 86 C ve 28 W'de sabitlenir. Yüksek 80 C aralığı, 16 inç Core U serisi bir dizüstü bilgisayar için oldukça sıcaktır. Aynı testi dizüstü bilgisayardaAcer Swift Edge 16 örneğin, Ryzen 7 7840U ile karşılaştırıldığında CPU'nun sadece 64 C'de stabilize olmasına neden olur.
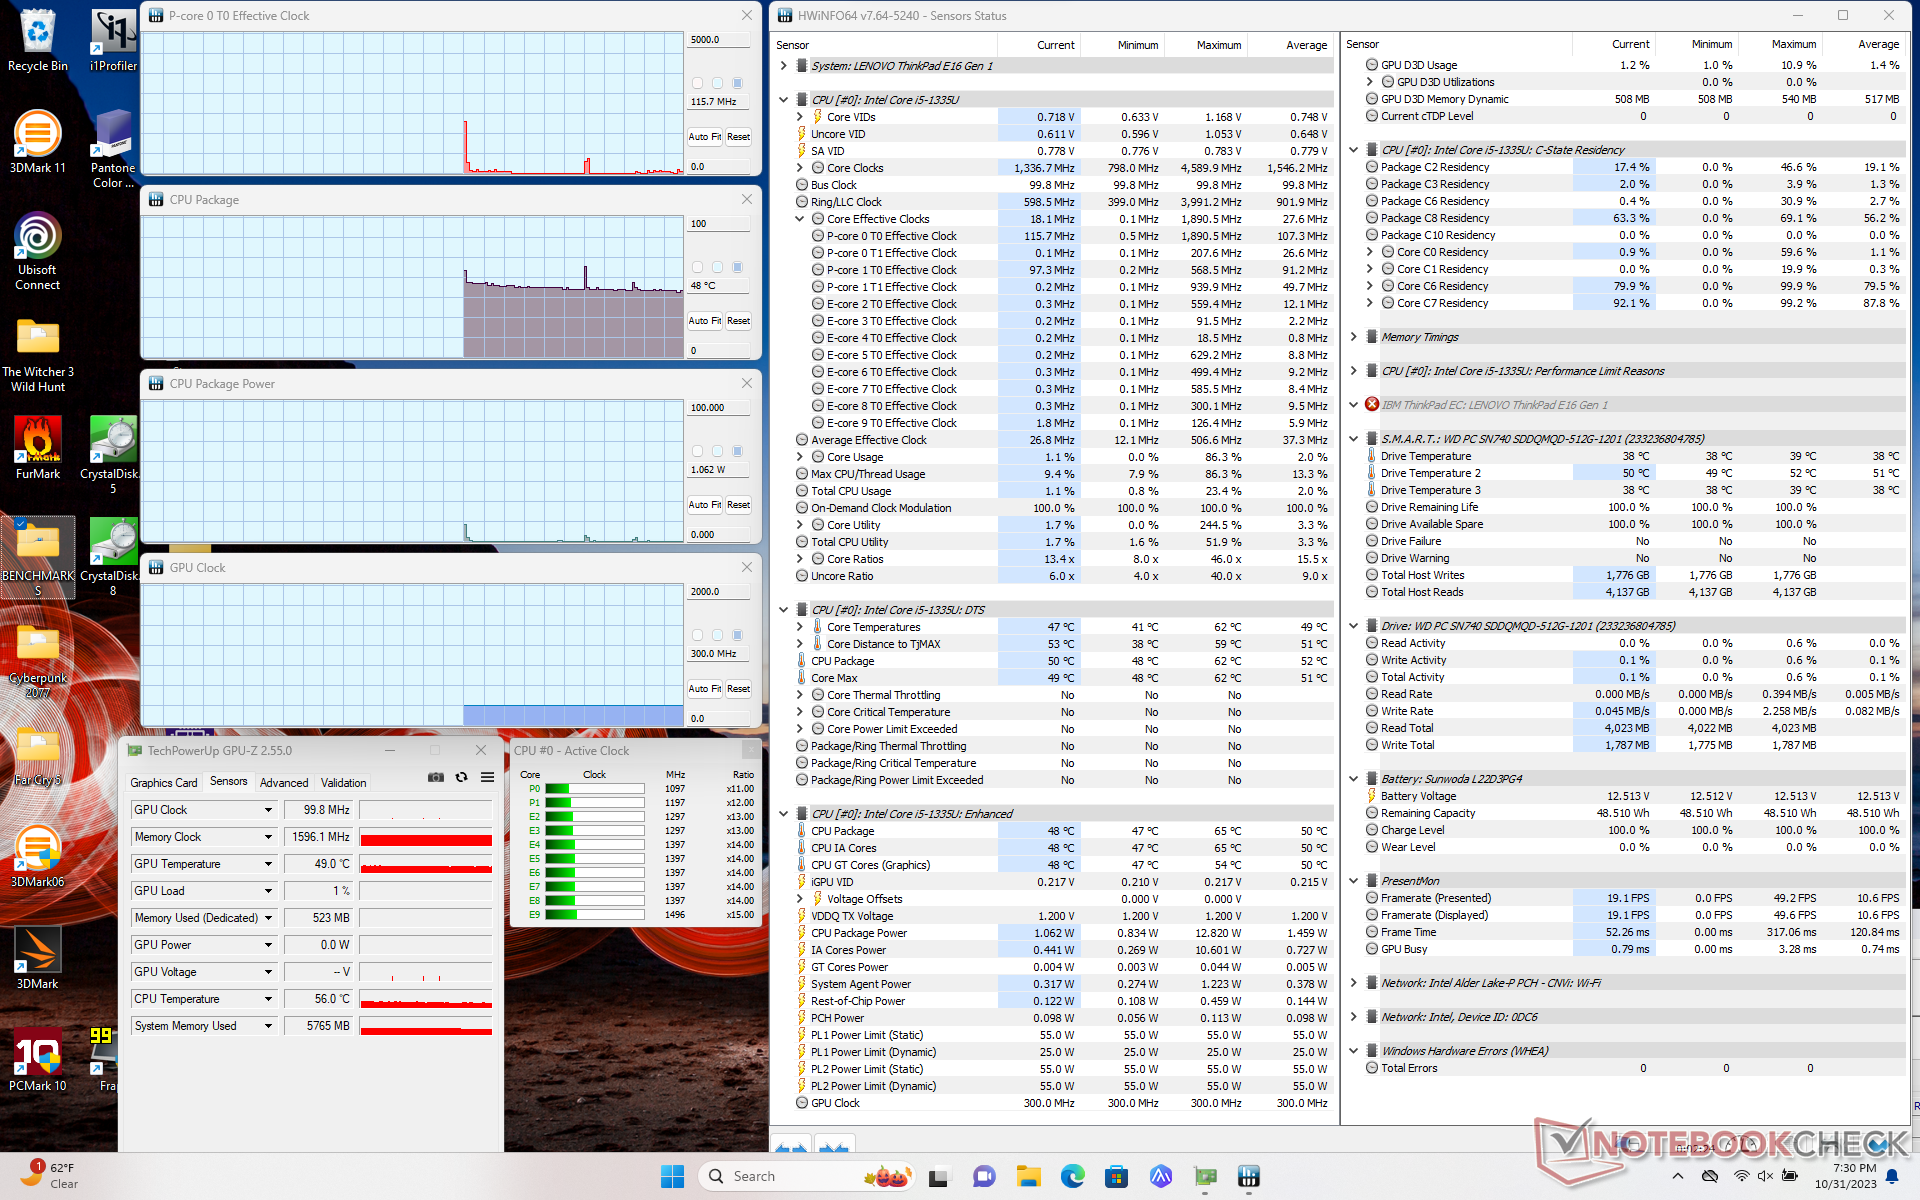
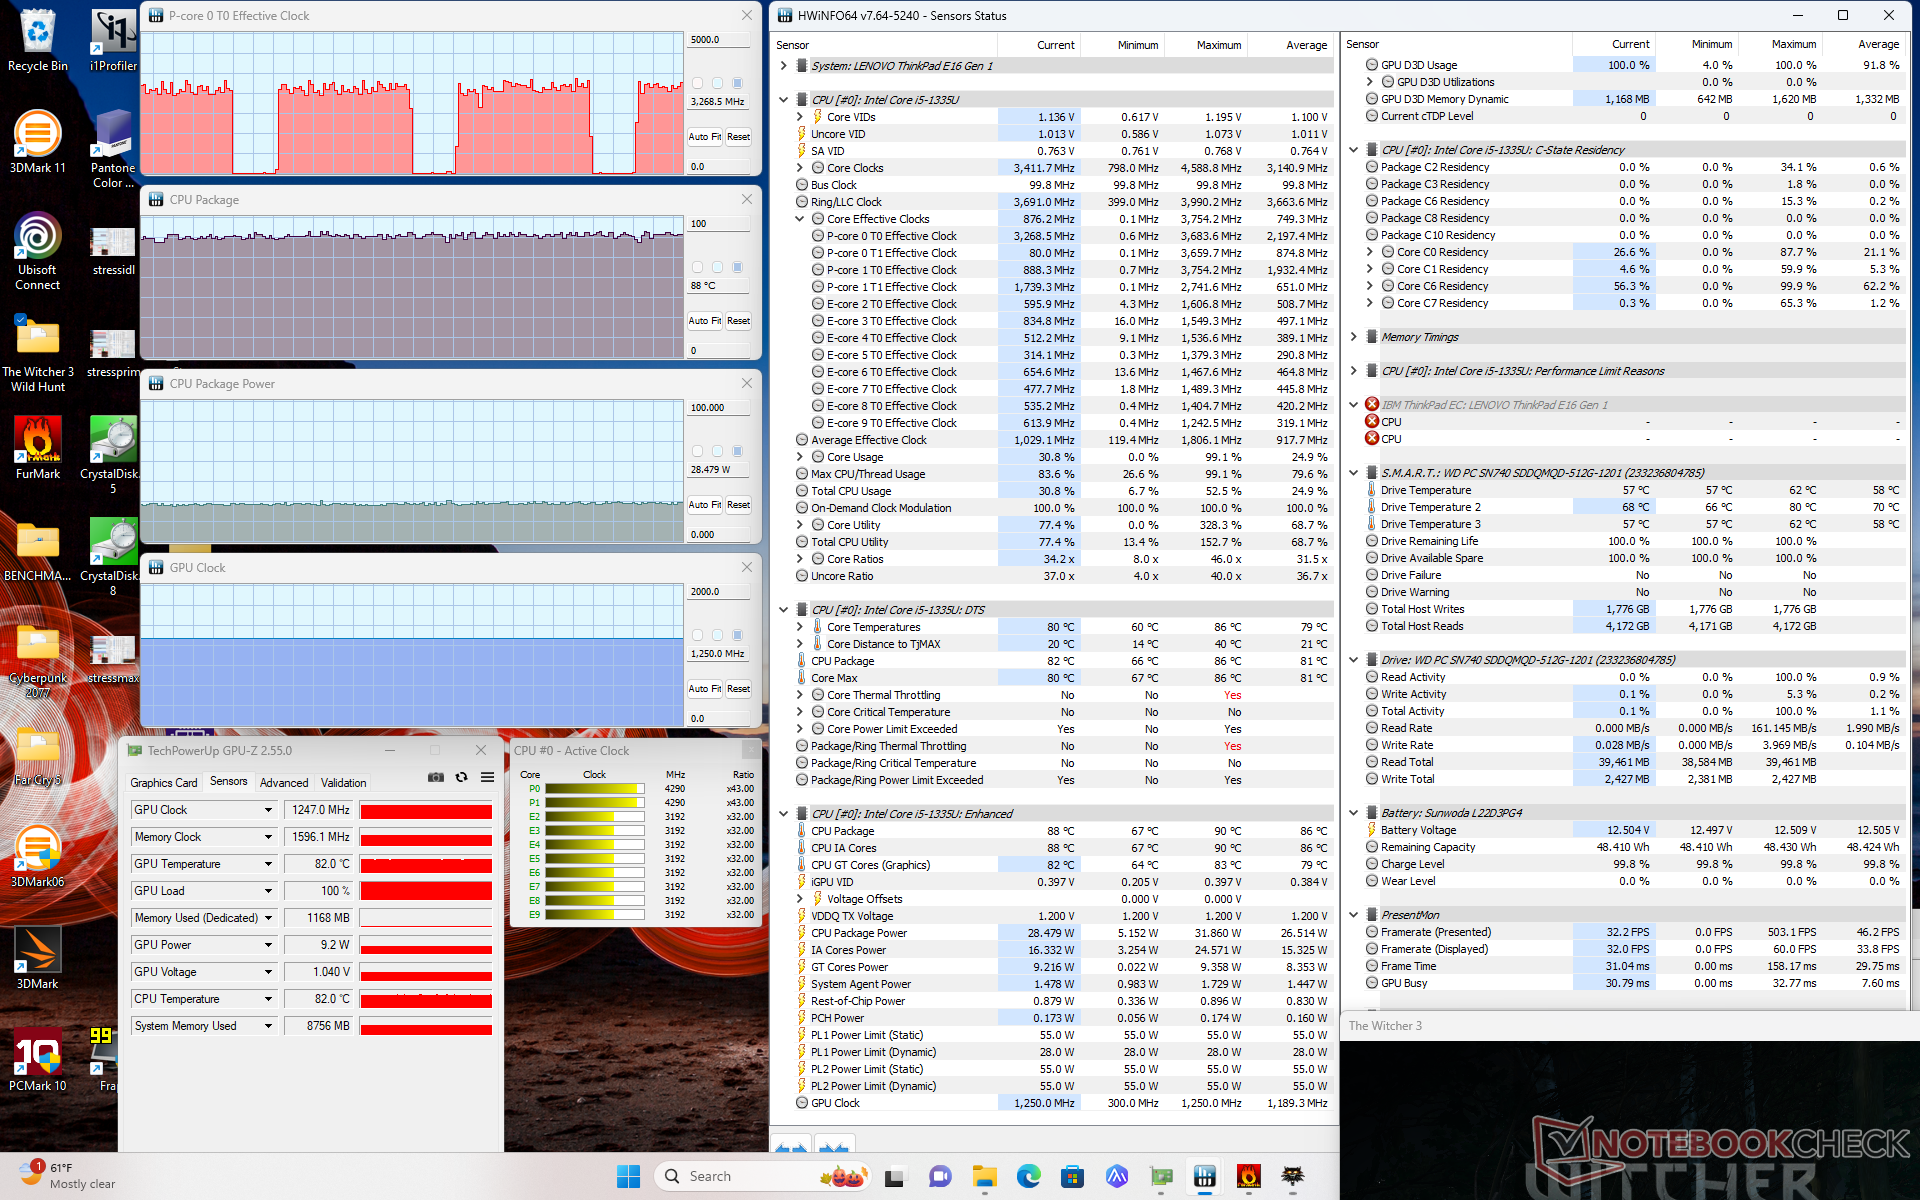
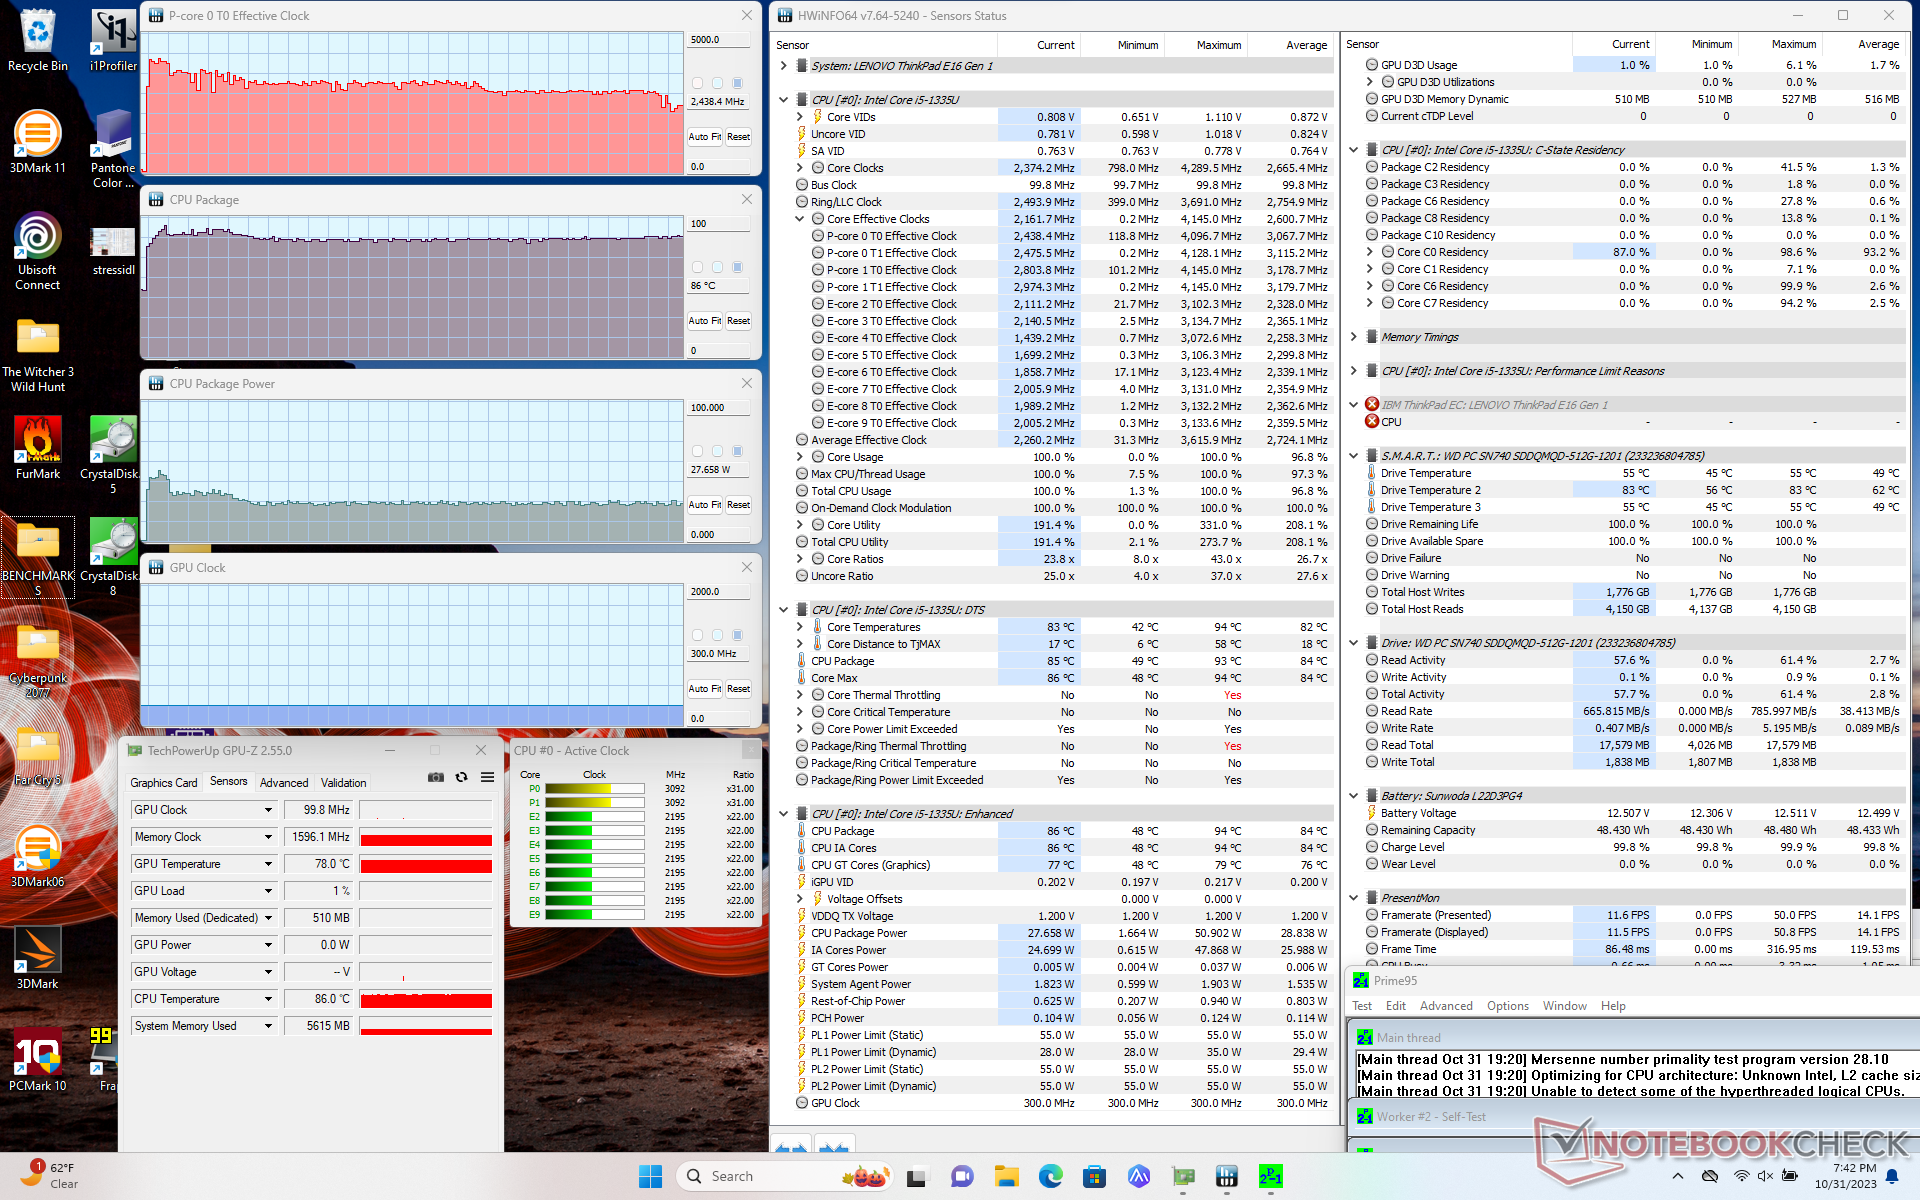
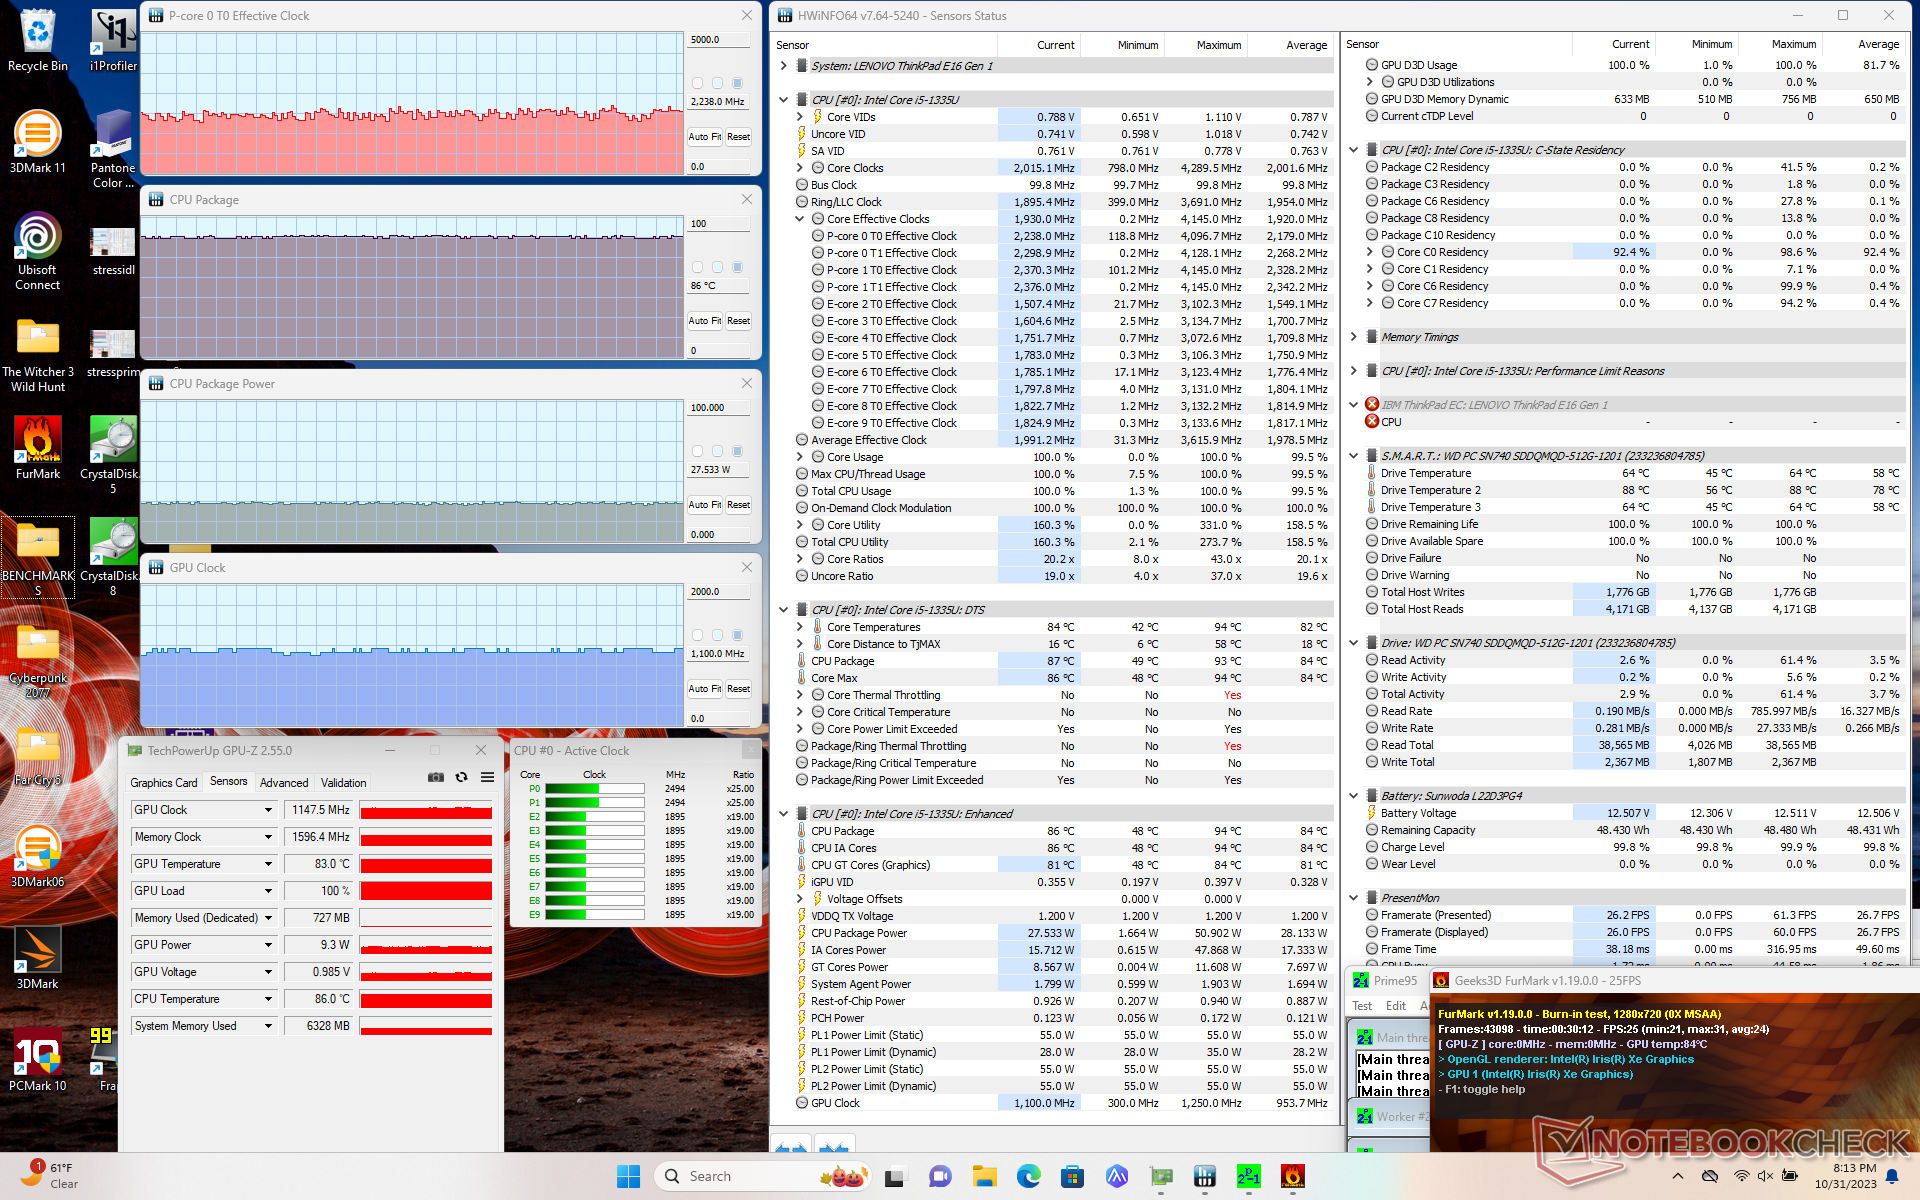
| CPU Saati (GHz) | GPU Saati (MHz) | Ortalama CPU Sıcaklığı (°C) | |
| Sistem Boşta | -- | -- | 48 |
| Prime95 Stres | 2.4 | -- | 86 |
| Prime95 + FurMark Stres | ~2.2 | 1100 | 86 |
| Witcher 3 Stres | ~3,2 | 1250 | 88 |
Konuşmacılar
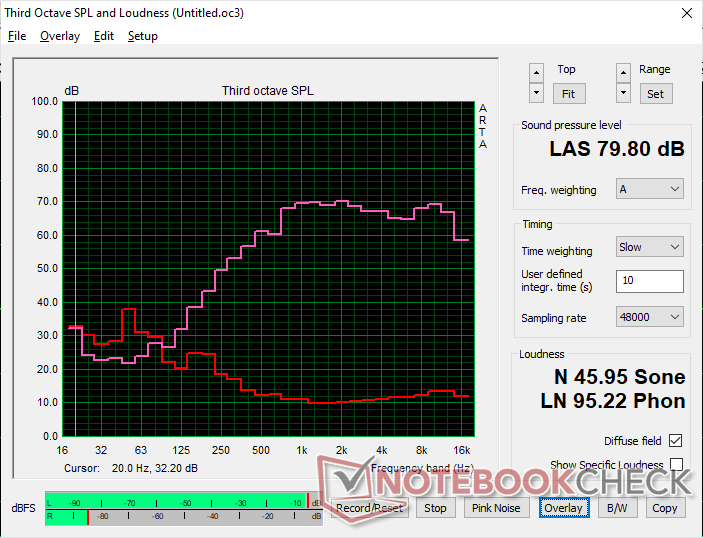
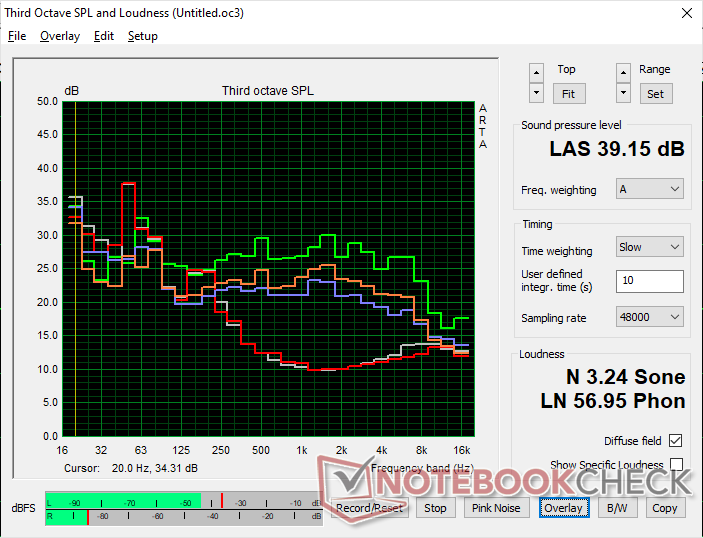
Lenovo ThinkPad E16 G1 Core i5-1335U ses analizi
(±) | hoparlör ses yüksekliği ortalama ama iyi (79.8 dB)
Bas 100 - 315Hz
(-) | neredeyse hiç bas yok - ortalama olarak medyandan 24.7% daha düşük
(±) | Bas doğrusallığı ortalamadır (8.8% delta - önceki frekans)
Ortalar 400 - 2000 Hz
(+) | dengeli ortalar - medyandan yalnızca 4.8% uzakta
(+) | orta frekanslar doğrusaldır (4.8% deltadan önceki frekansa)
Yüksekler 2 - 16 kHz
(+) | dengeli yüksekler - medyandan yalnızca 2.1% uzakta
(+) | yüksekler doğrusaldır (2.7% deltadan önceki frekansa)
Toplam 100 - 16.000 Hz
(±) | Genel sesin doğrusallığı ortalamadır (18.4% ortancaya göre fark)
Aynı sınıfla karşılaştırıldığında
» Bu sınıftaki tüm test edilen cihazların %33%'si daha iyi, 7% benzer, 59% daha kötüydü
» En iyisinin deltası 7% idi, ortalama 21% idi, en kötüsü 53% idi
Test edilen tüm cihazlarla karşılaştırıldığında
» Test edilen tüm cihazların %41'si daha iyi, 8 benzer, % 51 daha kötüydü
» En iyisinin deltası 4% idi, ortalama 23% idi, en kötüsü 134% idi
Apple MacBook Pro 16 2021 M1 Pro ses analizi
(+) | hoparlörler nispeten yüksek sesle çalabilir (84.7 dB)
Bas 100 - 315Hz
(+) | iyi bas - medyandan yalnızca 3.8% uzakta
(+) | bas doğrusaldır (5.2% delta ile önceki frekans)
Ortalar 400 - 2000 Hz
(+) | dengeli ortalar - medyandan yalnızca 1.3% uzakta
(+) | orta frekanslar doğrusaldır (2.1% deltadan önceki frekansa)
Yüksekler 2 - 16 kHz
(+) | dengeli yüksekler - medyandan yalnızca 1.9% uzakta
(+) | yüksekler doğrusaldır (2.7% deltadan önceki frekansa)
Toplam 100 - 16.000 Hz
(+) | genel ses doğrusaldır (4.6% ortancaya göre fark)
Aynı sınıfla karşılaştırıldığında
» Bu sınıftaki tüm test edilen cihazların %0%'si daha iyi, 0% benzer, 100% daha kötüydü
» En iyisinin deltası 5% idi, ortalama 17% idi, en kötüsü 45% idi
Test edilen tüm cihazlarla karşılaştırıldığında
» Test edilen tüm cihazların %0'si daha iyi, 0 benzer, % 100 daha kötüydü
» En iyisinin deltası 4% idi, ortalama 23% idi, en kötüsü 134% idi
Enerji Yönetimi
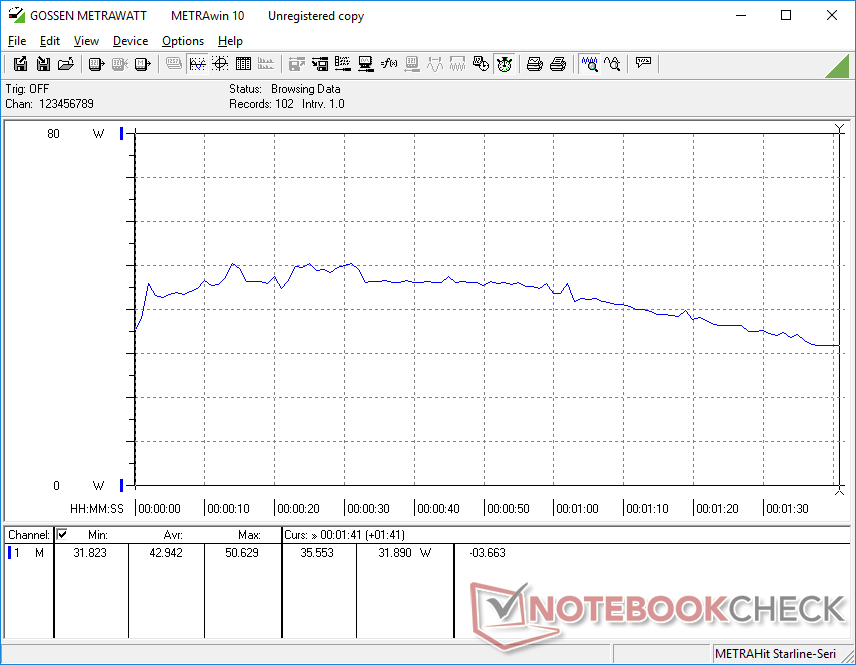
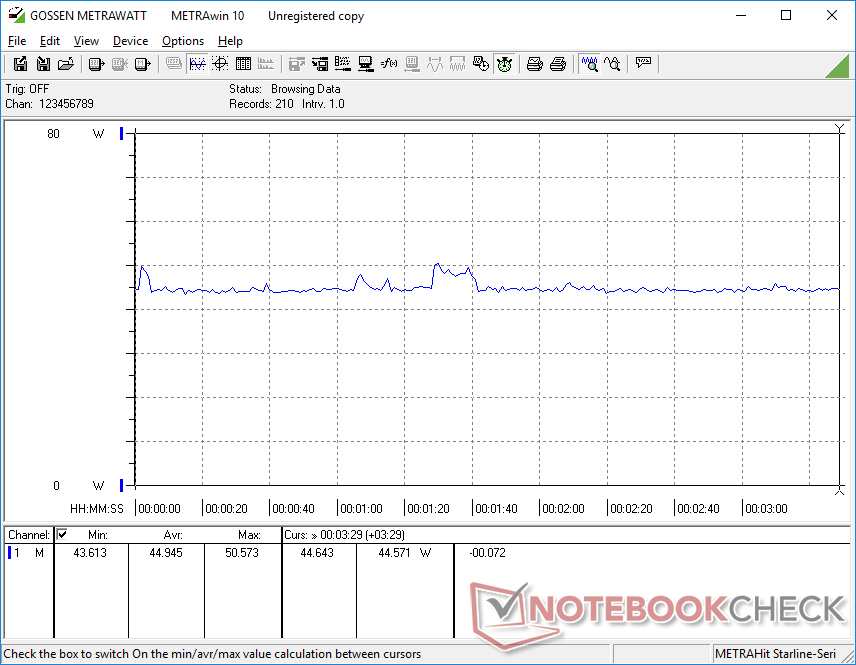
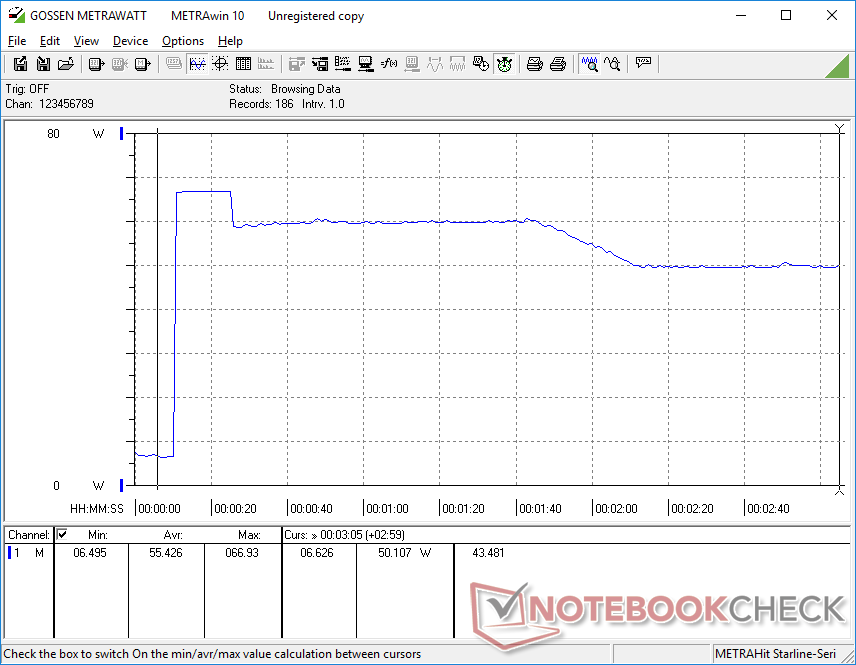
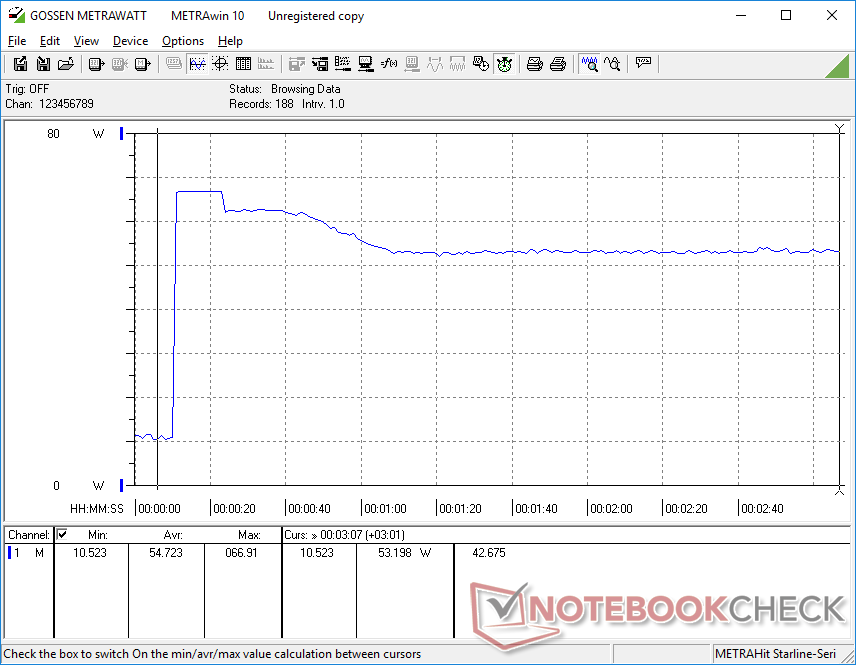
Güç Tüketimi
Çok iş parçacıklı yükler söz konusu olduğunda AMD işlemci genellikle Intel'den daha hızlı olsa da, CPU yoğun görevleri çalıştırırken Intel sistemi genellikle AMD sürümünden daha zorludur. Örneğin CineBench R15 xT başlatıldığında, AMD ünitesinde sadece 45 W'a kıyasla Intel ünitemizde tüketim 68 W'a kadar çıkabiliyordu. Prime95 çalıştırılırken de benzer sonuçlar gözlemlenebilir. Masaüstünde boşta çalışırken veya aşağıdaki gibi GPU yoğun görevleri çalıştırırken genel tüketim Witcher 3 bunun dışında Intel ve AMD sürümleri arasında hemen hemen aynıdır.
| Kapalı / Bekleme modu | |
| Boşta | |
| Çalışırken |
|
Key:
min: | |
| Lenovo ThinkPad E16 G1 Core i5-1335U i5-1335U, Iris Xe G7 80EUs, , IPS, 1920x1200, 16" | Lenovo ThinkPad E16 G1-21JUS08X00 R7 7730U, Vega 8, WD PC SN740 SDDPNQD-1T00, IPS, 2560x1600, 16" | Dell Inspiron 16 7635 2-in-1 R5 7530U, Vega 7, Kioxia BG5 KBG50ZNS512G, IPS, 1920x1200, 16" | Acer TravelMate P4 TMP416-51-55KN i5-1240P, Iris Xe G7 80EUs, Micron 2450 512GB MTFDKBA512TFK, IPS, 1920x1200, 16" | Samsung Galaxy Book3 Pro 16 i5-1340P, Iris Xe G7 80EUs, WD PC SN740 256GB SDDPNQD-256G, AMOLED, 2880x1800, 16" | LG Gram 16Z90Q i7-1260P, Iris Xe G7 96EUs, Samsung PM9A1 MZVL21T0HCLR, IPS, 2560x1600, 16" | |
|---|---|---|---|---|---|---|
| Power Consumption | -3% | 2% | 1% | 9% | -7% | |
| Idle Minimum * (Watt) | 4.9 | 4.1 16% | 4.8 2% | 5.2 -6% | 3.9 20% | 5 -2% |
| Idle Average * (Watt) | 8.3 | 9.6 -16% | 7.6 8% | 7.1 14% | 4.8 42% | 8 4% |
| Idle Maximum * (Watt) | 8.6 | 10.2 -19% | 8.7 -1% | 9.6 -12% | 10 -16% | 14 -63% |
| Load Average * (Watt) | 42.9 | 47.3 -10% | 47.1 -10% | 47 -10% | 44 -3% | 47 -10% |
| Witcher 3 ultra * (Watt) | 44.9 | 46.7 -4% | 46.6 -4% | 43.3 4% | 42.3 6% | 37.8 16% |
| Load Maximum * (Watt) | 67 | 55.7 17% | 56.4 16% | 56 16% | 63 6% | 56 16% |
* ... daha küçük daha iyidir
Power Consumption Witcher 3 / Stresstest
Power Consumption external Monitor
Pil Ömrü
Model iki pil kapasitesi seçeneği ile geliyor: 47 Wh ve 57 Wh. Intel ünitemiz daha küçük olan seçenekle gelirken, AMD ünitemiz daha büyük olanla gönderiliyor. Pil ömrü, sadece 5 saatlik gerçek dünya tarama kullanımı için AMD ünitemizdekinin sadece yarısı kadardır. 16 inçlik bir dizüstü bilgisayar için 47 Wh'lık seçenek beklenenden çok daha küçük ve kesin bir köşe.
Boş kapasiteden tam kapasiteye şarj etmek neyse ki bir saatten biraz fazla bir sürede oldukça hızlı.
| Lenovo ThinkPad E16 G1 Core i5-1335U i5-1335U, Iris Xe G7 80EUs, 47 Wh | Lenovo ThinkPad E16 G1-21JUS08X00 R7 7730U, Vega 8, 57 Wh | Dell Inspiron 16 7635 2-in-1 R5 7530U, Vega 7, 64 Wh | Acer TravelMate P4 TMP416-51-55KN i5-1240P, Iris Xe G7 80EUs, 56 Wh | Samsung Galaxy Book3 Pro 16 i5-1340P, Iris Xe G7 80EUs, 76 Wh | LG Gram 16Z90Q i7-1260P, Iris Xe G7 96EUs, 80 Wh | |
|---|---|---|---|---|---|---|
| Pil Çalışma Süresi | 117% | 179% | 81% | 96% | 94% | |
| WiFi v1.3 (h) | 5.2 | 11.3 117% | 14.5 179% | 9.4 81% | 10.2 96% | 10.1 94% |
| H.264 (h) | 11.7 | 14.4 | ||||
| Load (h) | 1.3 | 1.9 | 2 | 2.6 | ||
| Reader / Idle (h) | 26 | 30.4 | 18.1 |
Artılar
Eksiler
Karar - AMD Pil Ömrü Konusunda Büyük Kazandı
AMD yerine Intel ThinkPad E16 G1'i tercih ettiğinizde Thunderbolt desteği, daha hızlı tek iş parçacığı performansı ve Core i7-1355U'yu seçtiğiniz varsayılırsa daha hızlı entegre grafik performansı elde edersiniz. Bununla birlikte, bu avantajlar tartışmalı bir şekilde AMD sürümü daha uzun pil ömrü, watt başına daha yüksek performans, daha hızlı çoklu iş parçacığı performansı ve M.2 2280 SSD desteği sunar. Bu nedenle, AMD seçeneklerini atlamaya karar verirseniz Intel sürümünün üstün yerleştirme özelliklerine gerçekten değer vermeniz gerekecektir.
ThinkPad E16 G1'inize Thunderbolt monitörler veya eGPU'lar bağlamayı planlamıyorsanız, AMD sürümleri yaklaşık aynı fiyata Intel seçeneklerinden hem daha uzun pil ömrü hem de daha hızlı çoklu iş parçacığı performansı sunabilir.
Sürüm tercihi ne olursa olsun, kullanıcılar yine de satın almadan önce ekran ve pil boyutu konusunda dikkatli olmak isteyeceklerdir. Ne yazık ki, her perakendeci renk kapsamını veya pil kapasitesini listelemiyor ve bu nedenle yanlışlıkla daha düşük uçlu ekrana veya daha küçük 47 Wh pil paketine sahip bir yapılandırma satın almak kolaydır. Temel yapılandırmaya göre önemli sıçramalar olduğundan, mümkünse tam sRGB kapsamını ve daha büyük 57 Wh pil paketini hedeflemenizi öneririz.
Fiyat ve Bulunabilirlik
Lenovo, ThinkPad E16 G1'i Core i3 yapılandırması için 638 USD veya Core i5 yapılandırması için 724 USD'den başlayan fiyatlarla satışa sunuyor.
Lenovo ThinkPad E16 G1 Core i5-1335U
- 11/02/2023 v7 (old)
Allen Ngo
Şeffaflık
İncelenecek cihazların seçimi editör ekibimiz tarafından yapılır. Test örneği, bu incelemenin amacı doğrultusunda üretici veya perakendeci tarafından yazara ödünç olarak sağlanmıştır. Borç verenin bu inceleme üzerinde herhangi bir etkisi olmadığı gibi, üretici de yayınlanmadan önce bu incelemenin bir kopyasını almamıştır. Bu incelemeyi yayınlama zorunluluğu yoktu. Bağımsız bir medya şirketi olarak Notebookcheck, üreticilerin, perakendecilerin veya yayıncıların otoritesine tabi değildir.
Notebookcheck bu şekilde test yapıyor
Notebookcheck, tüm sonuçların karşılaştırılabilir olmasını sağlamak için her yıl yüzlerce dizüstü bilgisayarı ve akıllı telefonu standart prosedürler kullanarak bağımsız olarak inceliyor. Yaklaşık 20 yıldır test yöntemlerimizi sürekli olarak geliştirdik ve bu süreçte endüstri standartlarını belirledik. Test laboratuvarlarımızda deneyimli teknisyenler ve editörler tarafından yüksek kaliteli ölçüm ekipmanları kullanılmaktadır. Bu testler çok aşamalı bir doğrulama sürecini içerir. Karmaşık derecelendirme sistemimiz, nesnelliği koruyan yüzlerce sağlam temellere dayanan ölçüm ve kıyaslamaya dayanmaktadır.Price comparison

