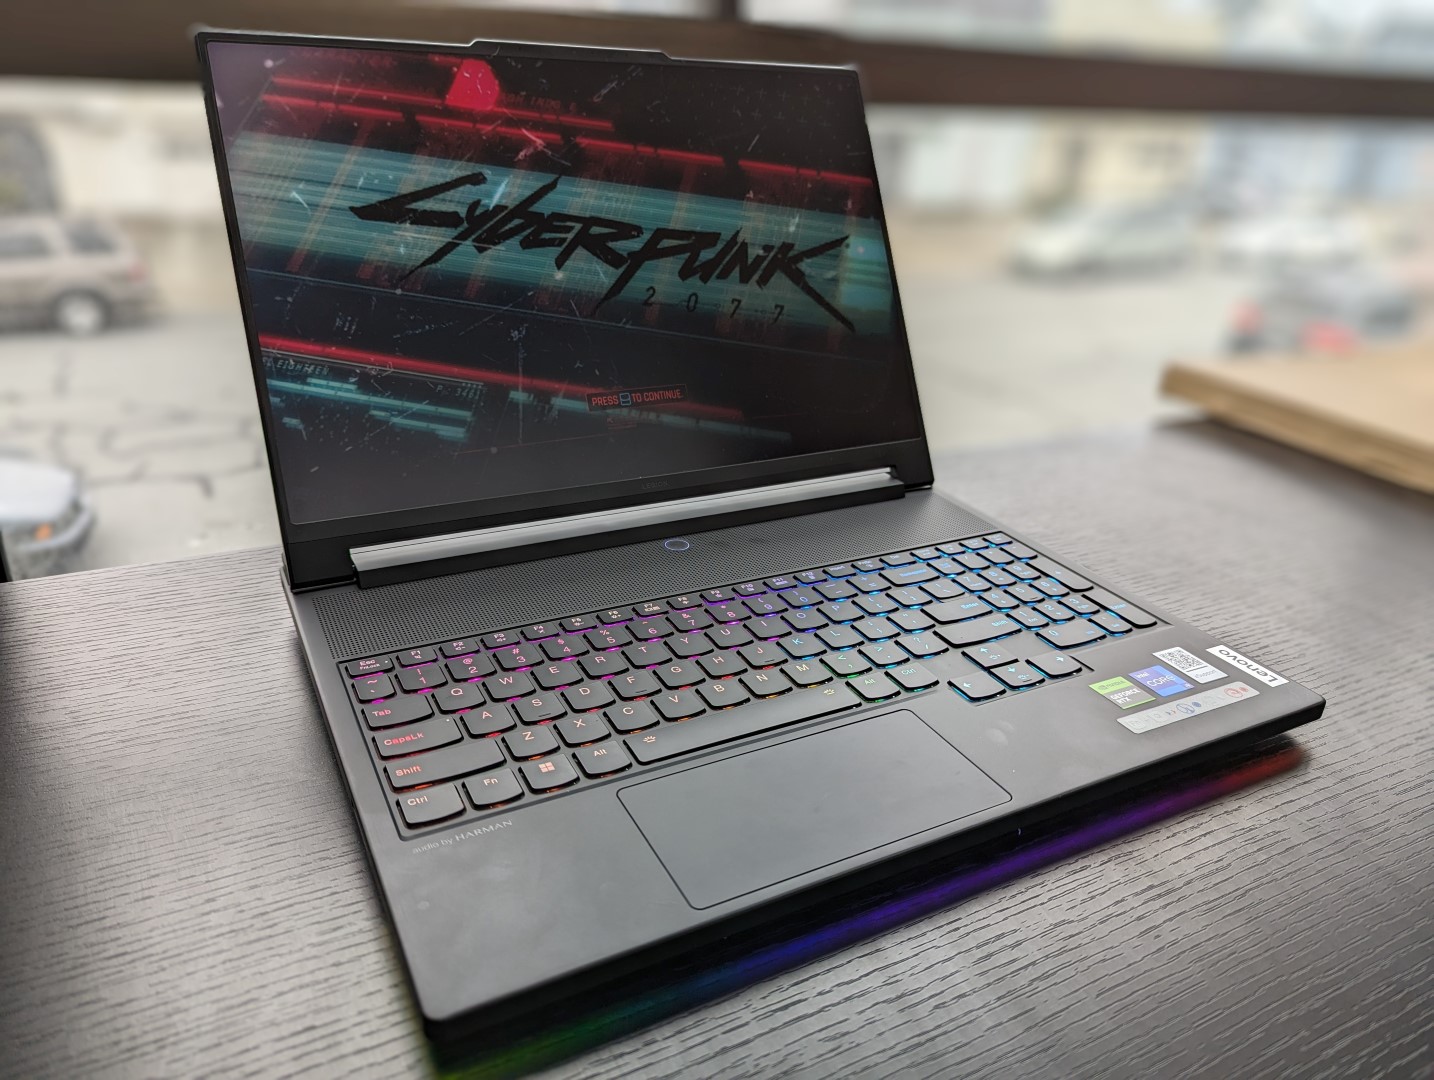
Legion 9i Gen 8 16IRX8 incelemesi: Lenovo'nun şimdiye kadarki en iddialı dizüstü oyun bilgisayarı

Sadece birkaç hafta önce tanıtıldı iFA 2023'teyeni Legion 9i 16, orta seviye Legion 5 serisini ve üst-orta seviye Legion 7 serisini geride bırakan mevcut en üst seviye Legion modelidir. Vasat Legion 9 ürününden sonra birkaç yıl içinde çıkan ilk 9 ürünüdür Legion Y920 2017 yılında geri döndü. En yeni model, mini LED ekranı ve entegre sıvı soğutma termalleri ile dikkat çekiyor.
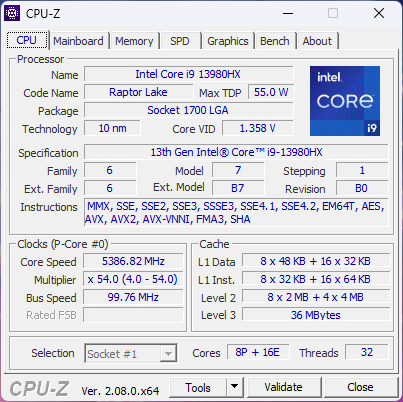
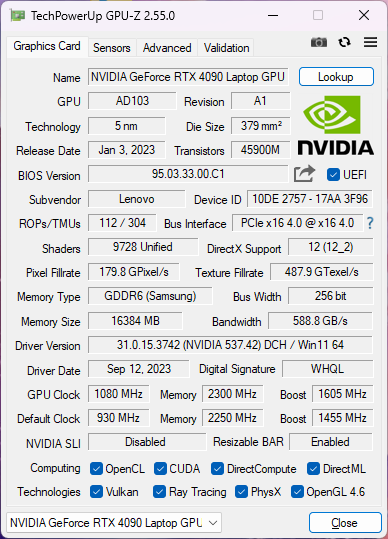
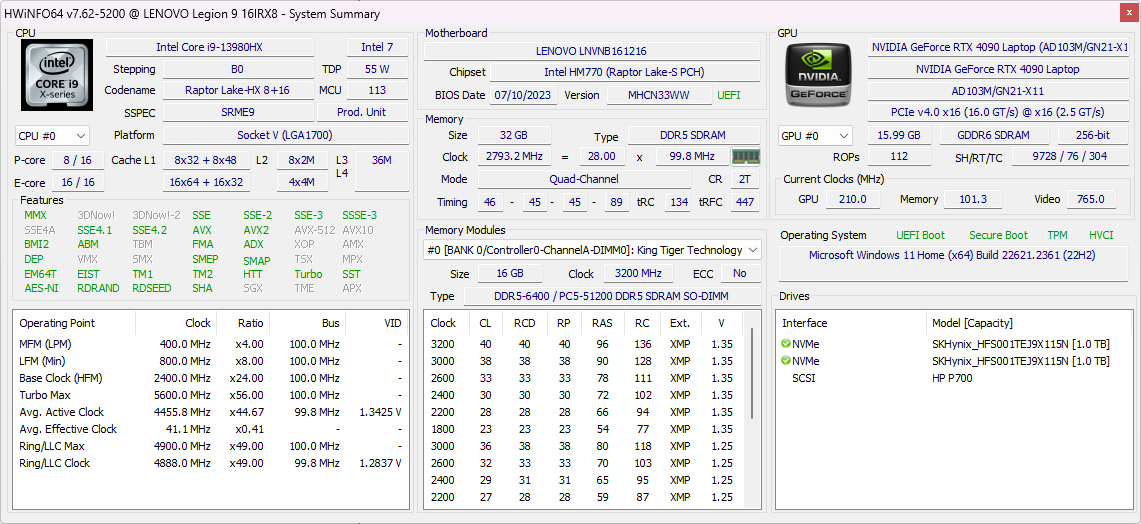
İnceleme ünitemiz, 13. nesil Core i9-13980HX CPU, 175 W GeForce RTX 4090 GPU, RAID 0'da 1 TB PCIe4 x4 NVMe SSD ve DCI-P3 renklerine sahip 3,2K (3200 x 2000) mini LED 165 Hz ekran dahil olmak üzere her şey ve mutfak lavabosu ile 4000 USD'nin biraz altında perakende satış için yapılandırıldı. Şu anda tüm seçenekler aynı Core i9 CPU ve mini LED ekran ile gönderilirken, yalnızca GPU RTX 4080'e kadar yapılandırılabilir.
Legion 9i 16'nın alternatifleri arasında aşağıdaki gibi diğer 16 inç oyun dizüstü bilgisayarları bulunmaktadır Razer Blade 16, Asus ROG Strix G16, HP Omen Transcend 16ve Alienware x16 R1.
Daha fazla Lenovo incelemesi:
Karşılaştırmalı olarak olası rakipler
Derecelendirme | Tarih | Modeli | Ağırlık | Yükseklik | Boyut | Çözünürlük | Fiyat |
|---|---|---|---|---|---|---|---|
| 90.2 % v7 (old) | 10/2023 | Lenovo Legion 9 16IRX8 i9-13980HX, GeForce RTX 4090 Laptop GPU | 2.6 kg | 22.7 mm | 16.00" | 3200x2000 | |
| 87.7 % v7 (old) | 09/2023 | Lenovo Legion Slim 5 16APH8 R7 7840HS, GeForce RTX 4060 Laptop GPU | 2.4 kg | 25.2 mm | 16.00" | 2560x1600 | |
| 89.8 % v7 (old) | 02/2023 | Razer Blade 16 Early 2023 RTX 4090 i9-13950HX, GeForce RTX 4090 Laptop GPU | 2.5 kg | 21.99 mm | 16.00" | 3840x2400 | |
| 88.4 % v7 (old) | 09/2023 | Asus ROG Strix G16 G614JZ i9-13980HX, GeForce RTX 4080 Laptop GPU | 2.4 kg | 30.4 mm | 16.00" | 2560x1600 | |
| 87.9 % v7 (old) | 09/2023 | HP Omen Transcend 16 i9-13900HX, GeForce RTX 4070 Laptop GPU | 2.3 kg | 19.8 mm | 16.00" | 2560x1600 | |
| 88.4 % v7 (old) | 07/2023 | Alienware x16 R1 i9-13900HK, GeForce RTX 4080 Laptop GPU | 2.6 kg | 18.57 mm | 16.00" | 2560x1600 |
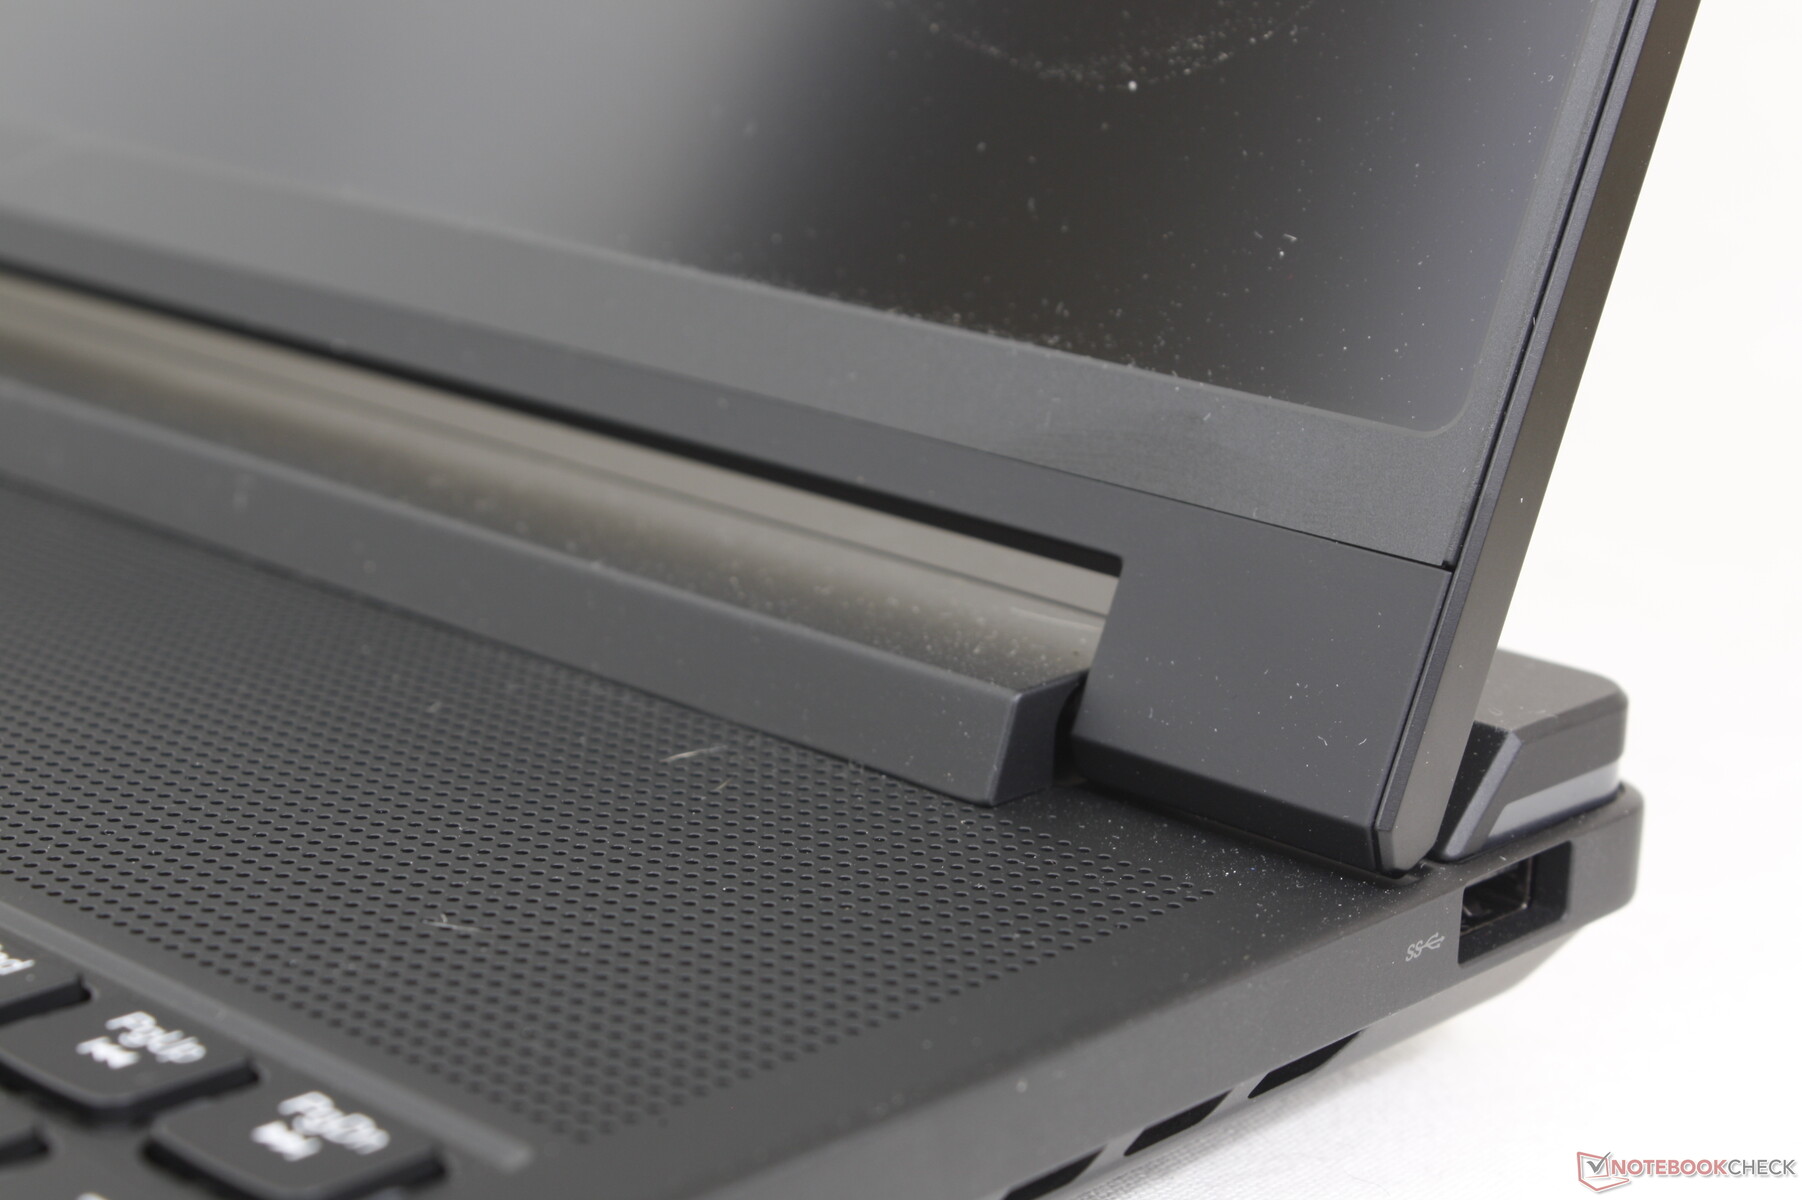
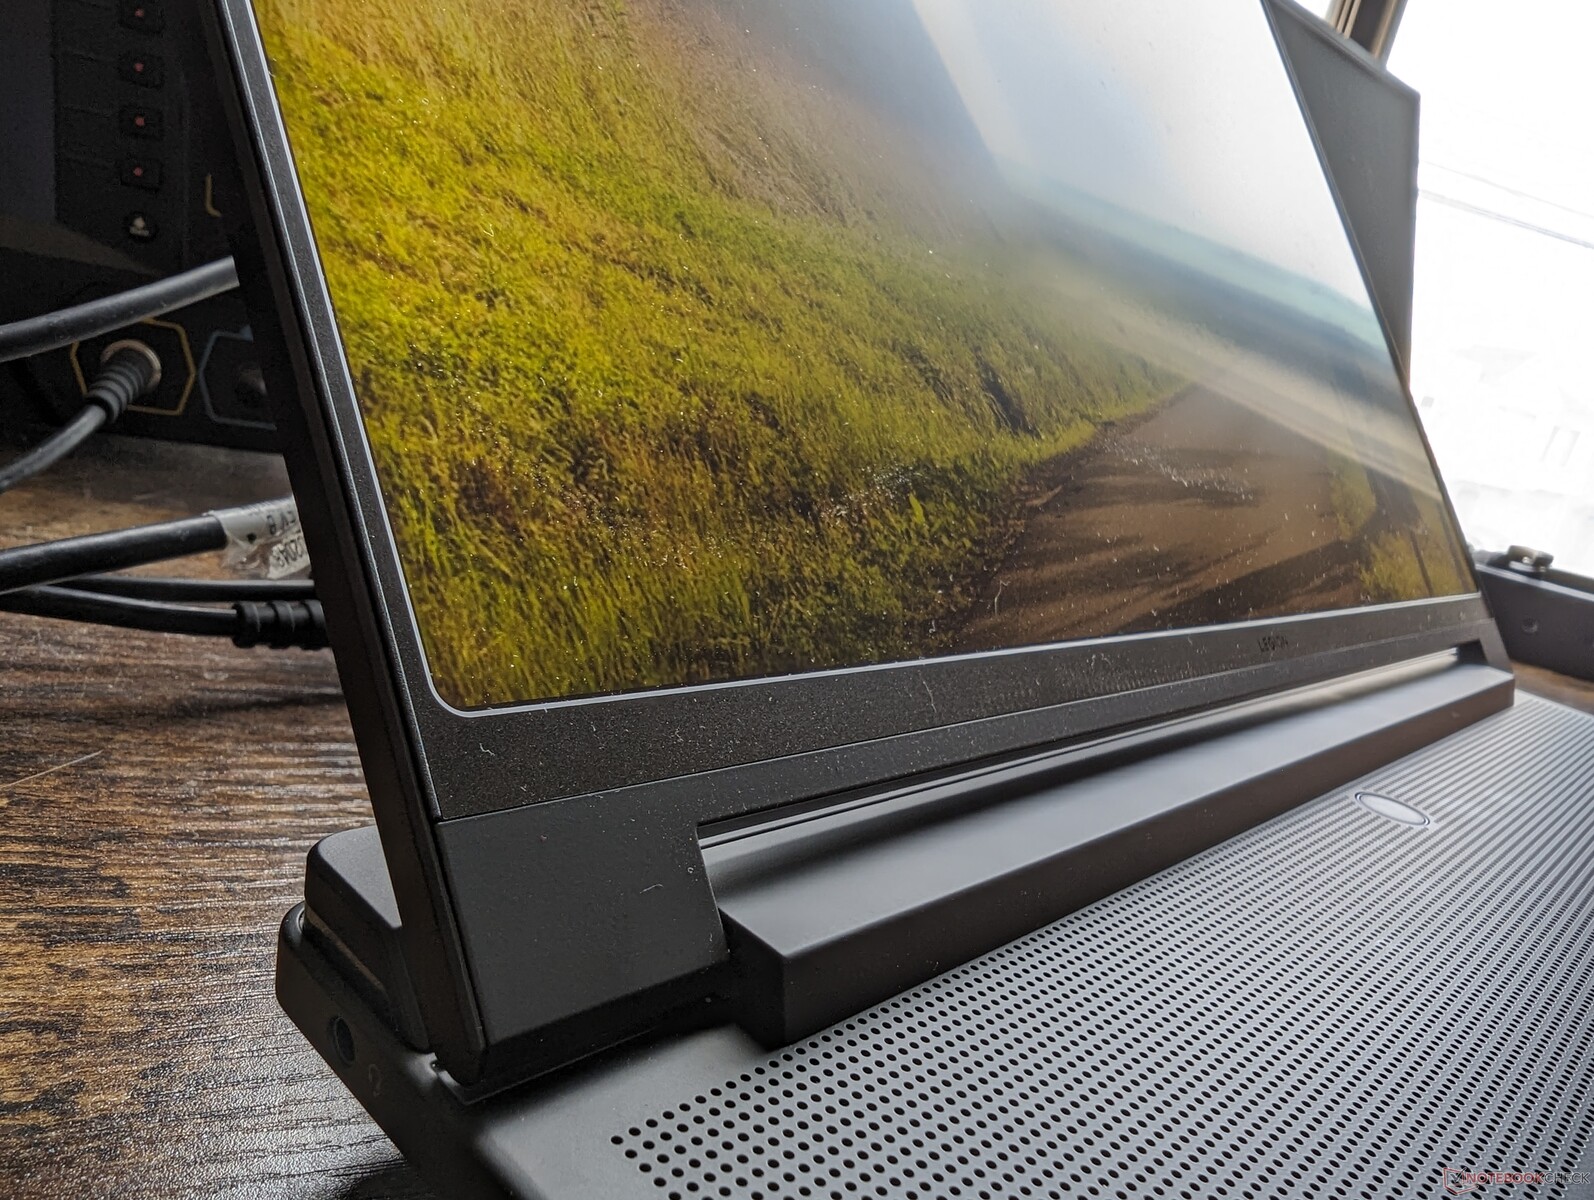
Case - Evrimleşmiş Bir Legion Tasarımı
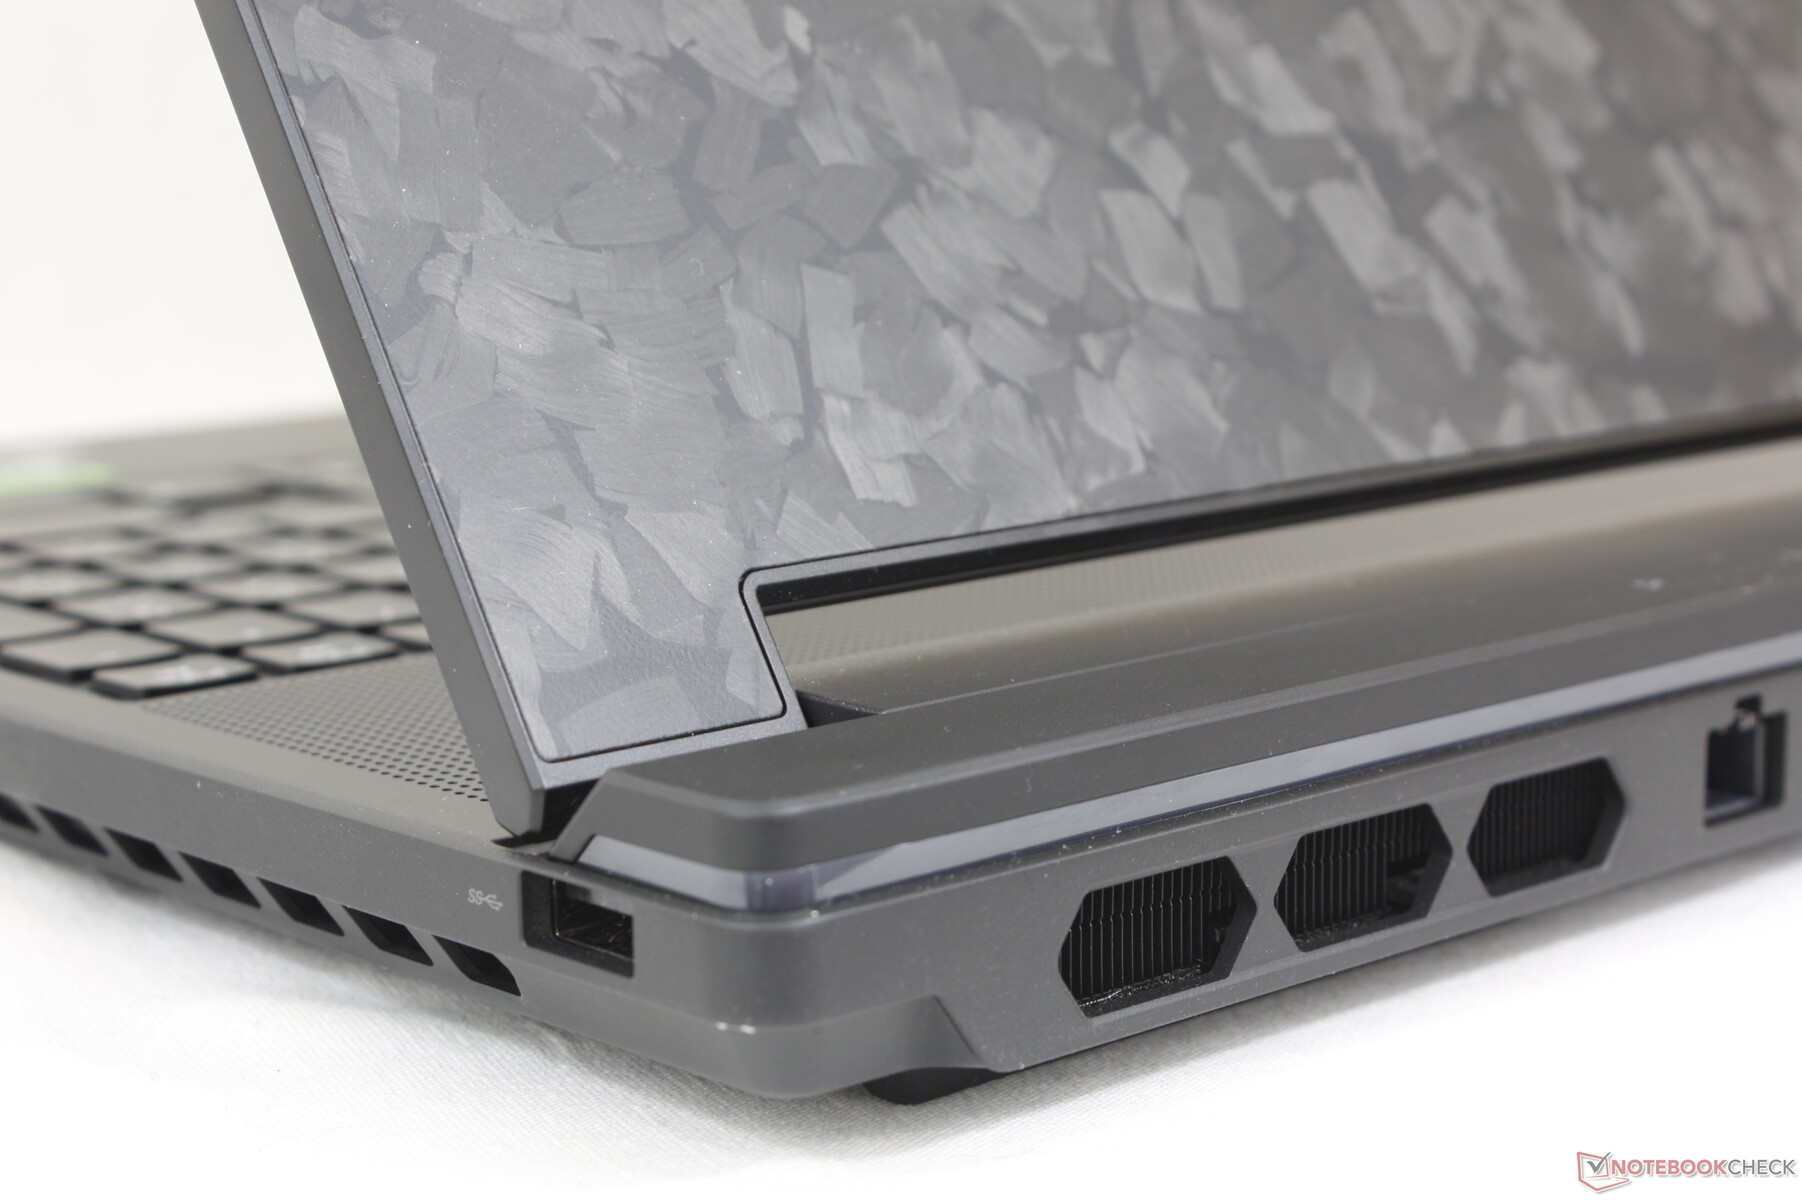
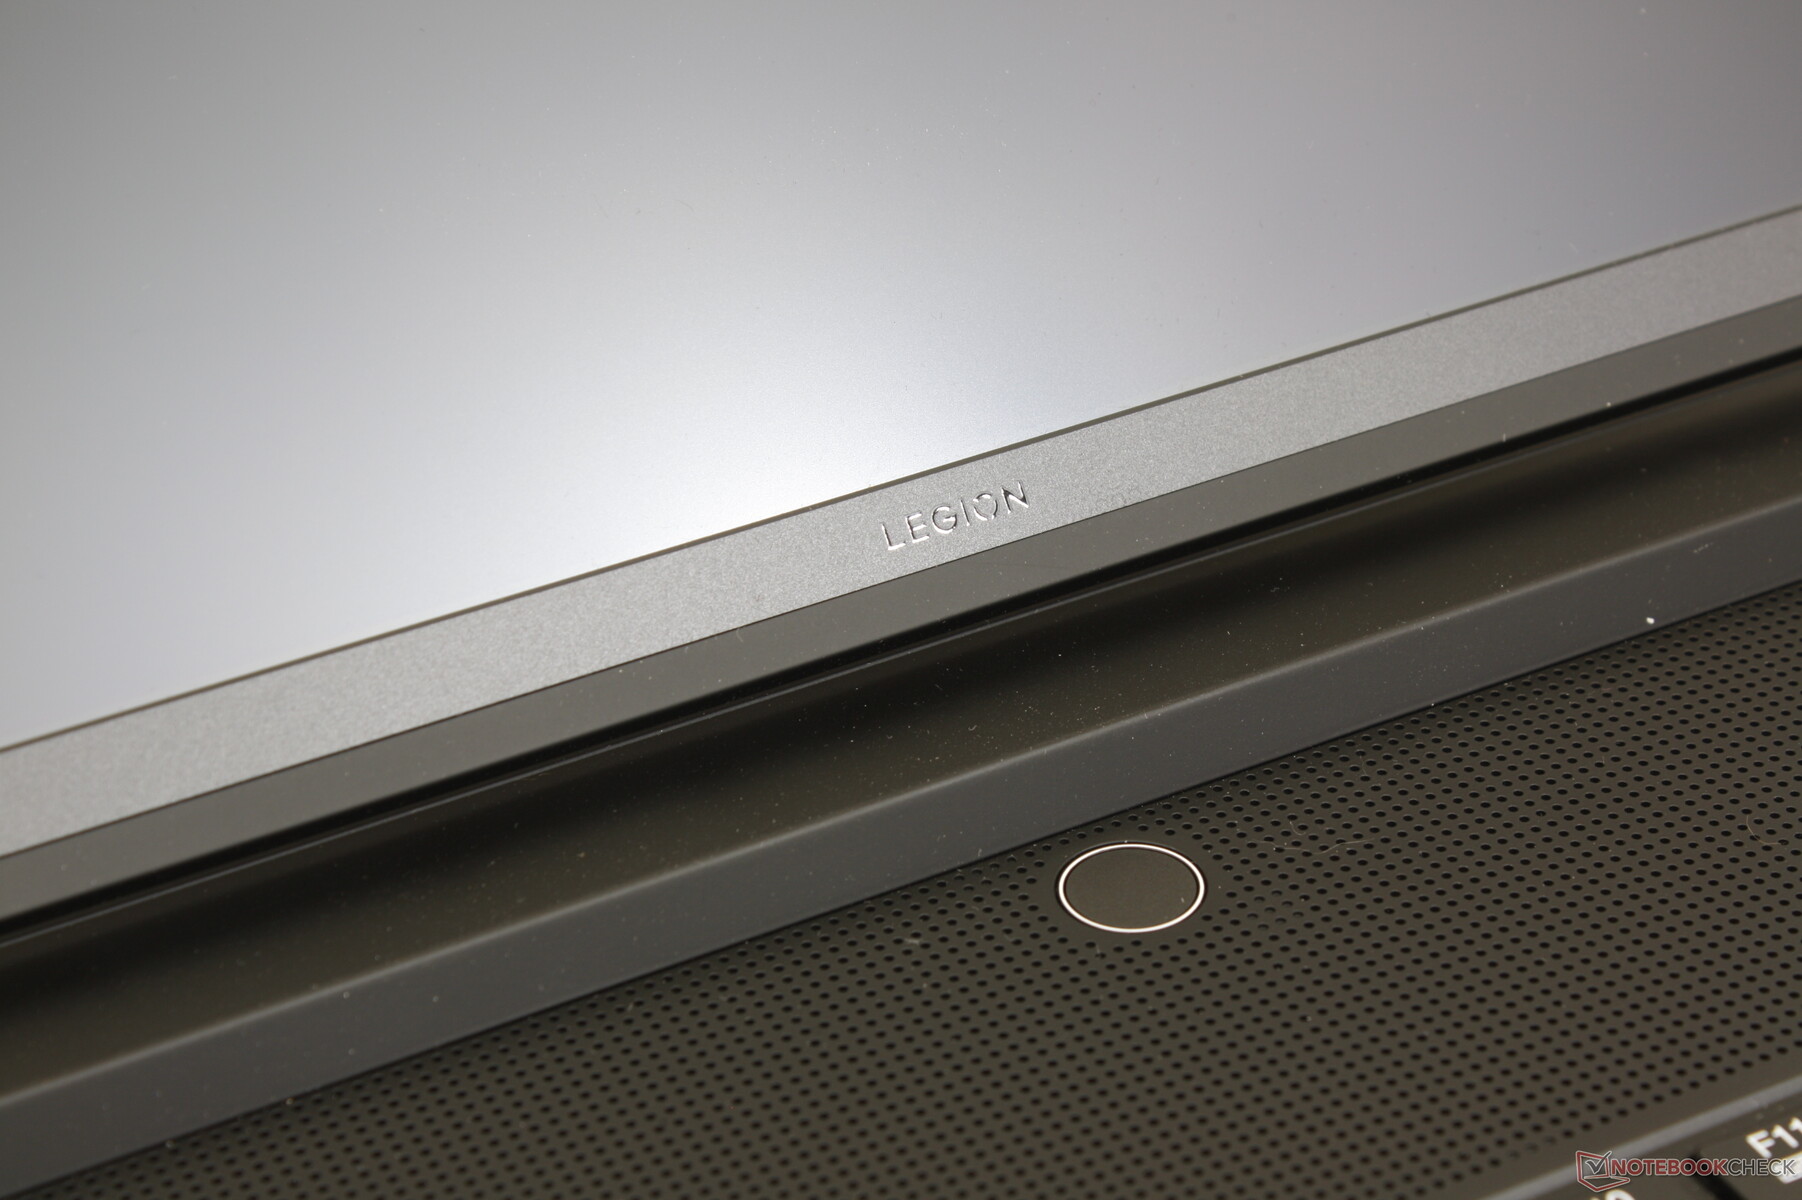
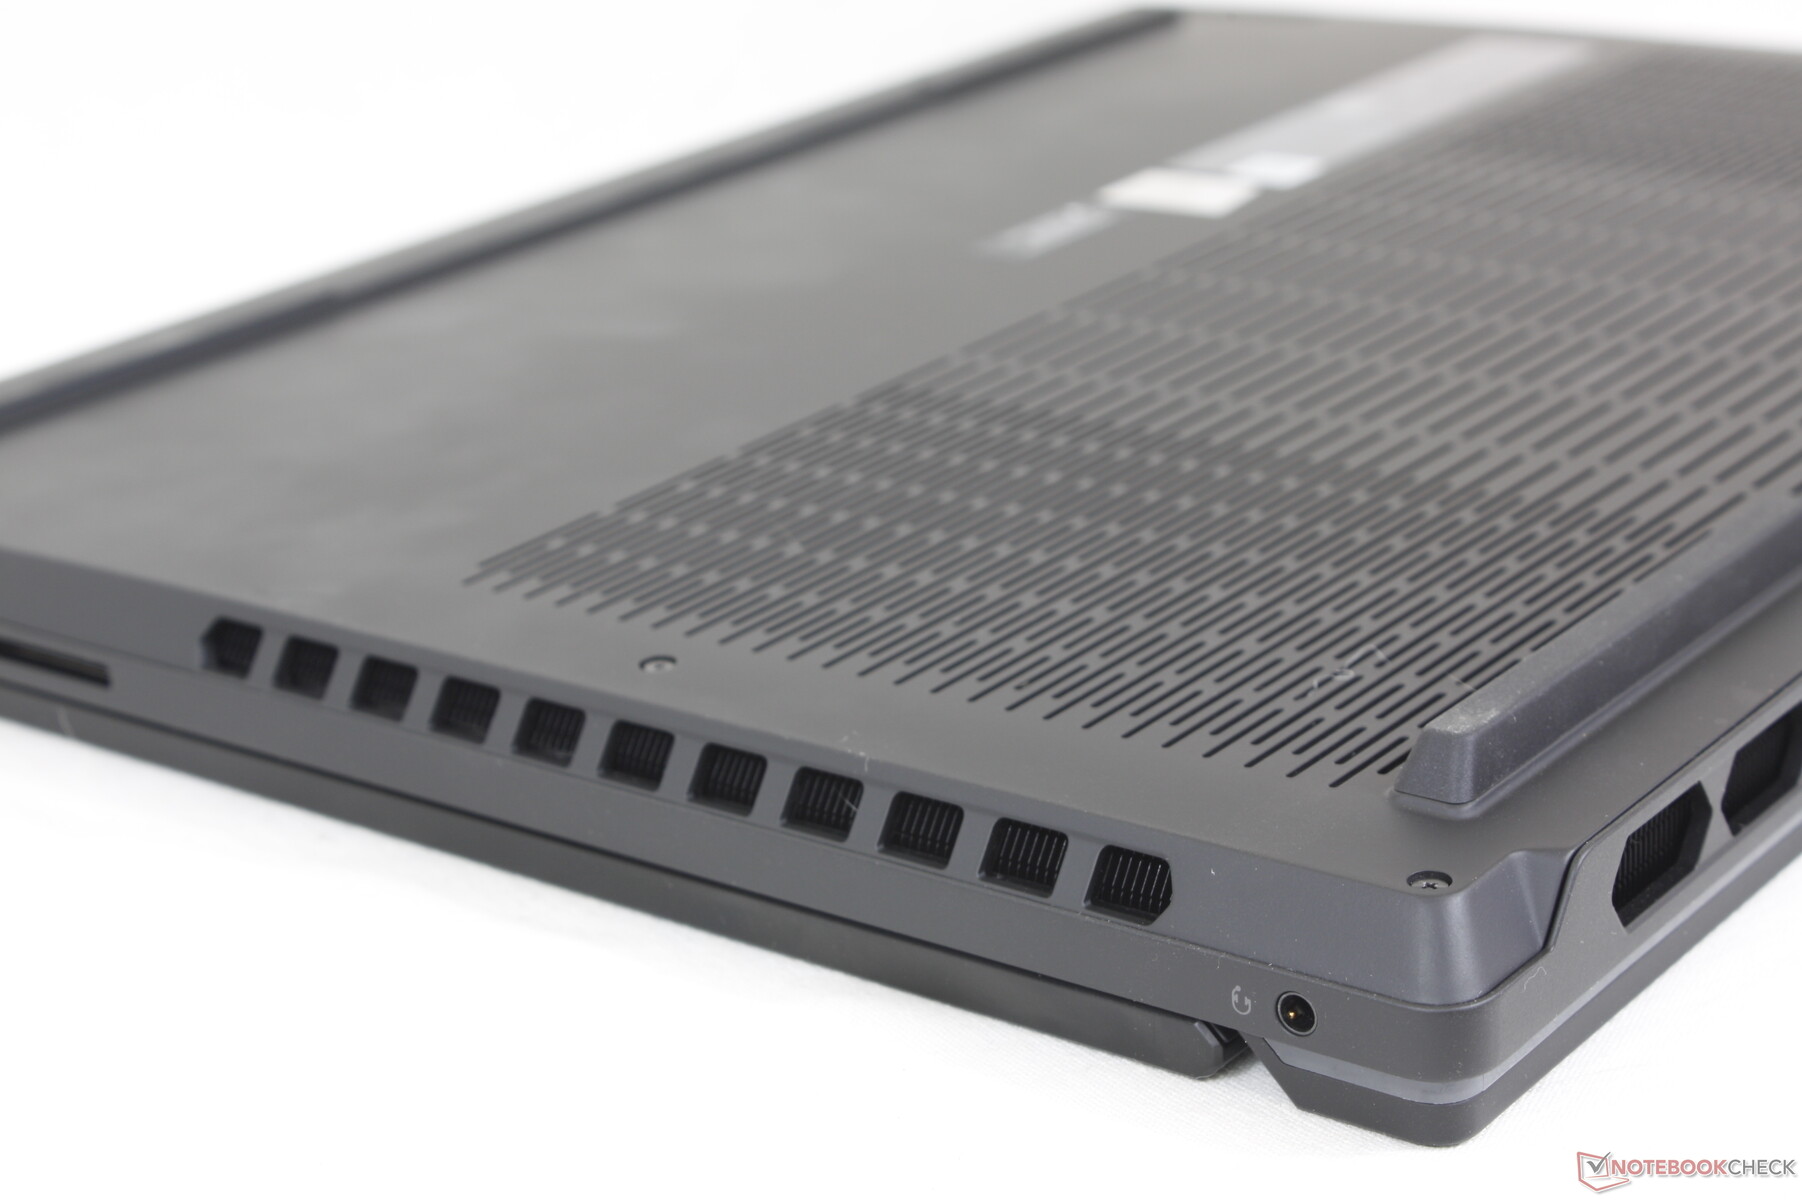
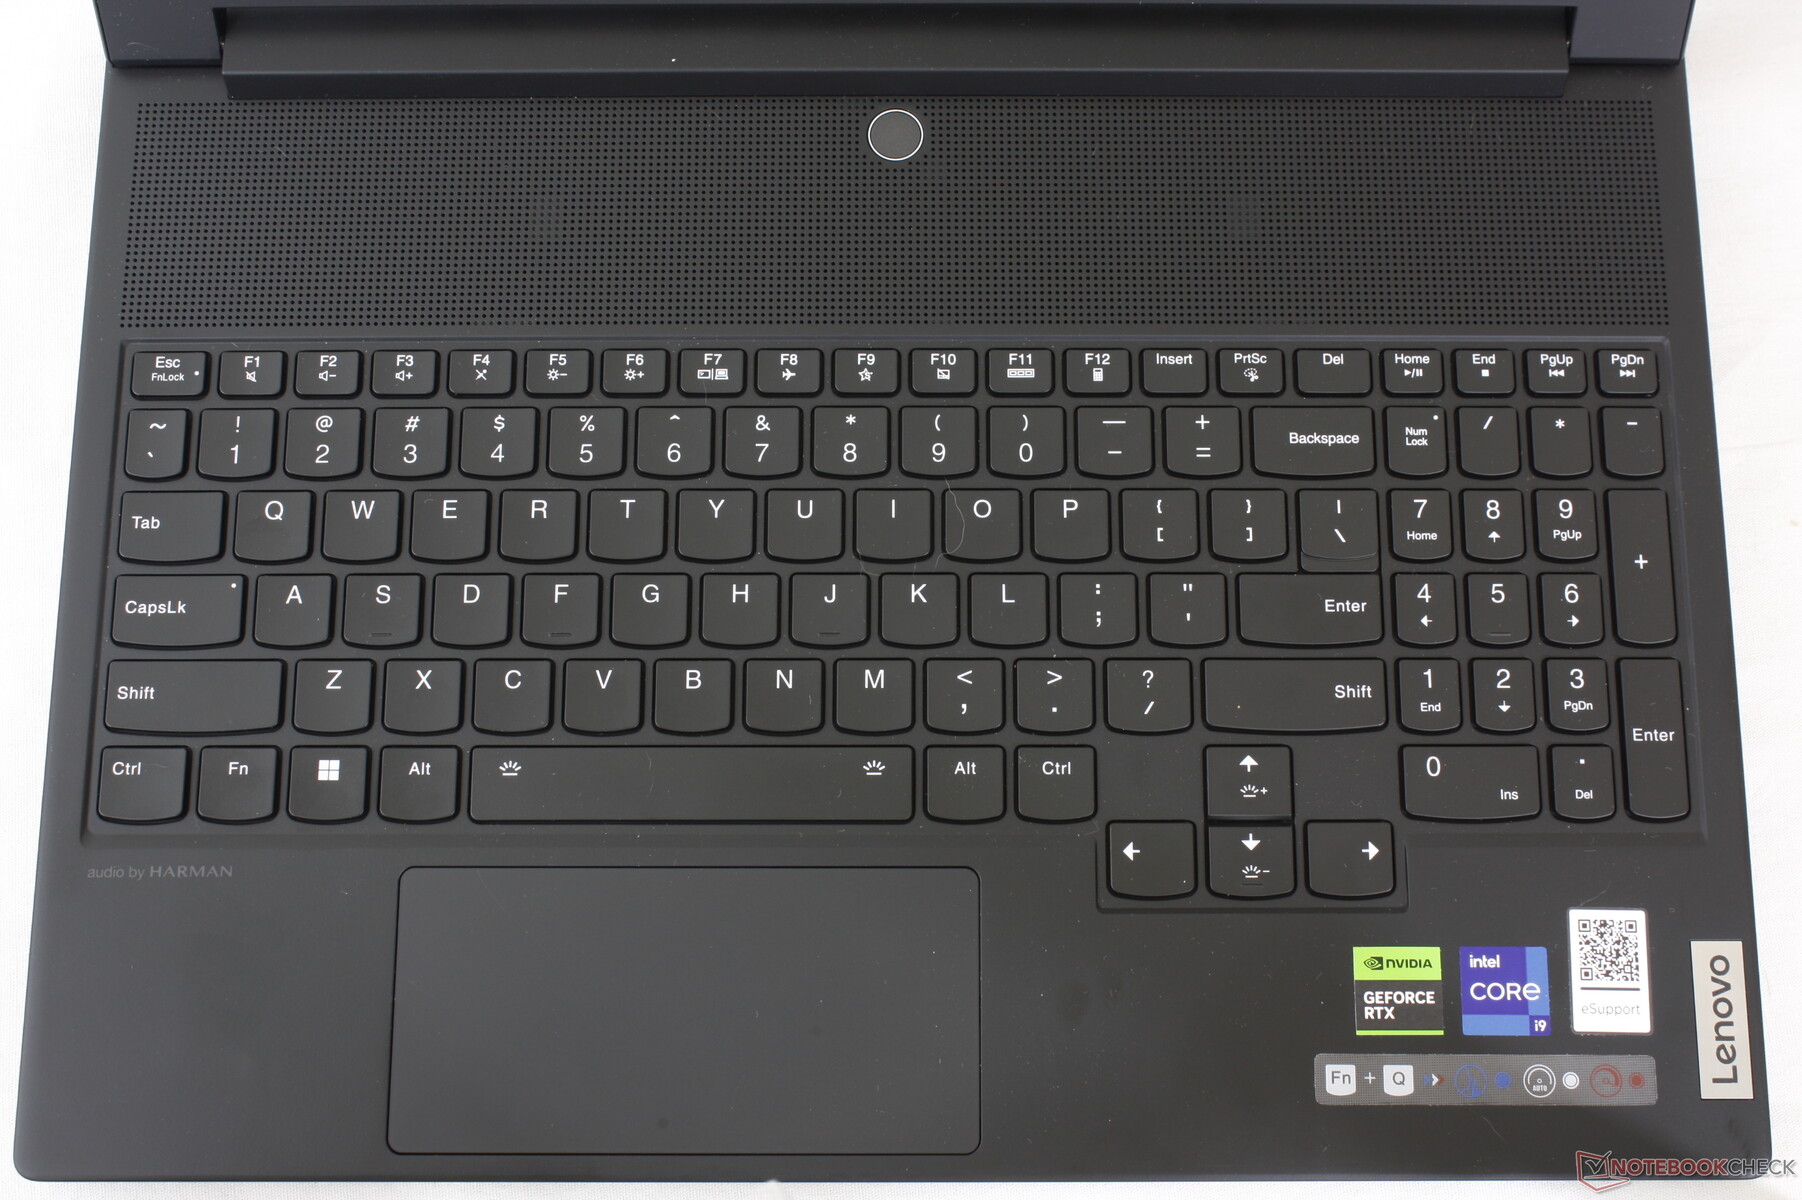
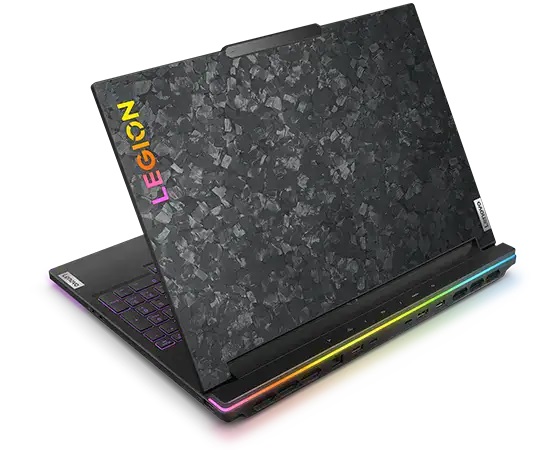
Legion 9i 16, Legion 7 serisi ile benzer mat magnezyum malzemeler kullanmaktadır, ancak görsel olarak çok farklıdırlar. İlk olarak klavye Asus Zephyrus S GX531 daha fazla havalandırma ızgarası ve daha büyük bir soğutma çözümüne yer açmak için kullanıcıya daha yakın olacak şekilde öne doğru itilmiştir. İkinci olarak, dış kapağın etrafındaki benzersiz karbon kaplama deseni, oyuncu estetiğine katkıda bulunurken parmak izi birikimini azaltmaya yardımcı olur. Ve son olarak, çıkıntılı arka kısım, tüm dahili değişiklikleri ve daha zorlu donanımları daha iyi barındırmak için kalınlaştırıldı.
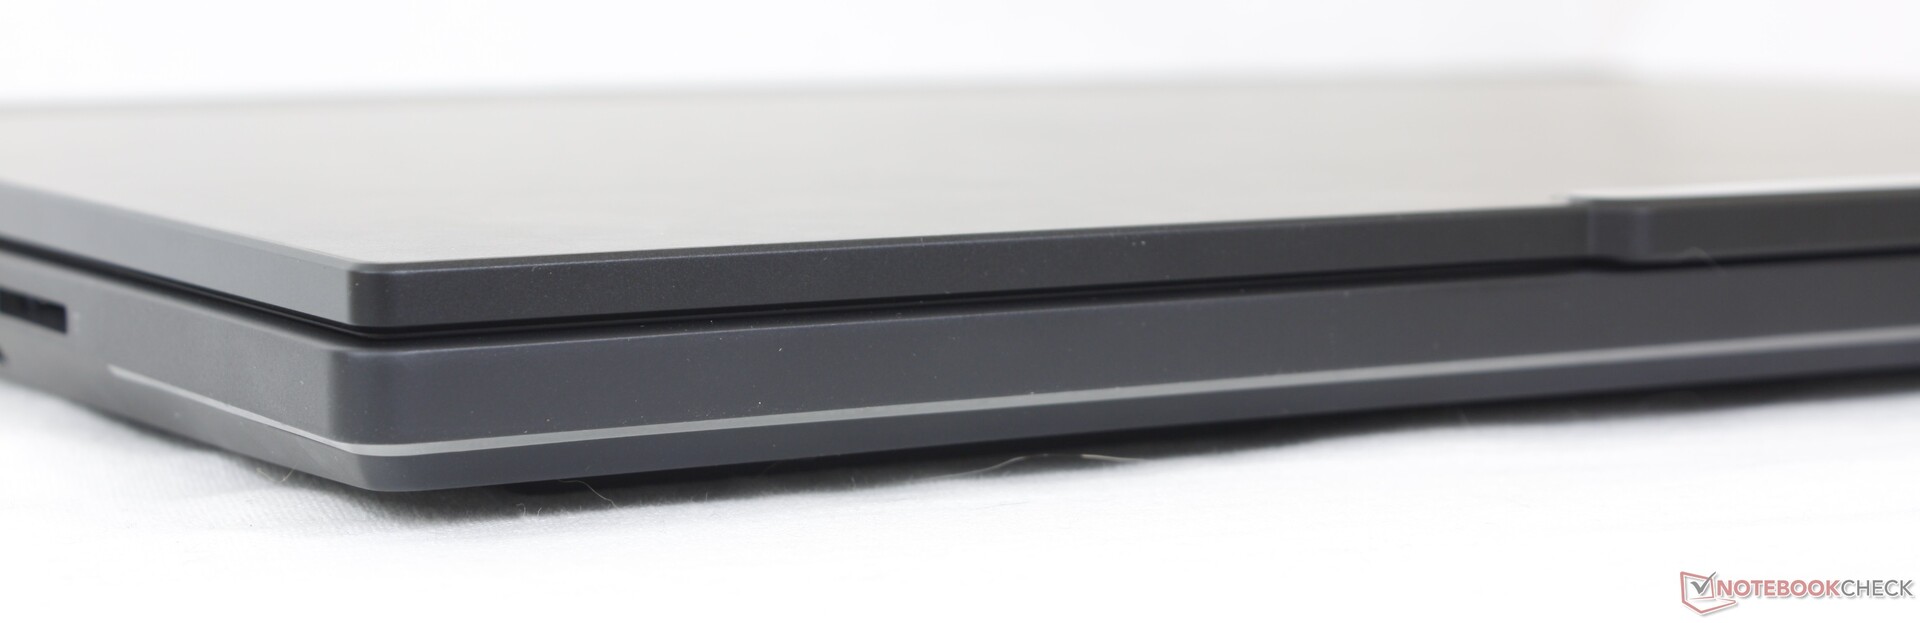
Kasa kalitesi mükemmel, sadece kapağı çevirmeye çalışırken veya klavye ortasına ya da avuç içi dayanaklarına basarken biraz eğiliyor.
Legion 7 16'dan daha iyi ya da daha kötü hissettirmiyor Alienware x16 R1 özellikle de hepsinin ağırlığı aynı olduğu için sağlamlık açısından. Bununla birlikte, menteşeler, çok daha büyük menteşelere kıyasla nispeten küçük kalmaktadır Asus Strix serisi ya da son zamanlardaMSI Raider GE68. Yeni olduklarında tatmin edici olabilirler, ancak uzun vadede ne kadar iyi performans göstereceklerini yalnızca zaman gösterecektir.
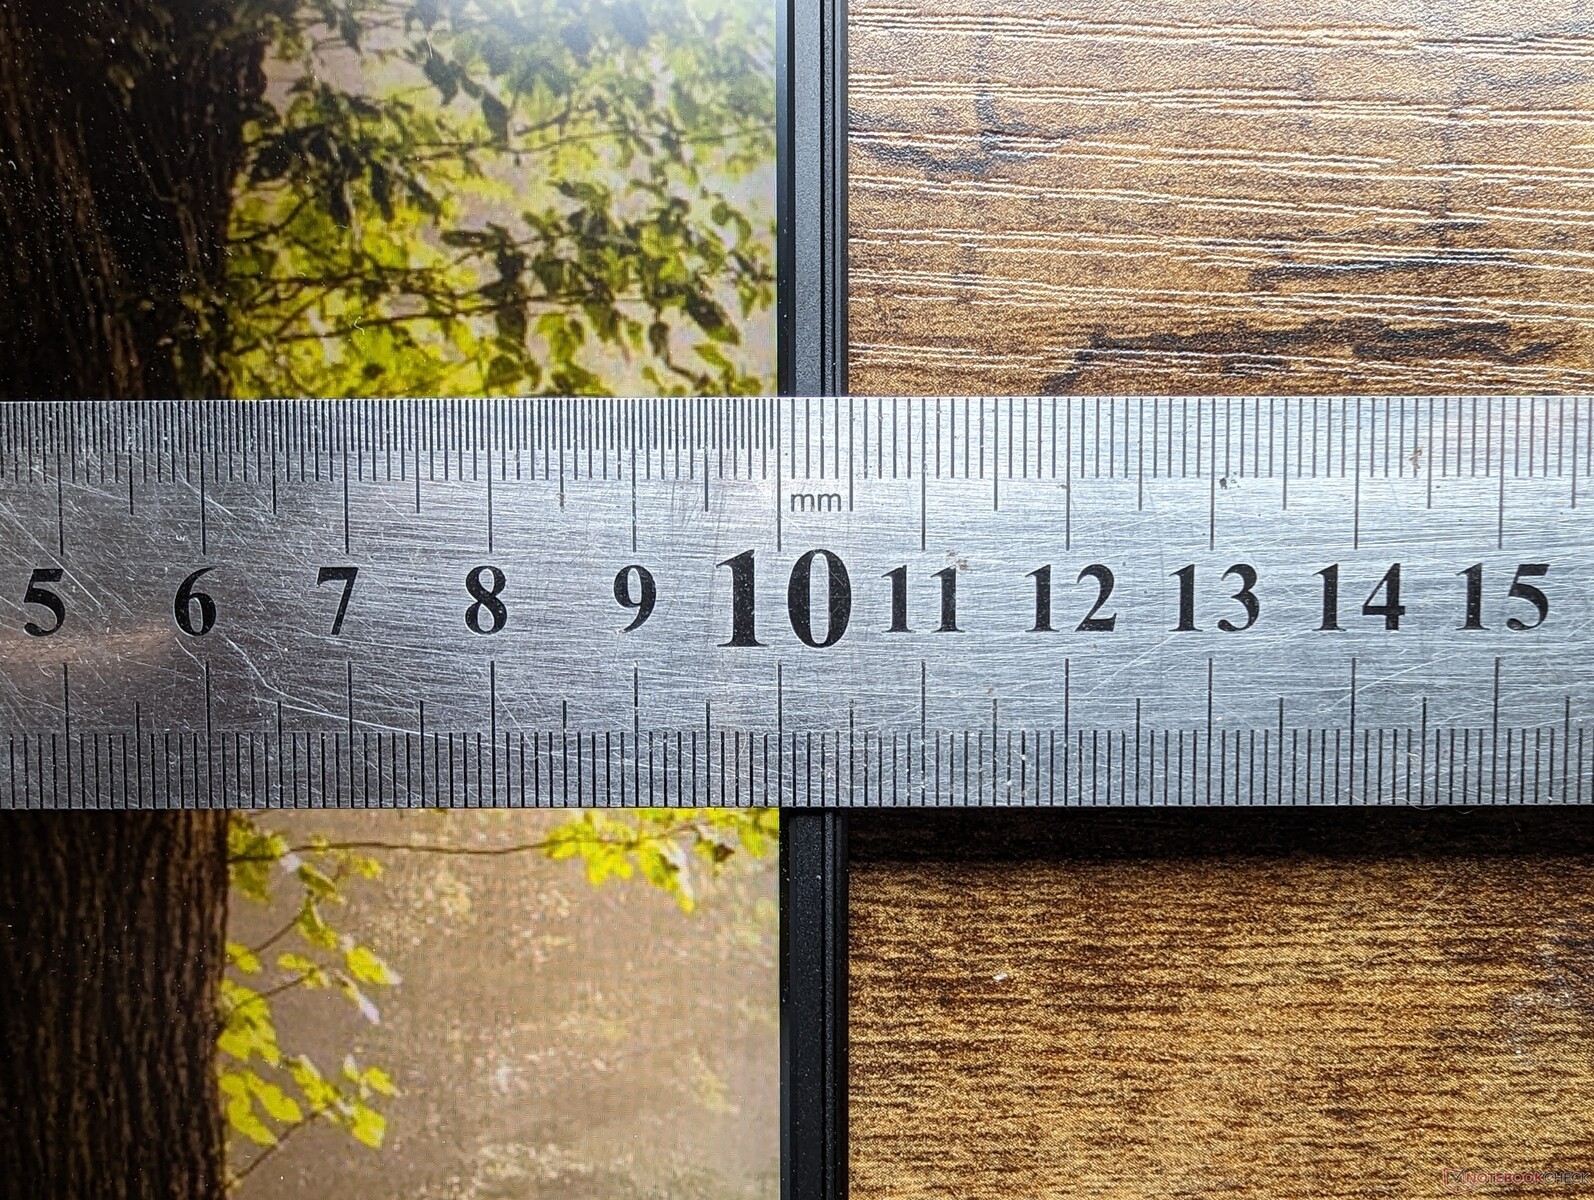
Genişletilmiş arka kısım ve zorlu Core i9/RTX 4090 dahili parçalar, Legion 7 16'dan daha büyük ve daha kalın bir kasaya yol açmıştır. Legion 9i 16, ROG Strix G16 gibi diğer birçok 16 inç oyun dizüstü bilgisayarından daha büyük olduğu için farklar göze çarpıyor, Bıçak 16veya Omen Transcend 16. Yüksek performans ve gelişmiş özellikler bu konuda taşınabilirlik pahasına gelir.
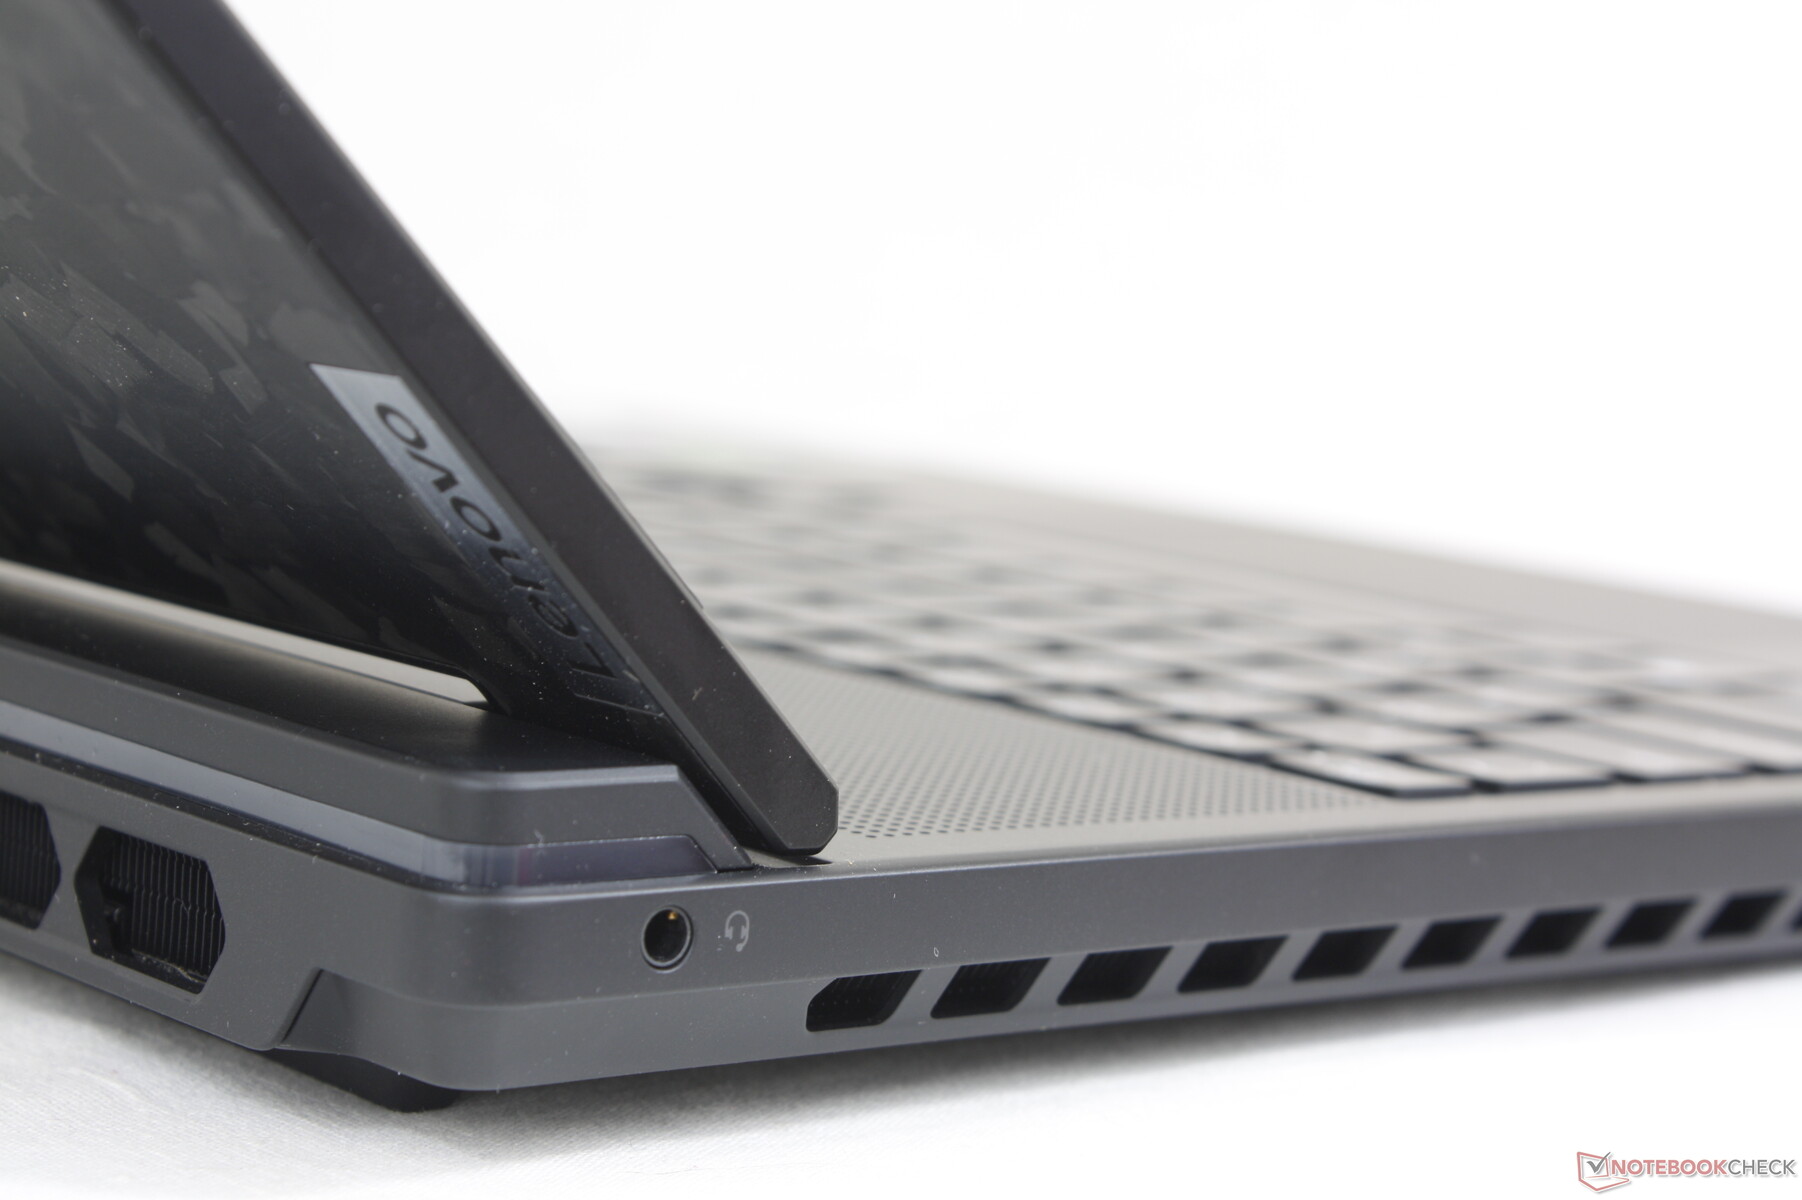
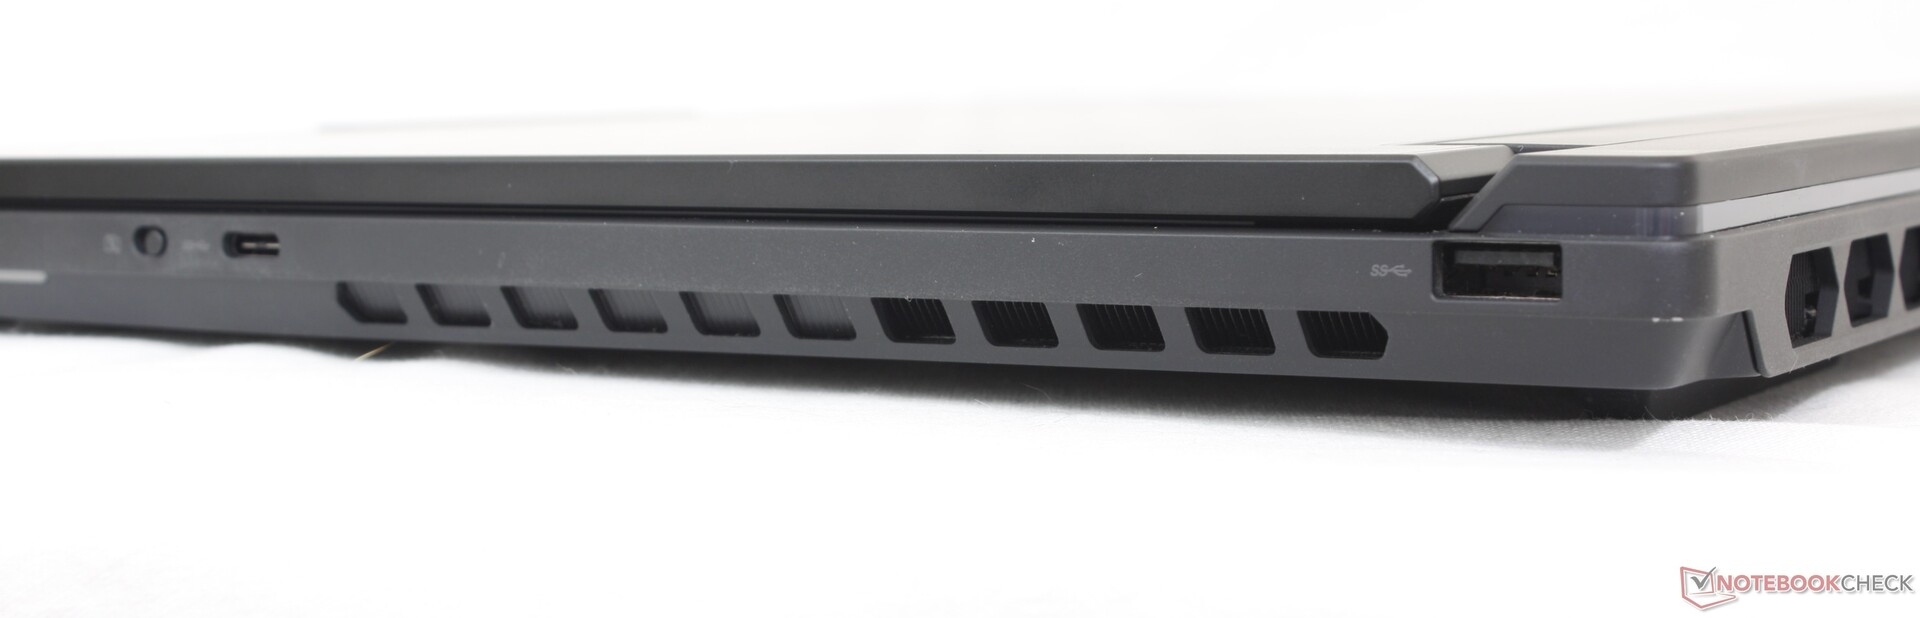
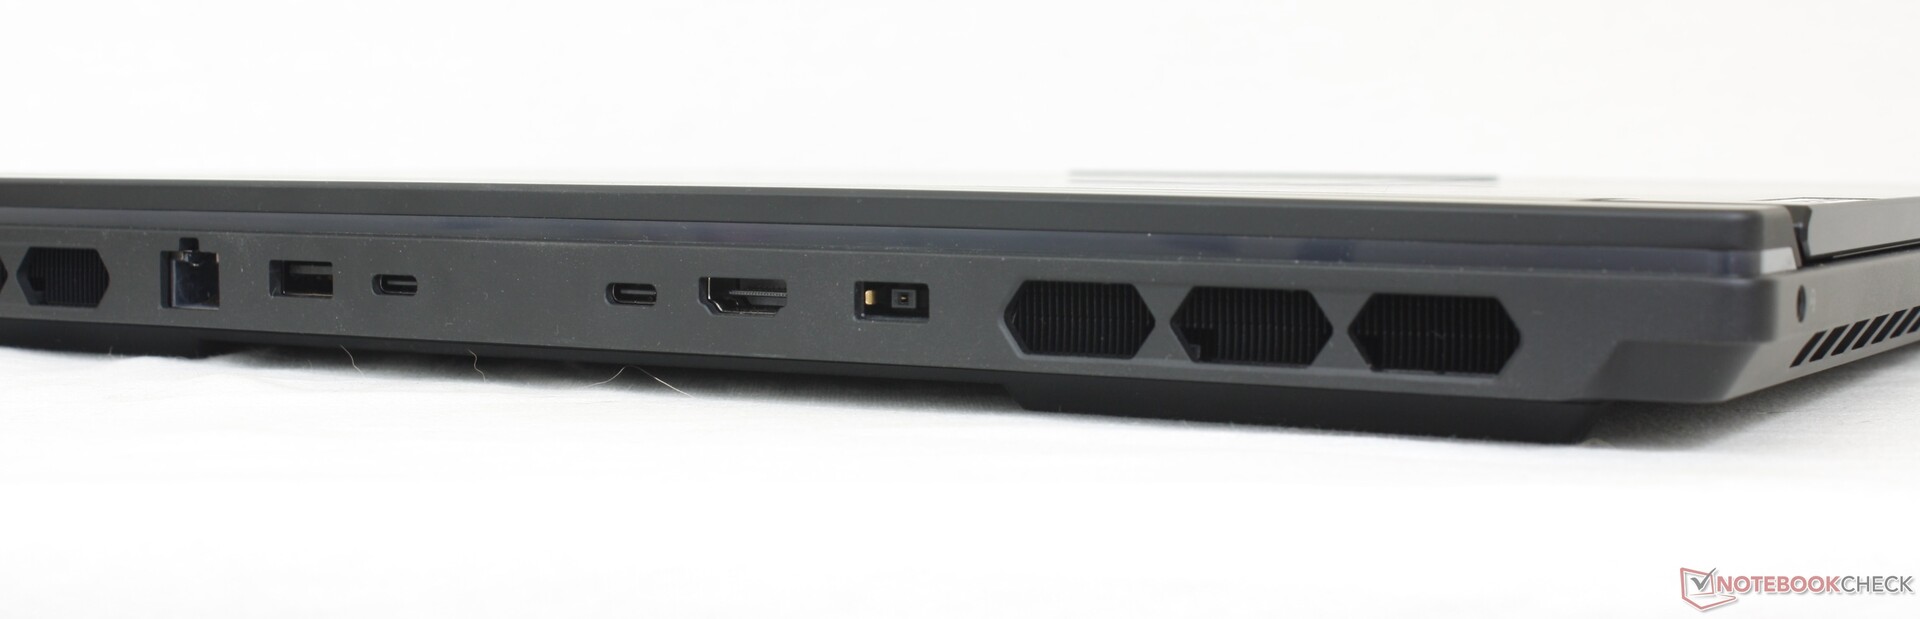
Bağlanabilirlik - Seçebileceğiniz Çok Şey Var
Port seçenekleri bol ve çoğu yanlar yerine arka kısımda yer alıyor. Alienware X16 R1'deki arka bağlantı noktalarının aksine, Lenovo'daki bağlantı noktaları daha kolay erişim için LED göstergelerle ayrı ayrı etiketlenmiştir.
Yalnızca iki arka USB-C bağlantı noktası harici monitörler için veya dizüstü bilgisayarı Güç Dağıtımı yoluyla şarj etmek için kullanılabilir. Sağ kenardaki üçüncü USB-C bağlantı noktası yalnızca veri ve harici cihazları şarj etmek içindir.
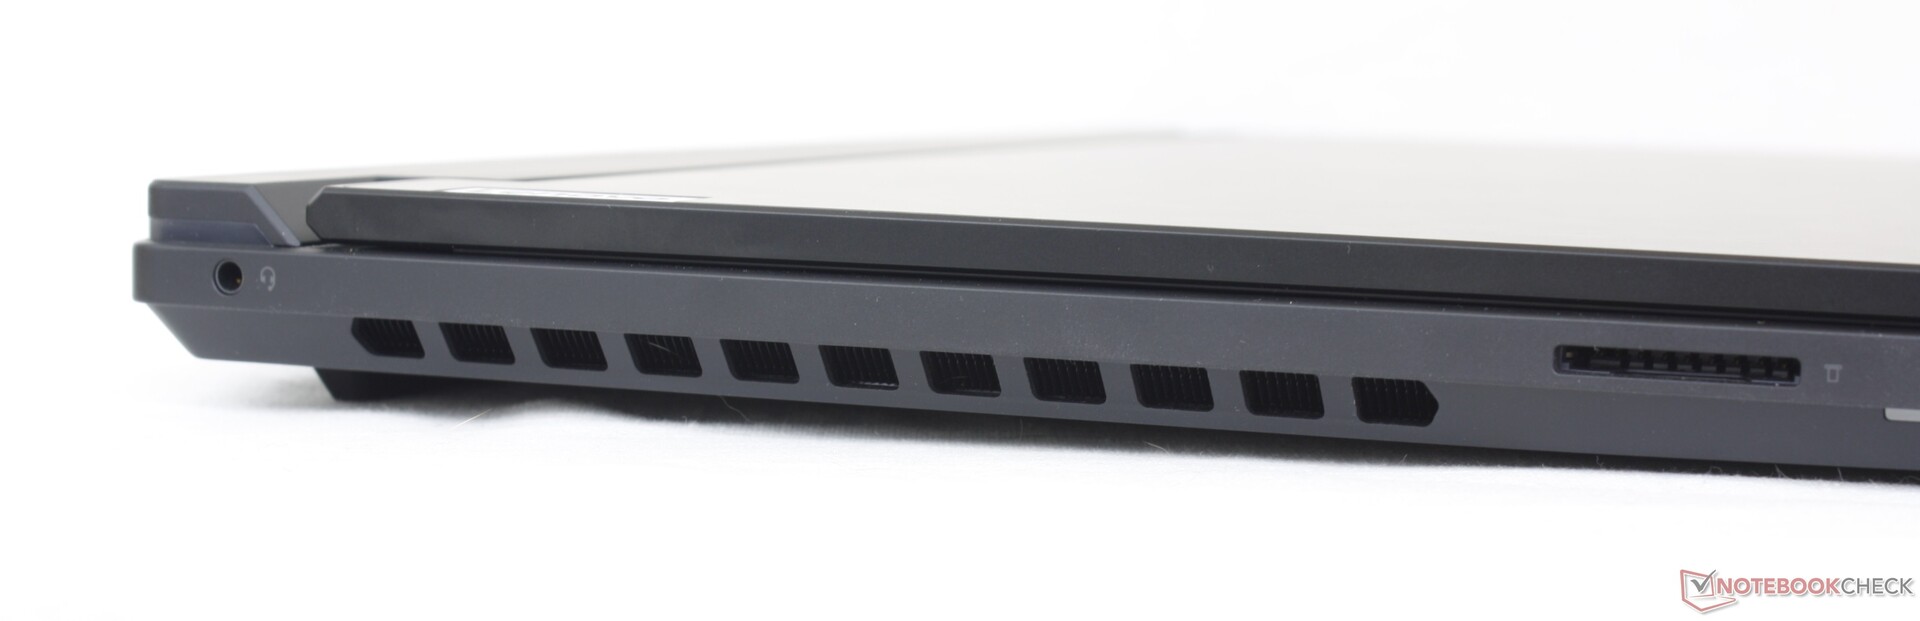
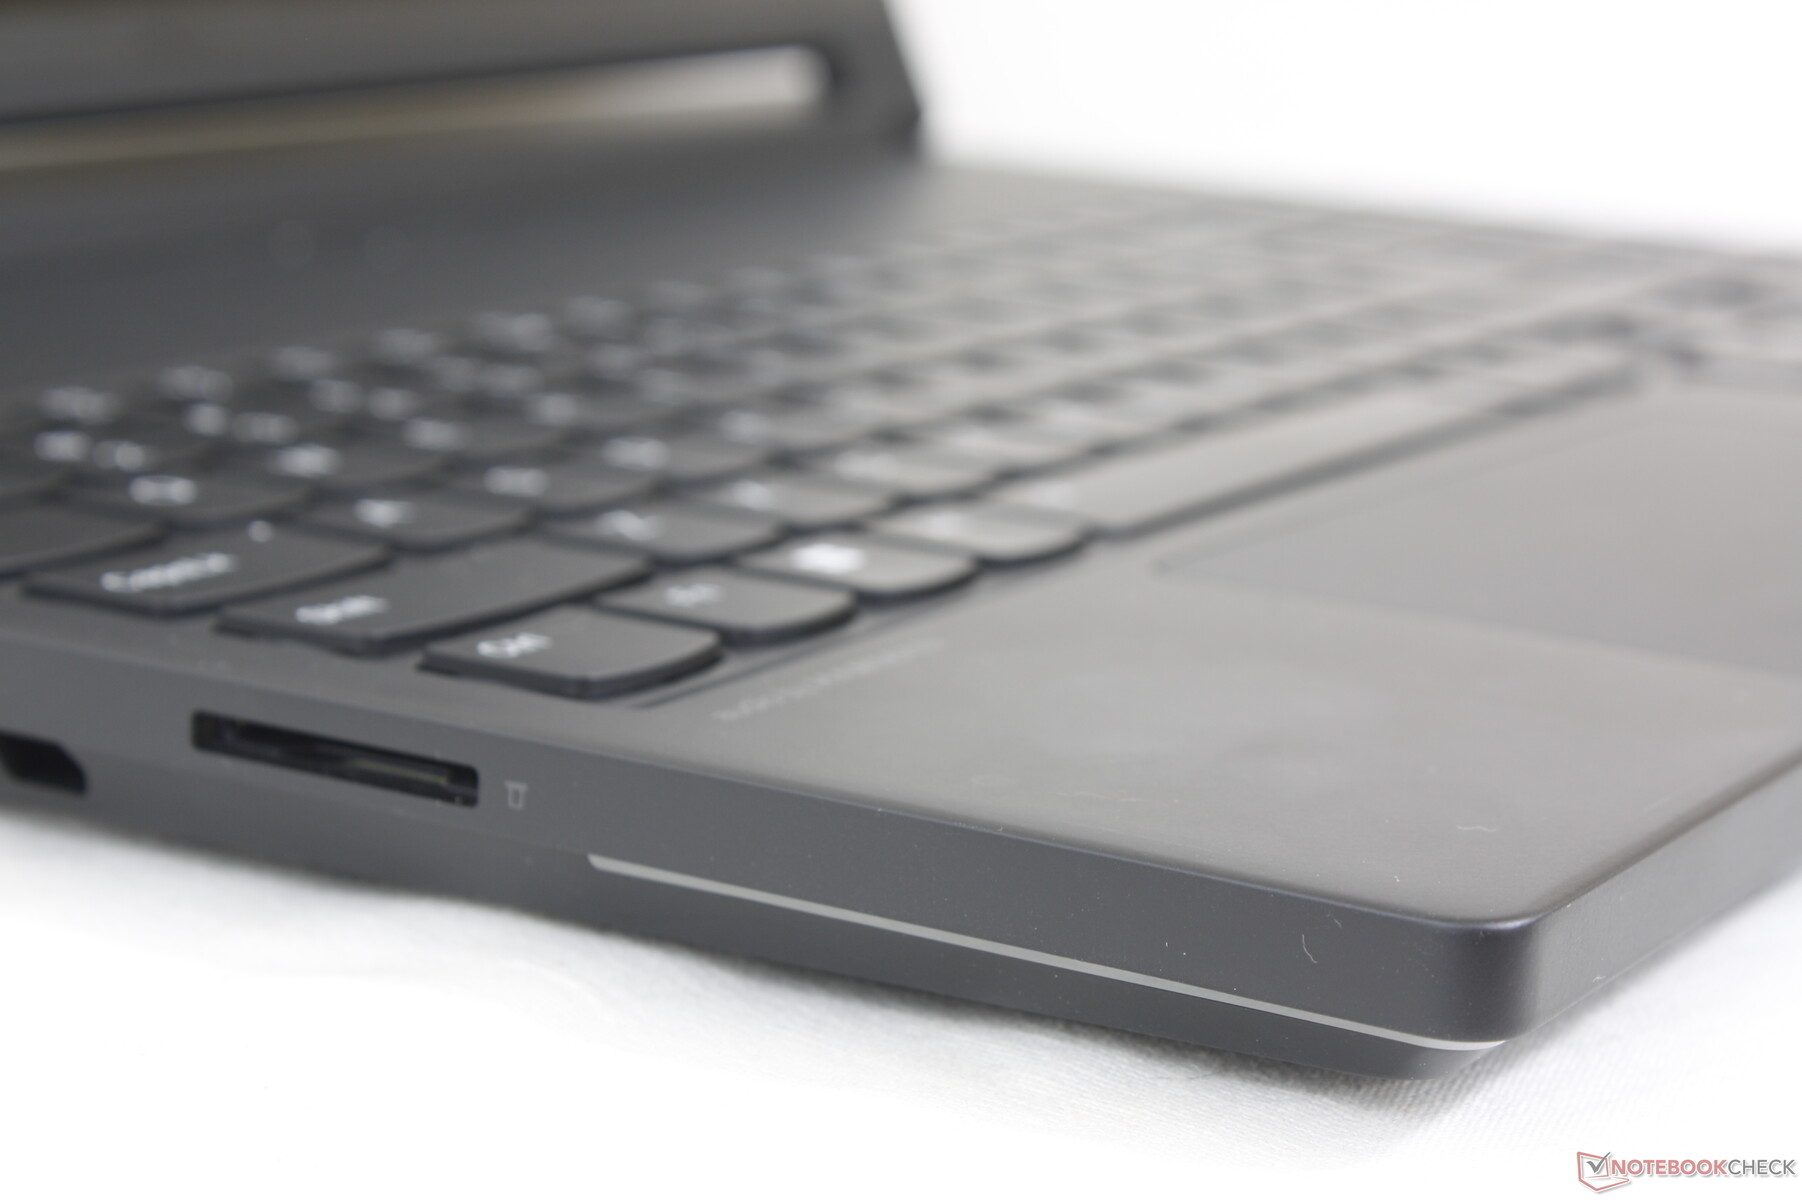
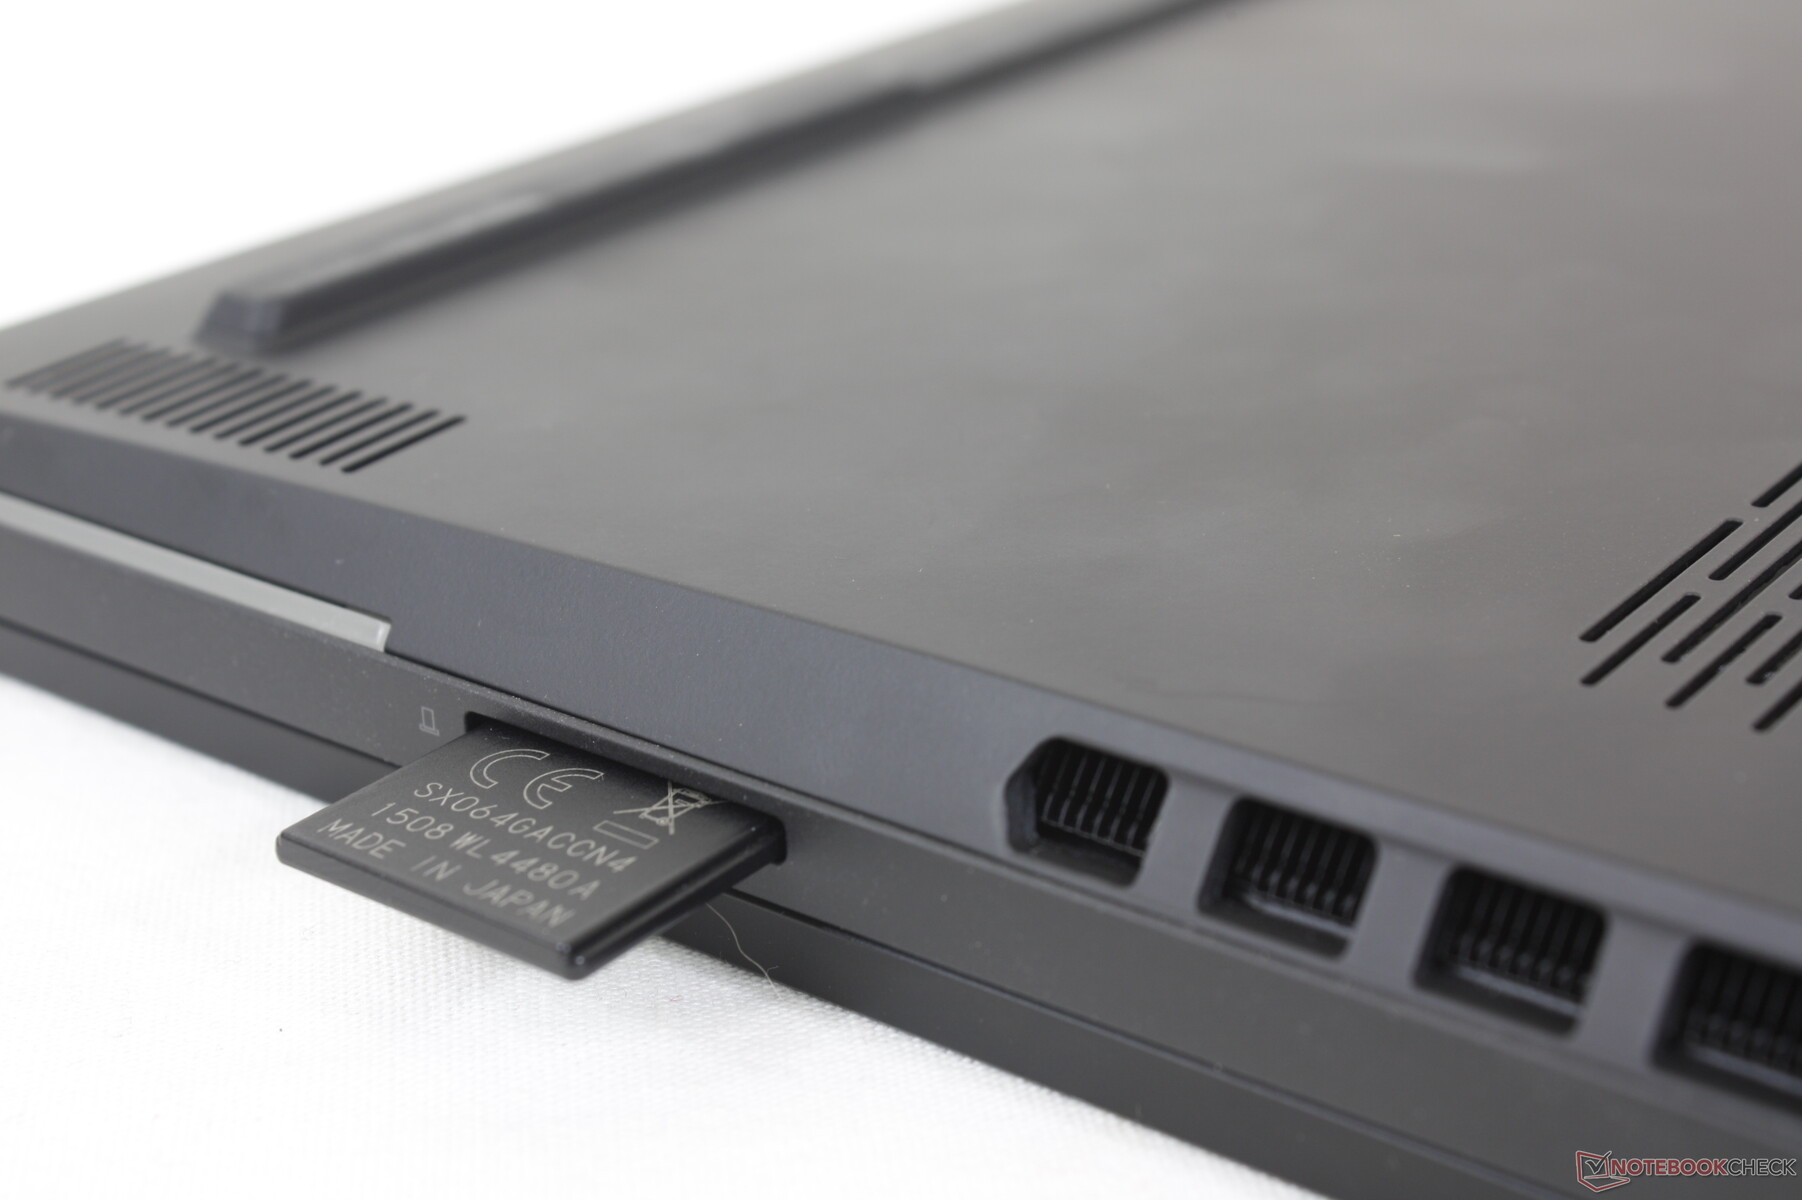
SD Kart Okuyucu
Entegre SD okuyucu, içerik oluşturucuları olduğu kadar sıkı oyuncuları da Legion 9i'ye çekmeyi amaçlıyor. Bununla birlikte, aktarım hızları o kadar da iyi değil, SD okuyucunun yarısından daha az bir hıza sahip.Razer Blade 16.
| SD Card Reader | |
| average JPG Copy Test (av. of 3 runs) | |
| Razer Blade 16 Early 2023 RTX 4090 (Angelbird AV PRO 128 GB V60) | |
| Lenovo Legion 9 16IRX8 (Toshiba Exceria Pro SDXC 64 GB UHS-II) | |
| Alienware x16 R1 (AV PRO microSD 128 GB V60) | |
| Lenovo Legion Slim 5 16APH8 (PNY EliteX-Pro60 V60 256 GB) | |
| maximum AS SSD Seq Read Test (1GB) | |
| Alienware x16 R1 (AV PRO microSD 128 GB V60) | |
| Razer Blade 16 Early 2023 RTX 4090 (Angelbird AV PRO 128 GB V60) | |
| Lenovo Legion 9 16IRX8 (Toshiba Exceria Pro SDXC 64 GB UHS-II) | |
| Lenovo Legion Slim 5 16APH8 (PNY EliteX-Pro60 V60 256 GB) | |
İletişim
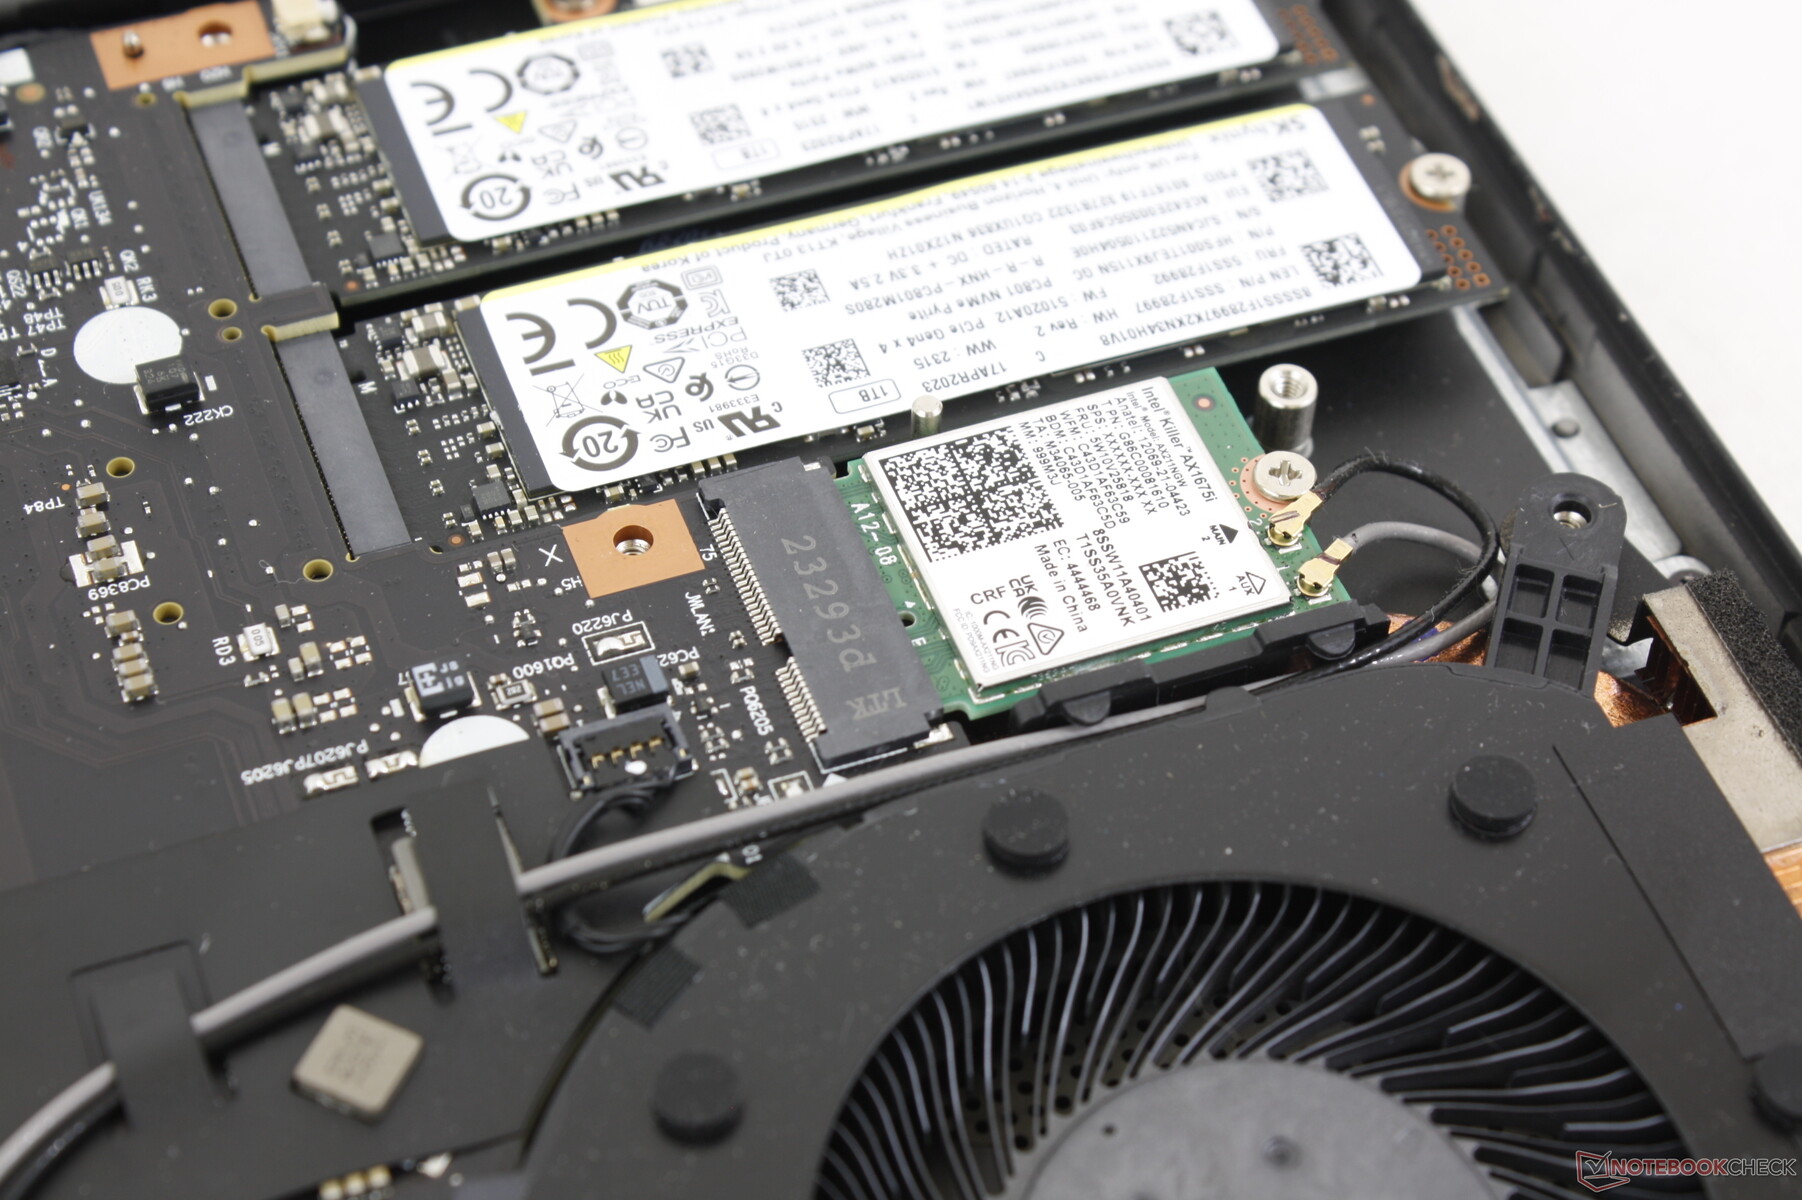
Normal AX211 için oyun markası olan Killer AX1675i standart olarak geliyor. Wi-Fi 6E ve Bluetooth 5.3 destekleniyor ve Asus AXE11000 6 GHz ağımızla eşleştirildiğinde hiçbir bağlantı sorunu yaşamadık.
Web kamerası
2 MP web kamerası, oyun dizüstü bilgisayar kategorisi için standarttır. Entegre bir kamera kapatma anahtarı olsa da, IR sensörü yoktur.

")
")
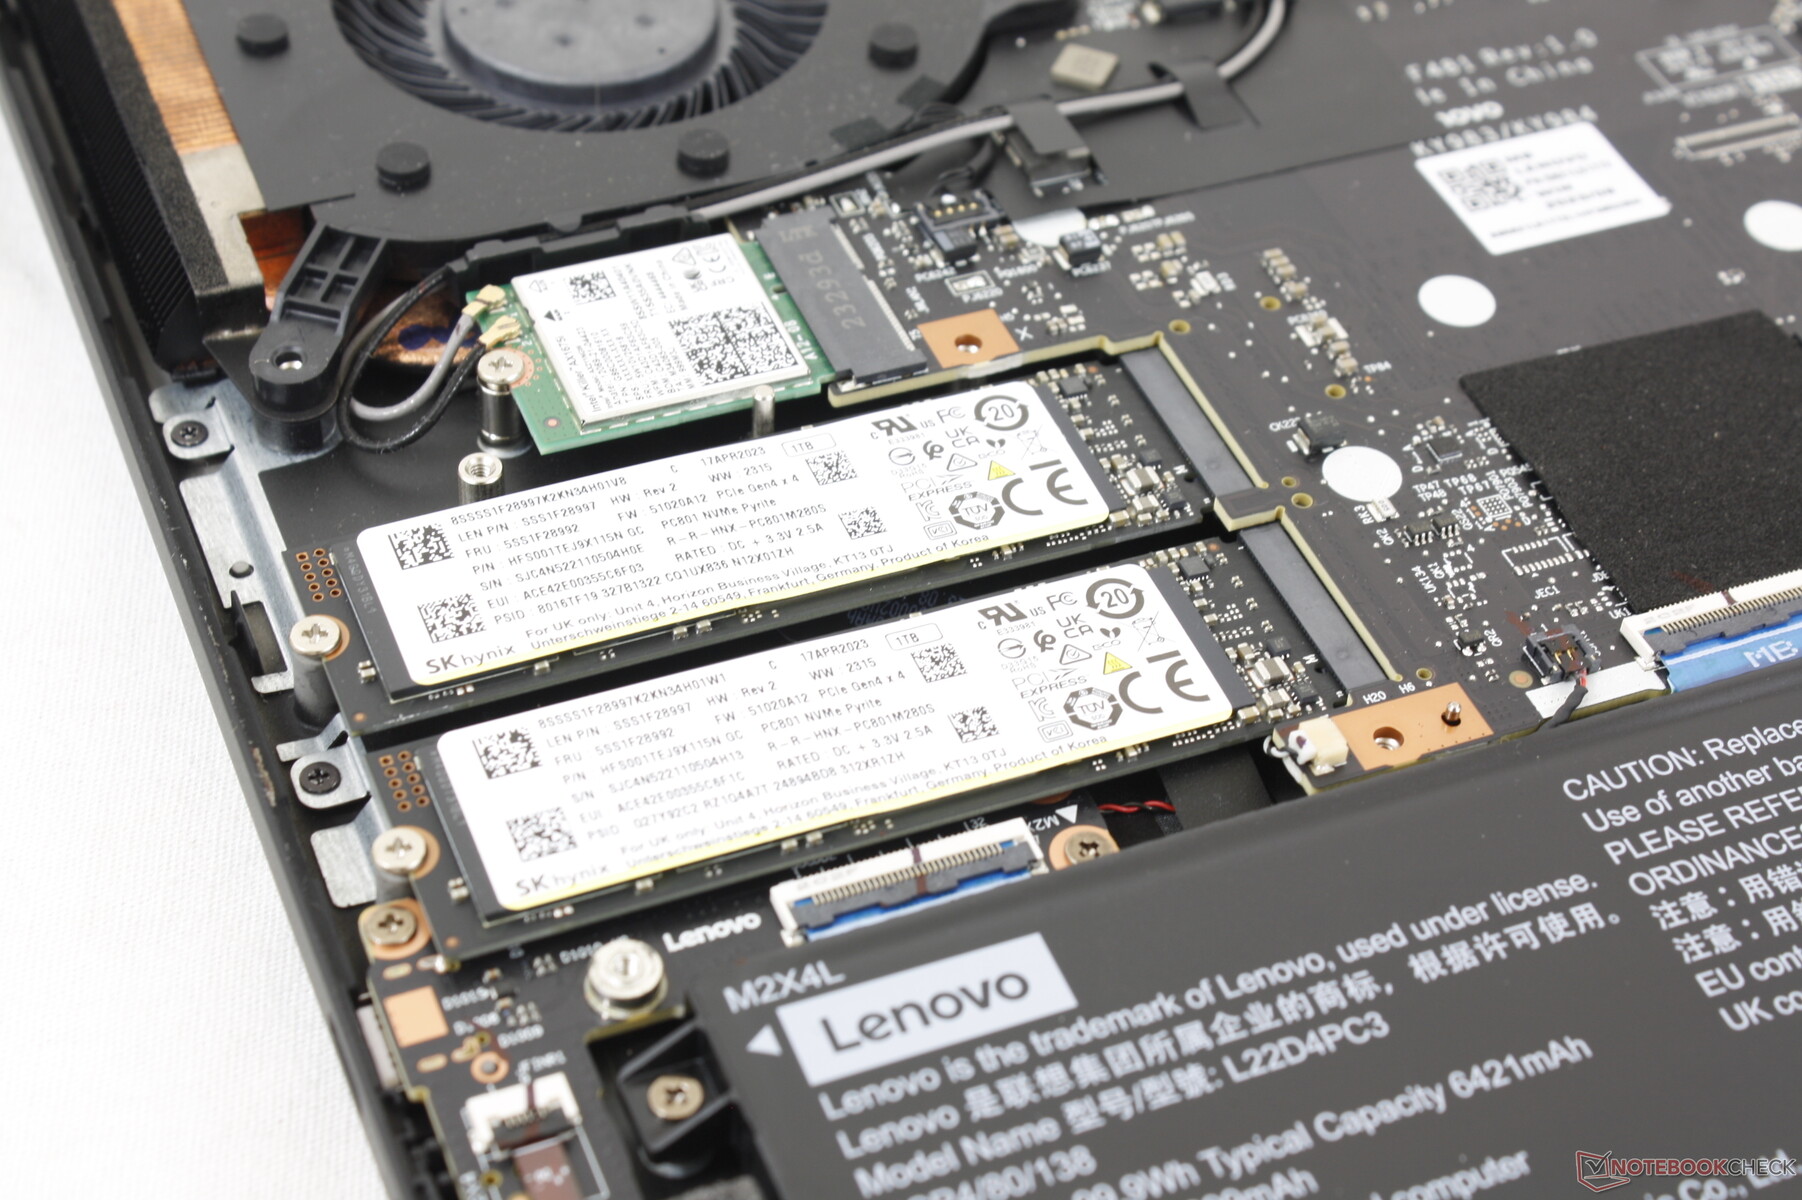
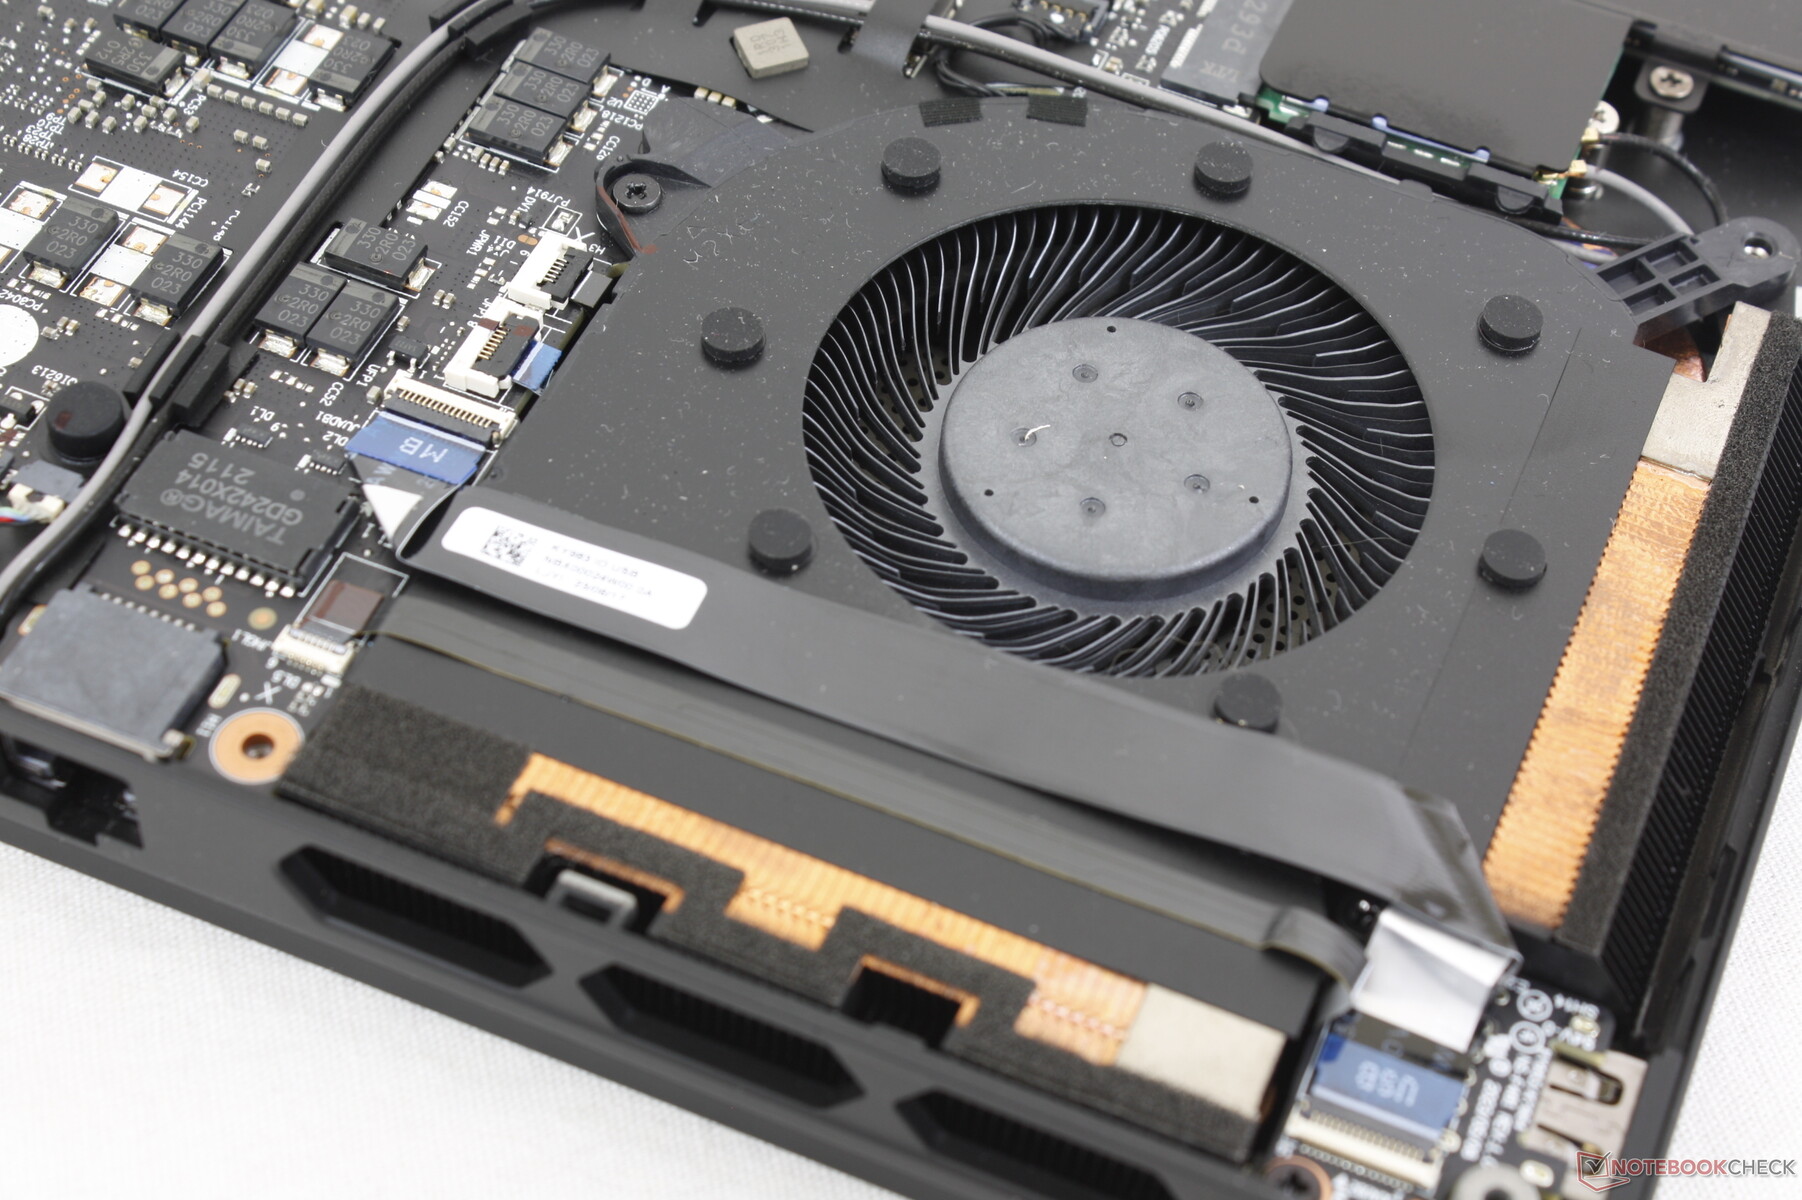
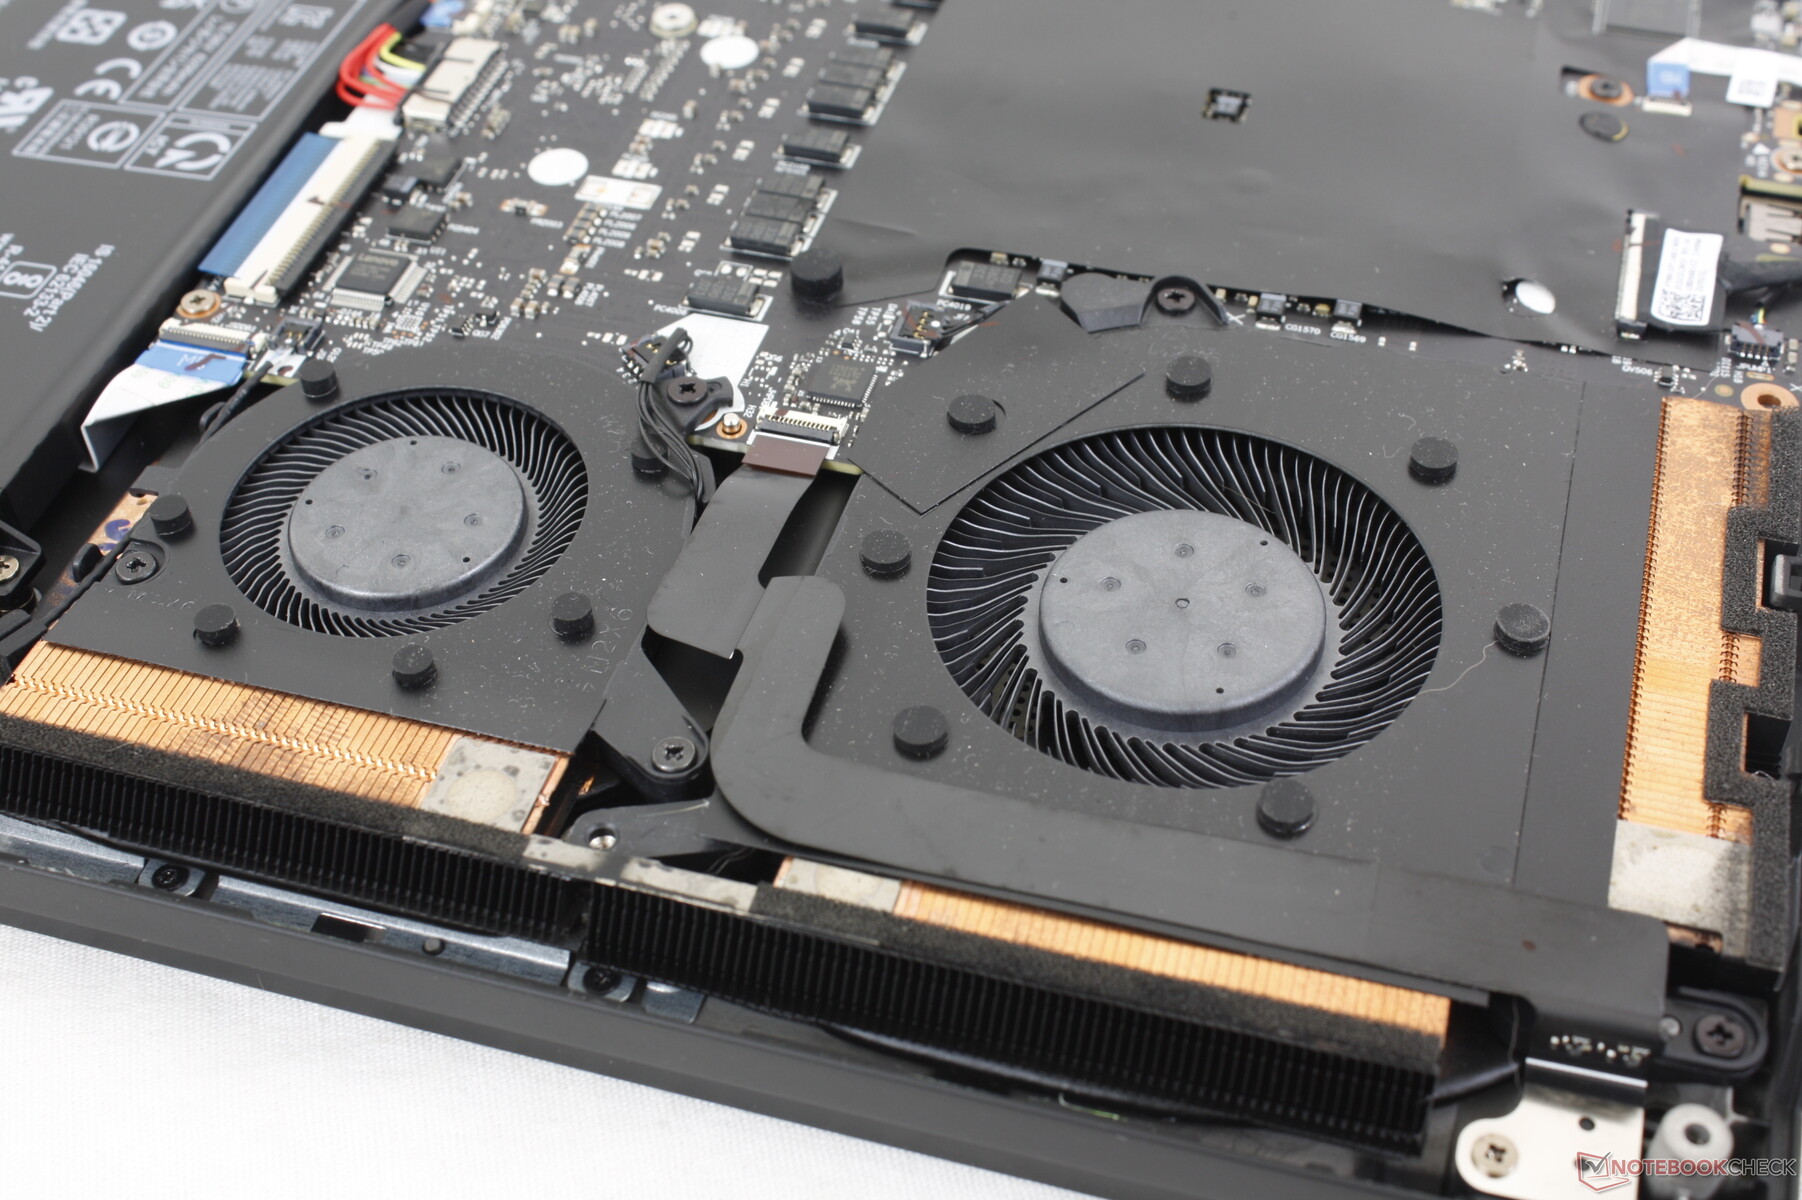
Bakım
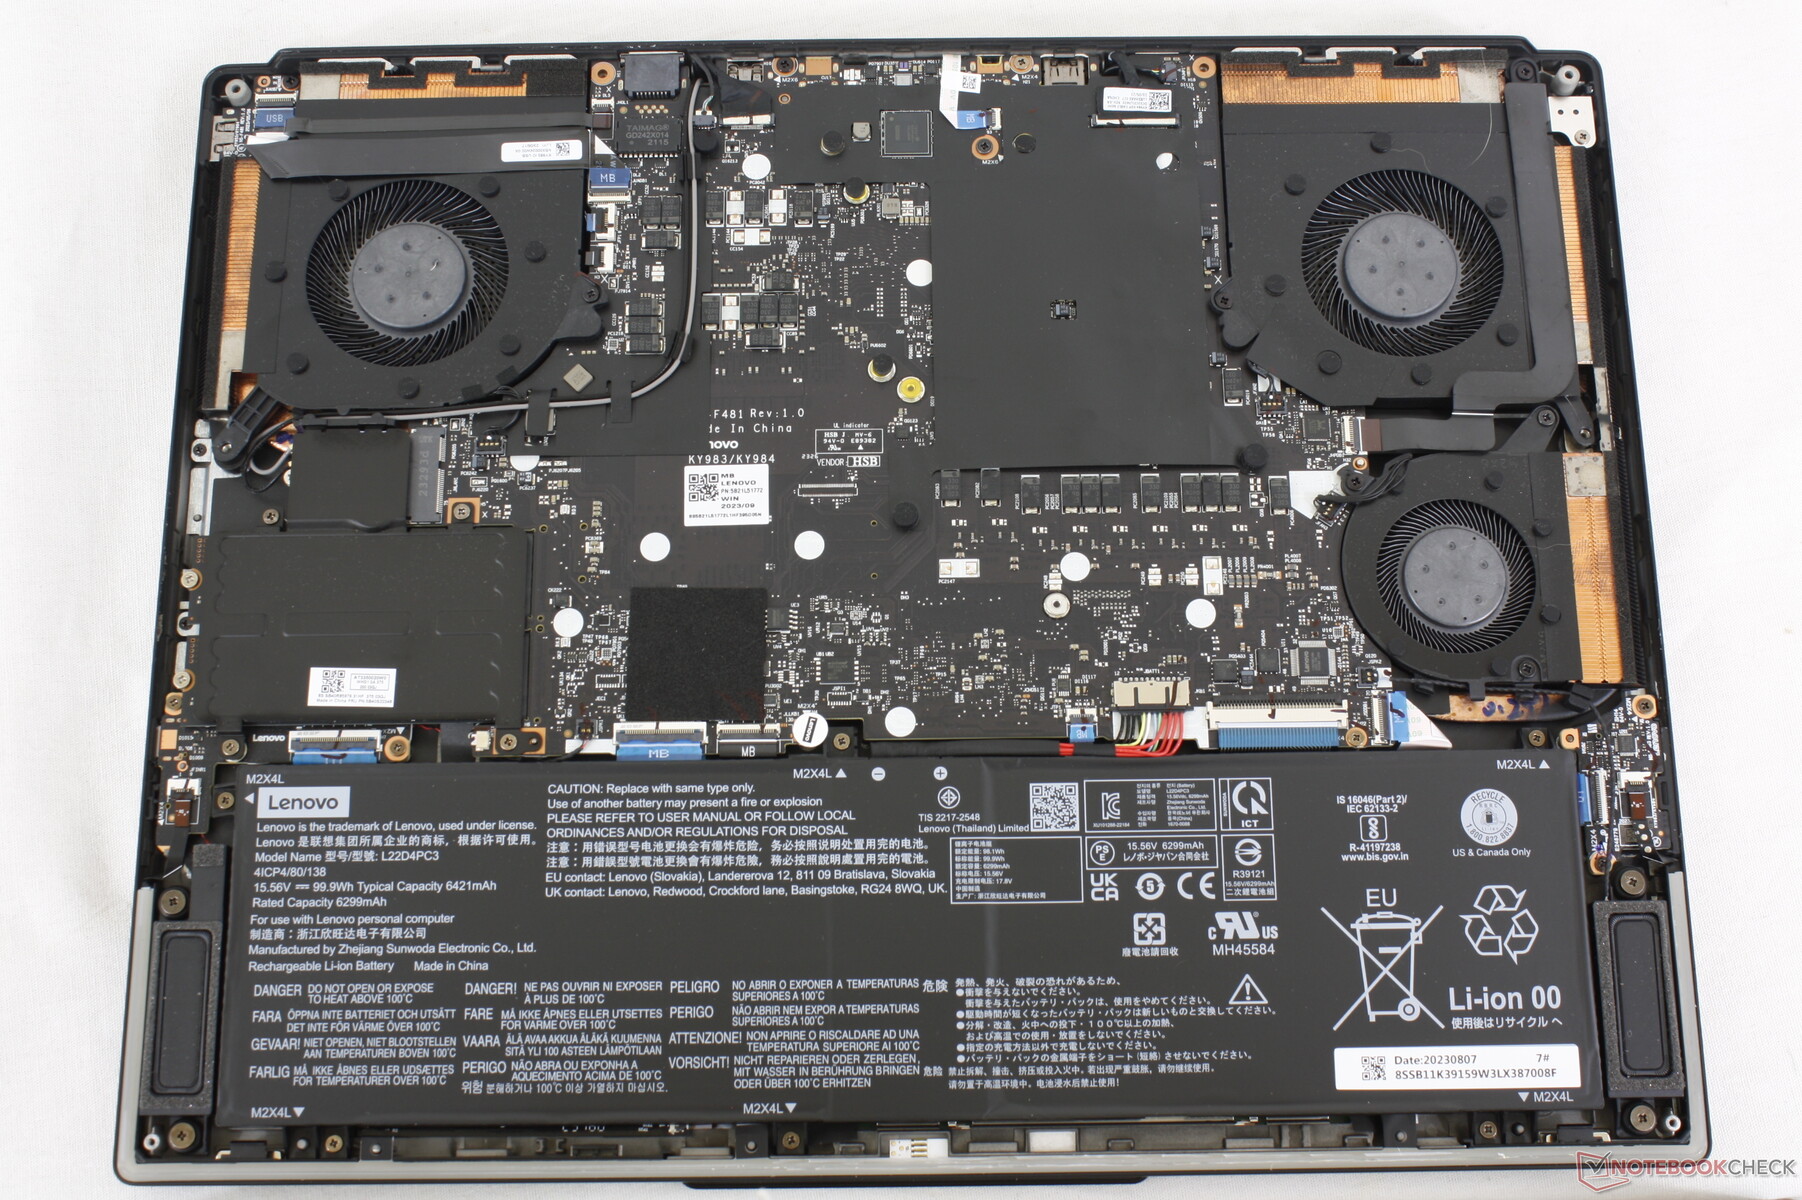
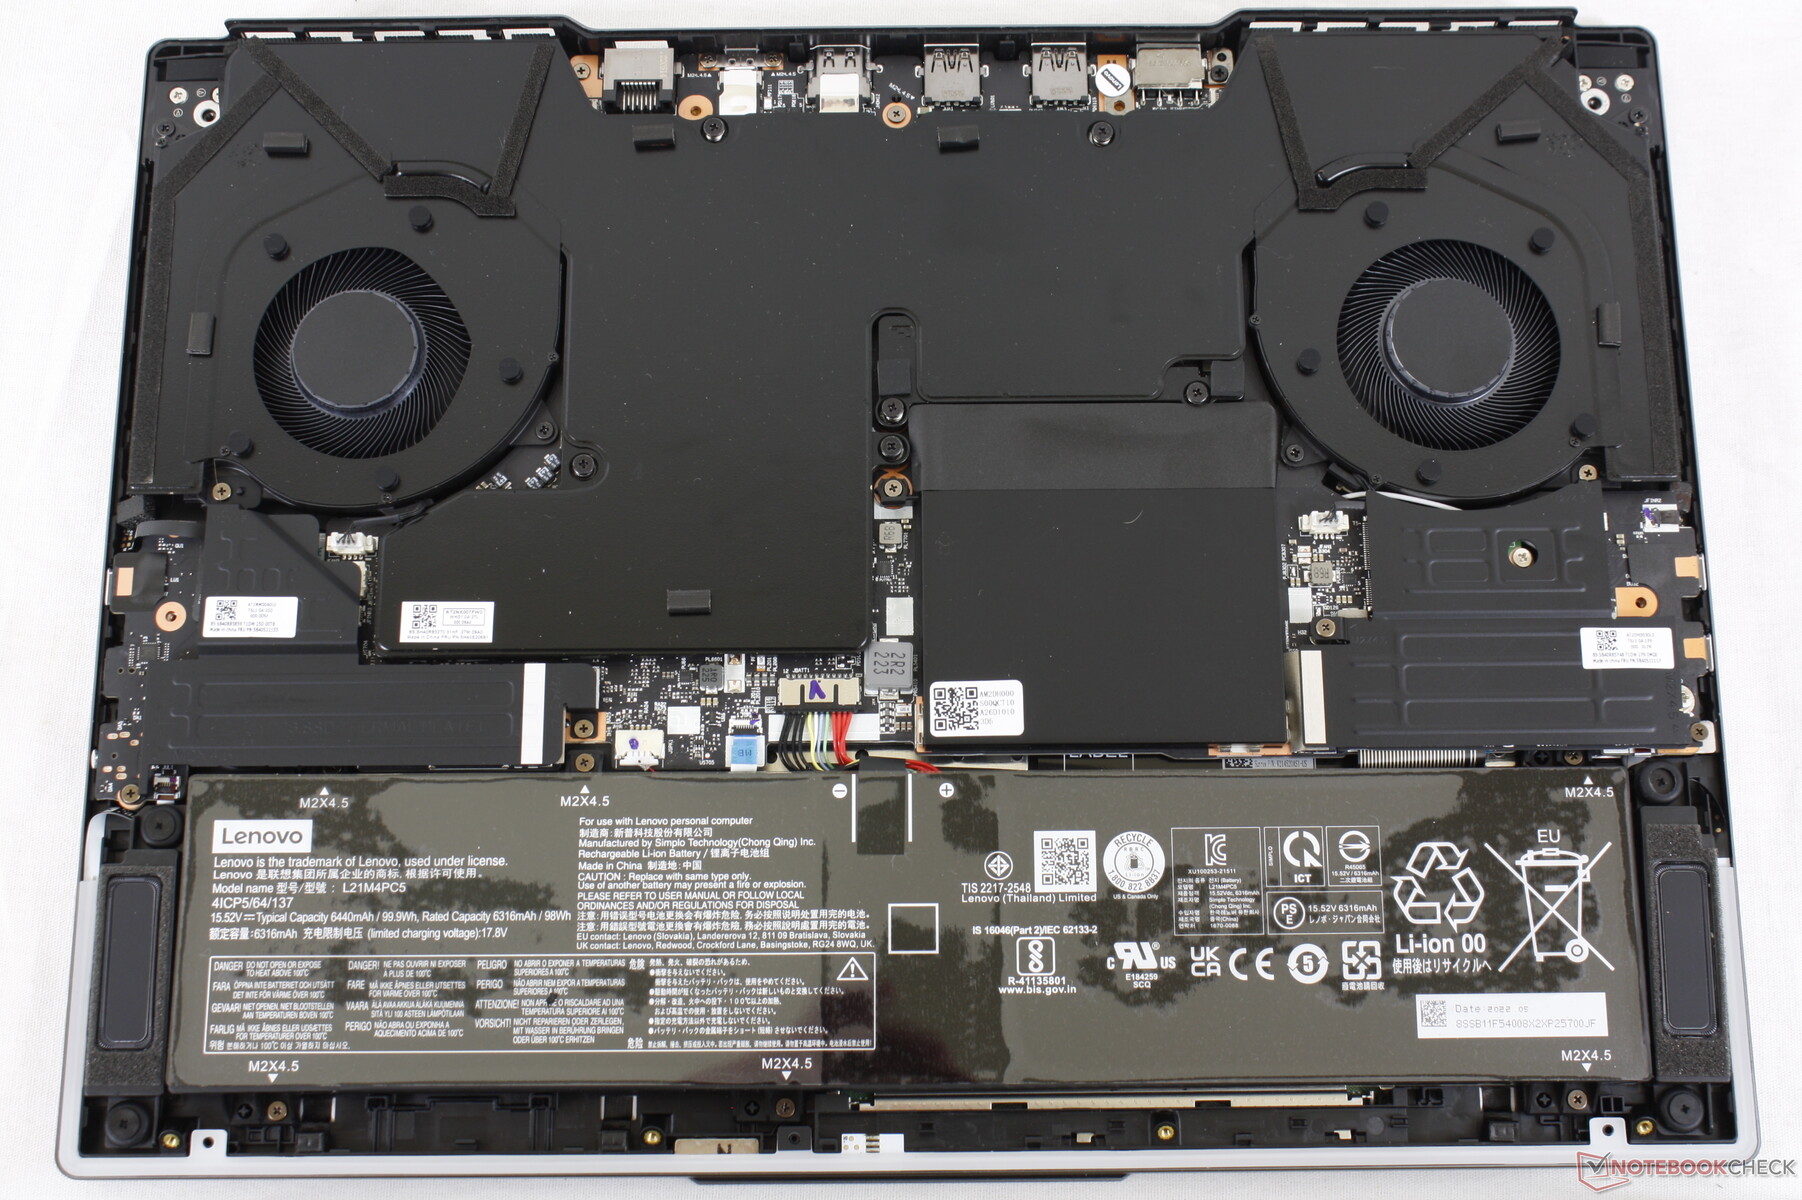
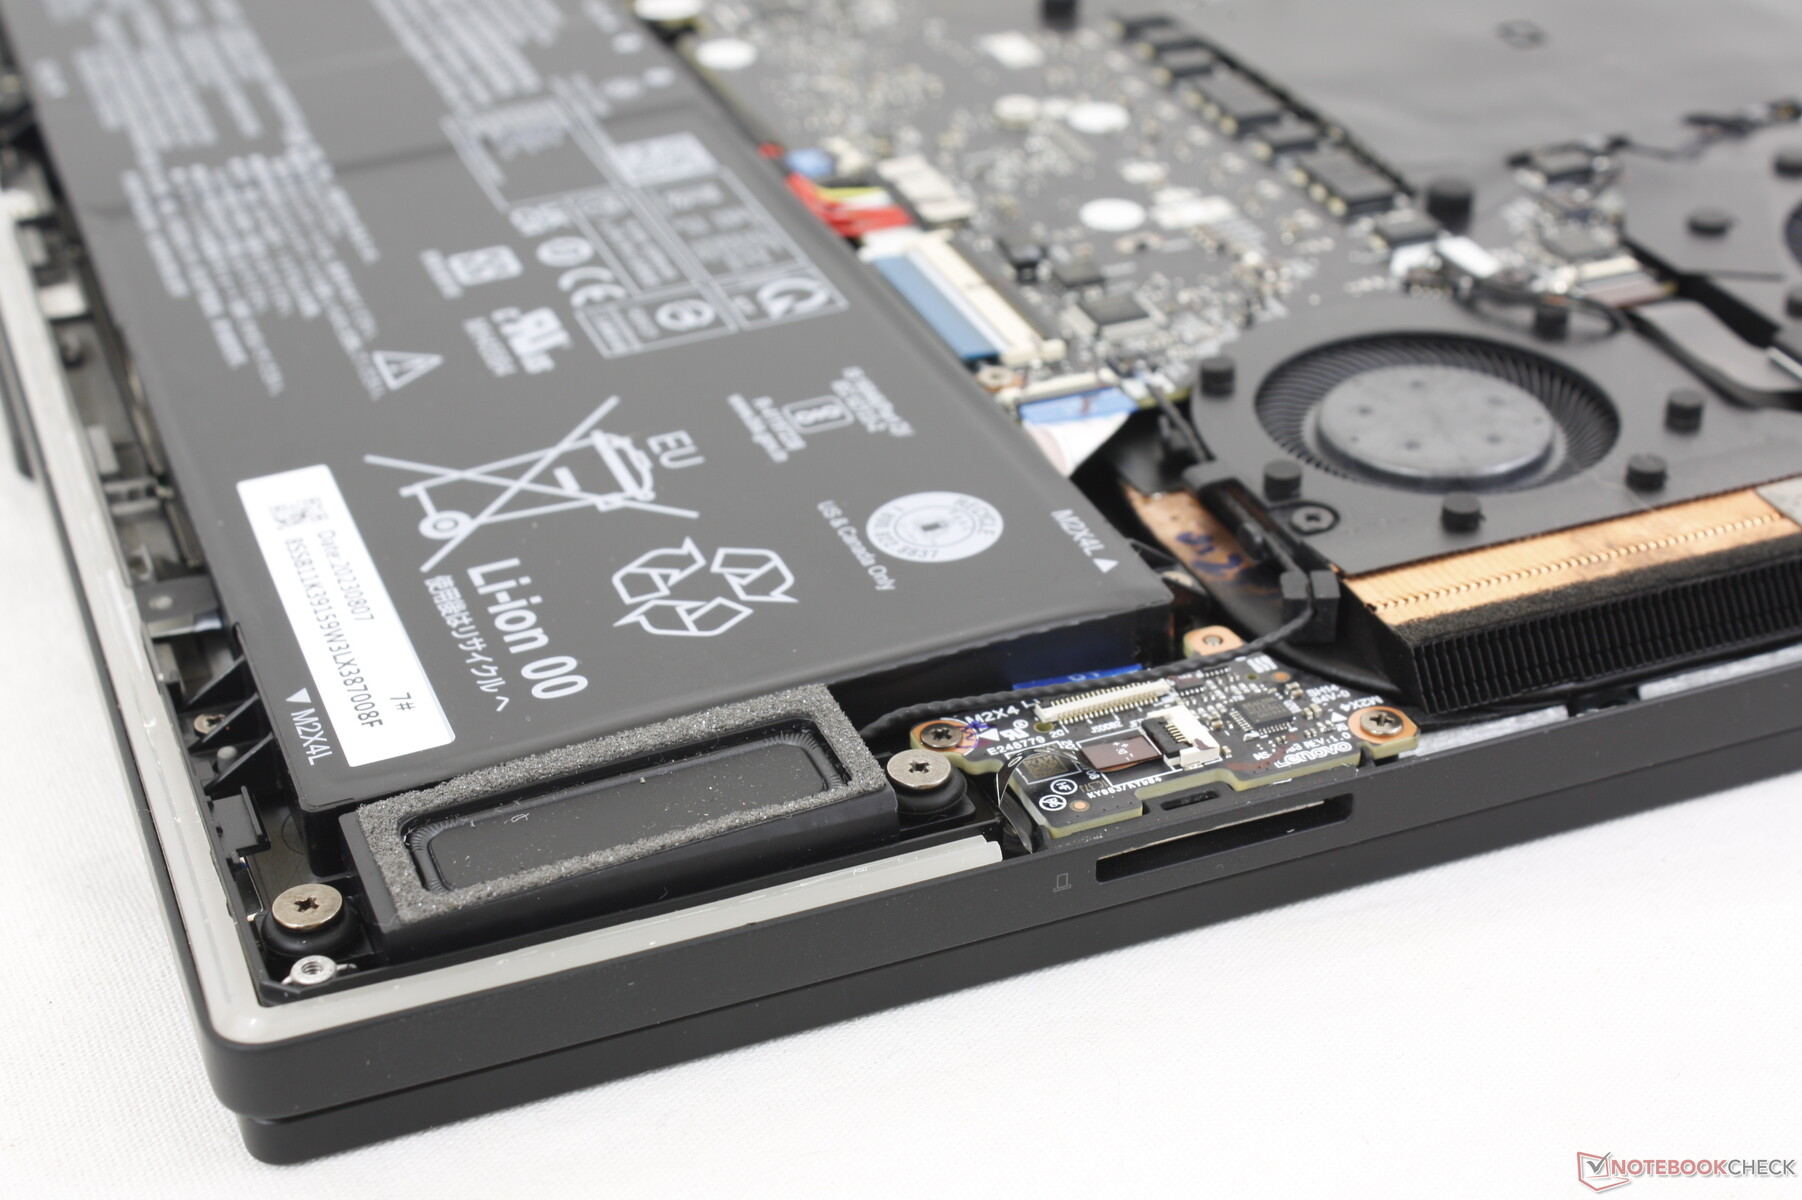
Alt panel, nispeten kolay çıkarılması için 8 Phillips vida ile sabitlenmiştir. Diğer çoğu dizüstü bilgisayarın aksine, Legion 9 16'daki anakart baş aşağı durmaktadır ve bu nedenle soğutma çözümü RAM modüllerine erişmek için daha fazla sökme işlemi gerekmektedir. En azından iki M.2 2280 SSD yuvasına kolayca erişilebilir.
Aksesuarlar ve Garanti
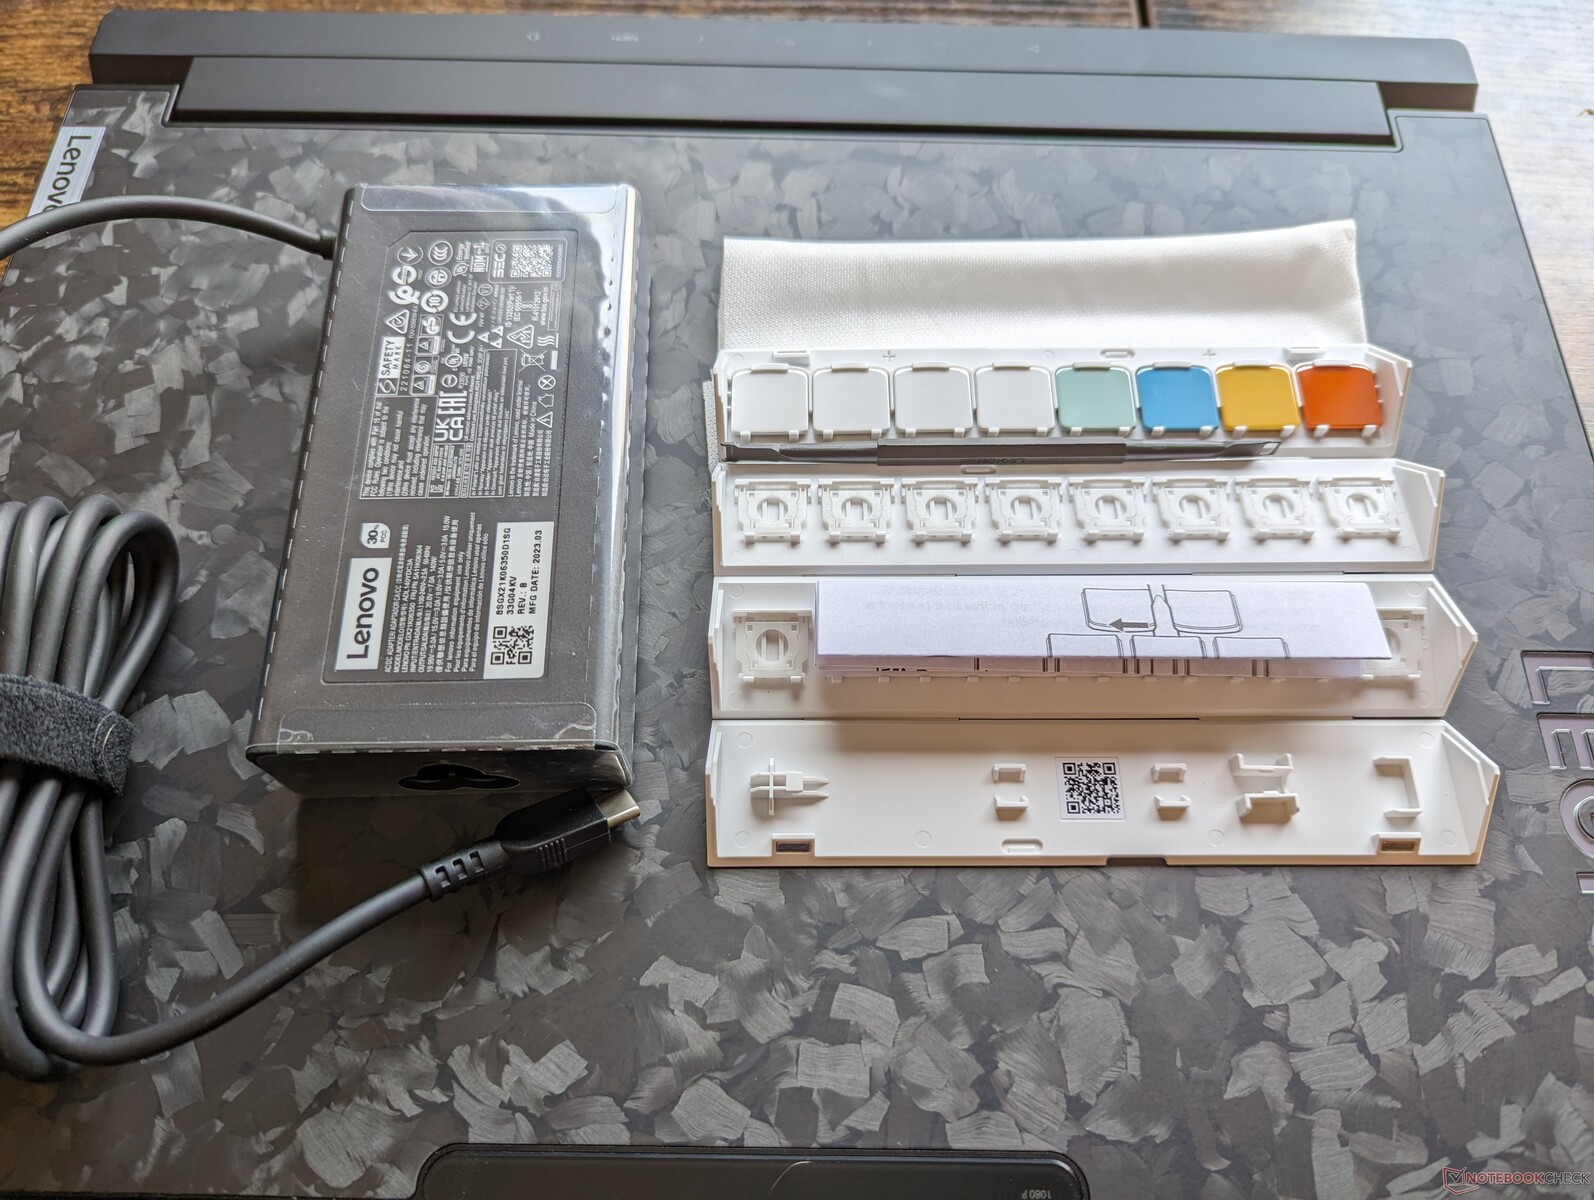
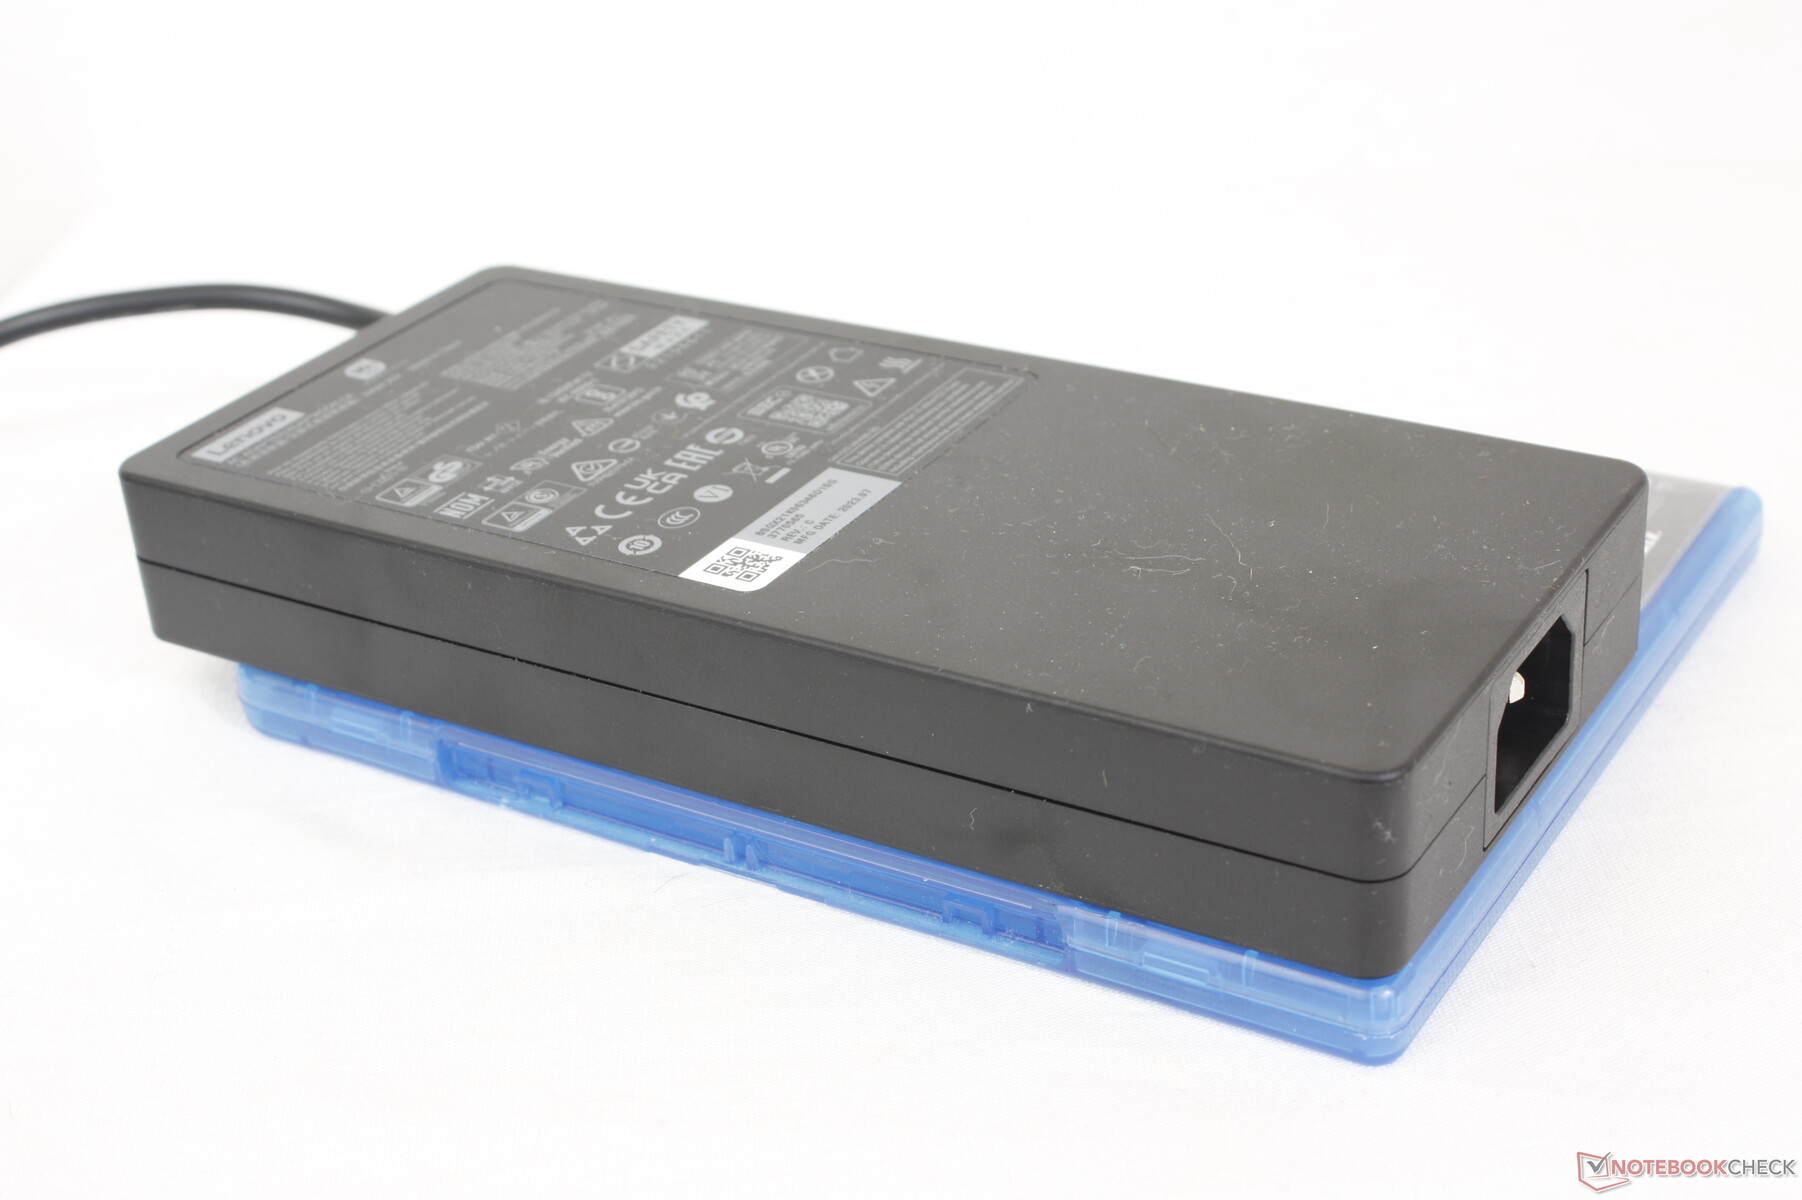
Her zamanki tescilli AC adaptörü ve evraklara ek olarak, perakende kutusunda bu dizüstü bilgisayarı ve diğer birçok USB-C cihazını ve 8 tuş kapağını şarj etmek için kullanılabilecek çok kullanışlı bir evrensel 140 W USB-C adaptörü de bulunmaktadır.
ABD'de satın alındığında standart bir yıllık sınırlı üretici garantisi geçerlidir.
Giriş Aygıtları - Sıkışık Clickpad ile Rahat Klavye
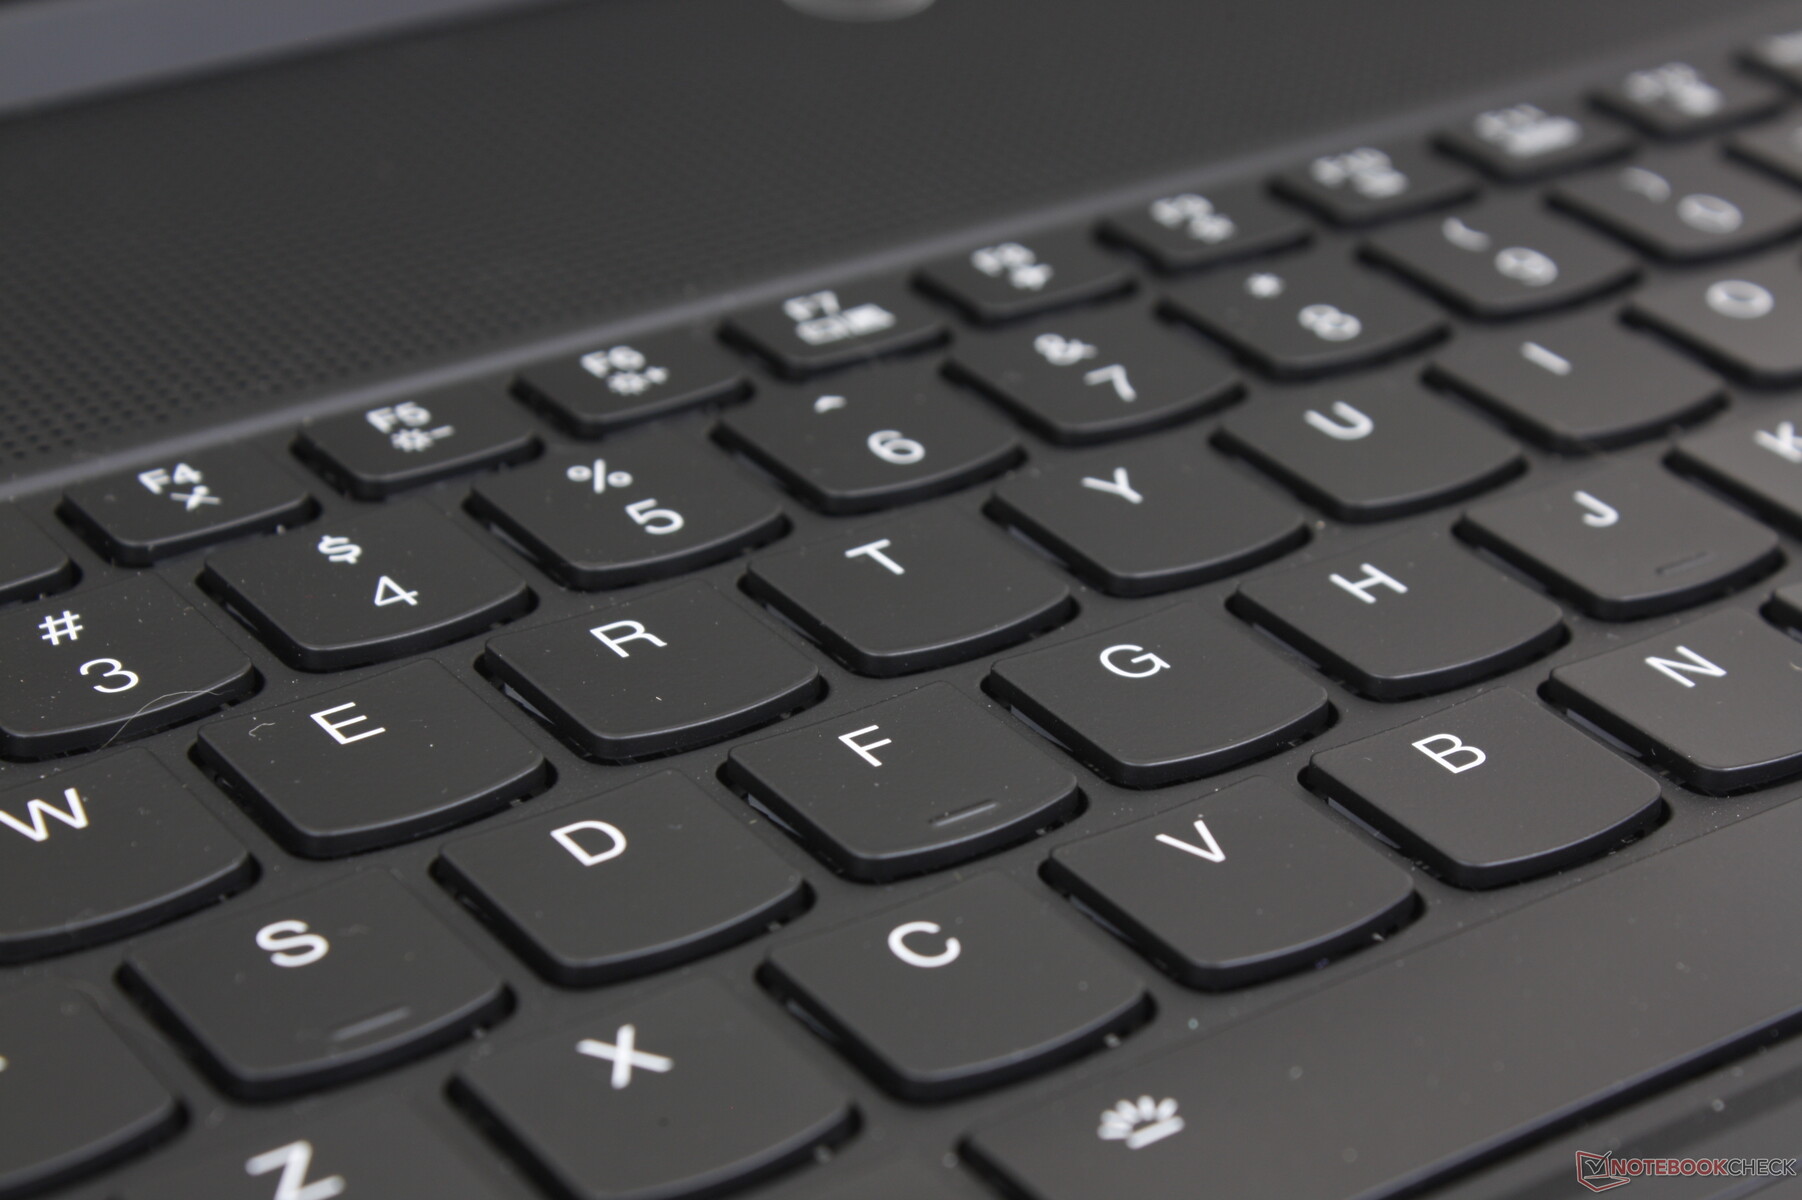
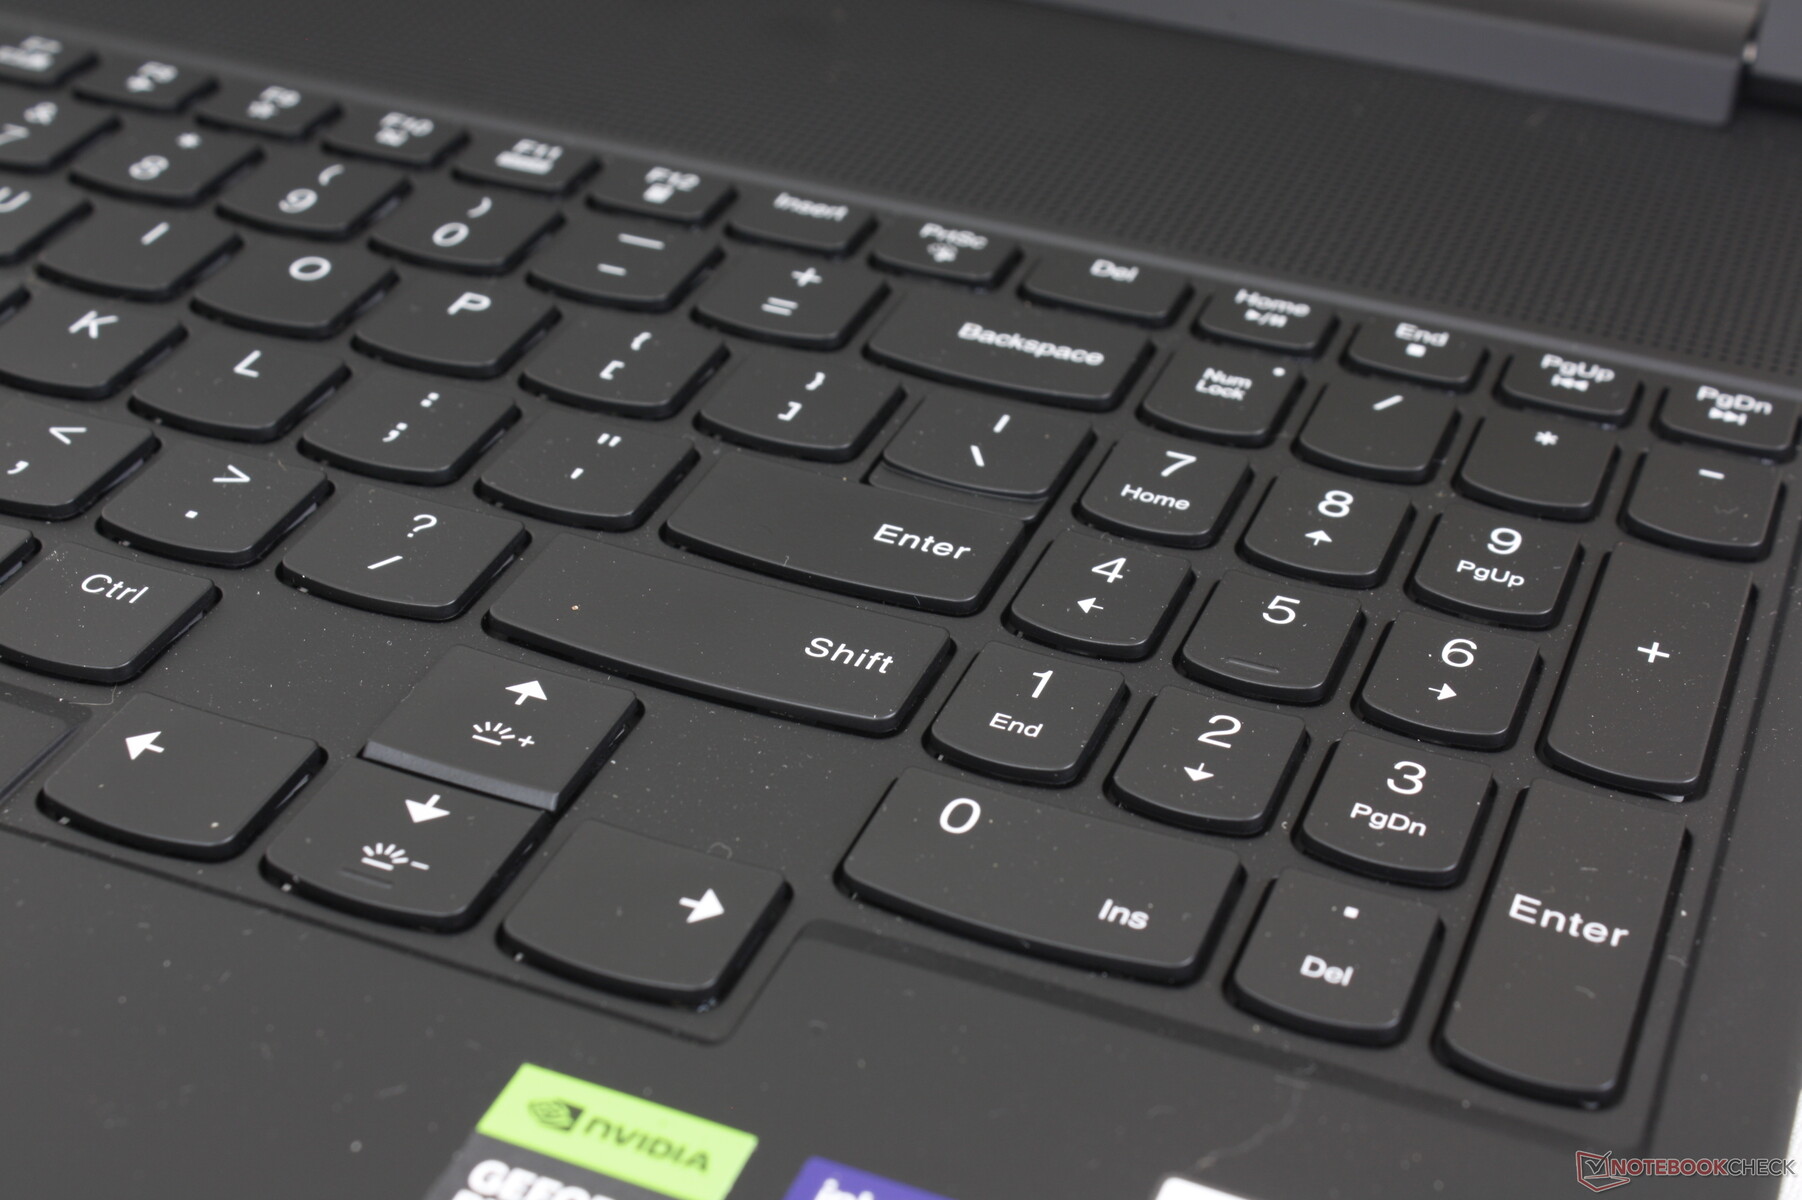
Klavye
TrueStrike klavye, çoğu Ultrabook'taki tuşlardan biraz daha derin olması için 1,5 mm tuş hareketi sunar. Membran tabanlı tuşlar için geri bildirim şaşırtıcı derecede keskin ve rahattır, bu da iyi bir yazma deneyimi için süslü mekanik anahtarlara ihtiyacınız olmadığını gösterir. Sert tuşlar Blade 16'daki tuşlardan daha yüksek seslidir veya Asus Zephyrus M16 ancak kesinlikle Schenker XMG Neo 15 gibi modellerdeki mekanik tuşlar kadar tıklamalı değil veya Alienware m18.
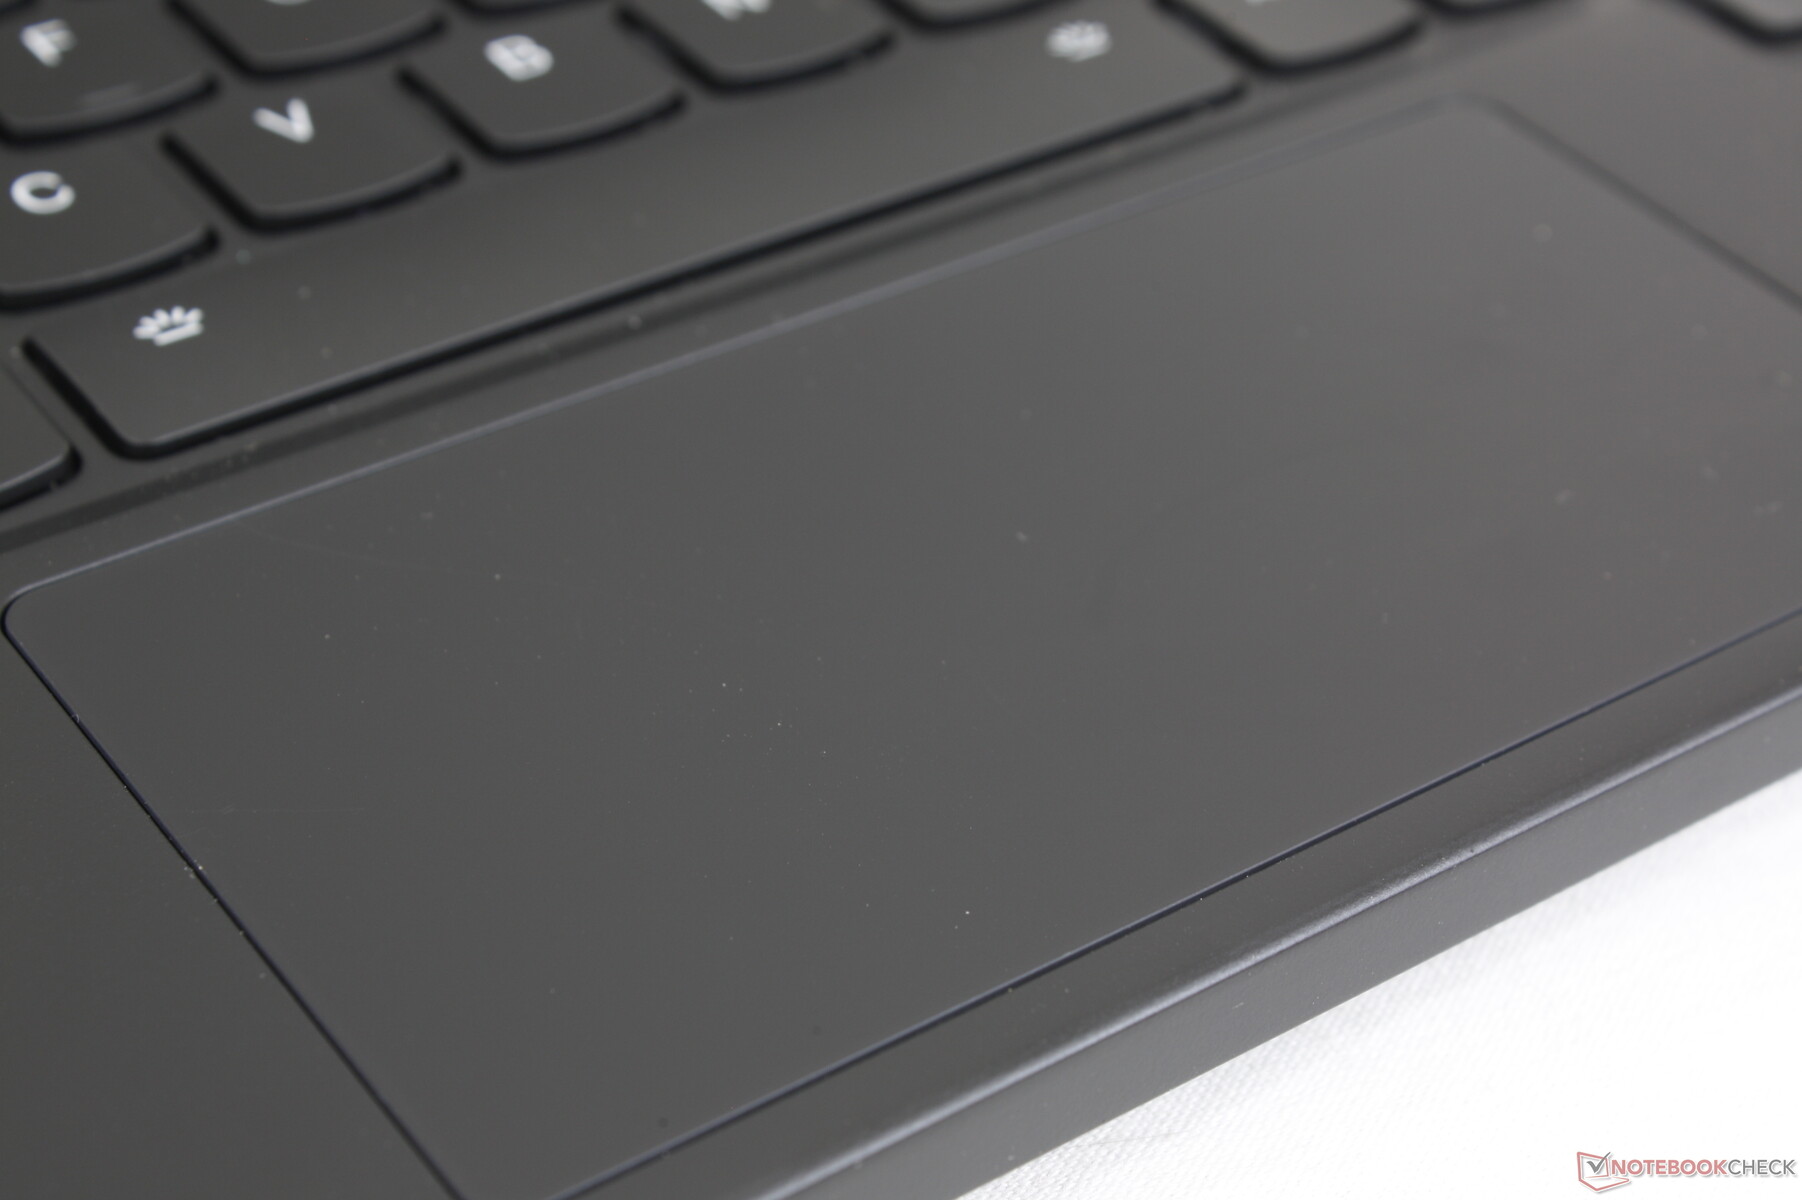
Dokunmatik yüzey
Klavyenin konumlandırılması nedeniyle clickpad'in boyutu sadece (12 x 5,9 cm)'ye düşürülmüştür. Uzun 16:10 ekranda dikey imleç hareketleri, özellikle aşağıdaki gibi çok daha büyük tıklama pedlerine sahip oyun dizüstü bilgisayarlarıyla karşılaştırıldığında sıkışık hissediliyor Razer Blade 16lenovo, oyuncuların senaryoların büyük çoğunluğu için kendi USB veya Bluetooth farelerini kullanmalarına güveniyor.
Kayma ve tıklama, küçük yüzey alanına rağmen sorunsuz ve tatmin edici bir tıklama ile gerçekleşiyor. Bununla birlikte, harici bir fare kullanıldığında aynı sorun yaşanmazken, clickpad kullanıldığında imleç hareketleri zaman zaman cihazımızda donuyordu. Herhangi bir kusur bulunmadığından emin olmak için satın aldıktan sonra clickpad'i iki kez kontrol etmenizi öneririz.
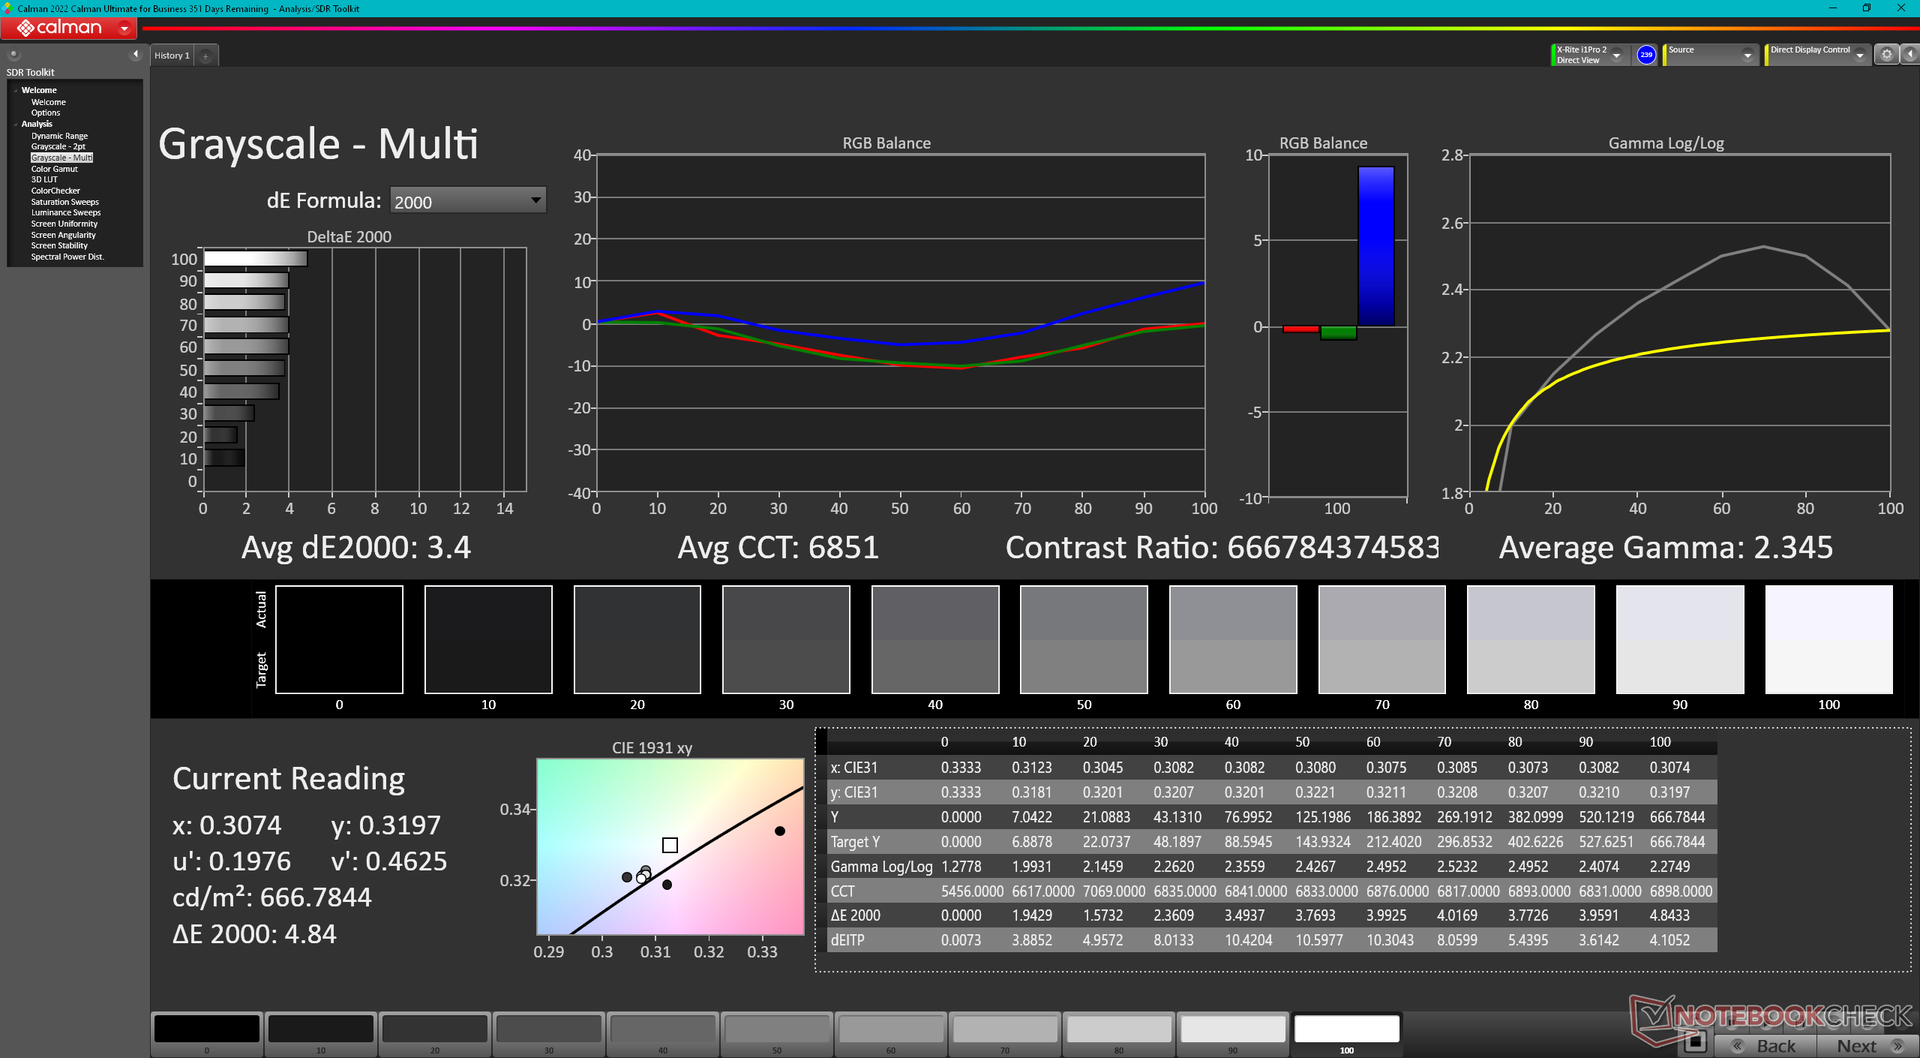
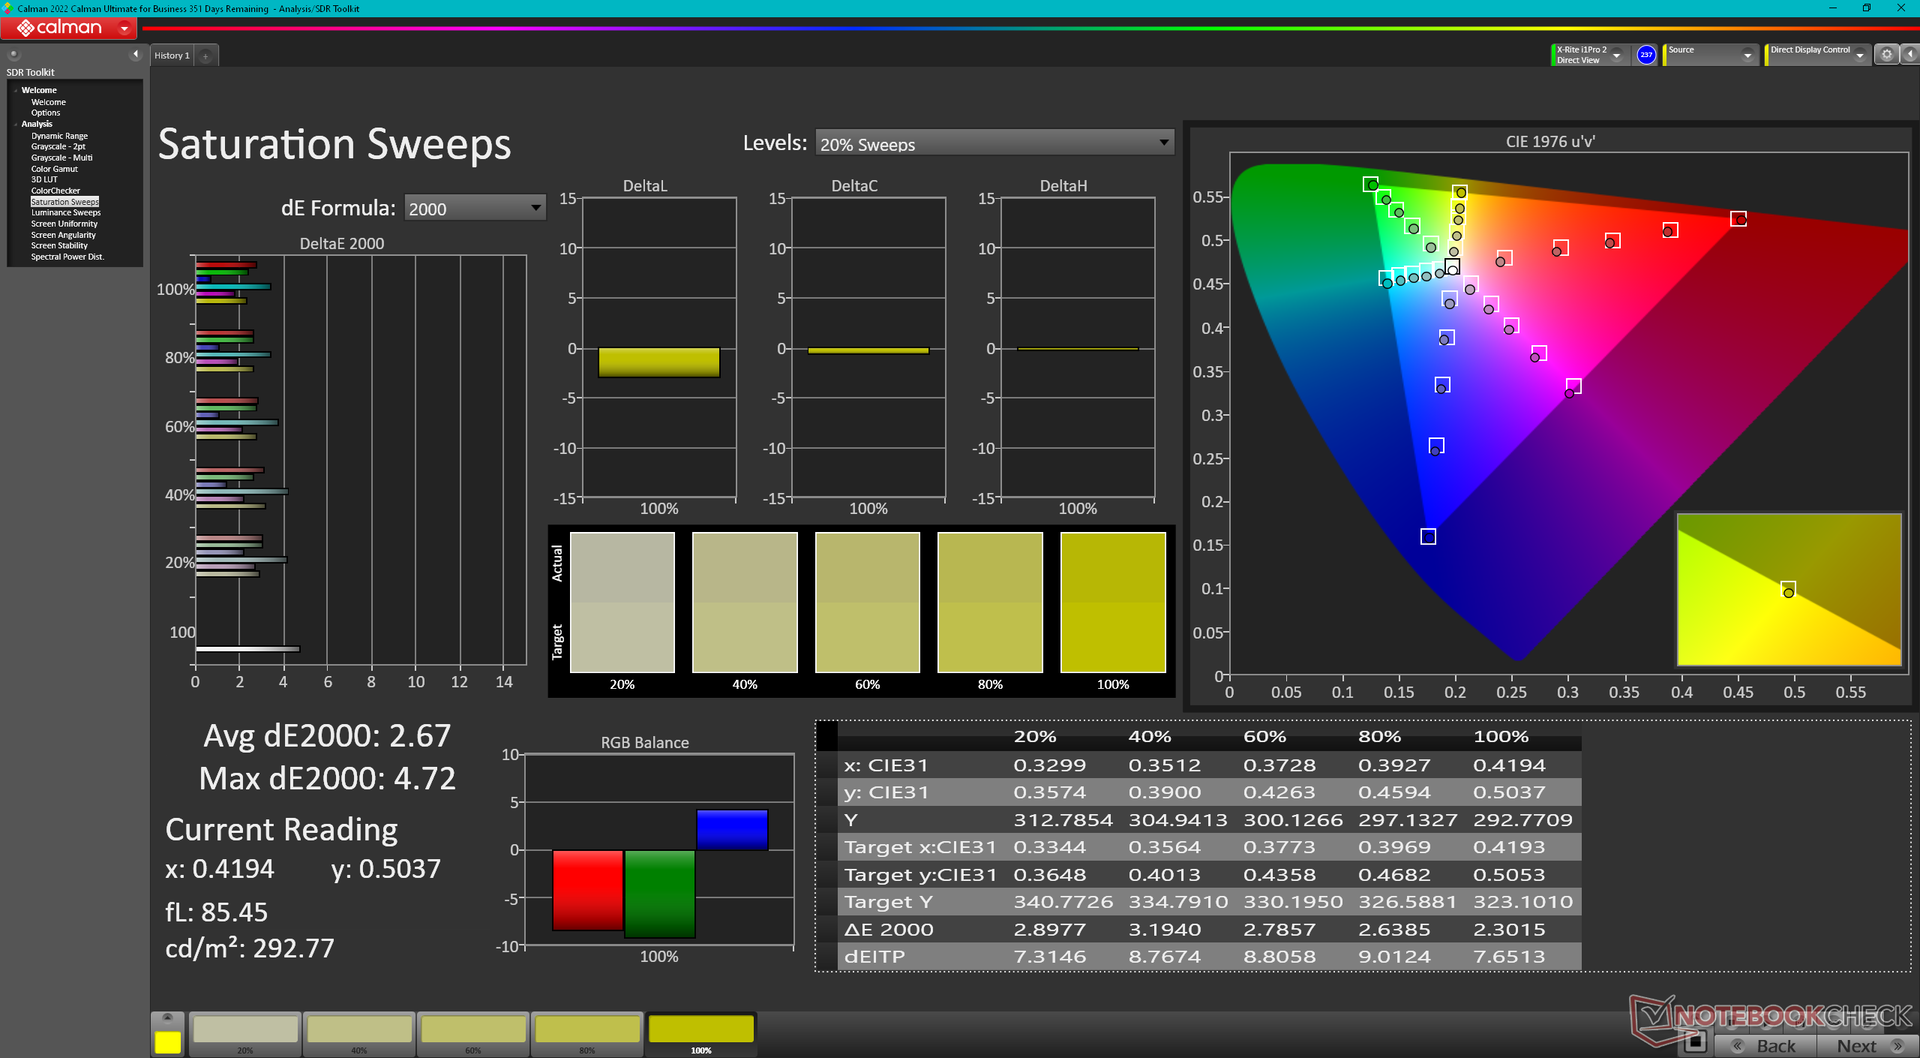
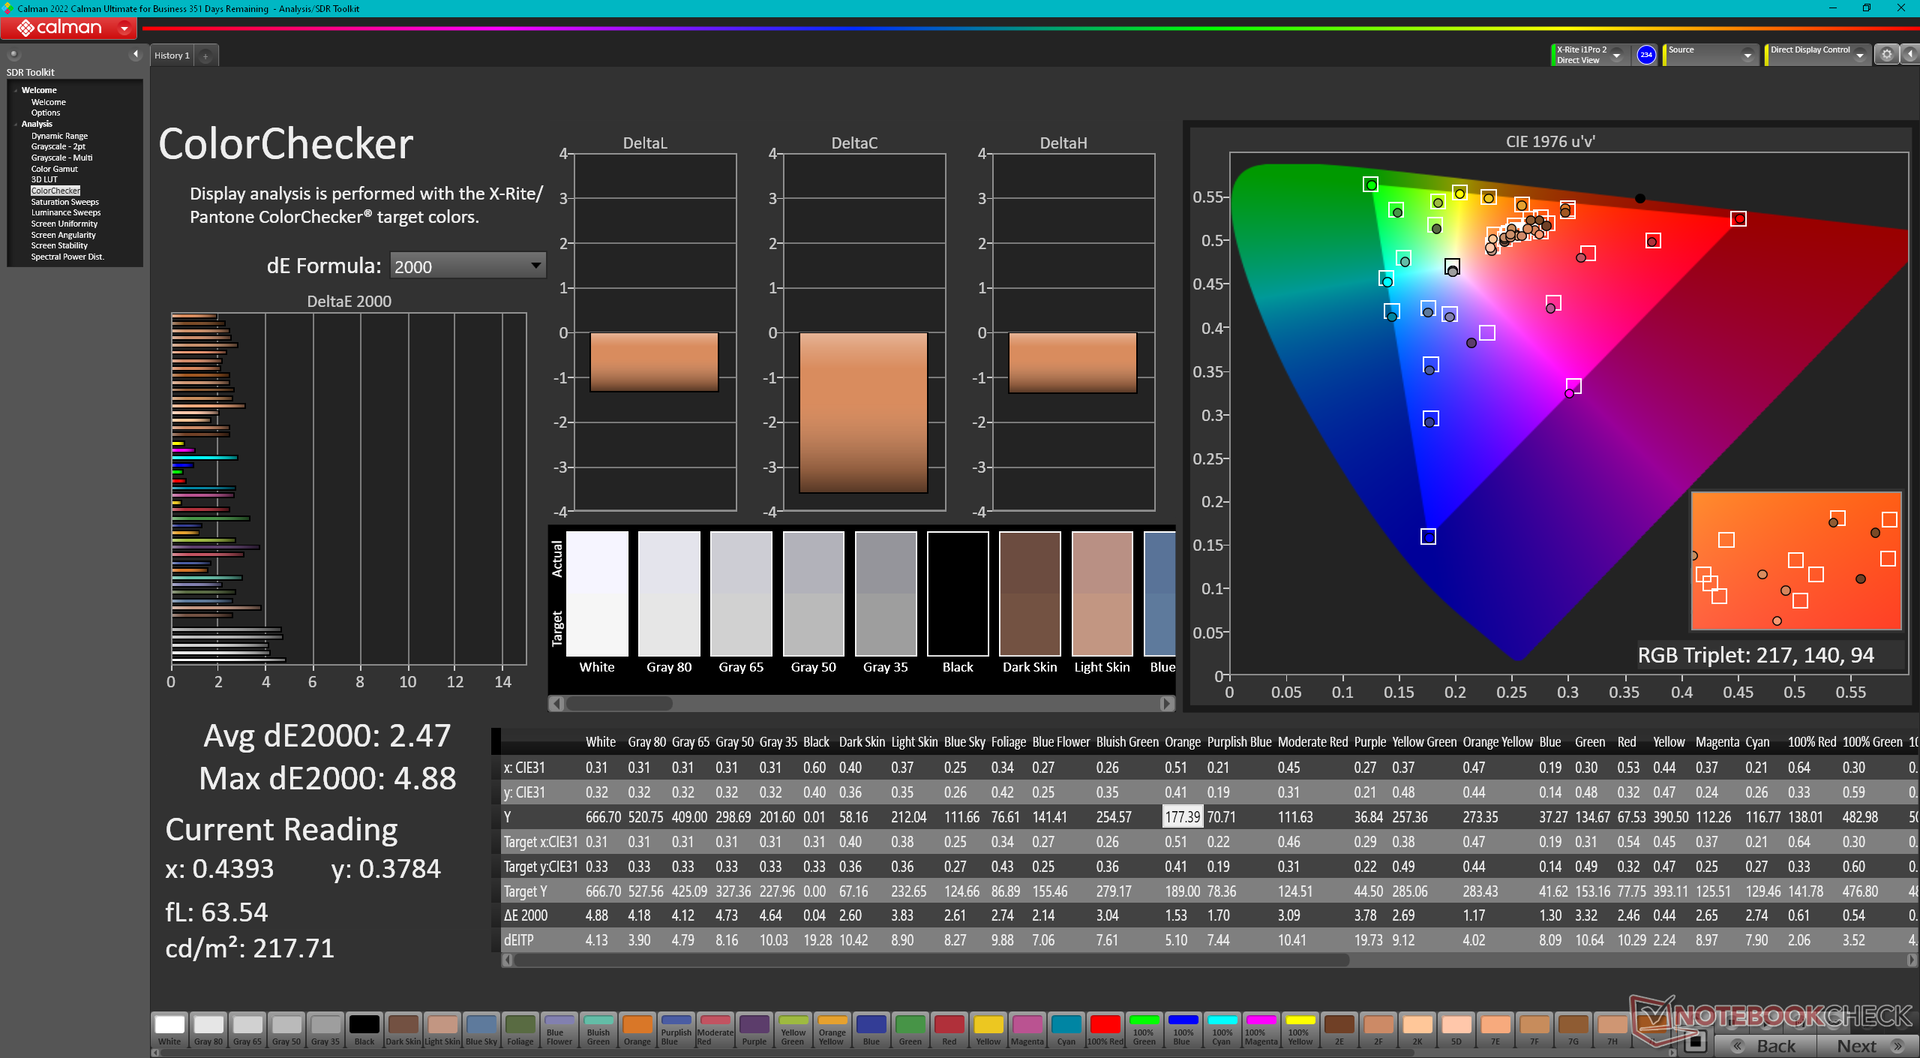
Teşhir - Ana Cazibe Merkezi
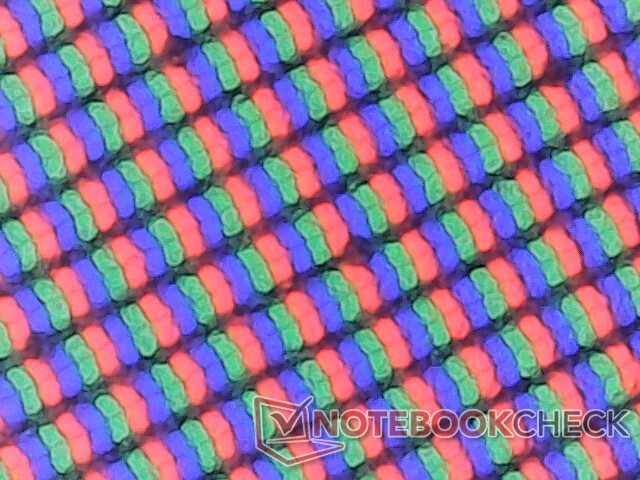
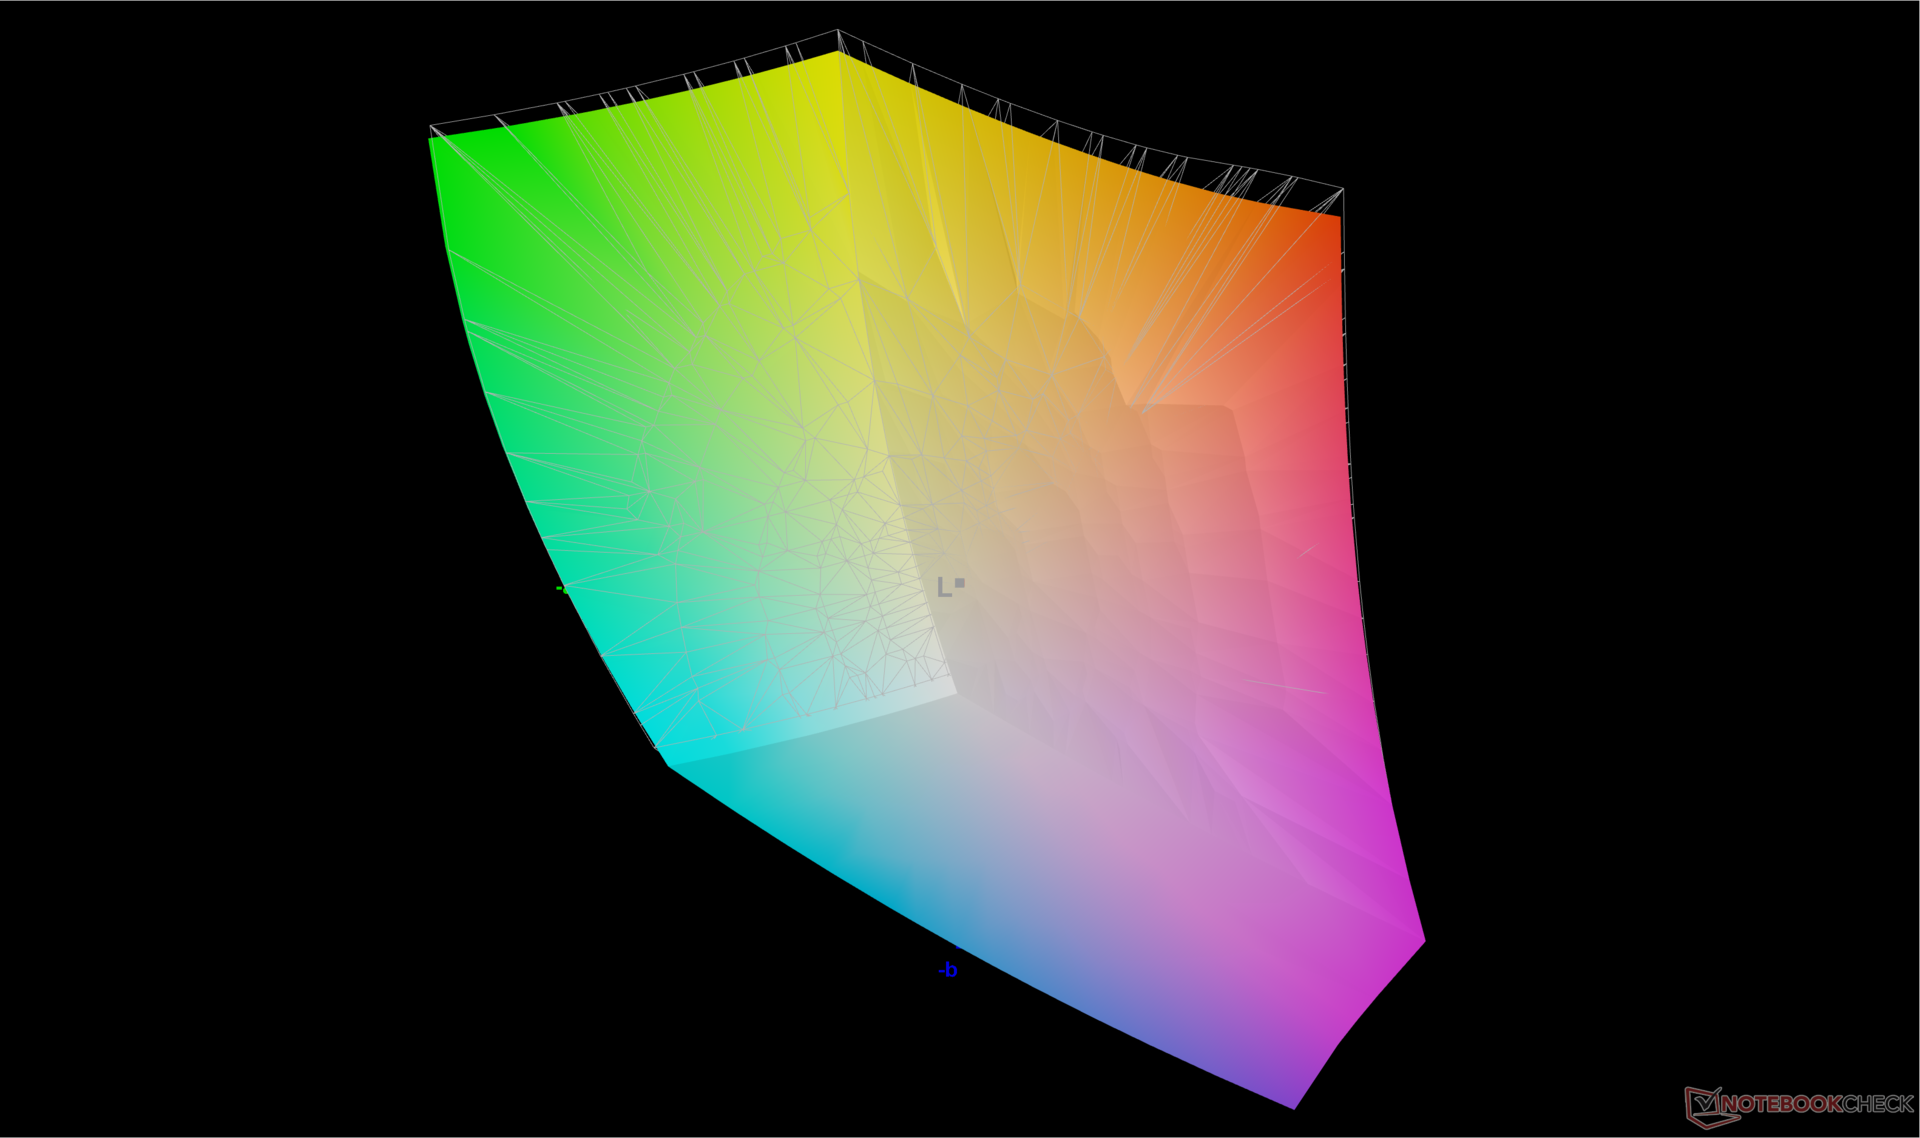
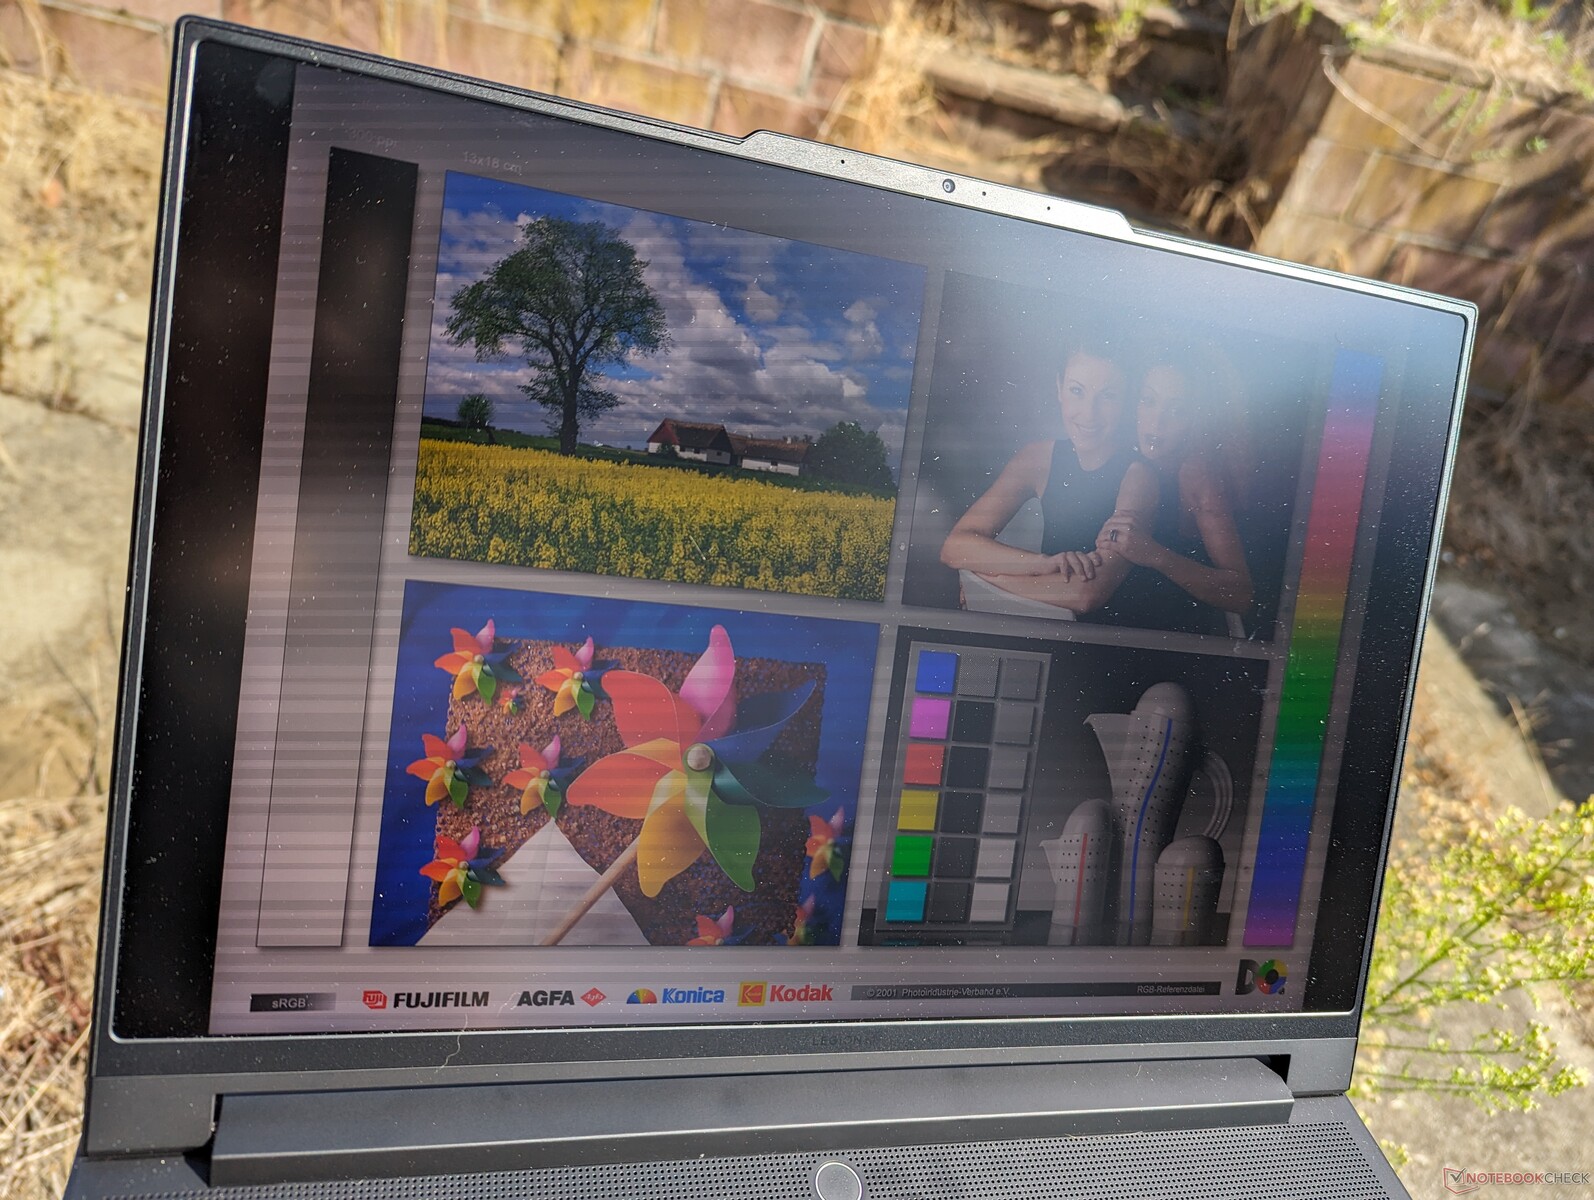
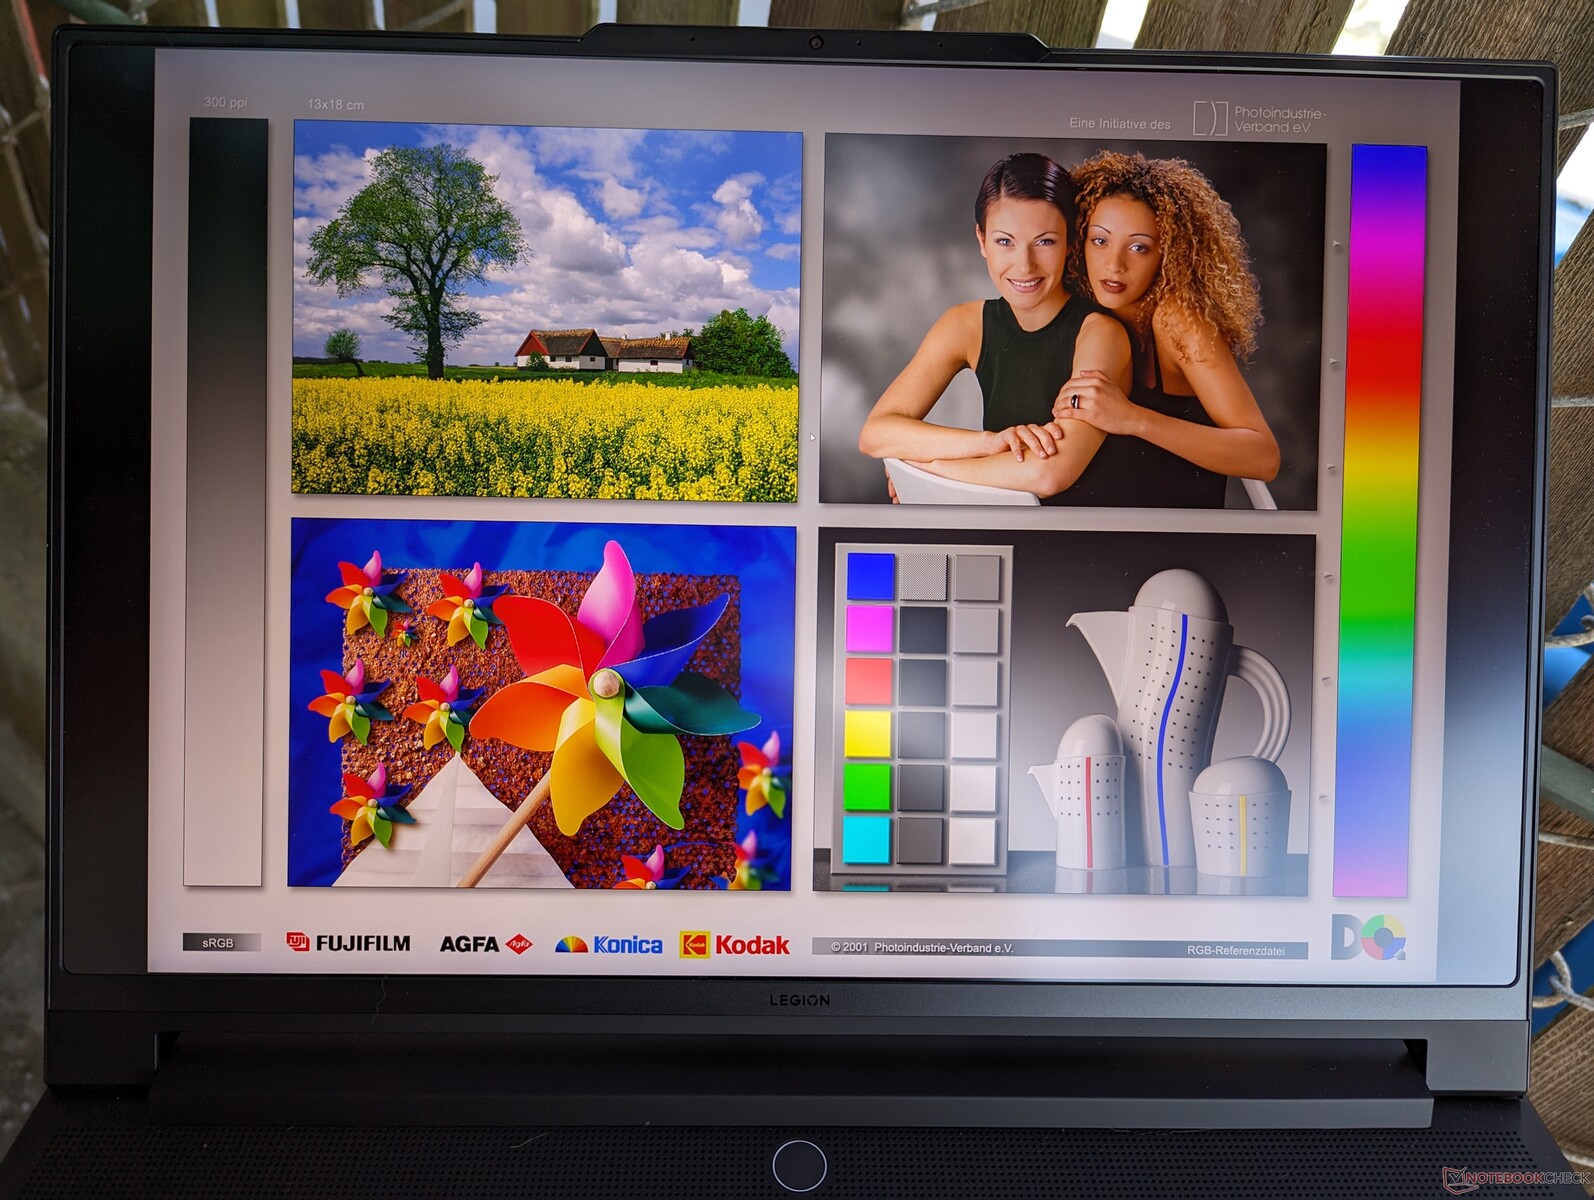
Geleneksel IPS ve OLED ile karşılaştırıldığında mini-LED, birincisinden daha üstün siyah seviyeleri ve genel olarak daha iyi HDR desteği için ikincisinden daha yüksek maksimum parlaklık seviyeleri sunar. Bu durumda Lenovo, dizüstü bilgisayar ekranlarında nadiren görülen HDR1000 desteği için 1200 nit maksimum parlaklık reklamı yapıyor. HDR modu etkinleştirildiğinde gerçek dünyadaki maksimum parlaklığın 1025 nit veya SDR içeriği görüntülerken 675 nit olduğunu doğrulayabiliyoruz. Oyun dizüstü bilgisayarlarındaki çoğu IPS ve OLED panel, karşılaştırıldığında genellikle 300 ila 500 nit arasında değişiyor. Bu nedenle, mini-LED'in avantajlarından daha iyi yararlanmak için mümkün olduğunda içeriği HDR modunda oynatmak isteyeceksiniz.
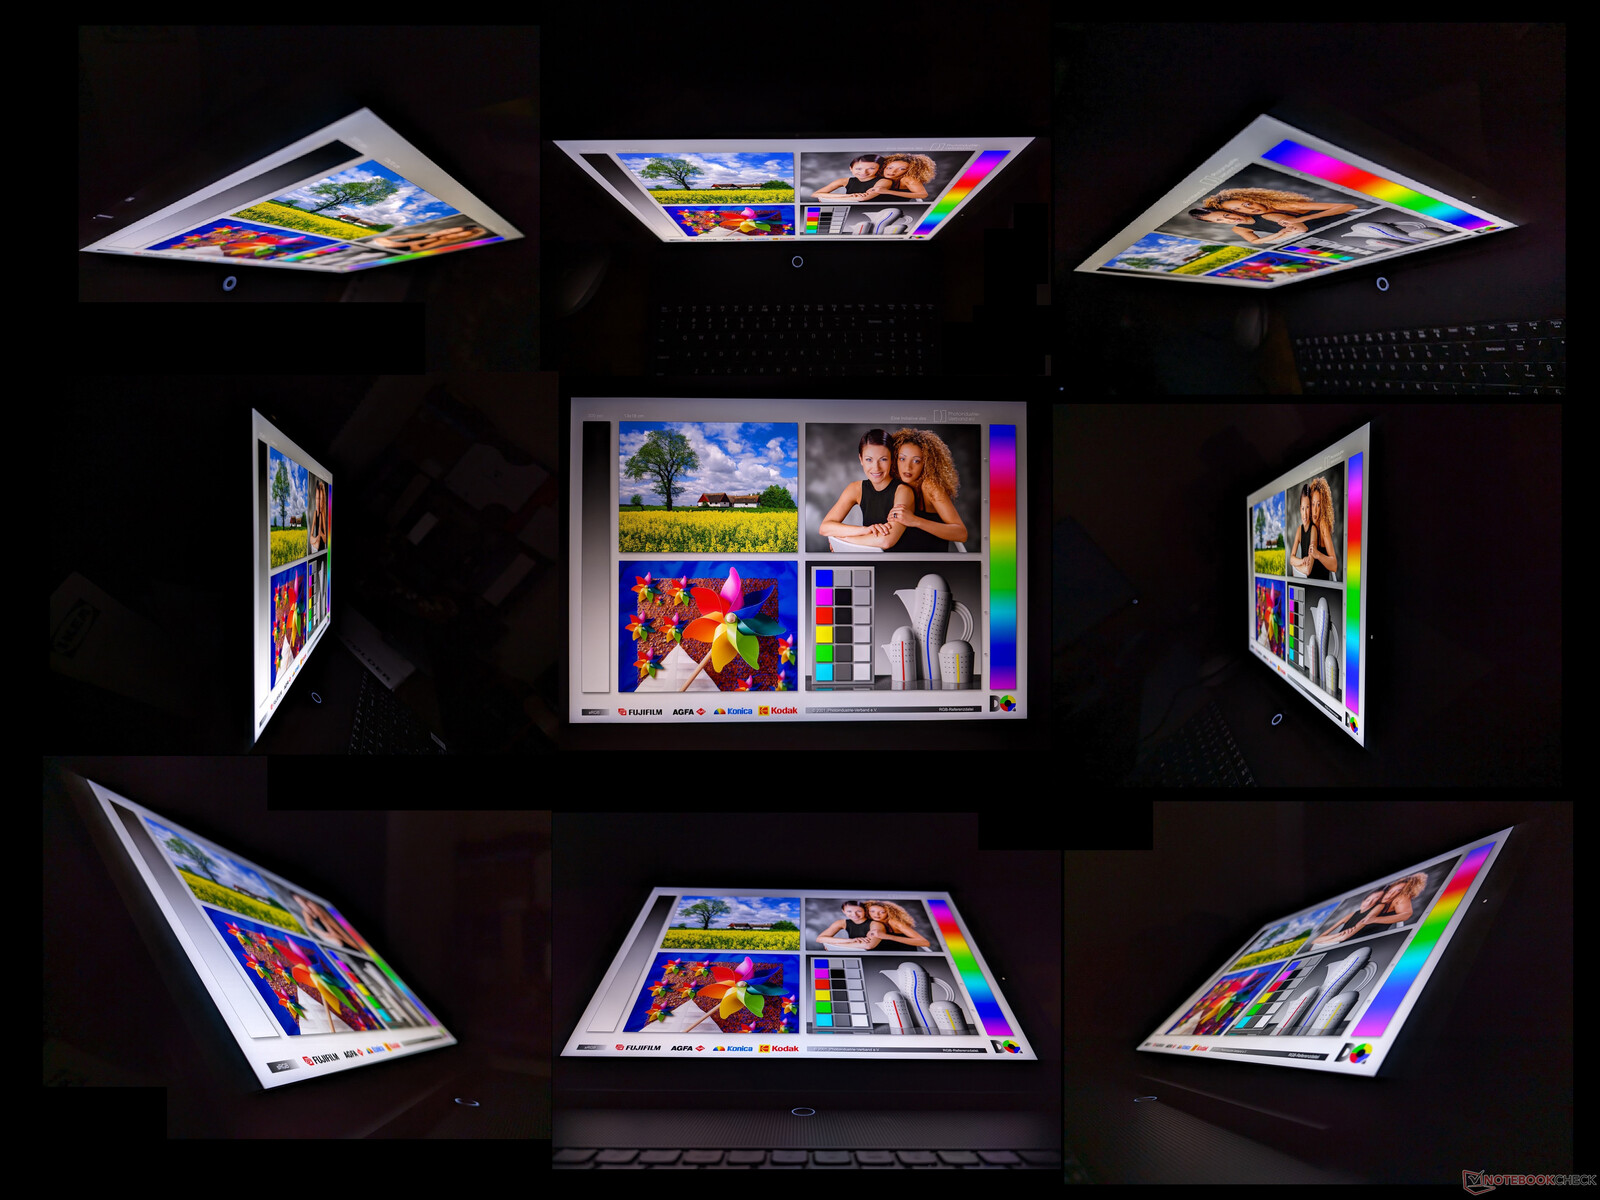
Çok yüksek parlaklık seviyelerinin yanı sıra, panel aynı zamanda G-Sync, tam DCI-P3 renkleri, hızlı 165 Hz yenileme hızı ve hem içerik oluşturma hem de oyun oynama amaçlarına uygun hızlı tepki sürelerine sahiptir.
| |||||||||||||||||||||||||
Aydınlatma: 96 %
Batarya modunda parlaklık: 674.9 cd/m²
Kontrast: 16873:1 (Siyah: 0.04 cd/m²)
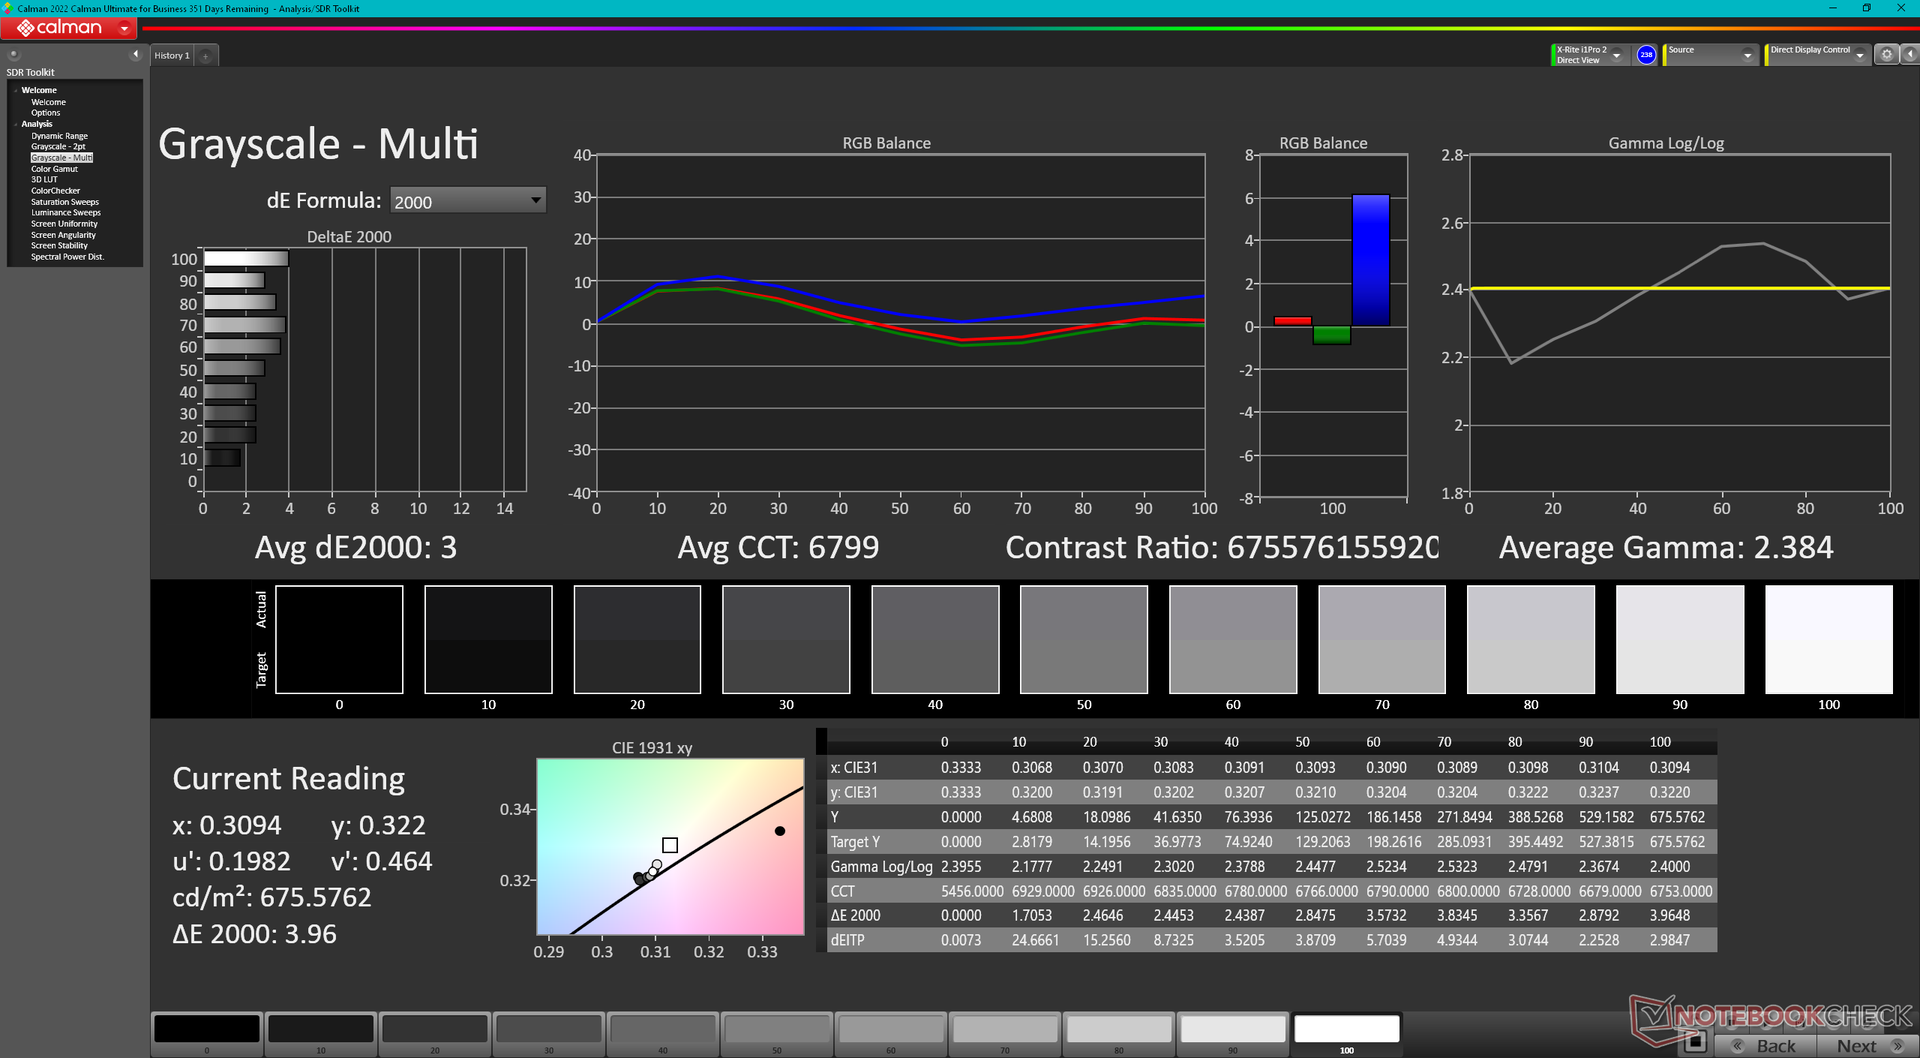
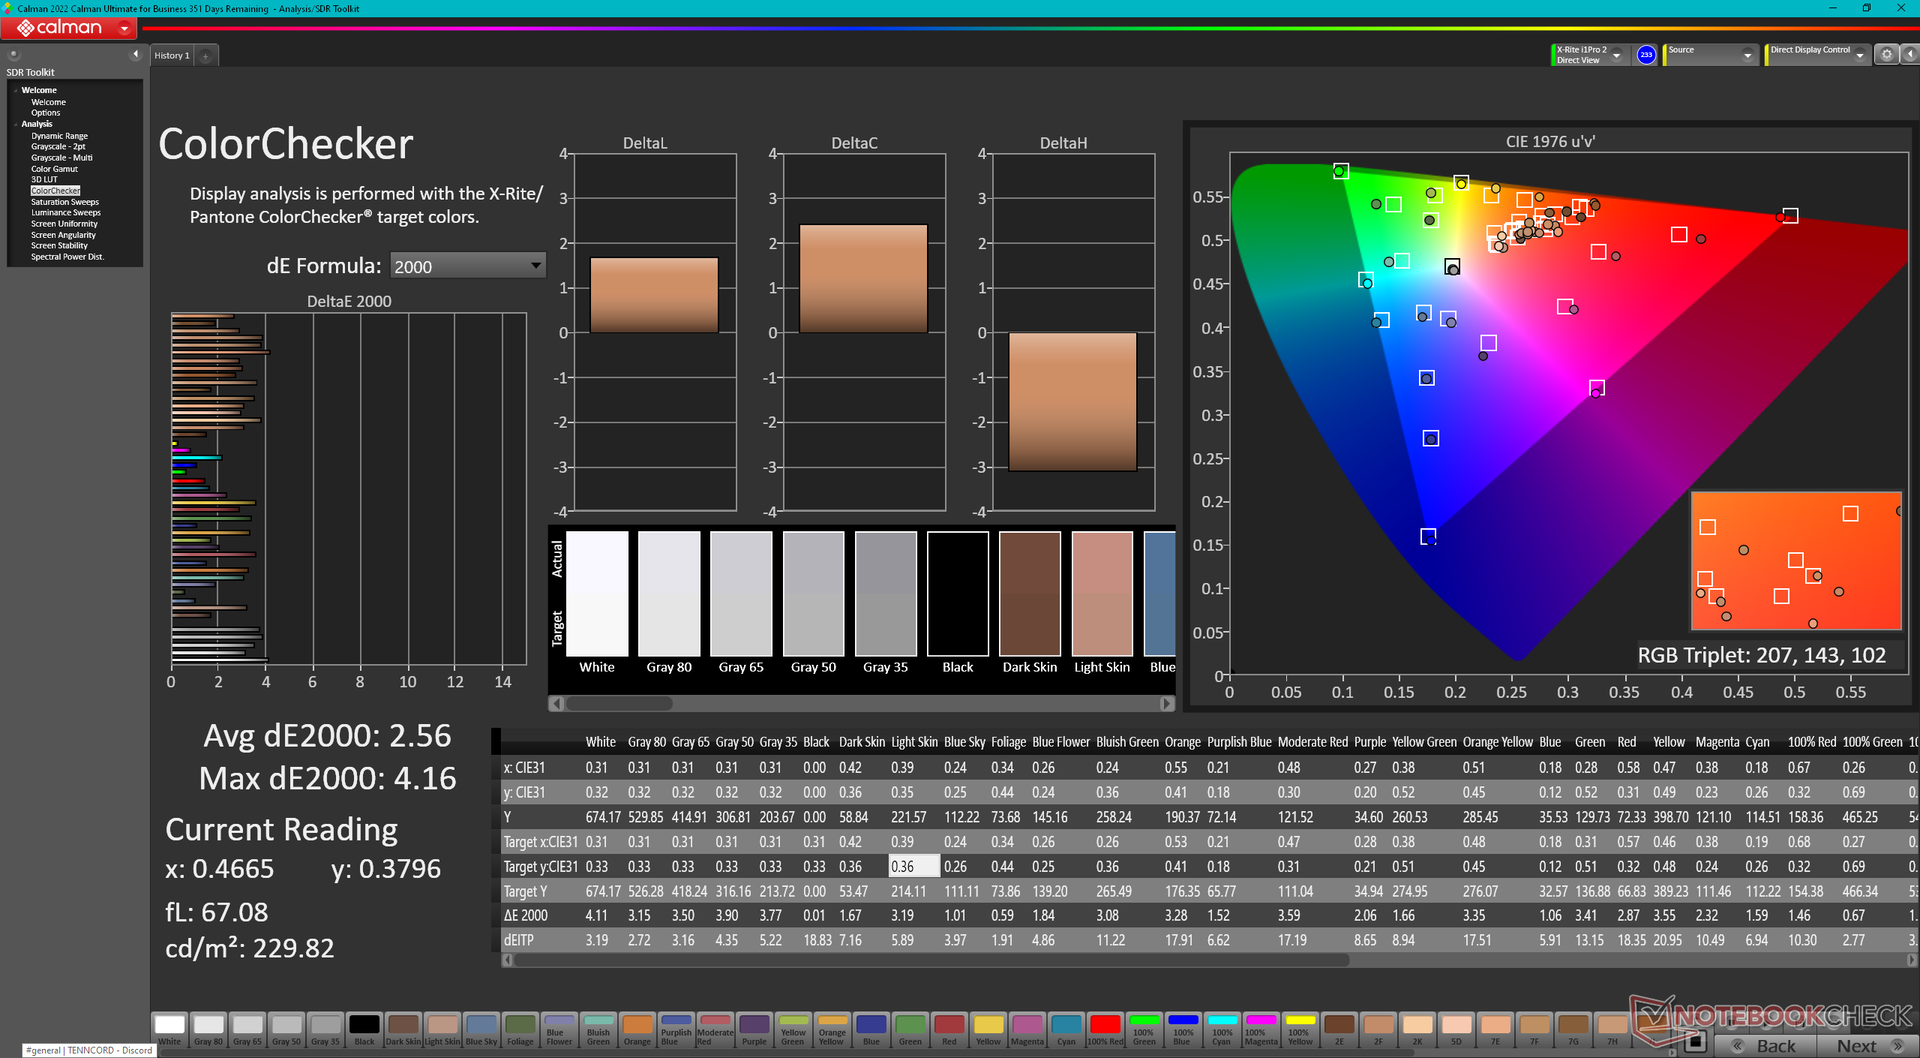
ΔE ColorChecker Calman: 2.56 | ∀{0.5-29.43 Ø4.71}
calibrated: 2.47
ΔE Greyscale Calman: 3 | ∀{0.09-98 Ø4.96}
87% AdobeRGB 1998 (Argyll 3D)
99.9% sRGB (Argyll 3D)
97.2% Display P3 (Argyll 3D)
Gamma: 2.38
CCT: 6799 K
| Lenovo Legion 9 16IRX8 CSOT T3 MNG007ZA2-2, Mini-LED, 3200x2000, 16" | Lenovo Legion Slim 5 16APH8 BOE NJ NE160QDM-NYC, IPS, 2560x1600, 16" | Razer Blade 16 Early 2023 RTX 4090 AUO B160ZAN01.U, mini-LED, 3840x2400, 16" | Asus ROG Strix G16 G614JZ TL160ADMP03-0, IPS, 2560x1600, 16" | HP Omen Transcend 16 AUOA3A6, Mini-LED, 2560x1600, 16" | Alienware x16 R1 BOE NE16NZ4, IPS, 2560x1600, 16" | |
|---|---|---|---|---|---|---|
| Display | -16% | 2% | -1% | 1% | 1% | |
| Display P3 Coverage (%) | 97.2 | 69.3 -29% | 99.9 3% | 97 0% | 99.2 2% | 99.2 2% |
| sRGB Coverage (%) | 99.9 | 100 0% | 100 0% | 99.9 0% | 100 0% | 100 0% |
| AdobeRGB 1998 Coverage (%) | 87 | 70 -20% | 90.9 4% | 84.9 -2% | 87.6 1% | 88.6 2% |
| Response Times | 27% | -206% | 53% | -121% | 37% | |
| Response Time Grey 50% / Grey 80% * (ms) | 13.3 ? | 10.7 ? 20% | 10.2 ? 23% | 5.1 ? 62% | 26.4 ? -98% | 5.1 ? 62% |
| Response Time Black / White * (ms) | 11.6 ? | 7.8 ? 33% | 62.04 ? -435% | 6.6 ? 43% | 28.2 ? -143% | 10.3 ? 11% |
| PWM Frequency (Hz) | 4742 | 2420 ? | 3506 ? | |||
| Screen | -109% | 62% | -111% | -26% | -73% | |
| Brightness middle (cd/m²) | 674.9 | 371.6 -45% | 730 8% | 470 -30% | 791.1 17% | 302.2 -55% |
| Brightness (cd/m²) | 682 | 343 -50% | 729 7% | 459 -33% | 800 17% | 285 -58% |
| Brightness Distribution (%) | 96 | 84 -12% | 94 -2% | 93 -3% | 95 -1% | 89 -7% |
| Black Level * (cd/m²) | 0.04 | 0.44 -1000% | 0.0045 89% | 0.42 -950% | 0.04 -0% | 0.26 -550% |
| Contrast (:1) | 16873 | 845 -95% | 162222 861% | 1119 -93% | 19778 17% | 1162 -93% |
| Colorchecker dE 2000 * | 2.56 | 1.52 41% | 5.65 -121% | 1.86 27% | 4.37 -71% | 1.63 36% |
| Colorchecker dE 2000 max. * | 4.16 | 2.68 36% | 10.11 -143% | 3.87 7% | 10.39 -150% | 4.13 1% |
| Colorchecker dE 2000 calibrated * | 2.47 | 0.33 87% | 1.85 25% | 0.93 62% | 1.04 58% | 1.17 53% |
| Greyscale dE 2000 * | 3 | 1.2 60% | 8.1 -170% | 2.7 10% | 6.5 -117% | 2.5 17% |
| Gamma | 2.38 92% | 2.1 105% | 1.98 111% | 2.246 98% | 2.28 96% | 2.23 99% |
| CCT | 6799 96% | 6503 100% | 5874 111% | 6711 97% | 6000 108% | 6590 99% |
| Toplam Ortalama (Program / Ayarlar) | -33% /
-70% | -47% /
11% | -20% /
-64% | -49% /
-33% | -12% /
-41% |
* ... daha küçük daha iyidir
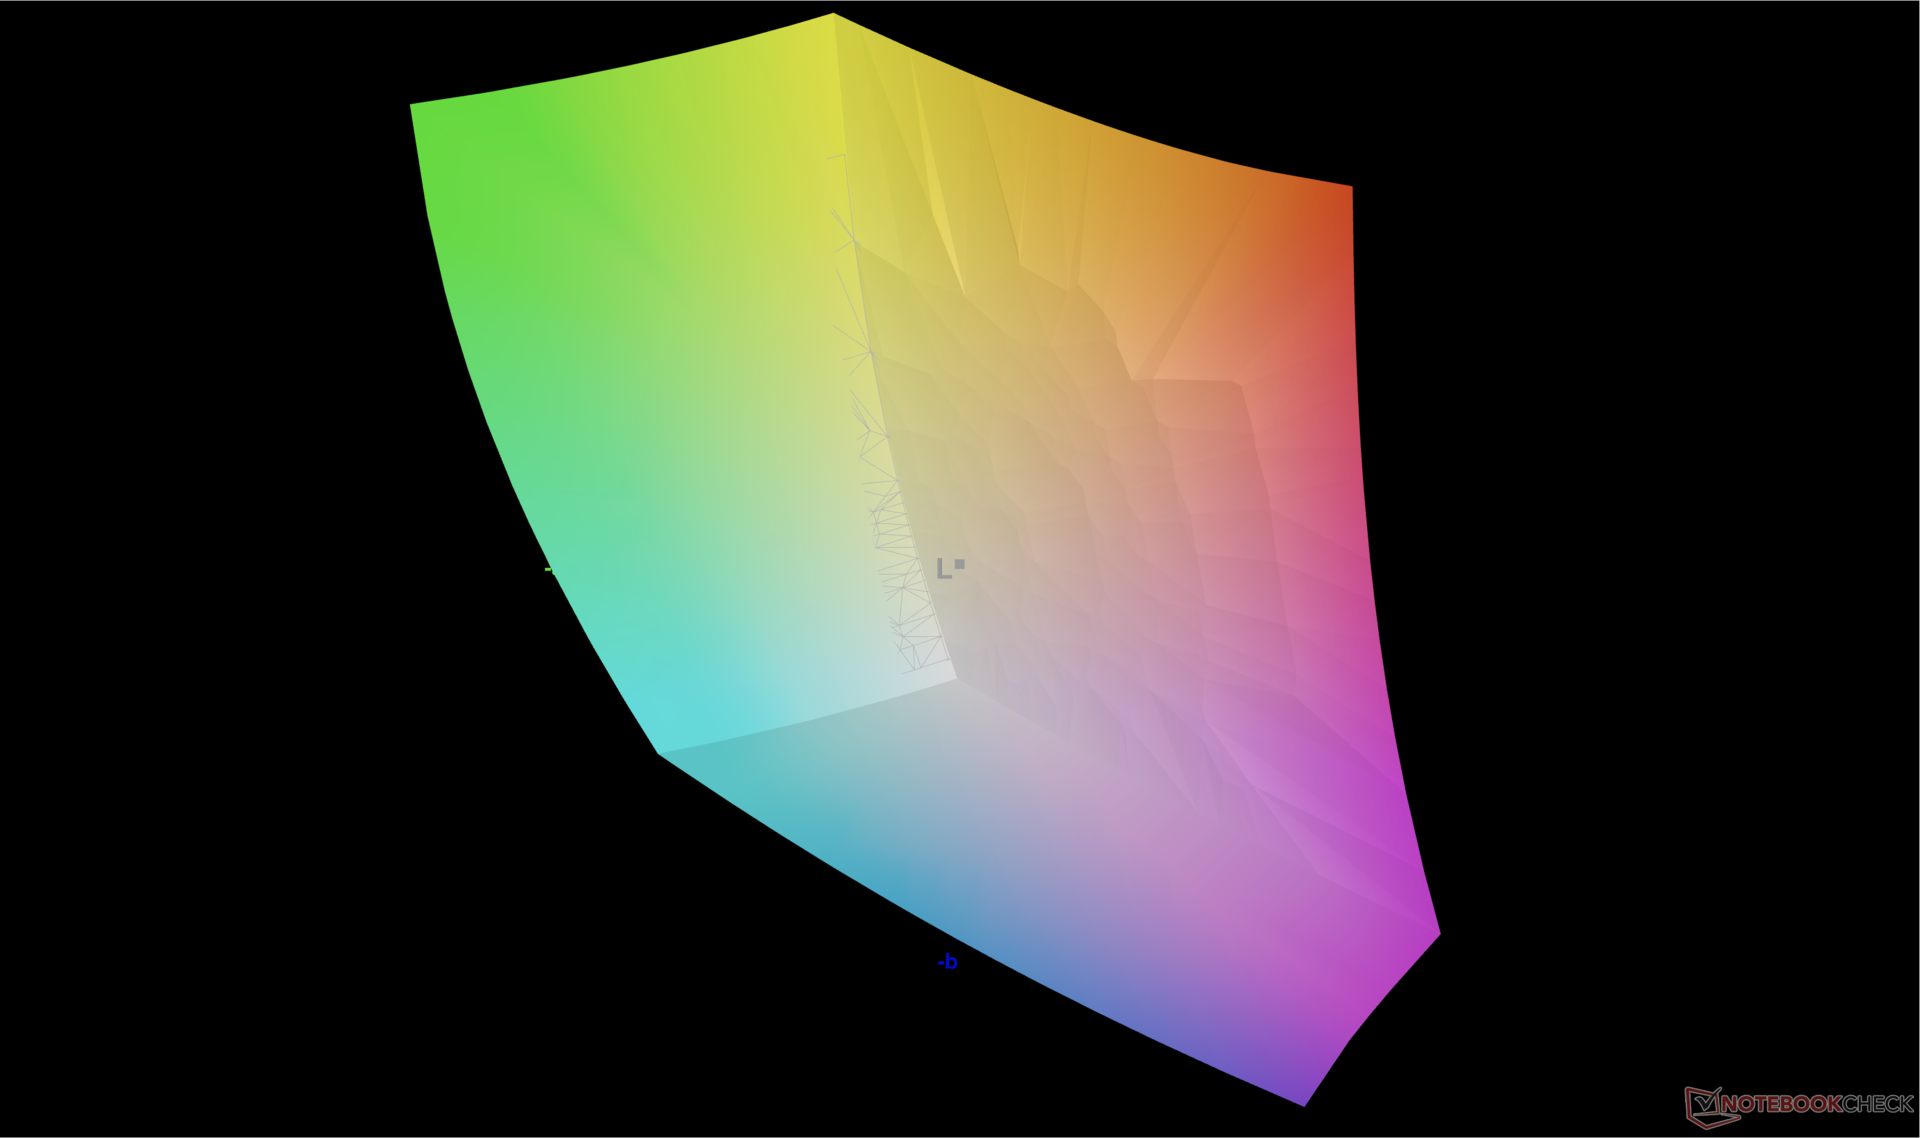
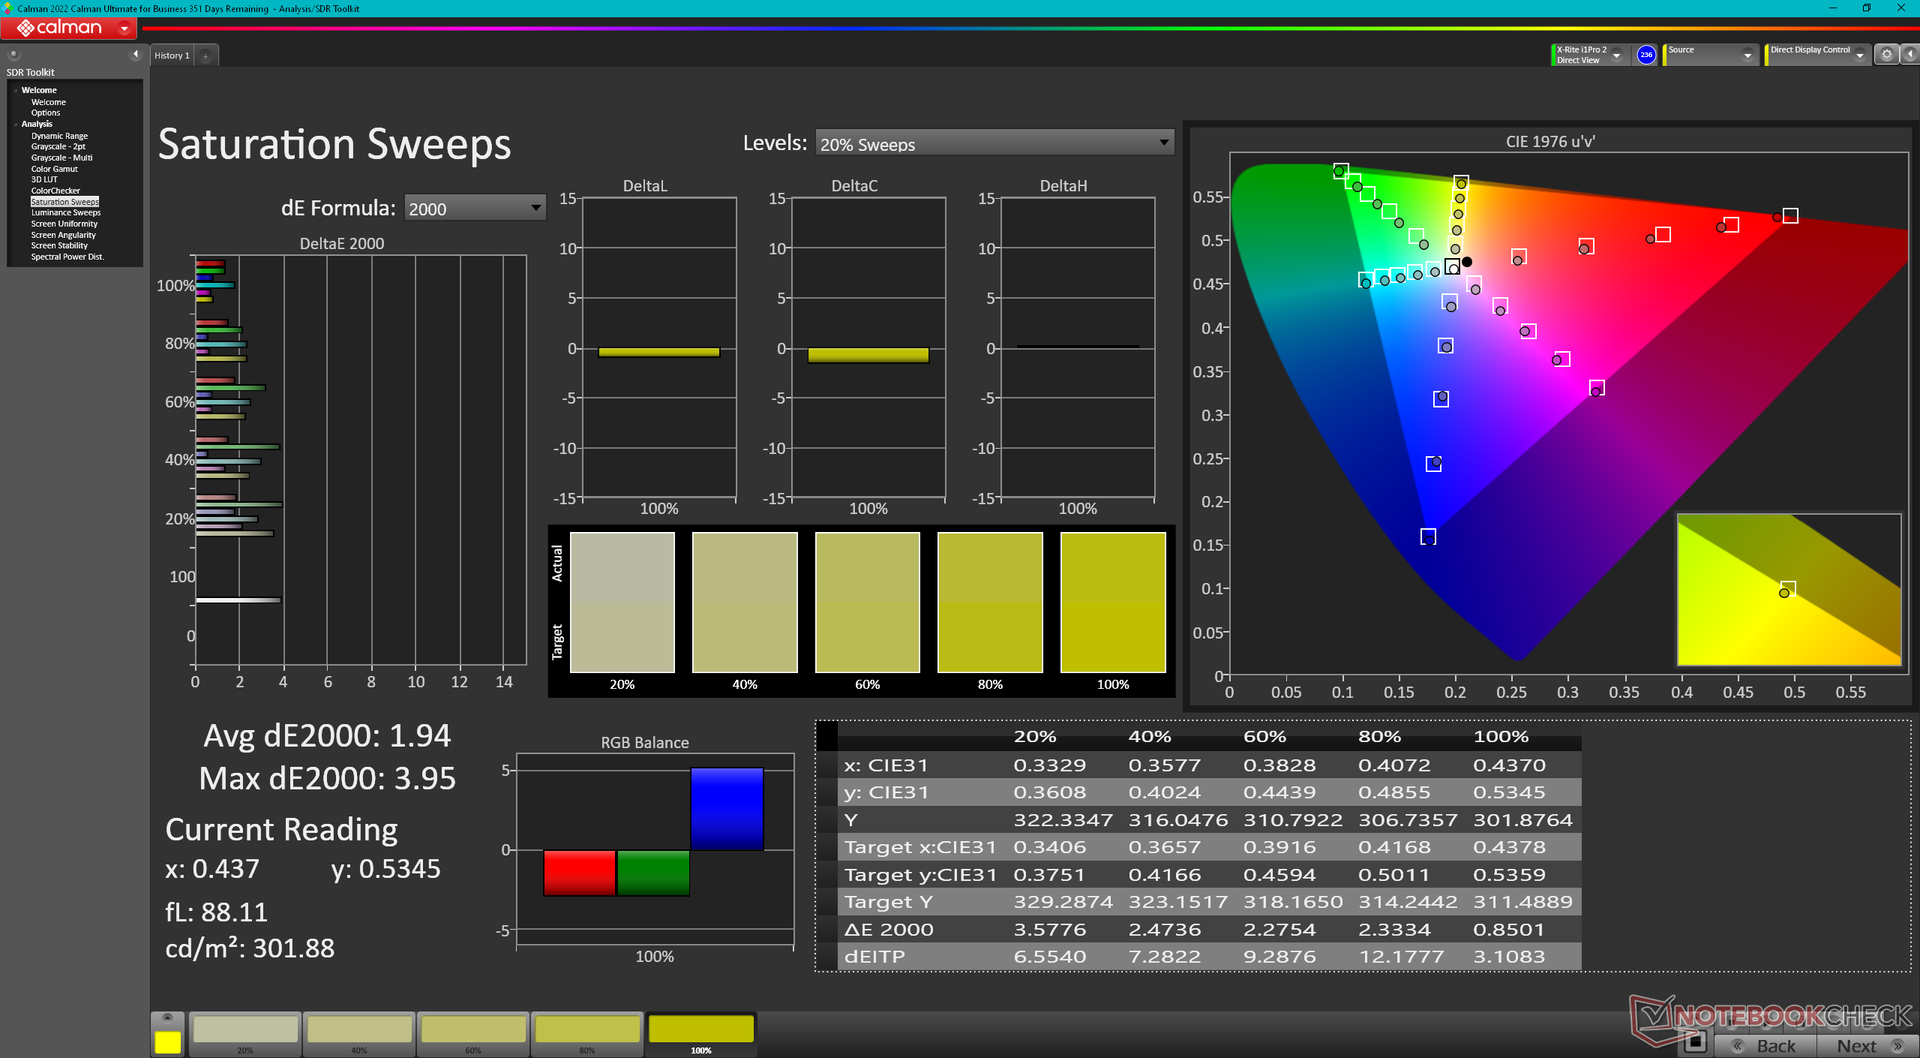
Ekran, ortalama gri tonlama ve renk DeltaE değerleri sırasıyla sadece 3 ve 2,56 olan P3 standardına göre kutudan iyi kalibre edilmiş olarak çıkıyor.
Yanıt Sürelerini Görüntüle
| ↔ Tepki Süresi Siyahtan Beyaza | ||
|---|---|---|
| 11.6 ms ... yükseliş ↗ ve sonbahar↘ birleşimi | ↗ 5.1 ms yükseliş | 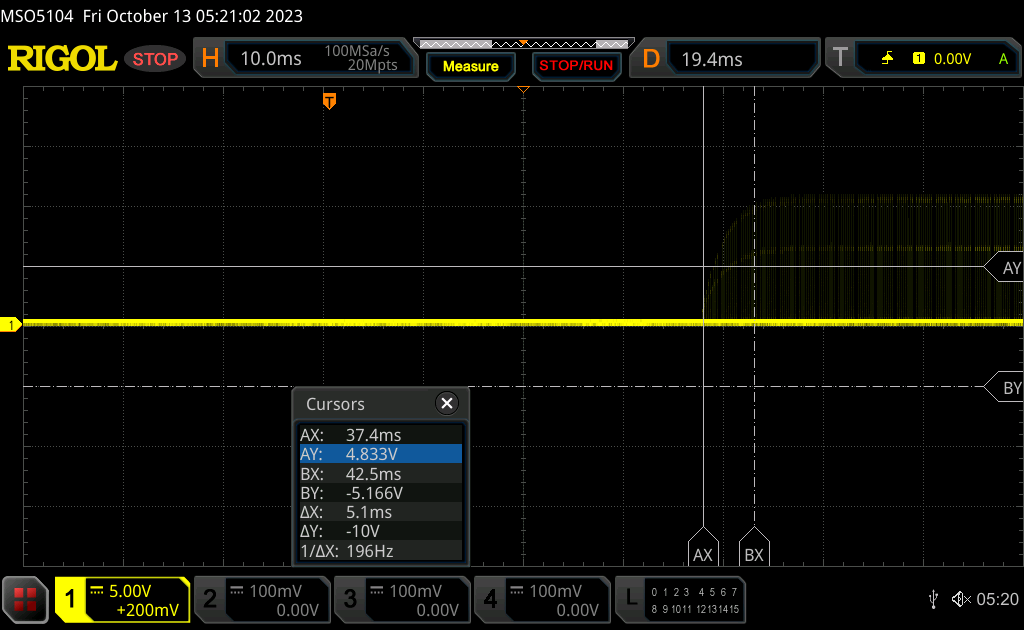 |
| ↘ 6.5 ms sonbahar | ||
| Ekran, testlerimizde iyi yanıt oranları gösteriyor ancak rekabetçi oyuncular için çok yavaş olabilir. Karşılaştırıldığında, test edilen tüm cihazlar 0.1 (minimum) ile 240 (maksimum) ms arasında değişir. » Tüm cihazların 31 %'si daha iyi. Bu, ölçülen yanıt süresinin test edilen tüm cihazların ortalamasından (19.8 ms) daha iyi olduğu anlamına gelir. | ||
| ↔ Tepki Süresi %50 Griden %80 Griye | ||
| 13.3 ms ... yükseliş ↗ ve sonbahar↘ birleşimi | ↗ 5.7 ms yükseliş | 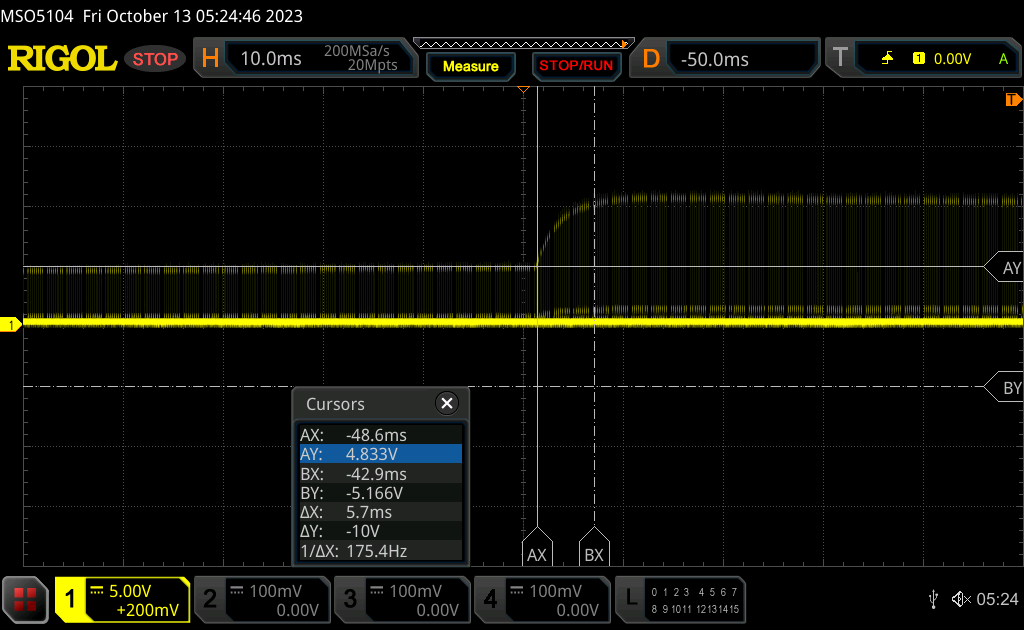 |
| ↘ 7.6 ms sonbahar | ||
| Ekran, testlerimizde iyi yanıt oranları gösteriyor ancak rekabetçi oyuncular için çok yavaş olabilir. Karşılaştırıldığında, test edilen tüm cihazlar 0.165 (minimum) ile 636 (maksimum) ms arasında değişir. » Tüm cihazların 27 %'si daha iyi. Bu, ölçülen yanıt süresinin test edilen tüm cihazların ortalamasından (30.9 ms) daha iyi olduğu anlamına gelir. | ||
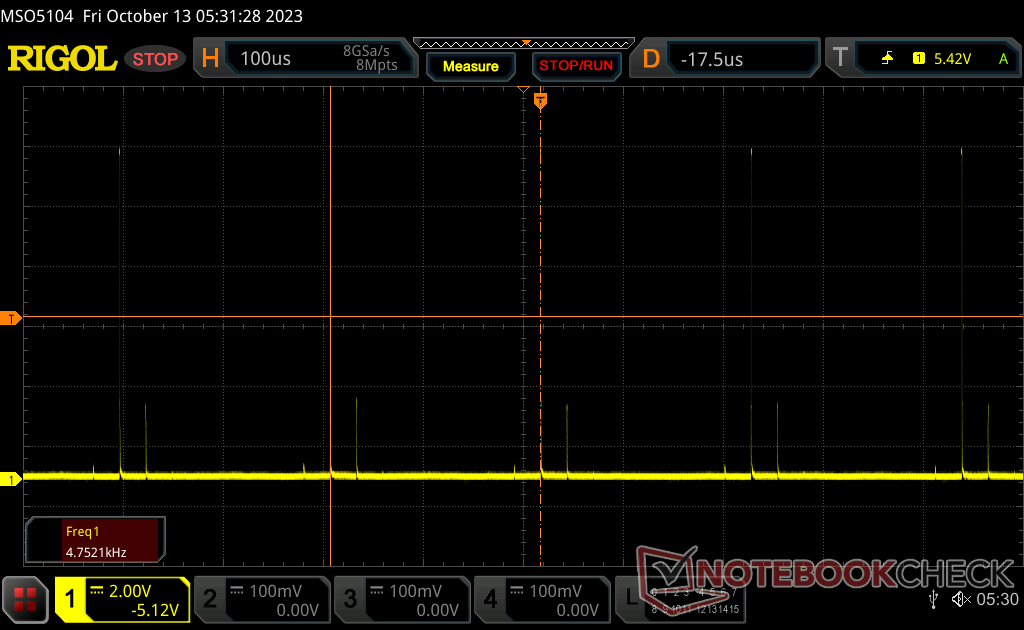
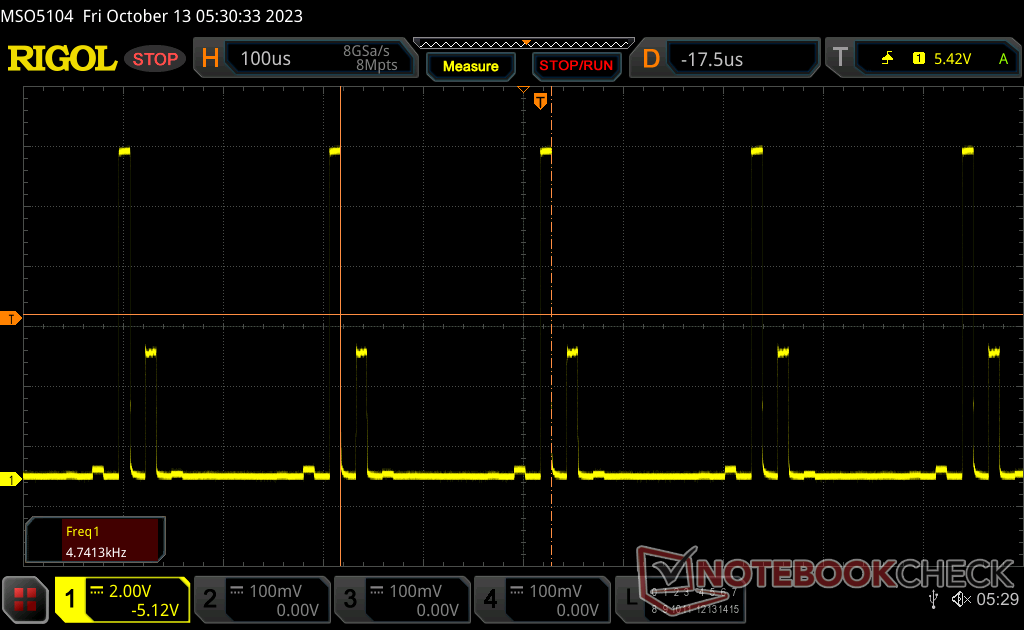
Ekran Titremesi / PWM (Darbe Genişliği Modülasyonu)
| Ekran titriyor / PWM algılandı | 4742 Hz | 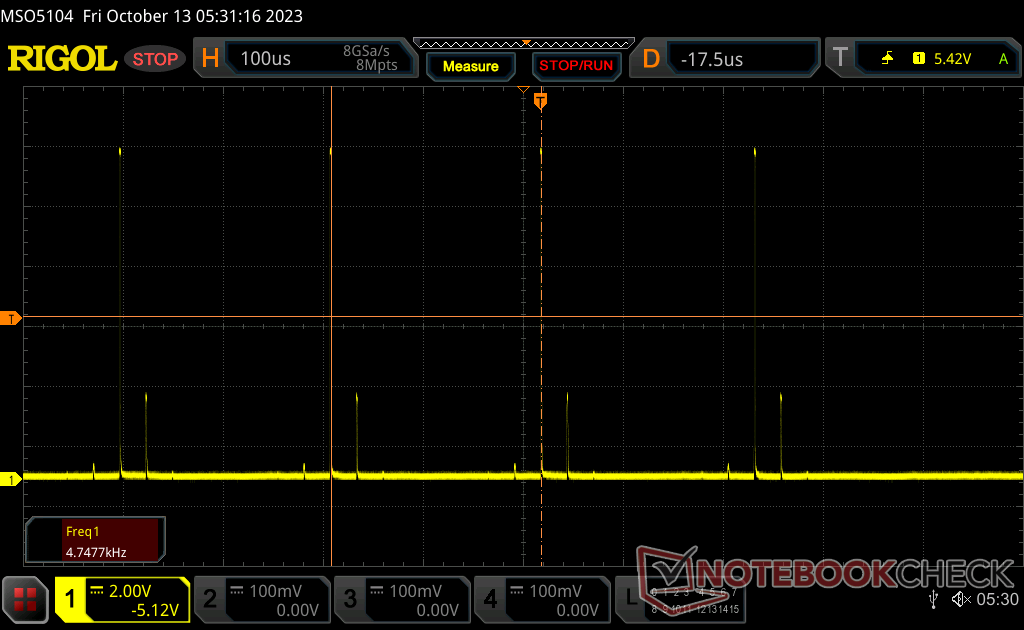 | |
Ekran arka ışığı 4742 Hz'de titriyor (en kötü durum, örneğin PWM kullanılması) . 4742 Hz frekansı oldukça yüksektir, bu nedenle PWM'ye duyarlı çoğu kullanıcı herhangi bir titremeyi fark etmemelidir. Karşılaştırıldığında: Test edilen tüm cihazların %52 %'si ekranı karartmak için PWM kullanmıyor. PWM tespit edilirse, ortalama 7741 (minimum: 5 - maksimum: 343500) Hz ölçüldü. | |||
Titreme tüm parlaklık seviyelerinde 4752 Hz'lik sabit bir frekansta mevcuttur.


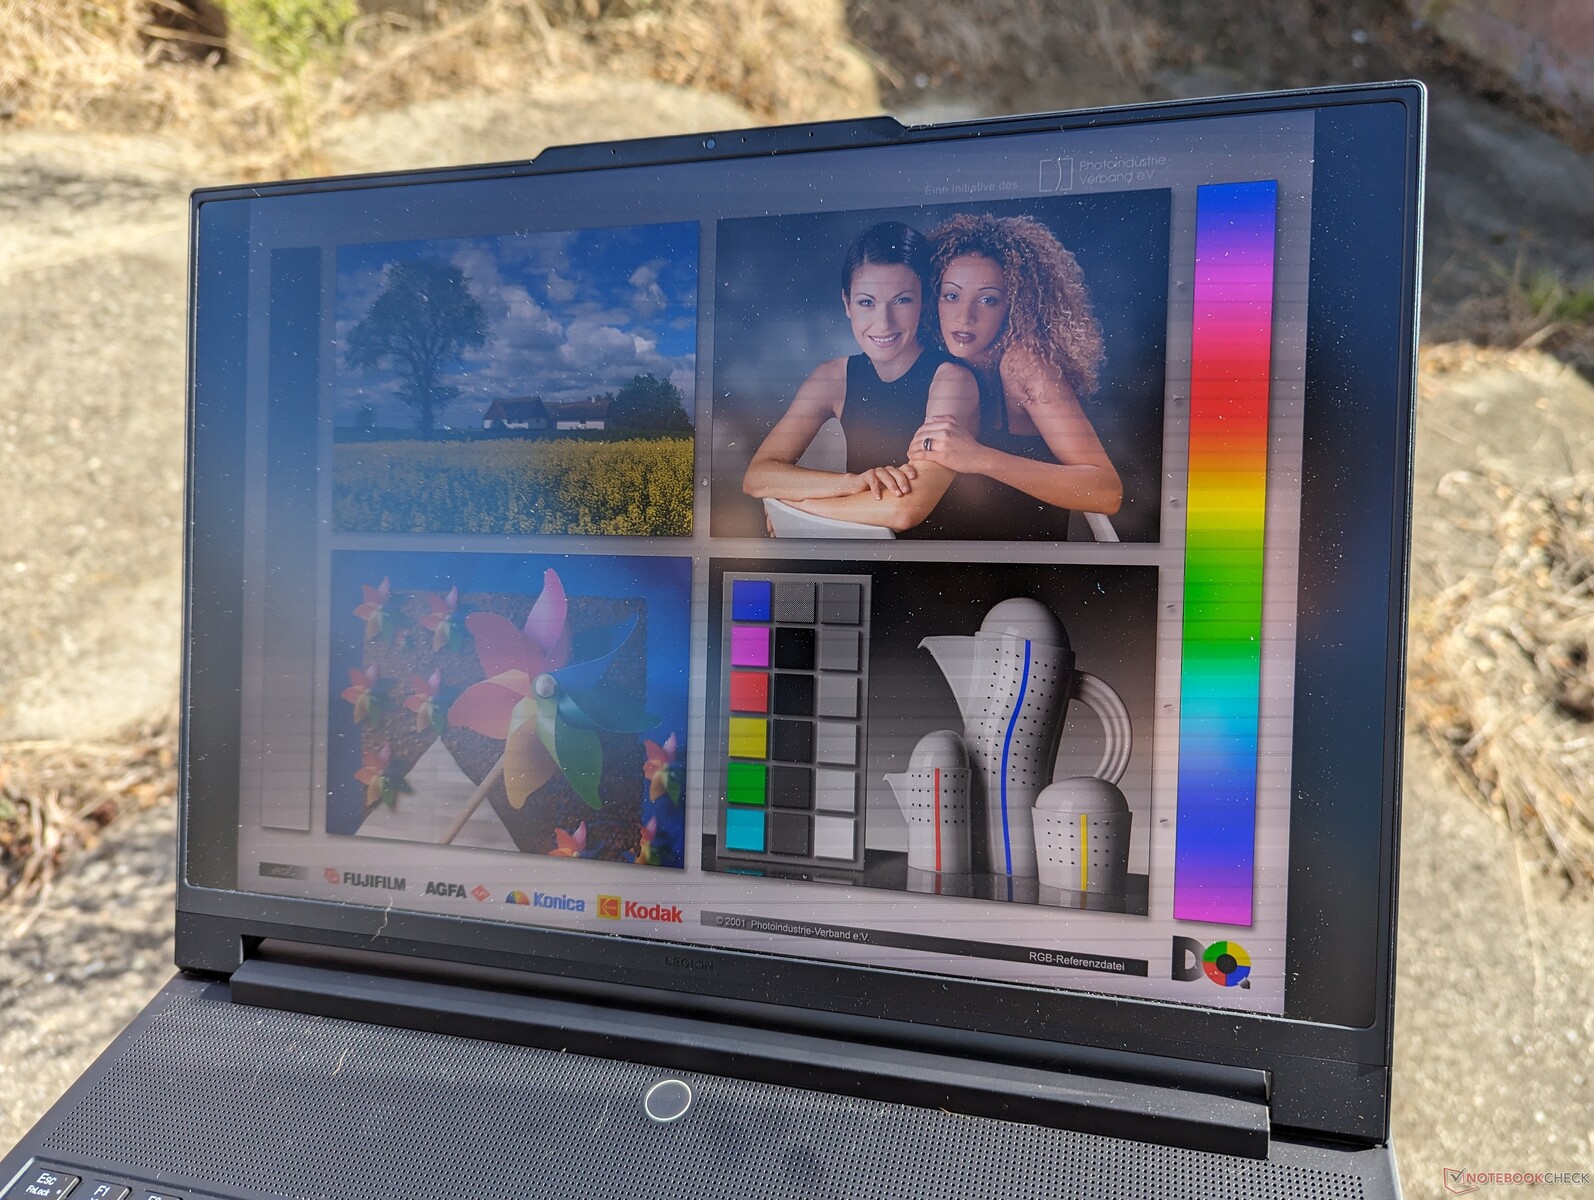
Mini LED'in yukarıda bahsedilen yüksek maksimum parlaklığı sayesinde bir oyun dizüstü bilgisayarı için dış mekan görünürlüğü mükemmeldir. Bununla birlikte, sistemin ağır ağırlığı ve kısa pil ömrü dizüstü bilgisayarı çoğunlukla iç mekan senaryolarıyla sınırlamaktadır.
Performans - Core i7'ye İzin Yok
Test Koşulları
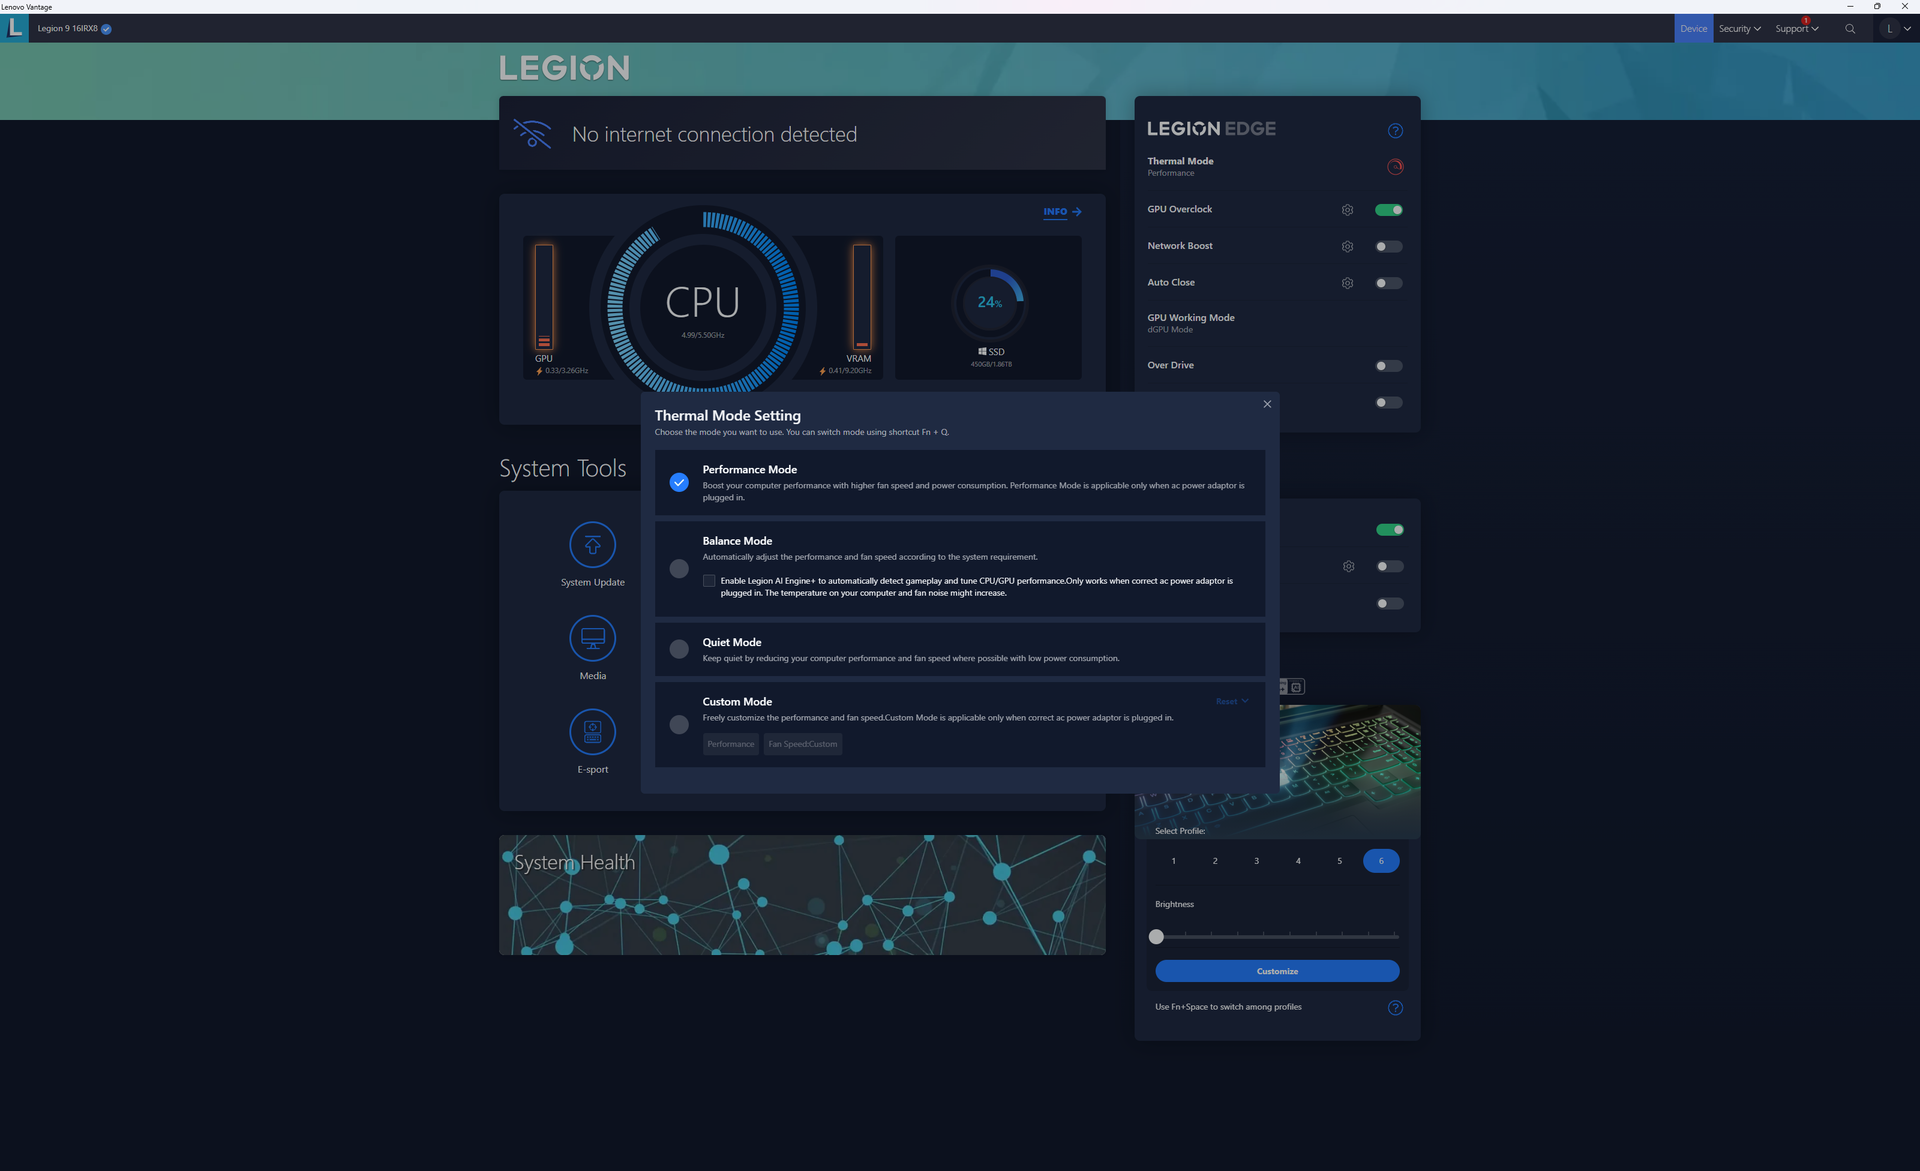
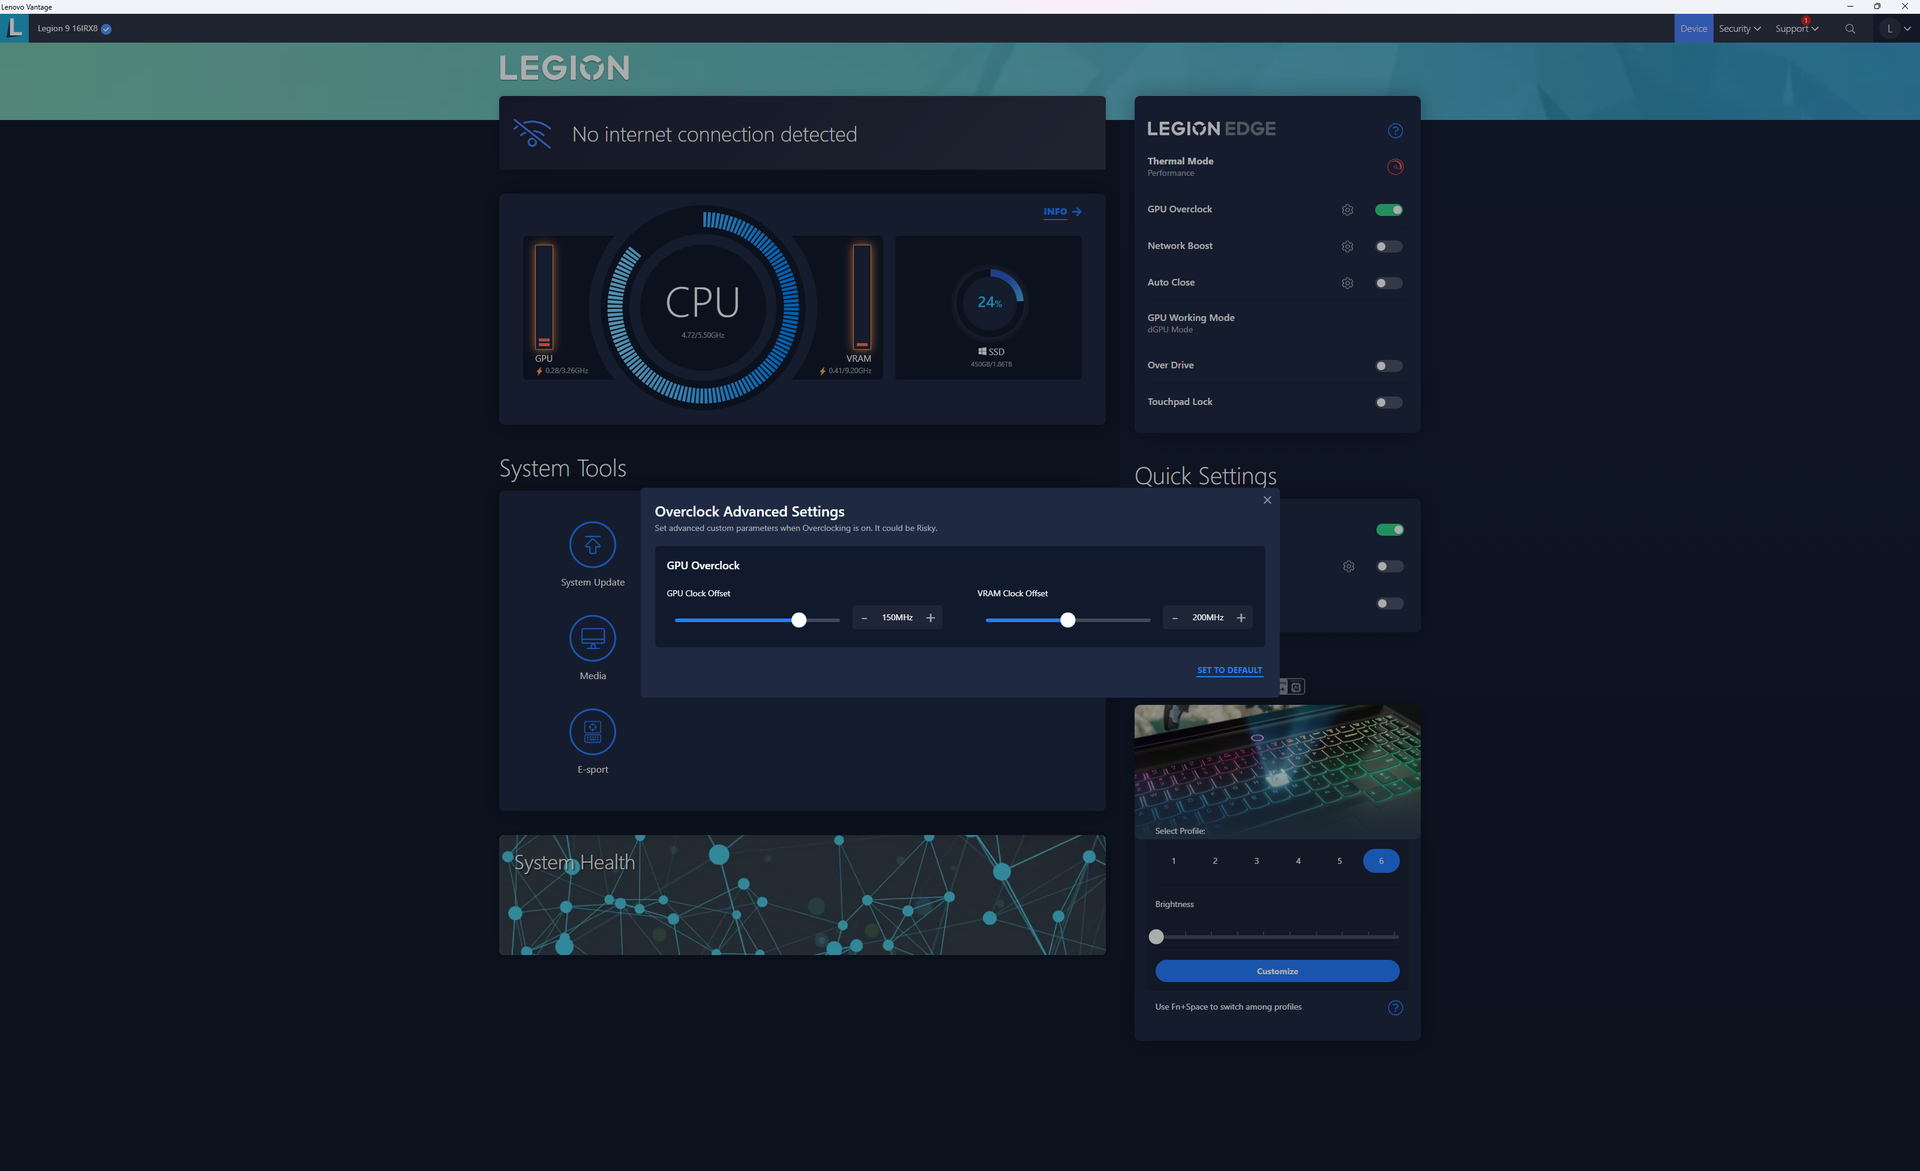
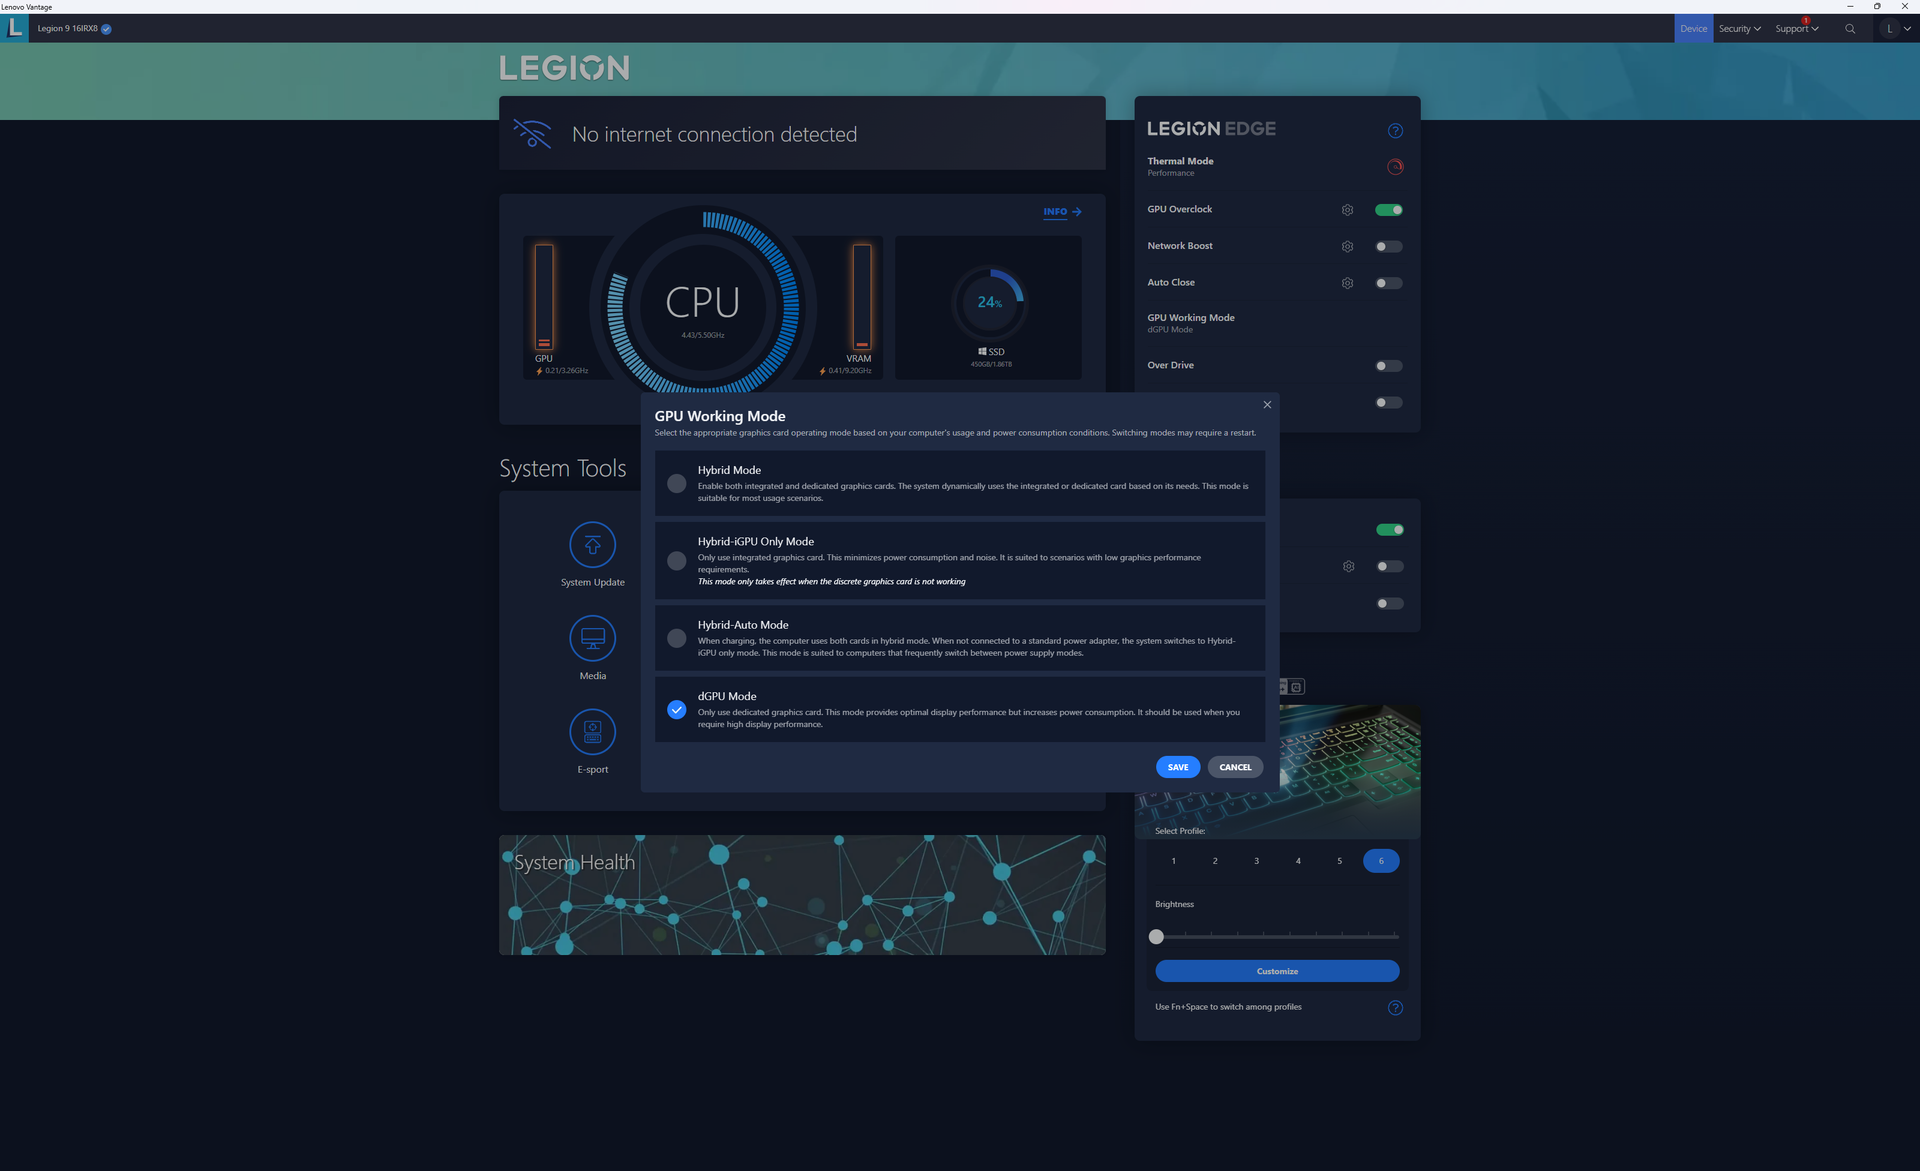
Aşağıdaki kıyaslamaları çalıştırmadan önce Lenovo Vantage aracılığıyla ünitemizi Performans moduna ve dGPU moduna ayarladık. GPU Hız Aşırtma da diğer üst düzey Legion modellerinde olduğu gibi varsayılan olarak +150 MHz GPU ve +200 MHz VRAM'de etkinleştirilmiştir. Sahiplerin güç profillerini ve diğer yardımcı ayarları ayarlamak için Vantage'a aşina olmaları önerilir.
Gelişmiş Optimus, MUX ve G-Sync'in tümü, yeni modellerden farklı olarak desteklenmektedir Legion İnce 5 14.
İşlemci
CPU performansı mükemmeldir ve çok iş parçacıklı iş yüklerinde genel kullanıma göre yaklaşık yüzde 80 ila 90 daha hızlı sonuç verir Core i7-13700H. Bu Core i9-13980HX şu anda Intel'in en hızlı mobil CPU'larından biri, ancak yine de rakiplerinin gerisinde kalıyorRyzen 9 7945HX çok iş parçacıklı kıyaslamaların çoğunda yaklaşık yüzde 10 oranında.
Performans, bir önceki yıla göre sadece yüzde 5 daha hızlıdır Core i9-13950HX 2023 Razer Blade 16 ile geçirdiğimiz zamana dayanarak. Ne yazık ki Lenovo, birkaç yüz dolar tasarruf etmek isteyebilecekler için Core i9-13980HX dışında başka CPU seçeneği sunmuyor.
Cinebench R15 Multi Loop
Cinebench R23: Multi Core | Single Core
Cinebench R20: CPU (Multi Core) | CPU (Single Core)
Cinebench R15: CPU Multi 64Bit | CPU Single 64Bit
Blender: v2.79 BMW27 CPU
7-Zip 18.03: 7z b 4 | 7z b 4 -mmt1
Geekbench 5.5: Multi-Core | Single-Core
HWBOT x265 Benchmark v2.2: 4k Preset
LibreOffice : 20 Documents To PDF
R Benchmark 2.5: Overall mean
| CPU Performance rating | |
| Asus Zephyrus Duo 16 GX650PY-NM006W | |
| Lenovo Legion 9 16IRX8 | |
| Ortalama Intel Core i9-13980HX | |
| Asus ROG Strix G16 G614JZ | |
| HP Omen Transcend 16 | |
| Razer Blade 16 Early 2023 RTX 4090 | |
| Alienware m16 R1 AMD | |
| Alienware x16 R1 -1! | |
| Alienware m16 R1 Intel | |
| Lenovo Legion Pro 5 16ARX8 | |
| Lenovo Legion Slim 5 16APH8 | |
| Lenovo Legion Pro 5 16ARX8 (R5 7645HX, RTX 4050) | |
| Dell G16 7620 | |
| HP Victus 16-r0077ng | |
| Lenovo Legion 7 16ARHA7 | |
| HP Omen 16-n0033dx | |
| Dell Inspiron 16 Plus 7610 -2! | |
| Cinebench R23 / Multi Core | |
| Asus Zephyrus Duo 16 GX650PY-NM006W | |
| Ortalama Intel Core i9-13980HX (28301 - 33052, n=11) | |
| Asus ROG Strix G16 G614JZ | |
| Lenovo Legion 9 16IRX8 | |
| Razer Blade 16 Early 2023 RTX 4090 | |
| Alienware m16 R1 AMD | |
| HP Omen Transcend 16 | |
| Alienware m16 R1 Intel | |
| Alienware x16 R1 | |
| Lenovo Legion Pro 5 16ARX8 | |
| Dell G16 7620 | |
| Lenovo Legion Slim 5 16APH8 | |
| HP Victus 16-r0077ng | |
| Lenovo Legion 7 16ARHA7 | |
| Lenovo Legion Pro 5 16ARX8 (R5 7645HX, RTX 4050) | |
| HP Omen 16-n0033dx | |
| Dell Inspiron 16 Plus 7610 | |
| Cinebench R23 / Single Core | |
| Lenovo Legion 9 16IRX8 | |
| Asus ROG Strix G16 G614JZ | |
| HP Omen Transcend 16 | |
| Ortalama Intel Core i9-13980HX (1825 - 2169, n=9) | |
| Alienware x16 R1 | |
| Razer Blade 16 Early 2023 RTX 4090 | |
| Asus Zephyrus Duo 16 GX650PY-NM006W | |
| Alienware m16 R1 Intel | |
| Alienware m16 R1 AMD | |
| Lenovo Legion Pro 5 16ARX8 | |
| Lenovo Legion Pro 5 16ARX8 (R5 7645HX, RTX 4050) | |
| Lenovo Legion Slim 5 16APH8 | |
| Dell G16 7620 | |
| HP Victus 16-r0077ng | |
| Lenovo Legion 7 16ARHA7 | |
| Dell Inspiron 16 Plus 7610 | |
| HP Omen 16-n0033dx | |
| Cinebench R20 / CPU (Multi Core) | |
| Asus Zephyrus Duo 16 GX650PY-NM006W | |
| Ortalama Intel Core i9-13980HX (10353 - 12437, n=10) | |
| Asus ROG Strix G16 G614JZ | |
| Lenovo Legion 9 16IRX8 | |
| Razer Blade 16 Early 2023 RTX 4090 | |
| Alienware m16 R1 AMD | |
| HP Omen Transcend 16 | |
| Alienware m16 R1 Intel | |
| Alienware x16 R1 | |
| Lenovo Legion Pro 5 16ARX8 | |
| Lenovo Legion Slim 5 16APH8 | |
| Dell G16 7620 | |
| HP Victus 16-r0077ng | |
| Lenovo Legion 7 16ARHA7 | |
| Lenovo Legion Pro 5 16ARX8 (R5 7645HX, RTX 4050) | |
| HP Omen 16-n0033dx | |
| Dell Inspiron 16 Plus 7610 | |
| Cinebench R20 / CPU (Single Core) | |
| Asus ROG Strix G16 G614JZ | |
| HP Omen Transcend 16 | |
| Ortalama Intel Core i9-13980HX (717 - 825, n=10) | |
| Asus Zephyrus Duo 16 GX650PY-NM006W | |
| Razer Blade 16 Early 2023 RTX 4090 | |
| Alienware x16 R1 | |
| Alienware m16 R1 Intel | |
| Lenovo Legion 9 16IRX8 | |
| Alienware m16 R1 AMD | |
| Lenovo Legion Pro 5 16ARX8 | |
| Lenovo Legion Pro 5 16ARX8 (R5 7645HX, RTX 4050) | |
| Lenovo Legion Slim 5 16APH8 | |
| Dell G16 7620 | |
| HP Victus 16-r0077ng | |
| Lenovo Legion 7 16ARHA7 | |
| HP Omen 16-n0033dx | |
| Dell Inspiron 16 Plus 7610 | |
| Cinebench R15 / CPU Multi 64Bit | |
| Asus Zephyrus Duo 16 GX650PY-NM006W | |
| Asus ROG Strix G16 G614JZ | |
| Asus ROG Strix G16 G614JZ | |
| Ortalama Intel Core i9-13980HX (4358 - 5172, n=11) | |
| Lenovo Legion 9 16IRX8 | |
| Razer Blade 16 Early 2023 RTX 4090 | |
| Alienware m16 R1 AMD | |
| HP Omen Transcend 16 | |
| Alienware m16 R1 Intel | |
| Lenovo Legion Pro 5 16ARX8 | |
| Alienware x16 R1 | |
| Lenovo Legion Slim 5 16APH8 | |
| Dell G16 7620 | |
| Lenovo Legion 7 16ARHA7 | |
| HP Victus 16-r0077ng | |
| Lenovo Legion Pro 5 16ARX8 (R5 7645HX, RTX 4050) | |
| HP Omen 16-n0033dx | |
| Dell Inspiron 16 Plus 7610 | |
| Cinebench R15 / CPU Single 64Bit | |
| Asus Zephyrus Duo 16 GX650PY-NM006W | |
| Asus ROG Strix G16 G614JZ | |
| Asus ROG Strix G16 G614JZ | |
| Lenovo Legion 9 16IRX8 | |
| Ortalama Intel Core i9-13980HX (289 - 312, n=11) | |
| HP Omen Transcend 16 | |
| Alienware m16 R1 AMD | |
| Lenovo Legion Pro 5 16ARX8 | |
| Lenovo Legion Pro 5 16ARX8 (R5 7645HX, RTX 4050) | |
| Lenovo Legion Slim 5 16APH8 | |
| Alienware x16 R1 | |
| Razer Blade 16 Early 2023 RTX 4090 | |
| Alienware m16 R1 Intel | |
| Lenovo Legion 7 16ARHA7 | |
| Dell G16 7620 | |
| HP Victus 16-r0077ng | |
| HP Omen 16-n0033dx | |
| Dell Inspiron 16 Plus 7610 | |
| Blender / v2.79 BMW27 CPU | |
| Dell Inspiron 16 Plus 7610 | |
| HP Omen 16-n0033dx | |
| Lenovo Legion Pro 5 16ARX8 (R5 7645HX, RTX 4050) | |
| Lenovo Legion 7 16ARHA7 | |
| HP Victus 16-r0077ng | |
| Lenovo Legion Slim 5 16APH8 | |
| Dell G16 7620 | |
| Lenovo Legion Pro 5 16ARX8 | |
| Alienware m16 R1 Intel | |
| HP Omen Transcend 16 | |
| Razer Blade 16 Early 2023 RTX 4090 | |
| Alienware m16 R1 AMD | |
| Ortalama Intel Core i9-13980HX (97 - 136, n=10) | |
| Asus ROG Strix G16 G614JZ | |
| Lenovo Legion 9 16IRX8 | |
| Asus Zephyrus Duo 16 GX650PY-NM006W | |
| 7-Zip 18.03 / 7z b 4 | |
| Asus Zephyrus Duo 16 GX650PY-NM006W | |
| Ortalama Intel Core i9-13980HX (104616 - 129804, n=10) | |
| Lenovo Legion 9 16IRX8 | |
| Asus ROG Strix G16 G614JZ | |
| Razer Blade 16 Early 2023 RTX 4090 | |
| Alienware m16 R1 AMD | |
| HP Omen Transcend 16 | |
| Alienware m16 R1 Intel | |
| Alienware x16 R1 | |
| Lenovo Legion Pro 5 16ARX8 | |
| Lenovo Legion Slim 5 16APH8 | |
| HP Victus 16-r0077ng | |
| Dell G16 7620 | |
| Lenovo Legion 7 16ARHA7 | |
| Lenovo Legion Pro 5 16ARX8 (R5 7645HX, RTX 4050) | |
| HP Omen 16-n0033dx | |
| Dell Inspiron 16 Plus 7610 | |
| 7-Zip 18.03 / 7z b 4 -mmt1 | |
| Asus Zephyrus Duo 16 GX650PY-NM006W | |
| Lenovo Legion Pro 5 16ARX8 | |
| Lenovo Legion Pro 5 16ARX8 (R5 7645HX, RTX 4050) | |
| Alienware m16 R1 AMD | |
| Lenovo Legion 9 16IRX8 | |
| Ortalama Intel Core i9-13980HX (6230 - 7163, n=10) | |
| Asus ROG Strix G16 G614JZ | |
| HP Omen Transcend 16 | |
| Razer Blade 16 Early 2023 RTX 4090 | |
| Lenovo Legion Slim 5 16APH8 | |
| Alienware m16 R1 Intel | |
| Alienware x16 R1 | |
| Lenovo Legion 7 16ARHA7 | |
| HP Omen 16-n0033dx | |
| HP Victus 16-r0077ng | |
| Dell Inspiron 16 Plus 7610 | |
| Dell G16 7620 | |
| Geekbench 5.5 / Multi-Core | |
| Lenovo Legion 9 16IRX8 | |
| Ortalama Intel Core i9-13980HX (18475 - 22200, n=10) | |
| Asus Zephyrus Duo 16 GX650PY-NM006W | |
| Asus ROG Strix G16 G614JZ | |
| HP Omen Transcend 16 | |
| Razer Blade 16 Early 2023 RTX 4090 | |
| Alienware m16 R1 AMD | |
| Alienware x16 R1 | |
| Alienware m16 R1 Intel | |
| Lenovo Legion Pro 5 16ARX8 | |
| Dell G16 7620 | |
| Lenovo Legion Slim 5 16APH8 | |
| HP Victus 16-r0077ng | |
| Lenovo Legion Pro 5 16ARX8 (R5 7645HX, RTX 4050) | |
| Lenovo Legion 7 16ARHA7 | |
| HP Omen 16-n0033dx | |
| Geekbench 5.5 / Single-Core | |
| Lenovo Legion 9 16IRX8 | |
| Asus Zephyrus Duo 16 GX650PY-NM006W | |
| HP Omen Transcend 16 | |
| Ortalama Intel Core i9-13980HX (1796 - 2139, n=10) | |
| Asus ROG Strix G16 G614JZ | |
| Lenovo Legion Pro 5 16ARX8 | |
| Alienware m16 R1 AMD | |
| Lenovo Legion Slim 5 16APH8 | |
| Lenovo Legion Pro 5 16ARX8 (R5 7645HX, RTX 4050) | |
| Razer Blade 16 Early 2023 RTX 4090 | |
| Alienware x16 R1 | |
| Alienware m16 R1 Intel | |
| HP Victus 16-r0077ng | |
| Dell G16 7620 | |
| Lenovo Legion 7 16ARHA7 | |
| HP Omen 16-n0033dx | |
| HWBOT x265 Benchmark v2.2 / 4k Preset | |
| Asus Zephyrus Duo 16 GX650PY-NM006W | |
| Lenovo Legion 9 16IRX8 | |
| Ortalama Intel Core i9-13980HX (27 - 33.4, n=9) | |
| Razer Blade 16 Early 2023 RTX 4090 | |
| Asus ROG Strix G16 G614JZ | |
| Alienware m16 R1 AMD | |
| HP Omen Transcend 16 | |
| Lenovo Legion Pro 5 16ARX8 | |
| Alienware m16 R1 Intel | |
| Alienware x16 R1 | |
| Lenovo Legion Slim 5 16APH8 | |
| Dell G16 7620 | |
| Lenovo Legion Pro 5 16ARX8 (R5 7645HX, RTX 4050) | |
| Lenovo Legion 7 16ARHA7 | |
| HP Victus 16-r0077ng | |
| HP Omen 16-n0033dx | |
| Dell Inspiron 16 Plus 7610 | |
| LibreOffice / 20 Documents To PDF | |
| HP Victus 16-r0077ng | |
| Asus Zephyrus Duo 16 GX650PY-NM006W | |
| HP Omen 16-n0033dx | |
| Lenovo Legion Pro 5 16ARX8 (R5 7645HX, RTX 4050) | |
| Lenovo Legion 7 16ARHA7 | |
| Dell G16 7620 | |
| Razer Blade 16 Early 2023 RTX 4090 | |
| Asus ROG Strix G16 G614JZ | |
| Dell Inspiron 16 Plus 7610 | |
| Alienware m16 R1 Intel | |
| Alienware x16 R1 | |
| HP Omen Transcend 16 | |
| Ortalama Intel Core i9-13980HX (35 - 51.4, n=10) | |
| Alienware m16 R1 AMD | |
| Lenovo Legion Slim 5 16APH8 | |
| Lenovo Legion Pro 5 16ARX8 | |
| Lenovo Legion 9 16IRX8 | |
| R Benchmark 2.5 / Overall mean | |
| Dell Inspiron 16 Plus 7610 | |
| Dell G16 7620 | |
| HP Victus 16-r0077ng | |
| HP Omen 16-n0033dx | |
| Lenovo Legion 7 16ARHA7 | |
| Alienware m16 R1 Intel | |
| Lenovo Legion Slim 5 16APH8 | |
| Lenovo Legion Pro 5 16ARX8 (R5 7645HX, RTX 4050) | |
| Alienware x16 R1 | |
| Alienware m16 R1 AMD | |
| Lenovo Legion Pro 5 16ARX8 | |
| HP Omen Transcend 16 | |
| Asus Zephyrus Duo 16 GX650PY-NM006W | |
| Razer Blade 16 Early 2023 RTX 4090 | |
| Ortalama Intel Core i9-13980HX (0.3793 - 0.4462, n=10) | |
| Asus ROG Strix G16 G614JZ | |
| Lenovo Legion 9 16IRX8 | |
Cinebench R23: Multi Core | Single Core
Cinebench R20: CPU (Multi Core) | CPU (Single Core)
Cinebench R15: CPU Multi 64Bit | CPU Single 64Bit
Blender: v2.79 BMW27 CPU
7-Zip 18.03: 7z b 4 | 7z b 4 -mmt1
Geekbench 5.5: Multi-Core | Single-Core
HWBOT x265 Benchmark v2.2: 4k Preset
LibreOffice : 20 Documents To PDF
R Benchmark 2.5: Overall mean
* ... daha küçük daha iyidir
AIDA64: FP32 Ray-Trace | FPU Julia | CPU SHA3 | CPU Queen | FPU SinJulia | FPU Mandel | CPU AES | CPU ZLib | FP64 Ray-Trace | CPU PhotoWorxx
| Performance rating | |
| Lenovo Legion 9 16IRX8 | |
| Ortalama Intel Core i9-13980HX | |
| Asus ROG Strix G16 G614JZ | |
| HP Omen Transcend 16 | |
| Razer Blade 16 Early 2023 RTX 4090 | |
| Lenovo Legion Slim 5 16APH8 | |
| Alienware x16 R1 | |
| AIDA64 / FP32 Ray-Trace | |
| Lenovo Legion Slim 5 16APH8 | |
| Asus ROG Strix G16 G614JZ | |
| Lenovo Legion 9 16IRX8 | |
| Ortalama Intel Core i9-13980HX (21332 - 29553, n=9) | |
| HP Omen Transcend 16 | |
| Alienware x16 R1 | |
| Razer Blade 16 Early 2023 RTX 4090 | |
| AIDA64 / FPU Julia | |
| Lenovo Legion 9 16IRX8 | |
| Ortalama Intel Core i9-13980HX (108001 - 148168, n=9) | |
| Asus ROG Strix G16 G614JZ | |
| Lenovo Legion Slim 5 16APH8 | |
| HP Omen Transcend 16 | |
| Razer Blade 16 Early 2023 RTX 4090 | |
| Alienware x16 R1 | |
| AIDA64 / CPU SHA3 | |
| Lenovo Legion 9 16IRX8 | |
| Asus ROG Strix G16 G614JZ | |
| Ortalama Intel Core i9-13980HX (5264 - 7142, n=9) | |
| Razer Blade 16 Early 2023 RTX 4090 | |
| HP Omen Transcend 16 | |
| Lenovo Legion Slim 5 16APH8 | |
| Alienware x16 R1 | |
| AIDA64 / CPU Queen | |
| Asus ROG Strix G16 G614JZ | |
| Ortalama Intel Core i9-13980HX (126758 - 143409, n=9) | |
| Razer Blade 16 Early 2023 RTX 4090 | |
| Lenovo Legion 9 16IRX8 | |
| HP Omen Transcend 16 | |
| Lenovo Legion Slim 5 16APH8 | |
| Alienware x16 R1 | |
| AIDA64 / FPU SinJulia | |
| Asus ROG Strix G16 G614JZ | |
| Ortalama Intel Core i9-13980HX (13785 - 17117, n=9) | |
| Lenovo Legion 9 16IRX8 | |
| Lenovo Legion Slim 5 16APH8 | |
| HP Omen Transcend 16 | |
| Razer Blade 16 Early 2023 RTX 4090 | |
| Alienware x16 R1 | |
| AIDA64 / FPU Mandel | |
| Lenovo Legion 9 16IRX8 | |
| Ortalama Intel Core i9-13980HX (53398 - 73758, n=9) | |
| Asus ROG Strix G16 G614JZ | |
| Lenovo Legion Slim 5 16APH8 | |
| HP Omen Transcend 16 | |
| Razer Blade 16 Early 2023 RTX 4090 | |
| Alienware x16 R1 | |
| AIDA64 / CPU AES | |
| Razer Blade 16 Early 2023 RTX 4090 | |
| Asus ROG Strix G16 G614JZ | |
| Lenovo Legion 9 16IRX8 | |
| Ortalama Intel Core i9-13980HX (105169 - 136520, n=9) | |
| HP Omen Transcend 16 | |
| Alienware x16 R1 | |
| Lenovo Legion Slim 5 16APH8 | |
| AIDA64 / CPU ZLib | |
| Lenovo Legion 9 16IRX8 | |
| Asus ROG Strix G16 G614JZ | |
| Ortalama Intel Core i9-13980HX (1513 - 2039, n=9) | |
| Razer Blade 16 Early 2023 RTX 4090 | |
| HP Omen Transcend 16 | |
| Alienware x16 R1 | |
| Lenovo Legion Slim 5 16APH8 | |
| AIDA64 / FP64 Ray-Trace | |
| Lenovo Legion Slim 5 16APH8 | |
| Lenovo Legion 9 16IRX8 | |
| Asus ROG Strix G16 G614JZ | |
| Ortalama Intel Core i9-13980HX (11431 - 16325, n=9) | |
| HP Omen Transcend 16 | |
| Alienware x16 R1 | |
| Razer Blade 16 Early 2023 RTX 4090 | |
| AIDA64 / CPU PhotoWorxx | |
| Razer Blade 16 Early 2023 RTX 4090 | |
| Lenovo Legion 9 16IRX8 | |
| HP Omen Transcend 16 | |
| Alienware x16 R1 | |
| Ortalama Intel Core i9-13980HX (37069 - 52949, n=9) | |
| Asus ROG Strix G16 G614JZ | |
| Lenovo Legion Slim 5 16APH8 | |
Sistem Performansı
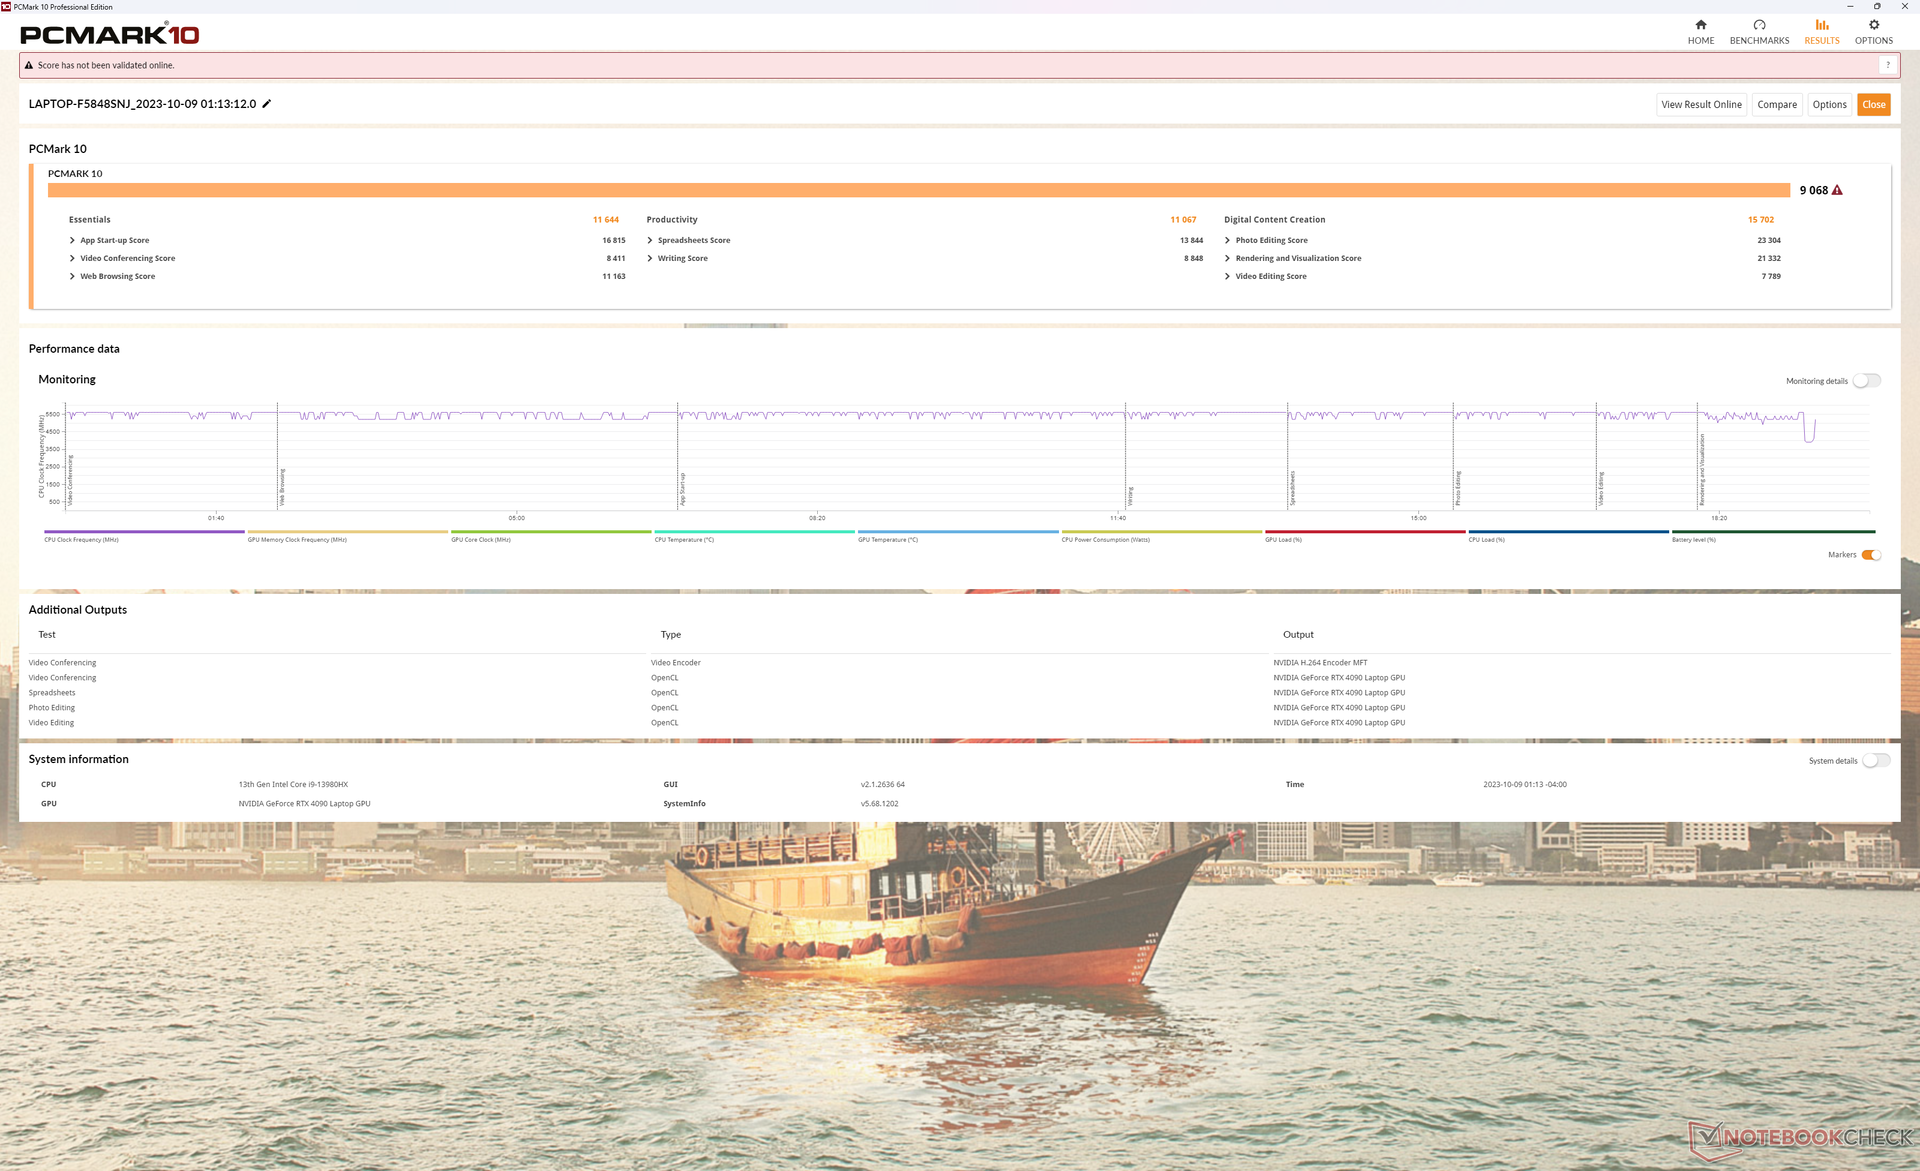
PCMark skorları, 13. nesil Core HX CPU, RTX 4090 GPU ve özellikle RAID 0 PCIe4 x4 konfigürasyonu sayesinde boyutu ne olursa olsun tüm oyun dizüstü bilgisayarları arasında en yüksek skorlardan bazılarıdır. Bununla birlikte, ekranın bazen alışılmadık derecede uzun süreler boyunca boş ve "donmuş" kaldığı uykudan uyanma sorunları yaşadık. Bunun, modelin birçok farklı GPU modu arasında nasıl hokkabazlık yaptığından kaynaklanabileceğinden şüpheleniyoruz.
CrossMark: Overall | Productivity | Creativity | Responsiveness
| PCMark 10 / Score | |
| Lenovo Legion 9 16IRX8 | |
| Ortalama Intel Core i9-13980HX, NVIDIA GeForce RTX 4090 Laptop GPU (8650 - 9068, n=4) | |
| Alienware x16 R1 | |
| HP Omen Transcend 16 | |
| Lenovo Legion Slim 5 16APH8 | |
| Razer Blade 16 Early 2023 RTX 4090 | |
| Asus ROG Strix G16 G614JZ | |
| PCMark 10 / Essentials | |
| Asus ROG Strix G16 G614JZ | |
| Lenovo Legion 9 16IRX8 | |
| Ortalama Intel Core i9-13980HX, NVIDIA GeForce RTX 4090 Laptop GPU (11215 - 11644, n=3) | |
| HP Omen Transcend 16 | |
| Lenovo Legion Slim 5 16APH8 | |
| Alienware x16 R1 | |
| Razer Blade 16 Early 2023 RTX 4090 | |
| PCMark 10 / Productivity | |
| Lenovo Legion 9 16IRX8 | |
| Ortalama Intel Core i9-13980HX, NVIDIA GeForce RTX 4090 Laptop GPU (10125 - 11067, n=3) | |
| Lenovo Legion Slim 5 16APH8 | |
| Alienware x16 R1 | |
| HP Omen Transcend 16 | |
| Razer Blade 16 Early 2023 RTX 4090 | |
| Asus ROG Strix G16 G614JZ | |
| PCMark 10 / Digital Content Creation | |
| Lenovo Legion 9 16IRX8 | |
| Ortalama Intel Core i9-13980HX, NVIDIA GeForce RTX 4090 Laptop GPU (15052 - 16012, n=3) | |
| Alienware x16 R1 | |
| HP Omen Transcend 16 | |
| Razer Blade 16 Early 2023 RTX 4090 | |
| Lenovo Legion Slim 5 16APH8 | |
| Asus ROG Strix G16 G614JZ | |
| CrossMark / Overall | |
| Asus ROG Strix G16 G614JZ | |
| Ortalama Intel Core i9-13980HX, NVIDIA GeForce RTX 4090 Laptop GPU (1935 - 2176, n=4) | |
| Razer Blade 16 Early 2023 RTX 4090 | |
| HP Omen Transcend 16 | |
| Alienware x16 R1 | |
| Lenovo Legion 9 16IRX8 | |
| Lenovo Legion Slim 5 16APH8 | |
| CrossMark / Productivity | |
| Asus ROG Strix G16 G614JZ | |
| Razer Blade 16 Early 2023 RTX 4090 | |
| Ortalama Intel Core i9-13980HX, NVIDIA GeForce RTX 4090 Laptop GPU (1764 - 2005, n=4) | |
| Alienware x16 R1 | |
| HP Omen Transcend 16 | |
| Lenovo Legion 9 16IRX8 | |
| Lenovo Legion Slim 5 16APH8 | |
| CrossMark / Creativity | |
| Asus ROG Strix G16 G614JZ | |
| Ortalama Intel Core i9-13980HX, NVIDIA GeForce RTX 4090 Laptop GPU (2267 - 2469, n=4) | |
| HP Omen Transcend 16 | |
| Lenovo Legion 9 16IRX8 | |
| Razer Blade 16 Early 2023 RTX 4090 | |
| Alienware x16 R1 | |
| Lenovo Legion Slim 5 16APH8 | |
| CrossMark / Responsiveness | |
| Asus ROG Strix G16 G614JZ | |
| Alienware x16 R1 | |
| Razer Blade 16 Early 2023 RTX 4090 | |
| Ortalama Intel Core i9-13980HX, NVIDIA GeForce RTX 4090 Laptop GPU (1556 - 1904, n=4) | |
| Lenovo Legion 9 16IRX8 | |
| HP Omen Transcend 16 | |
| Lenovo Legion Slim 5 16APH8 | |
| PCMark 10 Score | 9068 puan | |
Yardım | ||
| AIDA64 / Memory Copy | |
| Razer Blade 16 Early 2023 RTX 4090 | |
| Lenovo Legion 9 16IRX8 | |
| HP Omen Transcend 16 | |
| Alienware x16 R1 | |
| Ortalama Intel Core i9-13980HX (62189 - 80776, n=9) | |
| Lenovo Legion Slim 5 16APH8 | |
| Asus ROG Strix G16 G614JZ | |
| AIDA64 / Memory Read | |
| Lenovo Legion 9 16IRX8 | |
| Razer Blade 16 Early 2023 RTX 4090 | |
| HP Omen Transcend 16 | |
| Ortalama Intel Core i9-13980HX (62624 - 89096, n=9) | |
| Asus ROG Strix G16 G614JZ | |
| Alienware x16 R1 | |
| Lenovo Legion Slim 5 16APH8 | |
| AIDA64 / Memory Write | |
| Alienware x16 R1 | |
| Lenovo Legion Slim 5 16APH8 | |
| Razer Blade 16 Early 2023 RTX 4090 | |
| Lenovo Legion 9 16IRX8 | |
| HP Omen Transcend 16 | |
| Ortalama Intel Core i9-13980HX (59912 - 79917, n=9) | |
| Asus ROG Strix G16 G614JZ | |
| AIDA64 / Memory Latency | |
| Alienware x16 R1 | |
| Lenovo Legion Slim 5 16APH8 | |
| HP Omen Transcend 16 | |
| Asus ROG Strix G16 G614JZ | |
| Ortalama Intel Core i9-13980HX (79.4 - 93.2, n=9) | |
| Razer Blade 16 Early 2023 RTX 4090 | |
| Lenovo Legion 9 16IRX8 | |
* ... daha küçük daha iyidir
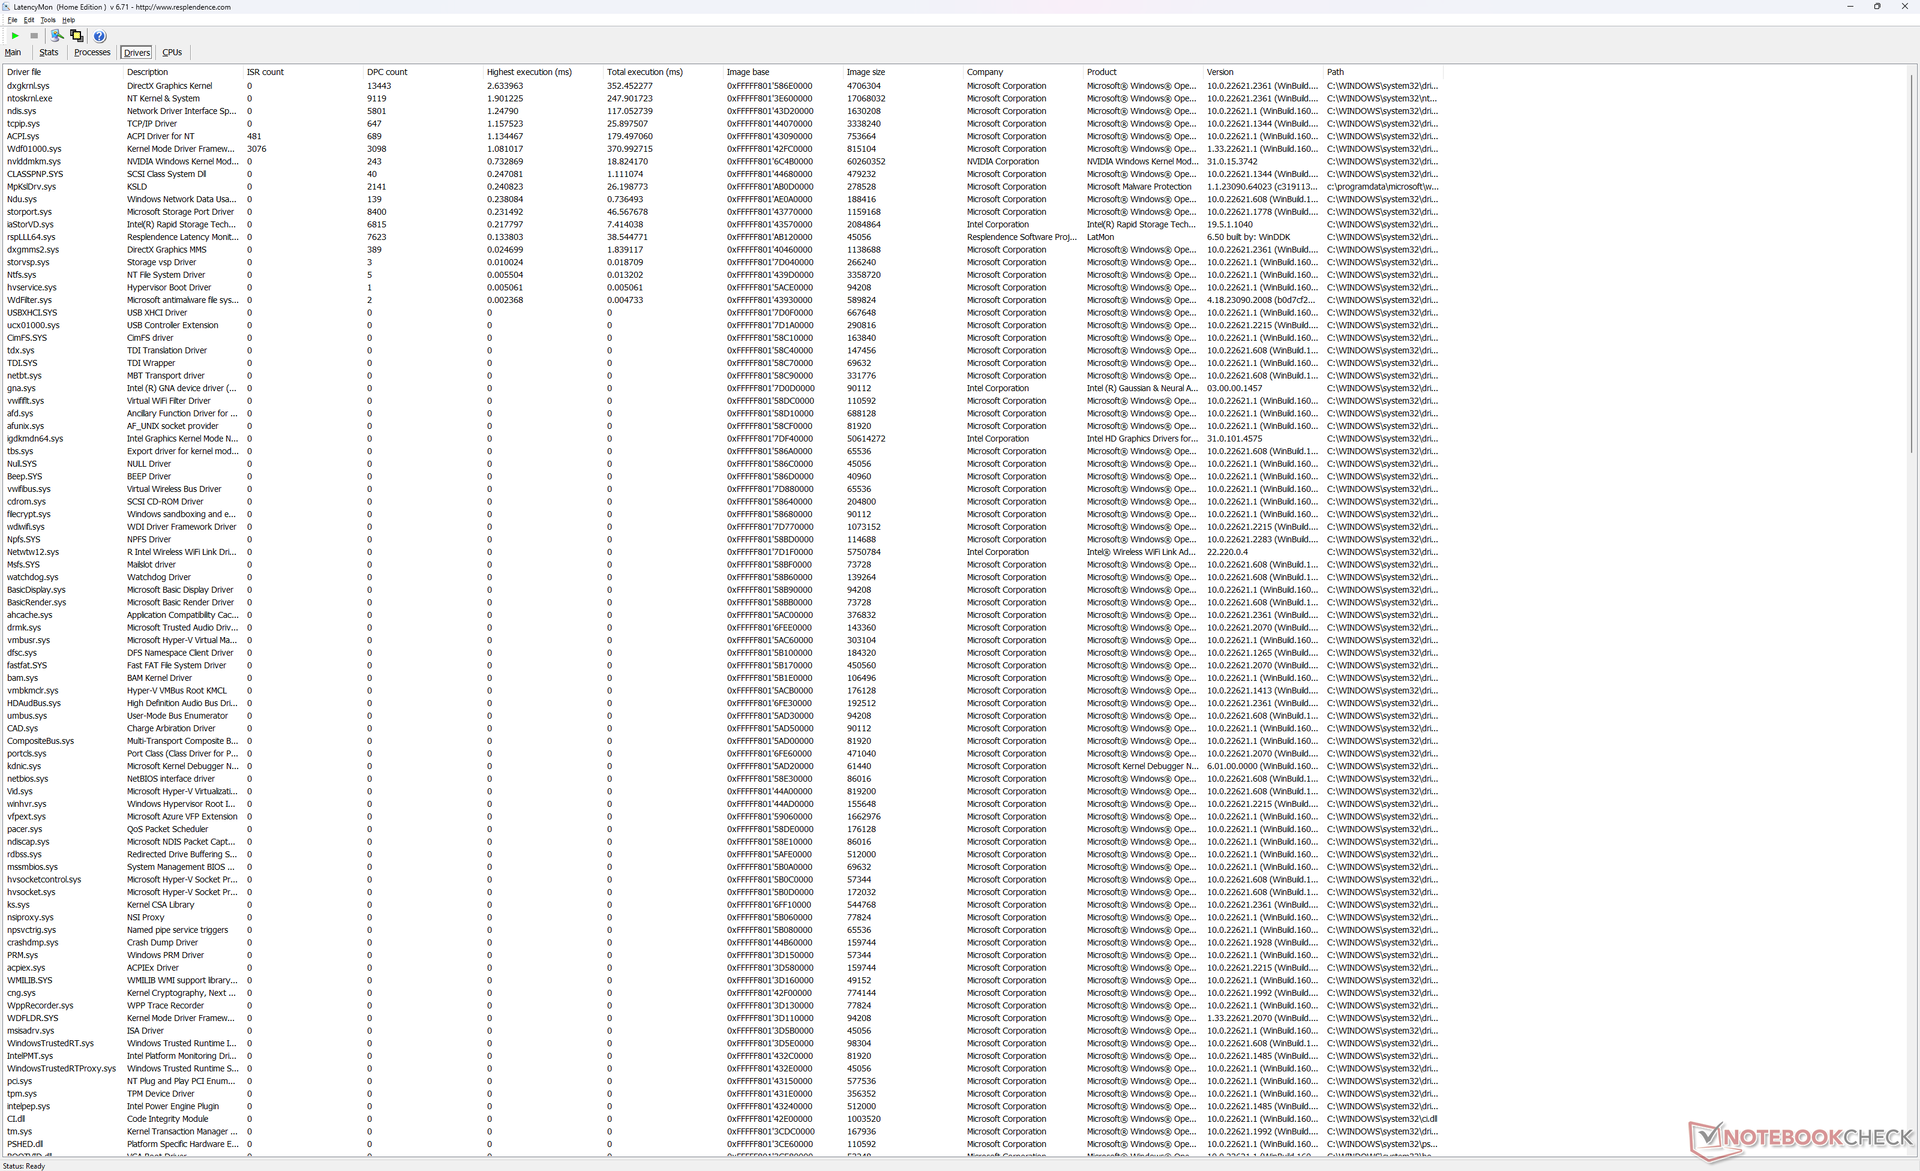
DPC Gecikme Süresi
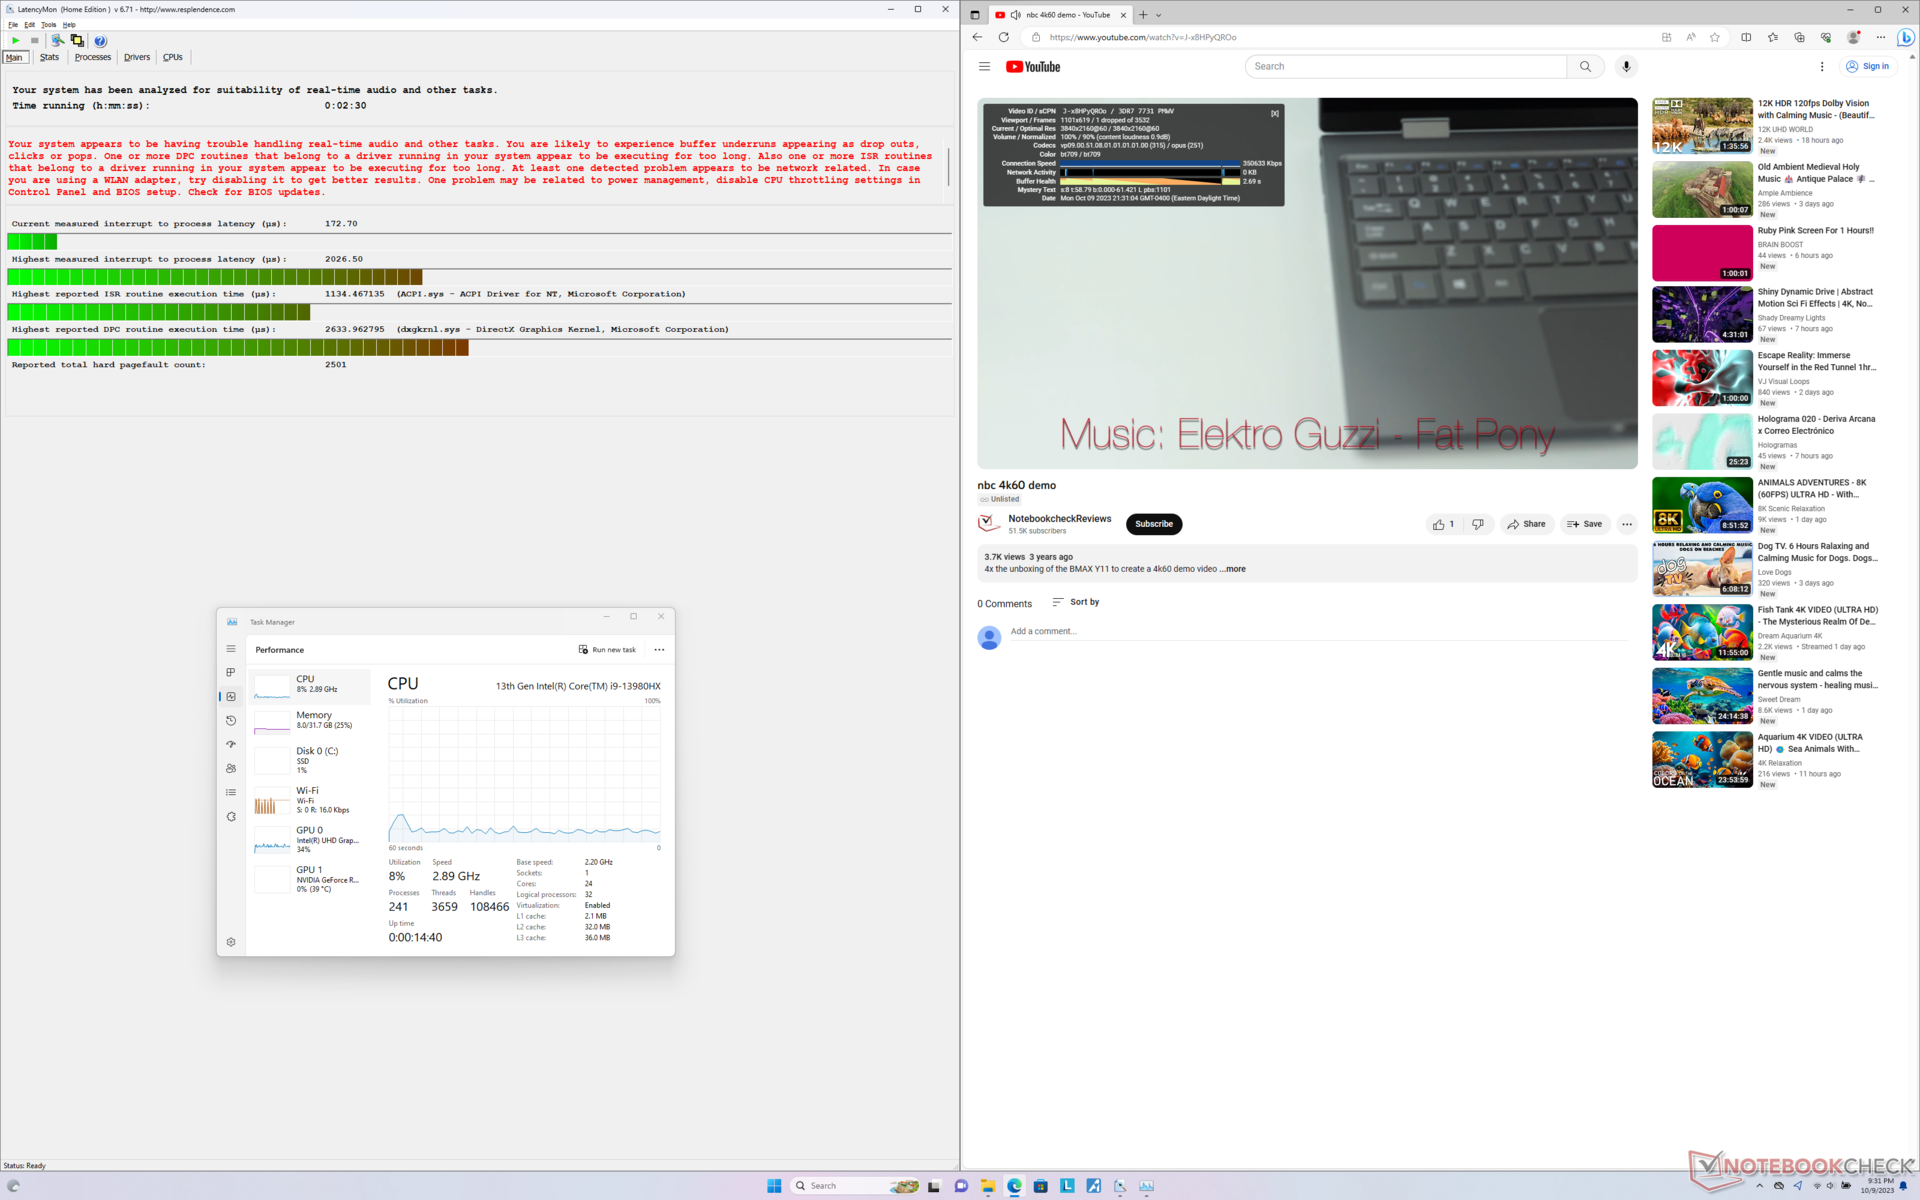
LatencyMon, ana sayfamızın birden fazla tarayıcı sekmesini açarken DPC sorunlarını ortaya çıkarıyor. 60 FPS'de 4K video oynatma, bir dakikalık bir aralıkta kaydedilen yalnızca bir kare ile neredeyse mükemmel.
| DPC Latencies / LatencyMon - interrupt to process latency (max), Web, Youtube, Prime95 | |
| Razer Blade 16 Early 2023 RTX 4090 | |
| Razer Blade 16 Early 2023 RTX 4090 | |
| Asus ROG Strix G16 G614JZ | |
| Lenovo Legion 9 16IRX8 | |
| HP Omen Transcend 16 | |
| Alienware x16 R1 | |
| Lenovo Legion Slim 5 16APH8 | |
* ... daha küçük daha iyidir
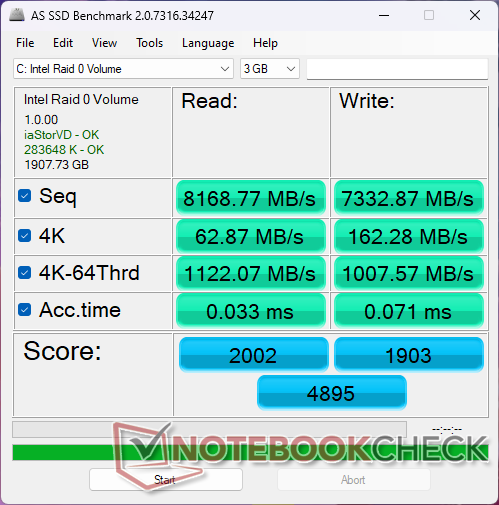
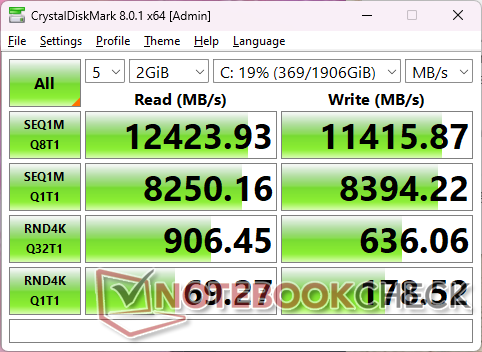
Depolama Cihazları
Ünitemiz iki ünite ile yapılandırılmış olarak gelir SK hynix HFS001TEJ9X115N RAID 0 yapılandırmasında PCIe4 x4 NVMe SSD'ler, sırasıyla 12000 MB/s ve 11000 MB/s'nin üzerinde inanılmaz hızlı sıralı okuma ve yazma hızları sunar. Ne yazık ki sürücüler, uzun süreler boyunca bu kadar yüksek hızlarda çalışırken yavaşlamaya eğilimlidir. Aşağıdaki DiskSpd döngü testi sonuçlarımız, sürücülerden birinin okuma hızlarının yaklaşık 4 dakika sonra 4600 MB/s civarına düştüğünü göstermektedir.

| Drive Performance rating - Percent | |
| Alienware x16 R1 | |
| Lenovo Legion 9 16IRX8 | |
| Razer Blade 16 Early 2023 RTX 4090 | |
| Asus ROG Strix G16 G614JZ | |
| HP Omen Transcend 16 | |
| Lenovo Legion Slim 5 16APH8 | |
* ... daha küçük daha iyidir
Disk Throttling: DiskSpd Read Loop, Queue Depth 8
GPU Performansı - 175 W TGP Graphics
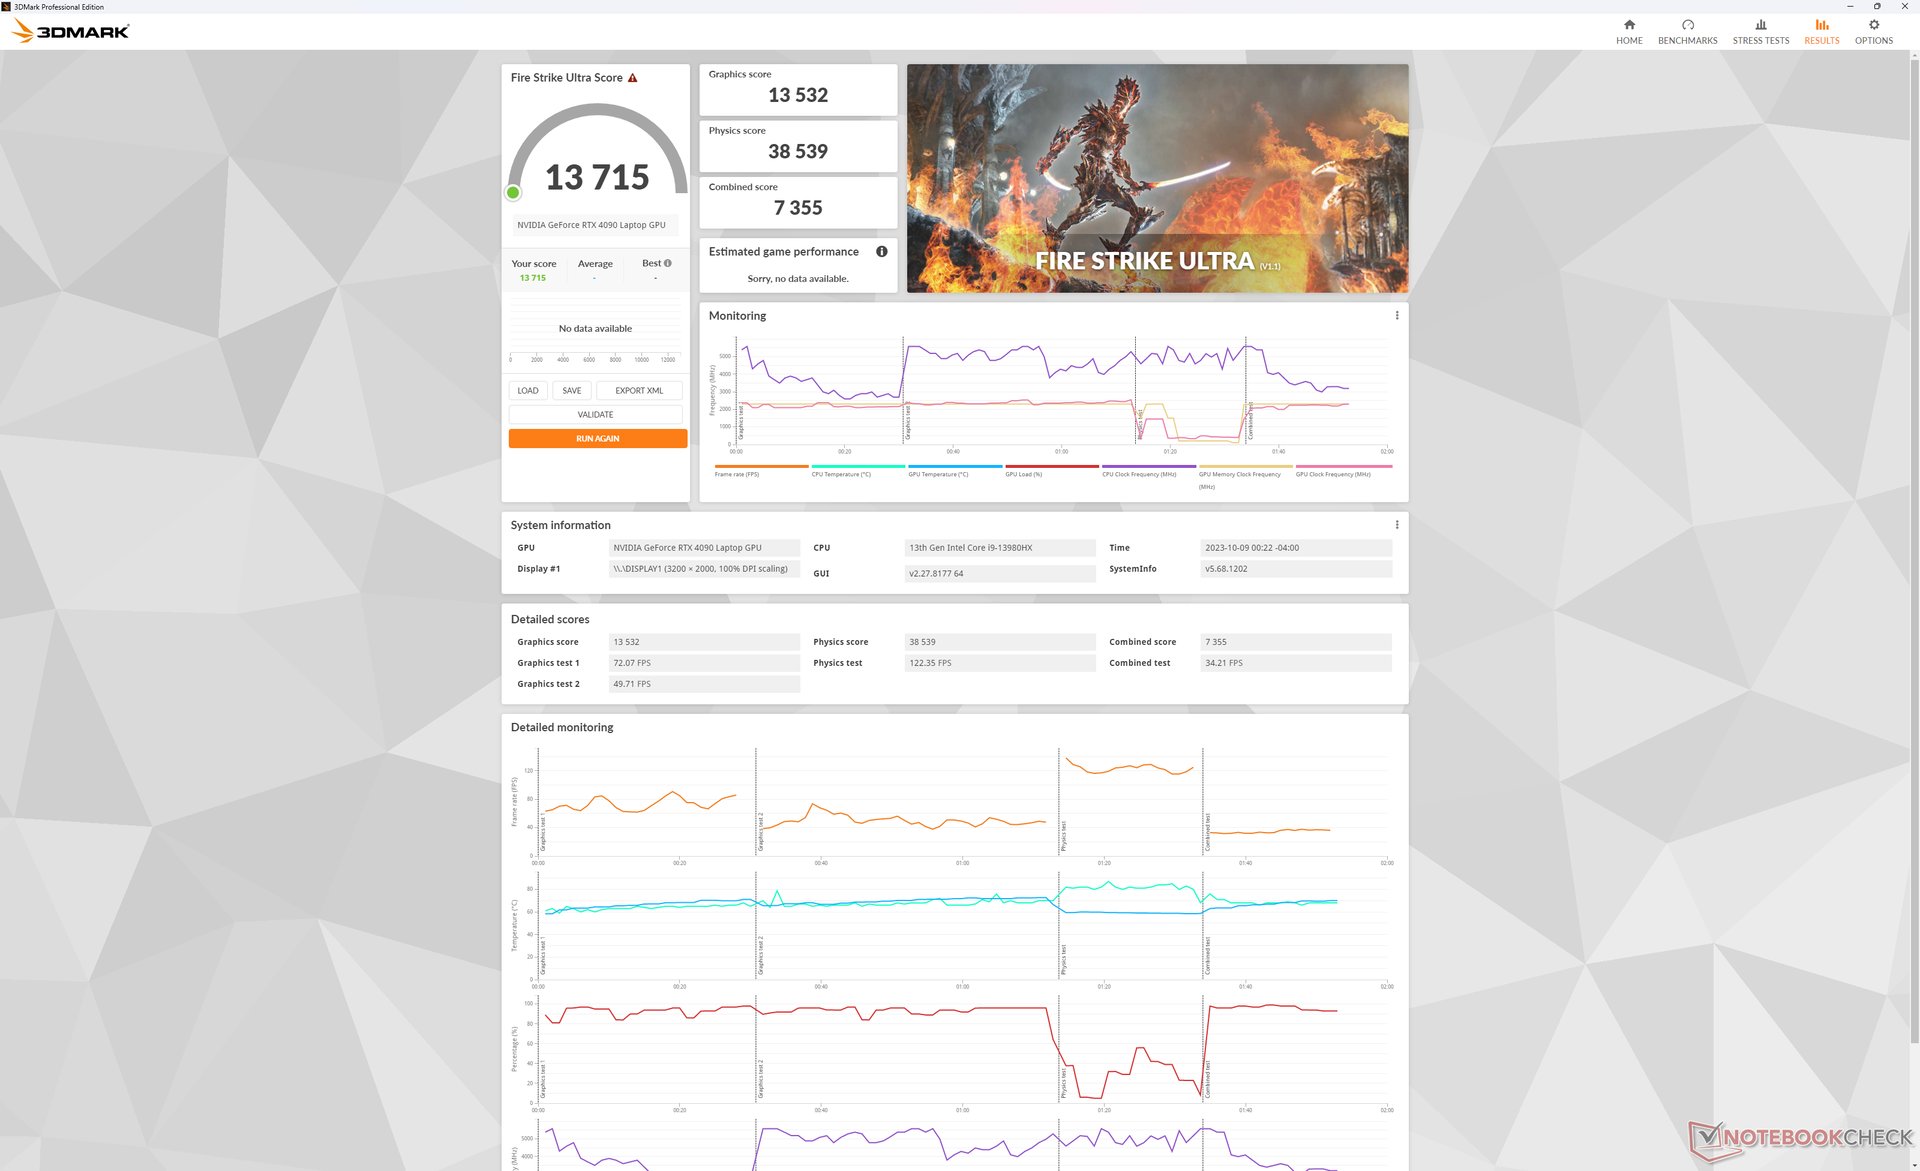
Bizim 175 W mobil GeForce RTX 4090 aynı GPU'ya sahip veritabanımızdaki ortalama dizüstü bilgisayarın sadece yüzde 1 ila 2 puan altında performans gösteriyor. Bazı RTX 4090 dizüstü bilgisayarların ne kadar büyük olabileceği düşünüldüğünde sonuçlar etkileyiciMSI Raider GE78 HX 13VI.
Büyük resme bakıldığında, mobil RTX 4090, "uygun" bir RTX 4090'dan yaklaşık yüzde 40 daha yavaştır masaüstü RTX 4090. Aslında, yüzde 5 ila 10 gibi mütevazı bir fayda sağlamaktadır mobil RTX 4080 yapılandırma.
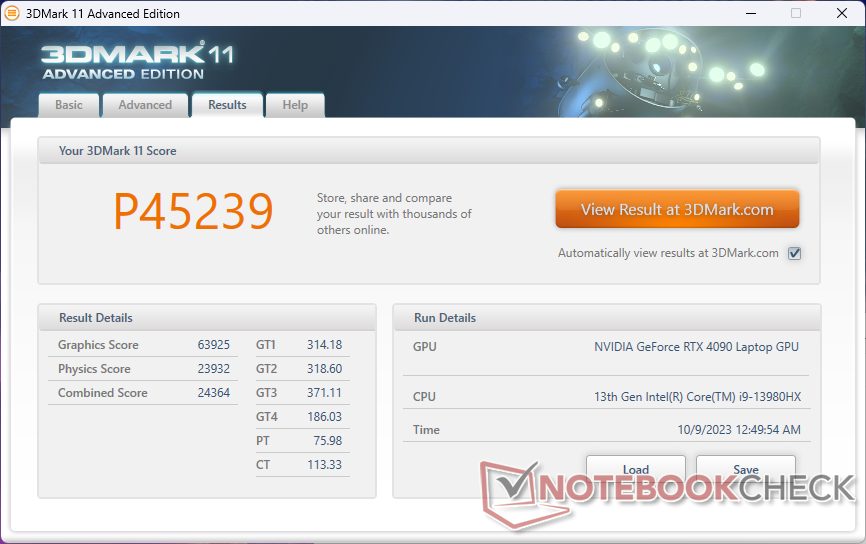
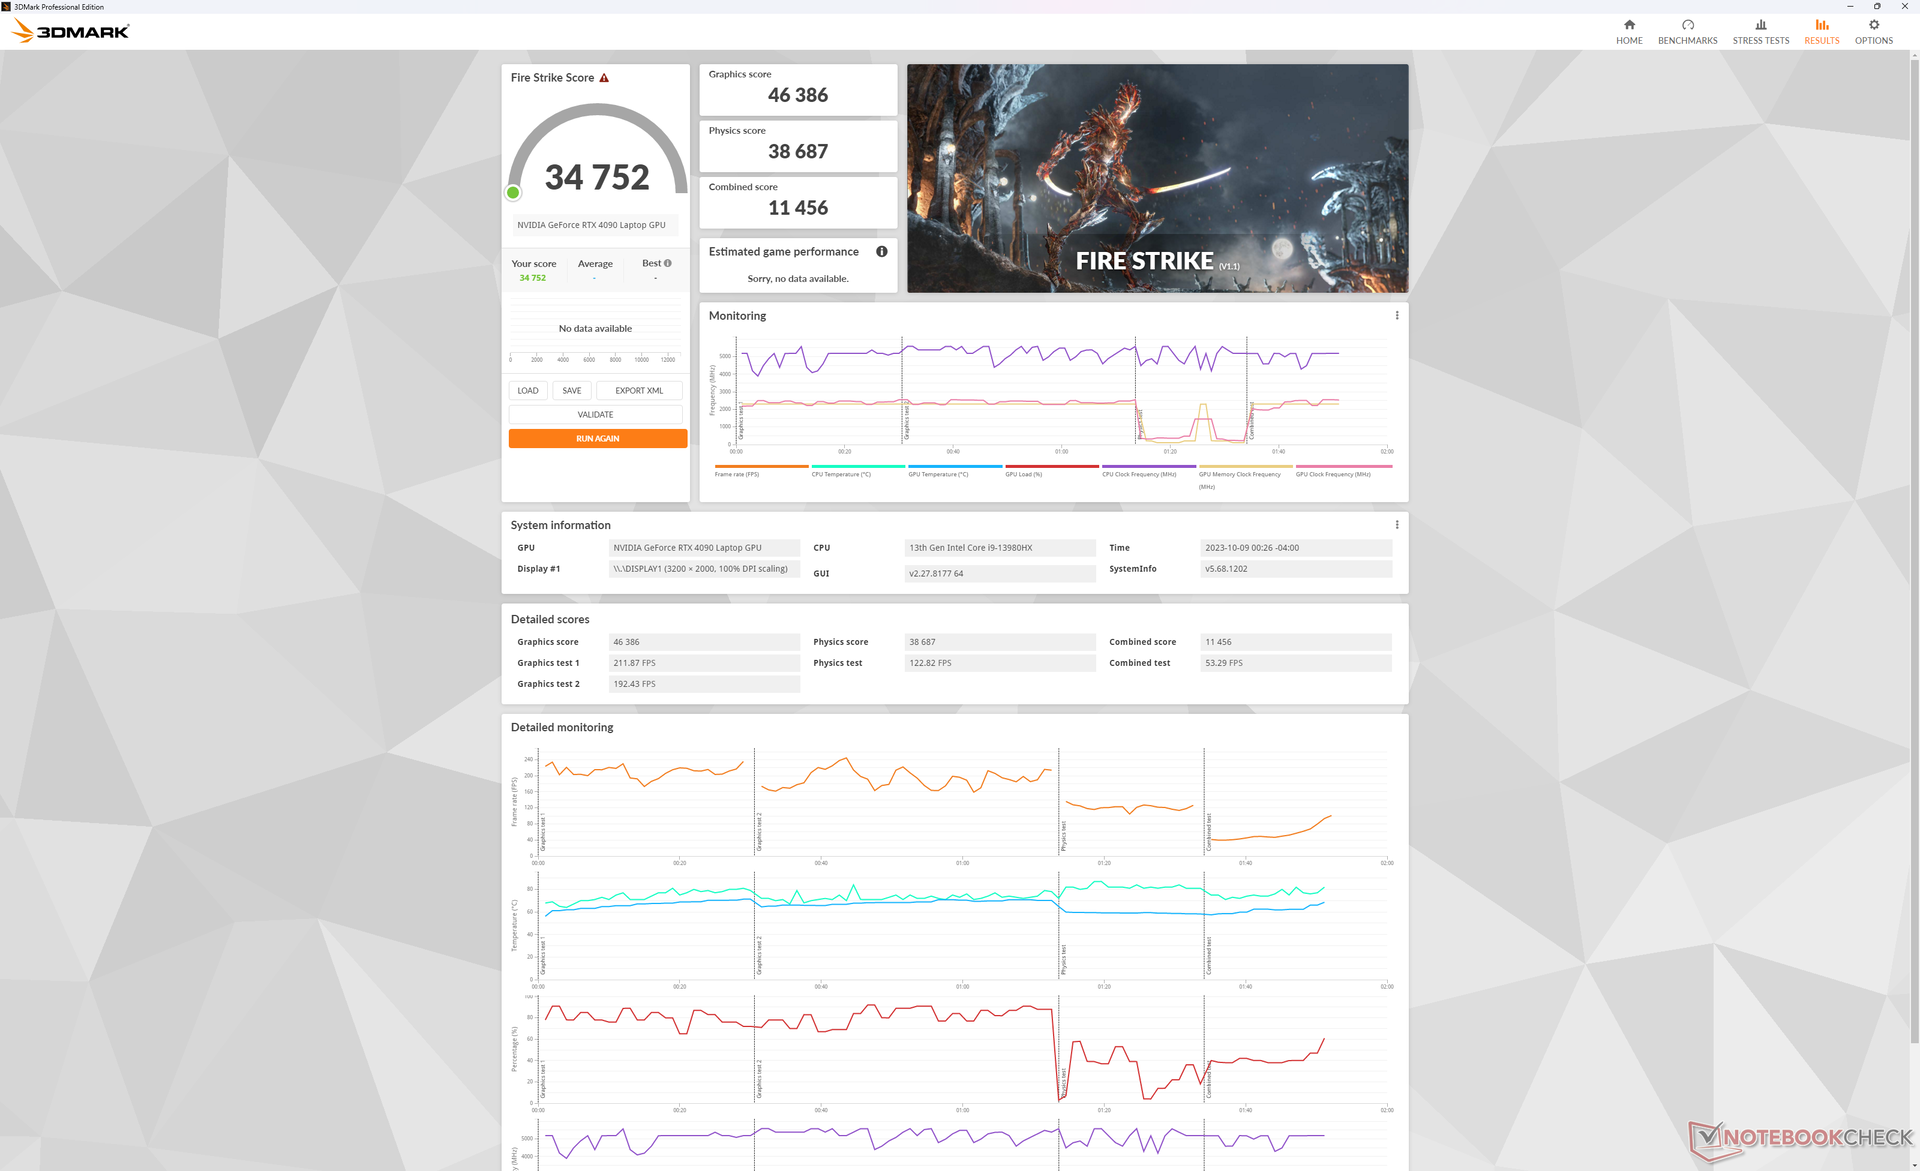
Hız aşırtma kapalıyken Dengeli güç profilinde çalıştırmak, aşağıdaki Fire Strike sonuç tablomuza göre grafik performansını yaklaşık yüzde 17 azaltacaktır.
| Güç Profili | Grafik Puanı | Fizik Puanı | Birleşik Puan |
| Performans Modu | 46386 | 38687 | 11456 |
| Dengeli Mod (GPU Hız Aşırtma kapalı) | 38285 (-17%) | 39020 (-0%) | 12715 (-0%) |
| Akü Gücü | 22176 (-52%) | 21072 (-46%) | 6306 (-45%) |
| 3DMark Performance rating - Percent | |
| AMD Ryzen 9 7950X3D | |
| NVIDIA GeForce RTX 4080 Founders Edition | |
| Lenovo Legion 9 16IRX8 | |
| Ortalama NVIDIA GeForce RTX 4090 Laptop GPU | |
| Alienware m16 R1 AMD | |
| Lenovo Legion 7 16IAX7-82TD004SGE -2! | |
| HP Omen Transcend 16 | |
| MSI Raider GE68HX 13VF | |
| HP Omen 16-b1090ng -1! | |
| Acer Predator Helios Neo 16 NH.QLTEG.002 -2! | |
| Dell G16 7620 -1! | |
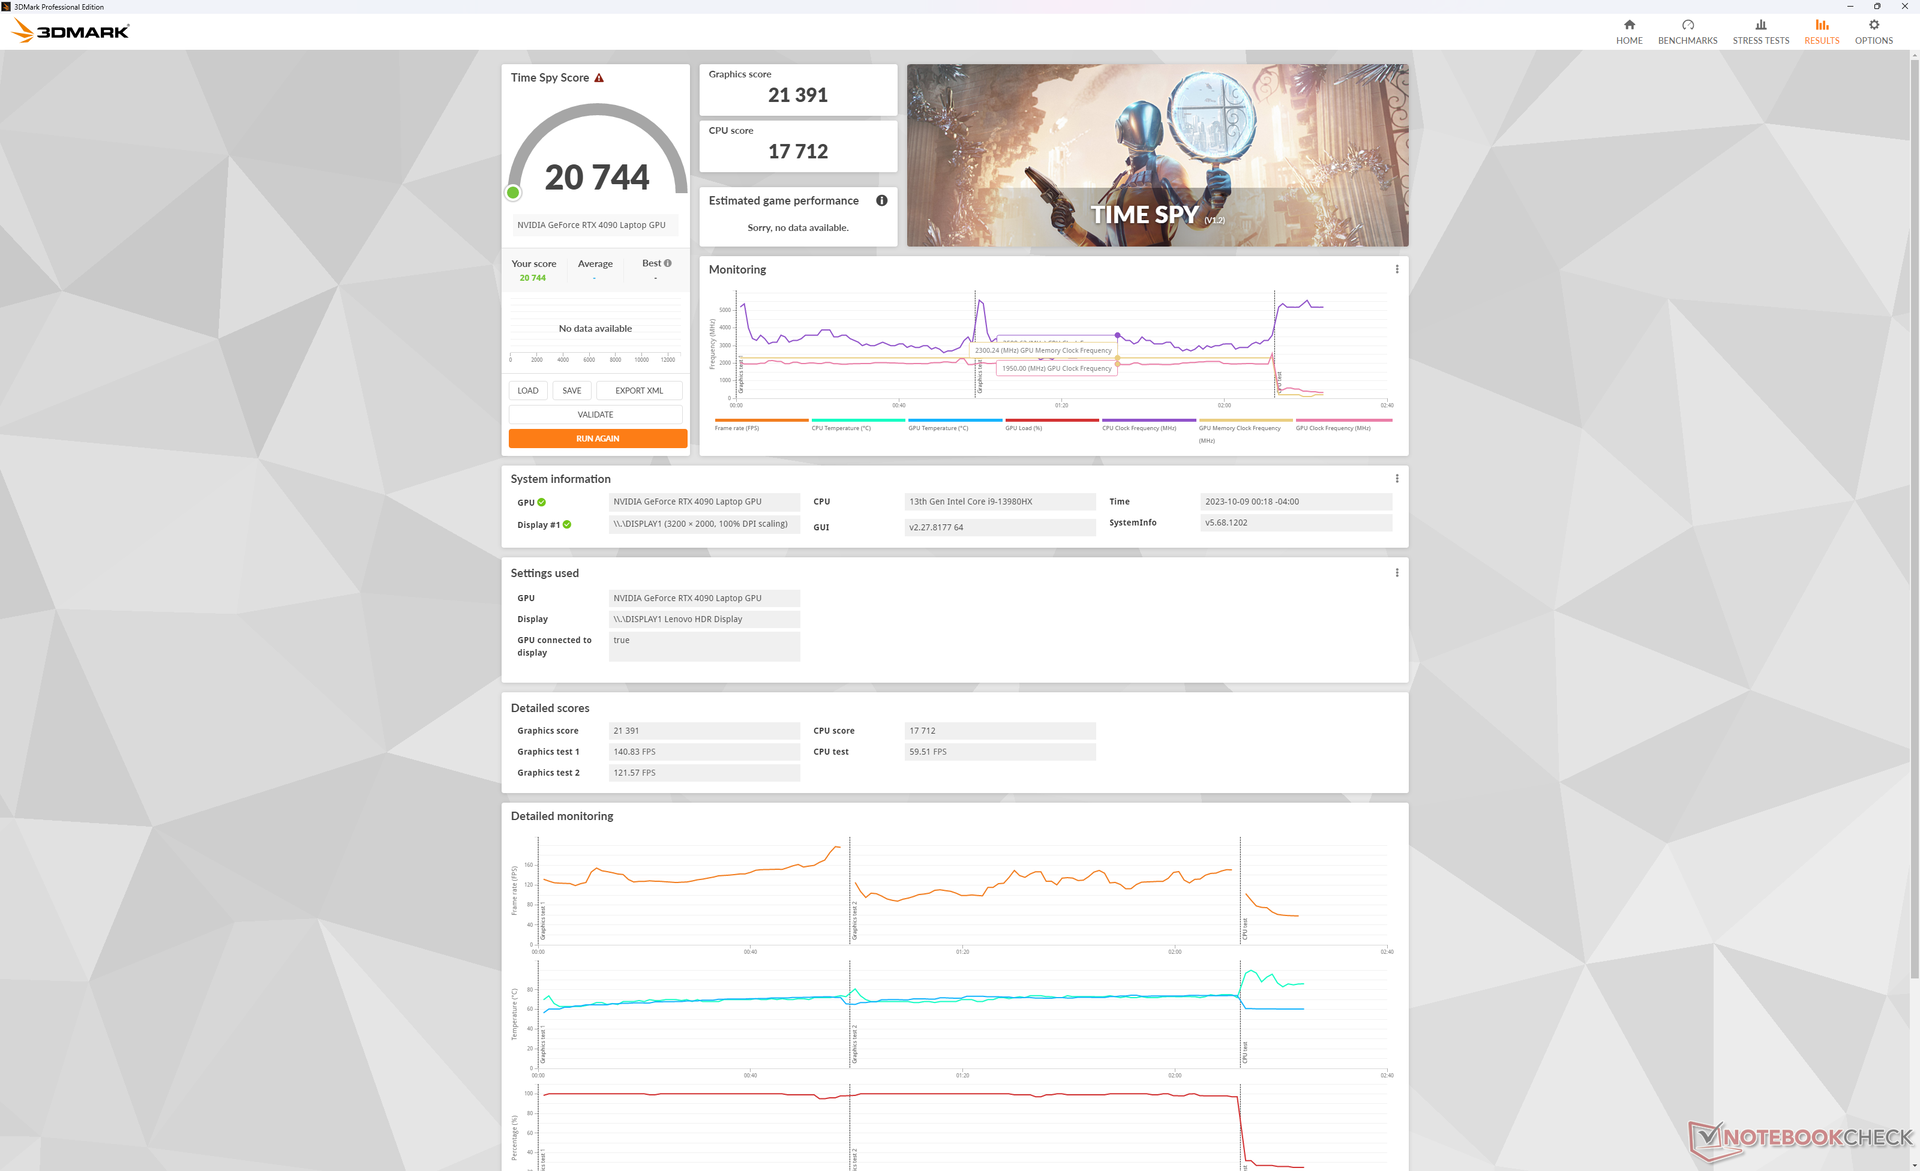
| 3DMark 11 Performance | 45239 puan | |
| 3DMark Fire Strike Score | 34752 puan | |
| 3DMark Time Spy Score | 20744 puan | |
Yardım | ||
* ... daha küçük daha iyidir
Oyun Performansı
Cyberpunk 2077 veya Ratchet and Clank gibi zorlu oyunlar da dahil olmak üzere tüm oyunlar QHD veya üzerinde çok iyi çalışır. G-Sync'in yalnızca dGPU moduna ayarlandığında etkinleştirilebileceğini, aksi takdirde Hibrit veya entegre grafik modlarında devre dışı bırakıldığını unutmayın.
| Ratchet & Clank Rift Apart | |
| 1920x1080 Low Preset | |
| Lenovo Legion 9 16IRX8 | |
| Ortalama NVIDIA GeForce RTX 4090 Laptop GPU (n=1) | |
| MSI Raider GE68HX 13VF | |
| 1920x1080 Medium Preset AA:T | |
| Ortalama NVIDIA GeForce RTX 4090 Laptop GPU (155.6 - 161.8, n=2) | |
| Lenovo Legion 9 16IRX8 | |
| MSI Raider GE68HX 13VF | |
| 1920x1080 High Preset AA:T | |
| Ortalama NVIDIA GeForce RTX 4090 Laptop GPU (135.4 - 136.6, n=2) | |
| Lenovo Legion 9 16IRX8 | |
| MSI Raider GE68HX 13VF | |
| 1920x1080 Very High Preset AA:T | |
| Ortalama NVIDIA GeForce RTX 4090 Laptop GPU (111.1 - 115.4, n=2) | |
| Lenovo Legion 9 16IRX8 | |
| MSI Raider GE68HX 13VF | |
| 2560x1440 Very High Preset AA:T | |
| Ortalama NVIDIA GeForce RTX 4090 Laptop GPU (98.7 - 107.1, n=2) | |
| Lenovo Legion 9 16IRX8 | |
Witcher 3 FPS Chart
| düşük | orta | yüksek | ultra | QHD | |
|---|---|---|---|---|---|
| GTA V (2015) | 187.1 | 186.3 | 184.8 | 150.7 | 145.3 |
| The Witcher 3 (2015) | 671.8 | 569 | 408.2 | 208.7 | 165 |
| Dota 2 Reborn (2015) | 244 | 217 | 208 | 193.1 | |
| Final Fantasy XV Benchmark (2018) | 231 | 207 | 181.3 | 158.4 | |
| X-Plane 11.11 (2018) | 214 | 185.9 | 140.1 | ||
| Far Cry 5 (2018) | 195 | 176 | 167 | 158 | 157 |
| Strange Brigade (2018) | 487 | 409 | 390 | 387 | 312 |
| Cyberpunk 2077 1.6 (2022) | 146.9 | 142.9 | 129.5 | 131.4 | 98.8 |
| Tiny Tina's Wonderlands (2022) | 377.6 | 290.4 | 226.2 | 186.4 | 137.8 |
| F1 22 (2022) | 336 | 333 | 286 | 130.8 | 90.9 |
| Ratchet & Clank Rift Apart (2023) | 163.4 | 155.6 | 135.4 | 111.1 | 98.7 |
| Cyberpunk 2077 (2023) | 131.22 | 89.55 | |||
| Alan Wake 2 (2023) | 121.1 | 83.7 | |||
| Avatar Frontiers of Pandora (2023) | 100 | 69 |
Emisyonlar
Sistem Gürültüsü
Fanlar neredeyse hiç boşta çalışmaz ve bu nedenle her zaman biraz gürültü beklenmelidir. Sessiz moda ayarlandığında bile web'de gezinme veya video akışı gibi en yaygın yükler altındayken 23,7 dB(A)'lık sessiz bir arka plana karşı 30,4 dB(A) civarında gezinme eğilimindedirler. Bu aralık, benzer koşullar altında diğer oyun dizüstü bilgisayarlarının çoğu için tipiktir, ancak Legion 9i 16, Dengeli iGPU modunda veya daha düşük bir modda çalıştırdığınız sürece sık sık titreşmez.
Fan gürültüsü, üst düzey oyun dizüstü bilgisayarları için beklenen aralık olan Performans modunda oyun oynarken 52,2 dB(A)'ya kadar önemli ölçüde yükselir. Bunun yerine Dengeli modda oyun oynanırsa gürültü biraz düşerek 49,5 dB(A) olur, ancak yukarıda belirtildiği gibi Performans moduyla karşılaştırıldığında yüzde 17 grafik açığı olduğunu unutmayın. Her iki durumda da oyun oynarken kulaklık kullanılması önerilir.
Ses yüksekliği
| Boşta |
| 24 / 24 / 30.4 dB |
| Çalışırken |
| 30.4 / 54.9 dB |
 | ||
30 dB sessiz 40 dB(A) duyulabilirlik 50 dB(A) gürültülü |
||
min: | ||
| Lenovo Legion 9 16IRX8 GeForce RTX 4090 Laptop GPU, i9-13980HX, 2x SK Hynix HFS001TEJ9X115N (RAID 0) | Lenovo Legion Slim 5 16APH8 GeForce RTX 4060 Laptop GPU, R7 7840HS, SK hynix PC801 HFS512GEJ9X115N | Razer Blade 16 Early 2023 RTX 4090 GeForce RTX 4090 Laptop GPU, i9-13950HX, SSSTC CA6-8D1024 | Asus ROG Strix G16 G614JZ GeForce RTX 4080 Laptop GPU, i9-13980HX, WD PC SN560 SDDPNQE-1T00 | HP Omen Transcend 16 GeForce RTX 4070 Laptop GPU, i9-13900HX, SK hynix PC801 HFS002TEJ9X101N | Alienware x16 R1 GeForce RTX 4080 Laptop GPU, i9-13900HK, SK hynix PC801 HFS001TEJ9X101N | |
|---|---|---|---|---|---|---|
| Noise | 1% | 3% | -11% | -13% | -1% | |
| kapalı / ortam * (dB) | 23.7 | 22.9 3% | 20.84 12% | 25 -5% | 22.9 3% | 22.7 4% |
| Idle Minimum * (dB) | 24 | 23.1 4% | 23.65 1% | 26 -8% | 29.1 -21% | 23.1 4% |
| Idle Average * (dB) | 24 | 23.1 4% | 23.65 1% | 28 -17% | 29.1 -21% | 25.8 -8% |
| Idle Maximum * (dB) | 30.4 | 27.7 9% | 23.65 22% | 30 1% | 29.1 4% | 25.8 15% |
| Load Average * (dB) | 30.4 | 33.3 -10% | 43.35 -43% | 48 -58% | 45.7 -50% | 39.3 -29% |
| Witcher 3 ultra * (dB) | 52.2 | 54 -3% | 46.7 11% | 49 6% | 54.3 -4% | 49.9 4% |
| Load Maximum * (dB) | 54.9 | 54 2% | 46.72 15% | 52 5% | 54.3 1% | 54.8 -0% |
* ... daha küçük daha iyidir
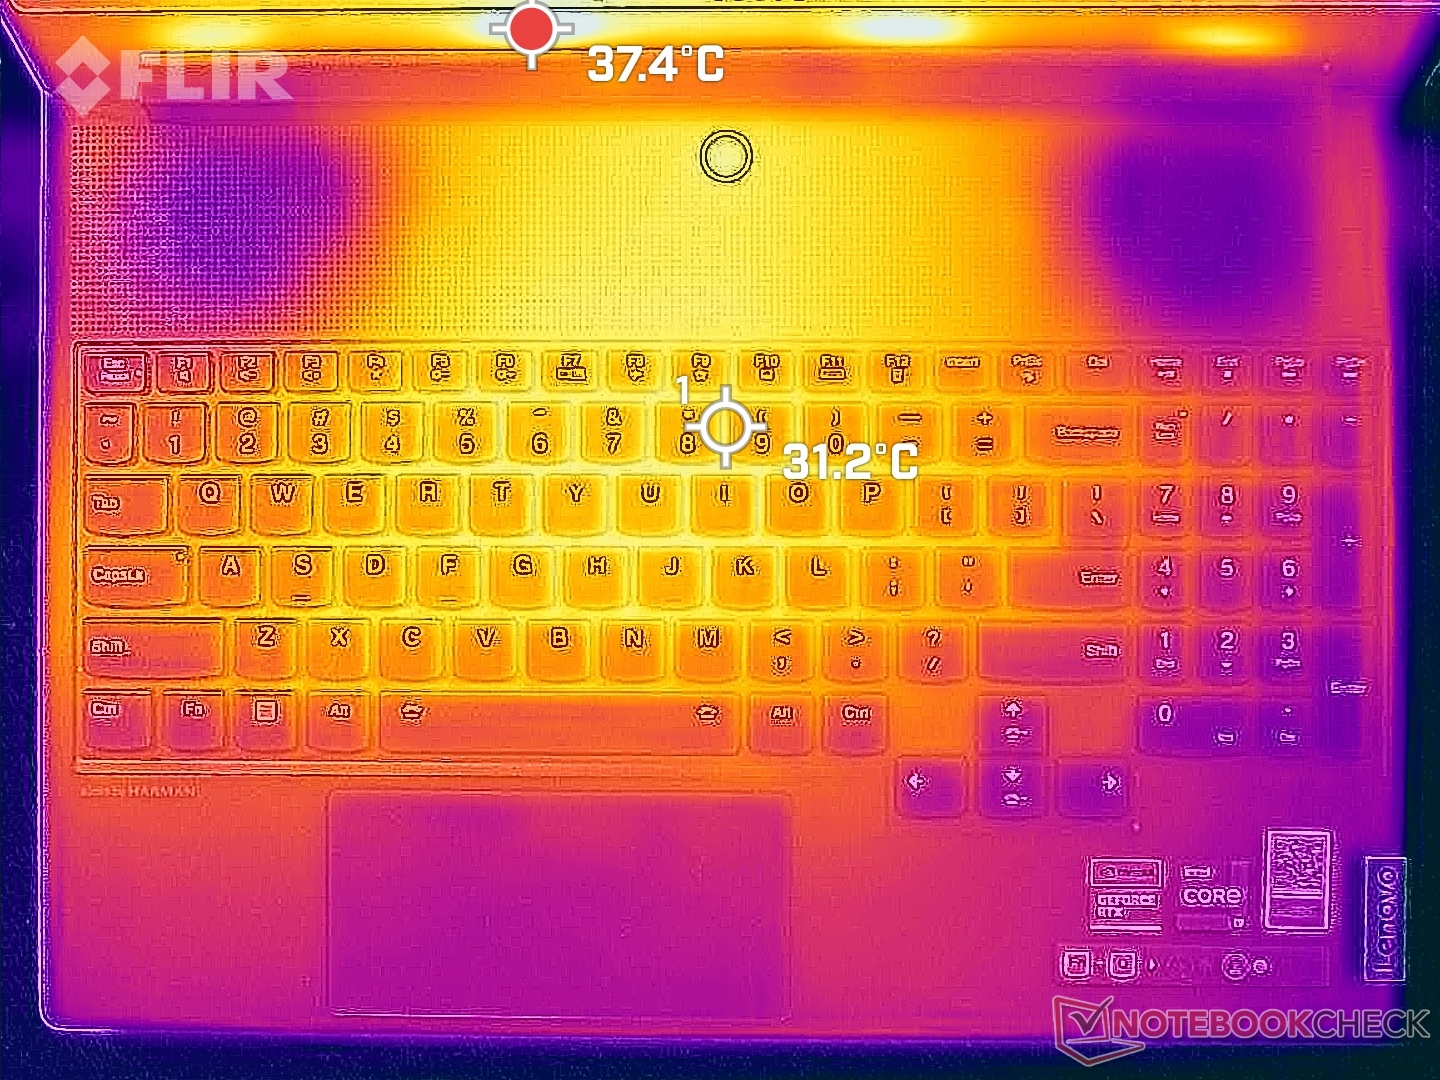
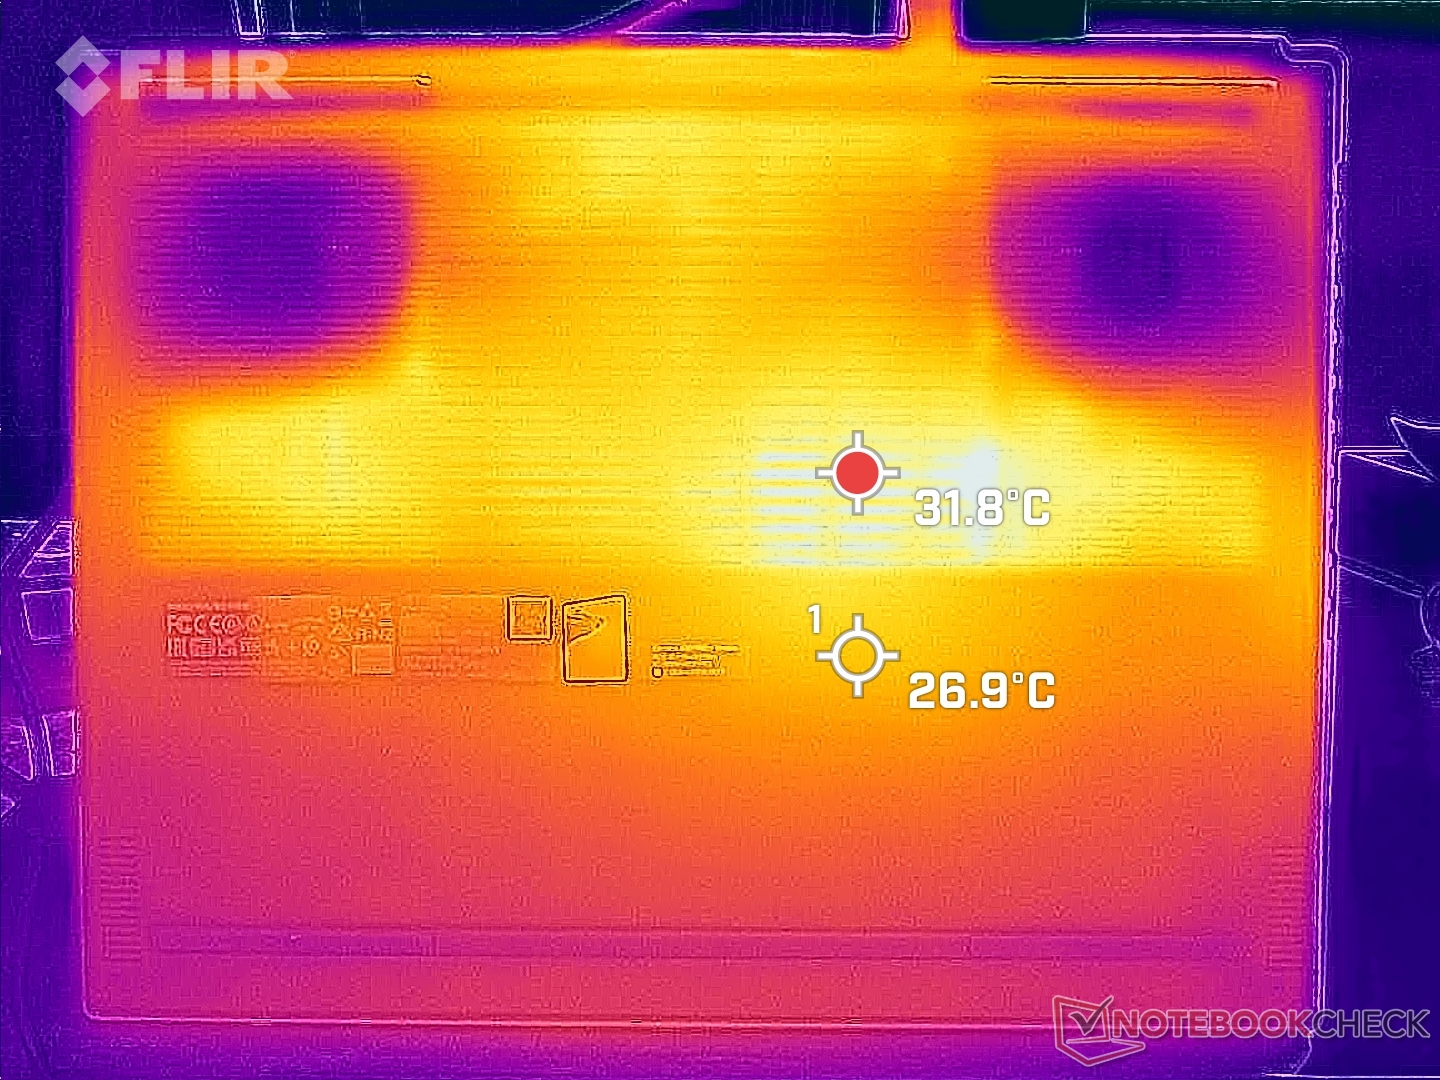
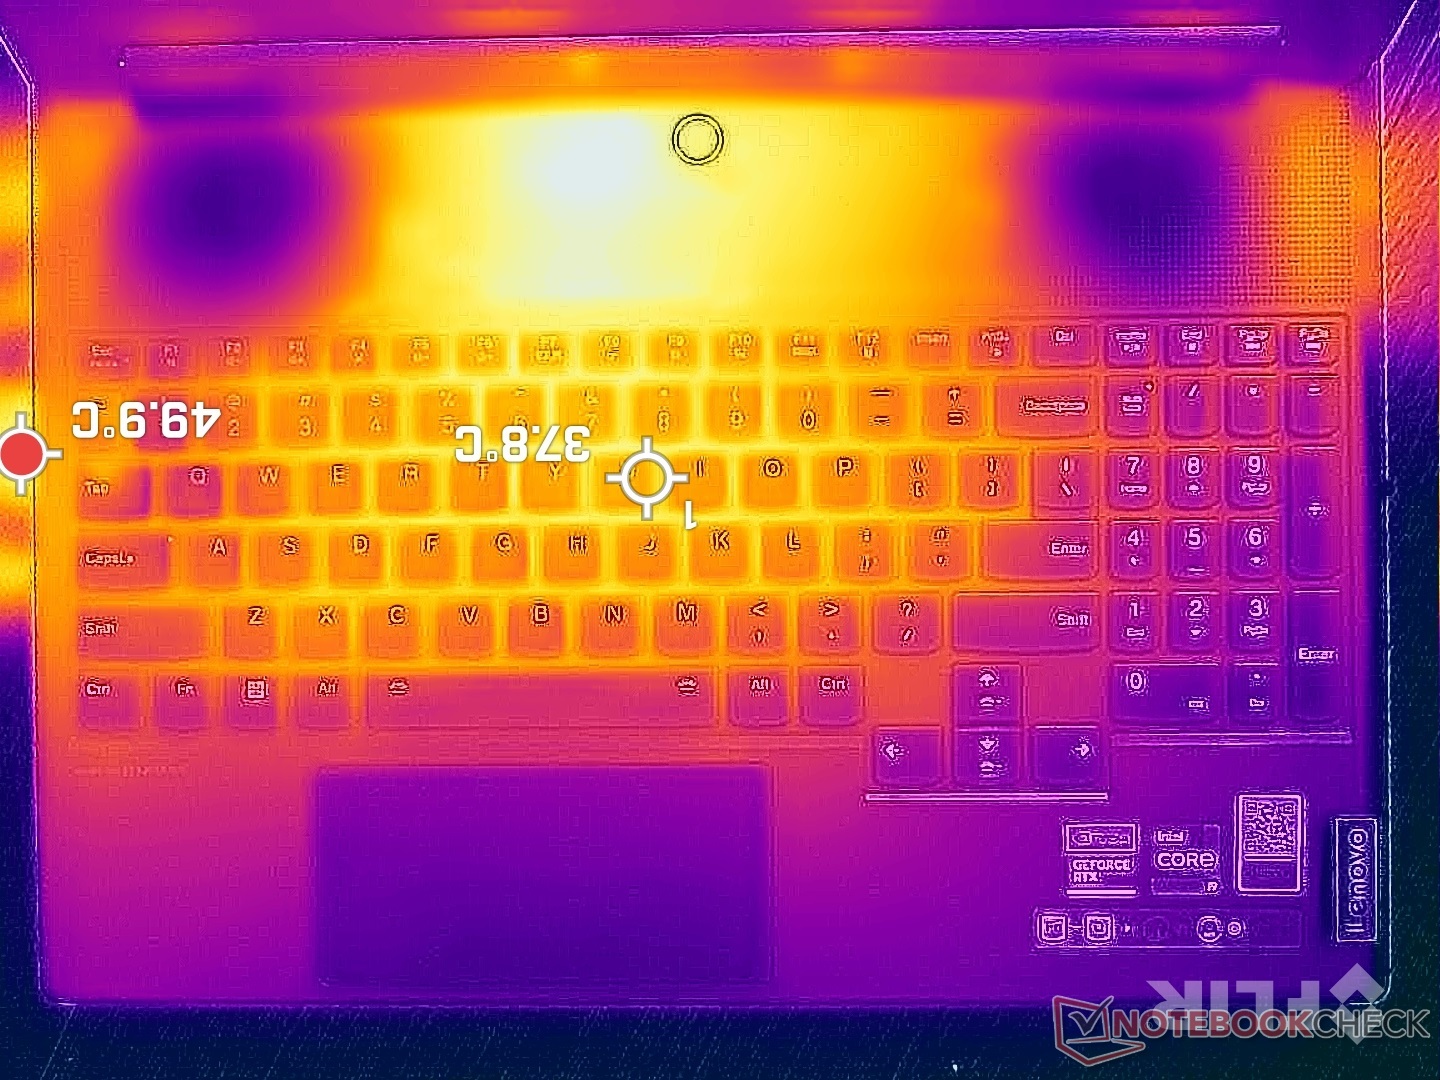
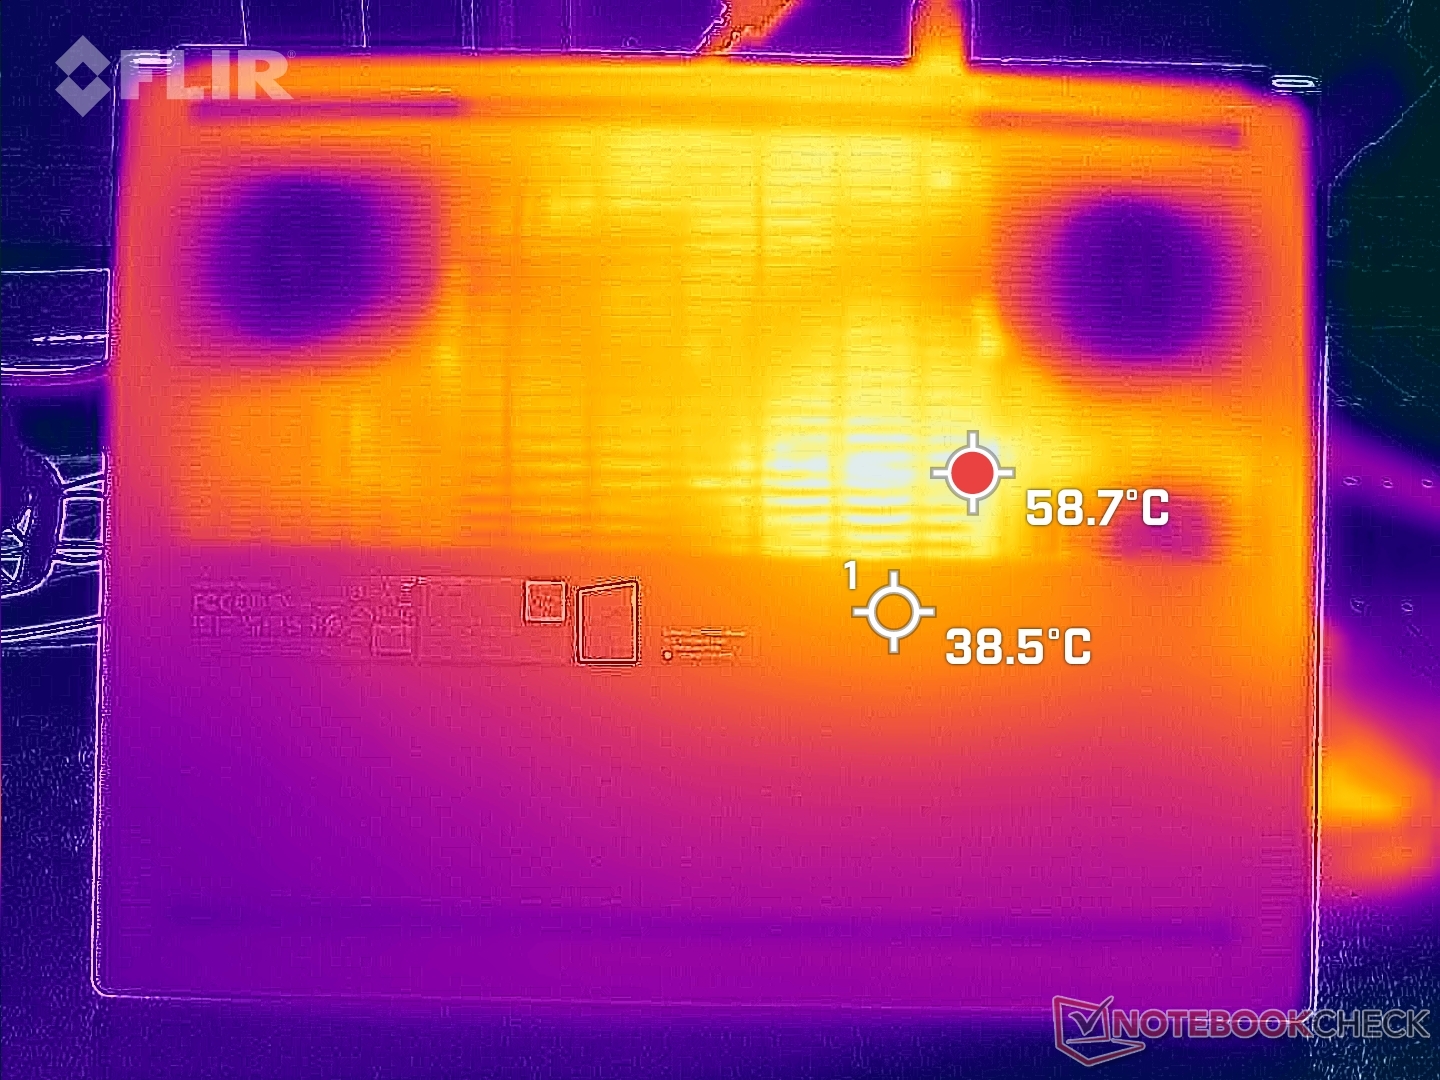
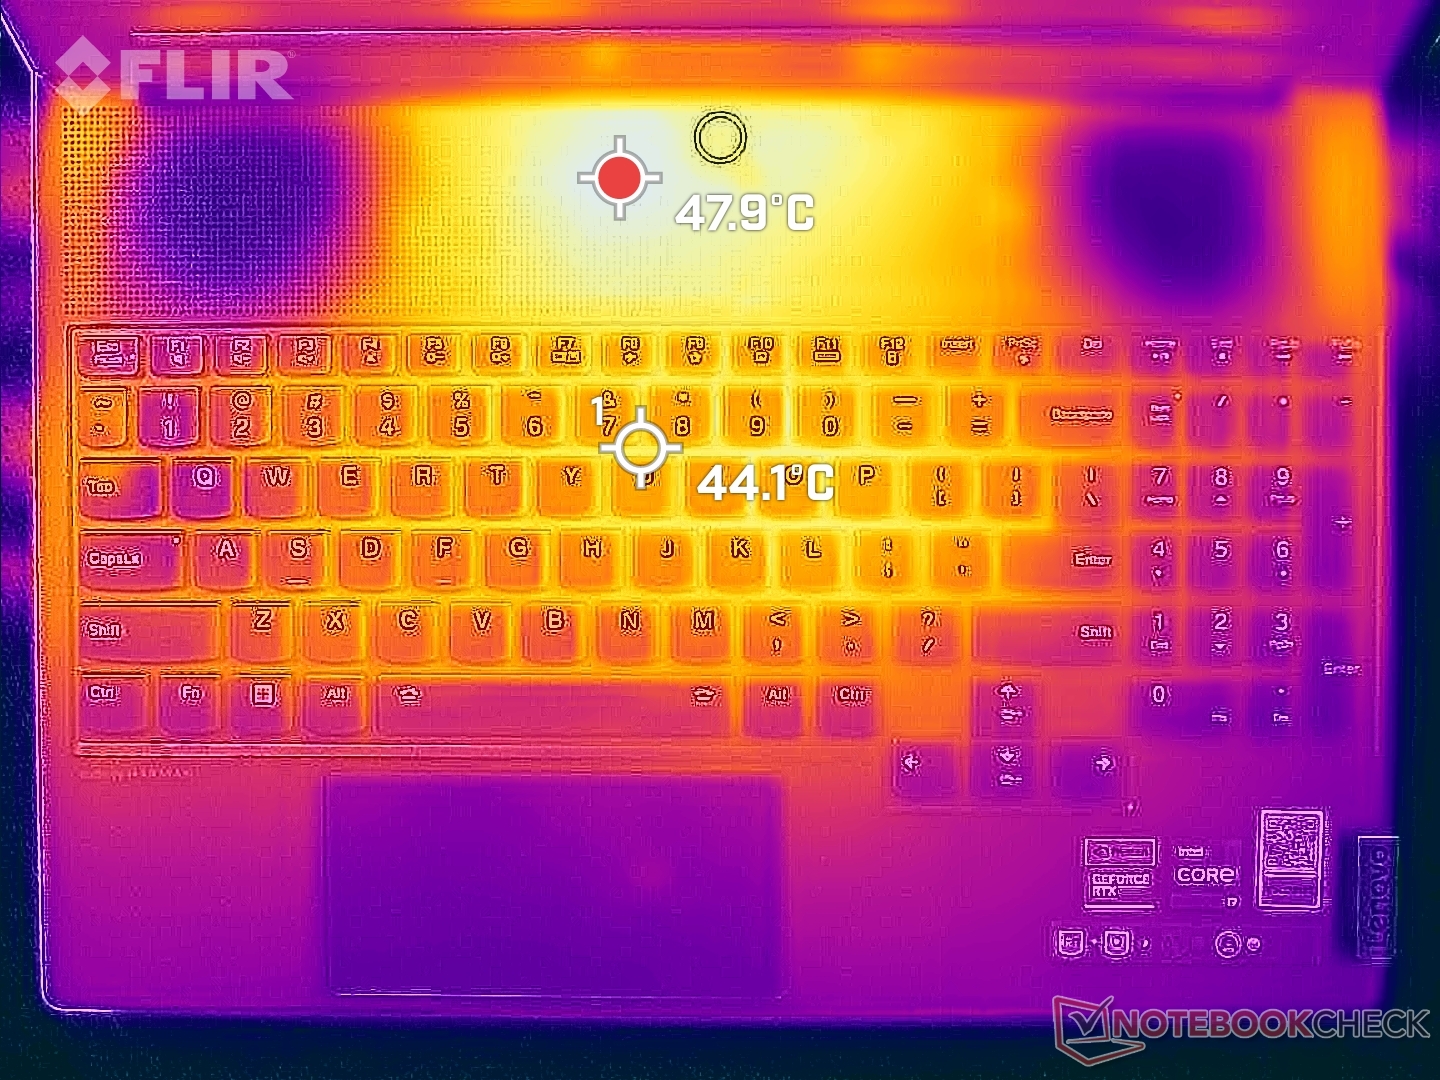
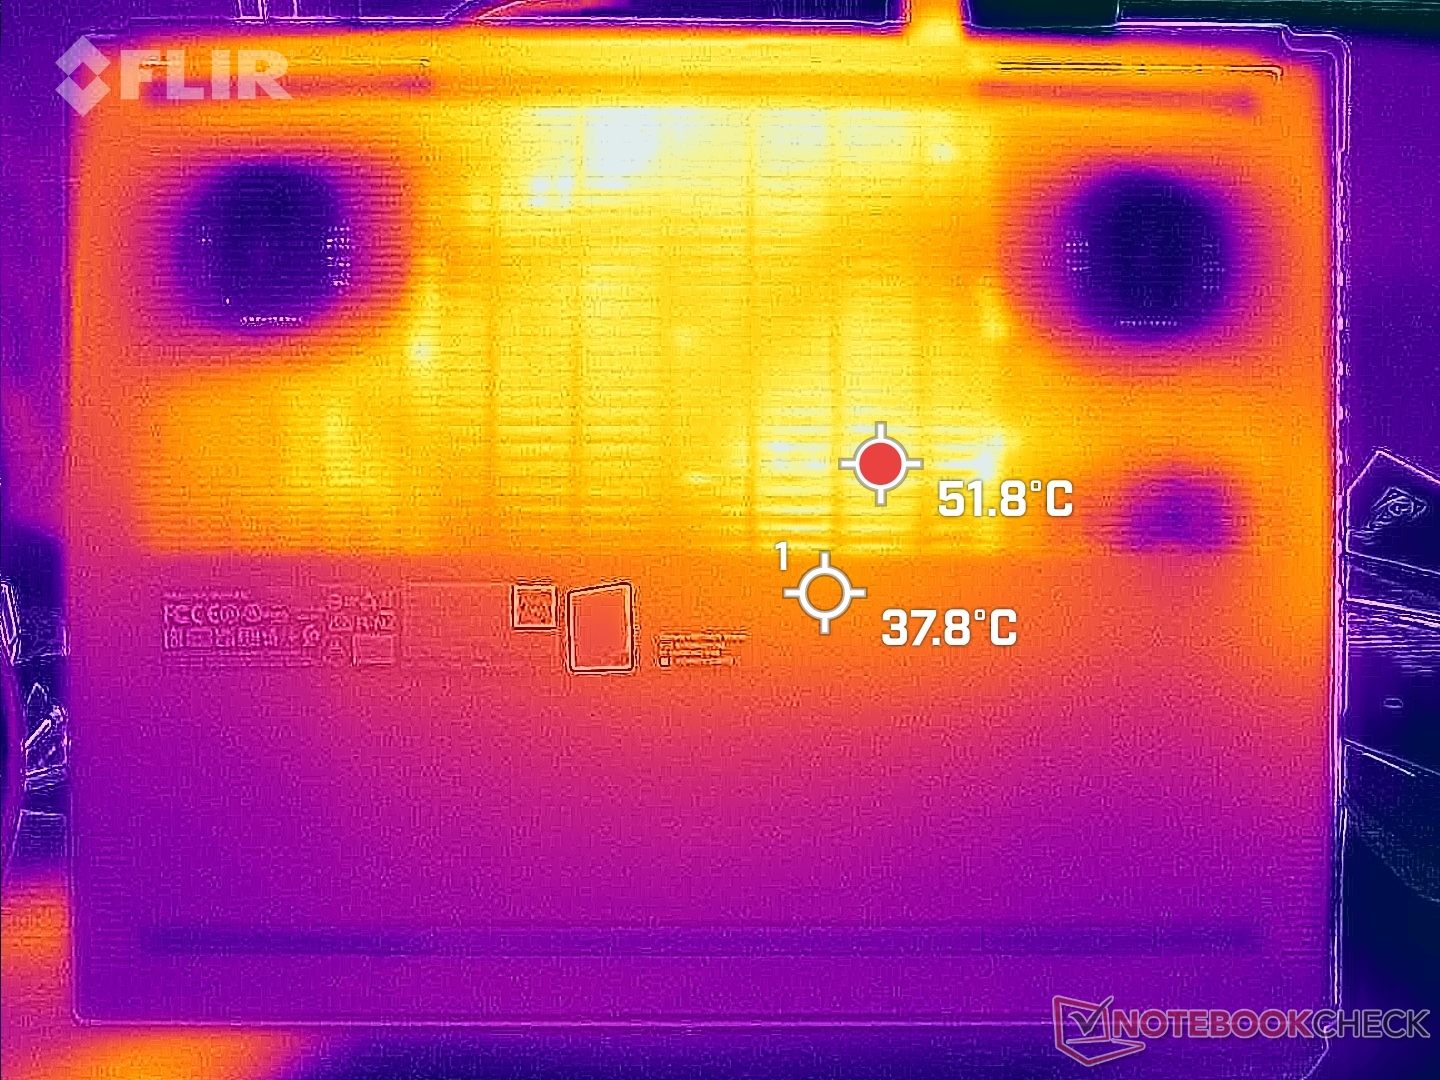
Sıcaklık
Gelişmiş termallere rağmen yüzey sıcaklıkları oldukça sıcak. Oyun oynarken, WASD tuşları ve klavye merkezi sırasıyla 42 C ve 46 C'ye kadar ısınabilir, bu da bizim gözlemlediğimizden biraz daha sıcaktır Alienware x16 R1. Razer Blade 16 gibi diğer birçok oyun dizüstü bilgisayarı, daha rahat oyun oynamak için klavyenin o kısmını serin tutmak için WASD tuşlarından temiz hava çeker, ancak aşağıdaki sıcaklık haritalarında gösterildiği gibi Legion 9 16 tasarımımız için durum böyle değildir.
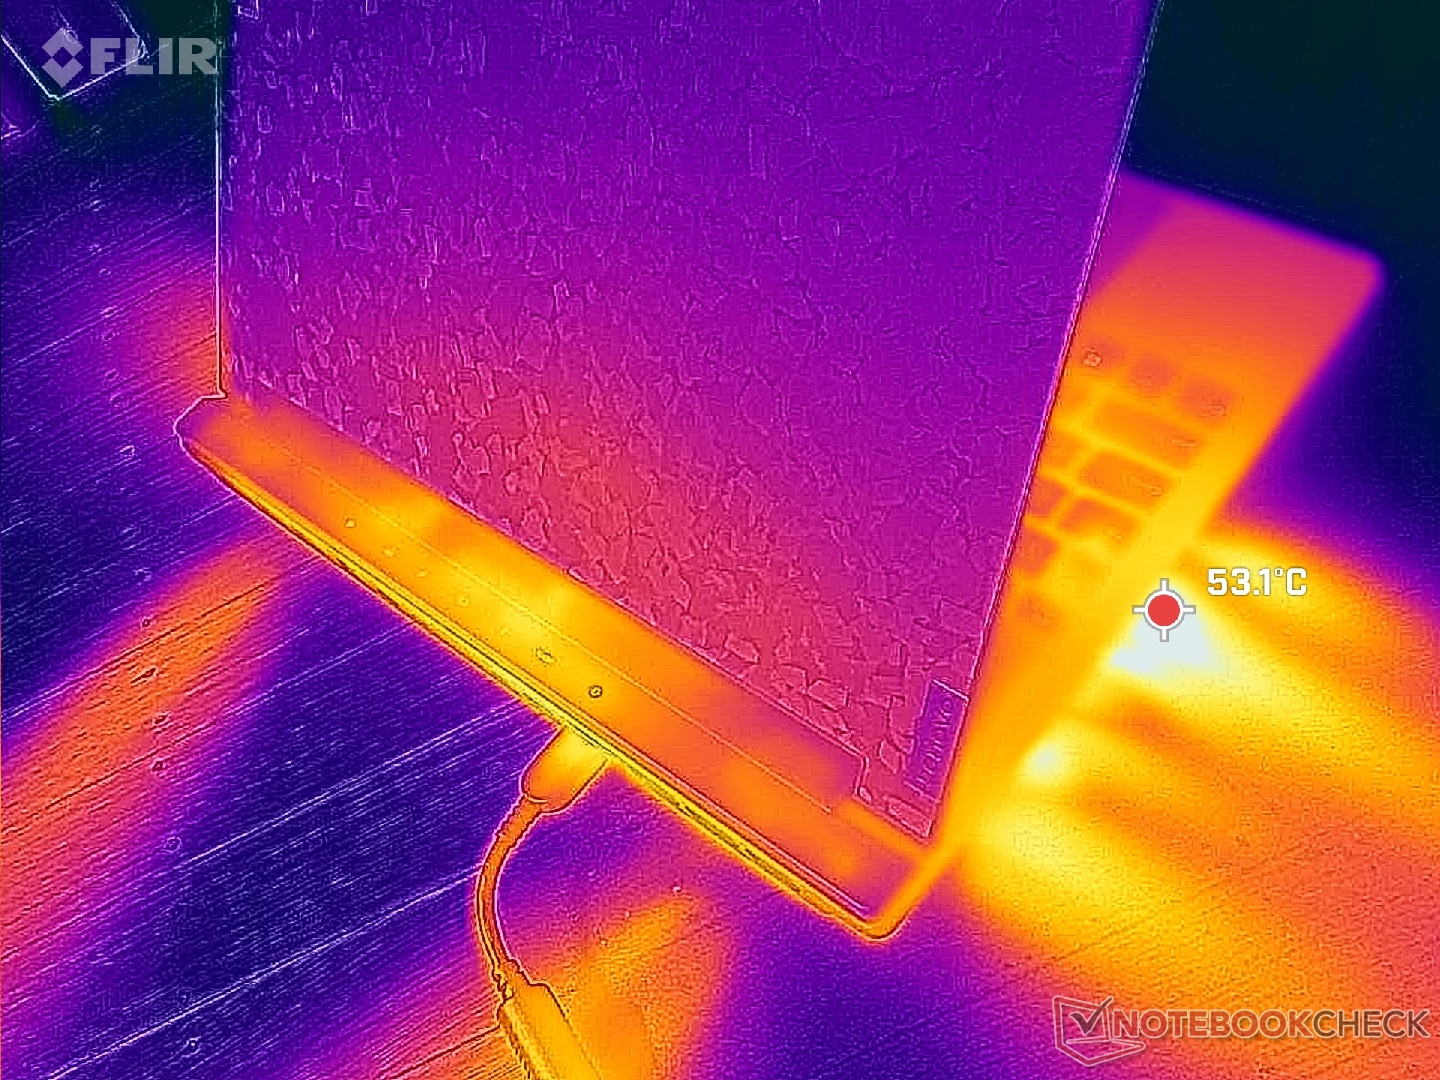
(-) Üst taraftaki maksimum sıcaklık, 40.4 °C / 105 F ortalamasına kıyasla 49.6 °C / 121 F'dir. , Gaming sınıfı için 21.2 ile 68.8 °C arasında değişir.
(-) Alt kısım, 43.2 °C / 110 F ortalamasına kıyasla maksimum 48.6 °C / 119 F'ye kadar ısınır
(+) Boşta kullanımda, üst tarafın ortalama sıcaklığı 30 °C / 86 F olup, cihazın 33.9 °C / 93 F.
(-) The Witcher 3 oynarken, üst tarafın ortalama sıcaklığı 38.1 °C / 101 F olup, cihazın 33.9 °C / 93 F.
(+) Avuç içi dayanakları ve dokunmatik yüzey maksimum (33.6 °C / 92.5 F) cilt sıcaklığına ulaşıyor ve bu nedenle sıcak değil.
(-) Benzer cihazların avuç içi dayanağı alanının ortalama sıcaklığı 28.8 °C / 83.8 F (-4.8 °C / -8.7 F) idi.
| Lenovo Legion 9 16IRX8 Intel Core i9-13980HX, NVIDIA GeForce RTX 4090 Laptop GPU | Lenovo Legion Slim 5 16APH8 AMD Ryzen 7 7840HS, NVIDIA GeForce RTX 4060 Laptop GPU | Razer Blade 16 Early 2023 RTX 4090 Intel Core i9-13950HX, NVIDIA GeForce RTX 4090 Laptop GPU | Asus ROG Strix G16 G614JZ Intel Core i9-13980HX, NVIDIA GeForce RTX 4080 Laptop GPU | HP Omen Transcend 16 Intel Core i9-13900HX, NVIDIA GeForce RTX 4070 Laptop GPU | Alienware x16 R1 Intel Core i9-13900HK, NVIDIA GeForce RTX 4080 Laptop GPU | |
|---|---|---|---|---|---|---|
| Heat | 18% | 2% | -1% | 5% | -2% | |
| Maximum Upper Side * (°C) | 49.6 | 40.6 18% | 52 -5% | 54 -9% | 47.4 4% | 47.2 5% |
| Maximum Bottom * (°C) | 48.6 | 42 14% | 47.6 2% | 55 -13% | 54.4 -12% | 47.8 2% |
| Idle Upper Side * (°C) | 33.2 | 27.8 16% | 33 1% | 29 13% | 28.4 14% | 36.8 -11% |
| Idle Bottom * (°C) | 34.2 | 26.6 22% | 30.6 11% | 33 4% | 29.2 15% | 35.8 -5% |
* ... daha küçük daha iyidir
Stres Testi
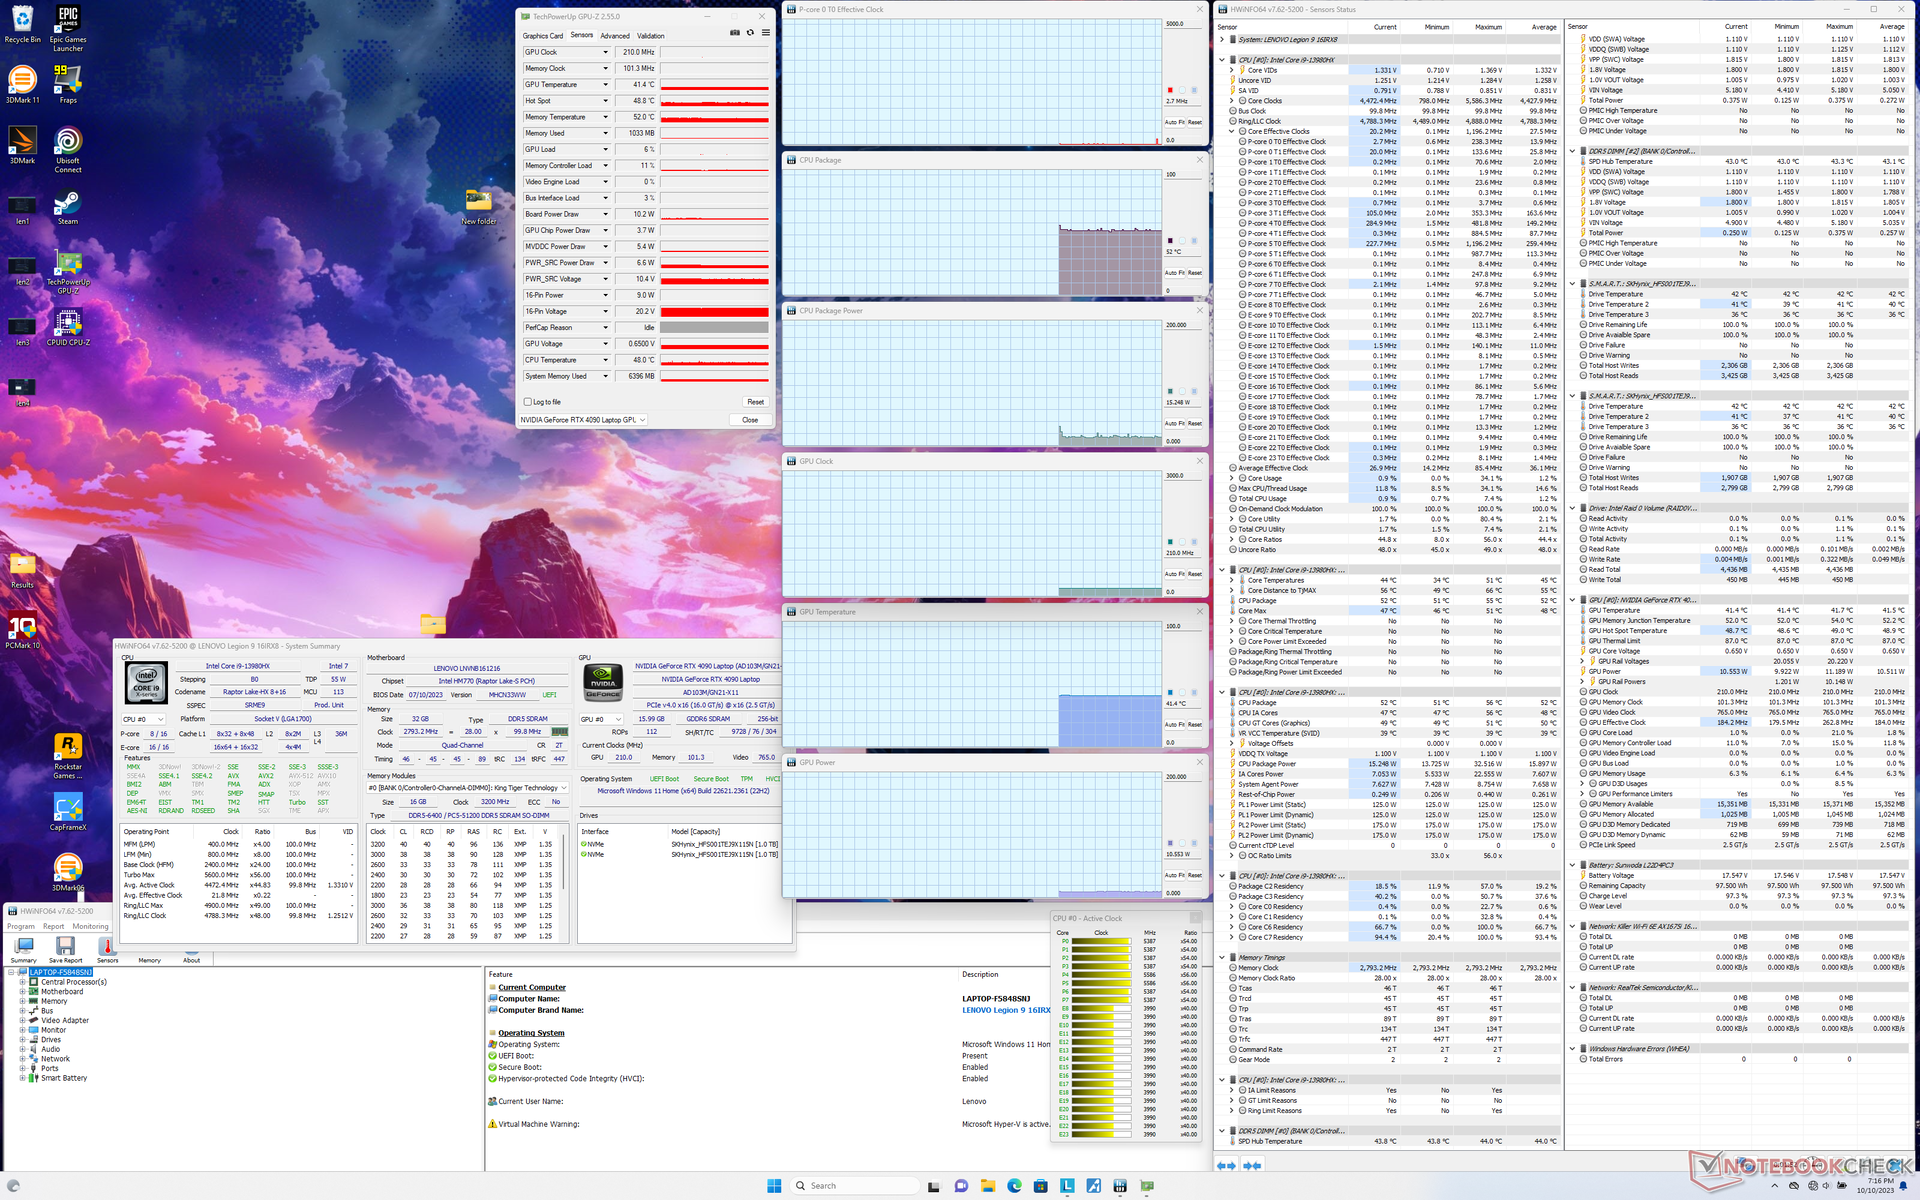
Prime95 stresini başlatırken CPU saat hızları ve kart güç çekimi, testin yaklaşık bir dakika sonrasında 3,0 GHz ve 125 W'ta düşüp sabitlenmeden önce sırasıyla 3,6 GHz ve 138 W'a yükselir. Çekirdek sıcaklığı daha büyük olan 100 C'ye kıyasla 83 C'de sabitleniyordu Alienware m18 R1 tam olarak aynı Core i9-13980HX ile donatılmıştır.
GPU performansı, yukarıda GPU Performansı bölümünde belirtildiği gibi büyük ölçüde seçilen güç profiline bağlıdır. Çalıştırırken Witcher 3 örneğin, Performans modunda Nvidia GPU, GPU Hız Aşırtma kapalı iken Dengeli modda sadece 1650 MHz ve 104 W'a kıyasla 2265 MHz ve 160 W'da stabilize olur. GPU sıcaklığı, aynı RTX 4090 GPU'ya sahip Blade 16'daki 71 C'ye kıyasla 78 C'de stabilize olur.
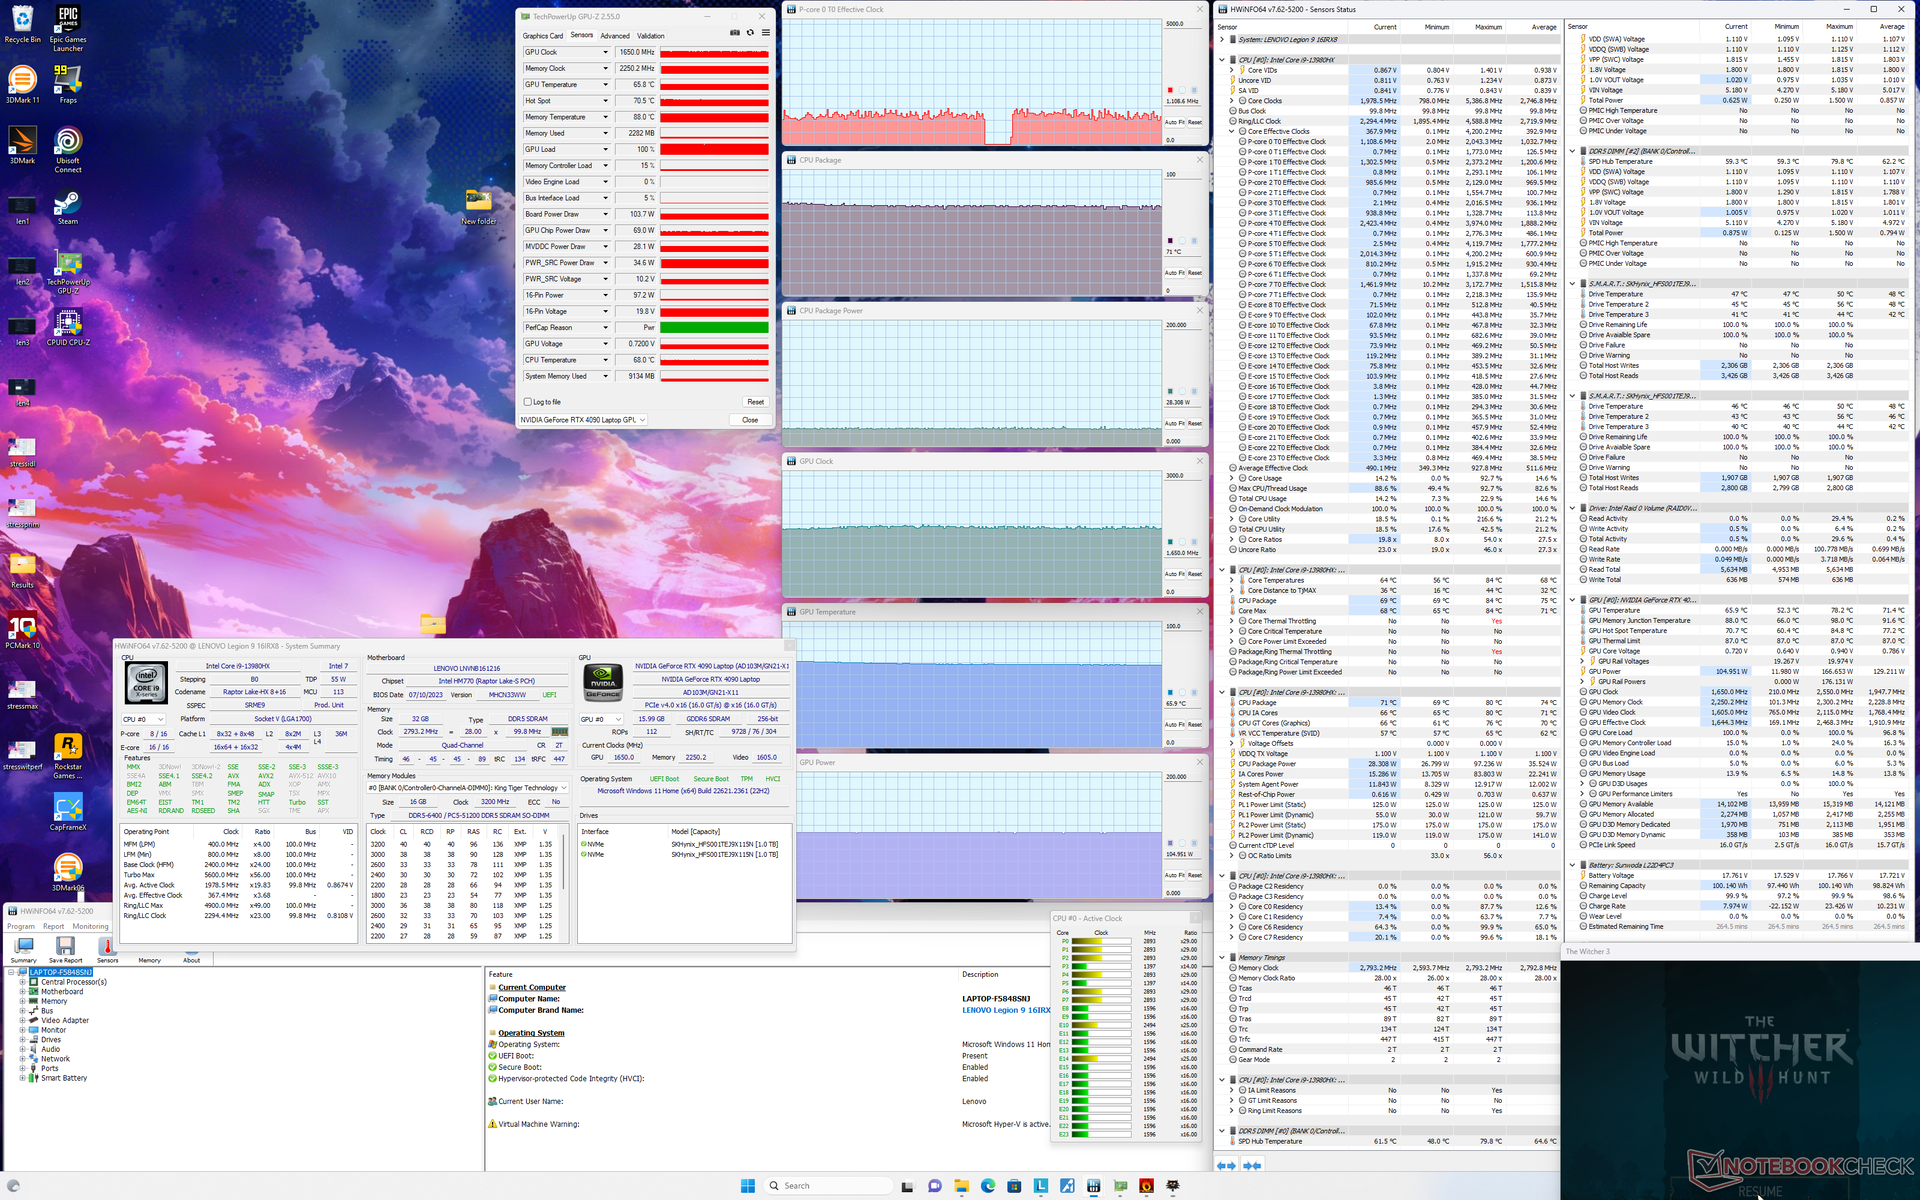
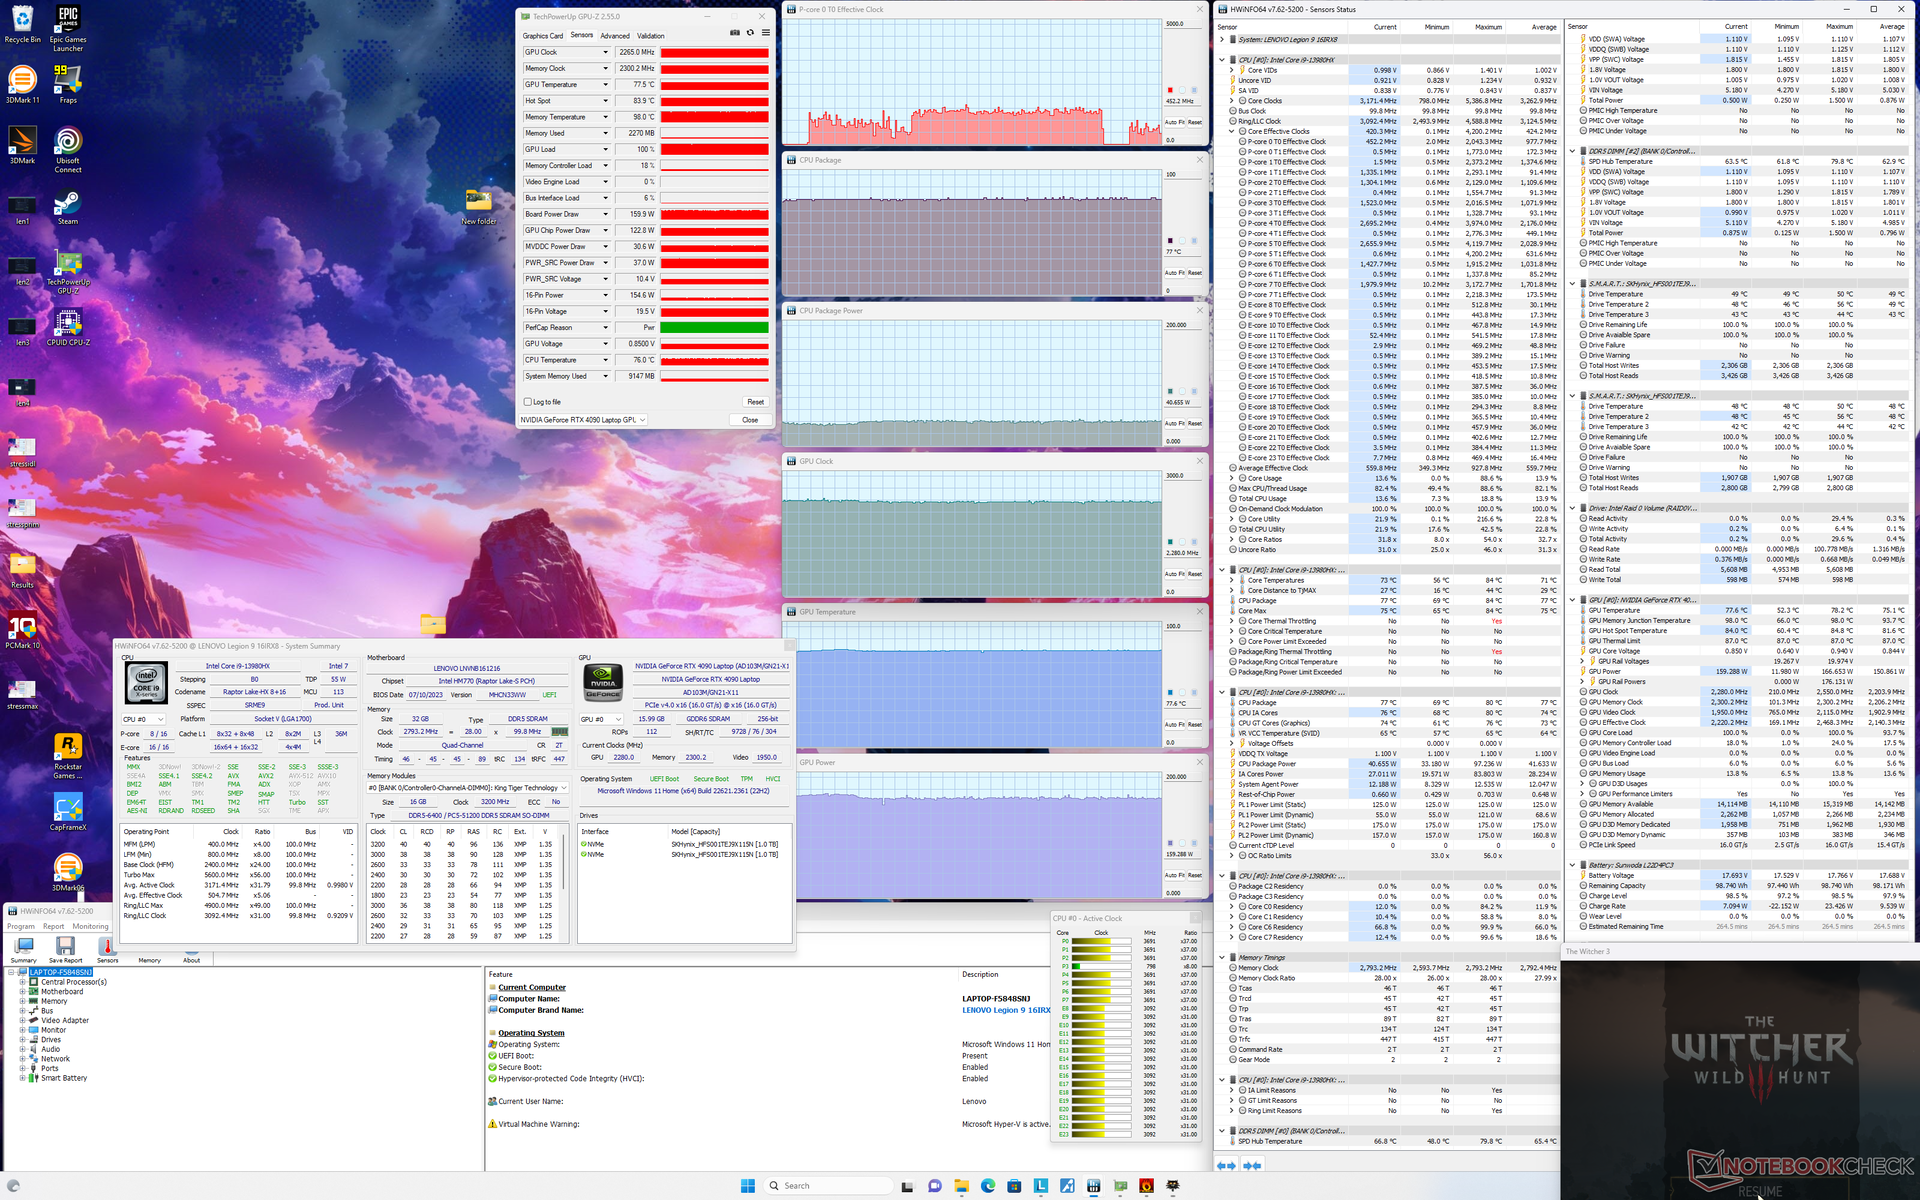
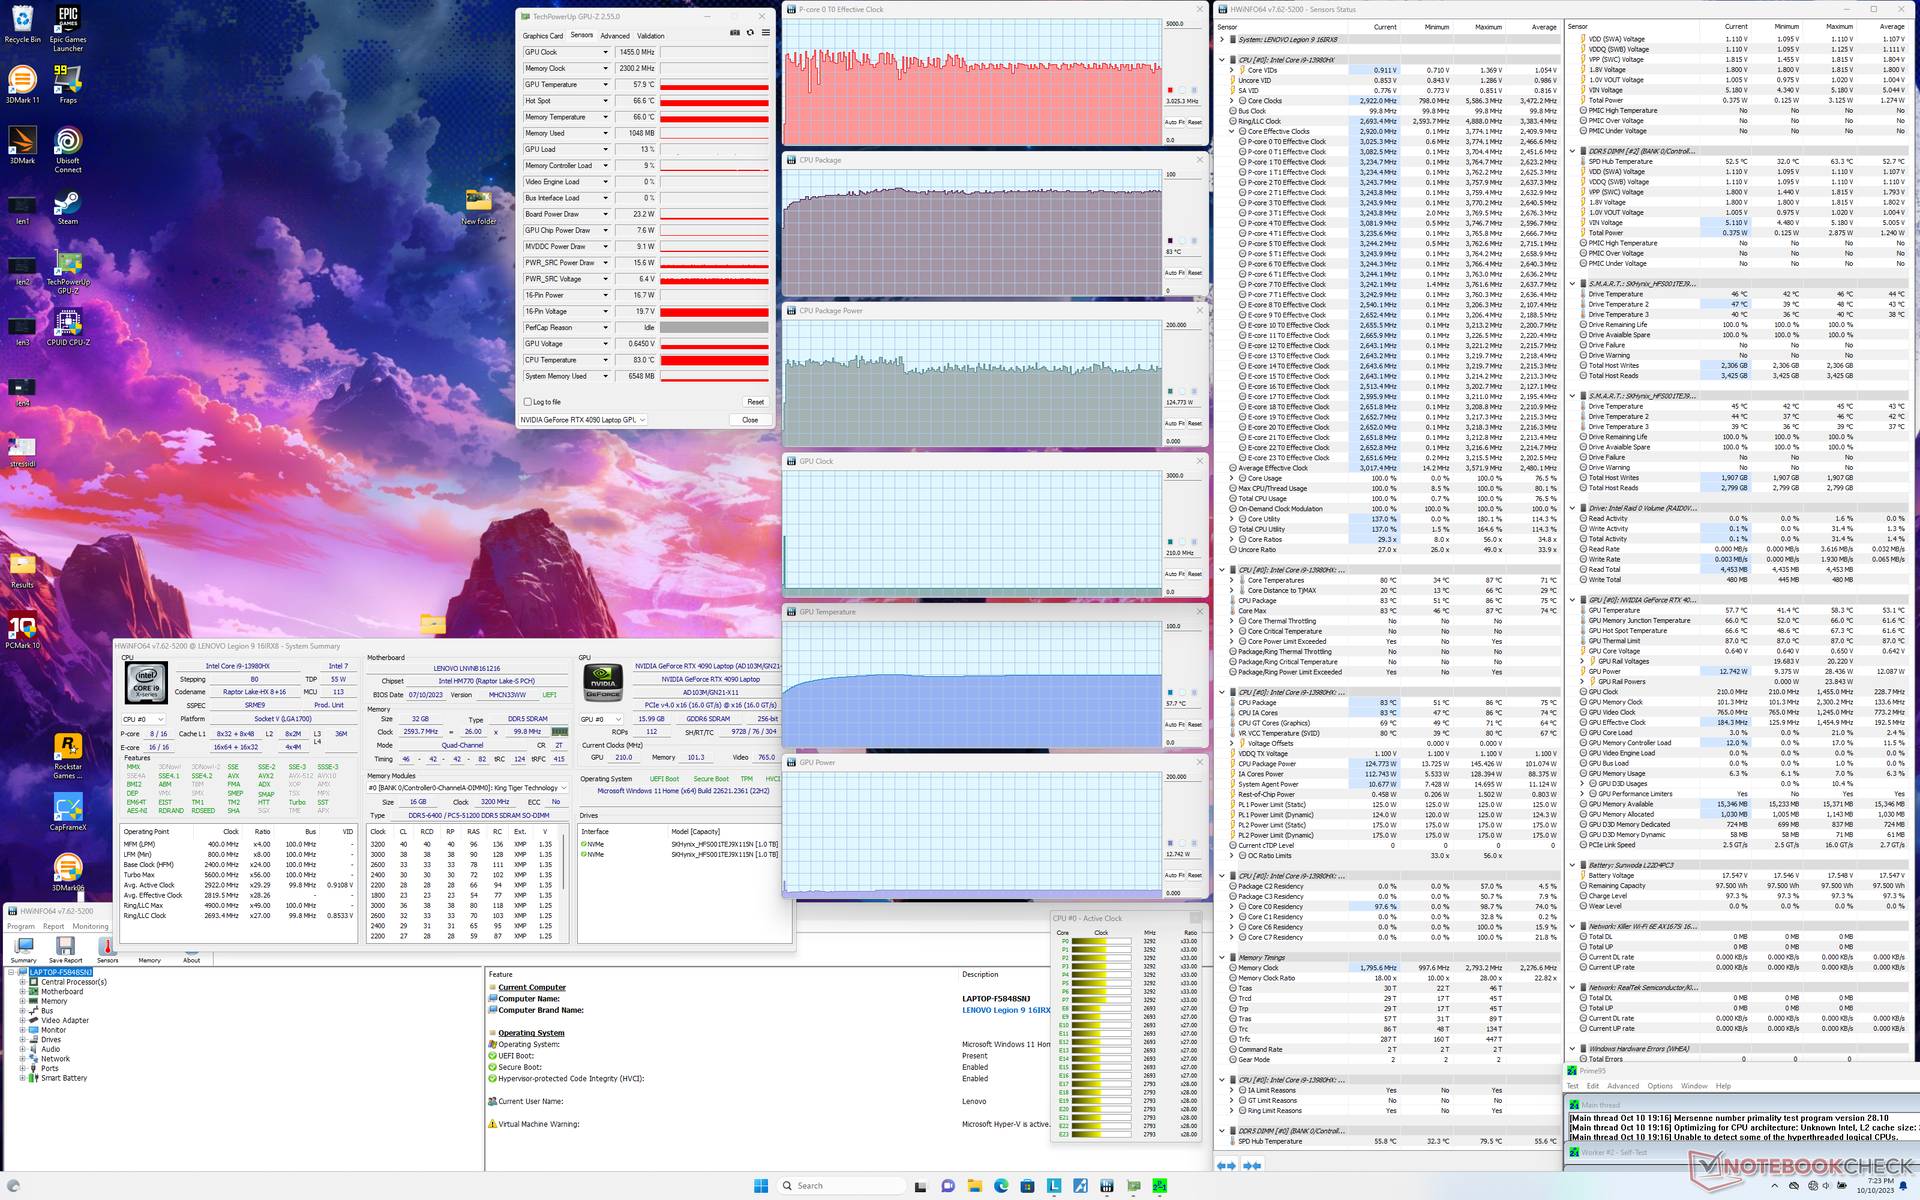
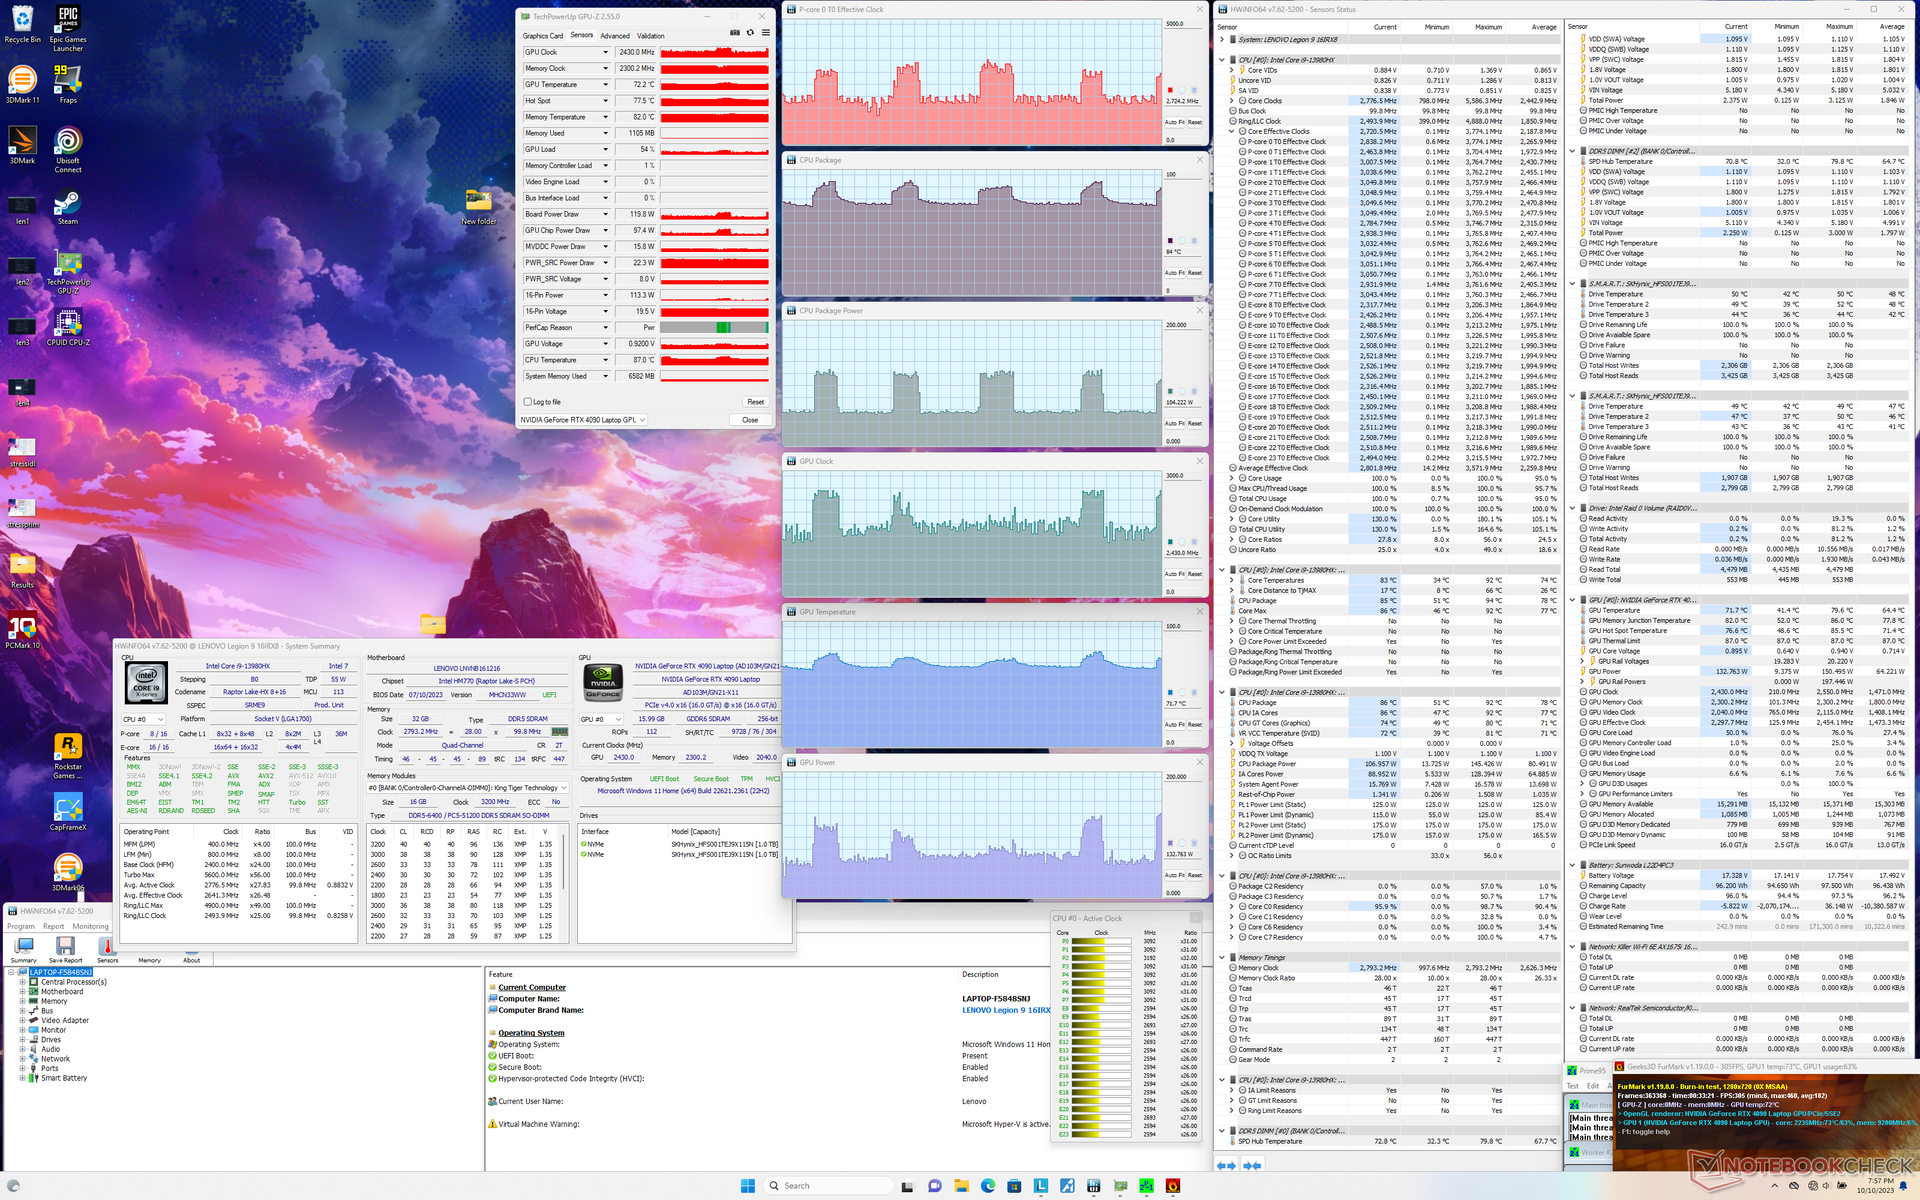
| CPU Saati (GHz) | GPU Saati (MHz) | Ortalama CPU Sıcaklığı (°C) | Ortalama GPU Sıcaklığı (°C) | |
| Sistem Boşta | -- | -- | 52 | 41 |
| Prime95 Stres | 3.0 | -- | 83 | 58 |
| Prime95 + FurMark Stres | 1.6 - 3.4 | 1365 - 2535 | 74 - 86 | 72 - 78 |
| Witcher 3 Stres (GPU Hız Aşırtma kapalı iken Dengeli mod) | ~1.1 | 1650 | 71 | 66 |
| Witcher 3 Stres (Performans modu) | ~1.1 | 2265 | 77 | 78 |
Konuşmacılar
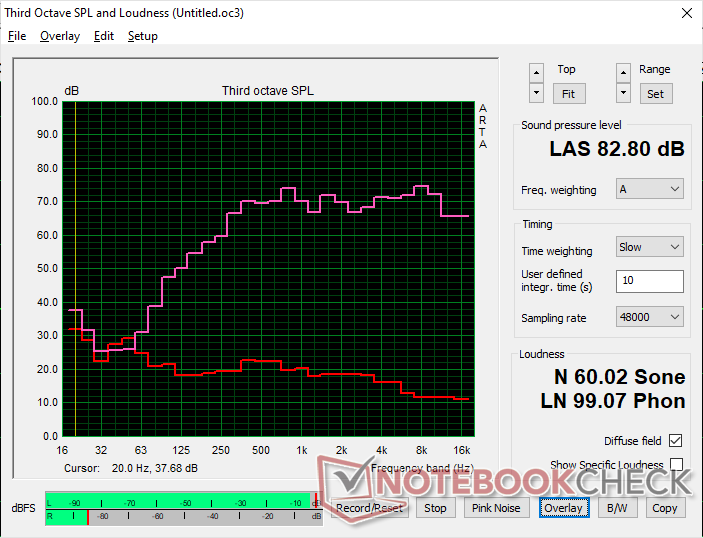
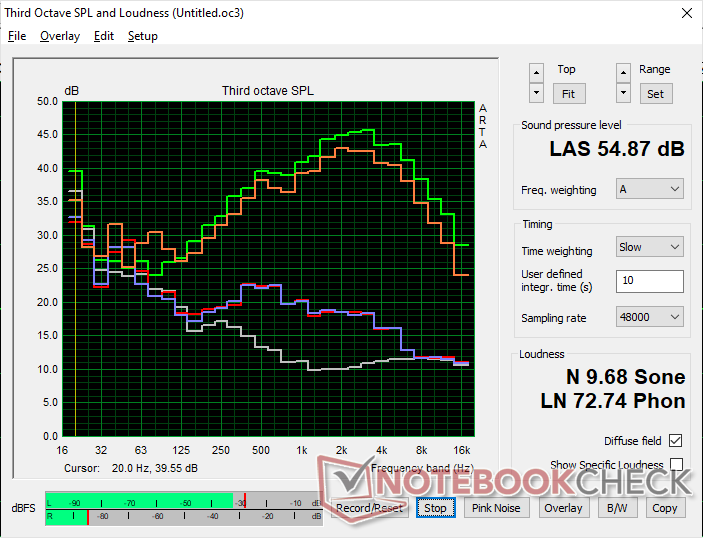
Lenovo Legion 9 16IRX8 ses analizi
(+) | hoparlörler nispeten yüksek sesle çalabilir (82.8 dB)
Bas 100 - 315Hz
(±) | azaltılmış bas - ortalama olarak medyandan 13.5% daha düşük
(±) | Bas doğrusallığı ortalamadır (9% delta - önceki frekans)
Ortalar 400 - 2000 Hz
(+) | dengeli ortalar - medyandan yalnızca 1.5% uzakta
(+) | orta frekanslar doğrusaldır (5.7% deltadan önceki frekansa)
Yüksekler 2 - 16 kHz
(+) | dengeli yüksekler - medyandan yalnızca 2.4% uzakta
(+) | yüksekler doğrusaldır (3.7% deltadan önceki frekansa)
Toplam 100 - 16.000 Hz
(+) | genel ses doğrusaldır (11% ortancaya göre fark)
Aynı sınıfla karşılaştırıldığında
» Bu sınıftaki tüm test edilen cihazların %7%'si daha iyi, 3% benzer, 89% daha kötüydü
» En iyisinin deltası 6% idi, ortalama 18% idi, en kötüsü 132% idi
Test edilen tüm cihazlarla karşılaştırıldığında
» Test edilen tüm cihazların %6'si daha iyi, 2 benzer, % 92 daha kötüydü
» En iyisinin deltası 4% idi, ortalama 23% idi, en kötüsü 134% idi
Apple MacBook Pro 16 2021 M1 Pro ses analizi
(+) | hoparlörler nispeten yüksek sesle çalabilir (84.7 dB)
Bas 100 - 315Hz
(+) | iyi bas - medyandan yalnızca 3.8% uzakta
(+) | bas doğrusaldır (5.2% delta ile önceki frekans)
Ortalar 400 - 2000 Hz
(+) | dengeli ortalar - medyandan yalnızca 1.3% uzakta
(+) | orta frekanslar doğrusaldır (2.1% deltadan önceki frekansa)
Yüksekler 2 - 16 kHz
(+) | dengeli yüksekler - medyandan yalnızca 1.9% uzakta
(+) | yüksekler doğrusaldır (2.7% deltadan önceki frekansa)
Toplam 100 - 16.000 Hz
(+) | genel ses doğrusaldır (4.6% ortancaya göre fark)
Aynı sınıfla karşılaştırıldığında
» Bu sınıftaki tüm test edilen cihazların %0%'si daha iyi, 0% benzer, 100% daha kötüydü
» En iyisinin deltası 5% idi, ortalama 17% idi, en kötüsü 45% idi
Test edilen tüm cihazlarla karşılaştırıldığında
» Test edilen tüm cihazların %0'si daha iyi, 0 benzer, % 100 daha kötüydü
» En iyisinin deltası 4% idi, ortalama 23% idi, en kötüsü 134% idi
Enerji Yönetimi
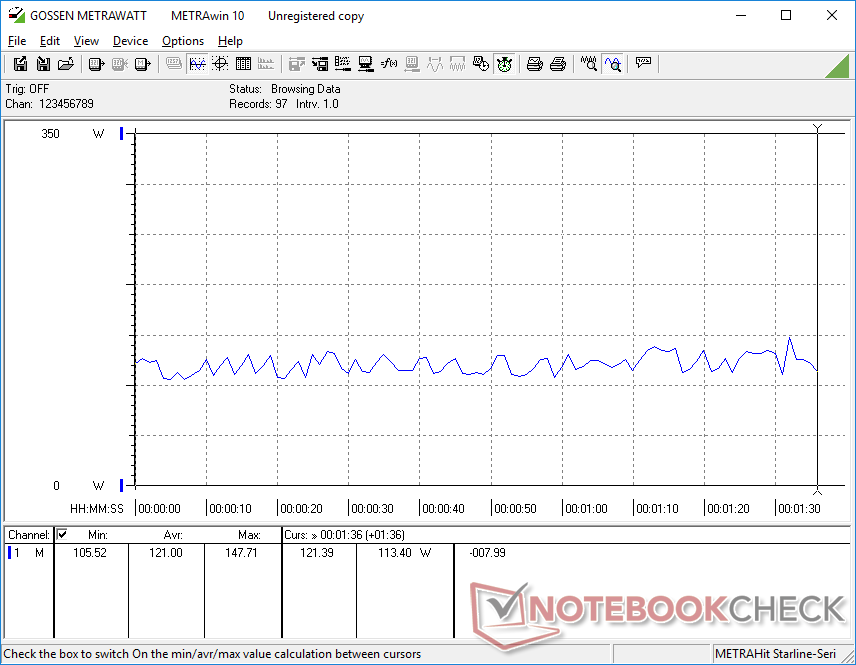
Güç Tüketimi
Güç ayarı ne olursa olsun güç tüketimi çok yüksektir. Masaüstünde Güç Tasarrufu iGPU modunda ve minimum parlaklık ayarında rölantide çalışırken, her biri IPS panelli Legion Slim 5 16 veya Asus ROG Strix G16 sadece 9 W ila 10 W'a kıyasla yine de 32 W gerekir. Tüketim aynı zamanda sadece parlaklığa değil, OLED panelde olduğu gibi renge de bağlıdır. Örneğin Legion 9i 16'mızdaki tamamen beyaz bir ekran, her iki renk için maksimum parlaklık ayarında bile tamamen siyah bir ekrandan yaklaşık 13 W daha fazla talep edecektir. IPS paneller ise renk ne olursa olsun en fazla birkaç watt talep edecektir.
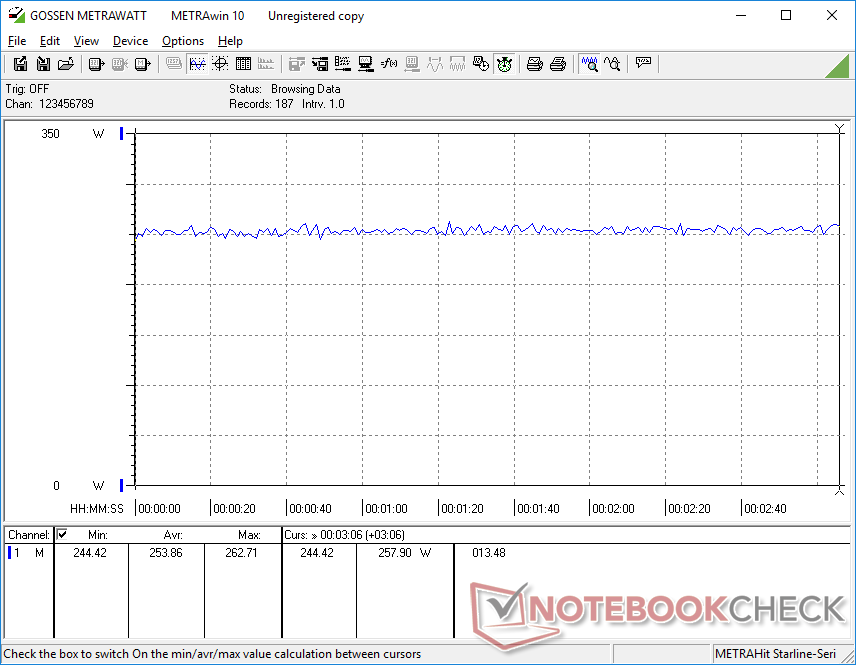
Prime95'i harici bir monitörde çalıştırmak, aşağıdaki karşılaştırma grafiklerinde gösterildiği gibi Lenovo ünitemiz ile rakip Ryzen 9 7945HX tarafından desteklenen Asus ROG Strix Scar 17 arasında çok benzer tüketim seviyeleri göstermektedir. Watt başına performans yine de AMD'nin lehine çünkü Ryzen 9 7945HX, benzer güç taleplerine rağmen çok iş parçacıklı iş yüklerinde Core i9-13980HX'i geride bırakıyor.
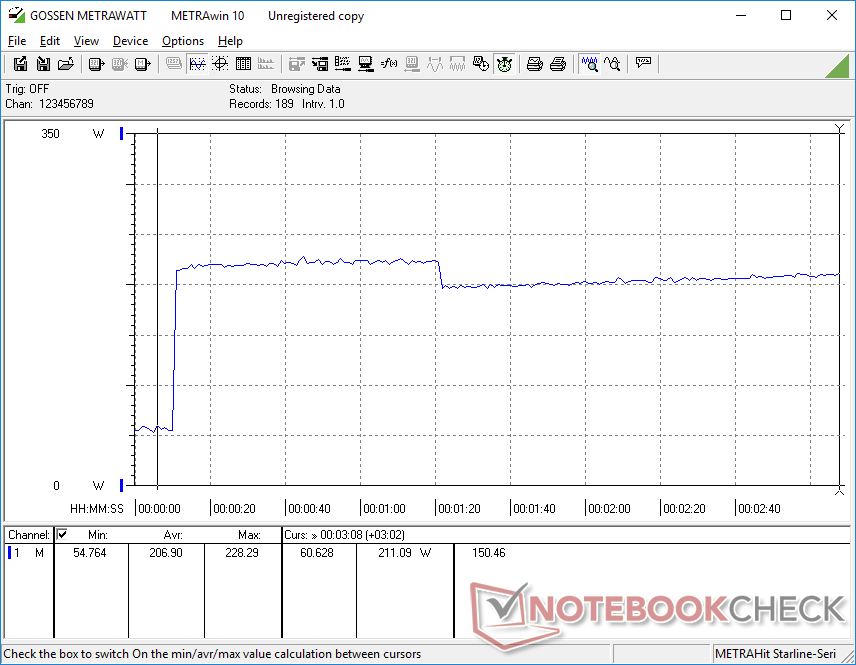
Oyun oynarken tüketim, Ryzen 9 7945HX ile karşılaştırıldığında yaklaşık yüzde 10 oranında biraz daha yüksektir Asus ROG Strix Scar 17 SE eski RTX 3080 Ti ile karşılaştırıldığında. Bununla birlikte, RTX 4090 ile grafik performansındaki yüzde 40 ila 75'lik artış, tüketimdeki daha küçük artışı fazlasıyla telafi ediyor. Mobil Ada Lovelace serisinin watt başına çok yüksek performansı etkileyici ve şu anda rakipsiz.
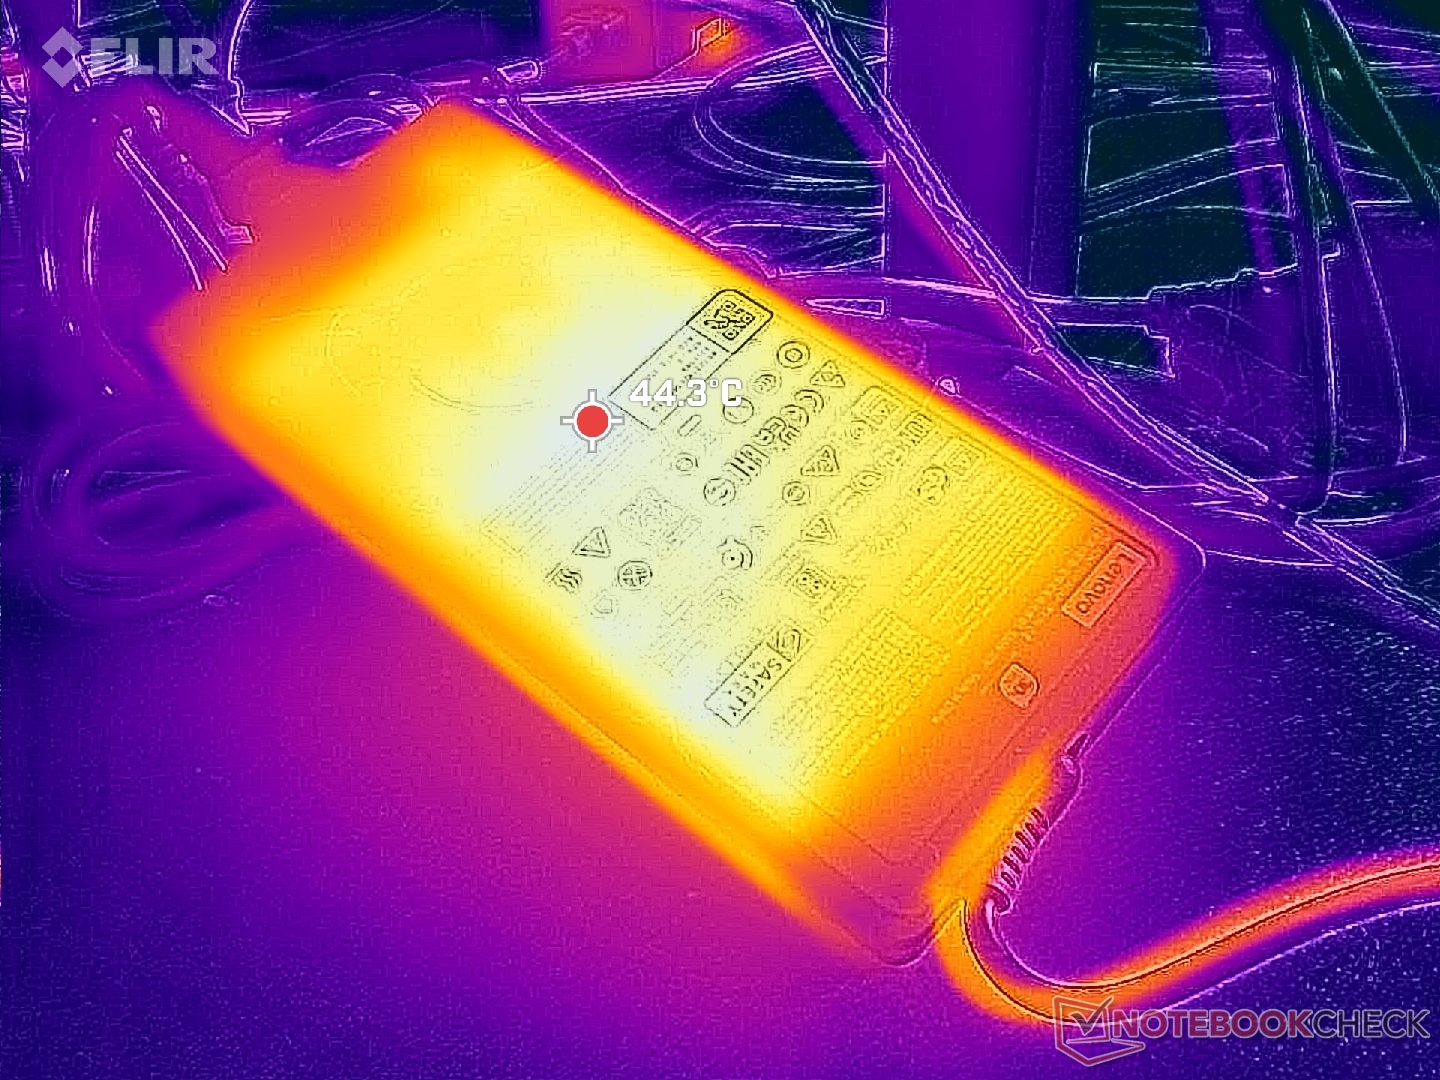
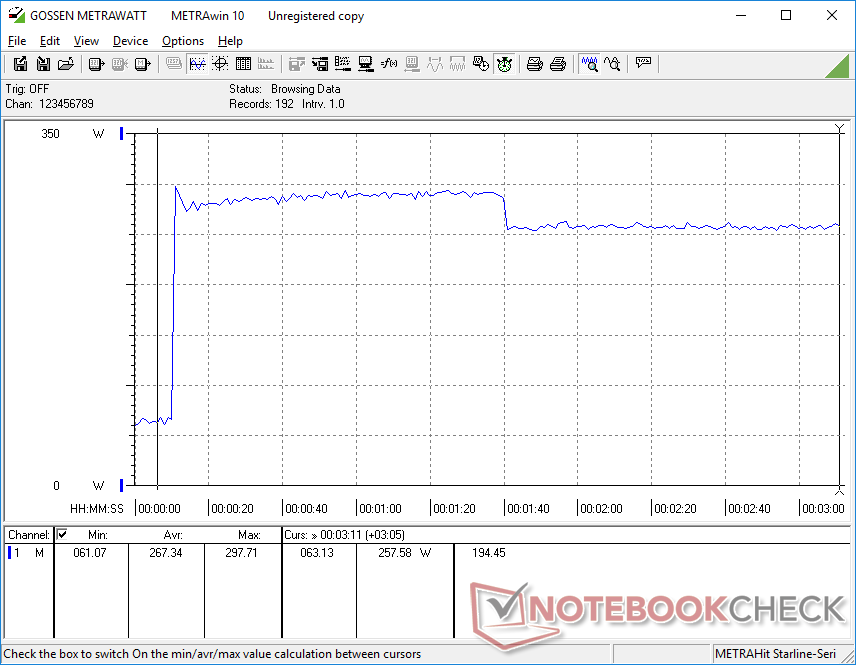
CPU ve GPU'nun her ikisi de yüzde 100 kullanımdayken orta büyüklükteki (18,5 x 2,6 x8,3 cm) 330 W AC adaptörden maksimum 298 W çekişi ölçebiliyoruz. Bu oran, termal sınırlamalar nedeniyle yalnızca geçicidir.
| Kapalı / Bekleme modu | |
| Boşta | |
| Çalışırken |
|
Key:
min: | |
| Lenovo Legion 9 16IRX8 i9-13980HX, GeForce RTX 4090 Laptop GPU, 2x SK Hynix HFS001TEJ9X115N (RAID 0), Mini-LED, 3200x2000, 16" | Lenovo Legion Slim 5 16APH8 R7 7840HS, GeForce RTX 4060 Laptop GPU, SK hynix PC801 HFS512GEJ9X115N, IPS, 2560x1600, 16" | Razer Blade 16 Early 2023 RTX 4090 i9-13950HX, GeForce RTX 4090 Laptop GPU, SSSTC CA6-8D1024, mini-LED, 3840x2400, 16" | Asus ROG Strix G16 G614JZ i9-13980HX, GeForce RTX 4080 Laptop GPU, WD PC SN560 SDDPNQE-1T00, IPS, 2560x1600, 16" | HP Omen Transcend 16 i9-13900HX, GeForce RTX 4070 Laptop GPU, SK hynix PC801 HFS002TEJ9X101N, Mini-LED, 2560x1600, 16" | Alienware x16 R1 i9-13900HK, GeForce RTX 4080 Laptop GPU, SK hynix PC801 HFS001TEJ9X101N, IPS, 2560x1600, 16" | |
|---|---|---|---|---|---|---|
| Power Consumption | 53% | 9% | 28% | 18% | 12% | |
| Idle Minimum * (Watt) | 32.3 | 9.4 71% | 27.5 15% | 10 69% | 19.2 41% | 25.2 22% |
| Idle Average * (Watt) | 42.6 | 15.5 64% | 34.4 19% | 16 62% | 22.7 47% | 29.9 30% |
| Idle Maximum * (Watt) | 57.9 | 24.4 58% | 35.4 39% | 27 53% | 55.4 4% | 49.8 14% |
| Load Average * (Watt) | 121 | 74.1 39% | 147.8 -22% | 129 -7% | 128.4 -6% | 105.4 13% |
| Witcher 3 ultra * (Watt) | 254 | 112.9 56% | 256 -1% | 247 3% | 206 19% | 263 -4% |
| Load Maximum * (Watt) | 297.7 | 206.5 31% | 286.7 4% | 342 -15% | 292 2% | 313.8 -5% |
* ... daha küçük daha iyidir
Power Consumption Witcher 3 / Stresstest
Power Consumption external Monitor
Pil Ömrü
Yukarıdaki yüksek güç tüketimi rakamlarımızla ilişkili olarak çalışma süreleri zayıftır. Dengeli iGPU moduna ayarlandığında bile sadece 160 dakika boyunca internette gezinebildik. HP gibi diğer mini LED dizüstü bilgisayarlar Omen Transcend 16ayrıca 90+ Wh'lık büyük batarya paketlerine rağmen çok kısa çalışma süreleri sergileyecektir.
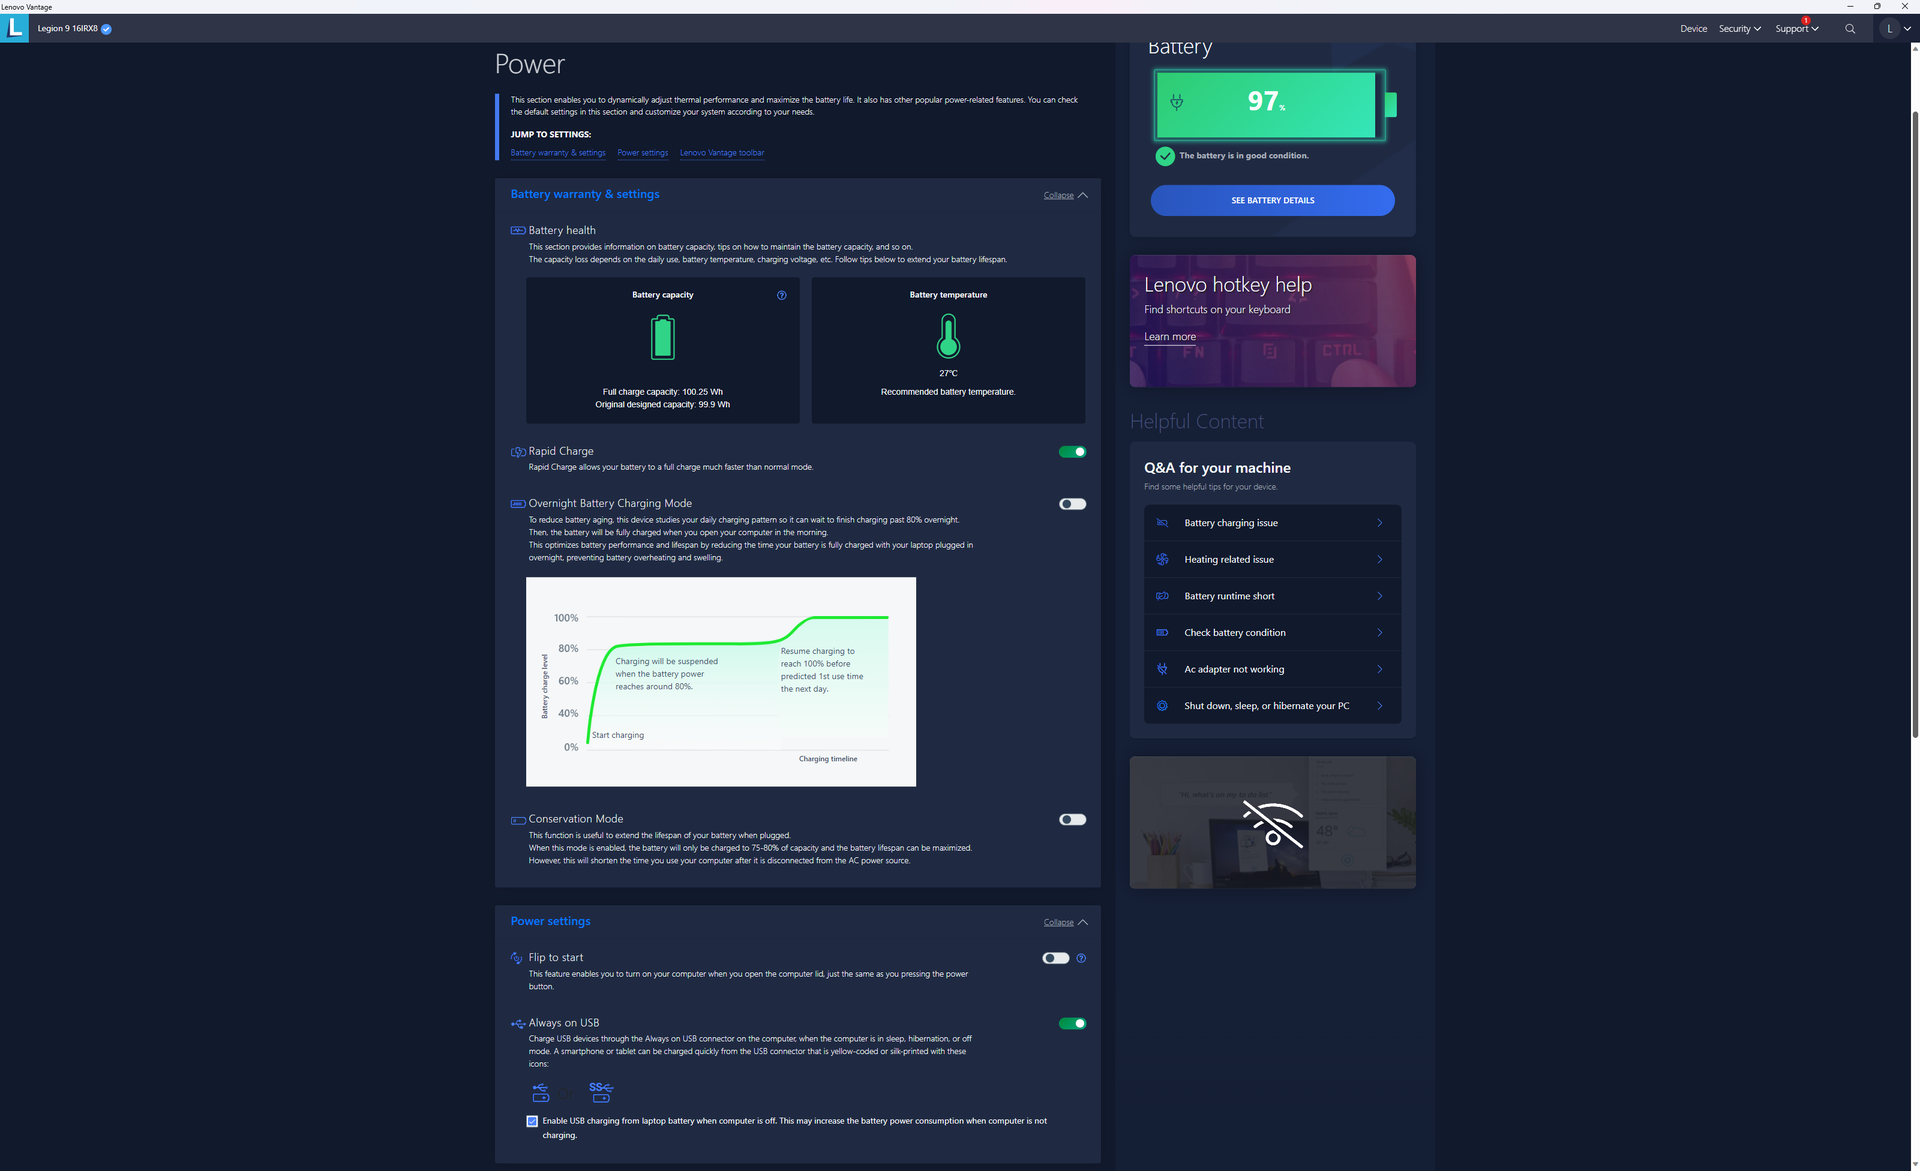
Lenovo Rapid Charge etkinleştirildiğinde, diğer oyun dizüstü bilgisayarlarının çoğundaki 90 dakika veya daha uzun süreye kıyasla en azından yaklaşık bir saatte çok hızlı şarj oluyor. Üçüncü taraf USB-C adaptörleri de sistemi daha yavaş bir hızda ve garanti edilmeyen uyumlulukla da olsa şarj edebilir.
| Lenovo Legion 9 16IRX8 i9-13980HX, GeForce RTX 4090 Laptop GPU, 99.9 Wh | Lenovo Legion Slim 5 16APH8 R7 7840HS, GeForce RTX 4060 Laptop GPU, 80 Wh | Razer Blade 16 Early 2023 RTX 4090 i9-13950HX, GeForce RTX 4090 Laptop GPU, 95.2 Wh | Asus ROG Strix G16 G614JZ i9-13980HX, GeForce RTX 4080 Laptop GPU, 90 Wh | HP Omen Transcend 16 i9-13900HX, GeForce RTX 4070 Laptop GPU, 97 Wh | Alienware x16 R1 i9-13900HK, GeForce RTX 4080 Laptop GPU, 90 Wh | |
|---|---|---|---|---|---|---|
| Pil Çalışma Süresi | 86% | 78% | 135% | 23% | -9% | |
| Reader / Idle (h) | 6.7 | 11.7 75% | 6.3 -6% | 7.3 9% | ||
| WiFi v1.3 (h) | 2.7 | 7.1 163% | 5.8 115% | 9.7 259% | 4.2 56% | 2.5 -7% |
| Load (h) | 1 | 1.2 20% | 1.4 40% | 1.1 10% | 1.2 20% | 0.7 -30% |
| H.264 (h) | 8.4 | |||||
| Witcher 3 ultra (h) | 1.6 |
Artılar
Eksiler
Karar - Paranın Satın Alabileceği En İyi Legion
Core i9 CPU, RTX 4090 GPU ve mini LED ekran için pazardaysanız, Legion 9i 16 kesinlikle dikkate değer. Gibi diğer mini LED oyun dizüstü bilgisayarlarıyla karşılaştırıldığında HP Omen Transcend 16, Razer Blade 16veya Asus Zephyrus M16lenovo, HP'den daha hızlı grafikler, Razer'dan daha düşük fiyatlar ve Asus'tan daha yüksek bir doğal çözünürlük sunuyor. Hem teknik özellikleri hem de fiziksel tasarımıyla zaten mükemmel olan Asus'tan bir adım öne çıkıyor Legion Pro 7 serisi.
Tüm yükseltmeler doğal olarak daha büyük ve daha ağır bir kasaya yol açmıştır. Lenovo'nun CPU ve ekran özelliklerini daha taşınabilir bir form faktöründe istiyorsanız, daha pahalı olan Blade 16 faydalı olabilir. Entegre sıvı soğutma kağıt üzerinde kulağa ilginç geliyor, ancak daha hafif, daha sessiz ve hatta daha serin bir tasarım yapmış gibi görünmüyor. Lenovo'nun aynı boyut kategorisindeki diğer oyun dizüstü bilgisayarları kadar yüksek sesle çalışmasını bekleyin.
Legion 9i 16, kısa pil ömrünü ve nispeten büyük kasayı göz ardı edebildiğiniz sürece meraklıların takdir edebileceği tüm süslü özelliklere ve yeni bir görünüme sahiptir.
İyi ya da kötü başka bir ekran seçeneği sunmadığı için Legion 9 16'yı istiyorsanız mini-LED'i gerçekten istemeniz gerekecek. Mini-LED, 1000 nit maksimum parlaklığından yararlanmak için HDR etkinleştirildiğinde en iyi performansını sergiliyor. Aksi takdirde panel, IPS veya OLED gibi daha ucuz panellere göre başka hiçbir önemli avantajı olmadan pil için çok talepkardır.
Fiyat ve Bulunabilirlik
Lenovo, Legion 9i Gen 8 modelini GeForce RTX 4080 ile yapılandırıldığında 3420 USD'den başlayan fiyatlarla, RTX 4090 ve ek depolama alanıyla tam yapılandırıldığında 4000 USD'ye varan fiyatlarla satışa sunuyor.
Lenovo Legion 9 16IRX8
- 10/15/2023 v7 (old)
Allen Ngo
Şeffaflık
İncelenecek cihazların seçimi editör ekibimiz tarafından yapılır. Test örneği, bu incelemenin amacı doğrultusunda üretici veya perakendeci tarafından yazara ödünç olarak sağlanmıştır. Borç verenin bu inceleme üzerinde herhangi bir etkisi olmadığı gibi, üretici de yayınlanmadan önce bu incelemenin bir kopyasını almamıştır. Bu incelemeyi yayınlama zorunluluğu yoktu. Bağımsız bir medya şirketi olarak Notebookcheck, üreticilerin, perakendecilerin veya yayıncıların otoritesine tabi değildir.
Notebookcheck bu şekilde test yapıyor
Notebookcheck, tüm sonuçların karşılaştırılabilir olmasını sağlamak için her yıl yüzlerce dizüstü bilgisayarı ve akıllı telefonu standart prosedürler kullanarak bağımsız olarak inceliyor. Yaklaşık 20 yıldır test yöntemlerimizi sürekli olarak geliştirdik ve bu süreçte endüstri standartlarını belirledik. Test laboratuvarlarımızda deneyimli teknisyenler ve editörler tarafından yüksek kaliteli ölçüm ekipmanları kullanılmaktadır. Bu testler çok aşamalı bir doğrulama sürecini içerir. Karmaşık derecelendirme sistemimiz, nesnelliği koruyan yüzlerce sağlam temellere dayanan ölçüm ve kıyaslamaya dayanmaktadır.Price comparison

