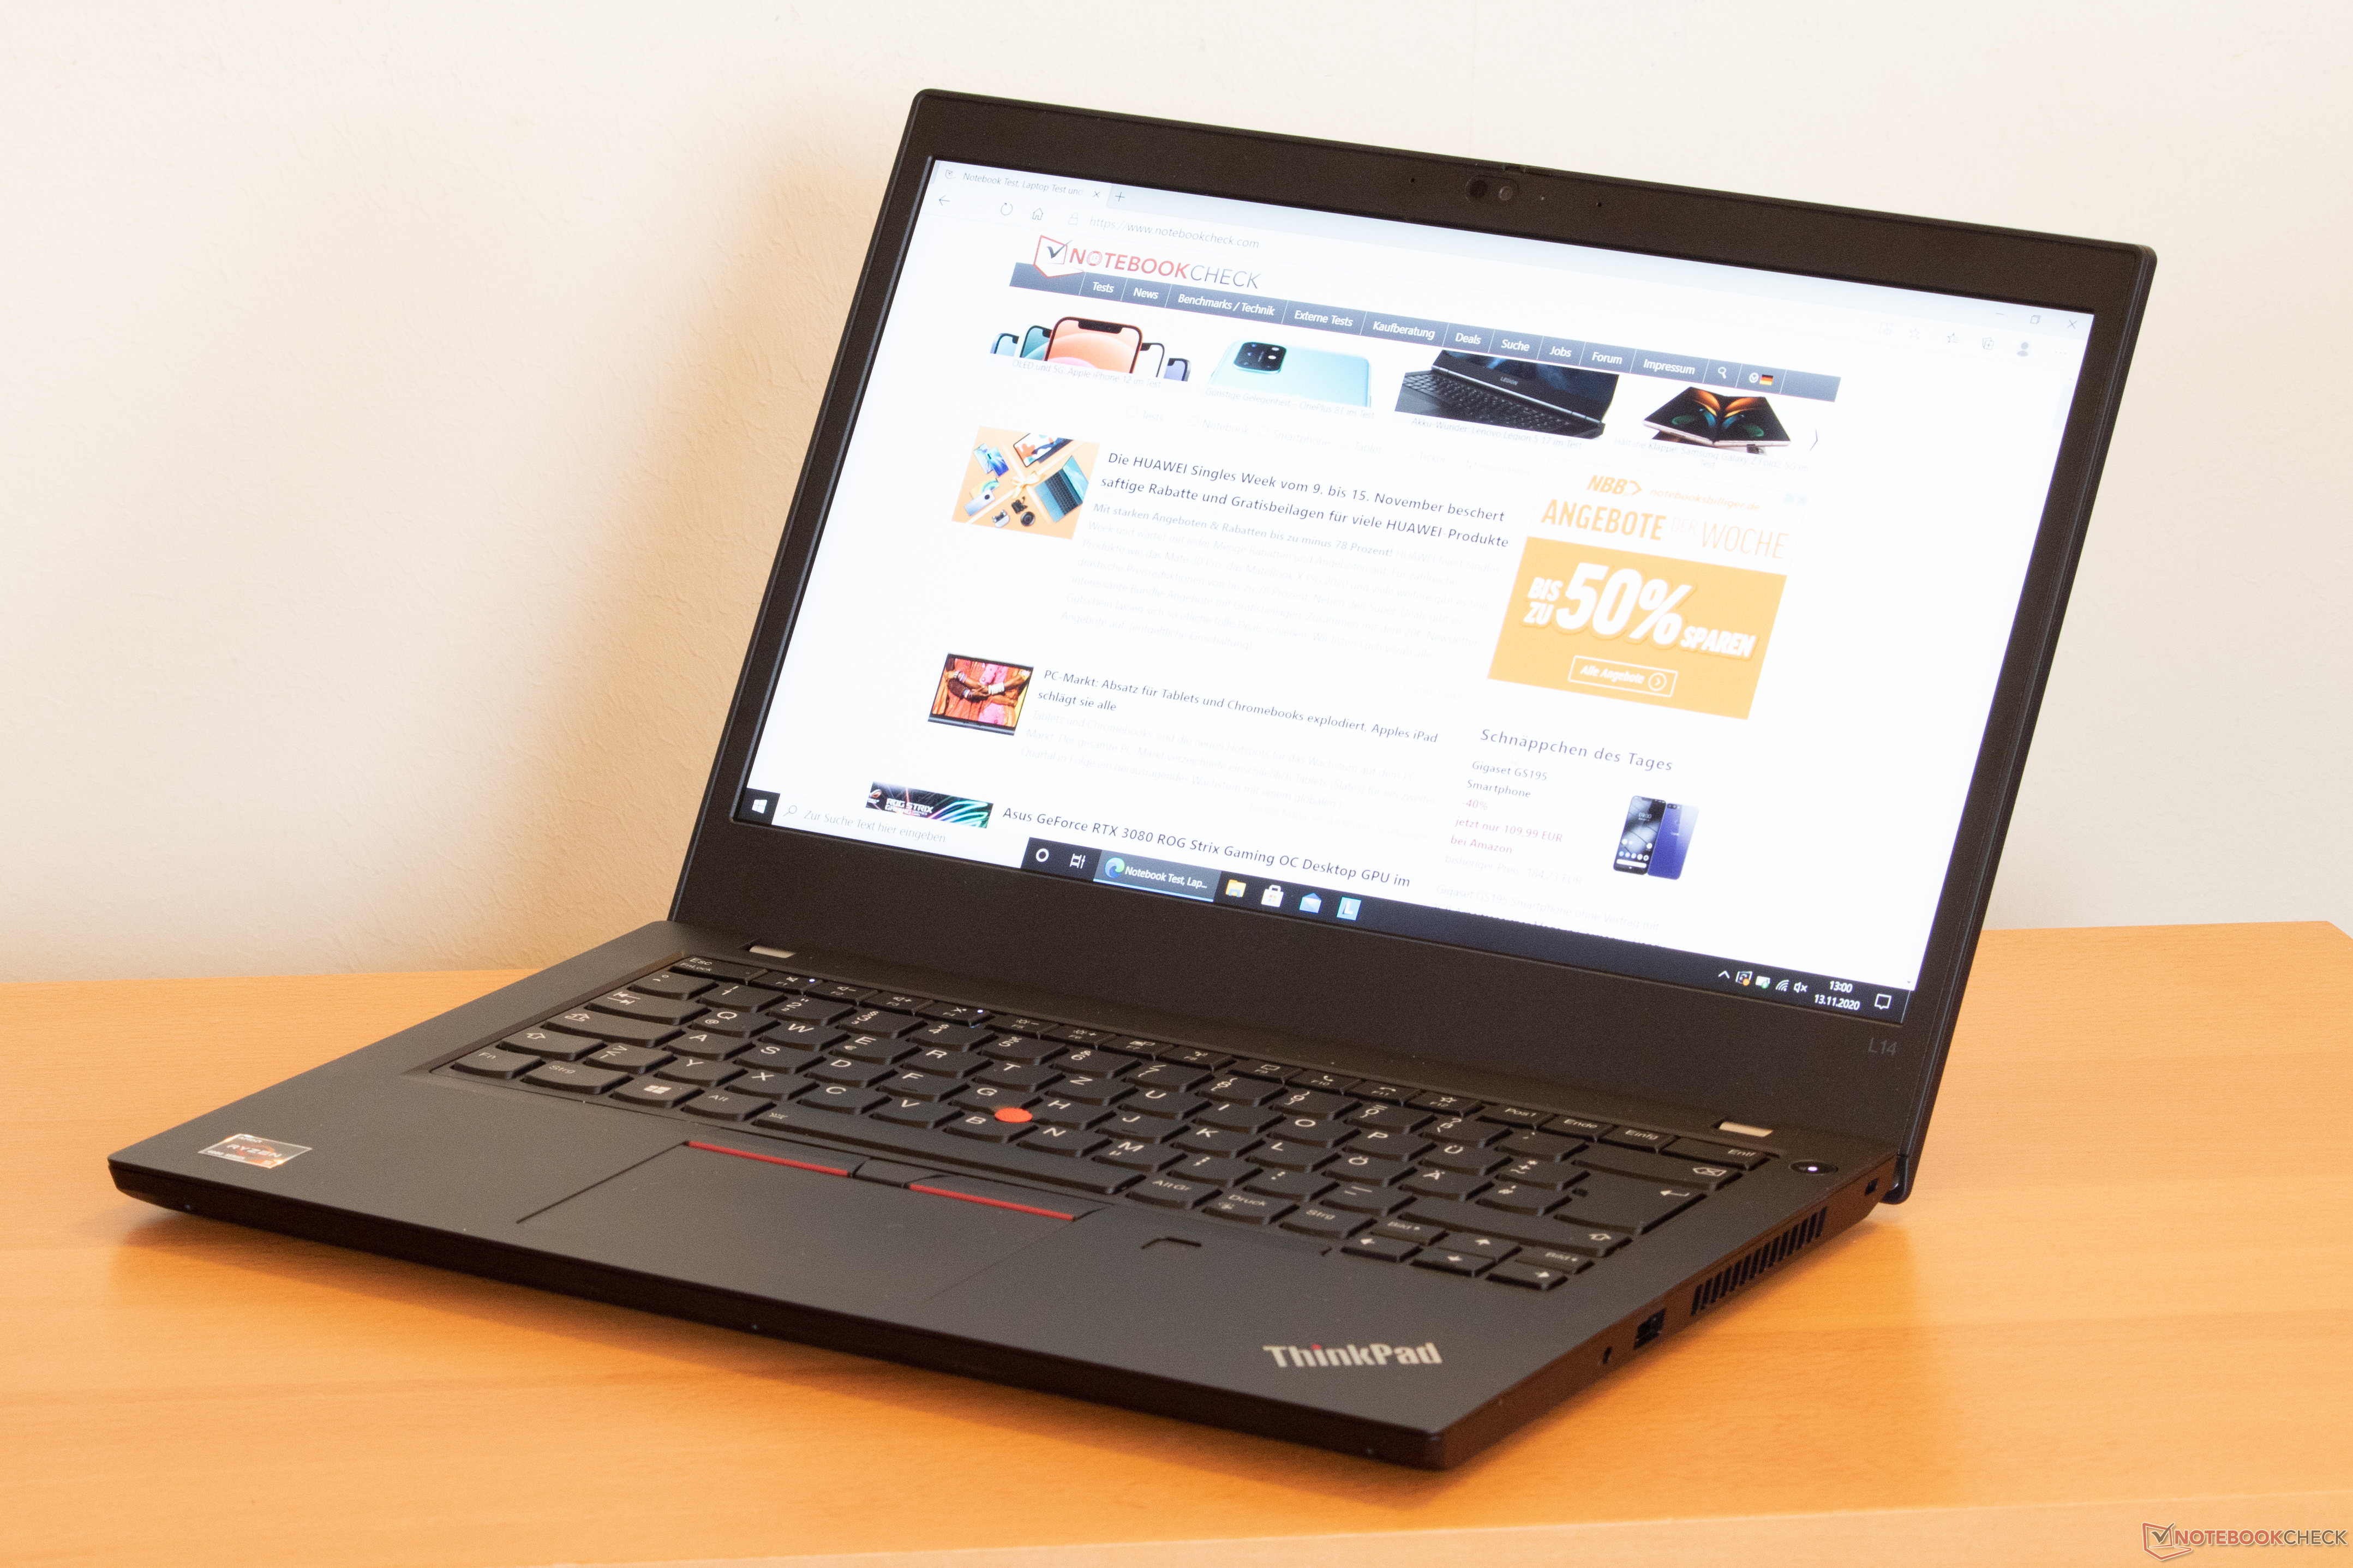
Lenovo ThinkPad L14 İncelemesi: AMD Tekrar Yapıyor
Lenovo ThinkPad L14, geçen yılki 14 inç ThinkPad L490'ın halefidir. Geçen yılki incelemede, genel olarak iyi bir paket olduğu ortaya çıkmasına rağmen ne ekranın ne de CPU'nun özellikle iyi performans göstermediğini fark ettik. Bu yıl, Lenovo'nun L serisi tarihinde ilk kez bir Intel ve bir AMD işlemci arasında seçim yapabilirsiniz. Lenovo'nun L serisi, daha yüksek kaliteli T serisi ile daha uygun fiyatlı giriş seviyesi E serisinin tam ortasında yer alır ve öncelikle iş kullanıcılarını hedef alır. L14'ün dış özelliklerinin çoğunu selefi ile paylaştığı göz önüne alındığında, bu incelemede esas olarak yeni AMD CPU'ya odaklanacağız.
Derecelendirme | Tarih | Modeli | Ağırlık | Yükseklik | Boyut | Çözünürlük | Fiyat |
|---|---|---|---|---|---|---|---|
| 85 % v7 (old) | 01/2021 | Lenovo ThinkPad L14-20U50003GE R5 4500U, Vega 6 | 1.7 kg | 20.4 mm | 14.00" | 1920x1080 | |
| 85 % v7 (old) | 12/2019 | Lenovo ThinkPad L490 20Q6S08600 i5-8265U, UHD Graphics 620 | 1.7 kg | 22.5 mm | 14.00" | 1920x1080 | |
| 85.6 % v7 (old) | 10/2020 | Lenovo ThinkPad E14 Gen2-20T7S00W00 R5 4500U, Vega 6 | 1.6 kg | 17.9 mm | 14.00" | 1920x1080 | |
| 88.8 % v7 (old) | 01/2021 | Lenovo ThinkPad T14s-20T00044GE i5-10210U, UHD Graphics 620 | 1.3 kg | 16.1 mm | 14.00" | 1920x1080 | |
| 83.2 % v7 (old) | 11/2020 | HP ProBook 445 G7 175W4EA R5 4500U, Vega 6 | 1.6 kg | 18 mm | 14.00" | 1920x1080 | |
| 85.3 % v7 (old) | Dell Latitude 14 5410-RJ80D i5-10310U, UHD Graphics 620 | 1.6 kg | 20.7 mm | 14.00" | 1920x1080 |
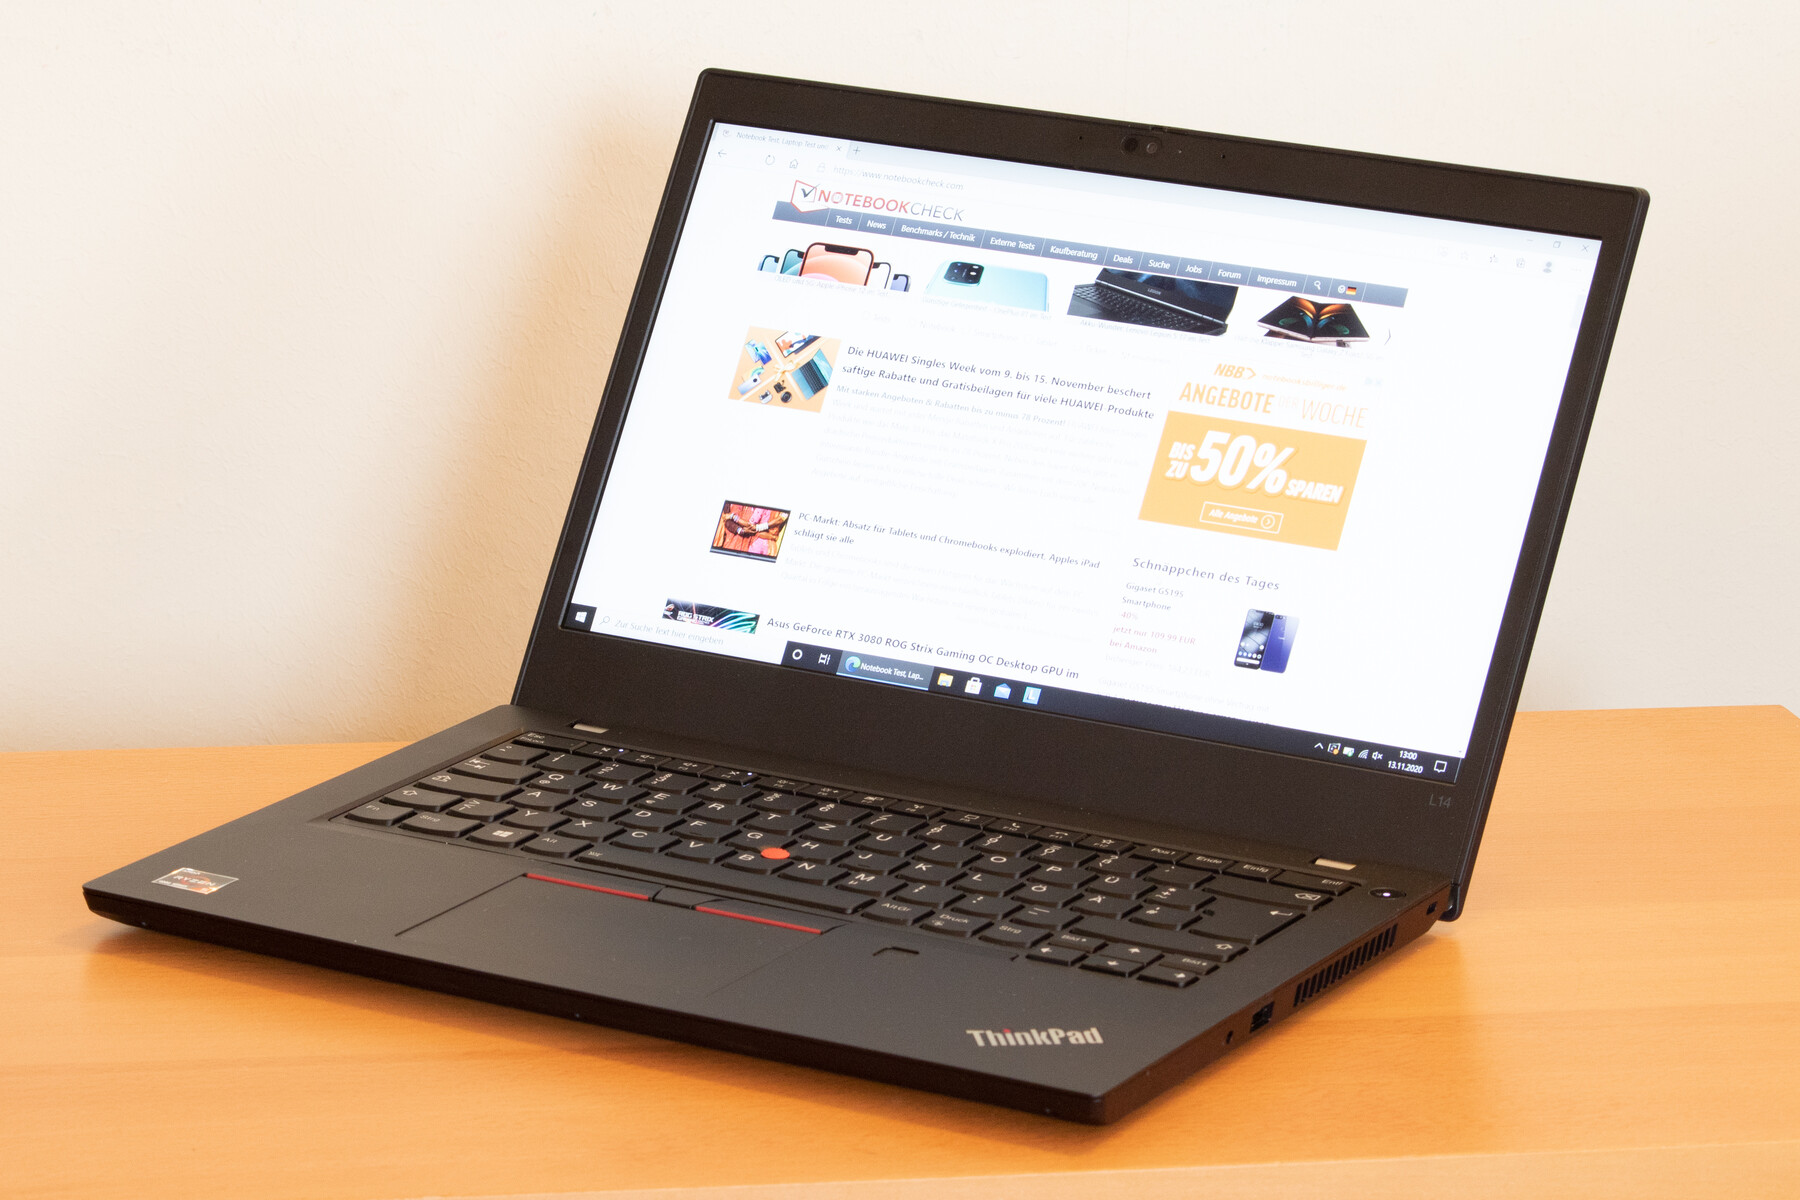
Durum - Tipik ThinkPad
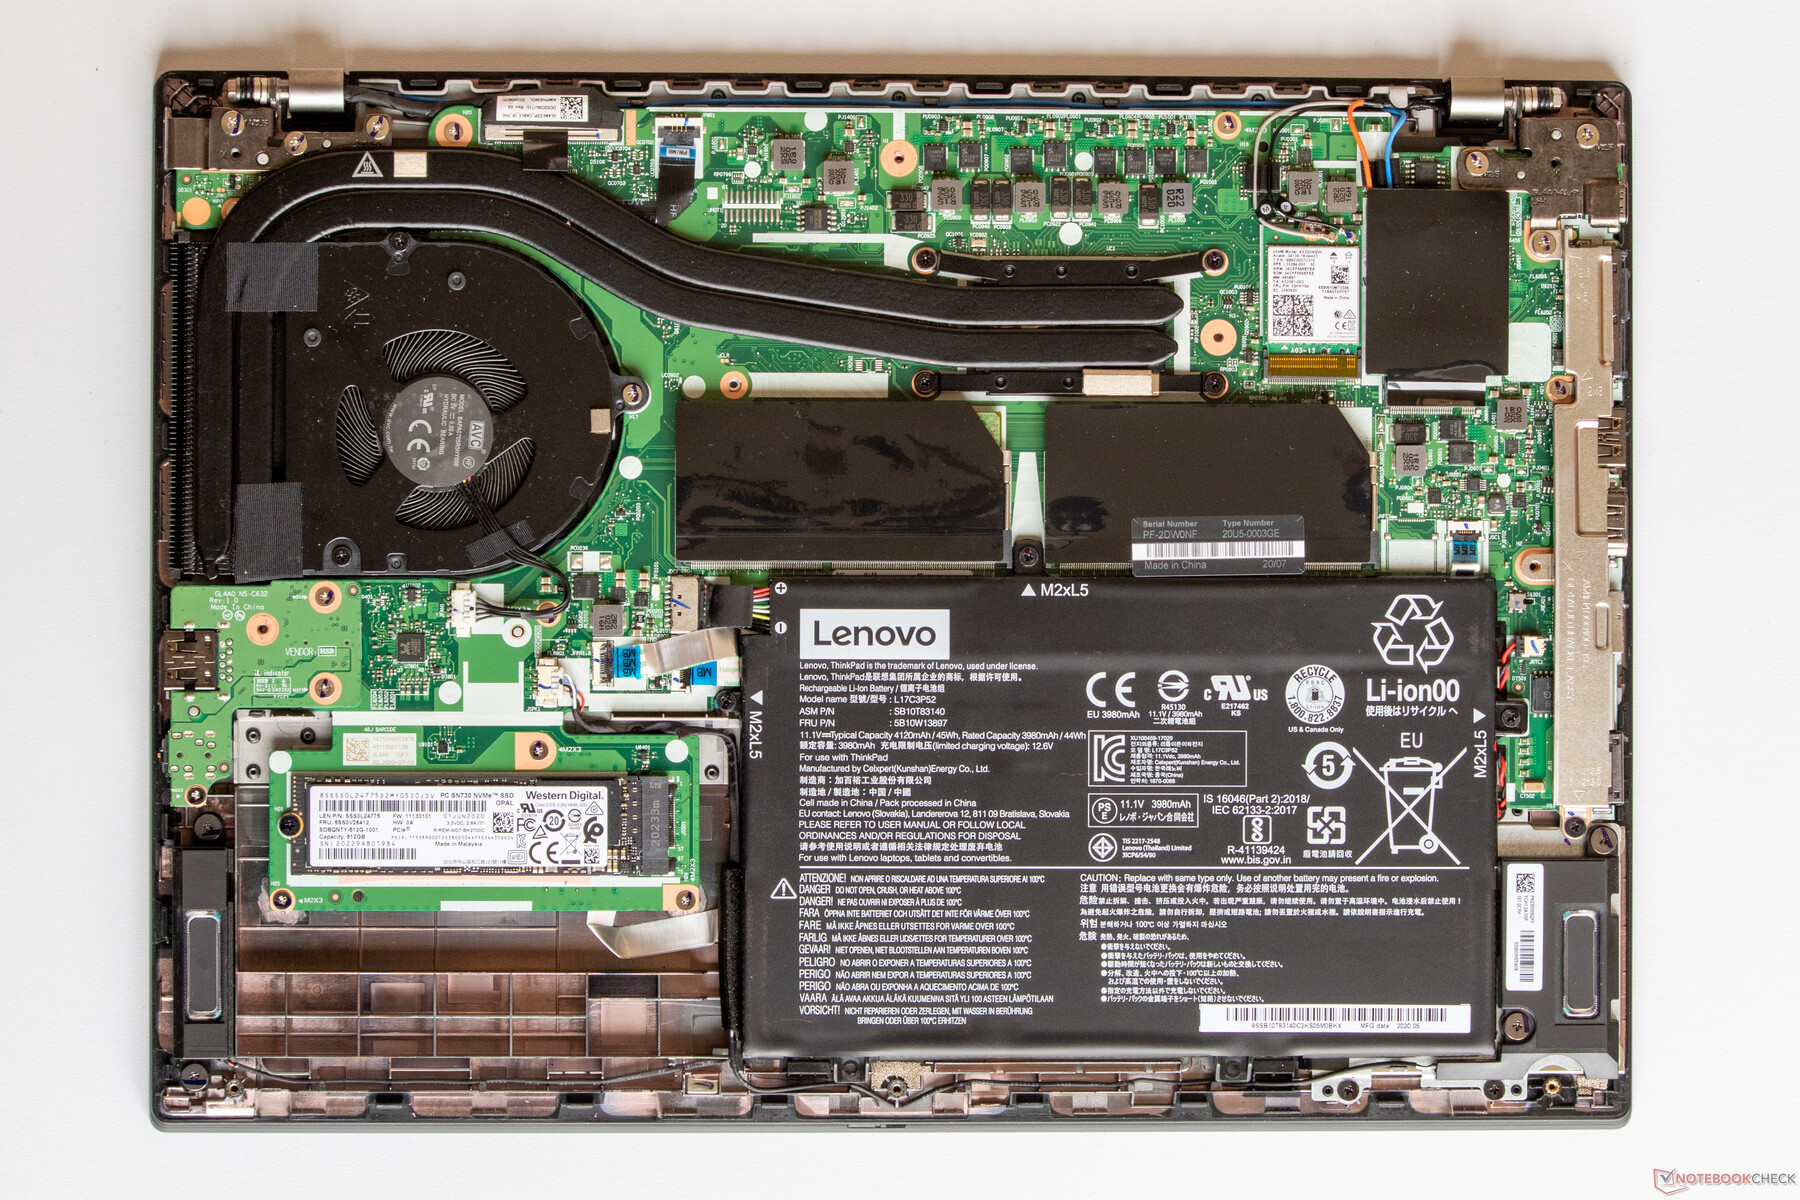
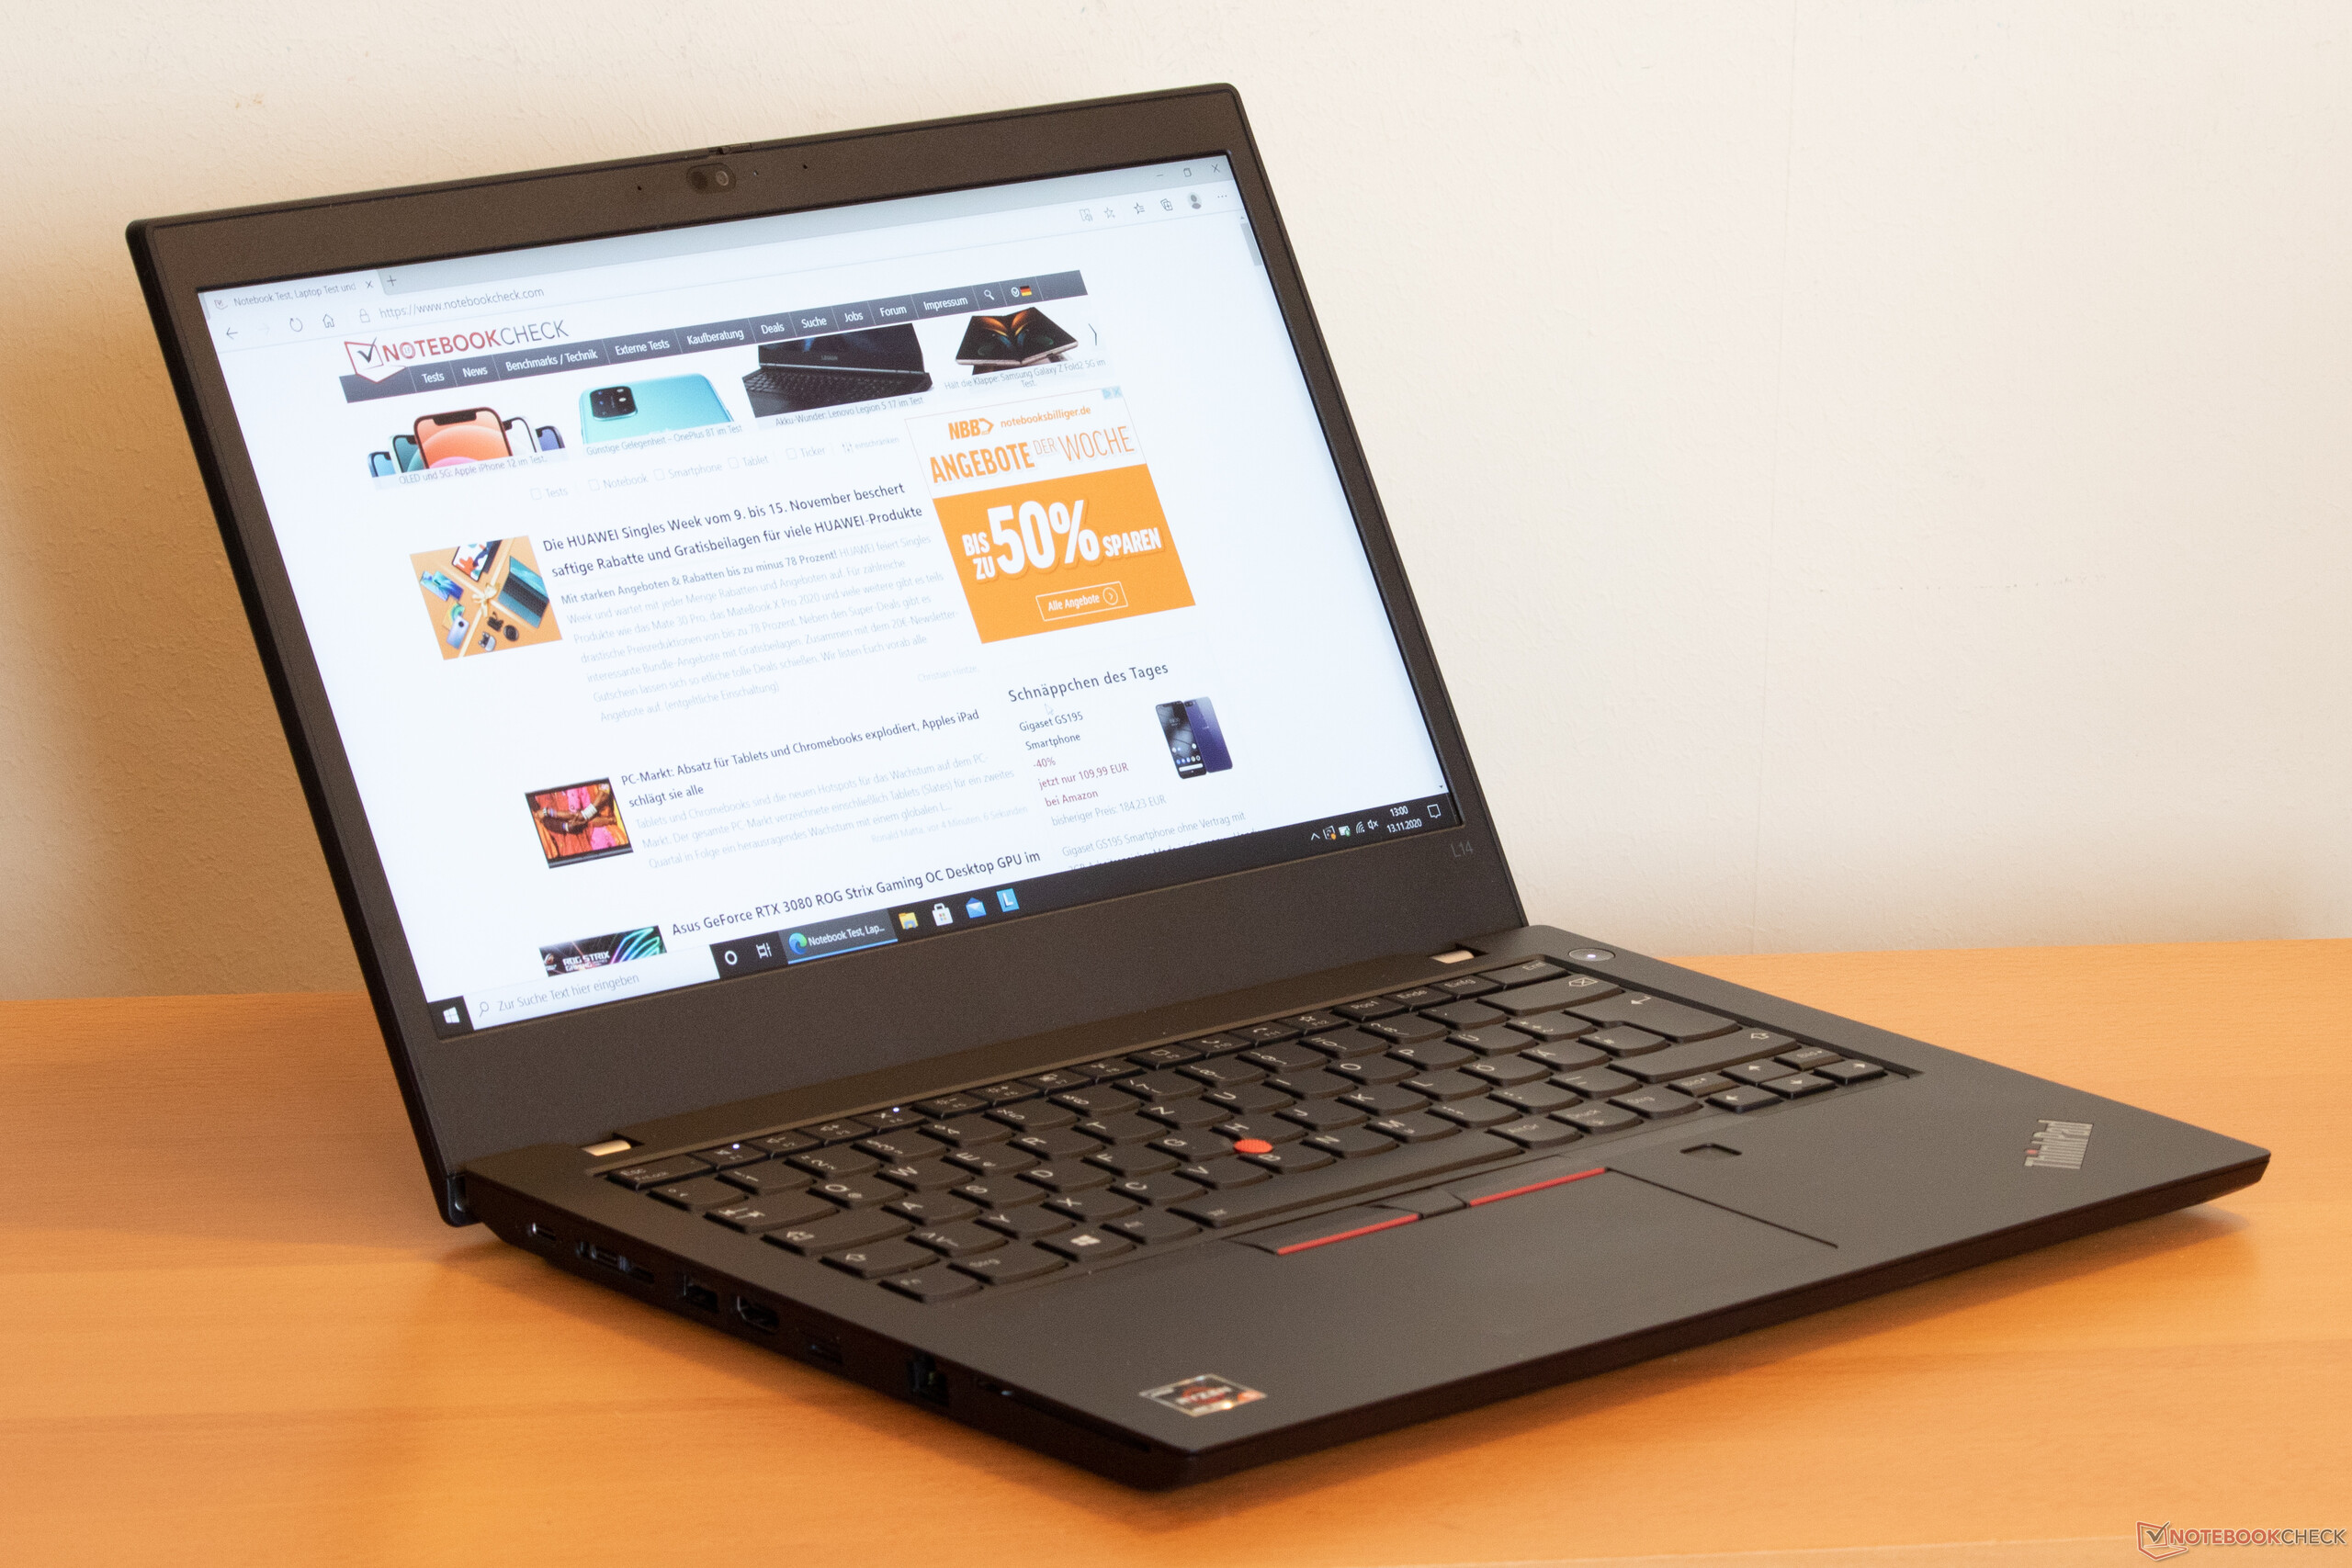
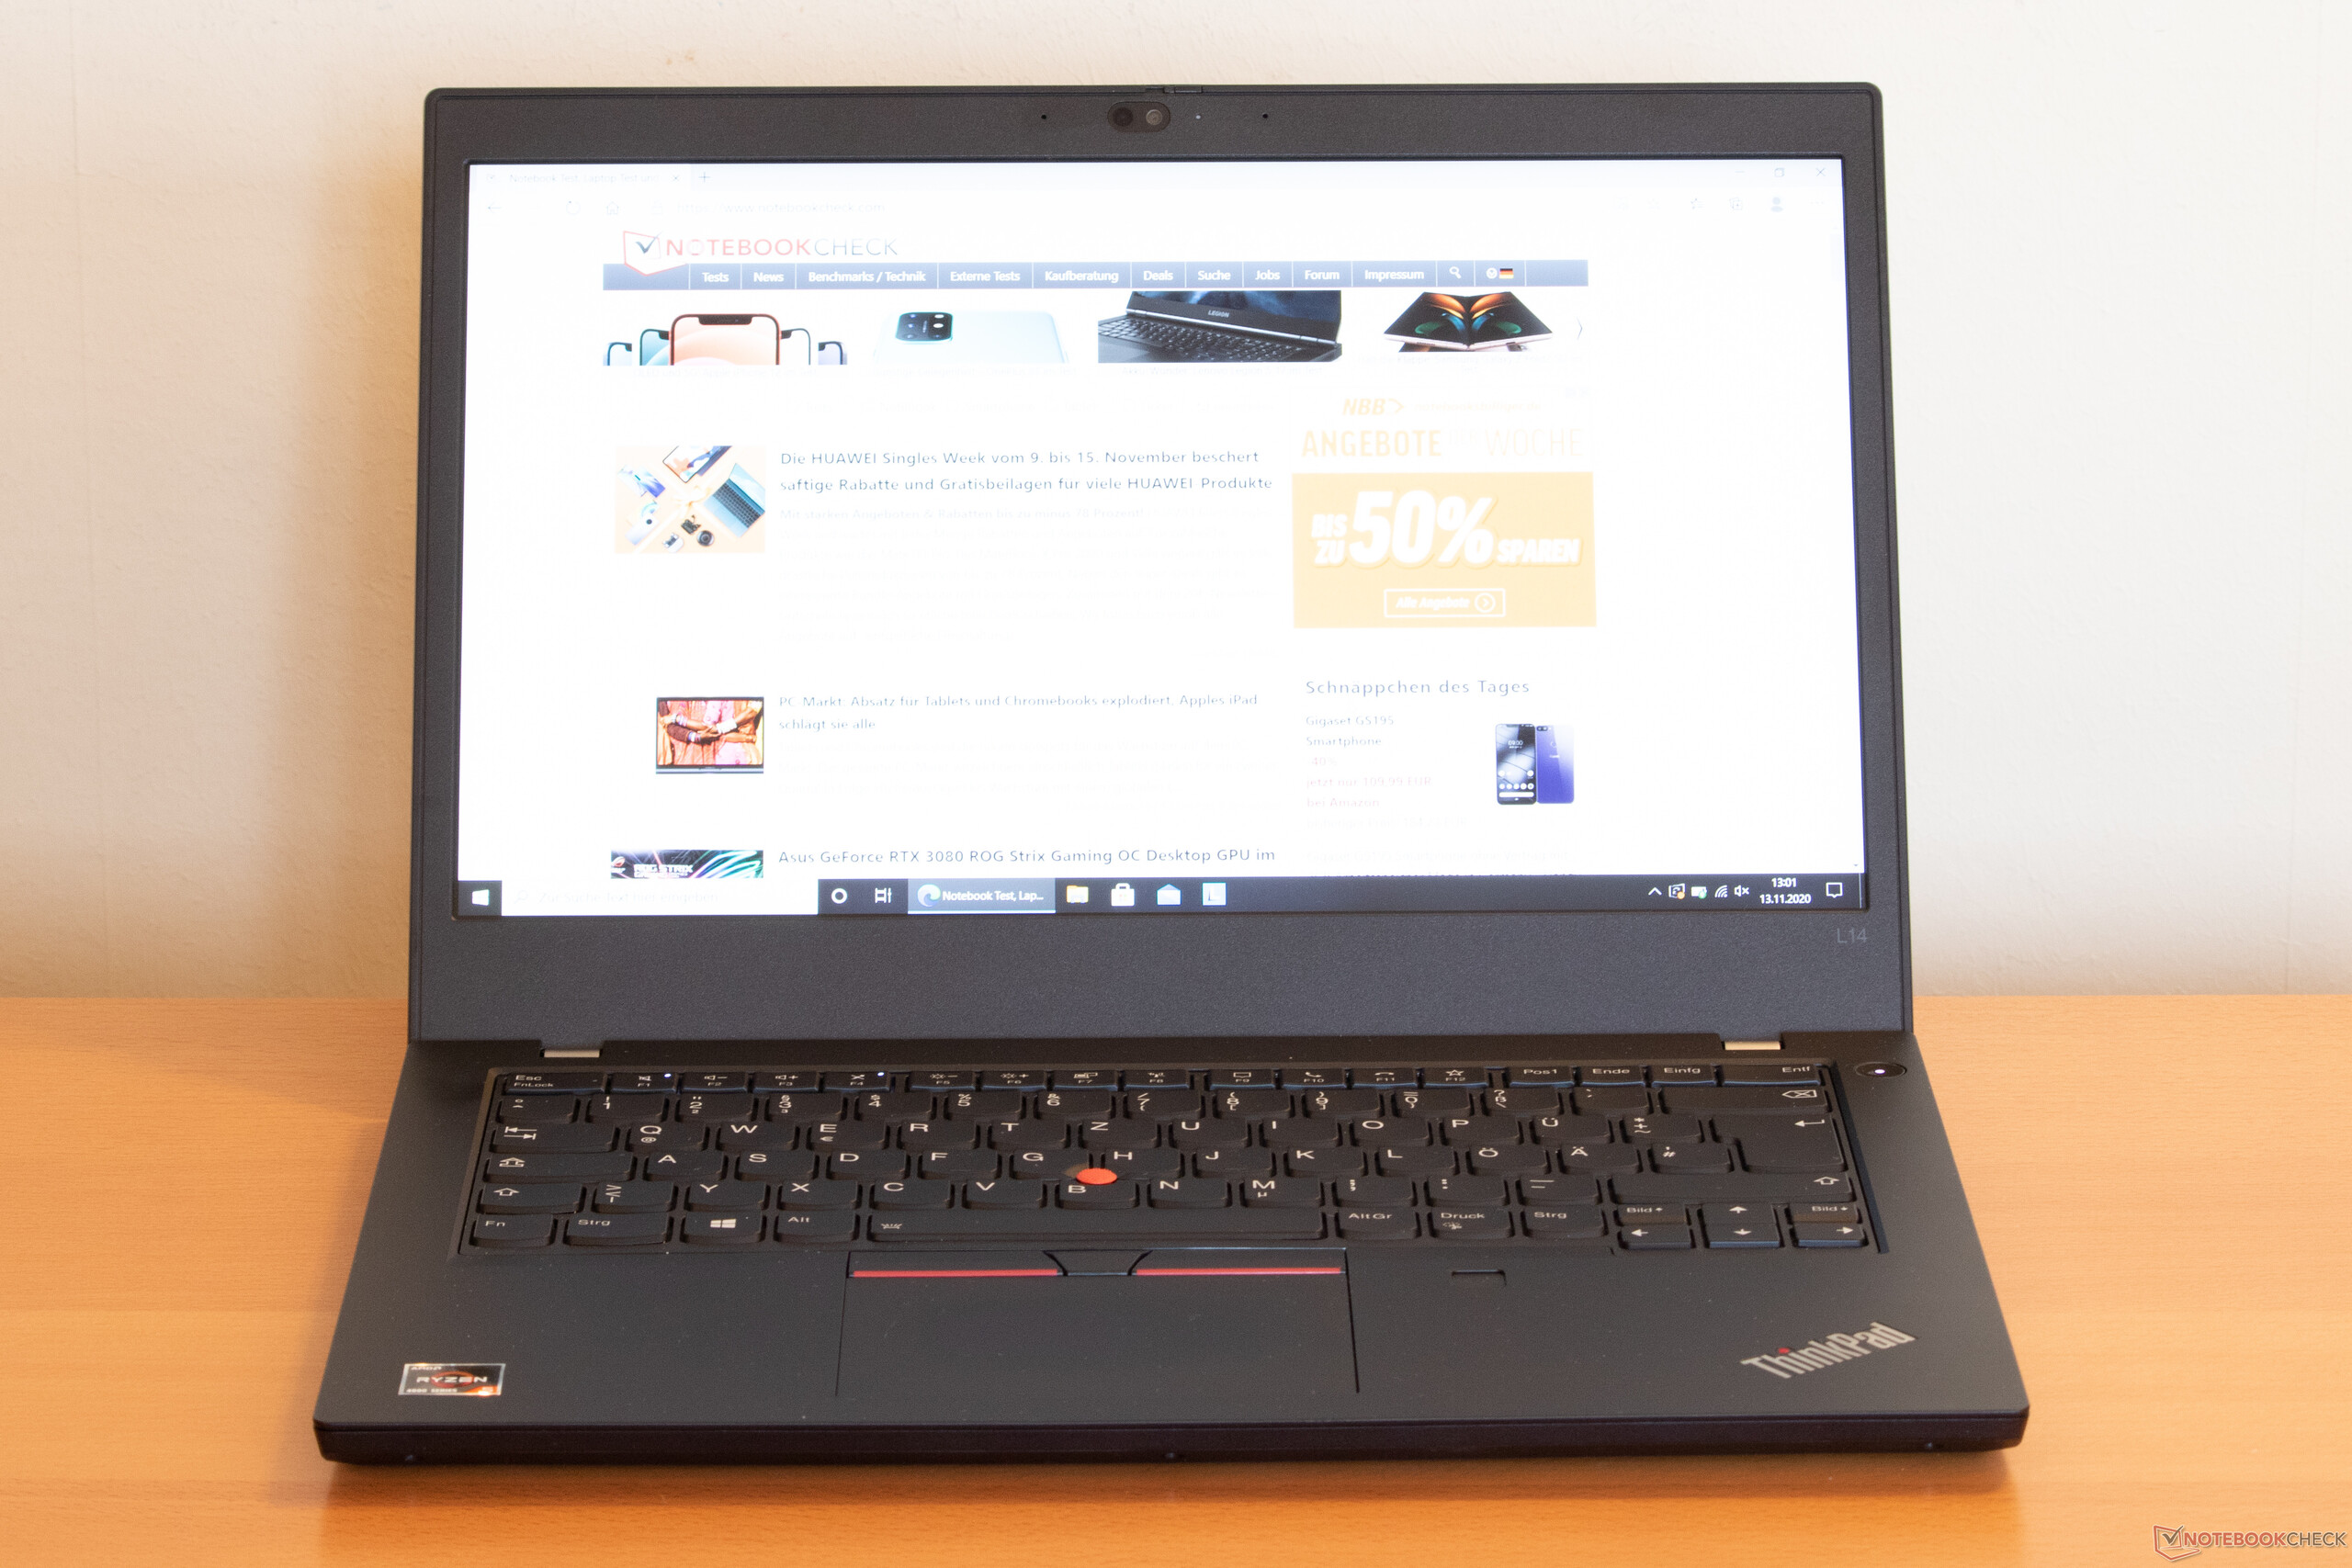
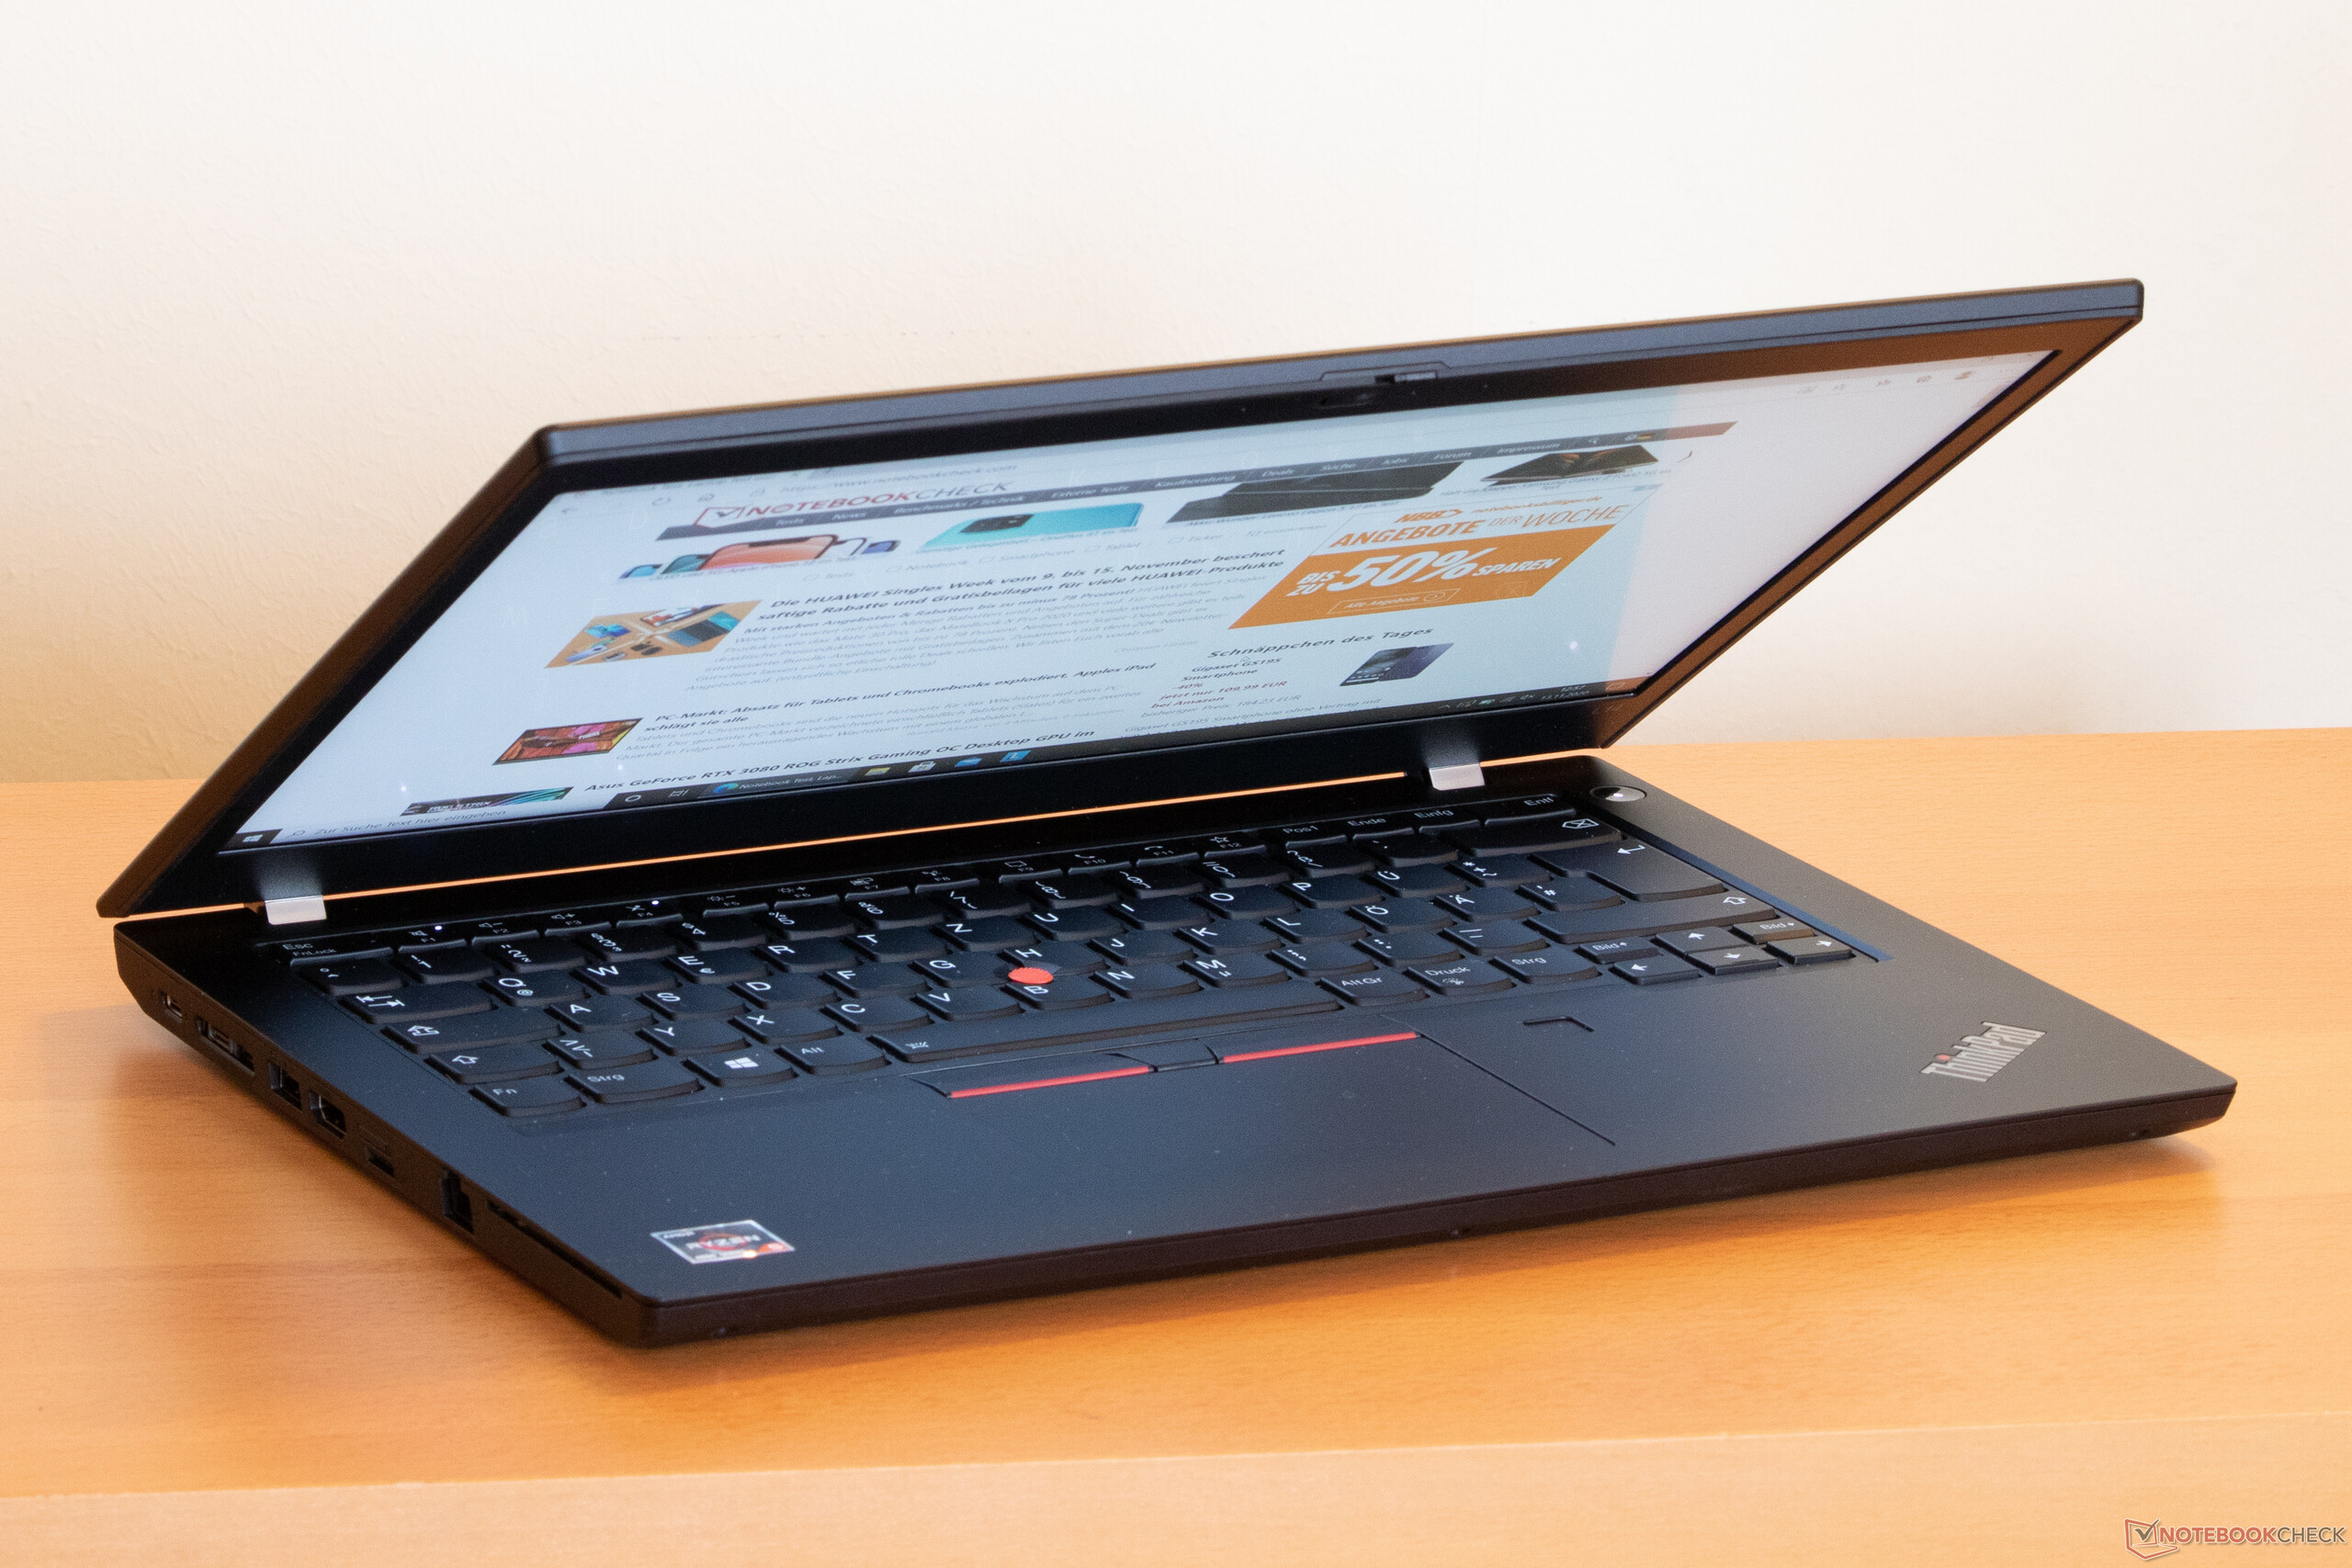
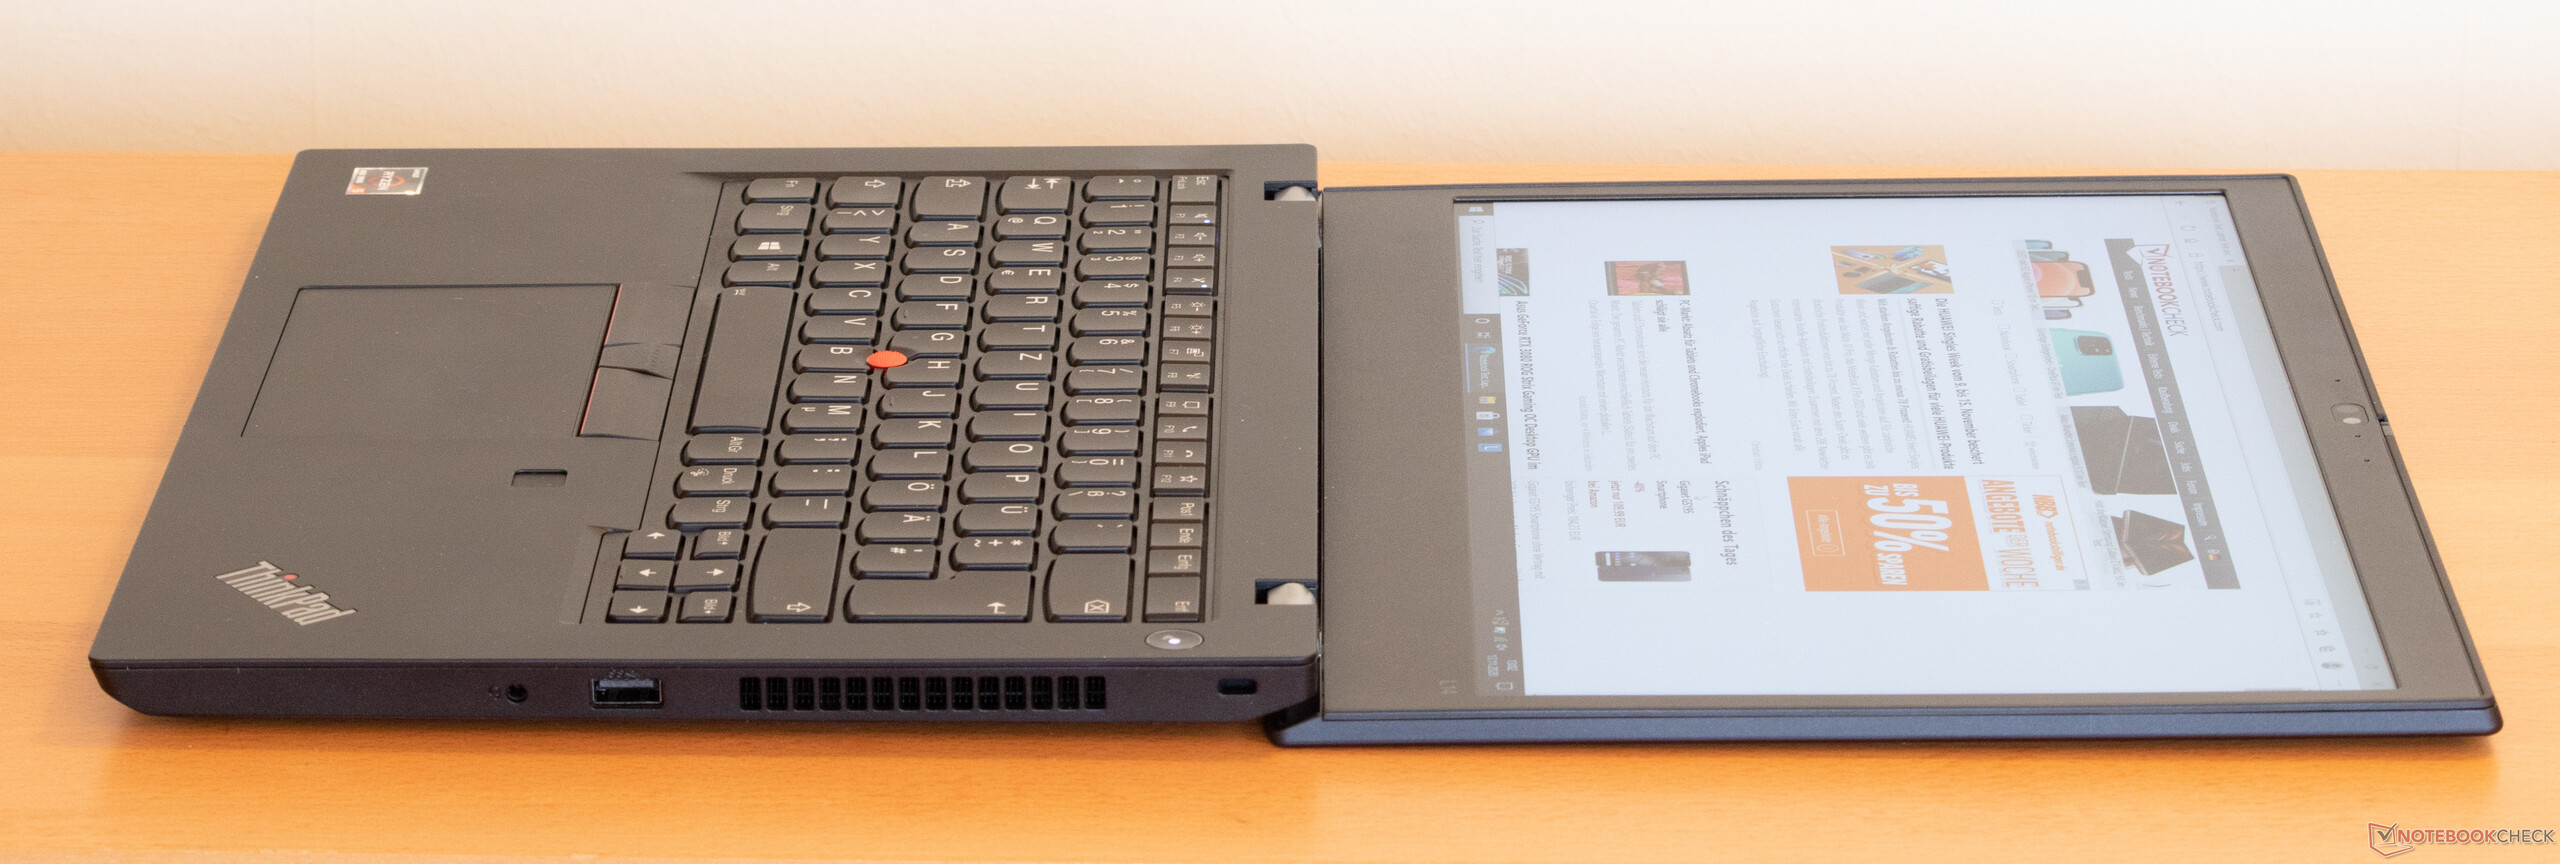
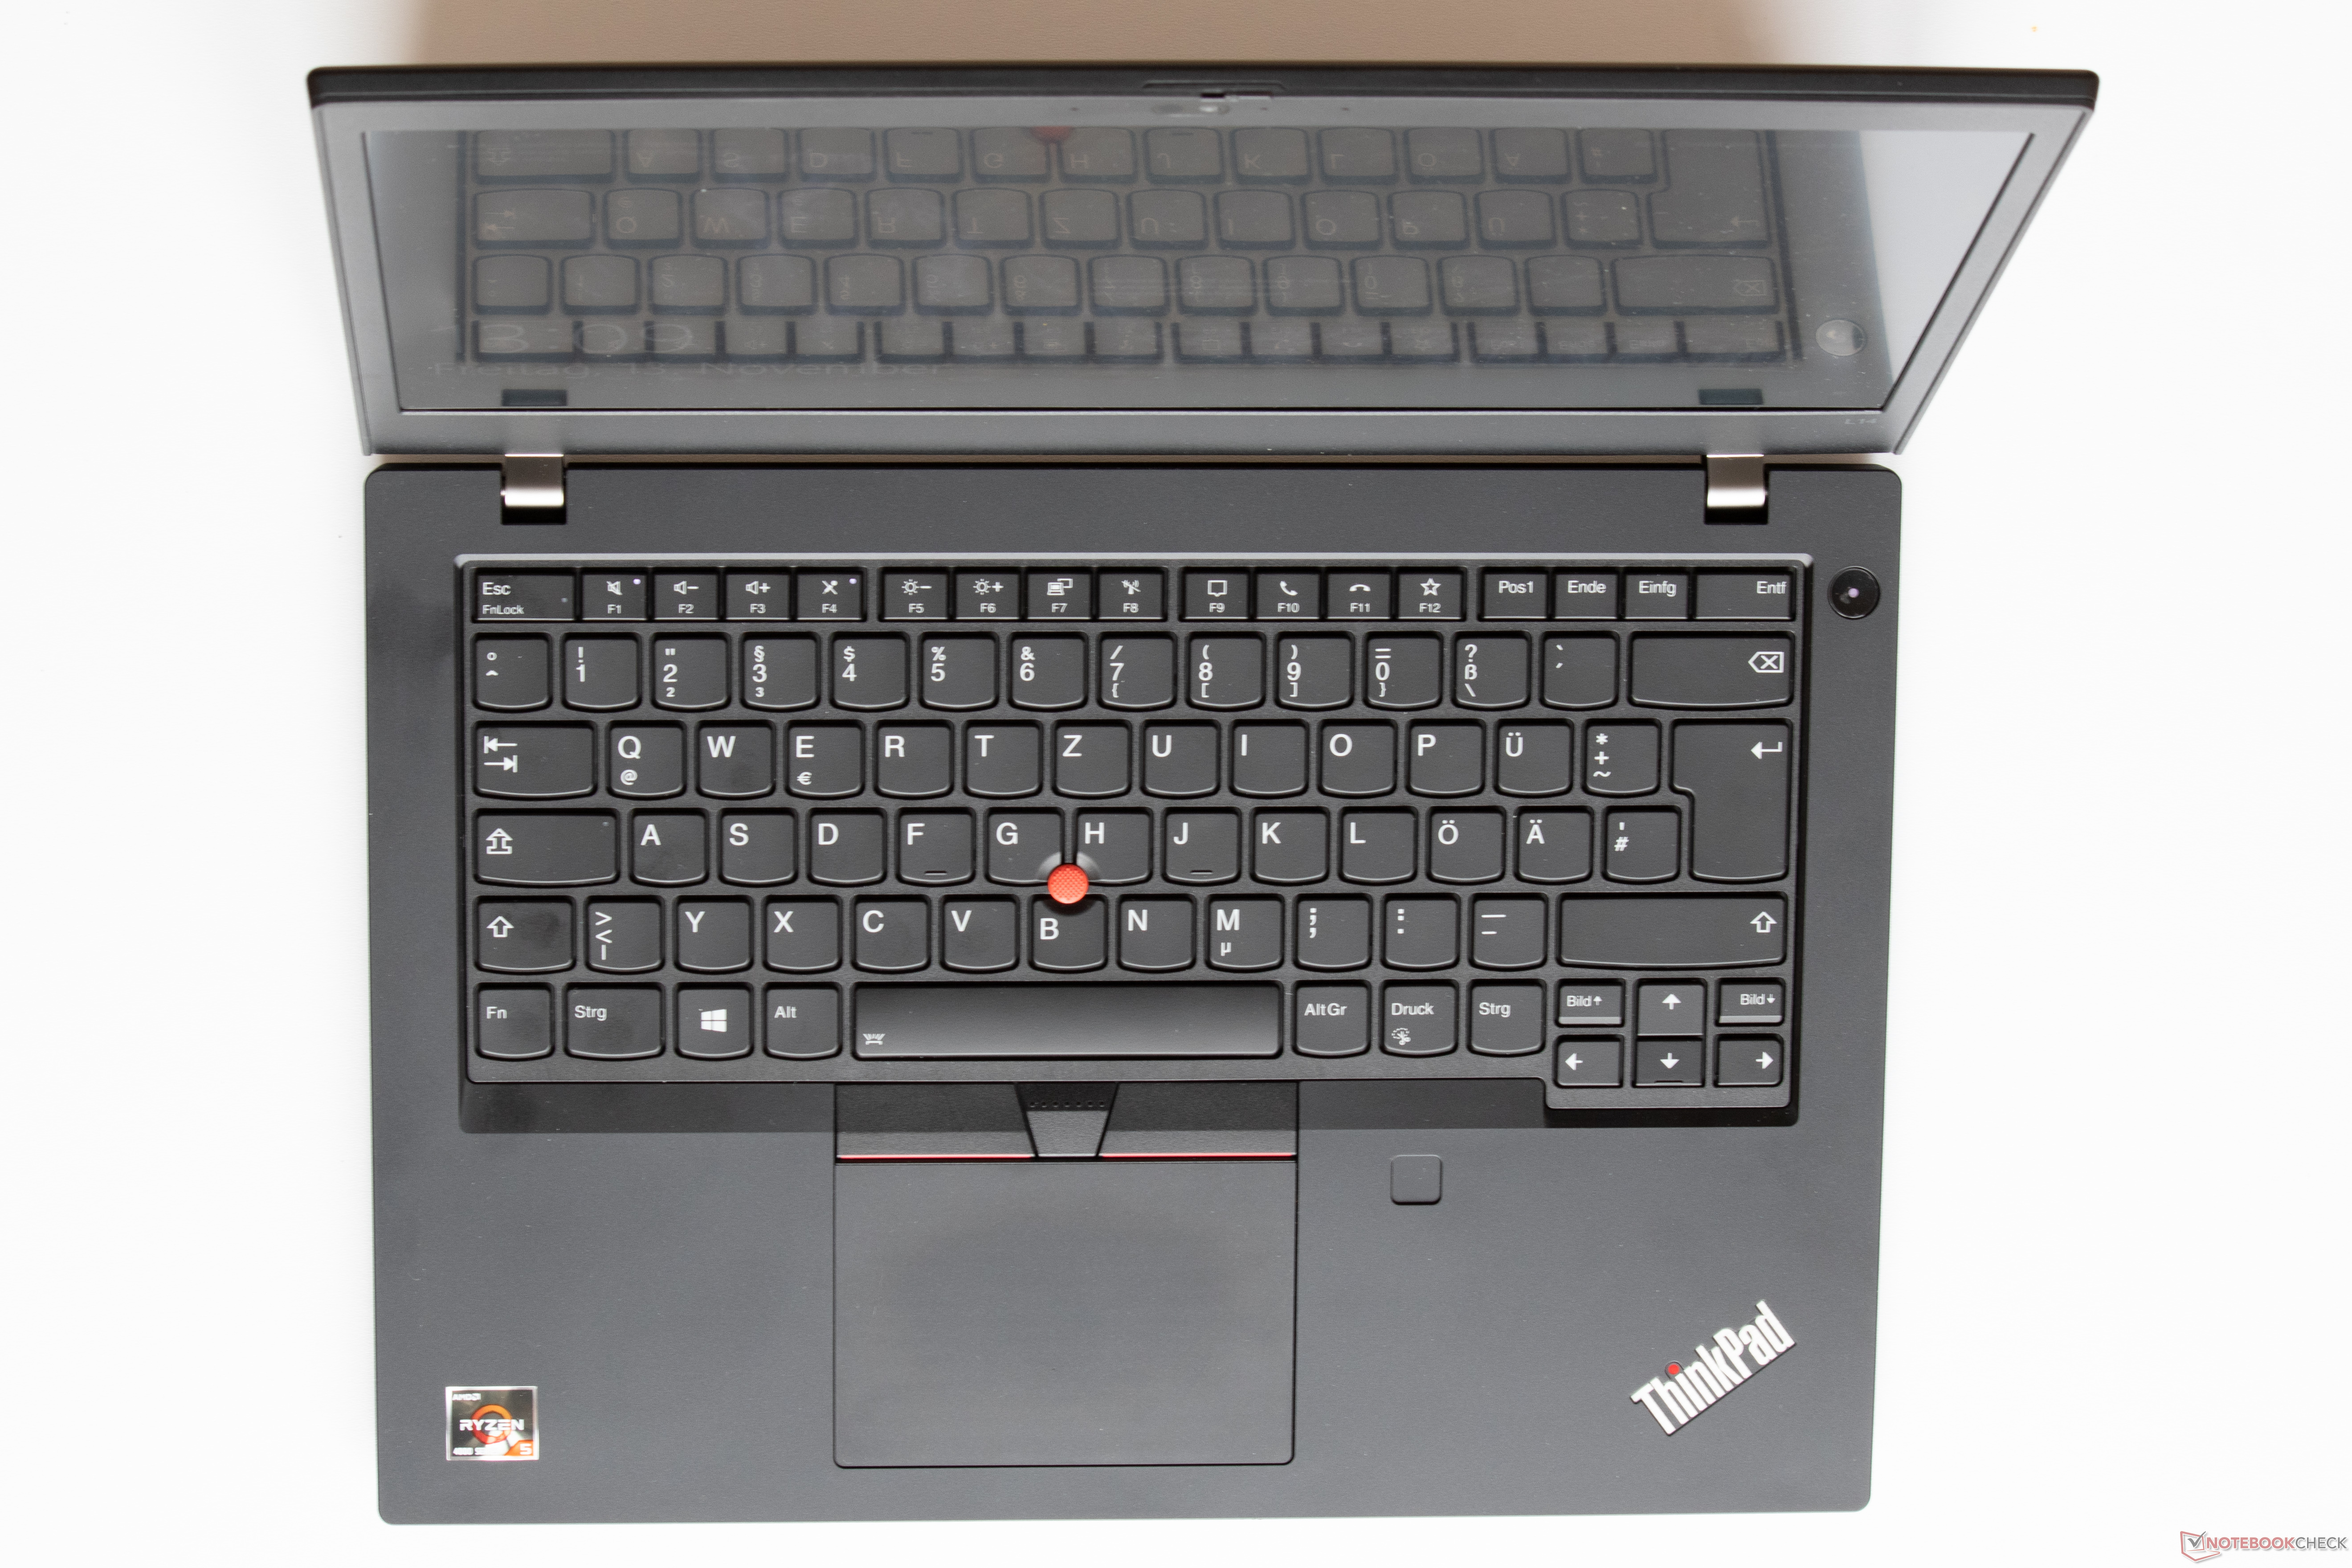
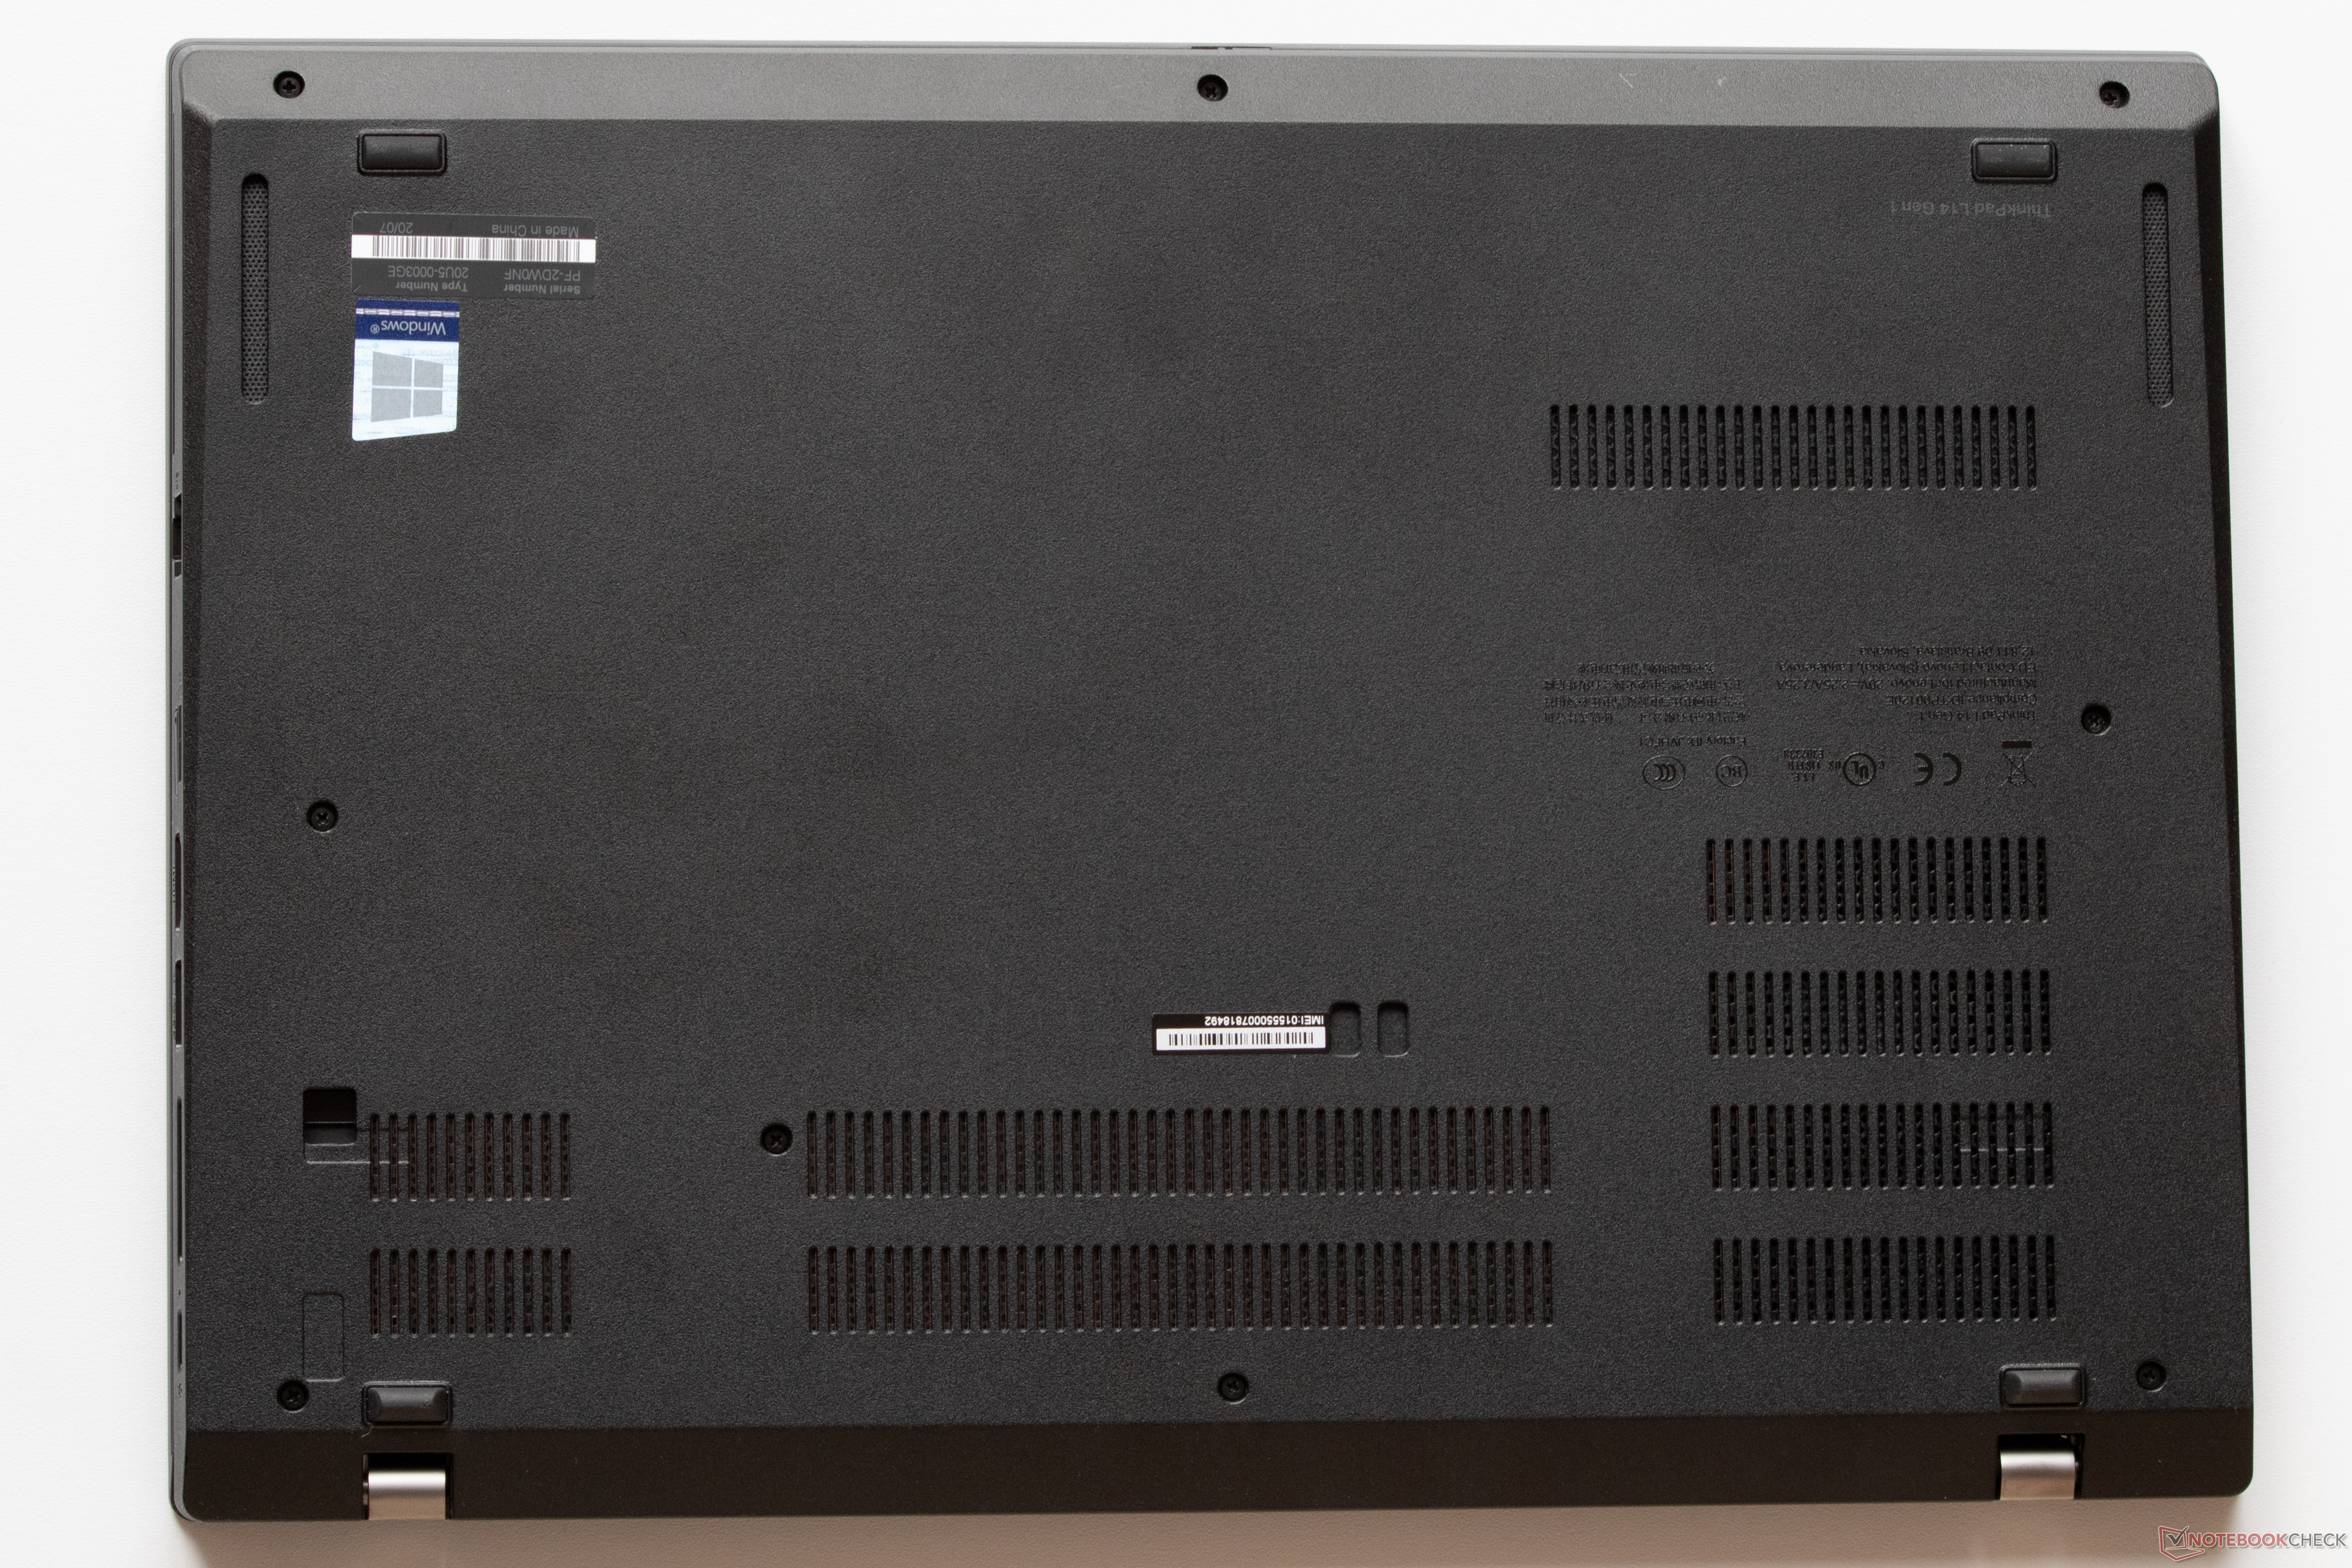
Lenovo'dan beklendiği gibi genel yapı kalitesi sağlam. ThinkPad L14 önemli ölçüde gıcırdıyor ya da bükülmüyor ve 14 inçlik kasanın tüm üst kısmı, parmak izlerini çekmesine rağmen pürüzlü plastikten yapılmıştır. İnce ekran çerçeveleri hafif lastikle kaplanmıştır ve ekran kapağı kapalıyken avuç içi dayanaklarıyla aynı hizada oturur. İki menteşe sağlamdır ve tek elle açılmanın mümkün kalmasını sağlamak için gereken mükemmel miktarda direnci sunar. Maksimum açılma açısı 180 derecedir. Alt panelin birkaç vida sökülerek kolayca çıkarılabileceği düşünüldüğünde, bu modelde bakım basit ve kolaydır. Bu, 64 GB'a kadar yükseltilebilen RAM gibi en önemli bileşenlere erişmenizi sağlayacaktır. Pil maalesef kullanıcı tarafından değiştirilemez.
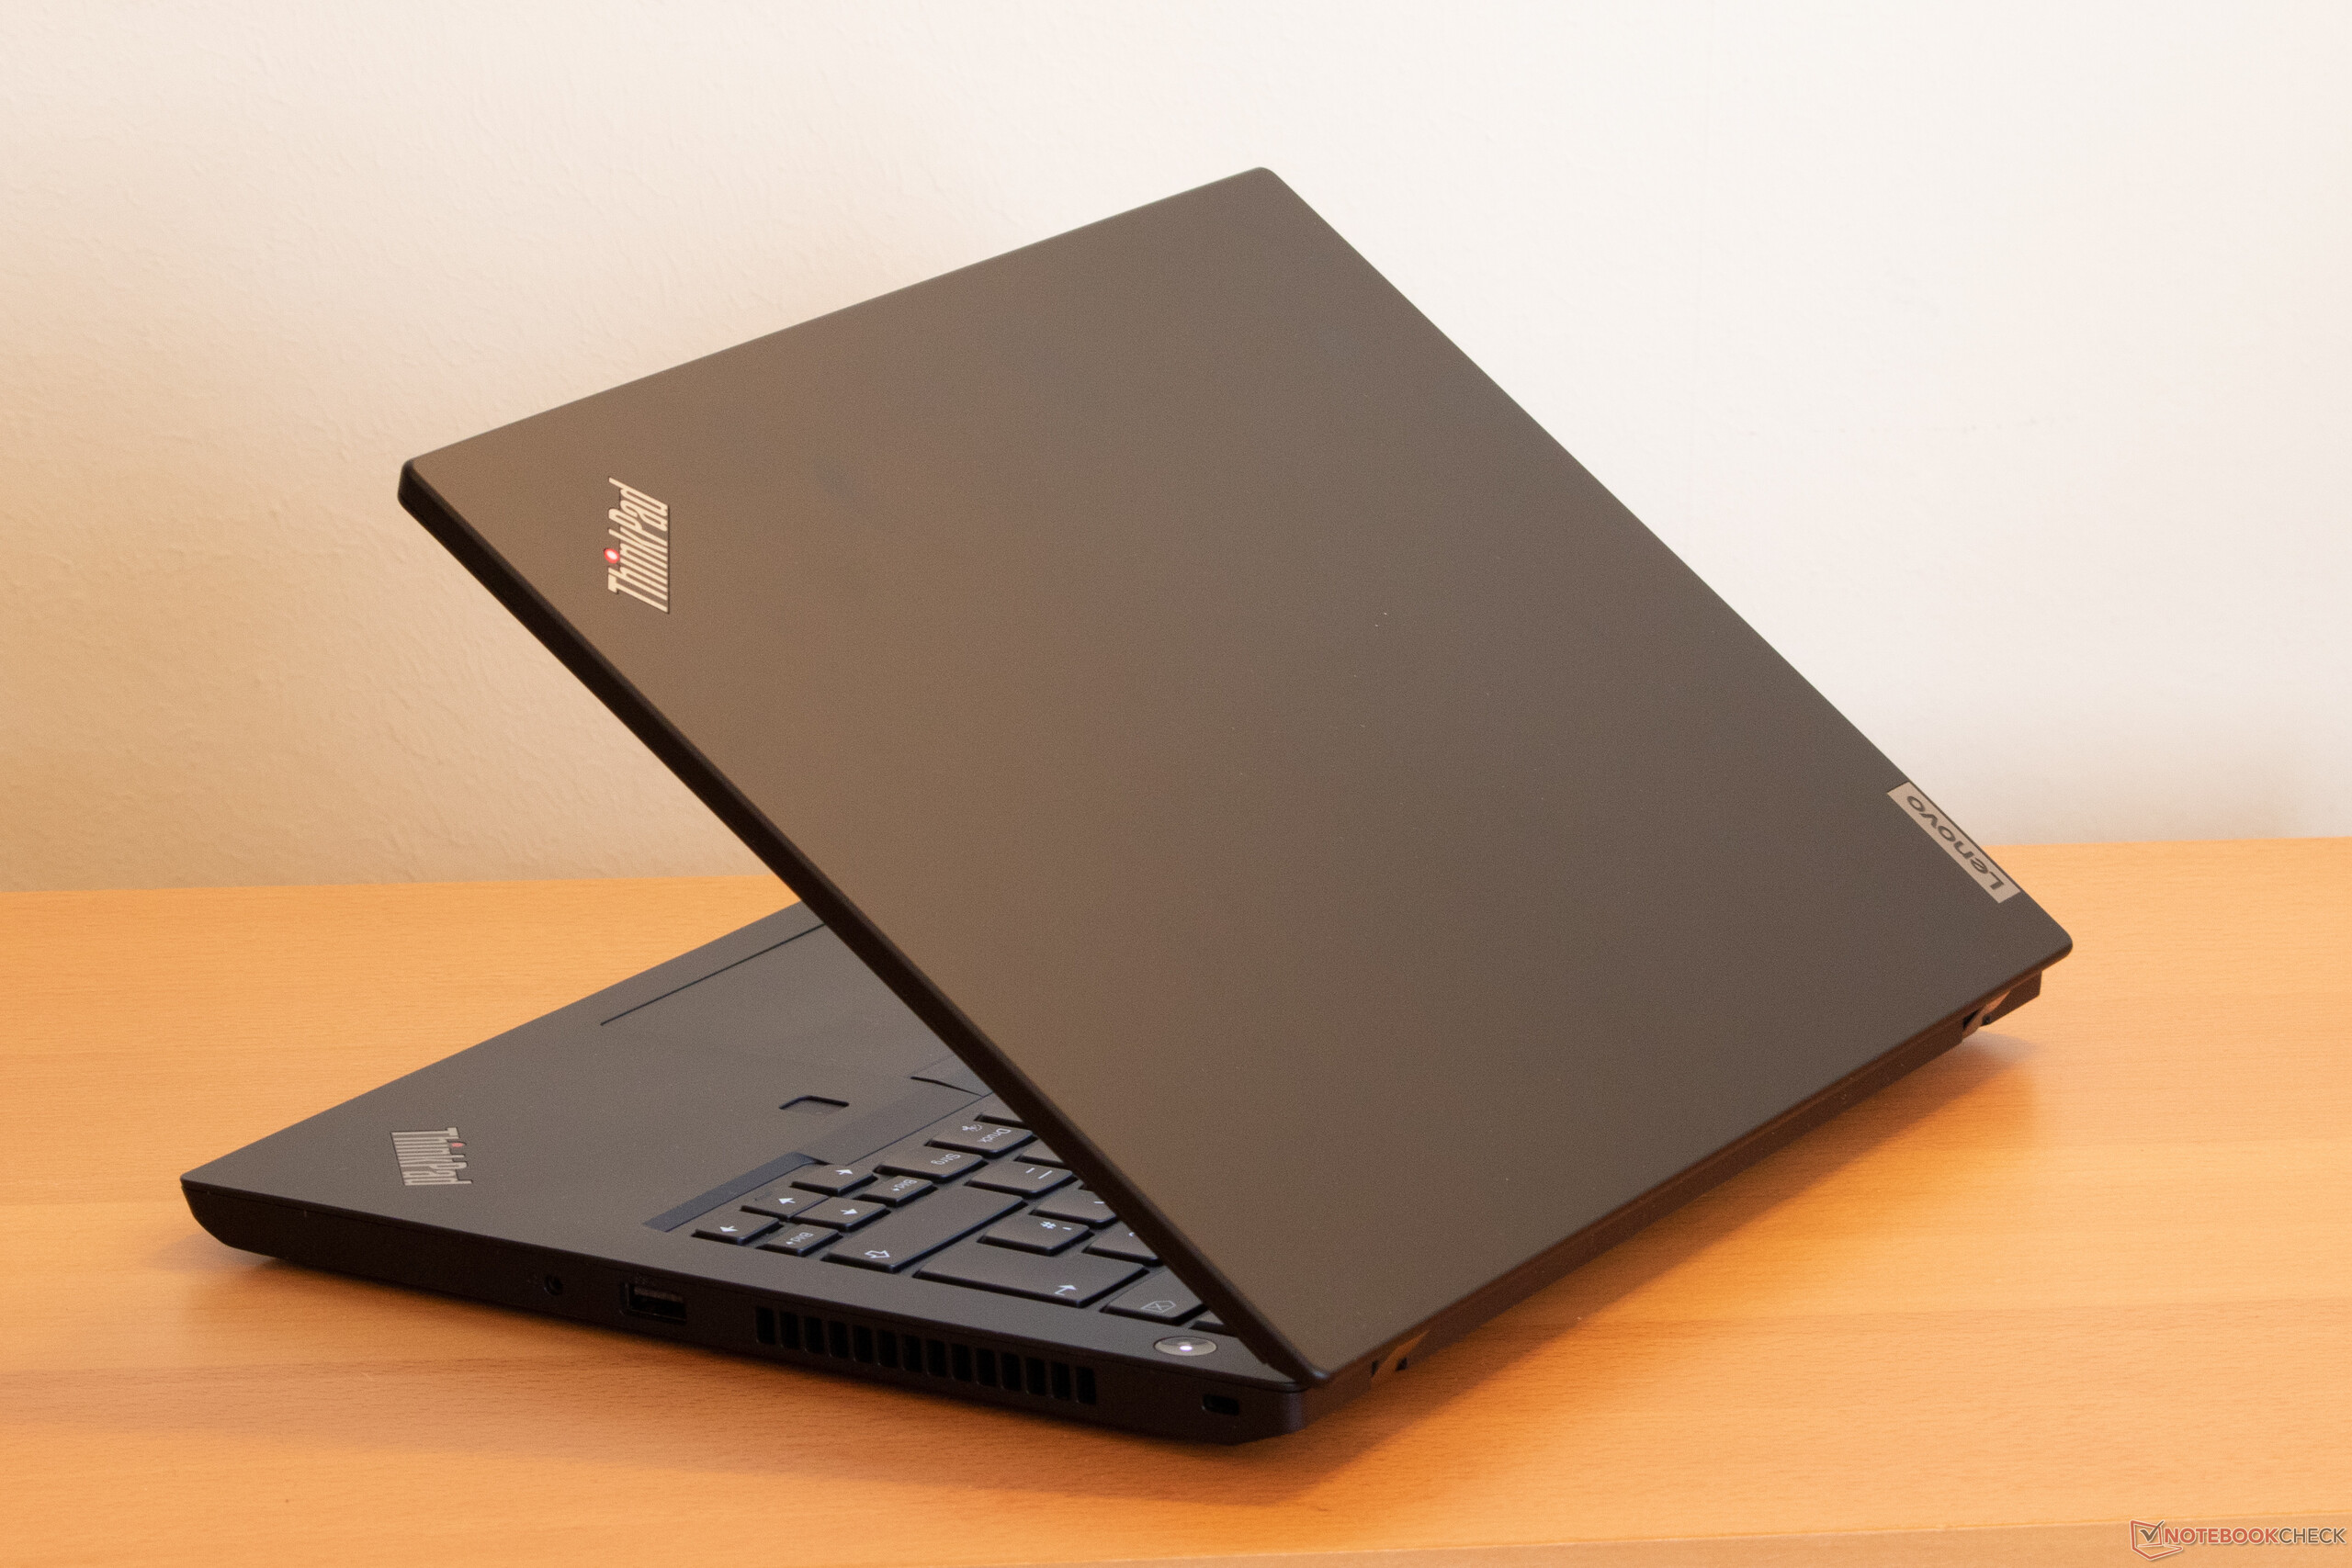
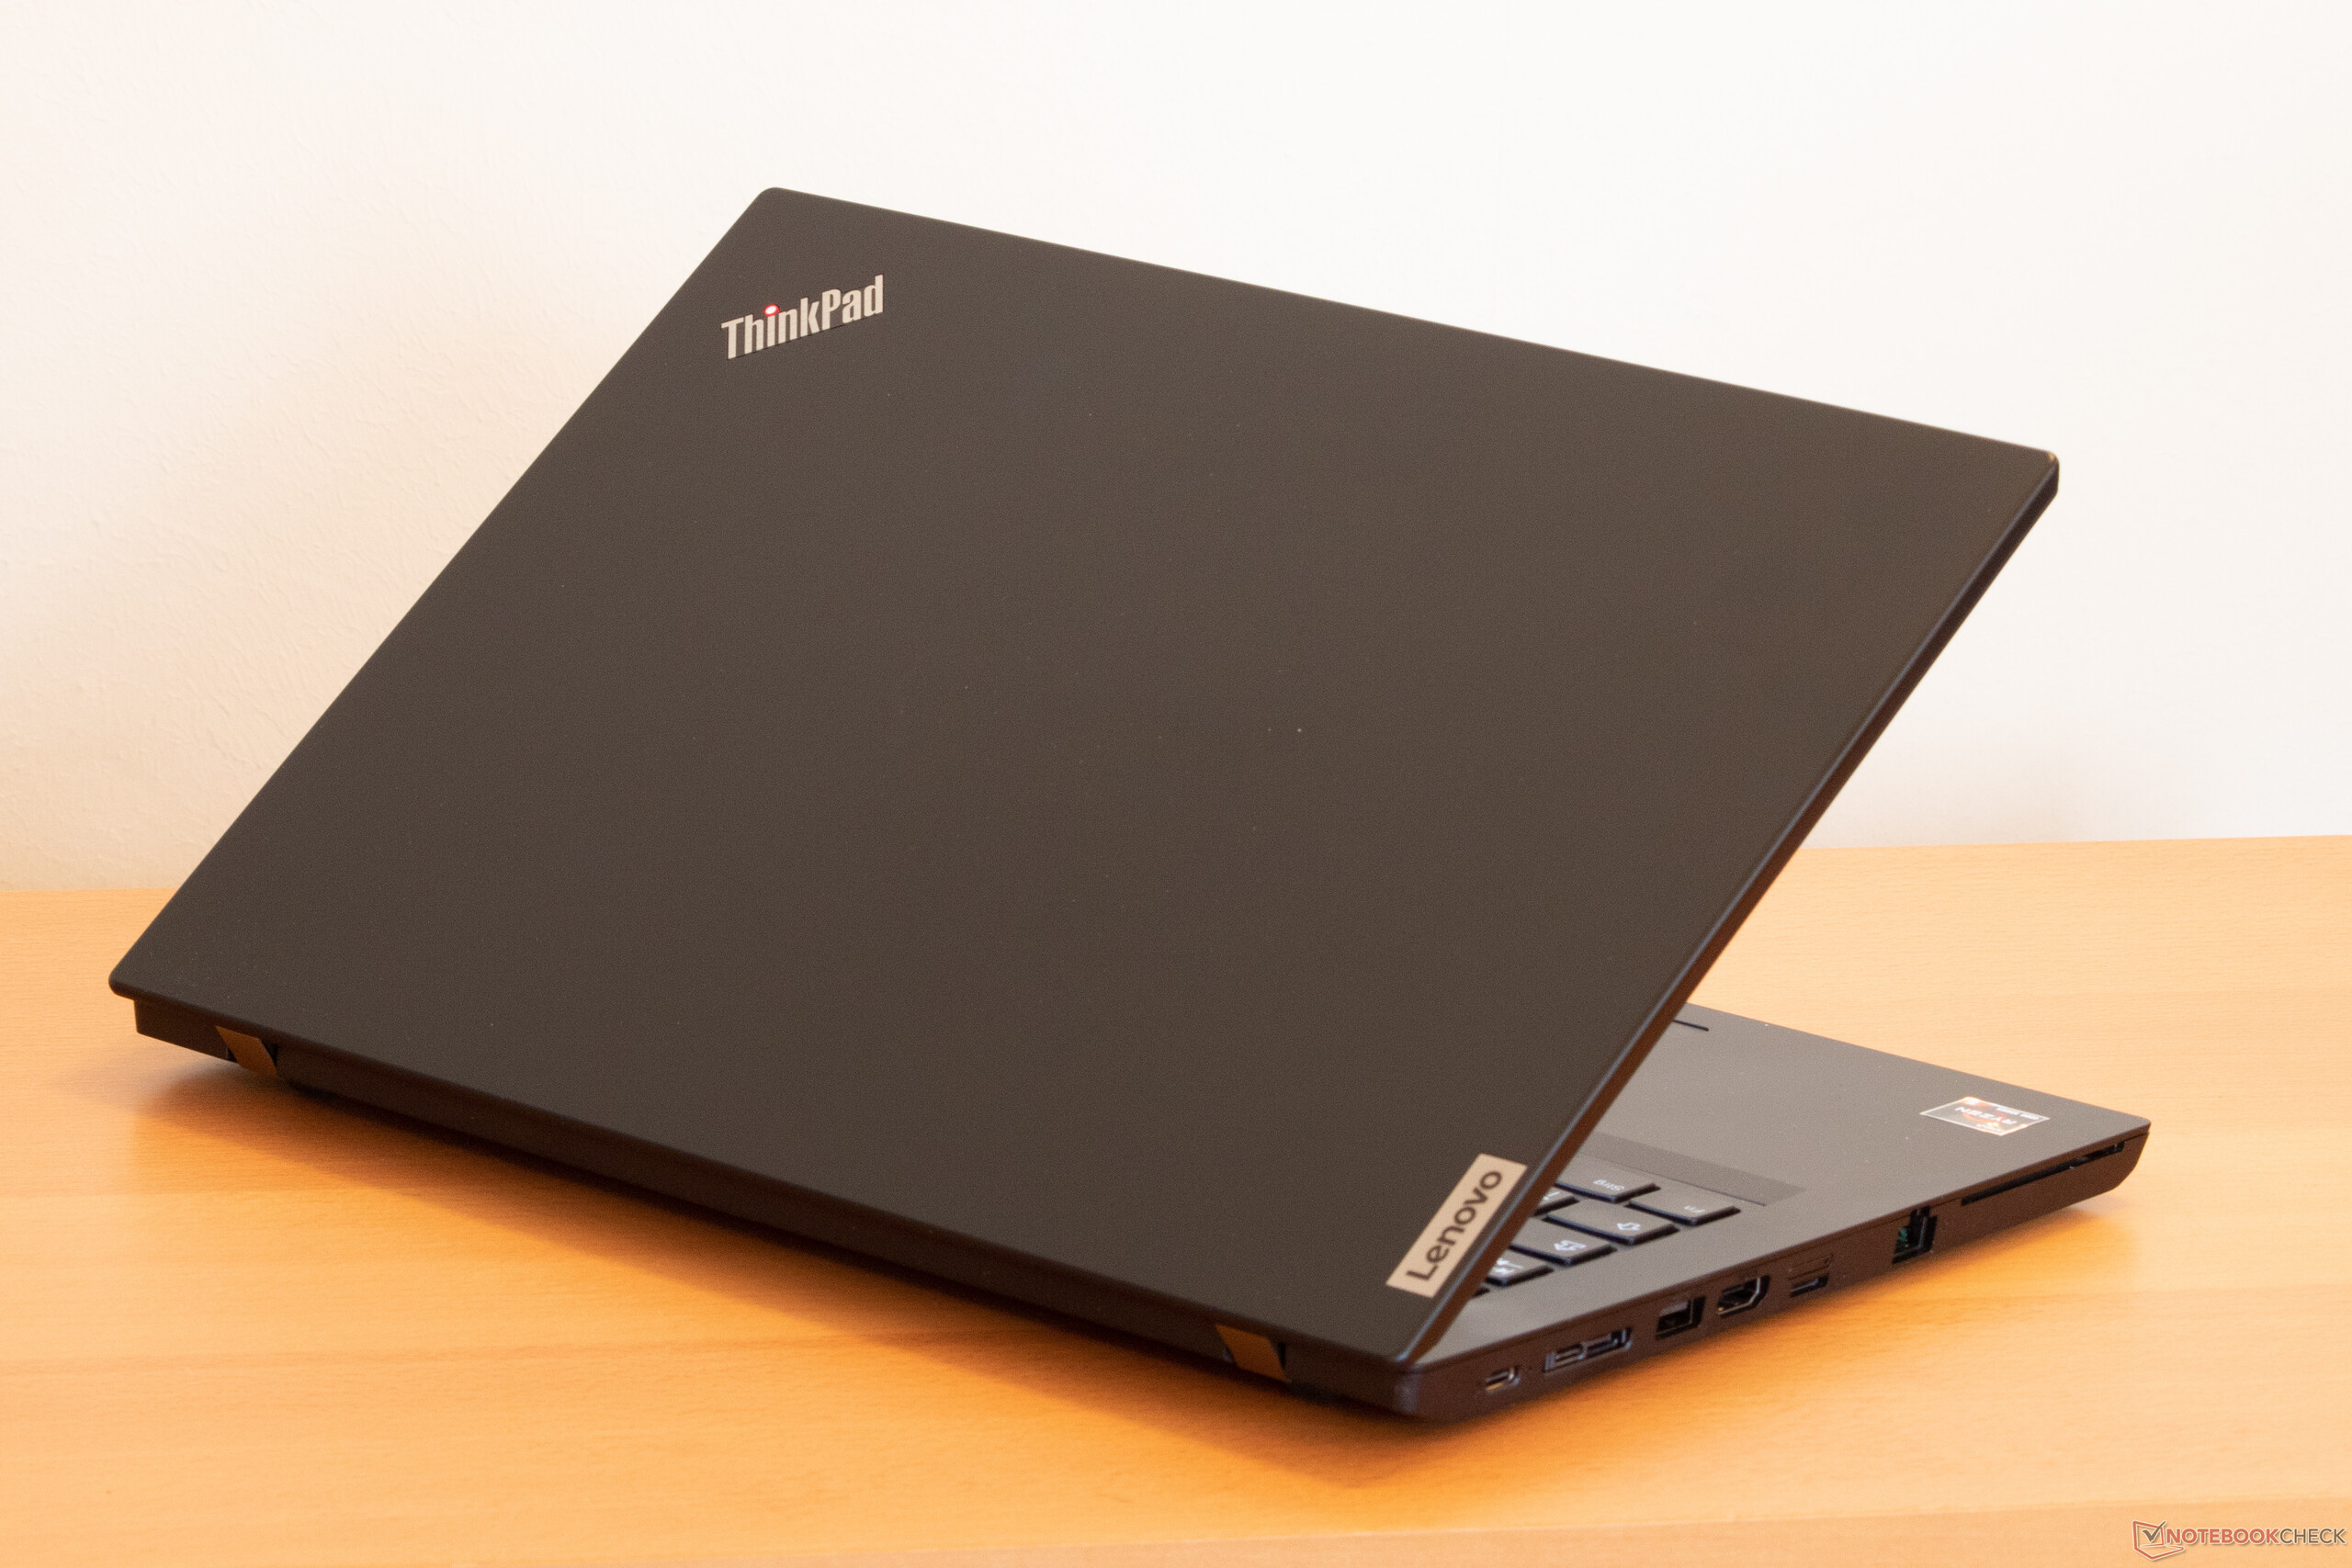
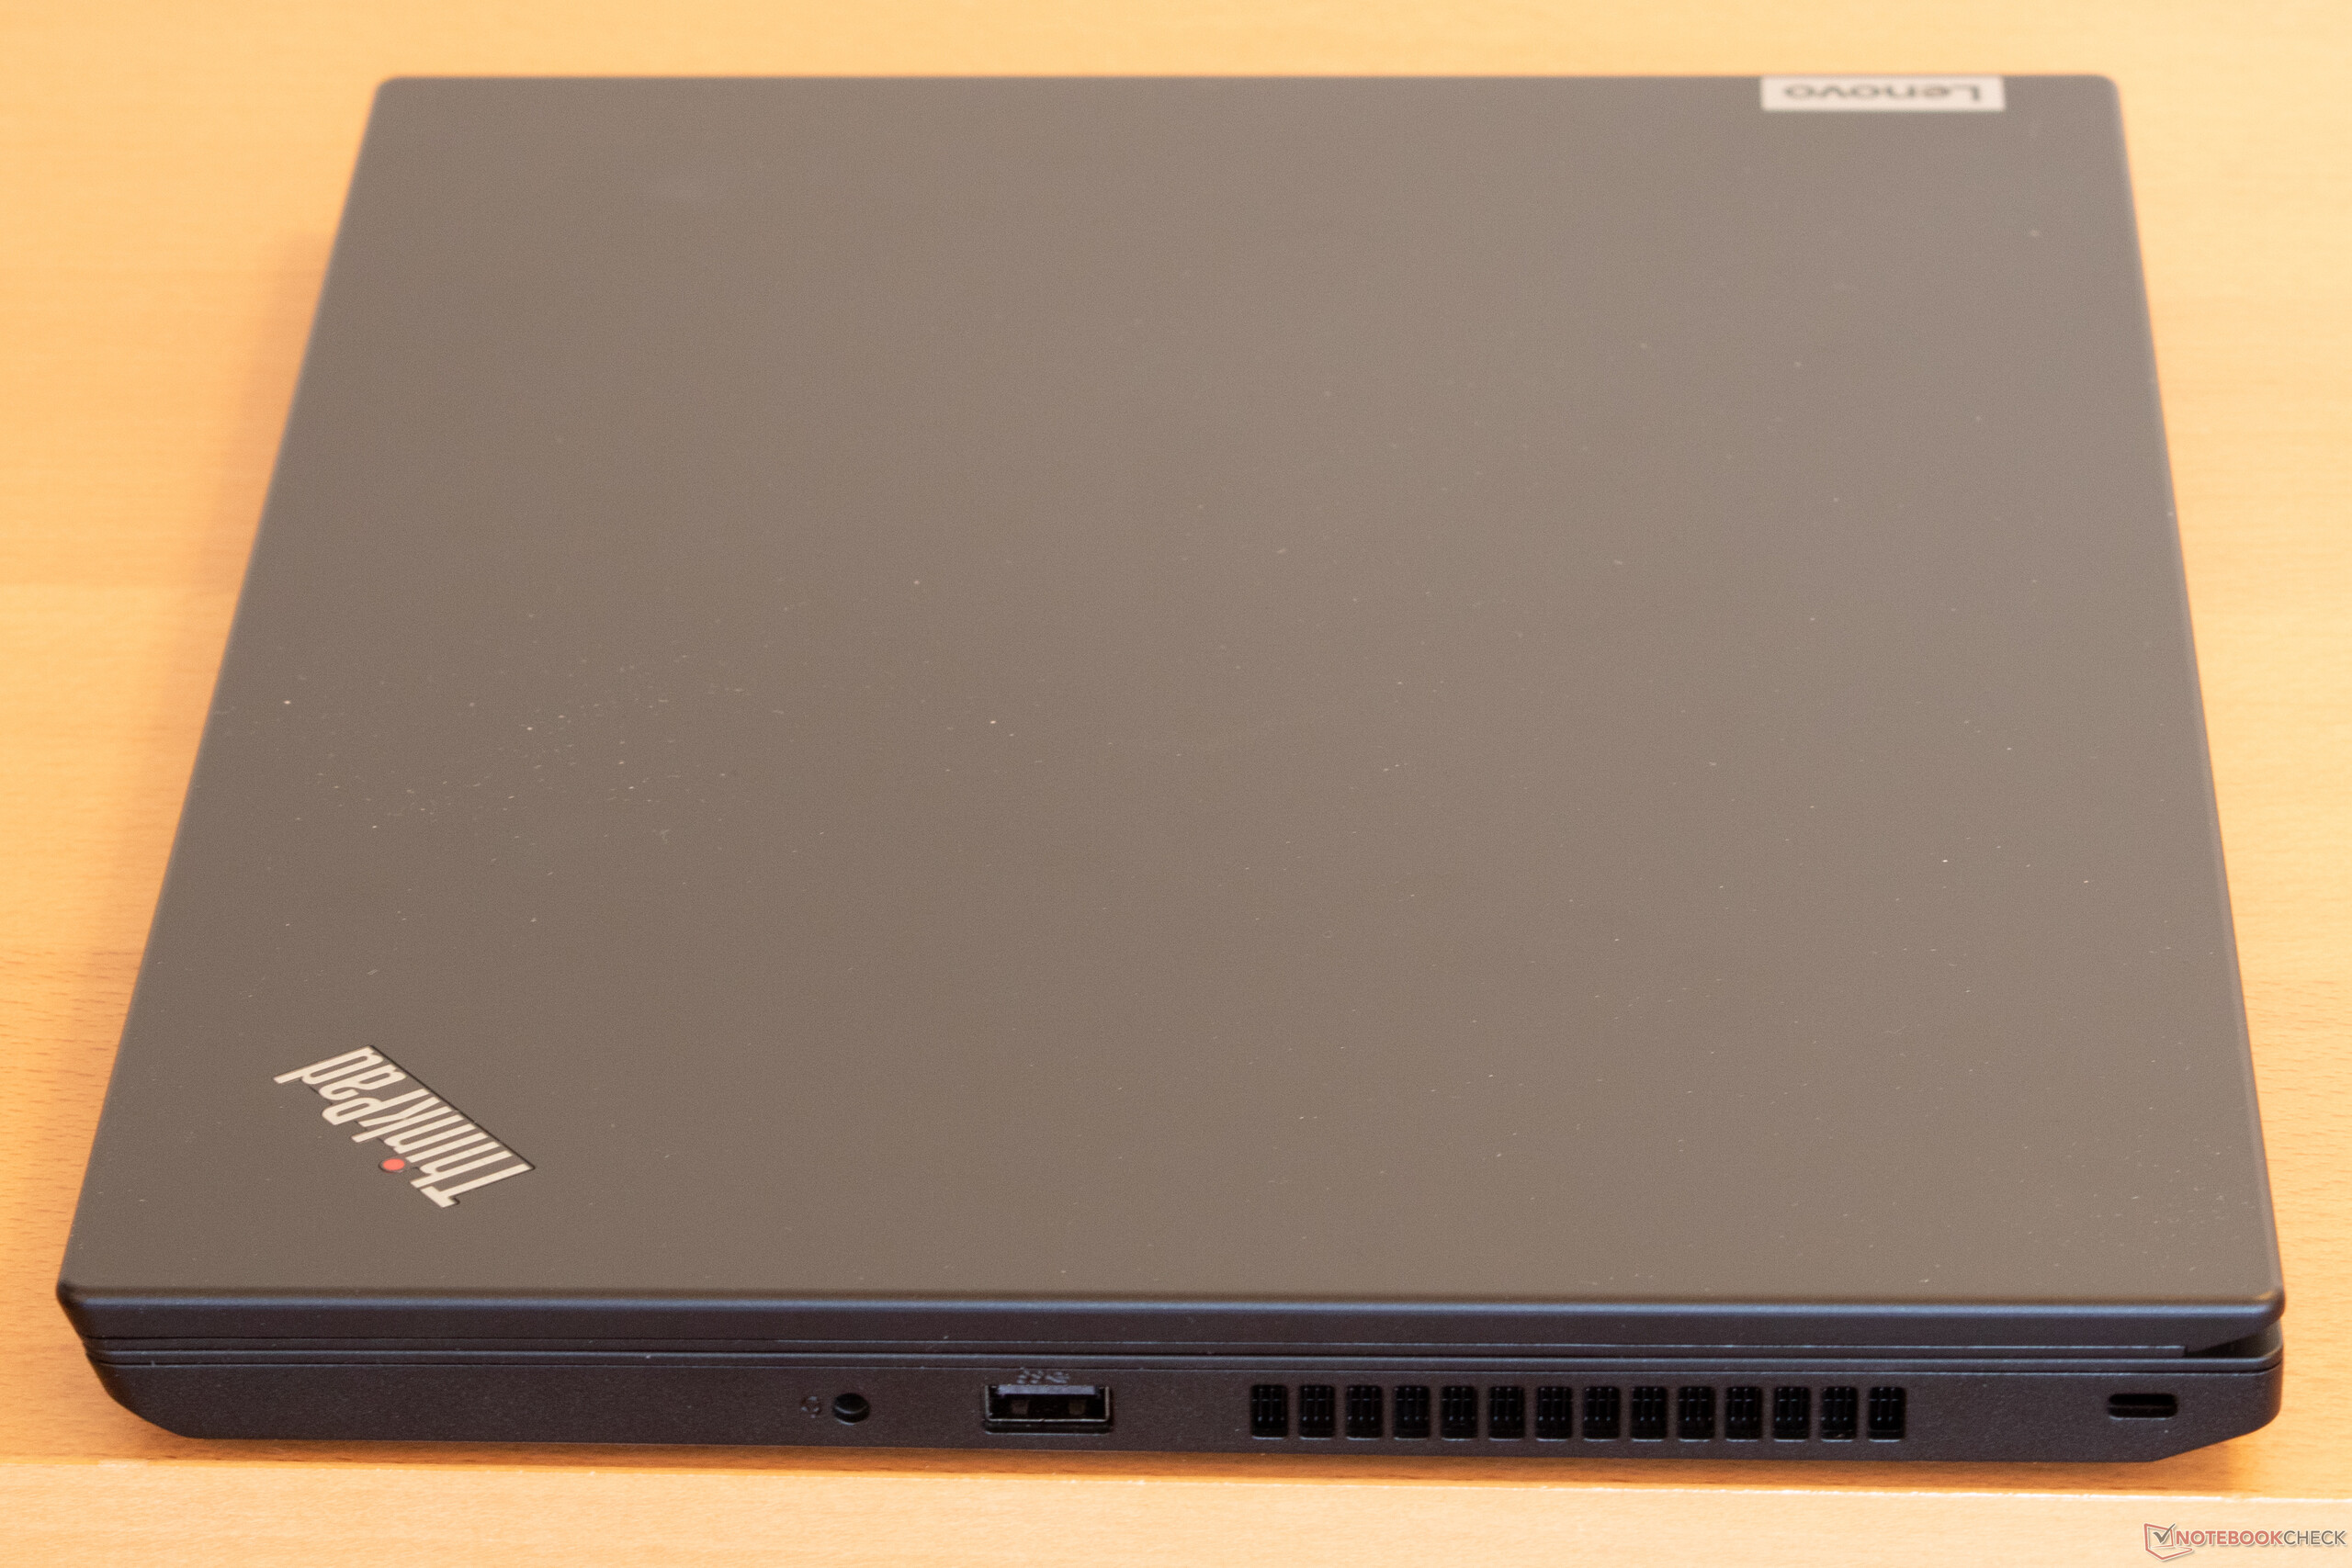
Geçen yılın L490'ına kıyasla L14 2,1 mm daha ince ve 4 mm daha dardır. Ağırlığı 1.7 kg ile aynı kaldı.
Bağlantı - AMD, HDMI 2.0'ı getiriyor
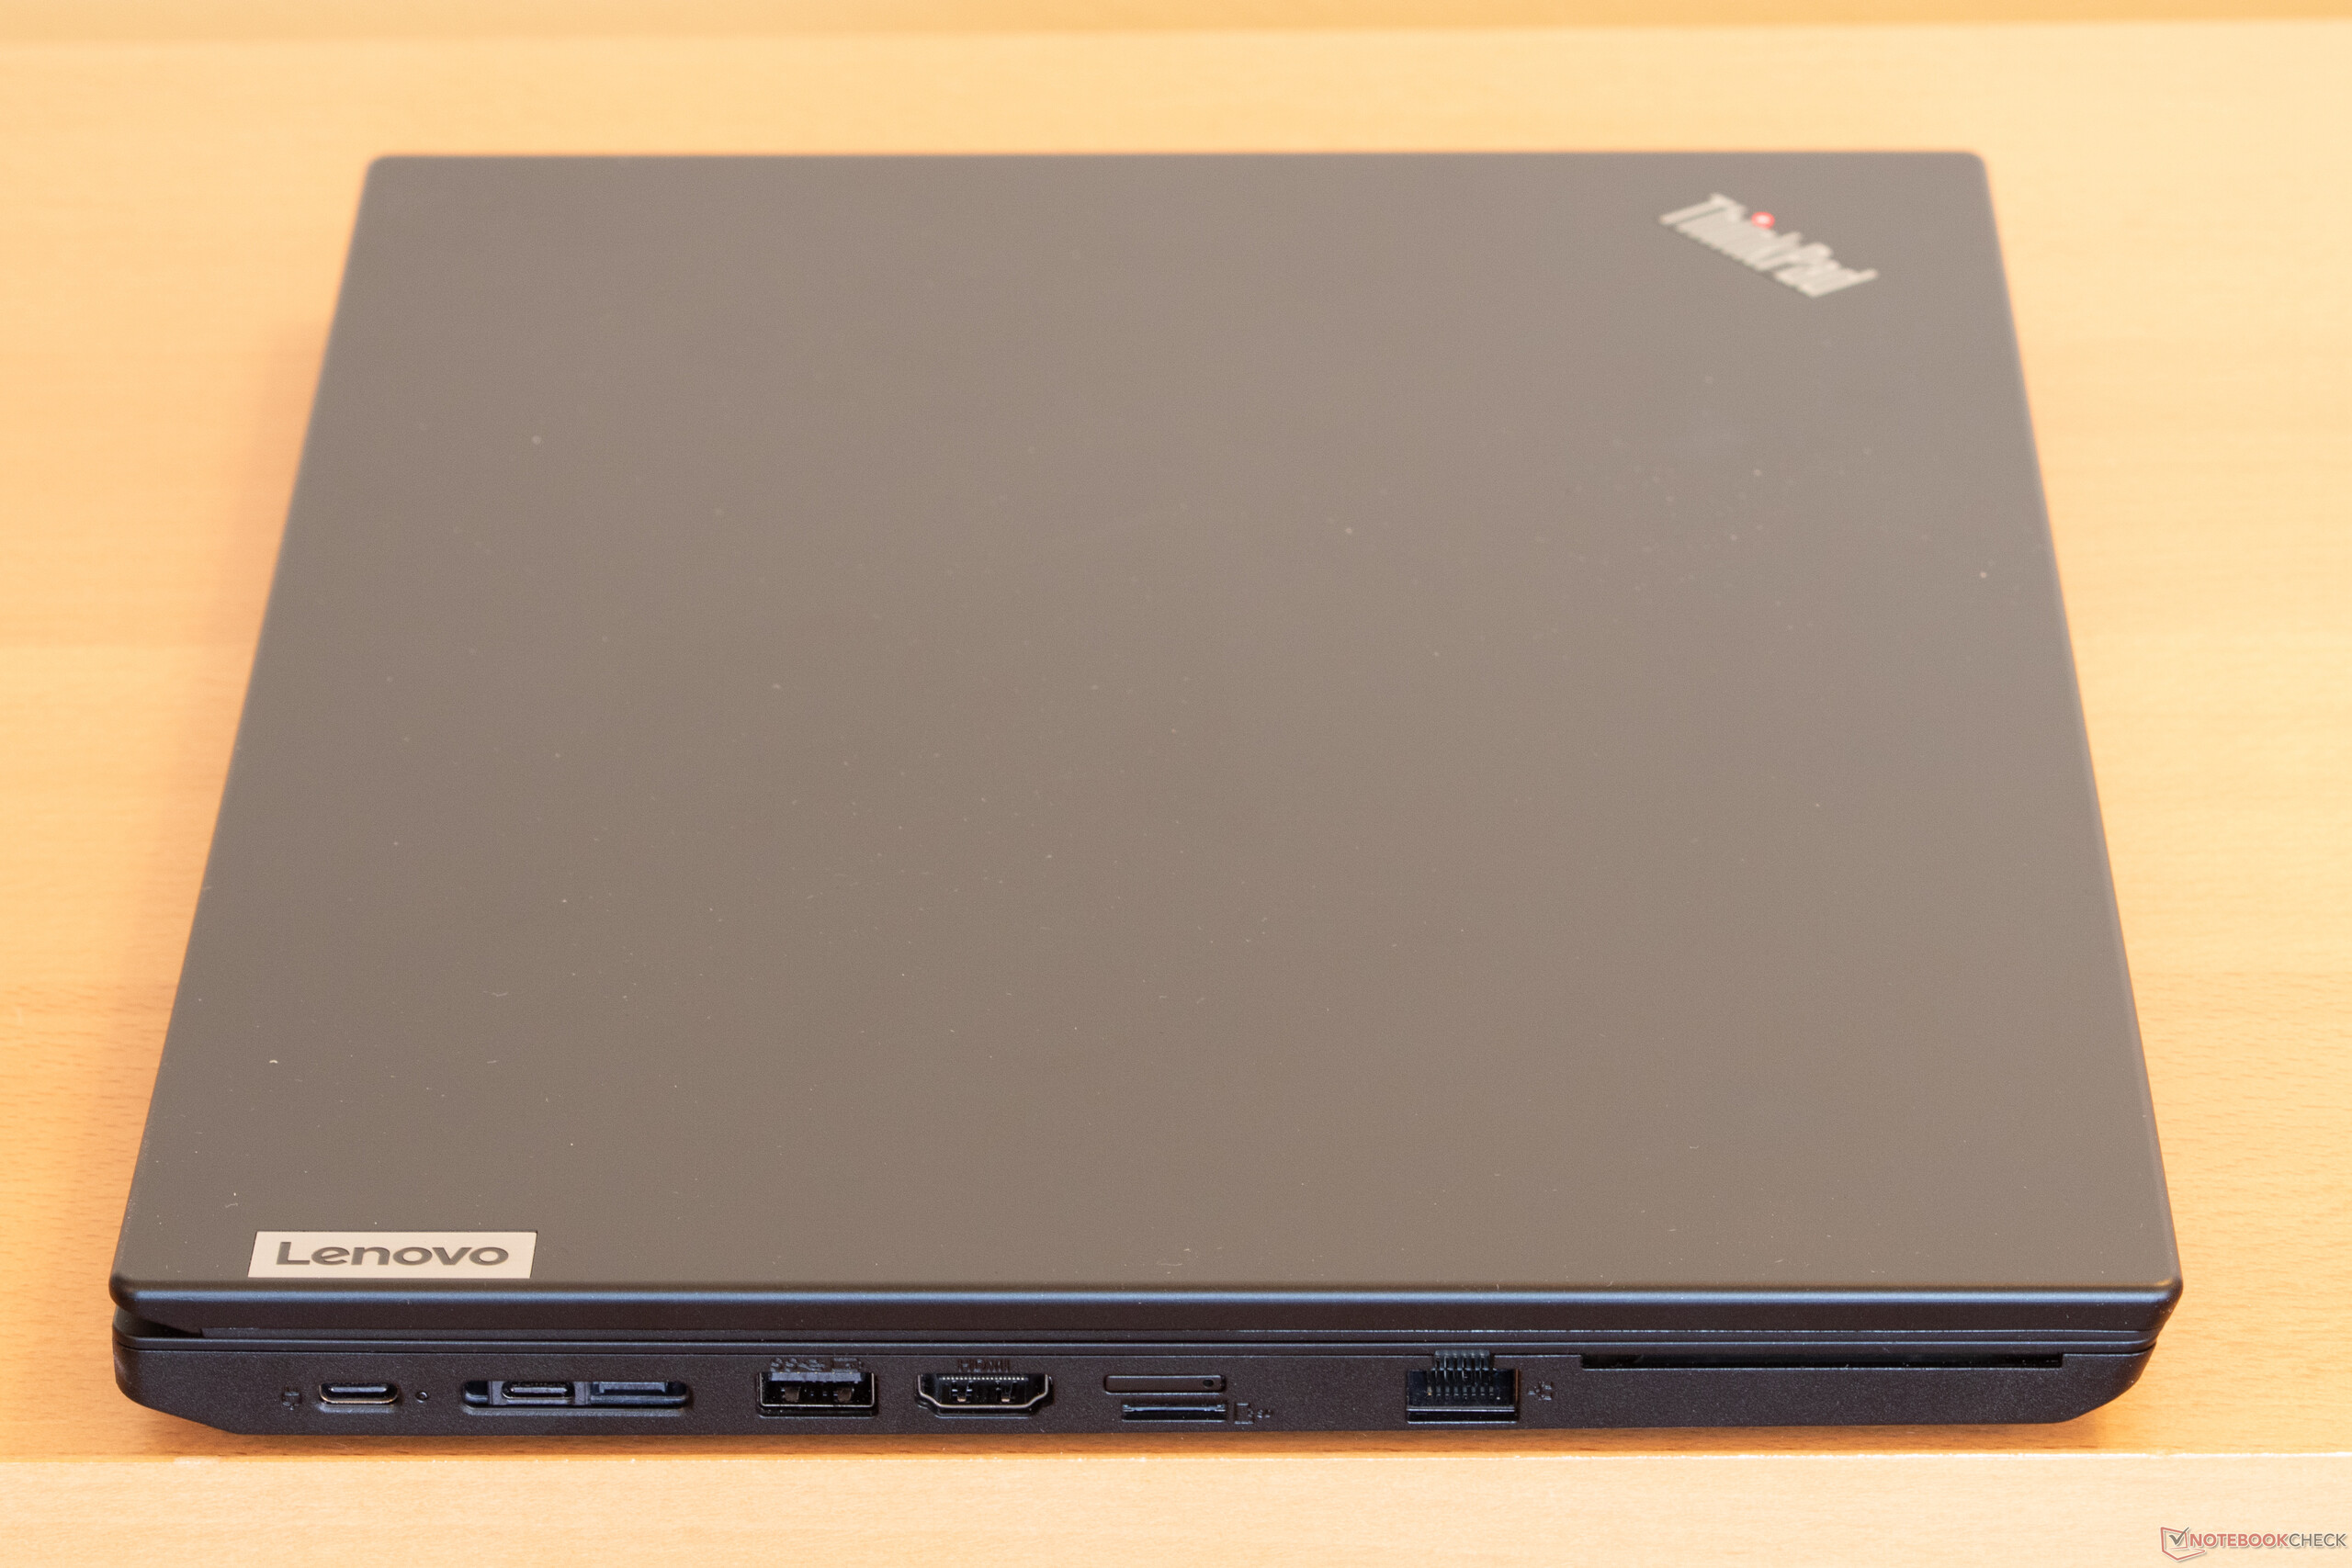
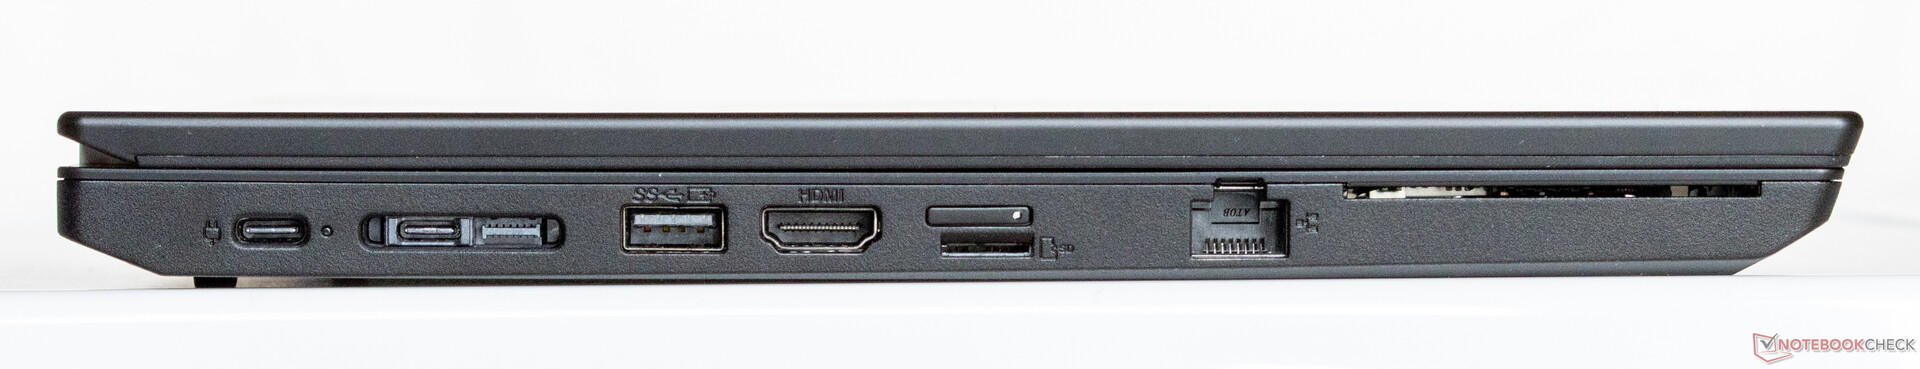
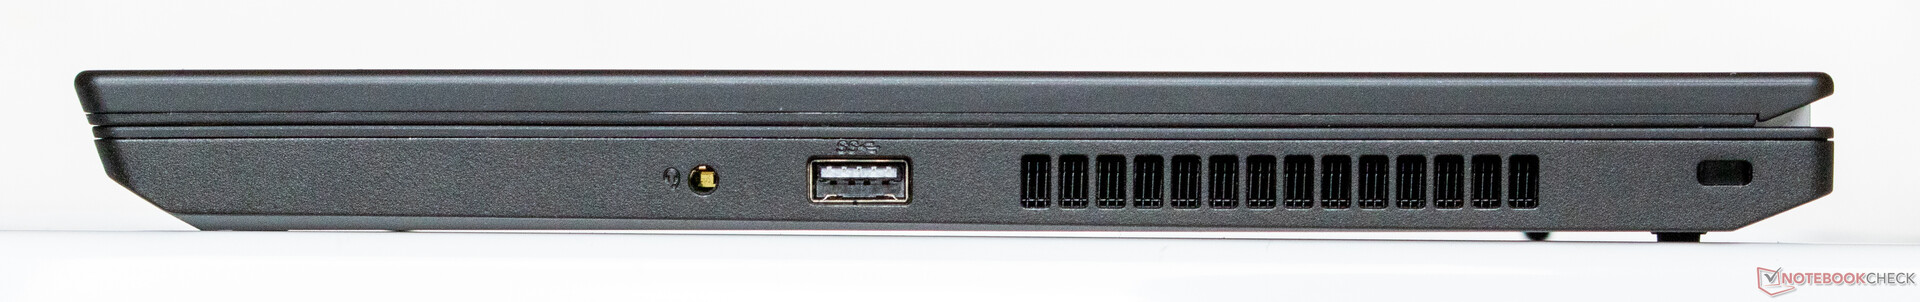
Bağlantı, geçen yılki L490'a göre değişmedi. L serisi, yalnızca T serisinde bulunan Thunderbolt bağlantı noktasından yoksun olmaya devam ediyor. Bağlantı noktası düzeni de ThinkPad L490'a göre değişmeden kaldı. Ana fark, artık 30 Hz yerine 60'ta 4K çözünürlükleri destekleyen yeni HDMI bağlantı noktasıdır. HDMI bağlantı noktasının Intel ve AMD modelleri arasında farklılık gösterdiğini unutmayın. AMD SKU'ları HDMI 2.0'ı (60 Hz'de 4k) desteklerken Intel SKU'lar hala HDMI 1.4 (24 Hz'de 4K) ile sınırlıdır.
| SD Card Reader | |
| average JPG Copy Test (av. of 3 runs) | |
| Dell Latitude 14 5410-RJ80D (Toshiba Exceria Pro M501 microSDXC 64GB) | |
| Lenovo ThinkPad T14s-20UJS00K00 (Toshiba Exceria Pro M501 64 GB UHS-II) | |
| Lenovo ThinkPad L14-20U50003GE (Toshiba Exceria Pro M501 64 GB UHS-II) | |
| Lenovo ThinkPad L490 20Q6S08600 (Toshiba Exceria Pro M501 64 GB UHS-II) | |
| HP ProBook 445 G7 175W4EA (Toshiba Exceria Pro SDXC 64 GB UHS-II) | |
| Sınıf ortalaması Office (19.8 - 198.5, n=21, son 2 yıl) | |
| Lenovo ThinkPad T14s-20T00044GE (Toshiba Exceria Pro M501 64 GB UHS-II) | |
| maximum AS SSD Seq Read Test (1GB) | |
| Dell Latitude 14 5410-RJ80D (Toshiba Exceria Pro M501 microSDXC 64GB) | |
| HP ProBook 445 G7 175W4EA (Toshiba Exceria Pro SDXC 64 GB UHS-II) | |
| Lenovo ThinkPad L14-20U50003GE (Toshiba Exceria Pro M501 64 GB UHS-II) | |
| Lenovo ThinkPad T14s-20UJS00K00 (Toshiba Exceria Pro M501 64 GB UHS-II) | |
| Lenovo ThinkPad L490 20Q6S08600 (Toshiba Exceria Pro M501 64 GB UHS-II) | |
| Sınıf ortalaması Office (27.4 - 249, n=20, son 2 yıl) | |
| Lenovo ThinkPad T14s-20T00044GE (Toshiba Exceria Pro M501 64 GB UHS-II) | |


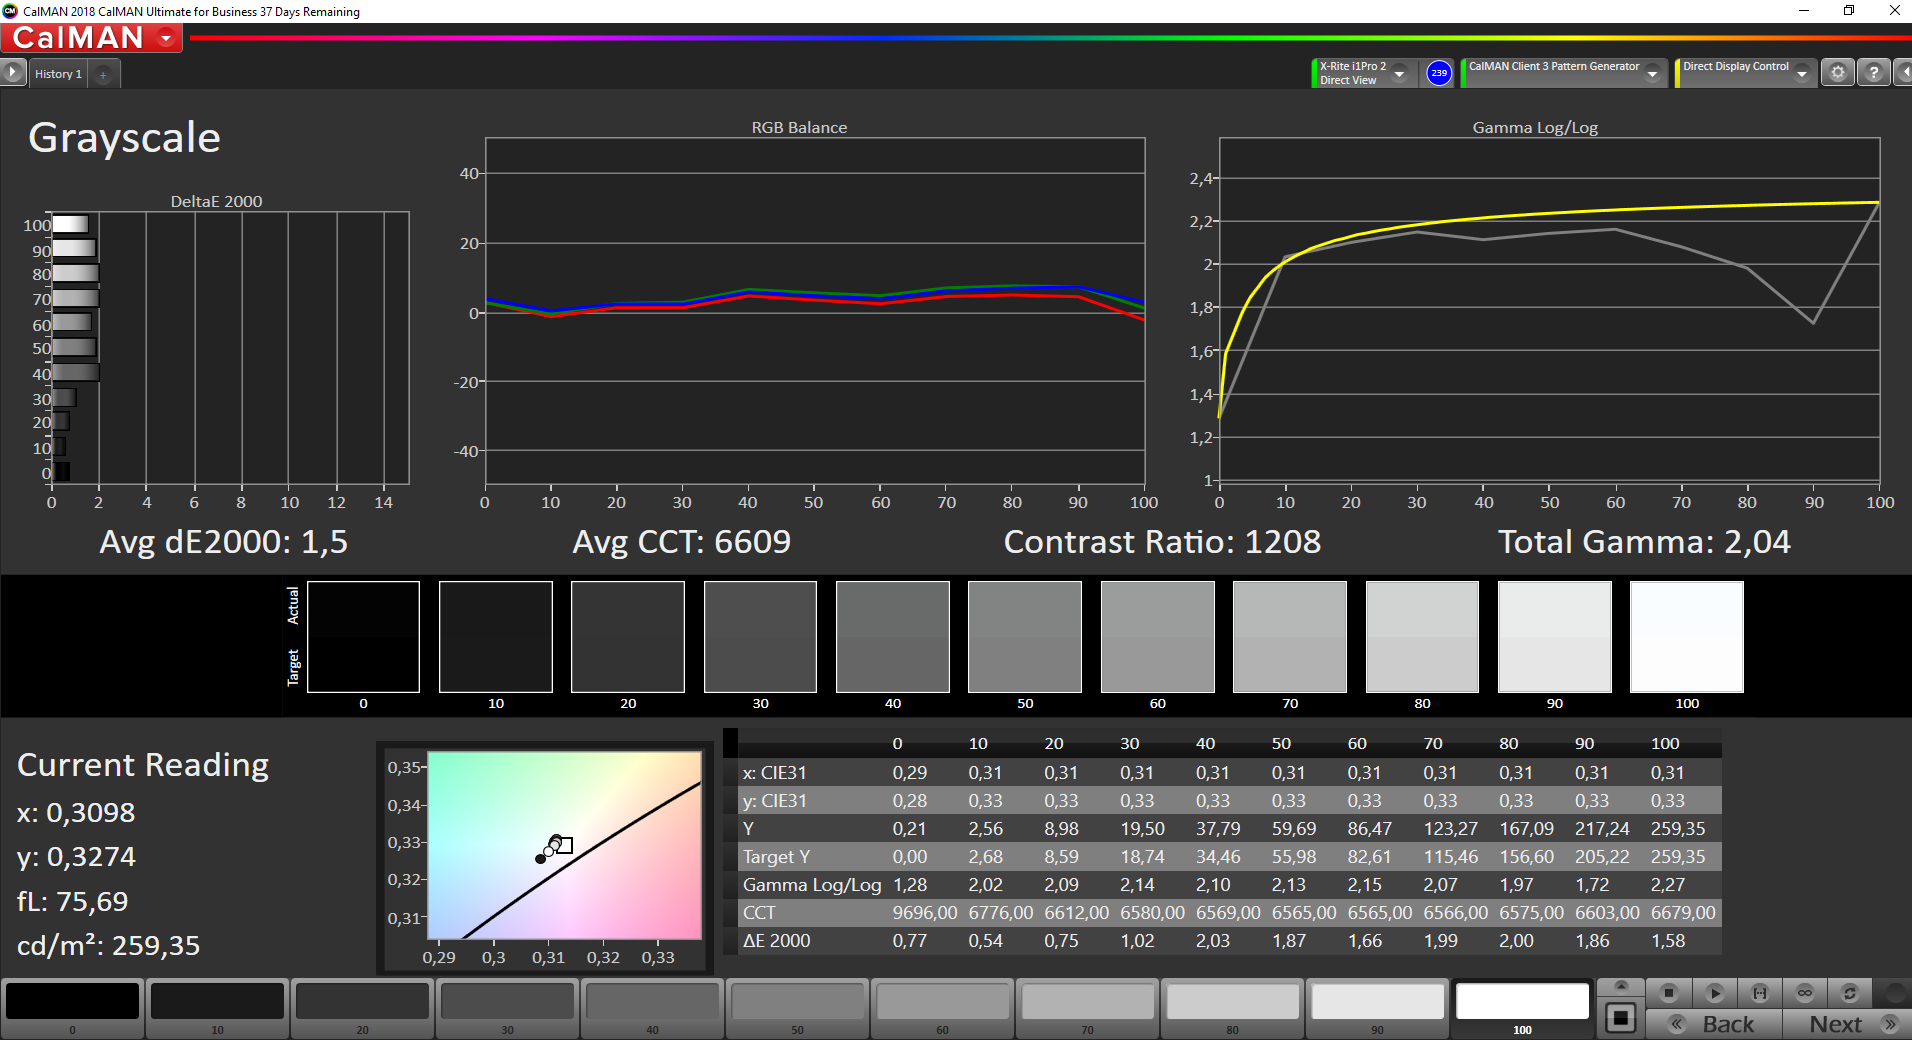
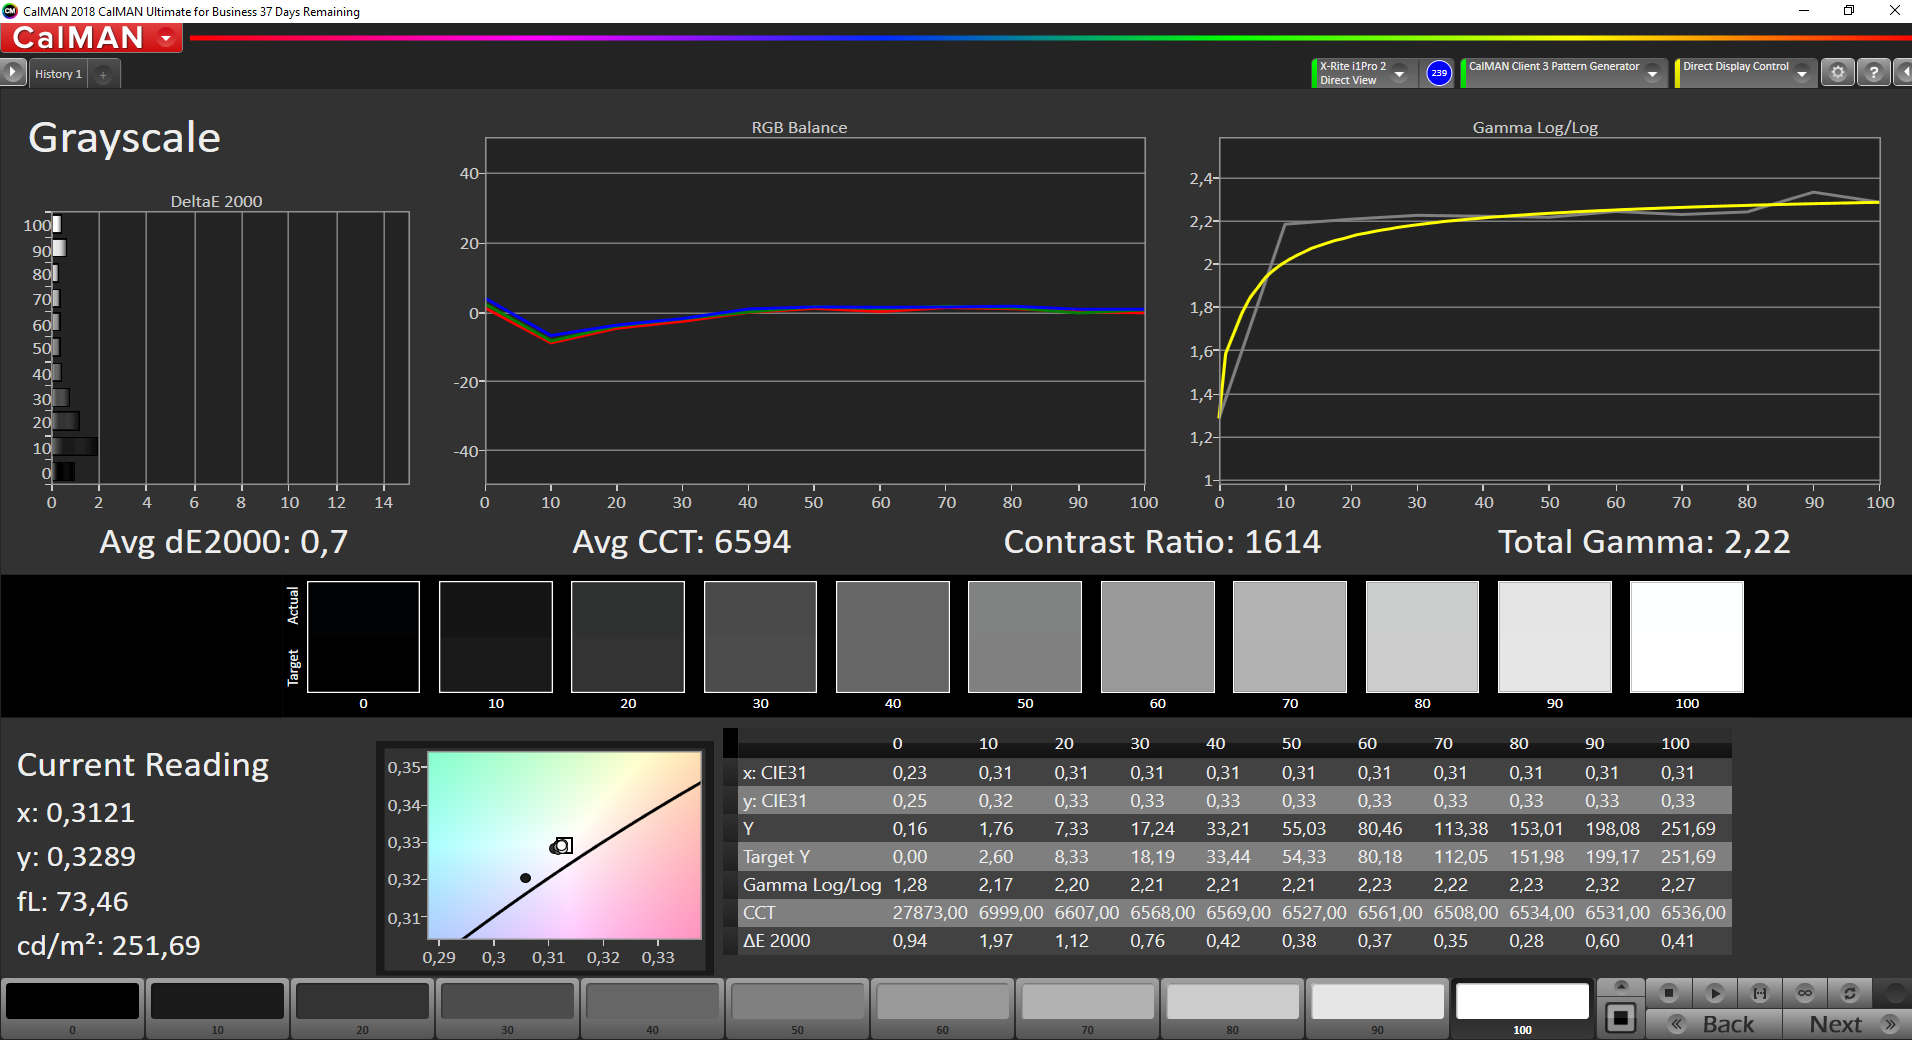
Ekran - Yalnızca Marjinal Olarak Daha İyi

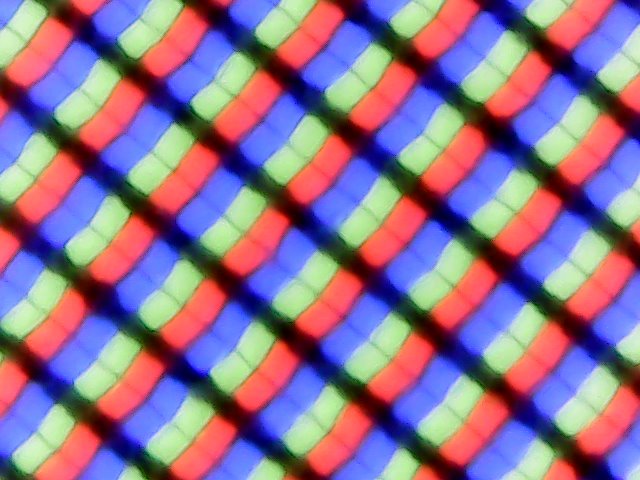
Geçen yılki L490, selefinden farklı bir panele sahipti ve L480'in çok loş olan ekranından neredeyse hiç parlak değildi. Bu yıl, ThinkPad L14'te bir başka panel daha görüyoruz, Innolux N140HCA-EAC - temelde ThinkPad T14s'in Innolux N140HCG-GQ2 panelinin daha ucuz bir modeli.
| |||||||||||||||||||||||||
Aydınlatma: 92 %
Batarya modunda parlaklık: 260 cd/m²
Kontrast: 1233:1 (Siyah: 0.21 cd/m²)
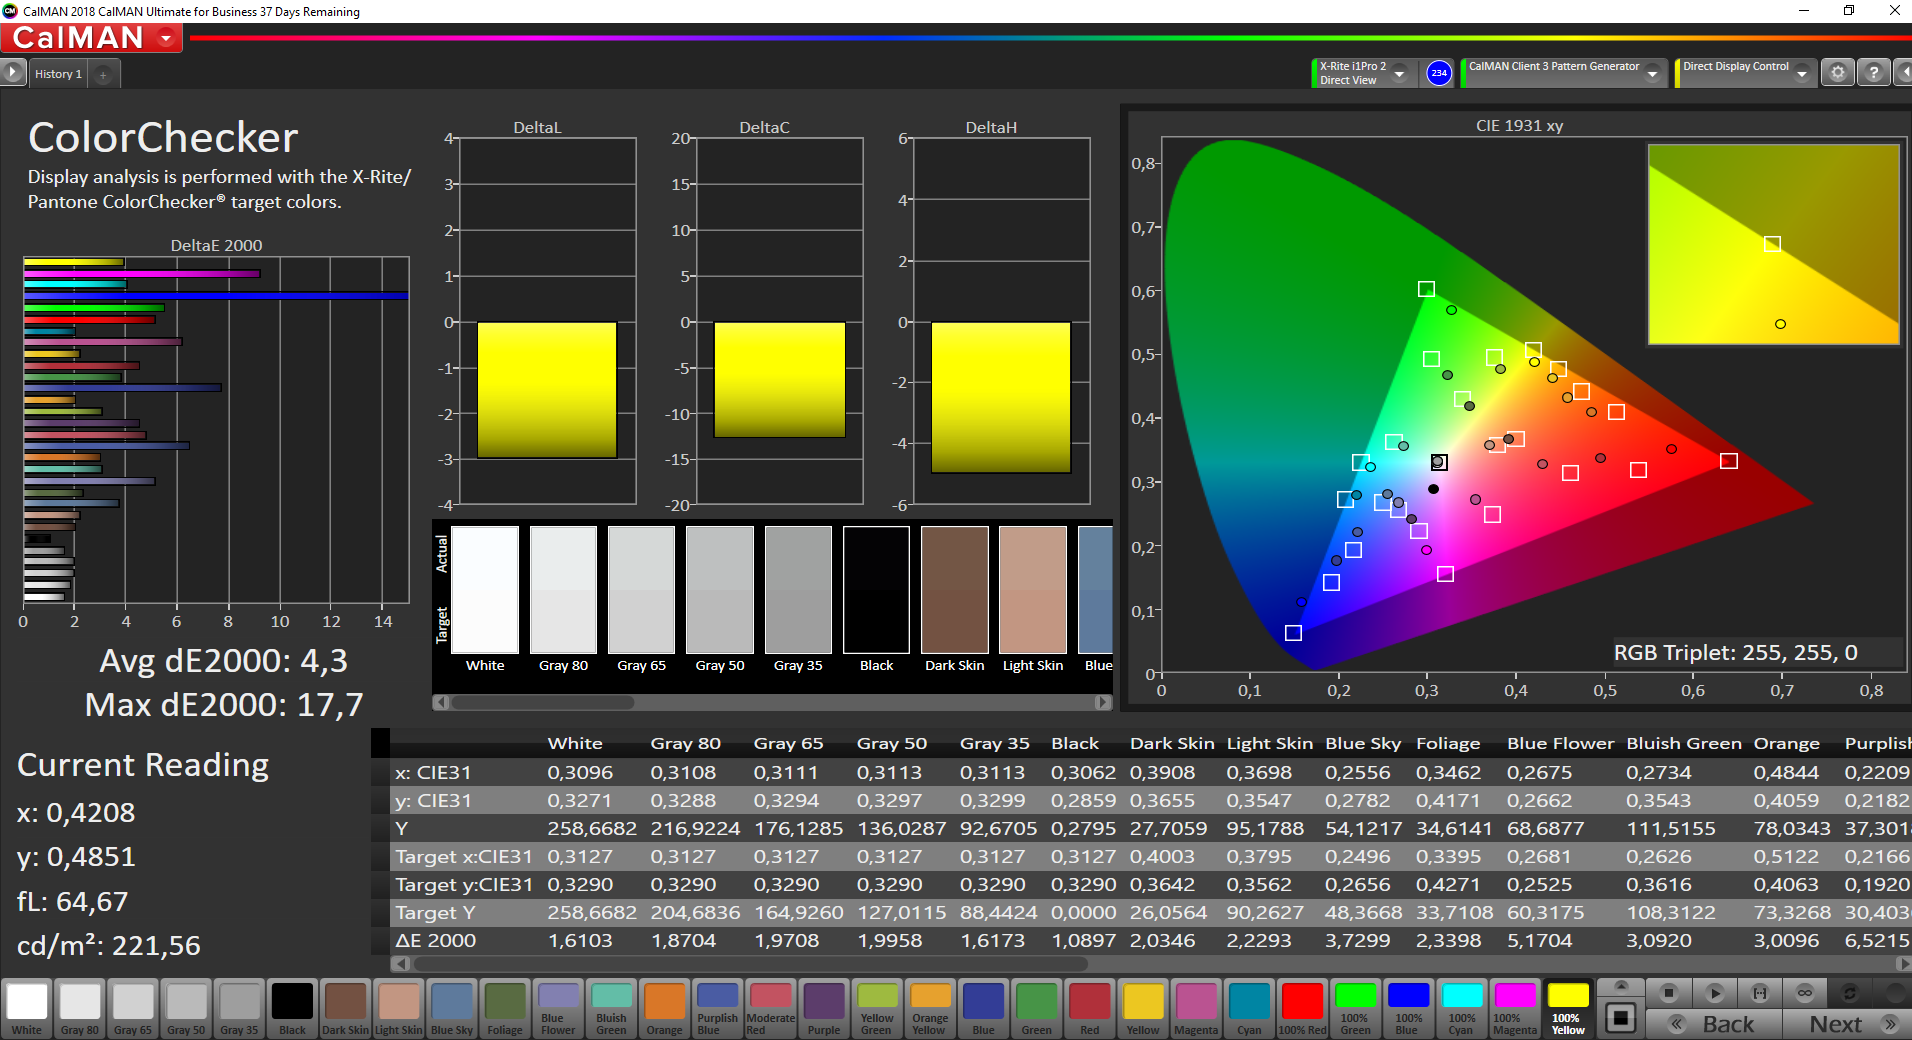
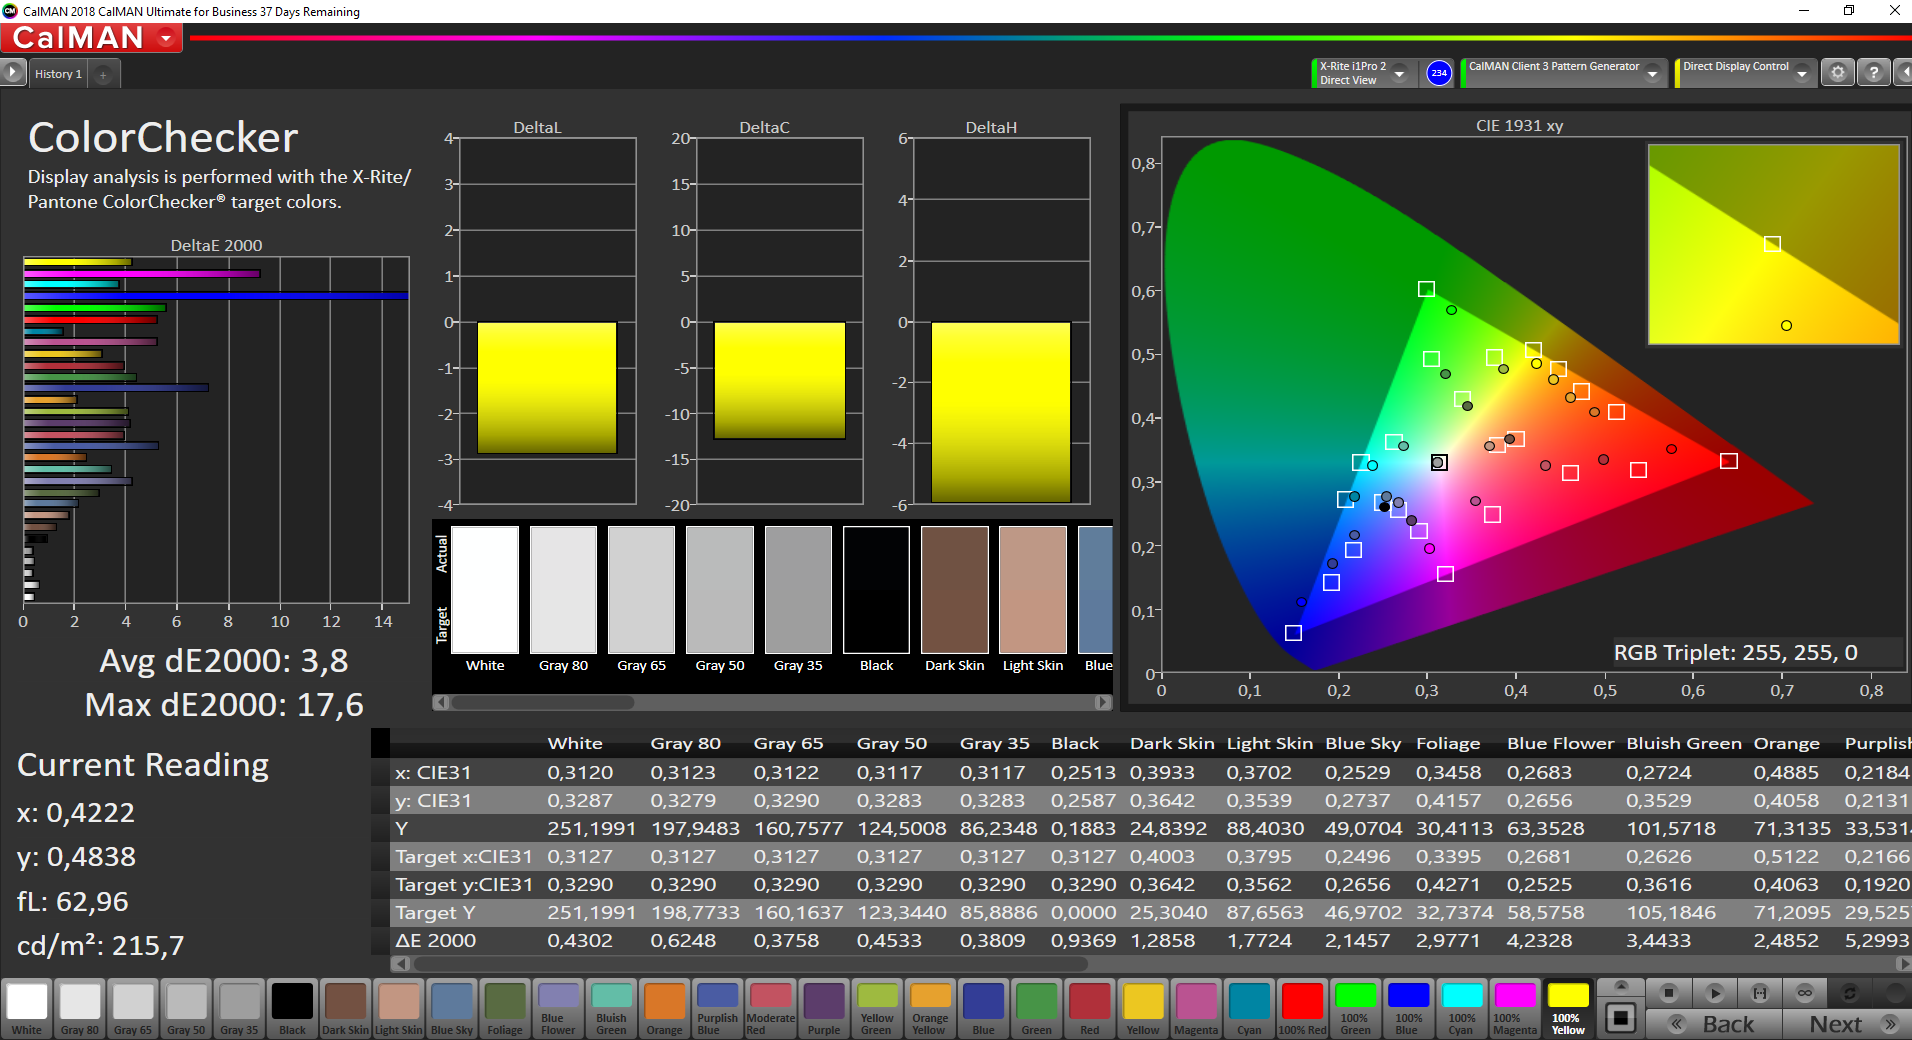
ΔE ColorChecker Calman: 4.3 | ∀{0.5-29.43 Ø4.72}
calibrated: 3.8
ΔE Greyscale Calman: 1.5 | ∀{0.09-98 Ø4.97}
62.9% sRGB (Argyll 1.6.3 3D)
40% AdobeRGB 1998 (Argyll 1.6.3 3D)
43.37% AdobeRGB 1998 (Argyll 3D)
63% sRGB (Argyll 3D)
41.96% Display P3 (Argyll 3D)
Gamma: 2.04
CCT: 6609 K
| Lenovo ThinkPad L14-20U50003GE N140HCA-EAC, IPS, 1920x1080, 14" | Lenovo ThinkPad L490 20Q6S08600 Lenovo LEN40A9, IPS, 1920x1080, 14" | Lenovo ThinkPad E14 Gen2-20T7S00W00 B140HAN05.7, a-Si IPS LED, 1920x1080, 14" | Lenovo ThinkPad T14s-20UJS00K00 N140HCG-GQ2, IPS , 1920x1080, 14" | Lenovo ThinkPad T14s-20T00044GE B140HAN05.7, LTPS AHVA-IPS LED, 1920x1080, 14" | HP ProBook 445 G7 175W4EA BOE0868, IPS, 1920x1080, 14" | Dell Latitude 14 5410-RJ80D BOE NV14N4F, a-Si IPS LED, 1920x1080, 14" | |
|---|---|---|---|---|---|---|---|
| Display | 0% | -9% | 58% | 56% | -5% | -7% | |
| Display P3 Coverage (%) | 41.96 | 41.93 0% | 38.16 -9% | 66.8 59% | 66.6 59% | 39.92 -5% | 39.02 -7% |
| sRGB Coverage (%) | 63 | 62.8 0% | 57.2 -9% | 97.9 55% | 96.8 54% | 59.6 -5% | 58 -8% |
| AdobeRGB 1998 Coverage (%) | 43.37 | 43.35 0% | 39.42 -9% | 69 59% | 67.6 56% | 41.25 -5% | 40.32 -7% |
| Response Times | 11% | -1% | 36% | -23% | 2% | -9% | |
| Response Time Grey 50% / Grey 80% * (ms) | 42 ? | 37.6 ? 10% | 46.4 ? -10% | 32.4 ? 23% | 63.2 ? -50% | 40 ? 5% | 46 ? -10% |
| Response Time Black / White * (ms) | 29.6 ? | 26.4 ? 11% | 27.2 ? 8% | 15.2 ? 49% | 28 ? 5% | 30 ? -1% | 32 ? -8% |
| PWM Frequency (Hz) | 25000 ? | 26040 ? | 192 ? | 1000 ? | |||
| Screen | -14% | -22% | 34% | 29% | -34% | -36% | |
| Brightness middle (cd/m²) | 259 | 252 -3% | 281 8% | 404 56% | 404 56% | 277 7% | 235 -9% |
| Brightness (cd/m²) | 244 | 238 -2% | 264 8% | 371 52% | 397 63% | 270 11% | 219 -10% |
| Brightness Distribution (%) | 92 | 82 -11% | 87 -5% | 88 -4% | 92 0% | 88 -4% | 81 -12% |
| Black Level * (cd/m²) | 0.21 | 0.32 -52% | 0.25 -19% | 0.34 -62% | 0.21 -0% | 0.285 -36% | 0.21 -0% |
| Contrast (:1) | 1233 | 788 -36% | 1124 -9% | 1188 -4% | 1924 56% | 972 -21% | 1119 -9% |
| Colorchecker dE 2000 * | 4.3 | 4.6 -7% | 5.8 -35% | 1.4 67% | 3.1 28% | 5.53 -29% | 6.11 -42% |
| Colorchecker dE 2000 max. * | 17.7 | 18.5 -5% | 22.3 -26% | 3.2 82% | 4.7 73% | 10.68 40% | 16.6 6% |
| Colorchecker dE 2000 calibrated * | 3.8 | 4 -5% | 4.9 -29% | 0.8 79% | 1.3 66% | 4.43 -17% | |
| Greyscale dE 2000 * | 1.5 | 2 -33% | 3.2 -113% | 1.6 -7% | 3.4 -127% | 6.2 -313% | 5.52 -268% |
| Gamma | 2.04 108% | 2 110% | 2.15 102% | 2.13 103% | 2.38 92% | 2.34 94% | 2.33 94% |
| CCT | 6609 98% | 6524 100% | 6452 101% | 6480 100% | 7070 92% | 7342 89% | 6680 97% |
| Color Space (Percent of AdobeRGB 1998) (%) | 40 | 40 0% | 36.2 -9% | 63 58% | 61.8 55% | 38 -5% | 37 -7% |
| Color Space (Percent of sRGB) (%) | 62.9 | 62.7 0% | 56.9 -10% | 97.9 56% | 96.6 54% | 59 -6% | 58 -8% |
| Toplam Ortalama (Program / Ayarlar) | -1% /
-8% | -11% /
-17% | 43% /
39% | 21% /
28% | -12% /
-24% | -17% /
-27% |
* ... daha küçük daha iyidir
L ve T serisi arasındaki farklar, maksimum parlaklık (244'e karşı 371 nit) ve ayrıca renk alanı kapsamı açısından çok belirgindir ve L14, daha pahalı olan iş kardeşinin çok gerisindedir. L490 ile karşılaştırıldığında parlaklık, kontrast oranı ve siyah seviyesindeki bazı iyileştirmelerle pratik olarak aynı kaldı. Bu, inceleme birimimizin hala HP ve Dell'den daha iyi performans gösterdiğini söyledi.
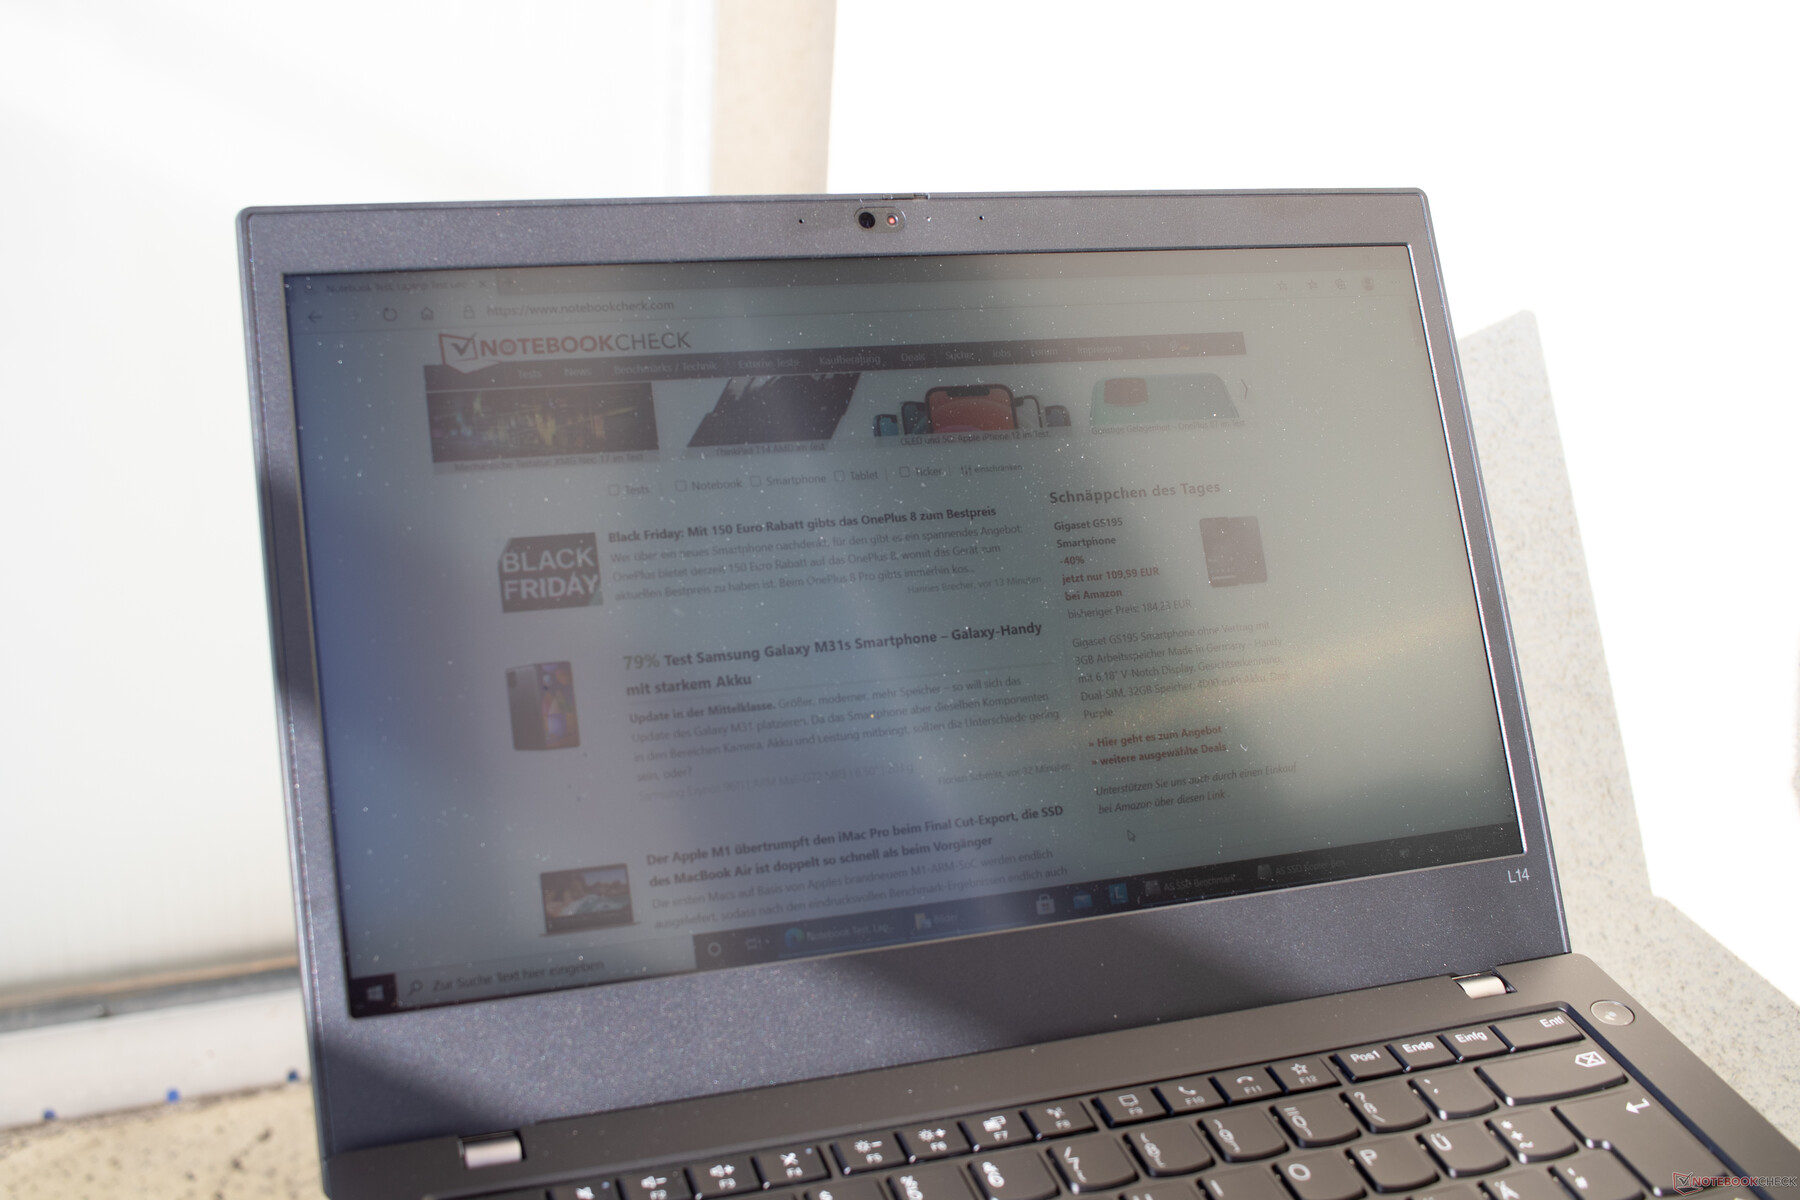
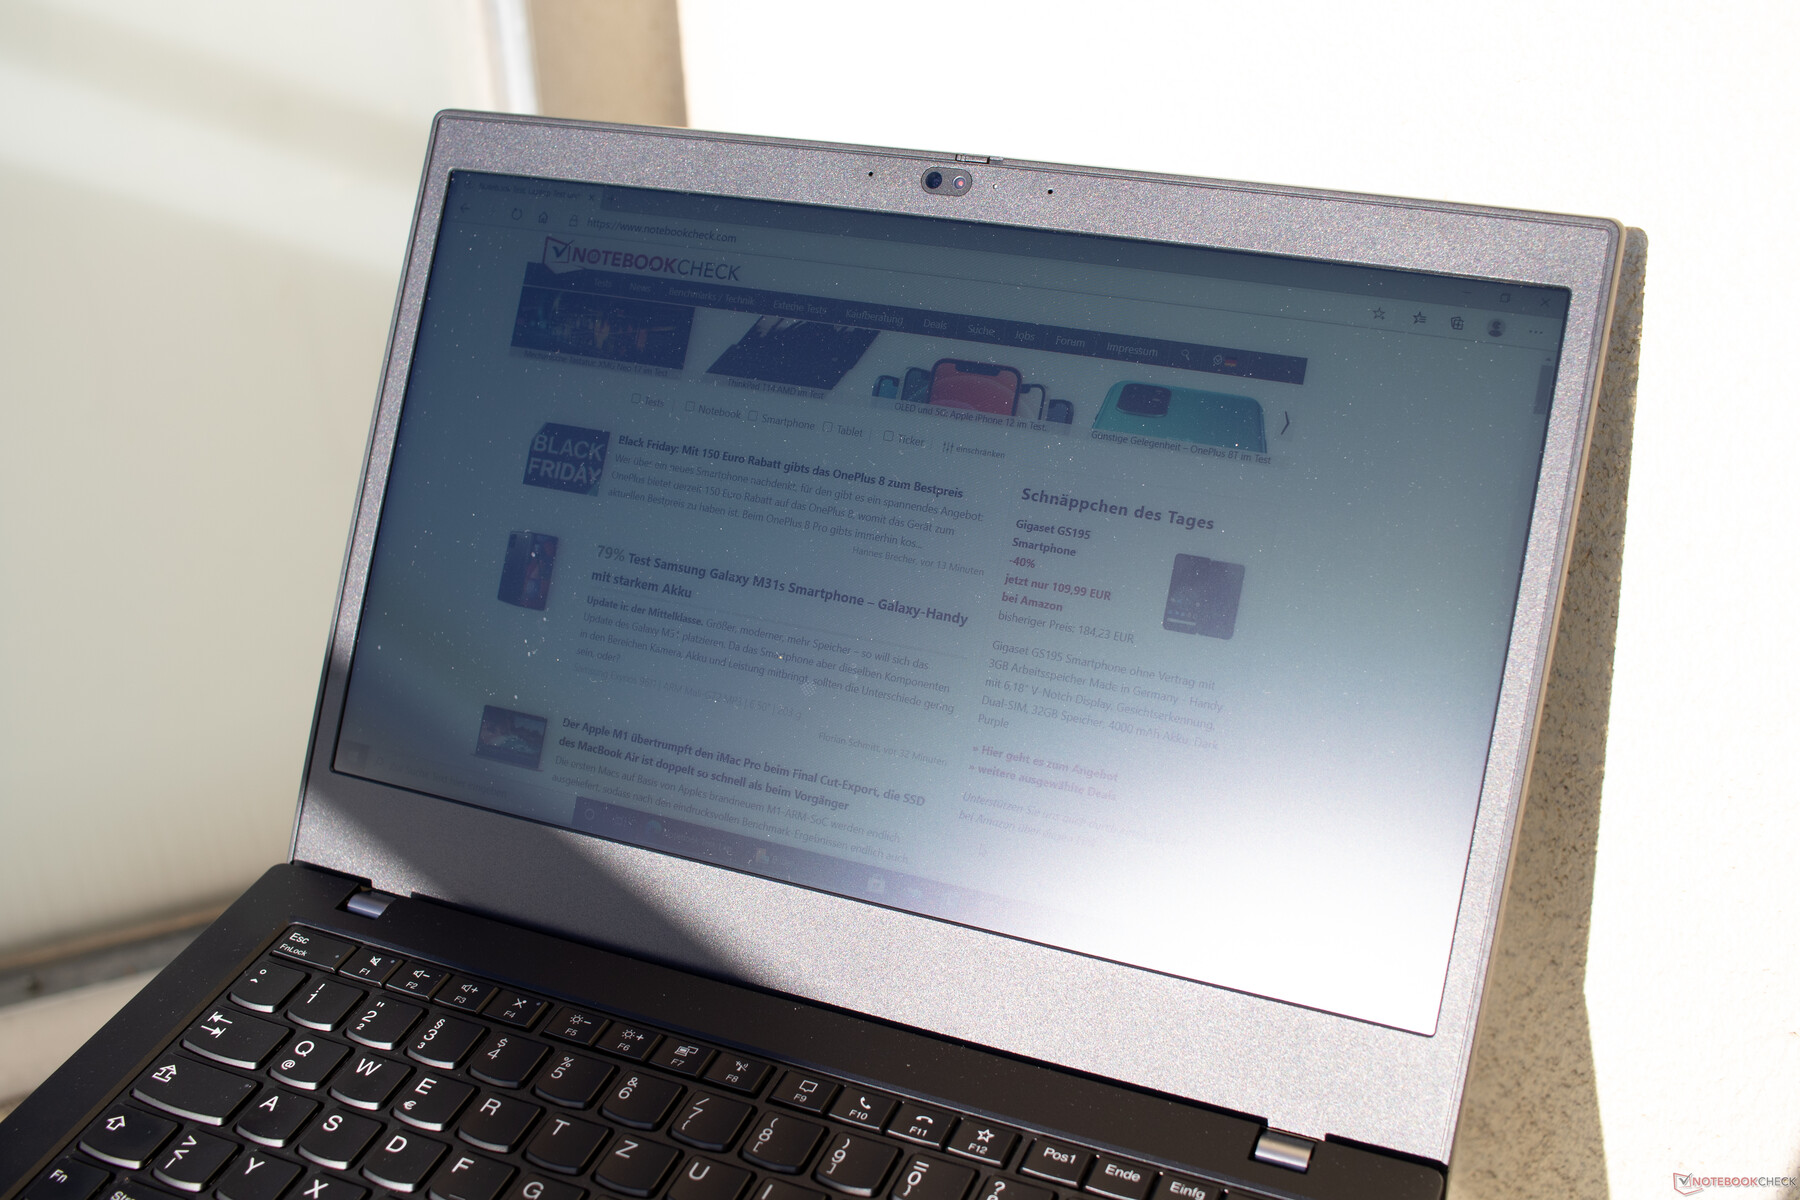
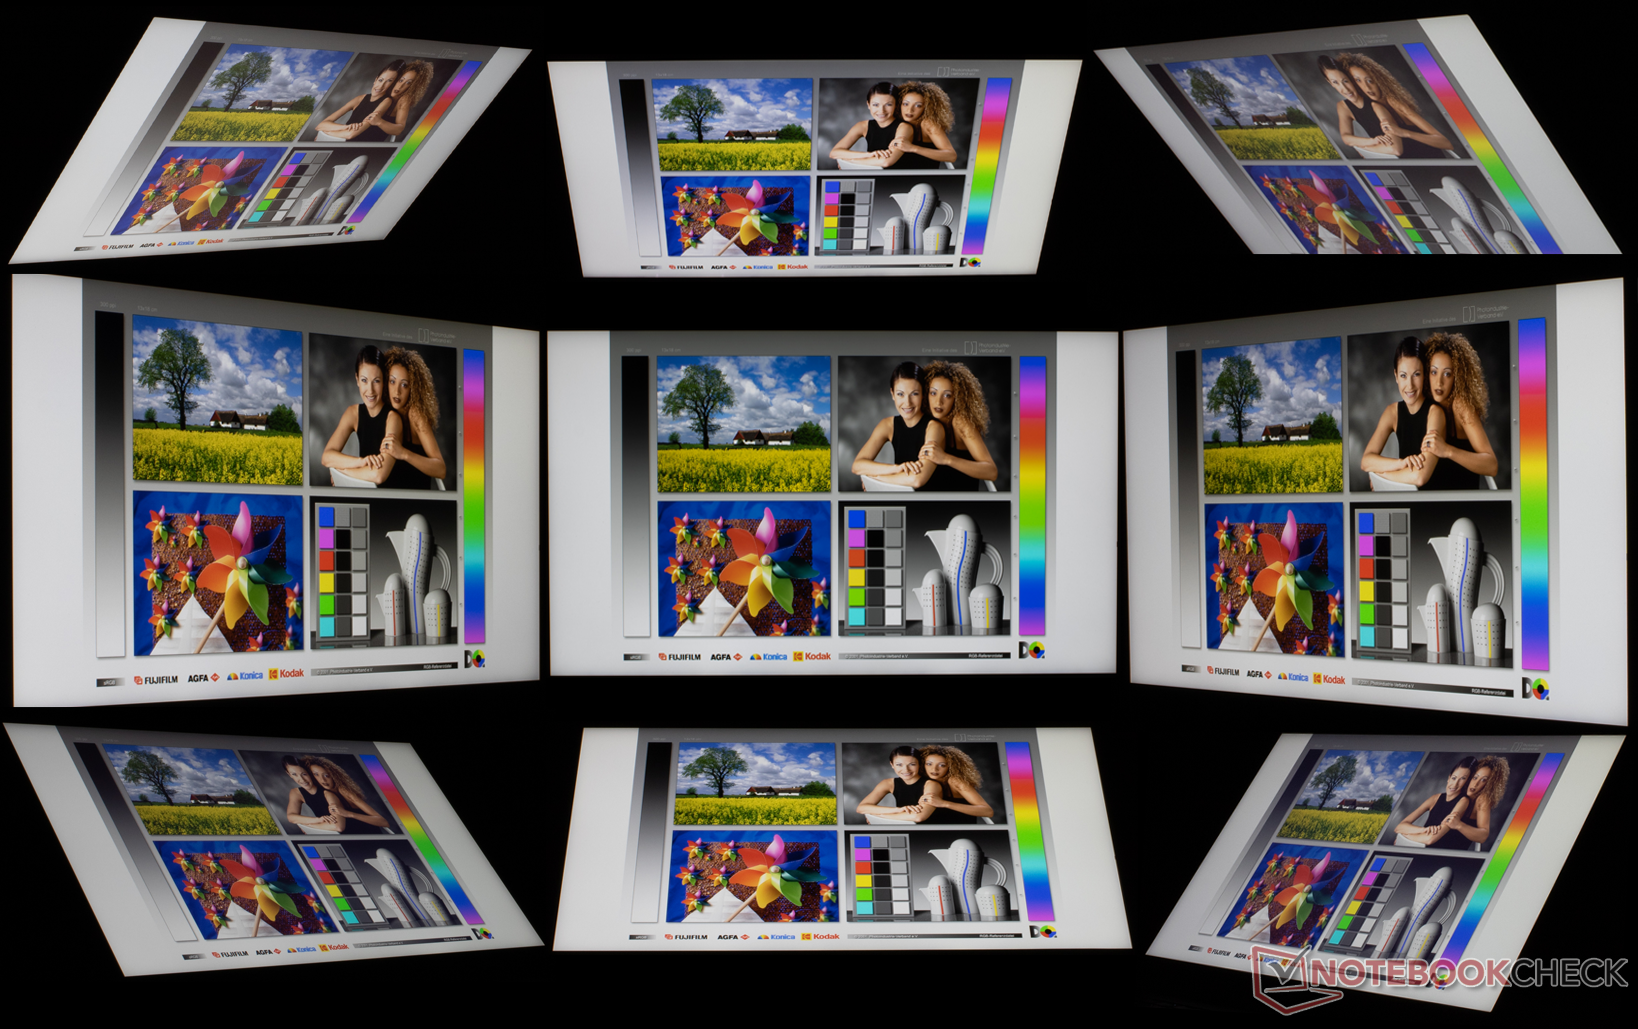
Dış mekanda kullanılabilirlik, aydınlık ortamlarda bile yeterliydi, ancak doğrudan ışık kaynaklarından kesinlikle kaçınmalısınız. Rahatlamak için bulutlu bir güne veya en azından tam gölgeye ihtiyacınız var.
Yanıt Sürelerini Görüntüle
| ↔ Tepki Süresi Siyahtan Beyaza | ||
|---|---|---|
| 29.6 ms ... yükseliş ↗ ve sonbahar↘ birleşimi | ↗ 15.6 ms yükseliş | 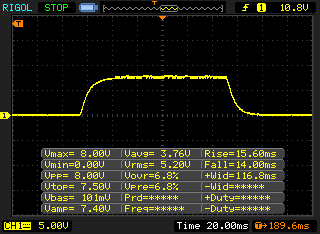 |
| ↘ 14 ms sonbahar | ||
| Ekran, testlerimizde nispeten yavaş yanıt oranları gösteriyor ve oyuncular için çok yavaş olabilir. Karşılaştırıldığında, test edilen tüm cihazlar 0.1 (minimum) ile 240 (maksimum) ms arasında değişir. » Tüm cihazların 79 %'si daha iyi. Bu, ölçülen yanıt süresinin test edilen tüm cihazların ortalamasından (19.8 ms) daha kötü olduğu anlamına gelir. | ||
| ↔ Tepki Süresi %50 Griden %80 Griye | ||
| 42 ms ... yükseliş ↗ ve sonbahar↘ birleşimi | ↗ 21.6 ms yükseliş | 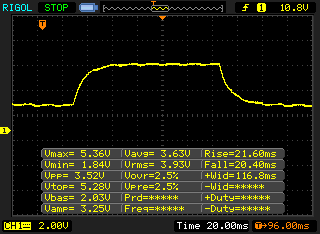 |
| ↘ 20.4 ms sonbahar | ||
| Ekran, testlerimizde yavaş yanıt oranları gösteriyor ve oyuncular için yetersiz olacaktır. Karşılaştırıldığında, test edilen tüm cihazlar 0.165 (minimum) ile 636 (maksimum) ms arasında değişir. » Tüm cihazların 67 %'si daha iyi. Bu, ölçülen yanıt süresinin test edilen tüm cihazların ortalamasından (31 ms) daha kötü olduğu anlamına gelir. | ||
Ekran Titremesi / PWM (Darbe Genişliği Modülasyonu)
| Ekran titriyor / PWM algılanmadı | 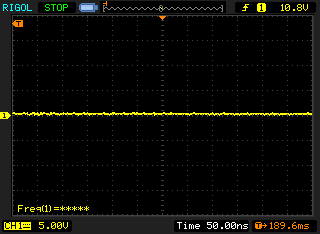 | ||
Karşılaştırıldığında: Test edilen tüm cihazların %52 %'si ekranı karartmak için PWM kullanmıyor. PWM tespit edilirse, ortalama 7763 (minimum: 5 - maksimum: 343500) Hz ölçüldü. | |||
Panelin kendisi, kalibrasyondan sonra bile büyük renk sapmalarından muzdarip olmaya devam eden nispeten ucuz bir IPS panelidir. Bu nedenle L14, ciddi fotoğraf düzenleme için uygun değildir, ancak tipik ofis ve iş ortamlarında mükemmel şekilde çalışmalıdır.
Performans - AMD ile Kısıtlama Yok
İşlemci
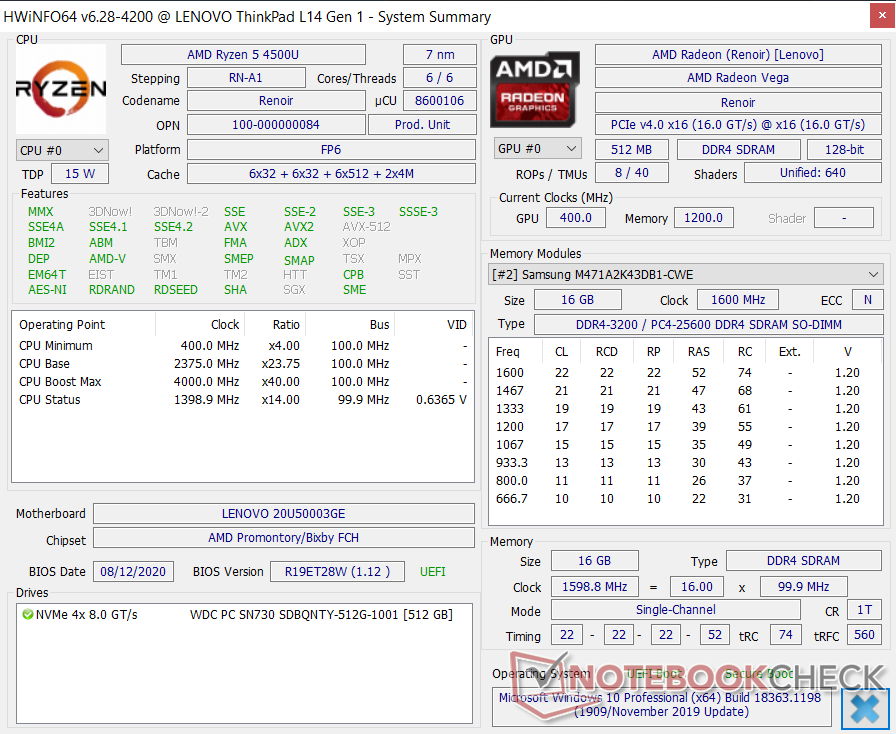
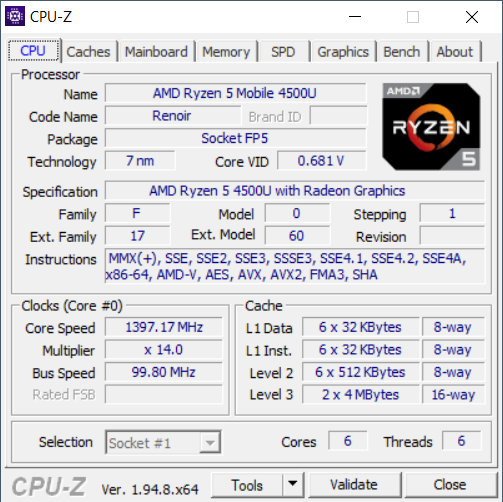
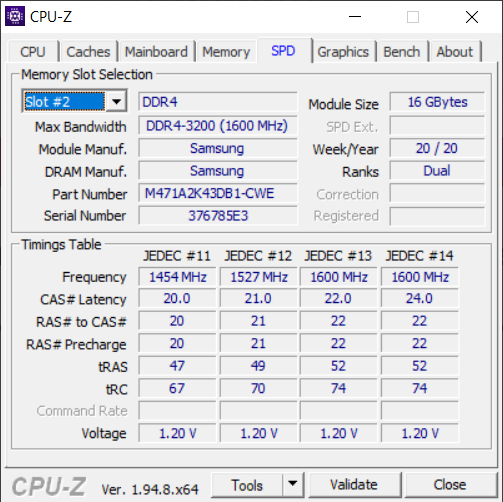
AMD'nin Ryzen 5 4500U, altı Zen 2 çekirdeğinde Hyperthreading'i desteklemiyor ve bu nedenle tam olarak sunabileceği çekirdek sayısı kadar iş parçacığı içeriyor. Bununla birlikte, 2,3 GHz'lik biraz daha yüksek bir temel saat hızında, 4 GHz'e kadar turbo güçlendirme ile çalışır. Ek ayrıntılar özel sayfamızda bulunabilir.
Çok çekirdekli kıyaslamalarda, AMD Ryzen 5 destekli ThinkPad L14, yakın zamanda gözden geçirilen ThinkPad E14'e benzer şekilde performans gösterdi ve aynı donanıma sahip HP ProBook 445 ve Dell Latitude 14 rakiplerinden daha iyi performans gösterdi. Ayrıca, performansı ilk çalıştırmadan sonra önemli ölçüde düşme eğiliminde olan Intel CPU'ların aksine, CineBench döngümüzde arka arkaya 20 kez çalıştırıldıktan sonra bile performansın sabit ve tutarlı kaldığı için, kısıtlama kanıtı bulamadık. Uzun lafın kısası: Intel CPU'lar, performans kısıtlamasına AMD CPU'lardan daha duyarlı görünüyor. Tüm Ryzen 5 dizüstü bilgisayarlar, tek çekirdekli karşılaştırmamızda neredeyse aynı şekilde performans gösterdi ve Intel Core i5'i küçük bir farkla geride bırakmayı başardı.
Cinebench R15: CPU Single 64Bit | CPU Multi 64Bit
Blender: v2.79 BMW27 CPU
7-Zip 18.03: 7z b 4 -mmt1 | 7z b 4
Geekbench 5.5: Single-Core | Multi-Core
HWBOT x265 Benchmark v2.2: 4k Preset
LibreOffice : 20 Documents To PDF
R Benchmark 2.5: Overall mean
| Cinebench R20 / CPU (Single Core) | |
| Sınıf ortalaması Office (345 - 816, n=72, son 2 yıl) | |
| Lenovo ThinkPad T14s-20UJS00K00 | |
| HP ProBook 445 G7 175W4EA | |
| Lenovo ThinkPad E14 Gen2-20T7S00W00 | |
| Lenovo ThinkPad L14-20U50003GE | |
| Ortalama AMD Ryzen 5 4500U (424 - 453, n=12) | |
| Dell Latitude 14 5410-RJ80D | |
| Lenovo ThinkPad T14s-20T00044GE | |
| Cinebench R20 / CPU (Multi Core) | |
| Sınıf ortalaması Office (648 - 8840, n=72, son 2 yıl) | |
| Lenovo ThinkPad T14s-20UJS00K00 | |
| Lenovo ThinkPad L14-20U50003GE | |
| Ortalama AMD Ryzen 5 4500U (1843 - 2530, n=13) | |
| HP ProBook 445 G7 175W4EA | |
| Lenovo ThinkPad E14 Gen2-20T7S00W00 | |
| Dell Latitude 14 5410-RJ80D | |
| Lenovo ThinkPad T14s-20T00044GE | |
| Cinebench R15 / CPU Single 64Bit | |
| Sınıf ortalaması Office (99.5 - 312, n=74, son 2 yıl) | |
| Lenovo ThinkPad T14s-20UJS00K00 | |
| Lenovo ThinkPad E14 Gen2-20T7S00W00 | |
| HP ProBook 445 G7 175W4EA | |
| Lenovo ThinkPad L14-20U50003GE | |
| Ortalama AMD Ryzen 5 4500U (156 - 177, n=13) | |
| Dell Latitude 14 5410-RJ80D | |
| Lenovo ThinkPad L490 20Q6S08600 | |
| Lenovo ThinkPad T14s-20T00044GE | |
| Cinebench R15 / CPU Multi 64Bit | |
| Sınıf ortalaması Office (250 - 3380, n=74, son 2 yıl) | |
| Lenovo ThinkPad T14s-20UJS00K00 | |
| Ortalama AMD Ryzen 5 4500U (715 - 1007, n=18) | |
| HP ProBook 445 G7 175W4EA | |
| Lenovo ThinkPad L14-20U50003GE | |
| Lenovo ThinkPad E14 Gen2-20T7S00W00 | |
| Dell Latitude 14 5410-RJ80D | |
| Lenovo ThinkPad T14s-20T00044GE | |
| Lenovo ThinkPad L490 20Q6S08600 | |
| Blender / v2.79 BMW27 CPU | |
| Lenovo ThinkPad L490 20Q6S08600 | |
| Dell Latitude 14 5410-RJ80D | |
| Lenovo ThinkPad T14s-20T00044GE | |
| HP ProBook 445 G7 175W4EA | |
| Ortalama AMD Ryzen 5 4500U (533 - 748, n=11) | |
| Lenovo ThinkPad E14 Gen2-20T7S00W00 | |
| Lenovo ThinkPad L14-20U50003GE | |
| Lenovo ThinkPad T14s-20UJS00K00 | |
| Sınıf ortalaması Office (158 - 1940, n=73, son 2 yıl) | |
| 7-Zip 18.03 / 7z b 4 -mmt1 | |
| Sınıf ortalaması Office (3387 - 6469, n=74, son 2 yıl) | |
| Lenovo ThinkPad T14s-20UJS00K00 | |
| HP ProBook 445 G7 175W4EA | |
| Lenovo ThinkPad L14-20U50003GE | |
| Ortalama AMD Ryzen 5 4500U (4235 - 4338, n=11) | |
| Lenovo ThinkPad E14 Gen2-20T7S00W00 | |
| Lenovo ThinkPad T14s-20T00044GE | |
| Lenovo ThinkPad L490 20Q6S08600 | |
| Dell Latitude 14 5410-RJ80D | |
| 7-Zip 18.03 / 7z b 4 | |
| Sınıf ortalaması Office (7098 - 76886, n=74, son 2 yıl) | |
| Lenovo ThinkPad T14s-20UJS00K00 | |
| Lenovo ThinkPad L14-20U50003GE | |
| Ortalama AMD Ryzen 5 4500U (22466 - 25891, n=11) | |
| Lenovo ThinkPad E14 Gen2-20T7S00W00 | |
| HP ProBook 445 G7 175W4EA | |
| Dell Latitude 14 5410-RJ80D | |
| Lenovo ThinkPad T14s-20T00044GE | |
| Lenovo ThinkPad L490 20Q6S08600 | |
| Geekbench 5.5 / Single-Core | |
| Sınıf ortalaması Office (811 - 2148, n=71, son 2 yıl) | |
| Lenovo ThinkPad T14s-20UJS00K00 | |
| Dell Latitude 14 5410-RJ80D | |
| Ortalama AMD Ryzen 5 4500U (1082 - 1220, n=10) | |
| Lenovo ThinkPad E14 Gen2-20T7S00W00 | |
| HP ProBook 445 G7 175W4EA | |
| Lenovo ThinkPad L14-20U50003GE | |
| Lenovo ThinkPad T14s-20T00044GE | |
| Geekbench 5.5 / Multi-Core | |
| Sınıf ortalaması Office (1483 - 16999, n=71, son 2 yıl) | |
| Lenovo ThinkPad T14s-20UJS00K00 | |
| Ortalama AMD Ryzen 5 4500U (4352 - 6234, n=10) | |
| Lenovo ThinkPad E14 Gen2-20T7S00W00 | |
| HP ProBook 445 G7 175W4EA | |
| Lenovo ThinkPad L14-20U50003GE | |
| Lenovo ThinkPad T14s-20T00044GE | |
| Dell Latitude 14 5410-RJ80D | |
| HWBOT x265 Benchmark v2.2 / 4k Preset | |
| Sınıf ortalaması Office (2.21 - 26, n=73, son 2 yıl) | |
| Lenovo ThinkPad T14s-20UJS00K00 | |
| Lenovo ThinkPad E14 Gen2-20T7S00W00 | |
| Lenovo ThinkPad L14-20U50003GE | |
| Ortalama AMD Ryzen 5 4500U (5.86 - 7.33, n=10) | |
| Lenovo ThinkPad T14s-20T00044GE | |
| Lenovo ThinkPad L490 20Q6S08600 | |
| Dell Latitude 14 5410-RJ80D | |
| LibreOffice / 20 Documents To PDF | |
| HP ProBook 445 G7 175W4EA | |
| Dell Latitude 14 5410-RJ80D | |
| Ortalama AMD Ryzen 5 4500U (58.2 - 78, n=11) | |
| Lenovo ThinkPad E14 Gen2-20T7S00W00 | |
| Lenovo ThinkPad L14-20U50003GE | |
| Lenovo ThinkPad T14s-20UJS00K00 | |
| Sınıf ortalaması Office (39.9 - 102.3, n=73, son 2 yıl) | |
| Lenovo ThinkPad T14s-20T00044GE | |
| R Benchmark 2.5 / Overall mean | |
| Dell Latitude 14 5410-RJ80D | |
| Lenovo ThinkPad T14s-20T00044GE | |
| Lenovo ThinkPad L14-20U50003GE | |
| Lenovo ThinkPad E14 Gen2-20T7S00W00 | |
| Ortalama AMD Ryzen 5 4500U (0.614 - 0.654, n=10) | |
| Lenovo ThinkPad T14s-20UJS00K00 | |
| Sınıf ortalaması Office (0.4098 - 0.888, n=73, son 2 yıl) | |
* ... daha küçük daha iyidir
System Performance
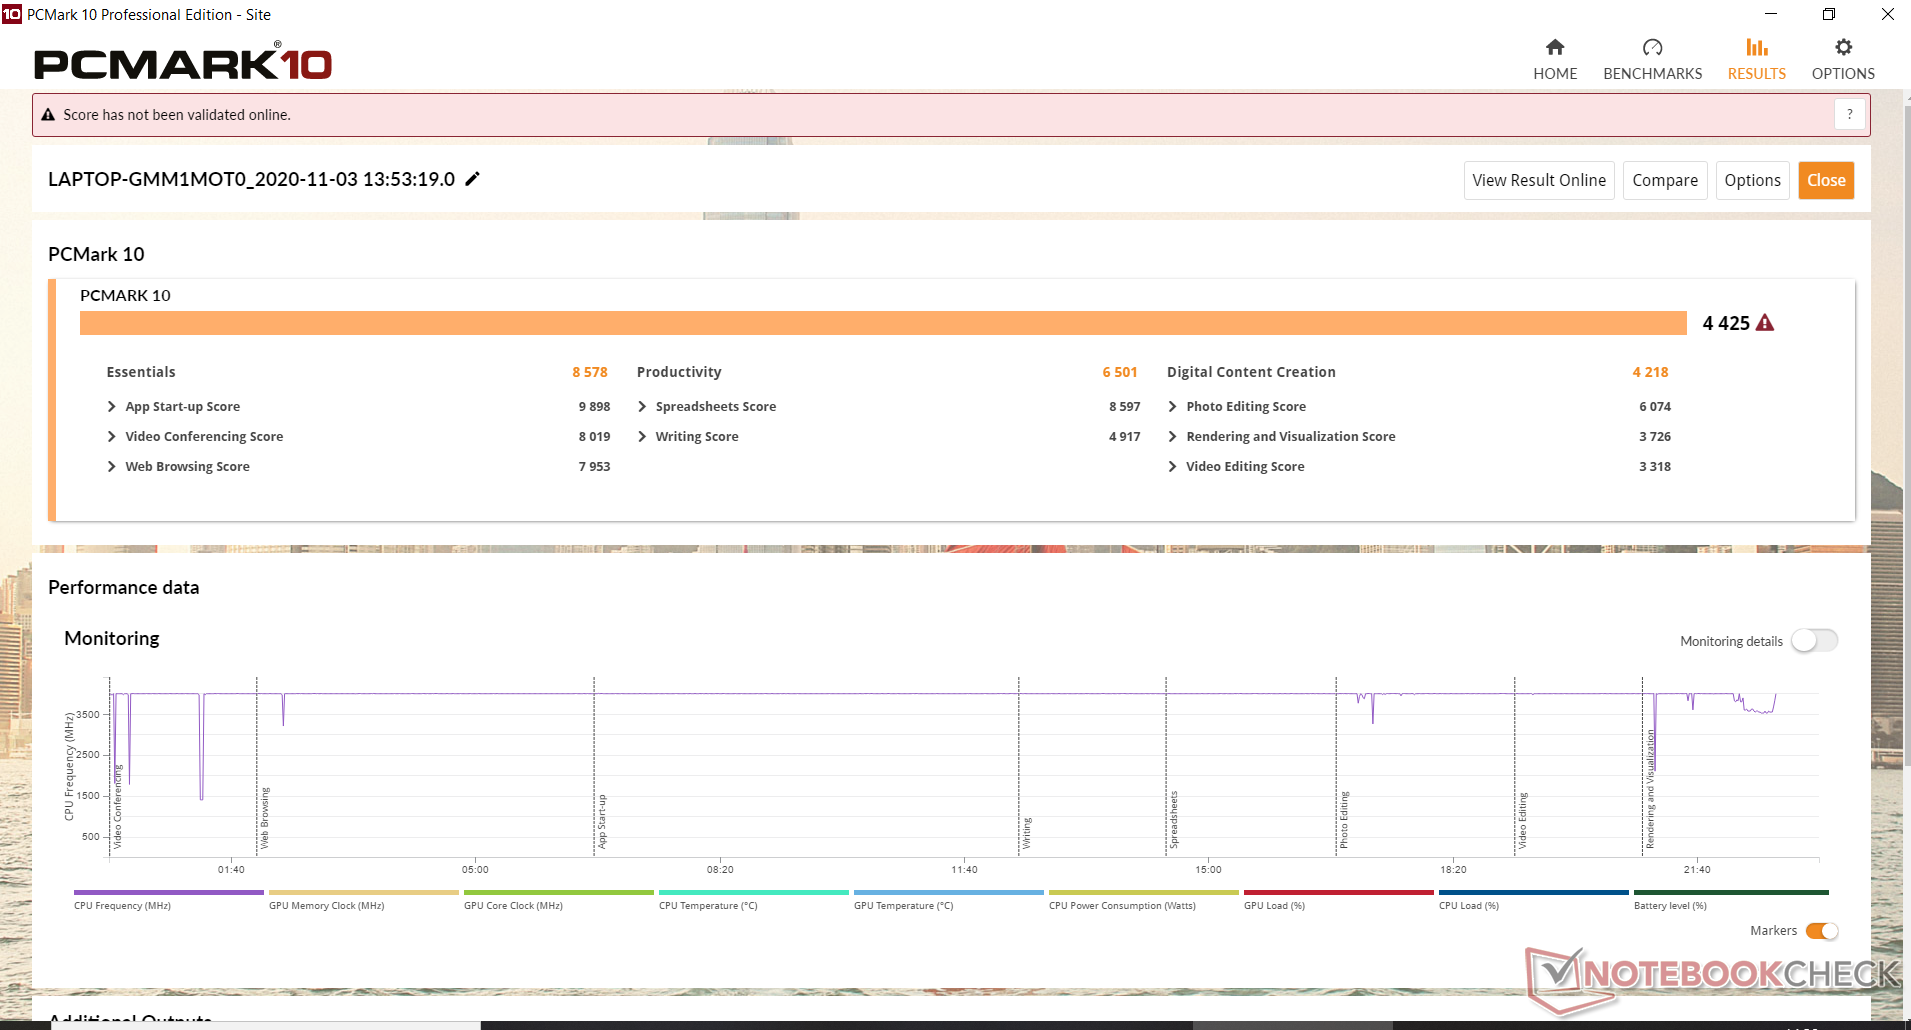
Compared to its competitors, the ThinkPad L14 performed average in PCMark 10. Nevertheless, it performed above average for an office and business notebook, which became noticeable not only in this particular synthetic benchmark but also during everyday use.
| PCMark 10 Score | 4425 puan | |
Yardım | ||
| DPC Latencies / LatencyMon - interrupt to process latency (max), Web, Youtube, Prime95 | |
| Acer TravelMate P6 P614-51T-G2-72ZU | |
| Lenovo ThinkPad T14s-20T00044GE | |
| Dell Latitude 14 5410-RJ80D | |
| Lenovo ThinkPad L14-20U50003GE | |
| HP ProBook 445 G7 175W4EA | |
| Lenovo ThinkPad E14 Gen2-20T7S00W00 | |
* ... daha küçük daha iyidir
Storage Devices
Our review unit featured a 512 GB Wester Digital SSD (WDC PC SN730 SDBQNTY-512GB) whose very important (from the operating system’s point of view at least) CrystalDiskMark 5.2 read/write 4K performance was lower than on all of its competitors. In AS SSD, its 4K read performance was lower than expected as well. We also found a significant performance difference between running on battery and running on mains. Without an active power supply, the read seq numbers dropped by almost 40 %.
| Lenovo ThinkPad L14-20U50003GE WDC PC SN730 SDBQNTY-512GB | Lenovo ThinkPad L490 20Q6S08600 Intel SSD Pro 7600p SSDPEKKF512G8L | Lenovo ThinkPad E14 Gen2-20T7S00W00 Toshiba BG4 KBG40ZNT512G | HP ProBook 445 G7 175W4EA Samsung PM991 MZVLQ512HALU | Dell Latitude 14 5410-RJ80D Toshiba KBG40ZNS256G NVMe | Lenovo ThinkPad T14s-20UJS00K00 WDC PC SN730 SDBPNTY-1T00 | Lenovo ThinkPad T14s-20T00044GE Samsung SSD PM981a MZVLB256HBHQ | Ortalama WDC PC SN730 SDBQNTY-512GB | |
|---|---|---|---|---|---|---|---|---|
| CrystalDiskMark 5.2 / 6 | 13% | 8% | 11% | 2% | 42% | 29% | 45% | |
| Write 4K (MB/s) | 76.7 | 128.3 67% | 102.3 33% | 144.6 89% | 95.5 25% | 108 41% | 117.5 53% | 140.9 ? 84% |
| Read 4K (MB/s) | 32.04 | 61.6 92% | 32.12 0% | 38.08 19% | 47.14 47% | 39.82 24% | 40.81 27% | 45.6 ? 42% |
| Write Seq (MB/s) | 1019 | 846 -17% | 1518 49% | 1320 30% | 1251 23% | 2028 99% | 2031 99% | 2066 ? 103% |
| Read Seq (MB/s) | 2014 | 1425 -29% | 1501 -25% | 1397 -31% | 1624 -19% | 1826 -9% | 1970 -2% | 2014 ? 0% |
| Write 4K Q32T1 (MB/s) | 415.6 | 503 21% | 356.4 -14% | 324.2 -22% | 333.5 -20% | 570 37% | 395.5 -5% | 472 ? 14% |
| Read 4K Q32T1 (MB/s) | 367.1 | 418.7 14% | 459.6 25% | 434.8 18% | 335.2 -9% | 401.5 9% | 361.4 -2% | 453 ? 23% |
| Write Seq Q32T1 (MB/s) | 1337 | 1391 4% | 1507 13% | 1382 3% | 1234 -8% | 3091 131% | 2330 74% | 2433 ? 82% |
| Read Seq Q32T1 (MB/s) | 2850 | 1570 -45% | 2327 -18% | 2354 -17% | 2247 -21% | 2872 1% | 2530 -11% | 3237 ? 14% |
| AS SSD | -15% | -64% | -21% | -81% | 13% | -7% | 0% | |
| Seq Read (MB/s) | 2247 | 1262 -44% | 2007 -11% | 1936 -14% | 1837 -18% | 2291 2% | 2631 17% | 2506 ? 12% |
| Seq Write (MB/s) | 1079 | 735 -32% | 1118 4% | 1213 12% | 700 -35% | 1343 24% | 1191 10% | 1655 ? 53% |
| 4K Read (MB/s) | 42.52 | 46.44 9% | 46.95 10% | 44.09 4% | 44.5 5% | 42.56 0% | 44.76 5% | 42.2 ? -1% |
| 4K Write (MB/s) | 129.1 | 137.5 7% | 124 -4% | 118.5 -8% | 90.1 -30% | 132.2 2% | 124.7 -3% | 127.5 ? -1% |
| 4K-64 Read (MB/s) | 1316 | 685 -48% | 1221 -7% | 867 -34% | 905 -31% | 850 -35% | 756 -43% | 1061 ? -19% |
| 4K-64 Write (MB/s) | 1332 | 905 -32% | 774 -42% | 838 -37% | 447.8 -66% | 2262 70% | 1300 -2% | 1480 ? 11% |
| Access Time Read * (ms) | 0.086 | 0.025 71% | 0.108 -26% | 0.122 -42% | 0.16 -86% | 0.05 42% | 0.089 -3% | 0.1012 ? -18% |
| Access Time Write * (ms) | 0.029 | 0.025 14% | 0.195 -572% | 0.034 -17% | 0.175 -503% | 0.028 3% | 0.03 -3% | 0.03833 ? -32% |
| Score Read (Points) | 1583 | 858 -46% | 1468 -7% | 1105 -30% | 1133 -28% | 1121 -29% | 1064 -33% | 1354 ? -14% |
| Score Write (Points) | 1569 | 1116 -29% | 1009 -36% | 1078 -31% | 608 -61% | 2529 61% | 1544 -2% | 1772 ? 13% |
| Score Total (Points) | 3907 | 2400 -39% | 3191 -18% | 2721 -30% | 2273 -42% | 4185 7% | 3090 -21% | 3781 ? -3% |
| Copy ISO MB/s (MB/s) | 1164 | 1181 | 2546 | 1813 | 1903 ? | |||
| Copy Program MB/s (MB/s) | 445.1 | 410.5 | 428.6 | 524 | 533 ? | |||
| Copy Game MB/s (MB/s) | 646 | 835 | 943 | 350.5 | 1074 ? | |||
| Toplam Ortalama (Program / Ayarlar) | -1% /
-3% | -28% /
-34% | -5% /
-7% | -40% /
-46% | 28% /
25% | 11% /
8% | 23% /
19% |
* ... daha küçük daha iyidir

Sustained Read: DiskSpd Read Loop, Queue Depth 8
GPU Performance
The Ryzen 5 features an AMD Radeon RX Vega 6 GPU with 8 CUs running at 1.2 GHz. This new GPU is a giant leap compared to the L490’s ancient Intel UHD Graphics 620, which is best exemplified by the fact that scores in 3DMark 11 doubled. Thus, the AMD-powered L-series is capable of taking on its Intel-equipped T-series that continues to include Intel’s UHD Graphics 620, and thus only performed half as well in our benchmarks. That said our review unit could have achieved even better scores with dual-channel RAM instead of its default single-channel configuration. Take for example the ThinkPad E14 with the very same iGPU as the L14 but dual-channel instead of single-channel mode RAM: it ran up to 29 % faster.
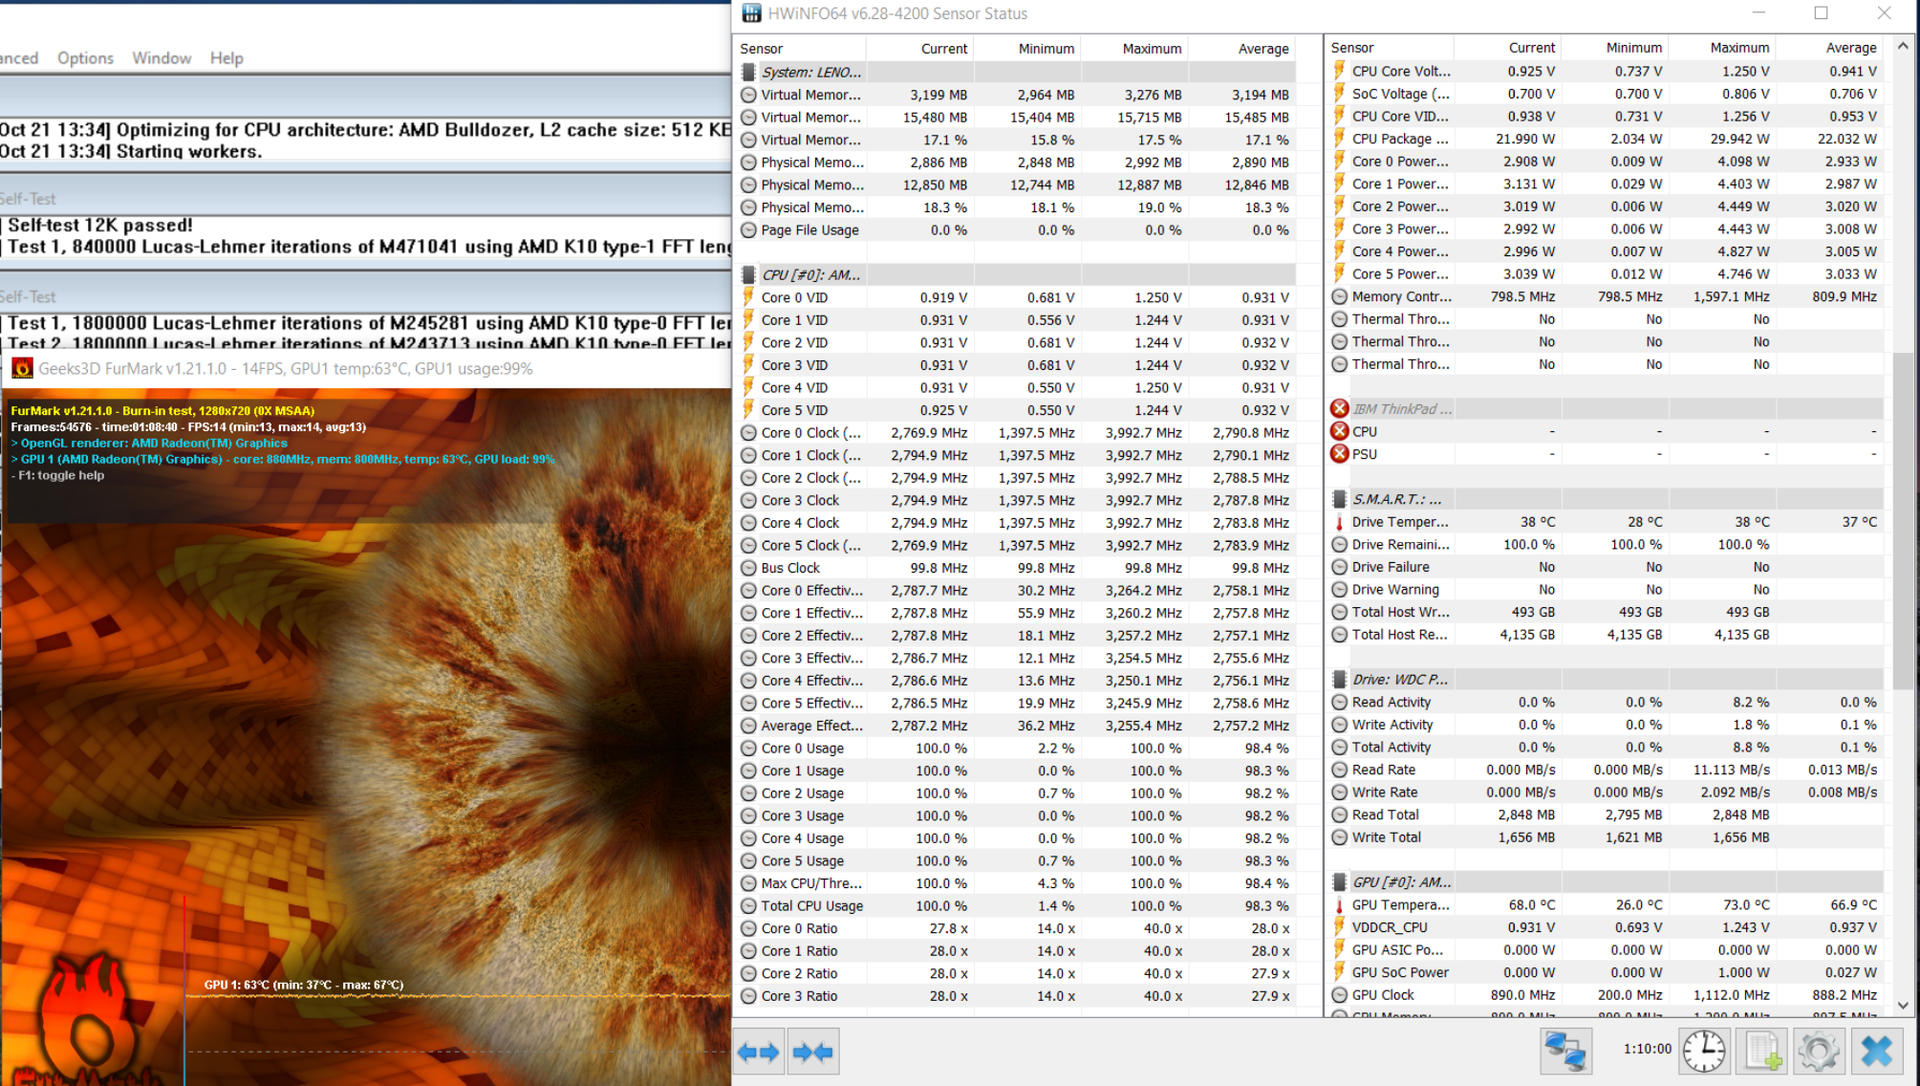
The L14 passed our stress test with flying colors. You will find more details in the emissions section under temperature below. Performance dropped slightly on battery. In 3DMark 11, we noticed a 5 % decrease in CPU (6,664 vs. 7,061 in Physics) and 9 % decrease in GPU performance (3,092 vs. 3,401 in Graphics).Gaming performance was right where we would have expected it to be. Overall, the L14 performed slightly below average for an AMD Radeon RX Vega 6. AMD’s Radeon RX Vega 7, such as we find for example in Lenovo’s T14s, was significantly faster, and outperformed our L14 by 10 FPS on average in FHD, a very common gaming display resolution.
| 3DMark 11 - 1280x720 Performance GPU | |
| Sınıf ortalaması Office (2551 - 18313, n=69, son 2 yıl) | |
| Lenovo ThinkPad T14s-20UJS00K00 | |
| Lenovo ThinkPad E14 Gen2-20T7S00W00 | |
| Ortalama AMD Radeon RX Vega 6 (Ryzen 4000/5000) (3401 - 4713, n=23) | |
| HP ProBook 445 G7 175W4EA | |
| Lenovo ThinkPad L14-20U50003GE | |
| Dell Latitude 14 5410-RJ80D | |
| Lenovo ThinkPad L490 20Q6S08600 | |
| 3DMark | |
| 1280x720 Cloud Gate Standard Graphics | |
| Sınıf ortalaması Office (11640 - 118515, n=37, son 2 yıl) | |
| Lenovo ThinkPad E14 Gen2-20T7S00W00 | |
| Ortalama AMD Radeon RX Vega 6 (Ryzen 4000/5000) (15227 - 24163, n=16) | |
| HP ProBook 445 G7 175W4EA | |
| Dell Latitude 14 5410-RJ80D | |
| Lenovo ThinkPad L490 20Q6S08600 | |
| 1920x1080 Fire Strike Graphics | |
| Sınıf ortalaması Office (736 - 21871, n=72, son 2 yıl) | |
| Lenovo ThinkPad T14s-20UJS00K00 | |
| Lenovo ThinkPad E14 Gen2-20T7S00W00 | |
| Ortalama AMD Radeon RX Vega 6 (Ryzen 4000/5000) (2122 - 3239, n=23) | |
| HP ProBook 445 G7 175W4EA | |
| Lenovo ThinkPad L14-20U50003GE | |
| Dell Latitude 14 5410-RJ80D | |
| Lenovo ThinkPad L490 20Q6S08600 | |
| 2560x1440 Time Spy Graphics | |
| Sınıf ortalaması Office (493 - 6679, n=67, son 2 yıl) | |
| Lenovo ThinkPad E14 Gen2-20T7S00W00 | |
| Ortalama AMD Radeon RX Vega 6 (Ryzen 4000/5000) (650 - 996, n=22) | |
| Dell Latitude 14 5410-RJ80D | |
| 3DMark 11 Performance | 3531 puan | |
| 3DMark Fire Strike Score | 2025 puan | |
Yardım | ||
Gaming Performance
Gaming performance was right where we would have expected it to be. Overall, the L14 performed slightly below average for an AMD Radeon RX Vega 6. AMD’s Radeon RX Vega 7, such as we find for example in Lenovo’s T14s, was significantly faster, and outperformed our L14 by 10 FPS on average in FHD, a very common gaming display resolution.
| The Witcher 3 | |
| 1024x768 Low Graphics & Postprocessing | |
| Lenovo ThinkPad T14s-20UJS00K00 | |
| Lenovo ThinkPad E14 Gen2-20T7S00W00 | |
| Ortalama AMD Radeon RX Vega 6 (Ryzen 4000/5000) (32.8 - 60, n=21) | |
| Sınıf ortalaması Office (32.2 - 61.2, n=2, son 2 yıl) | |
| HP ProBook 445 G7 175W4EA | |
| Lenovo ThinkPad L14-20U50003GE | |
| Dell Latitude 14 5410-RJ80D | |
| Lenovo ThinkPad T14s-20T00044GE | |
| 1366x768 Medium Graphics & Postprocessing | |
| Sınıf ortalaması Office (44.7 - 50.4, n=2, son 2 yıl) | |
| Ortalama AMD Radeon RX Vega 6 (Ryzen 4000/5000) (21.3 - 39, n=13) | |
| HP ProBook 445 G7 175W4EA | |
| 1920x1080 High Graphics & Postprocessing (Nvidia HairWorks Off) | |
| Sınıf ortalaması Office (23.7 - 33.4, n=2, son 2 yıl) | |
| Lenovo ThinkPad T14s-20UJS00K00 | |
| Lenovo ThinkPad E14 Gen2-20T7S00W00 | |
| Ortalama AMD Radeon RX Vega 6 (Ryzen 4000/5000) (10.7 - 19.4, n=20) | |
| Lenovo ThinkPad L14-20U50003GE | |
| HP ProBook 445 G7 175W4EA | |
| F1 2020 | |
| 1280x720 Ultra Low Preset | |
| Lenovo ThinkPad T14s-20UJS00K00 | |
| Ortalama AMD Radeon RX Vega 6 (Ryzen 4000/5000) (49.7 - 74, n=7) | |
| Lenovo ThinkPad L14-20U50003GE | |
| Acer TravelMate P6 P614-51T-G2-72ZU | |
| 1920x1080 Medium Preset AF:16x | |
| Lenovo ThinkPad T14s-20UJS00K00 | |
| Ortalama AMD Radeon RX Vega 6 (Ryzen 4000/5000) (20 - 34, n=7) | |
| Lenovo ThinkPad L14-20U50003GE | |
| Acer TravelMate P6 P614-51T-G2-72ZU | |
| 1920x1080 High Preset AA:T AF:16x | |
| Lenovo ThinkPad T14s-20UJS00K00 | |
| Ortalama AMD Radeon RX Vega 6 (Ryzen 4000/5000) (15 - 26, n=6) | |
| Lenovo ThinkPad L14-20U50003GE | |
| Acer TravelMate P6 P614-51T-G2-72ZU | |
| 1920x1080 Ultra High Preset AA:T AF:16x | |
| Lenovo ThinkPad T14s-20UJS00K00 | |
| Ortalama AMD Radeon RX Vega 6 (Ryzen 4000/5000) (14 - 19, n=4) | |
| Lenovo ThinkPad L14-20U50003GE | |
| düşük | orta | yüksek | ultra | |
|---|---|---|---|---|
| The Witcher 3 (2015) | 35 | 11.8 | ||
| Dota 2 Reborn (2015) | 90.6 | 70.7 | 34.7 | 32.7 |
| X-Plane 11.11 (2018) | 37.9 | 27.8 | 25.1 | |
| F1 2020 (2020) | 52 | 25 | 19 | 14 |
Emissions – Quiet Fan, Quiet Speaker
Noise Emissions
Just like its predecessor and the ThinkPad T14s our review unit remained pleasantly quiet overall. It peaked at just 32.8 dB(A) during our stress test, which was a pleasant surprise. Fan noise frequency was also very pleasant overall and not at all annoying even after long periods of time. We found no evidence of coil whine on our review unit.
Ses yüksekliği
| Boşta |
| 29.2 / 29.2 / 29.7 dB |
| Çalışırken |
| 30.5 / 32.8 dB |
 | ||
30 dB sessiz 40 dB(A) duyulabilirlik 50 dB(A) gürültülü |
||
min: | ||
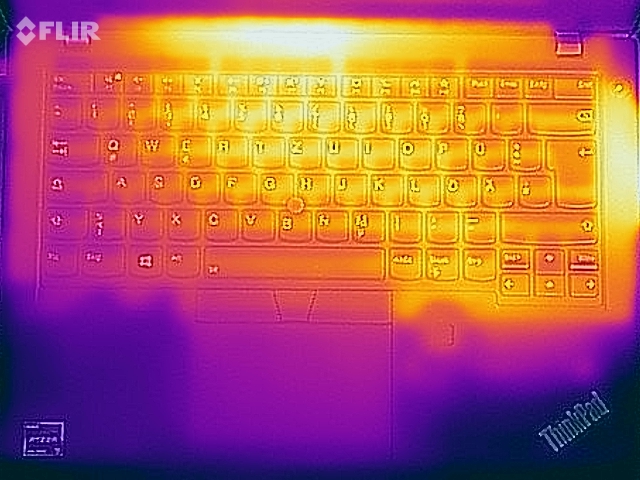
Temperature
Overall, the ThinkPad L14’s temperatures around the keyboard area were better than its L490 predecessor’s with Whiskey Lake that tended to reach up to 46 °C in the top right corner. In comparison, our AMD-powered review unit peaked at 43 °C. Unfortunately, temperatures around the palm rests are around 7 °C higher than on the L490. The L14’s hot spot is located at the bottom rear where it peaked at around 50 °C – too hot for lap use.
Power consumption very quickly settled at 25 W during our stress test resulting in around 2.8 GHz and around 890 MHz for CPU and GPU, respectively.
(±) Üst taraftaki maksimum sıcaklık, 34.3 °C / 94 F ortalamasına kıyasla 42.9 °C / 109 F'dir. , Office sınıfı için 21.2 ile 62.5 °C arasında değişir.
(-) Alt kısım, 36.8 °C / 98 F ortalamasına kıyasla maksimum 49.5 °C / 121 F'ye kadar ısınır
(+) Boşta kullanımda, üst tarafın ortalama sıcaklığı 25.2 °C / 77 F olup, cihazın 29.5 °C / 85 F.
(+) Avuç içi dayanakları ve dokunmatik yüzey maksimum (32.4 °C / 90.3 F) cilt sıcaklığına ulaşıyor ve bu nedenle sıcak değil.
(-) Benzer cihazların avuç içi dayanağı alanının ortalama sıcaklığı 27.5 °C / 81.5 F (-4.9 °C / -8.8 F) idi.

Speakers
Lenovo ThinkPad L14-20U50003GE ses analizi
(-) | hoparlörler çok yüksek ses çıkarmıyor (68.7 dB)
Bas 100 - 315Hz
(±) | azaltılmış bas - ortalama olarak medyandan 10.8% daha düşük
(±) | Bas doğrusallığı ortalamadır (11.4% delta - önceki frekans)
Ortalar 400 - 2000 Hz
(±) | daha yüksek ortalar - ortalama olarak medyandan 6.1% daha yüksek
(+) | orta frekanslar doğrusaldır (5.1% deltadan önceki frekansa)
Yüksekler 2 - 16 kHz
(+) | dengeli yüksekler - medyandan yalnızca 3% uzakta
(±) | Yükseklerin doğrusallığı ortalamadır (9.5% delta - önceki frekans)
Toplam 100 - 16.000 Hz
(±) | Genel sesin doğrusallığı ortalamadır (23.8% ortancaya göre fark)
Aynı sınıfla karşılaştırıldığında
» Bu sınıftaki tüm test edilen cihazların %68%'si daha iyi, 8% benzer, 23% daha kötüydü
» En iyisinin deltası 7% idi, ortalama 21% idi, en kötüsü 53% idi
Test edilen tüm cihazlarla karşılaştırıldığında
» Test edilen tüm cihazların %71'si daha iyi, 6 benzer, % 22 daha kötüydü
» En iyisinin deltası 4% idi, ortalama 24% idi, en kötüsü 134% idi
HP ProBook 445 G7 175W4EA ses analizi
(±) | hoparlör ses yüksekliği ortalama ama iyi (76.8 dB)
Bas 100 - 315Hz
(-) | neredeyse hiç bas yok - ortalama olarak medyandan 25.1% daha düşük
(±) | Bas doğrusallığı ortalamadır (9.5% delta - önceki frekans)
Ortalar 400 - 2000 Hz
(+) | dengeli ortalar - medyandan yalnızca 3.1% uzakta
(±) | Ortaların doğrusallığı ortalamadır (9% delta - önceki frekans)
Yüksekler 2 - 16 kHz
(+) | dengeli yüksekler - medyandan yalnızca 4.8% uzakta
(+) | yüksekler doğrusaldır (5.7% deltadan önceki frekansa)
Toplam 100 - 16.000 Hz
(±) | Genel sesin doğrusallığı ortalamadır (19.8% ortancaya göre fark)
Aynı sınıfla karşılaştırıldığında
» Bu sınıftaki tüm test edilen cihazların %41%'si daha iyi, 9% benzer, 51% daha kötüydü
» En iyisinin deltası 7% idi, ortalama 21% idi, en kötüsü 53% idi
Test edilen tüm cihazlarla karşılaştırıldığında
» Test edilen tüm cihazların %50'si daha iyi, 7 benzer, % 42 daha kötüydü
» En iyisinin deltası 4% idi, ortalama 24% idi, en kötüsü 134% idi
Dell Latitude 14 5410-RJ80D ses analizi
(±) | hoparlör ses yüksekliği ortalama ama iyi (77.5 dB)
Bas 100 - 315Hz
(-) | neredeyse hiç bas yok - ortalama olarak medyandan 19.7% daha düşük
(±) | Bas doğrusallığı ortalamadır (8.7% delta - önceki frekans)
Ortalar 400 - 2000 Hz
(+) | dengeli ortalar - medyandan yalnızca 4.6% uzakta
(±) | Ortaların doğrusallığı ortalamadır (7.4% delta - önceki frekans)
Yüksekler 2 - 16 kHz
(±) | daha yüksek en yüksekler - ortalama olarak medyandan 5.2% daha yüksek
(+) | yüksekler doğrusaldır (5.1% deltadan önceki frekansa)
Toplam 100 - 16.000 Hz
(±) | Genel sesin doğrusallığı ortalamadır (16% ortancaya göre fark)
Aynı sınıfla karşılaştırıldığında
» Bu sınıftaki tüm test edilen cihazların %18%'si daha iyi, 6% benzer, 76% daha kötüydü
» En iyisinin deltası 7% idi, ortalama 21% idi, en kötüsü 53% idi
Test edilen tüm cihazlarla karşılaştırıldığında
» Test edilen tüm cihazların %25'si daha iyi, 5 benzer, % 70 daha kötüydü
» En iyisinin deltası 4% idi, ortalama 24% idi, en kötüsü 134% idi
Energy Management – AMD Is Power Hungry
Power Consumption
Compared to its predecessor, power consumption increased by around 13 %. At maximum load it drew 50.6 W through its 65 W power supply. Our comparison table also reveals that Lenovo’s AMD-powered notebooks on average tend to have a higher power consumption than their Intel-equipped counterparts.
| Kapalı / Bekleme modu | |
| Boşta | |
| Çalışırken |
|
Key:
min: | |
| Lenovo ThinkPad L14-20U50003GE R5 4500U, Vega 6, WDC PC SN730 SDBQNTY-512GB, IPS, 1920x1080, 14" | Lenovo ThinkPad L490 20Q6S08600 i5-8265U, UHD Graphics 620, Intel SSD Pro 7600p SSDPEKKF512G8L, IPS, 1920x1080, 14" | Lenovo ThinkPad T14s-20T00044GE i5-10210U, UHD Graphics 620, Samsung SSD PM981a MZVLB256HBHQ, LTPS AHVA-IPS LED, 1920x1080, 14" | HP ProBook 445 G7 175W4EA R5 4500U, Vega 6, Samsung PM991 MZVLQ512HALU, IPS, 1920x1080, 14" | Dell Latitude 14 5410-RJ80D i5-10310U, UHD Graphics 620, Toshiba KBG40ZNS256G NVMe, a-Si IPS LED, 1920x1080, 14" | Lenovo ThinkPad E14 Gen2-20T7S00W00 R5 4500U, Vega 6, Toshiba BG4 KBG40ZNT512G, a-Si IPS LED, 1920x1080, 14" | Lenovo ThinkPad T14s-20UJS00K00 R7 PRO 4750U, Vega 7, WDC PC SN730 SDBPNTY-1T00, IPS , 1920x1080, 14" | Ortalama AMD Radeon RX Vega 6 (Ryzen 4000/5000) | Sınıf ortalaması Office | |
|---|---|---|---|---|---|---|---|---|---|
| Power Consumption | 13% | 16% | 11% | 13% | -7% | -14% | 3% | -11% | |
| Idle Minimum * (Watt) | 4.4 | 3.5 20% | 2.6 41% | 3.5 20% | 2.9 34% | 4.6 -5% | 5.7 -30% | 3.98 ? 10% | 4.4 ? -0% |
| Idle Average * (Watt) | 7.7 | 6.3 18% | 5.5 29% | 6.2 19% | 4.5 42% | 7.6 1% | 8.9 -16% | 6.53 ? 15% | 7.35 ? 5% |
| Idle Maximum * (Watt) | 8.9 | 8.7 2% | 7.5 16% | 8.8 1% | 7.4 17% | 9.7 -9% | 11 -24% | 8.65 ? 3% | 8.57 ? 4% |
| Load Average * (Watt) | 31.3 | 28.7 8% | 28.2 10% | 30 4% | 34.6 -11% | 39.1 -25% | 38.2 -22% | 35 ? -12% | 43.5 ? -39% |
| Witcher 3 ultra * (Watt) | 33 | ||||||||
| Load Maximum * (Watt) | 50.6 | 41.8 17% | 59.6 -18% | 45 11% | 60 -19% | 50.3 1% | 40.2 21% | 51.5 ? -2% | 64.5 ? -27% |
* ... daha küçük daha iyidir
Battery Life
Compared to its Whiskey Lake-equipped predecessor the AMD Ryzen 5-powered L14 ran about an hour longer under full load but shorter during video playback in return. In this particular test, the L14 landed in last place of its comparison group.
| Lenovo ThinkPad L14-20U50003GE R5 4500U, Vega 6, 45 Wh | Lenovo ThinkPad L490 20Q6S08600 i5-8265U, UHD Graphics 620, 45 Wh | Lenovo ThinkPad E14 Gen2-20T7S00W00 R5 4500U, Vega 6, 45 Wh | Lenovo ThinkPad T14s-20T00044GE i5-10210U, UHD Graphics 620, 57 Wh | HP ProBook 445 G7 175W4EA R5 4500U, Vega 6, 45 Wh | Dell Latitude 14 5410-RJ80D i5-10310U, UHD Graphics 620, 68 Wh | Lenovo ThinkPad T14s-20UJS00K00 R7 PRO 4750U, Vega 7, 57 Wh | Sınıf ortalaması Office | |
|---|---|---|---|---|---|---|---|---|
| Pil Çalışma Süresi | 4% | -17% | 37% | -13% | 47% | 24% | 39% | |
| H.264 (h) | 8.3 | 11.1 34% | 9.1 10% | 14.7 77% | 15.2 83% | 13.2 59% | 15.1 ? 82% | |
| WiFi v1.3 (h) | 8.1 | 7.9 -2% | 8.3 2% | 13.2 63% | 8.7 7% | 13.7 69% | 10.2 26% | 12.9 ? 59% |
| Load (h) | 2.4 | 1.9 -21% | 0.9 -62% | 1.7 -29% | 1.6 -33% | 2.1 -12% | 2.1 -12% | 1.795 ? -25% |
| Reader / Idle (h) | 18.6 | 12.4 | 23.7 ? |
Artılar
Eksiler
Verdict – A Breath of Fresh Air thanks to AMD
Lenovo did an overall very good job with the ThinkPad L14, which continues to emphasize Lenovo’s traditional strengths such as its sturdy high-quality case, its pleasant-to-use keyboard, straightforward maintenance, and an interesting collection of ports and connectivity including a smart card reader as well as a docking port for business users.
On the other hand, Lenovo missed its opportunity to improve upon the L490’s weaknesses, such as for example the dim display or its overall poor speakers that lack both volume and bass. Lenovo’s choice of display panel is a sore point in particular, and we would have wished for a wiser choice.
The most important achievement for the L-series is the introduction of AMD’s Ryzen 5 4500U. In our reviews of the ThinkPad E14 and T14 the AMD SKUs proved to perform much better than the Intel SKUs, and the same holds true with the L14 as well. AMD is simply better.
There was no noticeable throttling and thus no drop in performance during our CineBench loop. In contrast, Intel CPUs tend to lose a lot of performance after the first run due to performance throttling. The price you pay for this increase in performance is a slightly higher power consumption as well as higher surface temperatures at the bottom under maximum load. The GPU’s comparatively poor performance can be easily remedied by adding a second RAM module.
AMD brings a breath of fresh air to Lenovo’s ThinkPad series, and changes the traditional rules. Intel’s dominance is about to falter as AMD not only offers lower prices but also a significant performance boost. Thus, we have no choice but to once again highly recommend the AMD SKU over its Intel counterpart.
Lenovo ThinkPad L14-20U50003GE
- 12/14/2020 v7 (old)
Daniel Puschina
Price comparison

