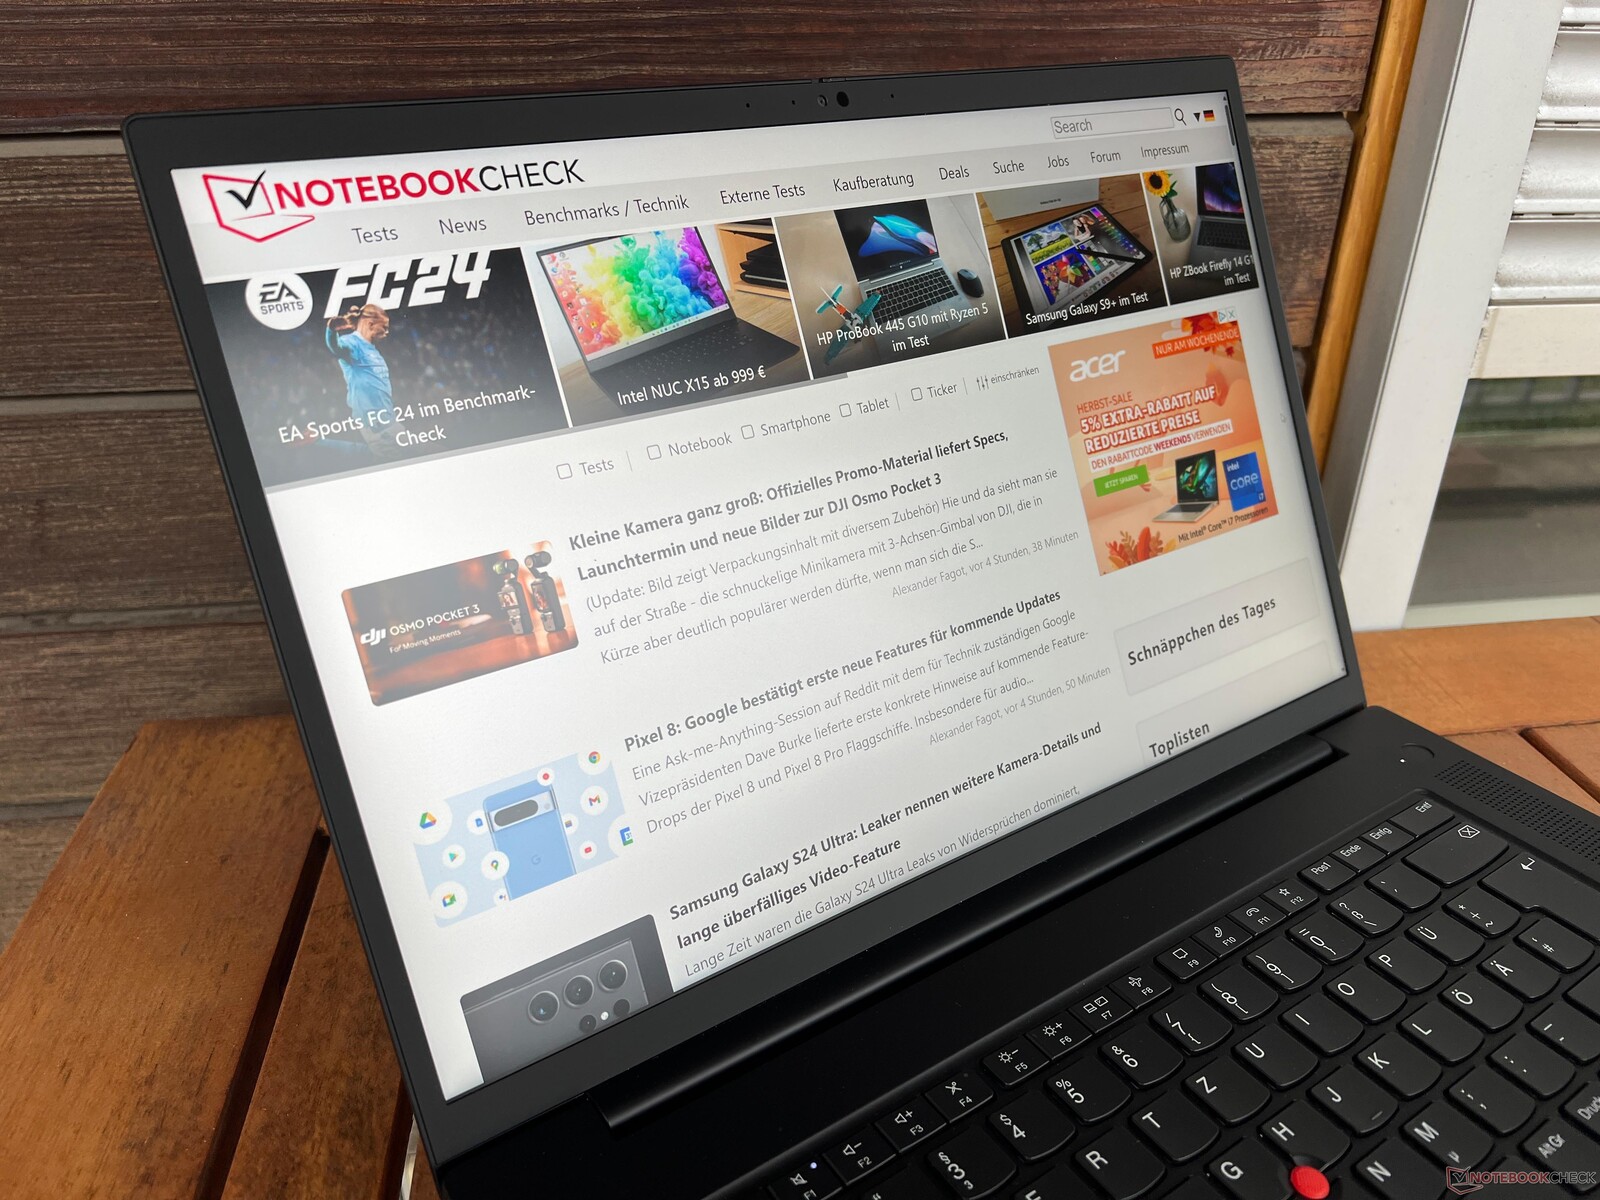
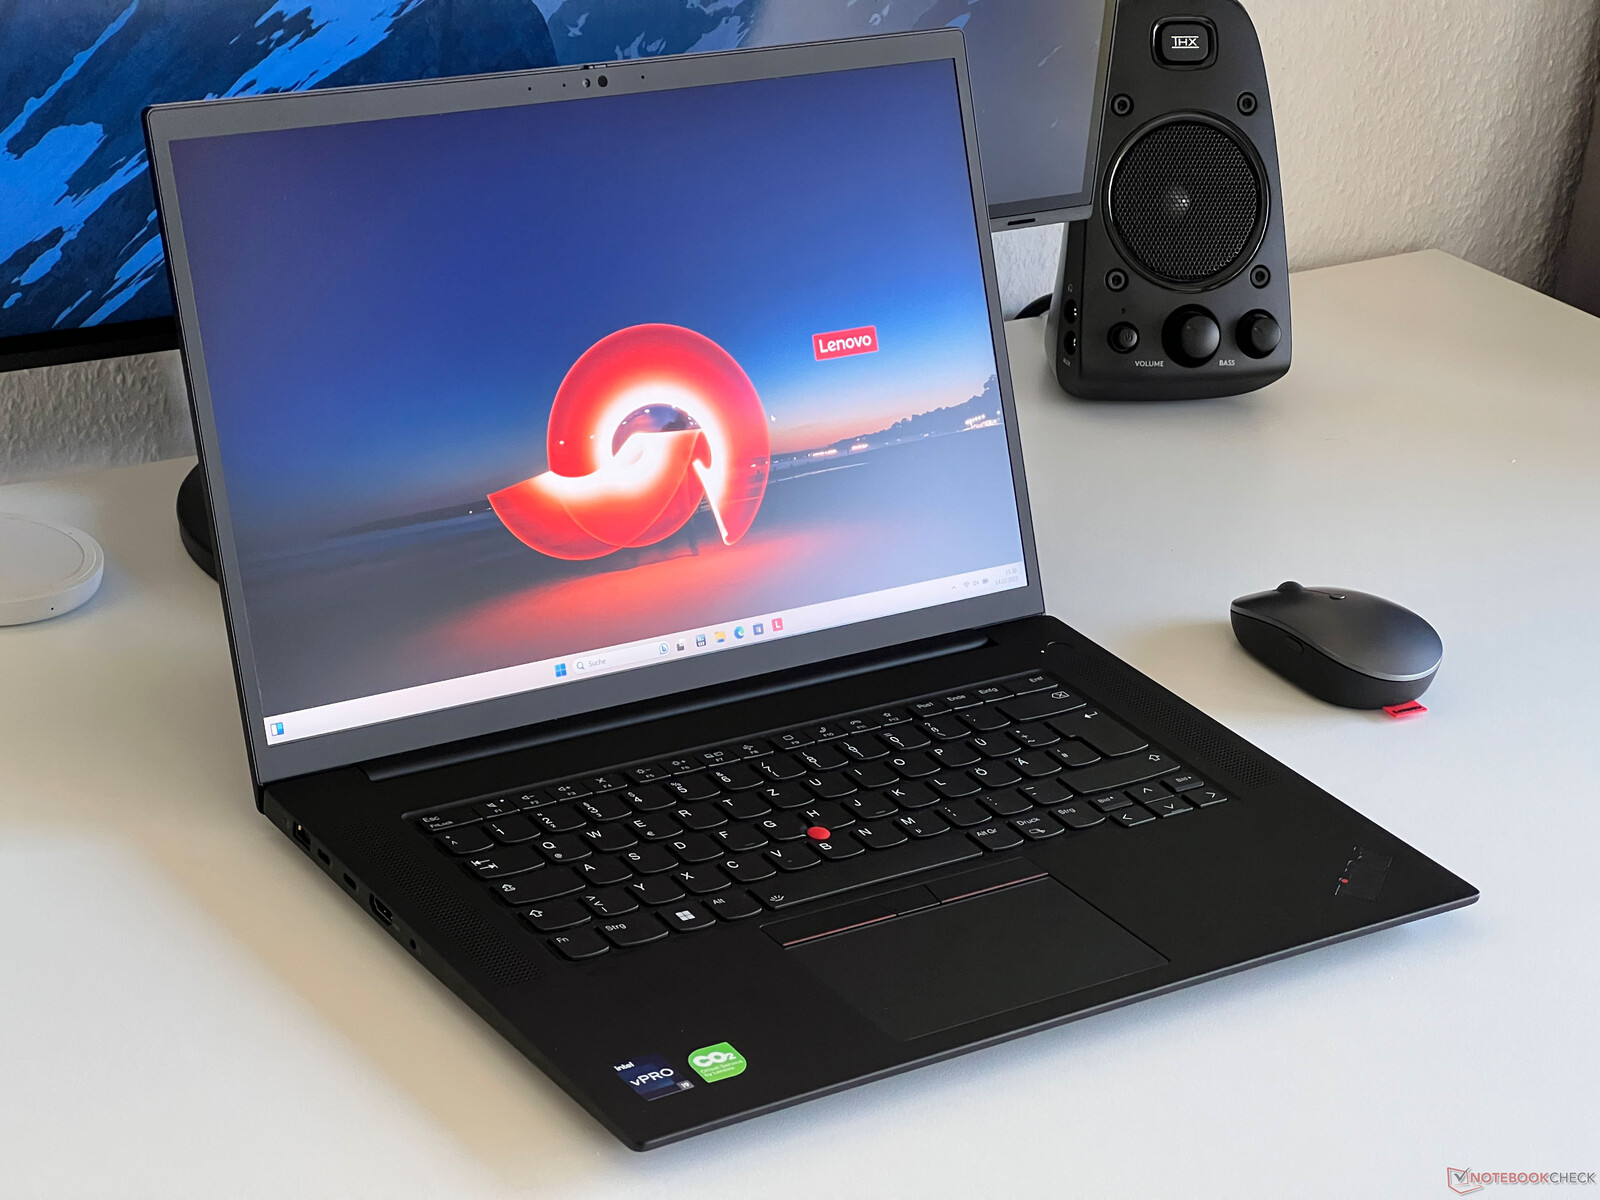
Lenovo ThinkPad P1 G6 dizüstü bilgisayar incelemede - Mobil iş istasyonu ThinkPad X1 Extreme'in yerini alıyor
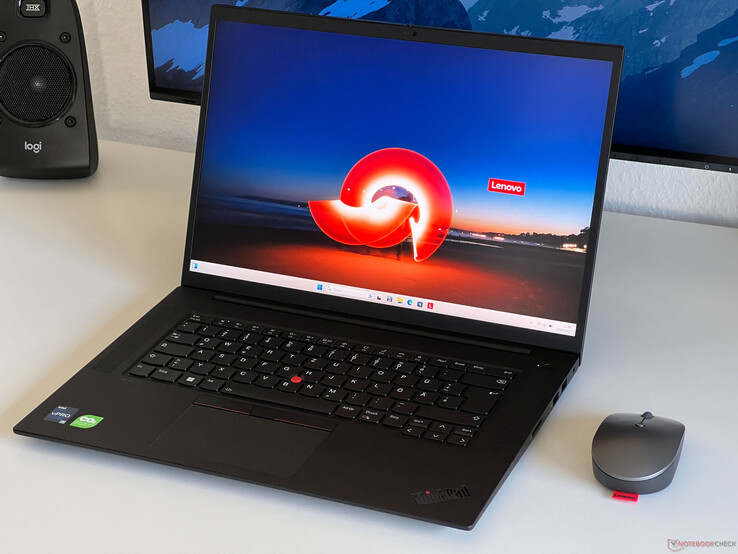
Lenovo yıllarca ürün gamında 16 inçlik iki büyük model bulundurdu: Lenovo ThinkPad X1 Extreme ve onunla aynı yapıya sahip iş istasyonu ThinkPad P1. Şimdi, portföy modernize edildi ve yeni ThinkPad P1 Gen 6 her iki rolü de hemen üstleniyor. Geçen yılın halefi yok ThinkPad X1 Extreme Gen 5 artık yok. Yeni ThinkPad P1 Gen 6, hem tüketici GeForce GPU'ları hem de profesyonel sınıf grafik adaptörleri ile sunuluyor ve seçimde çok yönlülük sunuyor. Özellikle, kasa tasarımı büyük ölçüde değişmedi ve iki temel model hala sunuluyor. Seçilen grafik kartına bağlı olarak geleneksel soğutma ya da buhar odası ( GeForce RTX 4060/RTX 3500 Ada için) kullanılıyor.
ThinkPad P1 Gen 6'daki bileşen yelpazesi oldukça geniş. Her zaman Intel'in en yeni 45 Watt Raptor-Lake CPU'larını kullanır ve grafik kartı seçenekleri RTX 1000 Ada'dan RTX 5000 Ada'ya (veya GeForce RTX 4060, 4080 veya 4090) kadar değişir. Bu geniş çeşitlilik önemli fiyat farklılıklarına yol açmaktadır. Core i7-13700H, 32 GB RAM ve RTX 1000 Ada ile donatılmış temel model şu anda yaklaşık 2850 USD'den başlıyor. Ancak Core i9, RTX 5000 Ada, 96 GB RAM ve OLED ekrana sahip üst düzey konfigürasyonlarda fiyatlar 6.350 USD'yi kolayca aşabiliyor.
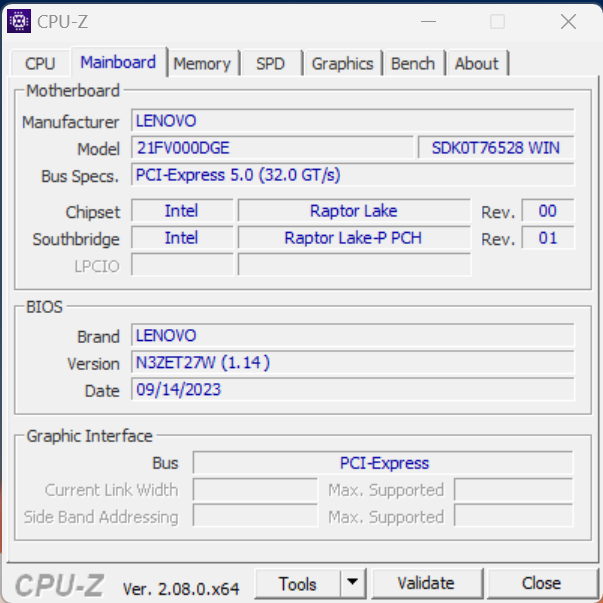
21FV000DGE ürün numarasıyla tanımlanan test cihazımızın fiyatı şu anda ~3.400 USD civarında. Özellikleri Core i9-13900HrTX 2000 Ada, 32 GB RAM ve 1 TB SSD'ye sahiptir. Ayrıca, 165 Hz yenileme hızına sahip isteğe bağlı WQHD IPS paneli de içeriyor. Lenovo'nun Campus programına erişimi olanlar bu modeli yaklaşık 3.000 USD karşılığında alabilirler.
Karşılaştırmalı olarak olası rakipler
Derecelendirme | Tarih | Modeli | Ağırlık | Yükseklik | Boyut | Çözünürlük | Fiyat |
|---|---|---|---|---|---|---|---|
| 91.7 % v7 (old) | 10/2023 | Lenovo ThinkPad P1 G6-21FV000DGE i9-13900H, RTX 2000 Ada Generation Laptop | 1.9 kg | 17.5 mm | 16.00" | 2560x1600 | |
| 89 % v7 (old) | 09/2023 | Dell Precision 5000 5680 i9-13900H, RTX 5000 Ada Generation Laptop | 2.3 kg | 22.17 mm | 16.00" | 3840x2400 | |
| 88.8 % v7 (old) | 02/2023 | Samsung Galaxy Book3 Ultra 16, i9-13900H RTX 4070 i9-13900H, GeForce RTX 4070 Laptop GPU | 1.8 kg | 16.8 mm | 16.00" | 2880x1800 | |
| 90.1 % v7 (old) | 01/2023 | HP ZBook Studio 16 G9 62U04EA i7-12800H, RTX A2000 Laptop GPU | 1.8 kg | 19 mm | 16.00" | 3840x2400 | |
| 84.3 % v7 (old) | MSI CreatorPro Z16P B12UKST i7-12700H, RTX A3000 Laptop GPU | 2.4 kg | 19 mm | 16.00" | 2560x1600 | ||
| 88.6 % v7 (old) | 11/2023 | Schenker VISION 16 Pro (M23) i7-13700H, GeForce RTX 4070 Laptop GPU | 1.6 kg | 17.1 mm | 16.00" | 2560x1600 |
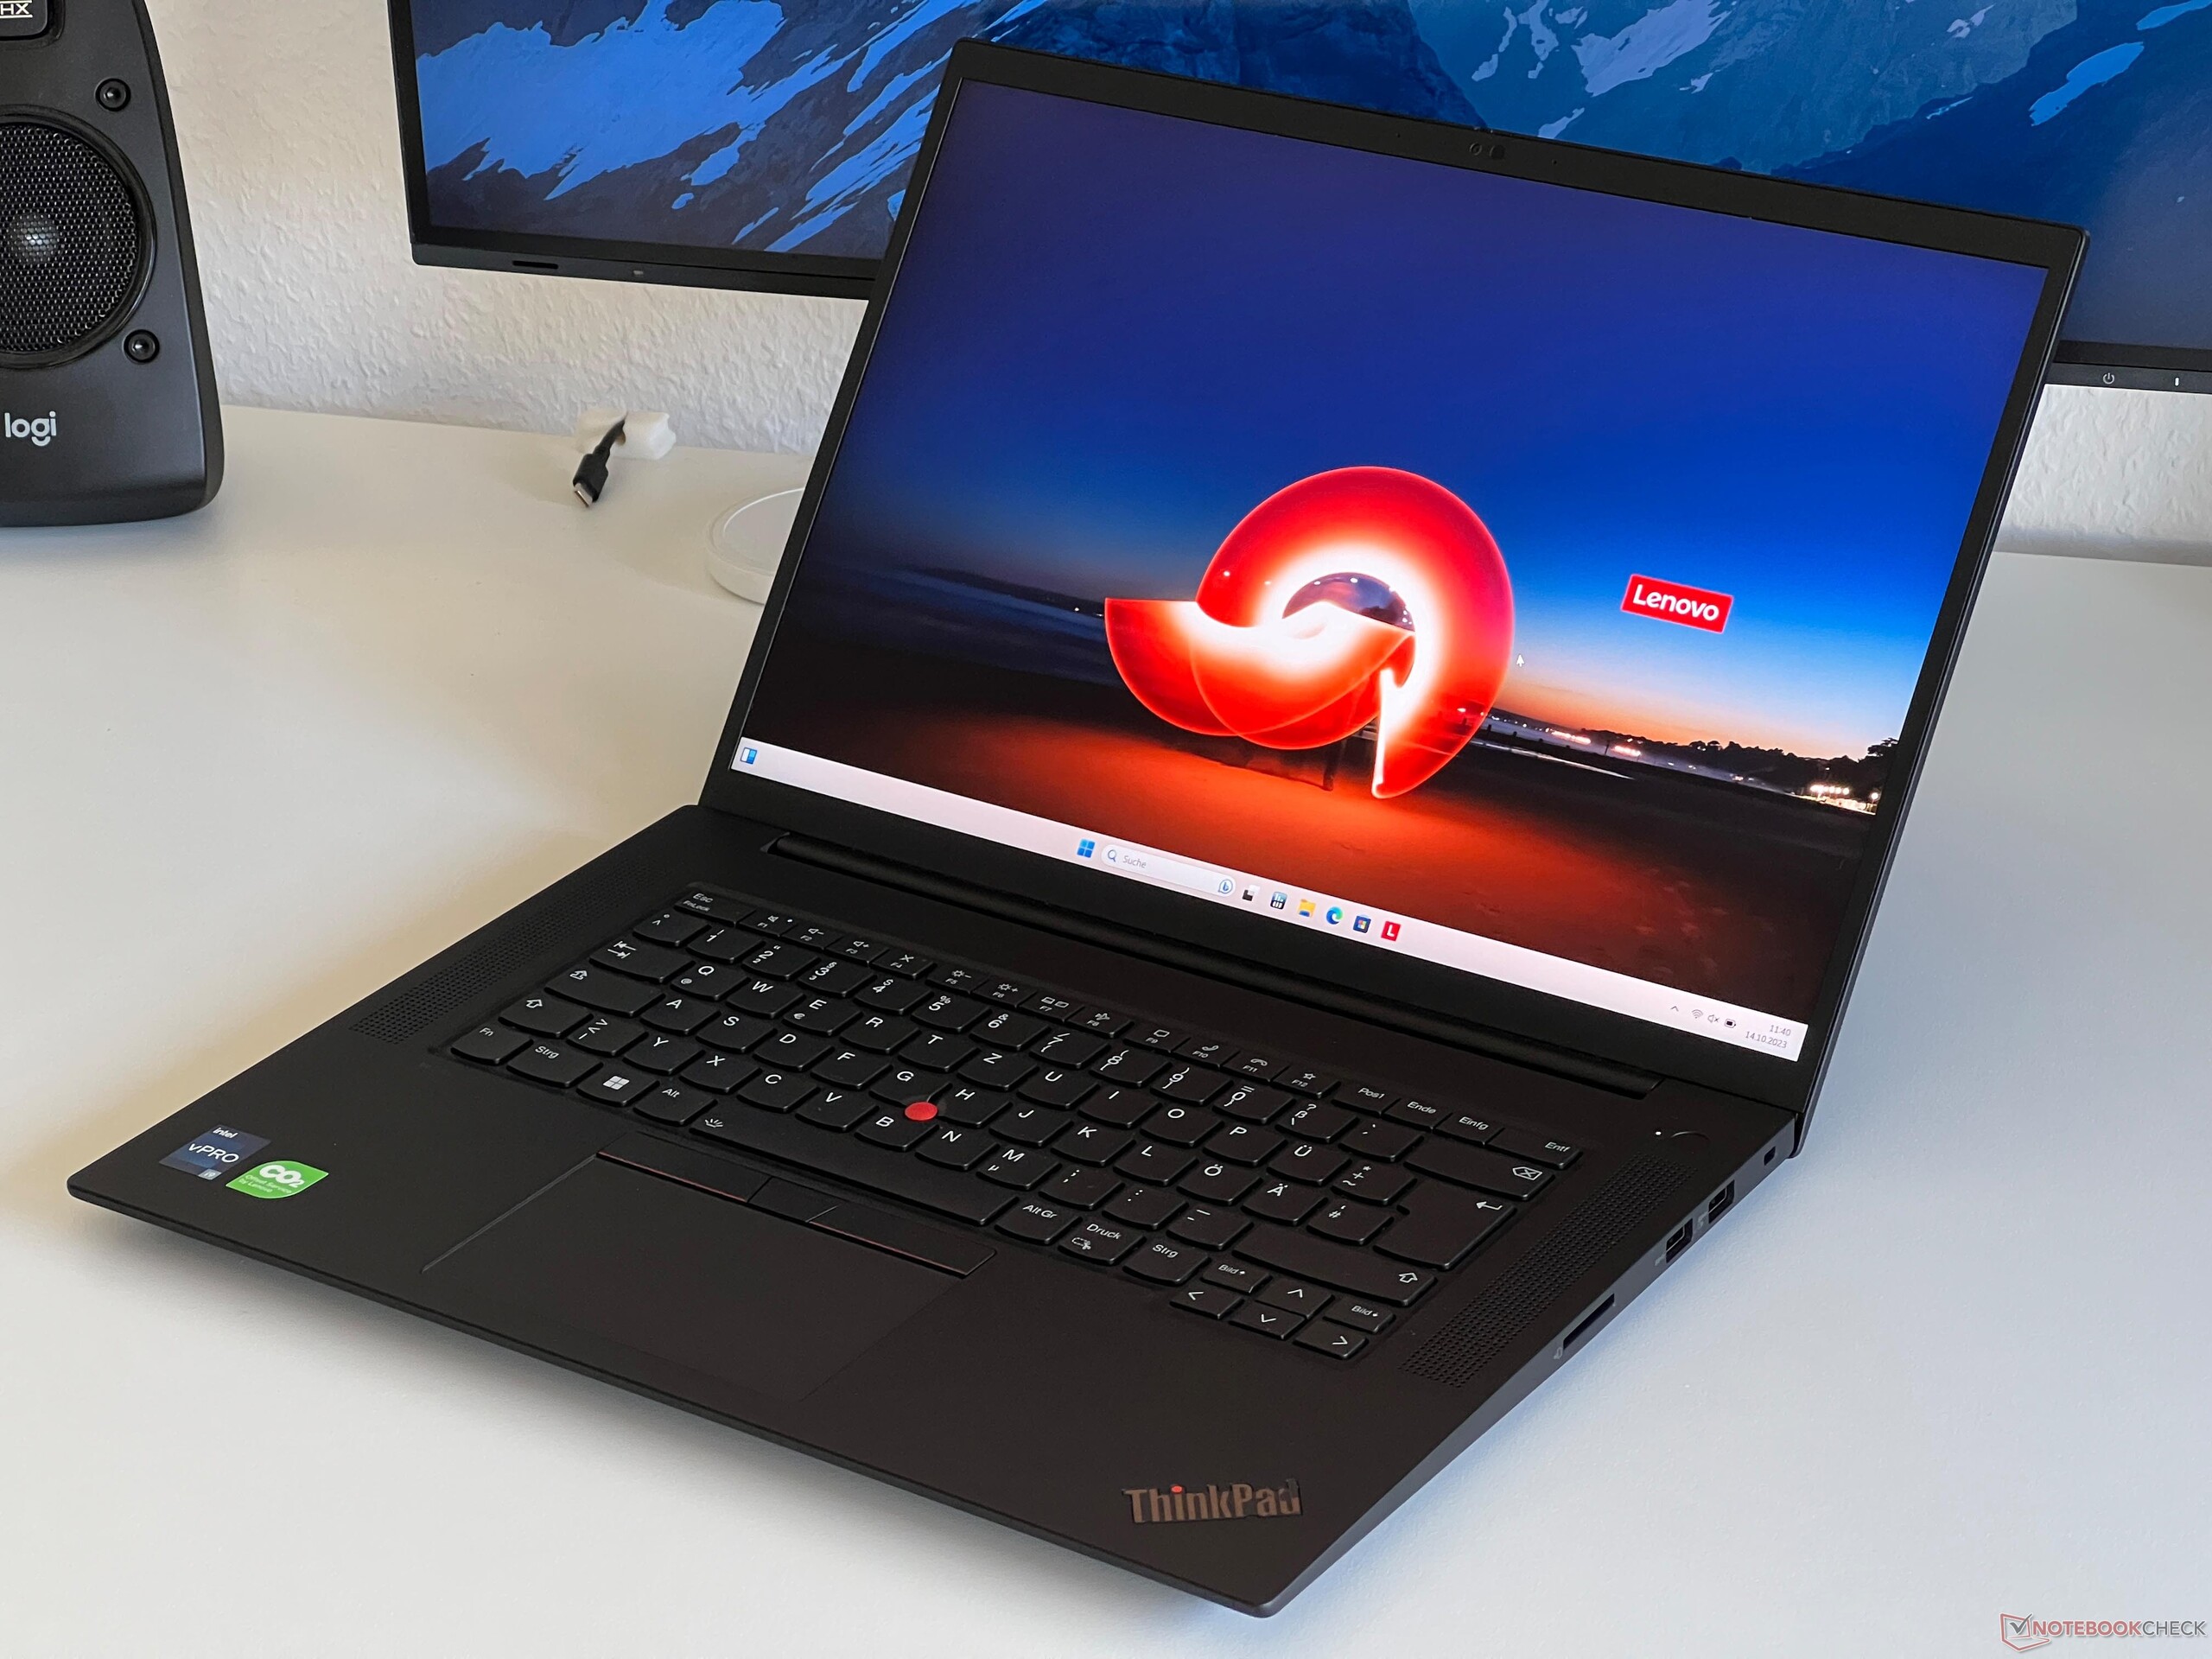
Kasa - Stabilite karbon fiber ve magnezyum ile sağlanır
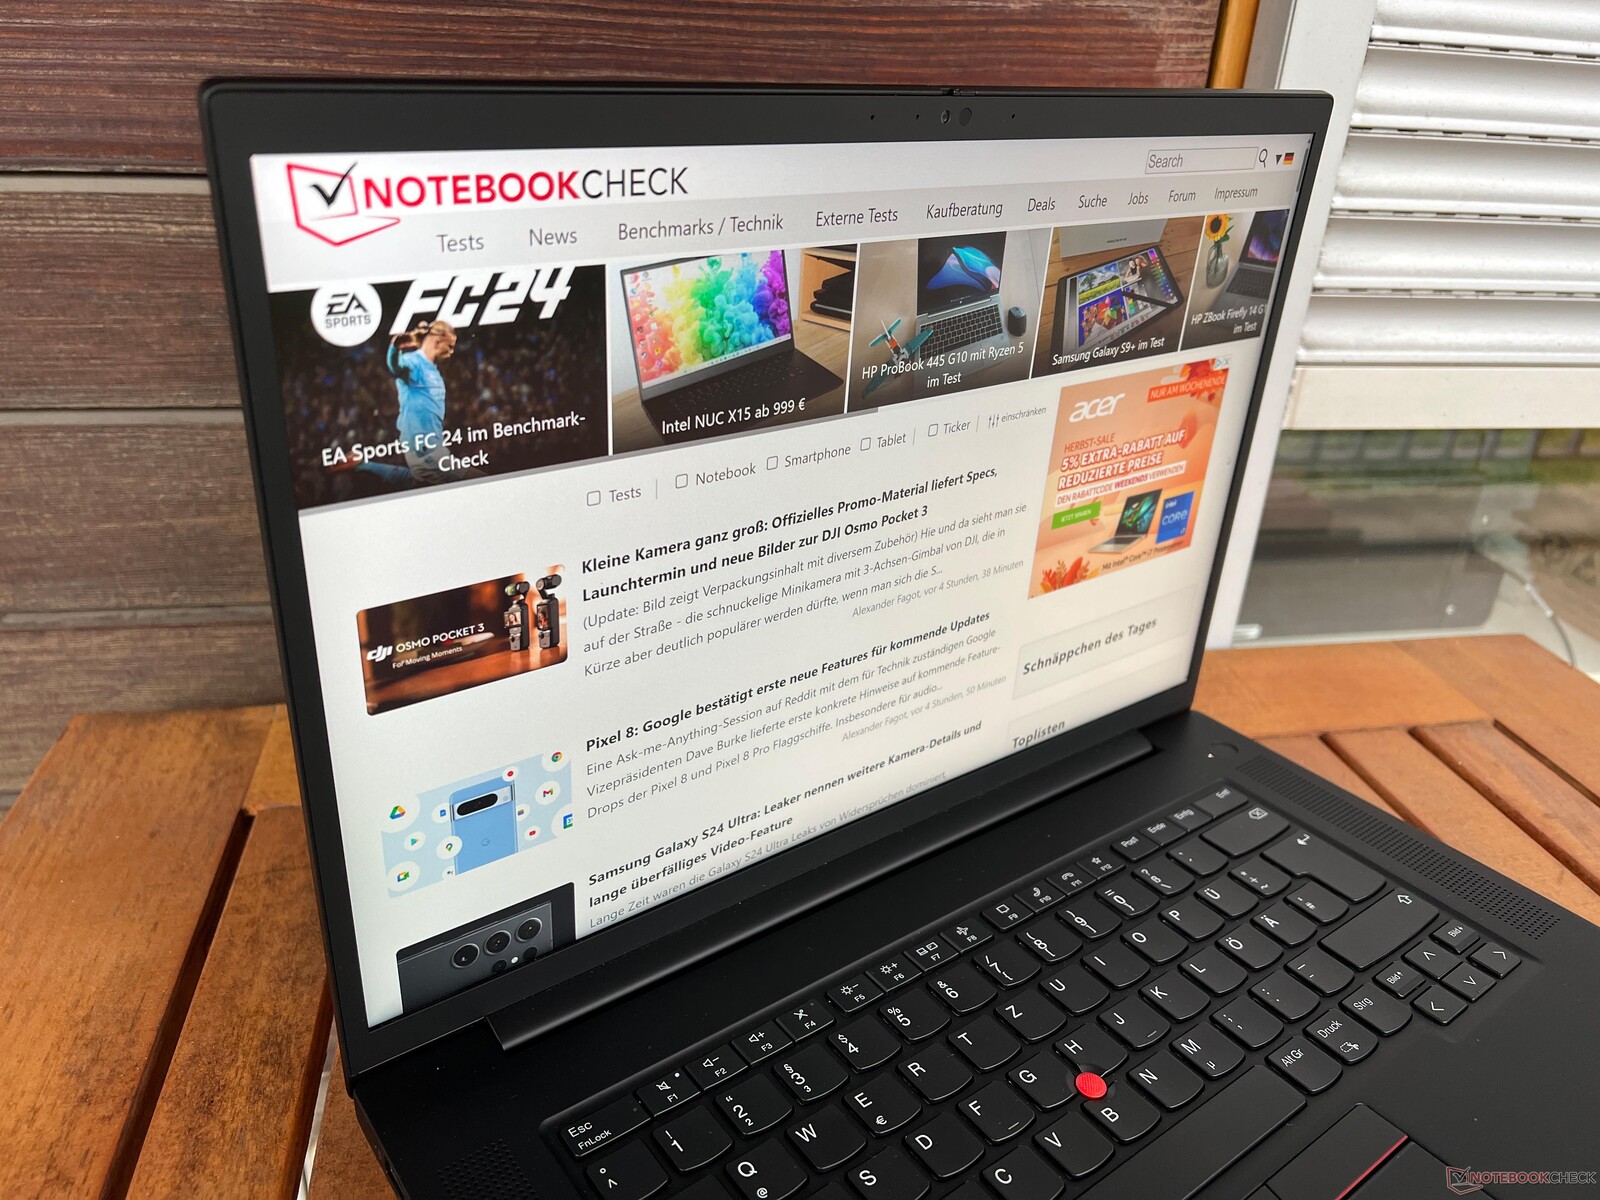
Lenovo, ThinkPad P1 Gen 6 için iyi bilinen tasarımını koruyarak selefleri G4 ve G5 nesilleriyle tutarlılığını sürdürüyor. Siyah tasarım, bireysel bakış açılarına bağlı olarak basit veya heyecansız olarak algılanabilir. Bununla birlikte, ThinkPad'in ayırt edici kimliği belirginliğini koruyor. OLED ekranlı modeller karbon fiber desenli bir ekran kapağı sergilemeye devam ediyor, ancak bu gerçek karbon fiber yerine baskılı bir tasarım. Genel olarak tasarım çağdaş görünümünü koruyor ancak pürüzsüz yüzeyler zaman içinde kir ve yağ birikimine karşı hassas olduğundan düzenli temizlik gerektiriyor.
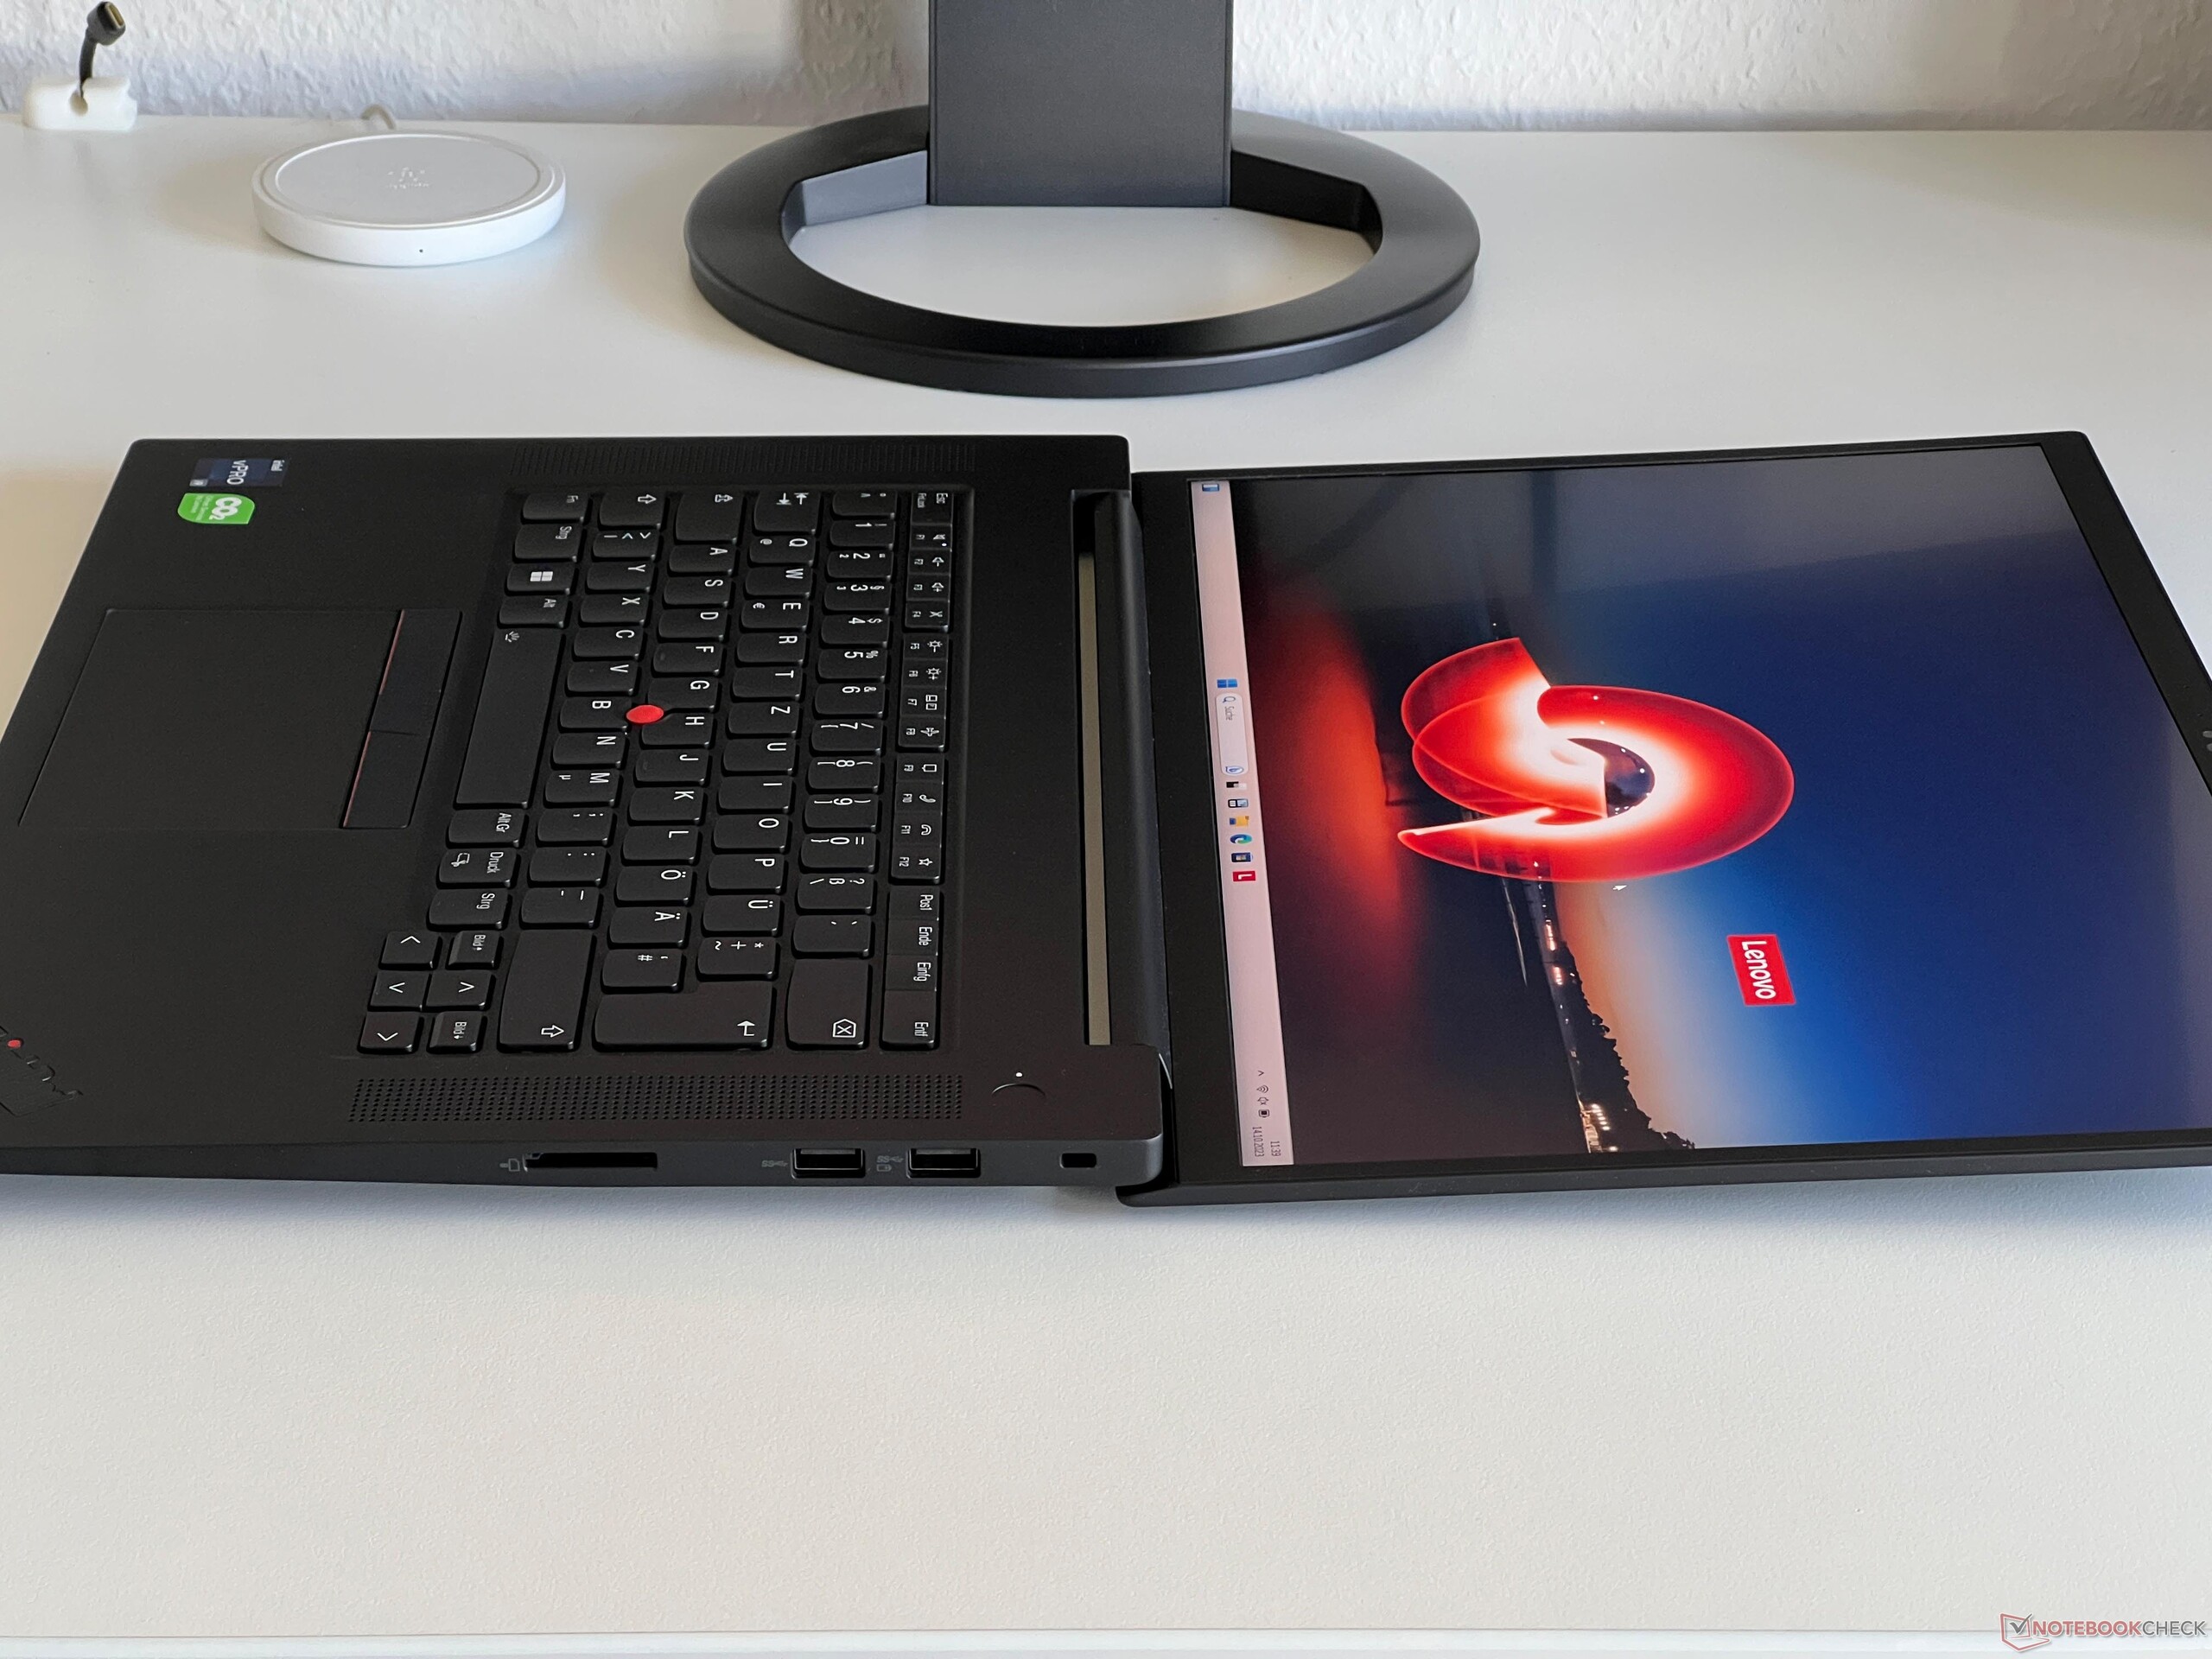
Yapı, karbon fiber ve magnezyumu birleştirerek olağanüstü bir sağlamlık sağlıyor. Hem ana ünite hem de ekran kapağı sağlamdır ve gözle görülür bir bükülme veya basınç noktası yoktur. Görüntü bozulmaları veya gıcırdama sesleri ile ilgili herhangi bir sorun yoktur. İki menteşe (maksimum açılma açısı 180 derece), kapağın tek elle açılmasına izin verirken, fark edilebilir herhangi bir sıçramayı önlemek için yeterli gerginliği korur.
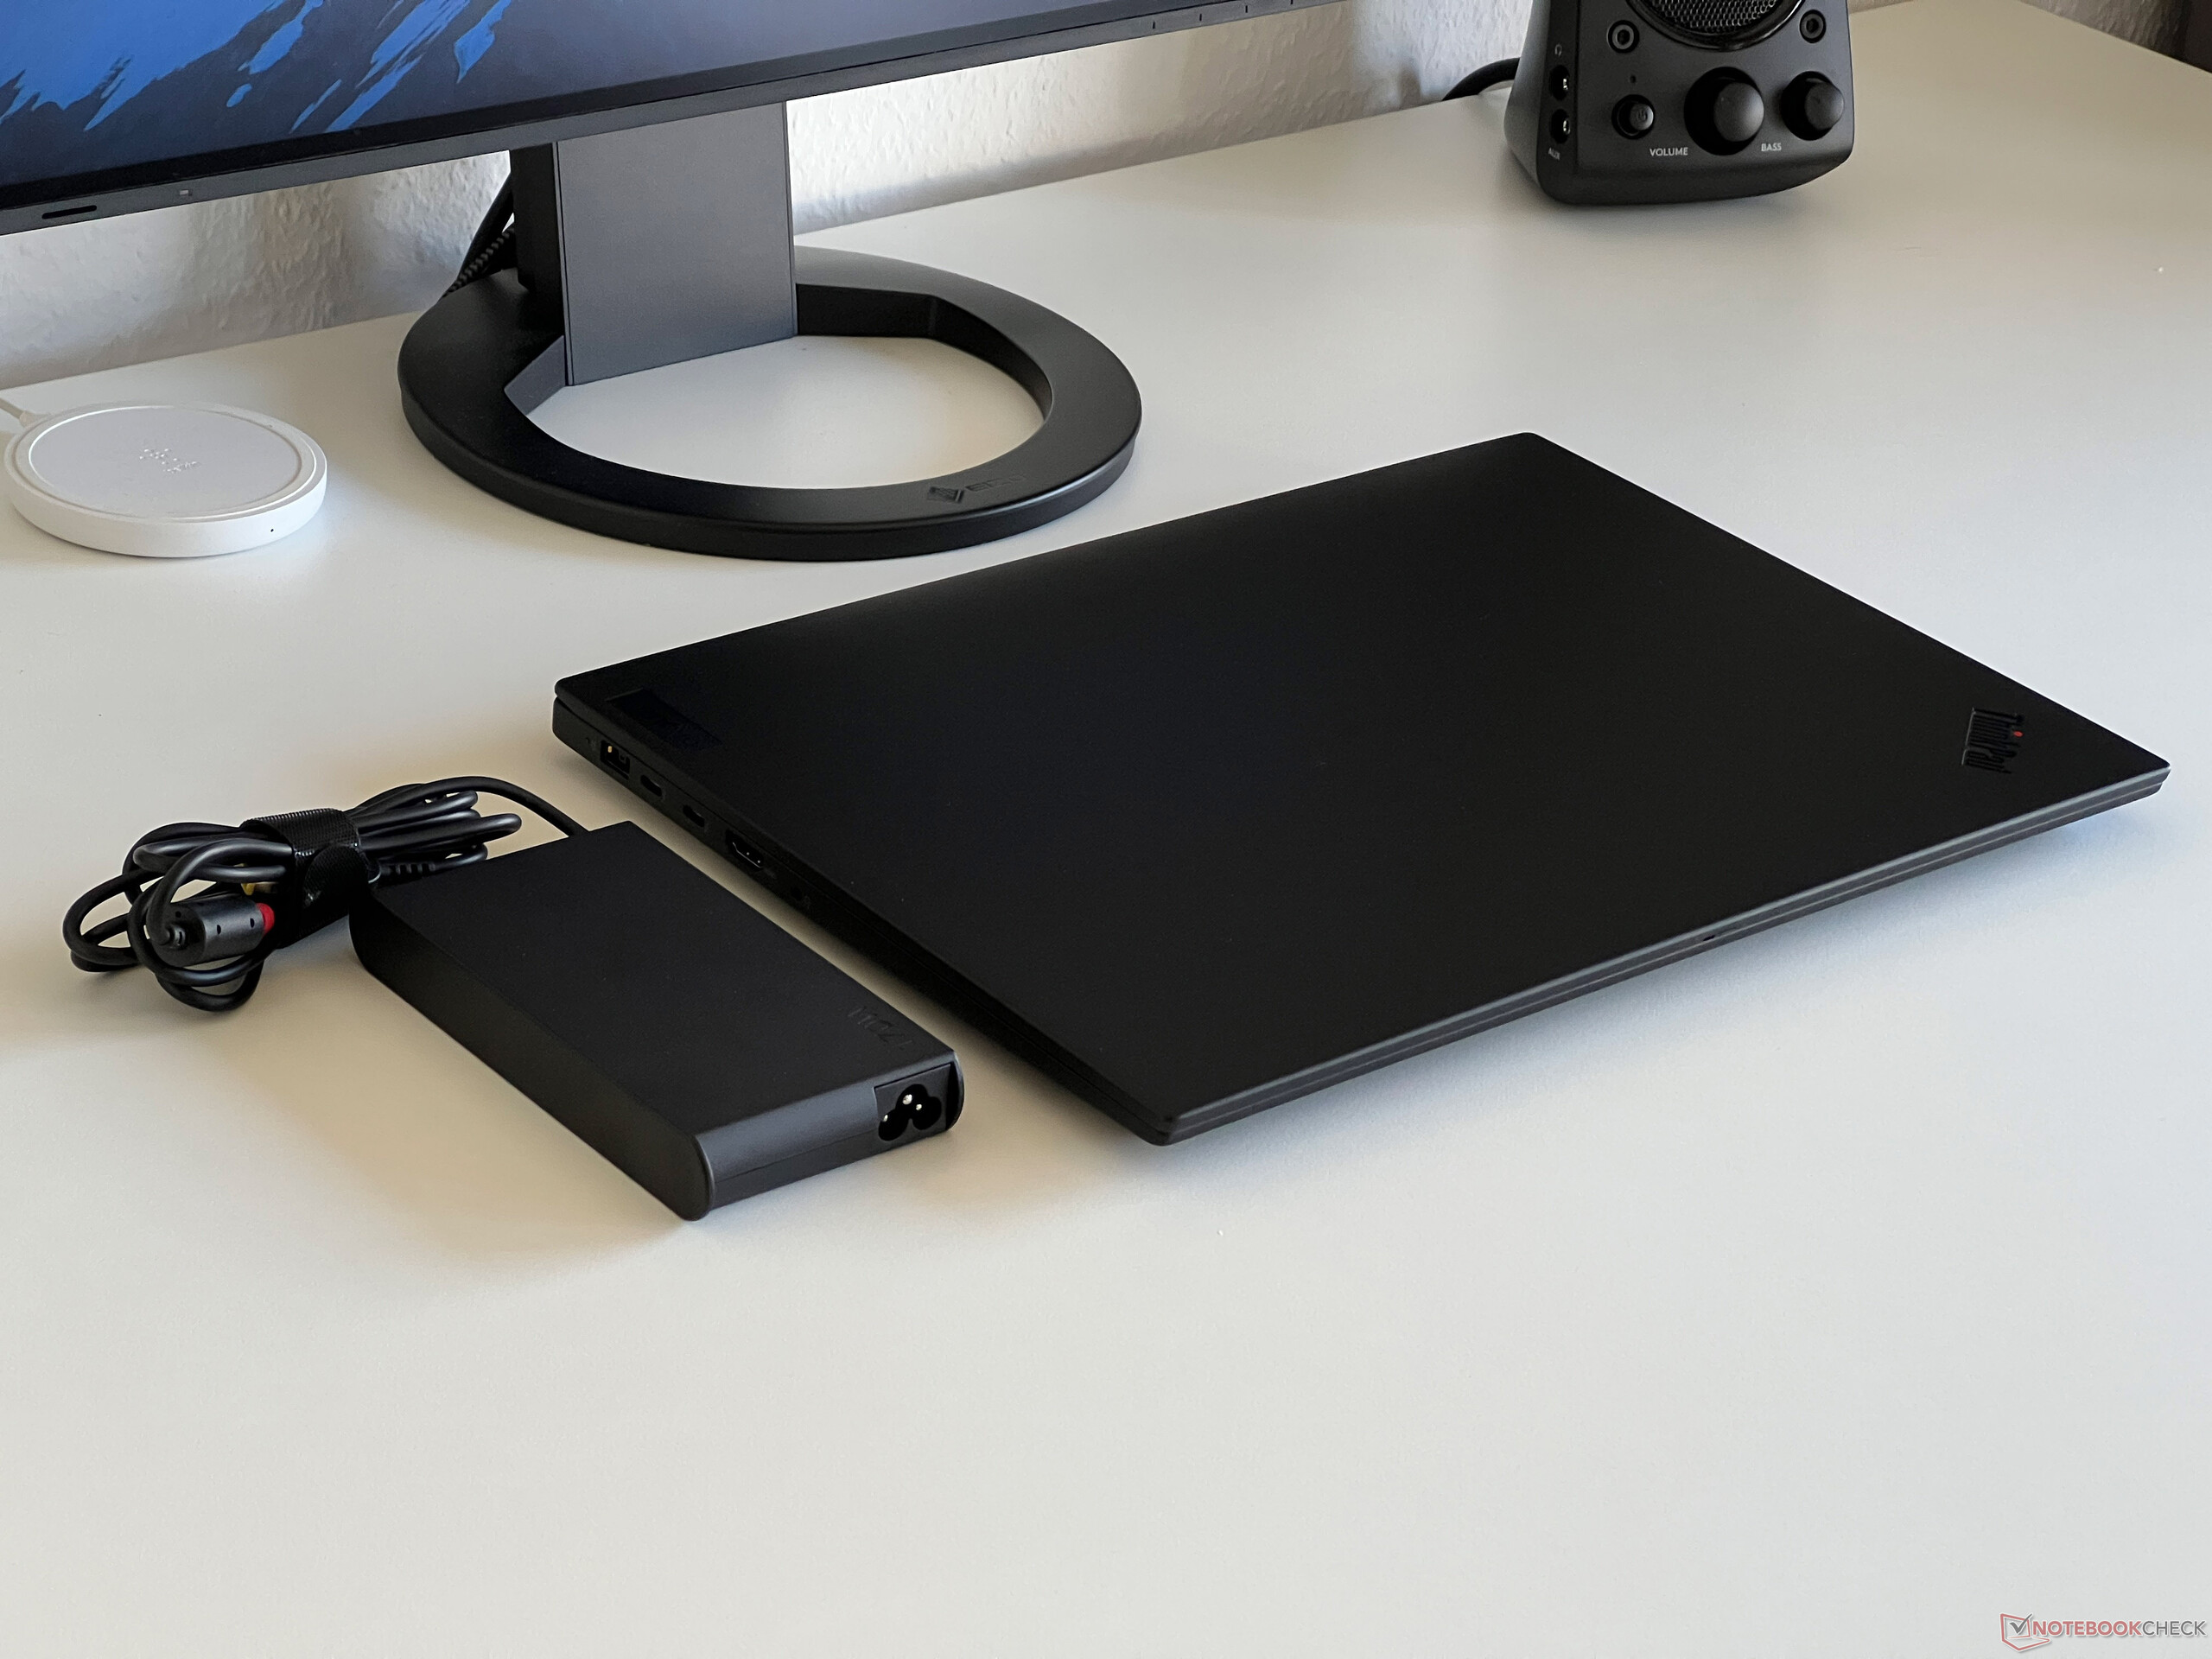
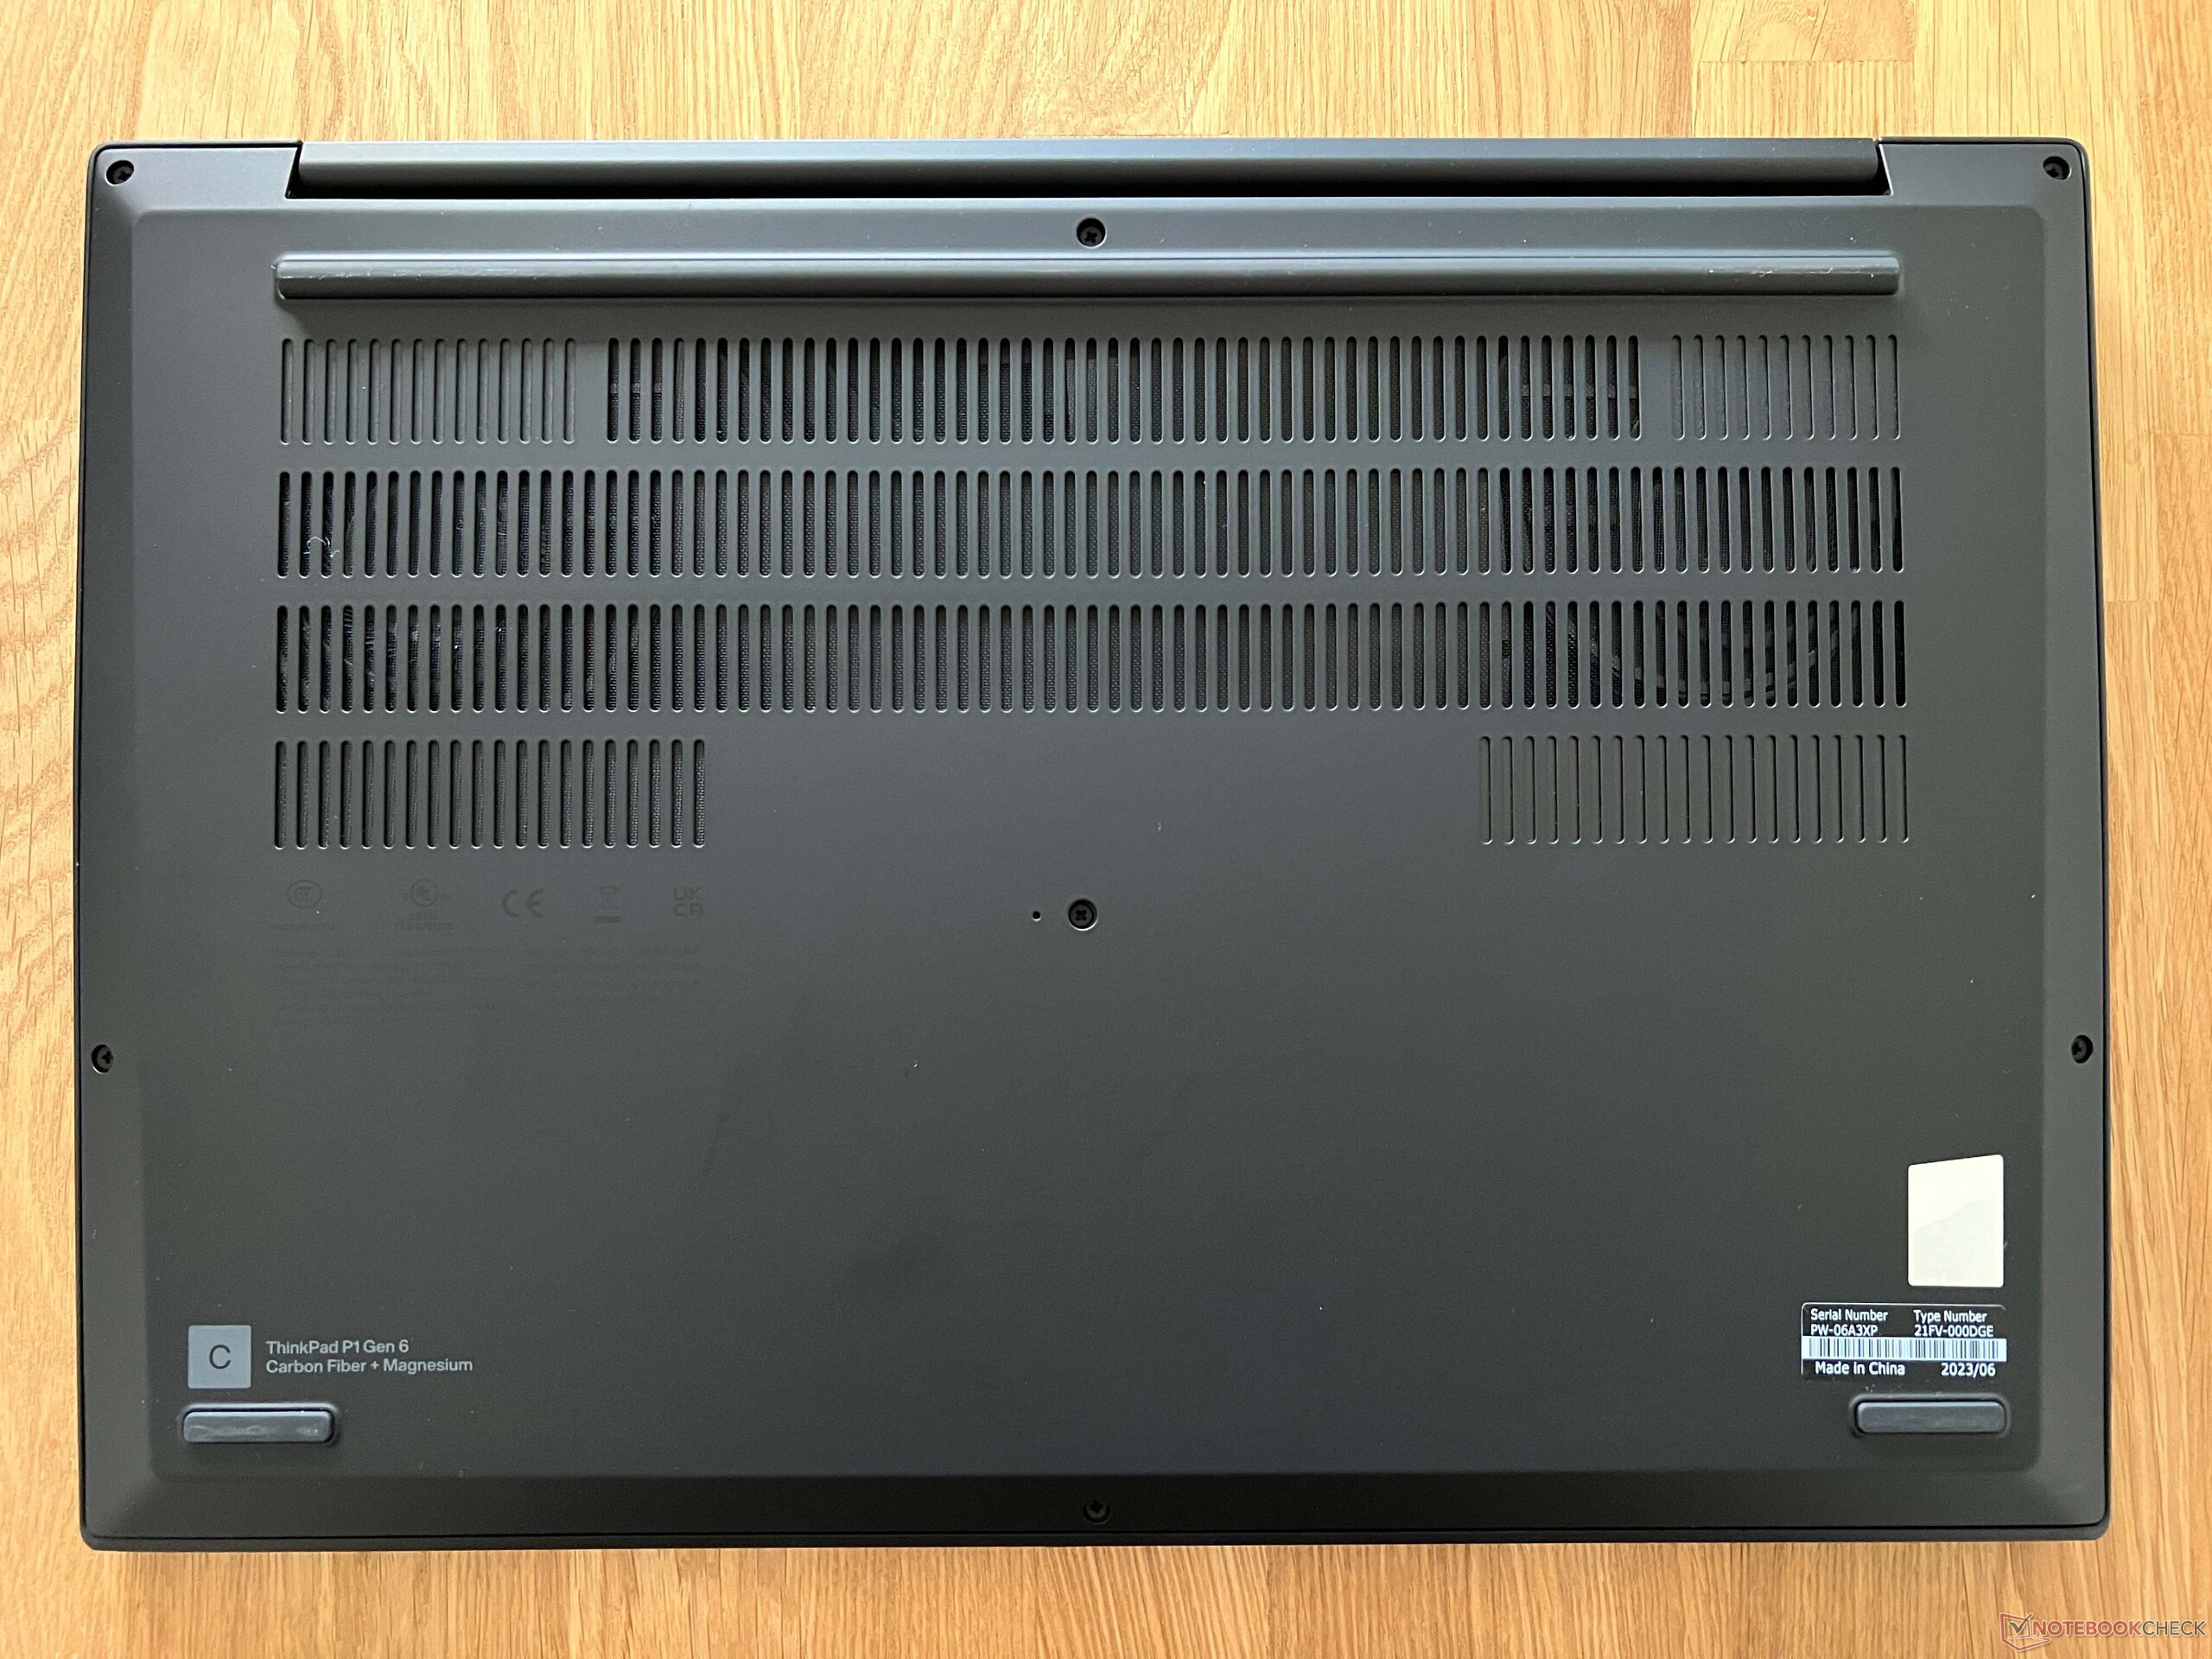
Karşılaştırılabilir aygıtlar benzer bir ayak izine sahiptir, ancak önemli ölçüde daha ağırdırlar. ThinkPad P1 Gen 6, 4,19 lbs'nin biraz altında olan ve yalnızca Schenker Vision 16'dan daha ağır olan en hafif varyantlardan biridir. 170 watt'lık güç kaynağı toplam ağırlığa fazladan 1,23 lbs ekliyor.
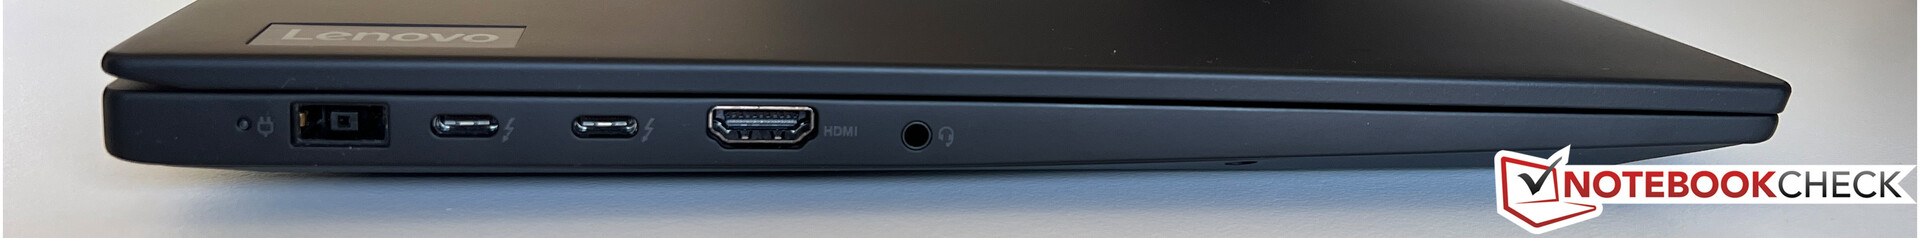
Bağlanabilirlik - Thunderbolt ve Wi-Fi 6E
Bağlantı noktalarında herhangi bir değişiklik yapılmadı ve tüm temel standartlar mevcut olmaya devam ediyor. Ayrıca, Thunderbolt 4'e sahip iki USB-C bağlantı noktası şarj için kullanılabilir ve minimum 90 watt güç sağlar.
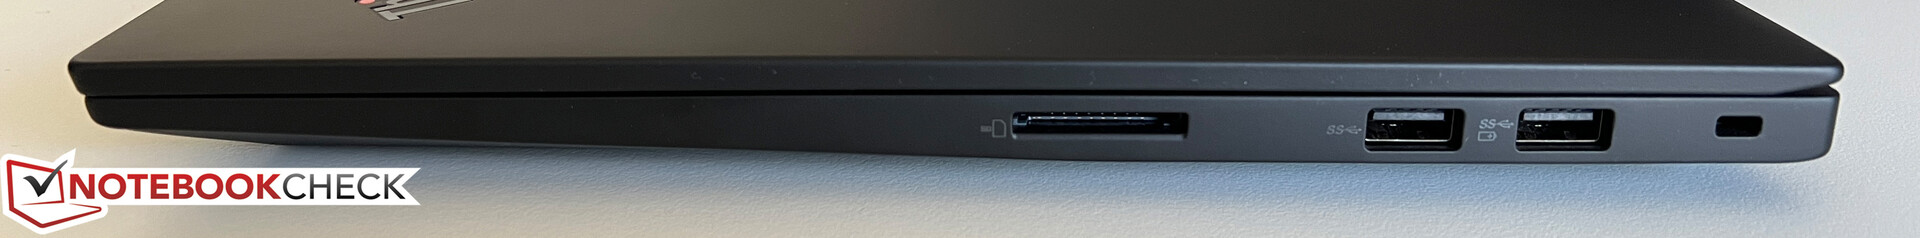
SD Kart Okuyucu
Doğru kart okuyucu yalnızca ortalama aktarım hızları sağlar. Referans kartımızla (Angelbird AV Pro V60) birlikte kullanıldığında aktarım hızları yaklaşık 80 MB/s'dir.
| SD Card Reader | |
| average JPG Copy Test (av. of 3 runs) | |
| Dell Precision 5000 5680 (Toshiba Exceria Pro SDXC 64 GB UHS-II) | |
| Sınıf ortalaması Workstation (49.6 - 681, n=14, son 2 yıl) | |
| MSI CreatorPro Z16P B12UKST (AV Pro V60) | |
| Lenovo ThinkPad P1 G6-21FV000DGE (Angelbird AV Pro V60) | |
| Samsung Galaxy Book3 Ultra 16, i9-13900H RTX 4070 (AV Pro SD microSD 128 GB V60) | |
| HP ZBook Studio 16 G9 62U04EA (Angelbird AV PRO V60) | |
| Lenovo ThinkPad X1 Extreme G5-21DE003RGE (AV Pro V60) | |
| Schenker VISION 16 Pro (M23) (Angelbird AV Pro V60) | |
| maximum AS SSD Seq Read Test (1GB) | |
| Sınıf ortalaması Workstation (87.6 - 1455, n=14, son 2 yıl) | |
| Dell Precision 5000 5680 (Toshiba Exceria Pro SDXC 64 GB UHS-II) | |
| Samsung Galaxy Book3 Ultra 16, i9-13900H RTX 4070 (AV Pro SD microSD 128 GB V60) | |
| Lenovo ThinkPad P1 G6-21FV000DGE (Angelbird AV Pro V60) | |
| MSI CreatorPro Z16P B12UKST (AV Pro V60) | |
| Lenovo ThinkPad X1 Extreme G5-21DE003RGE (AV Pro V60) | |
| HP ZBook Studio 16 G9 62U04EA (Angelbird AV PRO V60) | |
| Schenker VISION 16 Pro (M23) (Angelbird AV Pro V60) | |
İletişim
WLAN modülü ile ilgili bir değişiklik yok; Intel AX211 kartı hala kullanılıyor ve modern 6 GHz ağları destekliyor. Aktarım hızları mükemmel ve testlerimiz sırasında hiçbir bağlantı sorunuyla karşılaşmadık. Ethernet portu olmamasına rağmen, uyumlu bir USB-C adaptörü aracılığıyla eklenebilir. Kasanın içinde WWAN modülü için bir M.2-2242 yuvası var; ancak gerekli antenler önceden takılı değil, bu da WWAN bağlantısı için güçlendirme yapılmasını engelliyor.
| Networking | |
| Lenovo ThinkPad P1 G6-21FV000DGE | |
| iperf3 transmit AXE11000 | |
| iperf3 receive AXE11000 | |
| Dell Precision 5000 5680 | |
| iperf3 transmit AXE11000 | |
| iperf3 receive AXE11000 | |
| iperf3 transmit AXE11000 6GHz | |
| iperf3 receive AXE11000 6GHz | |
| Samsung Galaxy Book3 Ultra 16, i9-13900H RTX 4070 | |
| iperf3 transmit AXE11000 | |
| iperf3 receive AXE11000 | |
| iperf3 transmit AXE11000 6GHz | |
| iperf3 receive AXE11000 6GHz | |
| HP ZBook Studio 16 G9 62U04EA | |
| iperf3 transmit AXE11000 6GHz | |
| iperf3 receive AXE11000 6GHz | |
| MSI CreatorPro Z16P B12UKST | |
| iperf3 transmit AXE11000 6GHz | |
| iperf3 receive AXE11000 6GHz | |
| Schenker VISION 16 Pro (M23) | |
| iperf3 transmit AXE11000 | |
| iperf3 receive AXE11000 | |
| Lenovo ThinkPad X1 Extreme G5-21DE003RGE | |
| iperf3 transmit AXE11000 6GHz | |
| iperf3 receive AXE11000 6GHz | |
Web kamerası
1080p kamera iyi ışık koşullarında iyi fotoğraflar çeker ve mekanik bir deklanşör vardır. Buna ek olarak, Windows Hello aracılığıyla yüz tanıma için bir IR kamera mevcuttur.


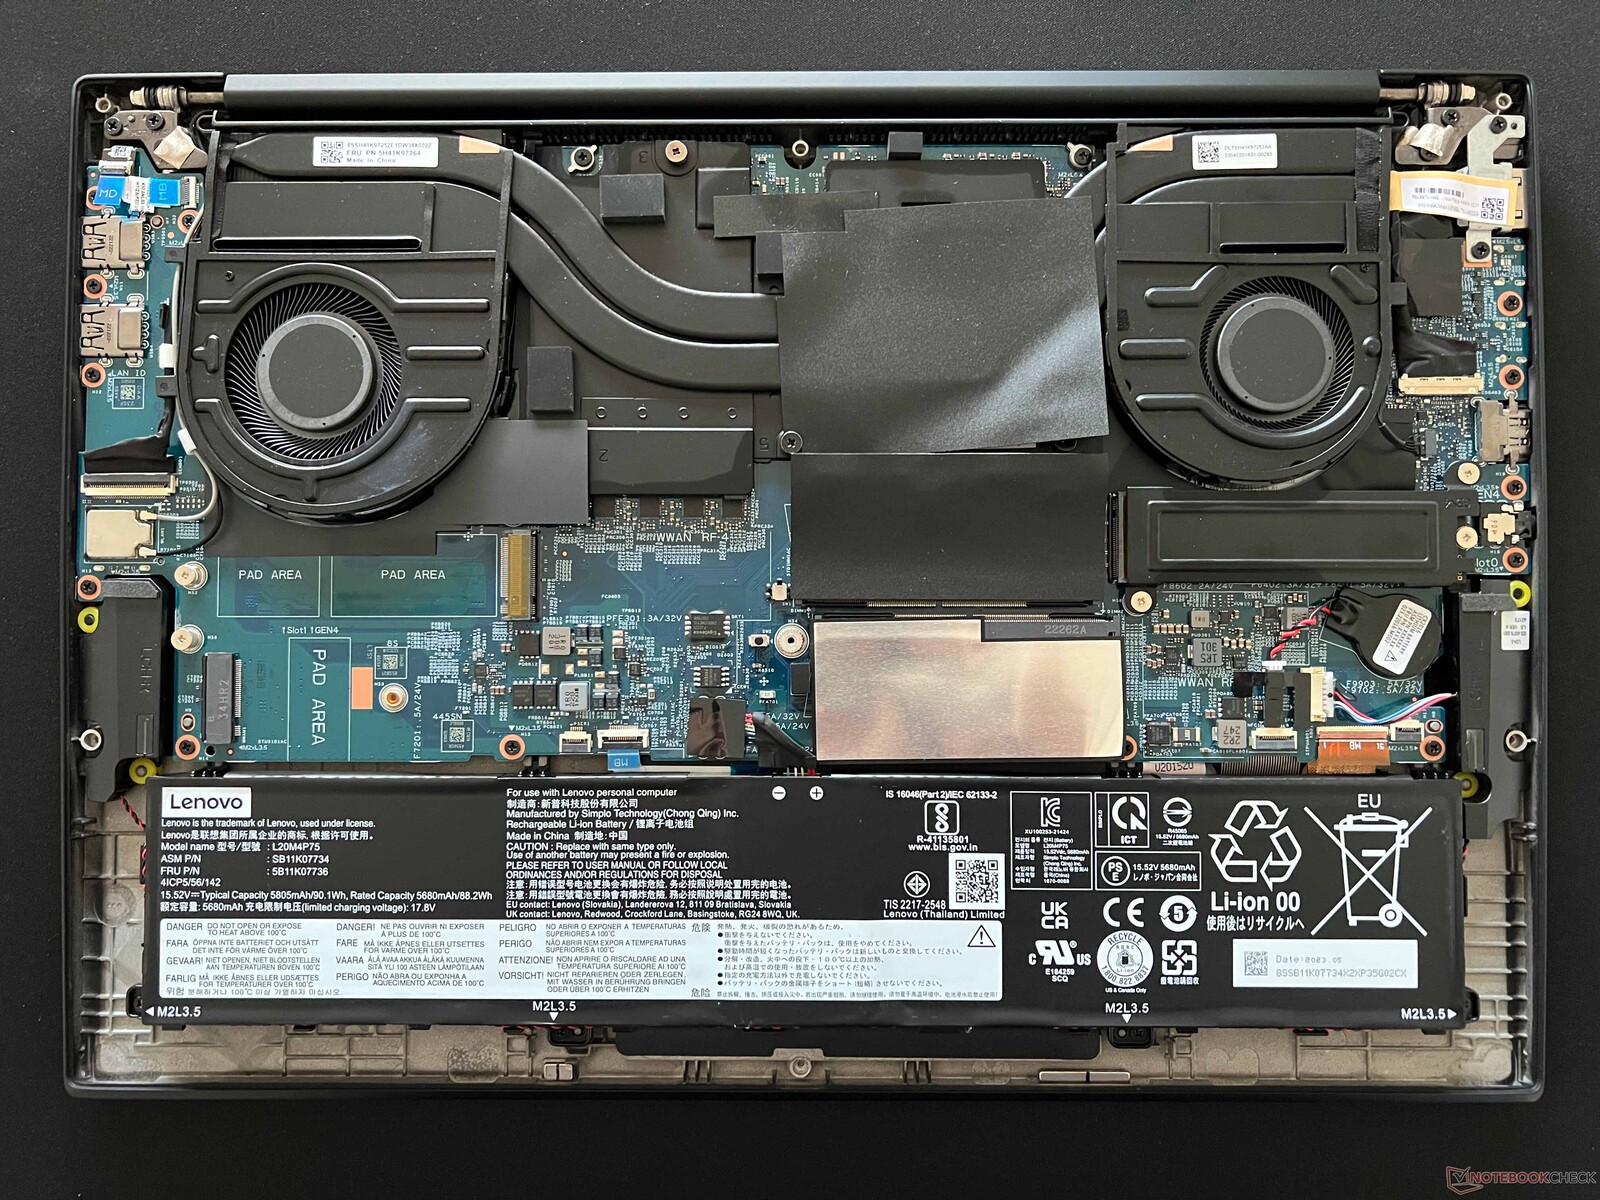
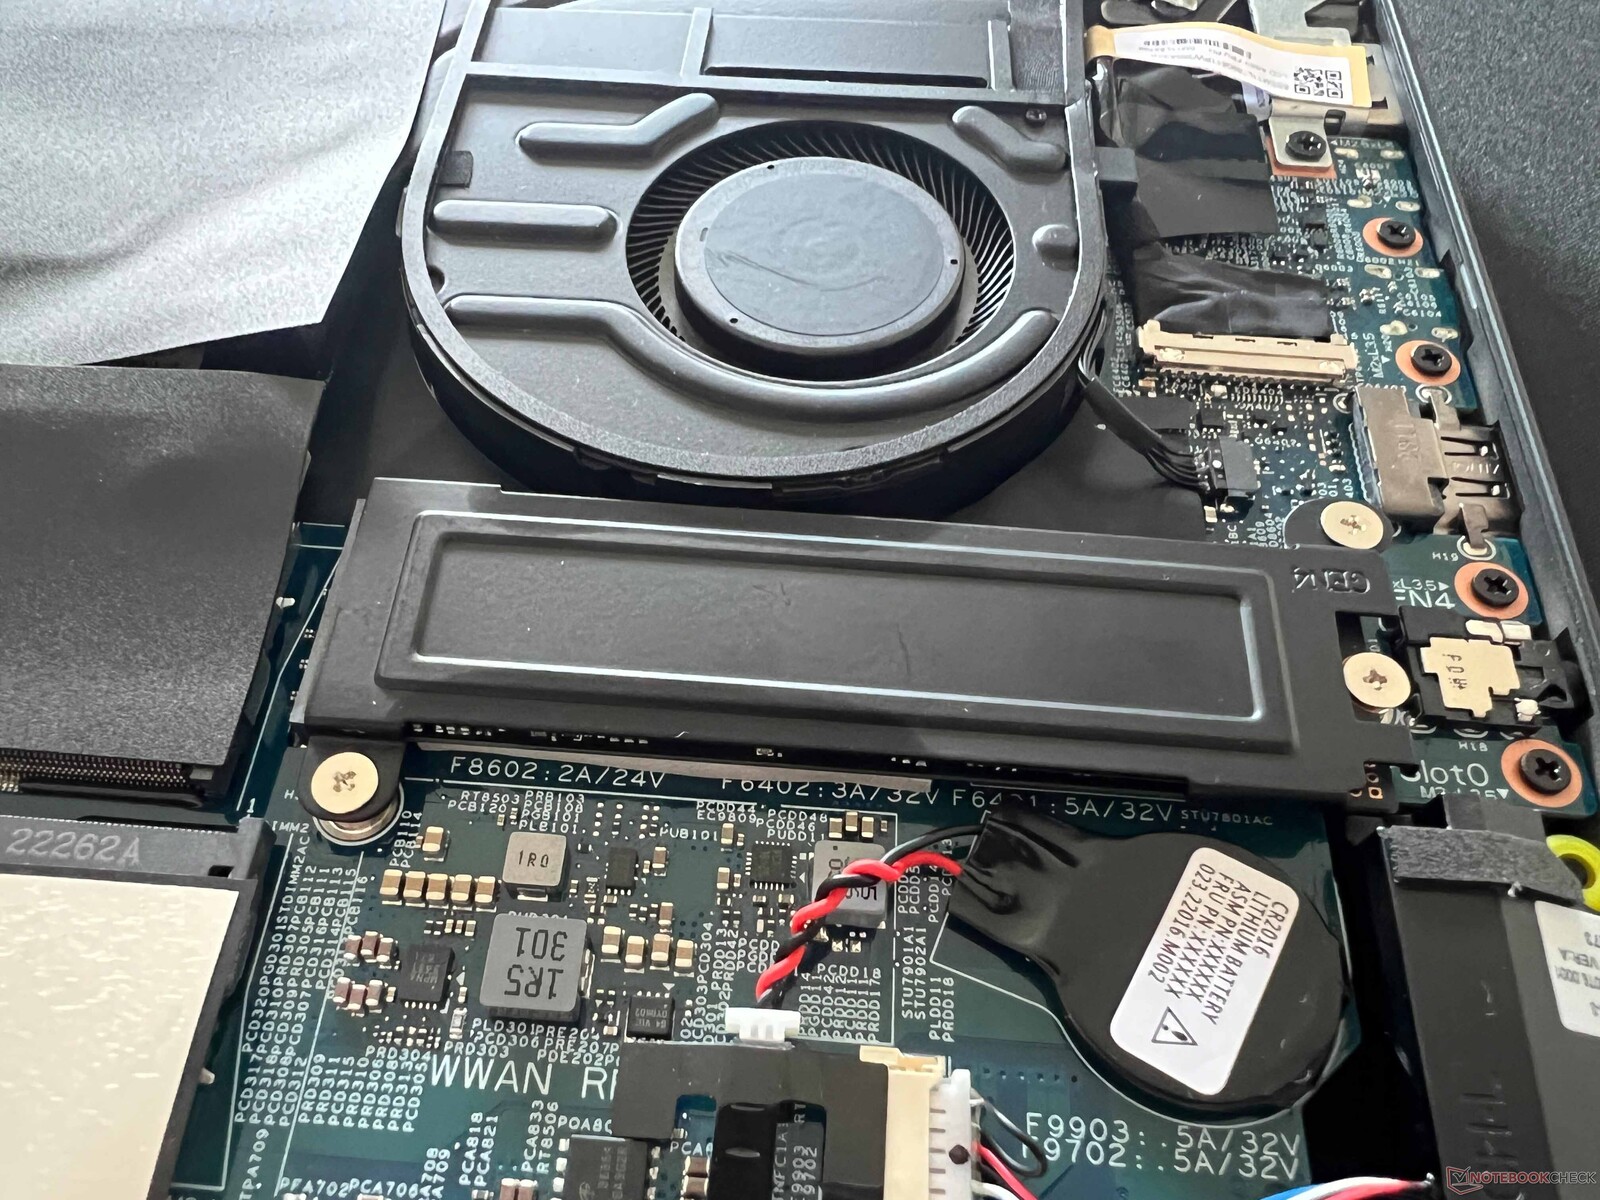
Bakım
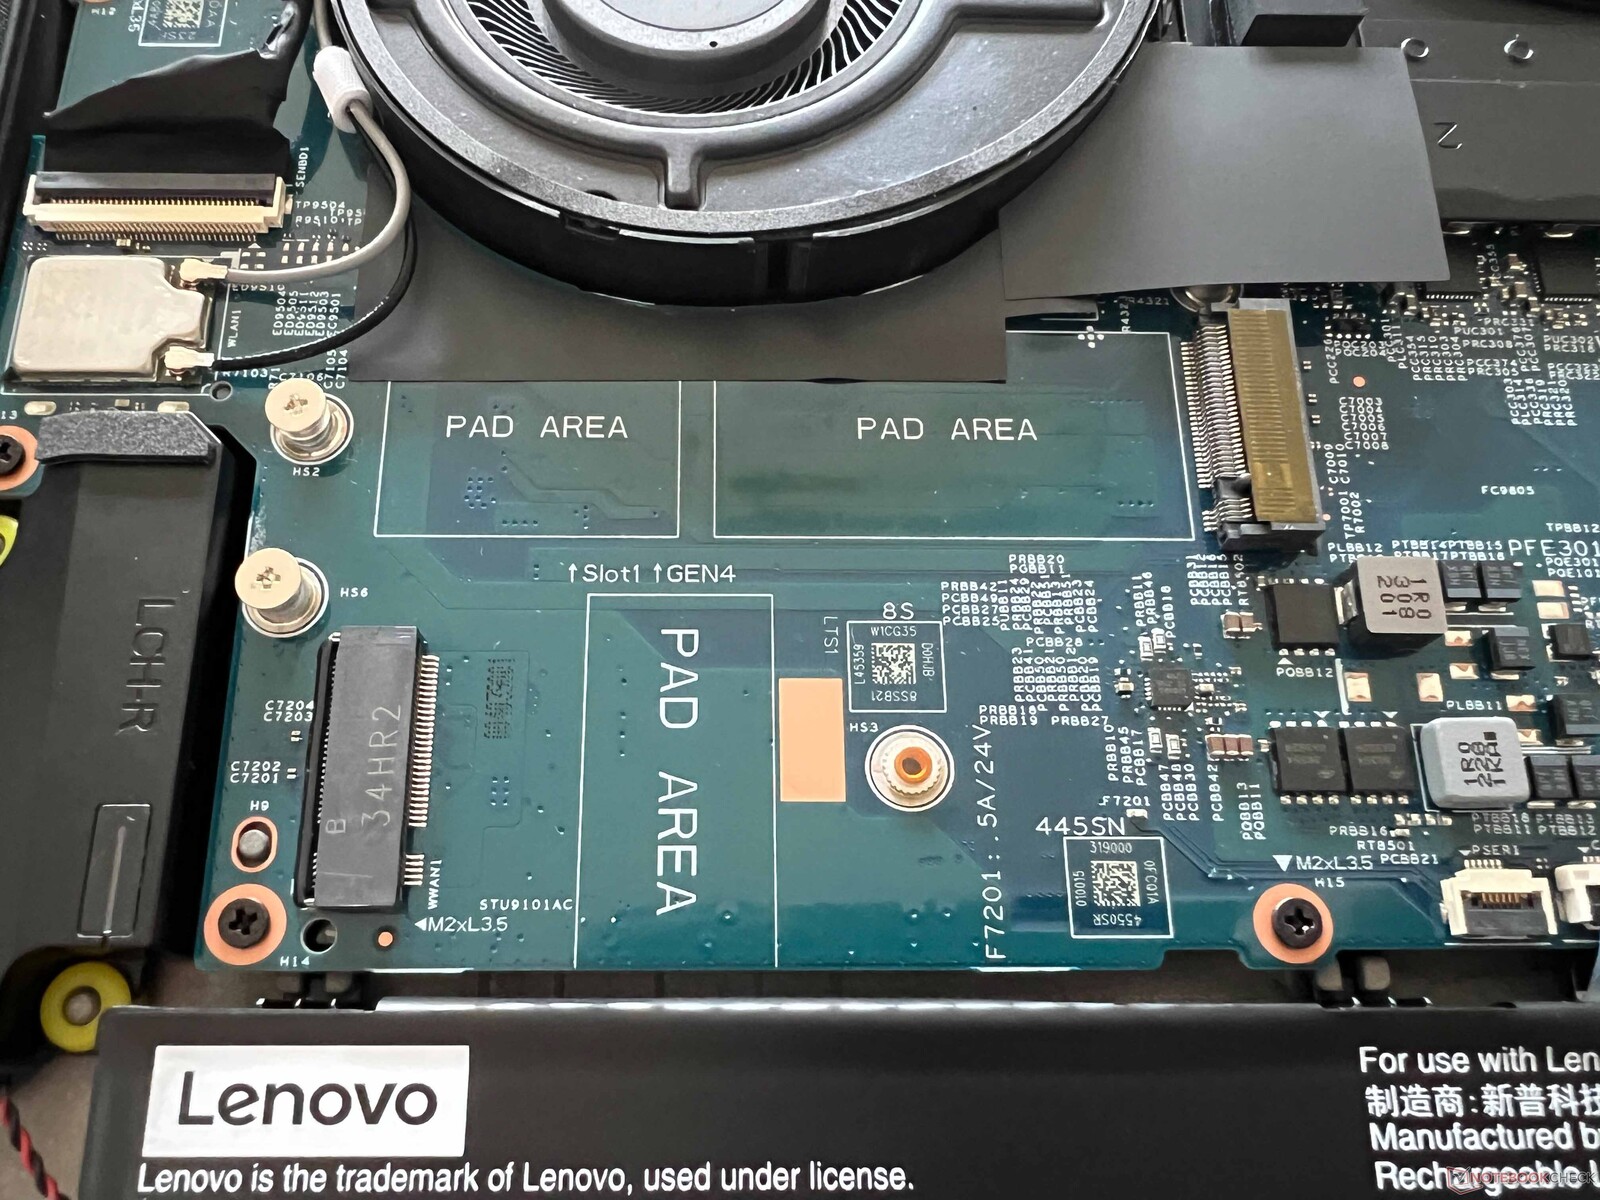
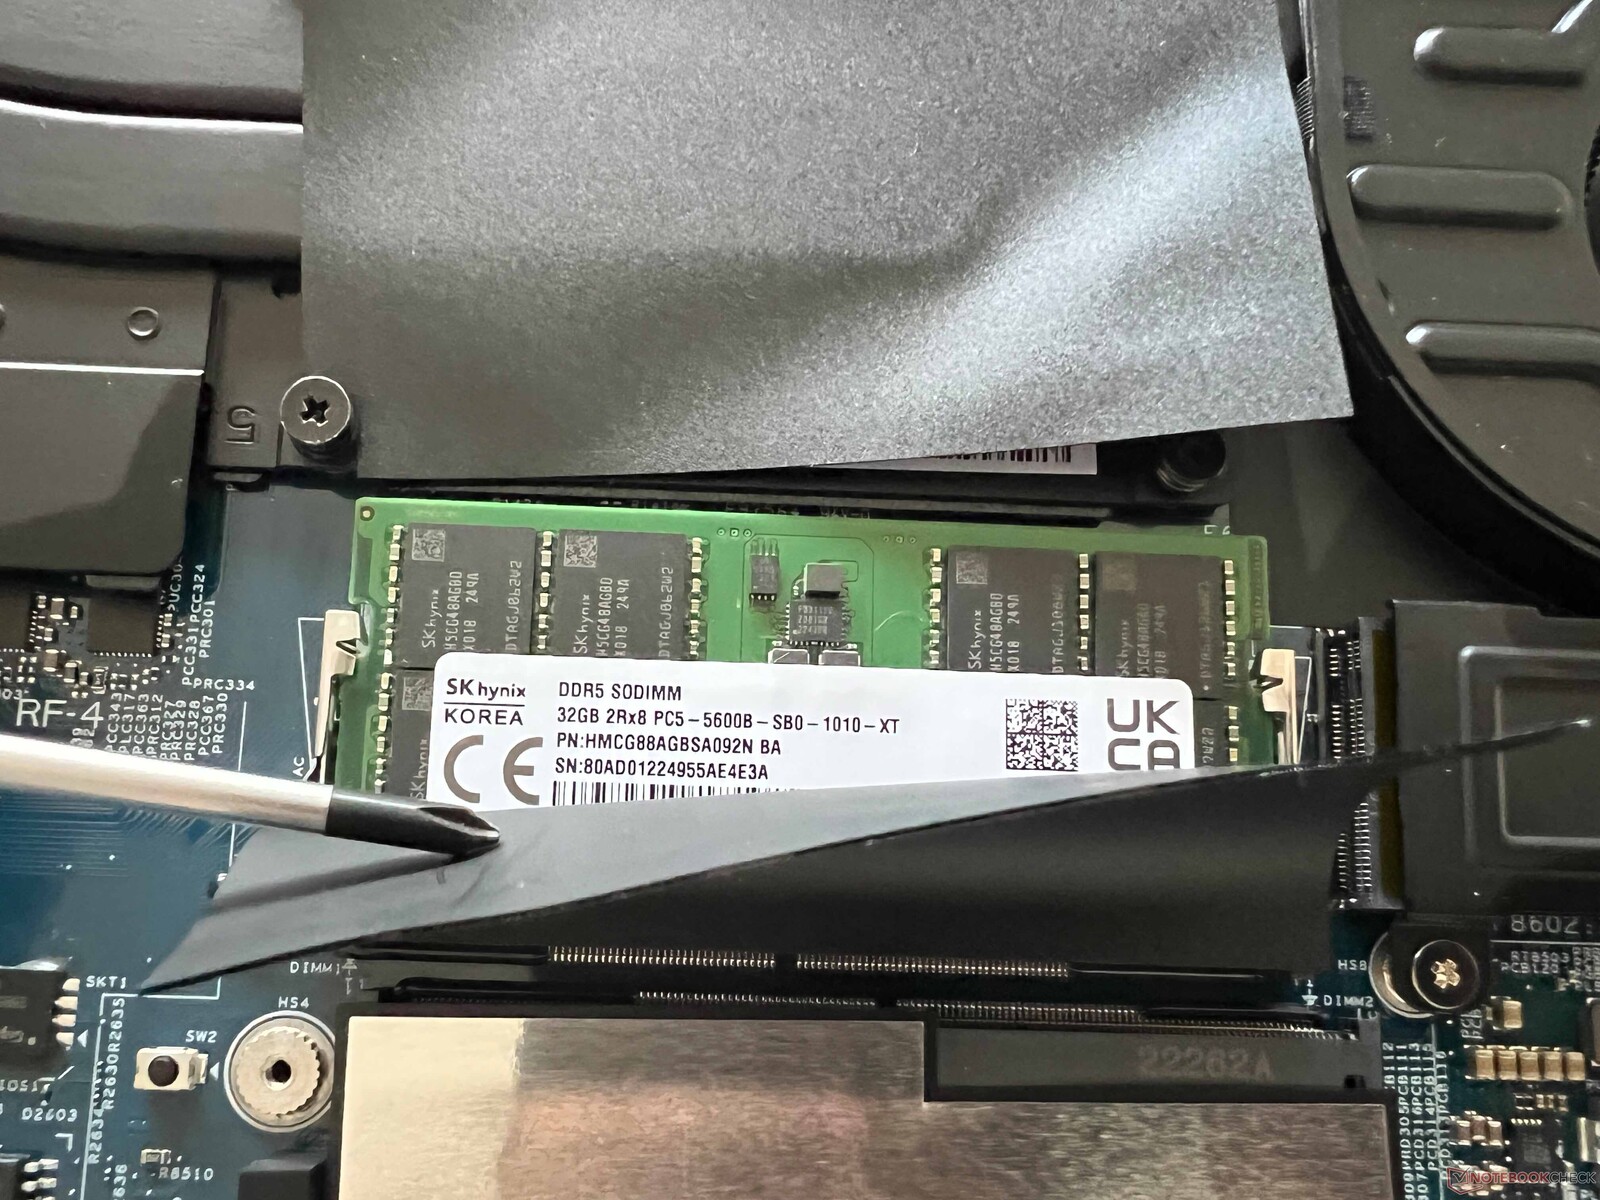
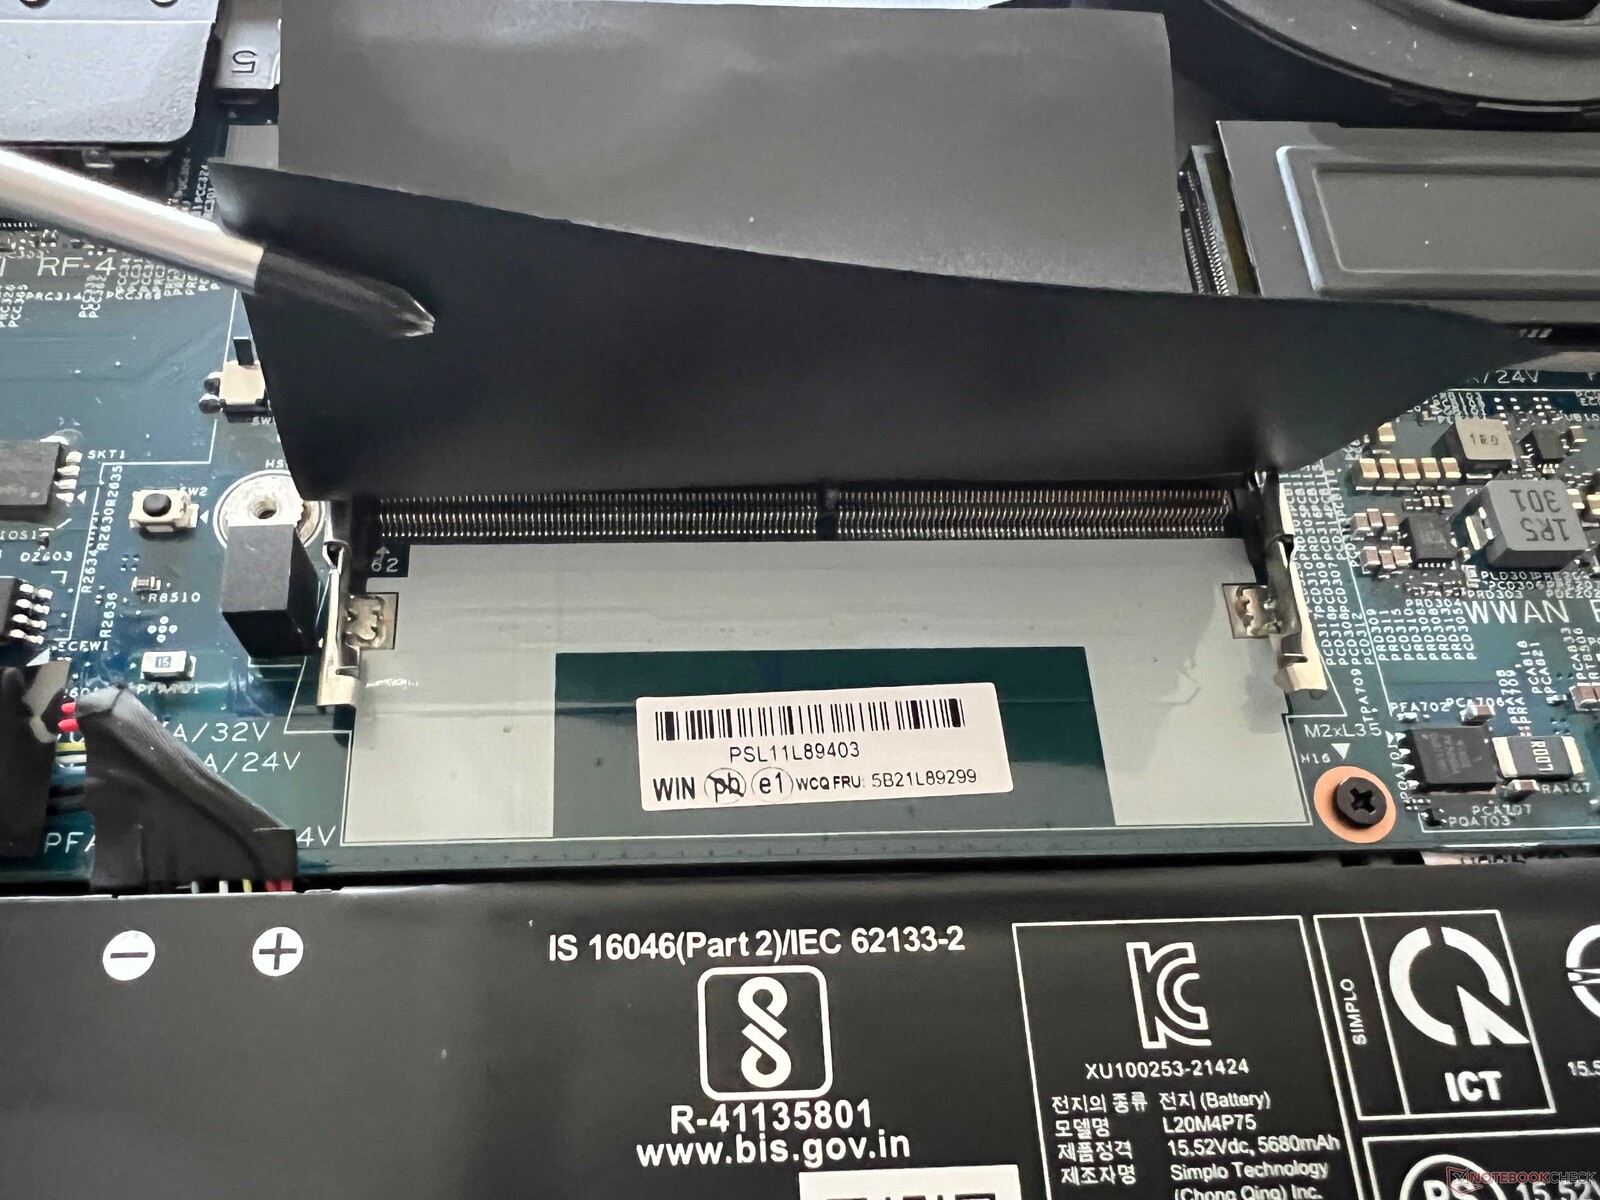
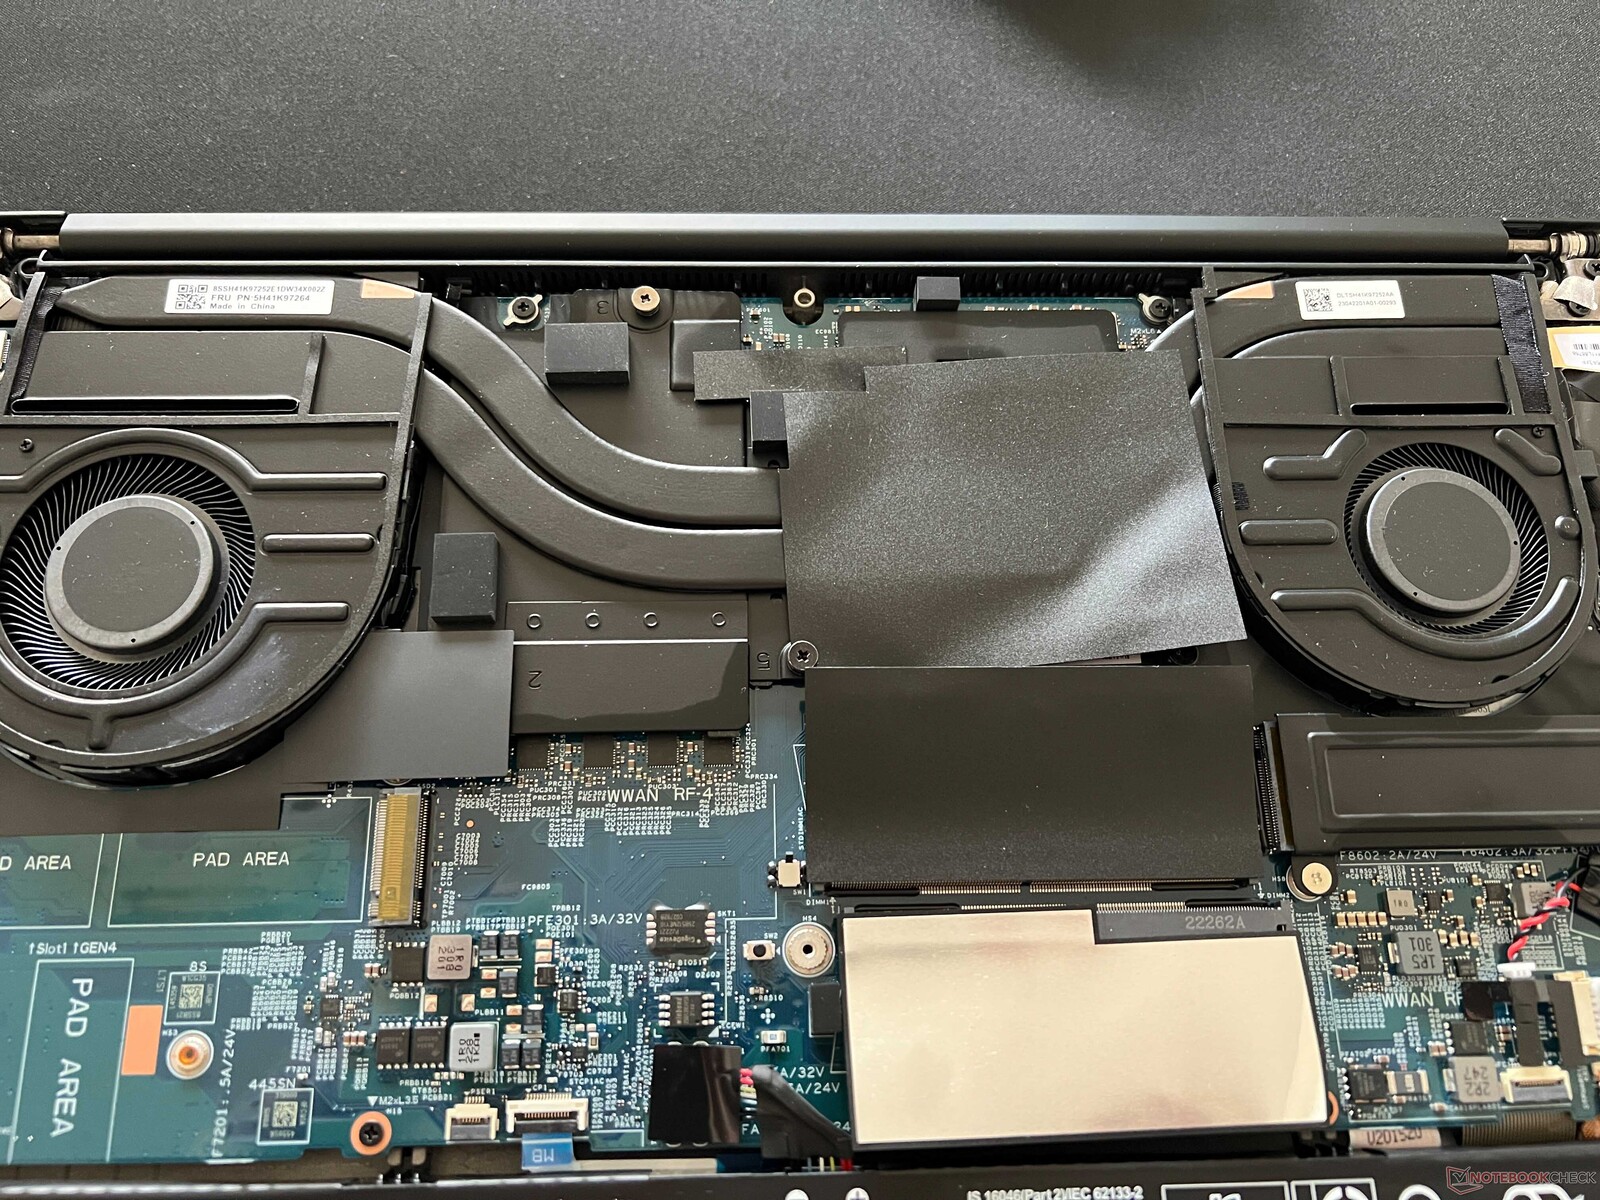
Alt kasa kapağı kolayca çıkarılabilir. Test cihazımız, M.2-2280 SSD'ler için iki yuvaya izin veren soğutma kanatlı geleneksel soğutmaya sahiptir. Ek olarak, RAM modülleri için iki SODIMM yuvası vardır, ancak WLAN modülü değiştirilemez.
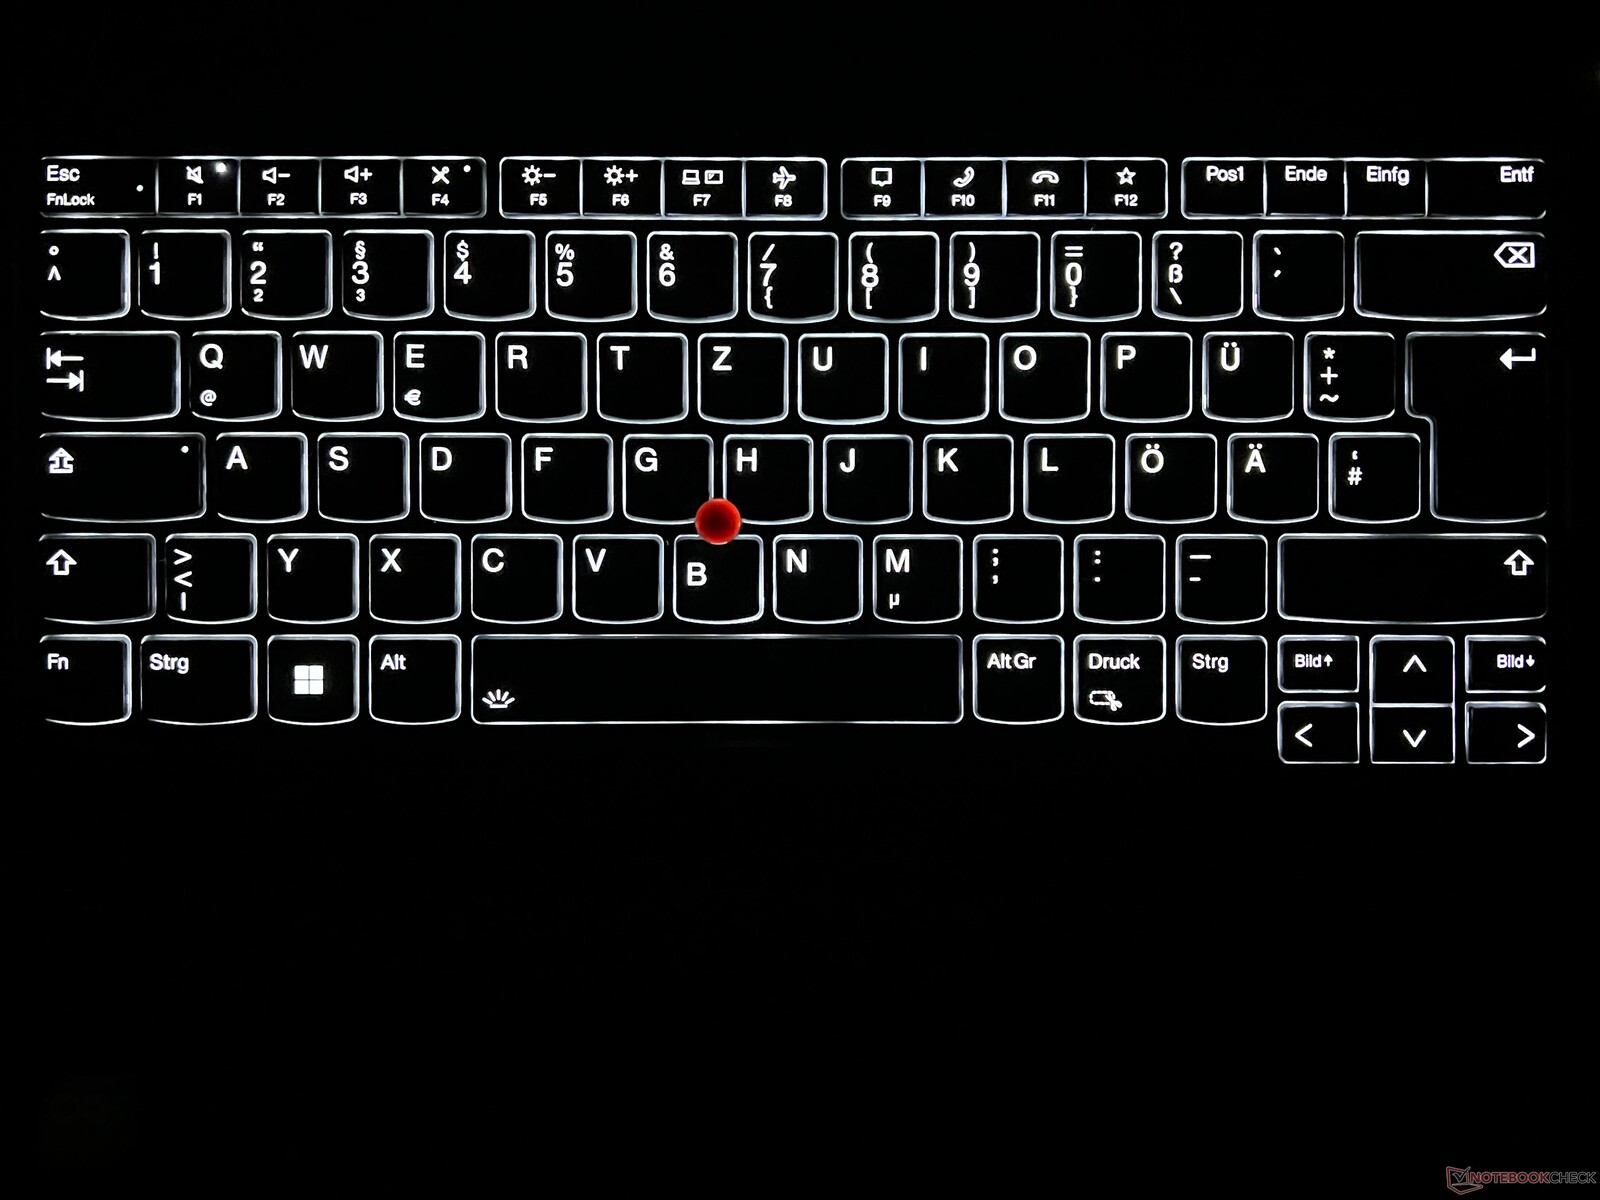
Giriş cihazları - 1,5 mm strok
Lenovo, son iki yıldır ThinkPad P1 için 0,06 inç vuruşlu bir klavye kullanıyor ve bu klavye mevcut modelde değişmedi. Klavye rahat bir yazma deneyimi sunarak uzun metinleri sorunsuz bir şekilde yazmaya olanak tanısa da, artık önceki modellerin kalitesiyle eşleşmiyor. Bu bakımdan rakiplerine göre önemli bir avantajı yok. İki kademeli beyaz arka ışık, bir sensör aracılığıyla otomatik aktivasyondan yoksun olmasına rağmen loş ışık koşullarında faydalı olduğunu kanıtlıyor.
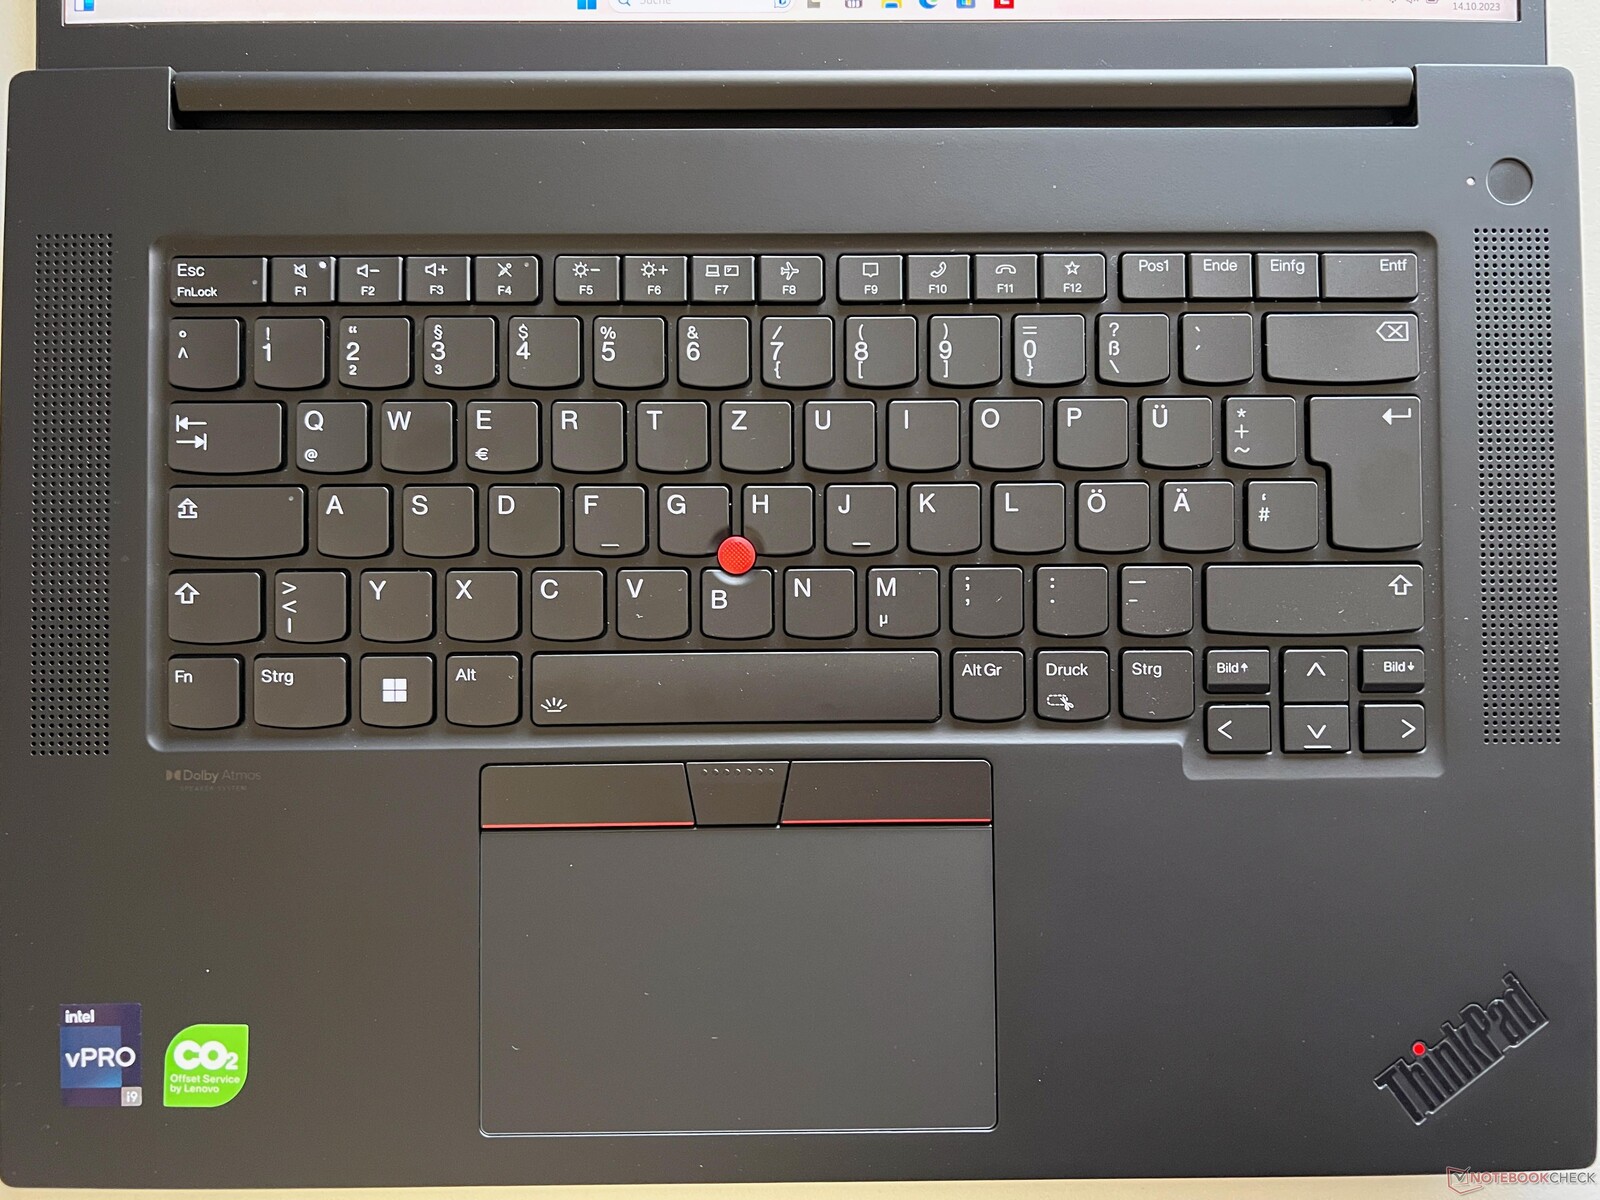
ClickPad, mükemmel kayma özellikleri ve yüksek kaliteli bir mekanizma sunarak sessiz ve pürüzsüz tıklama sesleri sağlar. Ayrıca, fare kontrolü için TrackPoint ve özel düğmeler mevcuttur. Düz tuşlar iyi ve sessiz bir yazma deneyimi sunuyor, sorunsuz çalışıyor; ancak test cihazımızdaki tuşlar biraz tıkırtılı görünüyor.
Ekran - 165 Hz ve 500 cd/m² ile mat IPS panel
Lenovo, geçen yılki G5 neslinde WQHD çözünürlüğe sahip isteğe bağlı 165 Hz ekranı tanıttı, ancak bunu ancak şimdi test edebiliyoruz. Standart yapılandırma 300 cd/m² parlaklığa sahip mat bir Full HD panel içeriyor. Buna ek olarak, tam P3 kapsama alanına sahip 4K OLED ekran seçeneği de mevcut. AdobeRGB kapsama alanına sahip 4K IPS modelinin, geçen yılki testimizde test ettiğimizi belirtmek gerekir ThinkPad X1 Extremebu versiyonda mevcut değildir.
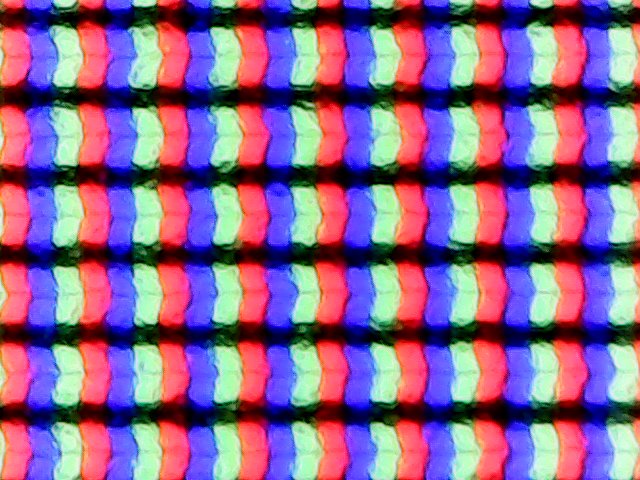
İnceleme ünitemizdeki opsiyonel IPS ekran, mükemmel öznel görüntü kalitesiyle öne çıkıyor. Renkler canlı görünüyor ve yüksek yenileme hızı sayesinde hareketler inanılmaz derecede akıcı ve tüm içerikler son derece keskin. Parlak alanlarda bile grenlilik yok ve ekran PWM titremesiyle ilgili herhangi bir sorun sergilemiyor. Ayrıca, tepki süreleri etkileyici derecede hızlı ve fark edilebilir gölgelenme efektleri yok. Yüksek parlaklık seviyelerinde, karanlık bir arka plan üzerinde hafif haleler görülebilir, ancak bu pratik kullanımda önemli bir sorun değildir.
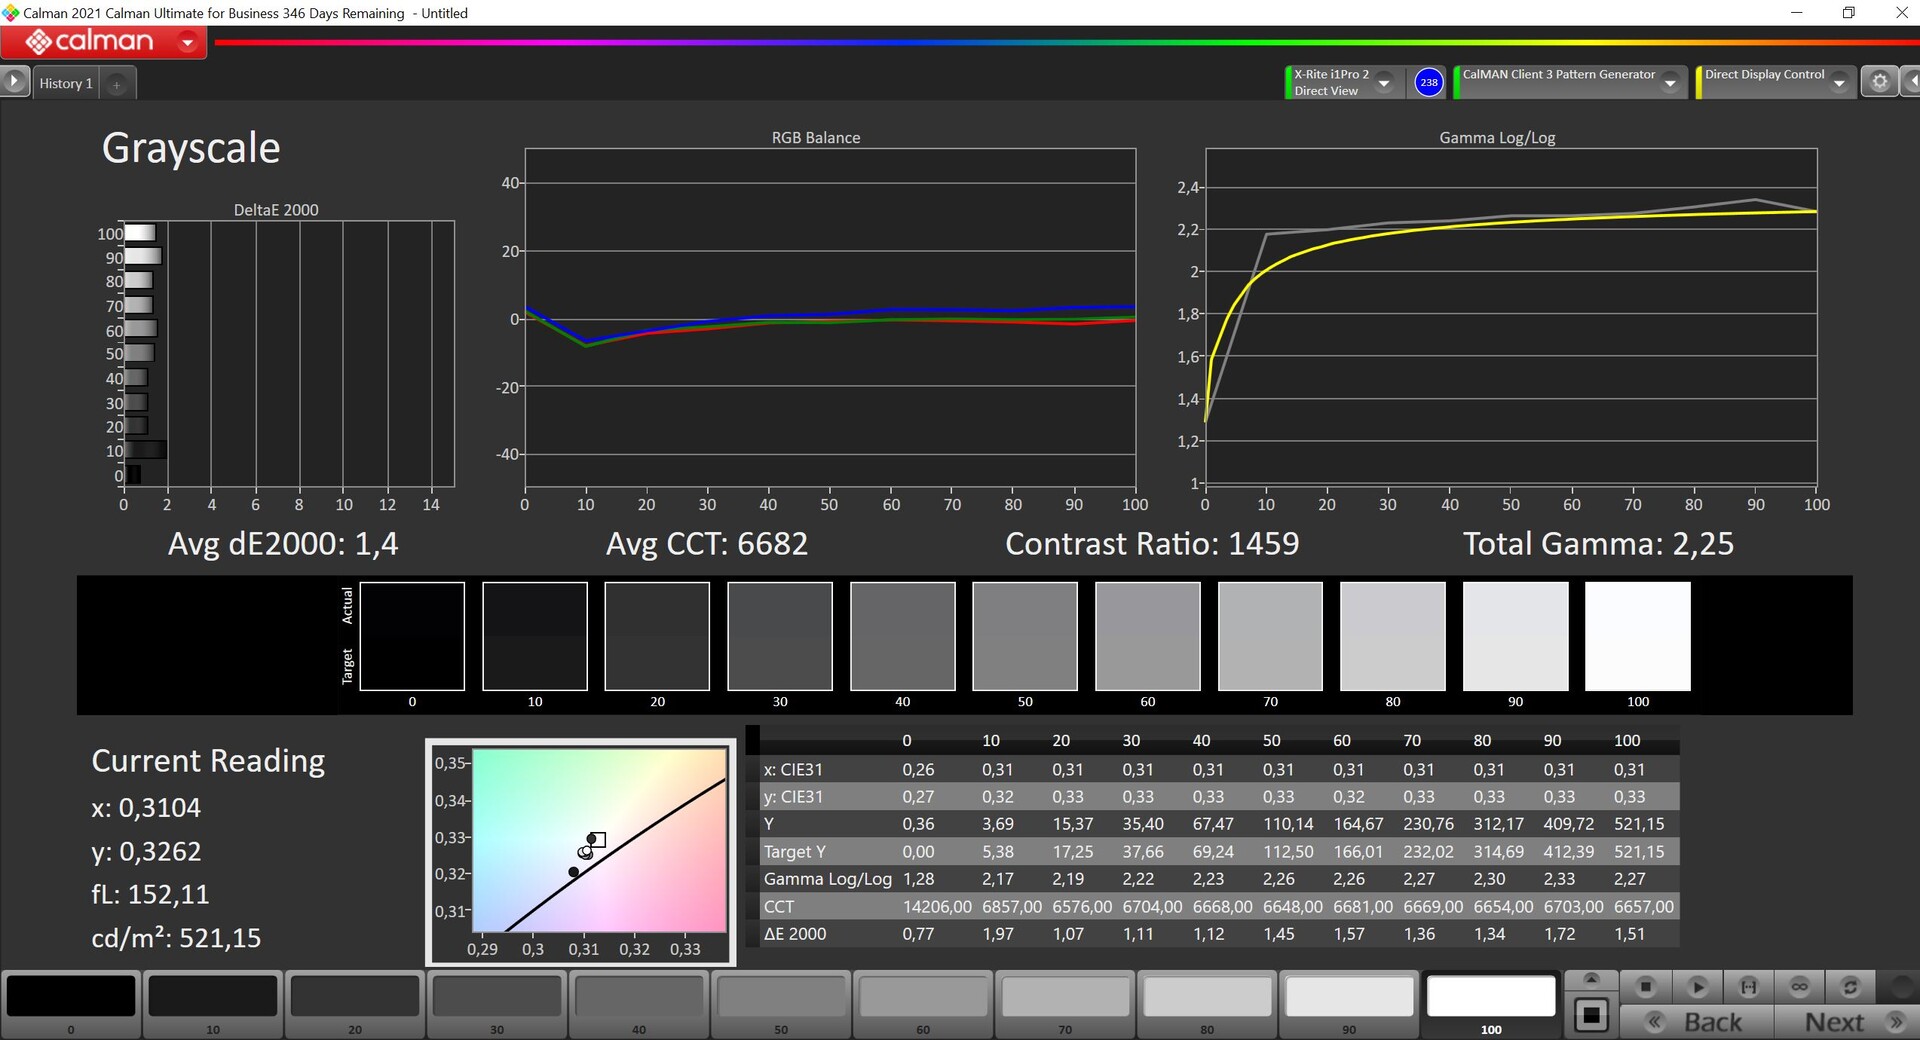
Lenovo, en azından ekranın merkezinde doğrulayabileceğimiz bir rakam olan 500 cd/m²'lik bir parlaklık iddia ediyor. İnceleme örneğimizin ortalama parlaklığı 485 cd/m²'nin biraz altındadır ve standart panele göre önemli bir iyileşmeyi temsil etmektedir. Siyah değeri (0,36 cd/m²) yüksek parlaklıktan biraz etkileniyor. Bununla birlikte, maksimum kontrast oranı hala 1400:1'i aşıyor.
| |||||||||||||||||||||||||
Aydınlatma: 89 %
Batarya modunda parlaklık: 520 cd/m²
Kontrast: 1447:1 (Siyah: 0.36 cd/m²)
ΔE ColorChecker Calman: 1.2 | ∀{0.5-29.43 Ø4.73}
calibrated: 1
ΔE Greyscale Calman: 1.4 | ∀{0.09-98 Ø4.97}
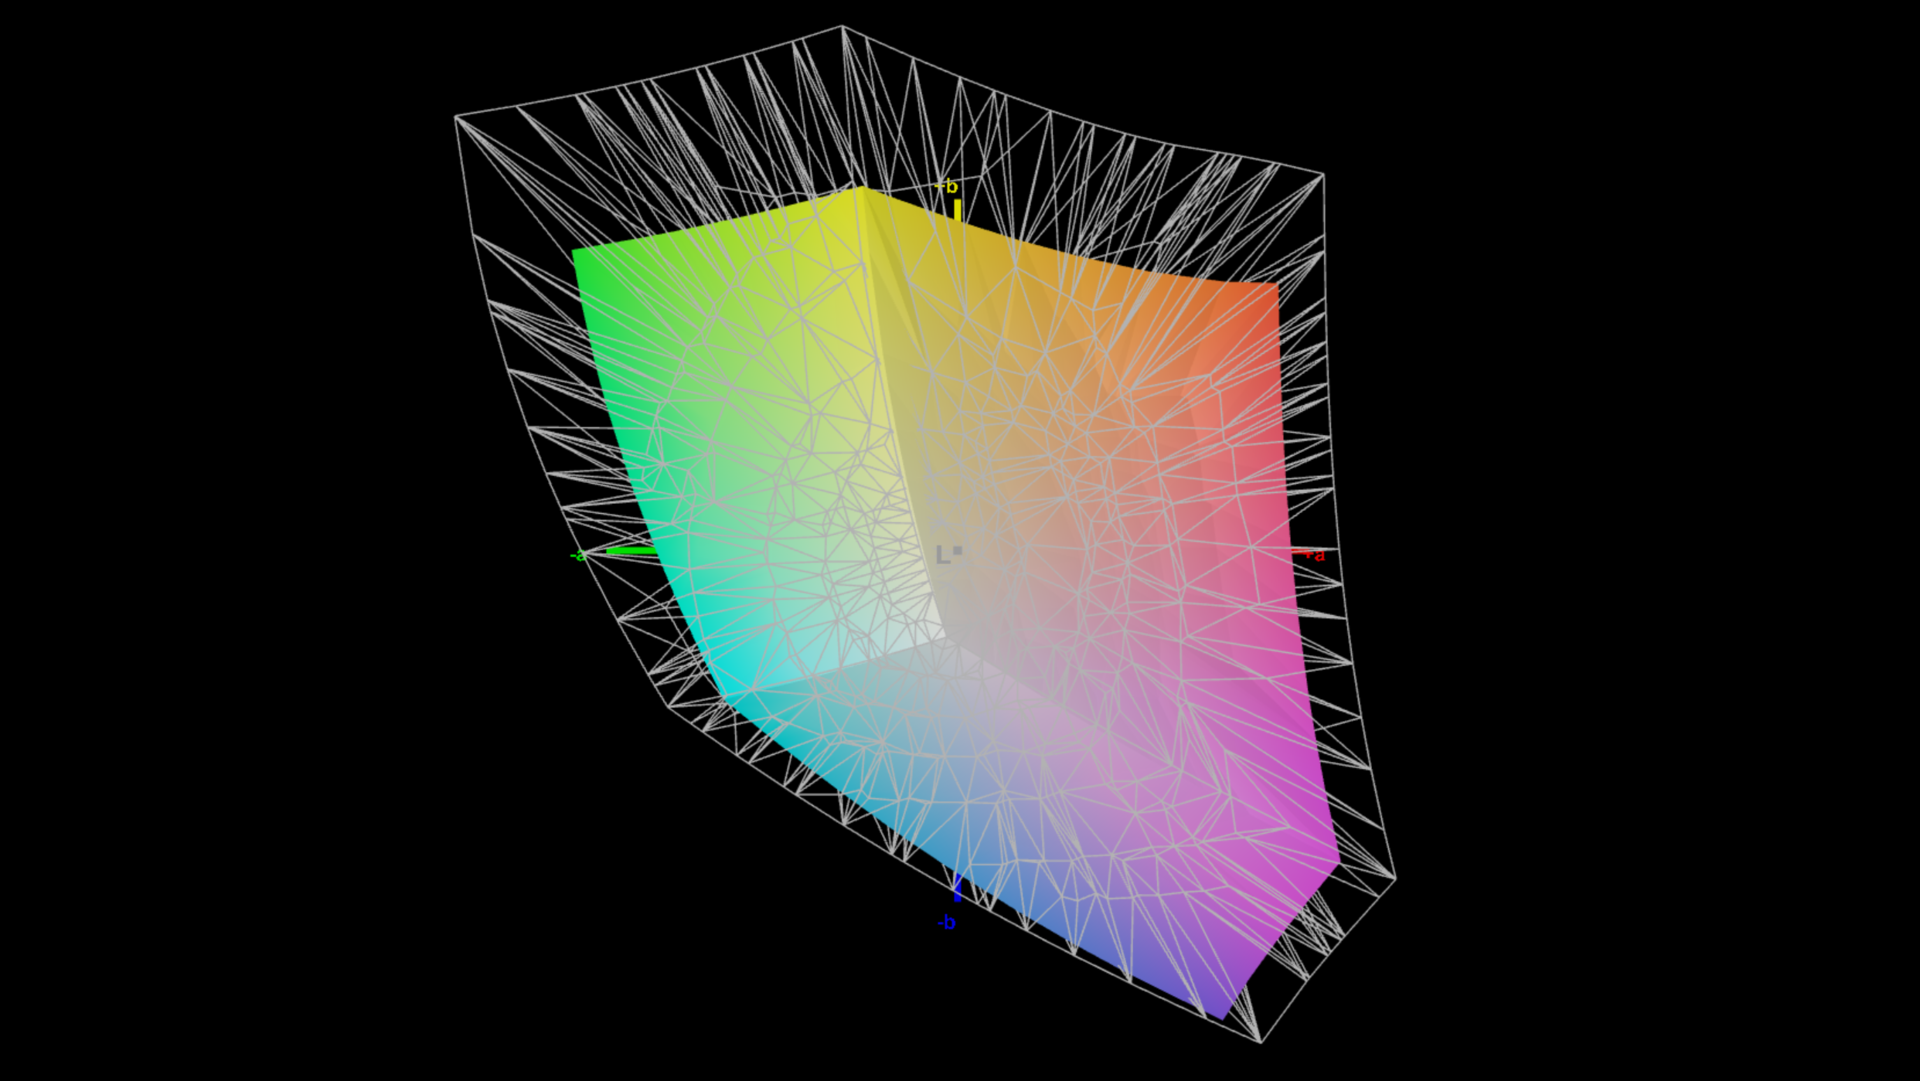
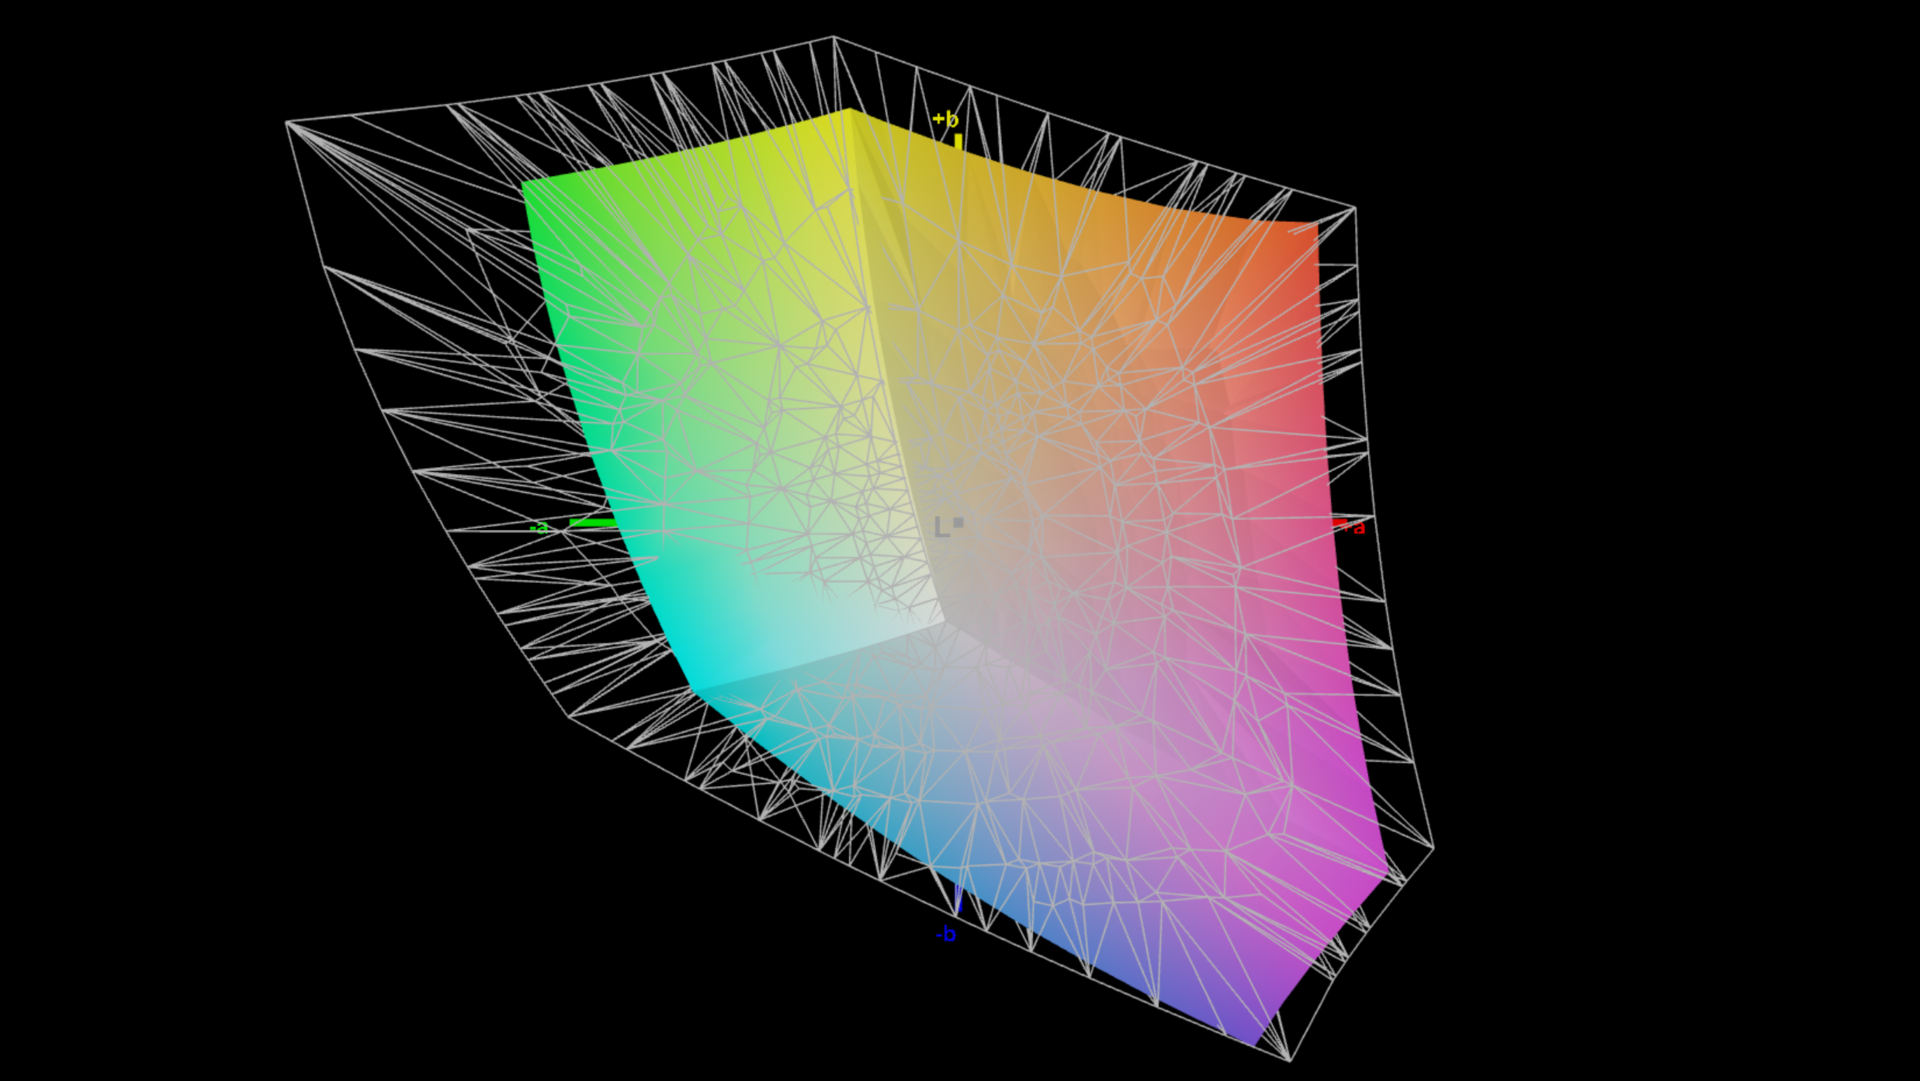
70.2% AdobeRGB 1998 (Argyll 3D)
97.5% sRGB (Argyll 3D)
68.1% Display P3 (Argyll 3D)
Gamma: 2.25
CCT: 6682 K
| Lenovo ThinkPad P1 G6-21FV000DGE NE160QDM-NY1, IPS, 2560x1600, 16" | Dell Precision 5000 5680 Samsung 160YV03, OLED, 3840x2400, 16" | Samsung Galaxy Book3 Ultra 16, i9-13900H RTX 4070 Samsung SDC4185 ATNA60CL03-0, OLED / AMOLED, 2880x1800, 16" | HP ZBook Studio 16 G9 62U04EA BOE0A52, IPS, 3840x2400, 16" | MSI CreatorPro Z16P B12UKST B160QAN02.N, IPS, 2560x1600, 16" | Schenker VISION 16 Pro (M23) NE160QDM-NZ1, IPS, 2560x1600, 16" | Lenovo ThinkPad X1 Extreme G5-21DE003RGE LP160UQ1-SPB1, IPS, 3840x2400, 16" | |
|---|---|---|---|---|---|---|---|
| Display | 30% | 27% | 23% | 23% | 1% | 22% | |
| Display P3 Coverage (%) | 68.1 | 99.9 47% | 95.3 40% | 97.5 43% | 97.6 43% | 68.8 1% | 84.6 24% |
| sRGB Coverage (%) | 97.5 | 100 3% | 99.1 2% | 99.9 2% | 99.9 2% | 98.8 1% | 99.2 2% |
| AdobeRGB 1998 Coverage (%) | 70.2 | 97.5 39% | 97.4 39% | 86.3 23% | 87.4 25% | 70 0% | 97.7 39% |
| Response Times | 85% | 82% | 12% | 15% | 8% | -168% | |
| Response Time Grey 50% / Grey 80% * (ms) | 13.7 ? | 1.68 ? 88% | 2 ? 85% | 15.3 ? -12% | 12.8 ? 7% | 13.7 ? -0% | 46 ? -236% |
| Response Time Black / White * (ms) | 9.6 ? | 1.77 ? 82% | 2 ? 79% | 6.1 ? 36% | 7.4 ? 23% | 8.1 ? 16% | 19.2 ? -100% |
| PWM Frequency (Hz) | 60 ? | 250 ? | |||||
| Screen | -79% | -51% | 0% | -10% | -74% | -29% | |
| Brightness middle (cd/m²) | 521 | 345.7 -34% | 403 -23% | 554 6% | 407 -22% | 384 -26% | 476 -9% |
| Brightness (cd/m²) | 484 | 349 -28% | 408 -16% | 516 7% | 388 -20% | 371 -23% | 470 -3% |
| Brightness Distribution (%) | 89 | 98 10% | 98 10% | 84 -6% | 88 -1% | 88 -1% | 90 1% |
| Black Level * (cd/m²) | 0.36 | 0.47 -31% | 0.36 -0% | 0.3 17% | 0.35 3% | ||
| Contrast (:1) | 1447 | 1179 -19% | 1131 -22% | 1280 -12% | 1360 -6% | ||
| Colorchecker dE 2000 * | 1.2 | 3.59 -199% | 2.63 -119% | 1 17% | 1.3 -8% | 3.4 -183% | 1.9 -58% |
| Colorchecker dE 2000 max. * | 2.5 | 7.02 -181% | 4.07 -63% | 2.4 4% | 2.5 -0% | 9.2 -268% | 4.7 -88% |
| Colorchecker dE 2000 calibrated * | 1 | 0.99 1% | 0.6 40% | 0.7 30% | 1.3 -30% | 1.3 -30% | |
| Greyscale dE 2000 * | 1.4 | 3.1 -121% | 2.69 -92% | 1.6 -14% | 2.1 -50% | 3.4 -143% | 2.4 -71% |
| Gamma | 2.25 98% | 2.13 103% | 2.48 89% | 2.29 96% | 2.26 97% | 2.16 102% | 2.24 98% |
| CCT | 6682 97% | 6448 101% | 6907 94% | 6458 101% | 6437 101% | 7462 87% | 6377 102% |
| Toplam Ortalama (Program / Ayarlar) | 12% /
-24% | 19% /
-5% | 12% /
7% | 9% /
1% | -22% /
-47% | -58% /
-38% |
* ... daha küçük daha iyidir
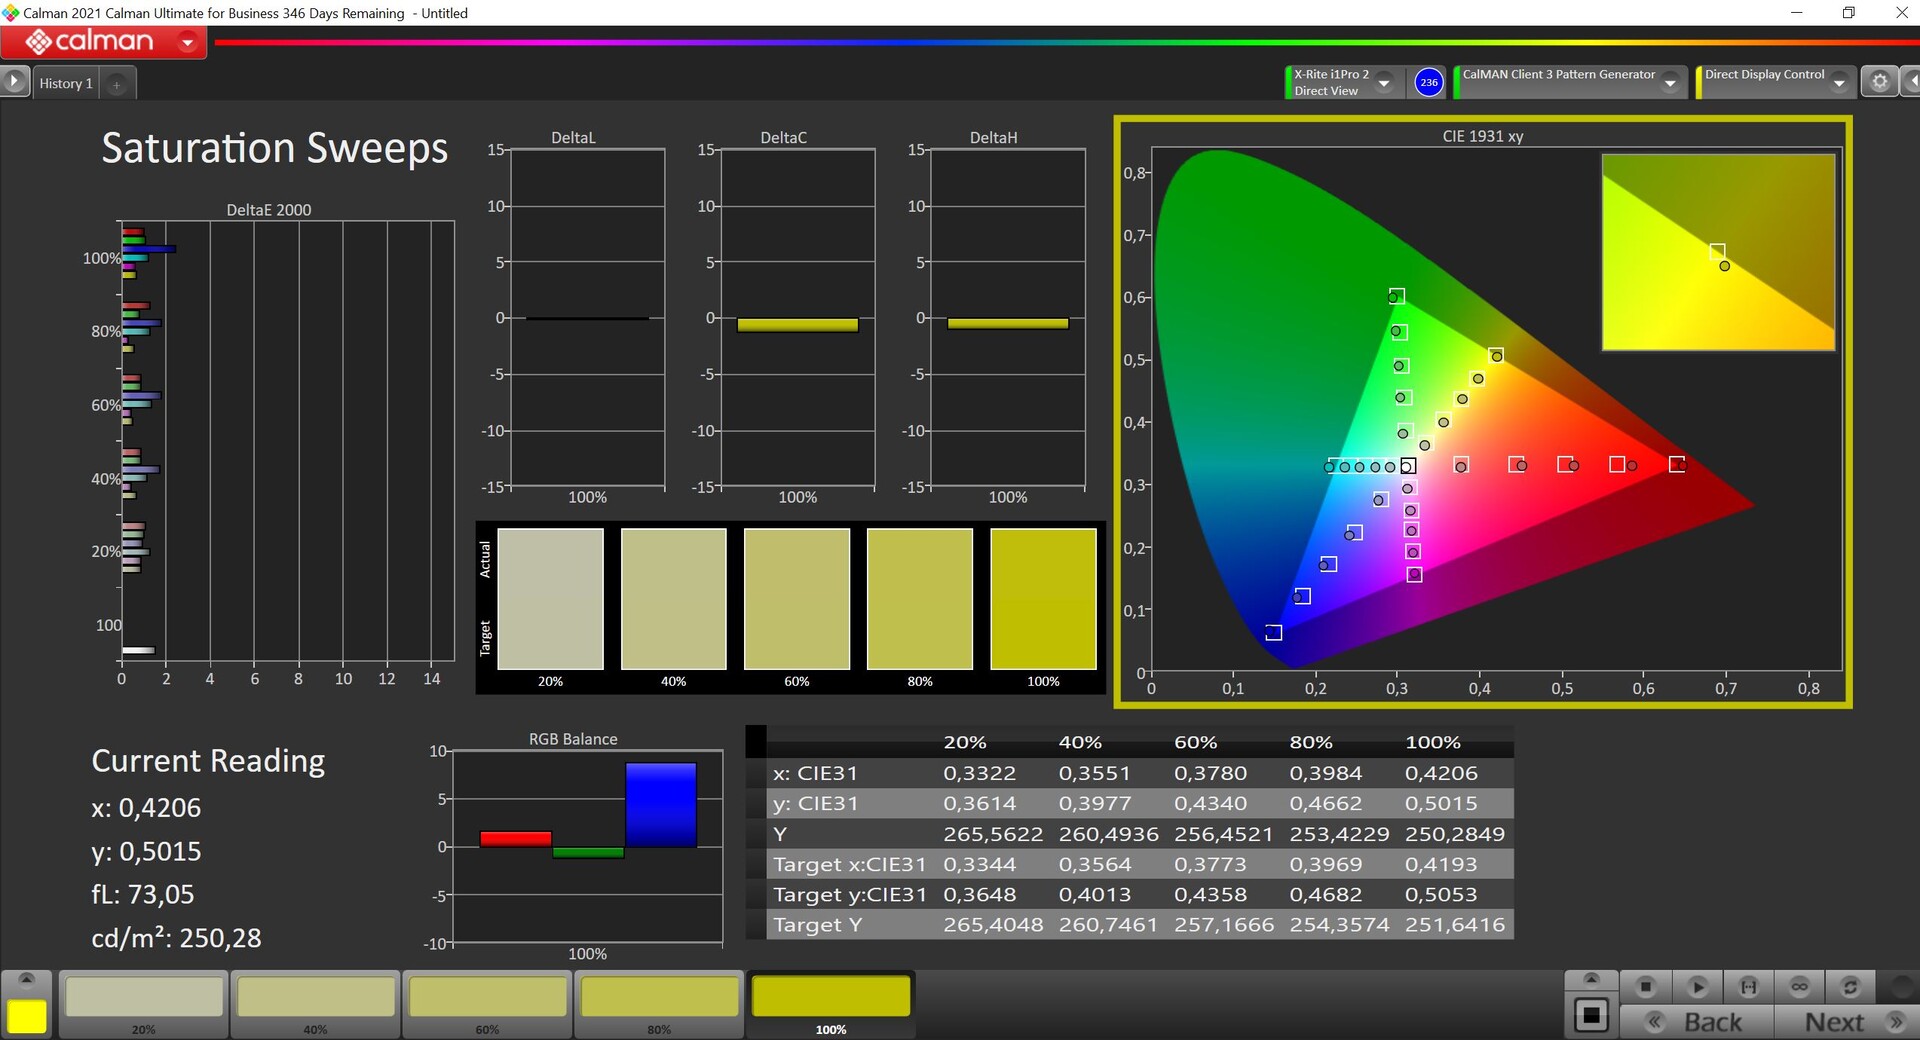
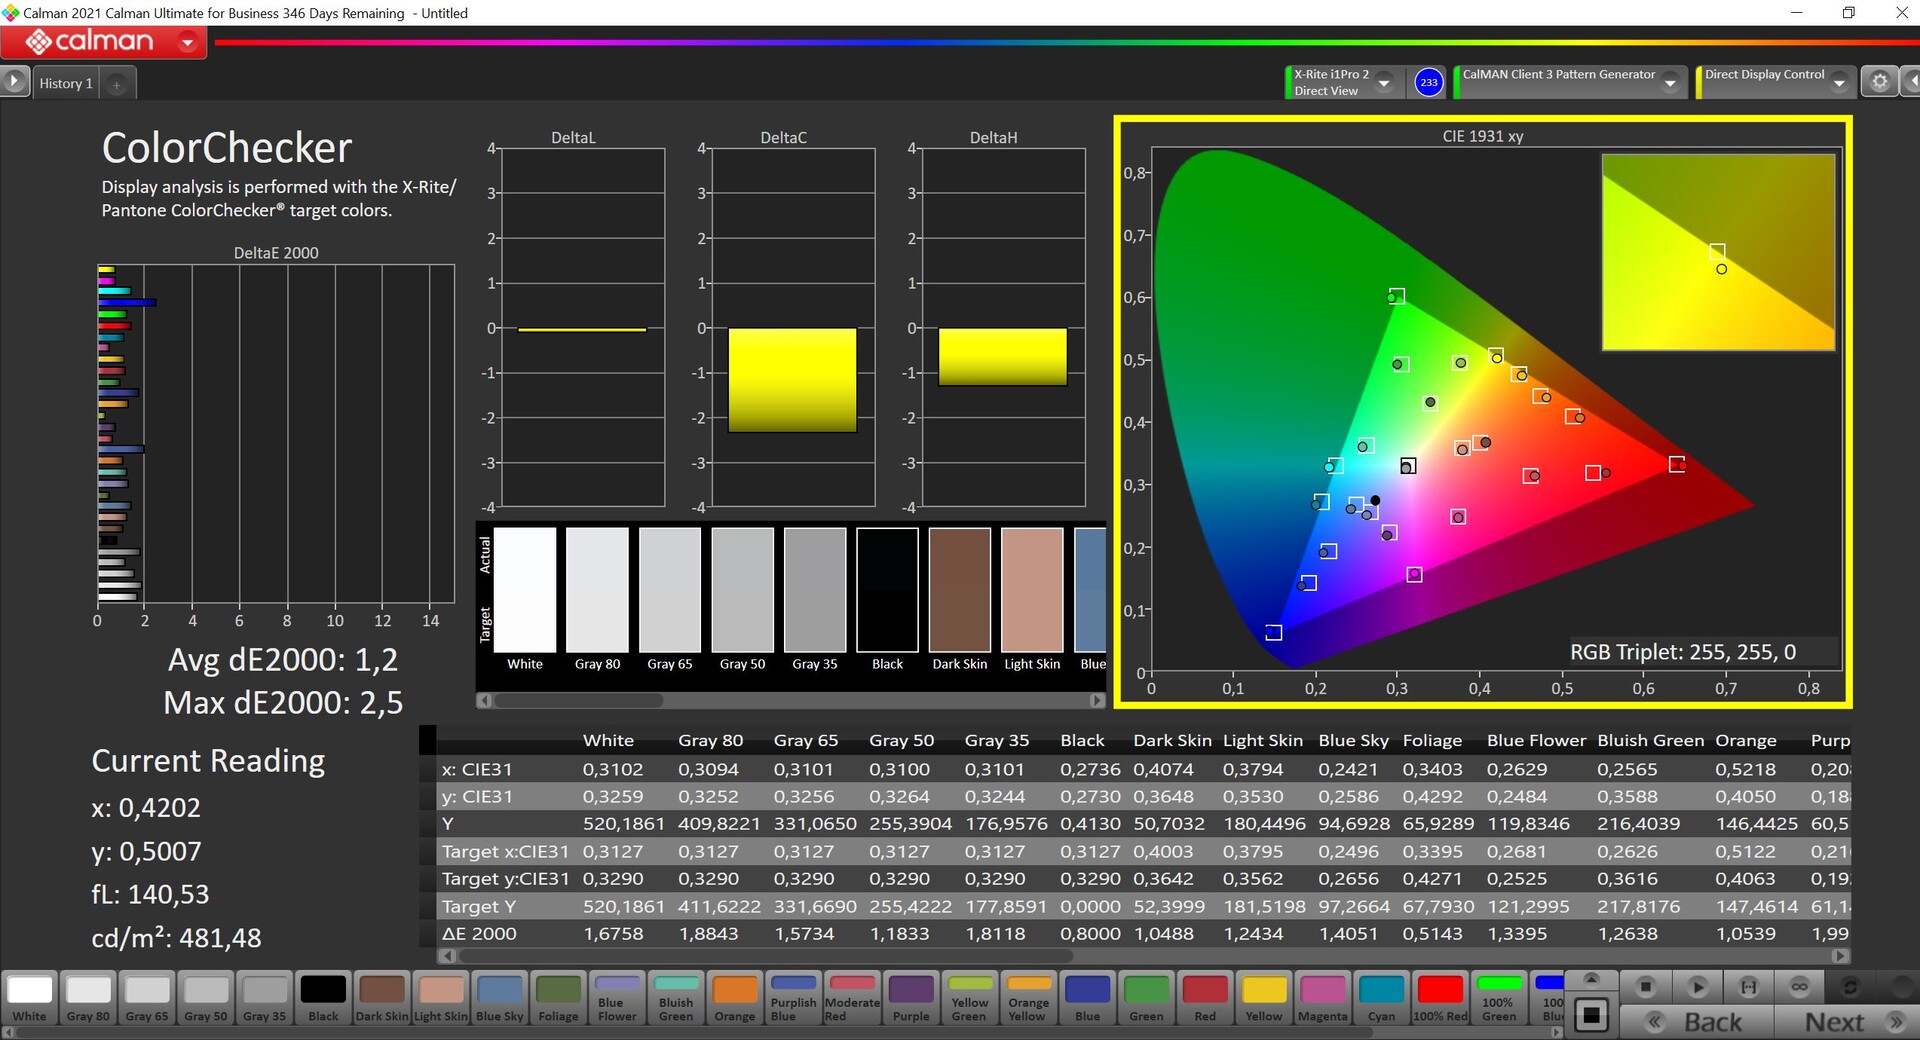
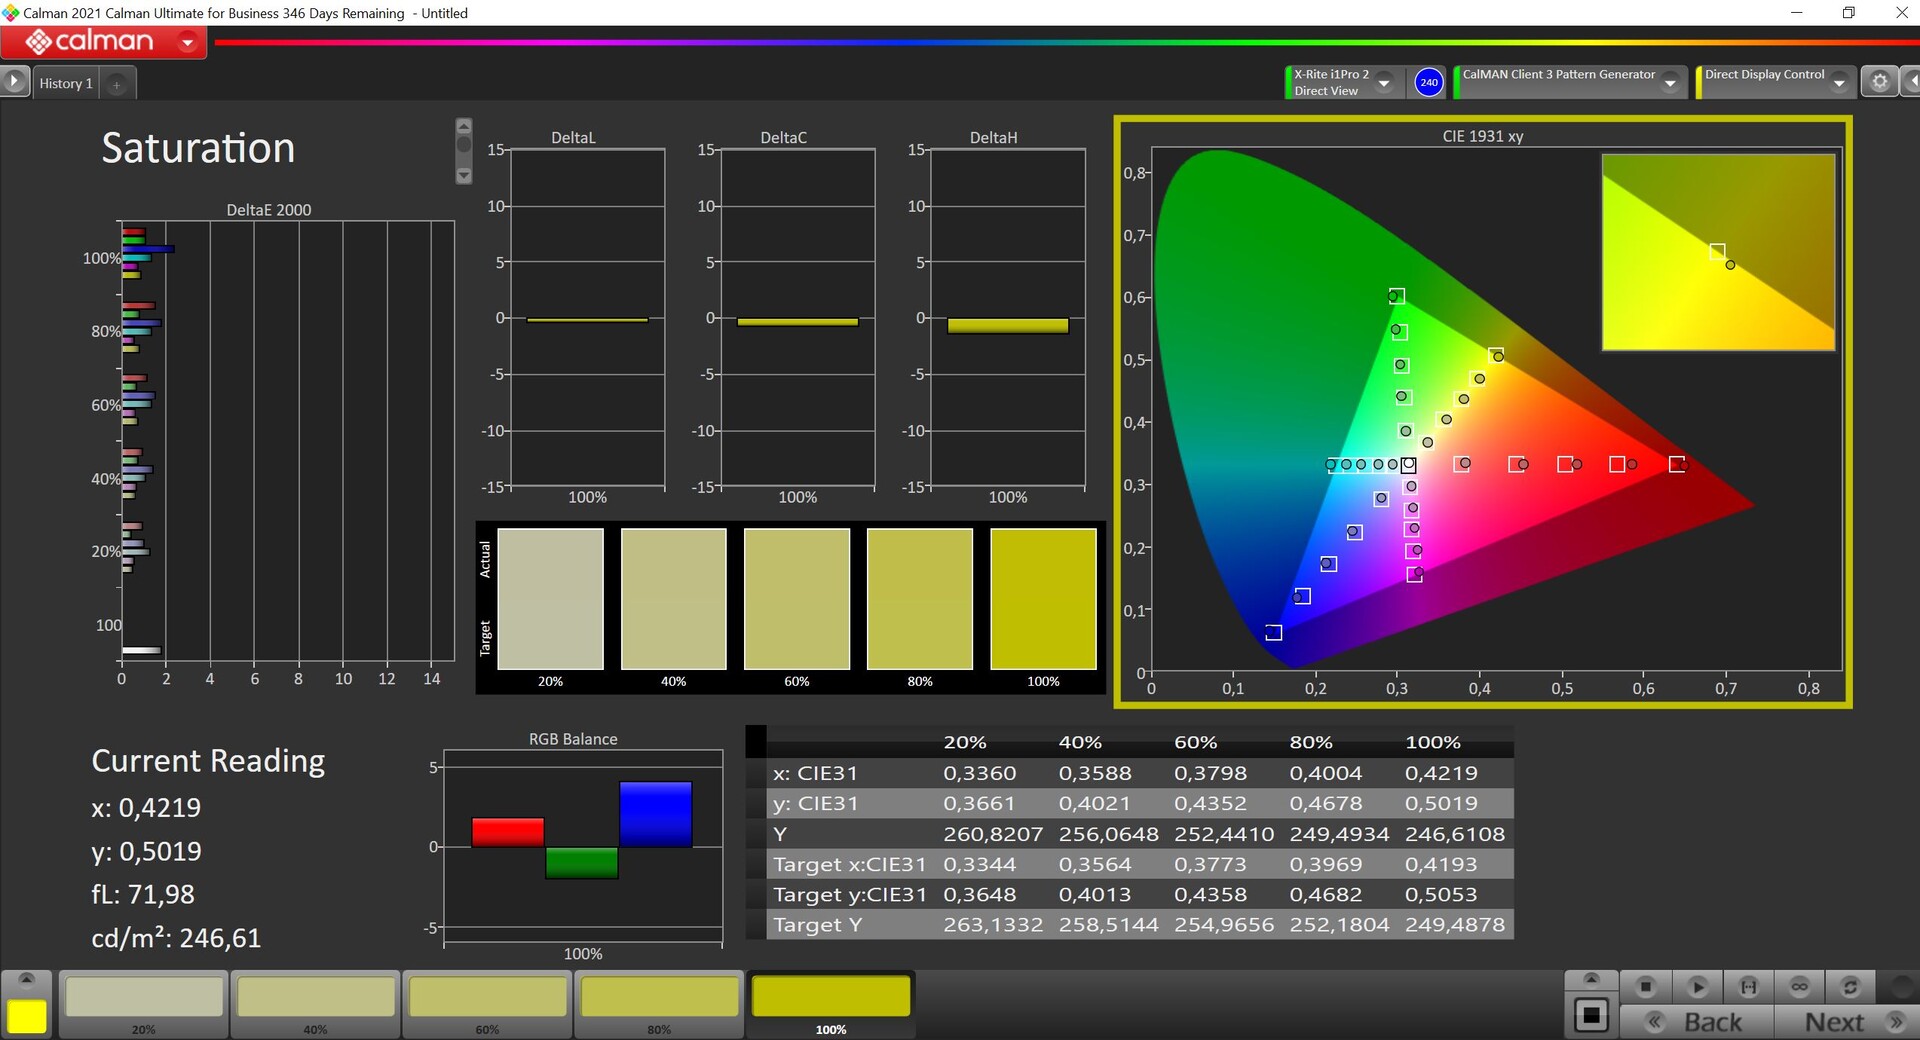
Her ThinkPad P1 Gen 6 ekranı fabrikada kalibre edilir ve müşteriler çeşitli renk profilleri arasından seçim yapabilir. Varsayılan profil, profesyonel CalMAN yazılımını kullanarak yaptığımız analizde gösterildiği gibi mükemmel değerler sergiliyor. Bu değerler zaten çok etkileyici, ne gri tonlamada ne de renklerde 3'ü aşan DeltaE-2000 sapması yok. Tek küçük dezavantaj, biraz daha sıcak olabilen gri tonlamadaki renk sıcaklığıdır. Bu önemsiz bir sorun ve kullanıcıların daha fazla kalibrasyon yapmasına gerek yok. Kendi kalibrasyonumuzu kullanarak renk tutarsızlıklarını biraz azaltabildik ve renk sıcaklığını optimum değere yaklaştırabildik (ilgili profil yukarıda ücretsiz olarak indirilebilir).


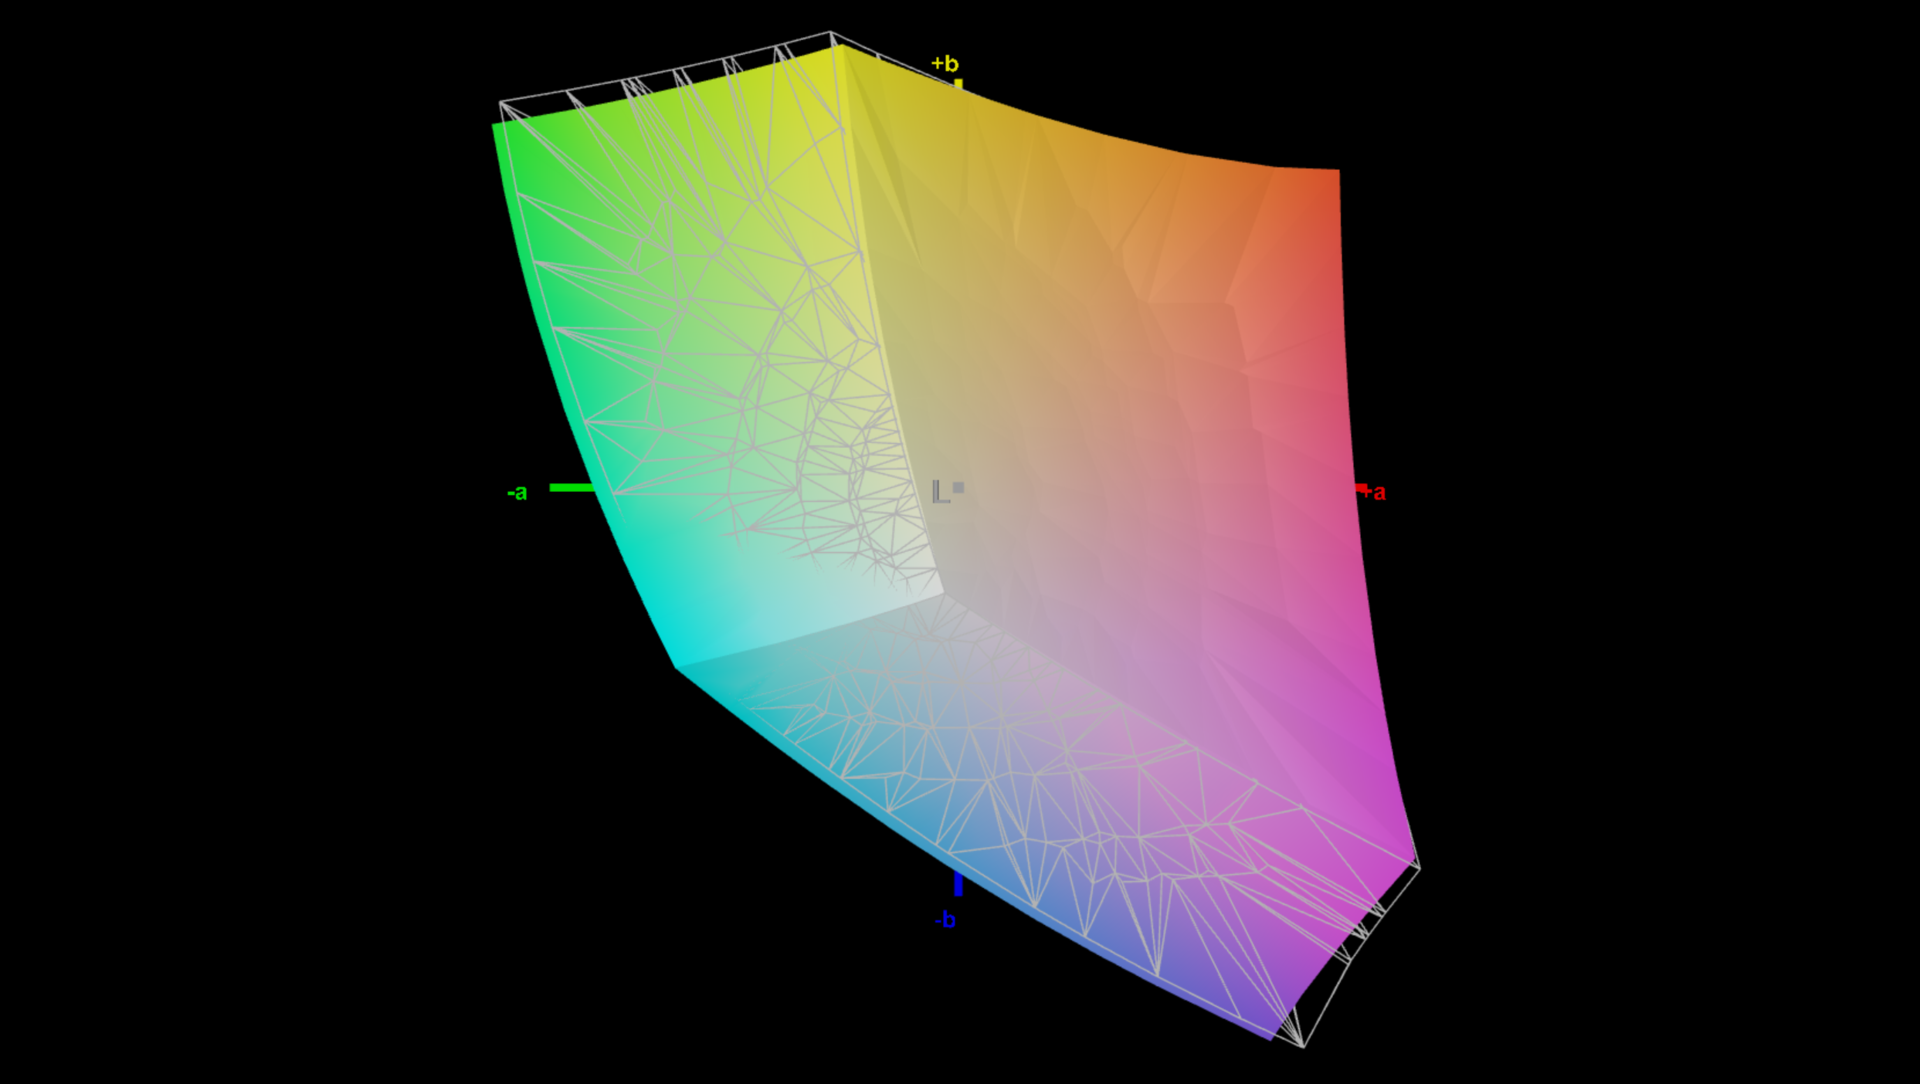
Ekran, birçok uygulama için yeterli olan daha küçük sRGB renk alanını tamamen kapsar. Daha geniş P3 renk alanına ihtiyacınız varsa OLED panel kullanmanız gerekecektir, ancak OLED'in PWM ve daha yüksek güç tüketimi gibi dezavantajları nedeniyle genellikle 165 Hz paneli öneriyoruz.
Yanıt Sürelerini Görüntüle
| ↔ Tepki Süresi Siyahtan Beyaza | ||
|---|---|---|
| 9.6 ms ... yükseliş ↗ ve sonbahar↘ birleşimi | ↗ 4.8 ms yükseliş | 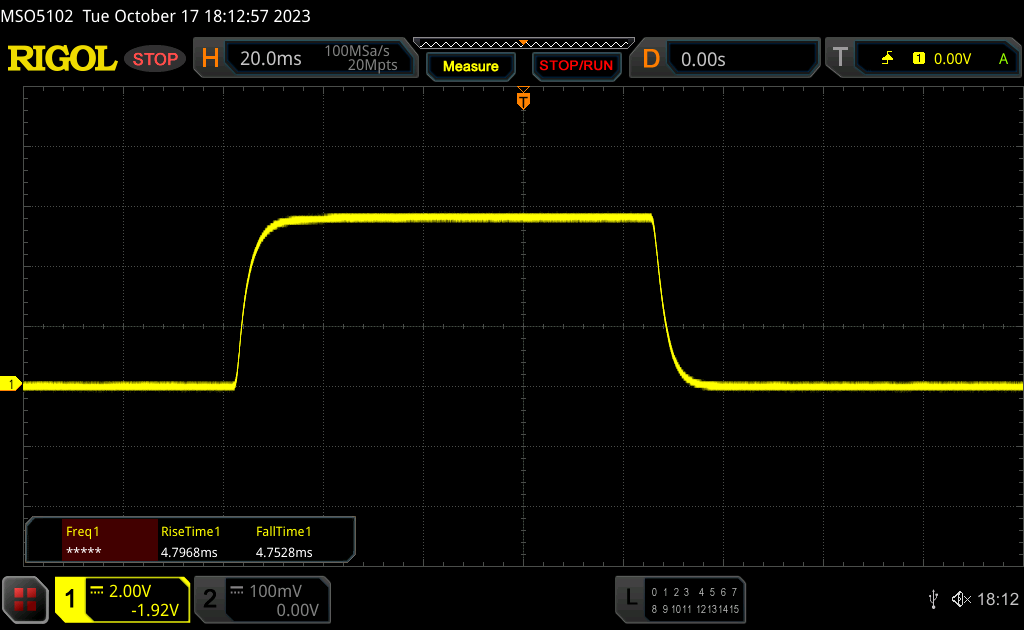 |
| ↘ 4.8 ms sonbahar | ||
| Ekran, testlerimizde hızlı yanıt oranları gösteriyor ve oyun oynamaya uygun olmalı. Karşılaştırıldığında, test edilen tüm cihazlar 0.1 (minimum) ile 240 (maksimum) ms arasında değişir. » Tüm cihazların 26 %'si daha iyi. Bu, ölçülen yanıt süresinin test edilen tüm cihazların ortalamasından (19.9 ms) daha iyi olduğu anlamına gelir. | ||
| ↔ Tepki Süresi %50 Griden %80 Griye | ||
| 13.7 ms ... yükseliş ↗ ve sonbahar↘ birleşimi | ↗ 6.7 ms yükseliş | 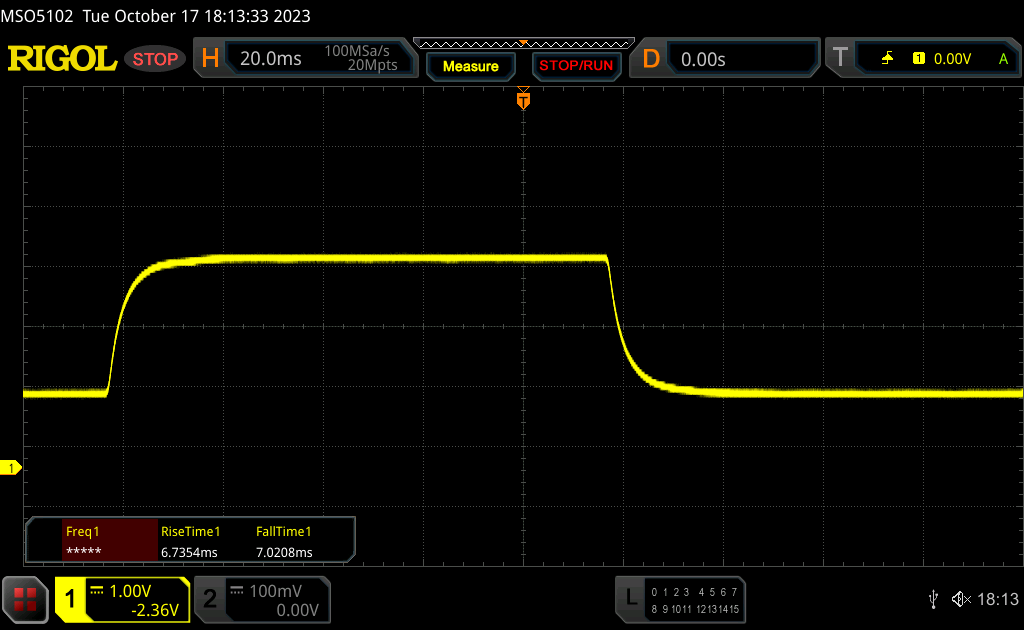 |
| ↘ 7 ms sonbahar | ||
| Ekran, testlerimizde iyi yanıt oranları gösteriyor ancak rekabetçi oyuncular için çok yavaş olabilir. Karşılaştırıldığında, test edilen tüm cihazlar 0.165 (minimum) ile 636 (maksimum) ms arasında değişir. » Tüm cihazların 27 %'si daha iyi. Bu, ölçülen yanıt süresinin test edilen tüm cihazların ortalamasından (31.1 ms) daha iyi olduğu anlamına gelir. | ||
Ekran Titremesi / PWM (Darbe Genişliği Modülasyonu)
| Ekran titriyor / PWM algılanmadı | 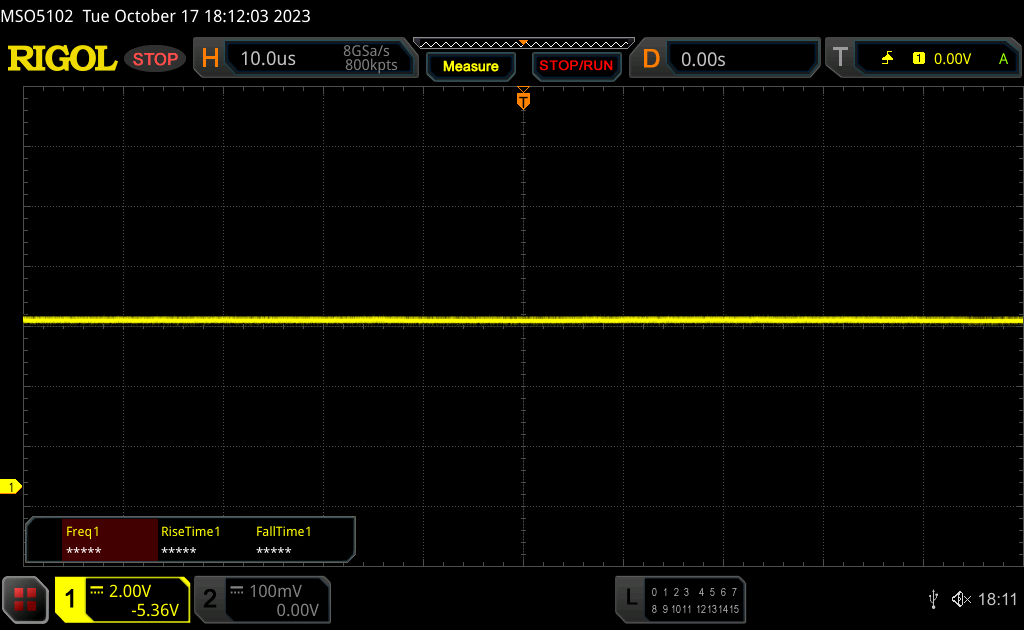 | ||
Karşılaştırıldığında: Test edilen tüm cihazların %52 %'si ekranı karartmak için PWM kullanmıyor. PWM tespit edilirse, ortalama 7798 (minimum: 5 - maksimum: 343500) Hz ölçüldü. | |||
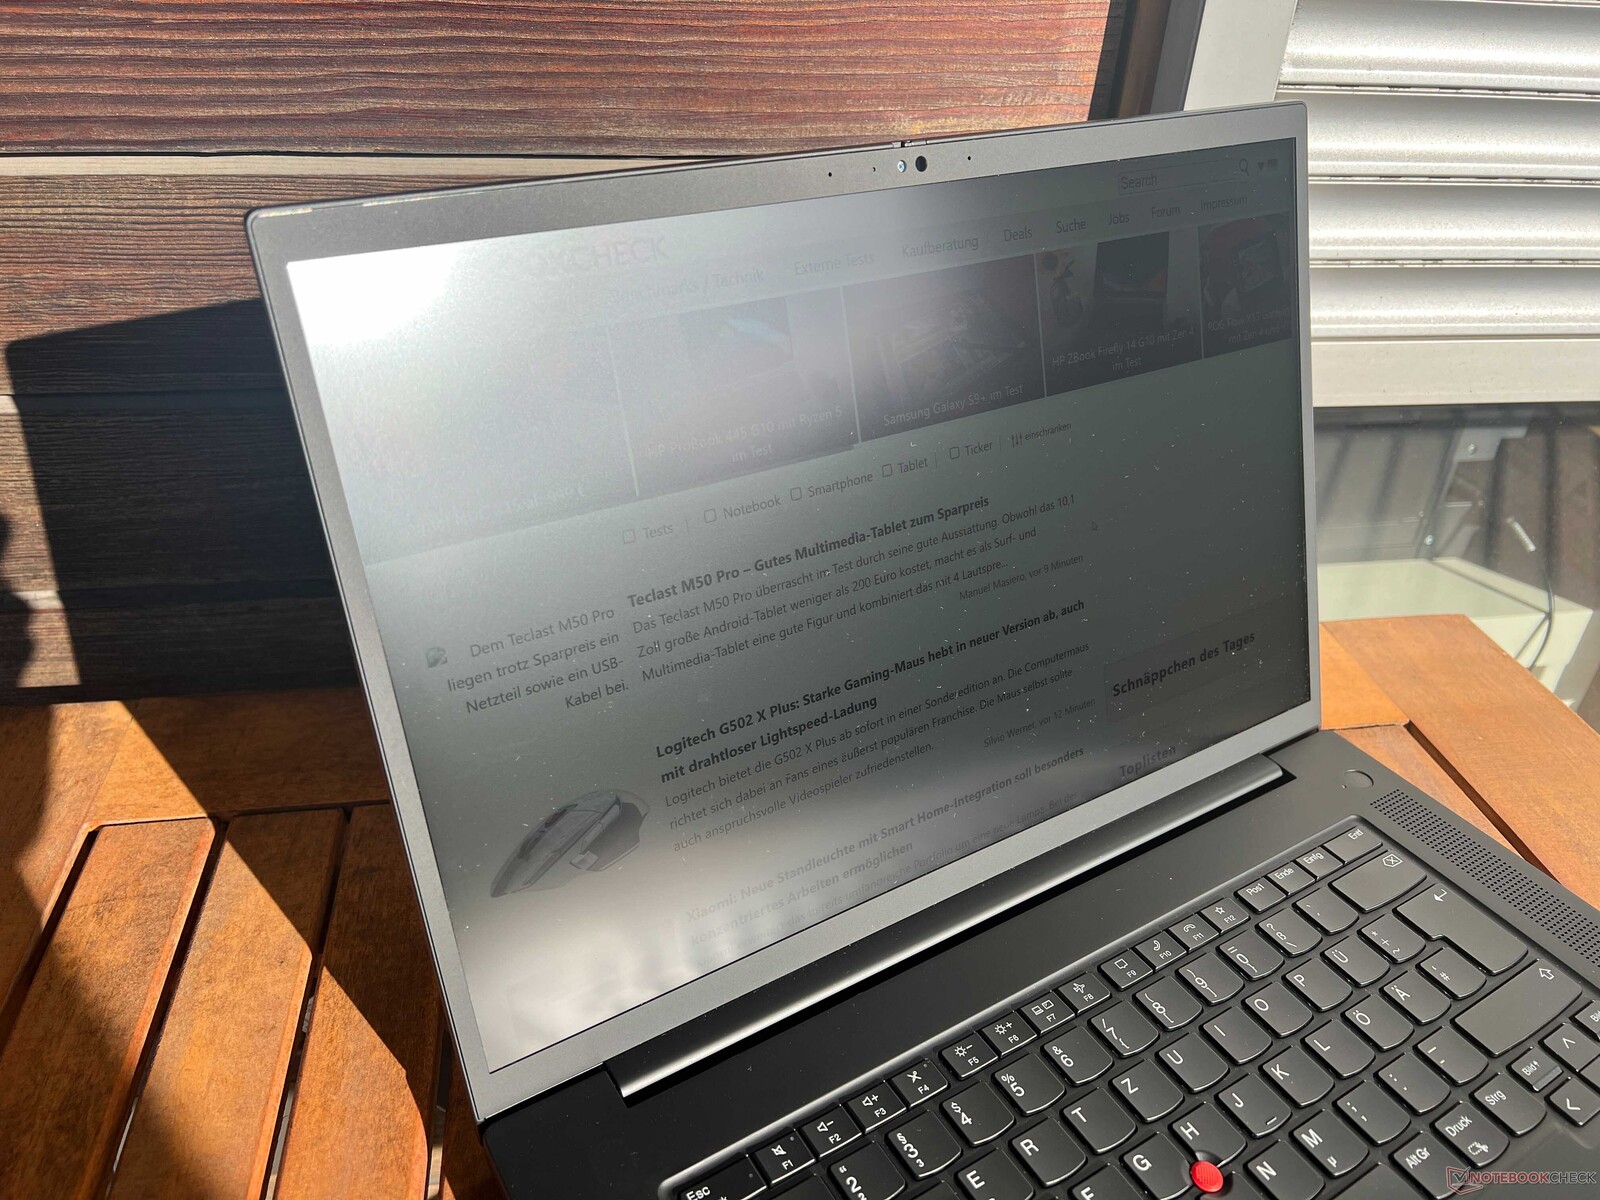
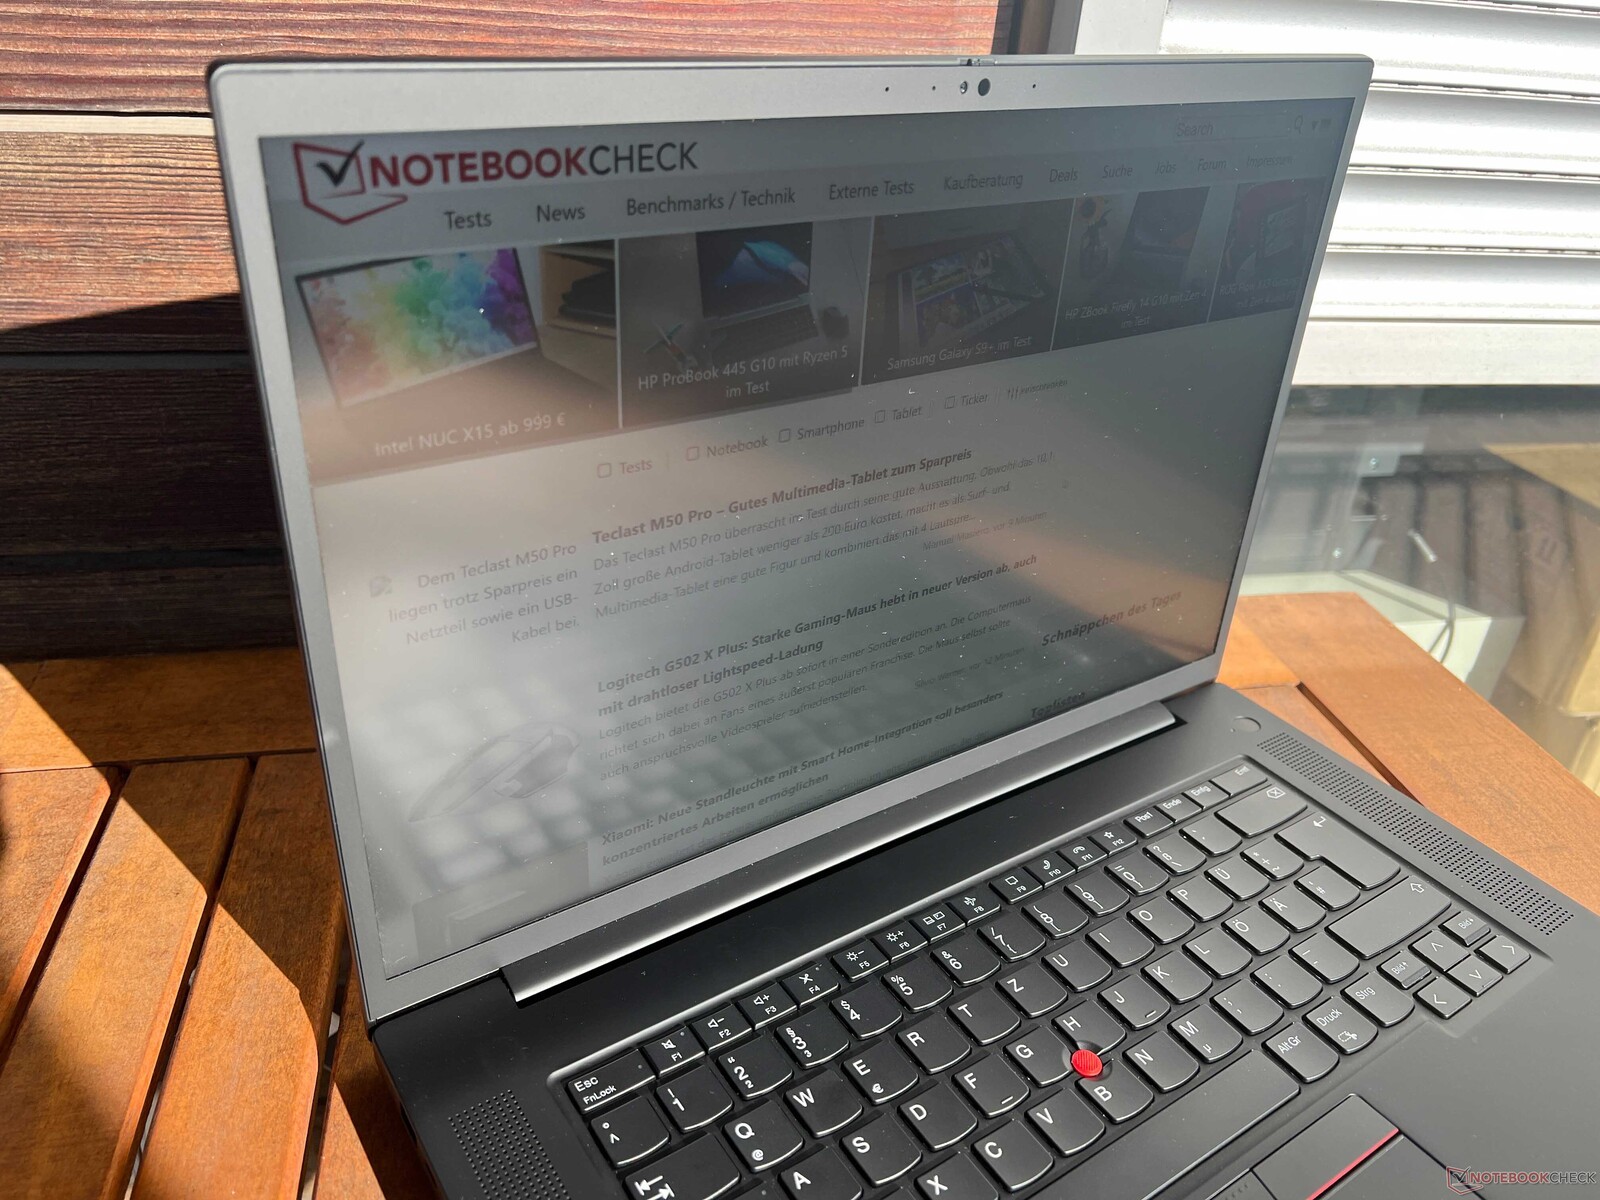
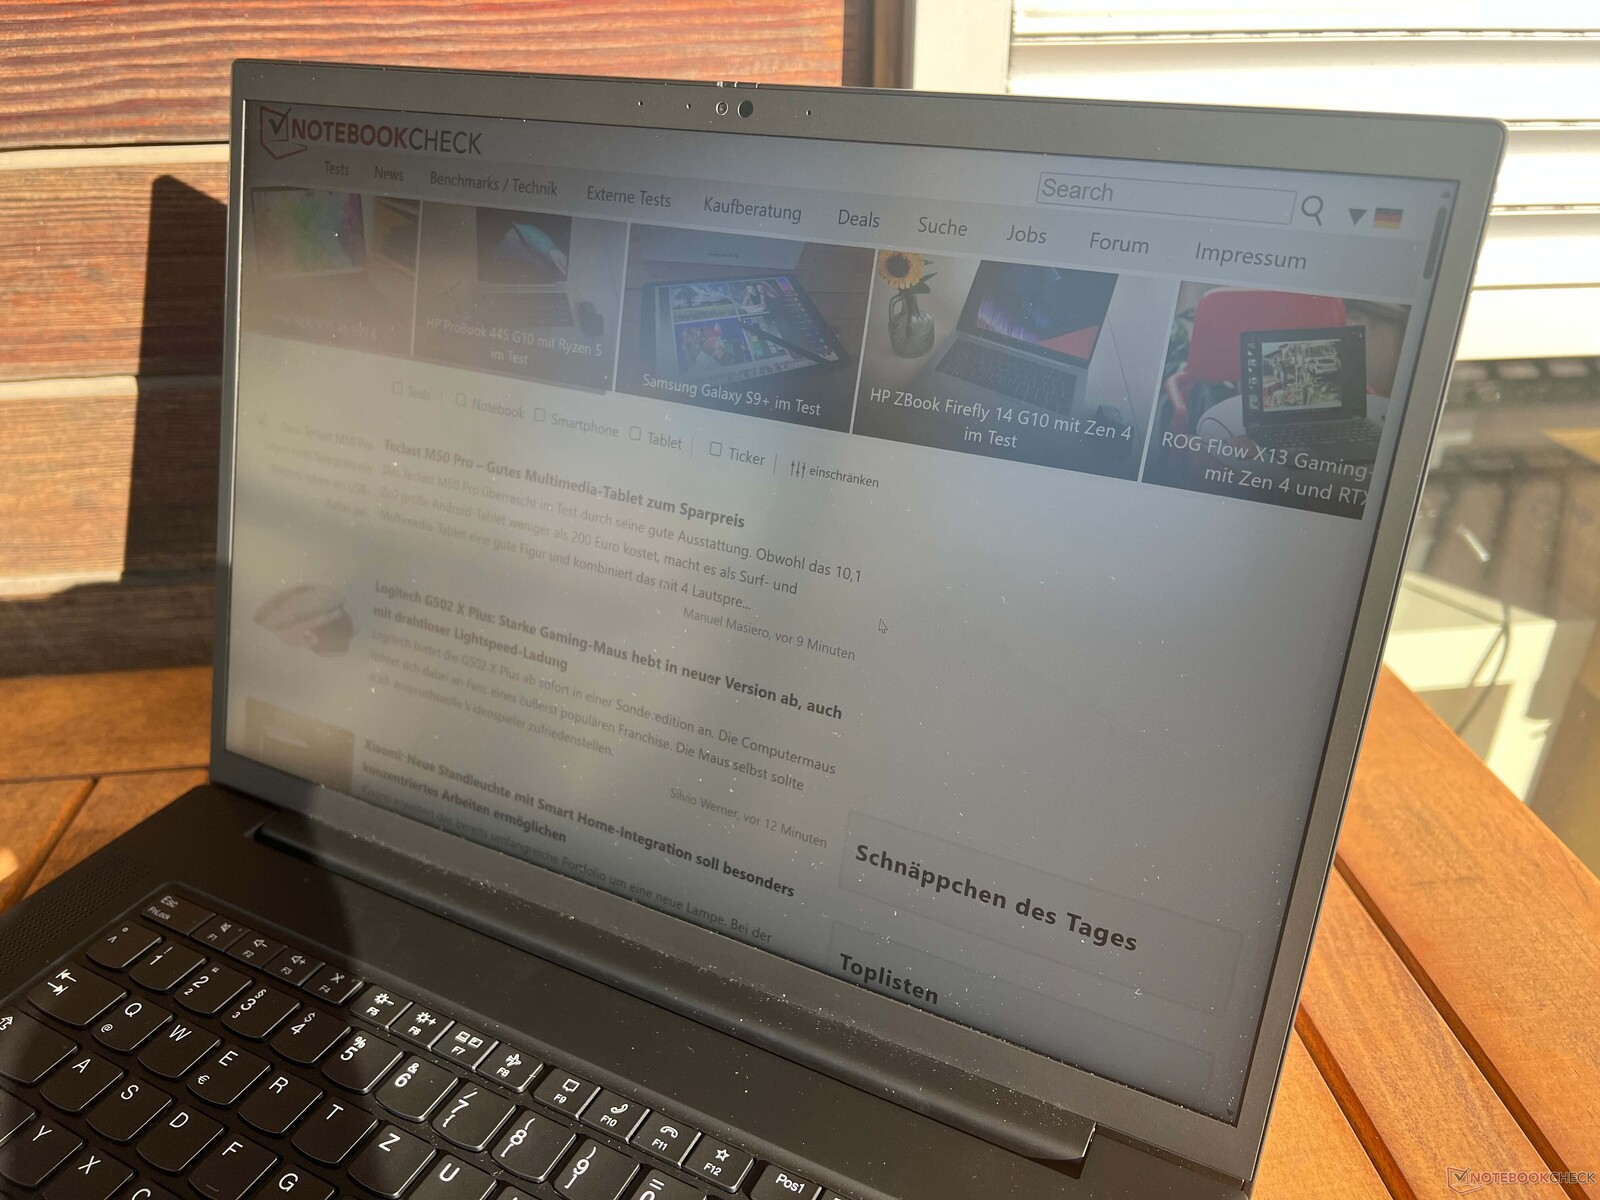
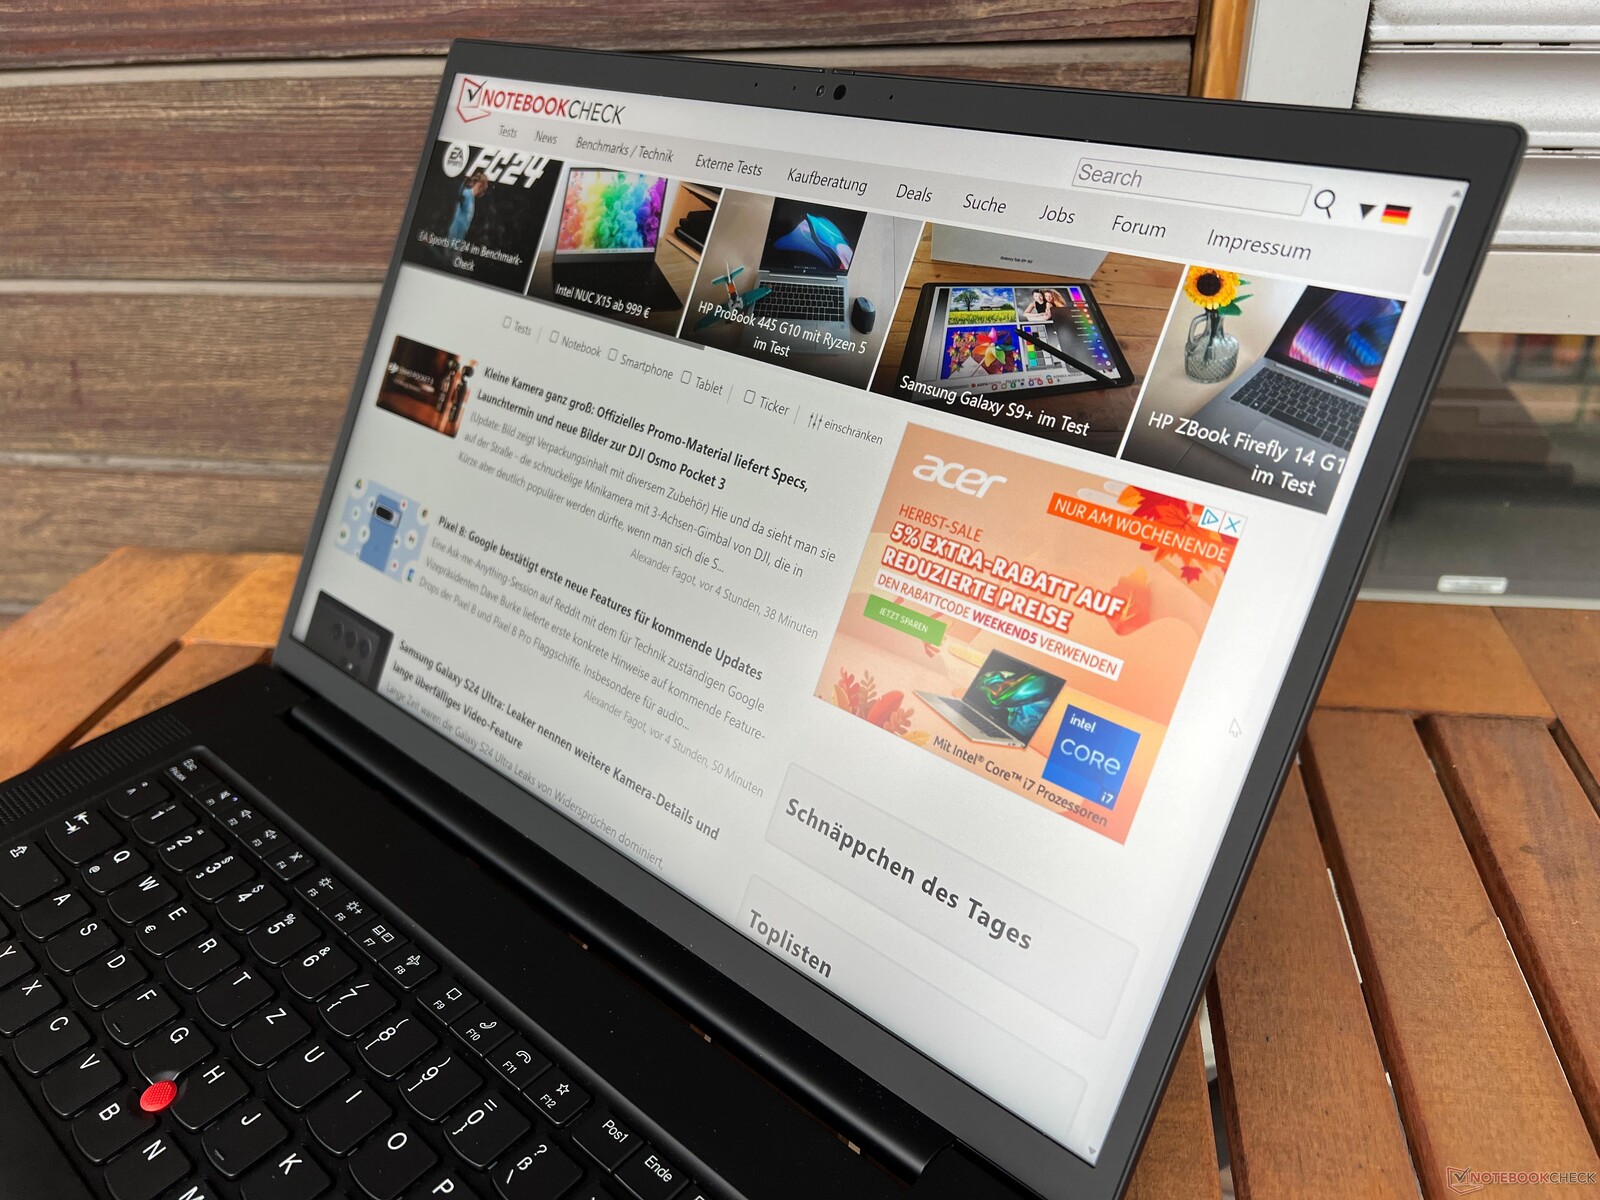
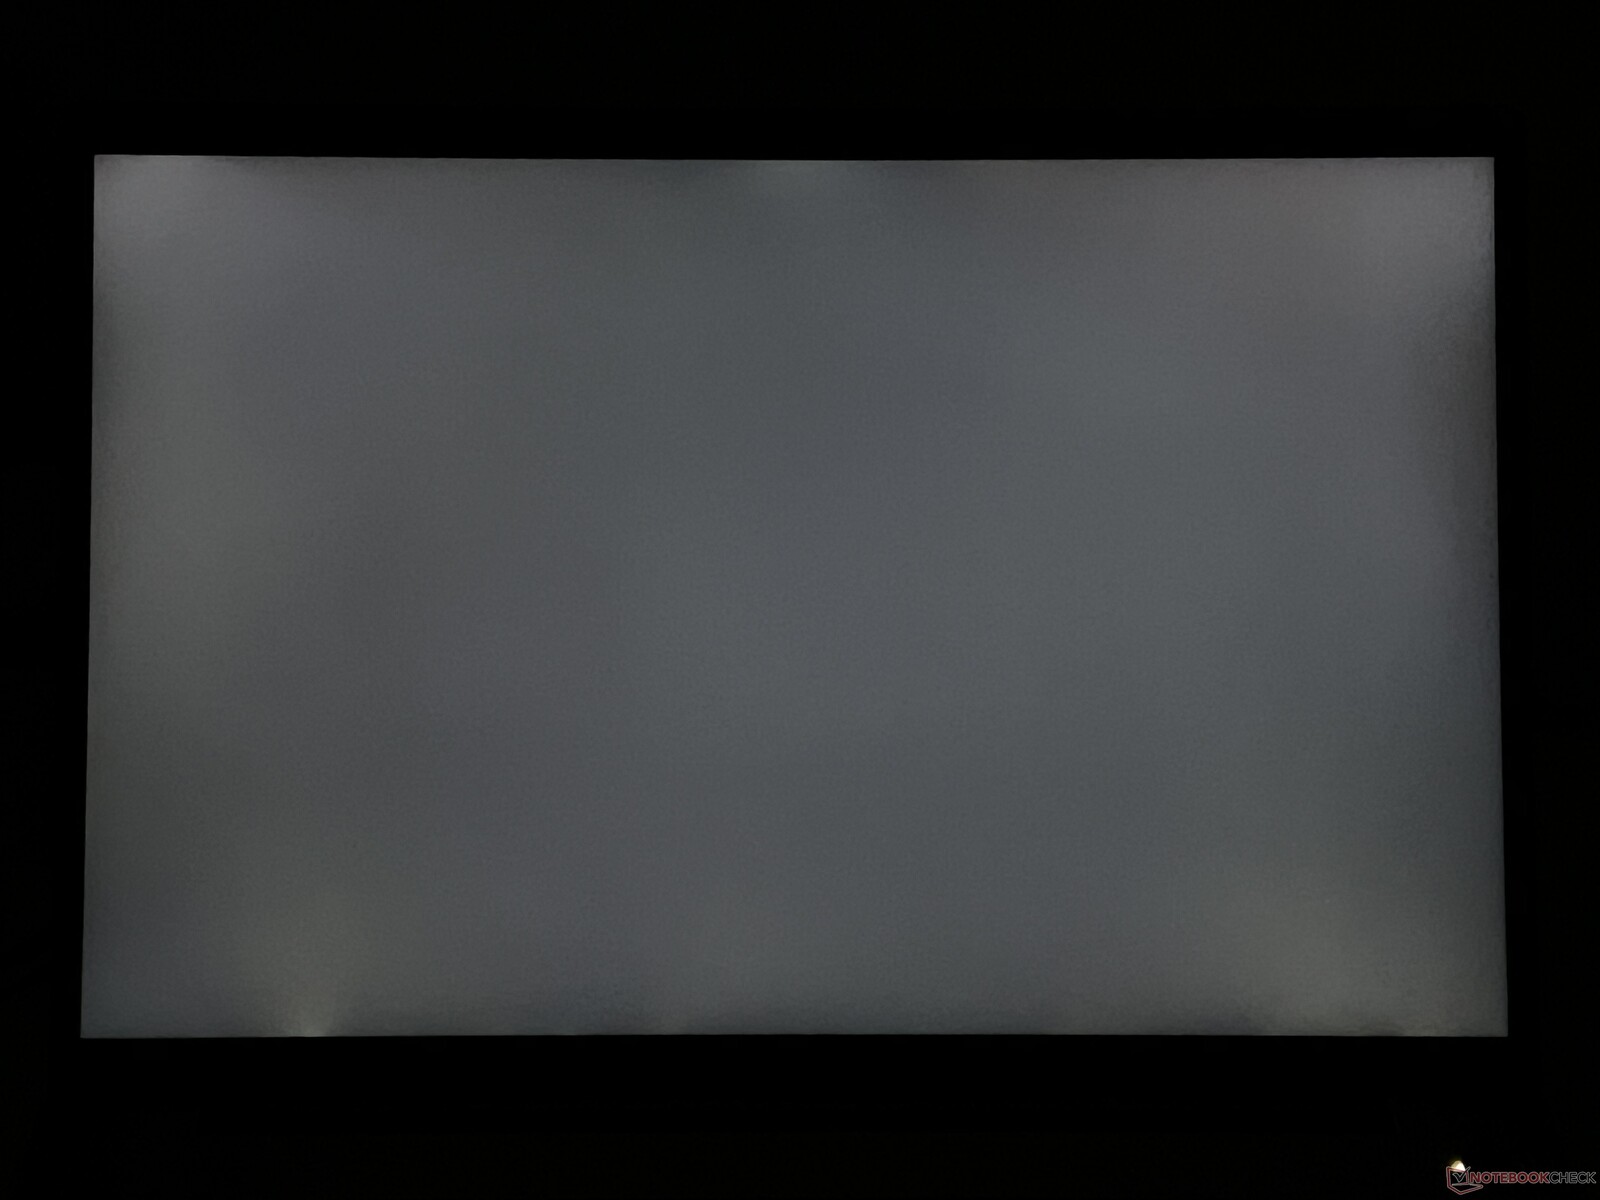
Mat ekran, doğrudan güneş ışığı altında zorlaşsa da açık havada kullanılabilir. IPS panel mükemmel görüş açısı kararlılığı sunar.

Performans - Raptor Gölü ve Ada Lovelace
Test Koşulları
Lenovo, ThinkPad modellerinde uzunca bir süredir ayrı güç profilleri kullanmıyor. Akıllı Soğutma ayarları standart Windows güç profilleriyle doğrudan bağlantılıdır. Aşağıdaki kıyaslamalar ve ölçümler için varsayılan ayar olarak En İyi Performans profilini kullandık.
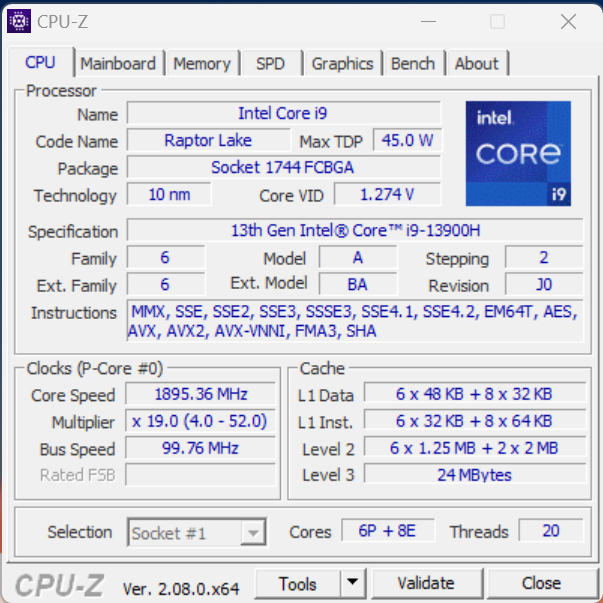
İşlemci - Core i7-13900H
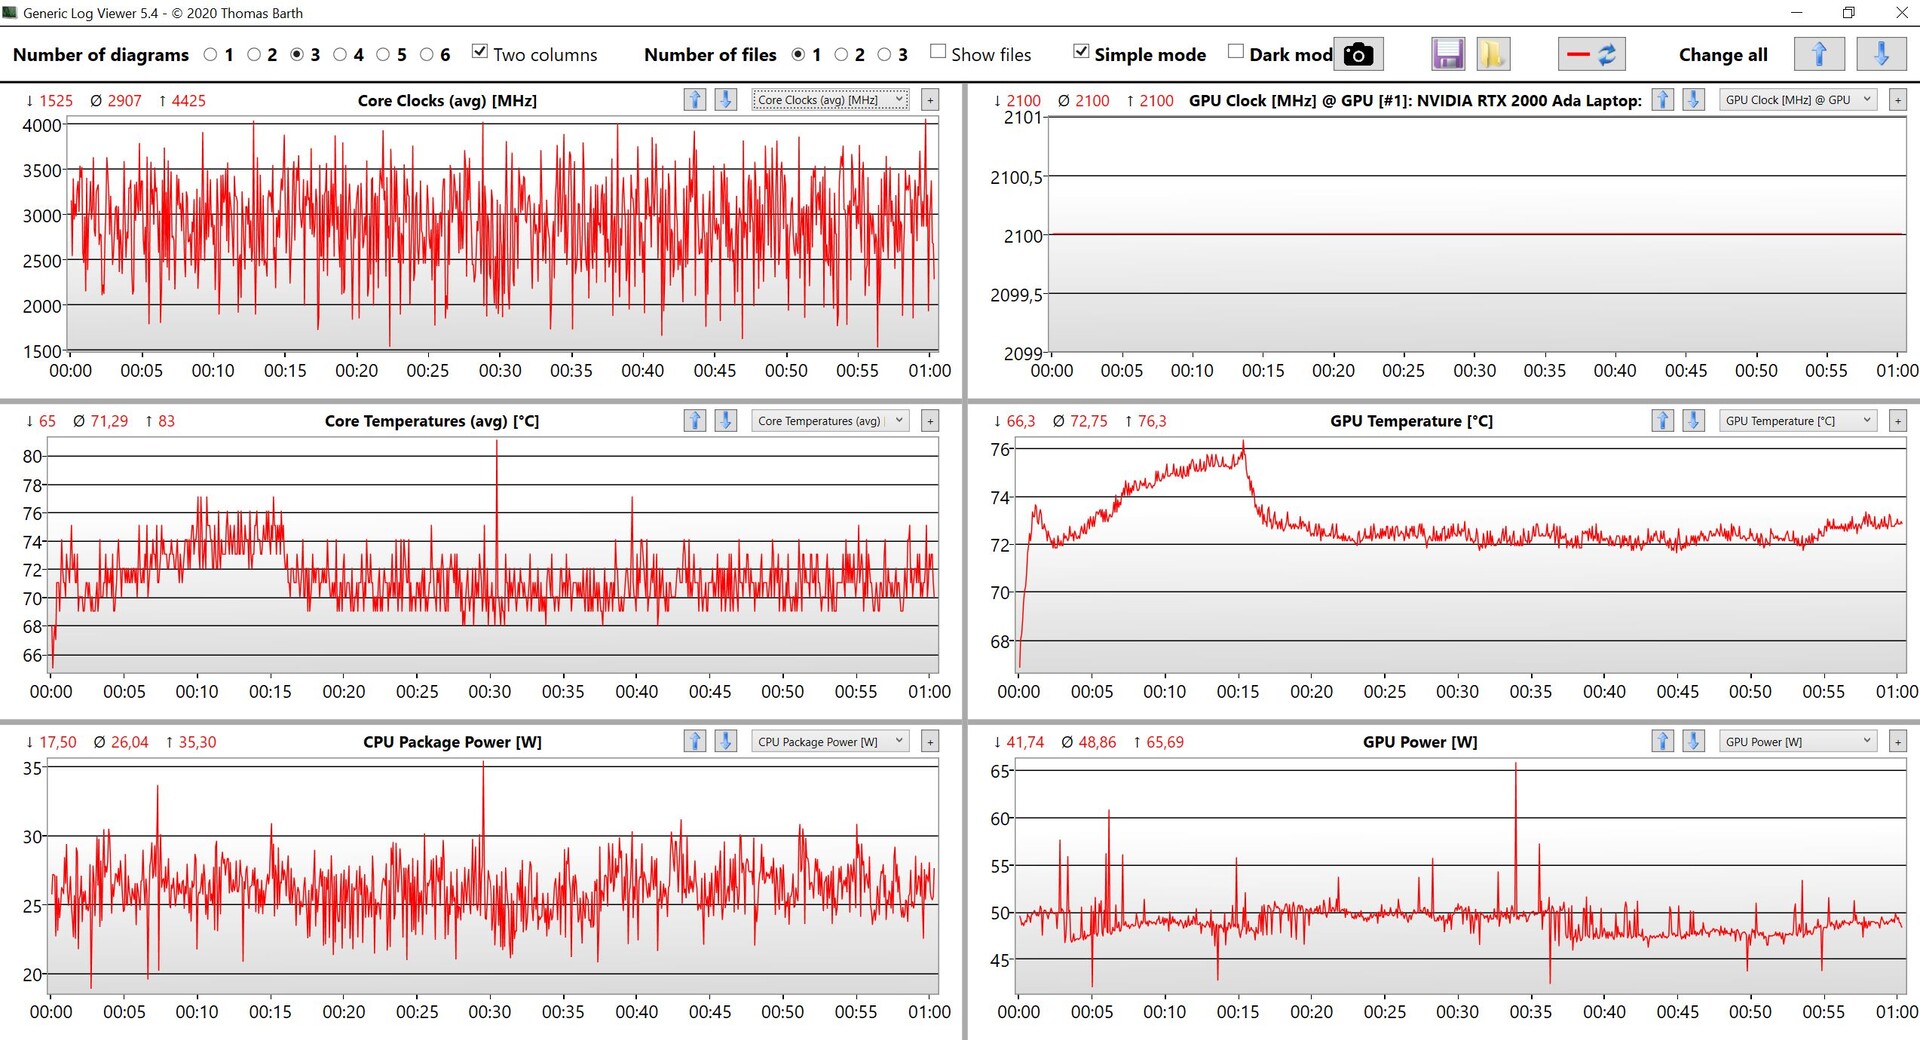
Bu Intel Core i9-13900H raptor-Lake neslinden 6 yüksek performanslı ve 8 verimli çekirdeğe sahiptir ve 20 iş parçacığına kadar işleyebilir. Raptor-Lake neslinden önemli ölçüde daha yüksek maksimum saat hızlarına sahiptir Core i7-13700H ve vPro özelliklerini desteklemektedir. Cinebench döngü testimizde küçük değişiklikler olmasına rağmen, ThinkPad P1 Gen 6'mızdaki CPU geçici olarak 96 watt'a kadar ve sürekli olarak yaklaşık 84 watt tüketebilir. Genel olarak, tek çekirdekli skorlar iyi, ancak çok çekirdekli performans daha fazla potansiyele sahip. Buhar odasına sahip CPU'ların daha iyi performans sağlaması düşünülebilir. Pille çalışırken, CPU 57 watt maksimum güç kullanımıyla sınırlıdır ve bu da çok çekirdekli performansın yaklaşık %25 daha düşük olmasına neden olur. Daha fazla CPU karşılaştırmasıtekni̇k bölüm.
Cinebench R15 Multi Loop
Cinebench R23: Multi Core | Single Core
Cinebench R20: CPU (Multi Core) | CPU (Single Core)
Cinebench R15: CPU Multi 64Bit | CPU Single 64Bit
Blender: v2.79 BMW27 CPU
7-Zip 18.03: 7z b 4 | 7z b 4 -mmt1
Geekbench 5.5: Multi-Core | Single-Core
HWBOT x265 Benchmark v2.2: 4k Preset
LibreOffice : 20 Documents To PDF
R Benchmark 2.5: Overall mean
| CPU Performance rating | |
| Sınıf ortalaması Workstation | |
| Dell Precision 5000 5680 | |
| Lenovo ThinkPad P1 G6-21FV000DGE | |
| HP ZBook Studio 16 G9 62U04EA | |
| Lenovo ThinkPad X1 Extreme G5-21DE003RGE | |
| Ortalama Intel Core i9-13900H | |
| MSI CreatorPro Z16P B12UKST | |
| Schenker VISION 16 Pro (M23) | |
| Samsung Galaxy Book3 Ultra 16, i9-13900H RTX 4070 | |
| Cinebench R23 / Multi Core | |
| Sınıf ortalaması Workstation (14055 - 38520, n=25, son 2 yıl) | |
| Dell Precision 5000 5680 | |
| Lenovo ThinkPad P1 G6-21FV000DGE | |
| Lenovo ThinkPad X1 Extreme G5-21DE003RGE | |
| MSI CreatorPro Z16P B12UKST | |
| Ortalama Intel Core i9-13900H (11997 - 20385, n=28) | |
| HP ZBook Studio 16 G9 62U04EA | |
| Schenker VISION 16 Pro (M23) | |
| Samsung Galaxy Book3 Ultra 16, i9-13900H RTX 4070 | |
| Cinebench R23 / Single Core | |
| Lenovo ThinkPad P1 G6-21FV000DGE | |
| Dell Precision 5000 5680 | |
| Sınıf ortalaması Workstation (1712 - 2228, n=25, son 2 yıl) | |
| Ortalama Intel Core i9-13900H (1297 - 2054, n=26) | |
| Schenker VISION 16 Pro (M23) | |
| HP ZBook Studio 16 G9 62U04EA | |
| Lenovo ThinkPad X1 Extreme G5-21DE003RGE | |
| MSI CreatorPro Z16P B12UKST | |
| Samsung Galaxy Book3 Ultra 16, i9-13900H RTX 4070 | |
| Cinebench R20 / CPU (Multi Core) | |
| Sınıf ortalaması Workstation (5471 - 15043, n=25, son 2 yıl) | |
| Dell Precision 5000 5680 | |
| Lenovo ThinkPad P1 G6-21FV000DGE | |
| Lenovo ThinkPad X1 Extreme G5-21DE003RGE | |
| MSI CreatorPro Z16P B12UKST | |
| Ortalama Intel Core i9-13900H (4935 - 7716, n=25) | |
| HP ZBook Studio 16 G9 62U04EA | |
| Schenker VISION 16 Pro (M23) | |
| Samsung Galaxy Book3 Ultra 16, i9-13900H RTX 4070 | |
| Cinebench R20 / CPU (Single Core) | |
| Lenovo ThinkPad P1 G6-21FV000DGE | |
| Dell Precision 5000 5680 | |
| Sınıf ortalaması Workstation (671 - 857, n=25, son 2 yıl) | |
| Schenker VISION 16 Pro (M23) | |
| Ortalama Intel Core i9-13900H (428 - 792, n=25) | |
| HP ZBook Studio 16 G9 62U04EA | |
| Lenovo ThinkPad X1 Extreme G5-21DE003RGE | |
| MSI CreatorPro Z16P B12UKST | |
| Samsung Galaxy Book3 Ultra 16, i9-13900H RTX 4070 | |
| Cinebench R15 / CPU Multi 64Bit | |
| Sınıf ortalaması Workstation (2489 - 5810, n=25, son 2 yıl) | |
| Lenovo ThinkPad X1 Extreme G5-21DE003RGE | |
| Ortalama Intel Core i9-13900H (2061 - 3100, n=26) | |
| Lenovo ThinkPad P1 G6-21FV000DGE | |
| HP ZBook Studio 16 G9 62U04EA | |
| Dell Precision 5000 5680 | |
| Schenker VISION 16 Pro (M23) | |
| MSI CreatorPro Z16P B12UKST | |
| Samsung Galaxy Book3 Ultra 16, i9-13900H RTX 4070 | |
| Cinebench R15 / CPU Single 64Bit | |
| Sınıf ortalaması Workstation (191.4 - 328, n=25, son 2 yıl) | |
| Dell Precision 5000 5680 | |
| Lenovo ThinkPad P1 G6-21FV000DGE | |
| Schenker VISION 16 Pro (M23) | |
| HP ZBook Studio 16 G9 62U04EA | |
| Ortalama Intel Core i9-13900H (211 - 297, n=26) | |
| Lenovo ThinkPad X1 Extreme G5-21DE003RGE | |
| MSI CreatorPro Z16P B12UKST | |
| Samsung Galaxy Book3 Ultra 16, i9-13900H RTX 4070 | |
| Blender / v2.79 BMW27 CPU | |
| Samsung Galaxy Book3 Ultra 16, i9-13900H RTX 4070 | |
| Schenker VISION 16 Pro (M23) | |
| Ortalama Intel Core i9-13900H (166 - 268, n=24) | |
| MSI CreatorPro Z16P B12UKST | |
| Dell Precision 5000 5680 | |
| Lenovo ThinkPad P1 G6-21FV000DGE | |
| HP ZBook Studio 16 G9 62U04EA | |
| Lenovo ThinkPad X1 Extreme G5-21DE003RGE | |
| Sınıf ortalaması Workstation (91 - 261, n=25, son 2 yıl) | |
| 7-Zip 18.03 / 7z b 4 | |
| Sınıf ortalaması Workstation (54741 - 116969, n=25, son 2 yıl) | |
| Lenovo ThinkPad P1 G6-21FV000DGE | |
| Dell Precision 5000 5680 | |
| HP ZBook Studio 16 G9 62U04EA | |
| MSI CreatorPro Z16P B12UKST | |
| Ortalama Intel Core i9-13900H (45045 - 79032, n=25) | |
| Lenovo ThinkPad X1 Extreme G5-21DE003RGE | |
| Schenker VISION 16 Pro (M23) | |
| Samsung Galaxy Book3 Ultra 16, i9-13900H RTX 4070 | |
| 7-Zip 18.03 / 7z b 4 -mmt1 | |
| Lenovo ThinkPad P1 G6-21FV000DGE | |
| Schenker VISION 16 Pro (M23) | |
| Dell Precision 5000 5680 | |
| Sınıf ortalaması Workstation (5126 - 6960, n=25, son 2 yıl) | |
| Ortalama Intel Core i9-13900H (3665 - 6600, n=25) | |
| HP ZBook Studio 16 G9 62U04EA | |
| Lenovo ThinkPad X1 Extreme G5-21DE003RGE | |
| MSI CreatorPro Z16P B12UKST | |
| Samsung Galaxy Book3 Ultra 16, i9-13900H RTX 4070 | |
| Geekbench 5.5 / Multi-Core | |
| Sınıf ortalaması Workstation (11542 - 25554, n=25, son 2 yıl) | |
| Dell Precision 5000 5680 | |
| HP ZBook Studio 16 G9 62U04EA | |
| Ortalama Intel Core i9-13900H (9094 - 15410, n=26) | |
| MSI CreatorPro Z16P B12UKST | |
| Schenker VISION 16 Pro (M23) | |
| Lenovo ThinkPad X1 Extreme G5-21DE003RGE | |
| Lenovo ThinkPad P1 G6-21FV000DGE | |
| Samsung Galaxy Book3 Ultra 16, i9-13900H RTX 4070 | |
| Geekbench 5.5 / Single-Core | |
| Dell Precision 5000 5680 | |
| Sınıf ortalaması Workstation (1781 - 2183, n=25, son 2 yıl) | |
| Lenovo ThinkPad P1 G6-21FV000DGE | |
| Ortalama Intel Core i9-13900H (1140 - 2043, n=26) | |
| Schenker VISION 16 Pro (M23) | |
| HP ZBook Studio 16 G9 62U04EA | |
| Lenovo ThinkPad X1 Extreme G5-21DE003RGE | |
| MSI CreatorPro Z16P B12UKST | |
| Samsung Galaxy Book3 Ultra 16, i9-13900H RTX 4070 | |
| HWBOT x265 Benchmark v2.2 / 4k Preset | |
| Sınıf ortalaması Workstation (14.4 - 40.5, n=25, son 2 yıl) | |
| Dell Precision 5000 5680 | |
| HP ZBook Studio 16 G9 62U04EA | |
| MSI CreatorPro Z16P B12UKST | |
| Lenovo ThinkPad P1 G6-21FV000DGE | |
| Ortalama Intel Core i9-13900H (14.1 - 22.3, n=25) | |
| Lenovo ThinkPad X1 Extreme G5-21DE003RGE | |
| Schenker VISION 16 Pro (M23) | |
| Samsung Galaxy Book3 Ultra 16, i9-13900H RTX 4070 | |
| LibreOffice / 20 Documents To PDF | |
| Samsung Galaxy Book3 Ultra 16, i9-13900H RTX 4070 | |
| Sınıf ortalaması Workstation (37.1 - 74.7, n=25, son 2 yıl) | |
| Schenker VISION 16 Pro (M23) | |
| Ortalama Intel Core i9-13900H (34.4 - 82.8, n=25) | |
| Lenovo ThinkPad P1 G6-21FV000DGE | |
| HP ZBook Studio 16 G9 62U04EA | |
| Lenovo ThinkPad X1 Extreme G5-21DE003RGE | |
| Dell Precision 5000 5680 | |
| MSI CreatorPro Z16P B12UKST | |
| R Benchmark 2.5 / Overall mean | |
| Samsung Galaxy Book3 Ultra 16, i9-13900H RTX 4070 | |
| Lenovo ThinkPad X1 Extreme G5-21DE003RGE | |
| MSI CreatorPro Z16P B12UKST | |
| Ortalama Intel Core i9-13900H (0.4052 - 0.723, n=25) | |
| HP ZBook Studio 16 G9 62U04EA | |
| Sınıf ortalaması Workstation (0.3825 - 0.603, n=25, son 2 yıl) | |
| Schenker VISION 16 Pro (M23) | |
| Lenovo ThinkPad P1 G6-21FV000DGE | |
| Dell Precision 5000 5680 | |
* ... daha küçük daha iyidir
AIDA64: FP32 Ray-Trace | FPU Julia | CPU SHA3 | CPU Queen | FPU SinJulia | FPU Mandel | CPU AES | CPU ZLib | FP64 Ray-Trace | CPU PhotoWorxx
| Performance rating | |
| Sınıf ortalaması Workstation | |
| MSI CreatorPro Z16P B12UKST | |
| Dell Precision 5000 5680 | |
| Lenovo ThinkPad P1 G6-21FV000DGE | |
| Ortalama Intel Core i9-13900H | |
| HP ZBook Studio 16 G9 62U04EA | |
| Lenovo ThinkPad X1 Extreme G5-21DE003RGE | |
| Schenker VISION 16 Pro (M23) | |
| Samsung Galaxy Book3 Ultra 16, i9-13900H RTX 4070 | |
| AIDA64 / FP32 Ray-Trace | |
| Sınıf ortalaması Workstation (10658 - 61611, n=25, son 2 yıl) | |
| Lenovo ThinkPad P1 G6-21FV000DGE | |
| Lenovo ThinkPad X1 Extreme G5-21DE003RGE | |
| Dell Precision 5000 5680 | |
| HP ZBook Studio 16 G9 62U04EA | |
| Ortalama Intel Core i9-13900H (6788 - 19557, n=25) | |
| Samsung Galaxy Book3 Ultra 16, i9-13900H RTX 4070 | |
| MSI CreatorPro Z16P B12UKST | |
| Schenker VISION 16 Pro (M23) | |
| AIDA64 / FPU Julia | |
| Sınıf ortalaması Workstation (56664 - 186971, n=25, son 2 yıl) | |
| Lenovo ThinkPad P1 G6-21FV000DGE | |
| Lenovo ThinkPad X1 Extreme G5-21DE003RGE | |
| HP ZBook Studio 16 G9 62U04EA | |
| Dell Precision 5000 5680 | |
| Ortalama Intel Core i9-13900H (22551 - 95579, n=25) | |
| MSI CreatorPro Z16P B12UKST | |
| Schenker VISION 16 Pro (M23) | |
| Samsung Galaxy Book3 Ultra 16, i9-13900H RTX 4070 | |
| AIDA64 / CPU SHA3 | |
| Sınıf ortalaması Workstation (2608 - 8975, n=25, son 2 yıl) | |
| Lenovo ThinkPad X1 Extreme G5-21DE003RGE | |
| Lenovo ThinkPad P1 G6-21FV000DGE | |
| HP ZBook Studio 16 G9 62U04EA | |
| MSI CreatorPro Z16P B12UKST | |
| Ortalama Intel Core i9-13900H (2491 - 4270, n=25) | |
| Dell Precision 5000 5680 | |
| Samsung Galaxy Book3 Ultra 16, i9-13900H RTX 4070 | |
| Schenker VISION 16 Pro (M23) | |
| AIDA64 / CPU Queen | |
| Dell Precision 5000 5680 | |
| Lenovo ThinkPad P1 G6-21FV000DGE | |
| HP ZBook Studio 16 G9 62U04EA | |
| Sınıf ortalaması Workstation (60778 - 144411, n=25, son 2 yıl) | |
| Ortalama Intel Core i9-13900H (65121 - 120936, n=25) | |
| Lenovo ThinkPad X1 Extreme G5-21DE003RGE | |
| MSI CreatorPro Z16P B12UKST | |
| Schenker VISION 16 Pro (M23) | |
| Samsung Galaxy Book3 Ultra 16, i9-13900H RTX 4070 | |
| AIDA64 / FPU SinJulia | |
| Sınıf ortalaması Workstation (8165 - 29343, n=25, son 2 yıl) | |
| Lenovo ThinkPad P1 G6-21FV000DGE | |
| Dell Precision 5000 5680 | |
| Lenovo ThinkPad X1 Extreme G5-21DE003RGE | |
| Ortalama Intel Core i9-13900H (6108 - 11631, n=25) | |
| HP ZBook Studio 16 G9 62U04EA | |
| MSI CreatorPro Z16P B12UKST | |
| Schenker VISION 16 Pro (M23) | |
| Samsung Galaxy Book3 Ultra 16, i9-13900H RTX 4070 | |
| AIDA64 / FPU Mandel | |
| Sınıf ortalaması Workstation (27301 - 98153, n=25, son 2 yıl) | |
| Lenovo ThinkPad P1 G6-21FV000DGE | |
| Lenovo ThinkPad X1 Extreme G5-21DE003RGE | |
| Dell Precision 5000 5680 | |
| HP ZBook Studio 16 G9 62U04EA | |
| Ortalama Intel Core i9-13900H (11283 - 48474, n=25) | |
| Samsung Galaxy Book3 Ultra 16, i9-13900H RTX 4070 | |
| MSI CreatorPro Z16P B12UKST | |
| Schenker VISION 16 Pro (M23) | |
| AIDA64 / CPU AES | |
| MSI CreatorPro Z16P B12UKST | |
| Sınıf ortalaması Workstation (56077 - 187841, n=25, son 2 yıl) | |
| Ortalama Intel Core i9-13900H (3691 - 149377, n=25) | |
| Lenovo ThinkPad X1 Extreme G5-21DE003RGE | |
| Lenovo ThinkPad P1 G6-21FV000DGE | |
| HP ZBook Studio 16 G9 62U04EA | |
| Dell Precision 5000 5680 | |
| Schenker VISION 16 Pro (M23) | |
| Samsung Galaxy Book3 Ultra 16, i9-13900H RTX 4070 | |
| AIDA64 / CPU ZLib | |
| Sınıf ortalaması Workstation (742 - 2148, n=25, son 2 yıl) | |
| Lenovo ThinkPad P1 G6-21FV000DGE | |
| Lenovo ThinkPad X1 Extreme G5-21DE003RGE | |
| HP ZBook Studio 16 G9 62U04EA | |
| Ortalama Intel Core i9-13900H (789 - 1254, n=25) | |
| MSI CreatorPro Z16P B12UKST | |
| Dell Precision 5000 5680 | |
| Samsung Galaxy Book3 Ultra 16, i9-13900H RTX 4070 | |
| Schenker VISION 16 Pro (M23) | |
| AIDA64 / FP64 Ray-Trace | |
| Sınıf ortalaması Workstation (5580 - 32891, n=25, son 2 yıl) | |
| Lenovo ThinkPad P1 G6-21FV000DGE | |
| Lenovo ThinkPad X1 Extreme G5-21DE003RGE | |
| HP ZBook Studio 16 G9 62U04EA | |
| Dell Precision 5000 5680 | |
| Ortalama Intel Core i9-13900H (3655 - 10716, n=25) | |
| MSI CreatorPro Z16P B12UKST | |
| Schenker VISION 16 Pro (M23) | |
| Samsung Galaxy Book3 Ultra 16, i9-13900H RTX 4070 | |
| AIDA64 / CPU PhotoWorxx | |
| Sınıf ortalaması Workstation (37151 - 93684, n=25, son 2 yıl) | |
| Samsung Galaxy Book3 Ultra 16, i9-13900H RTX 4070 | |
| Dell Precision 5000 5680 | |
| Schenker VISION 16 Pro (M23) | |
| MSI CreatorPro Z16P B12UKST | |
| Ortalama Intel Core i9-13900H (10871 - 50488, n=25) | |
| HP ZBook Studio 16 G9 62U04EA | |
| Lenovo ThinkPad P1 G6-21FV000DGE | |
| Lenovo ThinkPad X1 Extreme G5-21DE003RGE | |
Sistem Performansı
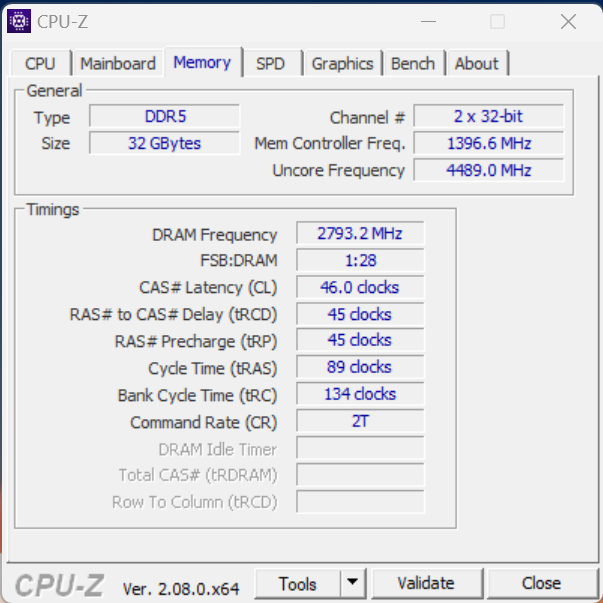
ThinkPad P1 Gen 6'nın sistem performansı olağanüstüdür ve bu durum hem sentetik kıyaslamalar hem de öznel performans değerlendirmemiz tarafından desteklenmektedir. Beklendiği gibi, RAM kıyaslamaları, çift kanallı RAM'e sahip modellere kıyasla belleğin tek kanallı yapılandırması nedeniyle biraz daha düşüktür. Test boyunca donma veya takılma ile ilgili herhangi bir sorun yaşanmadı.
CrossMark: Overall | Productivity | Creativity | Responsiveness
| PCMark 10 / Score | |
| Dell Precision 5000 5680 | |
| Sınıf ortalaması Workstation (6436 - 10409, n=21, son 2 yıl) | |
| Lenovo ThinkPad P1 G6-21FV000DGE | |
| Ortalama Intel Core i9-13900H, NVIDIA RTX 2000 Ada Generation Laptop (n=1) | |
| Schenker VISION 16 Pro (M23) | |
| Lenovo ThinkPad X1 Extreme G5-21DE003RGE | |
| MSI CreatorPro Z16P B12UKST | |
| HP ZBook Studio 16 G9 62U04EA | |
| Samsung Galaxy Book3 Ultra 16, i9-13900H RTX 4070 | |
| PCMark 10 / Essentials | |
| Dell Precision 5000 5680 | |
| Lenovo ThinkPad P1 G6-21FV000DGE | |
| Ortalama Intel Core i9-13900H, NVIDIA RTX 2000 Ada Generation Laptop (n=1) | |
| Schenker VISION 16 Pro (M23) | |
| MSI CreatorPro Z16P B12UKST | |
| Lenovo ThinkPad X1 Extreme G5-21DE003RGE | |
| Sınıf ortalaması Workstation (9622 - 11157, n=21, son 2 yıl) | |
| HP ZBook Studio 16 G9 62U04EA | |
| Samsung Galaxy Book3 Ultra 16, i9-13900H RTX 4070 | |
| PCMark 10 / Productivity | |
| Sınıf ortalaması Workstation (8789 - 20616, n=21, son 2 yıl) | |
| Dell Precision 5000 5680 | |
| Lenovo ThinkPad P1 G6-21FV000DGE | |
| Ortalama Intel Core i9-13900H, NVIDIA RTX 2000 Ada Generation Laptop (n=1) | |
| Schenker VISION 16 Pro (M23) | |
| Lenovo ThinkPad X1 Extreme G5-21DE003RGE | |
| MSI CreatorPro Z16P B12UKST | |
| Samsung Galaxy Book3 Ultra 16, i9-13900H RTX 4070 | |
| HP ZBook Studio 16 G9 62U04EA | |
| PCMark 10 / Digital Content Creation | |
| Dell Precision 5000 5680 | |
| Sınıf ortalaması Workstation (7744 - 15631, n=21, son 2 yıl) | |
| Schenker VISION 16 Pro (M23) | |
| Lenovo ThinkPad P1 G6-21FV000DGE | |
| Ortalama Intel Core i9-13900H, NVIDIA RTX 2000 Ada Generation Laptop (n=1) | |
| Lenovo ThinkPad X1 Extreme G5-21DE003RGE | |
| MSI CreatorPro Z16P B12UKST | |
| HP ZBook Studio 16 G9 62U04EA | |
| Samsung Galaxy Book3 Ultra 16, i9-13900H RTX 4070 | |
| CrossMark / Overall | |
| MSI CreatorPro Z16P B12UKST | |
| Dell Precision 5000 5680 | |
| Sınıf ortalaması Workstation (1307 - 2267, n=24, son 2 yıl) | |
| Schenker VISION 16 Pro (M23) | |
| Lenovo ThinkPad P1 G6-21FV000DGE | |
| Ortalama Intel Core i9-13900H, NVIDIA RTX 2000 Ada Generation Laptop (n=1) | |
| HP ZBook Studio 16 G9 62U04EA | |
| Lenovo ThinkPad X1 Extreme G5-21DE003RGE | |
| Samsung Galaxy Book3 Ultra 16, i9-13900H RTX 4070 | |
| CrossMark / Productivity | |
| MSI CreatorPro Z16P B12UKST | |
| Schenker VISION 16 Pro (M23) | |
| Dell Precision 5000 5680 | |
| Lenovo ThinkPad P1 G6-21FV000DGE | |
| Ortalama Intel Core i9-13900H, NVIDIA RTX 2000 Ada Generation Laptop (n=1) | |
| Sınıf ortalaması Workstation (1130 - 2122, n=24, son 2 yıl) | |
| HP ZBook Studio 16 G9 62U04EA | |
| Lenovo ThinkPad X1 Extreme G5-21DE003RGE | |
| Samsung Galaxy Book3 Ultra 16, i9-13900H RTX 4070 | |
| CrossMark / Creativity | |
| Dell Precision 5000 5680 | |
| Sınıf ortalaması Workstation (1657 - 2725, n=24, son 2 yıl) | |
| HP ZBook Studio 16 G9 62U04EA | |
| MSI CreatorPro Z16P B12UKST | |
| Lenovo ThinkPad P1 G6-21FV000DGE | |
| Ortalama Intel Core i9-13900H, NVIDIA RTX 2000 Ada Generation Laptop (n=1) | |
| Schenker VISION 16 Pro (M23) | |
| Lenovo ThinkPad X1 Extreme G5-21DE003RGE | |
| Samsung Galaxy Book3 Ultra 16, i9-13900H RTX 4070 | |
| CrossMark / Responsiveness | |
| MSI CreatorPro Z16P B12UKST | |
| Schenker VISION 16 Pro (M23) | |
| Lenovo ThinkPad P1 G6-21FV000DGE | |
| Ortalama Intel Core i9-13900H, NVIDIA RTX 2000 Ada Generation Laptop (n=1) | |
| Sınıf ortalaması Workstation (993 - 2096, n=24, son 2 yıl) | |
| Dell Precision 5000 5680 | |
| HP ZBook Studio 16 G9 62U04EA | |
| Lenovo ThinkPad X1 Extreme G5-21DE003RGE | |
| Samsung Galaxy Book3 Ultra 16, i9-13900H RTX 4070 | |
| PCMark 10 Score | 7522 puan | |
Yardım | ||
| AIDA64 / Memory Copy | |
| Sınıf ortalaması Workstation (56003 - 164795, n=25, son 2 yıl) | |
| Dell Precision 5000 5680 | |
| Samsung Galaxy Book3 Ultra 16, i9-13900H RTX 4070 | |
| Schenker VISION 16 Pro (M23) | |
| MSI CreatorPro Z16P B12UKST | |
| HP ZBook Studio 16 G9 62U04EA | |
| Ortalama Intel Core i9-13900H (37448 - 74486, n=25) | |
| Lenovo ThinkPad P1 G6-21FV000DGE | |
| Lenovo ThinkPad X1 Extreme G5-21DE003RGE | |
| AIDA64 / Memory Read | |
| Sınıf ortalaması Workstation (55795 - 121563, n=25, son 2 yıl) | |
| Schenker VISION 16 Pro (M23) | |
| Samsung Galaxy Book3 Ultra 16, i9-13900H RTX 4070 | |
| Dell Precision 5000 5680 | |
| MSI CreatorPro Z16P B12UKST | |
| HP ZBook Studio 16 G9 62U04EA | |
| Ortalama Intel Core i9-13900H (41599 - 75433, n=25) | |
| Lenovo ThinkPad P1 G6-21FV000DGE | |
| Lenovo ThinkPad X1 Extreme G5-21DE003RGE | |
| AIDA64 / Memory Write | |
| Samsung Galaxy Book3 Ultra 16, i9-13900H RTX 4070 | |
| Sınıf ortalaması Workstation (55663 - 214520, n=25, son 2 yıl) | |
| Dell Precision 5000 5680 | |
| Schenker VISION 16 Pro (M23) | |
| MSI CreatorPro Z16P B12UKST | |
| Ortalama Intel Core i9-13900H (36152 - 88505, n=25) | |
| HP ZBook Studio 16 G9 62U04EA | |
| Lenovo ThinkPad P1 G6-21FV000DGE | |
| Lenovo ThinkPad X1 Extreme G5-21DE003RGE | |
| AIDA64 / Memory Latency | |
| Sınıf ortalaması Workstation (84.5 - 165.2, n=25, son 2 yıl) | |
| Samsung Galaxy Book3 Ultra 16, i9-13900H RTX 4070 | |
| MSI CreatorPro Z16P B12UKST | |
| Dell Precision 5000 5680 | |
| HP ZBook Studio 16 G9 62U04EA | |
| Ortalama Intel Core i9-13900H (75.8 - 102.3, n=25) | |
| Lenovo ThinkPad X1 Extreme G5-21DE003RGE | |
| Schenker VISION 16 Pro (M23) | |
| Lenovo ThinkPad P1 G6-21FV000DGE | |
* ... daha küçük daha iyidir
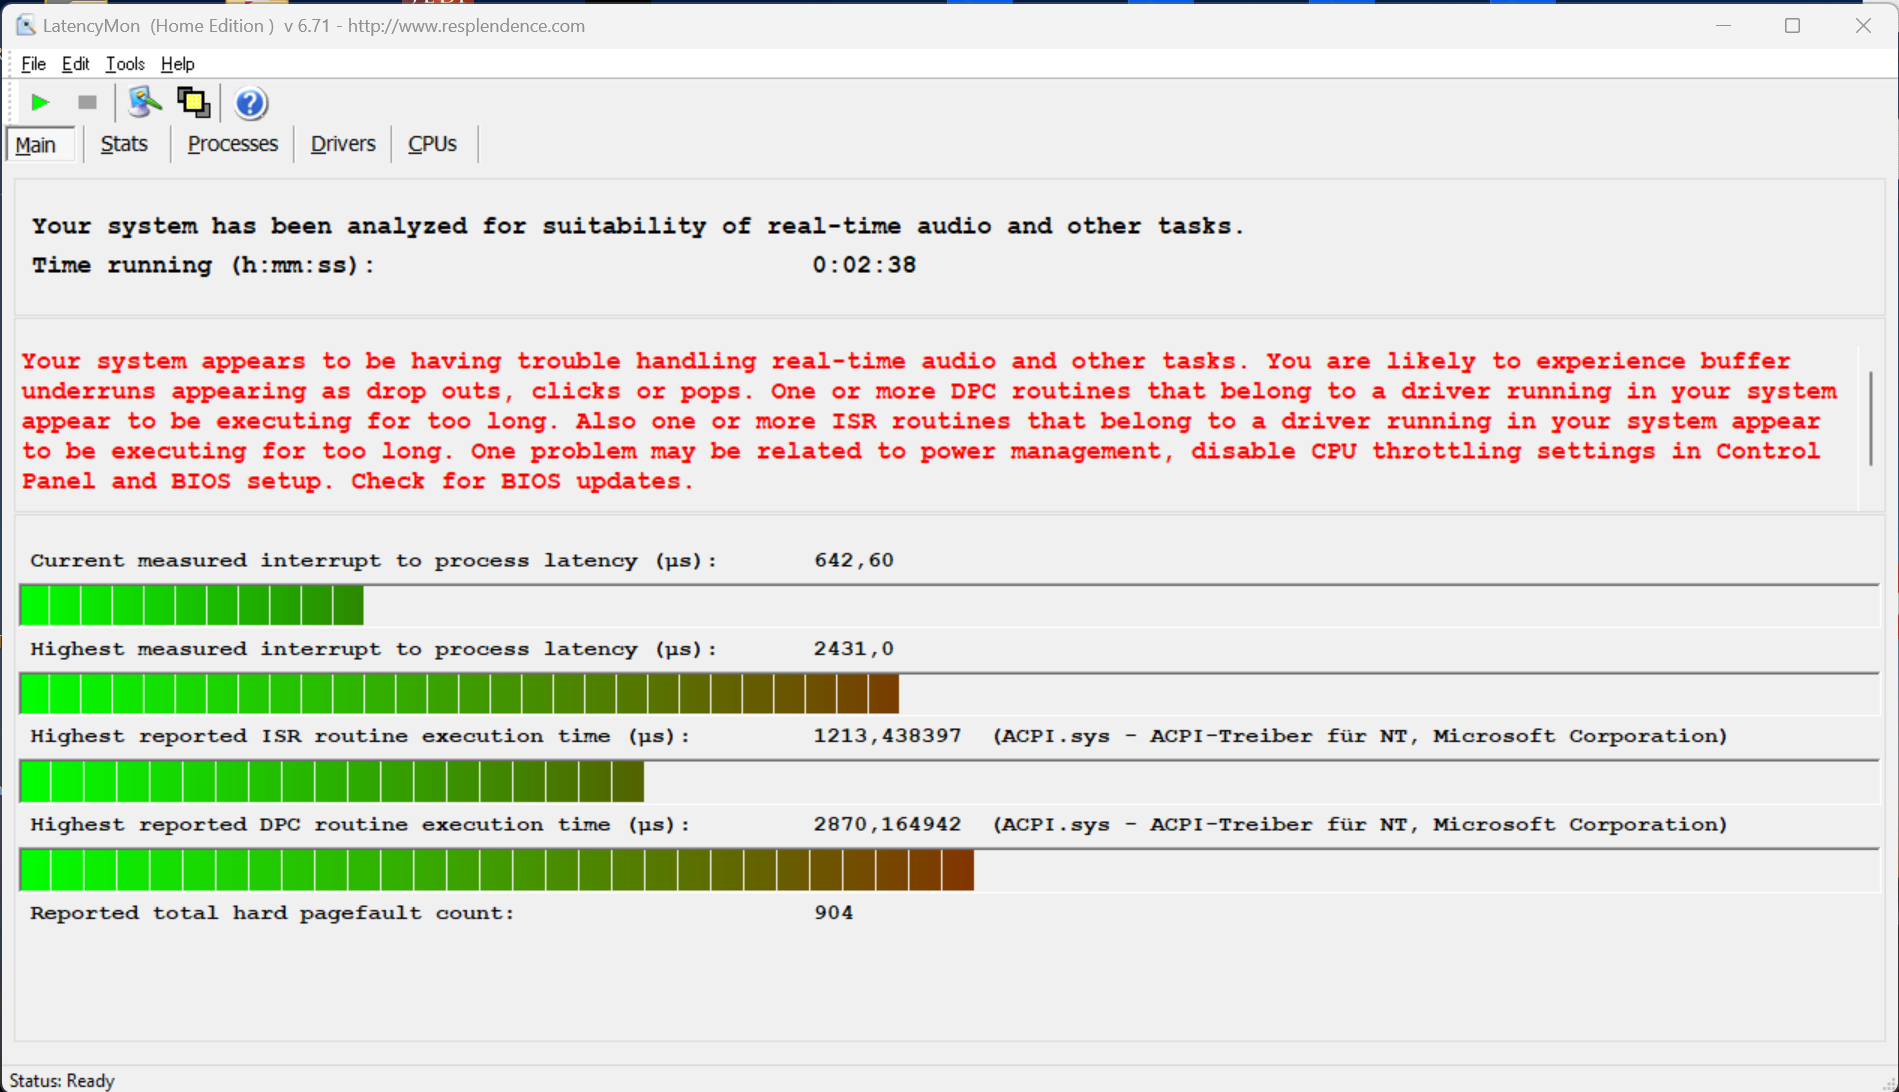
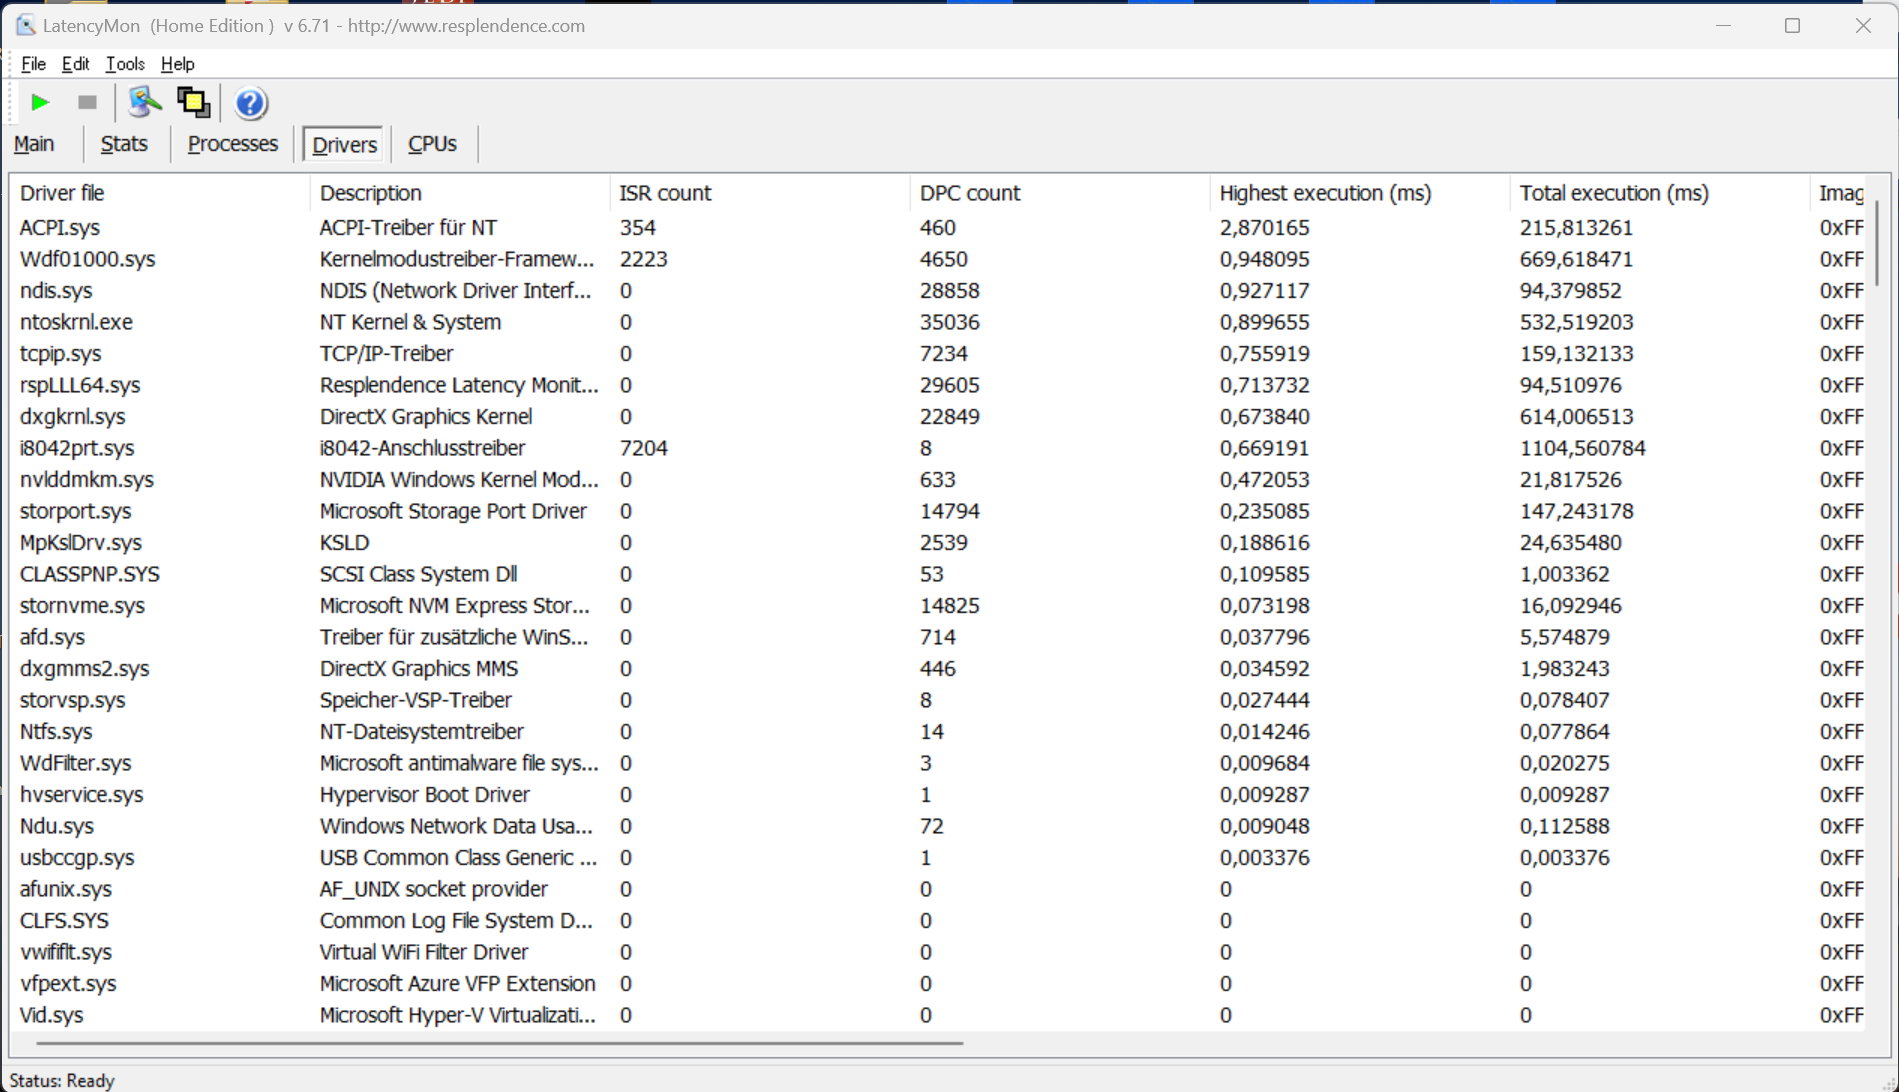
DPC Gecikme Süresi
Test cihazımız, web'de gezinme, 4K YouTube akışı ve CPU yükünü içeren standartlaştırılmış gecikme testimizde mevcut BIOS sürümüyle (1.14) gerçek zamanlı ses uygulamalarında zorluklar gösterdi. Ancak video oynatma sırasında hiçbir kare kaybolmadı.
| DPC Latencies / LatencyMon - interrupt to process latency (max), Web, Youtube, Prime95 | |
| Samsung Galaxy Book3 Ultra 16, i9-13900H RTX 4070 | |
| Lenovo ThinkPad P1 G6-21FV000DGE | |
| Dell Precision 5000 5680 | |
| Lenovo ThinkPad X1 Extreme G5-21DE003RGE | |
| HP ZBook Studio 16 G9 62U04EA | |
| Schenker VISION 16 Pro (M23) | |
| MSI CreatorPro Z16P B12UKST | |
* ... daha küçük daha iyidir
Depolama Cihazları
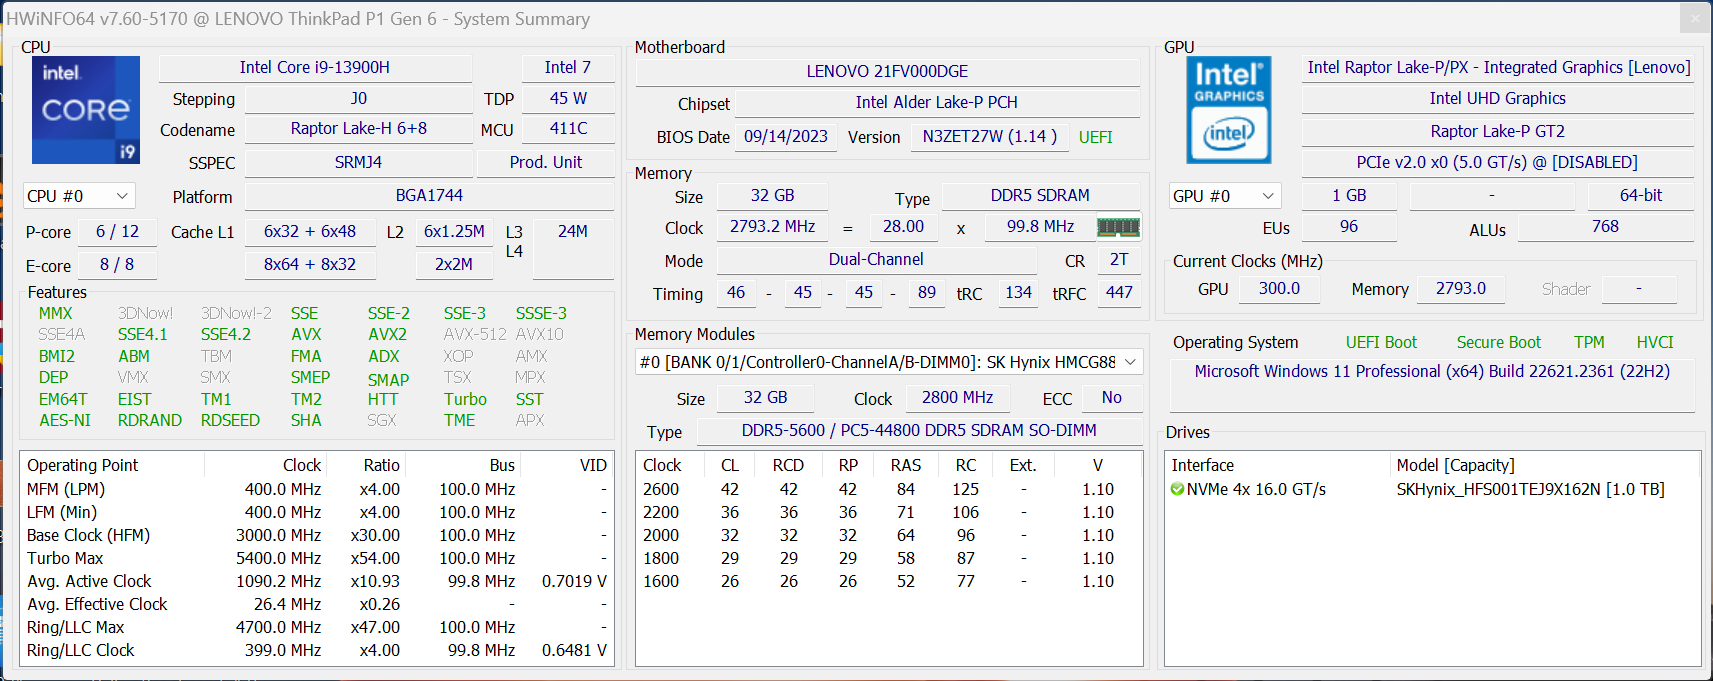
Geleneksel soğutmalı P1 G6 kurulumlarında iki hızlı PCIe 4.0 yuvası mevcuttur. Test cihazımız, ilk yapılandırmadan sonra 897 GB boş RAM sağlayan 1 TB SK Hynix PC711 ile donatılmıştır. PCIe 4.0 SSD, en yüksek performansta 7 GB/s'nin üzerine ulaşan olağanüstü aktarım hızlarına sahiptir. Lenovo ayrıca sürekli kullanımda bile tutarlı performans sağlamak için SSD'ye metal bir plaka ekliyor. Erişilebilir daha fazla SSD karşılaştırması var burada.

| Drive Performance rating - Percent | |
| Schenker VISION 16 Pro (M23) | |
| MSI CreatorPro Z16P B12UKST -8! | |
| Lenovo ThinkPad P1 G6-21FV000DGE | |
| Sınıf ortalaması Workstation | |
| Samsung Galaxy Book3 Ultra 16, i9-13900H RTX 4070 | |
| HP ZBook Studio 16 G9 62U04EA | |
| Dell Precision 5000 5680 | |
| Ortalama SK Hynix PC711 1TB HFS001TDE9X084N | |
| Lenovo ThinkPad X1 Extreme G5-21DE003RGE | |
* ... daha küçük daha iyidir
Continuous power read: DiskSpd Read Loop, Queue Depth 8
Grafik kartı - RTX 2000 Ada
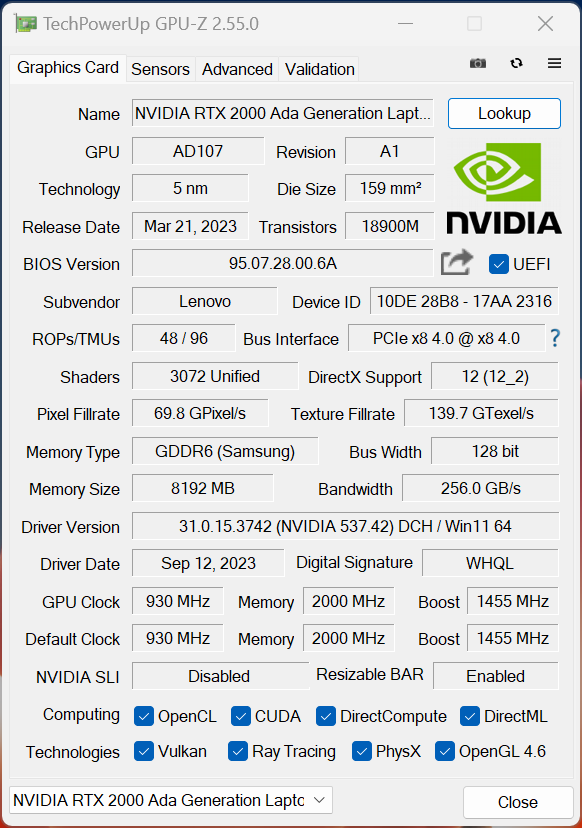
Lenovo şimdi Nvidia'nın en yeni Ada Lovelace GPU'larını içeriyor. GeForce modellerine ek olarak RTX 4060 Dizüstü Bilgisayar, RTX 4080 Dizüstü Bilgisayarve RTX 4090 Dizüstü Bilgisayar (teknik özellik sayfasında belirtildiği gibi her biri 80 watt'lık bir varyanta sahip), ayrıca RTX 1000 Ada (65 watt) gibi yeni profesyonel modeller de sunuyor, RTX 2000 Ada (65 watt), RTX 3500 Ada, RTX 4000 Adave amiral gemisi RTX 5000 Ada (80 watt TGP).
Şaşırtıcı bir şekilde, inceleme örneğimizdeki RTX 2000 Ada, GeForce RTX 4060 dizüstü bilgisayarı temel alıyor ve Lenovo geleneksel soğutmayı tercih etti. Sonuç olarak, "sadece" 65 watt (15 watt Dynamic Boost dahil) ile çalışıyor. 3DMark testlerinde RTX 2000 Ada, GPU'nun 65 watt (15 watt Dynamic Boost dahil) tüketmesine izin verilen Asus'un ROG Flow Z13 modelindeki GeForce RTX 4060 dizüstü bilgisayardan birkaç yüzde puan daha iyi performans gösteriyor. Saf performans açısından GPU, eski RTX A3000'i ve önceki ThinkPad X1 Extreme'deki RTX 3060 dizüstü bilgisayarı geride bırakarak önemli bir ilerlemeyi temsil ediyor. Ayrıca, eski RTX A2000'e göre avantaj neredeyse %70'tir.
Profesyonel kıyaslamalarda, RTX 2000 Ada sürekli olarak eski modelden daha iyi performans gösteriyor
RTX A3000ve genellikle daha kompakt olan RTX 3000 Ada'nın 50 watt'lık versiyonunu geride bırakır Dell Precision 5480.GPU'nun sürekli stres altında bile tutarlı performans göstermesi büyük bir artı. Batarya ile çalıştırıldığında, RTX 2000 Ada maksimum 45 watt kullanımla sınırlıdır ve bu da yaklaşık %15 daha düşük grafik performansı ile sonuçlanır (7.107 puan @ Time Spy Graphics). Daha fazla GPU karşılaştırması burada listelenmiştir.
| 3DMark Performance rating - Percent | |
| Dell Precision 5000 5680 | |
| Schenker VISION 16 Pro (M23) | |
| Sınıf ortalaması Workstation | |
| Samsung Galaxy Book3 Ultra 16, i9-13900H RTX 4070 | |
| Lenovo ThinkPad P1 G6-21FV000DGE | |
| Ortalama NVIDIA RTX 2000 Ada Generation Laptop | |
| Asus ROG Flow Z13 GZ301V | |
| MSI CreatorPro Z16P B12UKST | |
| Lenovo ThinkPad X1 Extreme G5-21DE003RGE | |
| HP ZBook Studio 16 G9 62U04EA | |
| 3DMark 11 - 1280x720 Performance GPU | |
| Dell Precision 5000 5680 | |
| Schenker VISION 16 Pro (M23) | |
| Sınıf ortalaması Workstation (10888 - 69594, n=25, son 2 yıl) | |
| Samsung Galaxy Book3 Ultra 16, i9-13900H RTX 4070 | |
| Lenovo ThinkPad P1 G6-21FV000DGE | |
| Ortalama NVIDIA RTX 2000 Ada Generation Laptop (26968 - 33001, n=4) | |
| Asus ROG Flow Z13 GZ301V | |
| MSI CreatorPro Z16P B12UKST | |
| Lenovo ThinkPad X1 Extreme G5-21DE003RGE | |
| HP ZBook Studio 16 G9 62U04EA | |
| 3DMark | |
| 1920x1080 Fire Strike Graphics | |
| Dell Precision 5000 5680 | |
| Schenker VISION 16 Pro (M23) | |
| Sınıf ortalaması Workstation (7578 - 52560, n=25, son 2 yıl) | |
| Lenovo ThinkPad P1 G6-21FV000DGE | |
| Ortalama NVIDIA RTX 2000 Ada Generation Laptop (20340 - 24596, n=4) | |
| Samsung Galaxy Book3 Ultra 16, i9-13900H RTX 4070 | |
| Asus ROG Flow Z13 GZ301V | |
| MSI CreatorPro Z16P B12UKST | |
| Lenovo ThinkPad X1 Extreme G5-21DE003RGE | |
| HP ZBook Studio 16 G9 62U04EA | |
| 2560x1440 Time Spy Graphics | |
| Dell Precision 5000 5680 | |
| Schenker VISION 16 Pro (M23) | |
| Sınıf ortalaması Workstation (2725 - 24806, n=25, son 2 yıl) | |
| Samsung Galaxy Book3 Ultra 16, i9-13900H RTX 4070 | |
| Lenovo ThinkPad P1 G6-21FV000DGE | |
| Ortalama NVIDIA RTX 2000 Ada Generation Laptop (7410 - 9158, n=4) | |
| Asus ROG Flow Z13 GZ301V | |
| MSI CreatorPro Z16P B12UKST | |
| Lenovo ThinkPad X1 Extreme G5-21DE003RGE | |
| HP ZBook Studio 16 G9 62U04EA | |
| 3DMark 06 Standard Score | 53707 puan | |
| 3DMark Vantage P Result | 37844 puan | |
| 3DMark 11 Performance | 27558 puan | |
| 3DMark Fire Strike Score | 19987 puan | |
| 3DMark Time Spy Score | 8849 puan | |
Yardım | ||
| Geekbench 5.5 - OpenCL Score | |
| HP ZBook Fury 16 G10 | |
| Dell Precision 5000 5680 | |
| Schenker VISION 16 Pro (M23) | |
| Dell Precision 5480 | |
| MSI CreatorPro Z16P B12UKST | |
| Lenovo ThinkPad X1 Extreme G5-21DE003RGE | |
| Lenovo ThinkPad P15 G2-20YQ001JGE | |
| Lenovo ThinkPad P1 G6-21FV000DGE | |
| Samsung Galaxy Book3 Ultra 16, i9-13900H RTX 4070 | |
| HP ZBook Studio 16 G9 62U04EA | |
| Geekbench 6.7 - GPU OpenCL | |
| HP ZBook Fury 16 G10 | |
| Dell Precision 5000 5680 | |
| Dell Precision 5480 | |
| Lenovo ThinkPad P1 G6-21FV000DGE | |
| V-Ray Benchmark Next 4.10 - GPU | |
| HP ZBook Fury 16 G10 | |
| Schenker VISION 16 Pro (M23) | |
| Lenovo ThinkPad P1 G6-21FV000DGE | |
| Samsung Galaxy Book3 Ultra 16, i9-13900H RTX 4070 | |
| Dell Precision 5480 | |
| MSI CreatorPro Z16P B12UKST | |
| Lenovo ThinkPad X1 Extreme G5-21DE003RGE | |
| Lenovo ThinkPad P15 G2-20YQ001JGE | |
| HP ZBook Studio 16 G9 62U04EA | |
| V-Ray 5 Benchmark | |
| GPU RTX | |
| HP ZBook Fury 16 G10 | |
| Dell Precision 5000 5680 | |
| Schenker VISION 16 Pro (M23) | |
| Lenovo ThinkPad P1 G6-21FV000DGE | |
| Dell Precision 5480 | |
| MSI CreatorPro Z16P B12UKST | |
| Lenovo ThinkPad X1 Extreme G5-21DE003RGE | |
| GPU CUDA | |
| HP ZBook Fury 16 G10 | |
| Dell Precision 5000 5680 | |
| Schenker VISION 16 Pro (M23) | |
| Lenovo ThinkPad P1 G6-21FV000DGE | |
| Dell Precision 5480 | |
| MSI CreatorPro Z16P B12UKST | |
| Lenovo ThinkPad X1 Extreme G5-21DE003RGE | |
| Blender / v3.3 Classroom OPTIX/RTX | |
| HP ZBook Studio 16 G9 62U04EA | |
| Lenovo ThinkPad X1 Extreme G5-21DE003RGE | |
| MSI CreatorPro Z16P B12UKST | |
| Lenovo ThinkPad P1 G6-21FV000DGE | |
| Ortalama NVIDIA RTX 2000 Ada Generation Laptop (25 - 31, n=4) | |
| Samsung Galaxy Book3 Ultra 16, i9-13900H RTX 4070 | |
| Sınıf ortalaması Workstation (10 - 95, n=19, son 2 yıl) | |
| Schenker VISION 16 Pro (M23) | |
| Dell Precision 5000 5680 | |
| Blender / v3.3 Classroom CUDA | |
| HP ZBook Studio 16 G9 62U04EA | |
| Ortalama NVIDIA RTX 2000 Ada Generation Laptop (51 - 155, n=4) | |
| Lenovo ThinkPad X1 Extreme G5-21DE003RGE | |
| MSI CreatorPro Z16P B12UKST | |
| Lenovo ThinkPad P1 G6-21FV000DGE | |
| Samsung Galaxy Book3 Ultra 16, i9-13900H RTX 4070 | |
| Sınıf ortalaması Workstation (16 - 142, n=19, son 2 yıl) | |
| Schenker VISION 16 Pro (M23) | |
| Dell Precision 5000 5680 | |
| Blender / v3.3 Classroom CPU | |
| Samsung Galaxy Book3 Ultra 16, i9-13900H RTX 4070 | |
| Schenker VISION 16 Pro (M23) | |
| Dell Precision 5000 5680 | |
| MSI CreatorPro Z16P B12UKST | |
| HP ZBook Studio 16 G9 62U04EA | |
| Lenovo ThinkPad P1 G6-21FV000DGE | |
| Lenovo ThinkPad X1 Extreme G5-21DE003RGE | |
| Ortalama NVIDIA RTX 2000 Ada Generation Laptop (291 - 347, n=4) | |
| Sınıf ortalaması Workstation (148 - 464, n=25, son 2 yıl) | |
* ... daha küçük daha iyidir
Oyun Performansı
Oyun kıyaslamalarımız sırasında profesyonel sürücüde herhangi bir sorunla karşılaşmadık ve performans bir GeForce RTX 4060 dizüstü bilgisayar karşılaştırılabilir TGP oranları ile. Sonuç olarak, Star Wars Jedi Survivor, Assassins' Creed Mirage veya Cyberpunk gibi güncel oyunlar maksimum ayarlarda ve 1080p çözünürlükte sorunsuz bir şekilde oynanabilir. Doğal WQHD çözünürlük için kullanıcıların Nvidia'nın DLSS'si gibi yükseltme yöntemlerine başvurmaları gerekebilir. Daha da önemlisi, uzun oyun seansları sırasında bile performans sabit kalıyor.
| Performance rating - Percent | |
| Dell Precision 5000 5680 -1! | |
| Schenker VISION 16 Pro (M23) | |
| Lenovo ThinkPad P1 G6-21FV000DGE | |
| Sınıf ortalaması Workstation | |
| MSI CreatorPro Z16P B12UKST | |
| Samsung Galaxy Book3 Ultra 16, i9-13900H RTX 4070 | |
| HP ZBook Studio 16 G9 62U04EA | |
| Lenovo ThinkPad X1 Extreme G5-21DE003RGE | |
| The Witcher 3 - 1920x1080 Ultra Graphics & Postprocessing (HBAO+) | |
| Dell Precision 5000 5680 | |
| Schenker VISION 16 Pro (M23) | |
| Lenovo ThinkPad P1 G6-21FV000DGE | |
| Samsung Galaxy Book3 Ultra 16, i9-13900H RTX 4070 | |
| Lenovo ThinkPad X1 Extreme G5-21DE003RGE | |
| MSI CreatorPro Z16P B12UKST | |
| Sınıf ortalaması Workstation (26.3 - 91.7, n=3, son 2 yıl) | |
| HP ZBook Studio 16 G9 62U04EA | |
| GTA V - 1920x1080 Highest AA:4xMSAA + FX AF:16x | |
| Dell Precision 5000 5680 | |
| Lenovo ThinkPad P1 G6-21FV000DGE | |
| Sınıf ortalaması Workstation (18.1 - 156.1, n=24, son 2 yıl) | |
| Schenker VISION 16 Pro (M23) | |
| MSI CreatorPro Z16P B12UKST | |
| Samsung Galaxy Book3 Ultra 16, i9-13900H RTX 4070 | |
| HP ZBook Studio 16 G9 62U04EA | |
| Lenovo ThinkPad X1 Extreme G5-21DE003RGE | |
| Final Fantasy XV Benchmark - 1920x1080 High Quality | |
| Dell Precision 5000 5680 | |
| Schenker VISION 16 Pro (M23) | |
| Sınıf ortalaması Workstation (26.4 - 197.6, n=25, son 2 yıl) | |
| Lenovo ThinkPad P1 G6-21FV000DGE | |
| Samsung Galaxy Book3 Ultra 16, i9-13900H RTX 4070 | |
| MSI CreatorPro Z16P B12UKST | |
| HP ZBook Studio 16 G9 62U04EA | |
| Lenovo ThinkPad X1 Extreme G5-21DE003RGE | |
| Strange Brigade - 1920x1080 ultra AA:ultra AF:16 | |
| Sınıf ortalaması Workstation (54.5 - 418, n=19, son 2 yıl) | |
| Schenker VISION 16 Pro (M23) | |
| Lenovo ThinkPad P1 G6-21FV000DGE | |
| Samsung Galaxy Book3 Ultra 16, i9-13900H RTX 4070 | |
| MSI CreatorPro Z16P B12UKST | |
| Lenovo ThinkPad X1 Extreme G5-21DE003RGE | |
| HP ZBook Studio 16 G9 62U04EA | |
| Dota 2 Reborn - 1920x1080 ultra (3/3) best looking | |
| HP ZBook Studio 16 G9 62U04EA | |
| MSI CreatorPro Z16P B12UKST | |
| Dell Precision 5000 5680 | |
| Schenker VISION 16 Pro (M23) | |
| Lenovo ThinkPad X1 Extreme G5-21DE003RGE | |
| Lenovo ThinkPad P1 G6-21FV000DGE | |
| Sınıf ortalaması Workstation (50.7 - 178.4, n=25, son 2 yıl) | |
| Samsung Galaxy Book3 Ultra 16, i9-13900H RTX 4070 | |
| X-Plane 11.11 - 1920x1080 high (fps_test=3) | |
| Schenker VISION 16 Pro (M23) | |
| Lenovo ThinkPad P1 G6-21FV000DGE | |
| Dell Precision 5000 5680 | |
| MSI CreatorPro Z16P B12UKST | |
| HP ZBook Studio 16 G9 62U04EA | |
| Lenovo ThinkPad X1 Extreme G5-21DE003RGE | |
| Sınıf ortalaması Workstation (30.5 - 139.7, n=25, son 2 yıl) | |
| Samsung Galaxy Book3 Ultra 16, i9-13900H RTX 4070 | |
| Cyberpunk 2077 1.6 | |
| 1920x1080 Ultra Preset | |
| Dell Precision 5000 5680 | |
| Schenker VISION 16 Pro (M23) | |
| Samsung Galaxy Book3 Ultra 16, i9-13900H RTX 4070 | |
| Lenovo ThinkPad P1 G6-21FV000DGE | |
| Ortalama NVIDIA RTX 2000 Ada Generation Laptop (n=1) | |
| MSI CreatorPro Z16P B12UKST | |
| Lenovo ThinkPad X1 Extreme G5-21DE003RGE | |
| HP ZBook Studio 16 G9 62U04EA | |
| 1920x1080 High Preset | |
| Dell Precision 5000 5680 | |
| Schenker VISION 16 Pro (M23) | |
| Lenovo ThinkPad P1 G6-21FV000DGE | |
| Ortalama NVIDIA RTX 2000 Ada Generation Laptop (n=1) | |
| Samsung Galaxy Book3 Ultra 16, i9-13900H RTX 4070 | |
| MSI CreatorPro Z16P B12UKST | |
| Lenovo ThinkPad X1 Extreme G5-21DE003RGE | |
| HP ZBook Studio 16 G9 62U04EA | |
| Far Cry 5 | |
| 1920x1080 High Preset AA:T | |
| Dell Precision 5000 5680 | |
| Schenker VISION 16 Pro (M23) | |
| Lenovo ThinkPad P1 G6-21FV000DGE | |
| MSI CreatorPro Z16P B12UKST | |
| Ortalama NVIDIA RTX 2000 Ada Generation Laptop (102 - 120, n=3) | |
| Lenovo ThinkPad X1 Extreme G5-21DE003RGE | |
| Samsung Galaxy Book3 Ultra 16, i9-13900H RTX 4070 | |
| Sınıf ortalaması Workstation (39 - 138, n=11, son 2 yıl) | |
| HP ZBook Studio 16 G9 62U04EA | |
| 1920x1080 Ultra Preset AA:T | |
| Dell Precision 5000 5680 | |
| Schenker VISION 16 Pro (M23) | |
| Lenovo ThinkPad P1 G6-21FV000DGE | |
| MSI CreatorPro Z16P B12UKST | |
| Ortalama NVIDIA RTX 2000 Ada Generation Laptop (95 - 113, n=3) | |
| Lenovo ThinkPad X1 Extreme G5-21DE003RGE | |
| Samsung Galaxy Book3 Ultra 16, i9-13900H RTX 4070 | |
| Sınıf ortalaması Workstation (37 - 128, n=11, son 2 yıl) | |
| HP ZBook Studio 16 G9 62U04EA | |
| Far Cry 6 | |
| 1920x1080 High Graphics Quality AA:T | |
| Lenovo ThinkPad P1 G6-21FV000DGE | |
| Ortalama NVIDIA RTX 2000 Ada Generation Laptop (n=1) | |
| Sınıf ortalaması Workstation (n=1son 2 yıl) | |
| 1920x1080 Ultra Graphics Quality + HD Textures AA:T | |
| Lenovo ThinkPad P1 G6-21FV000DGE | |
| Ortalama NVIDIA RTX 2000 Ada Generation Laptop (n=1) | |
| Star Wars Jedi Survivor | |
| 1920x1080 High Preset | |
| Schenker VISION 16 Pro (M23) | |
| Lenovo ThinkPad P1 G6-21FV000DGE | |
| Ortalama NVIDIA RTX 2000 Ada Generation Laptop (n=1) | |
| 1920x1080 Epic Preset | |
| Schenker VISION 16 Pro (M23) | |
| Lenovo ThinkPad P1 G6-21FV000DGE | |
| Ortalama NVIDIA RTX 2000 Ada Generation Laptop (n=1) | |
| Hogwarts Legacy | |
| 1920x1080 High Preset AA:High T | |
| Lenovo ThinkPad P1 G6-21FV000DGE | |
| Ortalama NVIDIA RTX 2000 Ada Generation Laptop (n=1) | |
| Samsung Galaxy Book3 Ultra 16, i9-13900H RTX 4070 | |
| 1920x1080 Ultra Preset AA:High T | |
| Lenovo ThinkPad P1 G6-21FV000DGE | |
| Ortalama NVIDIA RTX 2000 Ada Generation Laptop (n=1) | |
| Samsung Galaxy Book3 Ultra 16, i9-13900H RTX 4070 | |
| F1 2021 | |
| 1920x1080 High Preset AA:T AF:16x | |
| Schenker VISION 16 Pro (M23) | |
| Lenovo ThinkPad P1 G6-21FV000DGE | |
| Ortalama NVIDIA RTX 2000 Ada Generation Laptop (n=1) | |
| MSI CreatorPro Z16P B12UKST | |
| HP ZBook Studio 16 G9 62U04EA | |
| Lenovo ThinkPad X1 Extreme G5-21DE003RGE | |
| 1920x1080 Ultra High Preset + Raytracing AA:T AF:16x | |
| Schenker VISION 16 Pro (M23) | |
| Lenovo ThinkPad P1 G6-21FV000DGE | |
| Ortalama NVIDIA RTX 2000 Ada Generation Laptop (n=1) | |
| MSI CreatorPro Z16P B12UKST | |
| Lenovo ThinkPad X1 Extreme G5-21DE003RGE | |
| HP ZBook Studio 16 G9 62U04EA | |
| F1 22 | |
| 1920x1080 High Preset AA:T AF:16x | |
| Dell Precision 5000 5680 | |
| Schenker VISION 16 Pro (M23) | |
| Sınıf ortalaması Workstation (57.8 - 238, n=7, son 2 yıl) | |
| Lenovo ThinkPad P1 G6-21FV000DGE | |
| Ortalama NVIDIA RTX 2000 Ada Generation Laptop (119.9 - 138.5, n=3) | |
| MSI CreatorPro Z16P B12UKST | |
| Lenovo ThinkPad X1 Extreme G5-21DE003RGE | |
| HP ZBook Studio 16 G9 62U04EA | |
| Samsung Galaxy Book3 Ultra 16, i9-13900H RTX 4070 | |
| 1920x1080 Ultra High Preset AA:T AF:16x | |
| Dell Precision 5000 5680 | |
| Schenker VISION 16 Pro (M23) | |
| Sınıf ortalaması Workstation (16.9 - 95.5, n=7, son 2 yıl) | |
| Samsung Galaxy Book3 Ultra 16, i9-13900H RTX 4070 | |
| Lenovo ThinkPad P1 G6-21FV000DGE | |
| Ortalama NVIDIA RTX 2000 Ada Generation Laptop (44.2 - 52.8, n=3) | |
| MSI CreatorPro Z16P B12UKST | |
| Lenovo ThinkPad X1 Extreme G5-21DE003RGE | |
| HP ZBook Studio 16 G9 62U04EA | |
| F1 23 | |
| 1920x1080 High Preset AA:T AF:16x | |
| Ortalama NVIDIA RTX 2000 Ada Generation Laptop (142.1 - 147, n=2) | |
| Lenovo ThinkPad P1 G6-21FV000DGE | |
| Sınıf ortalaması Workstation (n=1son 2 yıl) | |
| 1920x1080 Ultra High Preset AA:T AF:16x | |
| Ortalama NVIDIA RTX 2000 Ada Generation Laptop (44.4 - 49.2, n=2) | |
| Lenovo ThinkPad P1 G6-21FV000DGE | |
| Sınıf ortalaması Workstation (n=1son 2 yıl) | |
Witcher 3 FPS chart
| düşük | orta | yüksek | ultra | QHD | |
|---|---|---|---|---|---|
| GTA V (2015) | 173 | 101.6 | 74.6 | ||
| The Witcher 3 (2015) | 390 | 261 | 164 | 79.6 | 65 |
| Dota 2 Reborn (2015) | 178.4 | 153.1 | 143.9 | 133.4 | |
| Final Fantasy XV Benchmark (2018) | 111.2 | 83.5 | 63.7 | ||
| X-Plane 11.11 (2018) | 149.2 | 131.6 | 108.9 | ||
| Far Cry 5 (2018) | 175 | 130 | 120 | 113 | 81 |
| Strange Brigade (2018) | 459 | 228 | 182.5 | 158.2 | 107.5 |
| F1 2021 (2021) | 353 | 230 | 186.6 | 99.2 | 74.9 |
| Far Cry 6 (2021) | 157 | 121 | 104 | 87 | 63 |
| Cyberpunk 2077 1.6 (2022) | 101 | 81 | 72 | 65 | 41 |
| F1 22 (2022) | 213 | 193.2 | 138.5 | 52.8 | 34.2 |
| Hogwarts Legacy (2023) | 101 | 80 | 64 | 53 | 38 |
| Star Wars Jedi Survivor (2023) | 49 | 45 | 42 | 40 | 27 |
| F1 23 (2023) | 202 | 192.1 | 142.1 | 44.4 | 27.6 |
| Assassin's Creed Mirage (2023) | 113 | 103 | 97 | 76 | 58 |
Emisyonlar - ThinkPad günlük kullanımda genellikle sessiz kalır
Sistem Gürültüsü
Temel görevler sırasında ThinkPad'in iki fanı genellikle tamamen devre dışı kalır. Yalnızca işlemci veya özel grafik kartı devreye girdiğinde duyulabilir hale geliyorlar. Etkinleştirildiğinde, fanların kademeli bir birikme olmadan anında yüksek hızda çalıştığını belirtmek gerekir. Oyun senaryolarında, yaklaşık 41-48 dB(A) arasında değişen gürültü seviyeleri ölçtük, 48 dB(A) stres testi sırasında maksimum fan hacmini temsil ediyor. Daha verimli iki performans modunda, gürültü seviyesi maksimum 40,7 dB(A)'ya ulaşıyor. Özellikle, test cihazımızda başka hiçbir elektronik ses tespit edilmedi.
Ses yüksekliği
| Boşta |
| 24.5 / 24.5 / 24.5 dB |
| Çalışırken |
| 48 / 48 dB |
 | ||
30 dB sessiz 40 dB(A) duyulabilirlik 50 dB(A) gürültülü |
||
min: | ||
| Lenovo ThinkPad P1 G6-21FV000DGE RTX 2000 Ada Generation Laptop, i9-13900H, SK Hynix PC711 1TB HFS001TDE9X084N | Dell Precision 5000 5680 RTX 5000 Ada Generation Laptop, i9-13900H, 2x SK hynix PC801 HFS512GEJ9X101N RAID 0 | Samsung Galaxy Book3 Ultra 16, i9-13900H RTX 4070 GeForce RTX 4070 Laptop GPU, i9-13900H, Samsung PM9A1 MZVL21T0HCLR | HP ZBook Studio 16 G9 62U04EA RTX A2000 Laptop GPU, i7-12800H, Micron 3400 1TB MTFDKBA1T0TFH | MSI CreatorPro Z16P B12UKST RTX A3000 Laptop GPU, i7-12700H, Samsung PM9A1 MZVL21T0HCLR | Schenker VISION 16 Pro (M23) GeForce RTX 4070 Laptop GPU, i7-13700H, Samsung 990 Pro 1 TB | Lenovo ThinkPad X1 Extreme G5-21DE003RGE GeForce RTX 3060 Laptop GPU, i7-12700H, Micron 3400 1TB MTFDKBA1T0TFH | |
|---|---|---|---|---|---|---|---|
| Noise | 2% | -4% | -2% | -4% | -13% | 3% | |
| kapalı / ortam * (dB) | 24.5 | 22.8 7% | 25.2 -3% | 24 2% | 24.1 2% | 25.9 -6% | 23.2 5% |
| Idle Minimum * (dB) | 24.5 | 23 6% | 25.2 -3% | 24 2% | 27.1 -11% | 25.9 -6% | 23.2 5% |
| Idle Average * (dB) | 24.5 | 23 6% | 25.2 -3% | 27.7 -13% | 27.1 -11% | 25.9 -6% | 23.2 5% |
| Idle Maximum * (dB) | 24.5 | 23 6% | 31.3 -28% | 27.7 -13% | 27.1 -11% | 32 -31% | 23.2 5% |
| Load Average * (dB) | 48 | 37.2 22% | 38.8 19% | 39.8 17% | 42.9 11% | 47.2 2% | 45.5 5% |
| Witcher 3 ultra * (dB) | 40.7 | 51 -25% | 44.3 -9% | 44 -8% | 53.1 -30% | 45.5 -12% | |
| Load Maximum * (dB) | 48 | 51 -6% | 51.2 -7% | 47.7 1% | 47 2% | 53.1 -11% | 45.5 5% |
* ... daha küçük daha iyidir
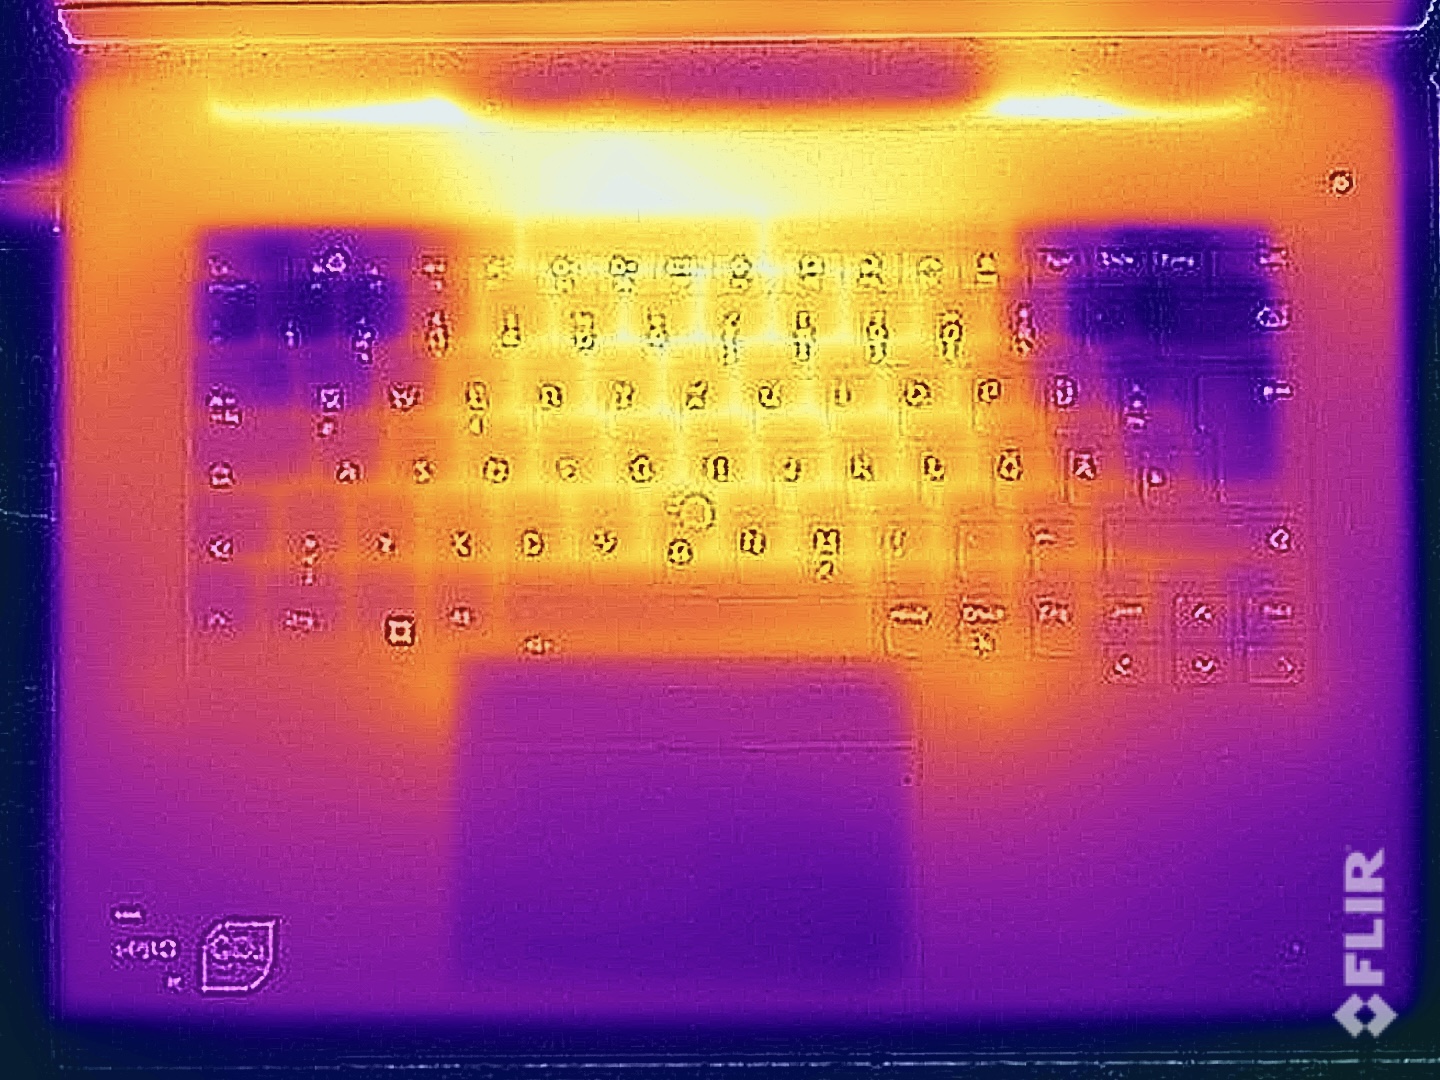
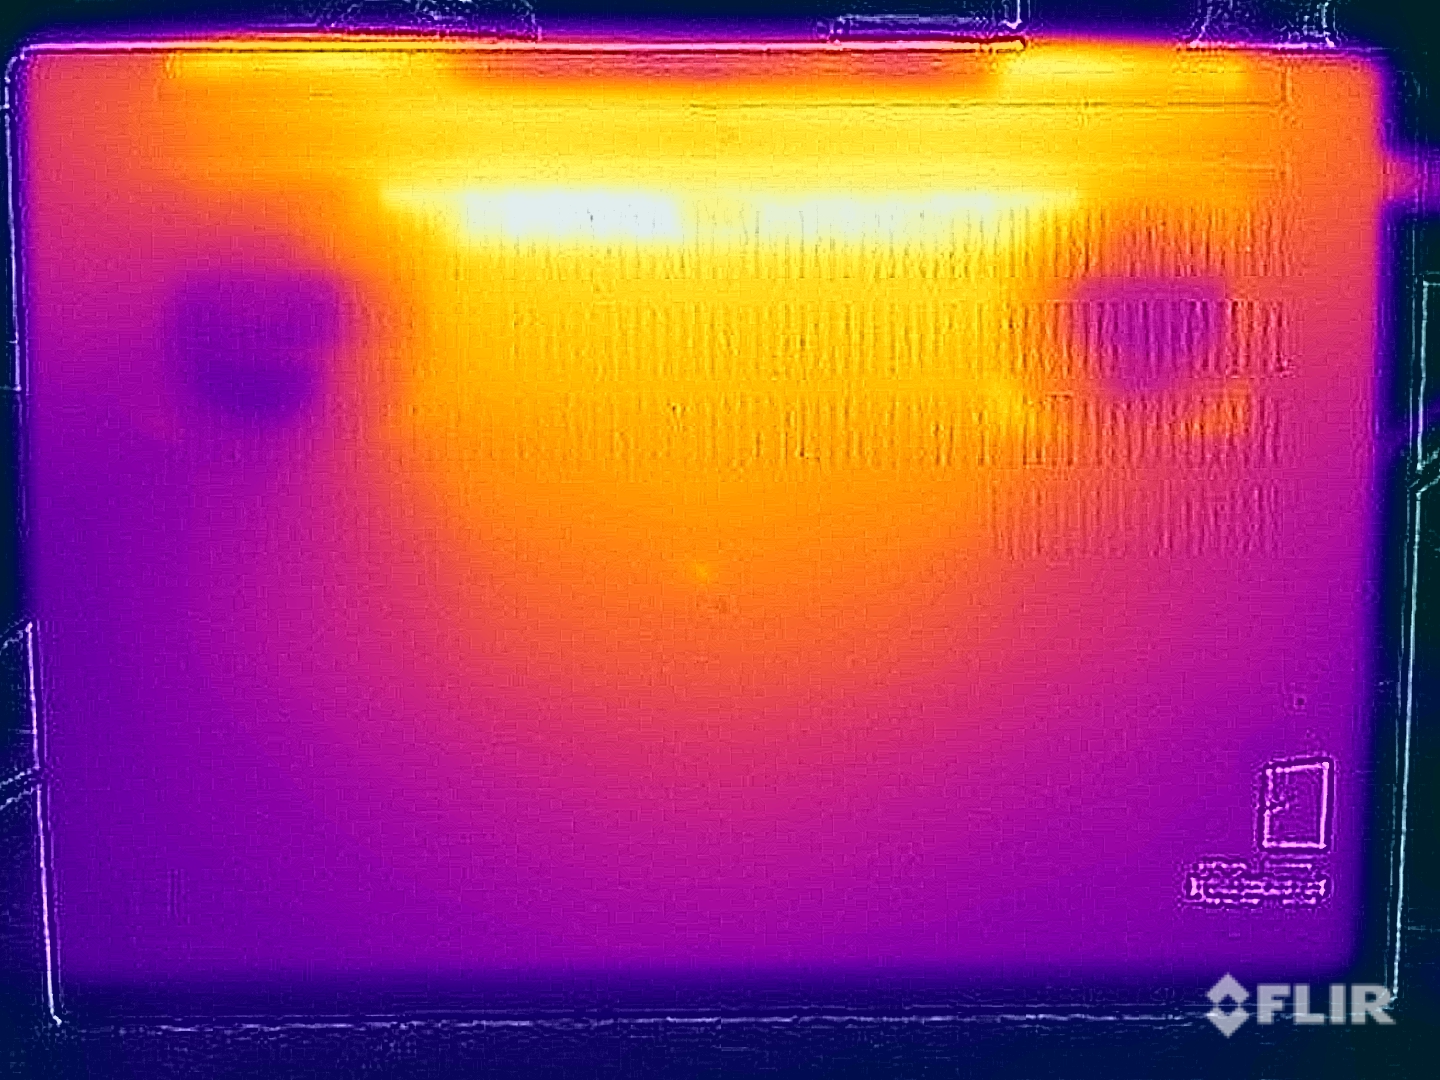
Sıcaklık
Basit görevler sırasında yüzey sıcaklıkları tamamen güvenli kalır ve kasa neredeyse hiç ısınmaz. Benzer şekilde önceki modelağır yük altında, sıcaklıklar alt tarafta 50°C'yi aşar. Cihazı bu gibi durumlarda kalçanızın üzerine koymamanız tavsiye edilir, ancak boyutu göz önüne alındığında bu senaryo pek olası değildir. Klavye alanı da 47 °C'ye kadar sıcaklıklara ulaşabilir, ancak önceki modelde daha da yüksek sıcaklıklar kaydetmiştik. Yük altında (veya oyun oynarken) yazı yazmak parmakların ısınmasına neden olabilir, ancak önemli bir rahatsızlık yoktur.
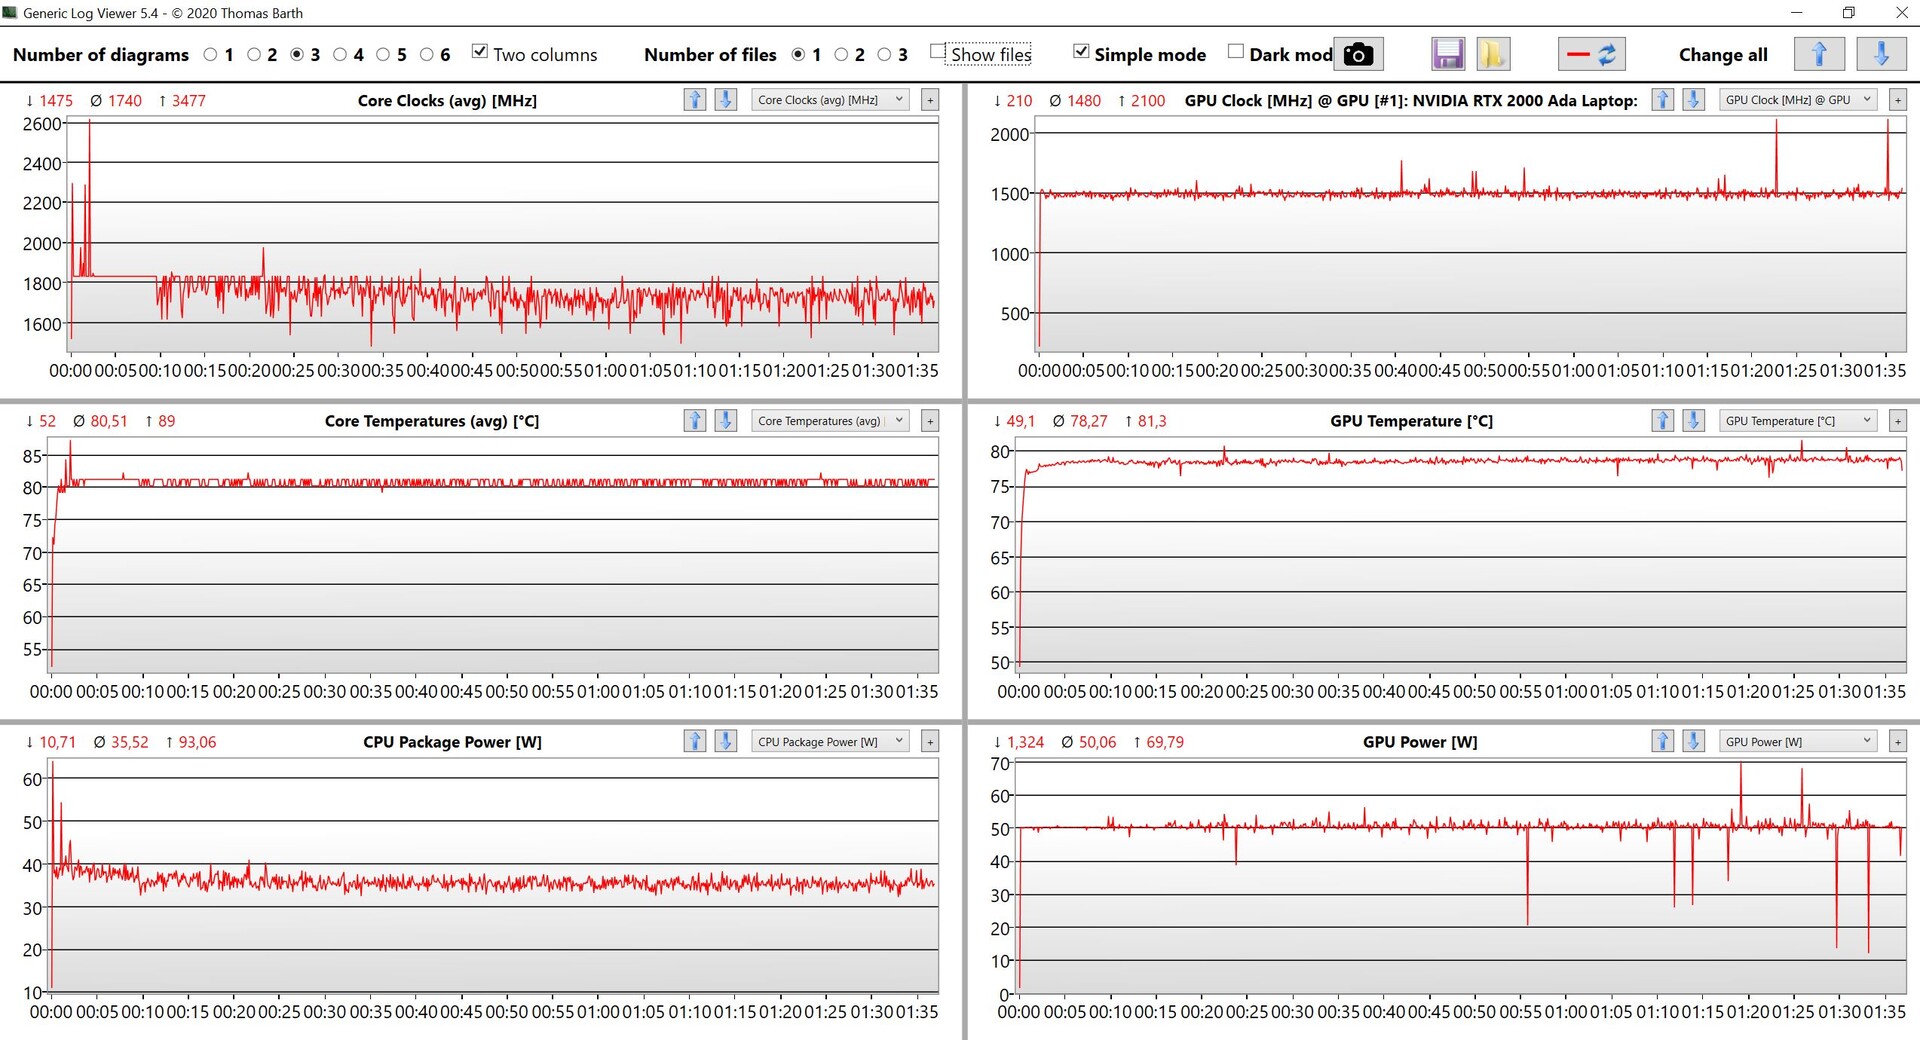
Stres testi sırasında, özel grafik kartı belirtilen 50 watt'ta çalışırken, işlemci yaklaşık 35 watt'ta sabitlenir. Sistem sürekli olarak 85 watt'lık toplam soğutma yükünü kaldırabiliyor. Karşılaştırma için, buhar hazneli G5 nesli toplamda yaklaşık 100 watt (GPU için 60 watt ve CPU için 40 watt) yönetmiştir.
(-) Üst taraftaki maksimum sıcaklık, 38.2 °C / 101 F ortalamasına kıyasla 47.1 °C / 117 F'dir. , Workstation sınıfı için 22.2 ile 69.8 °C arasında değişir.
(-) Alt kısım, 41.1 °C / 106 F ortalamasına kıyasla maksimum 56.5 °C / 134 F'ye kadar ısınır
(+) Boşta kullanımda, üst tarafın ortalama sıcaklığı 26.4 °C / 80 F olup, cihazın 32 °C / 90 F.
(-) The Witcher 3 oynarken, üst tarafın ortalama sıcaklığı 39.1 °C / 102 F olup, cihazın 32 °C / 90 F.
(+) Avuç içi dayanakları ve dokunmatik yüzey maksimum (35.1 °C / 95.2 F) cilt sıcaklığına ulaşıyor ve bu nedenle sıcak değil.
(-) Benzer cihazların avuç içi dayanağı alanının ortalama sıcaklığı 27.8 °C / 82 F (-7.3 °C / -13.2 F) idi.
| Lenovo ThinkPad P1 G6-21FV000DGE Intel Core i9-13900H, NVIDIA RTX 2000 Ada Generation Laptop | Dell Precision 5000 5680 Intel Core i9-13900H, NVIDIA RTX 5000 Ada Generation Laptop | Samsung Galaxy Book3 Ultra 16, i9-13900H RTX 4070 Intel Core i9-13900H, NVIDIA GeForce RTX 4070 Laptop GPU | HP ZBook Studio 16 G9 62U04EA Intel Core i7-12800H, NVIDIA RTX A2000 Laptop GPU | MSI CreatorPro Z16P B12UKST Intel Core i7-12700H, NVIDIA RTX A3000 Laptop GPU | Schenker VISION 16 Pro (M23) Intel Core i7-13700H, NVIDIA GeForce RTX 4070 Laptop GPU | Lenovo ThinkPad X1 Extreme G5-21DE003RGE Intel Core i7-12700H, NVIDIA GeForce RTX 3060 Laptop GPU | |
|---|---|---|---|---|---|---|---|
| Heat | -3% | -6% | 3% | -6% | 4% | -1% | |
| Maximum Upper Side * (°C) | 47.1 | 50.2 -7% | 45.9 3% | 38.7 18% | 56.3 -20% | 46.7 1% | 52 -10% |
| Maximum Bottom * (°C) | 56.5 | 32 43% | 50.9 10% | 53.4 5% | 68.3 -21% | 54.1 4% | 56.4 -0% |
| Idle Upper Side * (°C) | 28.1 | 37.4 -33% | 31.6 -12% | 27.3 3% | 25.2 10% | 26.5 6% | 26.4 6% |
| Idle Bottom * (°C) | 27.6 | 31.2 -13% | 34.2 -24% | 31.6 -14% | 25.9 6% | 26.8 3% | 27.2 1% |
* ... daha küçük daha iyidir
Konuşmacılar
Hoparlör özellikleri eski modele benzer ve yaklaşık 82 dB(A) olan maksimum ses seviyesi de karşılaştırılabilir. Mevcut P1 G6, muhtemelen yazılım optimizasyonları nedeniyle ölçümlerimizde biraz daha iyi performans gösteriyor. Gelişmiş bir ses deneyimi için önceden yüklenmiş Dolby uygulamasını etkinleştirmenizi şiddetle tavsiye ederiz. Stereo hoparlörler iyi bir genel performans sunarken, daha fazla hoparlöre sahip rakipler bu açıdan hala avantajlı.
Lenovo ThinkPad P1 G6-21FV000DGE ses analizi
(±) | hoparlör ses yüksekliği ortalama ama iyi (81.8 dB)
Bas 100 - 315Hz
(±) | azaltılmış bas - ortalama olarak medyandan 8.9% daha düşük
(±) | Bas doğrusallığı ortalamadır (12.3% delta - önceki frekans)
Ortalar 400 - 2000 Hz
(+) | dengeli ortalar - medyandan yalnızca 4.7% uzakta
(+) | orta frekanslar doğrusaldır (3.5% deltadan önceki frekansa)
Yüksekler 2 - 16 kHz
(+) | dengeli yüksekler - medyandan yalnızca 4.1% uzakta
(+) | yüksekler doğrusaldır (6.1% deltadan önceki frekansa)
Toplam 100 - 16.000 Hz
(+) | genel ses doğrusaldır (12.2% ortancaya göre fark)
Aynı sınıfla karşılaştırıldığında
» Bu sınıftaki tüm test edilen cihazların %18%'si daha iyi, 3% benzer, 79% daha kötüydü
» En iyisinin deltası 7% idi, ortalama 17% idi, en kötüsü 35% idi
Test edilen tüm cihazlarla karşılaştırıldığında
» Test edilen tüm cihazların %10'si daha iyi, 2 benzer, % 88 daha kötüydü
» En iyisinin deltası 4% idi, ortalama 24% idi, en kötüsü 134% idi
MSI CreatorPro Z16P B12UKST ses analizi
(+) | hoparlörler nispeten yüksek sesle çalabilir (83.3 dB)
Bas 100 - 315Hz
(-) | neredeyse hiç bas yok - ortalama olarak medyandan 18.7% daha düşük
(±) | Bas doğrusallığı ortalamadır (7% delta - önceki frekans)
Ortalar 400 - 2000 Hz
(+) | dengeli ortalar - medyandan yalnızca 3% uzakta
(+) | orta frekanslar doğrusaldır (6.8% deltadan önceki frekansa)
Yüksekler 2 - 16 kHz
(+) | dengeli yüksekler - medyandan yalnızca 4.6% uzakta
(+) | yüksekler doğrusaldır (6.4% deltadan önceki frekansa)
Toplam 100 - 16.000 Hz
(±) | Genel sesin doğrusallığı ortalamadır (15.2% ortancaya göre fark)
Aynı sınıfla karşılaştırıldığında
» Bu sınıftaki tüm test edilen cihazların %33%'si daha iyi, 10% benzer, 57% daha kötüydü
» En iyisinin deltası 7% idi, ortalama 17% idi, en kötüsü 35% idi
Test edilen tüm cihazlarla karşılaştırıldığında
» Test edilen tüm cihazların %21'si daha iyi, 4 benzer, % 74 daha kötüydü
» En iyisinin deltası 4% idi, ortalama 24% idi, en kötüsü 134% idi
Enerji Yönetimi - IPS panel ile iyi dayanıklılık
Güç Tüketimi
WQHD panelli ThinkPad P1 G6, 4K panelli eski ThinkPad X1 Extreme'e kıyasla önemli ölçüde daha yüksek verimlilik gösteriyor. Deneyimler, isteğe bağlı 4K OLED ekranın da önemli ölçüde daha fazla güç gerektireceğini gösteriyor. Maksimum boşta tüketim 165 Hz'de 15,3 watt'tır ve 60 Hz modunda yaklaşık 1,5 watt tasarruf edebilirsiniz. Dizüstü bilgisayar yük altında oldukça verimli kalıyor; oyun sırasında 100 watt'ın biraz üzerinde ölçüm yaptık. Önceki modelde bu değer daha düşük performansa rağmen 130 watt civarındaydı. Stres testinin başlangıcında kısa bir süre için maksimum 165 watt ölçmemize rağmen, hızla 110 watt civarına yerleşti. Birlikte verilen 170 watt'lık güç kaynağı bu güç gereksinimleri için fazlasıyla yeterli.
| Kapalı / Bekleme modu | |
| Boşta | |
| Çalışırken |
|
Key:
min: | |
| Lenovo ThinkPad P1 G6-21FV000DGE i9-13900H, RTX 2000 Ada Generation Laptop, SK Hynix PC711 1TB HFS001TDE9X084N, IPS, 2560x1600, 16" | Dell Precision 5000 5680 i9-13900H, RTX 5000 Ada Generation Laptop, 2x SK hynix PC801 HFS512GEJ9X101N RAID 0, OLED, 3840x2400, 16" | Samsung Galaxy Book3 Ultra 16, i9-13900H RTX 4070 i9-13900H, GeForce RTX 4070 Laptop GPU, Samsung PM9A1 MZVL21T0HCLR, OLED / AMOLED, 2880x1800, 16" | HP ZBook Studio 16 G9 62U04EA i7-12800H, RTX A2000 Laptop GPU, Micron 3400 1TB MTFDKBA1T0TFH, IPS, 3840x2400, 16" | MSI CreatorPro Z16P B12UKST i7-12700H, RTX A3000 Laptop GPU, Samsung PM9A1 MZVL21T0HCLR, IPS, 2560x1600, 16" | Schenker VISION 16 Pro (M23) i7-13700H, GeForce RTX 4070 Laptop GPU, Samsung 990 Pro 1 TB, IPS, 2560x1600, 16" | Lenovo ThinkPad X1 Extreme G5-21DE003RGE i7-12700H, GeForce RTX 3060 Laptop GPU, Micron 3400 1TB MTFDKBA1T0TFH, IPS, 3840x2400, 16" | Ortalama NVIDIA RTX 2000 Ada Generation Laptop | Sınıf ortalaması Workstation | |
|---|---|---|---|---|---|---|---|---|---|
| Power Consumption | -14% | 29% | -12% | -21% | -0% | -43% | 9% | -5% | |
| Idle Minimum * (Watt) | 8.3 | 8 4% | 4.3 48% | 7.2 13% | 10.8 -30% | 8.6 -4% | 11.8 -42% | 6.88 ? 17% | 8.94 ? -8% |
| Idle Average * (Watt) | 14.5 | 10.4 28% | 4.6 68% | 18.1 -25% | 16.3 -12% | 12 17% | 22.4 -54% | 12.1 ? 17% | 13.8 ? 5% |
| Idle Maximum * (Watt) | 15.3 | 30.5 -99% | 11.4 25% | 18.5 -21% | 16.9 -10% | 12.4 19% | 23.1 -51% | 14.5 ? 5% | 17.5 ? -14% |
| Load Average * (Watt) | 91.8 | 75.4 18% | 97 -6% | 112.8 -23% | 111.7 -22% | 80 13% | 138 -50% | 86.9 ? 5% | 95 ? -3% |
| Witcher 3 ultra * (Watt) | 104.7 | 134 -28% | 100.9 4% | 106.7 -2% | 152.1 -45% | 147.7 -41% | 129.9 -24% | ||
| Load Maximum * (Watt) | 164.5 | 175 -6% | 107 35% | 186 -13% | 177.4 -8% | 173.1 -5% | 225.6 -37% | 161.1 ? 2% | 175.2 ? -7% |
* ... daha küçük daha iyidir
Power consumption Witcher 3 / stress test
Power consumption with external monitor
Pil Ömrü
Pil 90 watt-saat kapasitesini koruyor ve özellikle 60 Hz modunda mükemmel pil çalışma süreleri sağlıyor. WLAN testimiz sırasında ThinkPad P1 G6, 150 cd/m²'de yaklaşık 9,5 saat (test cihazındaki maksimum parlaklığın %63'üne eşdeğer) ve tam parlaklıkta 6 saat 43 dakika elde etti. Büyük ekran ve neredeyse 500 cd/m²'lik yüksek parlaklık göz önüne alındığında, bu sonuçlar oldukça etkileyici. Video testi sırasında (yine 150 cd/m2'de) neredeyse 11 saat dayanır, ancak aşağıdaki tabloda görüldüğü gibi 165 Hz modunda çalışma süreleri daha kısadır:
| Mod | WLAN testi (150 cd/m²) | WLAN testi maks. parlaklık | Video testi (150 cd/m²) |
|---|---|---|---|
| 60 Hz | 567 dakika | 403 dakika | 674 dakika |
| 165 Hz | 500 dakika | 370 dakika | 548 dakika |
Yoğun kullanımda pil bir saatten biraz fazla sürede tükenebilir ve cihaz açıldığında tamamen şarj olması yaklaşık 100 dakika sürer. Yaklaşık %45 şarj 20 dakikadan kısa bir süre sonra kullanılabilir ve %80'e 50 dakika sonra ulaşılır.
| Lenovo ThinkPad P1 G6-21FV000DGE i9-13900H, RTX 2000 Ada Generation Laptop, 90 Wh | Dell Precision 5000 5680 i9-13900H, RTX 5000 Ada Generation Laptop, 98 Wh | Samsung Galaxy Book3 Ultra 16, i9-13900H RTX 4070 i9-13900H, GeForce RTX 4070 Laptop GPU, 76 Wh | HP ZBook Studio 16 G9 62U04EA i7-12800H, RTX A2000 Laptop GPU, 86 Wh | MSI CreatorPro Z16P B12UKST i7-12700H, RTX A3000 Laptop GPU, 90 Wh | Schenker VISION 16 Pro (M23) i7-13700H, GeForce RTX 4070 Laptop GPU, 80 Wh | Lenovo ThinkPad X1 Extreme G5-21DE003RGE i7-12700H, GeForce RTX 3060 Laptop GPU, 90 Wh | Sınıf ortalaması Workstation | |
|---|---|---|---|---|---|---|---|---|
| Pil Çalışma Süresi | 30% | -18% | -19% | -39% | -10% | -3% | 2% | |
| H.264 (h) | 11.2 | 9 -20% | 8.5 -24% | 7.8 -30% | 7.3 -35% | 9.51 ? -15% | ||
| WiFi v1.3 (h) | 9.5 | 9.9 4% | 8 -16% | 6.3 -34% | 5.8 -39% | 7.8 -18% | 6.7 -29% | 8.53 ? -10% |
| Load (h) | 1.1 | 1.7 55% | 0.9 -18% | 1.1 0% | 1.3 18% | 1.7 55% | 1.429 ? 30% |
Artılar
Eksiler
Karar - Çok iyi mobil iş istasyonu

Yeni ThinkPad P1 G6, değişmeyen kasa tasarımını koruyarak ve özel grafik kartına bağlı olarak iki farklı soğutma türü (ısı boruları veya buhar odası ile klasik) sunarak beklentileri karşılıyor. ThinkPad X1 Extreme'in kullanımdan kaldırılması, her iki model de aynı olduğu için yalnızca bir pazarlama kararıdır. Lenovo, profesyonel Nvidia GPU'ların yanı sıra, seçenekler biraz sınırlı olsa da tüketici varyantları da sunmaktadır RTX 4060 Dizüstü Bilgisayar, 4080 Dizüstü Bilgisayarve 4090 Dizüstü Bilgisayar.
İşlemci performansı açısından genel güç mükemmeldir ve Core i9 tek çekirdekli testlerde üstündür. Ayrıca, buhar odası soğutmalı daha güçlü modellerin biraz daha iyi CPU performansı sunabileceğinden şüpheleniliyor. Yeni RTX 2000 Ada, 65 watt'lık nispeten düşük TGP değerine rağmen üstün grafik performansı sunarak önemli bir yükseltme olarak öne çıkıyor. Eski modelden daha iyi performans gösteriyor RTX A3000 ve hatta GeForce RTX 3060 Dizüstü Bilgisayar. GPU, GeForce RTX 4060 dizüstü bilgisayardakine benzer olsa da, ThinkPad P1 G6'da daha sağlam buhar odası soğutmasıyla 80 watt'ta çalışıyor. Lenovo'nun bu konudaki farklılaşması tam olarak net değil.
ThinkPad P1 G6, ham performans yerine mobiliteye öncelik veren bir mobil iş istasyonu olarak mükemmeldir. Nvidia Ada GPU'lar etkileyici bir performans sunar ve 500 nit parlaklık ve 165 Hz yenileme hızına sahip isteğe bağlı IPS ekran, özellikle genişletilmiş bir renk alanına ihtiyacınız yoksa şiddetle tavsiye edilir.
Ekran olağanüstü iyi performans gösterirken, zayıf noktası küçük sRGB standardıyla sınırlı renk alanı kapsamıdır. Ekranın diğer tüm yönleri mükemmel, bu da onu isteğe bağlı OLED modeline göre tercih edilen bir seçenek haline getiriyor. OLED ekran için tek argüman, daha geniş renk alanı kapsamıdır. Lenovo'nun artık Adobe RGB renk alanına sahip 4K IPS ekranı sunmaması talihsizlik.
ThinkPad P1 G6, büyük kusurları olmayan iyi geliştirilmiş bir cihazdır. İyileştirmeler arasında daha hızlı bir kart okuyucu, 0,07 inç vuruşlu eski klavyelere geri dönme ve WWAN modülleri için önceden yönlendirilmiş antenler yer alabilir. Ek olarak, fan davranışının optimize edilmesi genel kullanıcı deneyimini geliştirecektir. Cihazın gürültü seviyesi yük altında 48 dB(A) ile zirve yapıyor ve bu da onu nispeten gürültülü yapıyor. Karşılaştırıldığında, selefinin buhar odası soğutması daha sessizdi.
Fiyat & Müsaitlik
ThinkPad P1 G6 inceleme örneğimiz Amazon 'dan ~3.000 USD karşılığında sipariş edilebilir. P1 G6 ayrıca Lenovo'nun çevrimiçi mağazasında da yapılandırılabilir.
Lenovo ThinkPad P1 G6-21FV000DGE
- 10/19/2023 v7 (old)
Andreas Osthoff
Şeffaflık
İncelenecek cihazların seçimi editör ekibimiz tarafından yapılır. Test örneği, bu incelemenin amacı doğrultusunda üretici veya perakendeci tarafından yazara ödünç olarak sağlanmıştır. Borç verenin bu inceleme üzerinde herhangi bir etkisi olmadığı gibi, üretici de yayınlanmadan önce bu incelemenin bir kopyasını almamıştır. Bu incelemeyi yayınlama zorunluluğu yoktu. Bağımsız bir medya şirketi olarak Notebookcheck, üreticilerin, perakendecilerin veya yayıncıların otoritesine tabi değildir.
Notebookcheck bu şekilde test yapıyor
Notebookcheck, tüm sonuçların karşılaştırılabilir olmasını sağlamak için her yıl yüzlerce dizüstü bilgisayarı ve akıllı telefonu standart prosedürler kullanarak bağımsız olarak inceliyor. Yaklaşık 20 yıldır test yöntemlerimizi sürekli olarak geliştirdik ve bu süreçte endüstri standartlarını belirledik. Test laboratuvarlarımızda deneyimli teknisyenler ve editörler tarafından yüksek kaliteli ölçüm ekipmanları kullanılmaktadır. Bu testler çok aşamalı bir doğrulama sürecini içerir. Karmaşık derecelendirme sistemimiz, nesnelliği koruyan yüzlerce sağlam temellere dayanan ölçüm ve kıyaslamaya dayanmaktadır.Price comparison

