Lenovo ThinkPad T14 AMD İncelemesi: Satın alabileceğiniz En İyi İş Dizüstü Bilgisayarı?
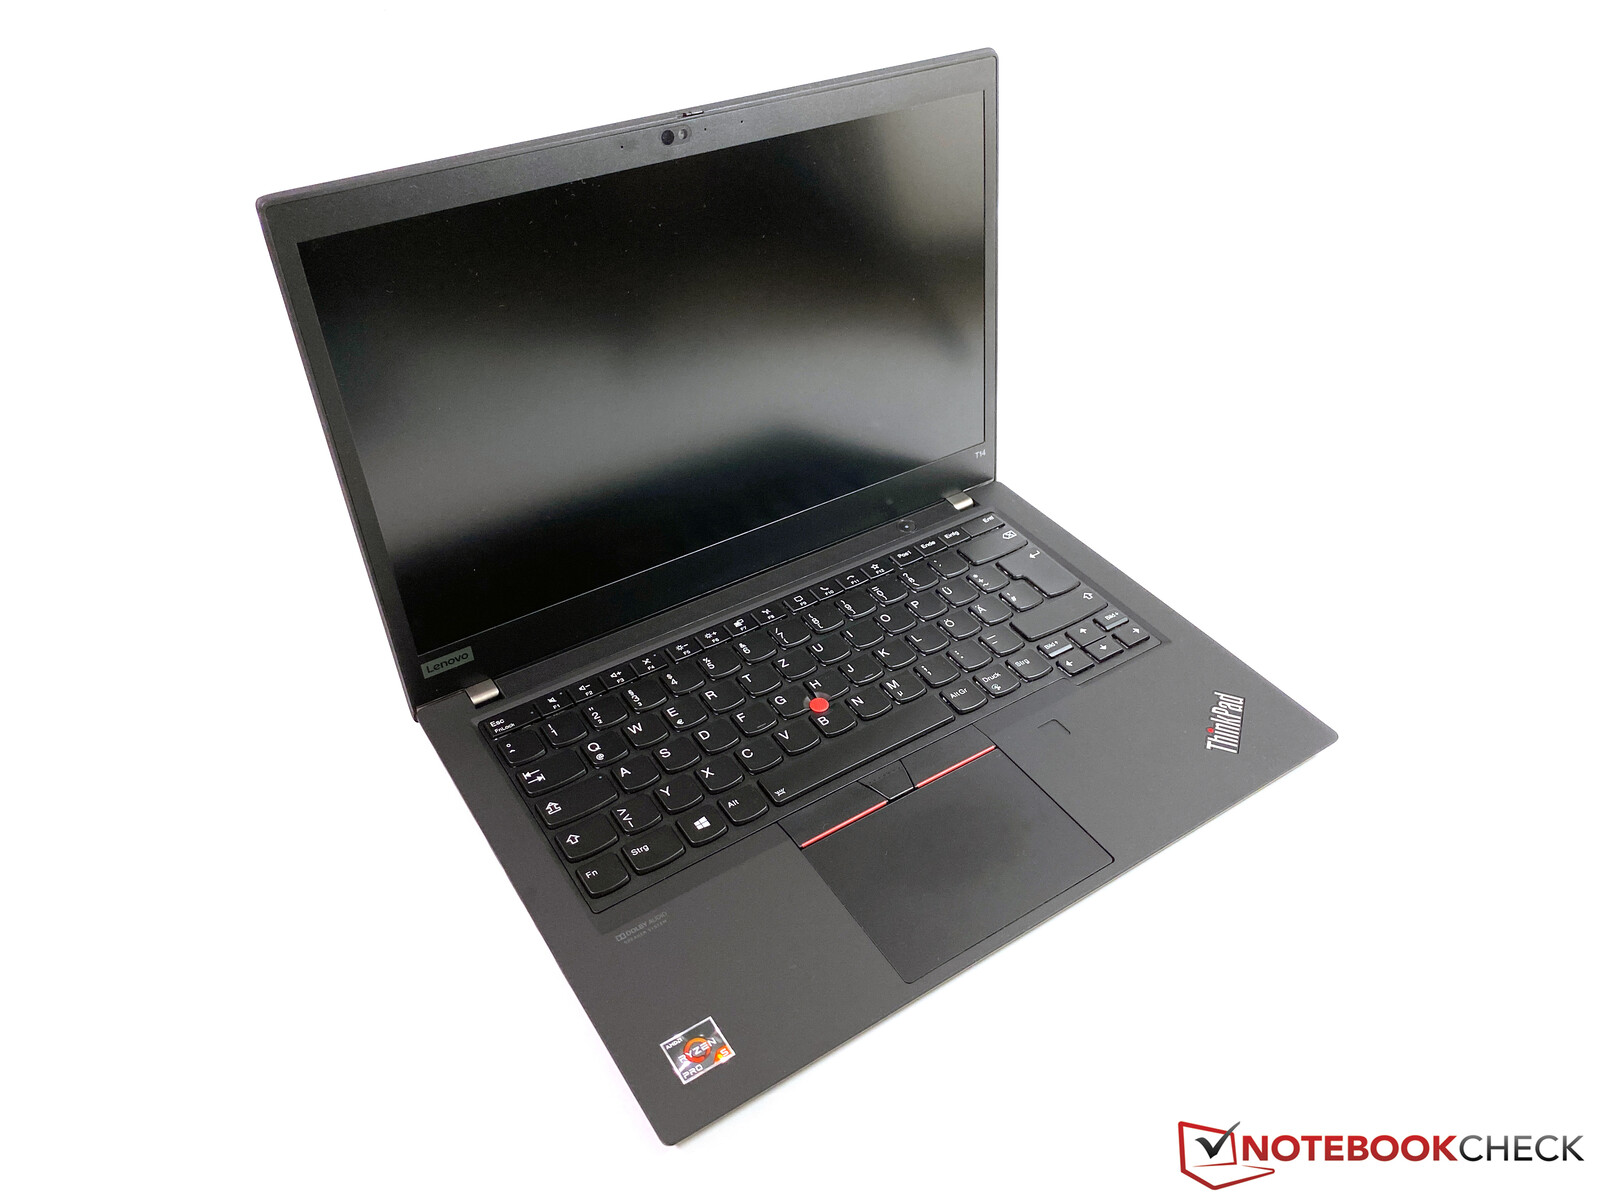
Lenovo, popüler iş dizüstü bilgisayarı ThinkPad T14'ü hem Intel hem de AMD işlemcilerle sunuyor ve her iki model de artık aynı model adını paylaşıyor. T14'ün Intel sürümünü daha önce inceledik ve şimdi T14 AMD'ye daha yakından bakıyoruz. Test birimimiz, yaklaşık 1.100 Euro (~ 1.308 $) değerinde 20UES00H00 adlı bir eğitim modelidir; düzenli müşteriler için karşılık gelen sürüm Lenovo'nun çevrimiçi mağazasında yaklaşık 1.300 Euro (~ 1.545 $) olarak listelenir. Test ünitemiz AMD Ryzen 5 Pro 4650U, entegre RX Vega 6, 16 GB RAM (tek kanal) ve mat LowPower 1080p ekran. Test modeli, Intel işlemcili daha önce gözden geçirilen ThinkPad T14 ile aynıdır, bu nedenle performans ve bileşenler açısından farklılıklara odaklanmak istiyoruz. Lütfen kasa, giriş aygıtları ve hoparlörler hakkında daha fazla bilgi için ThinkPad T14 Intel hakkındaki ayrıntılı incelememize bakın: Lenovo ThinkPad T14 Intel
Derecelendirme | Tarih | Modeli | Ağırlık | Yükseklik | Boyut | Çözünürlük | Fiyat |
|---|---|---|---|---|---|---|---|
| 88.9 % v7 (old) | 12/2020 | Lenovo ThinkPad T14-20UES00H00 R5 PRO 4650U, Vega 6 | 1.5 kg | 17.9 mm | 14.00" | 1920x1080 | |
| 88 % v7 (old) | 07/2020 | Lenovo ThinkPad T14-20S1S06B00 i5-10210U, UHD Graphics 620 | 1.5 kg | 17.9 mm | 14.00" | 1920x1080 | |
| 87.8 % v7 (old) | 12/2020 | HP EliteBook 845 G7-23Y60EA R5 PRO 4650U, Vega 6 | 1.5 kg | 17.9 mm | 14.00" | 1920x1080 | |
| 85.3 % v7 (old) | Dell Latitude 14 5410-RJ80D i5-10310U, UHD Graphics 620 | 1.6 kg | 20.7 mm | 14.00" | 1920x1080 | ||
| 90.5 % v7 (old) | 08/2020 | Lenovo ThinkPad T14s-20UJS00K00 R7 PRO 4750U, Vega 7 | 1.3 kg | 16.1 mm | 14.00" | 1920x1080 | |
| 88.7 % v7 (old) | 08/2020 | Lenovo ThinkPad T495-20NKS01Y00 R5 PRO 3500U, Vega 8 | 1.5 kg | 18.9 mm | 14.00" | 1920x1080 |
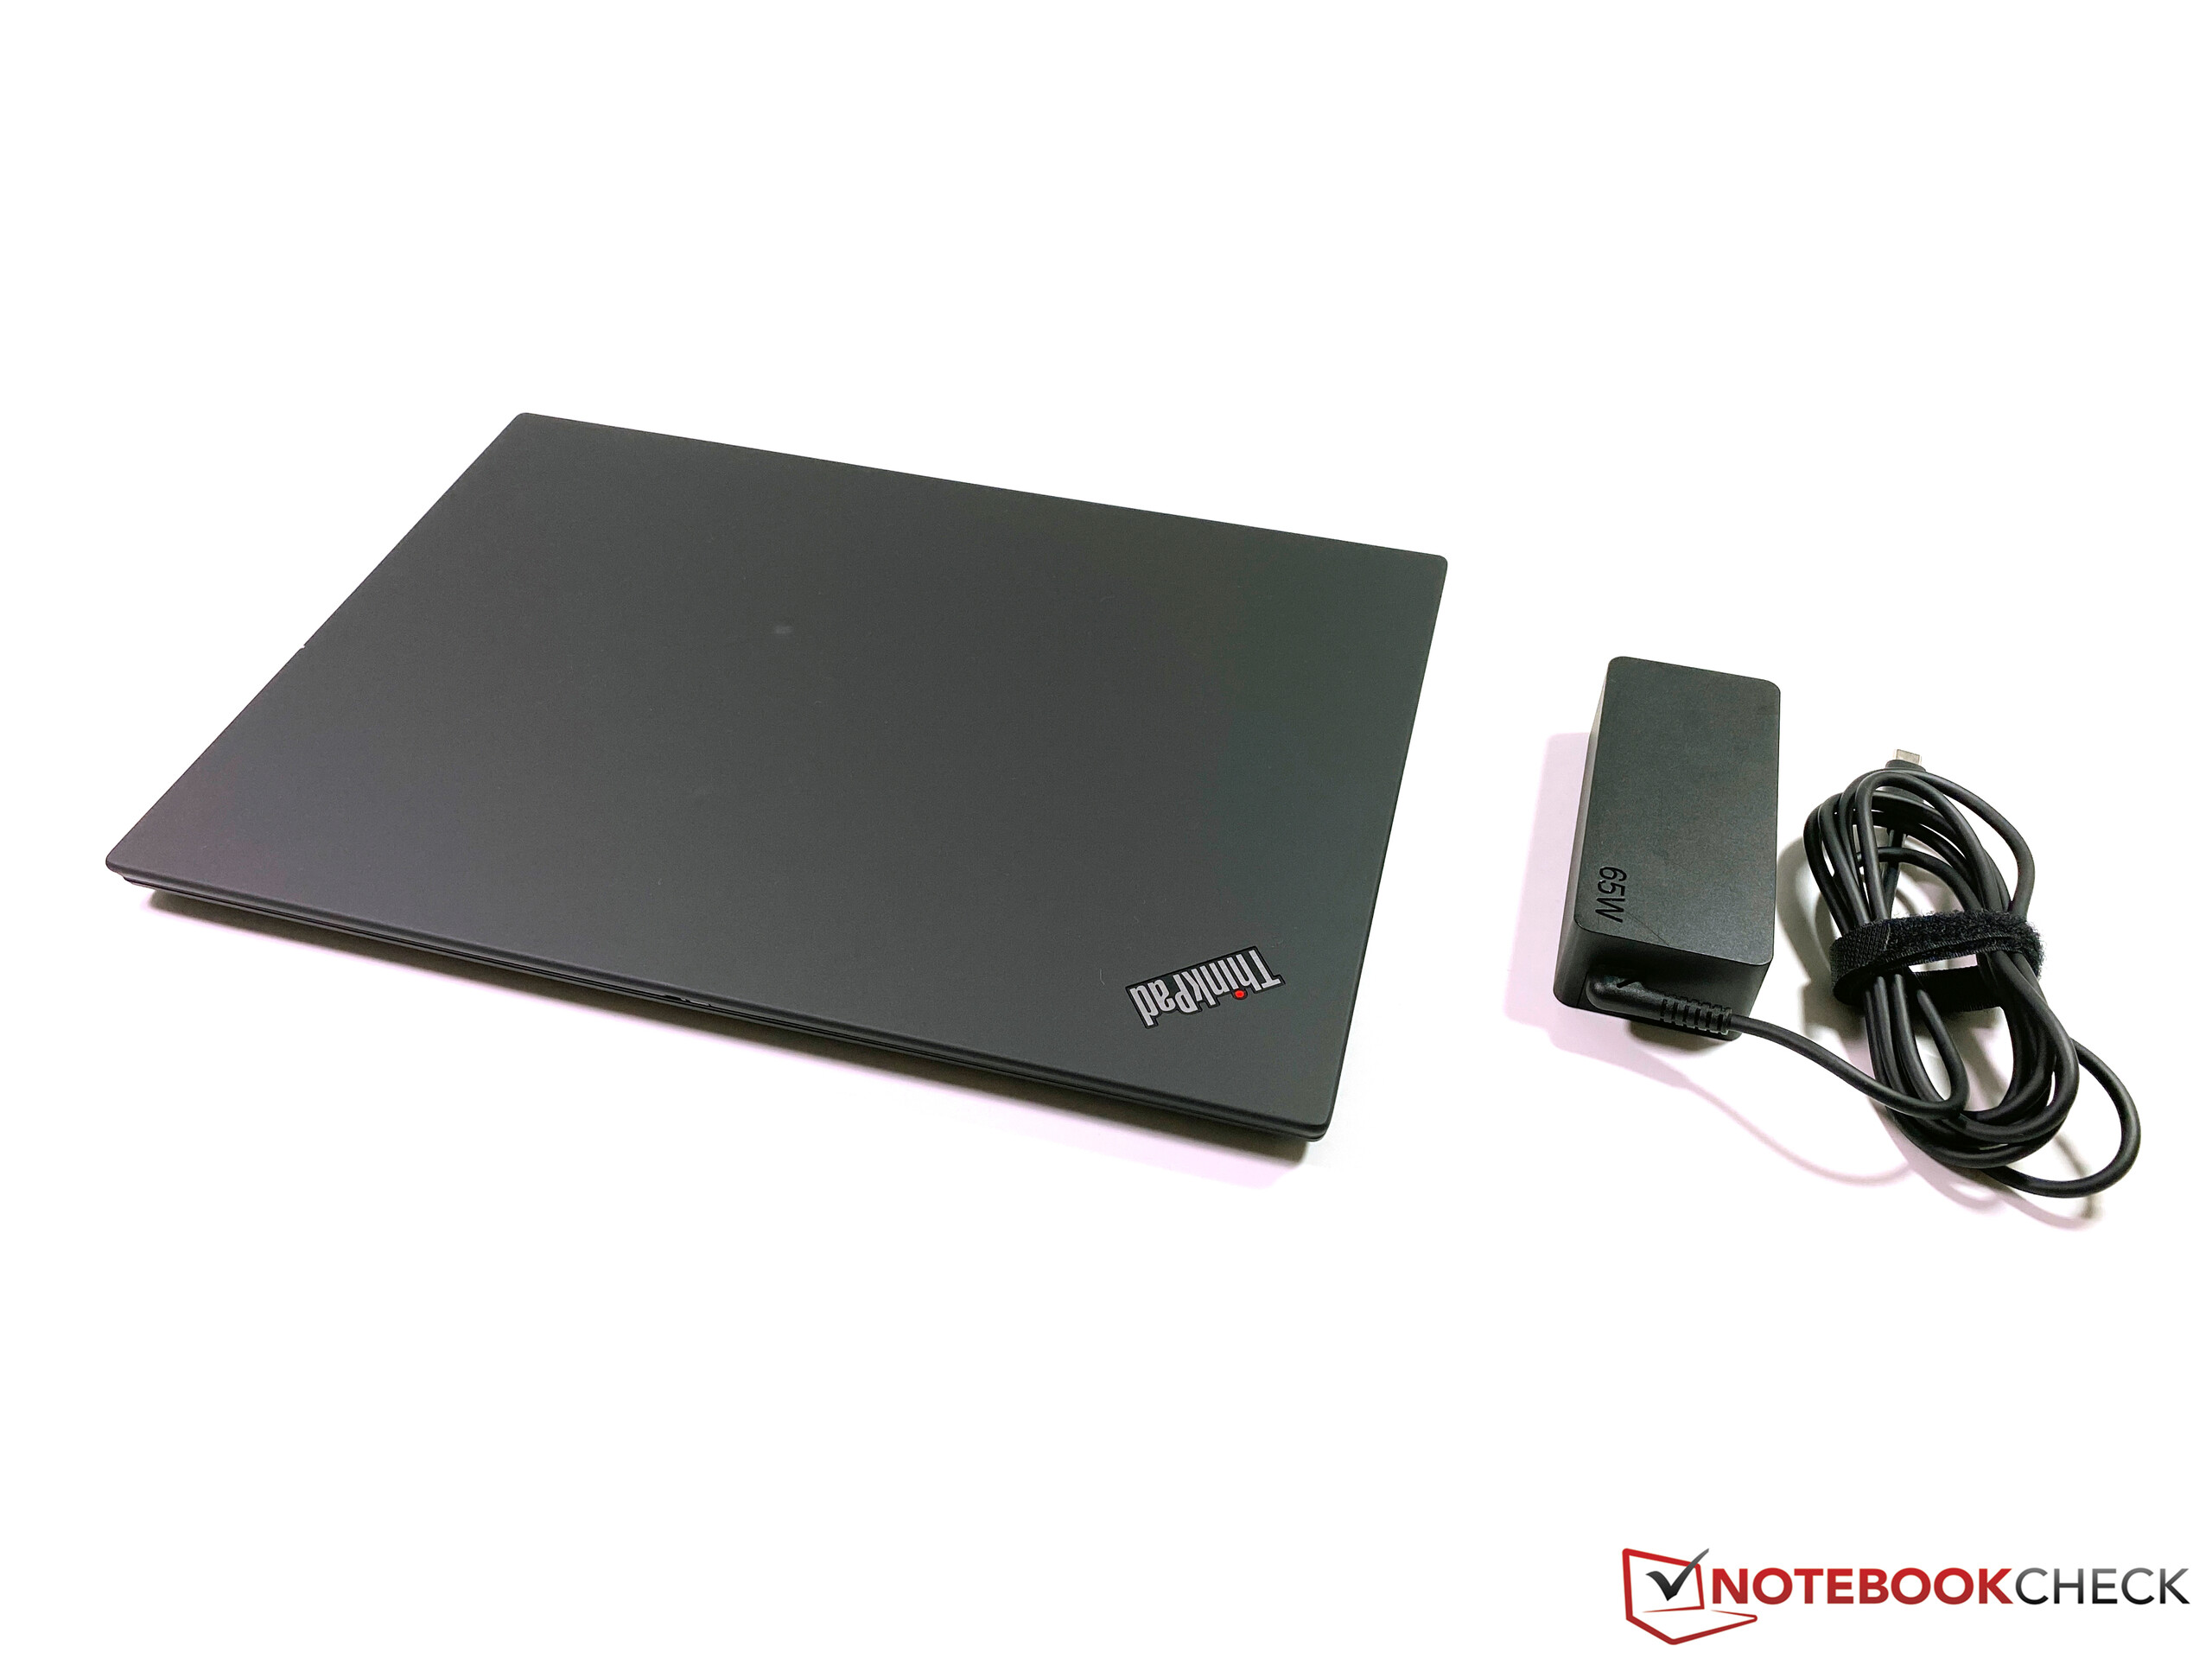
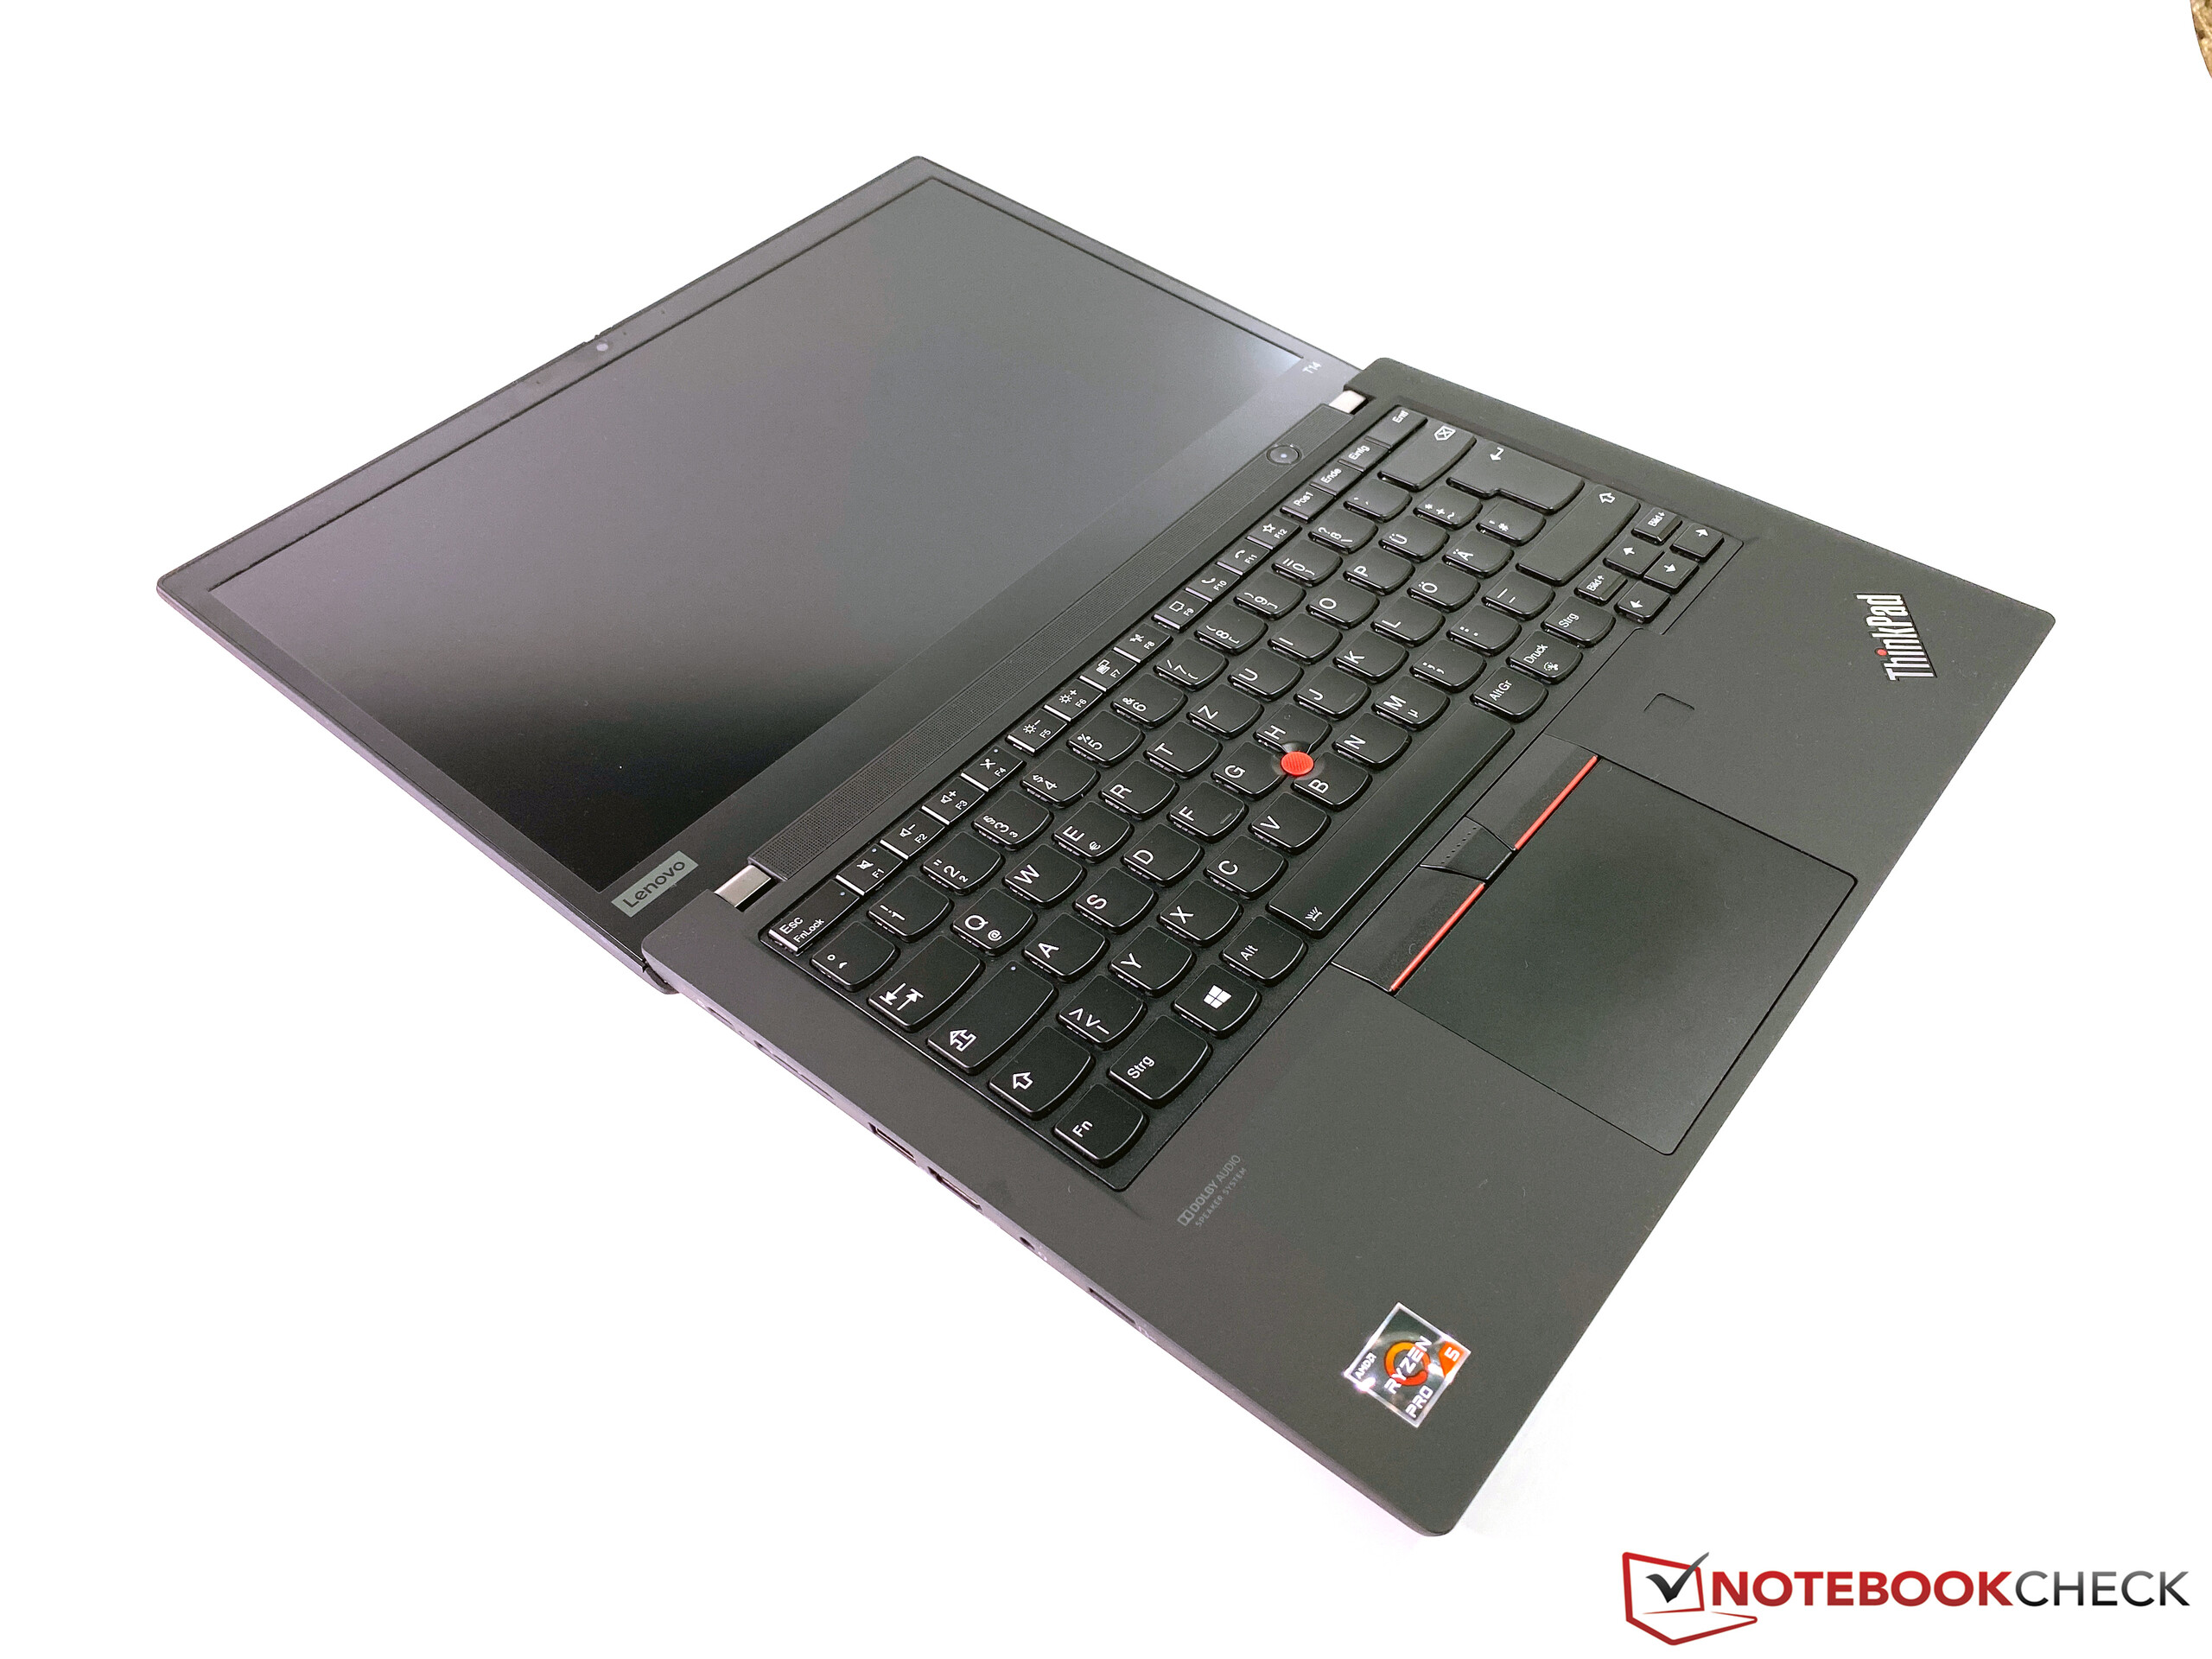
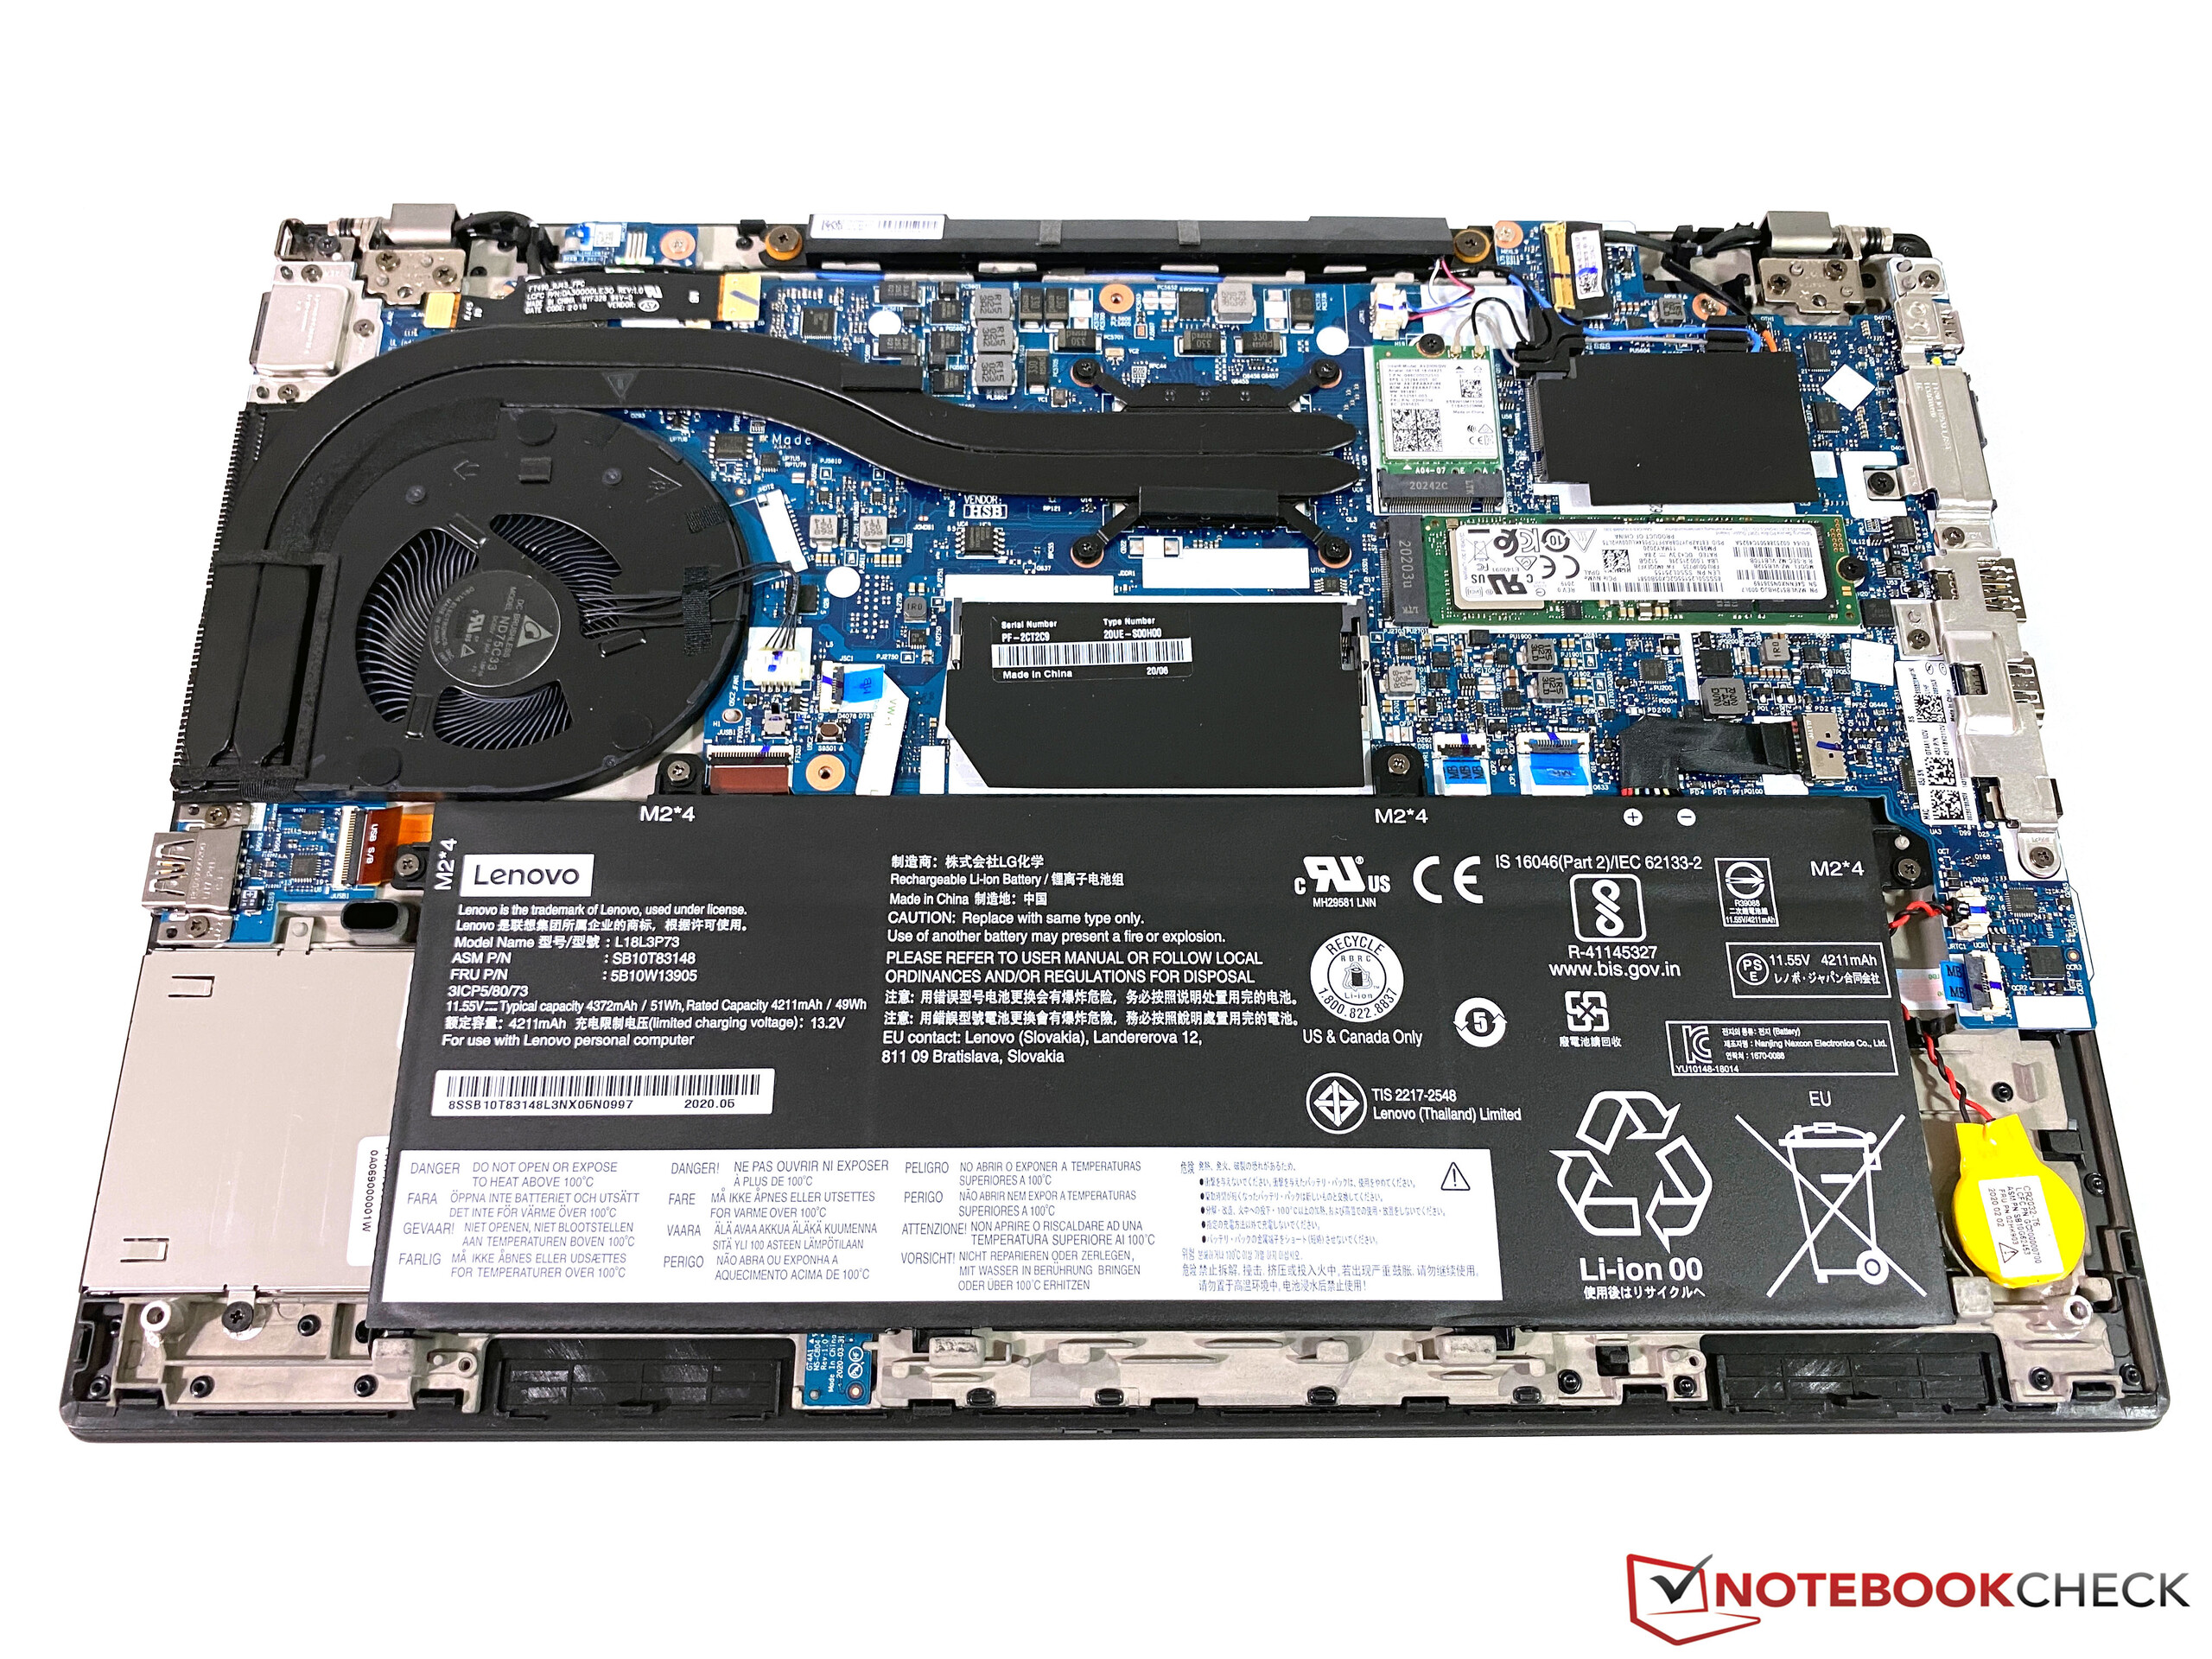
Durum - AMD ve Intel T14 aynıdır
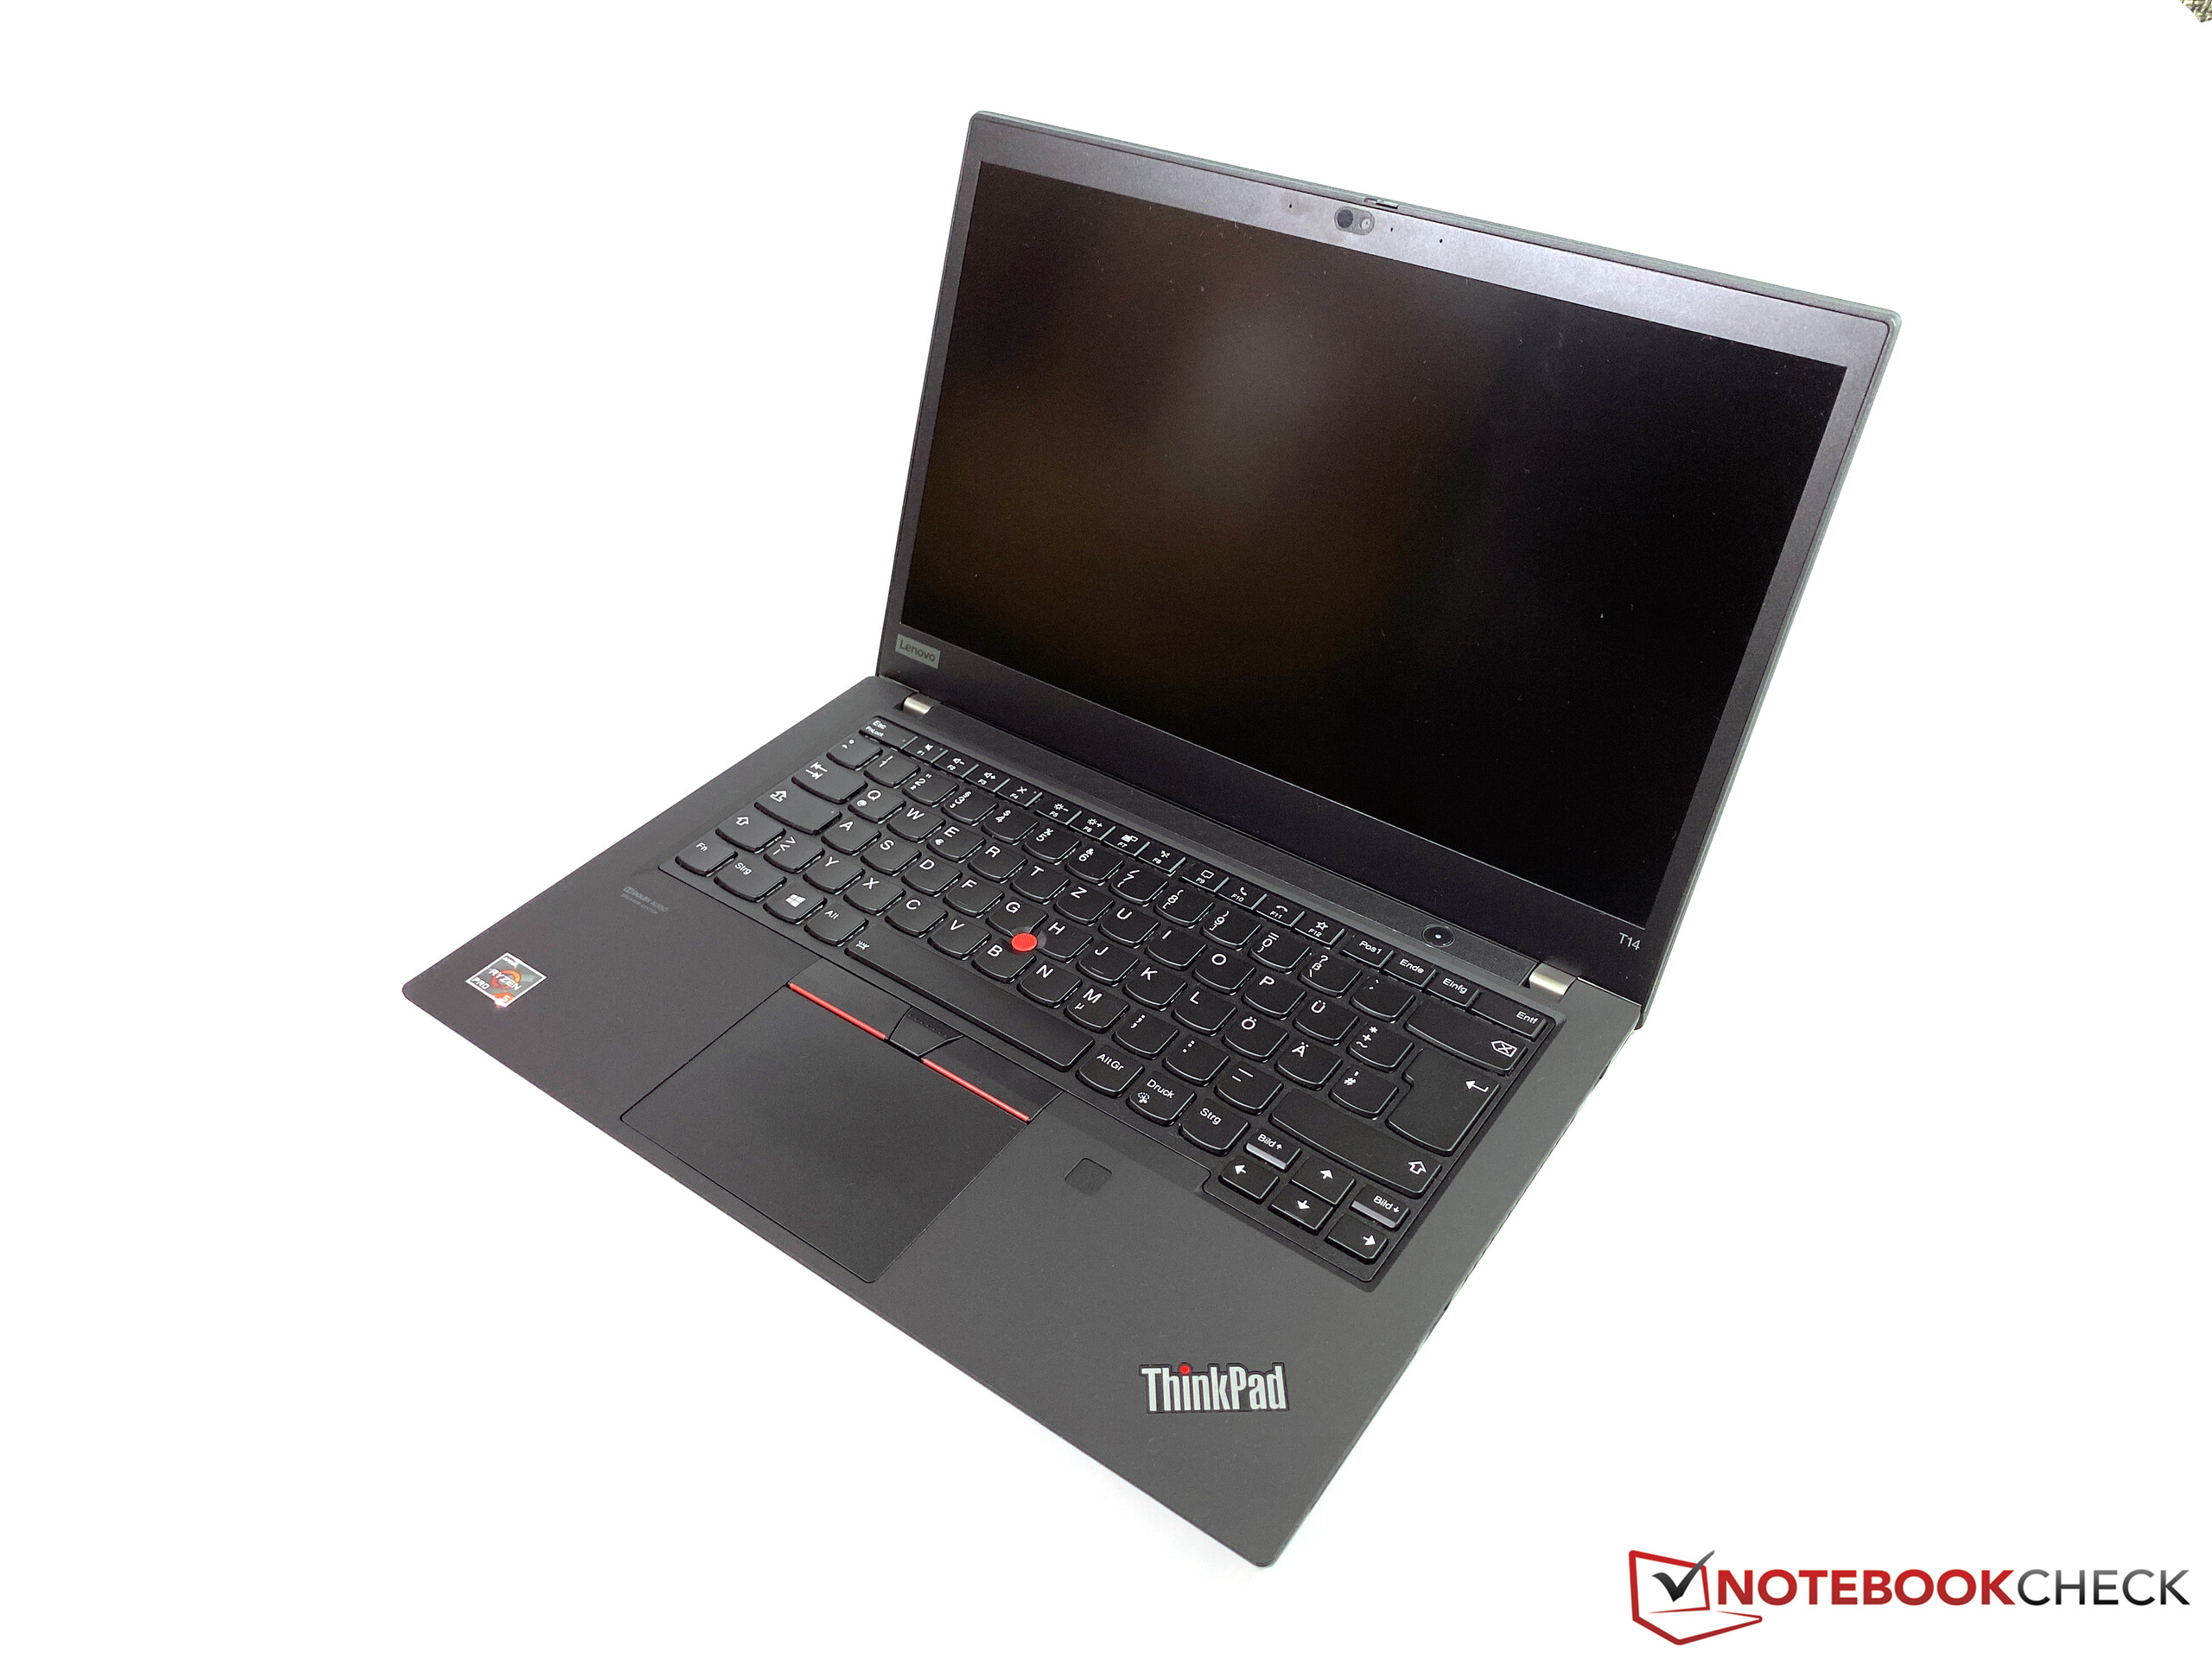
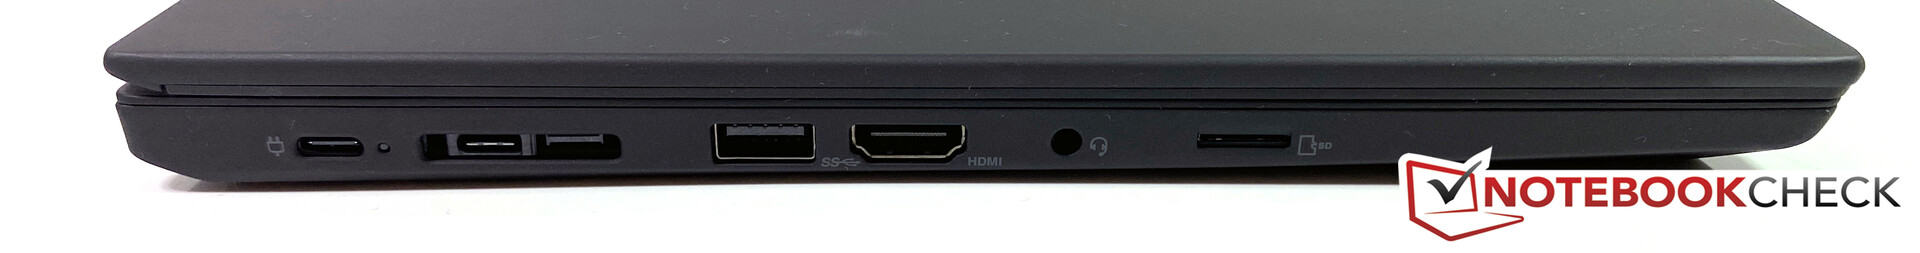
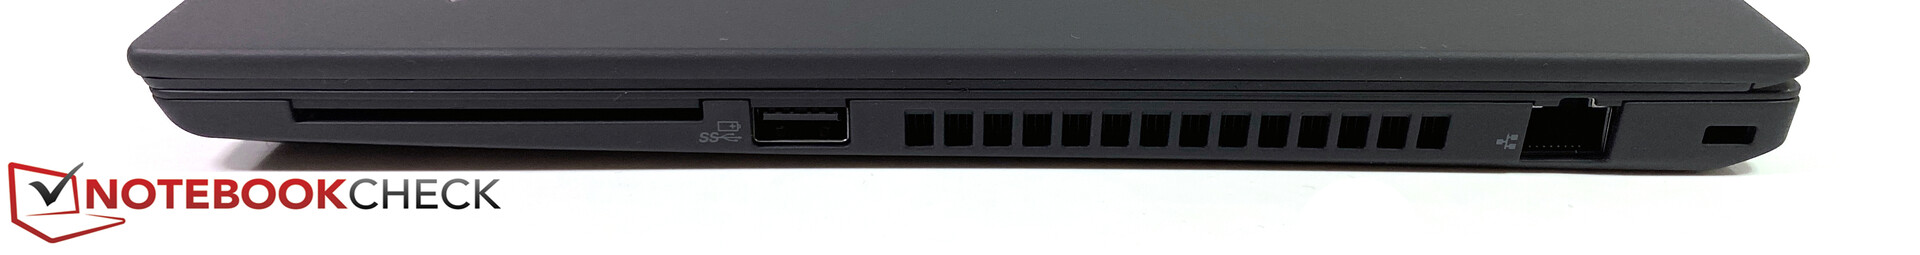
Bağlantı - TB3 olmadan ancak HDMI 2.0 ile T14 AMD
AMD tabanlı ThinkPad T14, Thunderbolt 3'ü desteklemez, ancak iki USB-C bağlantı noktası (USB 3.1 Gen.2, 10 Gb / s) yine de cihazı şarj etmek ve harici ekranlar eklemek için kullanılabilir (DisplayPort 1.4 Alt modu) . HDMI 2.0 çıkışı, Intel modeline göre başka bir avantajdır, bu nedenle 4K ekranlar 60 Hz'de çalıştırılabilir.
| SD Card Reader | |
| average JPG Copy Test (av. of 3 runs) | |
| Dell Latitude 14 5410-RJ80D (Toshiba Exceria Pro M501 microSDXC 64GB) | |
| Lenovo ThinkPad T14-20UES00H00 (Toshiba Exceria Pro M501 64 GB UHS-II) | |
| Lenovo ThinkPad T14s-20UJS00K00 (Toshiba Exceria Pro M501 64 GB UHS-II) | |
| Sınıf ortalaması Office (19.8 - 198.5, n=22, son 2 yıl) | |
| maximum AS SSD Seq Read Test (1GB) | |
| Dell Latitude 14 5410-RJ80D (Toshiba Exceria Pro M501 microSDXC 64GB) | |
| Lenovo ThinkPad T14s-20UJS00K00 (Toshiba Exceria Pro M501 64 GB UHS-II) | |
| Lenovo ThinkPad T14-20UES00H00 (Toshiba Exceria Pro M501 64 GB UHS-II) | |
| Sınıf ortalaması Office (27.4 - 249, n=21, son 2 yıl) | |
| Networking | |
| iperf3 transmit AX12 | |
| Dell Latitude 14 5410-RJ80D | |
| Lenovo ThinkPad T14s-20UJS00K00 | |
| HP EliteBook 845 G7-23Y60EA | |
| Ortalama Intel Wi-Fi 6 AX200 (447 - 1645, n=127) | |
| Lenovo ThinkPad T14-20S1S06B00 | |
| Lenovo ThinkPad T14-20UES00H00 | |
| iperf3 receive AX12 | |
| Lenovo ThinkPad T14-20S1S06B00 | |
| Lenovo ThinkPad T14s-20UJS00K00 | |
| Dell Latitude 14 5410-RJ80D | |
| HP EliteBook 845 G7-23Y60EA | |
| Ortalama Intel Wi-Fi 6 AX200 (523 - 1684, n=128) | |
| Lenovo ThinkPad T14-20UES00H00 | |


Ekran - Tanıdık 1080p Ekran
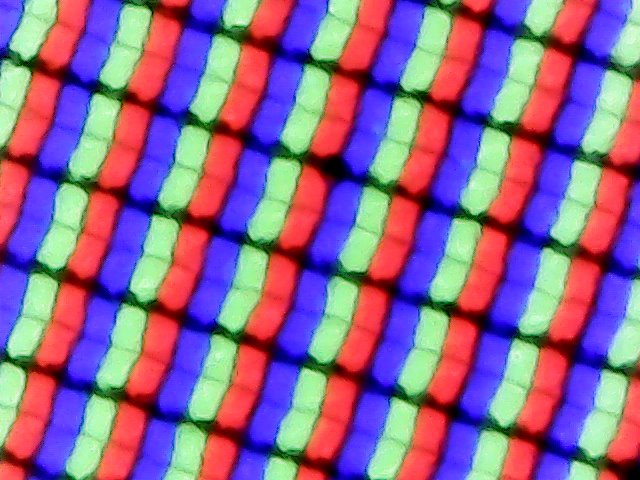
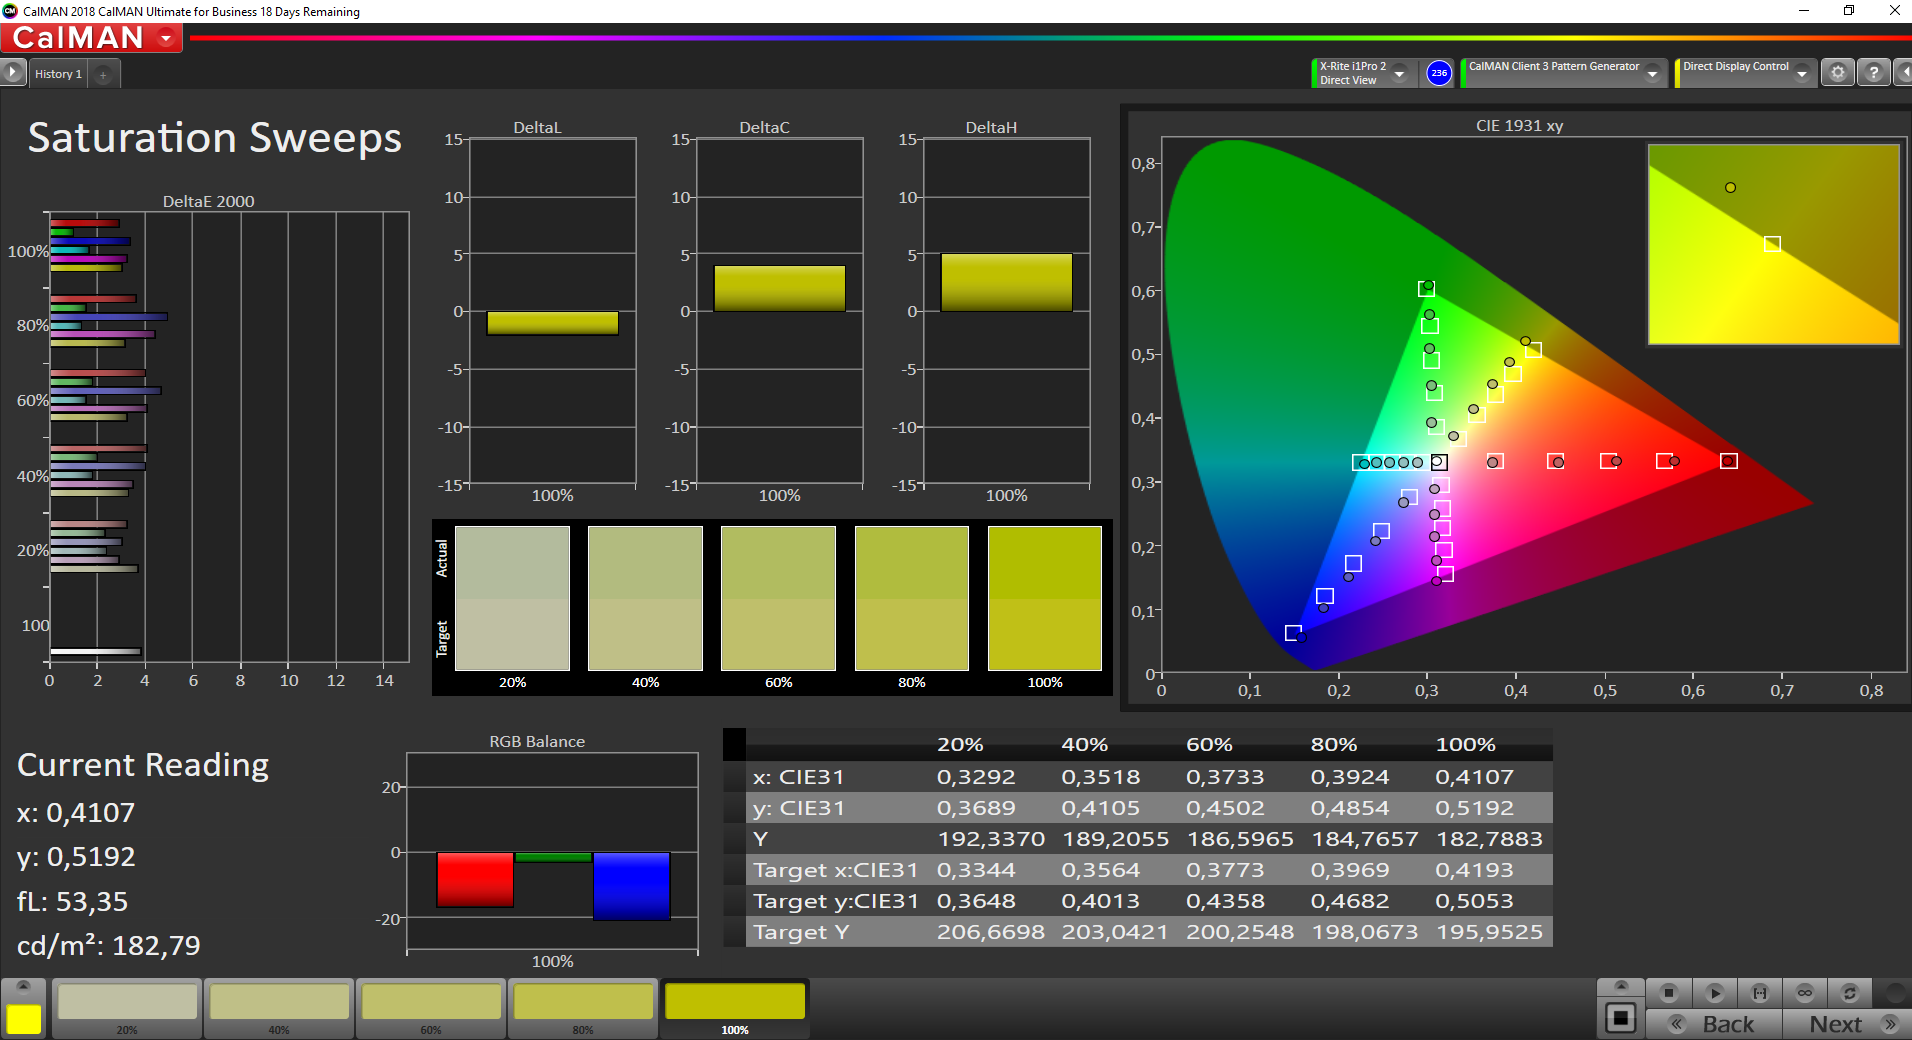
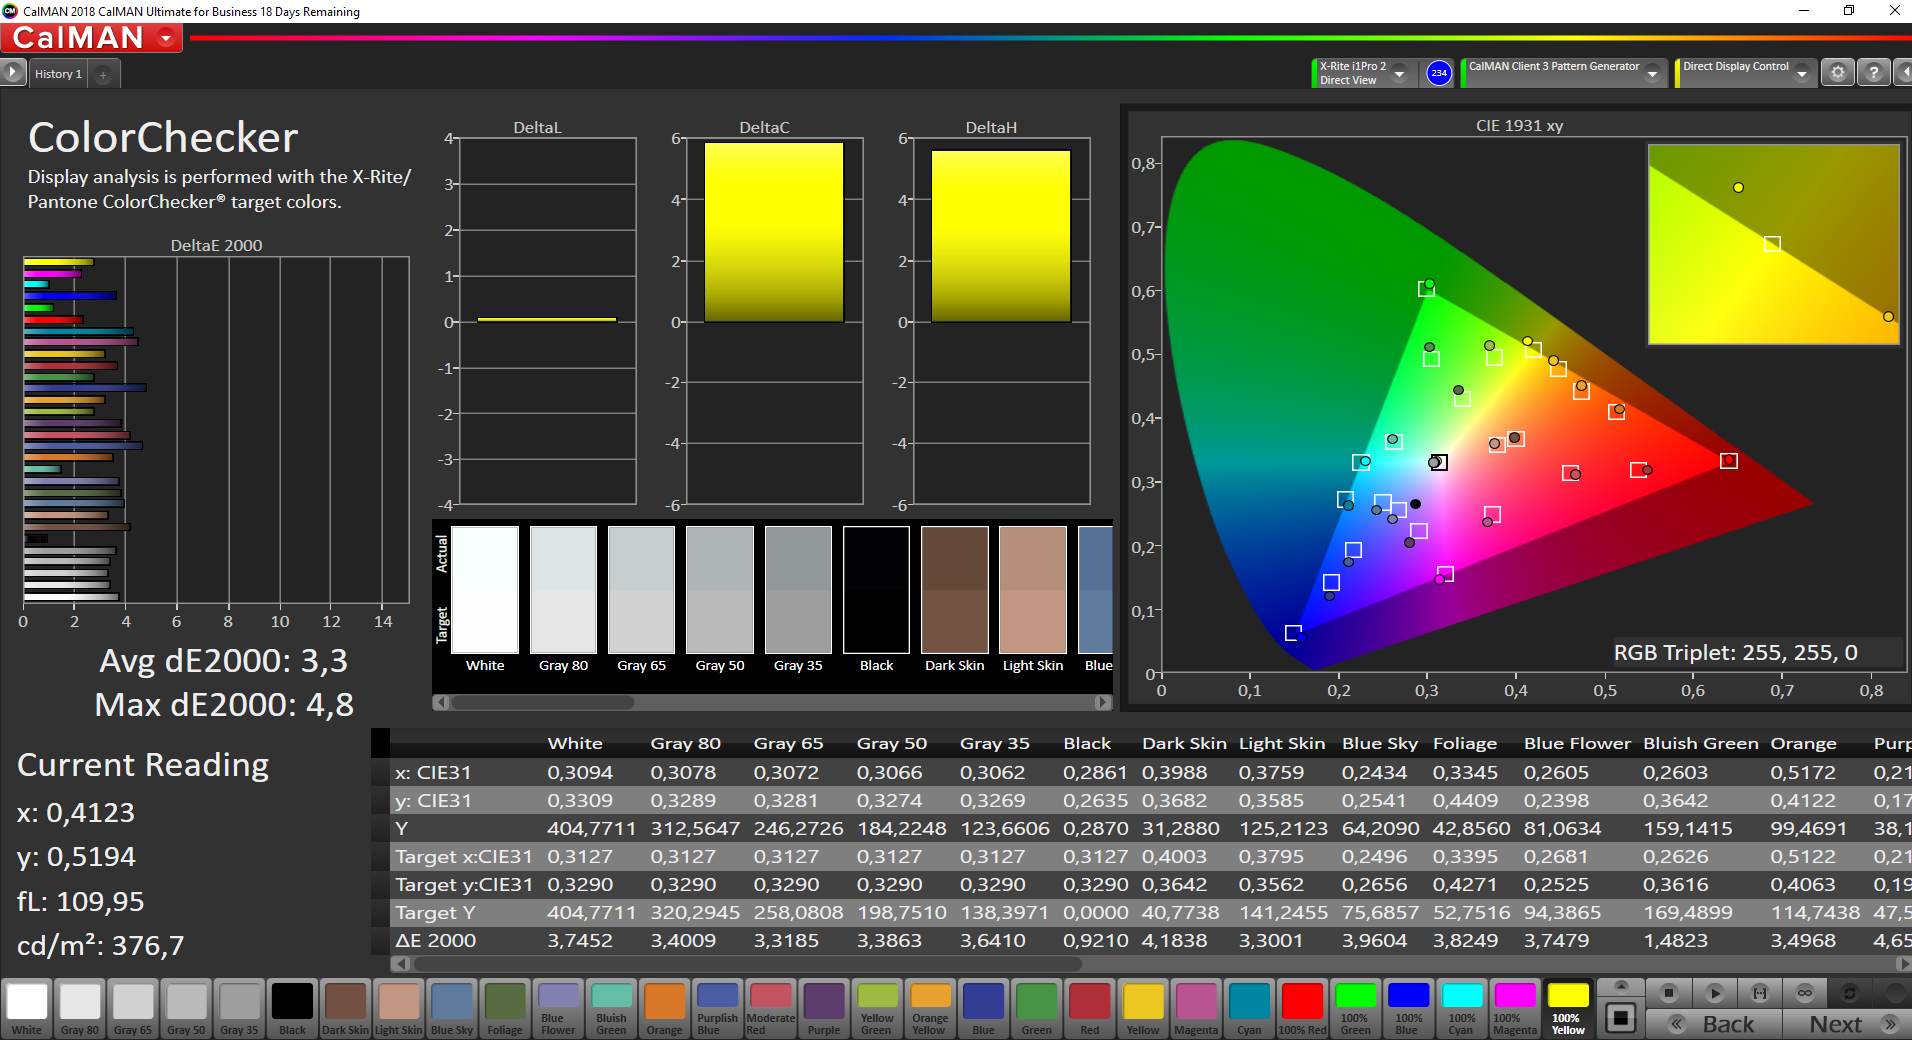
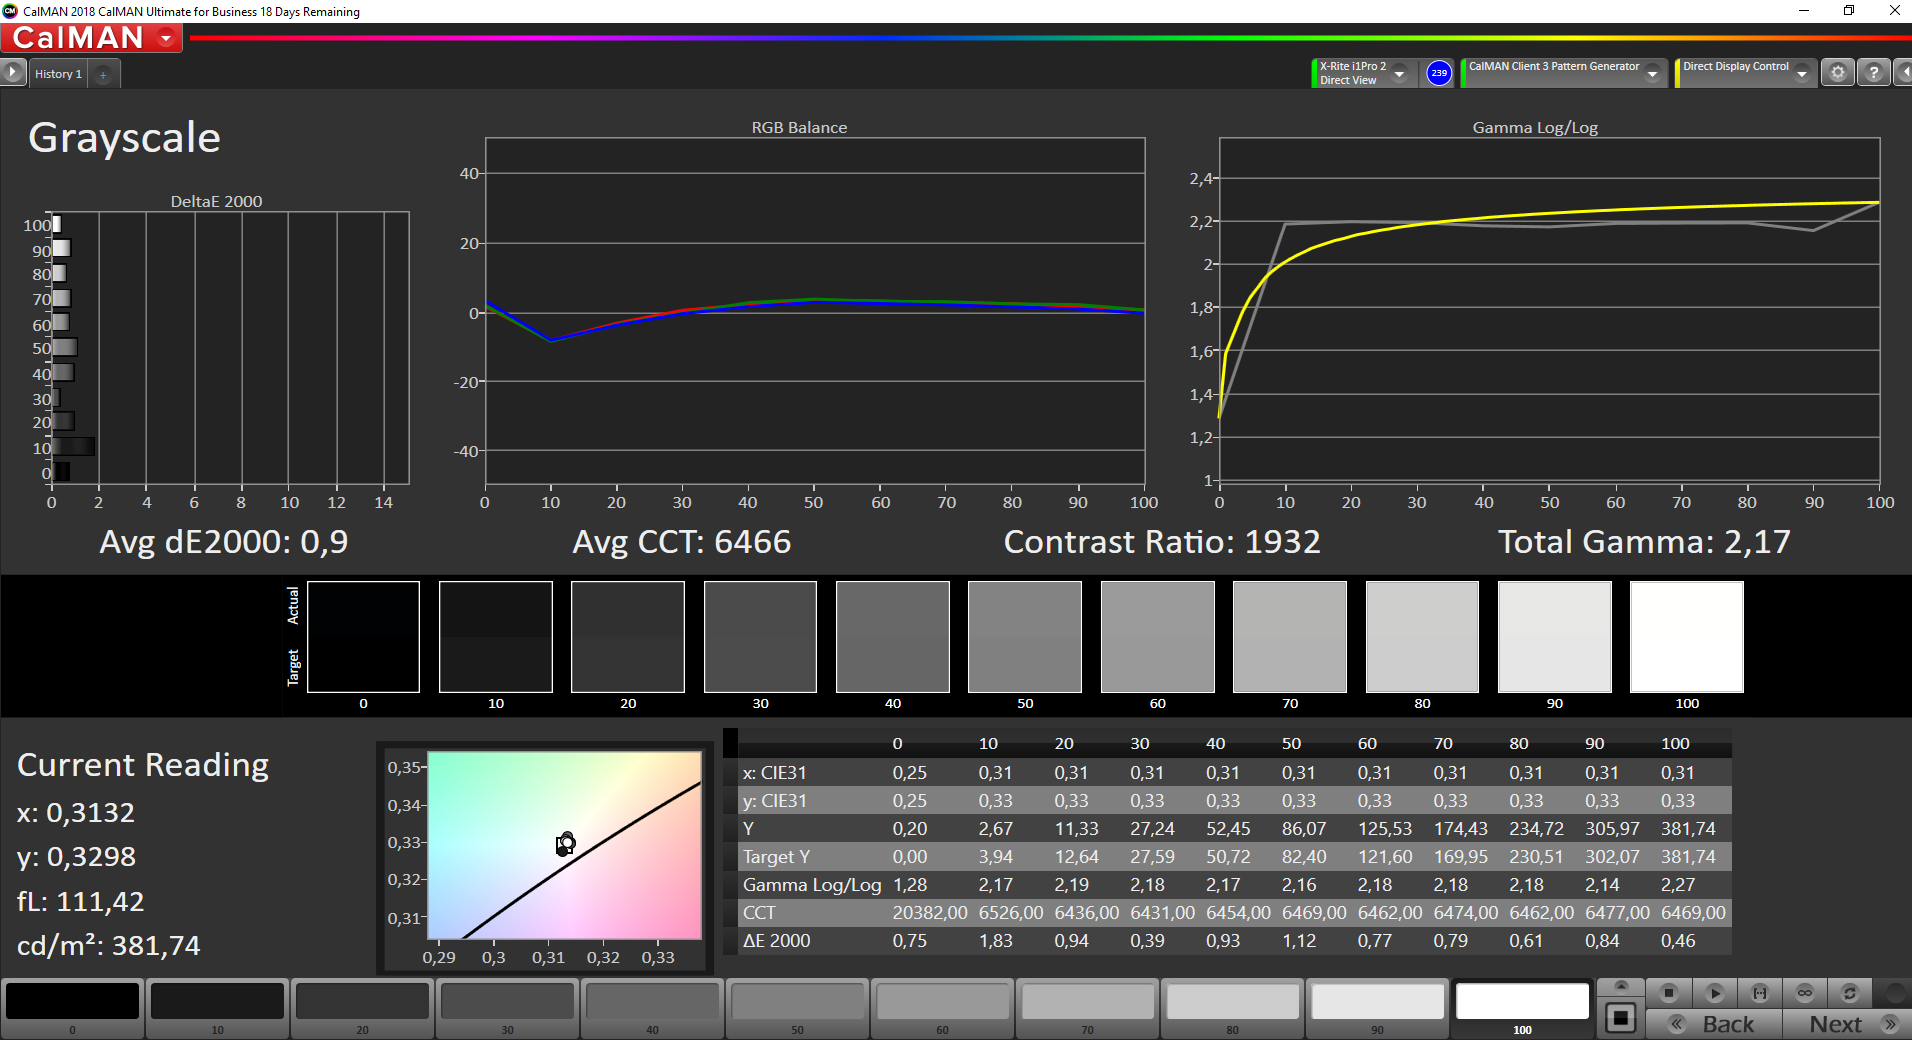
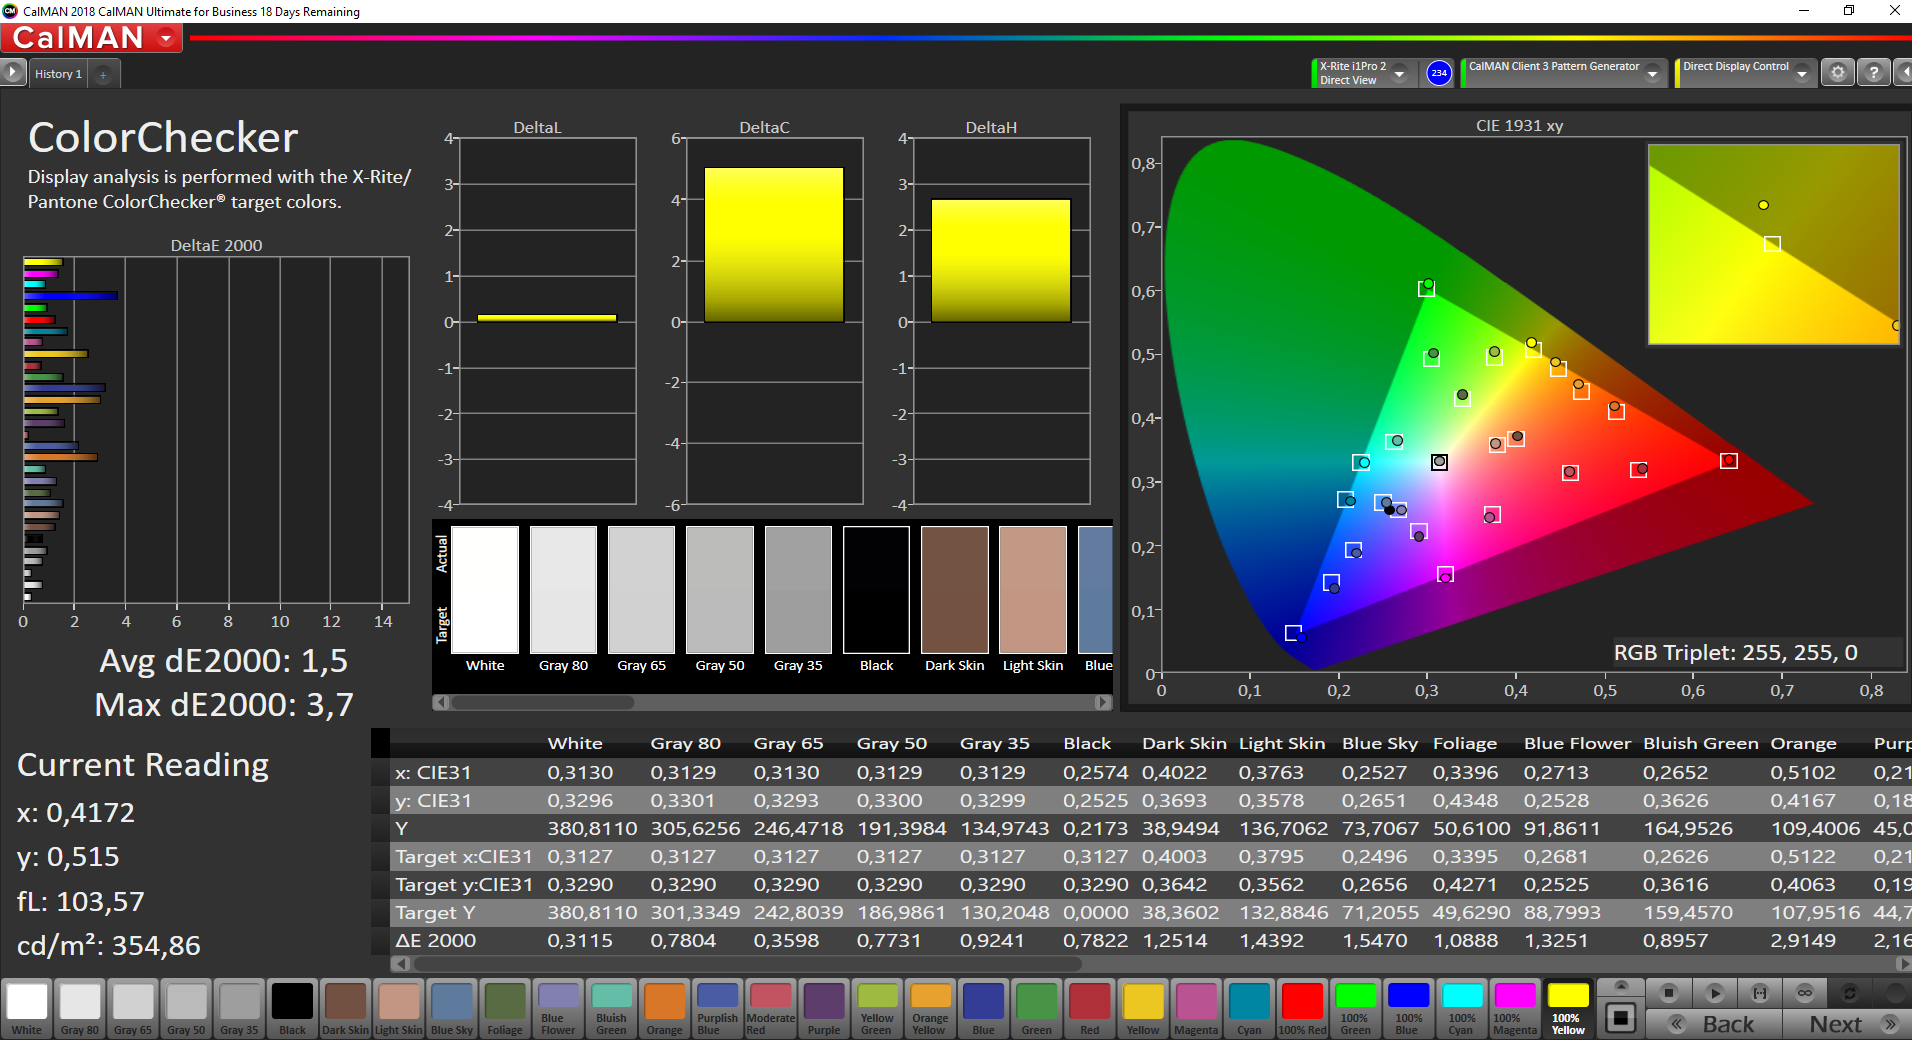
Mat LowPower 1080p ekranı (1920x1080 piksel) çok sayıda 14 inç ThinkPad'de inceledik. Lenovo, dört farklı tedarikçinin panellerini kullanıyor ve geçmişte dört modeli zaten karşılaştırmıştık. Müşteriler, satın almadan önce panel seçimini etkileyemez. Aynı paneli ThinkPad T14 Intel'de zaten test ettik, bu nedenle bu noktada işleri kısa tutmak istiyoruz. Öznel resim izlenimi çok iyi ve parlak yüzeyler bile çok grenli görünmüyor. Parlaklık, siyah değeri ve kontrast oranı için sonuçlar bir iş dizüstü bilgisayarı için çok iyidir ve ayrıca test ettiğimiz HP ve Dell'in rakiplerinden üstündür. PWM titremesini tespit edemiyoruz, ancak ekranda gözle görülür gölgelenme ile yavaş tepki süreleri oluyor. Renk doğruluğu kutudan çıkar çıkmaz çok iyidir, ancak ekranı resim düzenleme için kullanmak istiyorsanız yine de kalibrasyonu öneririz. Mat panel, yüksek parlaklık sayesinde dış mekanda gerçekten iyi çalışıyor. Ekran seçimi, iki ThinkPad sürümü (Intel / AMD) için neredeyse aynıdır ve yalnızca parlak 4K ekran Intel T14 için ayrılmıştır. Bununla birlikte, parlak bir 4K ekranın zaten bir iş dizüstü bilgisayarı için en iyi seçenek olduğunu düşünmüyoruz.
| |||||||||||||||||||||||||
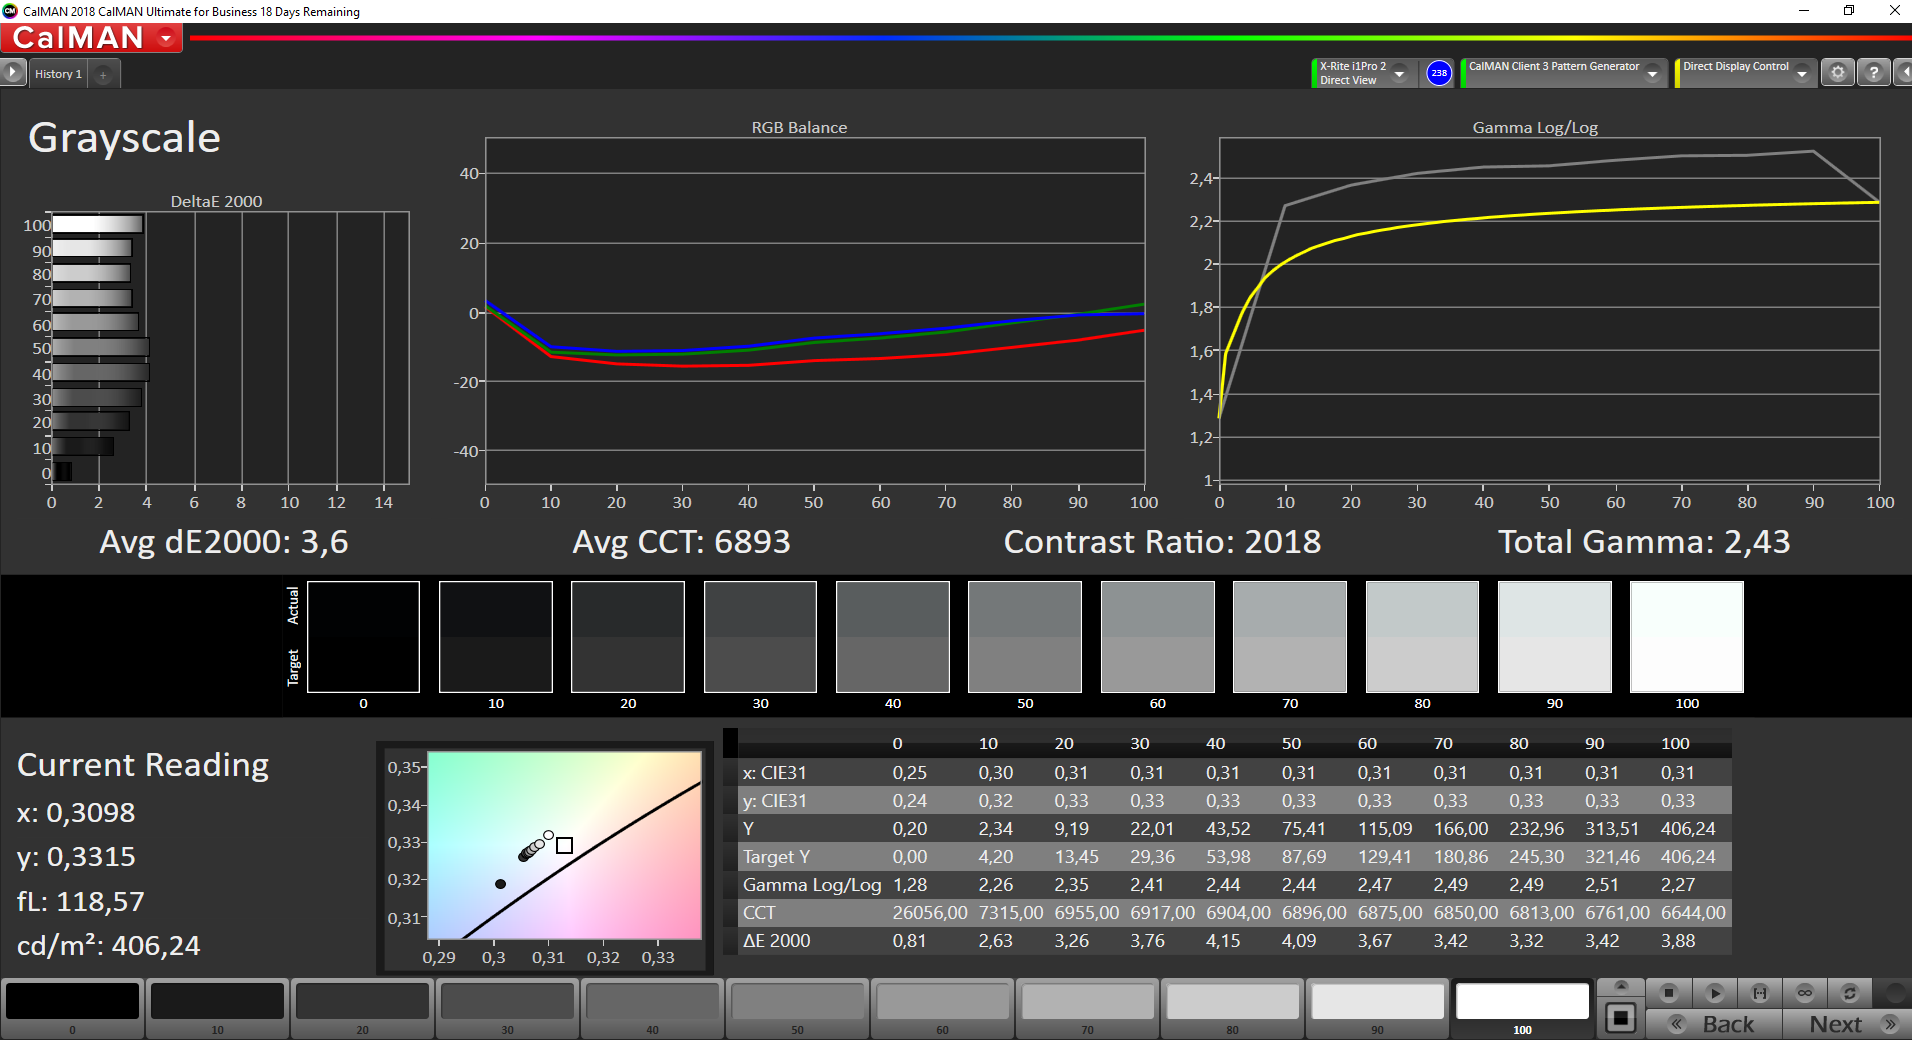
Aydınlatma: 88 %
Batarya modunda parlaklık: 409 cd/m²
Kontrast: 2030:1 (Siyah: 0.2 cd/m²)
ΔE ColorChecker Calman: 3.3 | ∀{0.5-29.43 Ø4.73}
calibrated: 1.5
ΔE Greyscale Calman: 3.6 | ∀{0.09-98 Ø4.97}
95.5% sRGB (Argyll 1.6.3 3D)
61.5% AdobeRGB 1998 (Argyll 1.6.3 3D)
67.2% AdobeRGB 1998 (Argyll 3D)
95.8% sRGB (Argyll 3D)
66.1% Display P3 (Argyll 3D)
Gamma: 2.43
CCT: 6893 K
| Lenovo ThinkPad T14-20UES00H00 B140HAN05.7, IPS, 1920x1080, 14" | HP EliteBook 845 G7-23Y60EA LG Philips LGD064E, IPS, 1920x1080, 14" | Dell Latitude 14 5410-RJ80D BOE NV14N4F, a-Si IPS LED, 1920x1080, 14" | Lenovo ThinkPad T14s-20UJS00K00 N140HCG-GQ2, IPS , 1920x1080, 14" | Lenovo ThinkPad T14-20S1S06B00 B140HAN05.7, LTPS IPS LED, 1920x1080, 14" | |
|---|---|---|---|---|---|
| Display | -43% | -40% | 2% | 0% | |
| Display P3 Coverage (%) | 66.1 | 36.76 -44% | 39.02 -41% | 66.8 1% | 66 0% |
| sRGB Coverage (%) | 95.8 | 55.3 -42% | 58 -39% | 97.9 2% | 96.8 1% |
| AdobeRGB 1998 Coverage (%) | 67.2 | 37.98 -43% | 40.32 -40% | 69 3% | 67.1 0% |
| Response Times | 32% | 10% | 49% | 10% | |
| Response Time Grey 50% / Grey 80% * (ms) | 64 ? | 37 ? 42% | 46 ? 28% | 32.4 ? 49% | 58.4 ? 9% |
| Response Time Black / White * (ms) | 29.6 ? | 23 ? 22% | 32 ? -8% | 15.2 ? 49% | 26.4 ? 11% |
| PWM Frequency (Hz) | 1000 ? | 26040 ? | |||
| Screen | -37% | -61% | 7% | -2% | |
| Brightness middle (cd/m²) | 406 | 227 -44% | 235 -42% | 404 0% | 397 -2% |
| Brightness (cd/m²) | 403 | 220 -45% | 219 -46% | 371 -8% | 394 -2% |
| Brightness Distribution (%) | 88 | 82 -7% | 81 -8% | 88 0% | 90 2% |
| Black Level * (cd/m²) | 0.2 | 0.18 10% | 0.21 -5% | 0.34 -70% | 0.2 -0% |
| Contrast (:1) | 2030 | 1261 -38% | 1119 -45% | 1188 -41% | 1985 -2% |
| Colorchecker dE 2000 * | 3.3 | 4.1 -24% | 6.11 -85% | 1.4 58% | 3.6 -9% |
| Colorchecker dE 2000 max. * | 4.8 | 7.06 -47% | 16.6 -246% | 3.2 33% | 5.9 -23% |
| Colorchecker dE 2000 calibrated * | 1.5 | 4.04 -169% | 0.8 47% | 1.2 20% | |
| Greyscale dE 2000 * | 3.6 | 1.99 45% | 5.52 -53% | 1.6 56% | 3.9 -8% |
| Gamma | 2.43 91% | 2.48 89% | 2.33 94% | 2.13 103% | 2.48 89% |
| CCT | 6893 94% | 6607 98% | 6680 97% | 6480 100% | 7090 92% |
| Color Space (Percent of AdobeRGB 1998) (%) | 61.5 | 35 -43% | 37 -40% | 63 2% | 61.4 0% |
| Color Space (Percent of sRGB) (%) | 95.5 | 55 -42% | 58 -39% | 97.9 3% | 96.6 1% |
| Toplam Ortalama (Program / Ayarlar) | -16% /
-29% | -30% /
-47% | 19% /
12% | 3% /
-0% |
* ... daha küçük daha iyidir

Yanıt Sürelerini Görüntüle
| ↔ Tepki Süresi Siyahtan Beyaza | ||
|---|---|---|
| 29.6 ms ... yükseliş ↗ ve sonbahar↘ birleşimi | ↗ 13.2 ms yükseliş | 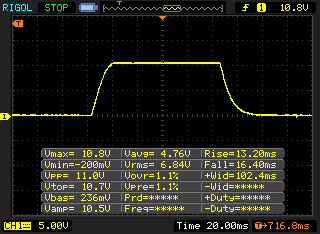 |
| ↘ 16.4 ms sonbahar | ||
| Ekran, testlerimizde nispeten yavaş yanıt oranları gösteriyor ve oyuncular için çok yavaş olabilir. Karşılaştırıldığında, test edilen tüm cihazlar 0.1 (minimum) ile 240 (maksimum) ms arasında değişir. » Tüm cihazların 79 %'si daha iyi. Bu, ölçülen yanıt süresinin test edilen tüm cihazların ortalamasından (19.9 ms) daha kötü olduğu anlamına gelir. | ||
| ↔ Tepki Süresi %50 Griden %80 Griye | ||
| 64 ms ... yükseliş ↗ ve sonbahar↘ birleşimi | ↗ 30.8 ms yükseliş | 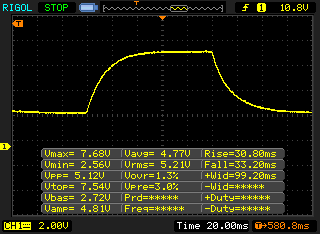 |
| ↘ 33.2 ms sonbahar | ||
| Ekran, testlerimizde yavaş yanıt oranları gösteriyor ve oyuncular için yetersiz olacaktır. Karşılaştırıldığında, test edilen tüm cihazlar 0.165 (minimum) ile 636 (maksimum) ms arasında değişir. » Tüm cihazların 97 %'si daha iyi. Bu, ölçülen yanıt süresinin test edilen tüm cihazların ortalamasından (31.1 ms) daha kötü olduğu anlamına gelir. | ||
Ekran Titremesi / PWM (Darbe Genişliği Modülasyonu)
| Ekran titriyor / PWM algılanmadı |  | ||
Karşılaştırıldığında: Test edilen tüm cihazların %52 %'si ekranı karartmak için PWM kullanmıyor. PWM tespit edilirse, ortalama 7791 (minimum: 5 - maksimum: 343500) Hz ölçüldü. | |||
Performans - 6 çekirdekli AMD Ryzen Pro ile ThinkPad
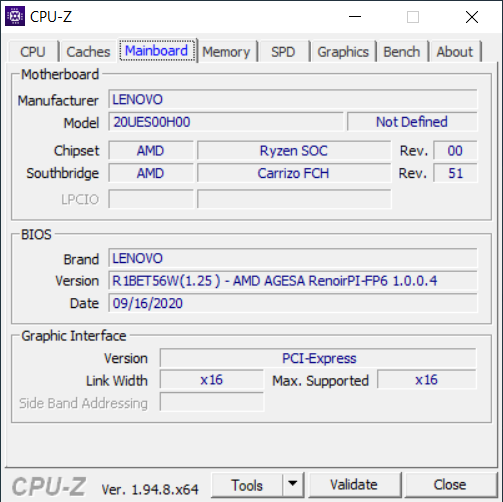
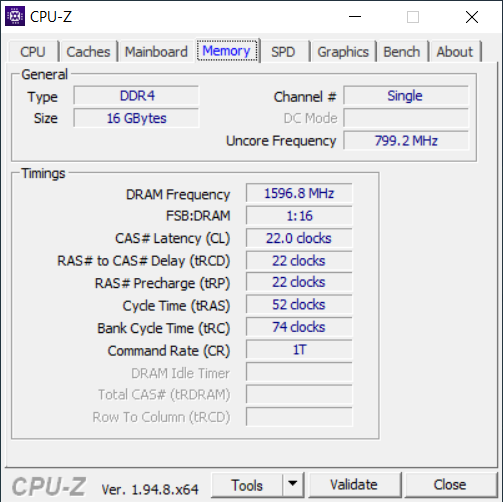
ThinkPad T14'ün önceden yapılandırılmış modellerinin çoğu, tek kanallı RAM ile gönderilir. Ancak ek SODIMM yuvası sayesinde belleği yükseltmek oldukça kolaydır ve özellikle iGPU için gözle görülür bir performans avantajı sağlayabilir. Testlerimiz ve derecelendirmemiz için tek kanallı yapılandırmayı kullandık, ancak bazı bölümlerde ikinci bir RAM modülüne (bu durumda Crucial'dan 16 GB DDR4-3200) sahip çift kanallı bir yapılandırma ile sonuçları da dahil ettik.
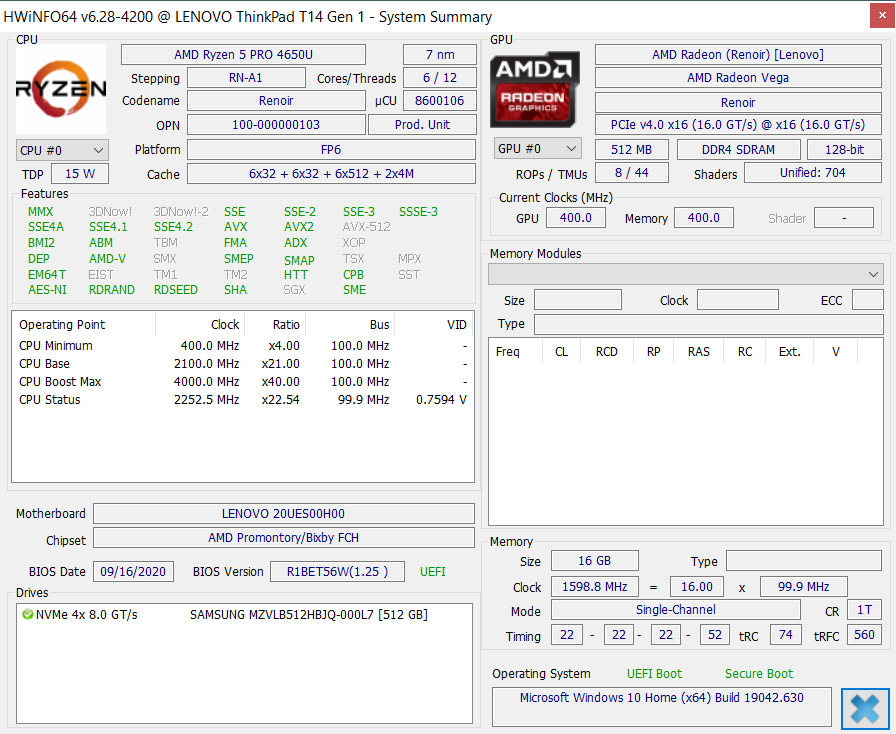
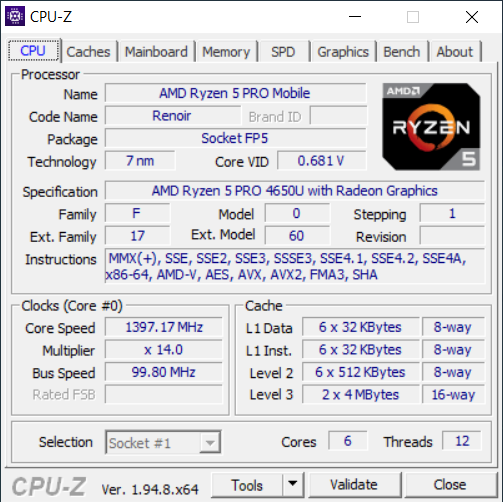
İşlemci - Ryzen 5 Pro ile T14
L veya E serisinin daha ucuz ThinkPad modelleriyle karşılaştırıldığında Lenovo, daha pahalı T serileri için Ryzen Pro CPU'ları kullanıyor. Bu Pro CPU'lar, Intel'in vPro teknolojisine benzer ek güvenlik özellikleri sunar. Ryzen 7 Pro 4750U'yu 8 çekirdekli alabilirsiniz, ancak test ünitemiz "sadece" 6 çekirdekli (12 iş parçacığı, 4.0 GHz'e kadar) daha yavaş Ryzen 5 Pro 4650U'yu alır. Lenovo, TDP sınırları açısından oldukça muhafazakar. 25 W (6x 3.1-3.2 GHz) kısa patlama ve 23 Watt (6x 3.0 GHz) sürekli değer ile T14. Intel T14 çok daha yüksek bir kısa vadeli tüketime sahiptir, ancak sonunda sadece ~ 17 W seviyesinde düşer. Daha ince T14s AMD biraz daha düşük sınırlara (25/18 W) sahiptir.
CPU performansı, biraz daha yüksek bir başlangıç TDP yapılandırmasından (30/23 W) yararlanan HP EliteBook 845 G7 ile hemen hemen aynıdır. Daha hızlı Ryzen 7 Pro'ya sahip ThinkPad T14s, çok çekirdekli kıyaslamalarda önde, ancak aynı işlemciye sahip T14, daha yüksek TDP limitleri sayesinde daha da hızlı olmalı. Intel rekabeti kolayca yeniliyor ve hala Tiger Lake işlemcili iş dizüstü bilgisayarlarını beklemek zorundayız. Şu anda AMD'nin işlemcileri çok daha iyi performans sunuyor. Genel olarak, "daha küçük" Ryzen 5 Pro bile mükemmel bir izlenim bırakıyor ve bir mobil iş dizüstü bilgisayarı için bol miktarda performans sunuyor. CPU performansı pil gücünde azalmaz.
Cinebench R15: CPU Single 64Bit | CPU Multi 64Bit
Blender: v2.79 BMW27 CPU
7-Zip 18.03: 7z b 4 -mmt1 | 7z b 4
Geekbench 5.5: Single-Core | Multi-Core
HWBOT x265 Benchmark v2.2: 4k Preset
LibreOffice : 20 Documents To PDF
R Benchmark 2.5: Overall mean
| Cinebench R20 / CPU (Single Core) | |
| Sınıf ortalaması Office (345 - 816, n=73, son 2 yıl) | |
| Lenovo ThinkPad T14s-20UJS00K00 | |
| HP EliteBook 845 G7-23Y60EA | |
| Ortalama AMD Ryzen 5 PRO 4650U (453 - 454, n=4) | |
| Lenovo ThinkPad T14-20UES00H00 | |
| Dell Latitude 14 5410-RJ80D | |
| Lenovo ThinkPad T14-20S1S06B00 | |
| Lenovo ThinkPad T495-20NKS01Y00 | |
| Cinebench R20 / CPU (Multi Core) | |
| Sınıf ortalaması Office (648 - 8840, n=73, son 2 yıl) | |
| Lenovo ThinkPad T14s-20UJS00K00 | |
| HP EliteBook 845 G7-23Y60EA | |
| Ortalama AMD Ryzen 5 PRO 4650U (2561 - 2692, n=4) | |
| Lenovo ThinkPad T14-20UES00H00 | |
| Dell Latitude 14 5410-RJ80D | |
| Lenovo ThinkPad T14-20S1S06B00 | |
| Lenovo ThinkPad T495-20NKS01Y00 | |
| Cinebench R15 / CPU Single 64Bit | |
| Sınıf ortalaması Office (99.5 - 312, n=75, son 2 yıl) | |
| Lenovo ThinkPad T14s-20UJS00K00 | |
| Lenovo ThinkPad T14-20UES00H00 | |
| Ortalama AMD Ryzen 5 PRO 4650U (175 - 177, n=4) | |
| HP EliteBook 845 G7-23Y60EA | |
| Dell Latitude 14 5410-RJ80D | |
| Lenovo ThinkPad T14-20S1S06B00 | |
| Lenovo ThinkPad T495-20NKS01Y00 | |
| Cinebench R15 / CPU Multi 64Bit | |
| Sınıf ortalaması Office (250 - 3380, n=75, son 2 yıl) | |
| Lenovo ThinkPad T14s-20UJS00K00 | |
| HP EliteBook 845 G7-23Y60EA | |
| Ortalama AMD Ryzen 5 PRO 4650U (1123 - 1168, n=4) | |
| Lenovo ThinkPad T14-20UES00H00 | |
| Dell Latitude 14 5410-RJ80D | |
| Lenovo ThinkPad T14-20S1S06B00 | |
| Lenovo ThinkPad T495-20NKS01Y00 | |
| Blender / v2.79 BMW27 CPU | |
| Dell Latitude 14 5410-RJ80D | |
| Lenovo ThinkPad T14-20S1S06B00 | |
| Lenovo ThinkPad T495-20NKS01Y00 | |
| Lenovo ThinkPad T14-20UES00H00 | |
| Ortalama AMD Ryzen 5 PRO 4650U (415 - 448, n=4) | |
| HP EliteBook 845 G7-23Y60EA | |
| Lenovo ThinkPad T14s-20UJS00K00 | |
| Sınıf ortalaması Office (158 - 1940, n=74, son 2 yıl) | |
| 7-Zip 18.03 / 7z b 4 -mmt1 | |
| Sınıf ortalaması Office (3387 - 6469, n=75, son 2 yıl) | |
| Lenovo ThinkPad T14s-20UJS00K00 | |
| Lenovo ThinkPad T14-20UES00H00 | |
| Lenovo ThinkPad T14-20S1S06B00 | |
| Ortalama AMD Ryzen 5 PRO 4650U (4202 - 4359, n=4) | |
| HP EliteBook 845 G7-23Y60EA | |
| Dell Latitude 14 5410-RJ80D | |
| Lenovo ThinkPad T495-20NKS01Y00 | |
| 7-Zip 18.03 / 7z b 4 | |
| Sınıf ortalaması Office (7098 - 76886, n=75, son 2 yıl) | |
| Lenovo ThinkPad T14s-20UJS00K00 | |
| HP EliteBook 845 G7-23Y60EA | |
| Ortalama AMD Ryzen 5 PRO 4650U (30895 - 32454, n=4) | |
| Lenovo ThinkPad T14-20UES00H00 | |
| Dell Latitude 14 5410-RJ80D | |
| Lenovo ThinkPad T14-20S1S06B00 | |
| Lenovo ThinkPad T495-20NKS01Y00 | |
| Geekbench 5.5 / Single-Core | |
| Sınıf ortalaması Office (811 - 2128, n=71, son 2 yıl) | |
| Lenovo ThinkPad T14s-20UJS00K00 | |
| Dell Latitude 14 5410-RJ80D | |
| Lenovo ThinkPad T14-20UES00H00 | |
| Ortalama AMD Ryzen 5 PRO 4650U (1065 - 1102, n=4) | |
| HP EliteBook 845 G7-23Y60EA | |
| Lenovo ThinkPad T14-20S1S06B00 | |
| Geekbench 5.5 / Multi-Core | |
| Sınıf ortalaması Office (1483 - 16999, n=71, son 2 yıl) | |
| Lenovo ThinkPad T14s-20UJS00K00 | |
| HP EliteBook 845 G7-23Y60EA | |
| Ortalama AMD Ryzen 5 PRO 4650U (4581 - 4705, n=4) | |
| Lenovo ThinkPad T14-20UES00H00 | |
| Dell Latitude 14 5410-RJ80D | |
| Lenovo ThinkPad T14-20S1S06B00 | |
| HWBOT x265 Benchmark v2.2 / 4k Preset | |
| Sınıf ortalaması Office (2.21 - 26, n=74, son 2 yıl) | |
| Lenovo ThinkPad T14s-20UJS00K00 | |
| HP EliteBook 845 G7-23Y60EA | |
| Ortalama AMD Ryzen 5 PRO 4650U (7.82 - 8.14, n=4) | |
| Lenovo ThinkPad T14-20UES00H00 | |
| Lenovo ThinkPad T14-20S1S06B00 | |
| Dell Latitude 14 5410-RJ80D | |
| Lenovo ThinkPad T495-20NKS01Y00 | |
| LibreOffice / 20 Documents To PDF | |
| HP EliteBook 845 G7-23Y60EA | |
| Ortalama AMD Ryzen 5 PRO 4650U (61.5 - 88.8, n=4) | |
| Dell Latitude 14 5410-RJ80D | |
| Lenovo ThinkPad T14-20UES00H00 | |
| Lenovo ThinkPad T14s-20UJS00K00 | |
| Lenovo ThinkPad T14-20S1S06B00 | |
| Sınıf ortalaması Office (39.9 - 102.3, n=74, son 2 yıl) | |
| R Benchmark 2.5 / Overall mean | |
| Dell Latitude 14 5410-RJ80D | |
| Lenovo ThinkPad T14-20S1S06B00 | |
| Ortalama AMD Ryzen 5 PRO 4650U (0.643 - 0.663, n=4) | |
| HP EliteBook 845 G7-23Y60EA | |
| Lenovo ThinkPad T14-20UES00H00 | |
| Lenovo ThinkPad T14s-20UJS00K00 | |
| Sınıf ortalaması Office (0.4098 - 0.888, n=74, son 2 yıl) | |
* ... daha küçük daha iyidir
Sistem performansı
Sistem performansıyla ilgili herhangi bir sorun fark etmedik ve beklendiği gibi T14 çok duyarlı bir sistem. İkinci bir bellek modülü, PCMark 10 sonucunu yaklaşık% 6 iyileştirecektir (4740'a karşı 4473 puan).
| PCMark 8 | |
| Home Score Accelerated v2 | |
| Sınıf ortalaması Office (n=1son 2 yıl) | |
| Lenovo ThinkPad T14s-20UJS00K00 | |
| Lenovo ThinkPad T14-20UES00H00 | |
| Lenovo ThinkPad T495-20NKS01Y00 | |
| Ortalama AMD Ryzen 5 PRO 4650U, AMD Radeon RX Vega 6 (Ryzen 4000/5000) (3802 - 4111, n=2) | |
| Lenovo ThinkPad T14-20S1S06B00 | |
| Dell Latitude 14 5410-RJ80D | |
| Work Score Accelerated v2 | |
| Lenovo ThinkPad T14s-20UJS00K00 | |
| Sınıf ortalaması Office (n=1son 2 yıl) | |
| Lenovo ThinkPad T14-20UES00H00 | |
| Ortalama AMD Ryzen 5 PRO 4650U, AMD Radeon RX Vega 6 (Ryzen 4000/5000) (4993 - 5383, n=2) | |
| Dell Latitude 14 5410-RJ80D | |
| Lenovo ThinkPad T14-20S1S06B00 | |
| Lenovo ThinkPad T495-20NKS01Y00 | |
| Creative Score Accelerated v2 | |
| Lenovo ThinkPad T14s-20UJS00K00 | |
| Lenovo ThinkPad T14-20UES00H00 | |
| Ortalama AMD Ryzen 5 PRO 4650U, AMD Radeon RX Vega 6 (Ryzen 4000/5000) (n=1) | |
| Lenovo ThinkPad T495-20NKS01Y00 | |
| Dell Latitude 14 5410-RJ80D | |
| PCMark 8 Home Score Accelerated v2 | 4111 puan | |
| PCMark 8 Creative Score Accelerated v2 | 5214 puan | |
| PCMark 8 Work Score Accelerated v2 | 5383 puan | |
| PCMark 10 Score | 4473 puan | |
Yardım | ||
DPC Gecikmesi
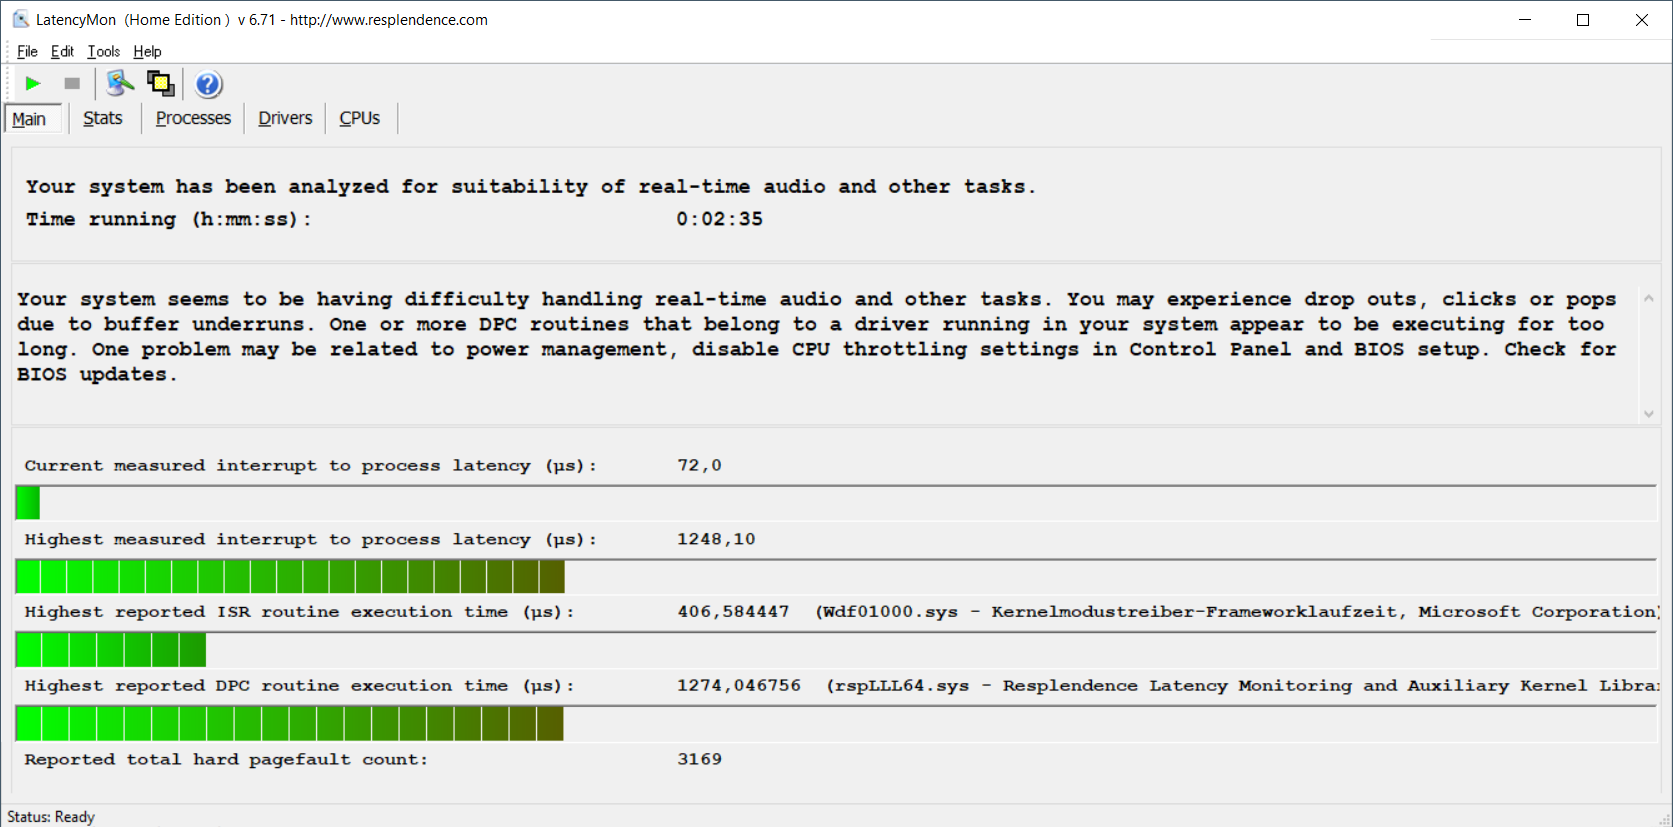
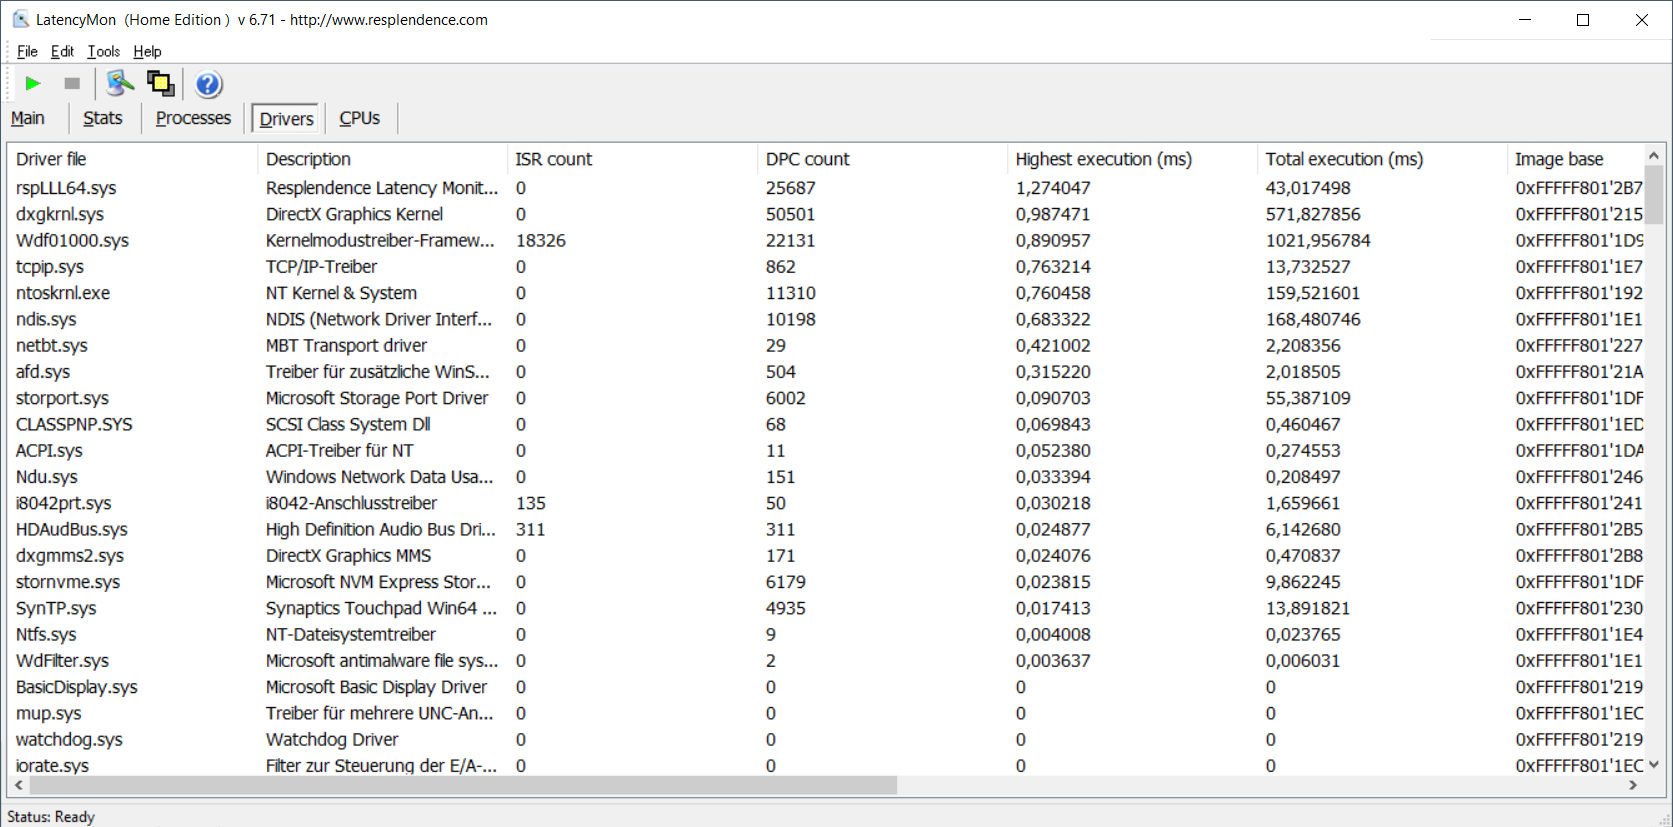
| DPC Latencies / LatencyMon - interrupt to process latency (max), Web, Youtube, Prime95 | |
| Dell Latitude 14 5410-RJ80D | |
| Lenovo ThinkPad T14s-20UJS00K00 | |
| Lenovo ThinkPad T14-20UES00H00 | |
| Lenovo ThinkPad T14-20S1S06B00 | |
| HP EliteBook 845 G7-23Y60EA | |
* ... daha küçük daha iyidir
Depolama Aygıtları - Hızlı Samsung PCIe-SSD ile T14
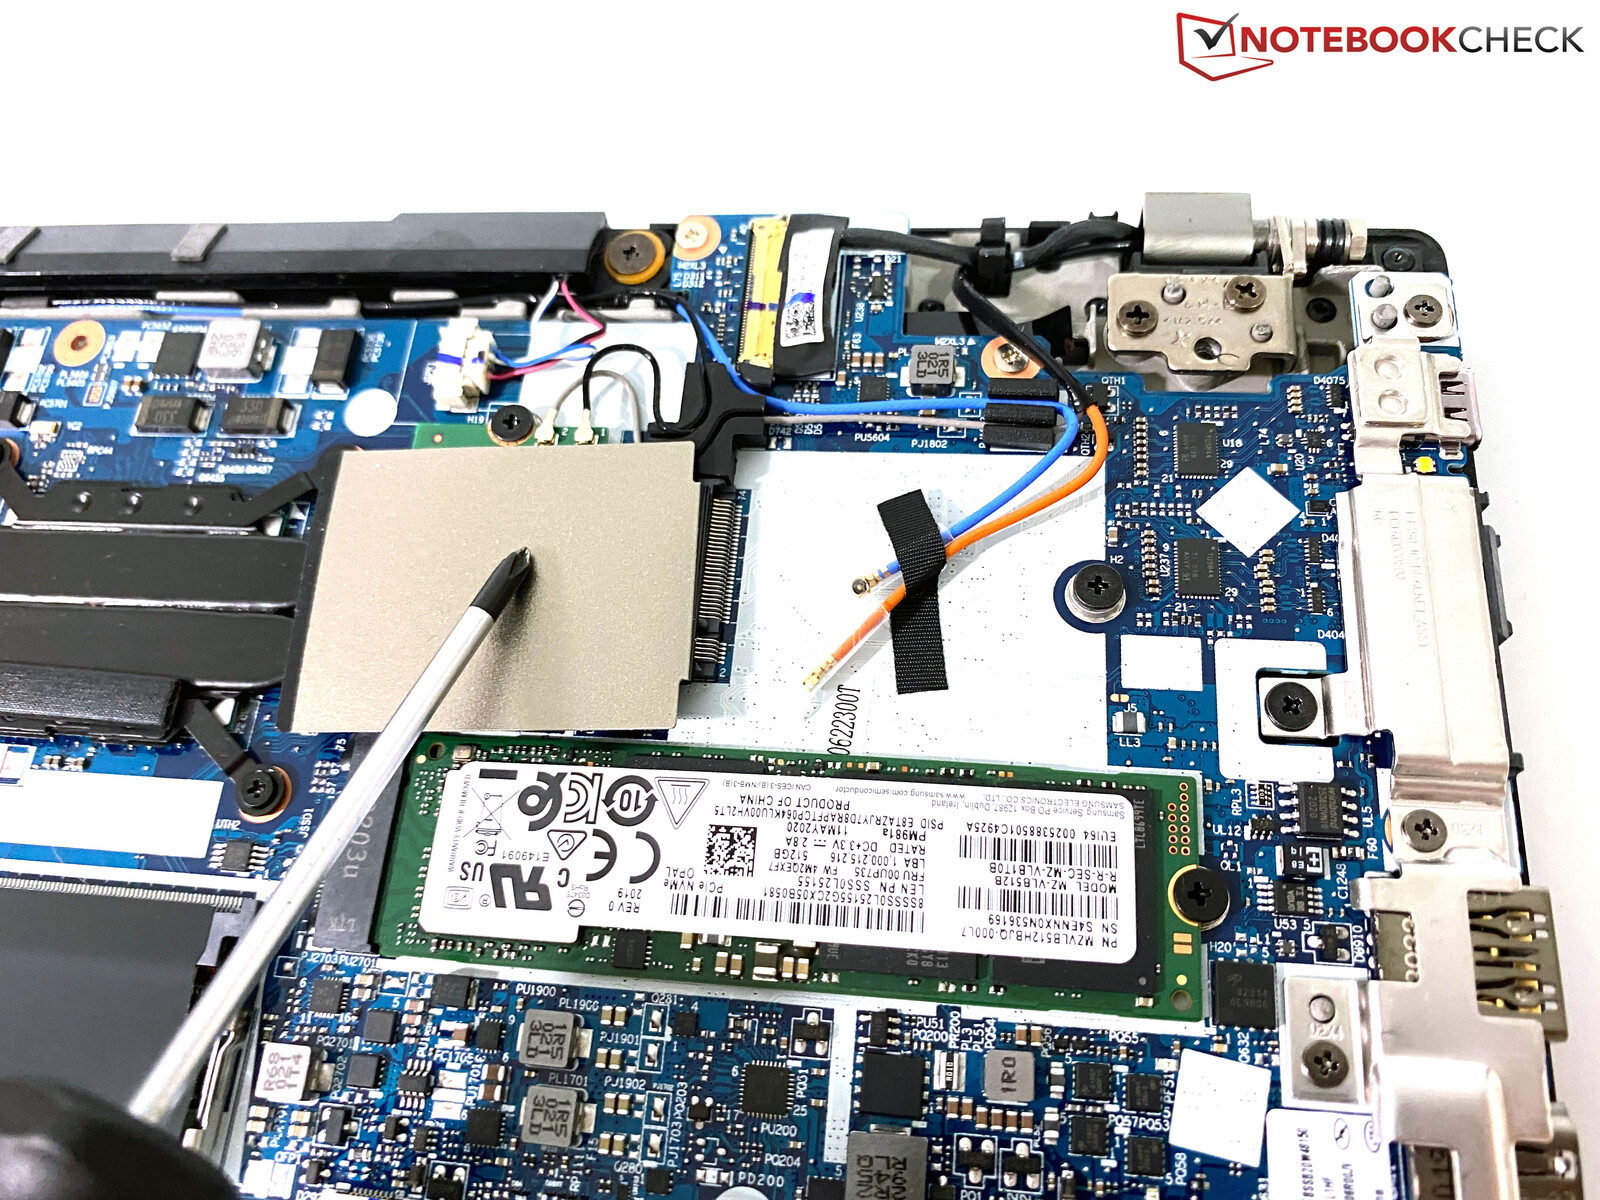
ThinkPad T14, normal bir M.2-2280 SSD için bir yuvaya sahiptir. Test ünitemiz Samsung'dan bir sürücü (PM981a) ve 512 GB kapasite ile donatılmıştır ve ilk kurulumdan sonra 445 GB kullanabilirsiniz. PCIe-SSD'nin performansı çok iyi. İsteğe bağlı WWAN modülü için tasarlanan boş M.2-2242 yuvası da bir PCIe-SSD ile donatılabilir.
| Lenovo ThinkPad T14-20UES00H00 Samsung SSD PM981a MZVLB512HBJQ | HP EliteBook 845 G7-23Y60EA Samsung PM991 MZVLQ256HAJD | Dell Latitude 14 5410-RJ80D Toshiba KBG40ZNS256G NVMe | Lenovo ThinkPad T14s-20UJS00K00 WDC PC SN730 SDBPNTY-1T00 | Lenovo ThinkPad T14-20S1S06B00 Lite-On CA5-8D512 | Lenovo ThinkPad T495-20NKS01Y00 Samsung SSD PM981 MZVLB512HAJQ | Ortalama Samsung SSD PM981a MZVLB512HBJQ | |
|---|---|---|---|---|---|---|---|
| CrystalDiskMark 5.2 / 6 | -34% | -20% | 5% | 1% | 10% | 15% | |
| Write 4K (MB/s) | 88.1 | 80.6 -9% | 95.5 8% | 108 23% | 114.1 30% | 137.7 56% | 140.8 ? 60% |
| Read 4K (MB/s) | 38.28 | 31.2 -18% | 47.14 23% | 39.82 4% | 53.6 40% | 44.11 15% | 48.6 ? 27% |
| Write Seq (MB/s) | 2002 | 883 -56% | 1251 -38% | 2028 1% | 1743 -13% | 2714 36% | 2106 ? 5% |
| Read Seq (MB/s) | 2153 | 1352 -37% | 1624 -25% | 1826 -15% | 2092 -3% | 2665 24% | 2099 ? -3% |
| Write 4K Q32T1 (MB/s) | 423.7 | 361 -15% | 333.5 -21% | 570 35% | 394.8 -7% | 251.2 -41% | 451 ? 6% |
| Read 4K Q32T1 (MB/s) | 393.2 | 272 -31% | 335.2 -15% | 401.5 2% | 372.6 -5% | 336.6 -14% | 482 ? 23% |
| Write Seq Q32T1 (MB/s) | 2889 | 979 -66% | 1234 -57% | 3091 7% | 2176 -25% | 2994 4% | 2903 ? 0% |
| Read Seq Q32T1 (MB/s) | 3566 | 2286 -36% | 2247 -37% | 2872 -19% | 3204 -10% | 3547 -1% | 3511 ? -2% |
| AS SSD | -65% | -99% | 9% | 19% | 13% | 9% | |
| Seq Read (MB/s) | 2138 | 1649 -23% | 1837 -14% | 2291 7% | 2125 -1% | 2661 24% | 2412 ? 13% |
| Seq Write (MB/s) | 1226 | 615 -50% | 700 -43% | 1343 10% | 1087 -11% | 2330 90% | 1983 ? 62% |
| 4K Read (MB/s) | 55 | 42.8 -22% | 44.5 -19% | 42.56 -23% | 49.34 -10% | 48.28 -12% | 53.1 ? -3% |
| 4K Write (MB/s) | 123.5 | 110.5 -11% | 90.1 -27% | 132.2 7% | 119 -4% | 94.7 -23% | 131.1 ? 6% |
| 4K-64 Read (MB/s) | 850 | 450 -47% | 905 6% | 850 0% | 859 1% | 1475 74% | 1201 ? 41% |
| 4K-64 Write (MB/s) | 1852 | 780 -58% | 447.8 -76% | 2262 22% | 1125 -39% | 1494 -19% | 1726 ? -7% |
| Access Time Read * (ms) | 0.04 | 0.154 -285% | 0.16 -300% | 0.05 -25% | 0.058 -45% | 0.046 -15% | 0.05525 ? -38% |
| Access Time Write * (ms) | 0.029 | 0.035 -21% | 0.175 -503% | 0.028 3% | 0.032 -10% | 0.041 -41% | 0.05394 ? -86% |
| Score Read (Points) | 1119 | 658 -41% | 1133 1% | 1121 0% | 1121 0% | 1790 60% | 1495 ? 34% |
| Score Write (Points) | 2098 | 953 -55% | 608 -71% | 2529 21% | 1353 -36% | 1822 -13% | 2055 ? -2% |
| Score Total (Points) | 3758 | 1910 -49% | 2273 -40% | 4185 11% | 3007 -20% | 4514 20% | 4303 ? 15% |
| Copy ISO MB/s (MB/s) | 1386 | 236 -83% | 2546 84% | 1265 -9% | 1894 ? 37% | ||
| Copy Program MB/s (MB/s) | 417.7 | 60.6 -85% | 428.6 3% | 1353 224% | 539 ? 29% | ||
| Copy Game MB/s (MB/s) | 916 | 126.6 -86% | 943 3% | 3007 228% | 1193 ? 30% | ||
| Toplam Ortalama (Program / Ayarlar) | -50% /
-54% | -60% /
-66% | 7% /
7% | 10% /
13% | 12% /
12% | 12% /
11% |
* ... daha küçük daha iyidir

DiskSpd Read Loop, Queue Depth 8
GPU Performance - Radeon RX Vega 6
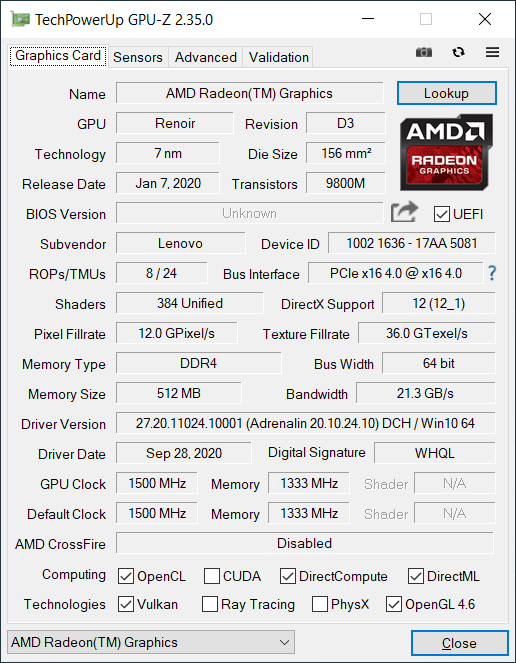
The AMD Ryzen 5 Pro 4650U is equipped with the integrated graphics unit Radeon RX Vega 6. Compared to previous versions of the Vega 6, the core clock is now much higher (1500 vs. 1100 MHz), but the performance of our test unit is throttled due to the single-channel memory configuration. As soon as we add the second memory module, there are performance gains between 30% and 44% (see table) depending on the benchmark. Intel's iGPUs from the Comet Lake chips (which are still used for business laptops right now) are much slower.
The performance of the iGPU remains stable under sustained workloads; the device easily passes the Fire Strike stress test at 99.4%. There is no performance reduction on battery, either.
| Benchmark | Single-Channel RAM | Dual-Channel RAM | Difference |
|---|---|---|---|
| 3DMark 11 Graphics | 3608 | 4711 | +30% |
| 3DMark Fire Strike Graphics | 2228 | 3217 | +44% |
| 3DMark Time Spy Graphics | 661 | 884 | +33% |
| 3DMark 11 - 1280x720 Performance GPU | |
| Sınıf ortalaması Office (2551 - 18313, n=68, son 2 yıl) | |
| Lenovo ThinkPad T14s-20UJS00K00 | |
| Ortalama AMD Radeon RX Vega 6 (Ryzen 4000/5000) (3401 - 4713, n=23) | |
| Lenovo ThinkPad T14-20UES00H00 | |
| Lenovo ThinkPad T495-20NKS01Y00 | |
| HP EliteBook 845 G7-23Y60EA | |
| Dell Latitude 14 5410-RJ80D | |
| Lenovo ThinkPad T14-20S1S06B00 | |
| 3DMark | |
| 1920x1080 Fire Strike Graphics | |
| Sınıf ortalaması Office (736 - 21871, n=73, son 2 yıl) | |
| Lenovo ThinkPad T14s-20UJS00K00 | |
| Ortalama AMD Radeon RX Vega 6 (Ryzen 4000/5000) (2122 - 3239, n=23) | |
| Lenovo ThinkPad T495-20NKS01Y00 | |
| Lenovo ThinkPad T14-20UES00H00 | |
| HP EliteBook 845 G7-23Y60EA | |
| Dell Latitude 14 5410-RJ80D | |
| Lenovo ThinkPad T14-20S1S06B00 | |
| 2560x1440 Time Spy Graphics | |
| Sınıf ortalaması Office (493 - 6679, n=68, son 2 yıl) | |
| Ortalama AMD Radeon RX Vega 6 (Ryzen 4000/5000) (650 - 996, n=22) | |
| Lenovo ThinkPad T495-20NKS01Y00 | |
| Lenovo ThinkPad T14-20UES00H00 | |
| HP EliteBook 845 G7-23Y60EA | |
| Dell Latitude 14 5410-RJ80D | |
| Lenovo ThinkPad T14-20S1S06B00 | |
| 3DMark 11 Performance | 3754 puan | |
| 3DMark Fire Strike Score | 2018 puan | |
| 3DMark Time Spy Score | 758 puan | |
Yardım | ||
Gaming Performance
An office laptop like the T14 is obviously not a gaming machine, but simple titles actually run smoothly at low settings. A second memory module once again improves the performance noticeably, which is also shown by the following table.
| Benchmark | Single-Channel RAM | Dual-Channel RAM | Difference |
|---|---|---|---|
| Witcher 3 Low | 39 FPS | 60 FPS | +54% |
| Far Cry 5 Low | 27 FPS | 42 FPS | +56% |
| F1 2020 Low | 50 FPS | 74 FPS | +48% |
| düşük | orta | yüksek | ultra | |
|---|---|---|---|---|
| The Witcher 3 (2015) | 39 | 12.5 | ||
| Dota 2 Reborn (2015) | 88.5 | 67.1 | 33.7 | 31.3 |
| X-Plane 11.11 (2018) | 36.1 | 26.8 | 24.5 | |
| Far Cry 5 (2018) | 27 | 13 | 12 | |
| F1 2020 (2020) | 50 | 25 |
Emissions - Quiet fan and high temperatures
System Noise
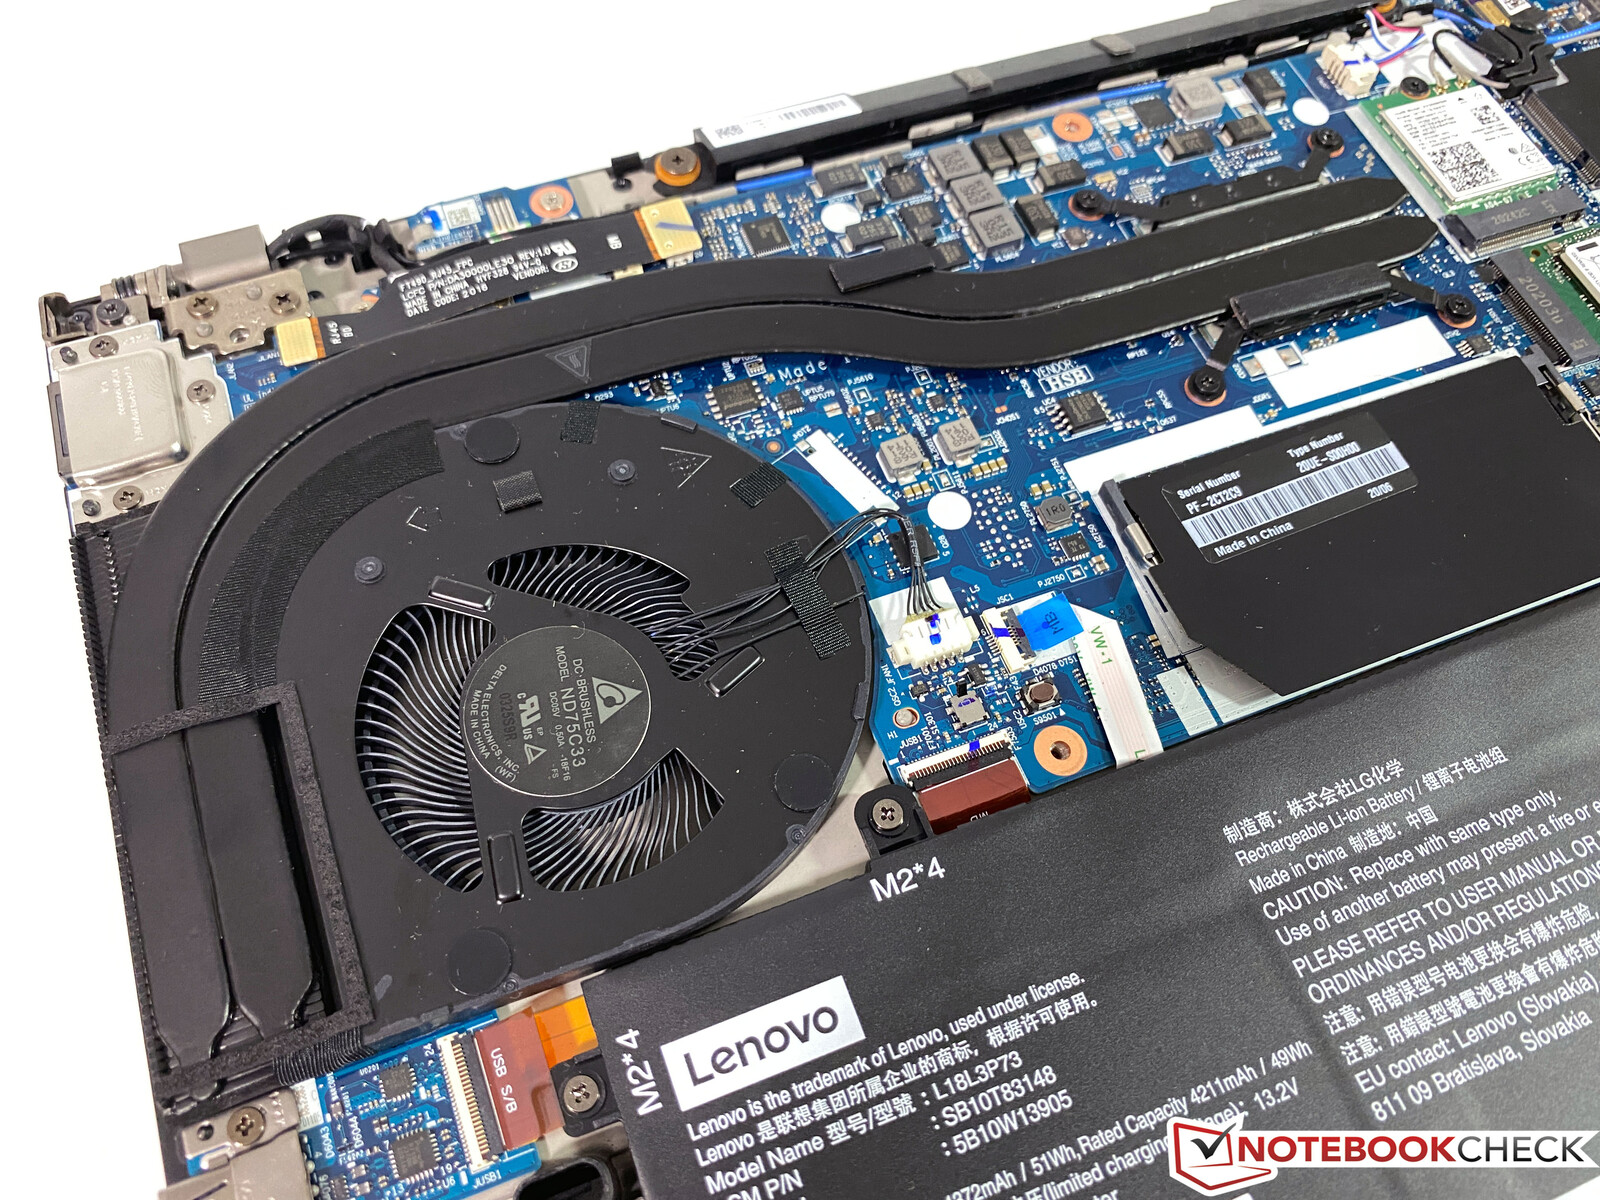
Similar to the Intel model of the ThinkPad T14 as well as the ThinkPad T14s, the fan of our AMD-based review unit is pretty restrained and stays very quiet even under full load. All in all, all three systems are very similar in our measurements, so Lenovo still favors a quiet fan noise for its business laptops. We did not notice any other electronic sounds during our review period.
Ses yüksekliği
| Boşta |
| 29.3 / 29.3 / 30.3 dB |
| Çalışırken |
| 31.3 / 33 dB |
 | ||
30 dB sessiz 40 dB(A) duyulabilirlik 50 dB(A) gürültülü |
||
min: | ||
| Lenovo ThinkPad T14-20UES00H00 Vega 6, R5 PRO 4650U, Samsung SSD PM981a MZVLB512HBJQ | HP EliteBook 845 G7-23Y60EA Vega 6, R5 PRO 4650U, Samsung PM991 MZVLQ256HAJD | Dell Latitude 14 5410-RJ80D UHD Graphics 620, i5-10310U, Toshiba KBG40ZNS256G NVMe | Lenovo ThinkPad T14s-20UJS00K00 Vega 7, R7 PRO 4750U, WDC PC SN730 SDBPNTY-1T00 | Lenovo ThinkPad T14-20S1S06B00 UHD Graphics 620, i5-10210U, Lite-On CA5-8D512 | |
|---|---|---|---|---|---|
| Noise | 12% | 3% | 1% | -2% | |
| kapalı / ortam * (dB) | 29.3 | 25.4 13% | 24.9 15% | 29.2 -0% | 29.6 -1% |
| Idle Minimum * (dB) | 29.3 | 25.4 13% | 24.9 15% | 29.2 -0% | 29.6 -1% |
| Idle Average * (dB) | 29.3 | 25.4 13% | 24.9 15% | 29.2 -0% | 29.6 -1% |
| Idle Maximum * (dB) | 30.3 | 25.4 16% | 24.9 18% | 29.6 2% | 29.6 2% |
| Load Average * (dB) | 31.3 | 29.6 5% | 38.7 -24% | 30.2 4% | 33.5 -7% |
| Witcher 3 ultra * (dB) | 33 | 32.3 2% | |||
| Load Maximum * (dB) | 33 | 29.5 11% | 39.2 -19% | 32.3 2% | 33.5 -2% |
* ... daha küçük daha iyidir
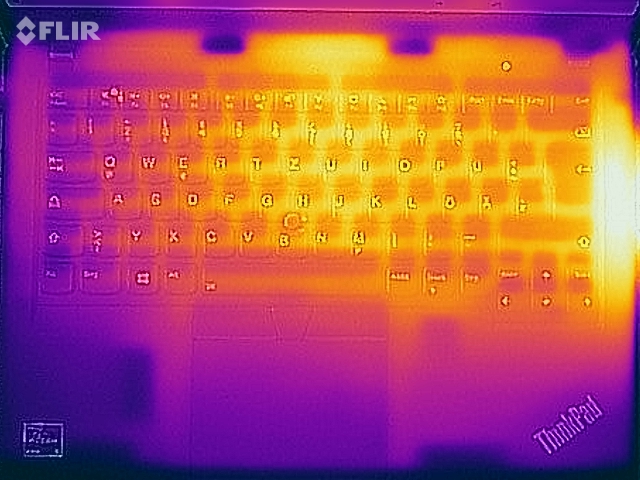
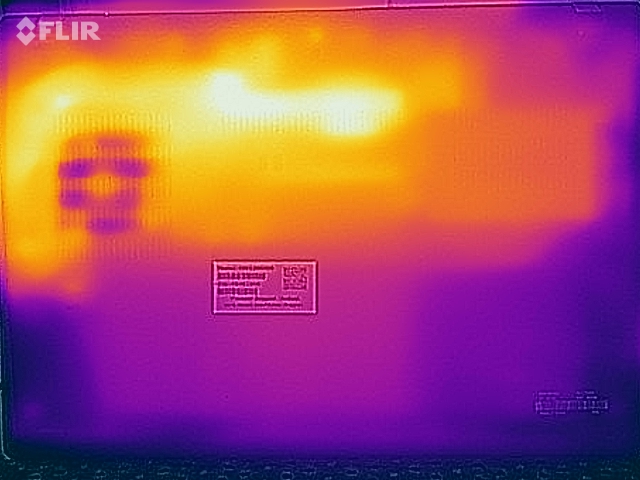
Temperature
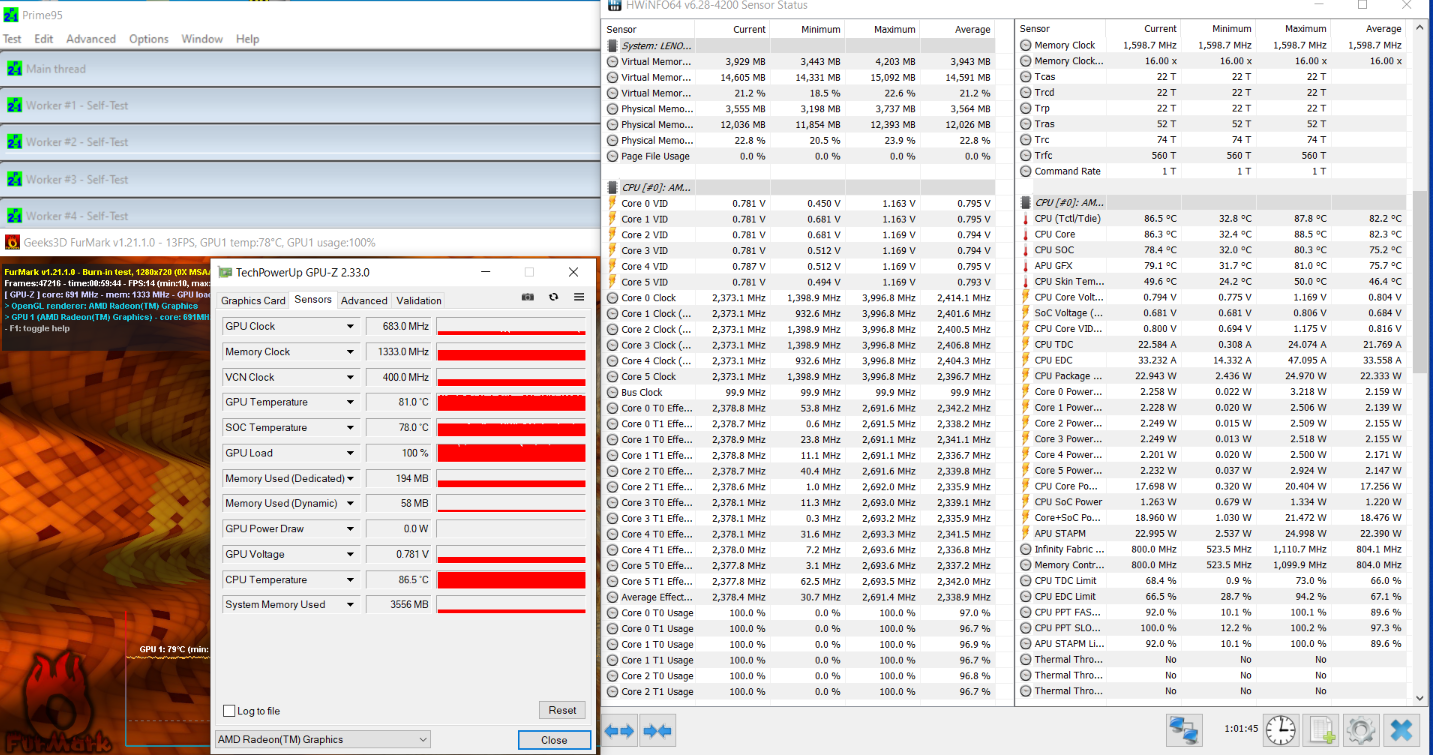
However, the quiet fan noise results in high surface temperatures under load, even though the results are lower compared to the T14 with the Intel CPU. We can still measure almost 60 °C at the bottom and 50 °C at the top of the base unit in our stress test. These temperatures are just too high for an office laptop and you should definitely not put the device on your lap when you stress it.
Similar to pure CPU stress, the power consumption of the APU quickly levels off at 23 W and stays there. This results in a CPU clock of 6x ~2.4 GHz and ~700 MHz for the iGPU.
(-) Üst taraftaki maksimum sıcaklık, 34.3 °C / 94 F ortalamasına kıyasla 49.2 °C / 121 F'dir. , Office sınıfı için 21.2 ile 62.5 °C arasında değişir.
(-) Alt kısım, 36.8 °C / 98 F ortalamasına kıyasla maksimum 59.2 °C / 139 F'ye kadar ısınır
(+) Boşta kullanımda, üst tarafın ortalama sıcaklığı 25.9 °C / 79 F olup, cihazın 29.5 °C / 85 F.
(+) Avuç içi dayanakları ve dokunmatik yüzey maksimum (33.5 °C / 92.3 F) cilt sıcaklığına ulaşıyor ve bu nedenle sıcak değil.
(-) Benzer cihazların avuç içi dayanağı alanının ortalama sıcaklığı 27.5 °C / 81.5 F (-6 °C / -10.8 F) idi.
Speakers
Lenovo ThinkPad T14-20UES00H00 ses analizi
(-) | hoparlörler çok yüksek ses çıkarmıyor (70.2 dB)
Bas 100 - 315Hz
(±) | azaltılmış bas - ortalama olarak medyandan 13.8% daha düşük
(±) | Bas doğrusallığı ortalamadır (11.9% delta - önceki frekans)
Ortalar 400 - 2000 Hz
(±) | daha yüksek ortalar - ortalama olarak medyandan 6.5% daha yüksek
(±) | Ortaların doğrusallığı ortalamadır (7.1% delta - önceki frekans)
Yüksekler 2 - 16 kHz
(+) | dengeli yüksekler - medyandan yalnızca 3.1% uzakta
(+) | yüksekler doğrusaldır (6% deltadan önceki frekansa)
Toplam 100 - 16.000 Hz
(±) | Genel sesin doğrusallığı ortalamadır (24.6% ortancaya göre fark)
Aynı sınıfla karşılaştırıldığında
» Bu sınıftaki tüm test edilen cihazların %73%'si daha iyi, 7% benzer, 21% daha kötüydü
» En iyisinin deltası 7% idi, ortalama 21% idi, en kötüsü 53% idi
Test edilen tüm cihazlarla karşılaştırıldığında
» Test edilen tüm cihazların %75'si daha iyi, 5 benzer, % 20 daha kötüydü
» En iyisinin deltası 4% idi, ortalama 24% idi, en kötüsü 134% idi
HP EliteBook 845 G7-23Y60EA ses analizi
(-) | hoparlörler çok yüksek ses çıkarmıyor (67.8 dB)
Bas 100 - 315Hz
(-) | neredeyse hiç bas yok - ortalama olarak medyandan 19.7% daha düşük
(±) | Bas doğrusallığı ortalamadır (11.7% delta - önceki frekans)
Ortalar 400 - 2000 Hz
(+) | dengeli ortalar - medyandan yalnızca 1.3% uzakta
(+) | orta frekanslar doğrusaldır (4.8% deltadan önceki frekansa)
Yüksekler 2 - 16 kHz
(+) | dengeli yüksekler - medyandan yalnızca 3% uzakta
(+) | yüksekler doğrusaldır (4.5% deltadan önceki frekansa)
Toplam 100 - 16.000 Hz
(±) | Genel sesin doğrusallığı ortalamadır (16.2% ortancaya göre fark)
Aynı sınıfla karşılaştırıldığında
» Bu sınıftaki tüm test edilen cihazların %40%'si daha iyi, 4% benzer, 56% daha kötüydü
» En iyisinin deltası 5% idi, ortalama 18% idi, en kötüsü 53% idi
Test edilen tüm cihazlarla karşılaştırıldığında
» Test edilen tüm cihazların %26'si daha iyi, 6 benzer, % 68 daha kötüydü
» En iyisinin deltası 4% idi, ortalama 24% idi, en kötüsü 134% idi
Dell Latitude 14 5410-RJ80D ses analizi
(±) | hoparlör ses yüksekliği ortalama ama iyi (77.5 dB)
Bas 100 - 315Hz
(-) | neredeyse hiç bas yok - ortalama olarak medyandan 19.7% daha düşük
(±) | Bas doğrusallığı ortalamadır (8.7% delta - önceki frekans)
Ortalar 400 - 2000 Hz
(+) | dengeli ortalar - medyandan yalnızca 4.6% uzakta
(±) | Ortaların doğrusallığı ortalamadır (7.4% delta - önceki frekans)
Yüksekler 2 - 16 kHz
(±) | daha yüksek en yüksekler - ortalama olarak medyandan 5.2% daha yüksek
(+) | yüksekler doğrusaldır (5.1% deltadan önceki frekansa)
Toplam 100 - 16.000 Hz
(±) | Genel sesin doğrusallığı ortalamadır (16% ortancaya göre fark)
Aynı sınıfla karşılaştırıldığında
» Bu sınıftaki tüm test edilen cihazların %18%'si daha iyi, 6% benzer, 76% daha kötüydü
» En iyisinin deltası 7% idi, ortalama 21% idi, en kötüsü 53% idi
Test edilen tüm cihazlarla karşılaştırıldığında
» Test edilen tüm cihazların %25'si daha iyi, 5 benzer, % 70 daha kötüydü
» En iyisinin deltası 4% idi, ortalama 24% idi, en kötüsü 134% idi
Energy Management - AMD ThinkPad with increased power consumption
Power Consumption
Our idle measurements show that Lenovo still has to improve the power consumption of the AMD ThinkPad. Similar to the T14s, the results are higher compared to the Intel counterparts. HP's EliteBook 845 G7 with the AMD APU, for example, is also more than 2 W more efficient in our idle min scenario (where the maximum display brightness is not relevant). The included 65 W power adapter is completely sufficient, even during the stress test.
| Kapalı / Bekleme modu | |
| Boşta | |
| Çalışırken |
|
Key:
min: | |
| Lenovo ThinkPad T14-20UES00H00 R5 PRO 4650U, Vega 6, Samsung SSD PM981a MZVLB512HBJQ, IPS, 1920x1080, 14" | HP EliteBook 845 G7-23Y60EA R5 PRO 4650U, Vega 6, Samsung PM991 MZVLQ256HAJD, IPS, 1920x1080, 14" | Dell Latitude 14 5410-RJ80D i5-10310U, UHD Graphics 620, Toshiba KBG40ZNS256G NVMe, a-Si IPS LED, 1920x1080, 14" | Lenovo ThinkPad T14s-20UJS00K00 R7 PRO 4750U, Vega 7, WDC PC SN730 SDBPNTY-1T00, IPS , 1920x1080, 14" | Lenovo ThinkPad T14-20S1S06B00 i5-10210U, UHD Graphics 620, Lite-On CA5-8D512, LTPS IPS LED, 1920x1080, 14" | Lenovo ThinkPad T495-20NKS01Y00 R5 PRO 3500U, Vega 8, Samsung SSD PM981 MZVLB512HAJQ, IPS, 1920x1080, 14" | Ortalama AMD Radeon RX Vega 6 (Ryzen 4000/5000) | Sınıf ortalaması Office | |
|---|---|---|---|---|---|---|---|---|
| Power Consumption | 29% | 19% | -0% | -1% | 5% | 12% | -2% | |
| Idle Minimum * (Watt) | 5.8 | 3.1 47% | 2.9 50% | 5.7 2% | 3.2 45% | 5.1 12% | 3.98 ? 31% | 4.41 ? 24% |
| Idle Average * (Watt) | 8.3 | 5.6 33% | 4.5 46% | 8.9 -7% | 6.1 27% | 7.7 7% | 6.53 ? 21% | 7.37 ? 11% |
| Idle Maximum * (Watt) | 11 | 8.6 22% | 7.4 33% | 11 -0% | 10.4 5% | 10.7 3% | 8.65 ? 21% | 8.58 ? 22% |
| Load Average * (Watt) | 39.5 | 28.4 28% | 34.6 12% | 38.2 3% | 45.6 -15% | 35.8 9% | 35 ? 11% | 43 ? -9% |
| Load Maximum * (Watt) | 40.8 | 35.4 13% | 60 -47% | 40.2 1% | 68.6 -68% | 43.2 -6% | 51.5 ? -26% | 64.6 ? -58% |
* ... daha küçük daha iyidir
Battery Runtime
The battery capacity (50 Wh) is identical to the Intel SKU, but the battery runtime is shorter due to the higher consumption values. About 8.5 hours in the Wi-Fi test (or 7.5 hours at full brightness, respectively) is not a bad result for the AMD T14, but the Intel T14 lasts much longer at 11 and 8:13 hours. However, the AMD model is ahead in the video test, so it looks like the iGPU is more efficient than the Intel counterpart. Both versions will drain the battery in about 70 minutes under load.
| Lenovo ThinkPad T14-20UES00H00 R5 PRO 4650U, Vega 6, 50 Wh | HP EliteBook 845 G7-23Y60EA R5 PRO 4650U, Vega 6, 56 Wh | Dell Latitude 14 5410-RJ80D i5-10310U, UHD Graphics 620, 68 Wh | Lenovo ThinkPad T14s-20UJS00K00 R7 PRO 4750U, Vega 7, 57 Wh | Lenovo ThinkPad T14-20S1S06B00 i5-10210U, UHD Graphics 620, 50 Wh | Lenovo ThinkPad T495-20NKS01Y00 R5 PRO 3500U, Vega 8, 50 Wh | Sınıf ortalaması Office | |
|---|---|---|---|---|---|---|---|
| Pil Çalışma Süresi | 40% | 56% | 37% | 10% | 17% | 45% | |
| H.264 (h) | 11.6 | 9.5 -18% | 15.2 31% | 13.2 14% | 10.4 -10% | 11.8 2% | 15 ? 29% |
| WiFi v1.3 (h) | 8.4 | 12.2 45% | 13.7 63% | 10.2 21% | 11 31% | 9.1 8% | 12.9 ? 54% |
| Load (h) | 1.2 | 2.3 92% | 2.1 75% | 2.1 75% | 1.3 8% | 1.7 42% | 1.807 ? 51% |
| Reader / Idle (h) | 16.2 | 23.7 ? |
Artılar
Eksiler
Verdict - The T14 is also better with AMD APU
Similar to many other ThinkPad models, the T14 with the AMD processor also left a better impression during our review compared to the Intel counterpart. The battery runtime is a bit worse and Thunderbolt 3 is missing as well, but you get HDMI 2.0 in return and the AMD APU is just much more powerful. The performance gap would be even larger if our review unit was equipped with dual-channel memory or the faster Ryzen 7 Pro processor. The lack of the glossy 4K screen for the AMD ThinkPad T14 is not a big deal in our opinion.
The ThinkPad T14 with the AMD processor leaves a good impression in our review and offers much more CPU and GPU performance for a lower price. All in all, it is the better all-rounder for the office.
The AMD model has two more advantages. Lenovo uses the Pro versions of AMD's processors, so you get extended security features. These are available on Intel chips as well, but you will have to pay extra to get processors with vPro support. Then there is the price, because a comparable Intel version of the T14 is about 300 Euros (~$357) more expensive.
The T14 AMD definitely gets our recommendation, even though the T14s AMD is an even better package and stays the best office laptop you can get from Lenovo right now.
Lenovo ThinkPad T14-20UES00H00
- 11/16/2020 v7 (old)
Andreas Osthoff
Price comparison

