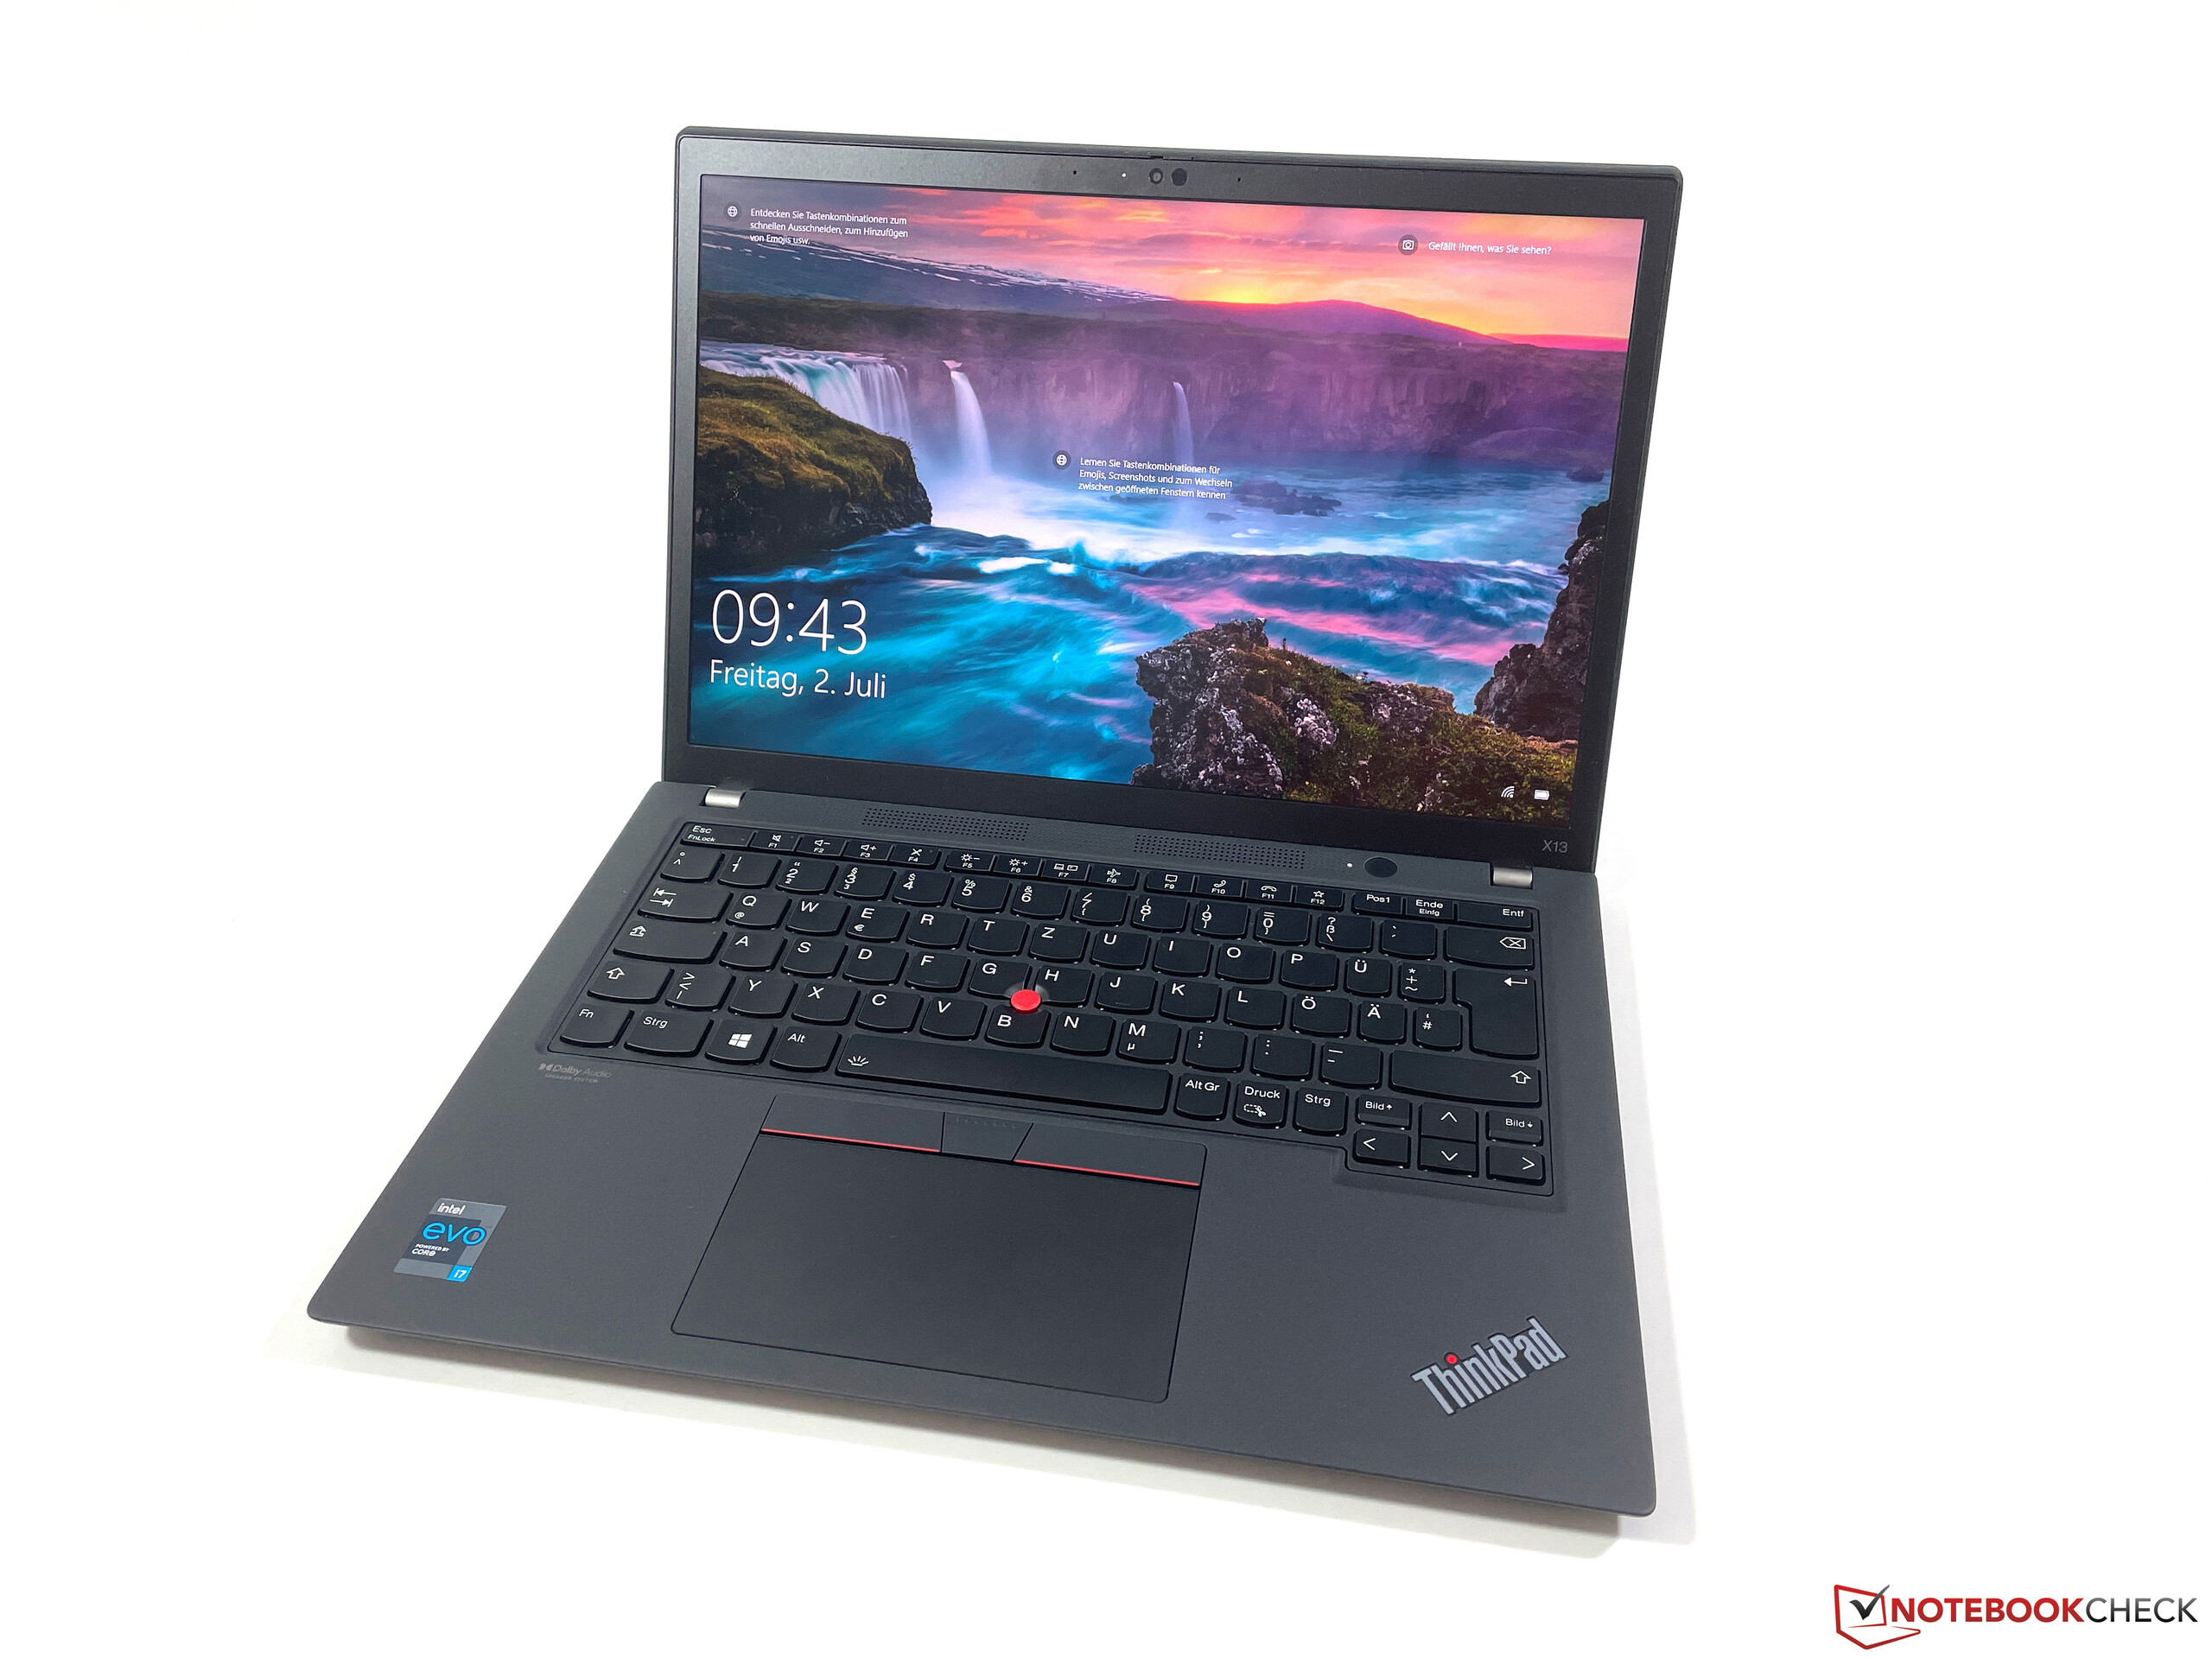
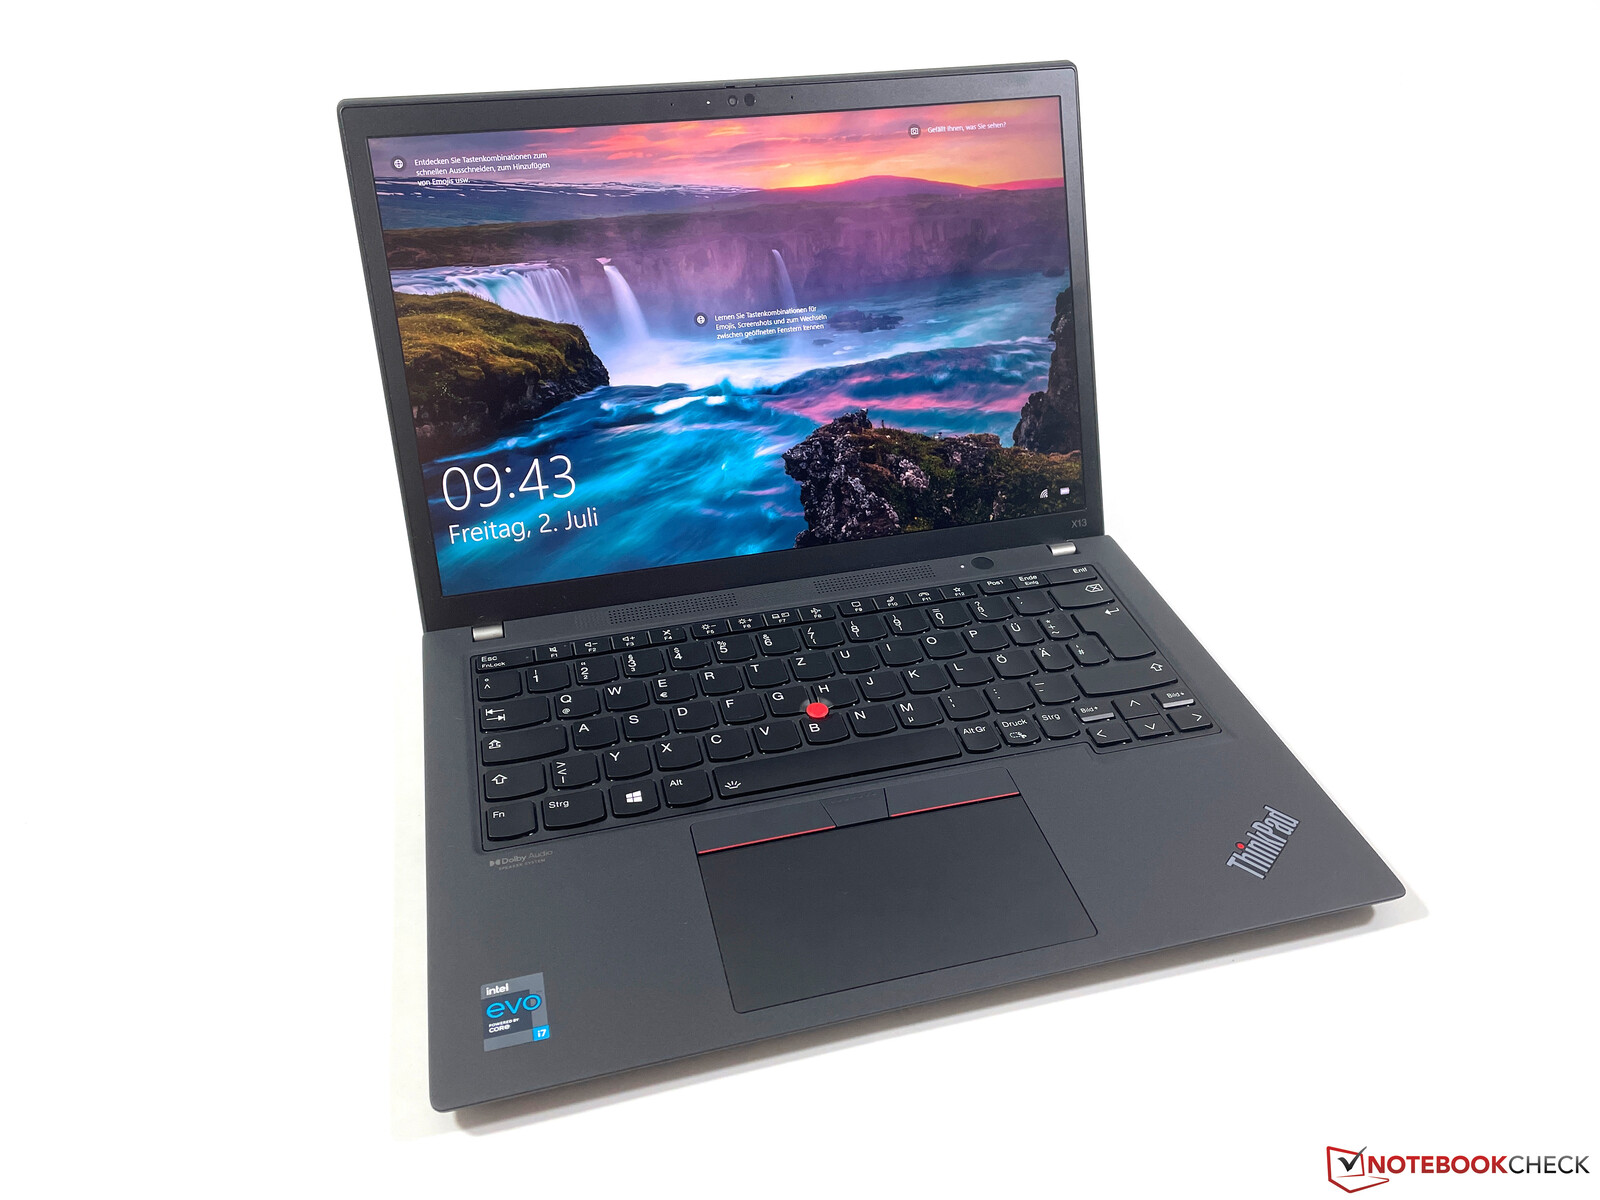
Lenovo ThinkPad X13 G2 İncelemesi: Kusursuz bir mobil yoldaş?

Geçen yılki ThinkPad X13 yeni bir tasarım aldı, ancak yine de kökleri eski ThinkPad X390'a dayanıyordu. ThinkPad X13'ün ikinci nesli ise yeni bir kasa, güncellenmiş CPU'lar ve ThinkPad X1 modelleri gibi yeni 16:10 en boy oranlı ekranlarla büyük bir güncellemeyle geliyor.
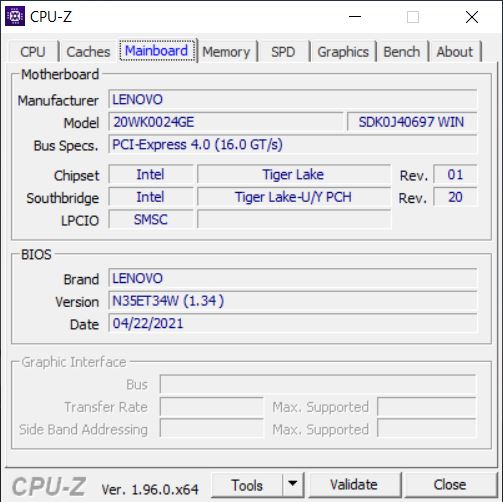
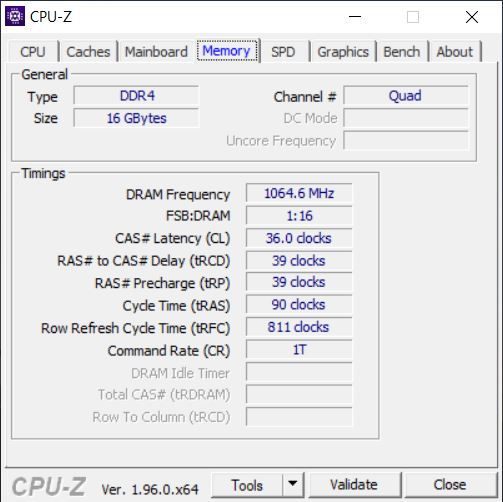
ThinkPad X13 G2, Intel veya AMD CPU'larla önceden olduğu gibi yine kullanılabilir, ancak önce Intel modelleri mevcut. Test birimimiz 20WK0024GE adını taşıyor ve düzenli müşteriler için ~ 1900 Euro veya Lenovo'nun eğitim programına erişiminiz varsa ~ 1800 Euro tutarındadır. Yapılandırma modern bir Tiger Lake i7 işlemci, 16 GB RAM, 512 GB PCIe-SSD depolama, 1920 x 1200 pikselli 16:10 panel ve 5G modem içeriyor.
Dell, Fujitsu veya HP'nin tüm yakın ticari rakiplerini henüz incelemedik, bu nedenle bu inceleme için karşılaştırma cihazı olarak bazı tüketici modellerini de kullanacağız.
Karşılaştırmada muhtemel rakipleri
Derecelendirme | Tarih | Model | Ağırlık | Depolama | Boyut | Çözünürlük | En iyi fiyat |
|---|---|---|---|---|---|---|---|
Kasa - Yeni malzemelerle Lenovo
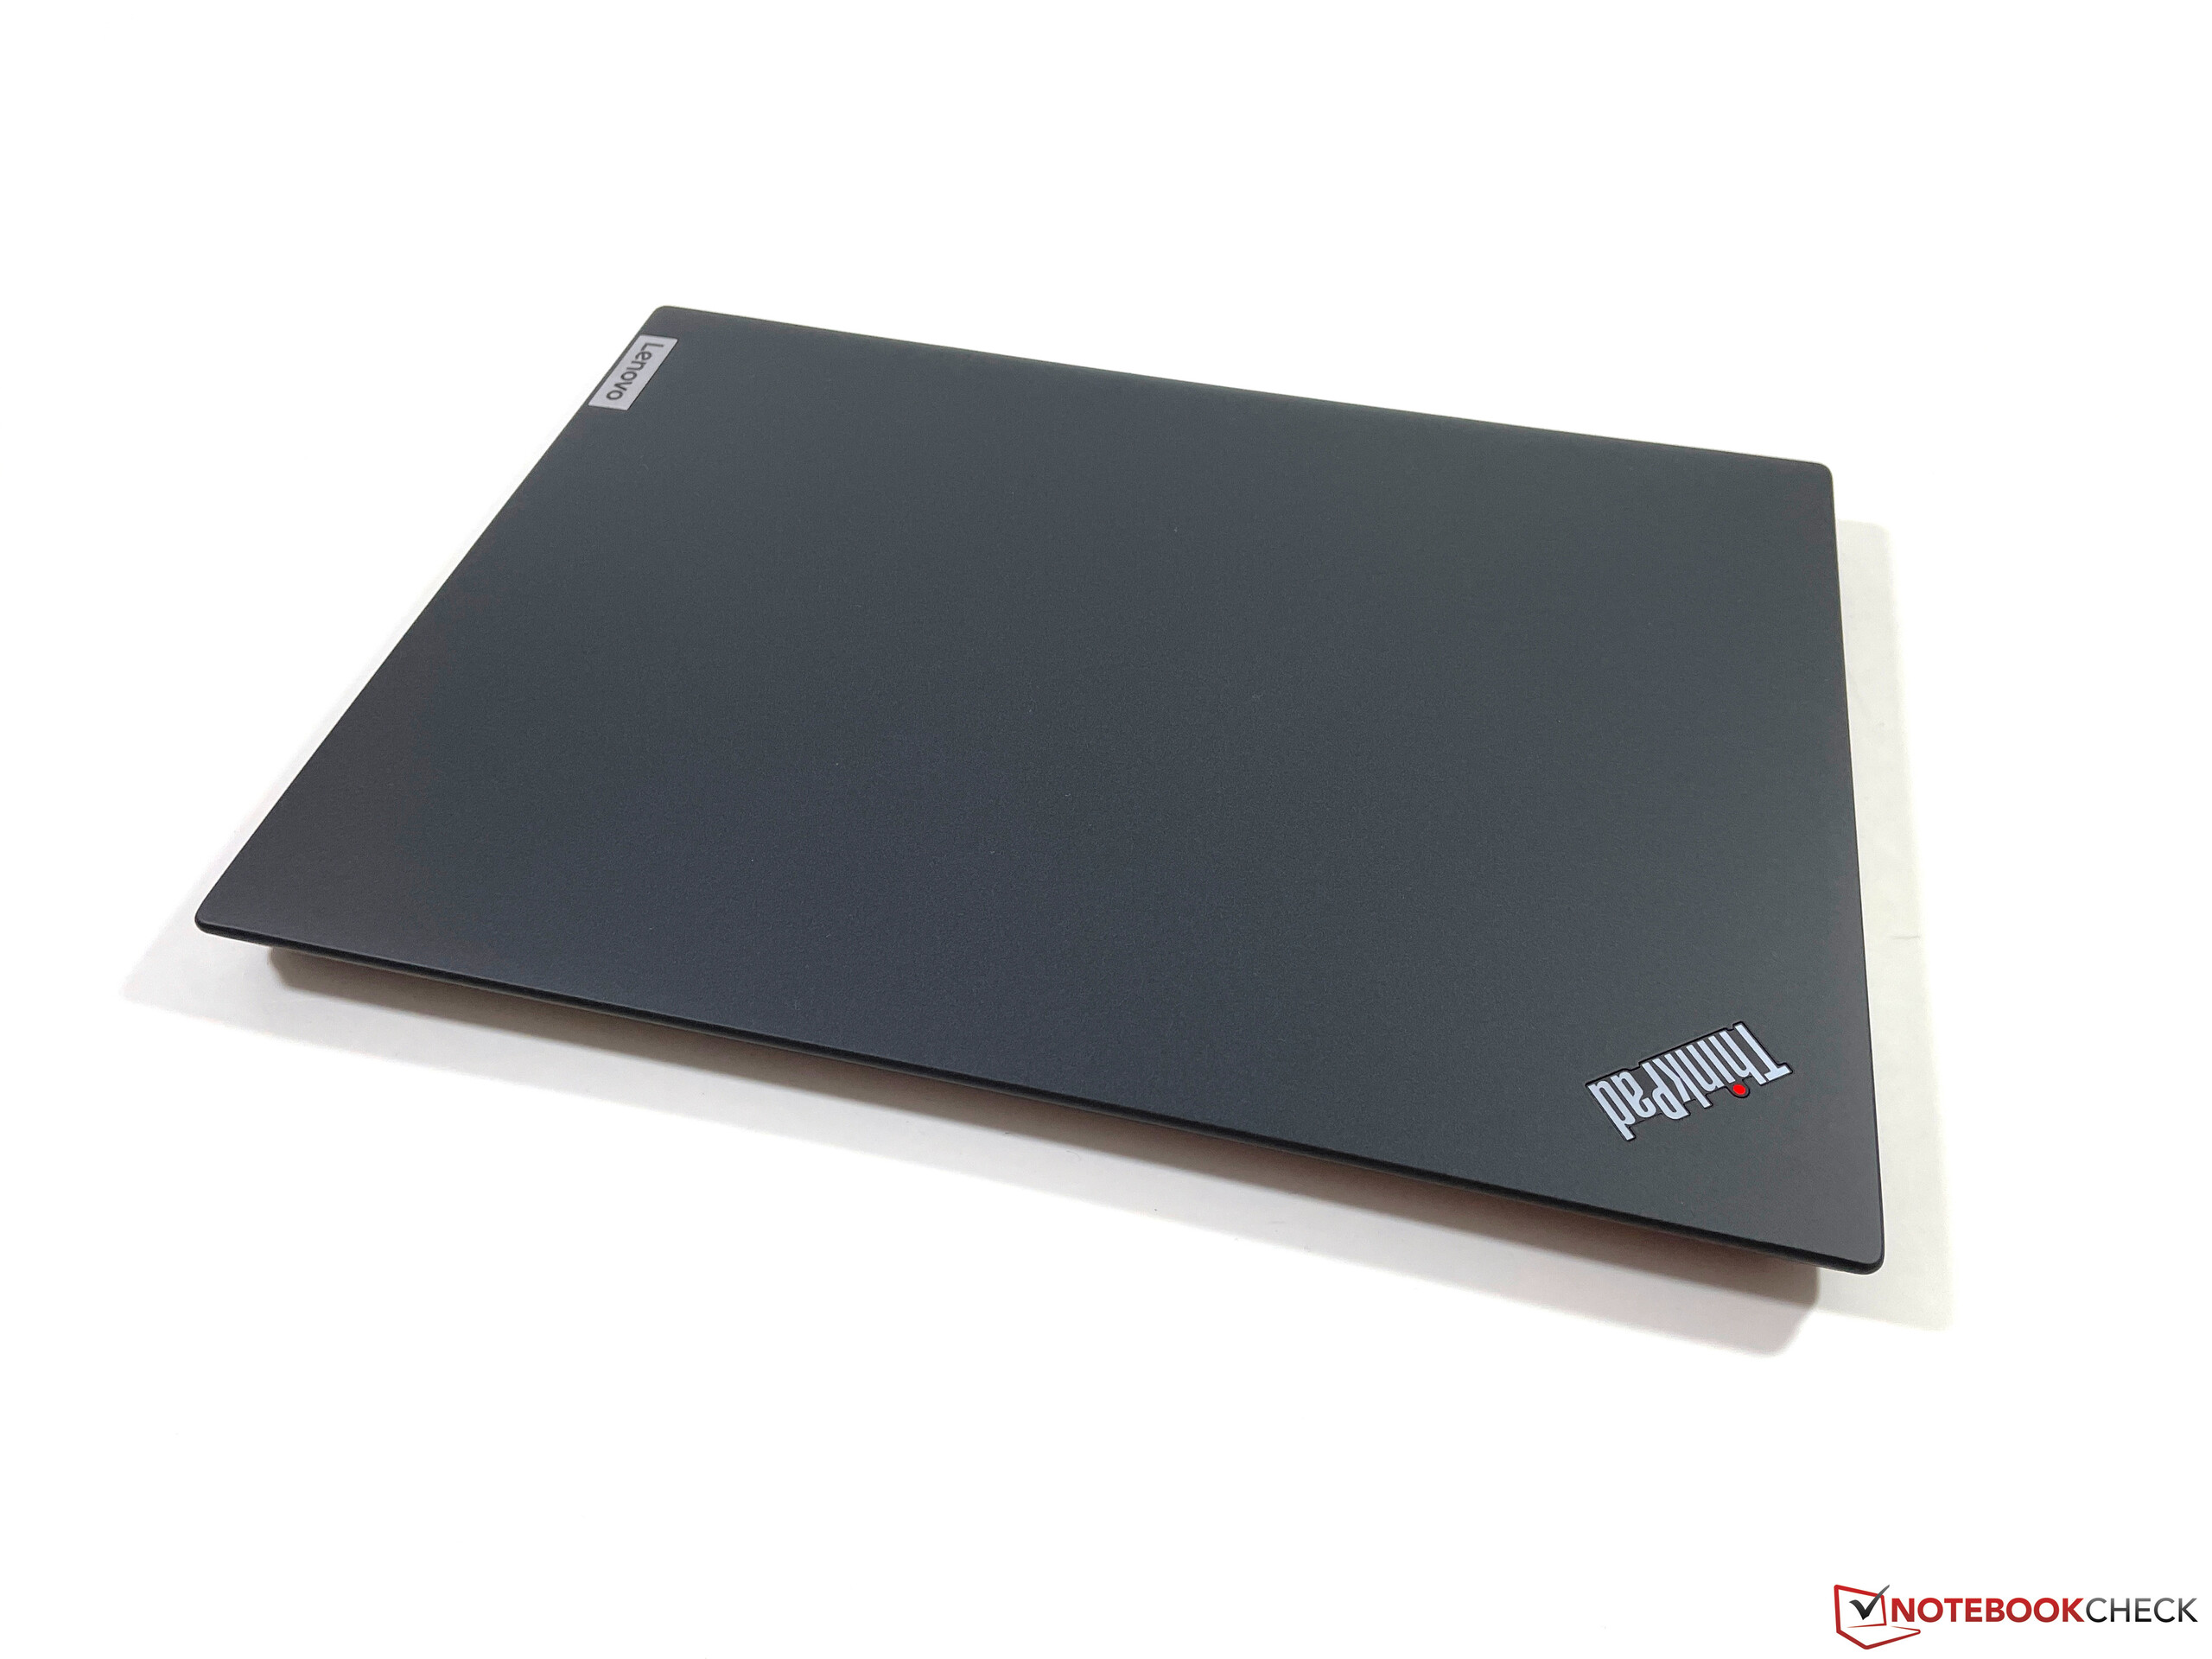
Lenovo, ikinci nesil için yeni bir kasa kullanıyor. Dışarıdan büyük bir fark görmeyeceksiniz ancak çok daha modern görünen kapağı açtığınızda yeni 16:10 paneli ve her yandaki ince çerçeveleri hemen göreceksiniz. Renk başka bir fark, çünkü siyah yüzeyler artık biraz daha parlak ve klavye ile dokunmatik yüzey arasında açıkça görülebilir bir kontrast var. X13 G2'yi gümüş (Fırtına Grisi) olarak da alabilirsiniz.
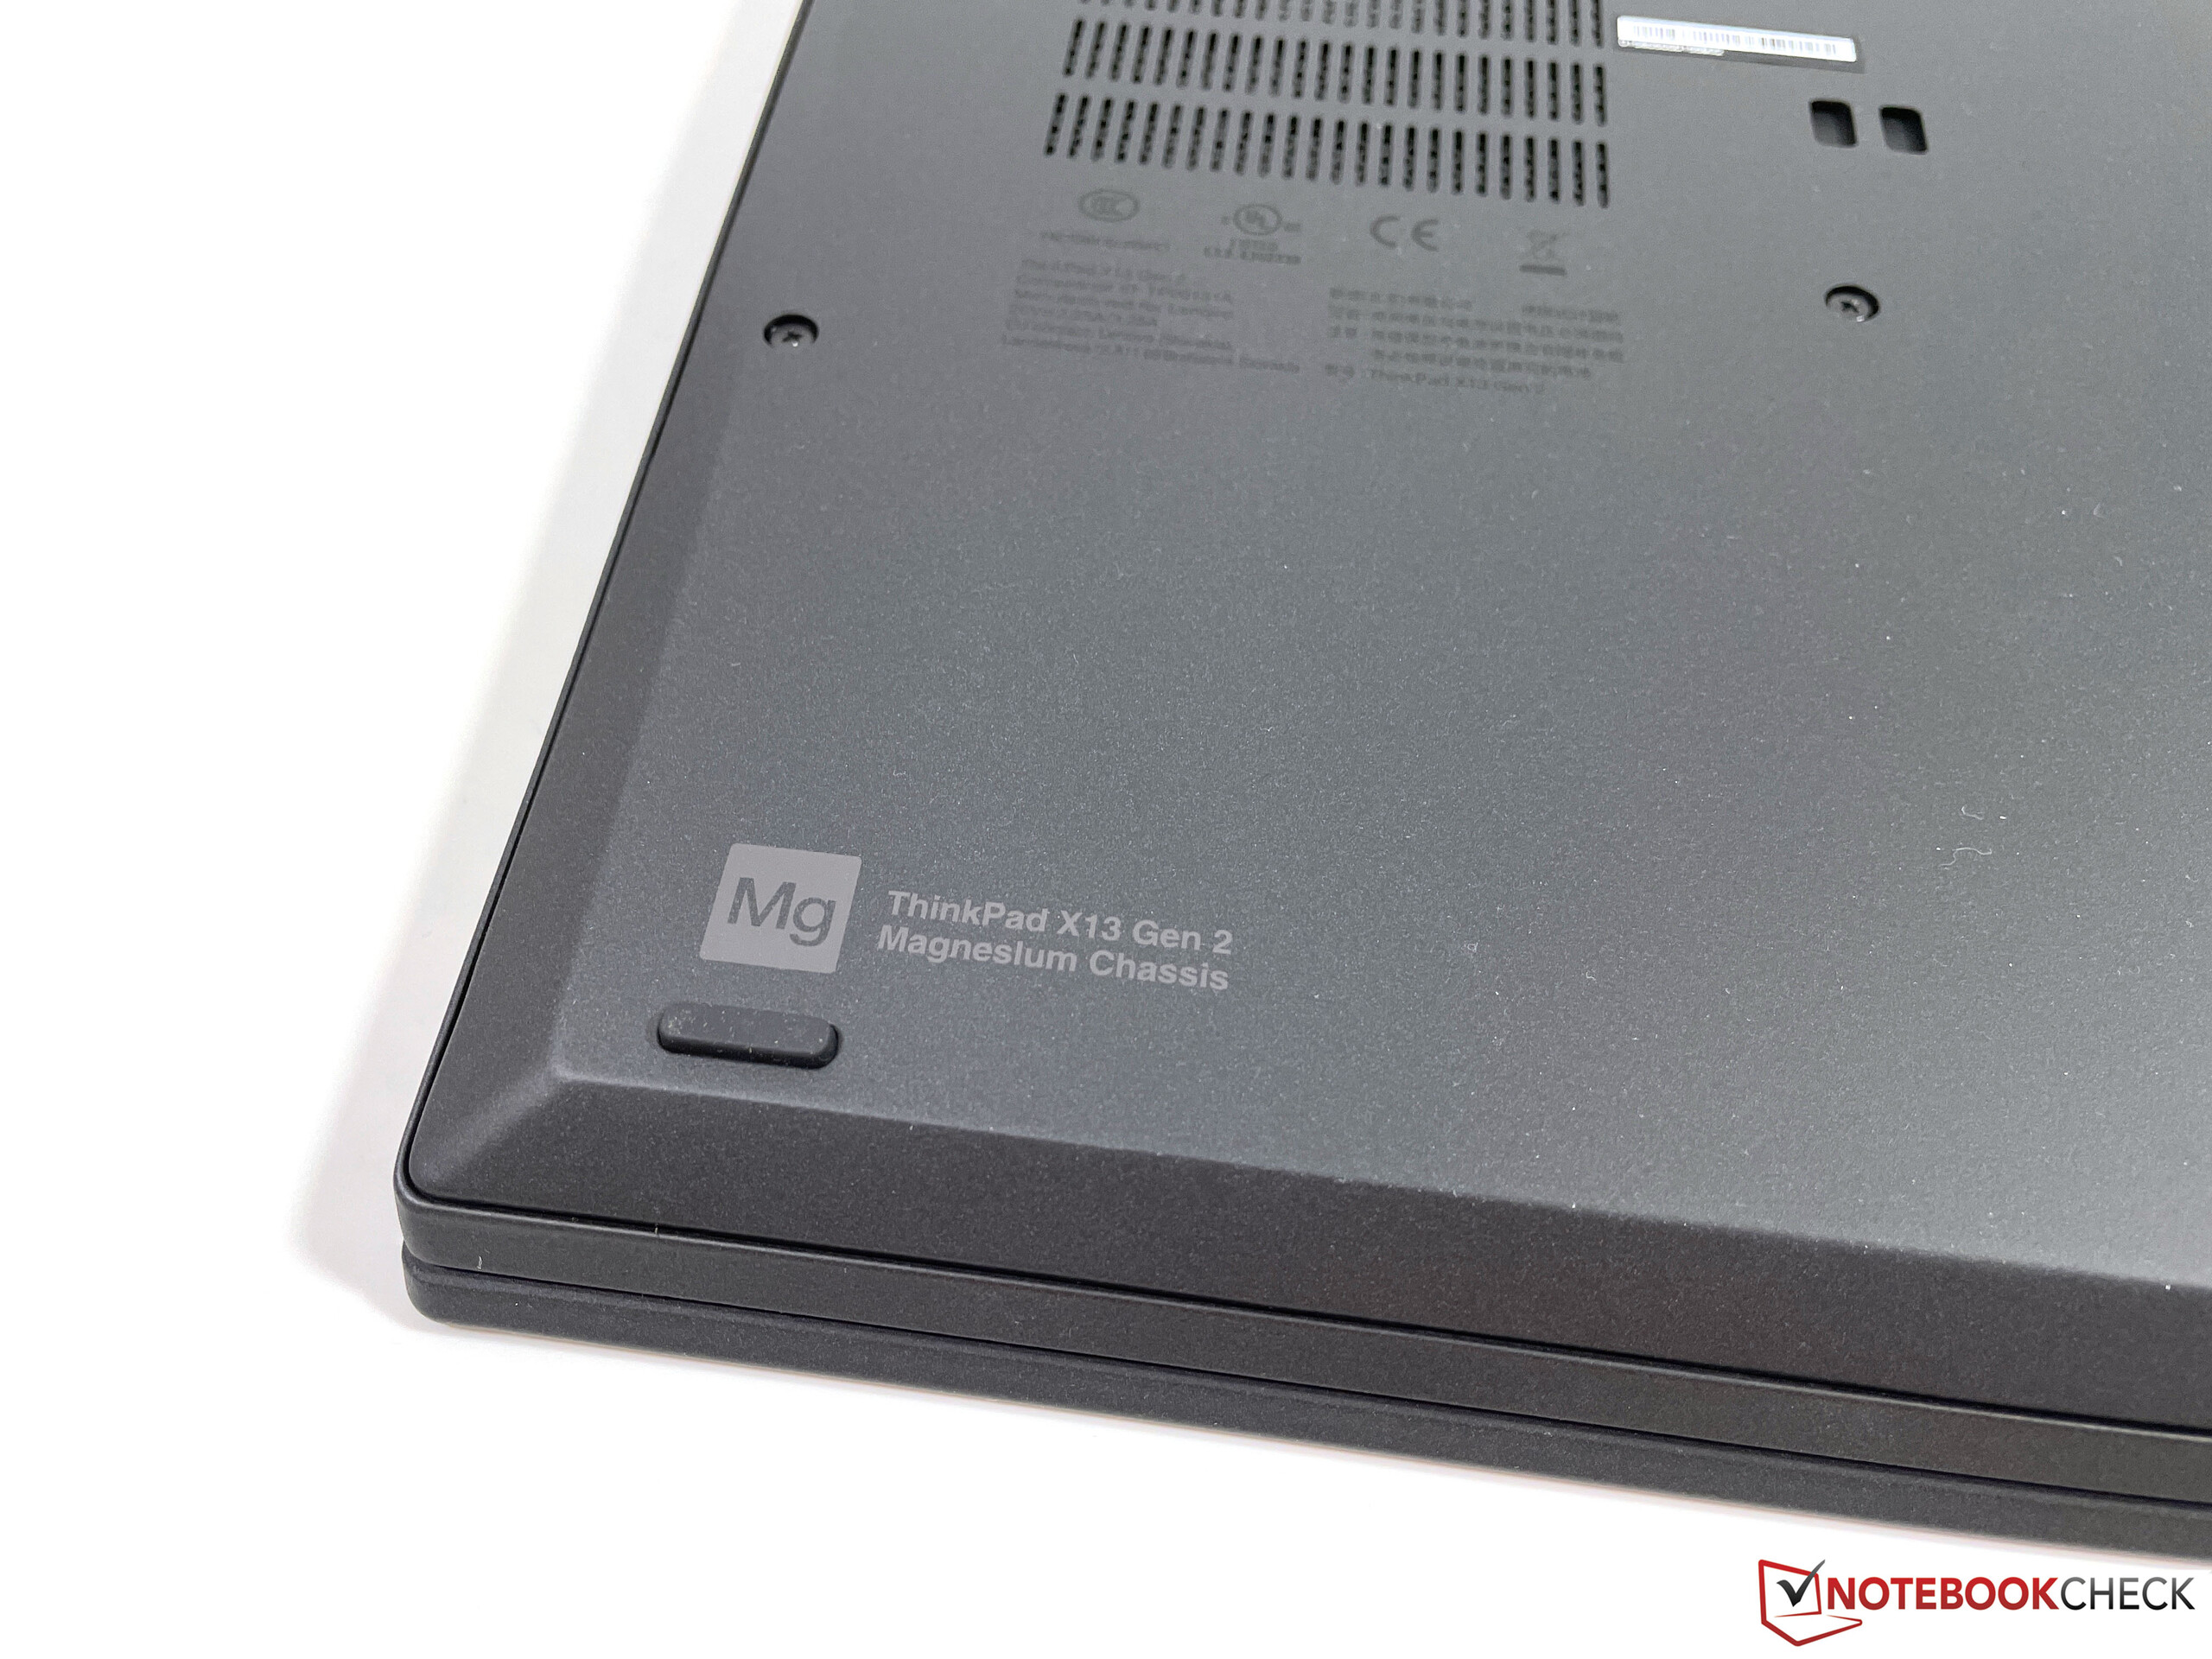
Malzemeler de biraz değişti ve X13 Yoga G2'de de önemli farklılıklar var. Taban ünitesinin hem üst hem de alt kısmı magnezyumdan yapılmıştı, ancak yeni modelde sadece magnezyumdan yapılmış bir üst kısım var ve yüzey de biraz daha pürüzlü. İkincisi, parmak izlerini bu kadar çabuk görmemeniz avantajına sahiptir. Alt panel artık alüminyumdan yapılmıştır. Sonuç olarak, ana ünitenin kararlılığı çok iyidir ve ana üniteyi döndürmeye çalıştığımızda yalnızca bazı gıcırdayan sesler çıkarabiliriz.
Kapak artık bir PPS plastik/cam elyaf kompozitinden değil, sadece PPS plastikten yapılmıştır. Kapak çok sağlamdır ve resim tahrişlerine neden olamayız. İki menteşe bir kez daha maksimum 180 derece açılma açısına izin veriyor, ancak zevkimize göre biraz daha sıkı olabilirler. Biraz zıplama var ve kapak yaklaşık 20 derecelik bir açıyla kapanıyor.
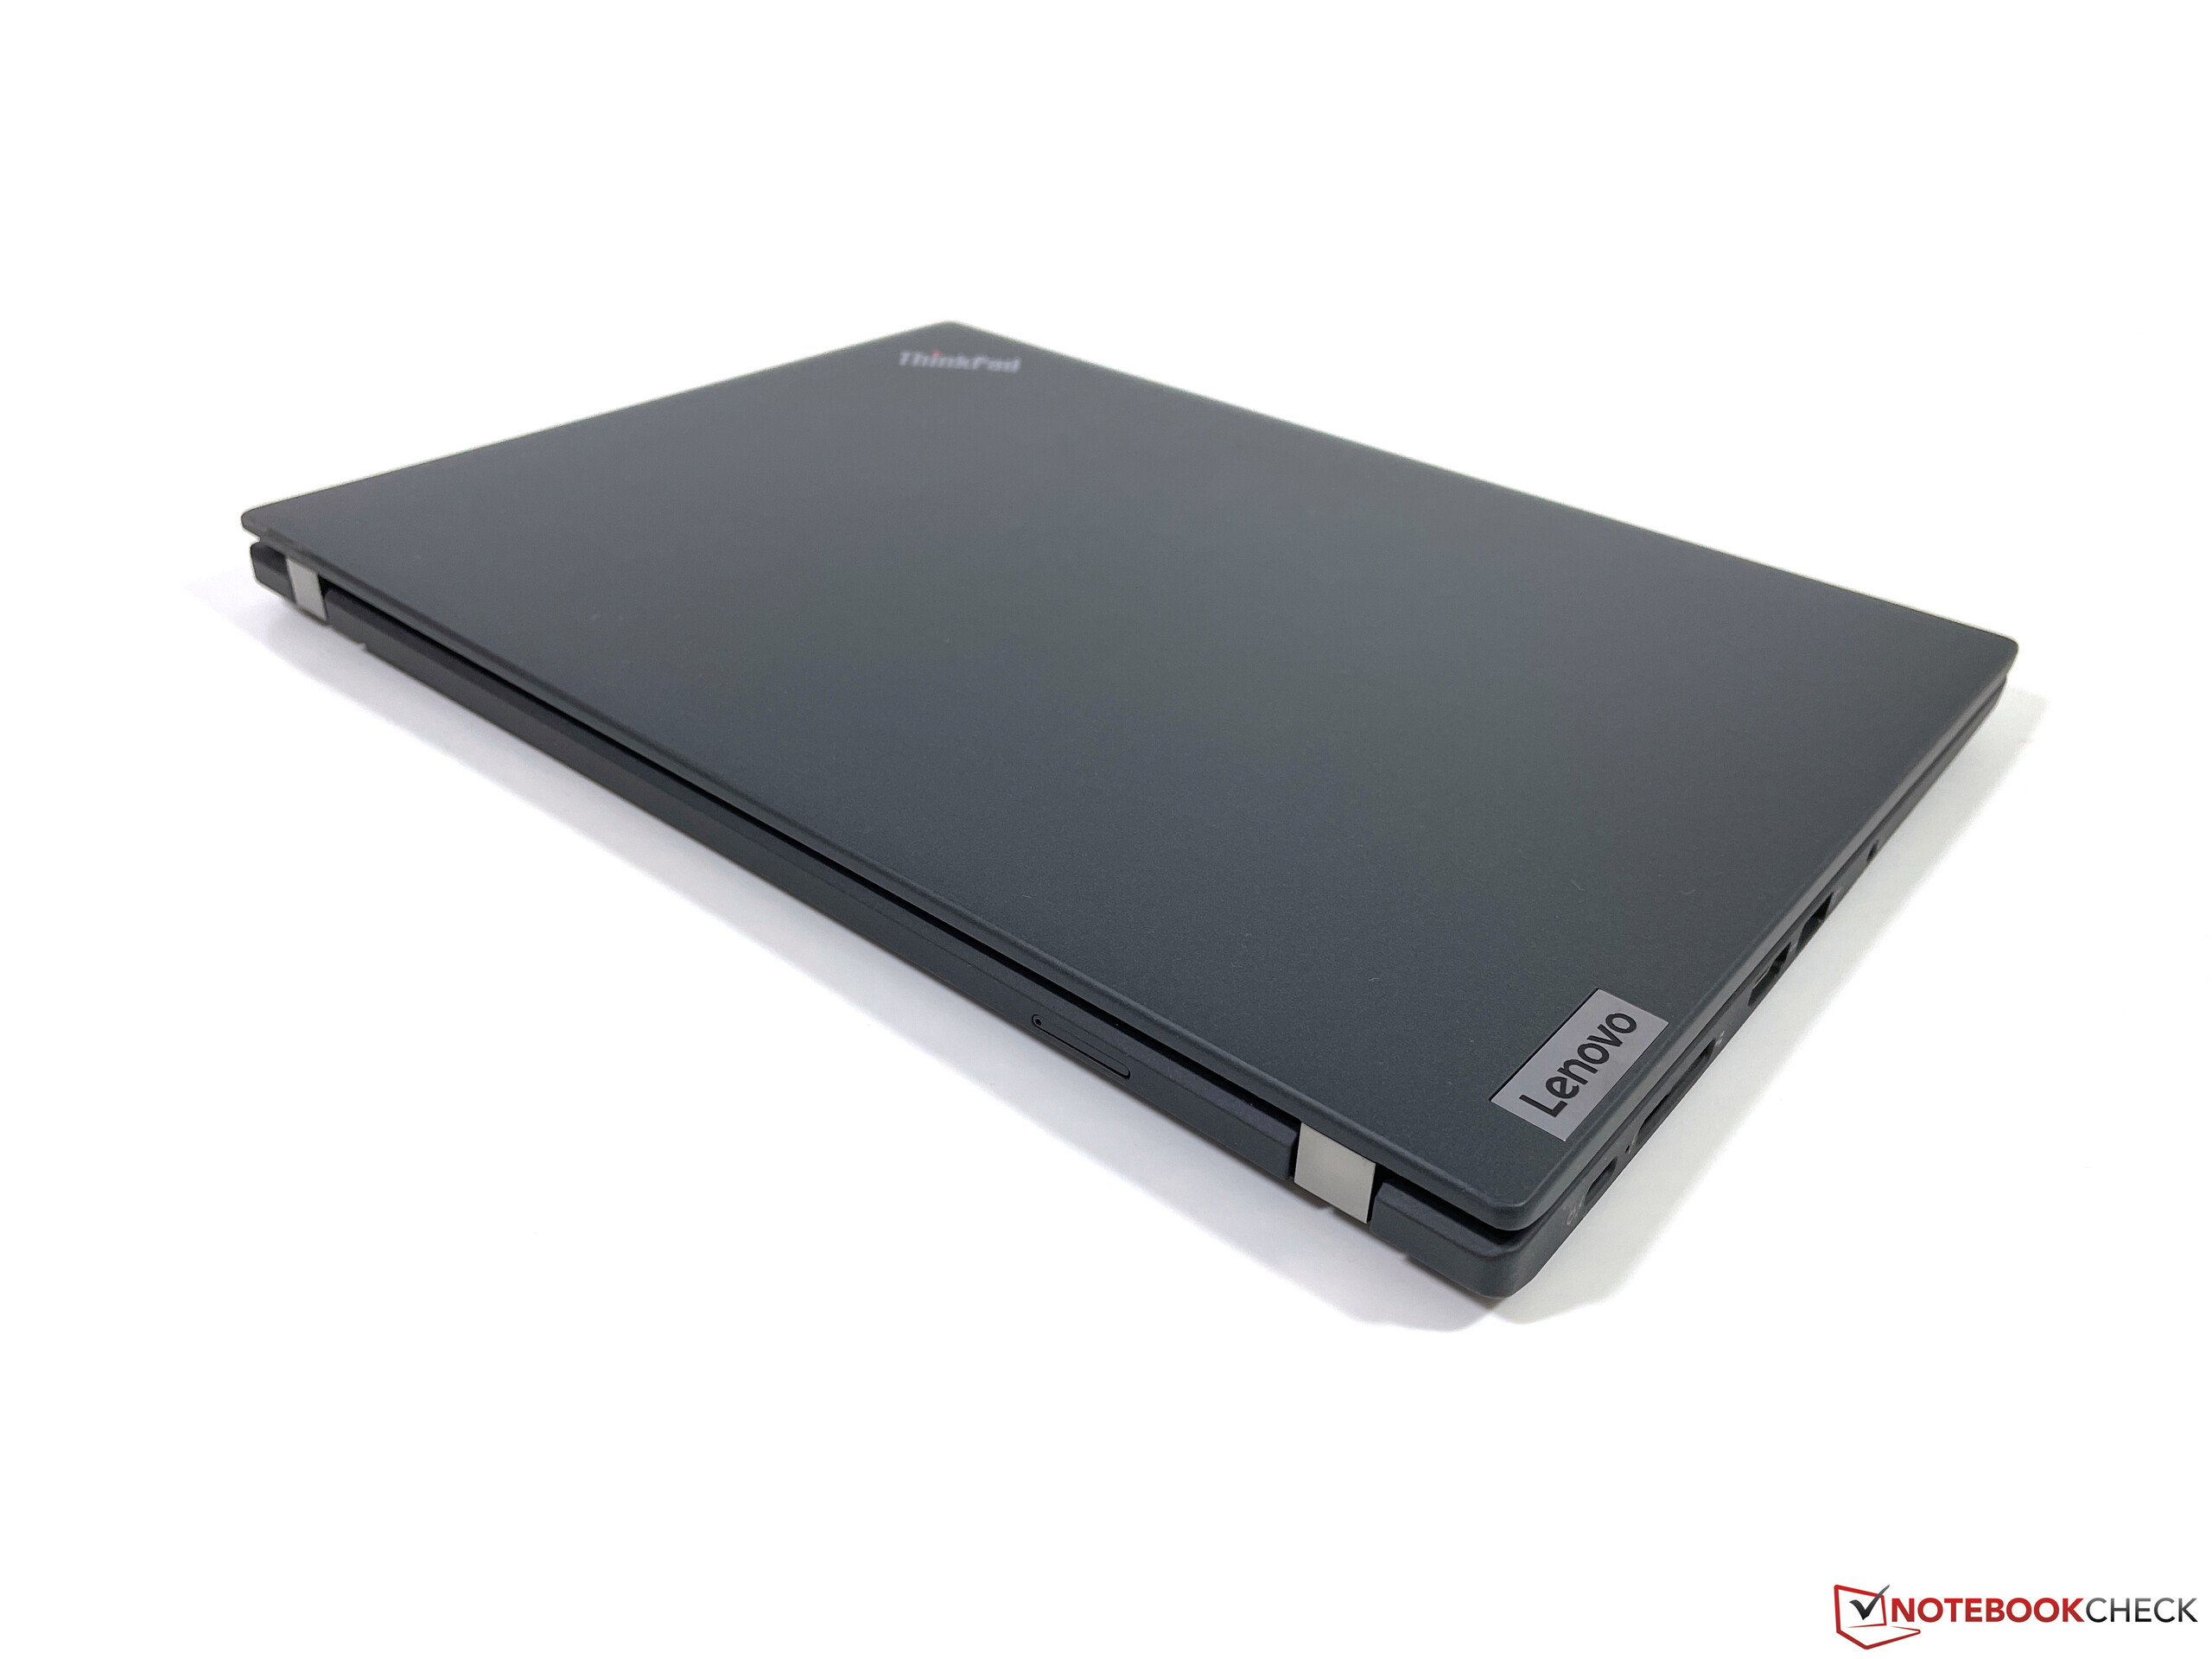

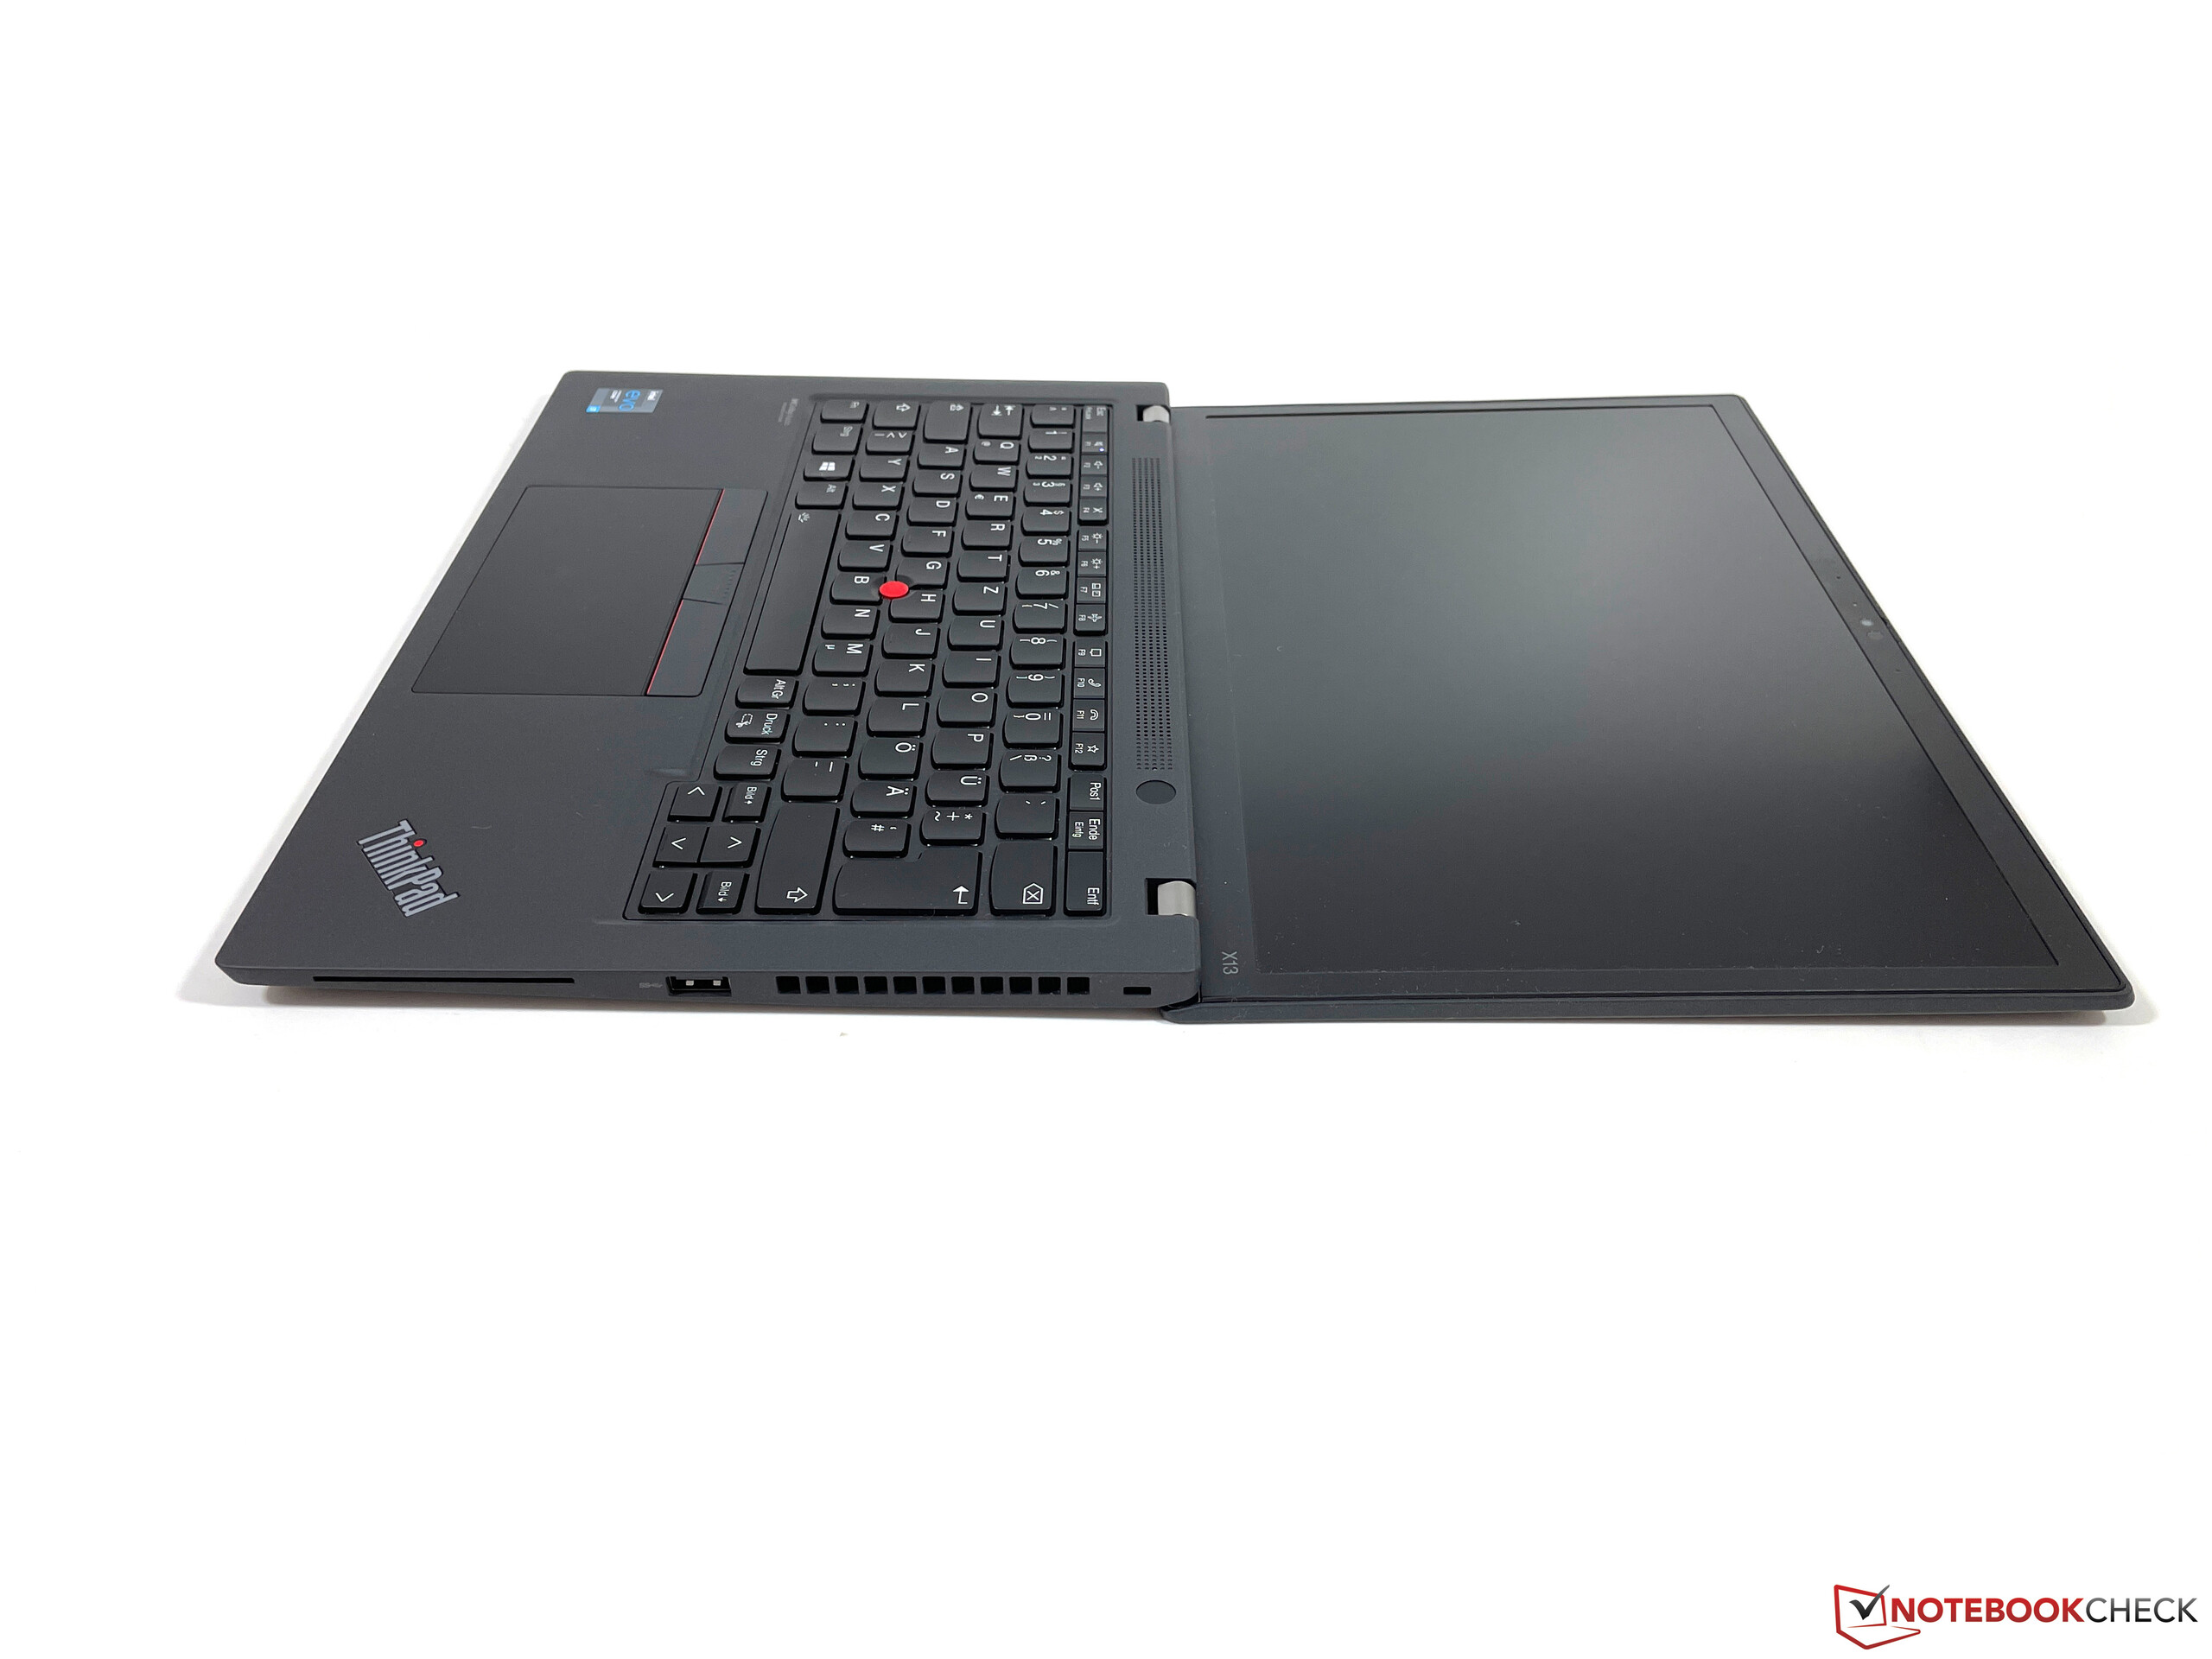
Eski ThinkPad X13 ile karşılaştırıldığında, yeni model biraz daha dar ancak boyutları ve yaklaşık 1,3 kg ağırlığı karşılaştırılabilir. Diğer tüm karşılaştırma aygıtları da aynı oyun sahasındadır, yalnızca Dell XPS 13 çok daha kompakttır.
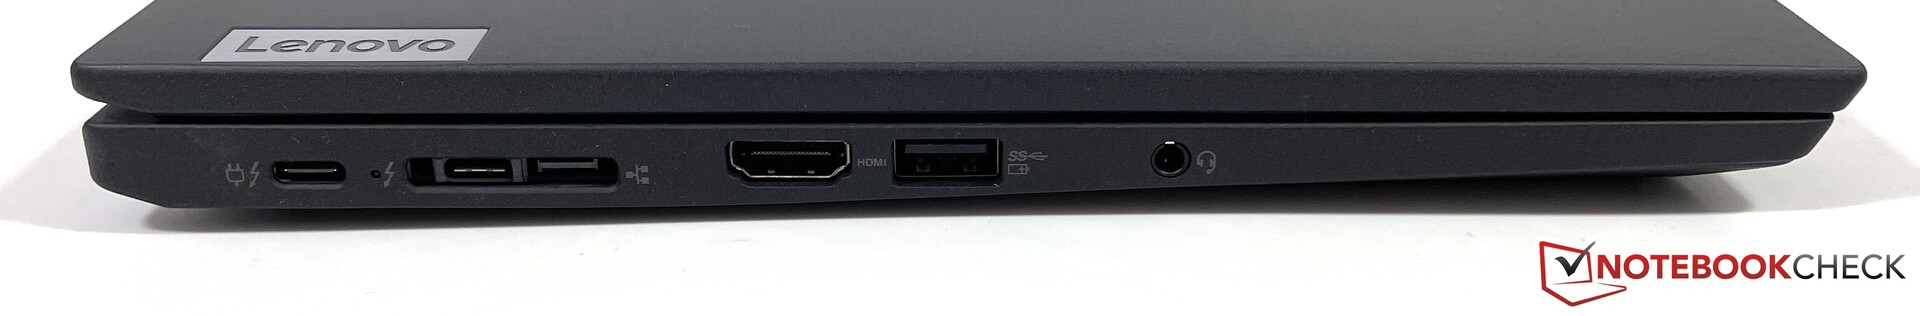
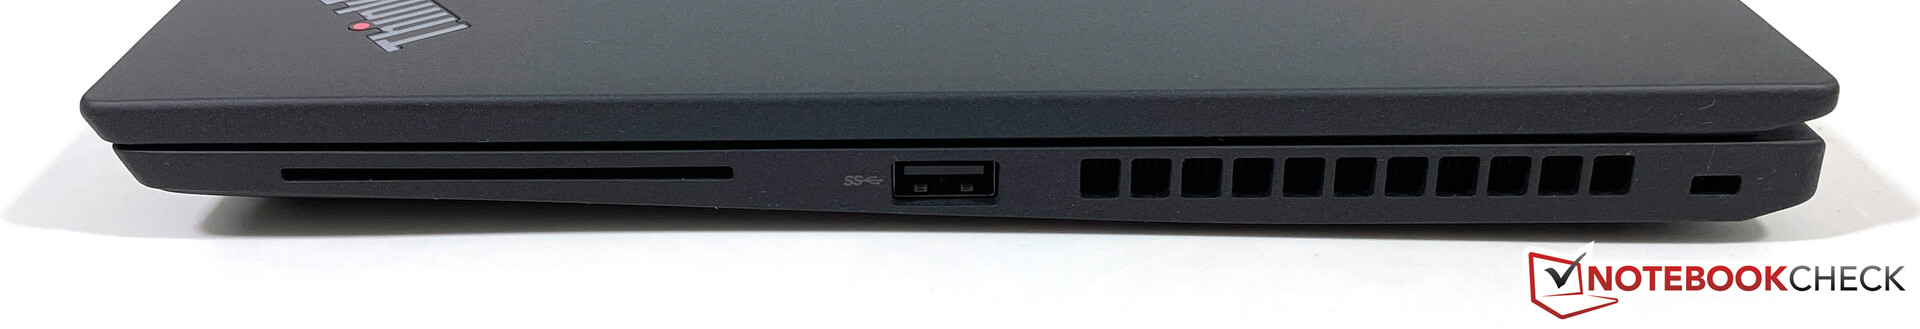
Bağlanabilirlik - X13 şimdi Thunderbolt 4 ile geliyor
X13 G2'deki bağlantı noktası seçenekleri rakiplerine göre çok daha iyi. Yalnızca Thunderbolt 4 destekli iki USB-C bağlantı noktası değil, aynı zamanda tam boyutlu bir HDMI çıkışı ve iki normal USB-A bağlantı noktası elde edersiniz. Ancak, SD kart okuyucu yok.
İletişim - 5G bir seçenek olarak sunulmuşİletişim - 5G bir seçenek olarak sunulmuş
Lenovo, kablolu Gigabit-Ethernet'e (adaptör aracılığıyla) ek olarak, X13 G2'yi Intel'in (AX210) en yeni Wi-Fi 6E modülüyle de donatıyor. Netgear Nighthawk RAX120 yönlendirici ile standart Wi-Fi testimizde çok yüksek aktarım hızlarını yönetiyor ve inceleme süremiz boyunca ne Netgear yönlendiricide ne de AVM Fritz!Box 7590'da (Wi-Fi 5) herhangi bir bağlantı sorunu fark etmedik. ).
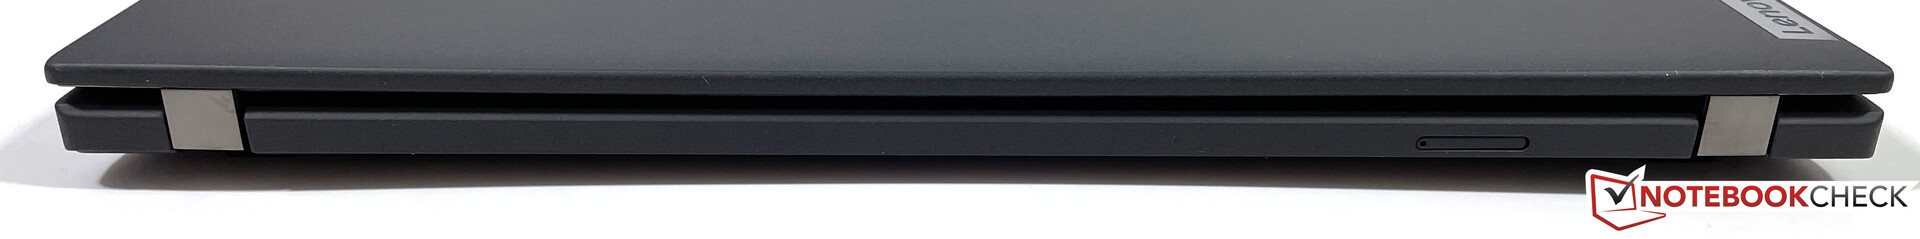
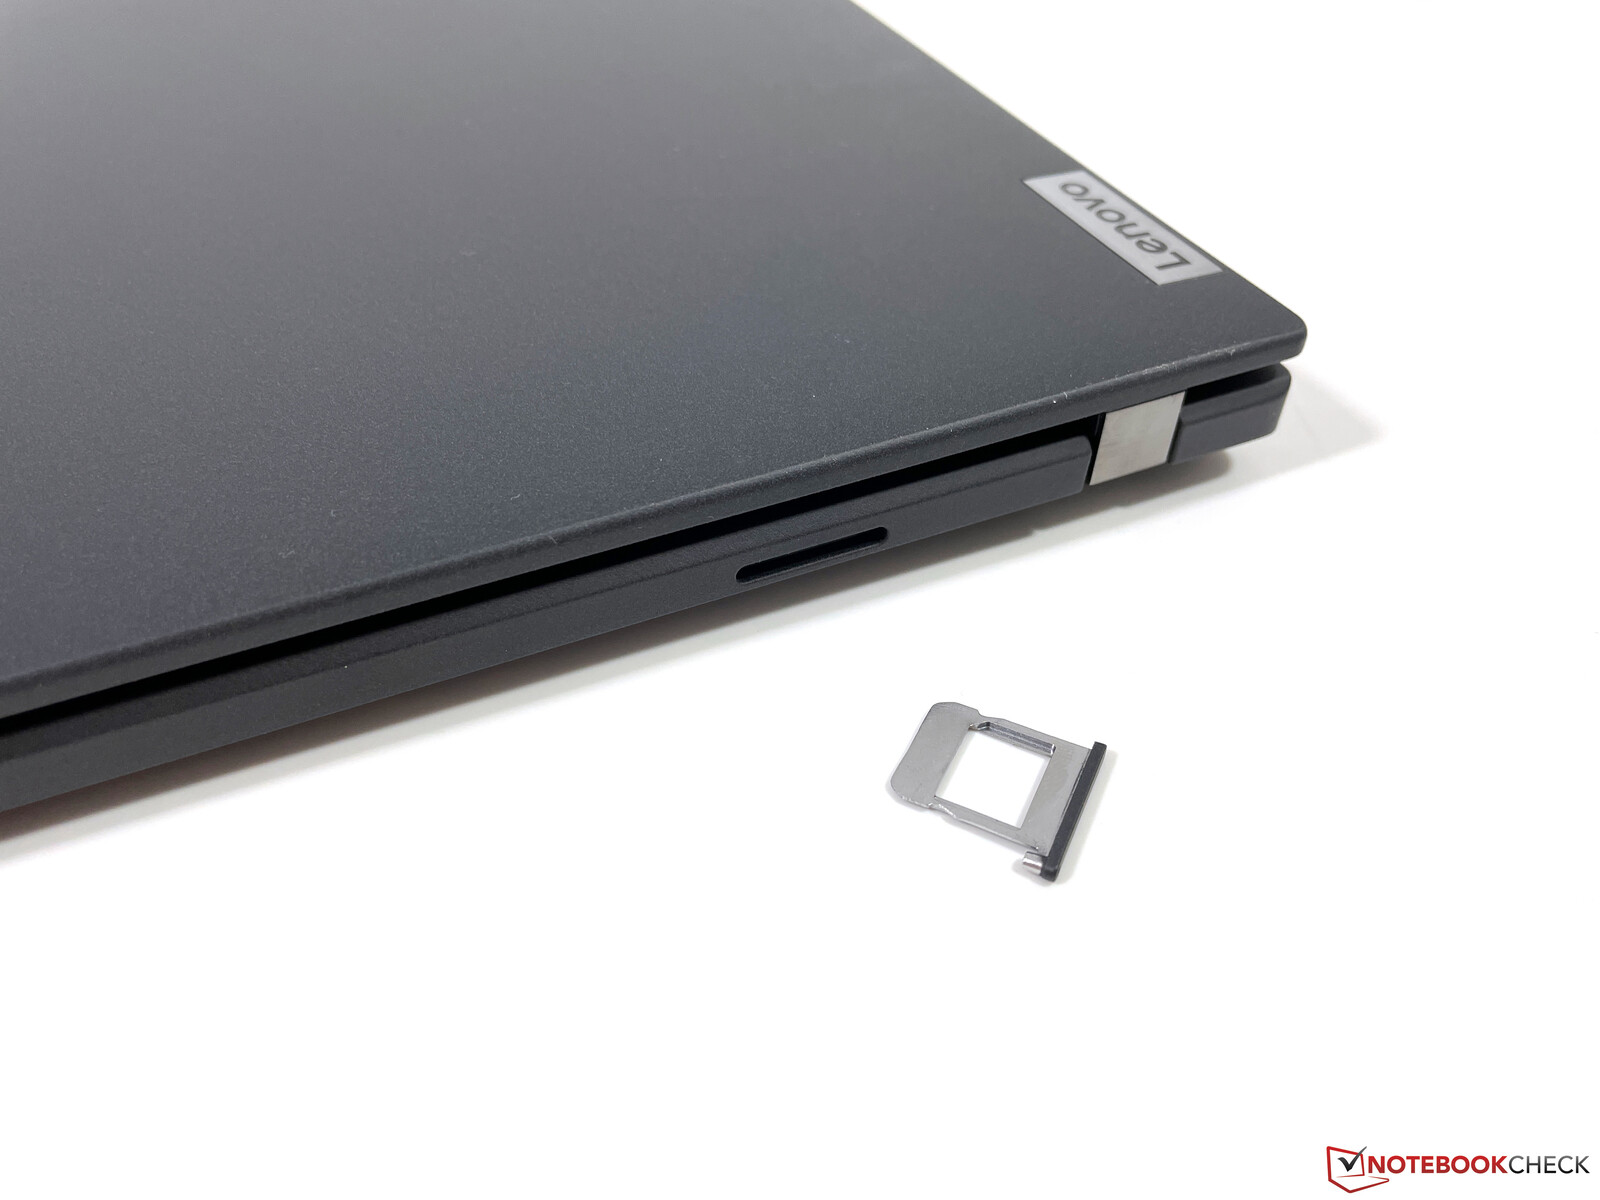
X13 G2'yi 4G veya 5G modemlerle de alabilirsiniz. İnceleme birimimiz Qualcomm'dan (Snapdragon X55) bir 5G modülü ile donatılmıştır, ancak yalnızca bir eSIM ile birlikte çalışır. Arkadaki Nano-SIM yuvası, T-Mobile'ın SIM kartımızla çalışmadı.
| Networking | |
| iperf3 transmit AX12 | |
| Lenovo ThinkPad X13 G2 20WK0024GE | |
| Ortalama Intel Wi-Fi 6E AX210 (675 - 1602, n=27) | |
| Huawei MateBook X Pro 2021 | |
| HP EliteBook 830 G7 | |
| Dell XPS 13 9310 Core i7 FHD | |
| Lenovo ThinkPad X13-20UGS00800 | |
| Apple MacBook Pro 13 Late 2020 M1 Entry (8 / 256 GB) | |
| iperf3 receive AX12 | |
| Lenovo ThinkPad X13 G2 20WK0024GE | |
| Dell XPS 13 9310 Core i7 FHD | |
| Huawei MateBook X Pro 2021 | |
| HP EliteBook 830 G7 | |
| Lenovo ThinkPad X13-20UGS00800 | |
| Ortalama Intel Wi-Fi 6E AX210 (914 - 1716, n=27) | |
| Apple MacBook Pro 13 Late 2020 M1 Entry (8 / 256 GB) | |
Kamera - ThinkPad şimdi 1080p’li
Lenovo şimdi 2MP'lik bir 1080p kamera kullanıyor ve görüntü kalitesi eskisinden biraz daha iyi. Kamera açıkça video konferanslar ve benzerleri için çalışıyor, ancak yine de harika fotoğraflar çekmiyor.


Bakım
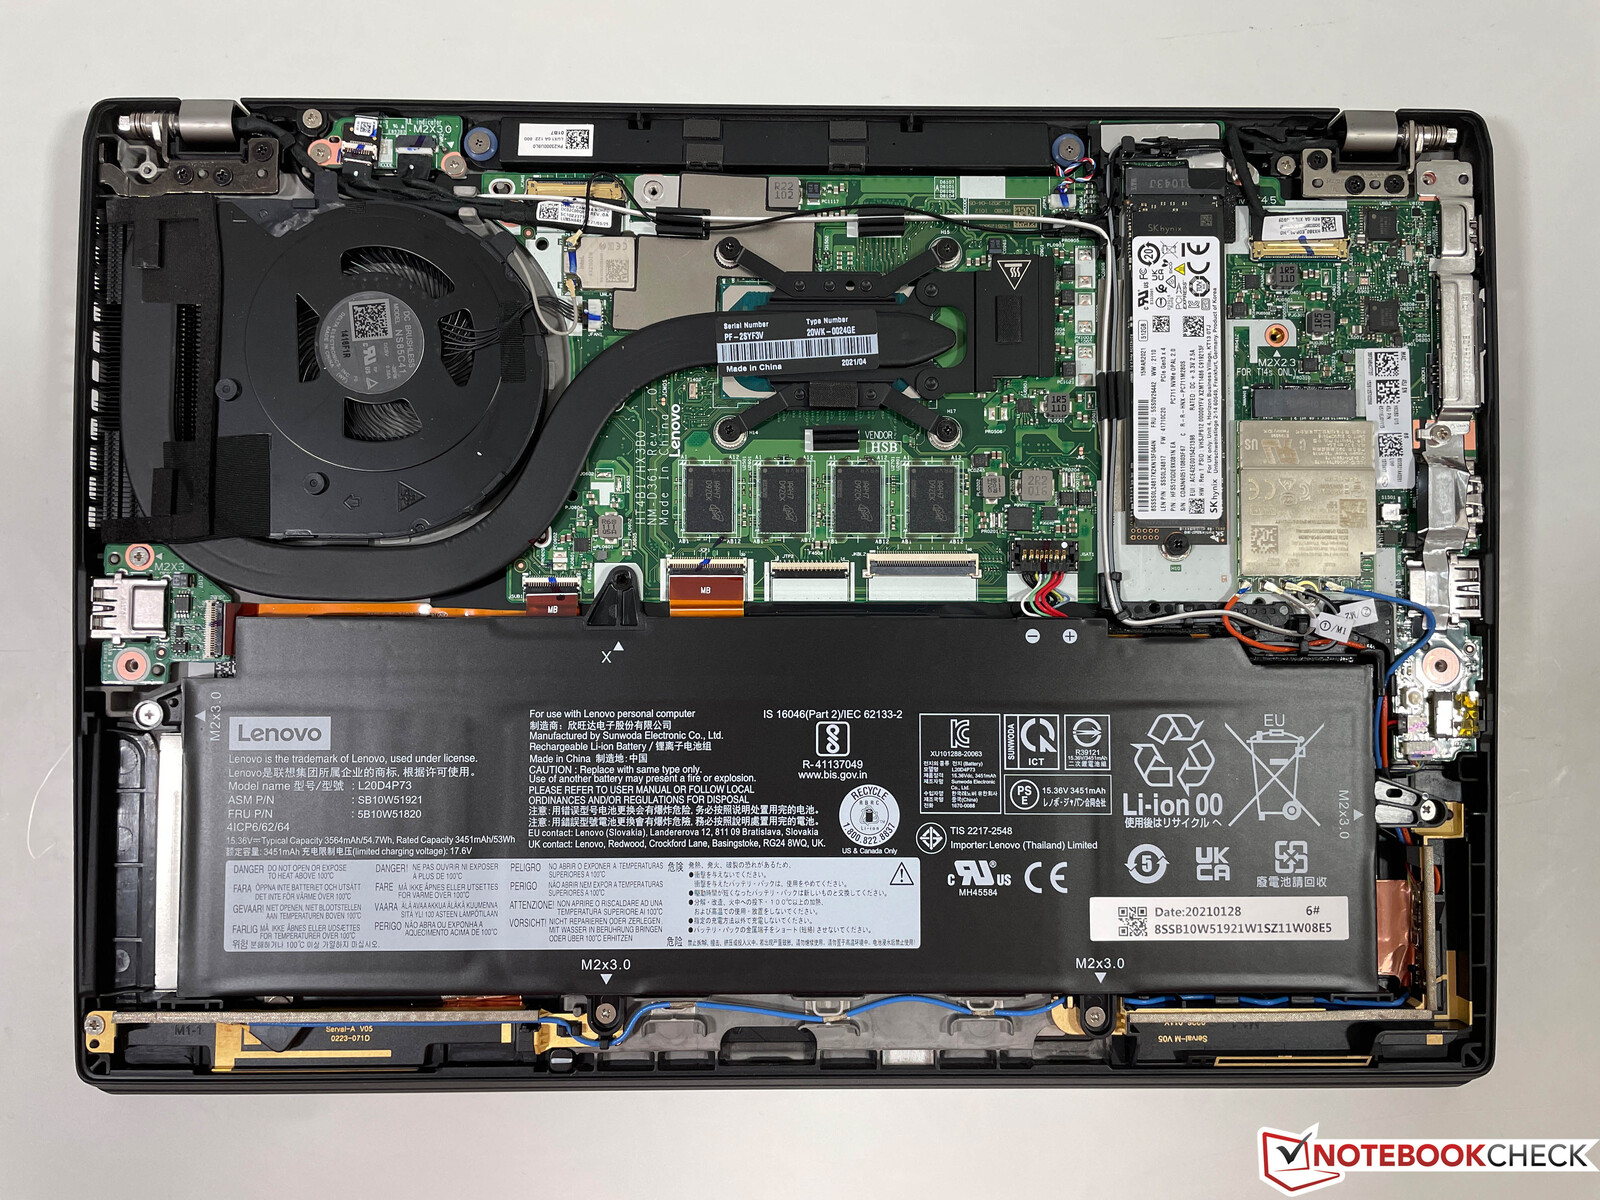
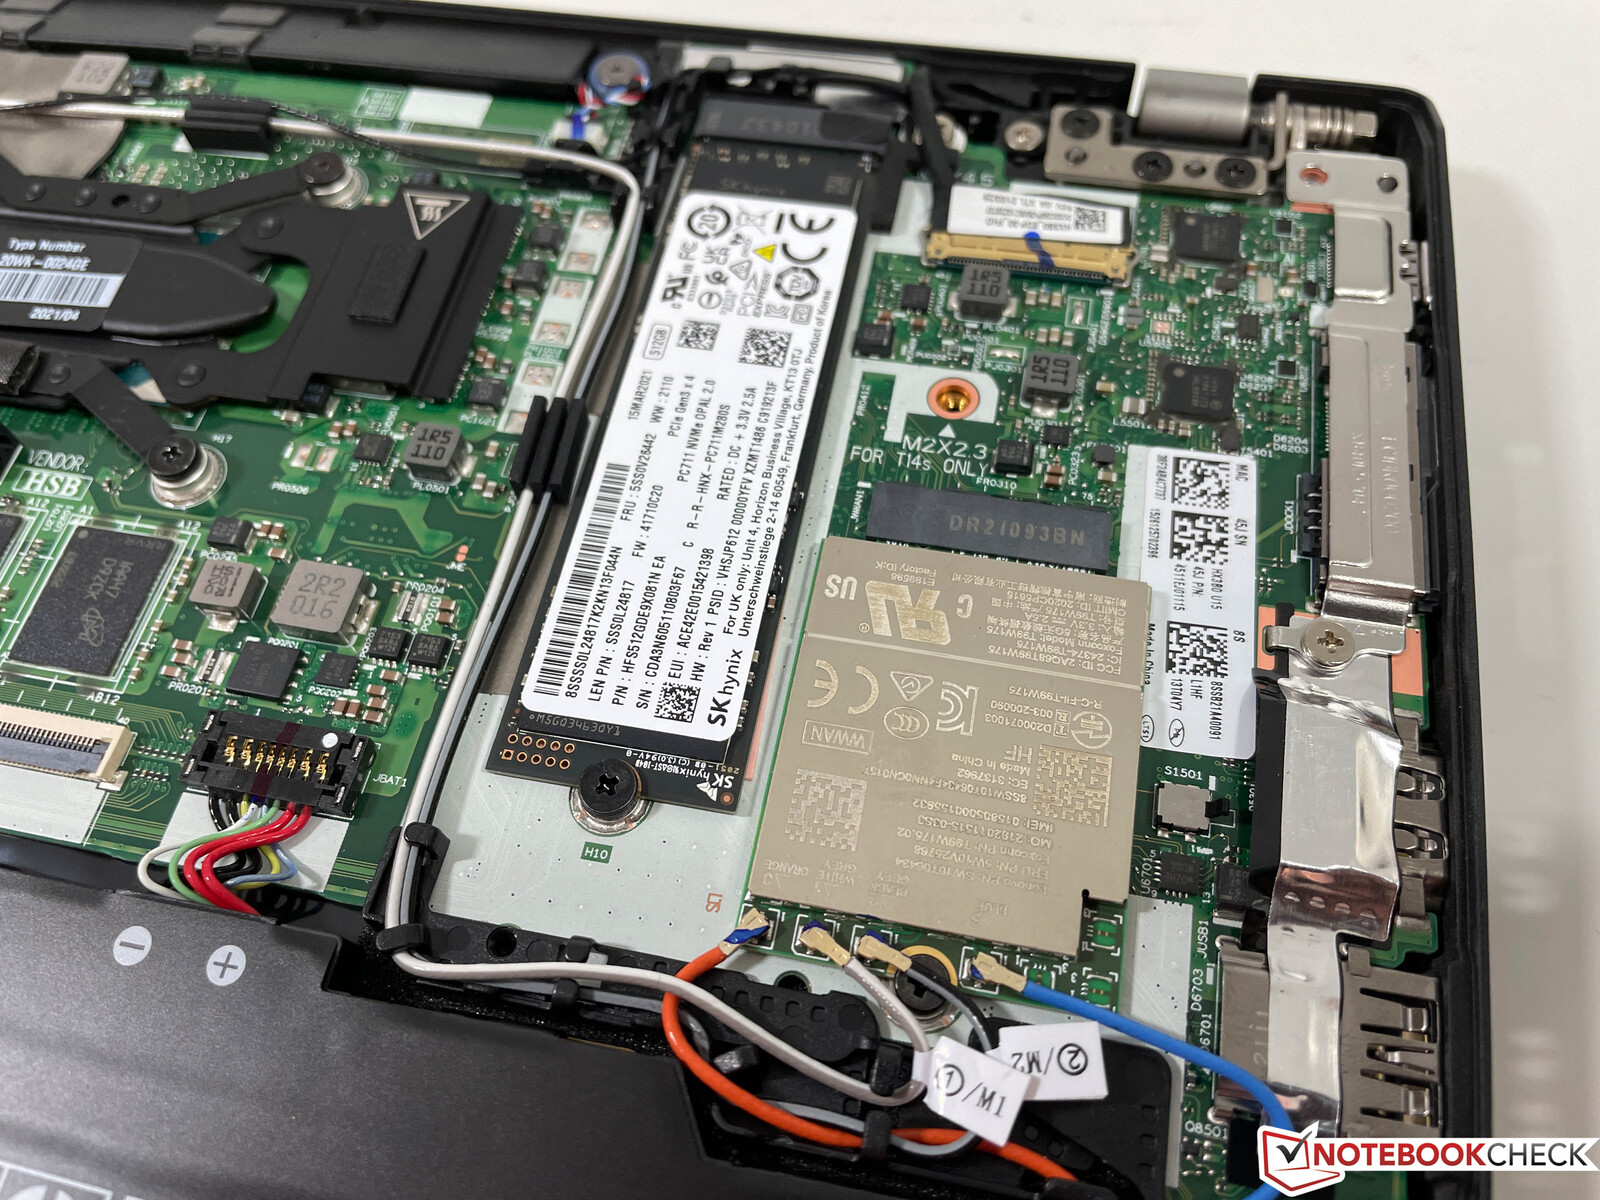
Alt panel bir çift Philips vida ile sabitlenmiştir ve çıkarılması kolaydır. Lenovo, X13 G2 ve T14s G2 için aynı anakartı kullanıyor ve kullanıcı içeride pek bir şey yapamıyor. Hem Wi-Fi modülü hem de bellek lehimlidir, bu nedenle M.2-2280 SSD'nin yanı sıra yalnızca WWAN modülüne erişebilirsiniz ve fan da temizlenebilir.
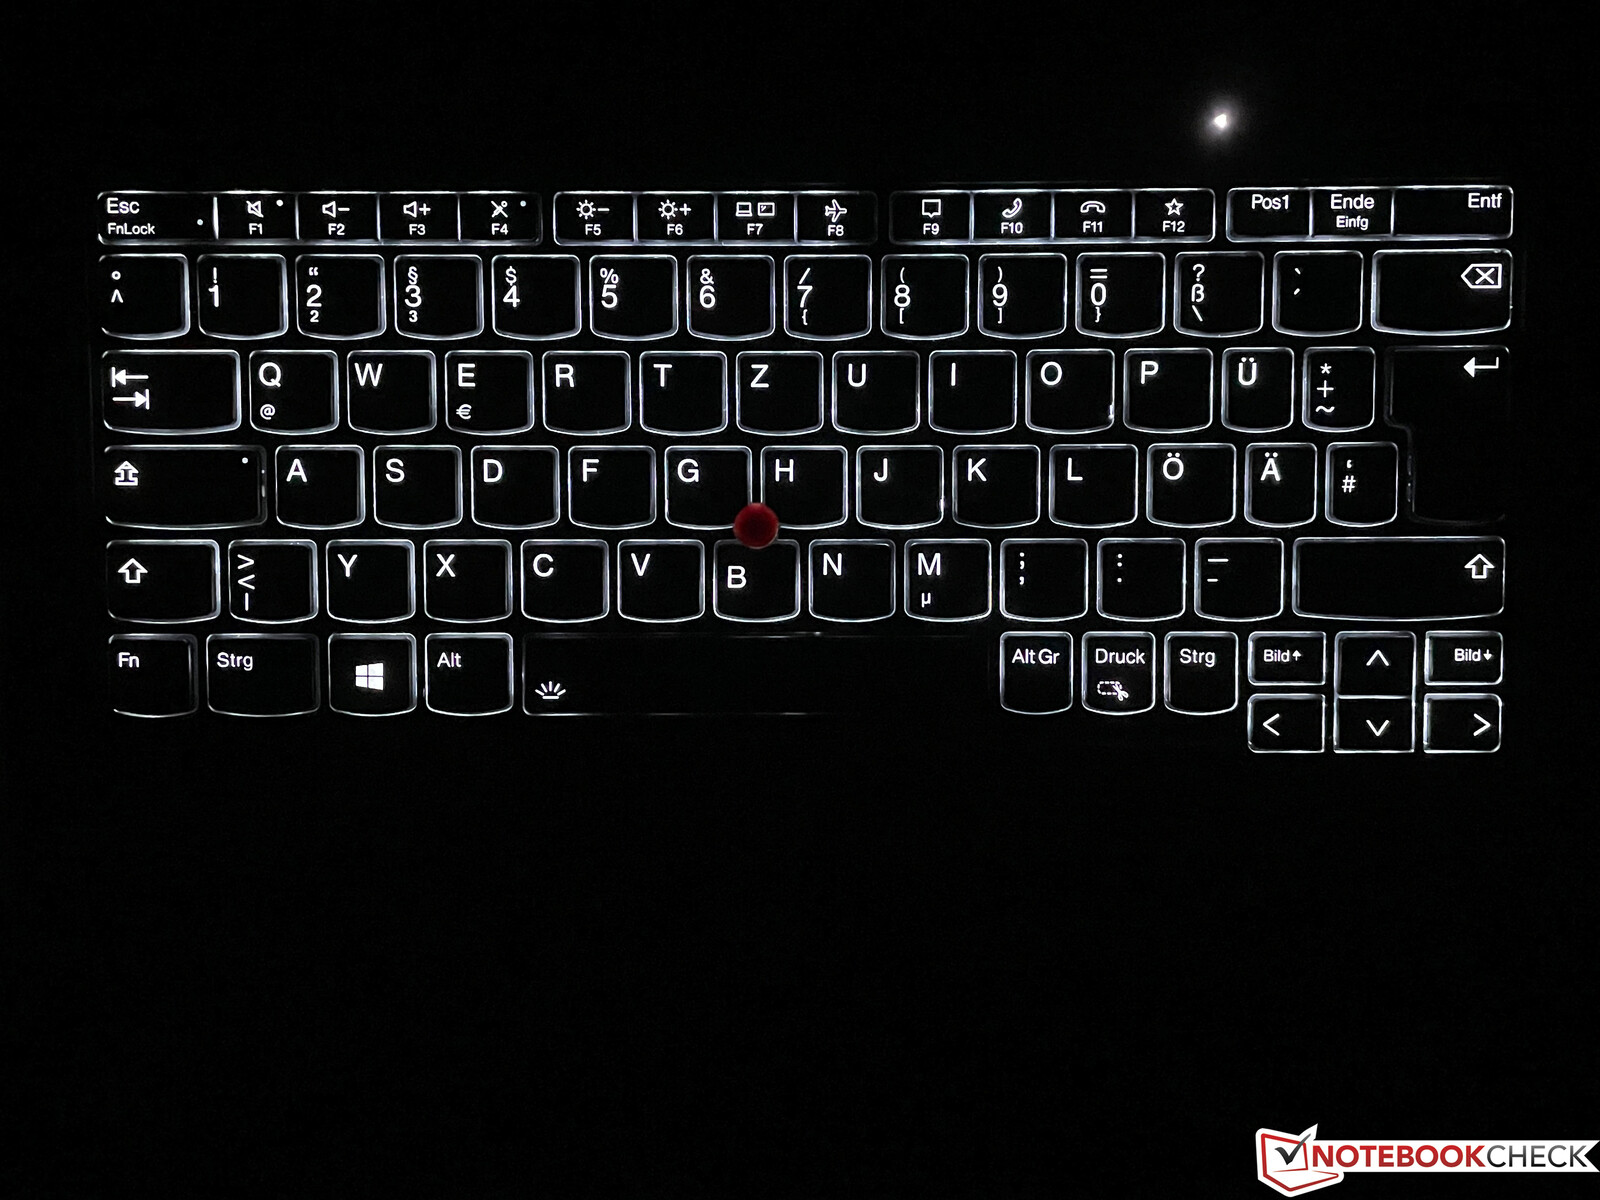
Giriş Aygıtları - Daha yüzeysel tuşlar ve azaltılmış tuş işleme(travel) uzaklığı
Klavye
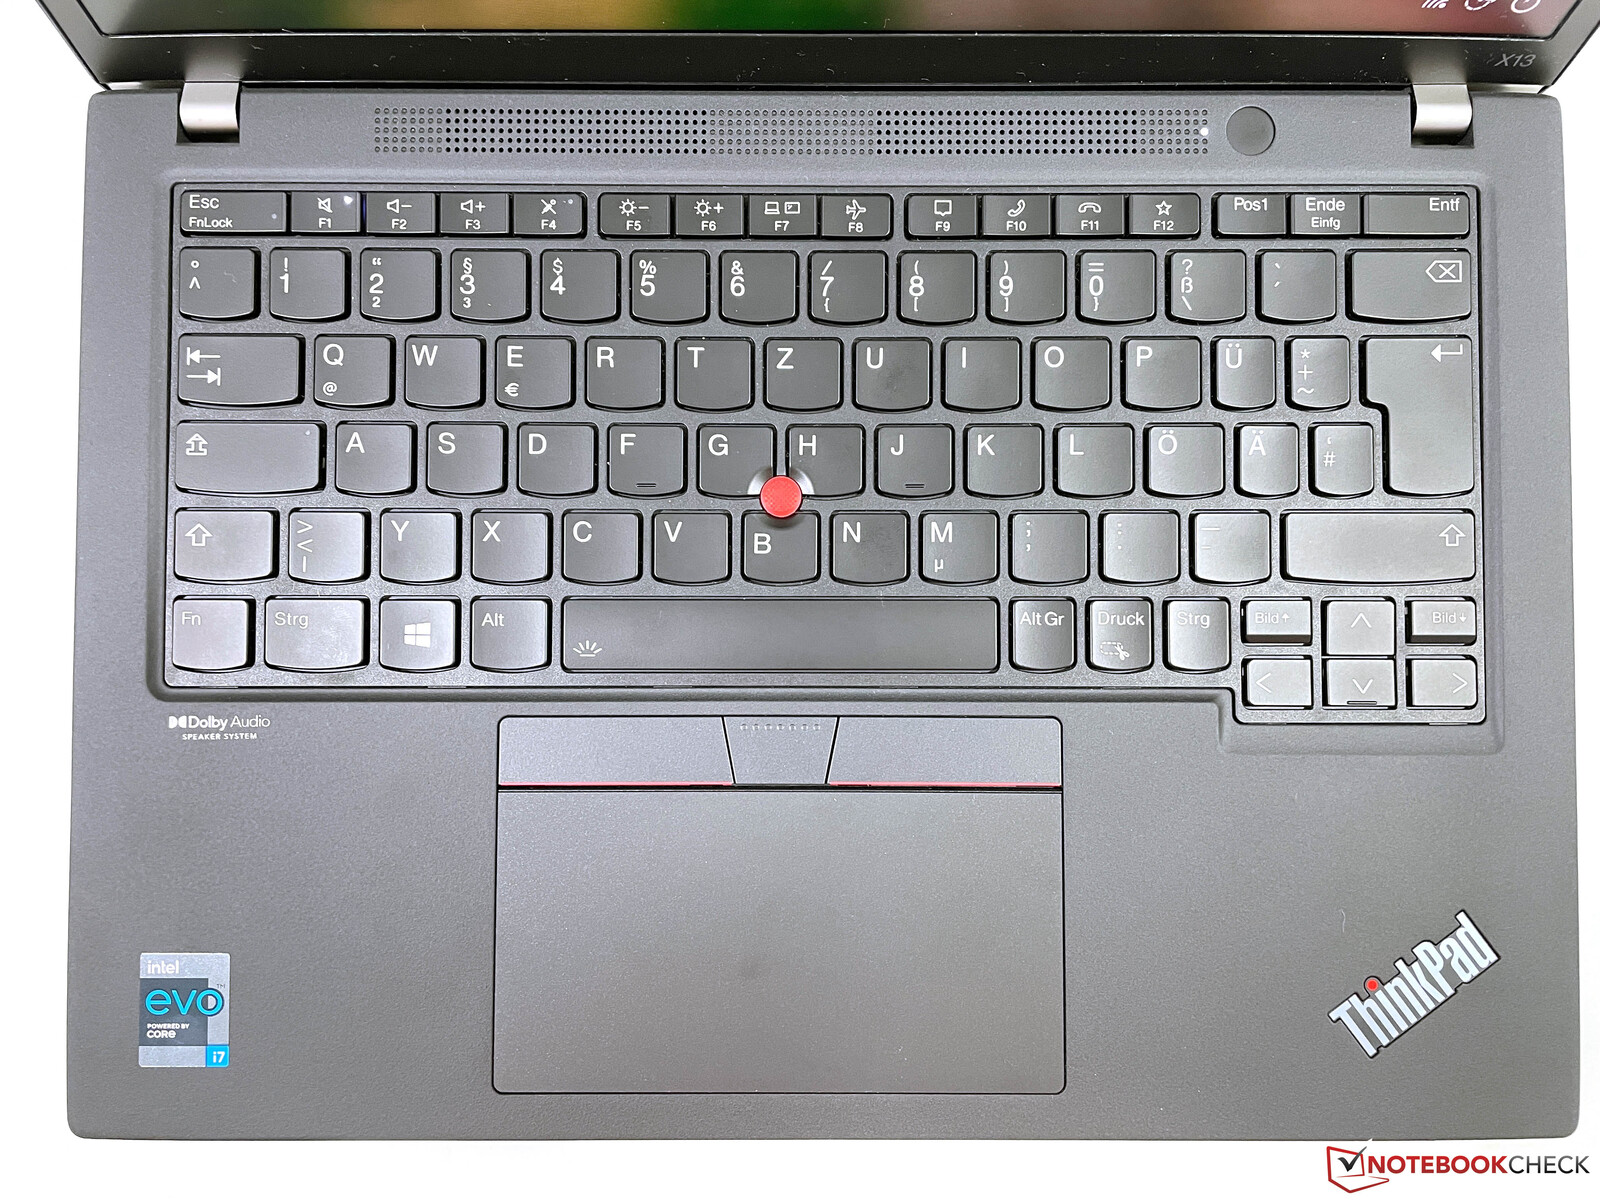
Klavyenin genişliği bir kez daha biraz azaldı (normal boyutun yaklaşık %95'i), ancak buna oldukça çabuk alışacaksınız. Ancak, mevcut ThinkPad X1 Carbon'a benzer şekilde, tuşlar artık 1,5 mm'lik azaltılmış tuş hareket mesafesine sahip ve tuşlar da daha düz. Bu açıkça yazma deneyimini etkiler. Tüketici dizüstü bilgisayarlarına kıyasla hala avantajlar var, ancak HP veya Dell'in diğer iş klavyeleri hemen hemen aynı seviyede ve artık ThinkPad X13 G2'nin büyük bir avantajı yok. Elbette burada yüksek seviyeden şikayet ediyoruz ve klavye daha uzun metinler için de uygun ama bir önceki modelin bu kategoride büyük bir avantajı vardı.
Yine de, iyi çalışan ve karanlık ortamlarda çalışmayı çok daha kolay hale getiren iki aşamalı beyaz arka plan aydınlatması elde edersiniz.
Dokunmatik Yüzey ve TrackPoint
Lenovo artık yeni X13 G2 için çok daha geniş bir dokunmatik yüzey (11.5 x 6.1 cm) kullanıyor ve kullanımı kolay. Pürüzsüz yüzey iyi kayma özellikleri sağlar, ancak dokunmatik yüzeyin alt kısmına tıkladığınızda oldukça yüksek ve ucuz bir tıklama sesi duyarsınız.
Kırmızı TrackPoint ve klavyenin üzerindeki ek düğmeler bir kez daha mevcuttur ve alıştıktan sonra kullanımı kolaydır. Özel düğmeler de iyi çalışır, ancak iki düğmenin tıklama sesi biraz farklıdır.
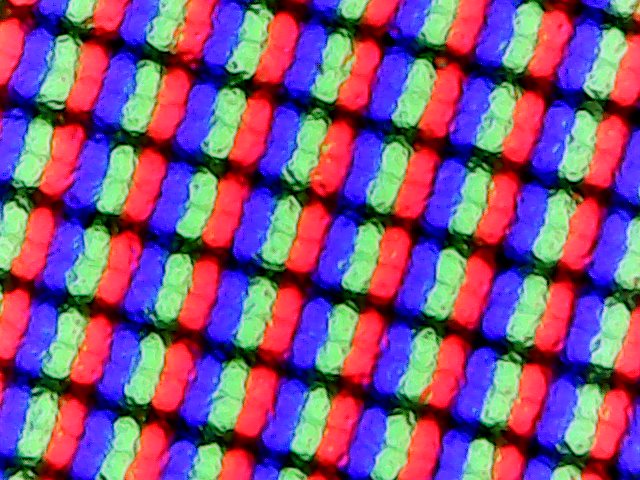
Ekran - 13,3 inç şimdi 16:10'da
Lenovo, X13 G2'yi 16:10 en boy oranına sahip mat 13,3 inç IPS ekranlarla donatıyor. Dört farklı seçenek arasından seçim yapabilirsiniz:
- WUXGA (1920 x 1200, 300 cd/m²)
- WUXGA (1920 x 1200, Dokunmatik, 300 cd/m²)
- WUXGA (1920 x 1200, Gizlilik Koruması, 500 cd/m²)
- WQXGA (2560 x 1600, LowPower, 400 cd/m²)
WQXGA panelini X13 Yoga G2'de inceleme şansımız oldu; X13 G2 inceleme birimimiz, varsayılan WUXGA ekran ve 300 nit parlaklık ile donatılmıştır. Ekranlardan biraz hayal kırıklığına uğradık; Lenovo'nun 14 inçlik serisinden bildiğimiz en az 400 nit ve LowPower ekran görmek isterdik.
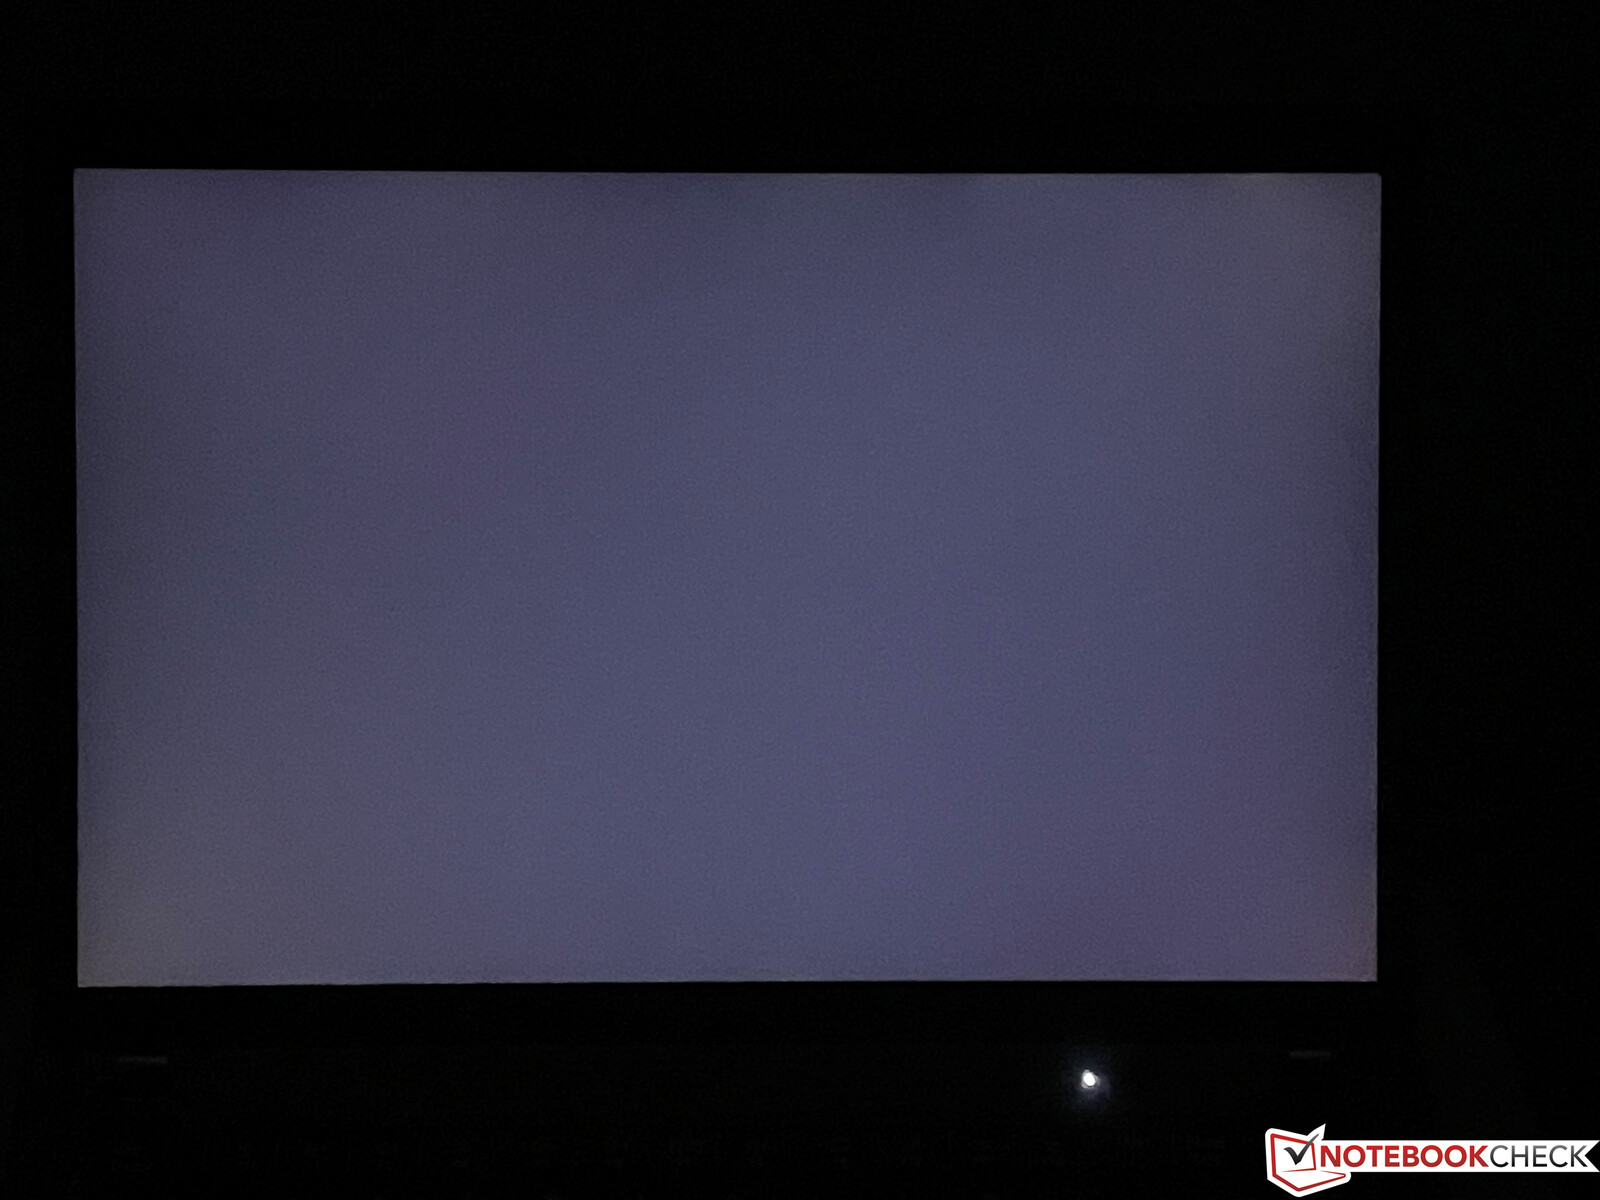
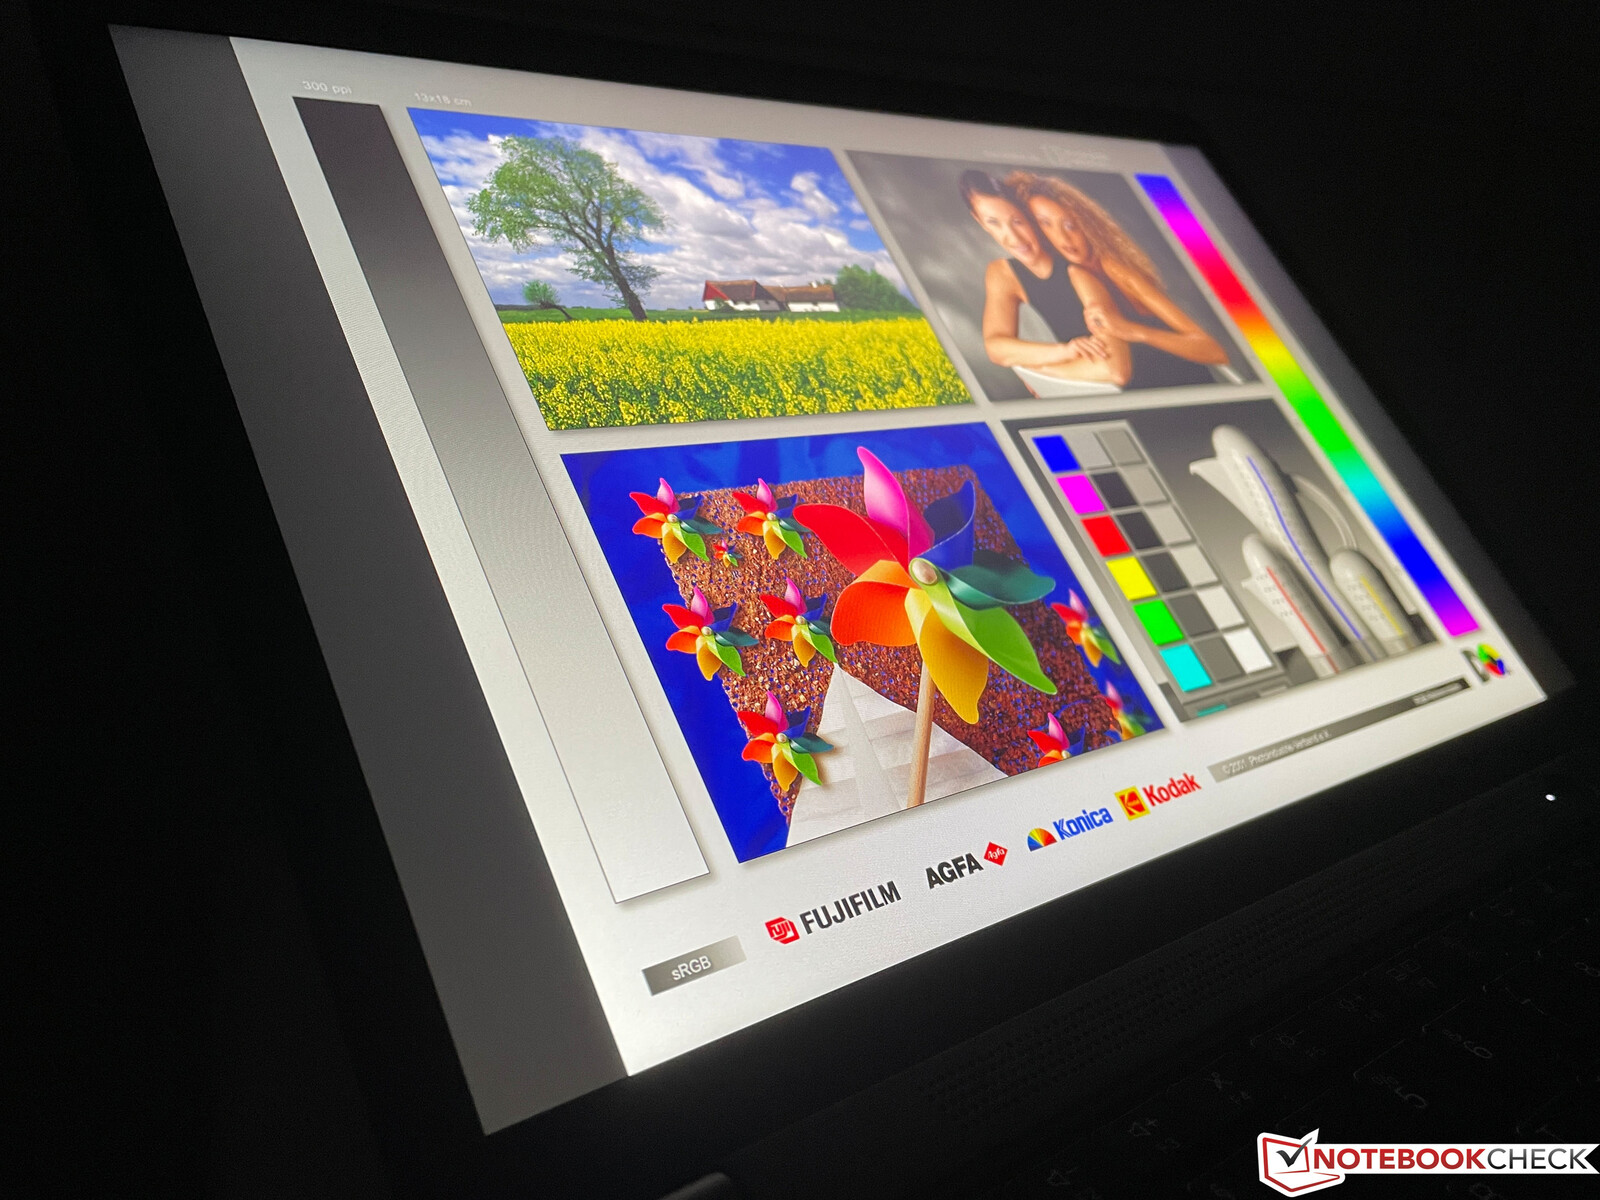
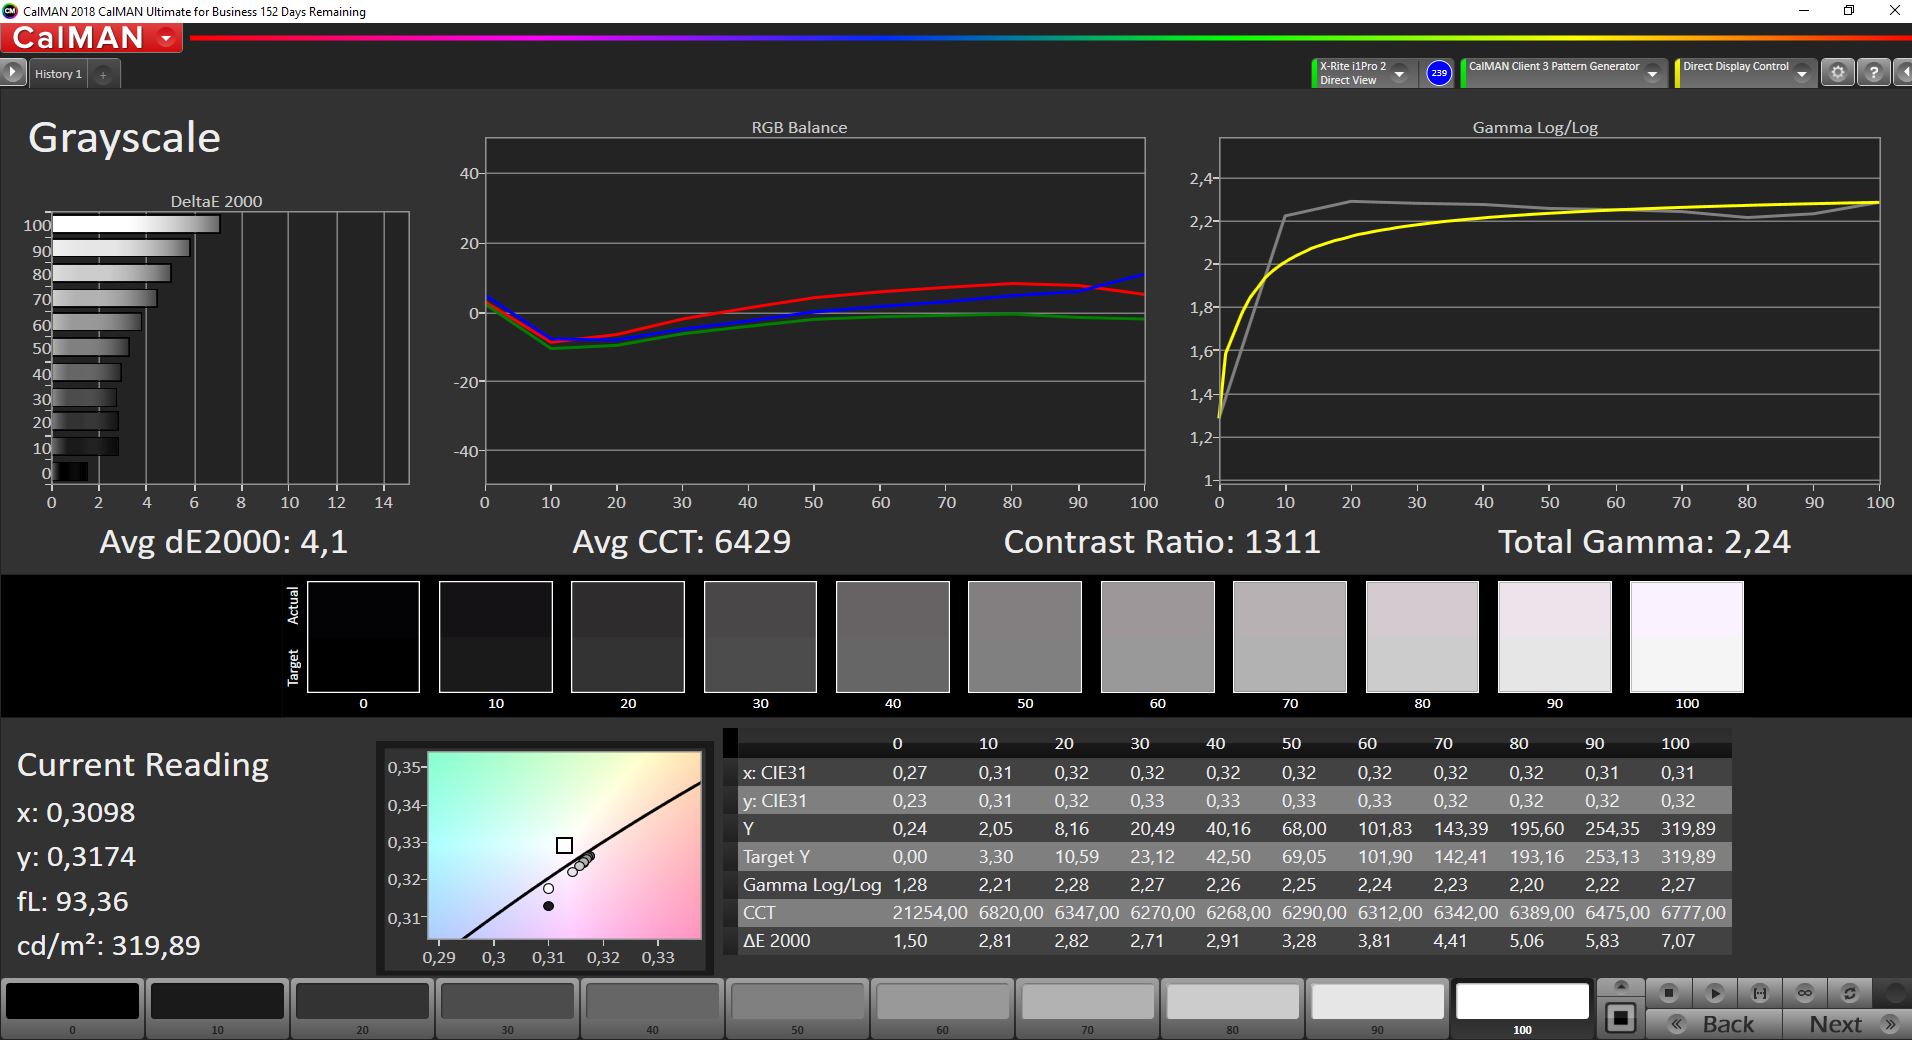
Test ünitemiz, 1300:1'den fazla kontrast oranıyla ortalama 310 nit parlaklığı yönetir. Sübjektif resim izlenimi iyidir ve parlak yüzeyler bile fazla grenli görünmez. Herhangi bir PWM titremesi tespit etmedik ve IPS ekranının görüş açısı kararlılığı çok iyi. Arka ışık kanaması önemli bir sorun değildir; maksimum parlaklık koyu bir arka planla birlikte kullanıldığında üst kenarda yalnızca bazı parlak noktalar vardır.
| |||||||||||||||||||||||||
Aydınlatma: 89 %
Batarya modunda parlaklık: 319 cd/m²
Kontrast: 1333:1 (Siyah: 0.24 cd/m²)
ΔE ColorChecker Calman: 2.7 | ∀{0.5-29.43 Ø4.73}
calibrated: 0.9
ΔE Greyscale Calman: 4.1 | ∀{0.09-98 Ø4.97}
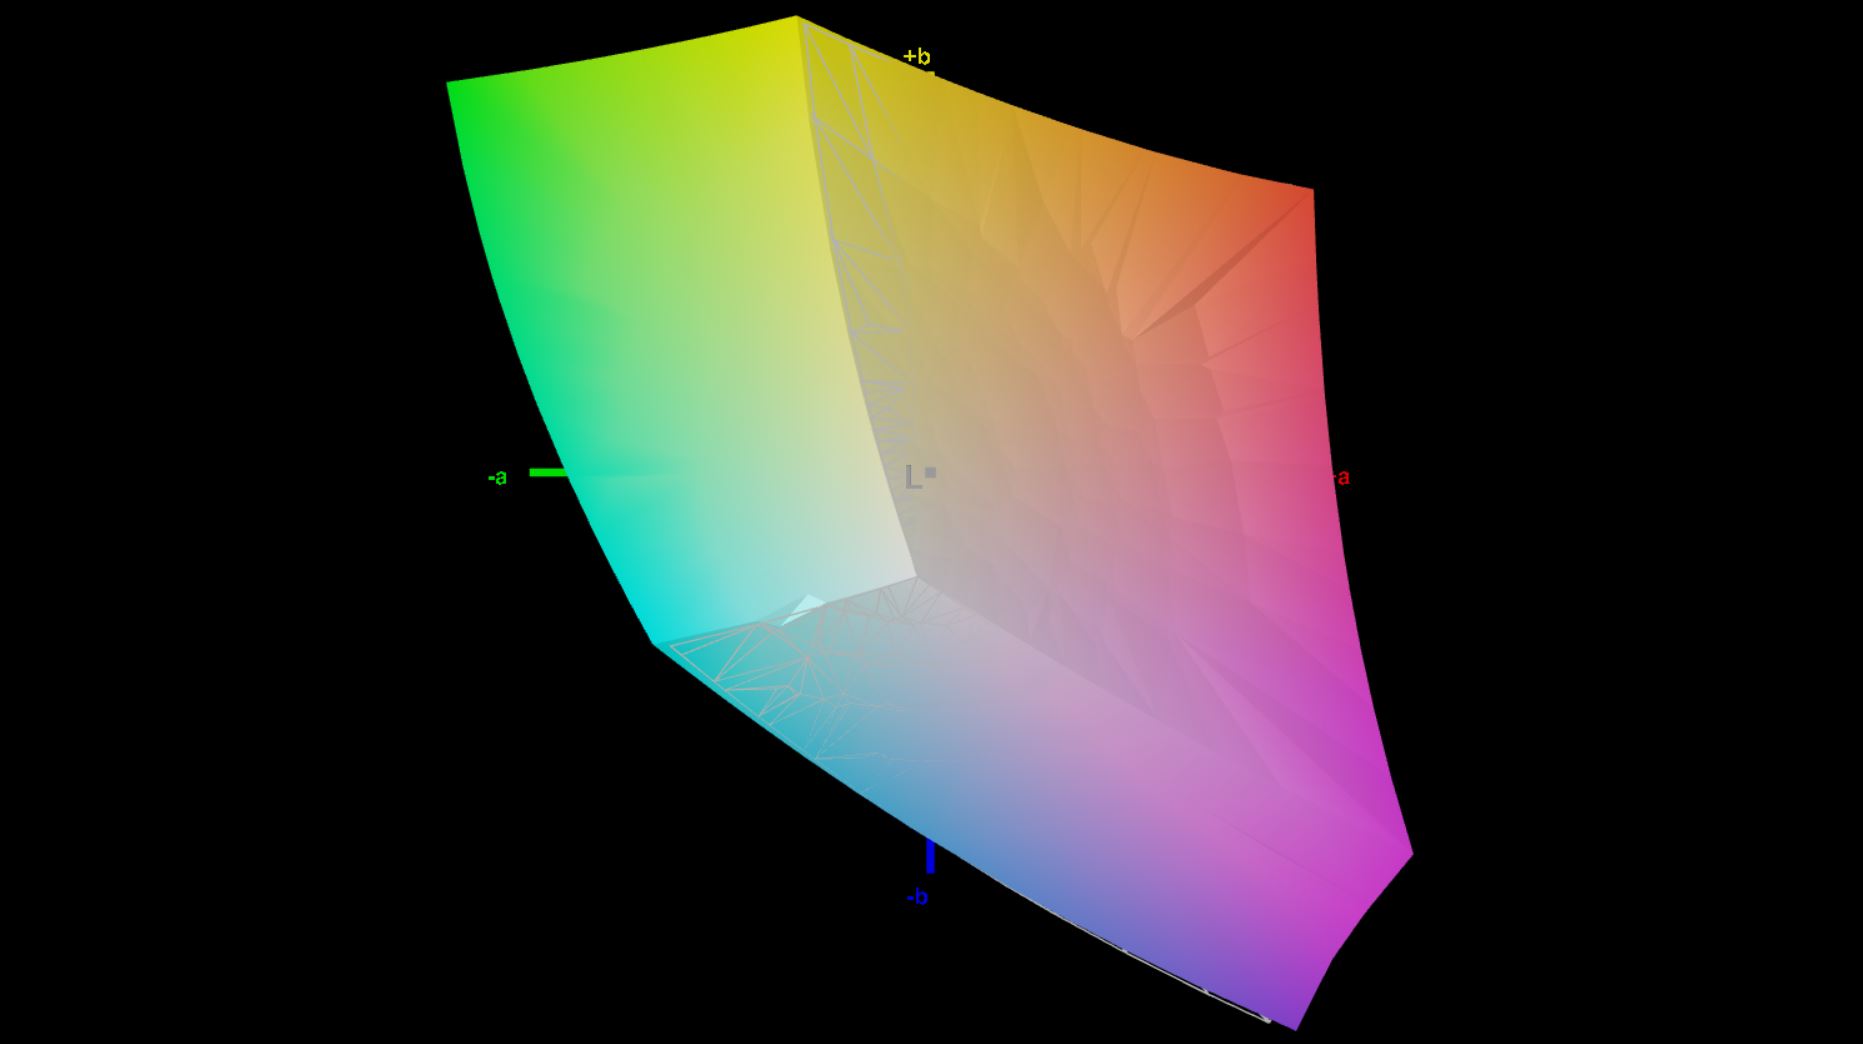
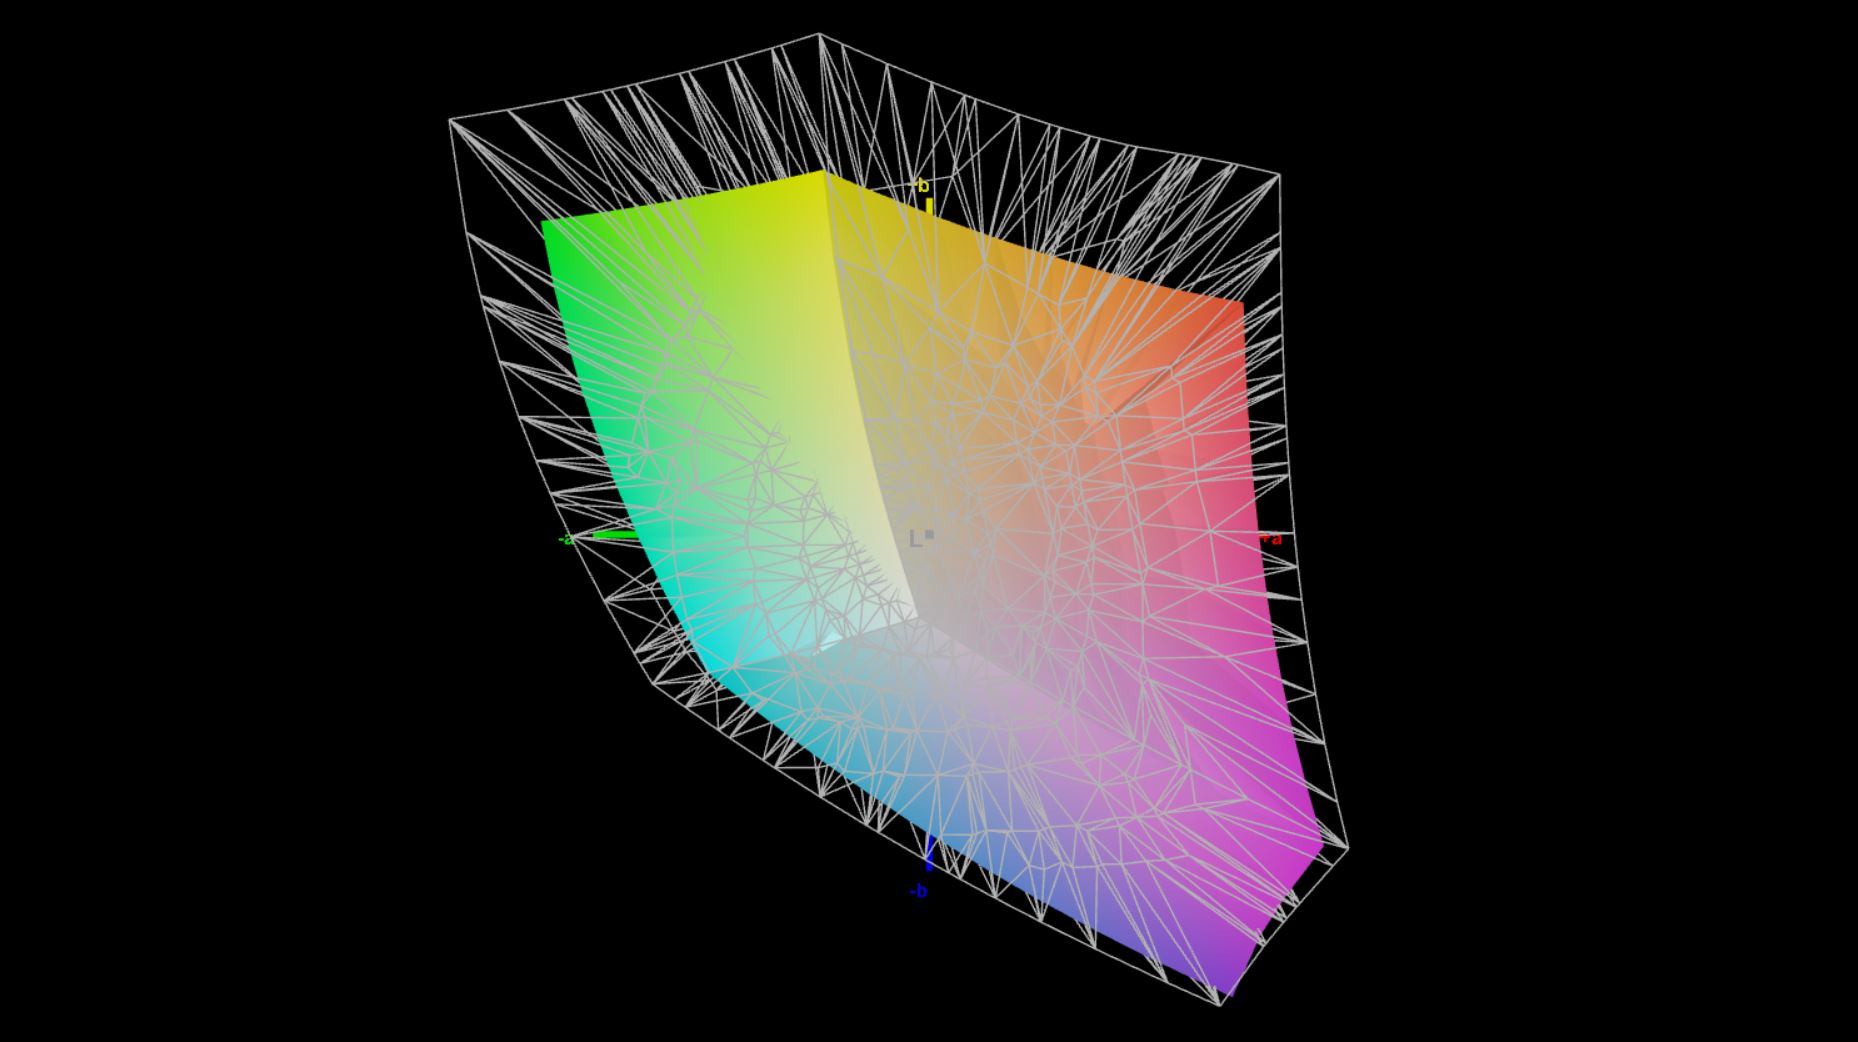
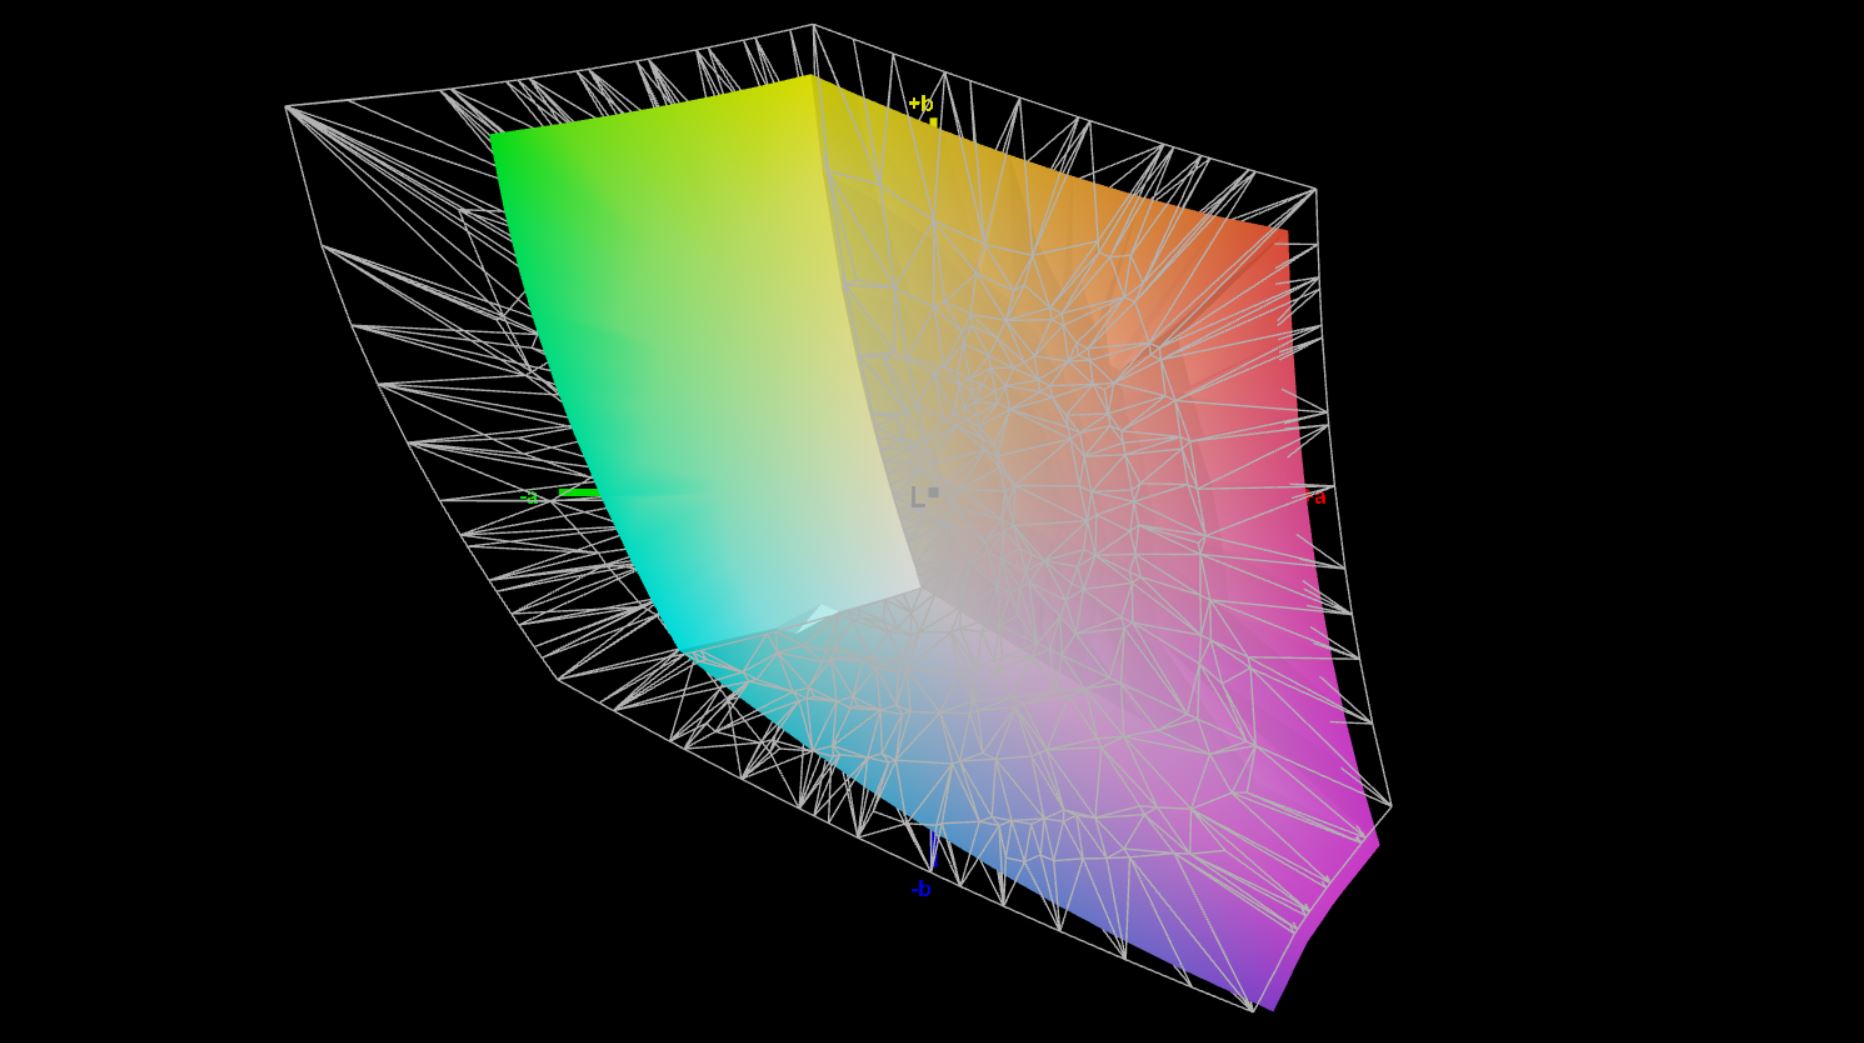
71.1% AdobeRGB 1998 (Argyll 3D)
99.7% sRGB (Argyll 3D)
71.1% Display P3 (Argyll 3D)
Gamma: 2.24
CCT: 6429 K
| Lenovo ThinkPad X13 G2 20WK0024GE NV133WUM-N61, IPS, 1920x1200, 13.3" | Dell XPS 13 9310 Core i7 FHD Sharp LQ134N1, IPS, 1920x1200, 13.4" | Apple MacBook Pro 13 Late 2020 M1 Entry (8 / 256 GB) IPS, 2560x1600, 13.3" | HP EliteBook 830 G7 Chi Mei CMN13A9, IPS, 1920x1080, 13.3" | Huawei MateBook X Pro 2021 TIANMA XM, IPS, 3000x2000, 13.9" | Lenovo ThinkPad X13-20UGS00800 B133HAK01.1, IPS LED, 1920x1080, 13.3" | Lenovo ThinkPad X13 Yoga G2 LP133WQ1-SPF2, IPS LED, 2560x1600, 13.3" | |
|---|---|---|---|---|---|---|---|
| Display | 1% | -5% | -7% | -7% | -2% | ||
| Display P3 Coverage (%) | 71.1 | 70.9 0% | 65.7 -8% | 64.9 -9% | 64.8 -9% | 68.3 -4% | |
| sRGB Coverage (%) | 99.7 | 99.1 -1% | 97.4 -2% | 94.4 -5% | 95.6 -4% | 99.1 -1% | |
| AdobeRGB 1998 Coverage (%) | 71.1 | 72.9 3% | 67.4 -5% | 66.3 -7% | 65.7 -8% | 70.3 -1% | |
| Response Times | -81% | -52% | -69% | -38% | -79% | -78% | |
| Response Time Grey 50% / Grey 80% * (ms) | 30.8 ? | 52 ? -69% | 48 ? -56% | 46.8 ? -52% | 37.6 ? -22% | 56.8 ? -84% | 52 ? -69% |
| Response Time Black / White * (ms) | 17.2 ? | 33.2 ? -93% | 25.2 ? -47% | 32 ? -86% | 26.4 ? -53% | 30 ? -74% | 32 ? -86% |
| PWM Frequency (Hz) | 2475 ? | 122000 ? | 26600 ? | ||||
| Screen | 2% | 37% | 2% | 24% | -23% | 30% | |
| Brightness middle (cd/m²) | 320 | 543.3 70% | 510 59% | 454.5 42% | 502 57% | 331 3% | 460 44% |
| Brightness (cd/m²) | 310 | 524 69% | 491 58% | 435 40% | 474 53% | 315 2% | 423 36% |
| Brightness Distribution (%) | 89 | 92 3% | 94 6% | 91 2% | 89 0% | 90 1% | 85 -4% |
| Black Level * (cd/m²) | 0.24 | 0.38 -58% | 0.29 -21% | 0.27 -13% | 0.33 -38% | 0.21 12% | 0.33 -38% |
| Contrast (:1) | 1333 | 1430 7% | 1759 32% | 1683 26% | 1521 14% | 1576 18% | 1394 5% |
| Colorchecker dE 2000 * | 2.7 | 3.02 -12% | 1.3 52% | 3.12 -16% | 1.35 50% | 6.1 -126% | 1 63% |
| Colorchecker dE 2000 max. * | 7.6 | 7.61 -0% | 3 61% | 4.85 36% | 3.67 52% | 10 -32% | 1.5 80% |
| Colorchecker dE 2000 calibrated * | 0.9 | 1.23 -37% | 1.97 -119% | 1.2 -33% | 1.2 -33% | 0.8 11% | |
| Greyscale dE 2000 * | 4.1 | 5 -22% | 2 51% | 3.1 24% | 1.7 59% | 6.3 -54% | 1.2 71% |
| Gamma | 2.24 98% | 2.02 109% | 2.23 99% | 2.01 109% | 2.24 98% | 2.77 79% | 2.26 97% |
| CCT | 6429 101% | 6550 99% | 6933 94% | 6902 94% | 6440 101% | 6938 94% | 6652 98% |
| Color Space (Percent of AdobeRGB 1998) (%) | 66.8 | 88.3 | 61.5 | 61.1 | 60.7 | 64.4 | |
| Color Space (Percent of sRGB) (%) | 99.6 | 100 | 97 | 94.3 | 95.4 | 99.12 | |
| Toplam Ortalama (Program / Ayarlar) | -26% /
-10% | -8% /
20% | -24% /
-9% | -7% /
8% | -36% /
-28% | -17% /
8% |
* ... daha küçük daha iyidir
Renk doğruluğu kutudan çıktığı haliyle zaten çok iyi ve tüm renkler sRGB renk referansına kıyasla 3'lük hedef sapma dahilinde. Profesyonel CalMAN yazılımıyla yaptığımız ekran analizi, gri tonlamada pembeye doğru hafif bir renk dökümü ortaya koyuyor. Ancak bu, yalnızca kalibre edilmiş bir ekranla doğrudan karşılaştırıldığında fark edilebilir.
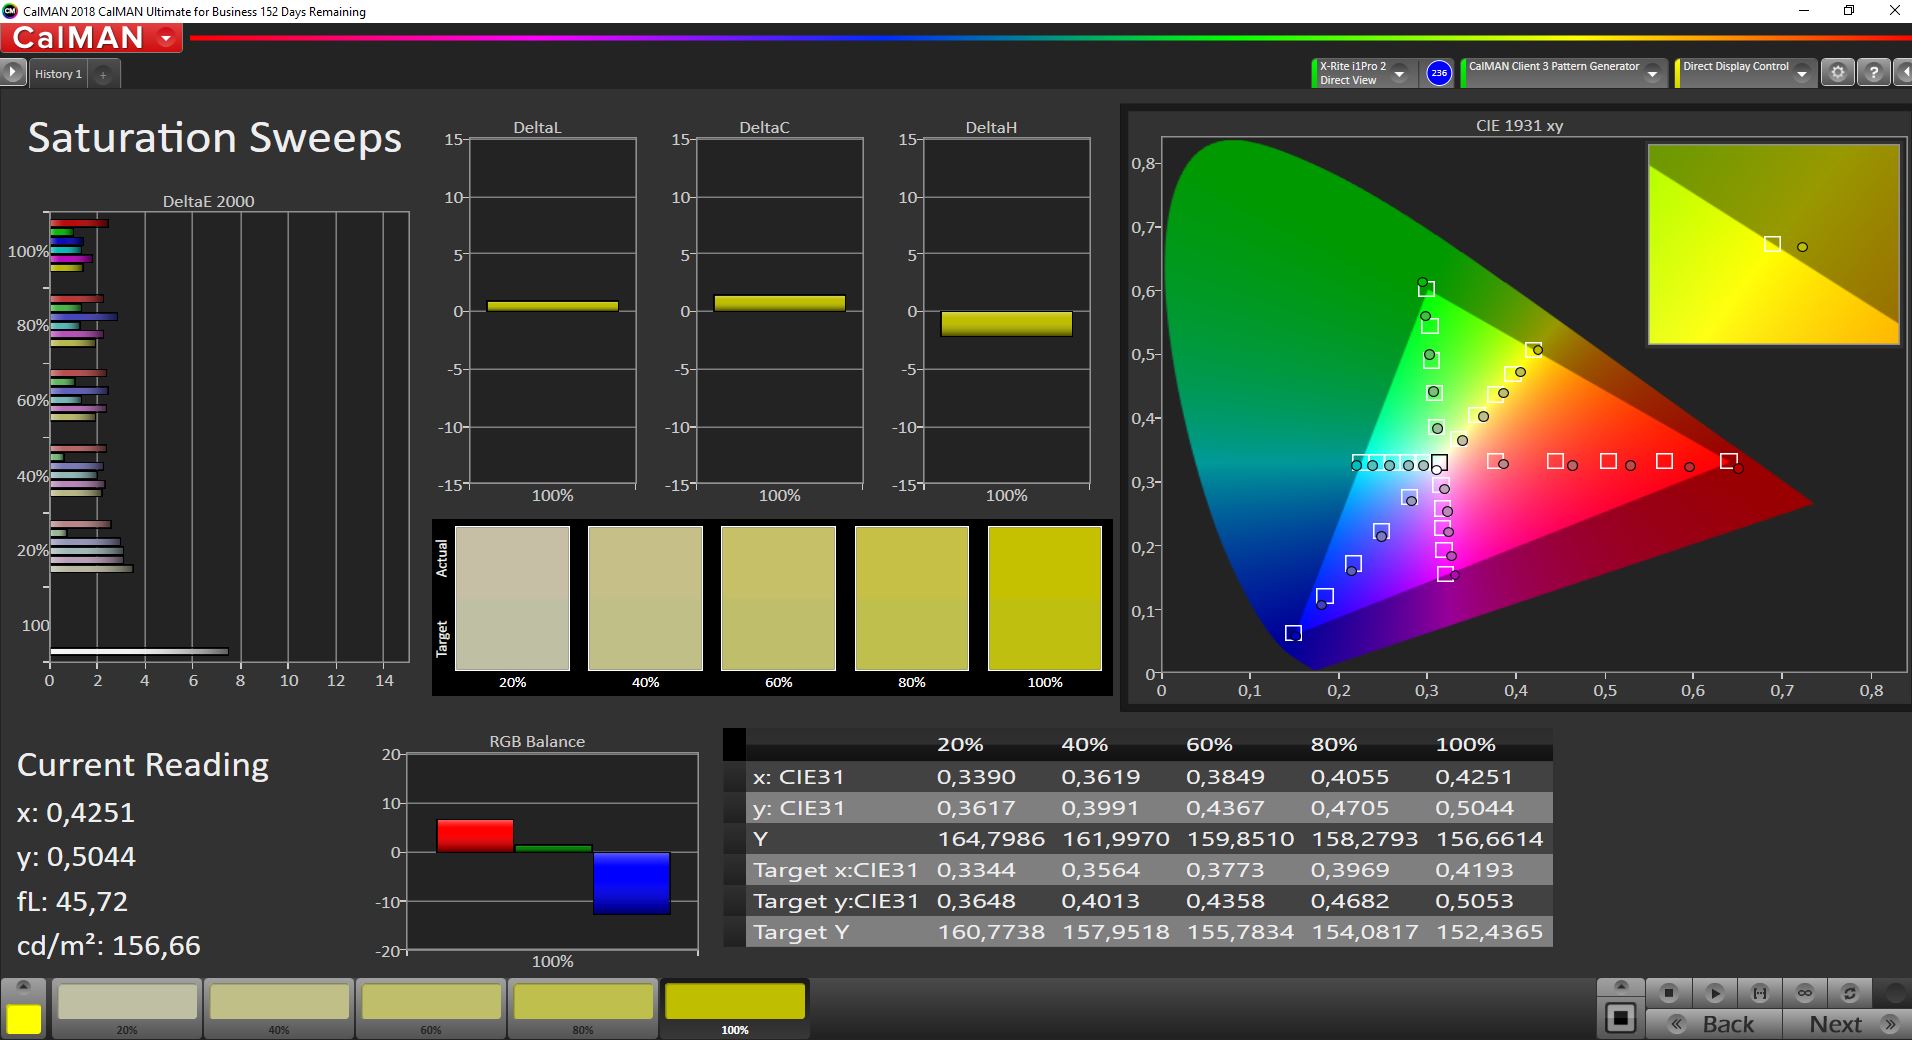
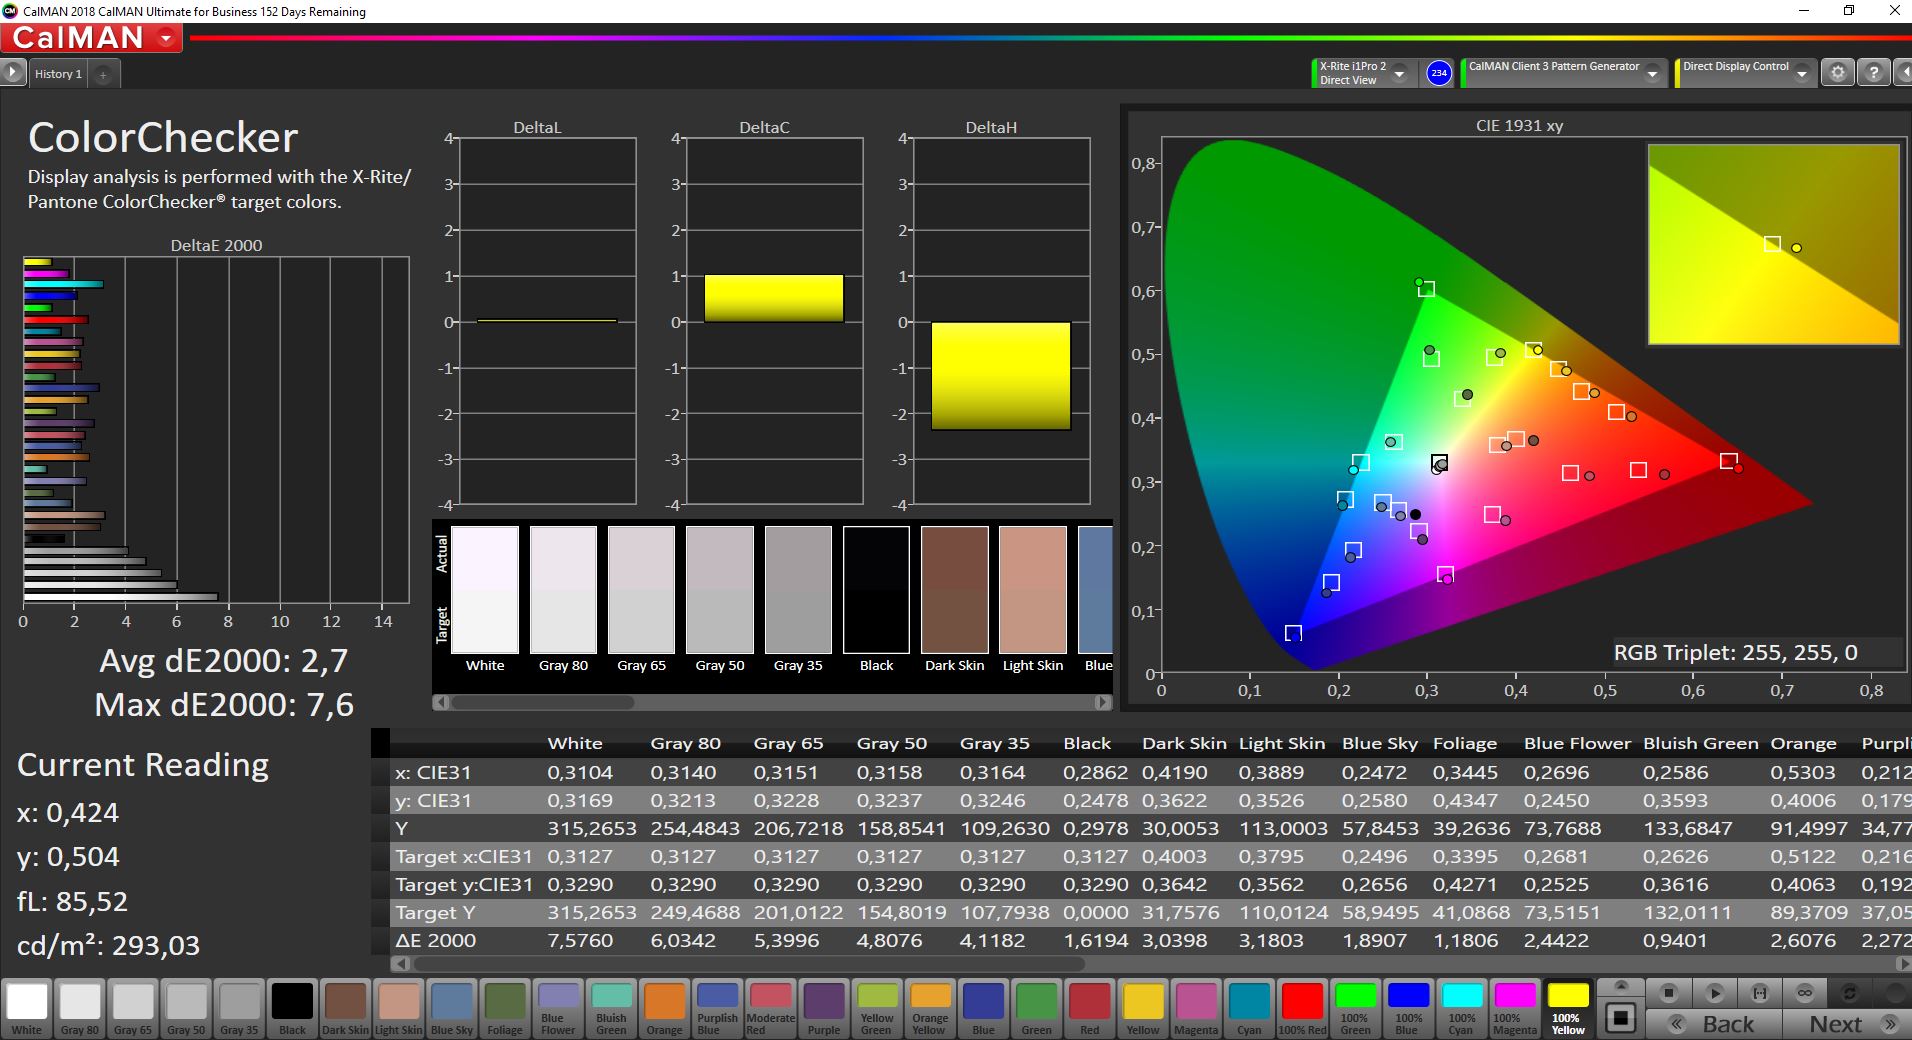
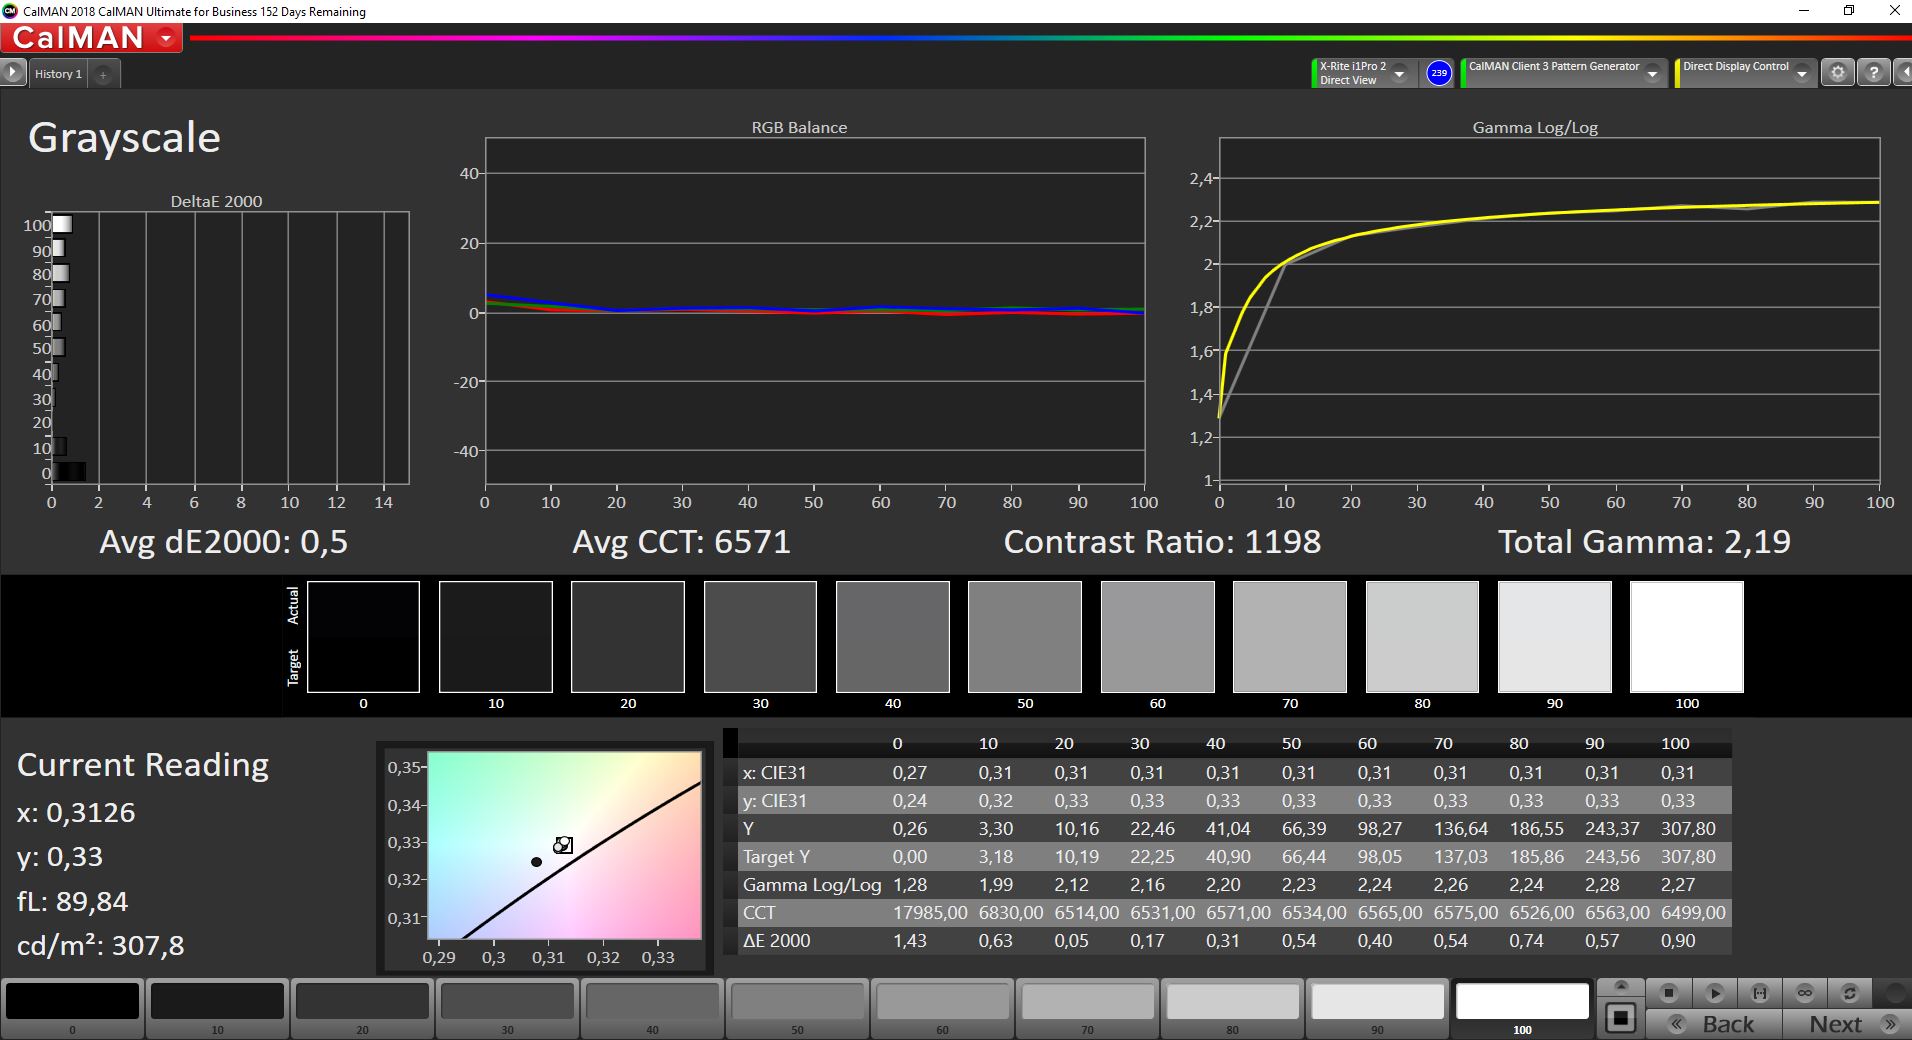
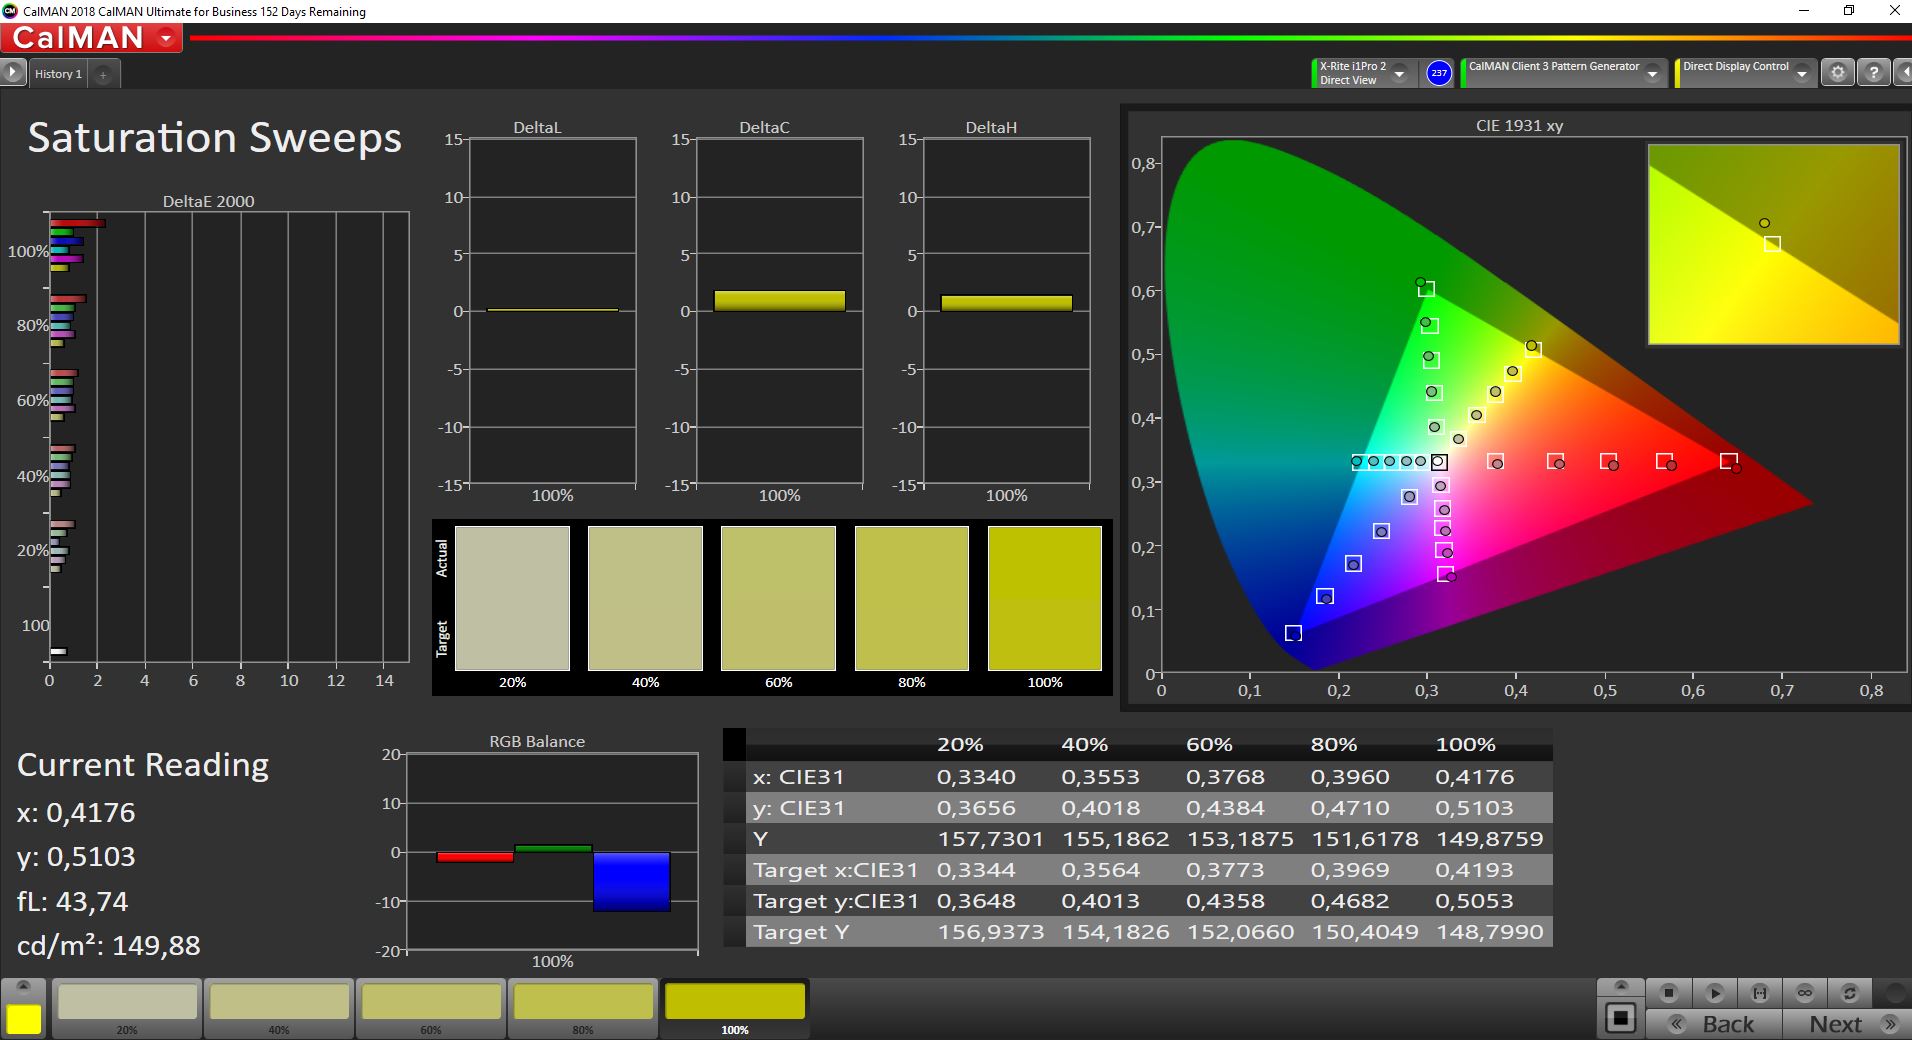
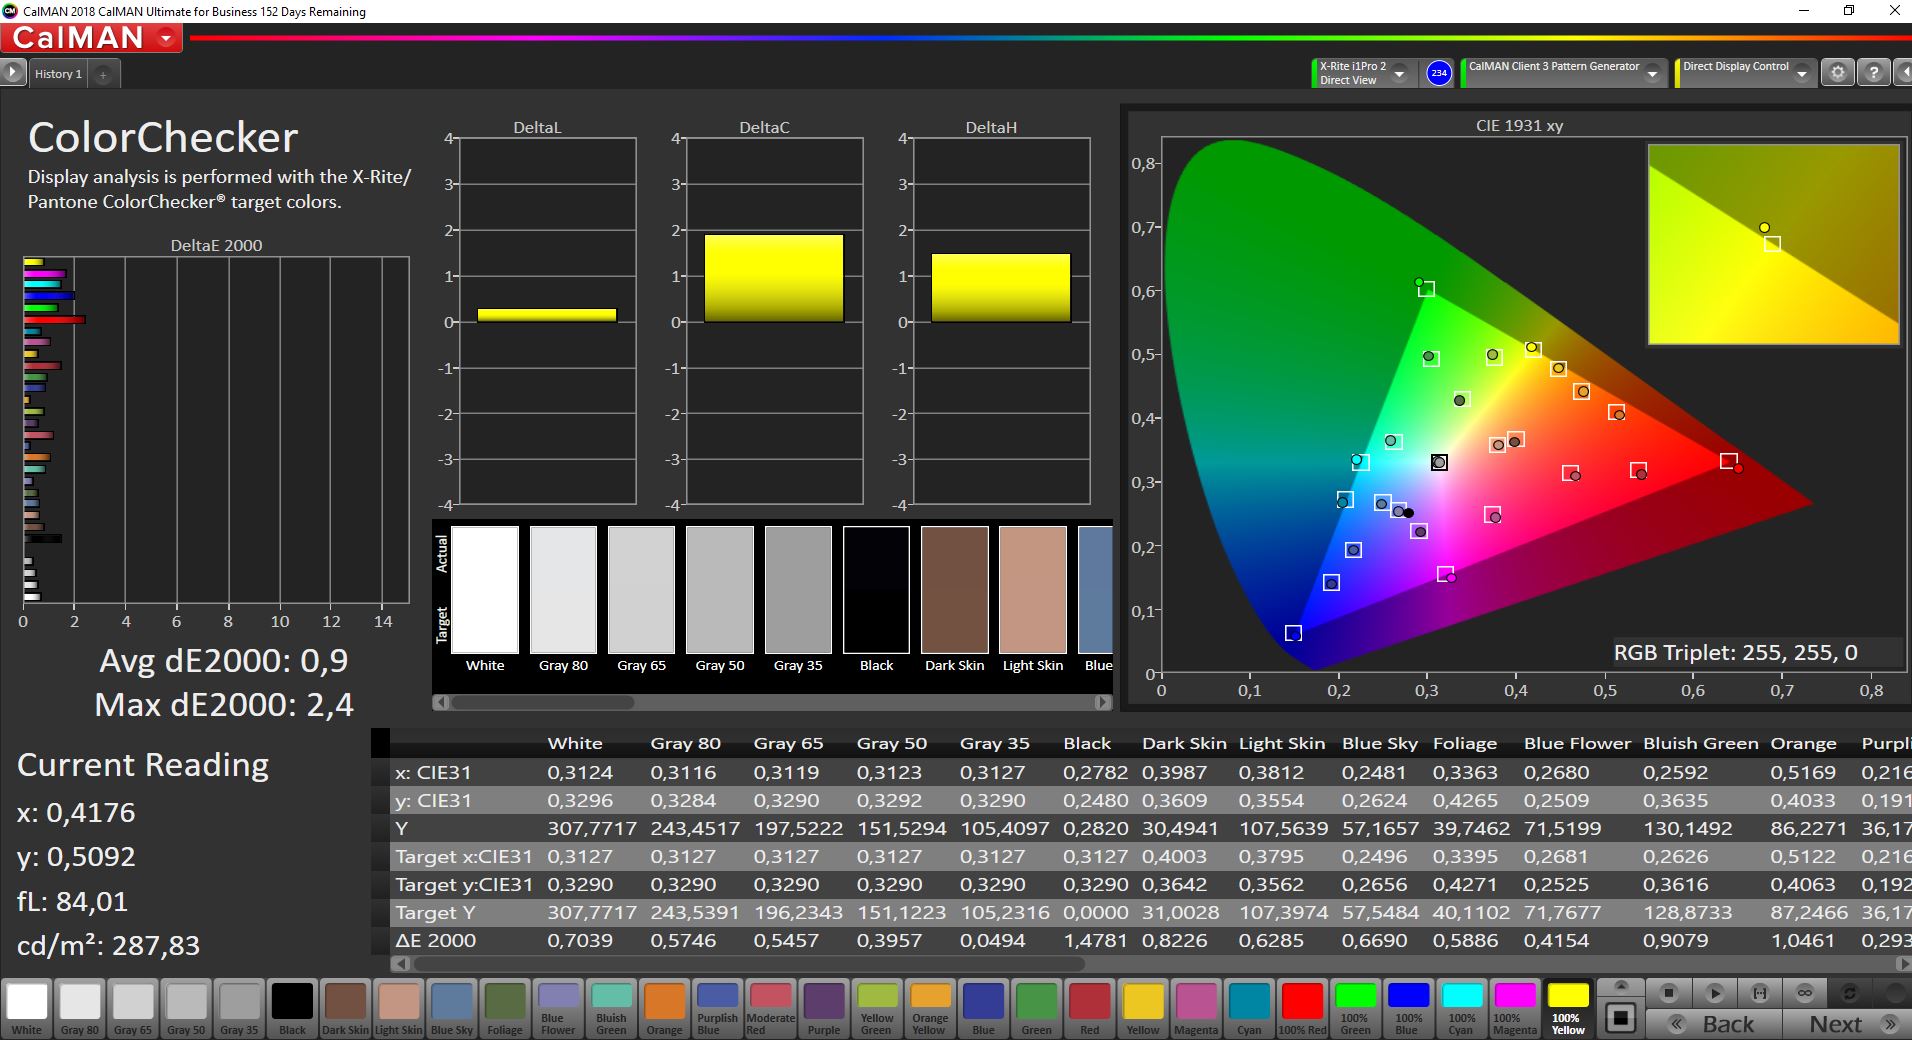
Paneli X-Rite i1 Pro 2 spektrofotometre ile kalibre ettik (profil yukarıdan ücretsiz olarak indirilebilir) ve hem gri tonlamayı hem de renkleri iyileştirmeyi başardık. Küçük sRGB renk alanı tamamen kaplanmıştır, bu da panelin resim/video düzenleme için uygun olduğu anlamına gelir.
Yanıt Sürelerini Görüntüle
| ↔ Tepki Süresi Siyahtan Beyaza | ||
|---|---|---|
| 17.2 ms ... yükseliş ↗ ve sonbahar↘ birleşimi | ↗ 8.4 ms yükseliş | 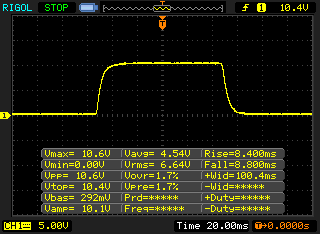 |
| ↘ 8.8 ms sonbahar | ||
| Ekran, testlerimizde iyi yanıt oranları gösteriyor ancak rekabetçi oyuncular için çok yavaş olabilir. Karşılaştırıldığında, test edilen tüm cihazlar 0.1 (minimum) ile 240 (maksimum) ms arasında değişir. » Tüm cihazların 39 %'si daha iyi. Bu, ölçülen yanıt süresinin test edilen tüm cihazların ortalamasından (19.9 ms) daha iyi olduğu anlamına gelir. | ||
| ↔ Tepki Süresi %50 Griden %80 Griye | ||
| 30.8 ms ... yükseliş ↗ ve sonbahar↘ birleşimi | ↗ 14.8 ms yükseliş | 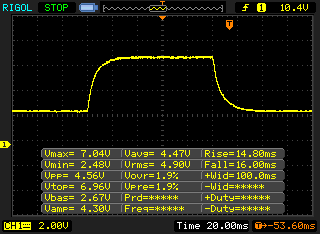 |
| ↘ 16 ms sonbahar | ||
| Ekran, testlerimizde yavaş yanıt oranları gösteriyor ve oyuncular için yetersiz olacaktır. Karşılaştırıldığında, test edilen tüm cihazlar 0.165 (minimum) ile 636 (maksimum) ms arasında değişir. » Tüm cihazların 41 %'si daha iyi. Bu, ölçülen yanıt süresinin test edilen tüm cihazların ortalamasına benzer olduğu anlamına gelir (31.1 ms). | ||
Ekran Titremesi / PWM (Darbe Genişliği Modülasyonu)
| Ekran titriyor / PWM algılanmadı | 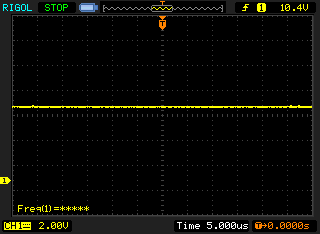 | ||
Karşılaştırıldığında: Test edilen tüm cihazların %52 %'si ekranı karartmak için PWM kullanmıyor. PWM tespit edilirse, ortalama 7791 (minimum: 5 - maksimum: 343500) Hz ölçüldü. | |||
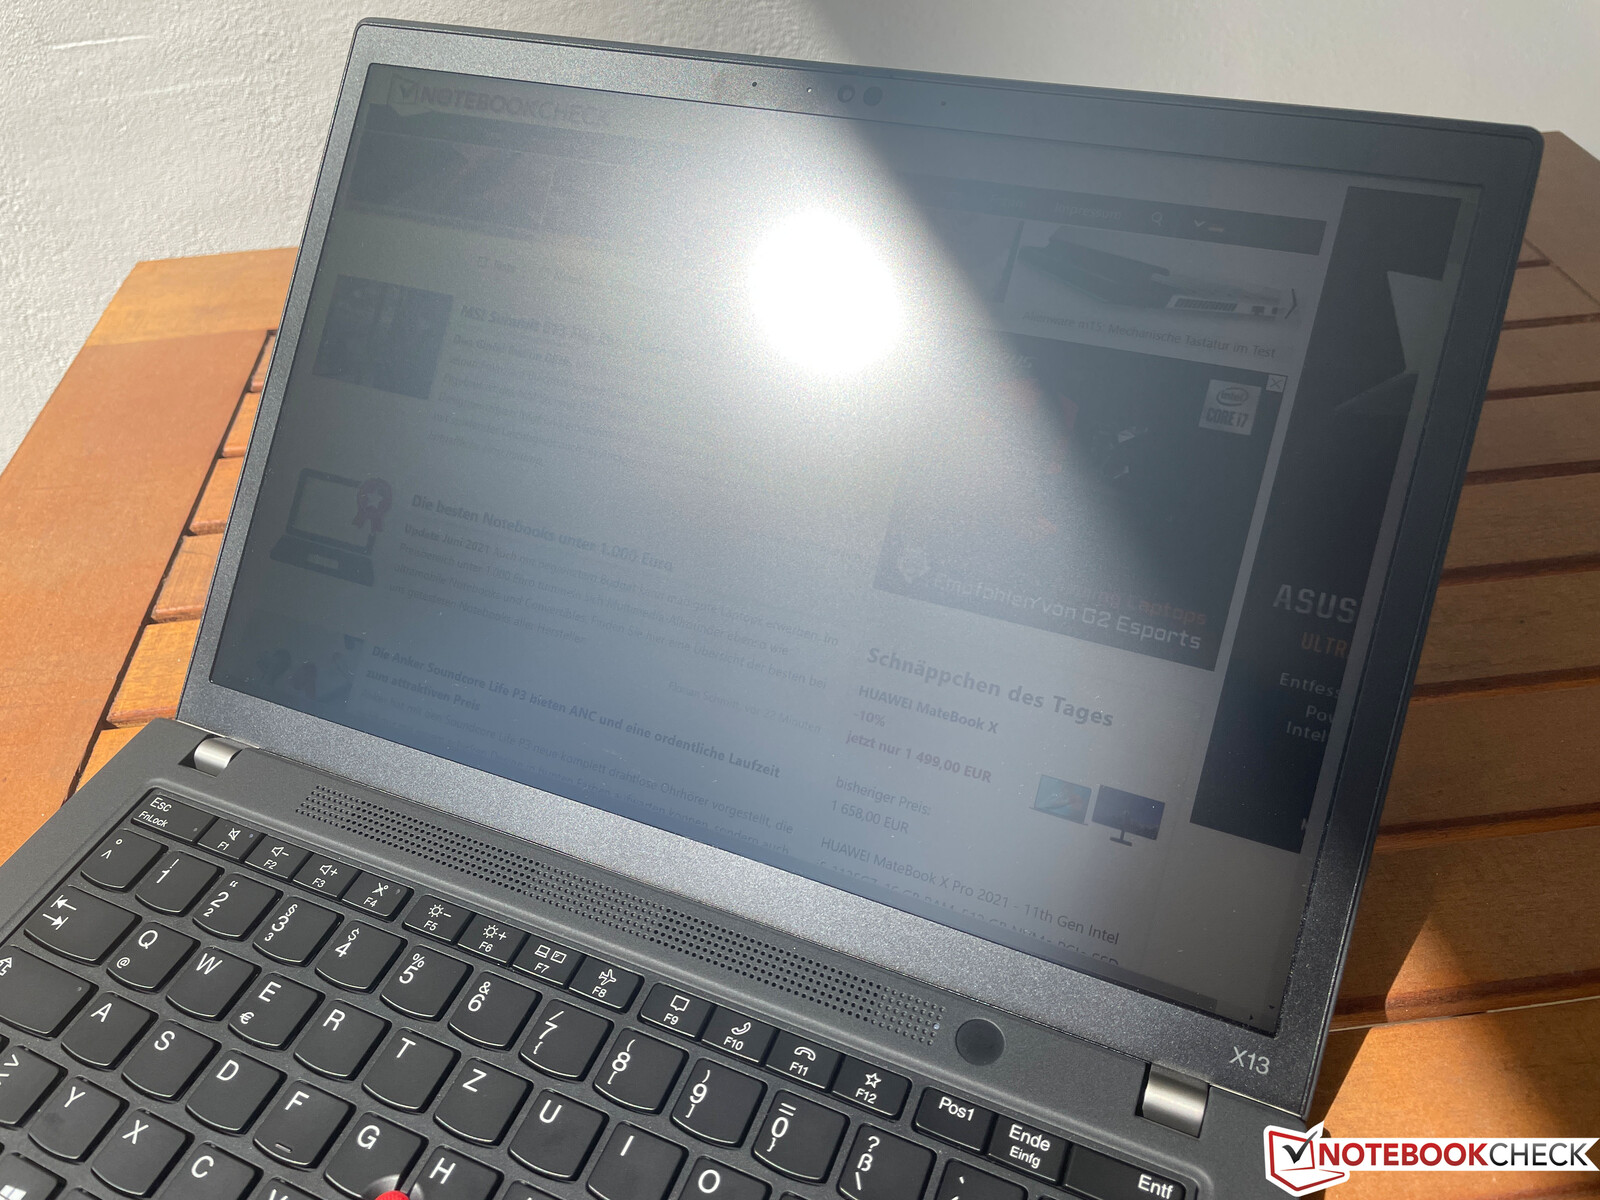
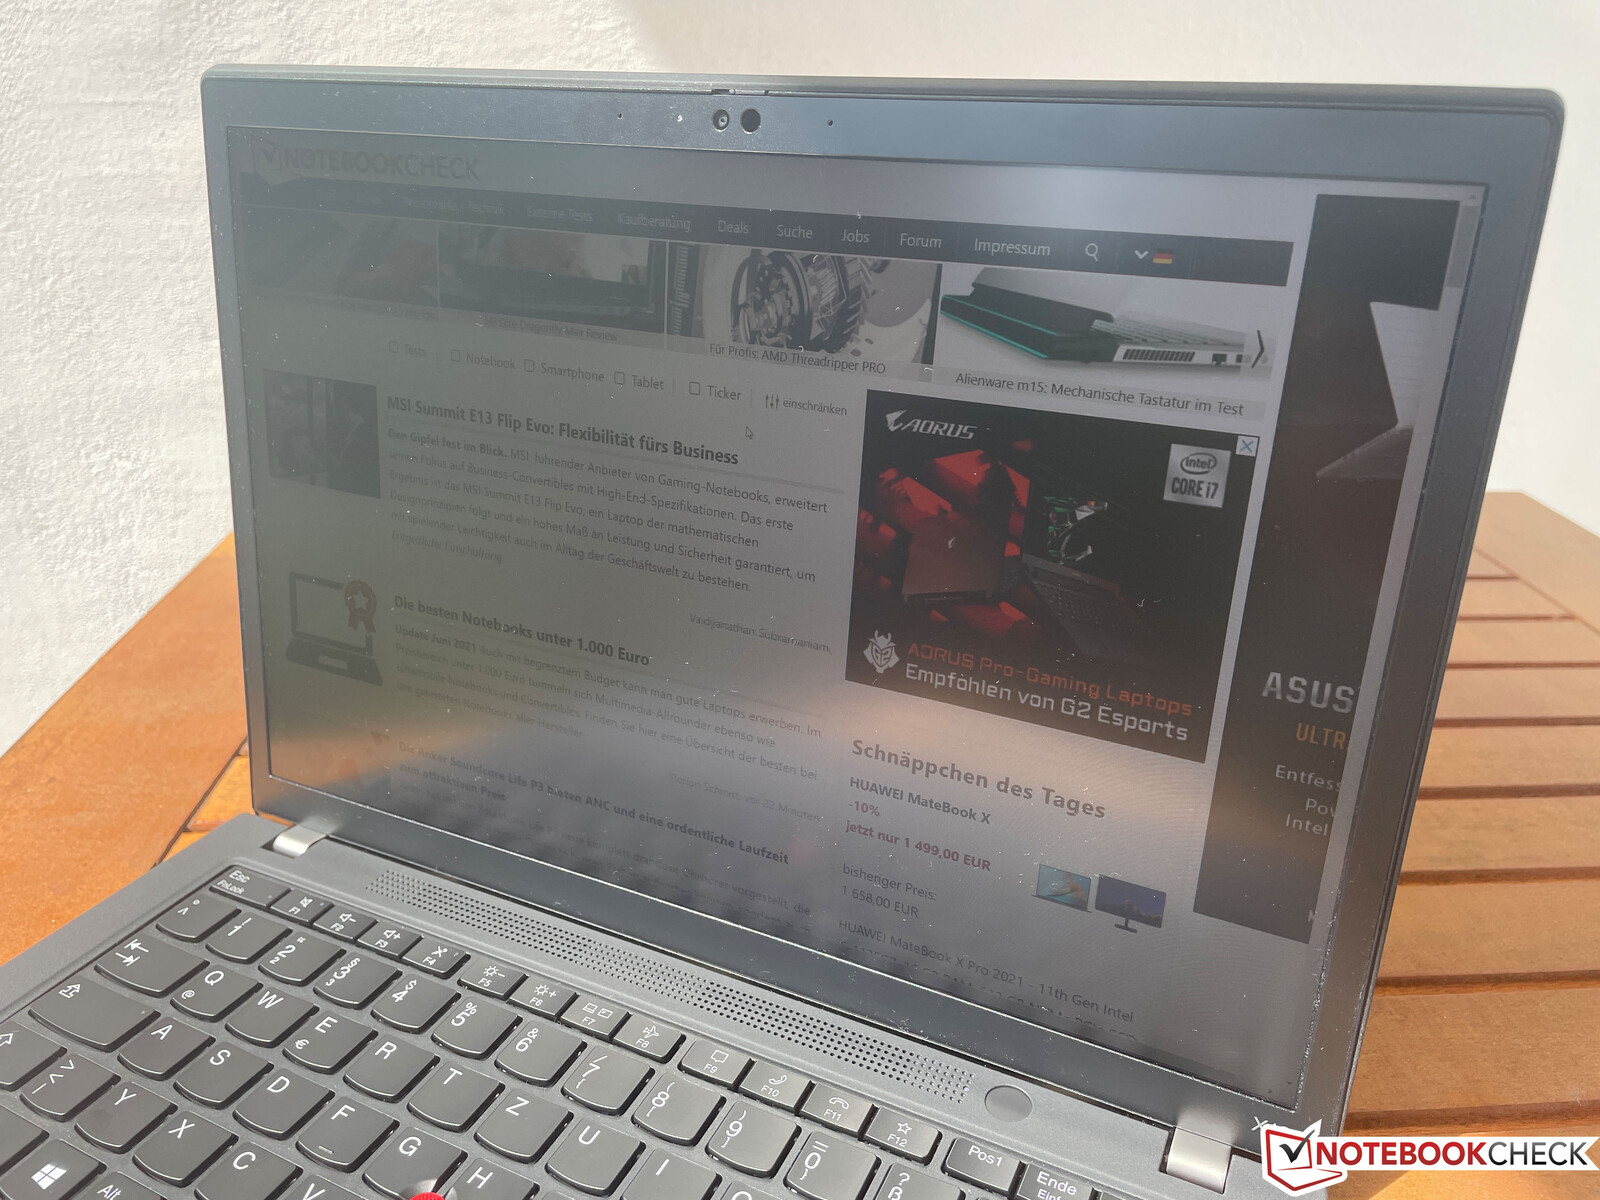
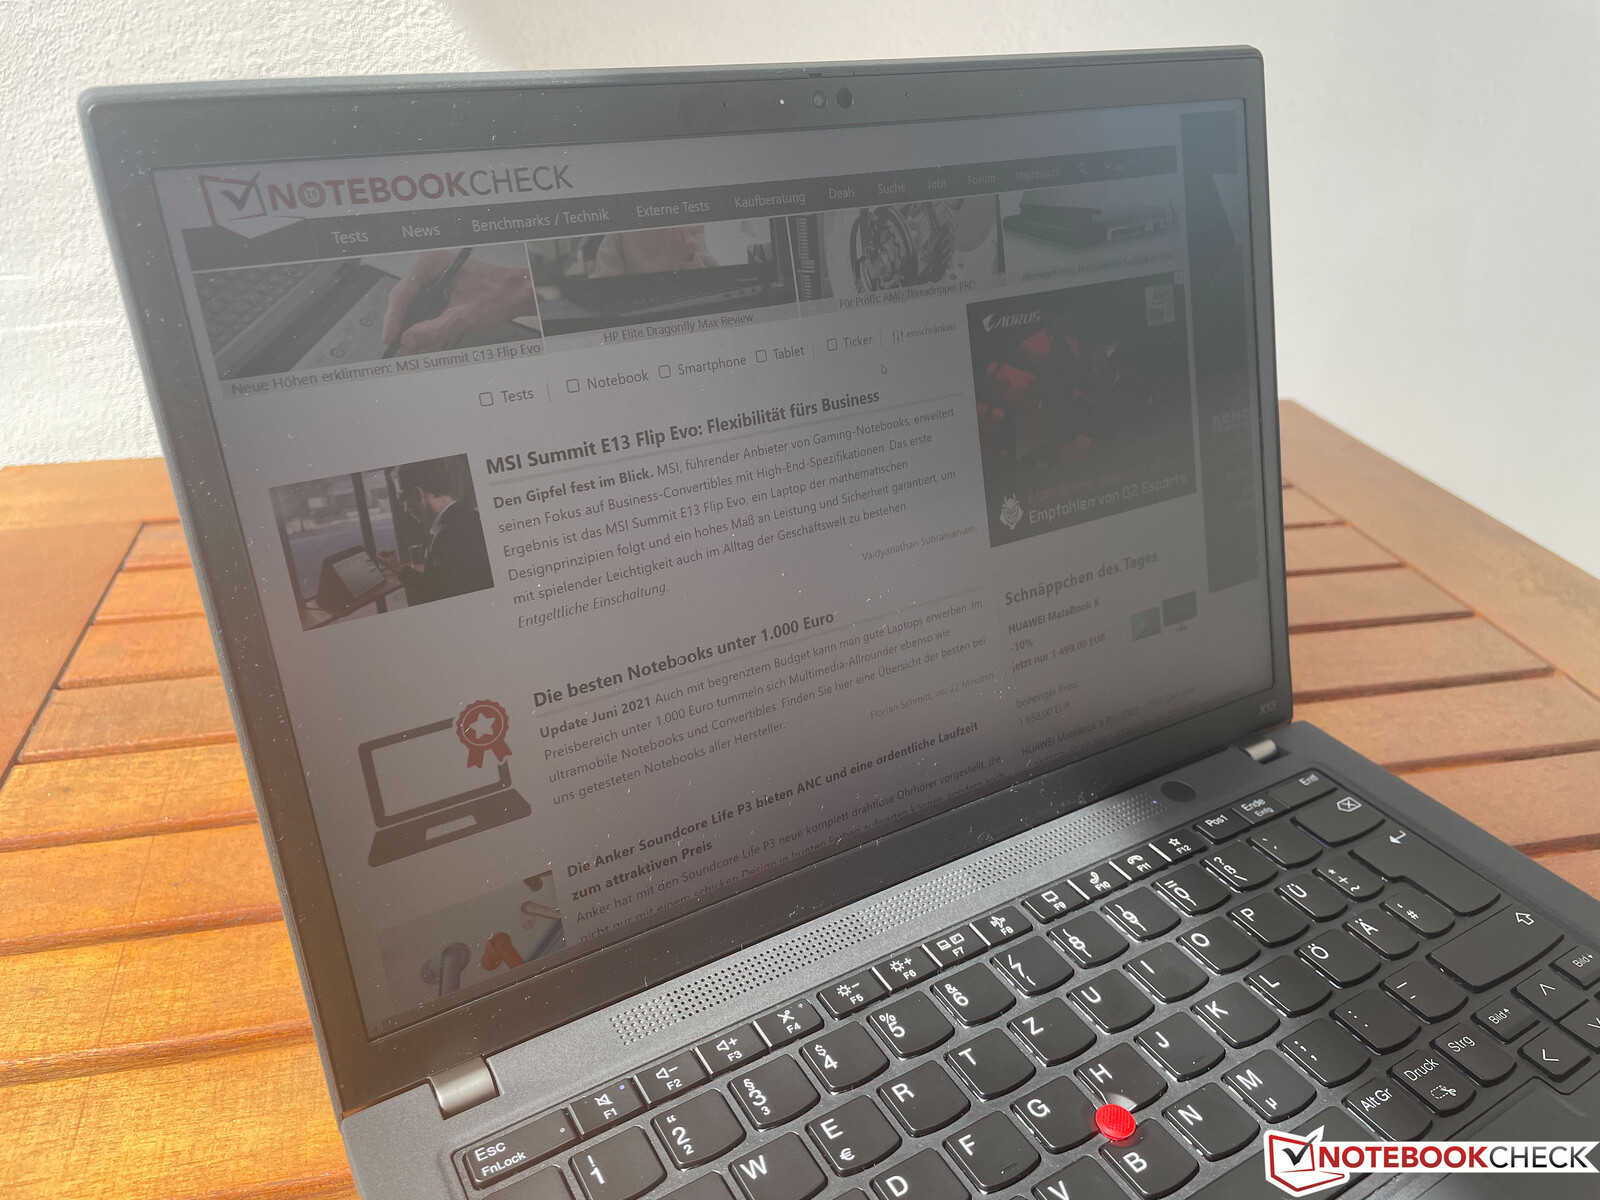
Mat panel sayesinde X13 G2'yi dış mekanlarda kullanmak sorun değil. Doğrudan güneş ışığından kaçındığınız sürece içeriği çok parlak ortamlarda bile görebilirsiniz. Daha fazla izleme konforu için daha parlak bir paneli yine de takdir ederdik.
Performans - Tiger Lake ve lehimlenmiş RAM
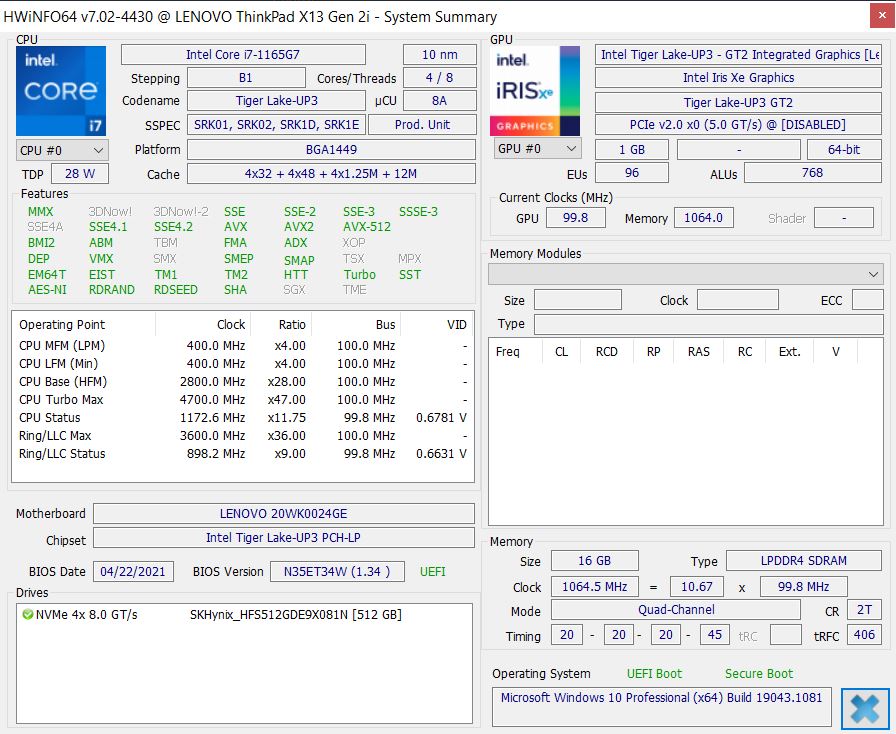
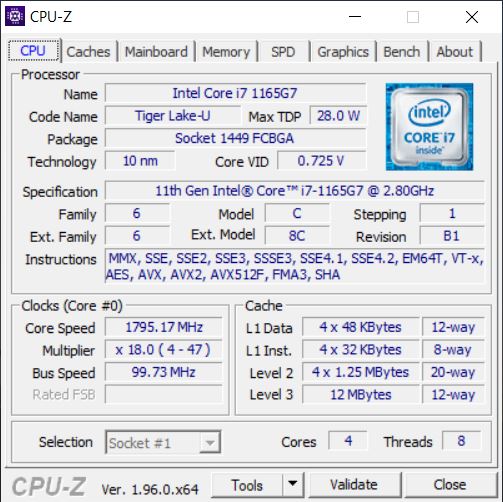
İşlemci - Core i7-1165G7
İnceleme birimimiz, dört çekirdeği (8 iş parçacığı) vurguladığınızda, bir çekirdek için maksimum 4,7 GHz veya 4,1 GHz'e kadar tanıdık Tiger Lake işlemci Core i7-1165G7 (UP3) kullanır. İşlemci hakkında daha fazla bilgiyi burada bulabilirsiniz.
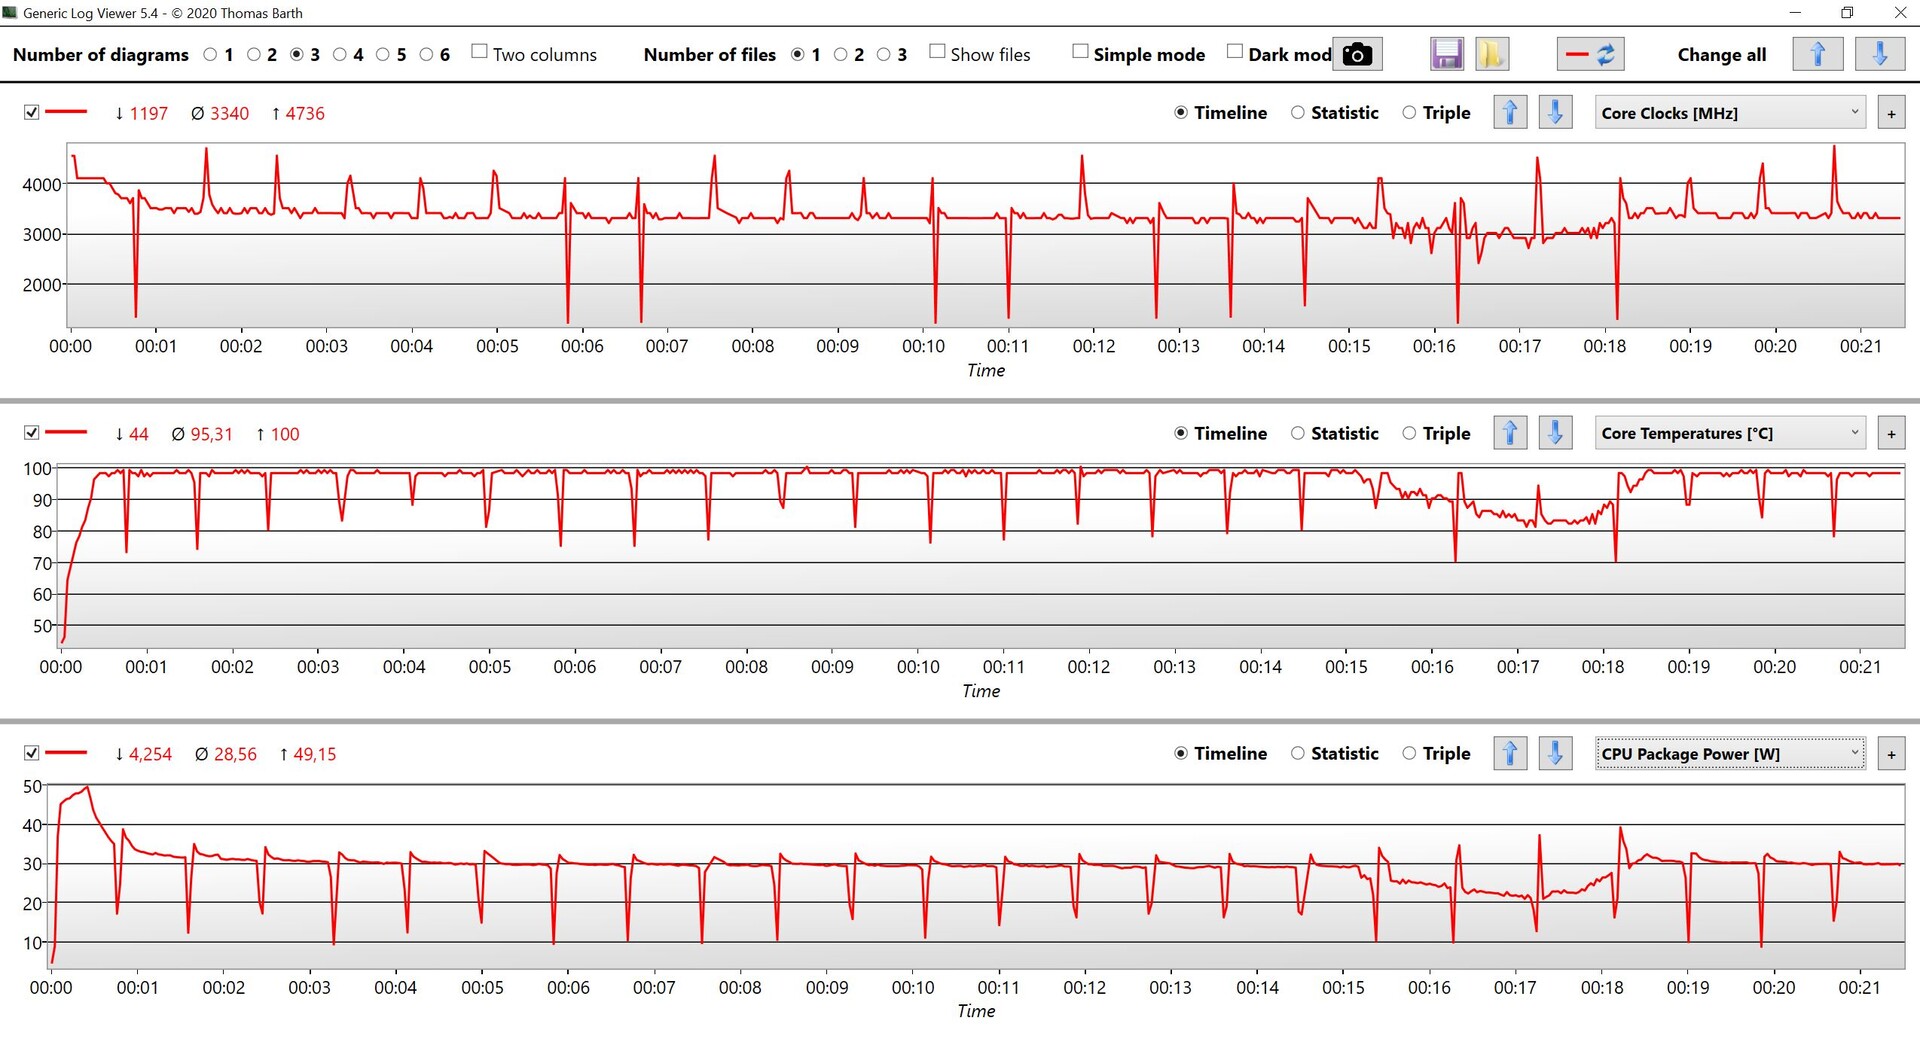
Lenovo, güç sınırlarını çok cömertçe belirler ve testlerin başında maksimum 4,1 GHz (~50W'a eşittir) saatini gerçekten görebiliriz. Ancak kısa bir süre sonra değer 4x 3.3 GHz ve 30W'da sabitleniyor. Sonuçta iyi sonuçlar, ancak işlemci genellikle 100 °C işaretini çiziyor. Yaklaşık 15 dakika sonra küçük bir performans düşüşü görebiliriz, ancak performans hızla tekrar dengelenir.
Cinebench R15 Multi Loop
Yeni X13 G2, diğer Tiger Lake dizüstü bilgisayarları ve selefi ile karşılaştırıldığında nasıl bir performans sergiliyor? Core i7, temel olarak tek çekirdekli testlerde yüksek saat hızından yararlanıyor ve yeni X13 G2 genellikle sıralamanın en üstünde yer alıyor. Performansı da iyi ve diğer tüm Intel tabanlı rakiplerin önünde (Comet Lake'li selefi %30 dövüldü), ancak eski X13 G1 AMD hala fark edilir derecede daha hızlı. Yeni Ryzen 5000 CPU'larla X13 G2'nin performansını görmek için şimdiden sabırsızlanıyoruz. Güç limitleri karşılaştırılabilir ise daha da iyi CPU bekliyoruz. MacBook Pro 13'teki Apple's M1 CPU'su, bir çekirdeği vurguladığınızda aynı hızdadır, ancak yerel çok çekirdekli kıyaslamalarda (>%30) çok daha hızlıdır.
Güç tüketimi pil gücüyle 30W ile sınırlıdır, bu nedenle şebekeye kıyasla yalnızca ~%15'lik küçük bir performans açığı vardır.
Cinebench R20: CPU (Single Core) | CPU (Multi Core)
Cinebench R15: CPU Single 64Bit | CPU Multi 64Bit
Blender: v2.79 BMW27 CPU
7-Zip 18.03: 7z b 4 -mmt1 | 7z b 4
Geekbench 5.5: Single-Core | Multi-Core
HWBOT x265 Benchmark v2.2: 4k Preset
LibreOffice : 20 Documents To PDF
R Benchmark 2.5: Overall mean
| Cinebench R23 / Single Core | |
| Sınıf ortalaması Subnotebook (358 - 2213, n=61, son 2 yıl) | |
| Lenovo ThinkPad X13 G2 20WK0024GE | |
| Apple MacBook Pro 13 Late 2020 M1 Entry (8 / 256 GB) | |
| Ortalama Intel Core i7-1165G7 (1110 - 1539, n=59) | |
| Huawei MateBook X Pro 2021 | |
| Cinebench R23 / Multi Core | |
| Sınıf ortalaması Subnotebook (1555 - 21812, n=60, son 2 yıl) | |
| Apple MacBook Pro 13 Late 2020 M1 Entry (8 / 256 GB) | |
| Lenovo ThinkPad X13 G2 20WK0024GE | |
| Ortalama Intel Core i7-1165G7 (2525 - 6862, n=64) | |
| Huawei MateBook X Pro 2021 | |
| Cinebench R20 / CPU (Single Core) | |
| Sınıf ortalaması Subnotebook (128 - 832, n=57, son 2 yıl) | |
| Lenovo ThinkPad X13 G2 20WK0024GE | |
| Dell XPS 13 9310 Core i7 FHD | |
| Ortalama Intel Core i7-1165G7 (442 - 589, n=81) | |
| Huawei MateBook X Pro 2021 | |
| Lenovo ThinkPad X13-20UGS00800 | |
| HP EliteBook 830 G7 | |
| Apple MacBook Pro 13 Late 2020 M1 Entry (8 / 256 GB) | |
| Lenovo ThinkPad X13-20T20033GE | |
| Cinebench R20 / CPU (Multi Core) | |
| Sınıf ortalaması Subnotebook (579 - 8541, n=57, son 2 yıl) | |
| Lenovo ThinkPad X13-20UGS00800 | |
| Lenovo ThinkPad X13 G2 20WK0024GE | |
| Apple MacBook Pro 13 Late 2020 M1 Entry (8 / 256 GB) | |
| Ortalama Intel Core i7-1165G7 (1060 - 2657, n=81) | |
| Dell XPS 13 9310 Core i7 FHD | |
| Huawei MateBook X Pro 2021 | |
| HP EliteBook 830 G7 | |
| Lenovo ThinkPad X13-20T20033GE | |
| Cinebench R15 / CPU Single 64Bit | |
| Sınıf ortalaması Subnotebook (72.4 - 322, n=57, son 2 yıl) | |
| Lenovo ThinkPad X13 G2 20WK0024GE | |
| Dell XPS 13 9310 Core i7 FHD | |
| Ortalama Intel Core i7-1165G7 (115 - 230, n=78) | |
| Huawei MateBook X Pro 2021 | |
| Apple MacBook Pro 13 Late 2020 M1 Entry (8 / 256 GB) | |
| Lenovo ThinkPad X13-20UGS00800 | |
| HP EliteBook 830 G7 | |
| Lenovo ThinkPad X13-20T20033GE | |
| Cinebench R15 / CPU Multi 64Bit | |
| Sınıf ortalaması Subnotebook (327 - 3345, n=57, son 2 yıl) | |
| Lenovo ThinkPad X13-20UGS00800 | |
| Apple MacBook Pro 13 Late 2020 M1 Entry (8 / 256 GB) | |
| Lenovo ThinkPad X13 G2 20WK0024GE | |
| Dell XPS 13 9310 Core i7 FHD | |
| Ortalama Intel Core i7-1165G7 (553 - 1027, n=86) | |
| Lenovo ThinkPad X13-20T20033GE | |
| Huawei MateBook X Pro 2021 | |
| Blender / v2.79 BMW27 CPU | |
| Lenovo ThinkPad X13-20T20033GE | |
| Huawei MateBook X Pro 2021 | |
| HP EliteBook 830 G7 | |
| Dell XPS 13 9310 Core i7 FHD | |
| Ortalama Intel Core i7-1165G7 (468 - 1138, n=80) | |
| Lenovo ThinkPad X13 G2 20WK0024GE | |
| Lenovo ThinkPad X13-20UGS00800 | |
| Sınıf ortalaması Subnotebook (159 - 2271, n=58, son 2 yıl) | |
| 7-Zip 18.03 / 7z b 4 -mmt1 | |
| Sınıf ortalaması Subnotebook (2643 - 6699, n=59, son 2 yıl) | |
| Dell XPS 13 9310 Core i7 FHD | |
| Lenovo ThinkPad X13 G2 20WK0024GE | |
| Ortalama Intel Core i7-1165G7 (4478 - 5507, n=80) | |
| Huawei MateBook X Pro 2021 | |
| HP EliteBook 830 G7 | |
| Lenovo ThinkPad X13-20UGS00800 | |
| Lenovo ThinkPad X13-20T20033GE | |
| 7-Zip 18.03 / 7z b 4 | |
| Sınıf ortalaması Subnotebook (11668 - 77867, n=57, son 2 yıl) | |
| Lenovo ThinkPad X13-20UGS00800 | |
| Lenovo ThinkPad X13 G2 20WK0024GE | |
| Ortalama Intel Core i7-1165G7 (15347 - 27405, n=80) | |
| HP EliteBook 830 G7 | |
| Dell XPS 13 9310 Core i7 FHD | |
| Huawei MateBook X Pro 2021 | |
| Lenovo ThinkPad X13-20T20033GE | |
| Geekbench 5.5 / Single-Core | |
| Sınıf ortalaması Subnotebook (726 - 2224, n=48, son 2 yıl) | |
| Apple MacBook Pro 13 Late 2020 M1 Entry (8 / 256 GB) | |
| Dell XPS 13 9310 Core i7 FHD | |
| Lenovo ThinkPad X13 G2 20WK0024GE | |
| Ortalama Intel Core i7-1165G7 (1302 - 1595, n=77) | |
| Huawei MateBook X Pro 2021 | |
| HP EliteBook 830 G7 | |
| Lenovo ThinkPad X13-20UGS00800 | |
| Lenovo ThinkPad X13-20T20033GE | |
| Geekbench 5.5 / Multi-Core | |
| Sınıf ortalaması Subnotebook (2557 - 17218, n=48, son 2 yıl) | |
| Apple MacBook Pro 13 Late 2020 M1 Entry (8 / 256 GB) | |
| Dell XPS 13 9310 Core i7 FHD | |
| Lenovo ThinkPad X13 G2 20WK0024GE | |
| Lenovo ThinkPad X13-20UGS00800 | |
| Huawei MateBook X Pro 2021 | |
| Ortalama Intel Core i7-1165G7 (3078 - 5926, n=77) | |
| Lenovo ThinkPad X13-20T20033GE | |
| HP EliteBook 830 G7 | |
| HWBOT x265 Benchmark v2.2 / 4k Preset | |
| Sınıf ortalaması Subnotebook (0.97 - 25.1, n=57, son 2 yıl) | |
| Lenovo ThinkPad X13-20UGS00800 | |
| Lenovo ThinkPad X13 G2 20WK0024GE | |
| Ortalama Intel Core i7-1165G7 (1.39 - 8.47, n=80) | |
| Dell XPS 13 9310 Core i7 FHD | |
| Huawei MateBook X Pro 2021 | |
| HP EliteBook 830 G7 | |
| Lenovo ThinkPad X13-20T20033GE | |
| LibreOffice / 20 Documents To PDF | |
| HP EliteBook 830 G7 | |
| Lenovo ThinkPad X13-20UGS00800 | |
| Sınıf ortalaması Subnotebook (39.9 - 220, n=56, son 2 yıl) | |
| Lenovo ThinkPad X13-20T20033GE | |
| Ortalama Intel Core i7-1165G7 (21.5 - 88.1, n=78) | |
| Dell XPS 13 9310 Core i7 FHD | |
| Lenovo ThinkPad X13 G2 20WK0024GE | |
| Huawei MateBook X Pro 2021 | |
| R Benchmark 2.5 / Overall mean | |
| Lenovo ThinkPad X13-20T20033GE | |
| HP EliteBook 830 G7 | |
| Lenovo ThinkPad X13-20UGS00800 | |
| Huawei MateBook X Pro 2021 | |
| Ortalama Intel Core i7-1165G7 (0.552 - 1.002, n=80) | |
| Dell XPS 13 9310 Core i7 FHD | |
| Lenovo ThinkPad X13 G2 20WK0024GE | |
| Sınıf ortalaması Subnotebook (0.4024 - 1.456, n=58, son 2 yıl) | |
* ... daha küçük daha iyidir
Sistem performansı
ThinkPad X13 G2'nin öznel performans izlenimi çok iyidir ve tüm girdiler fark edilir gecikmeler olmadan yürütülür. Benzer bileşenler sayesinde çoğu karşılaştırma cihazı çok yakın olmasına ve pratikte bir fark görmeyeceğiniz halde, sentetik kıyaslama testlerindeki sonuçlar da iyidir. X13 G2'nin belleği (LPDDR4x-4266) artık lehimlenmiştir ve genişletilemez. Fiyatının yüksek olduğunu göz önünde bulundurarak en az 16 GB öneriyoruz; 32 GB'a kadar alabilirsiniz.
| PCMark 10 / Score | |
| Sınıf ortalaması Subnotebook (4920 - 9939, n=44, son 2 yıl) | |
| Lenovo ThinkPad X13 G2 20WK0024GE | |
| Ortalama Intel Core i7-1165G7, Intel Iris Xe Graphics G7 96EUs (4531 - 5454, n=50) | |
| Lenovo ThinkPad X13-20UGS00800 | |
| Dell XPS 13 9310 Core i7 FHD | |
| Huawei MateBook X Pro 2021 | |
| HP EliteBook 830 G7 | |
| Lenovo ThinkPad X13-20T20033GE | |
| PCMark 10 / Essentials | |
| Sınıf ortalaması Subnotebook (8552 - 11646, n=44, son 2 yıl) | |
| Huawei MateBook X Pro 2021 | |
| Lenovo ThinkPad X13 G2 20WK0024GE | |
| Ortalama Intel Core i7-1165G7, Intel Iris Xe Graphics G7 96EUs (8997 - 11505, n=50) | |
| Dell XPS 13 9310 Core i7 FHD | |
| Lenovo ThinkPad X13-20UGS00800 | |
| Lenovo ThinkPad X13-20T20033GE | |
| HP EliteBook 830 G7 | |
| PCMark 10 / Productivity | |
| Sınıf ortalaması Subnotebook (5435 - 16606, n=44, son 2 yıl) | |
| Lenovo ThinkPad X13-20UGS00800 | |
| HP EliteBook 830 G7 | |
| Lenovo ThinkPad X13 G2 20WK0024GE | |
| Dell XPS 13 9310 Core i7 FHD | |
| Lenovo ThinkPad X13-20T20033GE | |
| Huawei MateBook X Pro 2021 | |
| Ortalama Intel Core i7-1165G7, Intel Iris Xe Graphics G7 96EUs (5570 - 7136, n=50) | |
| PCMark 10 / Digital Content Creation | |
| Sınıf ortalaması Subnotebook (5722 - 13779, n=44, son 2 yıl) | |
| Lenovo ThinkPad X13 G2 20WK0024GE | |
| Ortalama Intel Core i7-1165G7, Intel Iris Xe Graphics G7 96EUs (4083 - 5550, n=50) | |
| Lenovo ThinkPad X13-20UGS00800 | |
| Dell XPS 13 9310 Core i7 FHD | |
| Huawei MateBook X Pro 2021 | |
| HP EliteBook 830 G7 | |
| Lenovo ThinkPad X13-20T20033GE | |
| PCMark 10 Score | 5105 puan | |
Yardım | ||
DPC-Gecikmeleri
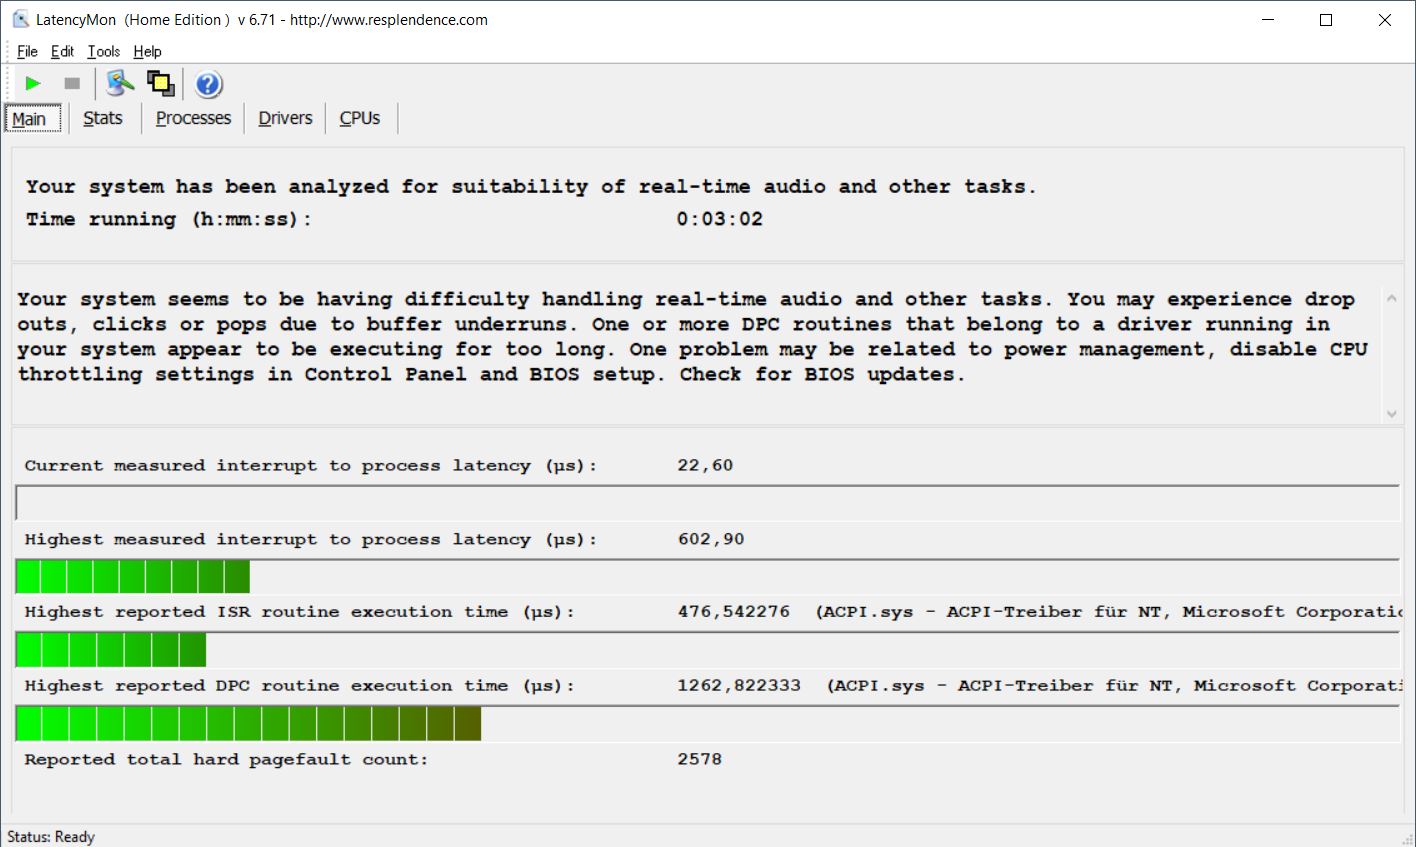
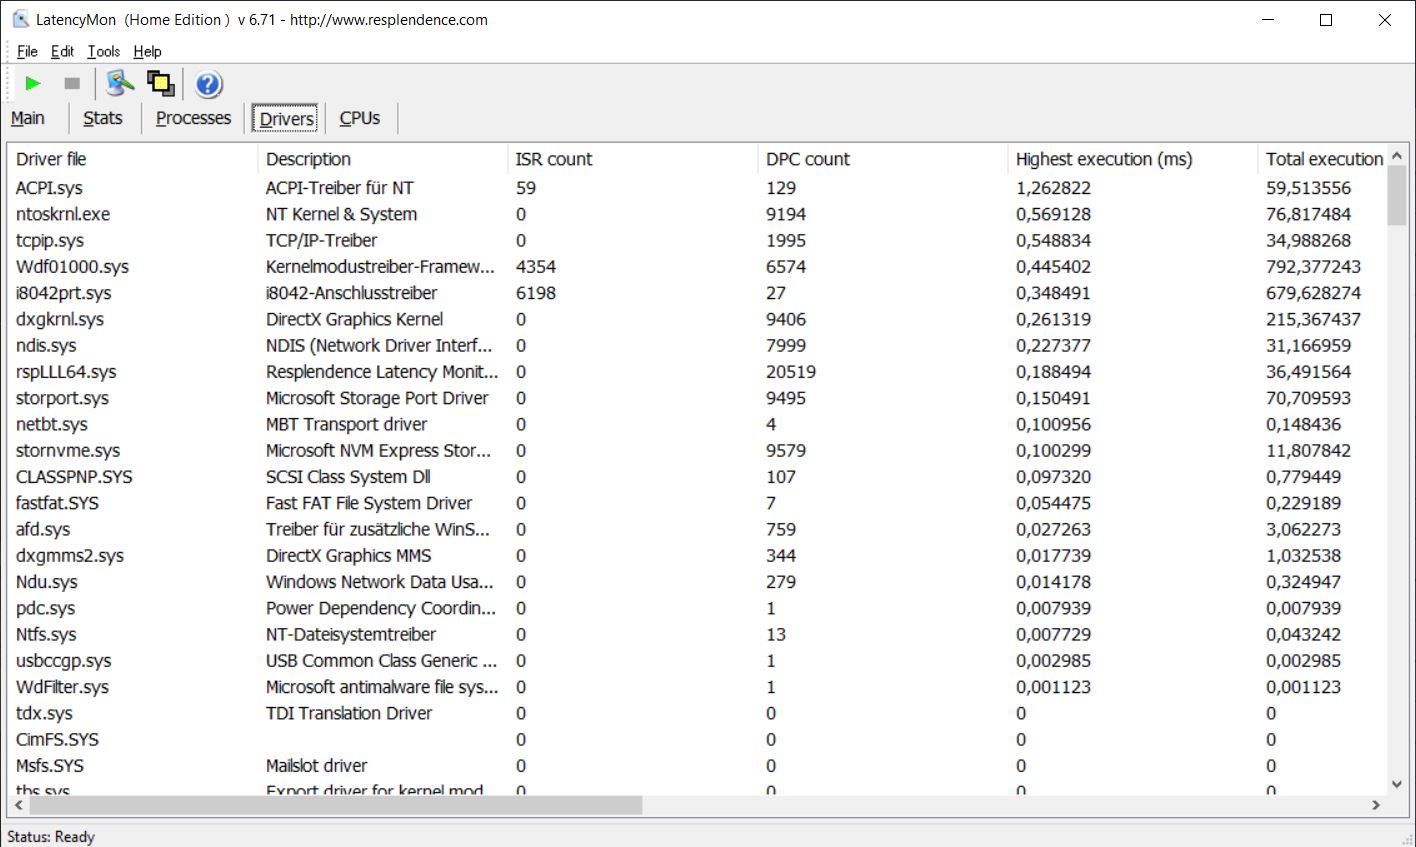
Standartlaştırılmış DPC gecikme testimiz (web'de gezinme, YouTube 4K oynatma, CPU yükü) ThinkPad X13 G2 için herhangi bir sorun göstermiyor ve YouTube video oynatımı sırasında da kare atlama olmadı.
| DPC Latencies / LatencyMon - interrupt to process latency (max), Web, Youtube, Prime95 | |
| Lenovo ThinkPad X13-20UGS00800 | |
| Huawei MateBook X Pro 2021 | |
| Dell XPS 13 9310 Core i7 FHD | |
| Lenovo ThinkPad X13-20T20033GE | |
| HP EliteBook 830 G7 | |
| Lenovo ThinkPad X13 G2 20WK0024GE | |
* ... daha küçük daha iyidir
Depolama Aygıtları - Think Pad, PCIe 4.0'ı destekliyor
Yeni ThinkPad X13 G2, hızlı PCIe 4.0 standardını destekliyor, ancak birimimiz hala bir PCIe-3.0-x4 sürücüsü kullanıyor. SK Hynix'ten çok hızlı bir sürüş olduğu için pratikte neredeyse hiç fark görmeyeceksiniz.
Depolama kapasitesi 512 GB'dir ve ilk kurulumdan sonra yaklaşık 411 GB kullanabilirsiniz. 3,5 GB/sn (okuma) ve neredeyse 2,9 GB/sn (yazma) aktarım hızlarını görebiliyoruz. Daha fazla SSD kıyaslaması burada mevcuttur..
| Lenovo ThinkPad X13 G2 20WK0024GE SK Hynix HFS512 GDE9X081N | Dell XPS 13 9310 Core i7 FHD Micron 2300 512GB MTFDHBA512TDV | HP EliteBook 830 G7 Samsung SSD PM981a MZVLB512HBJQ | Huawei MateBook X Pro 2021 Samsung PM981a MZVLB1T0HBLR | Ortalama SK Hynix HFS512 GDE9X081N | |
|---|---|---|---|---|---|
| CrystalDiskMark 5.2 / 6 | -12% | -7% | 14% | -5% | |
| Write 4K (MB/s) | 171.4 | 97.5 -43% | 118.3 -31% | 197.5 15% | 137.4 ? -20% |
| Read 4K (MB/s) | 70.8 | 50.9 -28% | 60.4 -15% | 52.9 -25% | 61.7 ? -13% |
| Write Seq (MB/s) | 1771 | 1811 2% | 2067 17% | 2174 23% | 2043 ? 15% |
| Read Seq (MB/s) | 1755 | 1836 5% | 2394 36% | 2156 23% | 1800 ? 3% |
| Write 4K Q32T1 (MB/s) | 525 | 521 -1% | 325.5 -38% | 632 20% | 463 ? -12% |
| Read 4K Q32T1 (MB/s) | 479.5 | 357.5 -25% | 332.2 -31% | 694 45% | 408 ? -15% |
| Write Seq Q32T1 (MB/s) | 2818 | 2879 2% | 2978 6% | 3017 7% | 2893 ? 3% |
| Read Seq Q32T1 (MB/s) | 3548 | 3204 -10% | 3552 0% | 3561 0% | 3585 ? 1% |
| AS SSD | -155% | -57% | -9% | -15% | |
| Seq Read (MB/s) | 2776 | 2091 -25% | 2081 -25% | 2794 1% | 2727 ? -2% |
| Seq Write (MB/s) | 1461 | 1396 -4% | 1433 -2% | 2385 63% | 1664 ? 14% |
| 4K Read (MB/s) | 63.8 | 49.29 -23% | 49.92 -22% | 60.7 -5% | 53.6 ? -16% |
| 4K Write (MB/s) | 209.4 | 104.2 -50% | 119.1 -43% | 180.8 -14% | 152.5 ? -27% |
| 4K-64 Read (MB/s) | 1148 | 827 -28% | 585 -49% | 1768 54% | 1025 ? -11% |
| 4K-64 Write (MB/s) | 1623 | 1636 1% | 1630 0% | 1800 11% | 1731 ? 7% |
| Access Time Read * (ms) | 0.032 | 0.066 -106% | 0.043 -34% | 0.037 -16% | 0.05417 ? -69% |
| Access Time Write * (ms) | 0.019 | 0.365 -1821% | 0.097 -411% | 0.073 -284% | 0.026 ? -37% |
| Score Read (Points) | 1489 | 1086 -27% | 843 -43% | 2108 42% | 1351 ? -9% |
| Score Write (Points) | 1978 | 1880 -5% | 1892 -4% | 2219 12% | 2051 ? 4% |
| Score Total (Points) | 4178 | 3499 -16% | 3149 -25% | 5392 29% | 4051 ? -3% |
| Copy ISO MB/s (MB/s) | 1833 | 1544 -16% | 2452 34% | 2065 13% | 2050 ? 12% |
| Copy Program MB/s (MB/s) | 993 | 613 -38% | 72.2 -93% | 734 -26% | 542 ? -45% |
| Copy Game MB/s (MB/s) | 1607 | 1451 -10% | 404 -75% | 1629 1% | 1228 ? -24% |
| Toplam Ortalama (Program / Ayarlar) | -84% /
-103% | -32% /
-39% | 3% /
-1% | -10% /
-11% |
* ... daha küçük daha iyidir

Sürekli yük okuması: DiskSpd Okuma Döngüsü, Sıra uzunluğu 8
GPU Performansı - Iris Xe Graphics G7
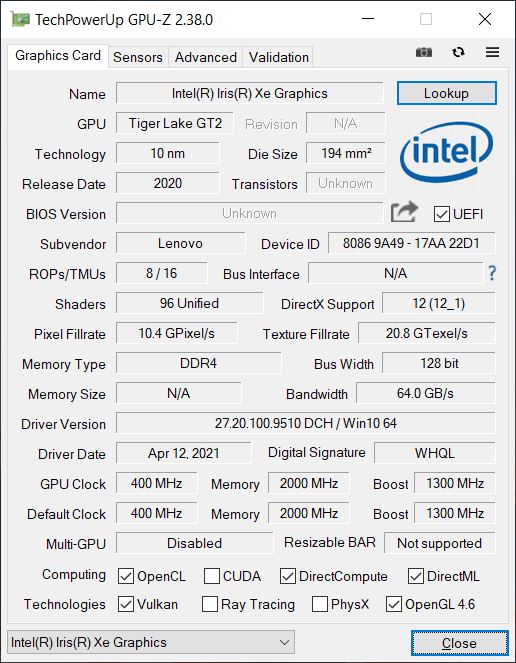
Core i7-1165G7, entegre Xe Graphics G7 ile donatılmıştır. 96 EUs ve maksimum 1300 MHz saat hızı ile daha hızlı versiyonudur. iGPU ayrıca çift kanallı konfigürasyonda hızlı bellekten yararlanır.
X13 G2, sentetik karşılaştırma testlerinde rakiplerinden daha hızlıdır ve grafik performansı, sürekli iş yükleri altında da sabittir; 3DMark stres testinden (Fire Strike) geçer. Intel iGPU'lu eski X13 G1 ile karşılaştırıldığında, performans faktör 3 tarafından neredeyse artırıldı ve modern Ryzen iGPU'ları da dövüldü. Pil gücüyle tam GPU performansını kullanabilirsiniz.
| 3DMark 11 - 1280x720 Performance GPU | |
| Sınıf ortalaması Subnotebook (995 - 18489, n=55, son 2 yıl) | |
| Lenovo ThinkPad X13 G2 20WK0024GE | |
| Dell XPS 13 9310 Core i7 FHD | |
| Ortalama Intel Iris Xe Graphics G7 96EUs (2867 - 7676, n=209) | |
| Huawei MateBook X Pro 2021 | |
| Lenovo ThinkPad X13-20UGS00800 | |
| HP EliteBook 830 G7 | |
| Lenovo ThinkPad X13-20T20033GE | |
| 3DMark | |
| 1280x720 Cloud Gate Standard Graphics | |
| Sınıf ortalaması Subnotebook (5577 - 61591, n=28, son 2 yıl) | |
| Lenovo ThinkPad X13 G2 20WK0024GE | |
| Huawei MateBook X Pro 2021 | |
| Ortalama Intel Iris Xe Graphics G7 96EUs (13162 - 39880, n=187) | |
| Dell XPS 13 9310 Core i7 FHD | |
| Lenovo ThinkPad X13-20UGS00800 | |
| HP EliteBook 830 G7 | |
| 1920x1080 Fire Strike Graphics | |
| Sınıf ortalaması Subnotebook (832 - 16347, n=56, son 2 yıl) | |
| Lenovo ThinkPad X13 G2 20WK0024GE | |
| Huawei MateBook X Pro 2021 | |
| Ortalama Intel Iris Xe Graphics G7 96EUs (2286 - 6624, n=222) | |
| Dell XPS 13 9310 Core i7 FHD | |
| Lenovo ThinkPad X13-20UGS00800 | |
| HP EliteBook 830 G7 | |
| Lenovo ThinkPad X13-20T20033GE | |
| 2560x1440 Time Spy Graphics | |
| Sınıf ortalaması Subnotebook (804 - 6288, n=55, son 2 yıl) | |
| Lenovo ThinkPad X13 G2 20WK0024GE | |
| Ortalama Intel Iris Xe Graphics G7 96EUs (707 - 1890, n=218) | |
| Huawei MateBook X Pro 2021 | |
| Dell XPS 13 9310 Core i7 FHD | |
| Lenovo ThinkPad X13-20UGS00800 | |
| HP EliteBook 830 G7 | |
| Lenovo ThinkPad X13-20T20033GE | |
| 3DMark 11 Performance | 7169 puan | |
| 3DMark Ice Storm Standard Score | 95856 puan | |
| 3DMark Cloud Gate Standard Score | 20532 puan | |
| 3DMark Fire Strike Score | 4795 puan | |
| 3DMark Time Spy Score | 1746 puan | |
Yardım | ||
Oyun Performansı
Gelişmiş grafik performansına rağmen, X13 G2 hala bir oyun dizüstü bilgisayarı değil, ancak en azından iGPU ile daha eski veya daha az güç gerektiren oyunları oynayabilirsiniz. Oyun performansı, daha uzun oyun oturumlarında da sabittir. Teknoloji bölümümüzde daha fazla oyun testi mevcuttur.
| F1 2020 | |
| 1920x1080 Ultra High Preset AA:T AF:16x | |
| Lenovo ThinkPad X13 G2 20WK0024GE | |
| Ortalama Intel Iris Xe Graphics G7 96EUs (15 - 28, n=31) | |
| 1920x1080 High Preset AA:T AF:16x | |
| Lenovo ThinkPad X13 G2 20WK0024GE | |
| Ortalama Intel Iris Xe Graphics G7 96EUs (22 - 44.4, n=32) | |
| 1920x1080 Medium Preset AF:16x | |
| Lenovo ThinkPad X13 G2 20WK0024GE | |
| Ortalama Intel Iris Xe Graphics G7 96EUs (23.1 - 57.5, n=34) | |
| 1280x720 Ultra Low Preset | |
| Lenovo ThinkPad X13 G2 20WK0024GE | |
| Ortalama Intel Iris Xe Graphics G7 96EUs (49 - 109.6, n=34) | |
| X-Plane 11.11 | |
| 1920x1080 high (fps_test=3) | |
| Sınıf ortalaması Subnotebook (20.7 - 50.5, n=51, son 2 yıl) | |
| Dell XPS 13 9310 Core i7 FHD | |
| Lenovo ThinkPad X13 G2 20WK0024GE | |
| Ortalama Intel Iris Xe Graphics G7 96EUs (11.1 - 59.8, n=213) | |
| Huawei MateBook X Pro 2021 | |
| Lenovo ThinkPad X13-20UGS00800 | |
| Lenovo ThinkPad X13-20T20033GE | |
| HP EliteBook 830 G7 | |
| 1920x1080 med (fps_test=2) | |
| Sınıf ortalaması Subnotebook (25.1 - 65.9, n=51, son 2 yıl) | |
| Dell XPS 13 9310 Core i7 FHD | |
| Lenovo ThinkPad X13 G2 20WK0024GE | |
| Ortalama Intel Iris Xe Graphics G7 96EUs (11.6 - 69.5, n=214) | |
| Huawei MateBook X Pro 2021 | |
| Lenovo ThinkPad X13-20UGS00800 | |
| Lenovo ThinkPad X13-20T20033GE | |
| HP EliteBook 830 G7 | |
| 1280x720 low (fps_test=1) | |
| Sınıf ortalaması Subnotebook (29.9 - 82.5, n=59, son 2 yıl) | |
| Dell XPS 13 9310 Core i7 FHD | |
| Lenovo ThinkPad X13 G2 20WK0024GE | |
| Ortalama Intel Iris Xe Graphics G7 96EUs (13.4 - 88.4, n=213) | |
| Lenovo ThinkPad X13-20UGS00800 | |
| Huawei MateBook X Pro 2021 | |
| Lenovo ThinkPad X13-20T20033GE | |
| HP EliteBook 830 G7 | |
Witcher 3 FPS Diagram
| düşük | orta | yüksek | ultra | |
|---|---|---|---|---|
| GTA V (2015) | 89.2 | 27.4 | 10.8 | |
| The Witcher 3 (2015) | 97 | 58 | 31 | 12.7 |
| Dota 2 Reborn (2015) | 83 | 72.1 | 46.9 | 44.4 |
| Final Fantasy XV Benchmark (2018) | 39.3 | 21.3 | 15.8 | |
| X-Plane 11.11 (2018) | 43.2 | 36.1 | 32.4 | |
| Far Cry 5 (2018) | 55 | 26 | 24 | 21 |
| Strange Brigade (2018) | 91.2 | 38.9 | 30.9 | 25 |
| F1 2020 (2020) | 88 | 46 | 34 | 23 |
Emisyonlar - Daha fazla performans ve daha gürültülü fan
Sistem Gürültüsü
Yüksek güç limitleri sayesinde, fanın yük altında daha hızlı dönmesi gerekiyor ve yeni model, çok sessiz olan önceki modele göre fark edilir şekilde daha yüksek sesle çalışıyor. Fanın mırıltısı rahatsız edici değil ve tiz bir ses de yok. Fan, "En İyi Performans" modunu (Windows güç kaydırıcısı) kullandığınızda günlük durumlarda da oldukça hızlı bir şekilde devreye girer. Maksimum performansa ihtiyacınız yoksa, kesinlikle daha az güçlü iki enerji ayarından birini öneriyoruz. Test ünitemizde bobin vızıltısı gibi elektronik seslerde herhangi bir sorun yaşanmadı.
Ses yüksekliği
| Boşta |
| 25.5 / 25.5 / 29 dB |
| Çalışırken |
| 37.4 / 37.4 dB |
 | ||
30 dB sessiz 40 dB(A) duyulabilirlik 50 dB(A) gürültülü |
||
min: | ||
| Lenovo ThinkPad X13 G2 20WK0024GE Iris Xe G7 96EUs, i7-1165G7, SK Hynix HFS512 GDE9X081N | Dell XPS 13 9310 Core i7 FHD Iris Xe G7 96EUs, i7-1165G7, Micron 2300 512GB MTFDHBA512TDV | Apple MacBook Pro 13 Late 2020 M1 Entry (8 / 256 GB) M1 8-Core GPU, M1, Apple SSD AP0256 | HP EliteBook 830 G7 UHD Graphics 620, i7-10810U, Samsung SSD PM981a MZVLB512HBJQ | Huawei MateBook X Pro 2021 Iris Xe G7 96EUs, i7-1165G7, Samsung PM981a MZVLB1T0HBLR | Lenovo ThinkPad X13-20UGS00800 Vega 7, R7 PRO 4750U, Samsung SSD PM981a MZVLB512HBJQ | |
|---|---|---|---|---|---|---|
| Noise | 6% | -7% | 0% | 7% | -2% | |
| kapalı / ortam * (dB) | 25.5 | 25.7 -1% | 29.2 -15% | 26.8 -5% | 25.4 -0% | 29.1 -14% |
| Idle Minimum * (dB) | 25.5 | 25.7 -1% | 29.2 -15% | 27.1 -6% | 25.6 -0% | 29.1 -14% |
| Idle Average * (dB) | 25.5 | 25.7 -1% | 29.2 -15% | 27.1 -6% | 25.6 -0% | 29.1 -14% |
| Idle Maximum * (dB) | 29 | 25.9 11% | 29.2 -1% | 27.1 7% | 25.6 12% | 29.1 -0% |
| Load Average * (dB) | 37.4 | 26.2 30% | 32.1 14% | 31.4 16% | 28.7 23% | 31.1 17% |
| Witcher 3 ultra * (dB) | 37.4 | 36.5 2% | 32 14% | |||
| Load Maximum * (dB) | 37.4 | 36.6 2% | 41.9 -12% | 39 -4% | 38.2 -2% | 31.8 15% |
* ... daha küçük daha iyidir
Sıcaklıklar
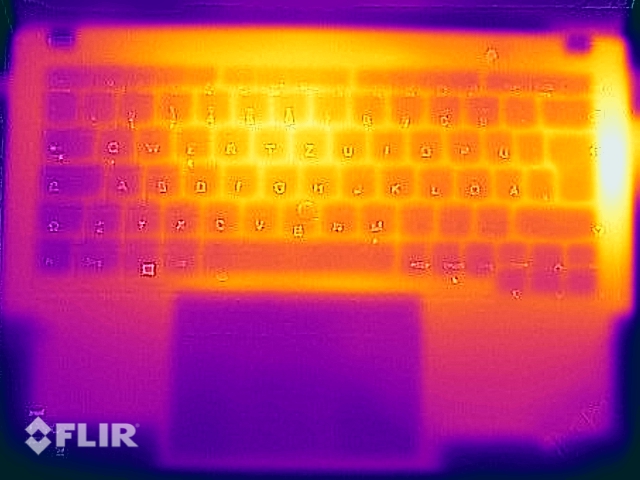
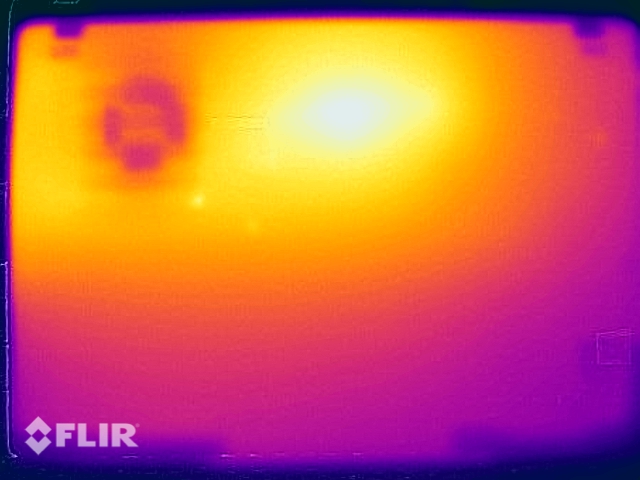
Kompakt X13 G2 yük altında oldukça ısınır ve ana ünitenin sağ tarafında fan egzozu çevresinde 50 °C'den fazla ölçüm yapabiliriz. Alt panel öncelikle CPU'nun bulunduğu merkezde ısınır. Not defterini strese soktuğunuzda kucağınıza koymamalısınız, ancak günlük senaryolarda herhangi bir sınırlama yoktur.
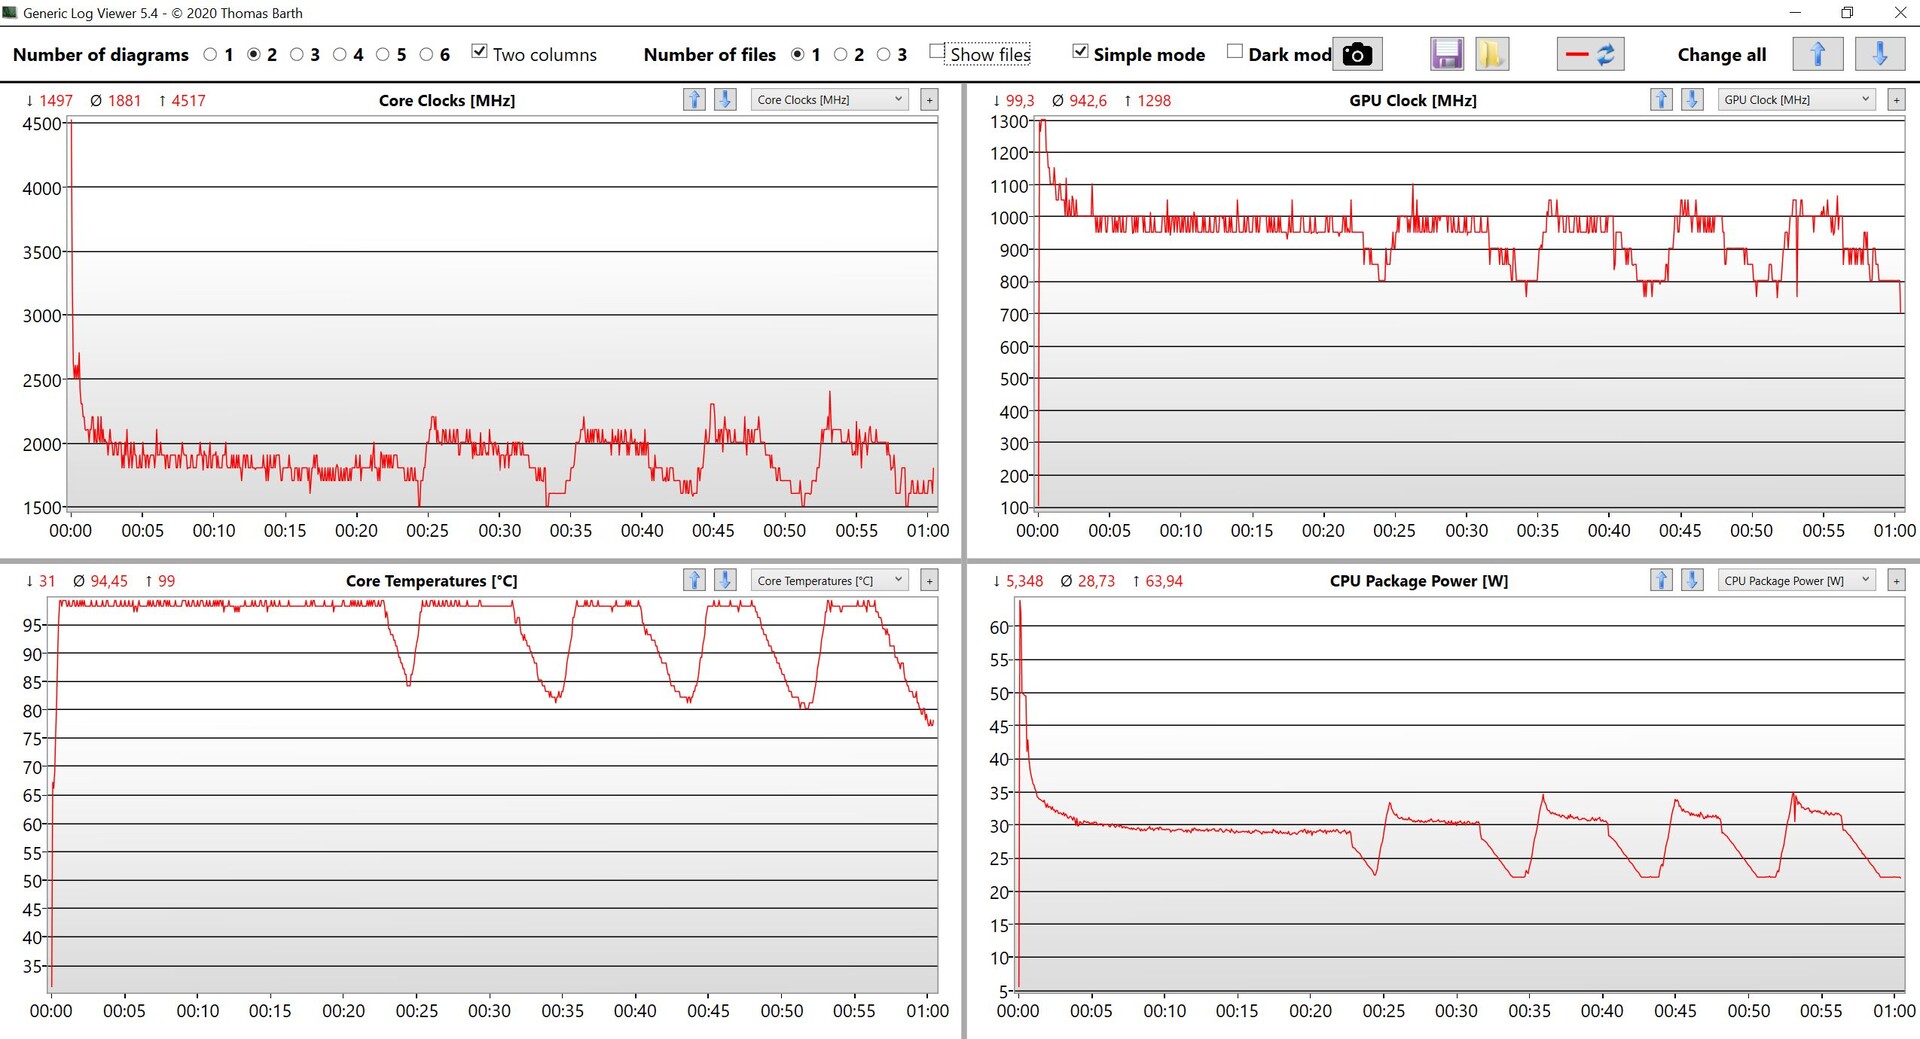
Bir kez daha, işlemcinin birleşik iş yüklerinde yaklaşık 30W (~1.9 GHz CPU ve ~950 MHz iGPU) seviyesinde hızla düştüğünü görebiliriz. Yaklaşık 25 dakika sonra bir dalgalanma görebiliriz, ancak ortalama değerler kabaca aynıdır. Gelecekte performansı dengelemek için bir yazılım güncellemesi olabilir.
(-) Üst taraftaki maksimum sıcaklık, 35.9 °C / 97 F ortalamasına kıyasla 53.9 °C / 129 F'dir. , Subnotebook sınıfı için 21.4 ile 59 °C arasında değişir.
(-) Alt kısım, 39.2 °C / 103 F ortalamasına kıyasla maksimum 49.1 °C / 120 F'ye kadar ısınır
(+) Boşta kullanımda, üst tarafın ortalama sıcaklığı 24 °C / 75 F olup, cihazın 30.8 °C / 87 F.
(-) The Witcher 3 oynarken, üst tarafın ortalama sıcaklığı 39.4 °C / 103 F olup, cihazın 30.8 °C / 87 F.
(±) Avuç içi dayanakları ve dokunmatik yüzey maksimum 37 °C / 98.6 F ile dokunulamayacak kadar ısınabilir.
(-) Benzer cihazların avuç içi dayanağı alanının ortalama sıcaklığı 28.2 °C / 82.8 F (-8.8 °C / -15.8 F) idi.
Hoparlörler
İki stereo hoparlör klavyenin üzerinde bulunuyor ve sesi kullanıcıya yönlendiriyor. Kalite, örneğin X1 Carbon gibi sistemler tarafından gösterilen optimizasyonlara yer bırakıyor. MacBook Pro 13 veya Huawei MateBook X Pro gibi tüketici modelleri de burada büyük bir avantaja sahip. Hoparlörler video konferanslar için kesinlikle yeterli ancak müzik dinlerken veya film izlerken kulaklık veya harici hoparlör kullanmanızı öneririz. Önceden yüklenmiş Dolby yazılımı farklı profiller sunar, ancak ses farklılıkları küçüktür.
Lenovo ThinkPad X13 G2 20WK0024GE ses analizi
(±) | hoparlör ses yüksekliği ortalama ama iyi (77.4 dB)
Bas 100 - 315Hz
(-) | neredeyse hiç bas yok - ortalama olarak medyandan 21.2% daha düşük
(±) | Bas doğrusallığı ortalamadır (7.8% delta - önceki frekans)
Ortalar 400 - 2000 Hz
(+) | dengeli ortalar - medyandan yalnızca 3.5% uzakta
(±) | Ortaların doğrusallığı ortalamadır (7.6% delta - önceki frekans)
Yüksekler 2 - 16 kHz
(+) | dengeli yüksekler - medyandan yalnızca 1.5% uzakta
(+) | yüksekler doğrusaldır (2.8% deltadan önceki frekansa)
Toplam 100 - 16.000 Hz
(±) | Genel sesin doğrusallığı ortalamadır (18% ortancaya göre fark)
Aynı sınıfla karşılaştırıldığında
» Bu sınıftaki tüm test edilen cihazların %51%'si daha iyi, 8% benzer, 41% daha kötüydü
» En iyisinin deltası 5% idi, ortalama 18% idi, en kötüsü 53% idi
Test edilen tüm cihazlarla karşılaştırıldığında
» Test edilen tüm cihazların %38'si daha iyi, 8 benzer, % 54 daha kötüydü
» En iyisinin deltası 4% idi, ortalama 24% idi, en kötüsü 134% idi
Apple MacBook Pro 13 Late 2020 M1 Entry (8 / 256 GB) ses analizi
(±) | hoparlör ses yüksekliği ortalama ama iyi (77.5 dB)
Bas 100 - 315Hz
(±) | azaltılmış bas - ortalama olarak medyandan 8.7% daha düşük
(±) | Bas doğrusallığı ortalamadır (8.6% delta - önceki frekans)
Ortalar 400 - 2000 Hz
(+) | dengeli ortalar - medyandan yalnızca 4.2% uzakta
(+) | orta frekanslar doğrusaldır (4.2% deltadan önceki frekansa)
Yüksekler 2 - 16 kHz
(+) | dengeli yüksekler - medyandan yalnızca 1.2% uzakta
(+) | yüksekler doğrusaldır (4% deltadan önceki frekansa)
Toplam 100 - 16.000 Hz
(+) | genel ses doğrusaldır (12.9% ortancaya göre fark)
Aynı sınıfla karşılaştırıldığında
» Bu sınıftaki tüm test edilen cihazların %19%'si daha iyi, 5% benzer, 76% daha kötüydü
» En iyisinin deltası 5% idi, ortalama 18% idi, en kötüsü 53% idi
Test edilen tüm cihazlarla karşılaştırıldığında
» Test edilen tüm cihazların %12'si daha iyi, 3 benzer, % 85 daha kötüydü
» En iyisinin deltası 4% idi, ortalama 24% idi, en kötüsü 134% idi
Huawei MateBook X Pro 2021 ses analizi
(+) | hoparlörler nispeten yüksek sesle çalabilir (82.7 dB)
Bas 100 - 315Hz
(±) | azaltılmış bas - ortalama olarak medyandan 13.6% daha düşük
(±) | Bas doğrusallığı ortalamadır (10.1% delta - önceki frekans)
Ortalar 400 - 2000 Hz
(+) | dengeli ortalar - medyandan yalnızca 2.9% uzakta
(+) | orta frekanslar doğrusaldır (3.3% deltadan önceki frekansa)
Yüksekler 2 - 16 kHz
(+) | dengeli yüksekler - medyandan yalnızca 4.6% uzakta
(±) | Yükseklerin doğrusallığı ortalamadır (8.2% delta - önceki frekans)
Toplam 100 - 16.000 Hz
(+) | genel ses doğrusaldır (11.8% ortancaya göre fark)
Aynı sınıfla karşılaştırıldığında
» Bu sınıftaki tüm test edilen cihazların %13%'si daha iyi, 3% benzer, 83% daha kötüydü
» En iyisinin deltası 5% idi, ortalama 18% idi, en kötüsü 53% idi
Test edilen tüm cihazlarla karşılaştırıldığında
» Test edilen tüm cihazların %8'si daha iyi, 3 benzer, % 89 daha kötüydü
» En iyisinin deltası 4% idi, ortalama 24% idi, en kötüsü 134% idi
Enerji Yönetimi – İyi dayanıklılığa sahip
Güç tüketimi
Enerji ölçümlerimiz herhangi bir sürpriz göstermiyor. X13 G2, boşta çalışırken çok verimli ve aynı zamanda AMD işlemcili eski X13 G1'den çok daha iyi. Ryzen 5000 ile yeni X13 G2'nin nasıl bir performans göstereceğini şimdiden görmek için sabırsızlanıyoruz. Pil gücünde klavye aydınlatmasının yalnızca ilk düzeyini kullanmalısınız, çünkü bu, tüketimi yalnızca ~0,4 W (düzey 2 + 1,4 W) artırır.
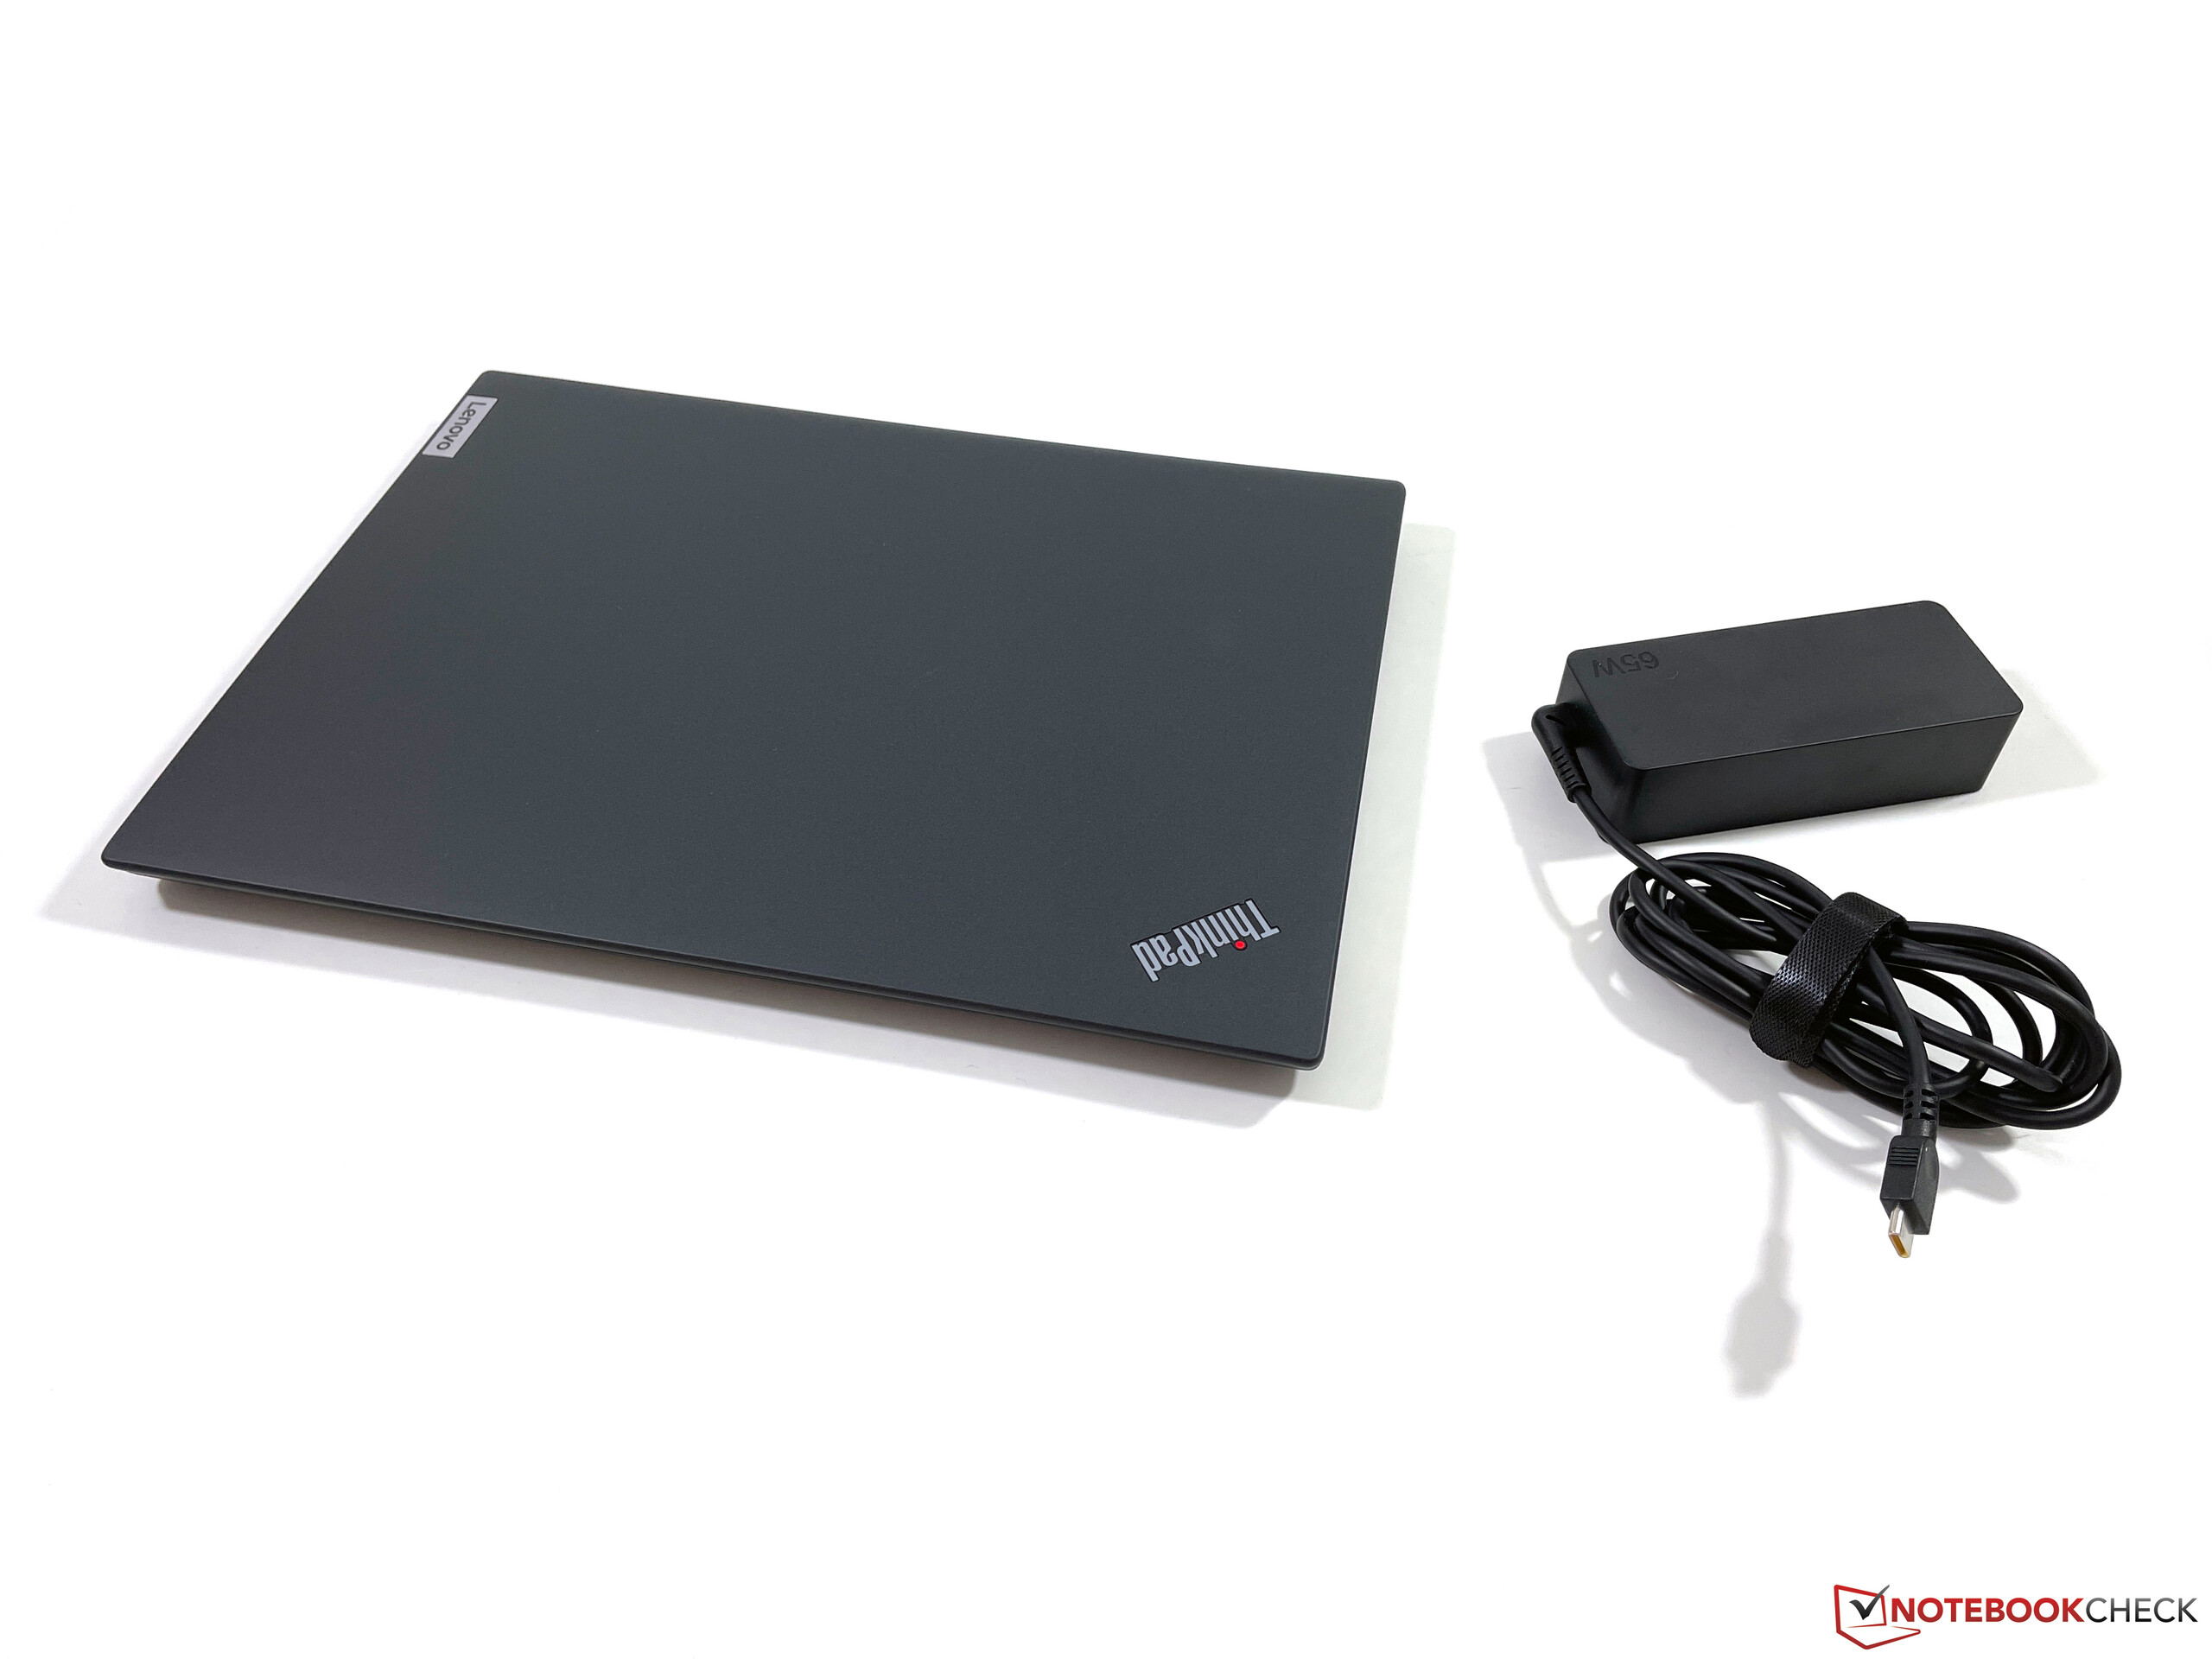
Stres testimiz sırasında tüketim 68.2W'a kadar çıkıyor, ancak hızlı bir şekilde yaklaşık 45W'a düşüyor. Bu, birlikte verilen 65W güç adaptörünün tamamen yeterli olduğu anlamına gelir.
| Kapalı / Bekleme modu | |
| Boşta | |
| Çalışırken |
|
Key:
min: | |
| Lenovo ThinkPad X13 G2 20WK0024GE i7-1165G7, Iris Xe G7 96EUs, SK Hynix HFS512 GDE9X081N, IPS, 1920x1200, 13.3" | Dell XPS 13 9310 Core i7 FHD i7-1165G7, Iris Xe G7 96EUs, Micron 2300 512GB MTFDHBA512TDV, IPS, 1920x1200, 13.4" | Apple MacBook Pro 13 Late 2020 M1 Entry (8 / 256 GB) M1, M1 8-Core GPU, Apple SSD AP0256, IPS, 2560x1600, 13.3" | HP EliteBook 830 G7 i7-10810U, UHD Graphics 620, Samsung SSD PM981a MZVLB512HBJQ, IPS, 1920x1080, 13.3" | Huawei MateBook X Pro 2021 i7-1165G7, Iris Xe G7 96EUs, Samsung PM981a MZVLB1T0HBLR, IPS, 3000x2000, 13.9" | Lenovo ThinkPad X13-20UGS00800 R7 PRO 4750U, Vega 7, Samsung SSD PM981a MZVLB512HBJQ, IPS LED, 1920x1080, 13.3" | Ortalama Intel Iris Xe Graphics G7 96EUs | Sınıf ortalaması Subnotebook | |
|---|---|---|---|---|---|---|---|---|
| Power Consumption | 0% | 16% | 7% | -40% | -34% | -43% | -12% | |
| Idle Minimum * (Watt) | 2.8 | 3.9 -39% | 1.67 40% | 3.6 -29% | 6.7 -139% | 6 -114% | 5.51 ? -97% | 3.82 ? -36% |
| Idle Average * (Watt) | 5.9 | 5.9 -0% | 6.7 -14% | 4.7 20% | 10 -69% | 8.9 -51% | 8.66 ? -47% | 6.61 ? -12% |
| Idle Maximum * (Watt) | 6.8 | 6.3 7% | 7.4 -9% | 5.1 25% | 10.3 -51% | 11.3 -66% | 10.9 ? -60% | 7.99 ? -18% |
| Load Average * (Watt) | 41.5 | 39.7 4% | 28 33% | 33.3 20% | 35.7 14% | 34.2 18% | 45.6 ? -10% | 41.9 ? -1% |
| Witcher 3 ultra * (Watt) | 34.2 | 34.8 -2% | 32.7 4% | |||||
| Load Maximum * (Watt) | 68.2 | 47.5 30% | 47.5 30% | 70 -3% | 67.6 1% | 37.2 45% | 67.8 ? 1% | 64.1 ? 6% |
* ... daha küçük daha iyidir
Witcher 3 enerji tüketimi
Batarya Çalışma Süresi
Lenovo, pil kapasitesini 48'den 54,7 Wh'ye çıkardı ve pil çalışma süresi iyileştirildi. X13 G2, 150 nit parlaklıkta 15 saatlik çalışma süresiyle video testinde daha verimli video kod çözücüden yararlanır. 150 nit'teki Wi-Fi testi neredeyse 10 saat sürüyor, ancak rakipler daha da uzun sürüyor. Hala çoğu durum için 10 saatin yeterli olması gerektiğini düşünüyoruz. Tam parlaklıkta Wi-Fi testi hala yaklaşık 8,5 saat çalışır.
Cihaz açıldığında pilin tam şarj olması 111 dakika sürer. ~28 dakika sonra kapasitenin %50'si kullanılabilir; 54 dakika sonra %80.
| Lenovo ThinkPad X13 G2 20WK0024GE i7-1165G7, Iris Xe G7 96EUs, 54.7 Wh | Dell XPS 13 9310 Core i7 FHD i7-1165G7, Iris Xe G7 96EUs, 52 Wh | Apple MacBook Pro 13 Late 2020 M1 Entry (8 / 256 GB) M1, M1 8-Core GPU, 58.2 Wh | HP EliteBook 830 G7 i7-10810U, UHD Graphics 620, 53 Wh | Huawei MateBook X Pro 2021 i7-1165G7, Iris Xe G7 96EUs, 56 Wh | Lenovo ThinkPad X13-20UGS00800 R7 PRO 4750U, Vega 7, 48 Wh | Lenovo ThinkPad X13-20T20033GE i5-10210U, UHD Graphics 620, 48 Wh | Sınıf ortalaması Subnotebook | |
|---|---|---|---|---|---|---|---|---|
| Pil Çalışma Süresi | 70% | 66% | 90% | 60% | -17% | 21% | 28% | |
| H.264 (h) | 15 | 19.2 28% | 8.3 -45% | 11.7 -22% | 15.6 ? 4% | |||
| WiFi v1.3 (h) | 10 | 11 10% | 20.4 104% | 11.5 15% | 10.5 5% | 8.7 -13% | 9.3 -7% | 14 ? 40% |
| Load (h) | 1.4 | 3.2 129% | 3.7 164% | 3 114% | 1.5 7% | 2.7 93% | 1.946 ? 39% |
Artılar
Eksiler
Son Görüş - Kullanılmayan potansiyele sahip ThinkPad X13 G2
Yeni ThinkPad X13 G2 iyi bir güncelleme geçirmiş. Cihaz biraz daha kompakt, 16:10 ekrana sahip, Tiger Lake işlemcinin performansı iyi ve Lenovo da pil kapasitesini artırmayı başarmış.
Dell XPS 13, Apple MacBook Pro 13 ve Huawei MateBook X Pro gibi tüketici cihazlarına kıyasla en büyük avantaj, SmartCard okuyucu ve LTE ve hatta 5G için isteğe bağlı WWAN modüllerini içeren kapsamlı bağlantıdır: İş cihazlarının da garanti açısından bir avantajı vardır.
Lenovo, alandan tasarruf etmek için azaltılmış hareket ve daha sığ tuşlara sahip klavyelere yönelik trendi hala takip ediyor. Üretici hala kanıtlanmış ThinkPad kalitesinin reklamını yapıyor ve klavye hiçbir şekilde kötü değil, ancak klavyeyi mevcut ThinkPad E14 G3 ile (yarı fiyatına) karşılaştırırsanız, örneğin, ne kadar daha iyi olabileceğini hemen görürsünüz.
5G, 16:10 ekran ve uzun pil ömrü ile mükemmel bağlantı: Klavye eskisi kadar iyi olmasa da ThinkPad X13 G2 hala çok iyi bir mobil arkadaştır.
Ekran konusunda da biraz hayal kırıklığına uğradık. Mat IPS ekranın görüntü kalitesi iyi, ancak biz çıkıntılar daha parlak paneller görmek isterdik. X13 Yoga G2 incelememizde gördüğümüz gibi, daha parlak, daha iyi görüntü kalitesi sunan ve pil ömrü üzerinde büyük bir etkisi olmayan 2560 x 1600 pikselli isteğe bağlı WQXGA panelini kesinlikle tavsiye ediyoruz. ThinkPad X13 G2'nin yeni EliteBook 830 G8'i ve (bulunduğu anda) AMD sürümünü inceleyeceğiz.
Fiyat ve Bulunabilirlik
Lenovo.com'da kendi ThinkPad X13 G2'nizi ~1200$'dan başlayan fiyatlarla yapılandırabilirsiniz. İnceleme yapılandırmamız şu anda yaklaşık 1500 ABD doları karşılığında kullanılabilir.
Lenovo ThinkPad X13 G2 20WK0024GE
- 07/06/2021 v7 (old)
Andreas Osthoff
Price comparison

