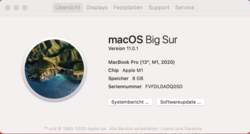
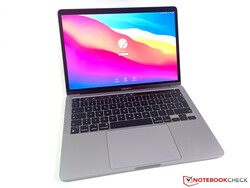
Apple MacBook Pro 13 2020 Dizüstü Bilgisayar İncelemesi: Giriş seviyesi Pro, M1 performans artışını da elde ediyor
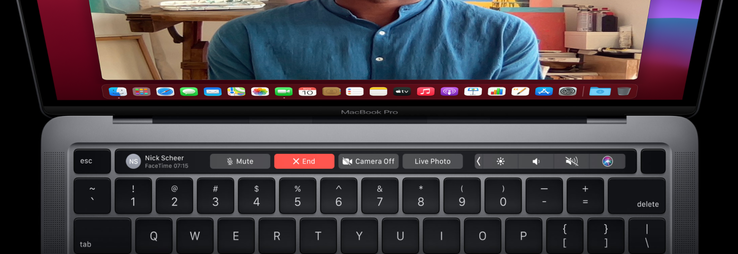
Yeni MacBook Air artık özel olarak Apple'ın kendi ARM silikonundan güç alırken, daha pahalı MacBook Pro 13'ün tamamen farklı iki modelini hala alıyoruz. Apple hala daha yüksek fiyat aralığında dört Thunderbolt bağlantı noktası ve Intel CPU'lar (28W) içeren sürümü sunuyor. 1799 $ 'dan başlayan fiyatlarla ve iki Thunderbolt bağlantı noktasına ve daha yavaş Intel CPU'lara (15W) sahip önceki giriş seviyesi MBP 13 artık Apple M1 yongasıyla donatılmıştır. Yeni MBP 13 M1'in fiyatı 1299 $ 'dan başlıyor (eğitim mağazasında 1199 $) Yeni MacBook Pro 13'ü daha pahalı modelle (4x Thunderbolt) ve ayrıca daha önce incelediğimiz MacBook Air M1 ile karşılaştıracağız. Air daha fazla iyileştirme aldı, bu nedenle daha ucuz MacBook Air'in daha iyi bir seçim olup olmadığını öğrenmek istiyoruz.
possible competitors in comparison
Derecelendirme | Tarih | Modeli | Ağırlık | Yükseklik | Boyut | Çözünürlük | Fiyat |
|---|---|---|---|---|---|---|---|
| 91.1 % v7 (old) | 01/2021 | Apple MacBook Pro 13 Late 2020 M1 Entry (8 / 256 GB) M1, M1 8-Core GPU | 1.4 kg | 15.6 mm | 13.30" | 2560x1600 | |
| 92.1 % v7 (old) | 06/2020 | Apple MacBook Pro 13 2020 2GHz i5 10th-Gen i5-1038NG7, Iris Plus Graphics G7 (Ice Lake 64 EU) | 1.4 kg | 15.6 mm | 13.30" | 2560x1600 | |
| 90.6 % v7 (old) | 02/2020 | Apple MacBook Pro 13 2019 2TB3 i5-8257U, Iris Plus Graphics 645 | 1.4 kg | 14.9 mm | 13.30" | 2560x1600 | |
| 91.1 % v7 (old) | 01/2021 | Apple MacBook Air 2020 M1 Entry M1, M1 7-Core GPU | 1.3 kg | 16.1 mm | 13.30" | 2560x1600 | |
| 88.1 % v7 (old) | 12/2020 | Dell XPS 13 9310 Core i7 FHD i7-1165G7, Iris Xe G7 96EUs | 1.3 kg | 14.8 mm | 13.40" | 1920x1200 | |
| 87.4 % v7 (old) | 05/2020 | Huawei MateBook X Pro 2020 i7 i7-10510U, GeForce MX250 | 1.3 kg | 14.6 mm | 13.90" | 3000x2000 | |
| 86.6 % v7 (old) | 01/2021 | Razer Book 13 FHD i7-1165G7, Iris Xe G7 96EUs | 1.4 kg | 15.15 mm | 13.40" | 1920x1200 |
Durum - Görünür fark yok
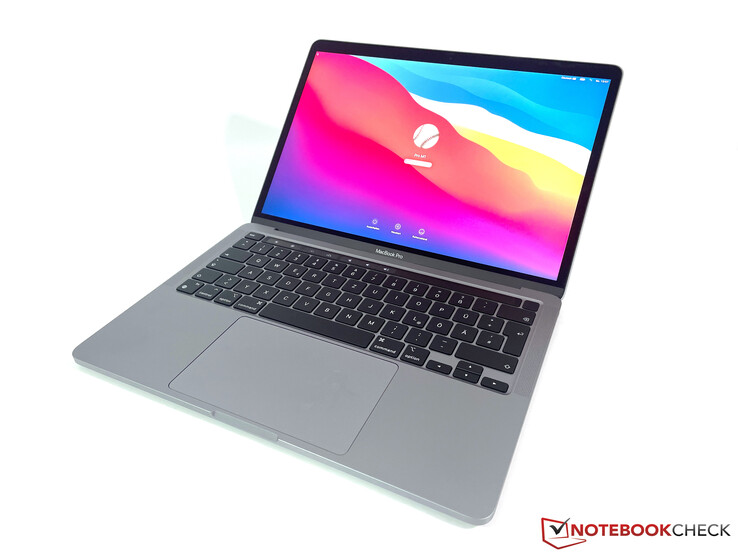
Apple, giriş seviyesi MBP 13'ün tanıdık yekpare kasasına dokunmadı ve yine de gümüş ve uzay grisi modeller arasında seçim yapabilirsiniz. MacBook Pro'nun kalitesi hala mükemmel ve yüzeyler pratikte kir veya yağlanmaya çok meyilli değil. Ancak kasa tasarımının yaşını fark etmeye başlıyorsunuz çünkü çerçeveler, örneğin Dell XPS 13 gibi rakiplere göre oldukça geniş.
Top 10
» Top 10 Multimedia Notebook listesi
» Top 10 oyun notebooku
» Top 10 bütçeye uygun Ofis/İş Notebook Listesi
» Top 10 Premium Ofis/İş notebookları
» Top 10 Çalışma istasyonu laptopları
» Top 10 Subnotebook listesi
» Top 10 Ultrabooklar
» En iyi 10 dönüştürülebilir modeli
» Seçimi en iyi 10 tablet
» Notebookcheck Top 10 Windows Tabletleri
» Top 10 Subnotebook listesi
» NotebookCheck tarafından incelenen en iyi Notebook ekranları
» Notebookcheck'in 500 Euro altındaki en iyi 10 Notebook listesi
» NotebookCheck tarafından seçilen 300 Euro altındaki en iyi 10 Notebook
» Notebookcheck'in 500 Euro altındaki en iyi 10 Notebook listesi
» Notebookcheck'in Top 10 akıllı telefon listesi
» Notebookcheck'in Top 10 hafif oyun notebookları
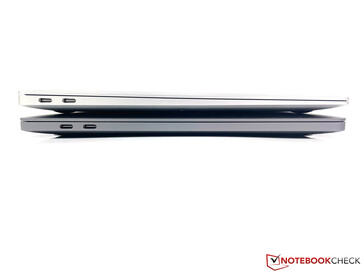
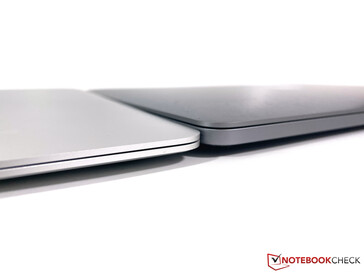
MacBook Pro 13 ve MacBook Air aynı ayak izine sahip, ancak MacBook Air öne doğru inceliyor. Bu nedenle, yazarken biraz daha rahat oluyor çünkü MBP 13'ün ön kenarı oldukça keskin. Air'in ağırlık avantajı ~ 150 gramda çok büyük değil.
Bağlantı - USB 4 ve Wi-Fi 6 ile MBP 13 M1
Sağda hala 3,5 mm stereo jak ve sol tarafta iki Thunderbolt 3 bağlantı noktası (USB-C konektörleri) var. Artık USB 4'ü de destekliyorlar, ancak aktarım hızı, USB 3.1 Gen.2 gibi 10 Gbps ile sınırlı. Yeni MacBook Air incelememizde daha önce gördüğümüz gibi, çevre birimleri bağladığınızda hala uyumluluk sorunları olabilir. İki bağlantı noktasından biri güç adaptörü tarafından engellenir ve bağlantı noktaları da birbirine çok yakındır; bu, örneğin daha geniş başparmak sürücüleri kullandığınızda bir sorun olabilir.
İletişim - Yalnızca 80 MHz Wi-Fi 6
MacBook Air M1 ve Wi-Fi 6 özellikli diğer Apple ürünlerine (örn. İPad'ler) benzer şekilde, Wi-Fi modülü (2x2) hızlı 802.11ax standardını destekler, ancak 160 MHz bağlantılarını değil yalnızca 80 MHz'i destekler. Bu nedenle, aktarım hızları, Intel CPU ve Wi-Fi 5 ile doğrudan önceki MBP 13 2020 ile karşılaştırıldığında daha iyi değil. Windows rekabetinin, daha eski Wi-Fi 5 modülleri (160 MHz) ile bile burada bir avantajı var.
| Networking | |
| iperf3 transmit AX12 | |
| Huawei MateBook X Pro 2020 i7 | |
| Razer Book 13 FHD | |
| Dell XPS 13 9310 Core i7 FHD | |
| Apple MacBook Pro 13 2020 2GHz i5 10th-Gen | |
| Ortalama 802.11 a/b/g/n/ac/ax (405 - 1750, n=103) | |
| Apple MacBook Pro 13 2020 2TB3 i5 | |
| Apple MacBook Pro 13 Late 2020 M1 Entry (8 / 256 GB) | |
| Apple MacBook Air 2020 M1 Entry | |
| iperf3 receive AX12 | |
| Razer Book 13 FHD | |
| Dell XPS 13 9310 Core i7 FHD | |
| Huawei MateBook X Pro 2020 i7 | |
| Apple MacBook Pro 13 2020 2GHz i5 10th-Gen | |
| Ortalama 802.11 a/b/g/n/ac/ax (284 - 1414, n=103) | |
| Apple MacBook Pro 13 2020 2TB3 i5 | |
| Apple MacBook Pro 13 Late 2020 M1 Entry (8 / 256 GB) | |
| Apple MacBook Air 2020 M1 Entry | |
Bakım
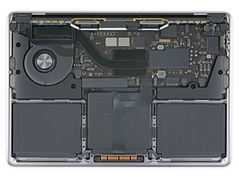
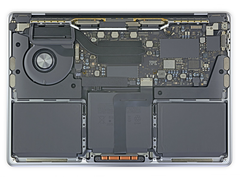
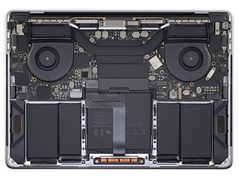
Apple, dahili düzeni Intel CPU'lu eski giriş seviyesi modelinden büyük ölçüde aldı; fan bile aynı. Bu, iki fanı olan daha pahalı MacBook Pro 13 4x TB3 ile karşılaştırıldığında hala büyük bir fark olduğu anlamına geliyor. Sonuç olarak, bu hala temelde burada kullanıcı bakımı açısından yapılacak hiçbir şey olmadığı anlamına gelir.
Ekran - 16:10 IPS Paneli
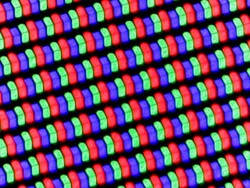
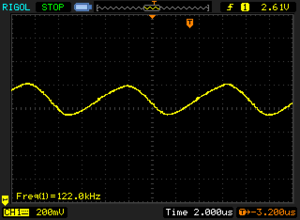
Ekran hala aynı. Bir kez daha 2560 x 1600 piksel (227 ppi) ve 16:10 en boy oranına sahip parlak bir IPS ekrana sahip oluyorsunuz. Apple 500 nit parlaklığın reklamını yapıyor, ancak bunu tüm ölçüm noktalarında teyit edemiyoruz. Sonuç olarak, öznel resim izlenimi mükemmel. Cihaz artık iOS uygulamalarını da destekliyor, bu nedenle artık bir dokunmatik ekran kesinlikle daha mantıklı olacaktır. Windows rakipleriyle karşılaştırıldığında MacBook Pro 13, çok iyi çalışan ortam ışığı sensörü, renk sıcaklığının otomatik olarak ayarlanması gibi başka avantajlar da sunuyor. ortam aydınlatması (TrueTone) ve macOS'ta mükemmel ölçeklendirme. Tepki süreleri yeterli, ancak bir kez% 49 veya daha az parlaklıkta arka plan aydınlatmasının titremesini belirleyebiliriz. Frekans 122 kHz'de çok yüksek, bu yüzden herhangi bir sorun olmamalı. Ayrıca osiloskopta% 50 veya daha fazla parlaklıkta bazı dalgalanmalar görebiliriz, ancak bunu ölçemiyoruz. Harika: Maksimum parlaklıkta bile siyah arka planda görünür arka ışık sızması yok.
| |||||||||||||||||||||||||
Aydınlatma: 94 %
Batarya modunda parlaklık: 510 cd/m²
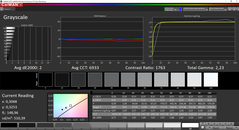
Kontrast: 1759:1 (Siyah: 0.29 cd/m²)
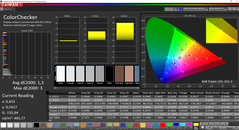
ΔE ColorChecker Calman: 1.3 | ∀{0.5-29.43 Ø4.76}
ΔE Greyscale Calman: 2 | ∀{0.09-98 Ø5}
100% sRGB (Argyll 1.6.3 3D)
88.3% AdobeRGB 1998 (Argyll 1.6.3 3D)
Gamma: 2.23
CCT: 6933 K
| Apple MacBook Pro 13 Late 2020 M1 Entry (8 / 256 GB) IPS, 2560x1600, 13.3" | Apple MacBook Pro 13 2020 2TB3 i5 2560x1600, 13.3" | Apple MacBook Air 2020 M1 Entry IPS, 2560x1600, 13.3" | Apple MacBook Pro 13 2020 2GHz i5 10th-Gen APPA03D, IPS, 2560x1600, 13.3" | Dell XPS 13 9310 Core i7 FHD Sharp LQ134N1, IPS, 1920x1200, 13.4" | Dell XPS 13 9310 Core i7 4K Sharp LQ134R1, IPS, 3840x2400, 13.4" | Razer Book 13 FHD Sharp LQ134N1JW48, IPS, 1920x1200, 13.4" | |
|---|---|---|---|---|---|---|---|
| Display | |||||||
| Display P3 Coverage (%) | 98.6 | 98.8 | 70.9 | 80.2 | 70.1 | ||
| sRGB Coverage (%) | 100 | 99.9 | 99.1 | 100 | 99.3 | ||
| AdobeRGB 1998 Coverage (%) | 85.9 | 86.4 | 72.9 | 78.9 | 71.6 | ||
| Response Times | -37% | 16% | -13% | -20% | -42% | -36% | |
| Response Time Grey 50% / Grey 80% * (ms) | 48 ? | 35.2 ? 27% | 31 ? 35% | 46 ? 4% | 52 ? -8% | 59.2 ? -23% | 56.8 ? -18% |
| Response Time Black / White * (ms) | 25.2 ? | 50.4 ? -100% | 26.1 ? -4% | 32.4 ? -29% | 33.2 ? -32% | 40.4 ? -60% | 38.8 ? -54% |
| PWM Frequency (Hz) | 122000 ? | 116300 ? | 118000 ? | 113600 ? | 2475 ? | 2137 ? | 2475 ? |
| Screen | -4% | -9% | -7% | -50% | -28% | 1% | |
| Brightness middle (cd/m²) | 510 | 508 0% | 417 -18% | 512 0% | 543.3 7% | 508.7 0% | 545.3 7% |
| Brightness (cd/m²) | 491 | 502 2% | 395 -20% | 491 0% | 524 7% | 479 -2% | 507 3% |
| Brightness Distribution (%) | 94 | 92 -2% | 91 -3% | 91 -3% | 92 -2% | 84 -11% | 88 -6% |
| Black Level * (cd/m²) | 0.29 | 0.4 -38% | 0.39 -34% | 0.32 -10% | 0.38 -31% | 0.3 -3% | 0.31 -7% |
| Contrast (:1) | 1759 | 1270 -28% | 1069 -39% | 1600 -9% | 1430 -19% | 1696 -4% | 1759 0% |
| Colorchecker dE 2000 * | 1.3 | 1.4 -8% | 1.12 14% | 1.7 -31% | 3.02 -132% | 2.72 -109% | 1.39 -7% |
| Colorchecker dE 2000 max. * | 3 | 2.5 17% | 2.71 10% | 3.4 -13% | 7.61 -154% | 4.7 -57% | 2.61 13% |
| Greyscale dE 2000 * | 2 | 1.7 15% | 1.7 15% | 1.9 5% | 5 -150% | 3.4 -70% | 1.3 35% |
| Gamma | 2.23 99% | 2.22 99% | 2207 0% | 2.19 100% | 2.02 109% | 2.11 104% | 2.2 100% |
| CCT | 6933 94% | 6861 95% | 6870 95% | 6817 95% | 6550 99% | 6245 104% | 6476 100% |
| Color Space (Percent of AdobeRGB 1998) (%) | 88.3 | 88.3 0% | 77.4 -12% | 66.8 -24% | 70.7 -20% | 65.9 -25% | |
| Color Space (Percent of sRGB) (%) | 100 | 100 0% | 99.9 0% | 99.6 0% | 100 0% | 99.6 0% | |
| Colorchecker dE 2000 calibrated * | 0.77 | 1 | 1.23 | 1.92 | 2.72 | ||
| Toplam Ortalama (Program / Ayarlar) | -21% /
-10% | 4% /
-4% | -10% /
-8% | -35% /
-45% | -35% /
-30% | -18% /
-5% |
* ... daha küçük daha iyidir
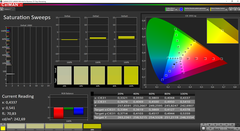
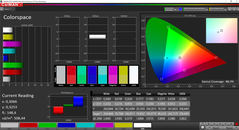
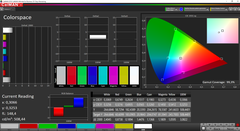
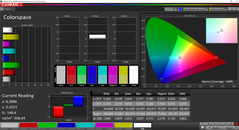
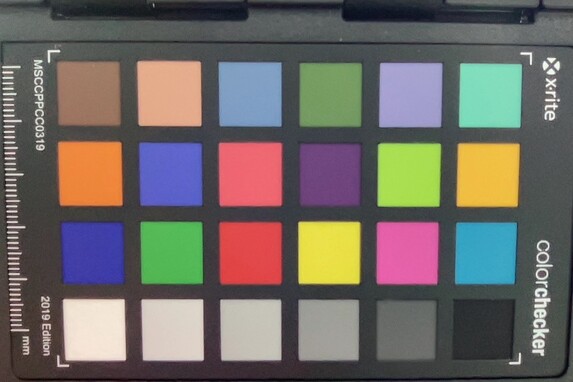
MacBook Pro 13, kutudan çıkar çıkmaz çok iyi kalibre edilmiştir. Gri tonlama performansına baktığımızda hala iyileştirmeler için biraz yer var, ancak tüm sapmalar zaten önemli işaretin 3 altında. Profesyonel CalMAN yazılımı ve X-Rite i1 Pro ile analizimiz için P3 referans renk uzayını kullandık 2 spektrofotometre.
Şu anda, bir yazılım sorunu nedeniyle yeni MacBook Pro 13 M1'i kalibre edemiyoruz. Bu nedenle, renk gamını belirlemek için CalMAN ölçümlerini (referans renk alanıyla 2D karşılaştırması) kullanmalıyız. Apple'ın tam P3 renk gamı hakkındaki iddiasını doğrulayabiliriz.
Yanıt Sürelerini Görüntüle
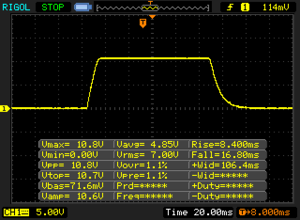
| ↔ Tepki Süresi Siyahtan Beyaza | ||
|---|---|---|
| 25.2 ms ... yükseliş ↗ ve sonbahar↘ birleşimi | ↗ 8.4 ms yükseliş | |
| ↘ 16.8 ms sonbahar | ||
| Ekran, testlerimizde nispeten yavaş yanıt oranları gösteriyor ve oyuncular için çok yavaş olabilir. Karşılaştırıldığında, test edilen tüm cihazlar 0.1 (minimum) ile 240 (maksimum) ms arasında değişir. » Tüm cihazların 60 %'si daha iyi. Bu, ölçülen yanıt süresinin test edilen tüm cihazların ortalamasından (20.1 ms) daha kötü olduğu anlamına gelir. | ||
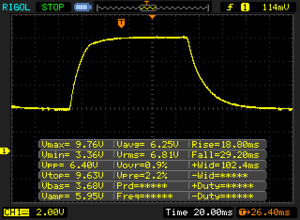
| ↔ Tepki Süresi %50 Griden %80 Griye | ||
| 48 ms ... yükseliş ↗ ve sonbahar↘ birleşimi | ↗ 18.8 ms yükseliş | |
| ↘ 29.2 ms sonbahar | ||
| Ekran, testlerimizde yavaş yanıt oranları gösteriyor ve oyuncular için yetersiz olacaktır. Karşılaştırıldığında, test edilen tüm cihazlar 0.165 (minimum) ile 636 (maksimum) ms arasında değişir. » Tüm cihazların 82 %'si daha iyi. Bu, ölçülen yanıt süresinin test edilen tüm cihazların ortalamasından (31.5 ms) daha kötü olduğu anlamına gelir. | ||
Ekran Titremesi / PWM (Darbe Genişliği Modülasyonu)
| Ekran titriyor / PWM algılandı | 122000 Hz | ≤ 49 % parlaklık ayarı | |
Ekran arka ışığı 122000 Hz'de titriyor (en kötü durum, örneğin PWM kullanılması) 49 % ve altındaki parlaklık ayarında titreme algılandı. Bu parlaklık ayarının üzerinde titreme veya PWM olmamalıdır. 122000 Hz frekansı oldukça yüksektir, bu nedenle PWM'ye duyarlı çoğu kullanıcı herhangi bir titremeyi fark etmemelidir. Karşılaştırıldığında: Test edilen tüm cihazların %53 %'si ekranı karartmak için PWM kullanmıyor. PWM tespit edilirse, ortalama 8036 (minimum: 5 - maksimum: 343500) Hz ölçüldü. | |||
IPS panelinin görüş açısı dengesi çok iyi. Ekran açık havada da iyi çalışıyor ve kesinlikle diğer birçok parlak ekran kadar yansıtıcı değil. Işık kaynaklarından doğrudan yansımalardan kaçınabildiğiniz sürece, dizüstü bilgisayarı daha aydınlık ortamlarda bile kullanmak sorun değil.
Performance - M1 clearly beats Intel
The entry-level model of the MacBook Pro 13 is, just like the new MacBook Air, equipped with Apple's new M1 processor (8 cores, 4x 3.2 GHz & 4x 2.3 GHz). The chip itself is completely identical in both devices, which also includes the clocks. The only difference is the integrated GPU, because the less expensive Air is available with a 7 or 8 GPU cores, the Pro always gets the faster 8-core GPU. The MBP 13 M1 also has the active cooling solution, which should stabilize the performance in sustained load scenarios.
Processor - Not faster than the MacBook Air in everyday scenarios
The performance of Apple's new M1 processor is once again impressive, not only compared to the previous Intel powered MBP 13 or the more expensive MBP 13 with four Thunderbolt ports. First, we have a look at the processor performance in native applications, in this case Cinebench R23. The single-core result is just marginally better than the MacBook Air M1, and even the first Multi run is just 5 % faster on the Pro. However, the Air has to reduce the performance a bit (-12 %) when you stress the device for longer periods due to the passive cooling solution. Still, you will hardly notice this in practice.
We are very impressed that the MacBook Pro 13 can maintain the performance. Almost all mobile devices (especially with 15W CPUs) usually throttle noticeably after the initial 30 seconds. The direct predecessor with the Intel Core i5-8257U is clearly beaten (+51 % Single, +94 % Multi). Our test device also beats pretty much everything in the single-core test, including the most powerful new Tiger Lake CPUs from Intel, the recent Ryzen mobile processors and even the current 45W CPUs from Intel do not stand a chance. Only the two brand-new desktop CPUs from AMD have a small lead.
The performance is not less impressive in the multi-core test, and Apple's M1 processor is only beaten by CPUs with much more cores. Among the mobile processors, only the AMD Ryzen 7 4800U has an advantage, but the much more popular Ryzen 7 4700U is marginally slower. All mobile Intel CPUs including the brand-new Tiger Lake processors are also slower.
| Cinebench R23 | |
| Single Core | |
| AMD Ryzen 9 5950X | |
| AMD Ryzen 5 5600X | |
| Apple MacBook Pro 13 Late 2020 M1 Entry (8 / 256 GB) | |
| Apple MacBook Air 2020 M1 Entry | |
| Dell XPS 13 9310 Core i7 4K | |
| Schenker Vision 15 | |
| Schenker XMG Core 17 Comet Lake | |
| Lenovo Yoga Slim 7-14ARE | |
| Lenovo Yoga Slim 7 14ARE05 82A20008GE | |
| Apple MacBook Pro 16 2019 i9 5500M | |
| Apple MacBook Pro 15 2018 (2.6 GHz, 560X) | |
| Apple MacBook Pro 13 2020 2TB3 i5 | |
| Multi Core | |
| AMD Ryzen 9 5950X | |
| AMD Ryzen 5 5600X | |
| Lenovo Yoga Slim 7-14ARE | |
| Apple MacBook Pro 16 2019 i9 5500M | |
| Apple MacBook Pro 16 2019 i9 5500M | |
| Apple MacBook Pro 13 Late 2020 M1 Entry (8 / 256 GB) | |
| Schenker XMG Core 17 Comet Lake | |
| Lenovo Yoga Slim 7 14ARE05 82A20008GE | |
| Apple MacBook Air 2020 M1 Entry | |
| Razer Book 13 FHD | |
| Apple MacBook Pro 15 2018 (2.6 GHz, 560X) | |
| Dell XPS 13 9310 Core i7 4K | |
| Schenker Vision 15 | |
| Apple MacBook Pro 13 2020 2TB3 i5 | |
Apps without a native version for the M1 CPU, are emulated by the app Rosetta, which works very well. However, the emulation does affect the performance a bit, so the advantage of the new M1 processor in the older Cinebench R15, for example, is a bit smaller. Still, the overall result is excellent.
Cinebench R15: CPU Single 64Bit | CPU Multi 64Bit
Blender: v2.79 BMW27 CPU
7-Zip 18.03: 7z b 4 -mmt1 | 7z b 4
Geekbench 5.5: Single-Core | Multi-Core
HWBOT x265 Benchmark v2.2: 4k Preset
LibreOffice : 20 Documents To PDF
R Benchmark 2.5: Overall mean
| Cinebench R20 / CPU (Single Core) | |
| Sınıf ortalaması Subnotebook (128 - 826, n=67, son 2 yıl) | |
| AMD Ryzen 9 5950X | |
| AMD Ryzen 5 5600X | |
| Razer Book 13 FHD | |
| Dell XPS 13 9310 Core i7 4K | |
| Dell XPS 13 9310 Core i7 FHD | |
| Schenker Vision 15 | |
| Schenker XMG Core 17 Comet Lake | |
| Lenovo Yoga Slim 7-14ARE | |
| Lenovo Yoga Slim 7 14ARE05 82A20008GE | |
| Apple MacBook Pro 16 2019 i9 5500M | |
| Apple MacBook Pro 16 2019 i9 5500M | |
| Apple MacBook Pro 15 2018 (2.6 GHz, 560X) | |
| Apple MacBook Pro 15 2018 (2.6 GHz, 560X) | |
| Apple MacBook Pro 13 2020 2GHz i5 10th-Gen | |
| Apple MacBook Pro 13 Late 2020 M1 Entry (8 / 256 GB) | |
| Huawei MateBook X Pro 2020 i7 | |
| Ortalama Apple M1 (401 - 406, n=4) | |
| Apple MacBook Air 2020 M1 Entry | |
| Apple MacBook Pro 13 2020 2TB3 i5 | |
| Apple MacBook Pro 13 2019 2TB3 | |
| Cinebench R20 / CPU (Multi Core) | |
| AMD Ryzen 9 5950X | |
| Sınıf ortalaması Subnotebook (579 - 8541, n=67, son 2 yıl) | |
| AMD Ryzen 5 5600X | |
| Apple MacBook Pro 16 2019 i9 5500M | |
| Apple MacBook Pro 16 2019 i9 5500M | |
| Lenovo Yoga Slim 7-14ARE | |
| Lenovo Yoga Slim 7 14ARE05 82A20008GE | |
| Schenker XMG Core 17 Comet Lake | |
| Apple MacBook Pro 15 2018 (2.6 GHz, 560X) | |
| Apple MacBook Pro 15 2018 (2.6 GHz, 560X) | |
| Razer Book 13 FHD | |
| Apple MacBook Pro 13 Late 2020 M1 Entry (8 / 256 GB) | |
| Ortalama Apple M1 (1863 - 2109, n=4) | |
| Schenker Vision 15 | |
| Apple MacBook Pro 13 2020 2GHz i5 10th-Gen | |
| Dell XPS 13 9310 Core i7 4K | |
| Dell XPS 13 9310 Core i7 FHD | |
| Apple MacBook Air 2020 M1 Entry | |
| Apple MacBook Pro 13 2020 2TB3 i5 | |
| Apple MacBook Pro 13 2019 2TB3 | |
| Huawei MateBook X Pro 2020 i7 | |
| Cinebench R15 / CPU Single 64Bit | |
| AMD Ryzen 9 5950X | |
| Sınıf ortalaması Subnotebook (72.4 - 322, n=67, son 2 yıl) | |
| AMD Ryzen 5 5600X | |
| Schenker Vision 15 | |
| Razer Book 13 FHD | |
| Dell XPS 13 9310 Core i7 FHD | |
| Dell XPS 13 9310 Core i7 4K | |
| Schenker XMG Core 17 Comet Lake | |
| Apple MacBook Pro 13 Late 2020 M1 Entry (8 / 256 GB) | |
| Apple MacBook Air 2020 M1 Entry | |
| Ortalama Apple M1 (206 - 208, n=3) | |
| Apple MacBook Pro 16 2019 i9 5500M | |
| Apple MacBook Pro 16 2019 i9 5500M | |
| Lenovo Yoga Slim 7-14ARE | |
| Lenovo Yoga Slim 7 14ARE05 82A20008GE | |
| Apple MacBook Pro 15 2018 (2.6 GHz, 560X) | |
| Huawei MateBook X Pro 2020 i7 | |
| Apple MacBook Pro 13 2020 2GHz i5 10th-Gen | |
| Apple MacBook Pro 13 2019 2TB3 | |
| Apple MacBook Pro 13 2020 2TB3 i5 | |
| Cinebench R15 / CPU Multi 64Bit | |
| AMD Ryzen 9 5950X | |
| Sınıf ortalaması Subnotebook (327 - 3345, n=67, son 2 yıl) | |
| AMD Ryzen 5 5600X | |
| Lenovo Yoga Slim 7-14ARE | |
| Apple MacBook Pro 16 2019 i9 5500M | |
| Apple MacBook Pro 16 2019 i9 5500M | |
| Schenker XMG Core 17 Comet Lake | |
| Lenovo Yoga Slim 7 14ARE05 82A20008GE | |
| Apple MacBook Pro 13 Late 2020 M1 Entry (8 / 256 GB) | |
| Apple MacBook Pro 15 2018 (2.6 GHz, 560X) | |
| Apple MacBook Pro 15 2018 (2.6 GHz, 560X) | |
| Apple MacBook Pro 15 2018 (2.6 GHz, 560X) | |
| Apple MacBook Pro 15 2018 (2.6 GHz, 560X) | |
| Ortalama Apple M1 (1020 - 1087, n=4) | |
| Schenker Vision 15 | |
| Apple MacBook Air 2020 M1 Entry | |
| Razer Book 13 FHD | |
| Dell XPS 13 9310 Core i7 FHD | |
| Dell XPS 13 9310 Core i7 4K | |
| Apple MacBook Pro 13 2020 2GHz i5 10th-Gen | |
| Apple MacBook Pro 13 2019 2TB3 | |
| Apple MacBook Pro 13 2020 2TB3 i5 | |
| Huawei MateBook X Pro 2020 i7 | |
| Blender / v2.79 BMW27 CPU | |
| Huawei MateBook X Pro 2020 i7 | |
| Apple MacBook Pro 13 2019 2TB3 | |
| Apple MacBook Air 2020 M1 Entry | |
| Dell XPS 13 9310 Core i7 4K | |
| Dell XPS 13 9310 Core i7 FHD | |
| Ortalama Apple M1 (412 - 710, n=2) | |
| Schenker Vision 15 | |
| Razer Book 13 FHD | |
| Apple MacBook Pro 15 2018 (2.6 GHz, 560X) | |
| Lenovo Yoga Slim 7 14ARE05 82A20008GE | |
| Sınıf ortalaması Subnotebook (159 - 2271, n=70, son 2 yıl) | |
| Schenker XMG Core 17 Comet Lake | |
| Apple MacBook Pro 16 2019 i9 5500M | |
| Lenovo Yoga Slim 7-14ARE | |
| AMD Ryzen 5 5600X | |
| AMD Ryzen 9 5950X | |
| Apple MacBook Pro 13 2020 2GHz i5 10th-Gen | |
| 7-Zip 18.03 / 7z b 4 -mmt1 | |
| AMD Ryzen 9 5950X | |
| AMD Ryzen 5 5600X | |
| Sınıf ortalaması Subnotebook (2643 - 6442, n=69, son 2 yıl) | |
| Apple MacBook Air 2020 M1 Entry | |
| Ortalama Apple M1 (n=1) | |
| Schenker XMG Core 17 Comet Lake | |
| Razer Book 13 FHD | |
| Dell XPS 13 9310 Core i7 FHD | |
| Schenker Vision 15 | |
| Dell XPS 13 9310 Core i7 4K | |
| Apple MacBook Pro 16 2019 i9 5500M | |
| Huawei MateBook X Pro 2020 i7 | |
| Apple MacBook Pro 15 2018 (2.6 GHz, 560X) | |
| Lenovo Yoga Slim 7-14ARE | |
| Lenovo Yoga Slim 7 14ARE05 82A20008GE | |
| Apple MacBook Pro 13 2020 2GHz i5 10th-Gen | |
| Apple MacBook Pro 13 2019 2TB3 | |
| 7-Zip 18.03 / 7z b 4 | |
| AMD Ryzen 9 5950X | |
| AMD Ryzen 5 5600X | |
| Sınıf ortalaması Subnotebook (11668 - 77867, n=67, son 2 yıl) | |
| Lenovo Yoga Slim 7-14ARE | |
| Apple MacBook Pro 16 2019 i9 5500M | |
| Schenker XMG Core 17 Comet Lake | |
| Apple MacBook Air 2020 M1 Entry | |
| Ortalama Apple M1 (n=1) | |
| Lenovo Yoga Slim 7 14ARE05 82A20008GE | |
| Apple MacBook Pro 15 2018 (2.6 GHz, 560X) | |
| Razer Book 13 FHD | |
| Schenker Vision 15 | |
| Dell XPS 13 9310 Core i7 FHD | |
| Dell XPS 13 9310 Core i7 4K | |
| Apple MacBook Pro 13 2019 2TB3 | |
| Apple MacBook Pro 13 2020 2GHz i5 10th-Gen | |
| Huawei MateBook X Pro 2020 i7 | |
| Geekbench 5.5 / Single-Core | |
| Sınıf ortalaması Subnotebook (726 - 2350, n=62, son 2 yıl) | |
| Apple MacBook Pro 13 Late 2020 M1 Entry (8 / 256 GB) | |
| Ortalama Apple M1 (1710 - 1745, n=9) | |
| Apple MacBook Air 2020 M1 Entry | |
| AMD Ryzen 9 5950X | |
| AMD Ryzen 5 5600X | |
| Razer Book 13 FHD | |
| Schenker Vision 15 | |
| Dell XPS 13 9310 Core i7 FHD | |
| Dell XPS 13 9310 Core i7 4K | |
| Schenker XMG Core 17 Comet Lake | |
| Apple MacBook Pro 13 2020 2GHz i5 10th-Gen | |
| Lenovo Yoga Slim 7-14ARE | |
| Lenovo Yoga Slim 7-14ARE | |
| Apple MacBook Pro 15 2018 (2.6 GHz, 560X) | |
| Lenovo Yoga Slim 7 14ARE05 82A20008GE | |
| Apple MacBook Pro 16 2019 i9 5500M | |
| Huawei MateBook X Pro 2020 i7 | |
| Apple MacBook Pro 13 2020 2TB3 i5 | |
| Geekbench 5.5 / Multi-Core | |
| AMD Ryzen 9 5950X | |
| Sınıf ortalaması Subnotebook (2557 - 17218, n=62, son 2 yıl) | |
| AMD Ryzen 5 5600X | |
| Apple MacBook Pro 13 Late 2020 M1 Entry (8 / 256 GB) | |
| Apple MacBook Air 2020 M1 Entry | |
| Ortalama Apple M1 (7034 - 7710, n=9) | |
| Apple MacBook Pro 16 2019 i9 5500M | |
| Lenovo Yoga Slim 7-14ARE | |
| Lenovo Yoga Slim 7-14ARE | |
| Schenker XMG Core 17 Comet Lake | |
| Lenovo Yoga Slim 7 14ARE05 82A20008GE | |
| Schenker Vision 15 | |
| Razer Book 13 FHD | |
| Dell XPS 13 9310 Core i7 4K | |
| Dell XPS 13 9310 Core i7 FHD | |
| Apple MacBook Pro 15 2018 (2.6 GHz, 560X) | |
| Apple MacBook Pro 13 2020 2GHz i5 10th-Gen | |
| Apple MacBook Pro 13 2020 2TB3 i5 | |
| Huawei MateBook X Pro 2020 i7 | |
| HWBOT x265 Benchmark v2.2 / 4k Preset | |
| AMD Ryzen 9 5950X | |
| AMD Ryzen 5 5600X | |
| Sınıf ortalaması Subnotebook (0.97 - 25.1, n=67, son 2 yıl) | |
| Lenovo Yoga Slim 7-14ARE | |
| Apple MacBook Pro 16 2019 i9 5500M | |
| Schenker XMG Core 17 Comet Lake | |
| Lenovo Yoga Slim 7 14ARE05 82A20008GE | |
| Razer Book 13 FHD | |
| Schenker Vision 15 | |
| Apple MacBook Pro 15 2018 (2.6 GHz, 560X) | |
| Apple MacBook Pro 13 2020 2GHz i5 10th-Gen | |
| Dell XPS 13 9310 Core i7 FHD | |
| Dell XPS 13 9310 Core i7 4K | |
| Apple MacBook Pro 13 2019 2TB3 | |
| Huawei MateBook X Pro 2020 i7 | |
| LibreOffice / 20 Documents To PDF | |
| Apple MacBook Pro 15 2018 (2.6 GHz, 560X) | |
| Apple MacBook Pro 13 2020 2GHz i5 10th-Gen | |
| Lenovo Yoga Slim 7 14ARE05 82A20008GE | |
| Apple MacBook Pro 16 2019 i9 5500M | |
| Apple MacBook Pro 16 2019 i9 5500M | |
| Lenovo Yoga Slim 7-14ARE | |
| Huawei MateBook X Pro 2020 i7 | |
| Sınıf ortalaması Subnotebook (38.5 - 220, n=66, son 2 yıl) | |
| Schenker XMG Core 17 Comet Lake | |
| Razer Book 13 FHD | |
| Dell XPS 13 9310 Core i7 4K | |
| Dell XPS 13 9310 Core i7 FHD | |
| AMD Ryzen 9 5950X | |
| Schenker Vision 15 | |
| AMD Ryzen 5 5600X | |
| Ortalama Apple M1 (n=1) | |
| Apple MacBook Air 2020 M1 Entry | |
| R Benchmark 2.5 / Overall mean | |
| Apple MacBook Air 2020 M1 Entry | |
| Ortalama Apple M1 (n=1) | |
| Apple MacBook Pro 15 2018 (2.6 GHz, 560X) | |
| Apple MacBook Pro 15 2018 (2.6 GHz, 560X) | |
| Apple MacBook Pro 13 2020 2GHz i5 10th-Gen | |
| Apple MacBook Pro 16 2019 i9 5500M | |
| Apple MacBook Pro 16 2019 i9 5500M | |
| Huawei MateBook X Pro 2020 i7 | |
| Lenovo Yoga Slim 7 14ARE05 82A20008GE | |
| Lenovo Yoga Slim 7-14ARE | |
| Dell XPS 13 9310 Core i7 4K | |
| Dell XPS 13 9310 Core i7 FHD | |
| Schenker XMG Core 17 Comet Lake | |
| Schenker Vision 15 | |
| Razer Book 13 FHD | |
| Sınıf ortalaması Subnotebook (0.403 - 1.456, n=68, son 2 yıl) | |
| AMD Ryzen 5 5600X | |
| AMD Ryzen 9 5950X | |
Cinebench R15: CPU Single 64Bit | CPU Multi 64Bit
Blender: v2.79 BMW27 CPU
7-Zip 18.03: 7z b 4 -mmt1 | 7z b 4
Geekbench 5.5: Single-Core | Multi-Core
HWBOT x265 Benchmark v2.2: 4k Preset
LibreOffice : 20 Documents To PDF
R Benchmark 2.5: Overall mean
* ... daha küçük daha iyidir
System Performance & SSD
There are no system benchmarks for the new M1 MacBooks yet, so we focus on the browser benchmarks and the subjective performance impression. If you have ever used Windows on an ARM notebook you probably expect performance issues, but this is fortunately not the case here. Subjectively, macOS even runs a bit better on the new M1 processor and almost all app for Intel Macs we have tried worked without any problems and the emulation did not have a significant impact on the performance impression. The browser benchmarks also produce excellent scores.
The new MBP 13 with the M1 processor is just a very fast and responsive machine when you use it. It obviously benefits from the PCIe SSD as well; the transfer rates are good, only the write result is a bit lower than expected. Still, this does not affect your everyday use.
* ... daha küçük daha iyidir
GPU Performance - iGPU with 8 cores
The MacBook Pro 13 M1 is always equipped with the faster 8-core version of the iGPU, while the entry-level Air is also available with a less powerful 7-core iGPU. The synthetic benchmark performance is pretty much identical to the MacBook Air with 8 GPU cores and roughly 5-10 % ahead of the MacBook Air with the 7-core iGPU. Our MacBook Pro 13 also passes the 3DMark Wild Life stress test without breaking a sweat.
Dedicated graphics cards like the GeForce MX350 are easily beaten and the M1 iGPU is just 24 % behind the mobile GeForce GTX 1650 Ti. The OpenCL performance on the other hand is comparable to the new Intel Xe Graphics (96 EUs) from the current Tiger Lake generation. The graphics adapter in the new iPad Air 2020 is also clearly beaten.
The MBP 13 M1 has no problems with iOS games. Other titles (like Borderlands 3, Shadow of the Tomb Raider) work, but they have to be emulated. Once there are native games for macOS with the M1 processor, we expect a significant performance bump. You might also experience some graphical issues, like we did wen we tested Total War: Three Kingdoms.
| 3DMark - Wild Life Unlimited Score | |
| KFA2 GeForce GTX 1650 EX One Click Plus | |
| Schenker XMG Core 17 Comet Lake | |
| Ortalama Apple M1 8-Core GPU (17731 - 18326, n=7) | |
| Apple MacBook Pro 13 Late 2020 M1 Entry (8 / 256 GB) | |
| Apple MacBook Air Late 2020 (M1, 8 Core GPU, 8 GB RAM) | |
| Apple MacBook Air 2020 M1 Entry | |
| Asus VivoBook S15 S533EQ-BQ002T | |
| Apple iPad Air 4 2020 | |
| Sınıf ortalaması Subnotebook (4696 - 10929, n=3, son 2 yıl) | |
| Samsung Galaxy Book Flex 15-NP950 | |
| Lenovo Yoga Slim 7 14ARE05 82A20008GE | |
| Dell Latitude 15 3510 NK2MC | |
| Geekbench 5.5 | |
| Metal Score | |
| Sınıf ortalaması Subnotebook (34603 - 34823, n=2, son 2 yıl) | |
| Apple MacBook Pro 13 Late 2020 M1 Entry (8 / 256 GB) | |
| Ortalama Apple M1 8-Core GPU (20411 - 21951, n=6) | |
| Apple MacBook Air Late 2020 (M1, 8 Core GPU, 8 GB RAM) | |
| Apple MacBook Air 2020 M1 Entry | |
| Apple iPad Air 4 2020 | |
| Apple MacBook Pro 13 2020 2TB3 i5 | |
| OpenCL Score | |
| KFA2 GeForce GTX 1650 EX One Click Plus | |
| Schenker XMG Core 17 Comet Lake | |
| Sınıf ortalaması Subnotebook (14920 - 51870, n=60, son 2 yıl) | |
| Schenker Vision 15 | |
| Apple MacBook Pro 13 Late 2020 M1 Entry (8 / 256 GB) | |
| Dell XPS 13 9310 Core i7 4K | |
| Ortalama Apple M1 8-Core GPU (18352 - 19323, n=3) | |
| Razer Book 13 FHD | |
| Dell XPS 13 9310 Core i7 FHD | |
| Apple MacBook Air Late 2020 (M1, 8 Core GPU, 8 GB RAM) | |
| Apple MacBook Air 2020 M1 Entry | |
| Asus VivoBook S15 S533EQ-BQ002T | |
| Lenovo Yoga Slim 7-14ARE | |
| Lenovo Yoga Slim 7-14ARE | |
| Lenovo Yoga Slim 7 14ARE05 82A20008GE | |
| Samsung Galaxy Book Flex 15-NP950 | |
| Apple MacBook Pro 13 2020 2TB3 i5 | |
| Dell Latitude 15 3510 NK2MC | |
| düşük | orta | yüksek | ultra | |
|---|---|---|---|---|
| Shadow of the Tomb Raider (2018) | 66 | 25 | 23 | |
| Total War: Three Kingdoms (2019) | 93.4 | 33 | 20.6 | |
| Borderlands 3 (2019) | 30.4 | 20.3 |
Emissions - MacBook Pro 13 stays cooler
System Noise
The fan is identical to the previous MBP 13 (2x TB3), so we were obviously eager to find out if there are any differences in terms of fan noise. The new MacBook Pro 13 with the M1 processor is a quieter device in general and the fan is not running as often as before. You will probably never hear the fan at all in everyday usage scenarios, and it usually takes about a minute before the fan starts spinning under load.
When we look at load scenarios, we have to differentiate between native and emulated apps. If you run Cinebench R23 (native), for example, it takes a couple of minutes before than fan kicks in and it will eventually fluctuate between 30.4-32.1 dB(A). For comparison: The predecessor reached its maximum fan noise of 40.8 dB(A) after a couple of minutes in this scenario. If you use Cinebench R15 on the other hand, the fan is spinning much faster on the new MBP 13 M1 and we can measure between 36.2-41.9 dB(A) after a couple of minutes. The change of the fan speed here is very slow, but you can notice it and we would prefer a steady rpm level.
Our stress test with Cinebench R23 (native) and Unigine Valley (emulated) will result in the maximum fan noise of the MBP 13 M1, which is even slightly louder compared to the predecessor at 41.9 dB(A). However, the fan is completely turned off if you only run Unigine Valley, so we suspect a bug here. The fan stayed very quiet during our gaming benchmarks and was often turned off.
| MacBook Pro 13 2020 M1 | MacBook Pro 13 2020 Core i5 | |
|---|---|---|
| Unigine Valley | fan off | 34 dB(A) |
| Cinebench R23 | 30.4-32.1 dB(A) | 40.8 dB(A) |
| Cinebench R15 | 36.2-41.9 dB(A) | 40.8 dB(A) |
| Stresstest (CB R23 + Unigine Valley) | 41.9 dB(A) | 40.8 dB(A) |
Ses yüksekliği
| Boşta |
| 29.2 / 29.2 / 29.2 dB |
| Çalışırken |
| 32.1 / 41.9 dB |
 | ||
30 dB sessiz 40 dB(A) duyulabilirlik 50 dB(A) gürültülü |
||
min: | ||
| Apple MacBook Pro 13 Late 2020 M1 Entry (8 / 256 GB) M1 8-Core GPU, M1, Apple SSD AP0256 | Apple MacBook Pro 13 2020 2TB3 i5 Iris Plus Graphics 645, i5-8257U, Apple SSD AP0512 | Apple MacBook Pro 13 2020 2GHz i5 10th-Gen Iris Plus Graphics G7 (Ice Lake 64 EU), i5-1038NG7, Apple SSD SM0512F | Dell XPS 13 9310 Core i7 FHD Iris Xe G7 96EUs, i7-1165G7, Micron 2300 512GB MTFDHBA512TDV | Huawei MateBook X Pro 2020 i7 GeForce MX250, i7-10510U, Samsung PM981a MZVLB1T0HBLR | Razer Book 13 FHD Iris Xe G7 96EUs, i7-1165G7, Samsung SSD PM981a MZVLB256HBHQ | |
|---|---|---|---|---|---|---|
| Noise | 0% | -2% | 13% | -3% | 6% | |
| kapalı / ortam * (dB) | 29.2 | 29.2 -0% | 29.6 -1% | 25.7 12% | 29.6 -1% | 27 8% |
| Idle Minimum * (dB) | 29.2 | 29.2 -0% | 29.6 -1% | 25.7 12% | 29.6 -1% | 27 8% |
| Idle Average * (dB) | 29.2 | 29.2 -0% | 29.6 -1% | 25.7 12% | 29.6 -1% | 27 8% |
| Idle Maximum * (dB) | 29.2 | 29.2 -0% | 29.6 -1% | 25.9 11% | 30.3 -4% | 27.1 7% |
| Load Average * (dB) | 32.1 | 32.9 -2% | 34.4 -7% | 26.2 18% | 38 -18% | 29 10% |
| Load Maximum * (dB) | 41.9 | 40.8 3% | 42.1 -0% | 36.6 13% | 38 9% | 44.8 -7% |
| Witcher 3 ultra * (dB) | 36.1 | 36.5 | 38 | 33.3 |
* ... daha küçük daha iyidir
Temperature
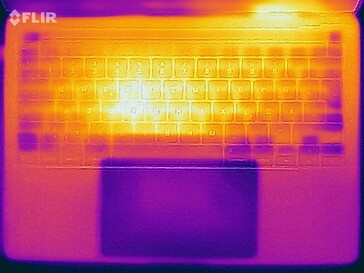
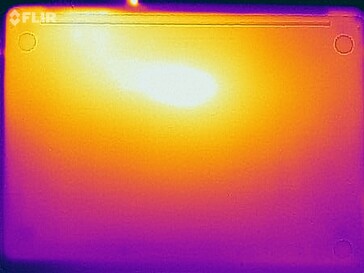
Apple manages the surface temperatures very well. The MacBook Air M1 was already pretty decent despite the passive cooling solution. The MacBook Pro 13 is even a bit better thanks to the fan. We have already mentioned that the performance is steady, and at the same time we only determine slightly more than 40 °C at some measuring spots. The direct predecessor with Intel i5 CPU was a couple of degrees warmer. This means you can comfortable put the new MBP 13 M1 on your lap without any concerns. It is also very cool during everyday tasks.
(±) Üst taraftaki maksimum sıcaklık, 35.9 °C / 97 F ortalamasına kıyasla 41 °C / 106 F'dir. , Subnotebook sınıfı için 21.4 ile 59 °C arasında değişir.
(±) Alt kısım, 39.3 °C / 103 F ortalamasına kıyasla maksimum 40.4 °C / 105 F'ye kadar ısınır
(+) Boşta kullanımda, üst tarafın ortalama sıcaklığı 23.3 °C / 74 F olup, cihazın 30.8 °C / 87 F.
(+) Avuç içi dayanakları ve dokunmatik yüzey, maksimum 31 °C / 87.8 F ile cilt sıcaklığından daha soğuktur ve bu nedenle dokunulduğunda soğuktur.
(-) Benzer cihazların avuç içi dayanağı alanının ortalama sıcaklığı 28.2 °C / 82.8 F (-2.8 °C / -5 F) idi.
Speakers
The speakers are identical to the previous model and our audio analysis also shows pretty much the exact values. Apple's stereo speakers are still among the best in the notebook segment.
Apple MacBook Pro 13 Late 2020 M1 Entry (8 / 256 GB) ses analizi
(±) | hoparlör ses yüksekliği ortalama ama iyi (77.5 dB)
Bas 100 - 315Hz
(±) | azaltılmış bas - ortalama olarak medyandan 8.7% daha düşük
(±) | Bas doğrusallığı ortalamadır (8.6% delta - önceki frekans)
Ortalar 400 - 2000 Hz
(+) | dengeli ortalar - medyandan yalnızca 4.2% uzakta
(+) | orta frekanslar doğrusaldır (4.2% deltadan önceki frekansa)
Yüksekler 2 - 16 kHz
(+) | dengeli yüksekler - medyandan yalnızca 1.2% uzakta
(+) | yüksekler doğrusaldır (4% deltadan önceki frekansa)
Toplam 100 - 16.000 Hz
(+) | genel ses doğrusaldır (12.9% ortancaya göre fark)
Aynı sınıfla karşılaştırıldığında
» Bu sınıftaki tüm test edilen cihazların %18%'si daha iyi, 5% benzer, 76% daha kötüydü
» En iyisinin deltası 5% idi, ortalama 18% idi, en kötüsü 53% idi
Test edilen tüm cihazlarla karşılaştırıldığında
» Test edilen tüm cihazların %12'si daha iyi, 3 benzer, % 86 daha kötüydü
» En iyisinin deltası 4% idi, ortalama 24% idi, en kötüsü 134% idi
Apple MacBook Pro 13 2020 2TB3 i5 ses analizi
(±) | hoparlör ses yüksekliği ortalama ama iyi (77.6 dB)
Bas 100 - 315Hz
(±) | azaltılmış bas - ortalama olarak medyandan 7.7% daha düşük
(±) | Bas doğrusallığı ortalamadır (7.8% delta - önceki frekans)
Ortalar 400 - 2000 Hz
(+) | dengeli ortalar - medyandan yalnızca 4.8% uzakta
(+) | orta frekanslar doğrusaldır (2.7% deltadan önceki frekansa)
Yüksekler 2 - 16 kHz
(+) | dengeli yüksekler - medyandan yalnızca 1.5% uzakta
(+) | yüksekler doğrusaldır (4.9% deltadan önceki frekansa)
Toplam 100 - 16.000 Hz
(+) | genel ses doğrusaldır (12.9% ortancaya göre fark)
Aynı sınıfla karşılaştırıldığında
» Bu sınıftaki tüm test edilen cihazların %12%'si daha iyi, 3% benzer, 86% daha kötüydü
» En iyisinin deltası 4% idi, ortalama 24% idi, en kötüsü 134% idi
Test edilen tüm cihazlarla karşılaştırıldığında
» Test edilen tüm cihazların %12'si daha iyi, 3 benzer, % 86 daha kötüydü
» En iyisinin deltası 4% idi, ortalama 24% idi, en kötüsü 134% idi
Energy Management - Apple M1 is more efficient
Power Consumption
The power consumption improved compared to the predecessor and the (already very low) idle values are even better this time. The MacBook Air M1 is a bit more efficient, but it also has a slightly darker screen. We can measure up to 47.5W under load, but it dropped to around 43W after one hour. Despite the high fan noise, the MacBook Pro 13 eventually has to reduce the performance a bit. The included 61W power adapter is completely sufficient and still has enough headroom to charge the battery under load.
The keyboard illumination is also very efficient. While we can see jumps of up to 2W on some Windows laptops, the highest keyboard illumination on the MBP 13 only increases the consumption by 0.8W.
| Kapalı / Bekleme modu | |
| Boşta | |
| Çalışırken |
|
Key:
min: | |
| Apple MacBook Pro 13 Late 2020 M1 Entry (8 / 256 GB) M1, M1 8-Core GPU, Apple SSD AP0256, IPS, 2560x1600, 13.3" | Apple MacBook Air 2020 M1 Entry M1, M1 7-Core GPU, Apple SSD AP0256Q, IPS, 2560x1600, 13.3" | Apple MacBook Pro 13 2020 2TB3 i5 i5-8257U, Iris Plus Graphics 645, Apple SSD AP0512, , 2560x1600, 13.3" | Apple MacBook Pro 13 2020 2GHz i5 10th-Gen i5-1038NG7, Iris Plus Graphics G7 (Ice Lake 64 EU), Apple SSD SM0512F, IPS, 2560x1600, 13.3" | Dell XPS 13 9310 Core i7 FHD i7-1165G7, Iris Xe G7 96EUs, Micron 2300 512GB MTFDHBA512TDV, IPS, 1920x1200, 13.4" | Huawei MateBook X Pro 2020 i7 i7-10510U, GeForce MX250, Samsung PM981a MZVLB1T0HBLR, LTPS, 3000x2000, 13.9" | Razer Book 13 FHD i7-1165G7, Iris Xe G7 96EUs, Samsung SSD PM981a MZVLB256HBHQ, IPS, 1920x1200, 13.4" | Ortalama Apple M1 8-Core GPU | Sınıf ortalaması Subnotebook | |
|---|---|---|---|---|---|---|---|---|---|
| Power Consumption | 8% | -34% | -64% | -30% | -74% | -27% | -50% | -50% | |
| Idle Minimum * (Watt) | 1.67 | 1.9 -14% | 2.3 -38% | 3.8 -128% | 3.9 -134% | 4.3 -157% | 3.3 -98% | 3.34 ? -100% | 3.94 ? -136% |
| Idle Average * (Watt) | 6.7 | 6.4 4% | 7.9 -18% | 8.6 -28% | 5.9 12% | 8.5 -27% | 6.4 4% | 14.6 ? -118% | 6.85 ? -2% |
| Idle Maximum * (Watt) | 7.4 | 7 5% | 8.6 -16% | 10.3 -39% | 6.3 15% | 12 -62% | 7 5% | 13.3 ? -80% | 8.41 ? -14% |
| Load Average * (Watt) | 28 | 25 11% | 46 -64% | 52.1 -86% | 39.7 -42% | 54.8 -96% | 37.3 -33% | 23 ? 18% | 43.8 ? -56% |
| Load Maximum * (Watt) | 47.5 | 30.3 36% | 64 -35% | 65.2 -37% | 47.5 -0% | 61.5 -29% | 53.7 -13% | 33.2 ? 30% | 66.6 ? -40% |
| Witcher 3 ultra * (Watt) | 48.2 | 34.8 | 47.1 | 36.4 |
* ... daha küçük daha iyidir
Battery Runtime
The battery capacity did not change (58.2 Wh), but the battery runtimes are noticeably longer compared to the previous Intel powered model. The MacBook Air M1 with the smaller battery (49.9 Wh) is beaten as well. We can determine more than 20 hours in our Wi-Fi test, and still more than 19 hours during video playback (both tests at an adjusted luminance of 150 cd/m²). If we repeat the Wi-Fi test with the maximum display brightness, the runtime drops by around 50 % to slightly more than 10 hours. Overall, these are excellent results.
| Apple MacBook Pro 13 Late 2020 M1 Entry (8 / 256 GB) M1, M1 8-Core GPU, 58.2 Wh | Apple MacBook Air 2020 M1 Entry M1, M1 7-Core GPU, 49.9 Wh | Apple MacBook Pro 13 2020 2TB3 i5 i5-8257U, Iris Plus Graphics 645, Wh | Apple MacBook Pro 13 2020 2GHz i5 10th-Gen i5-1038NG7, Iris Plus Graphics G7 (Ice Lake 64 EU), 58 Wh | Dell XPS 13 9310 Core i7 FHD i7-1165G7, Iris Xe G7 96EUs, 52 Wh | Huawei MateBook X Pro 2020 i7 i7-10510U, GeForce MX250, 57.4 Wh | Razer Book 13 FHD i7-1165G7, Iris Xe G7 96EUs, 55 Wh | Sınıf ortalaması Subnotebook | |
|---|---|---|---|---|---|---|---|---|
| Pil Çalışma Süresi | ||||||||
| WiFi v1.3 (h) | 20.4 | 16 -22% | 13.4 -34% | 12.1 -41% | 11 -46% | 10.4 -49% | 14.8 -27% | 13.5 ? -34% |
Artılar
Eksiler
Verdict - MBP 13 is very good, but it does not justify the additional price over the Air
We can keep the verdict about the new MacBook Pro 13 with the M1 processor pretty short: It builds on the strengths of the previous iterations and the new processor improves some aspects like the performance, the fan noise in everyday scenarios or longer battery runtime. However, there are still some drawbacks like the limited number of ports or the slow Wi-Fi 6 transfer speeds. All in all, it is still one of the best mobile devices on the market.
The problem is the comparison with the new MacBook Air. Thanks to the M1 update, the Air is now much more powerful than before, and you cannot really notice a difference between the two devices in practice. The MacBook Pro 13 only benefits from its fan under sustained workloads, but we do not think this is really an important aspect for the target audience. The performance drop of the Air is also not that bad (about 12 % in Cinebench R23).
The Air also closed the gap when it comes to the display. It is still a bit darker than the Pro (400 vs. 500 nits), but the Air now also supports the larger P3 color gamut. Both devices support the same connectivity features. The battery runtime is better on the Pro thanks to the bigger battery, but it is also heavier in return. The only real difference when you use the device is the Touch Bar of the MacBook Pro 13. However, every user has to decide whether this is a positive or negative aspect. To be honest, even after a couple of years, the Touch Bar is still just a gimmick most of the time and basic actions like adjusting of the display brightness or speaker volume usually requires more inputs. Personally, we would prefer the physical F keys of the MacBook Air.
The MacBook Pro 13 benefits heavily from the new M1 processor and it is certainly one of the best subnotebooks you can get. Compared to the new MacBook Air, however, we miss the "Pro" features. Both models are extremely close in everyday usage scenarios, so we would definitely prefer the less expensive MacBook Air.
The price of the MacBook Pro 13 with a 256 GB SSD starts at $1299, and $1499 with a 512 GB SSD. The MacBook Air with the faster 8-core GPU and 512 GB is available for $1249, so it offers a much better price-performance ratio.
All in all, the new MacBook Pro 13 M1 seems to be filler product that does not make much sense. We cannot find any real arguments to prefer the Pro over the new Air. We suspect Apple will eventually discontinue the entry-level MacBook Pro 13 in the not-too-distant future and only offer a single (and more expensive) MacBook Pro 13 (or maybe MacBook Pro 14) with a more powerful M1X processor.
Apple MacBook Pro 13 Late 2020 M1 Entry (8 / 256 GB)
- 12/18/2020 v7 (old)
Andreas Osthoff


