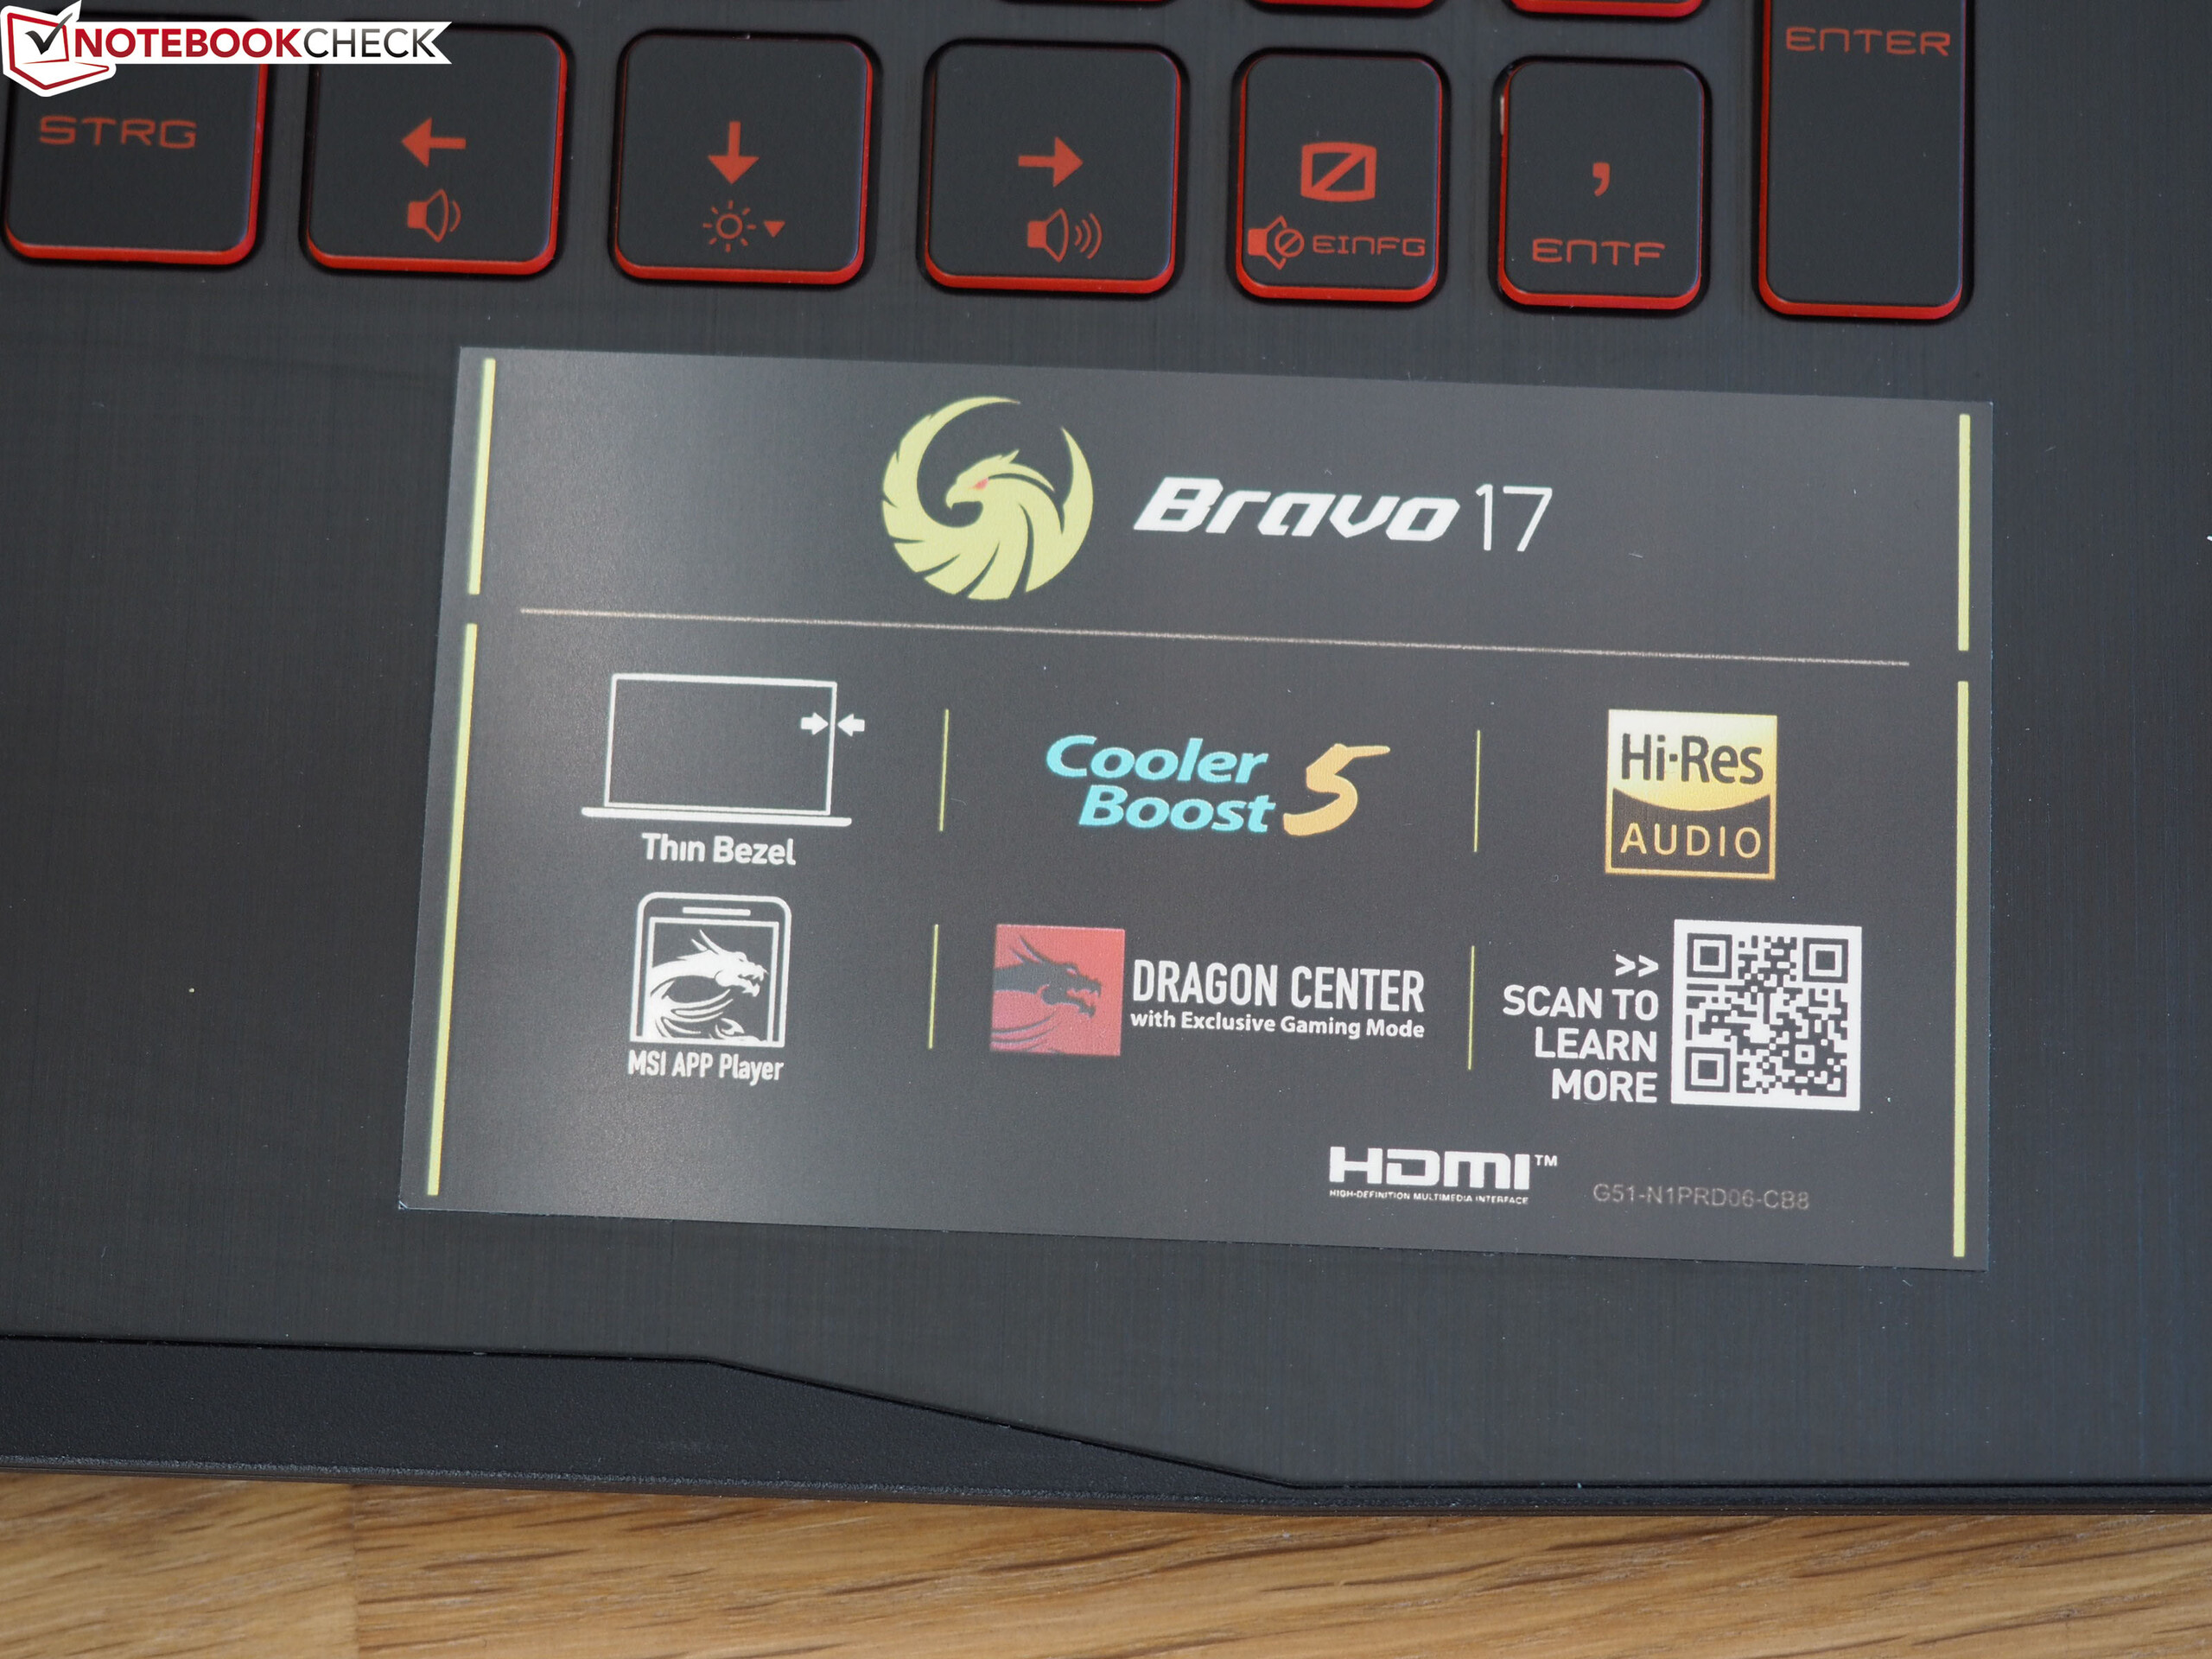
MSI Bravo 17 dizüstü bilgisayar incelemesi: Tamamen AMD oyun makinesi

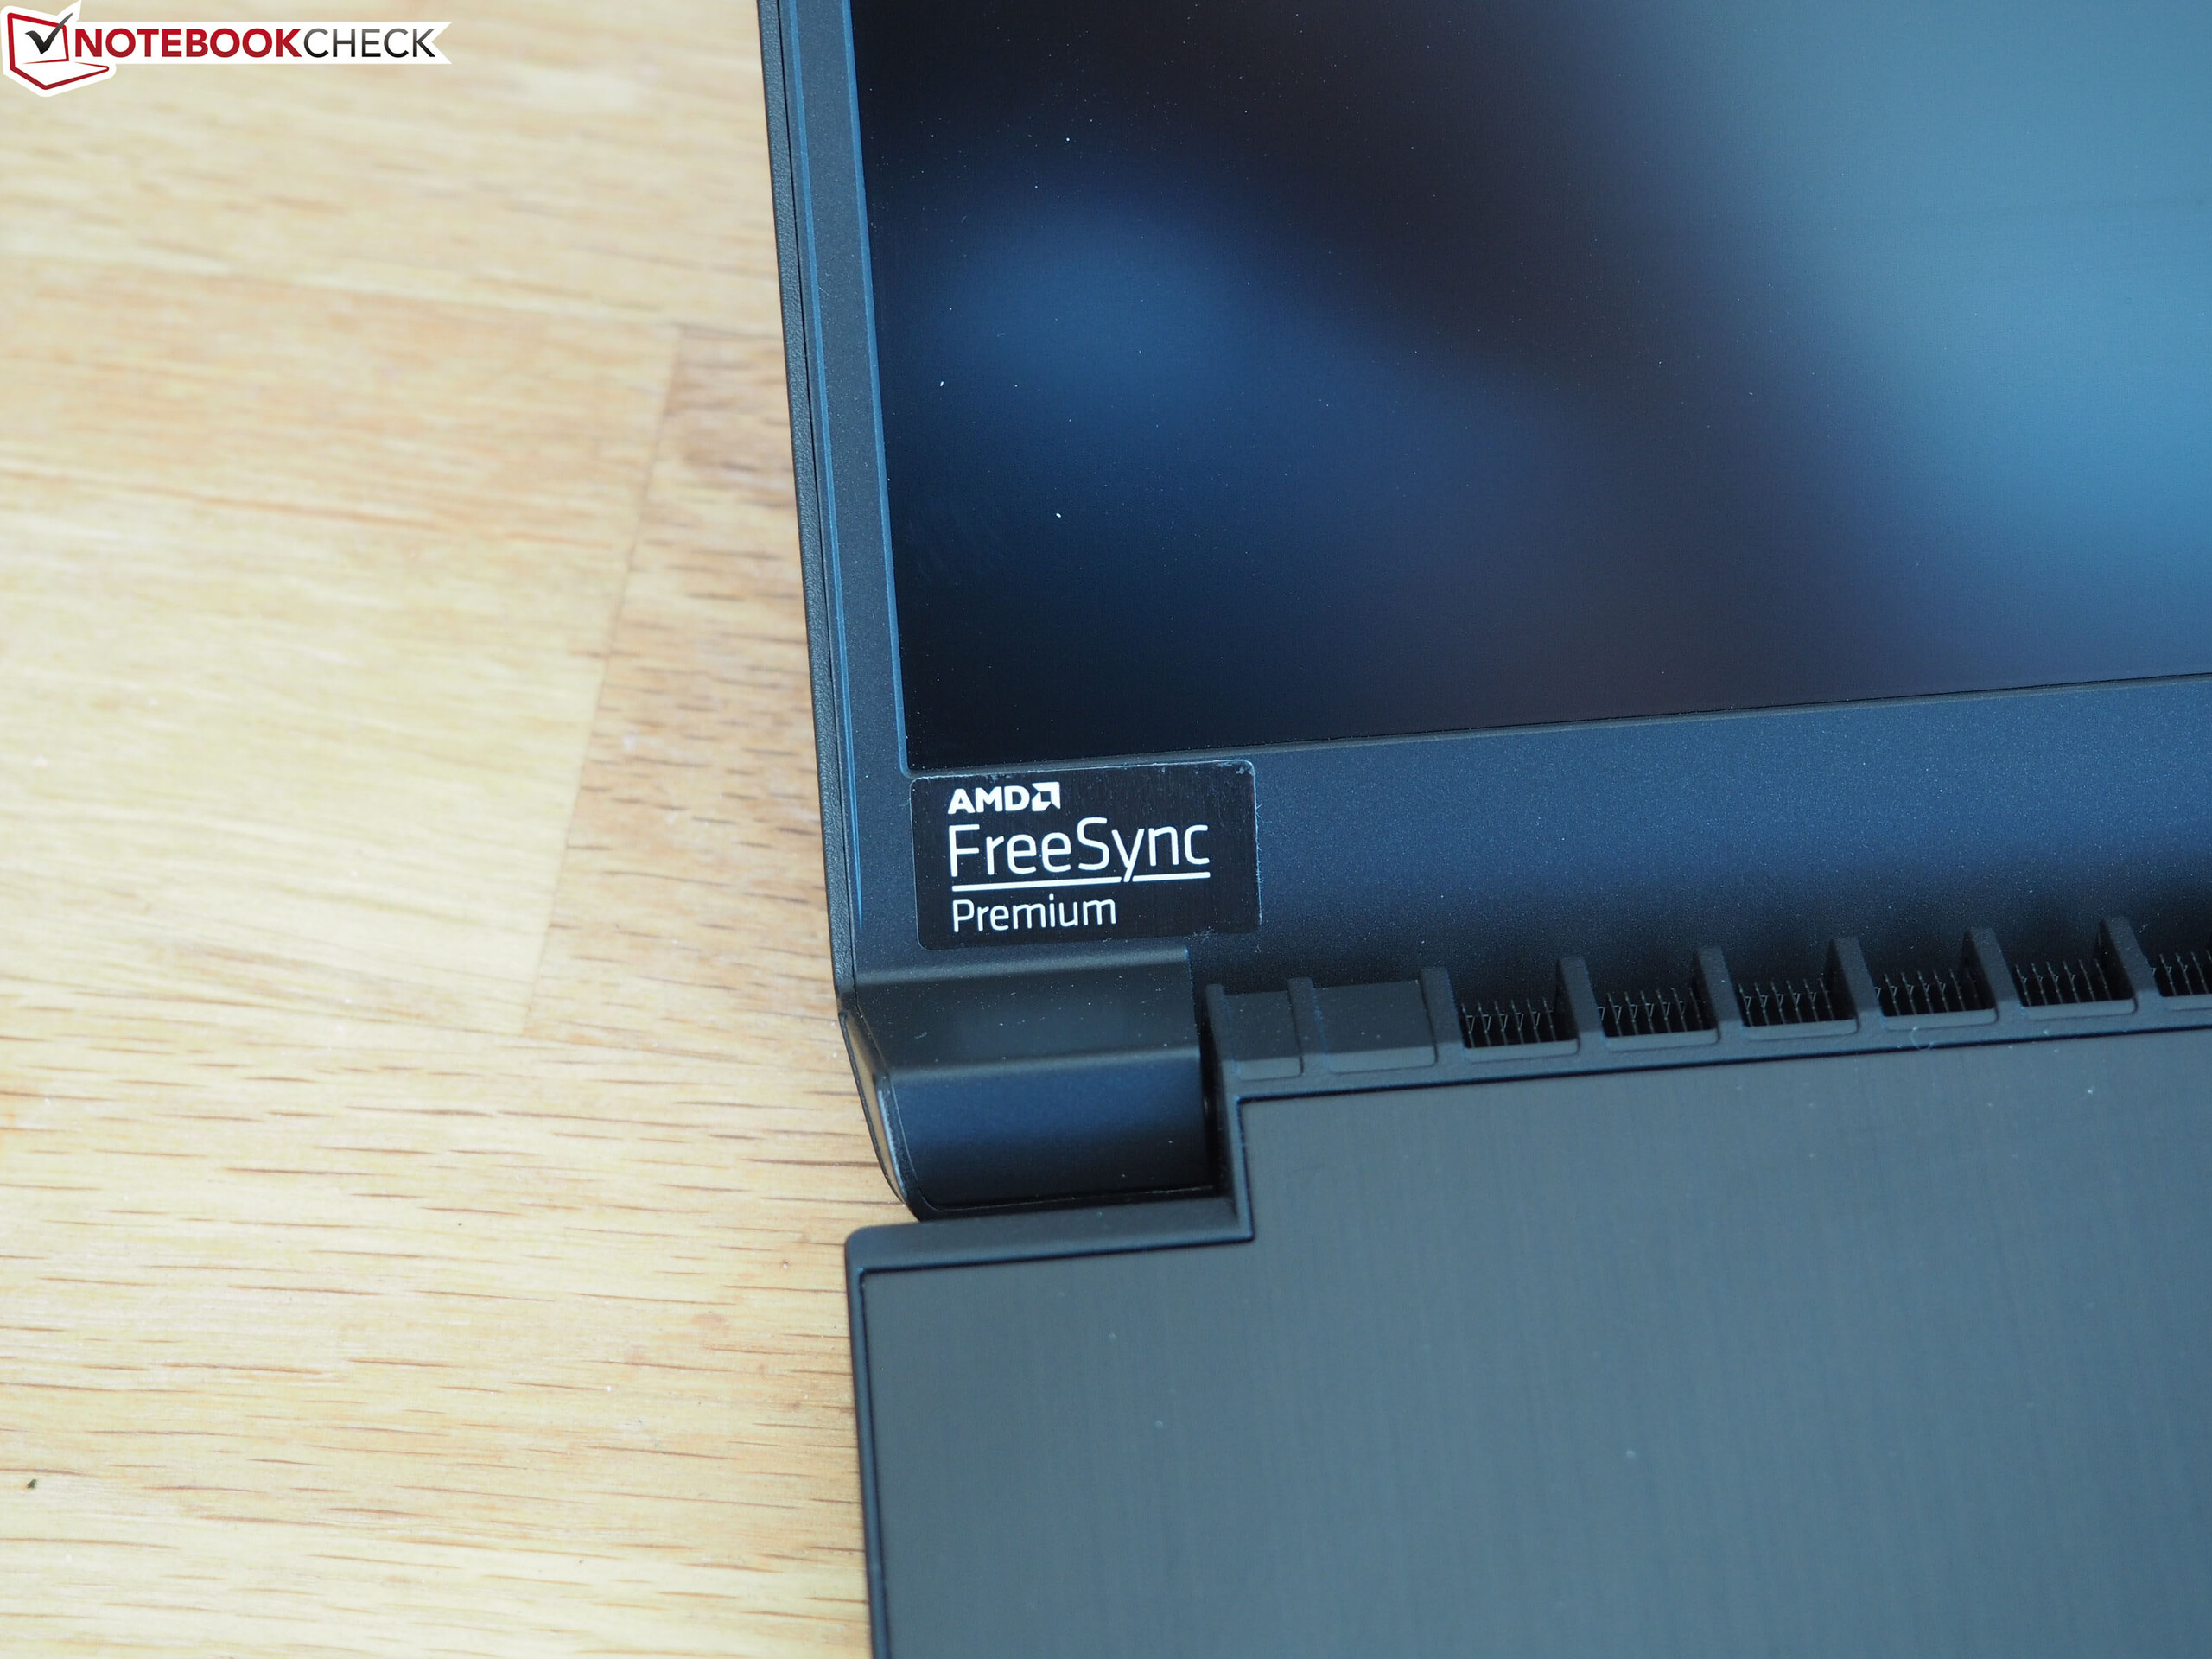
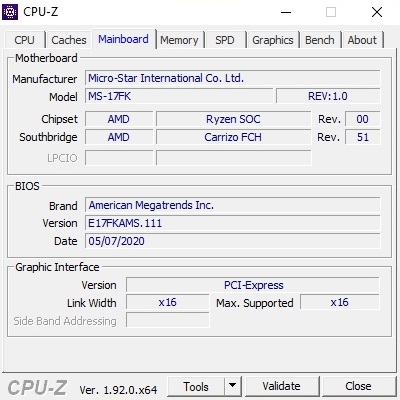
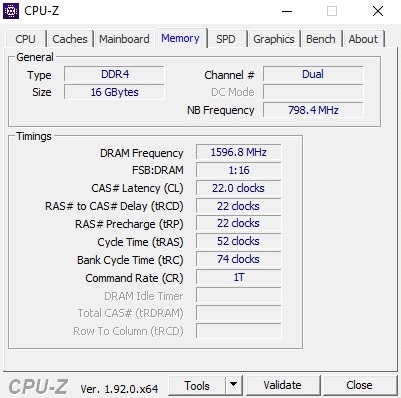
Fiyat konusunda bilinçli oyuncular 2020'de çok çeşitli heyecan verici dizüstü bilgisayarlarla karşılaşacaklar. Uzun bir kuru büyünün ardından AMD hayranları artık paralarının karşılığını alıyor. Buna iyi bir örnek, 1.250 Euro'nun (~ 1.414 $) altında mağazalarda satışa sunulacak yepyeni MSI Bravo 17'dir.Bu fiyata, alıcılar oyun için uygun bir üst orta sınıf sistem alırlar. Radeon RX 5500M, performans açısından kendini GeForce GTX 1650 ve GeForce GTX 1660 Ti arasında konumlandırırken, Ryzen 7 4800H, yalnızca performans açısından değil, aynı zamanda enerji verimliliği açısından da en güçlü Intel CPU'ları titretiyor. Aksi takdirde, test yapılandırmamızda çift kanal modunda 512 GB SSD ve 2x 8 GB DDR4 3200 RAM çubukları bulunur. Ayrıca, dizüstü bilgisayar FreeSync desteği ile 120 Hz mat ekrana sahiptir.
Bravo 17'nin rakipleri arasında Asus TUF FX705DT, Asus TUF A17 FA706IU ve Lenovo Legion Y540-17IRH gibi 1,500 Euro'dan (~ 1,696 $) daha düşük fiyat aralığındaki diğer bütçe oyun dizüstü bilgisayarları var. MSI Alpha 15 ve MSI GF75 İnce 9SC dahili yarışmacılar da tablolarda karşılaştırma cihazları olarak görünür.
Derecelendirme | Tarih | Modeli | Ağırlık | Yükseklik | Boyut | Çözünürlük | Fiyat |
|---|---|---|---|---|---|---|---|
| 80.9 % v7 (old) | 07/2020 | MSI Bravo 17 A4DDR R7 4800H, Radeon RX 5500M | 2.2 kg | 23 mm | 17.30" | 1920x1080 | |
| 78.8 % v7 (old) | 02/2020 | MSI Alpha 15 A3DDK-034 R7 3750H, Radeon RX 5500M | 2.3 kg | 27.5 mm | 15.60" | 1920x1080 | |
| 78 % v7 (old) | MSI GF75 Thin 9SC i7-9750H, GeForce GTX 1650 Mobile | 2.3 kg | 23.1 mm | 17.30" | 1920x1080 | ||
| 77.8 % v7 (old) | Asus TUF FX705DT-AU068T R5 3550H, GeForce GTX 1650 Mobile | 2.7 kg | 26.6 mm | 17.30" | 1920x1080 | ||
| 82.9 % v7 (old) | 06/2020 | Asus TUF A17 FA706IU-AS76 R7 4800H, GeForce GTX 1660 Ti Mobile | 2.6 kg | 26 mm | 17.30" | 1920x1080 | |
| 82.3 % v7 (old) | Lenovo Legion Y540-17IRH i5-9300H, GeForce GTX 1660 Ti Mobile | 2.8 kg | 26.3 mm | 17.30" | 1920x1080 |
Durum
Bravo 17'nin durumu, tahmini fiyat için şaşırtıcı derecede yüksek kalitede görünüyor. Bu şekilde, sadece kapak fırçalanmış alüminyumdan değil, aynı zamanda klavye çevresinden de yapılır. Burada geçmişte sık sık plastik bir şasiyle yaşamak zorunda kalıyordunuz. Biraz titrek bir ekranı açtığınızda, denge de oldukça iyi bir rakam kesiyor. Çoğu alanda, ana ünite sadece güçlü basınç altında biraz bükülebilir. Tasarım - kırmızı etiketli klavyeden ayrı olarak - oldukça sade, bu da cihazın çok gösterişli görünmemesini sağlıyor.
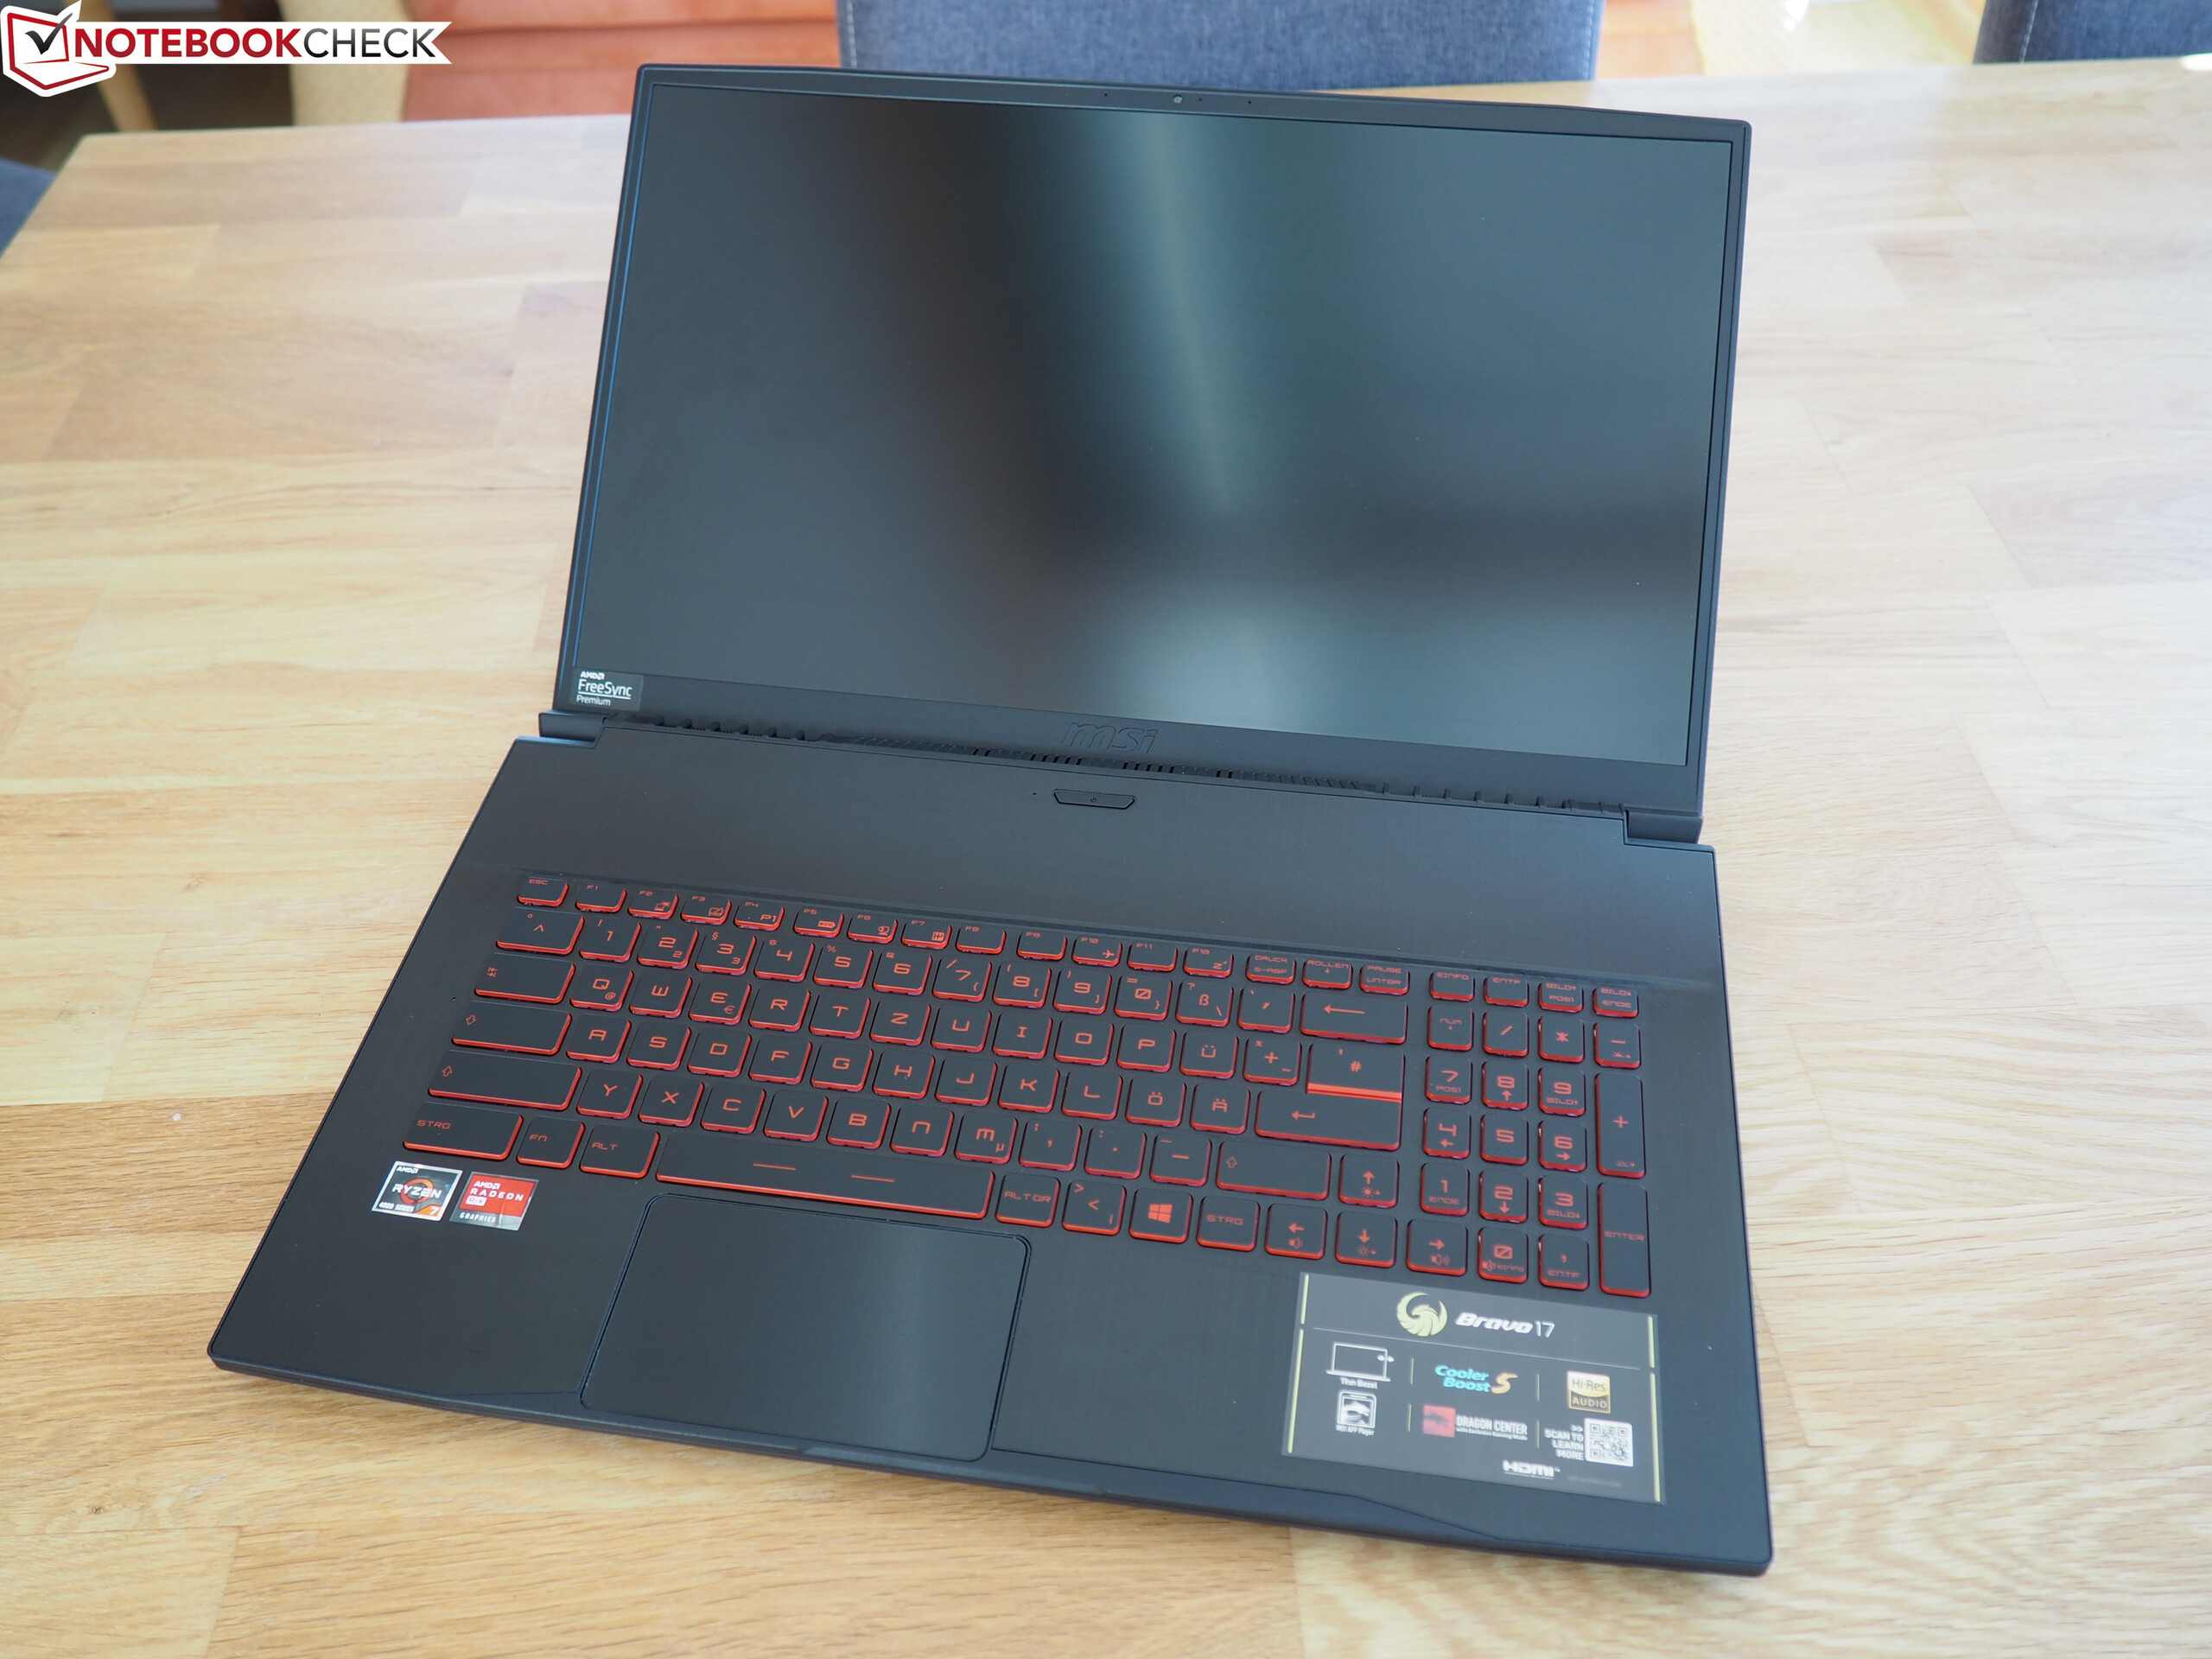
Orta ağırlık için artı noktalar da vardır: 2.2 kg'da Bravo 17, testteki en hafif 17 inçtir. Yarışma 2,3 ila 2,8 kg arasında değişmektedir. Bazı alıcılar da düşük toplam yükseklikten memnun kalacaklar: 2.3 cm ince bir görünüm garanti ediyor. İnce çerçeve tasarımı sayesinde ana boyutlar da (39.7 x 26.0 cm) sınırları dahilinde tutulur. İşçilik de arzulanan hiçbir şey bırakmıyor. Test cihazımızda, tüm elemanlar düzgün bir şekilde birbirine birleştirildi. MSI, sırasıyla lastik ayakları ve menteşe yapısını geliştirebilir. Dizüstü bilgisayar açıldığında çok kolay / hızlı bir şekilde kayıyor.
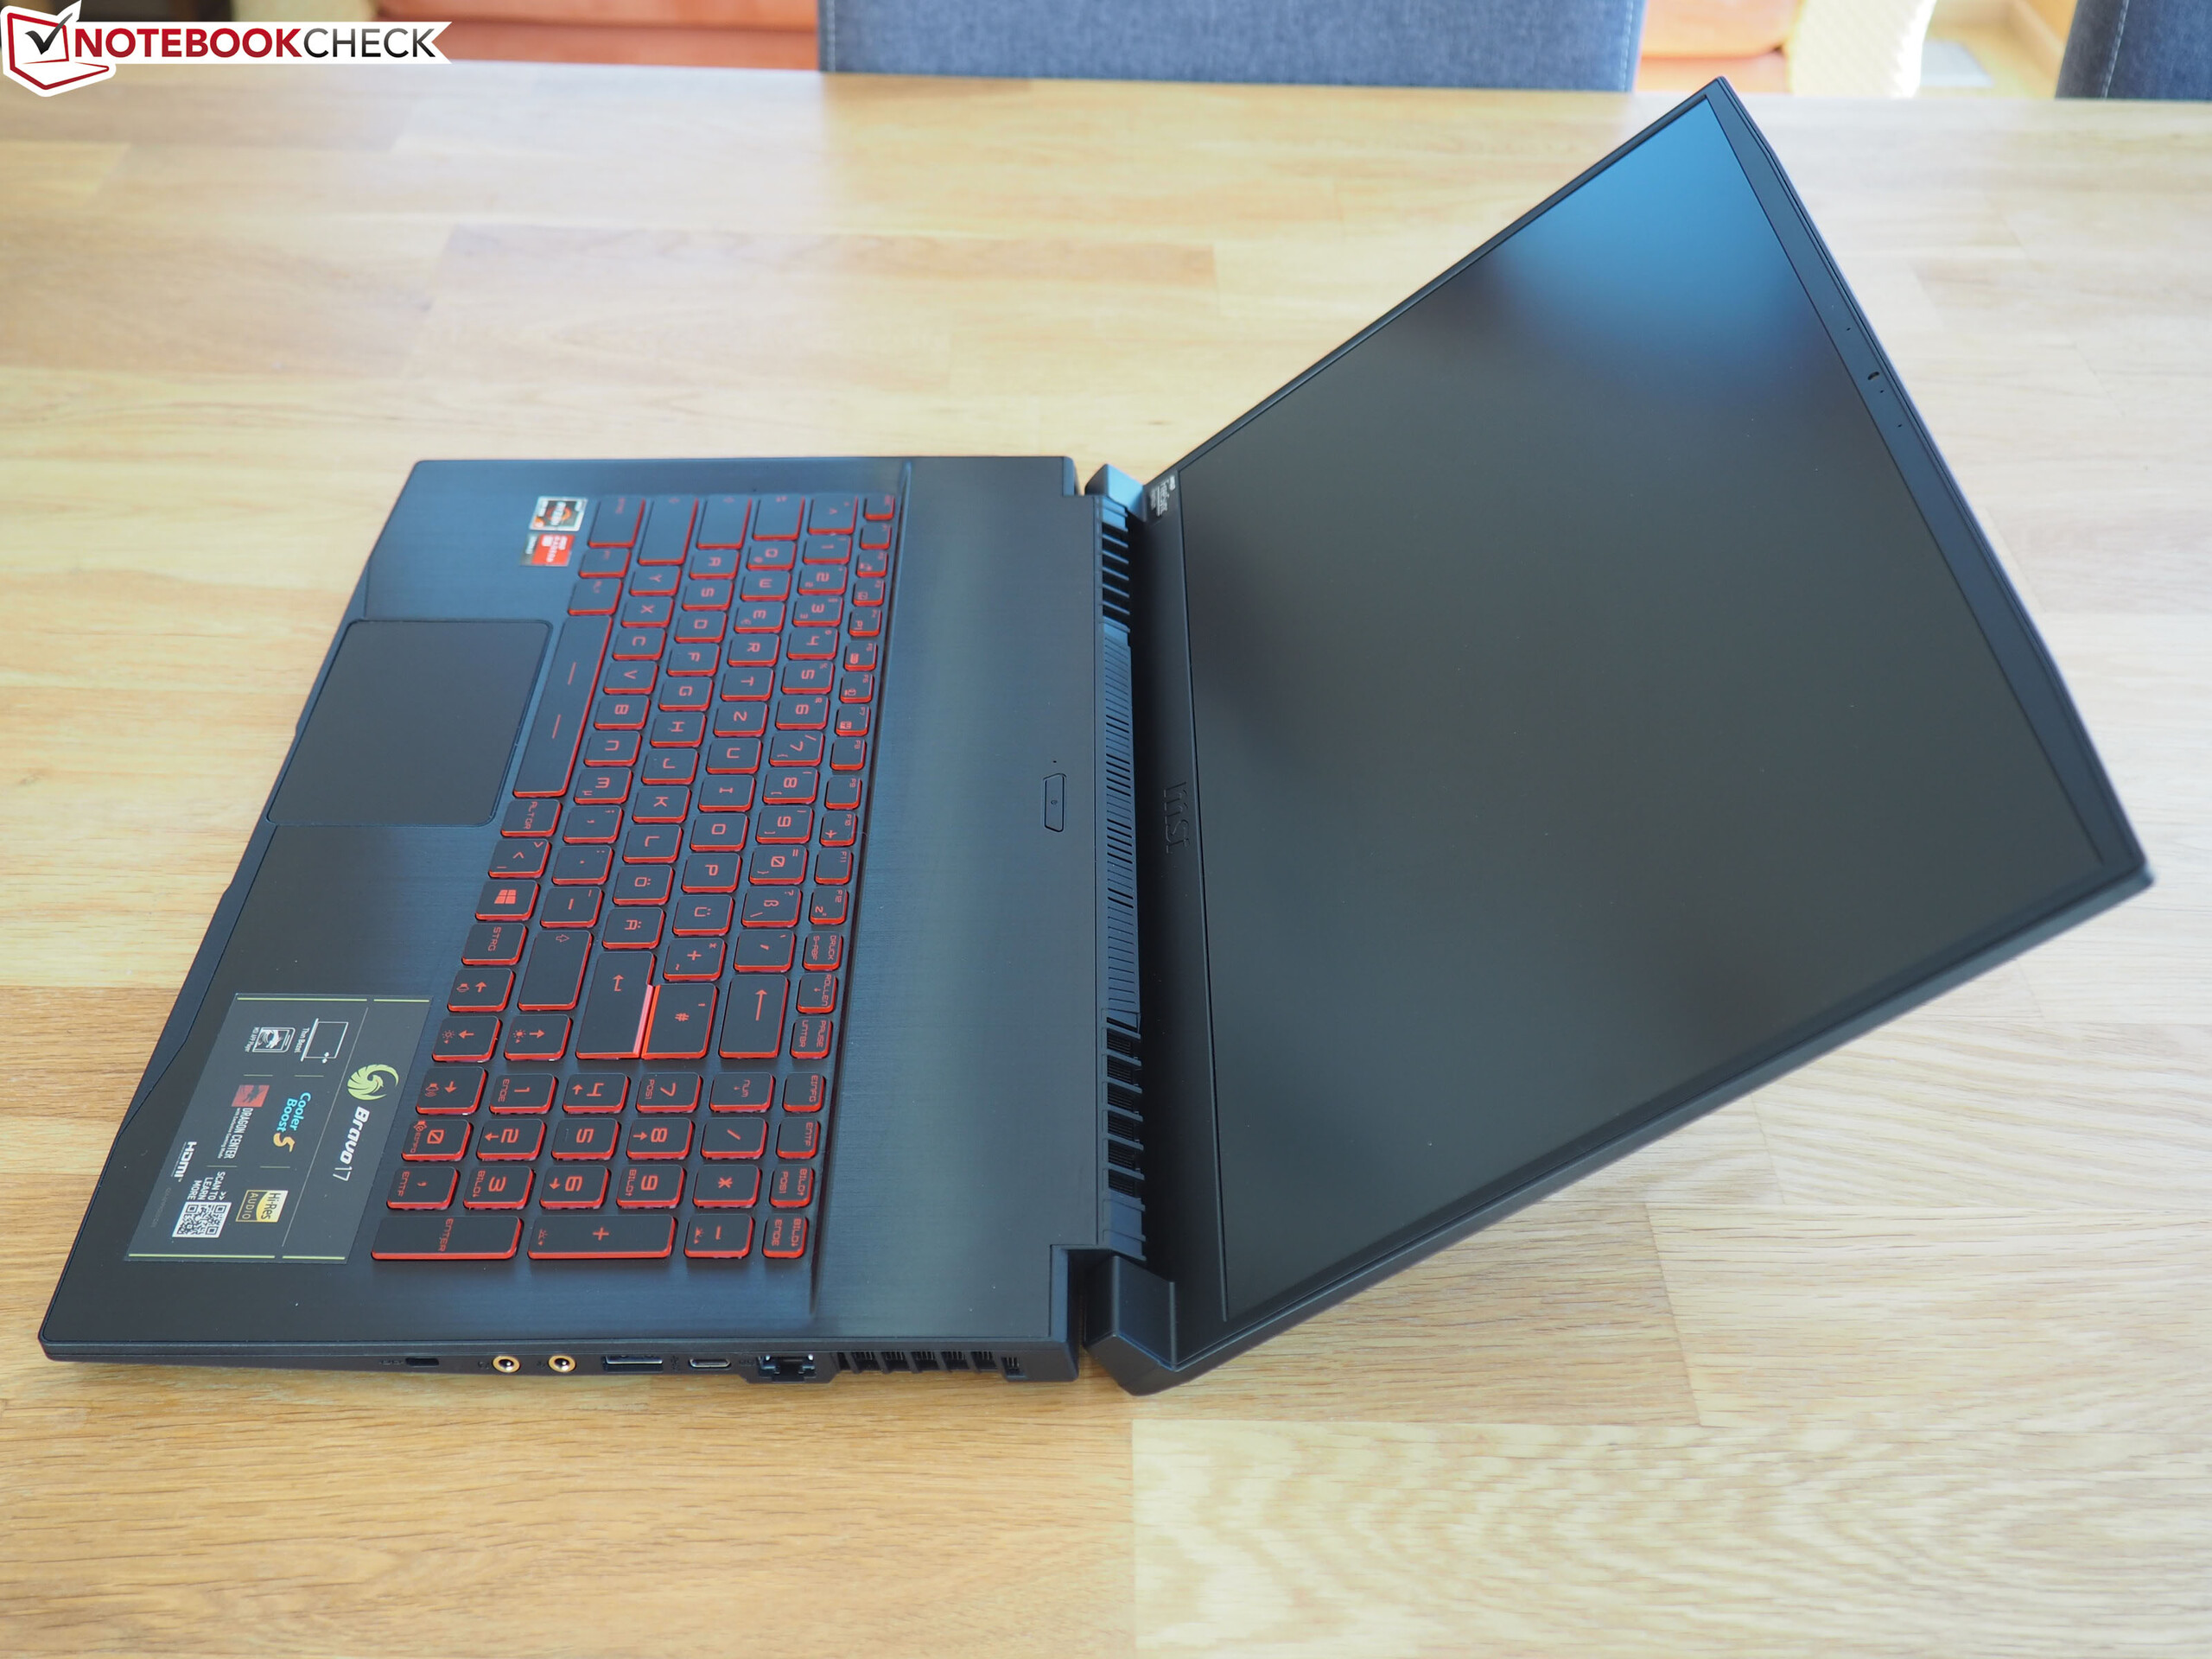
Bağlantı
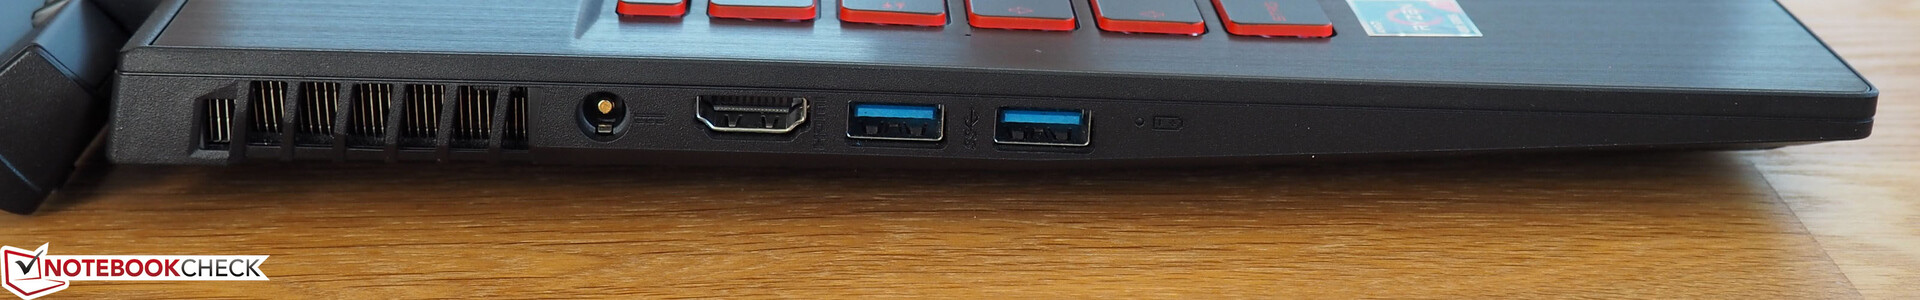
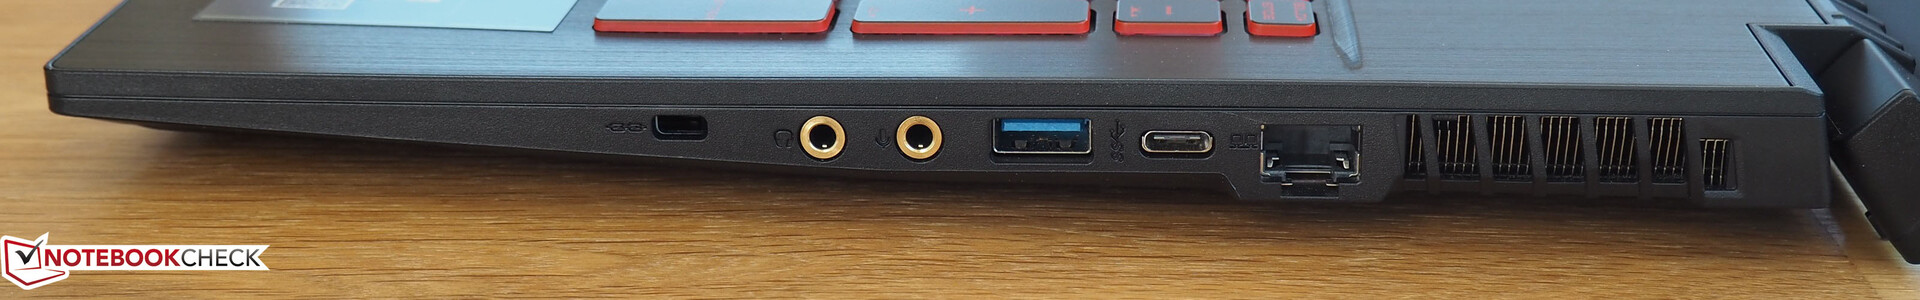
Bravo 17'nin cömert bir bağlantı noktası yapılandırmasına sahip olmasını beklememelisiniz. MSI hem DisplayPort bağlantısından hem de kart okuyucusundan çıkar. USB 3.2 Gen 2 (x2), Thunderbolt 3'ten bahsetmiyorum bile, gösterişsiz. Sonuç olarak, mevcut USB bağlantı noktaları (3x Type-A, 1x Type-C) yalnızca eski 3.0 standardına karşılık gelen USB 3.2 Gen 1'i destekler. Ayrıca, bir HDMI bağlantı noktası (not: 4K'da yalnızca 30 Hz), bir RJ45 bağlantı noktası ve iki altın kaplama ses jakı vardır. Yanlardaki havalandırma ızgaraları nedeniyle bağlantıların düzeni oldukça ideal olmasa bile, harici bir fare kullanırken hareket için bu kadar yer kaybetmezsiniz.
İletişim
Her ne kadar yakın zamanda değiştirilmiş test kurulumu (ac yönlendirici yerine balta yönlendirici) nedeniyle Wi-Fi sonuçları rekabetle karşılaştırılamaz olsa da, Bravo 17, WLAN performansı söz konusu olduğunda listenin en üstündedir. Gönderme için 880 Mb / s ve veri alma için 1,520 Mb / s iyi ila çok iyi değerleri temsil eder. Intel Wi-Fi 6 AX200 ile MSI modern bir kablosuz modül taktı.
| Networking | |
| iperf3 transmit AX12 | |
| MSI Bravo 17 A4DDR | |
| Lenovo Legion Y540-17IRH | |
| MSI GF75 Thin 9SC | |
| MSI Alpha 15 A3DDK-034 | |
| Asus TUF A17 FA706IU-AS76 | |
| Asus TUF FX705DT-AU068T | |
| iperf3 receive AX12 | |
| MSI Bravo 17 A4DDR | |
| Lenovo Legion Y540-17IRH | |
| MSI Alpha 15 A3DDK-034 | |
| MSI GF75 Thin 9SC | |
| Asus TUF A17 FA706IU-AS76 | |
| Asus TUF FX705DT-AU068T | |
Web kamerası
Çoğu dizüstü bilgisayarda olduğu gibi, Bravo 17 de iyi bir web kamerasından yoksundur. Ne görüntü netliği ne de renk doğruluğu ikna edicidir (fotoğraflara bakın).


Aksesuarlar
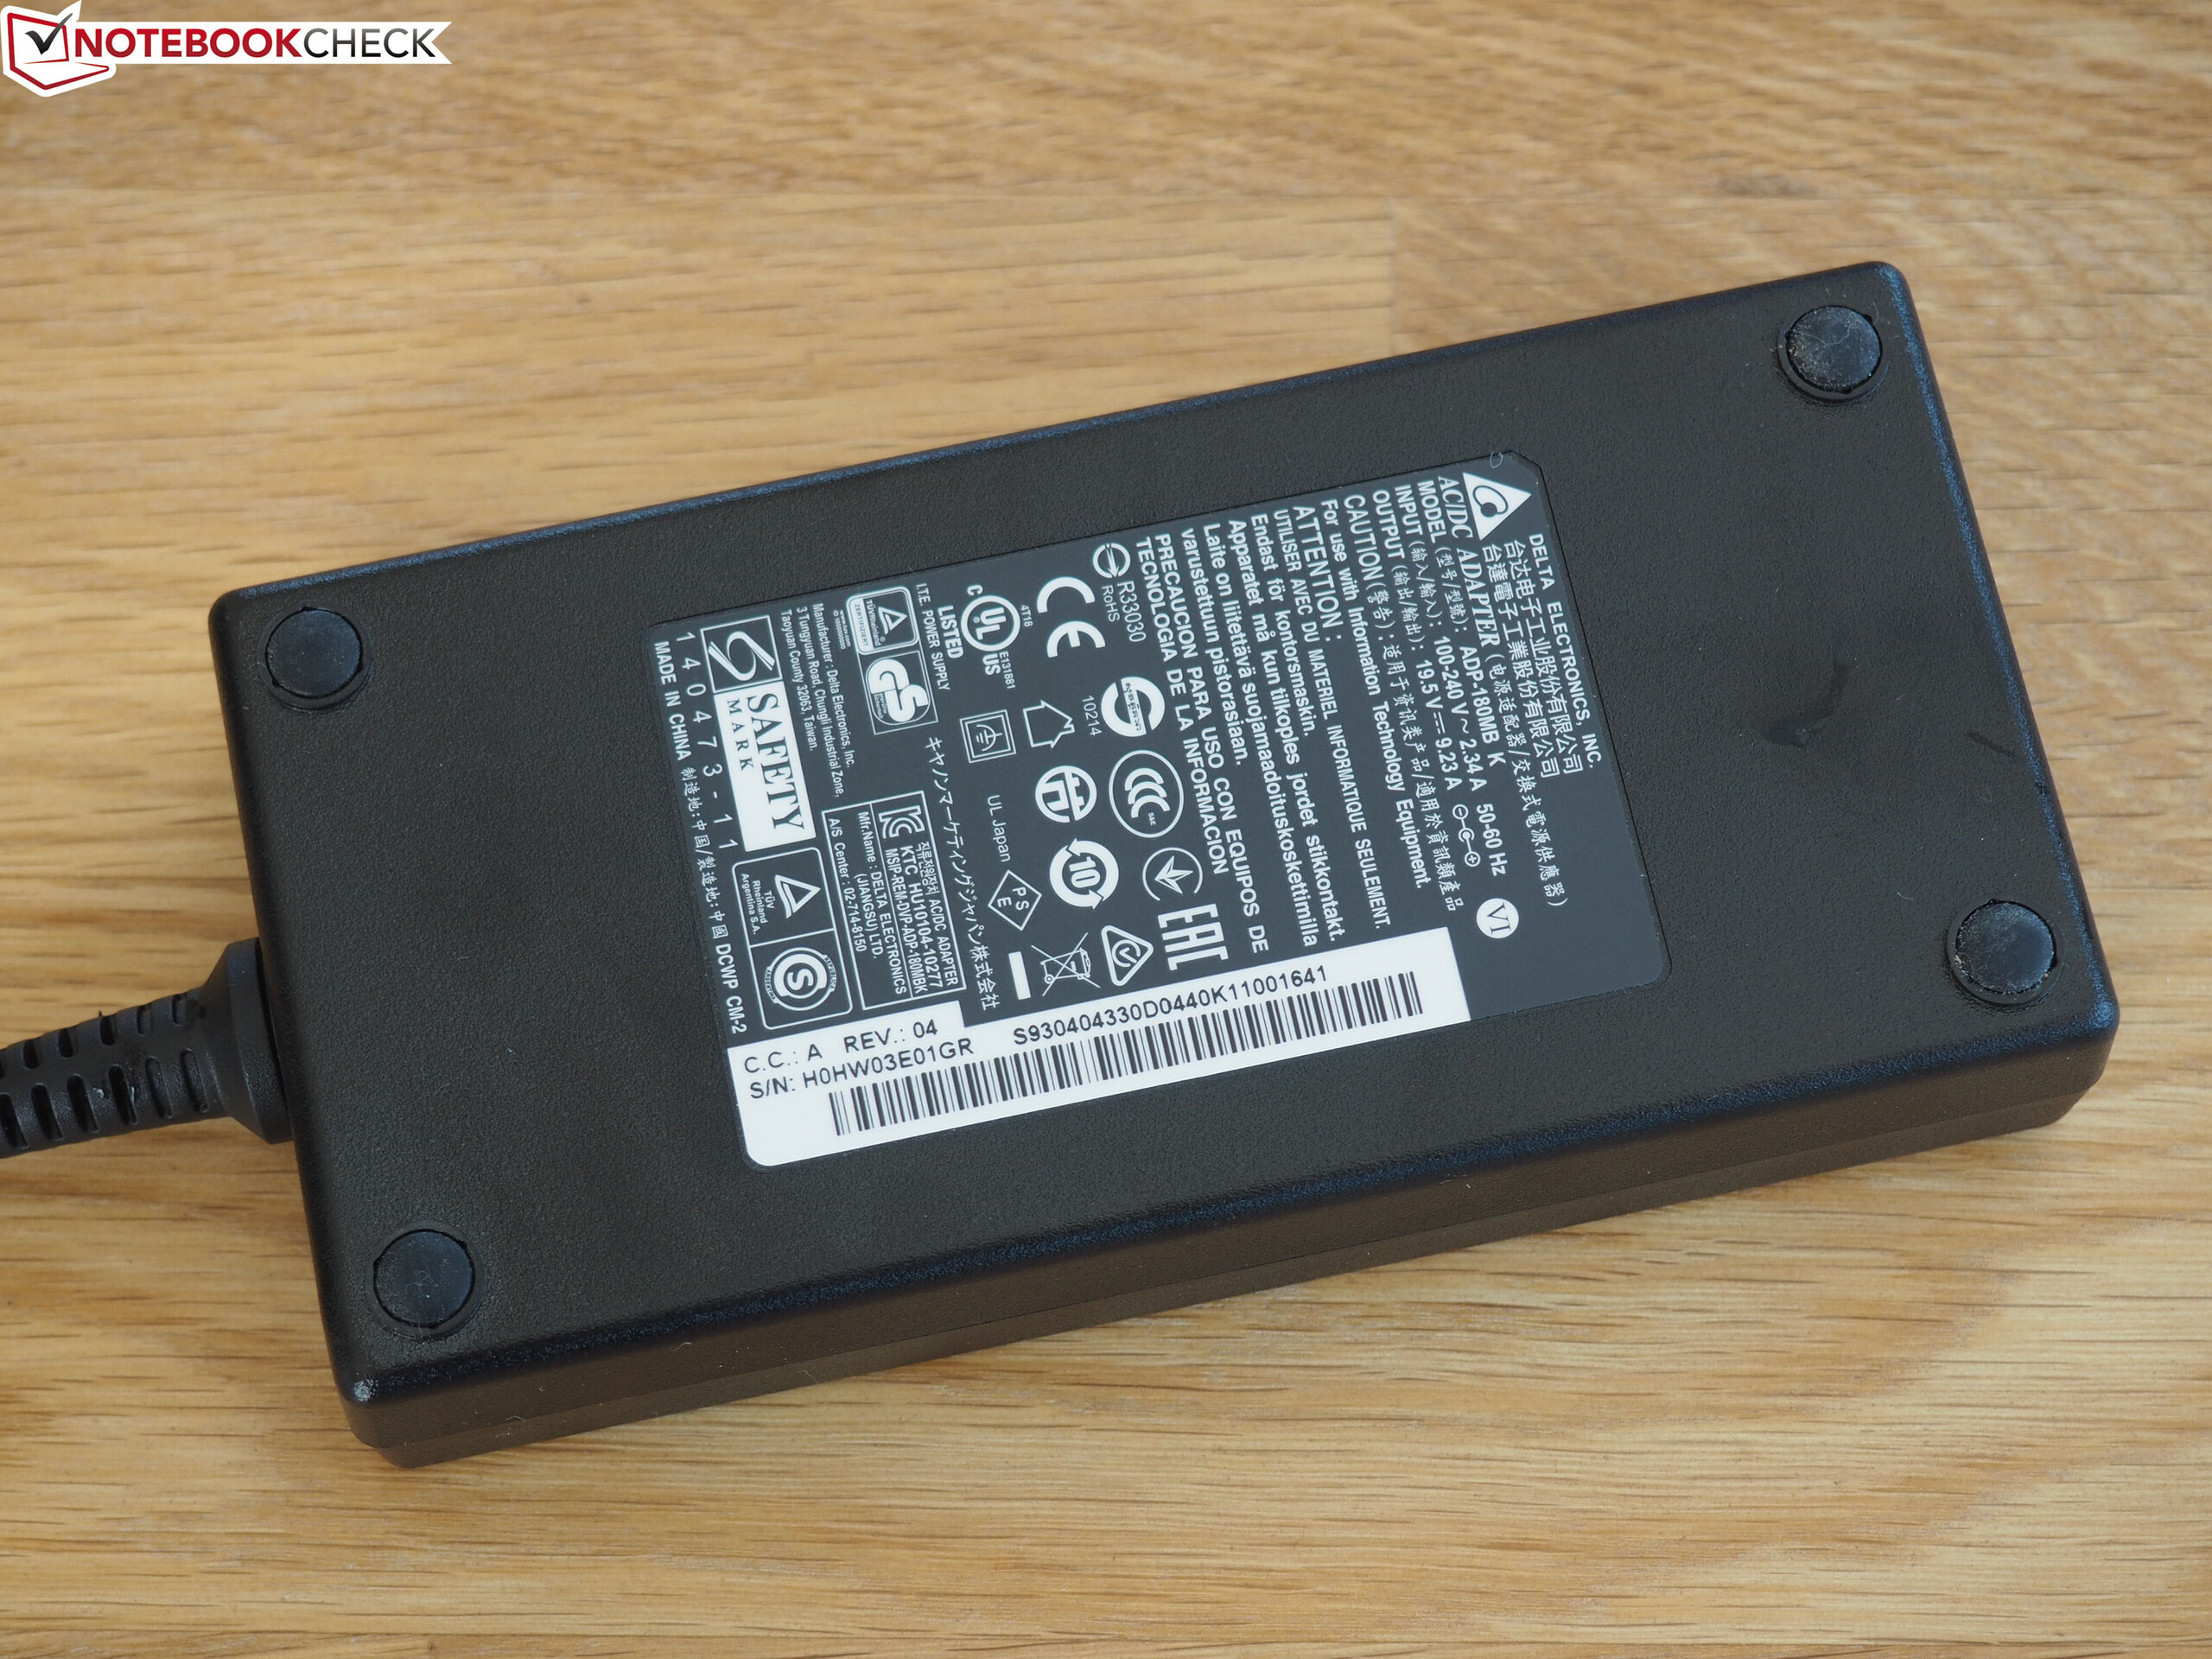
Aksesuarlar açısından MSI, kutuya yalnızca hızlı başlangıç kılavuzu ve kurtarma kılavuzu eklemiştir. Yaklaşık 600 gram ağırlığındaki 180 watt güç adaptörünün, 15 x 7.5 x 3 cm boyutunda nispeten kompakt olduğu ortaya çıktı.
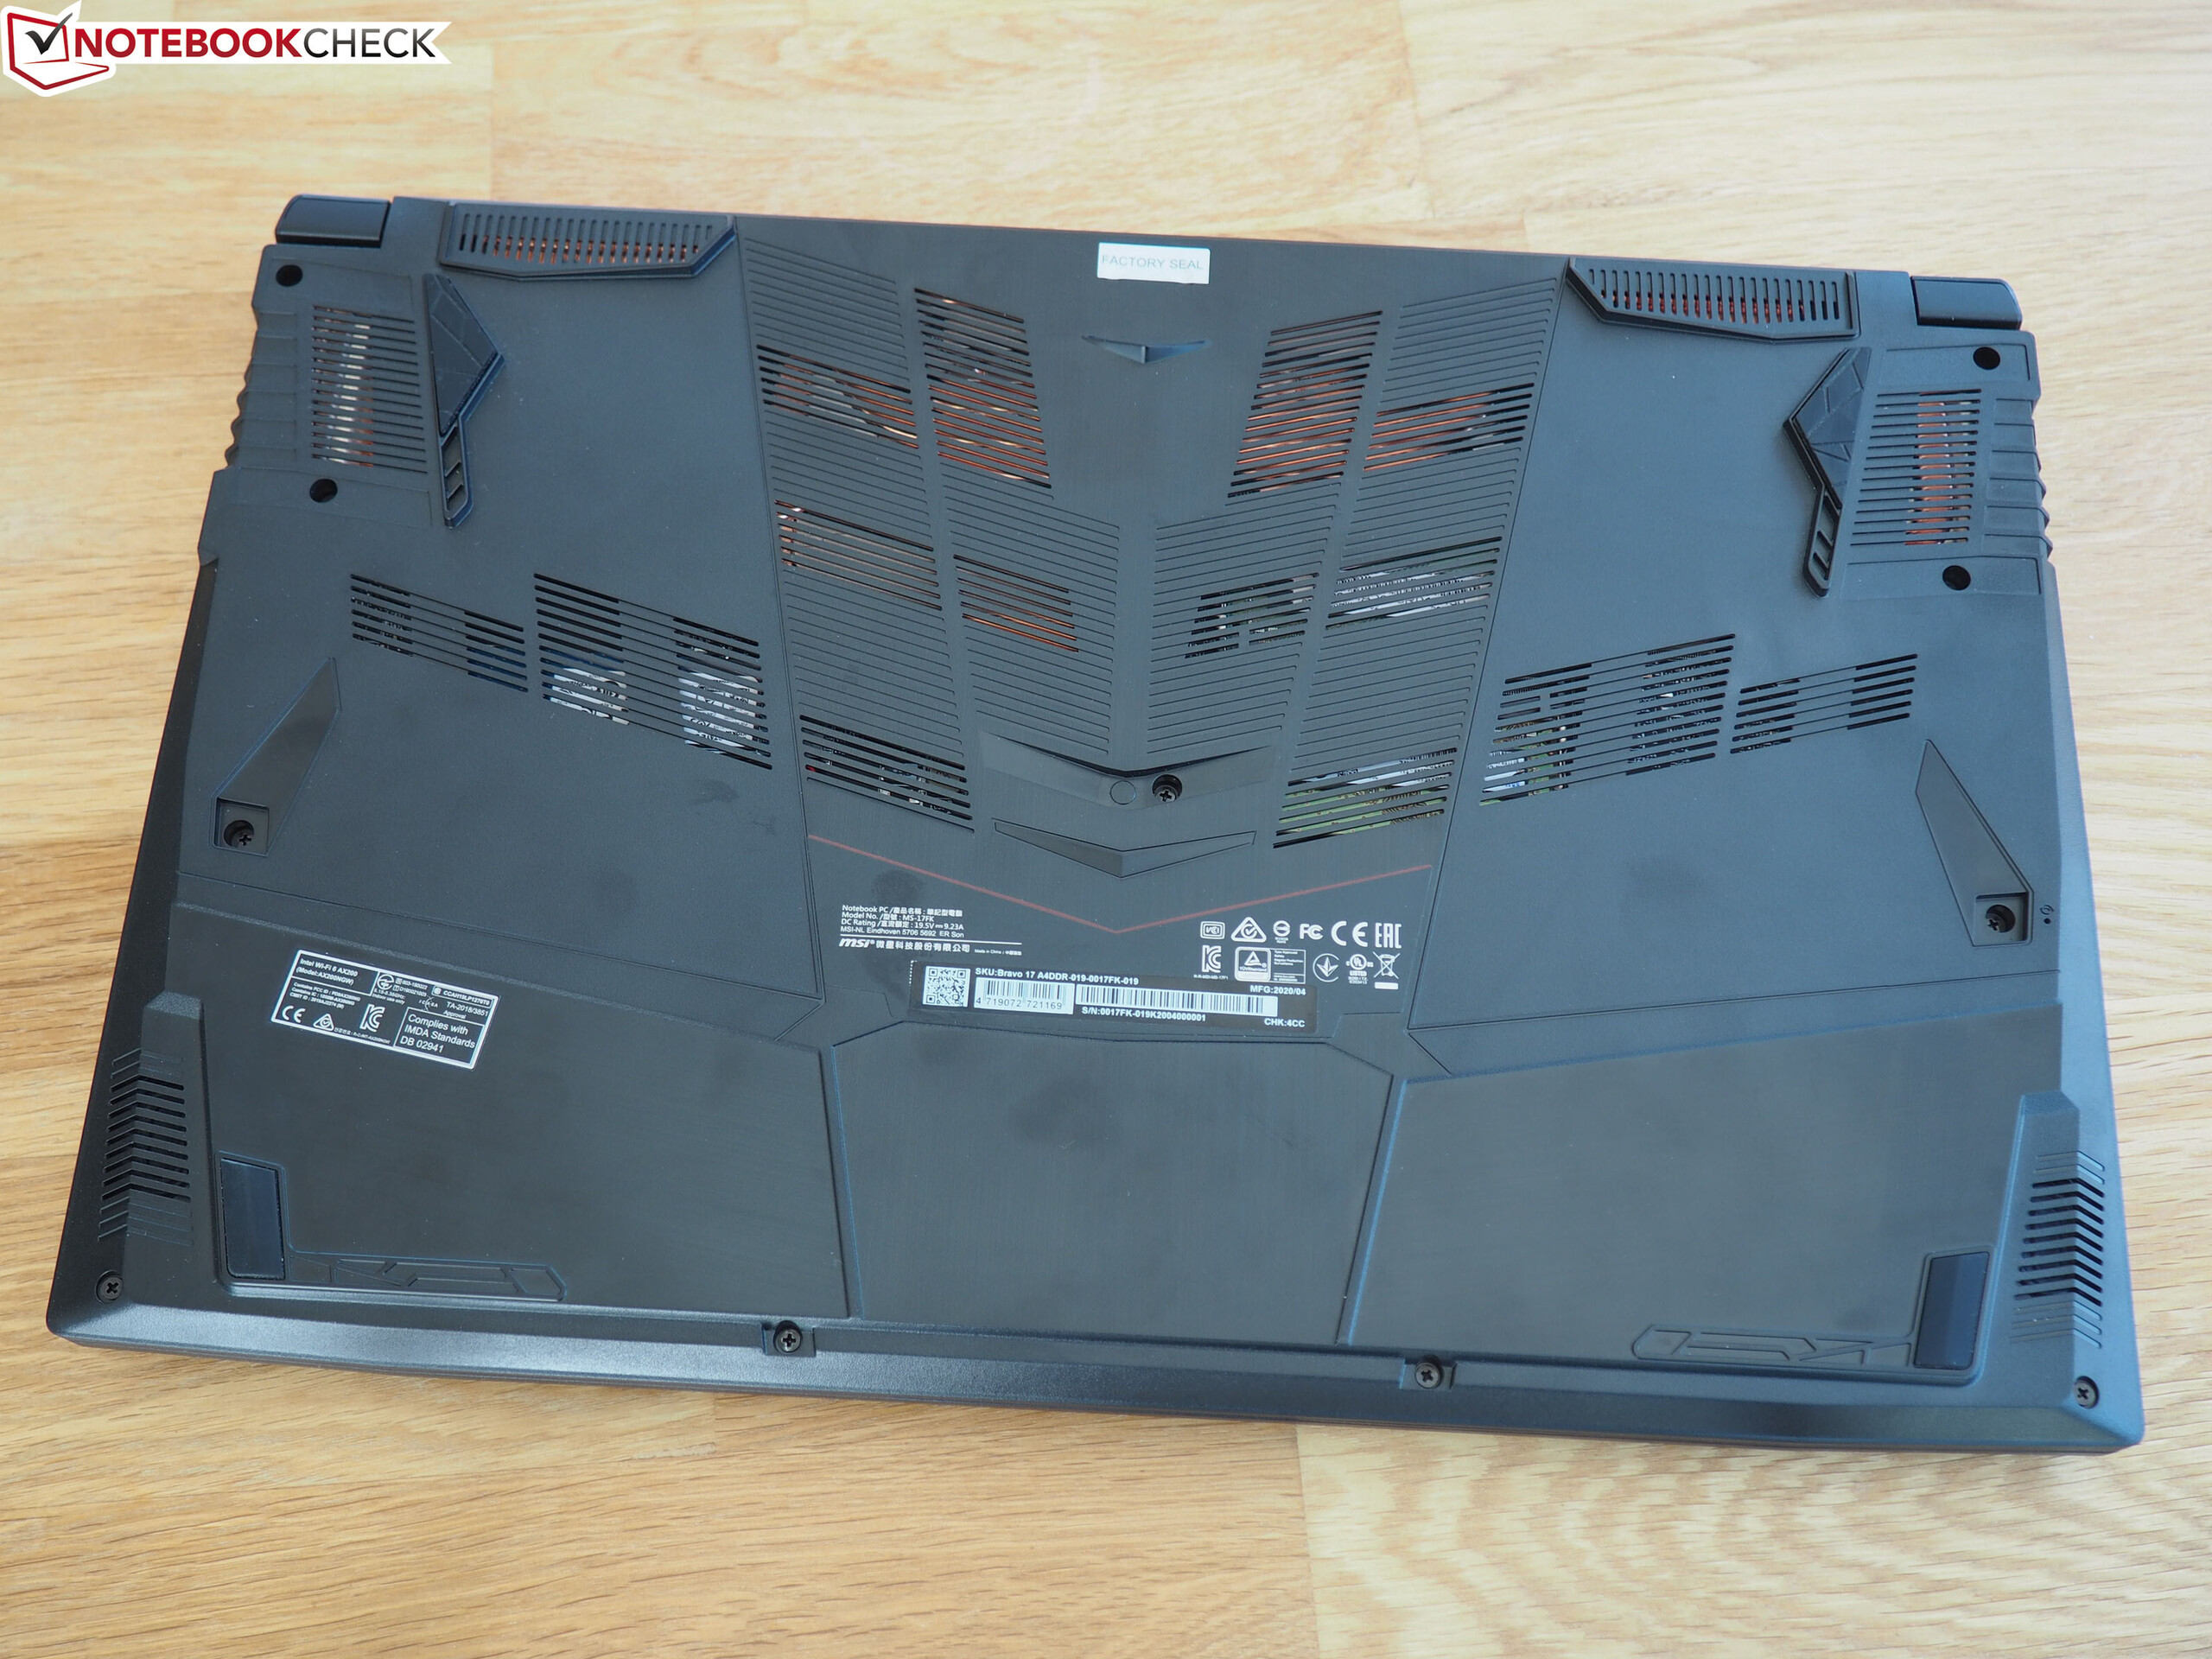
Bakım
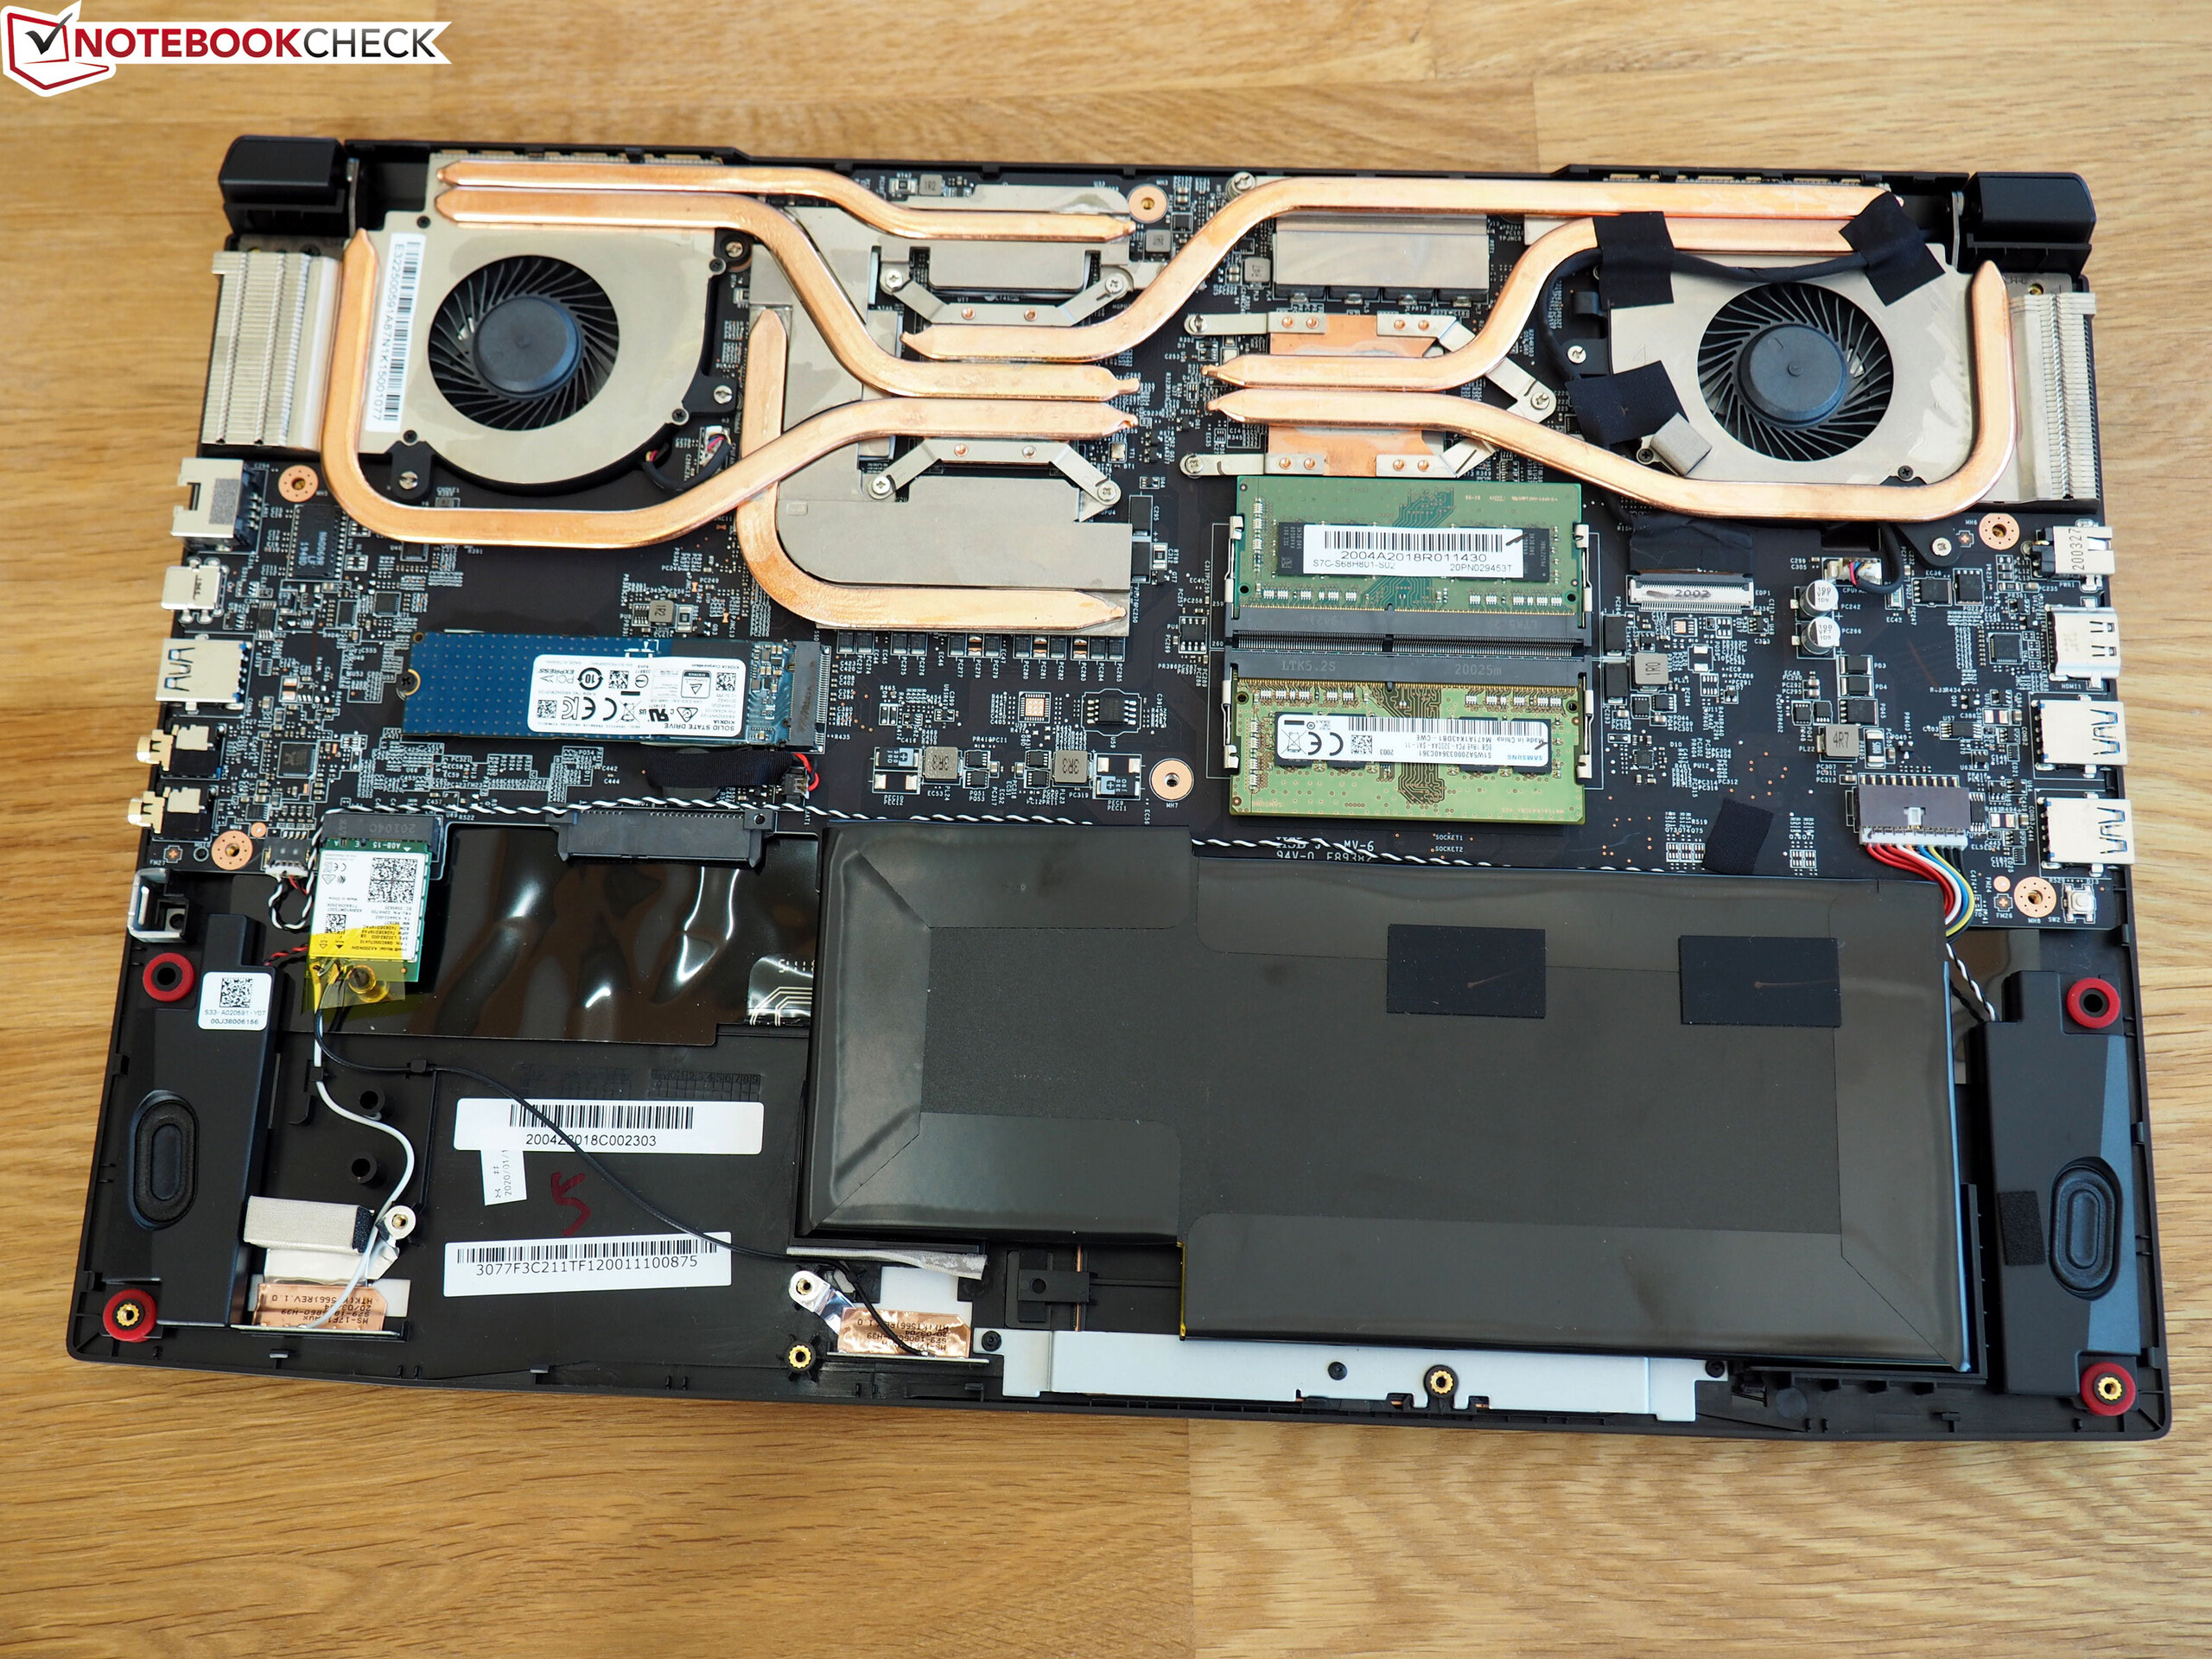
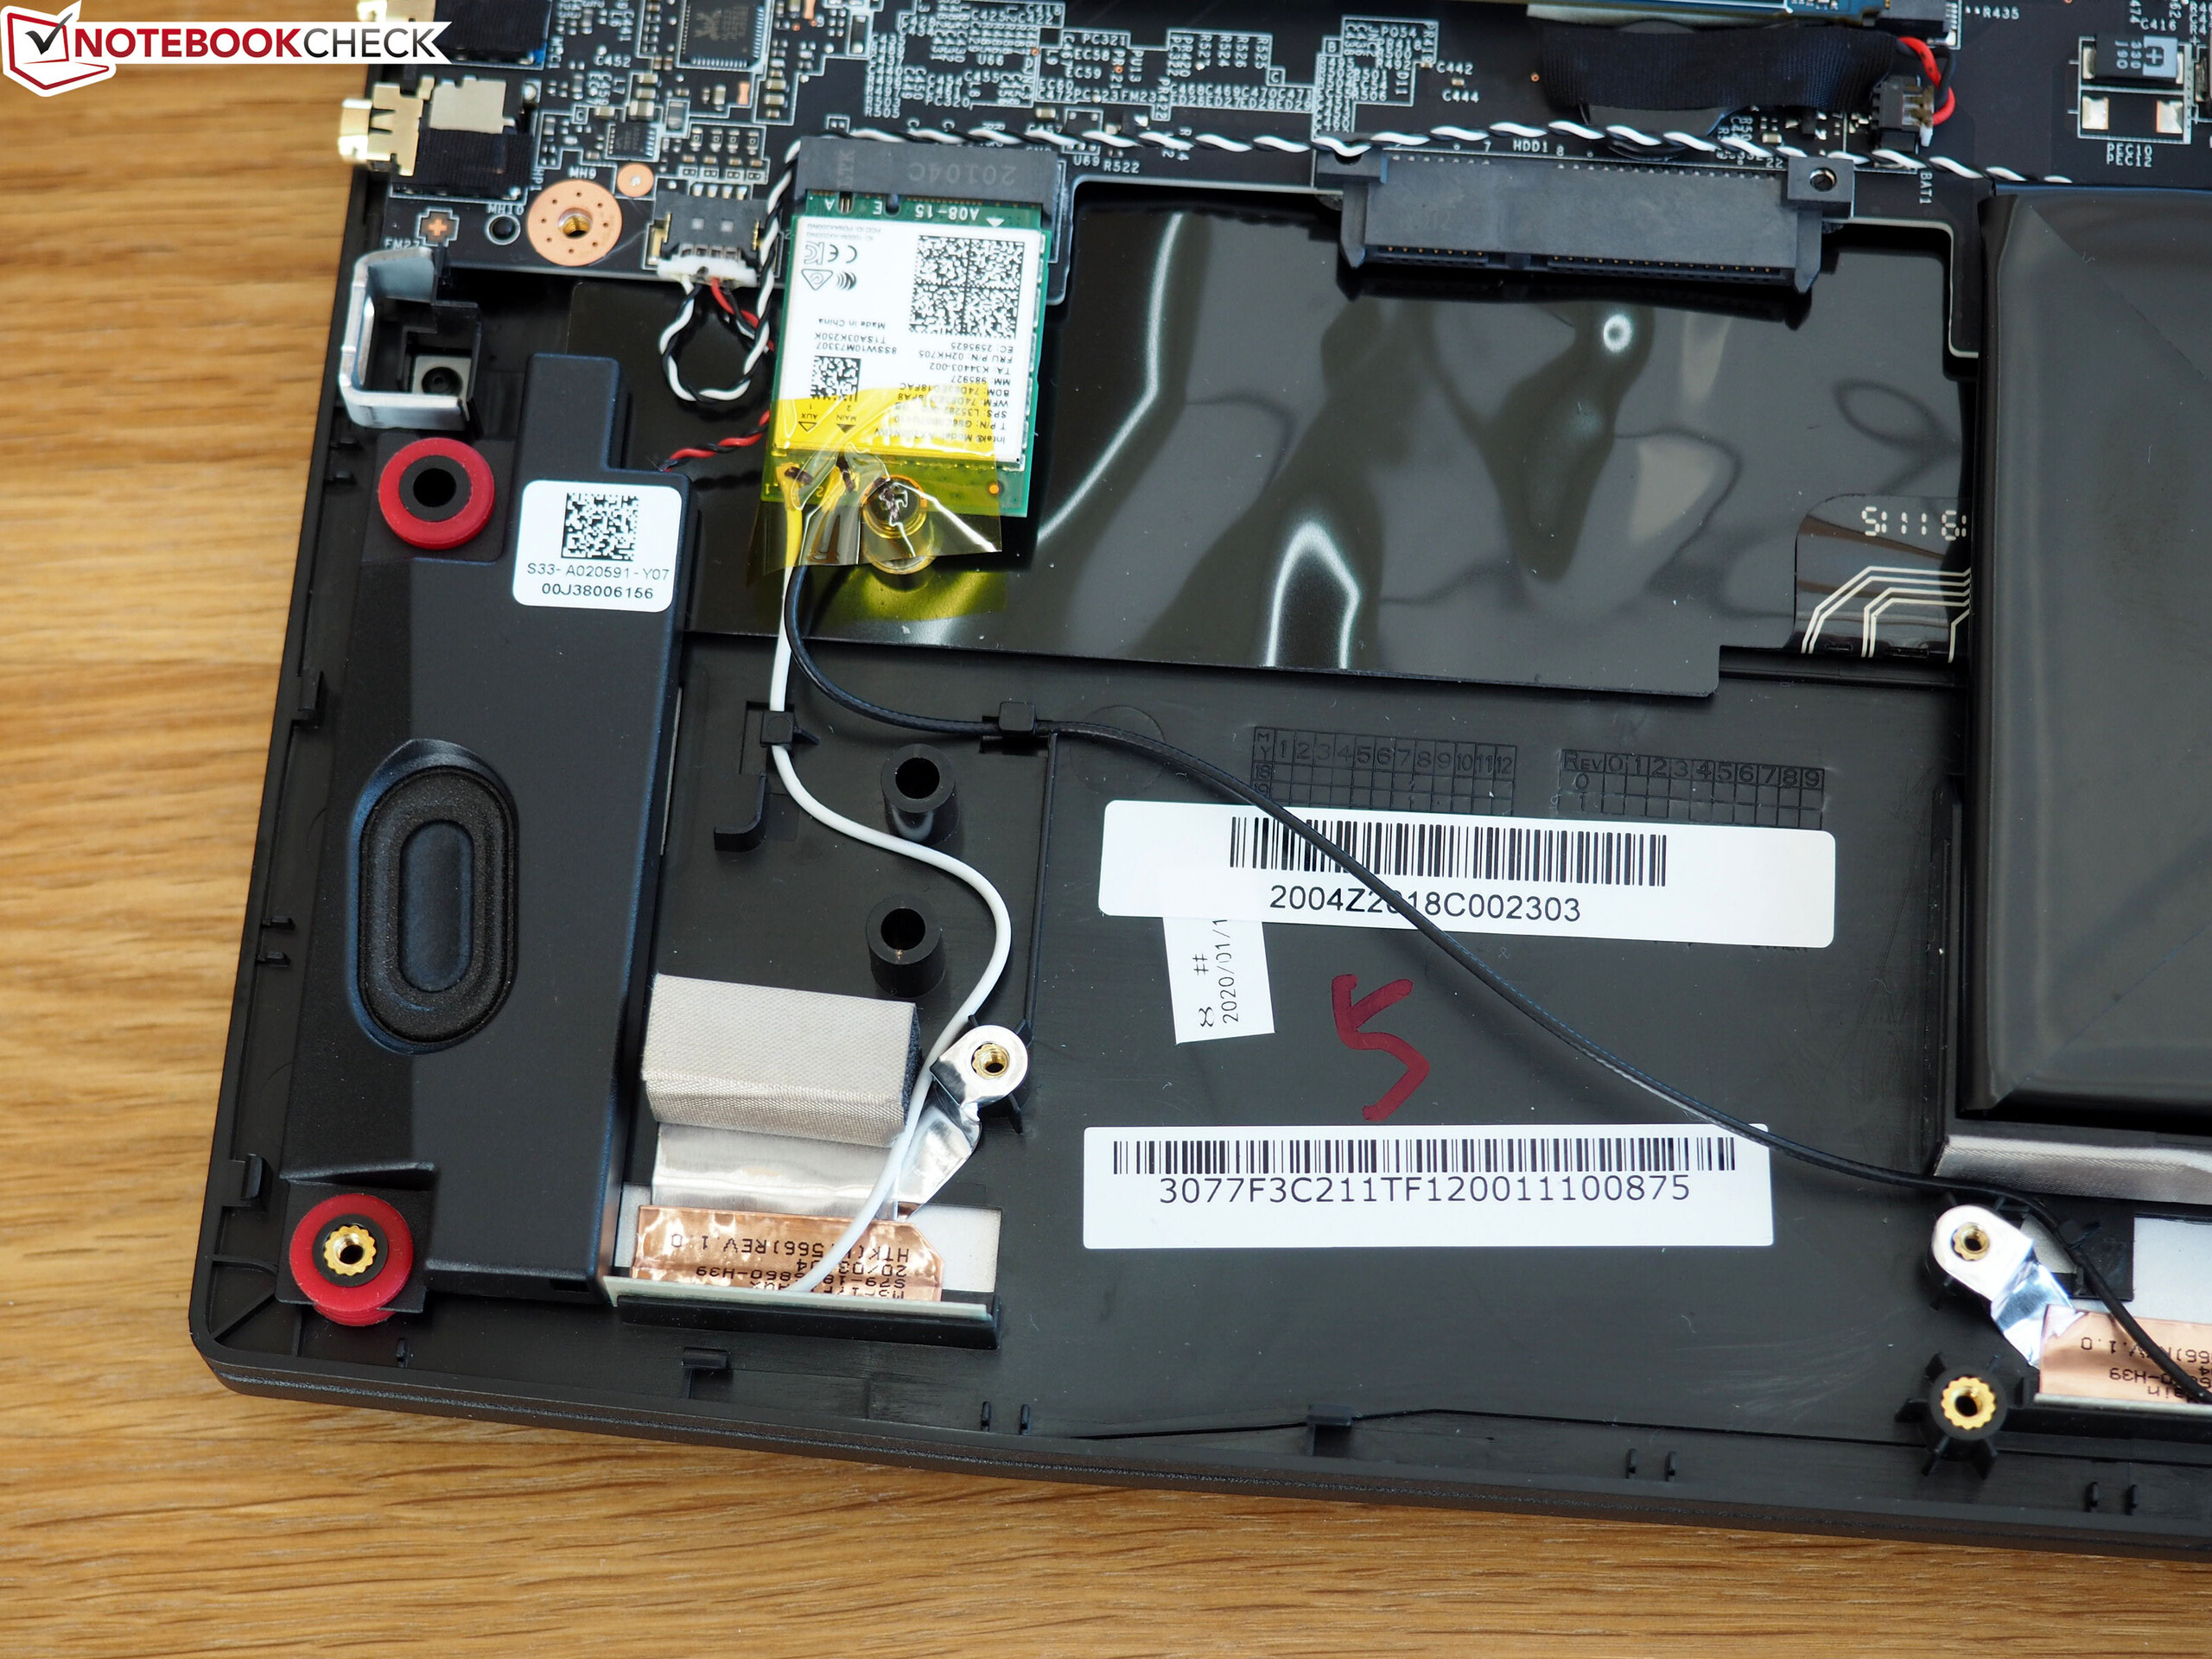
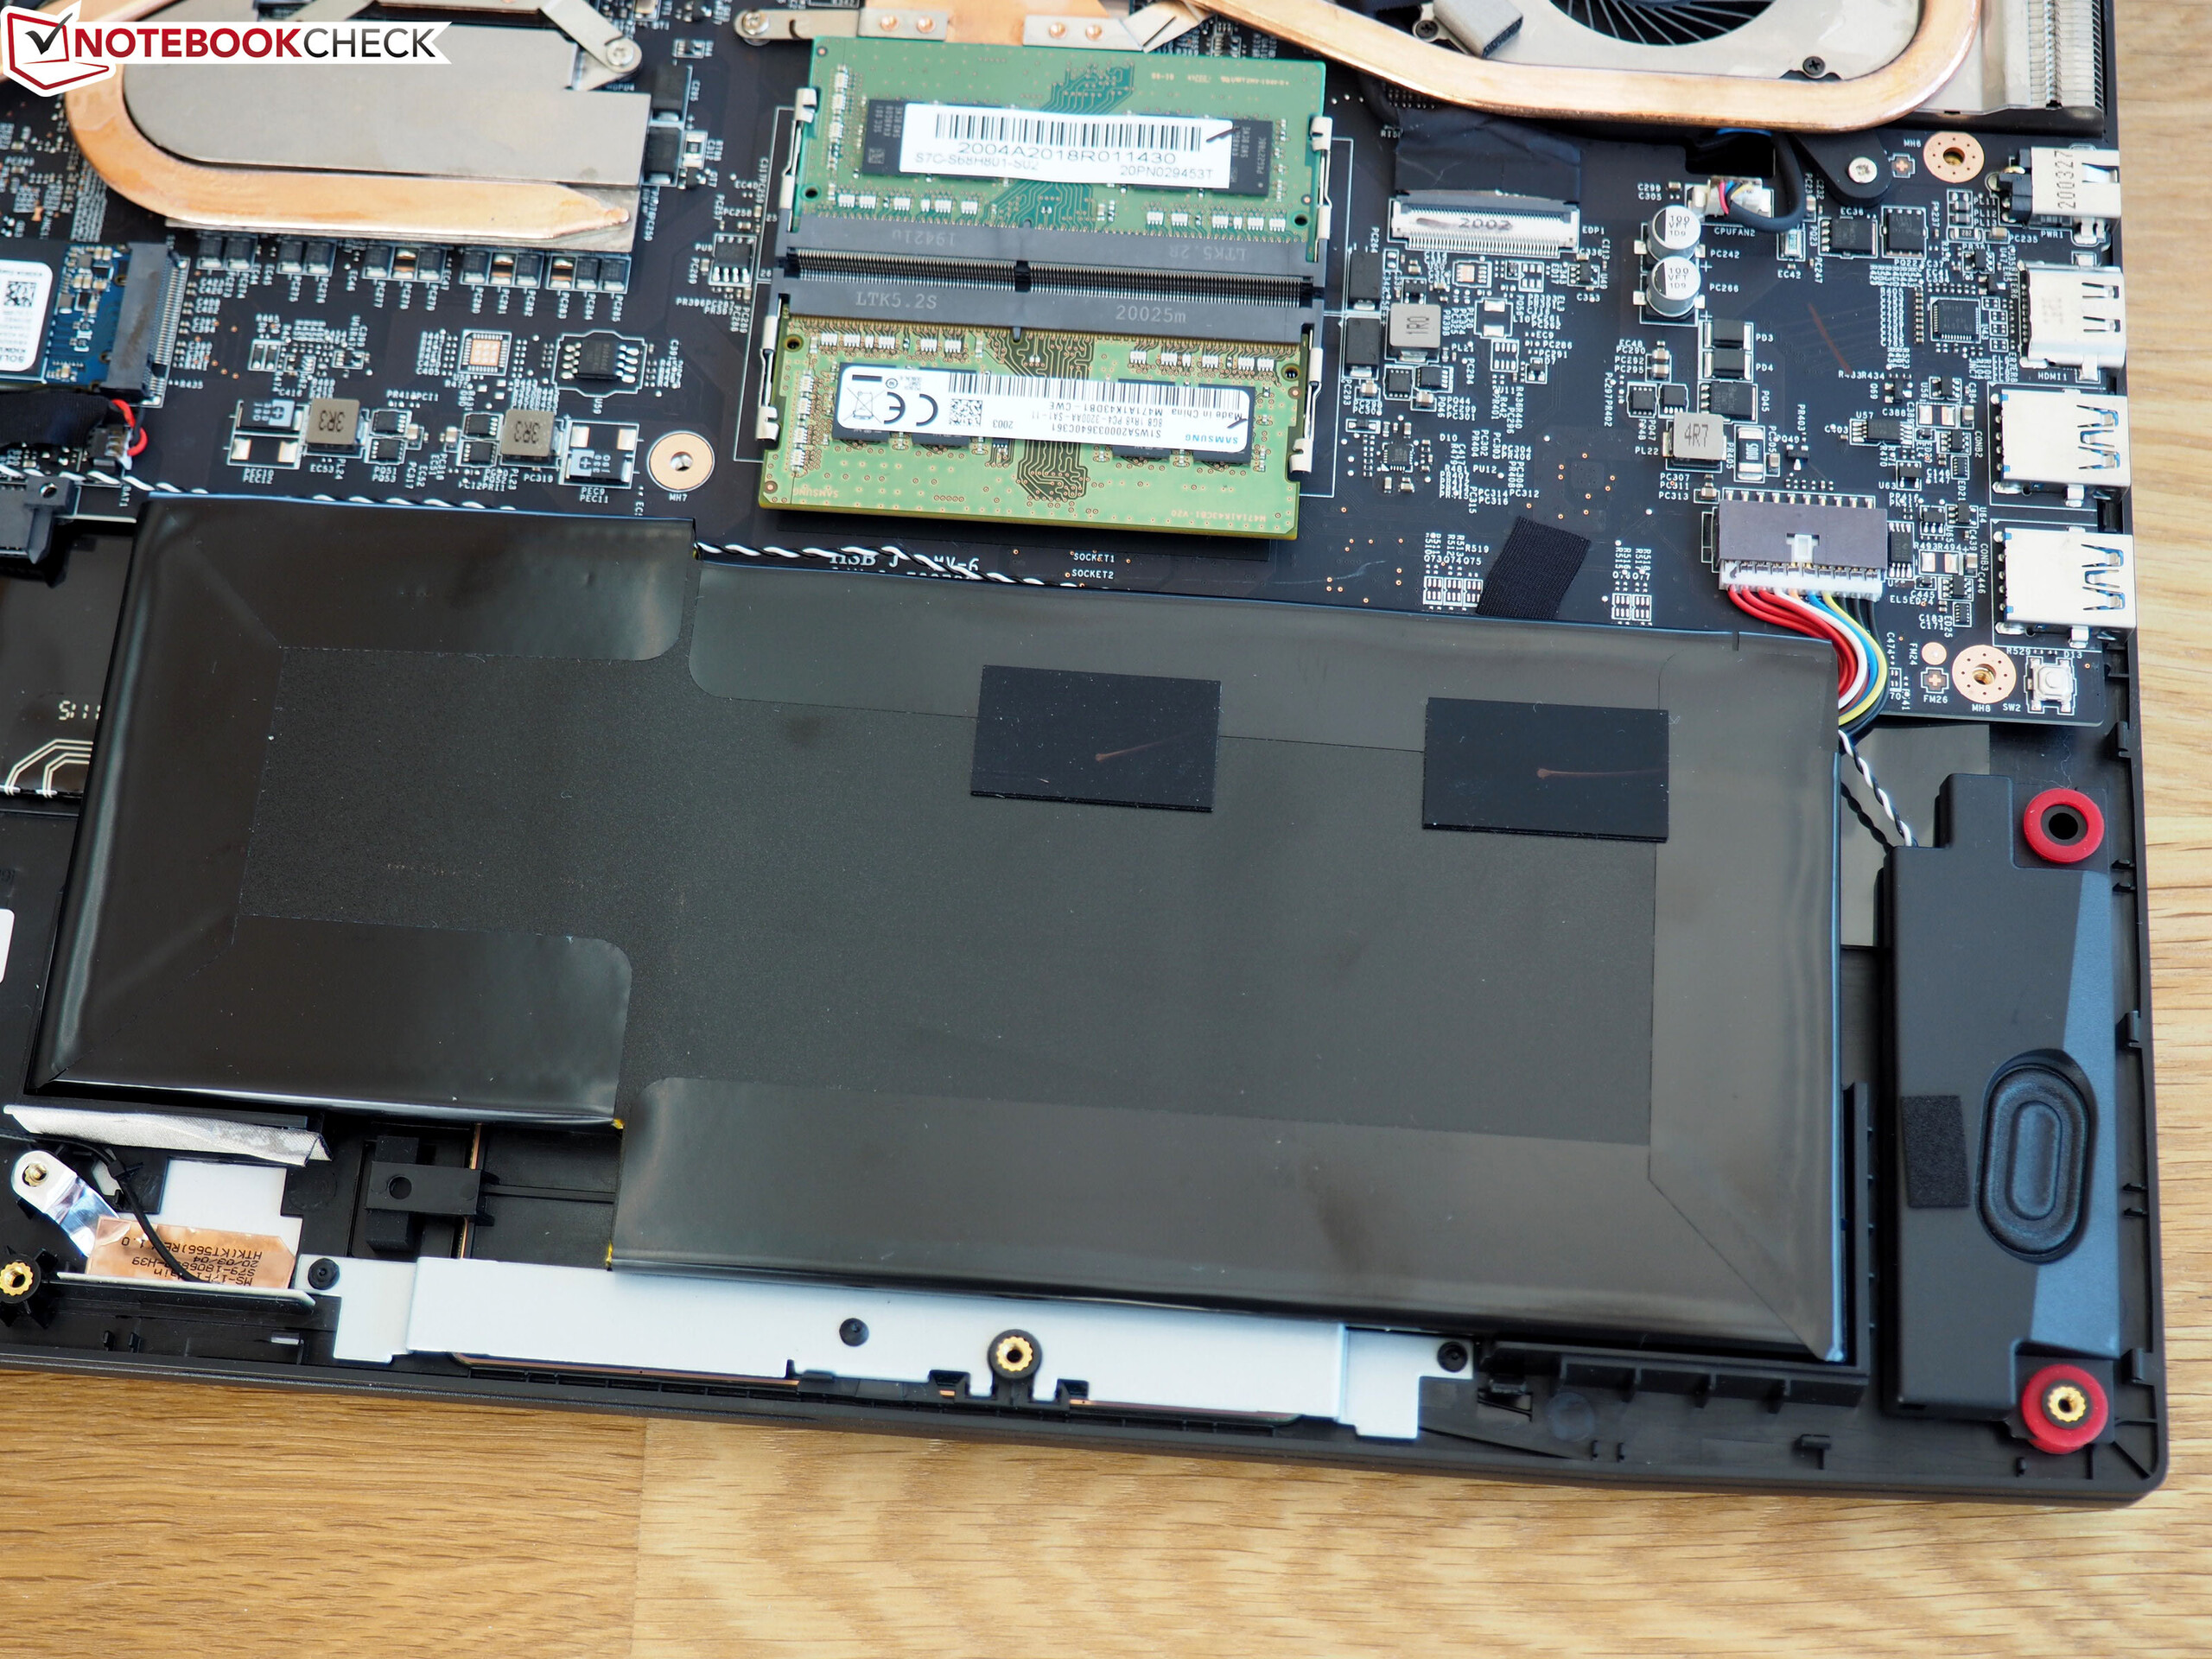
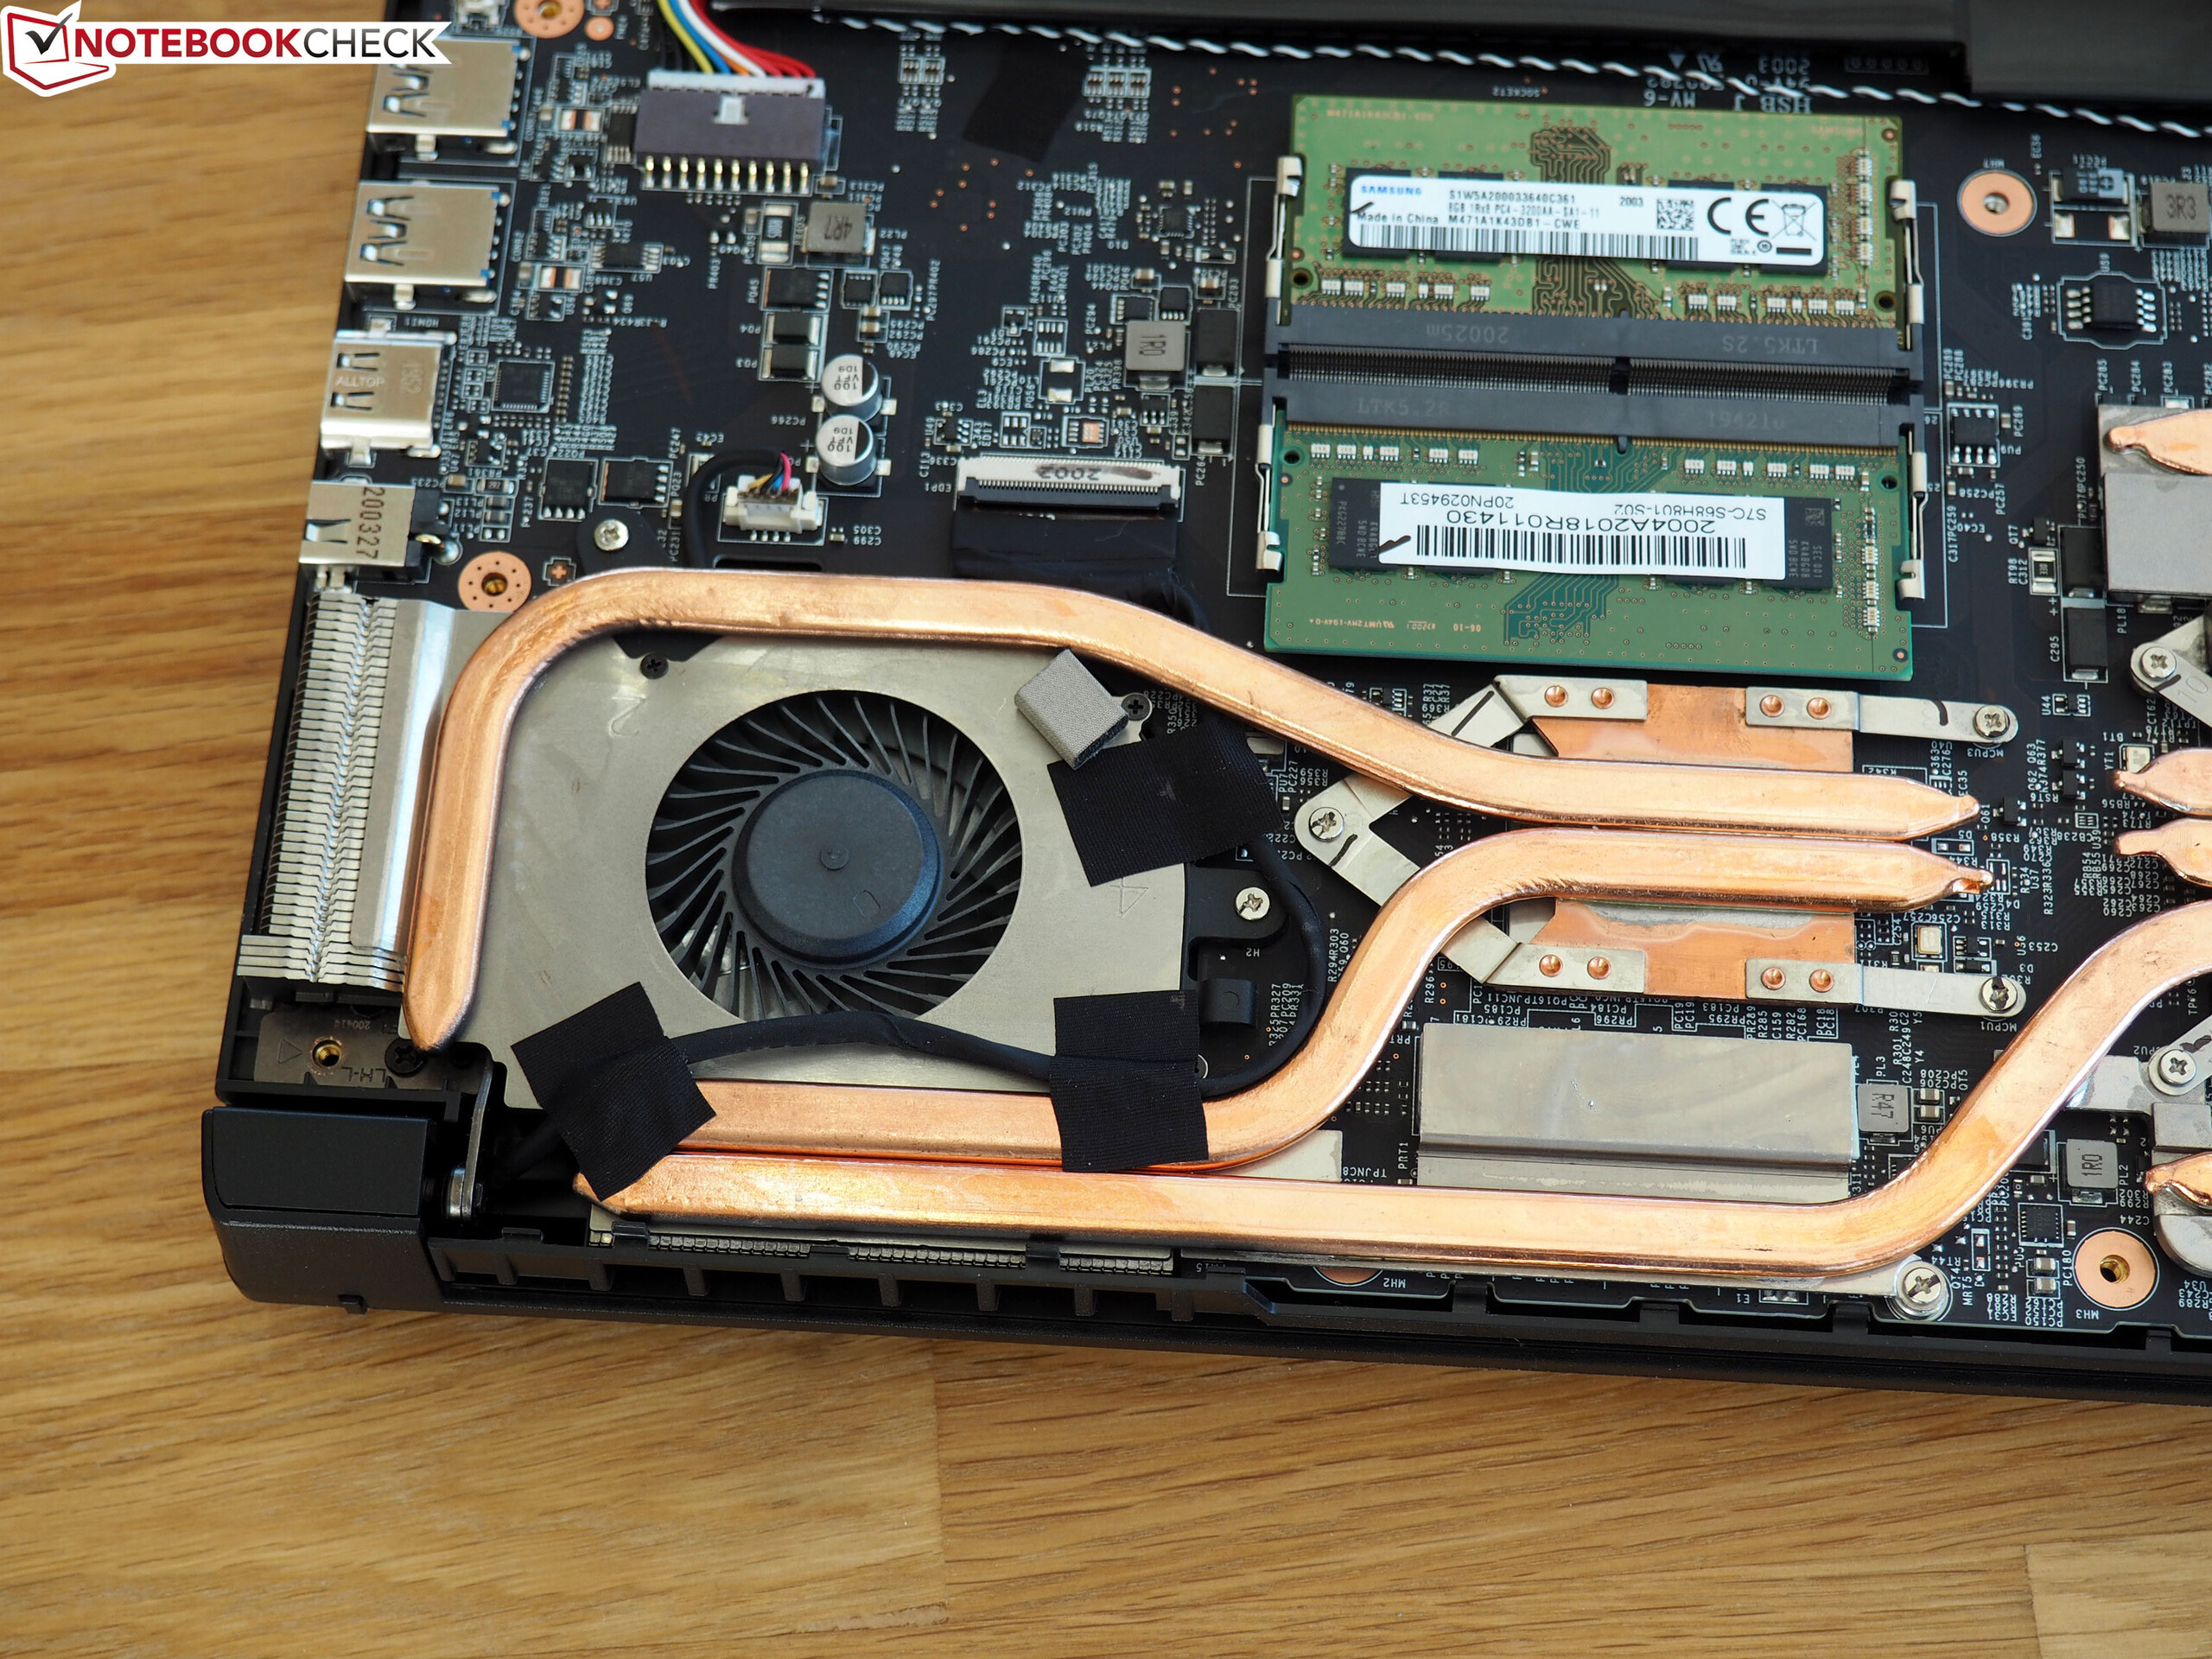
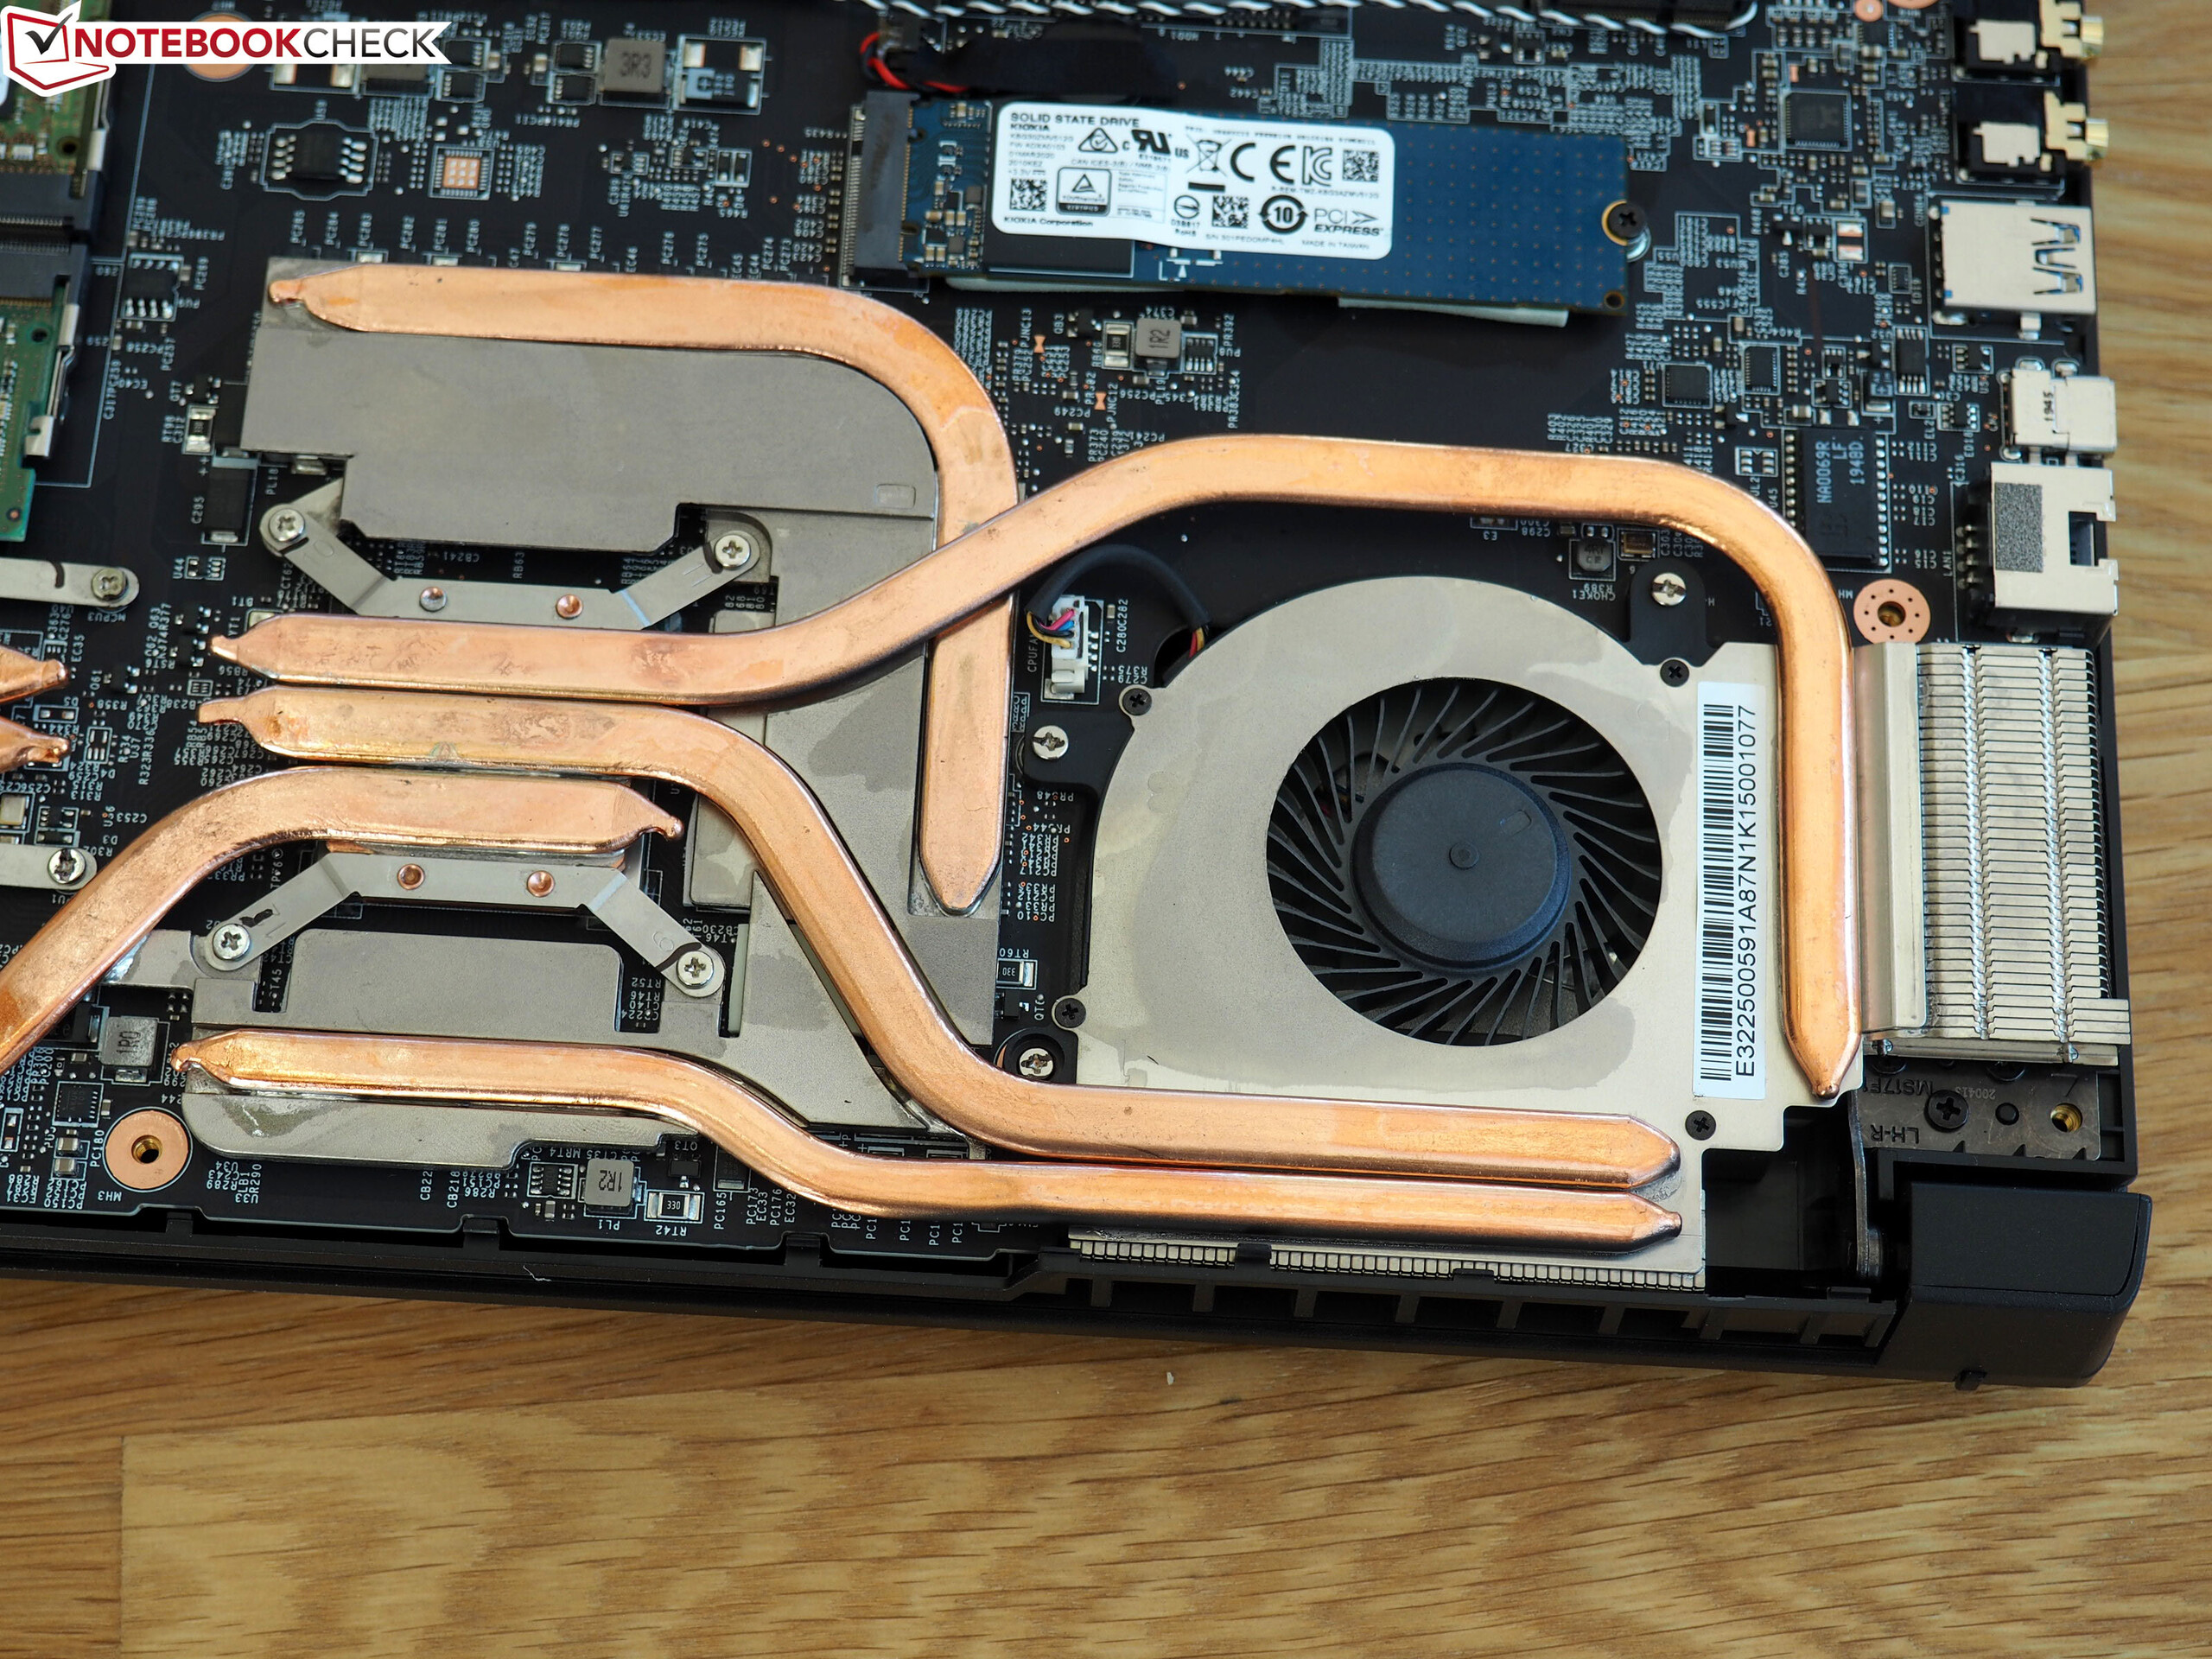
Bakım seçenekleri, bir oyun dizüstü bilgisayarı için tipiktir. 12 Philips vidayı kasanın altından çıkardıktan sonra, becerikli olmanız şartıyla tüm alt taraf sabitlemeden çıkarılabilir. Kasanın içinde pili ve Wi-Fi yongasını ve ayrıca iki RAM yuvası, bir M.2 yuvası ve (ücretsiz) 2,5 inç yuva bulacaksınız. Soğutma sistemi, CPU ve GPU'ya (her biri lehimlenmiş) doğru giden birkaç ısı borusu olan iki fandan oluşur.
Garanti
Garanti 24 ay geçerlidir. MSI, karşılama ve iade hizmetinden bahseder.
Giriş cihazları
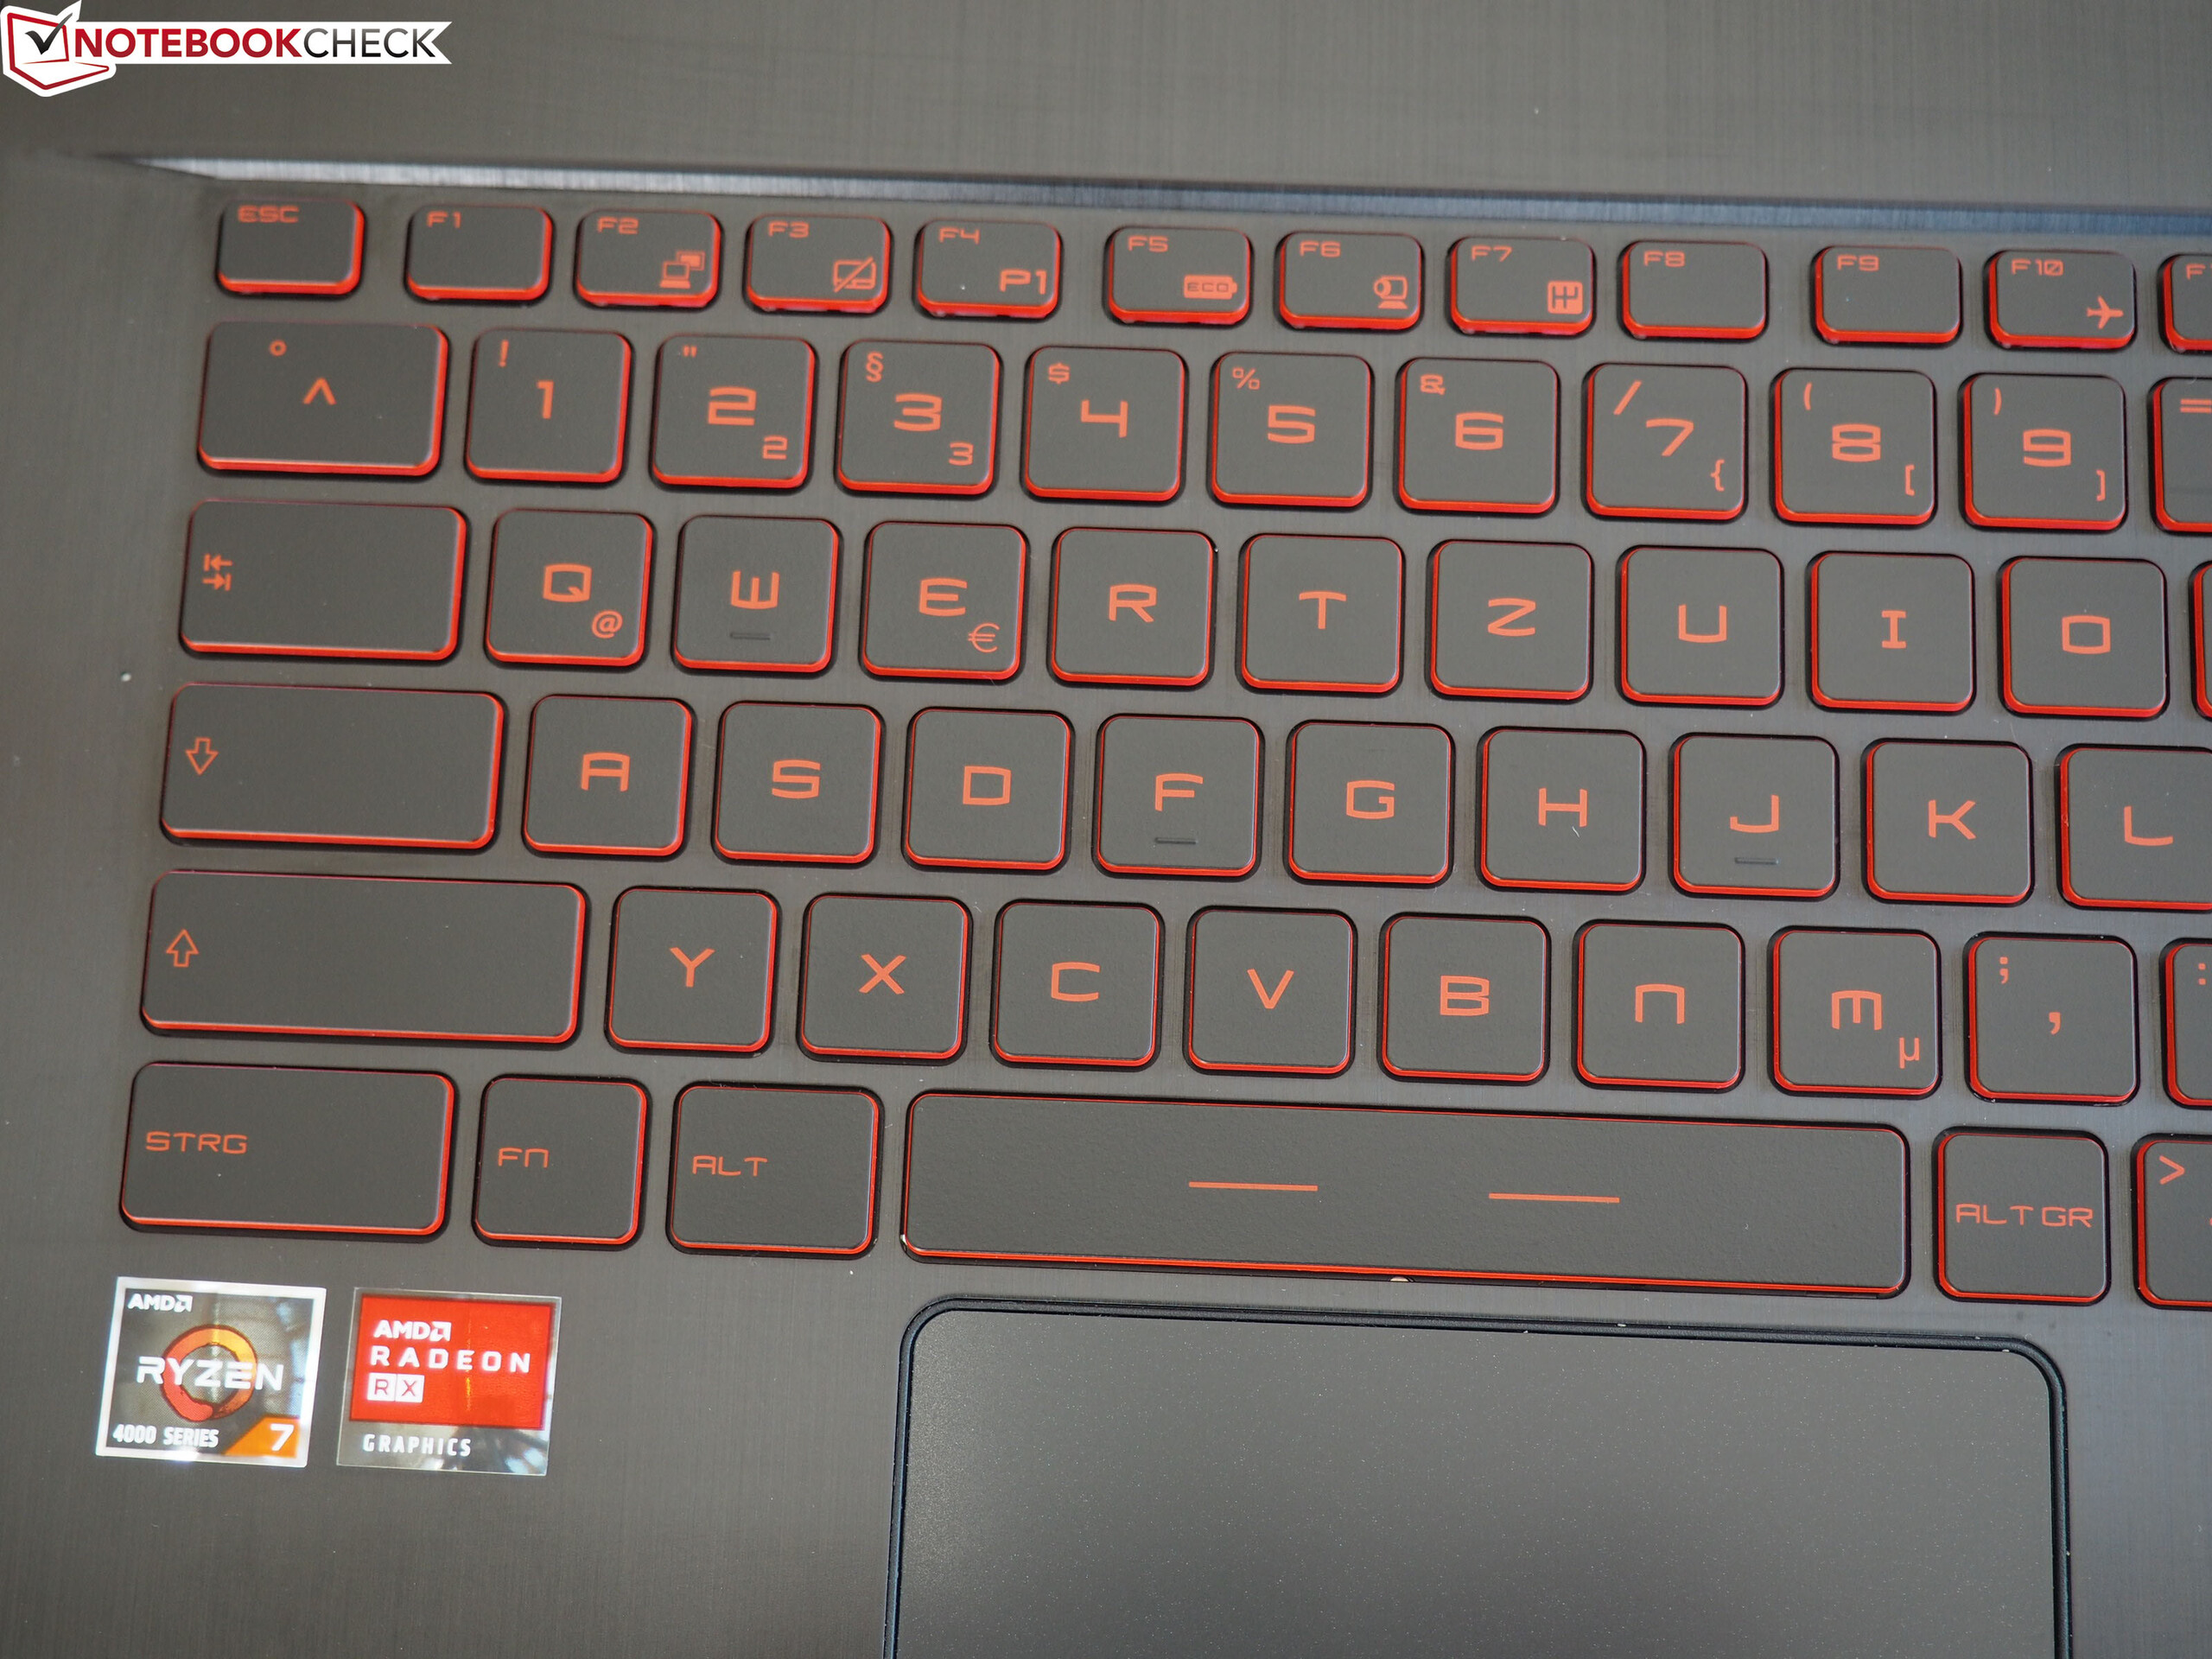
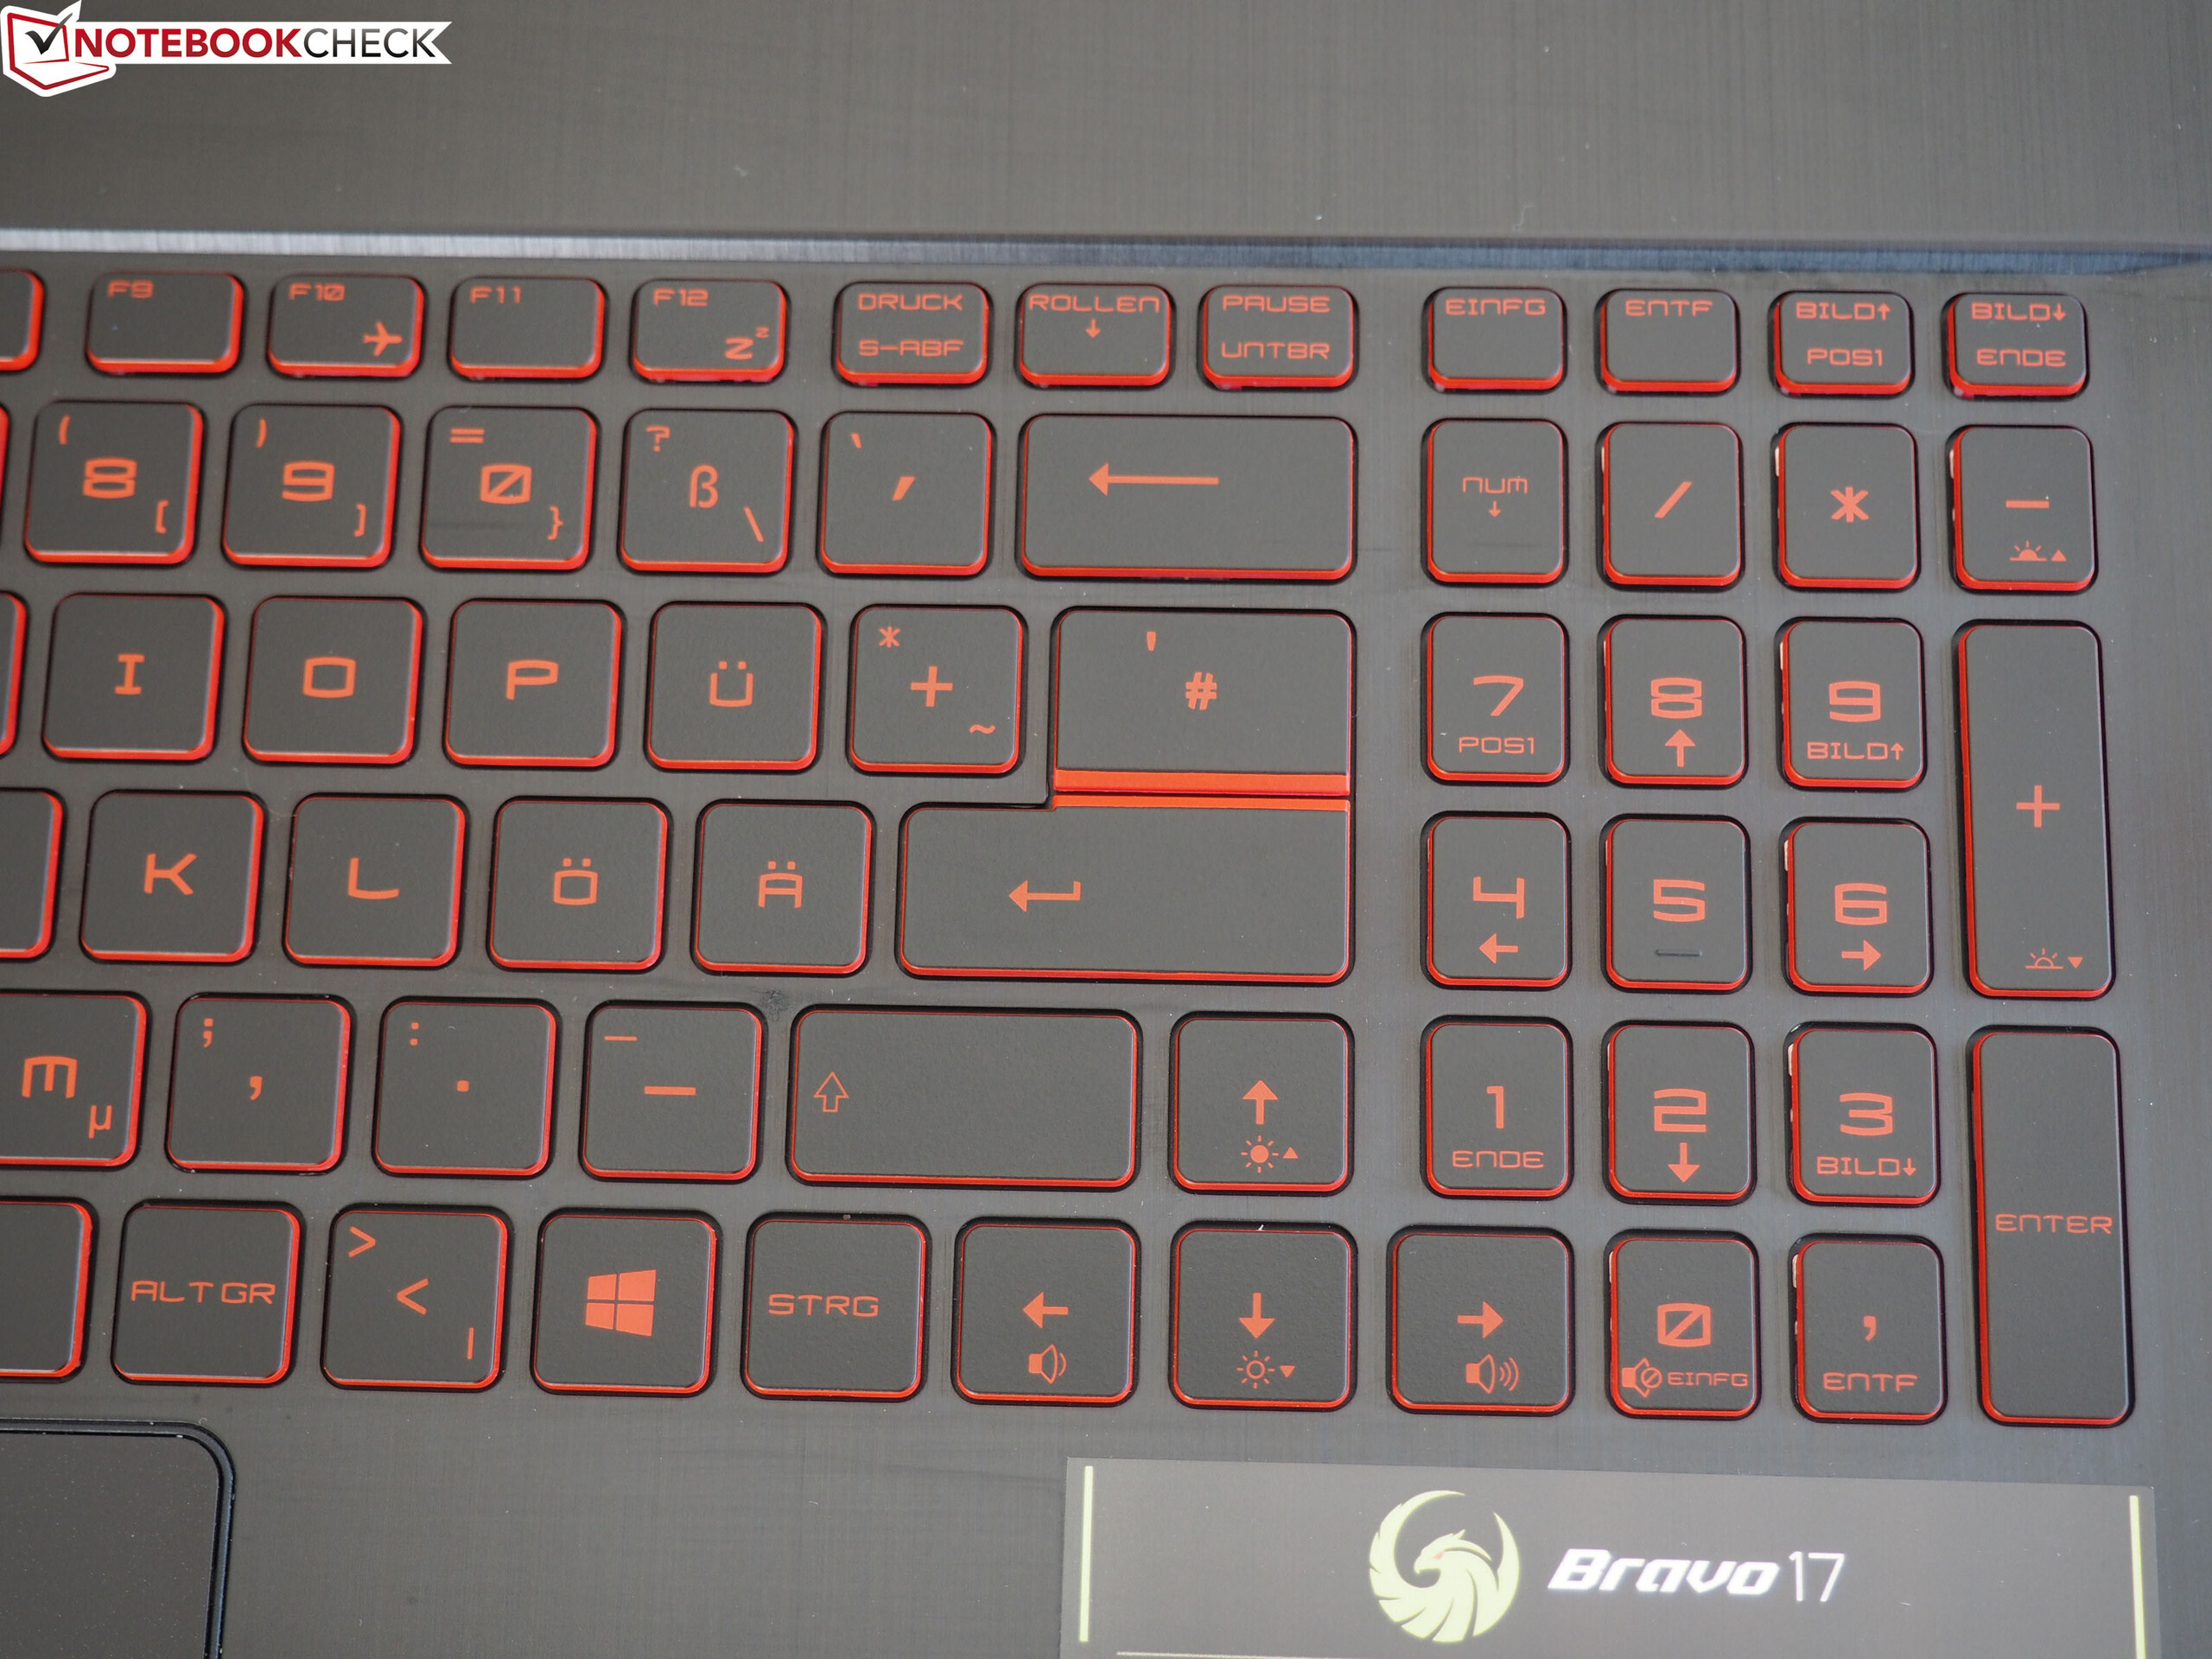
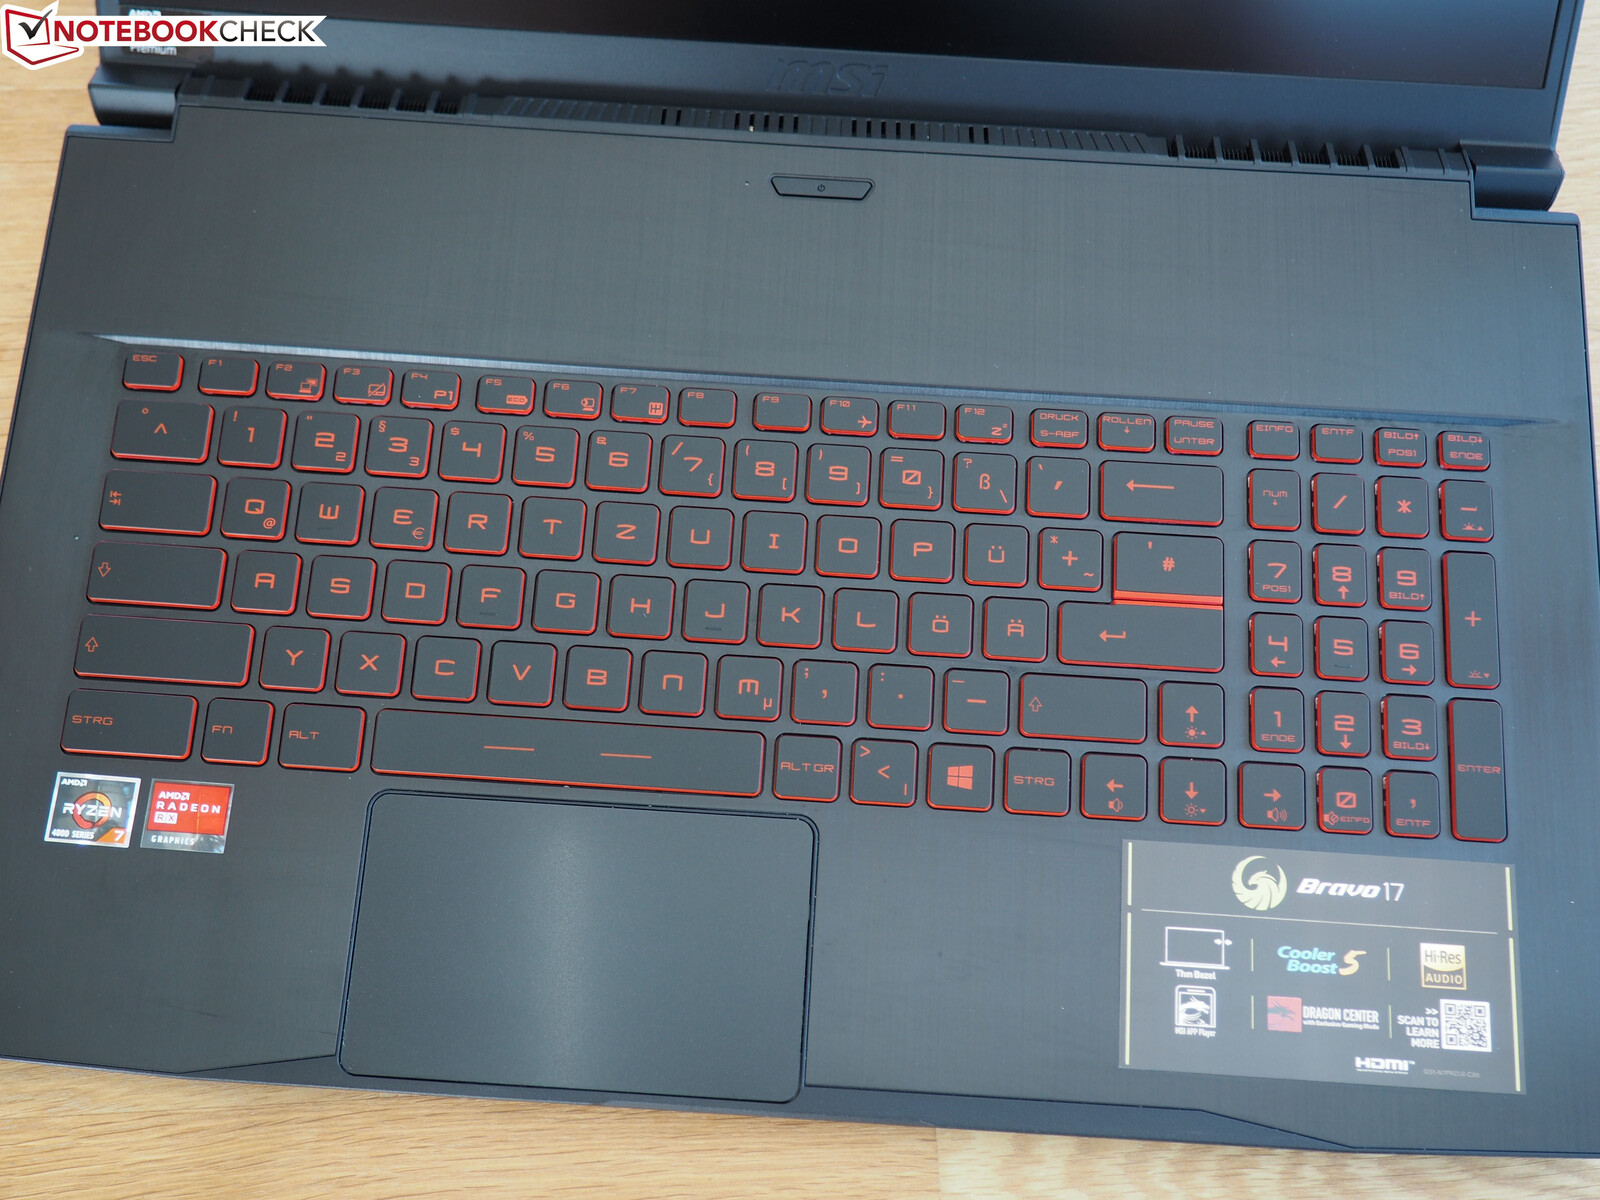
Keyboard
Although the keyboard model is already known from other MSI laptops, the layout requires a certain amount of getting used to. In addition to the <>| key, the # key is also in an unusual position on the German version, which can lead to incorrect entries at the beginning. Additionally, there is a single-line Enter key, which is also suboptimal. The fact that the arrow keys extend into the (rather narrow) number pad and the main field, on the other hand, is seen often.
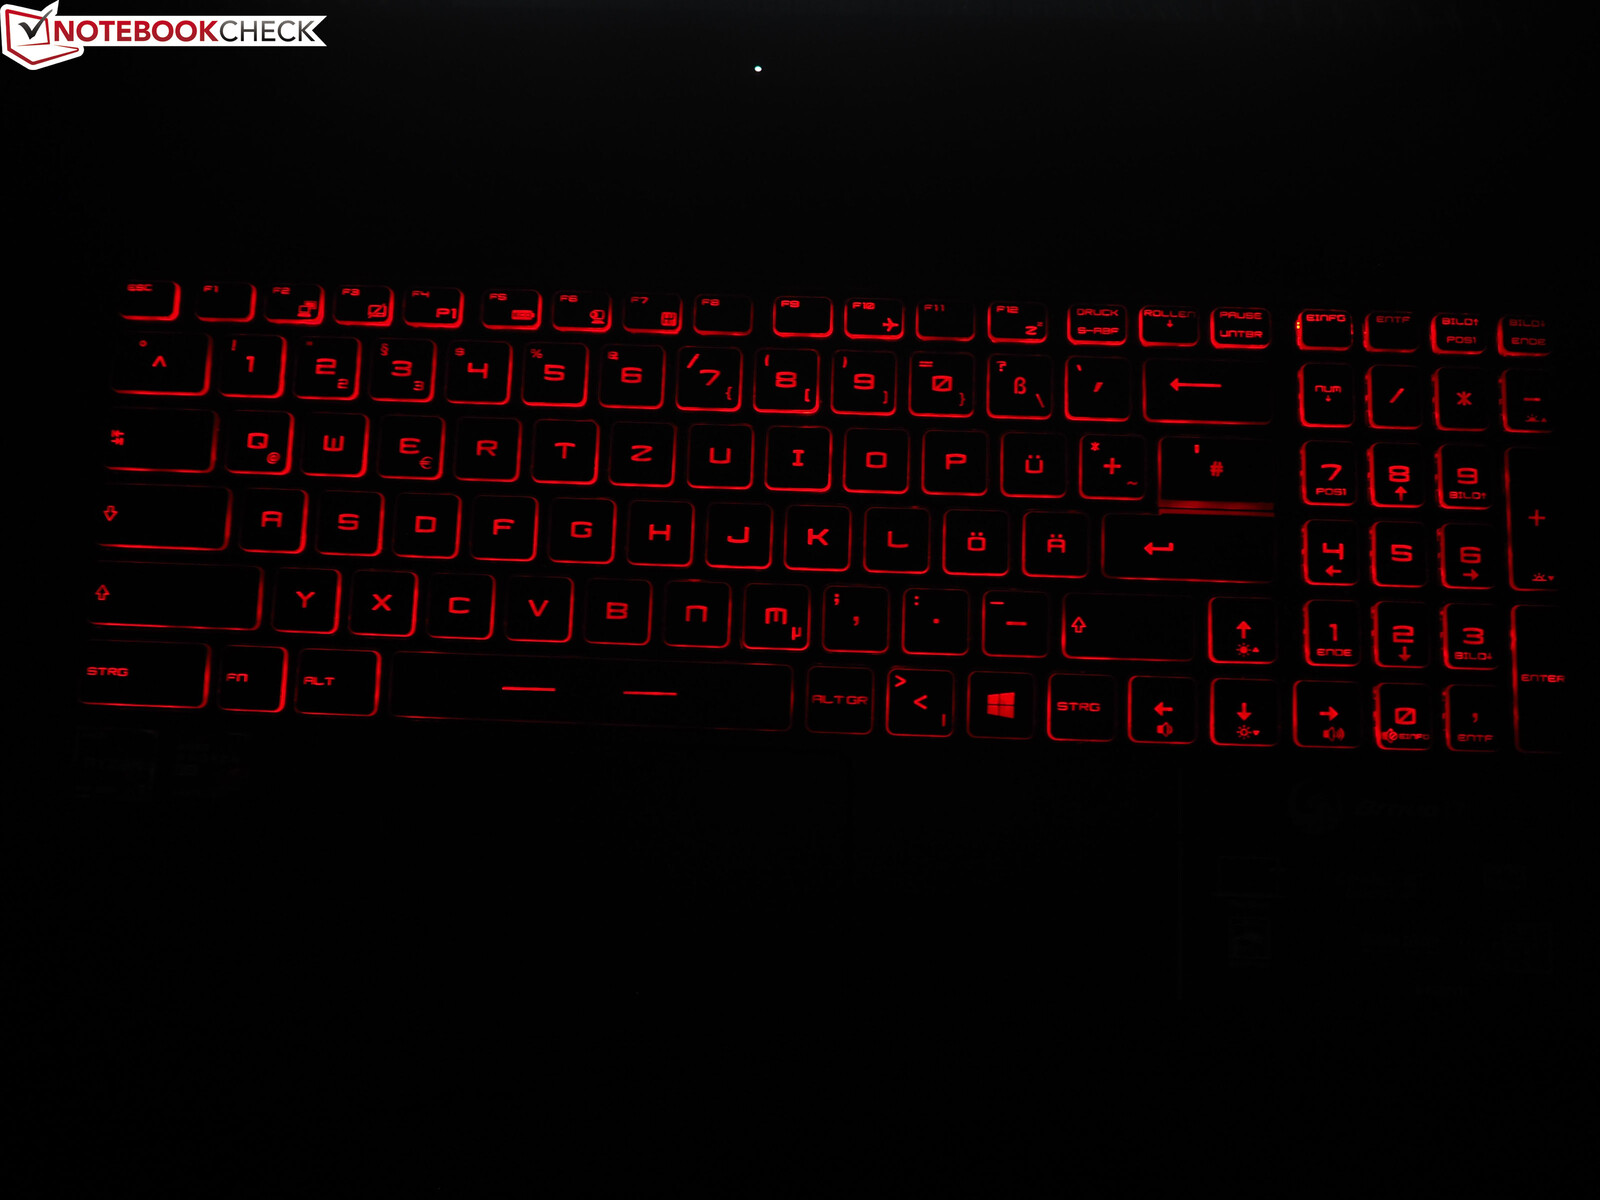
By the way, MSI forgoes RGB lighting to reduce costs a bit. The keyboard is illuminated in red to match the red labeling. We would describe the typing experience as ranging from decent to good. It feels neither particularly mushy nor particularly hard. The keyboard's positioning, in particular, is a point of criticism for MSI. Because it's placed very low, the palm rest only reaches a height of 7.5 cm. Unless you have tiny hands, your palms always lie unpleasantly on the edge or slide downwards off the case completely - an unnecessary design flaw.
Dokunmatik
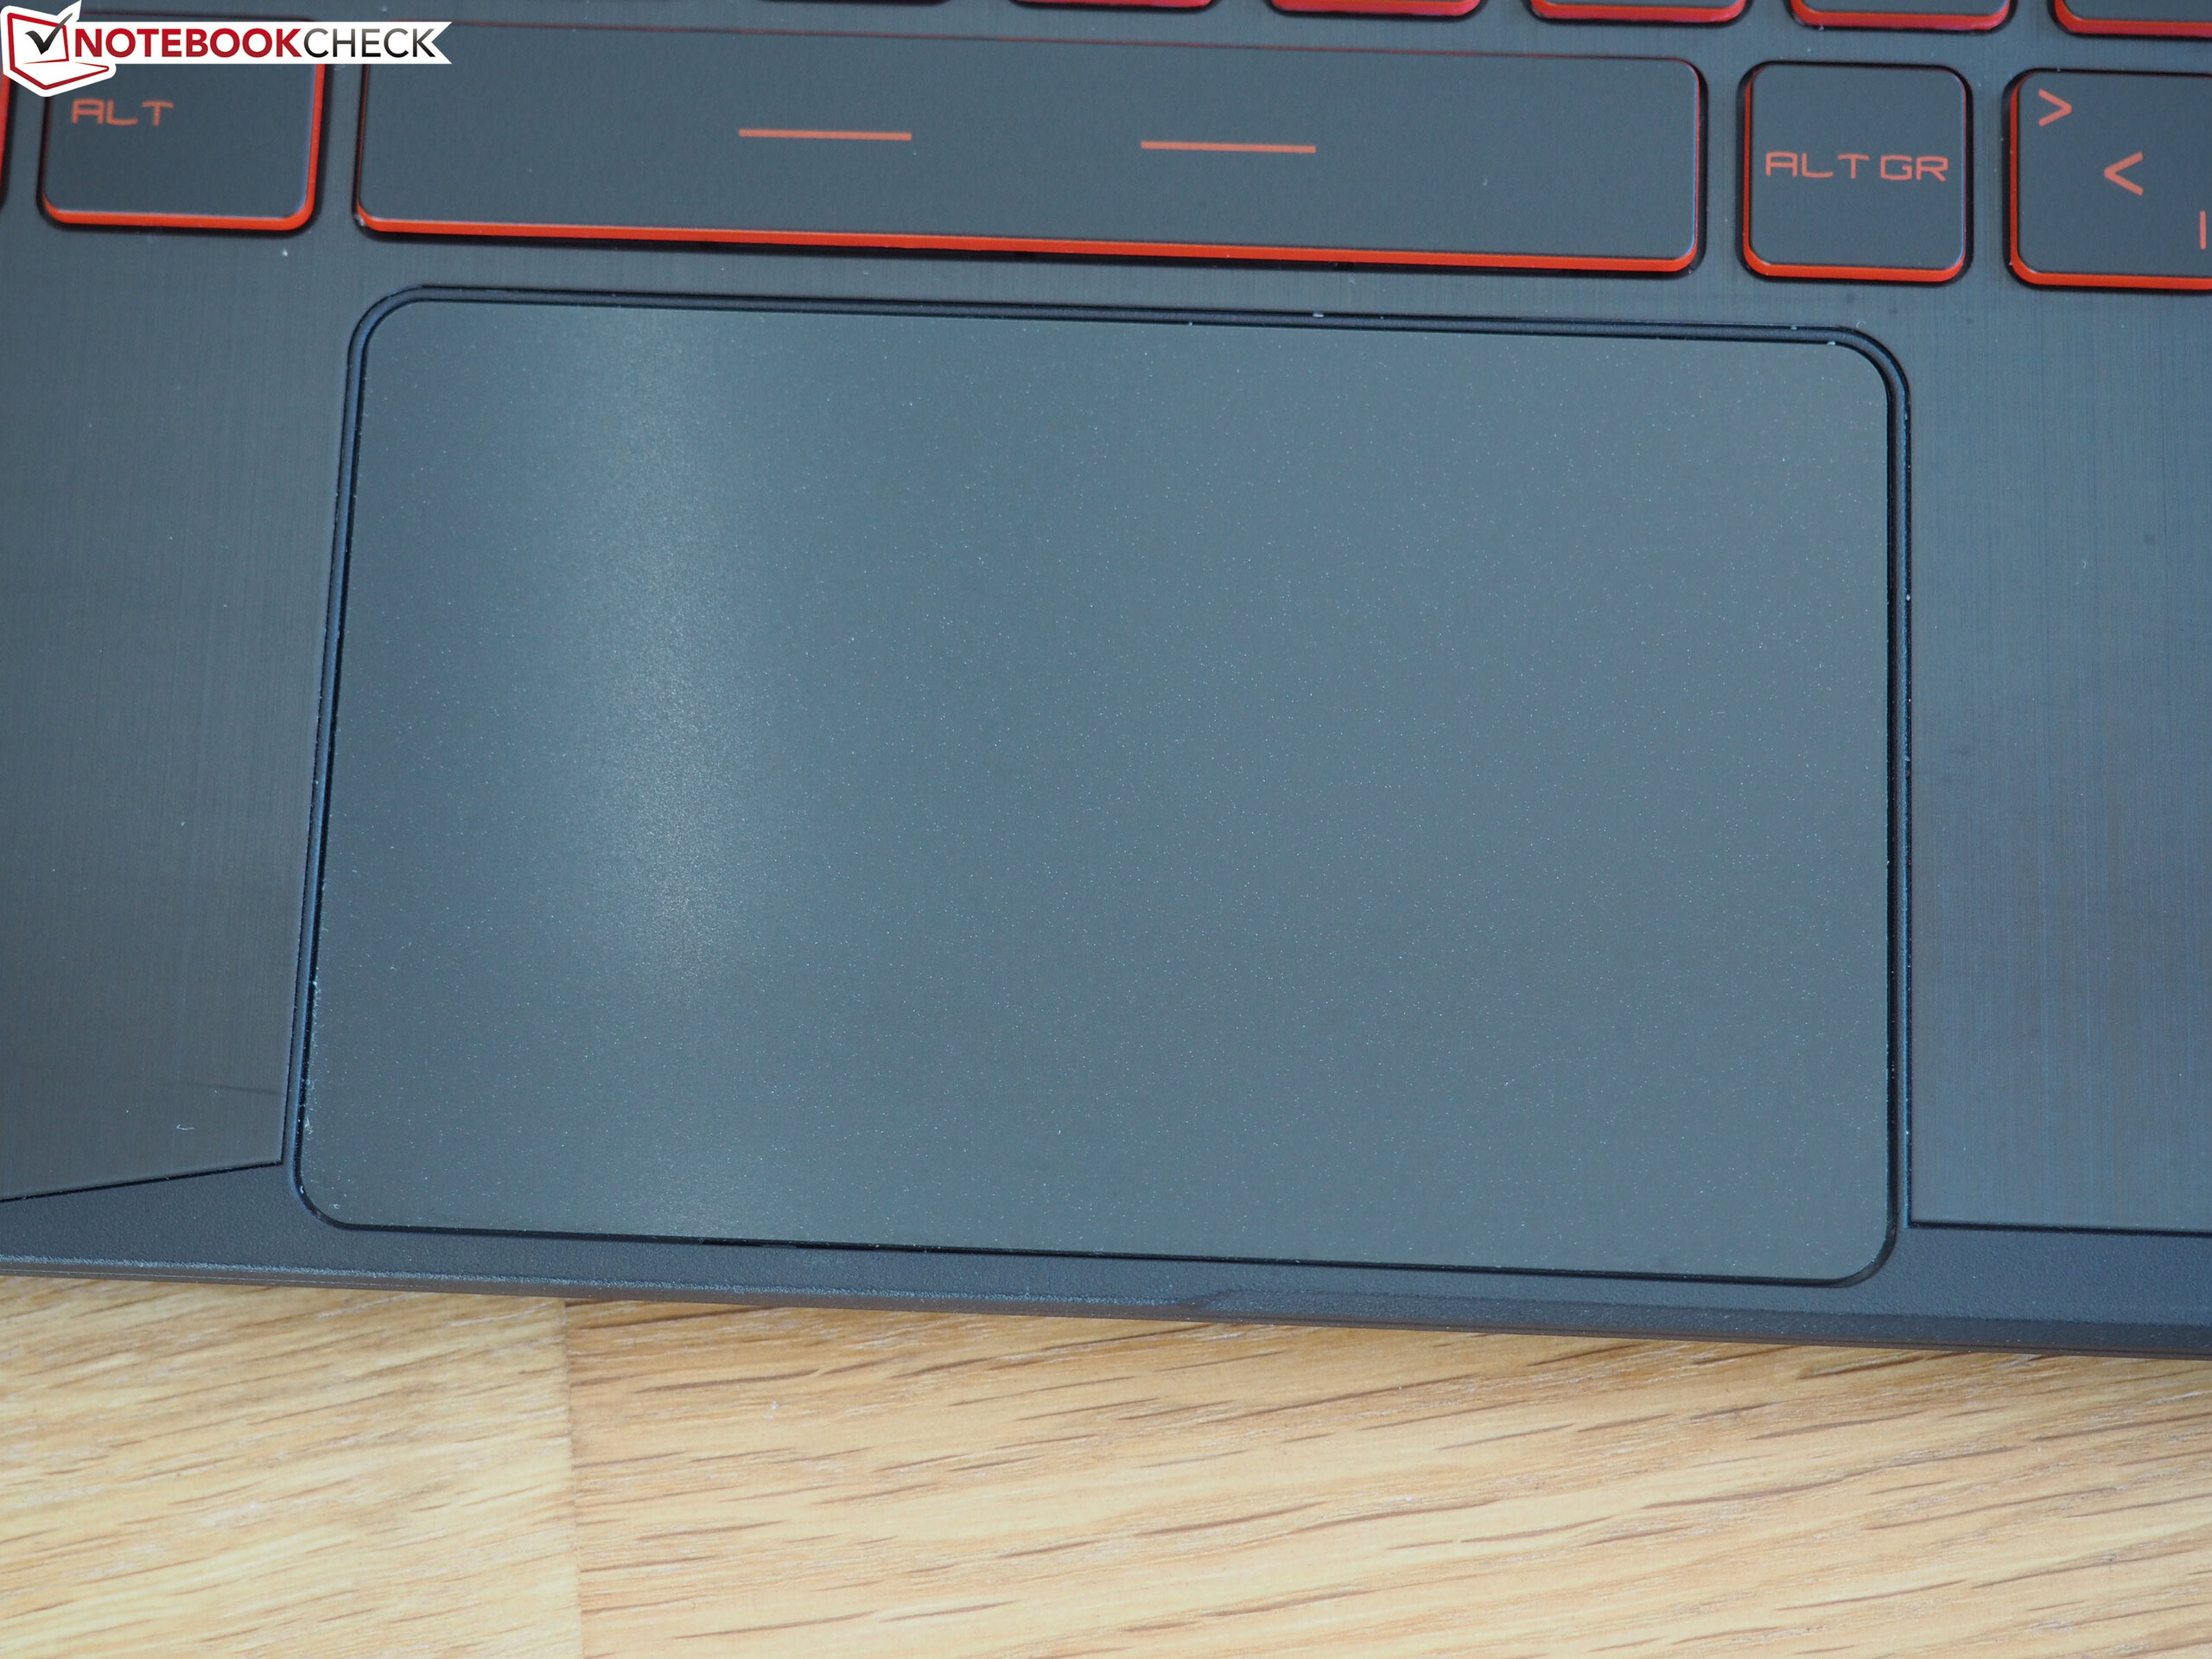
Dokunmatik yüzey çok etkileyici. Pürüzsüz yüzey sayesinde parmaklar yüzey üzerinde oldukça iyi kayar. Hassasiyet de fena değil. Aynı şey çoklu dokunma desteği için de geçerlidir. Belgeler, web siteleri vb. İki parmağınızla yakınlaştırılabilir ve stressiz olarak kaydırılabilir. Hareket tanıma çoğunlukla güvenilir bir şekilde çalışır. Dokunmatik yüzeyde özel tuşlar olmadığından, ana alana basılarak sol ve sağ tıklamalar tetiklenir. Tetikleyici gürültü - klavyenin aksine - nispeten yüksek ve çıngırak geliyor. Bununla birlikte, fare değişiminin temel stabilitesinden şikayet edecek hiçbir şey yoktur.
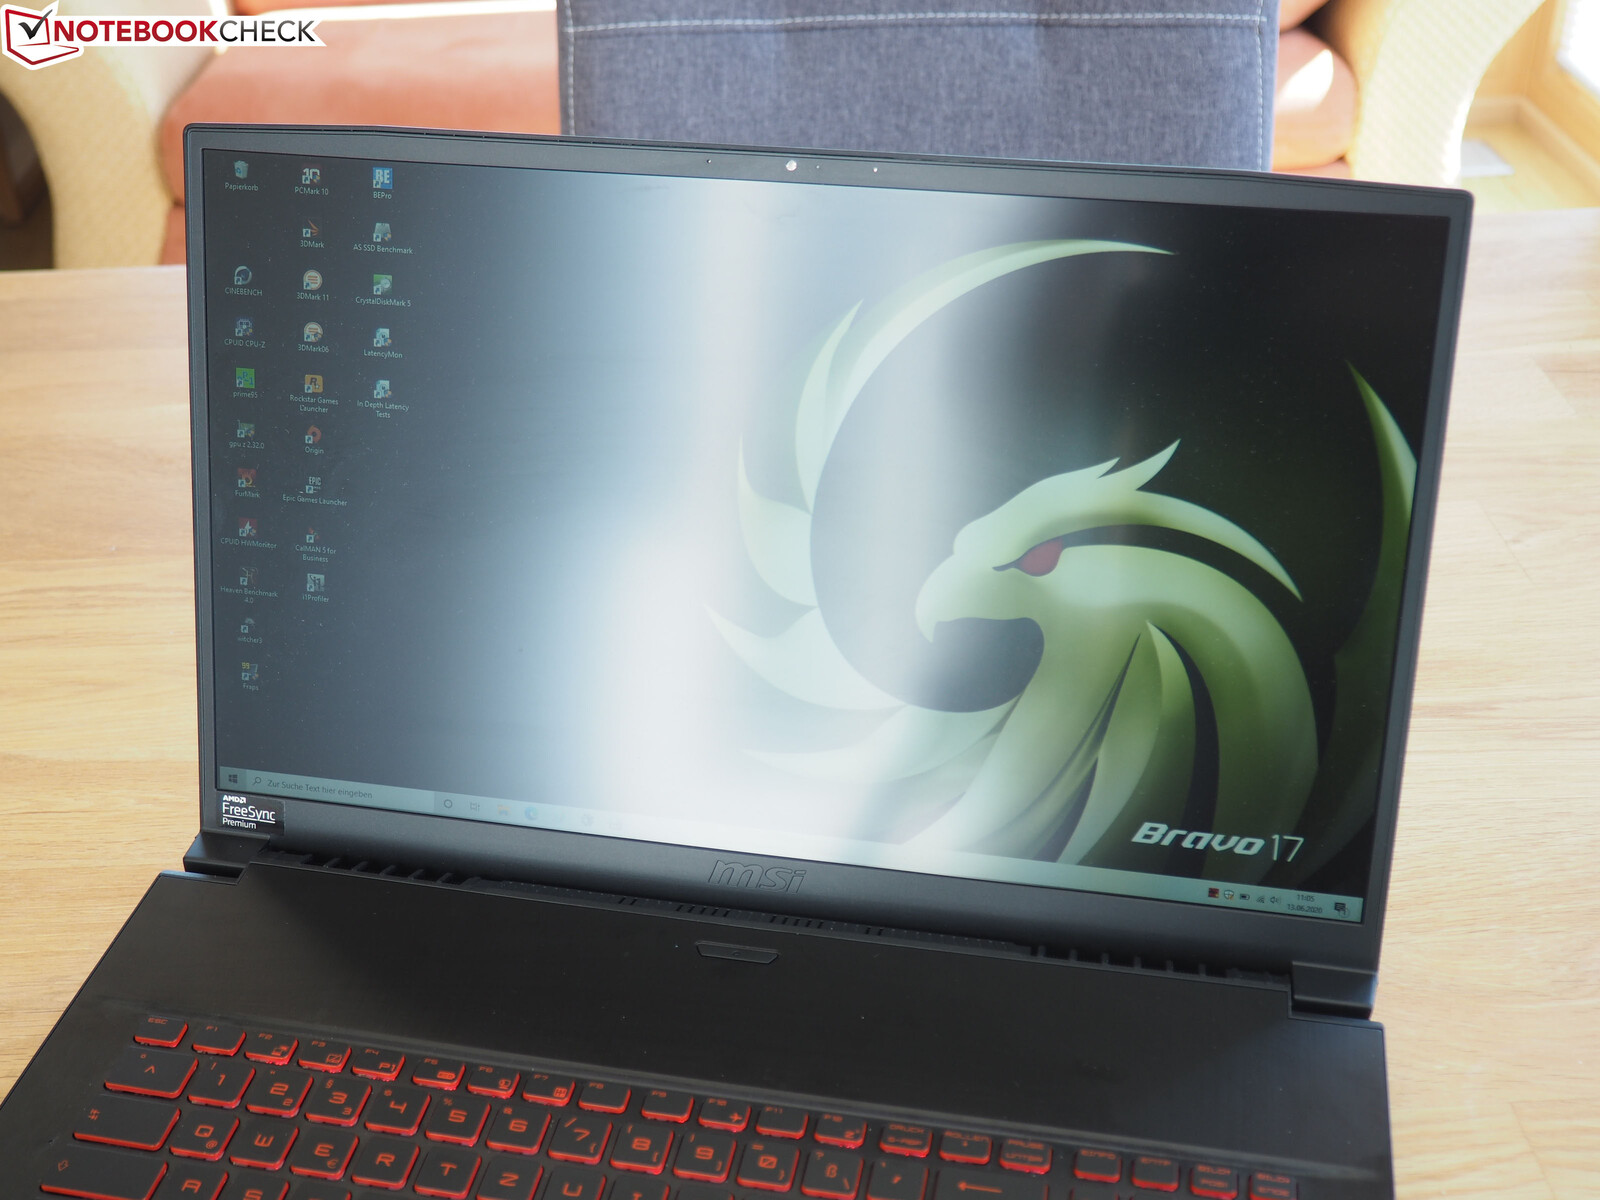
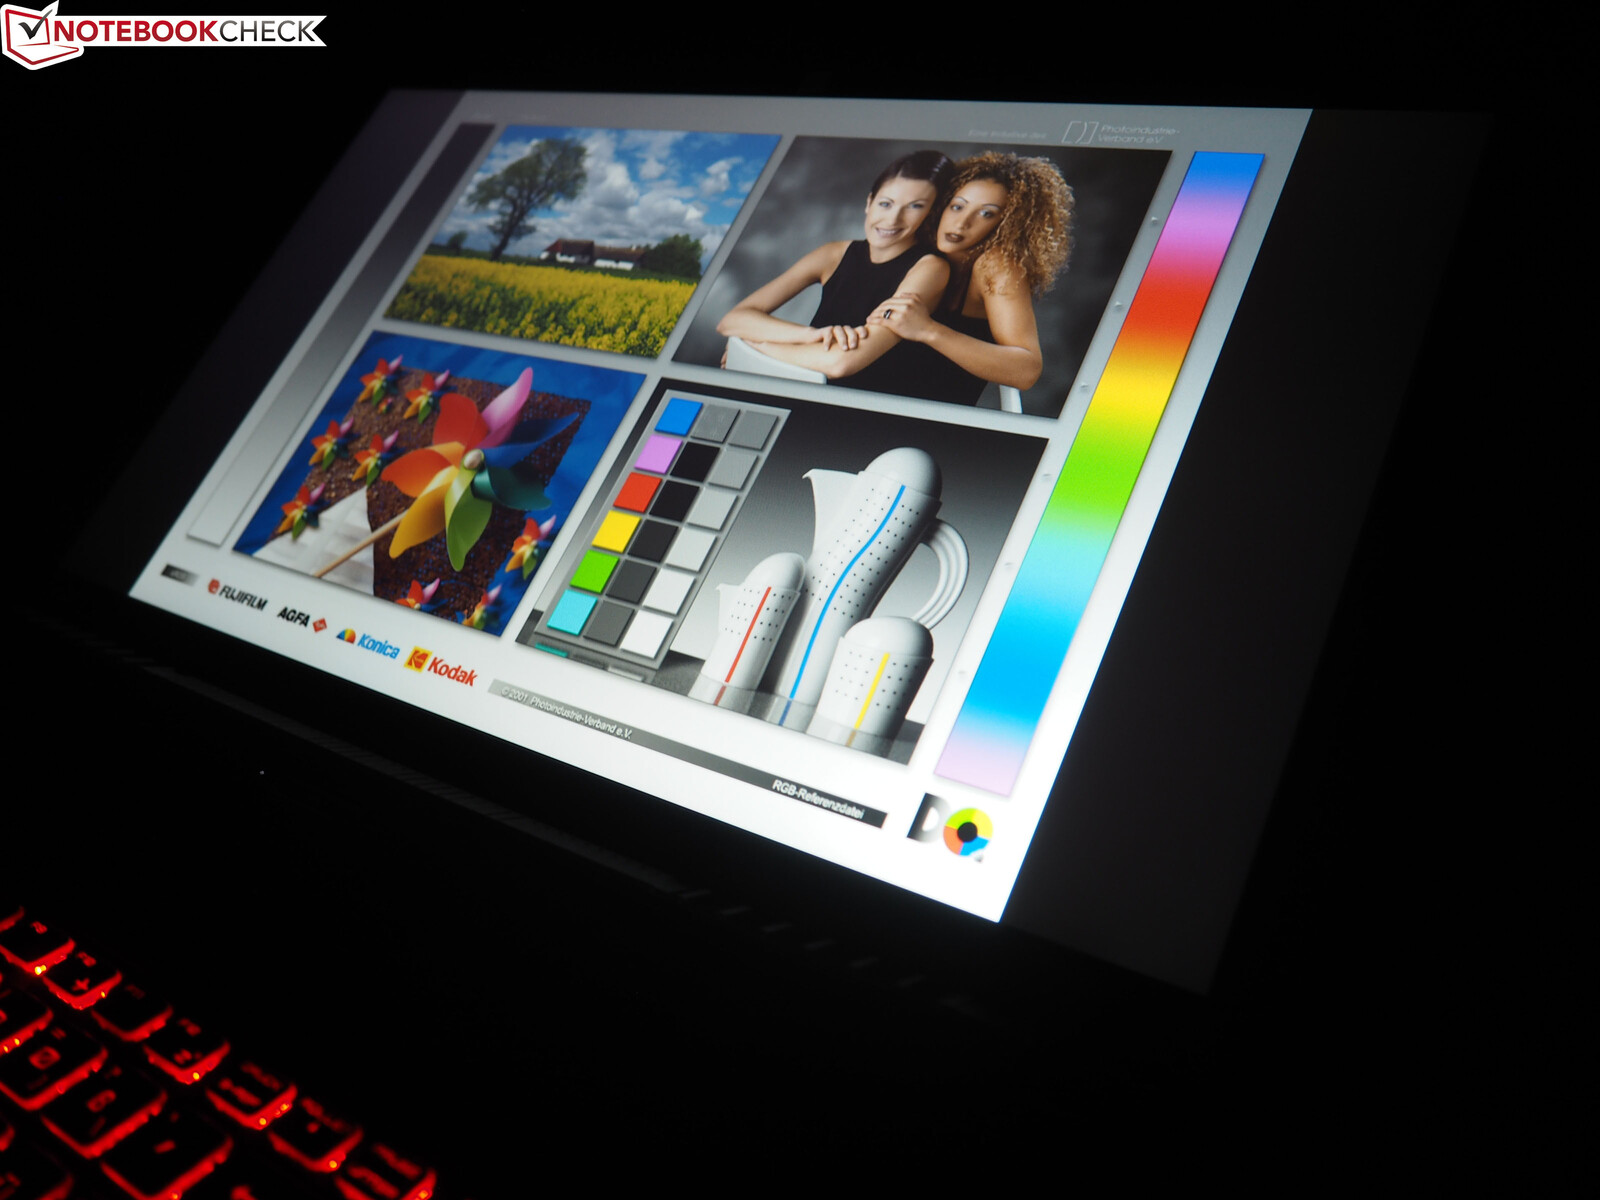
Görüntüle
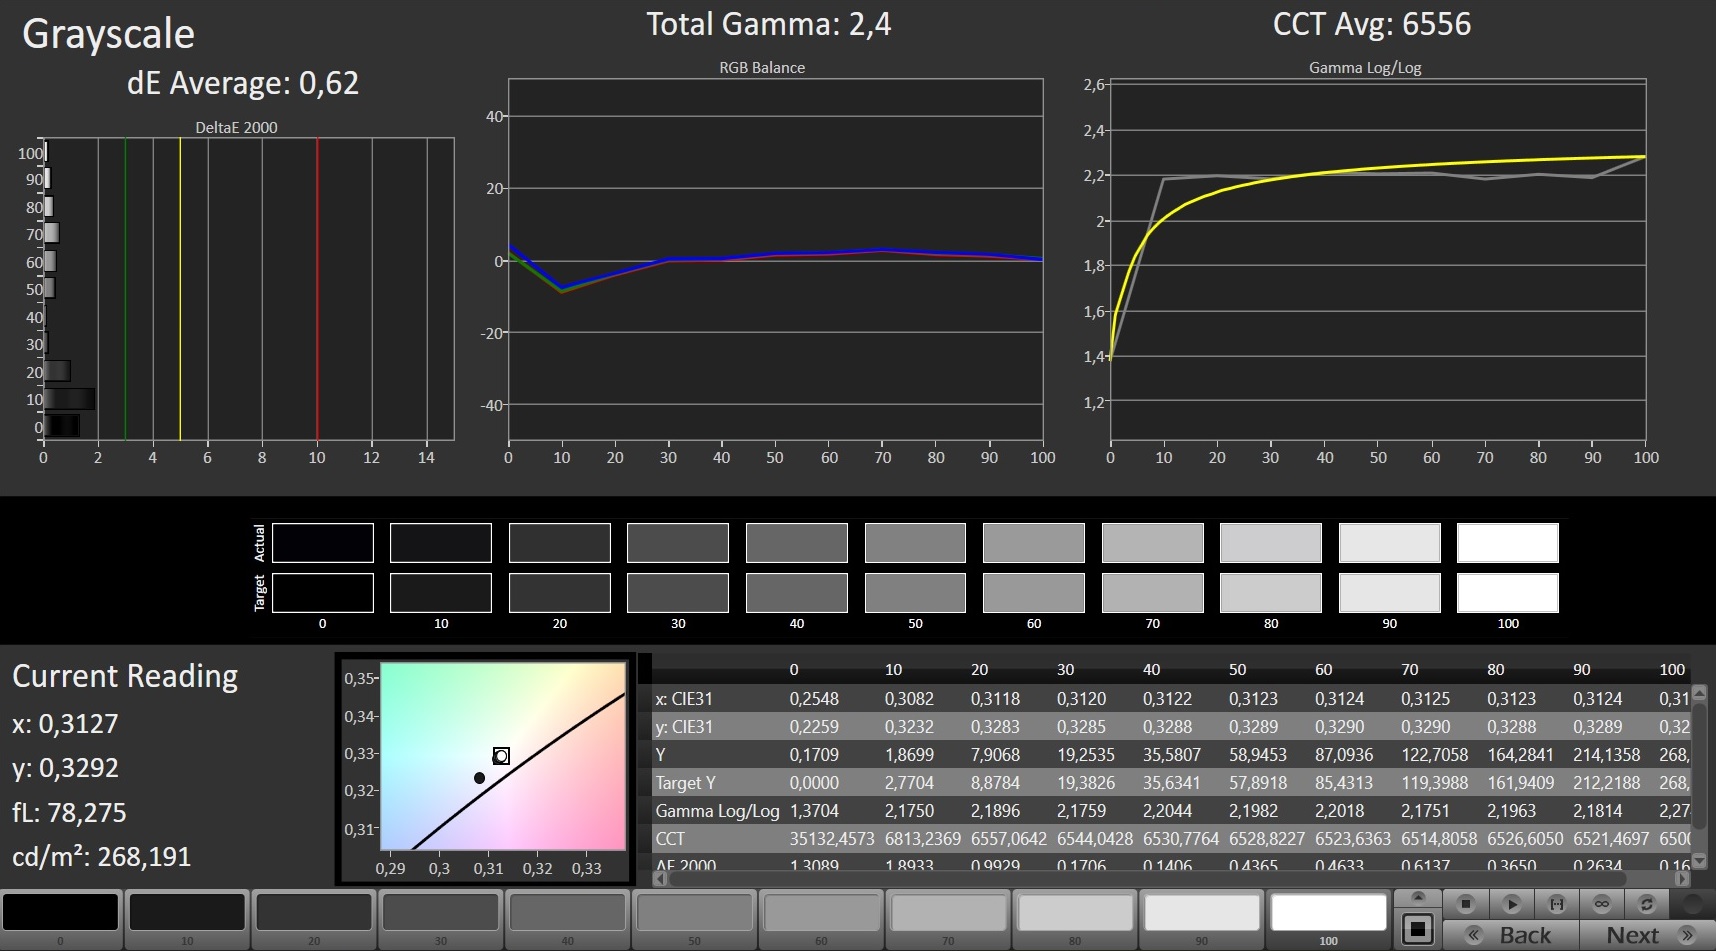
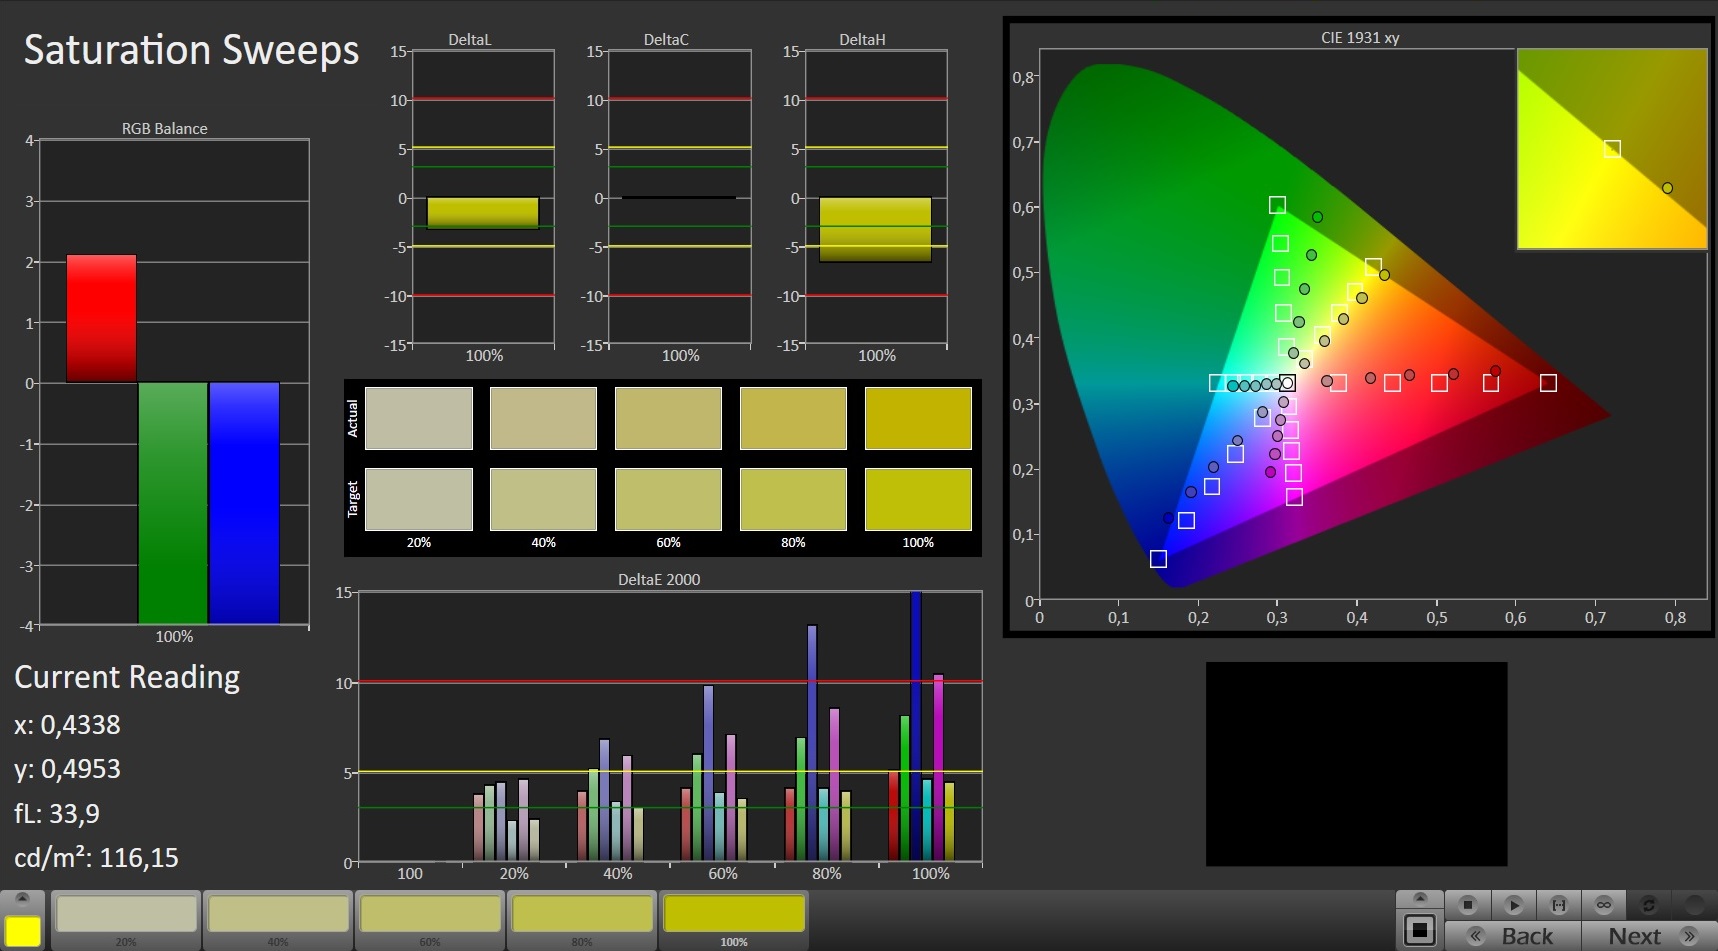
17 inç ekran karışık sonuçlar verir. Olumlu yönlerle başlayalım. 0.23 cd / m²'lik düşük siyah değeri nedeniyle, Bravo 17 ikna edici bir kontrast sunabilir. 1.150: 1'in hemen altında çoğu alıcıyı tatmin etmelidir.
| |||||||||||||||||||||||||
Aydınlatma: 88 %
Batarya modunda parlaklık: 264 cd/m²
Kontrast: 1148:1 (Siyah: 0.23 cd/m²)
ΔE ColorChecker Calman: 3.85 | ∀{0.5-29.43 Ø4.71}
calibrated: 3.4
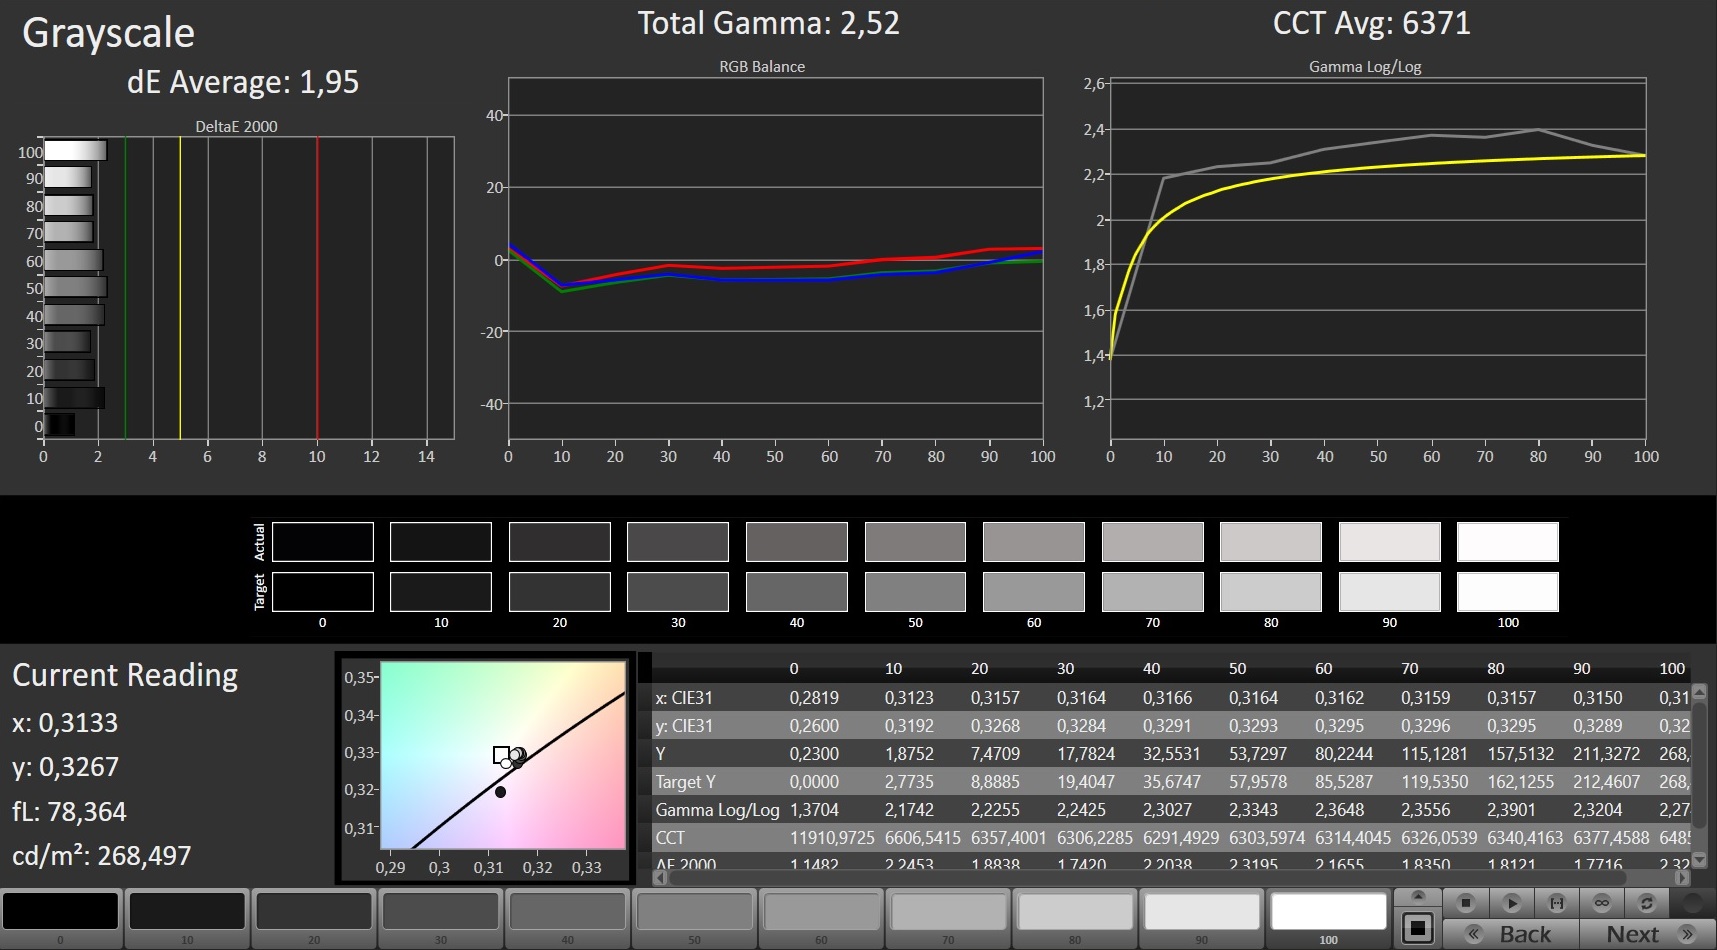
ΔE Greyscale Calman: 1.95 | ∀{0.09-98 Ø4.96}
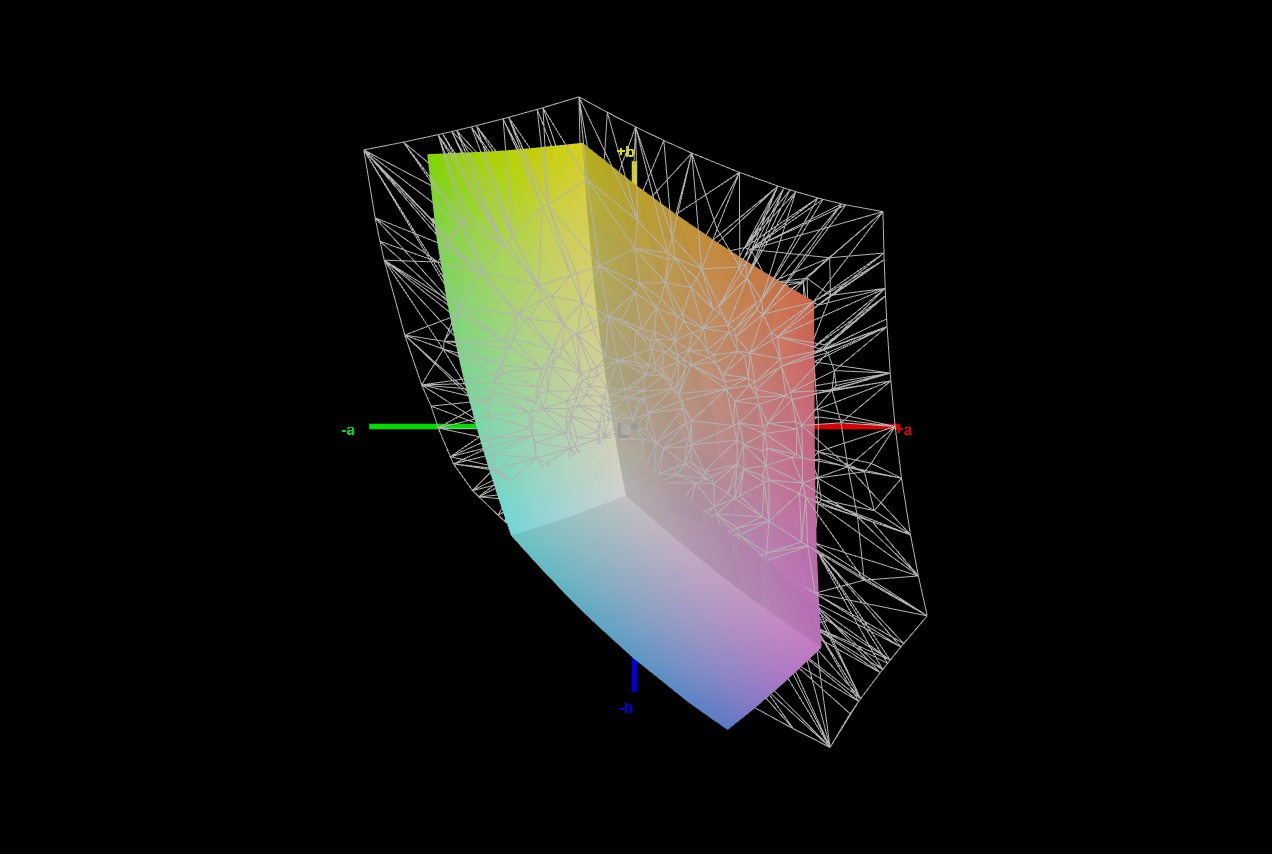
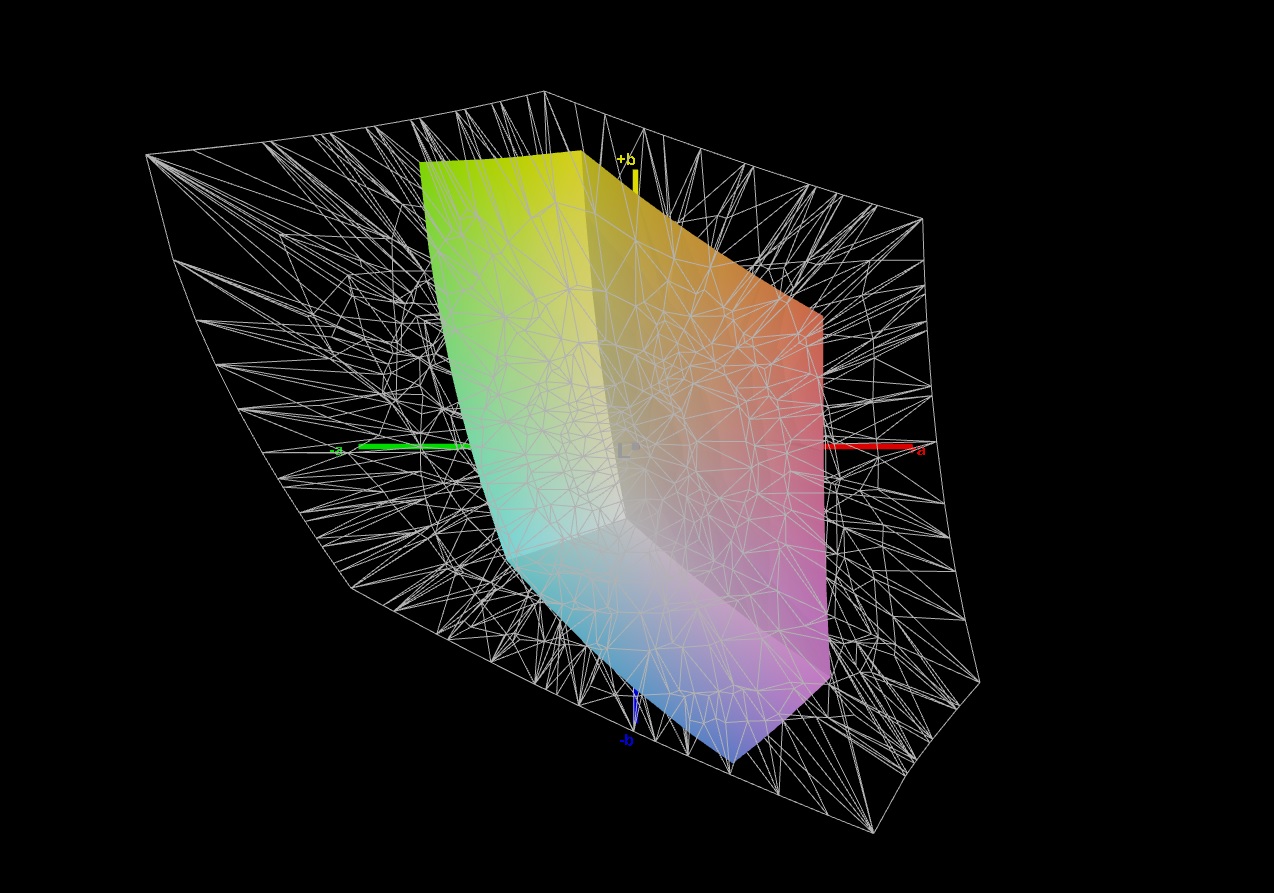
60% sRGB (Argyll 1.6.3 3D)
42% AdobeRGB 1998 (Argyll 1.6.3 3D)
41.88% AdobeRGB 1998 (Argyll 3D)
60.1% sRGB (Argyll 3D)
40.54% Display P3 (Argyll 3D)
Gamma: 2.52
CCT: 6371 K
| MSI Bravo 17 A4DDR AU Optronics B173HAN04.7 (AUO479D), IPS, 1920x1080 | MSI Alpha 15 A3DDK-034 AU Optronics B156HAN08.0 (AUO80ED), IPS, 1920x1080 | MSI GF75 Thin 9SC AU Optronics B173HAN04.2, IPS, 1920x1080 | Asus TUF FX705DT-AU068T AU Optronics B173HAN04.2, IPS, 1920x1080 | Asus TUF A17 FA706IU-AS76 BOE NV173FHM-NX1, IPS, 1920x1080 | Lenovo Legion Y540-17IRH AU Optronics B173HAN04.4 (AUO449D), IPS, 1920x1080 | |
|---|---|---|---|---|---|---|
| Display | 58% | 52% | 51% | -0% | 68% | |
| Display P3 Coverage (%) | 40.54 | 66.4 64% | 62.5 54% | 62.3 54% | 40.55 0% | 69 70% |
| sRGB Coverage (%) | 60.1 | 91 51% | 90 50% | 89.1 48% | 59.7 -1% | 98.3 64% |
| AdobeRGB 1998 Coverage (%) | 41.88 | 66.6 59% | 64 53% | 63.7 52% | 41.89 0% | 70.7 69% |
| Response Times | 74% | 6% | -2% | 40% | 56% | |
| Response Time Grey 50% / Grey 80% * (ms) | 40 ? | 7 ? 82% | 34 ? 15% | 41 ? -2% | 22.4 ? 44% | 18 ? 55% |
| Response Time Black / White * (ms) | 29.6 ? | 10.4 ? 65% | 30.4 ? -3% | 30 ? -1% | 19.2 ? 35% | 12.8 ? 57% |
| PWM Frequency (Hz) | ||||||
| Screen | -2% | 9% | 7% | -18% | 13% | |
| Brightness middle (cd/m²) | 264 | 310 17% | 344.7 31% | 316 20% | 264.8 0% | 286 8% |
| Brightness (cd/m²) | 244 | 310 27% | 332 36% | 294 20% | 253 4% | 282 16% |
| Brightness Distribution (%) | 88 | 86 -2% | 91 3% | 84 -5% | 90 2% | 87 -1% |
| Black Level * (cd/m²) | 0.23 | 0.29 -26% | 0.3 -30% | 0.32 -39% | 0.31 -35% | 0.19 17% |
| Contrast (:1) | 1148 | 1069 -7% | 1149 0% | 988 -14% | 854 -26% | 1505 31% |
| Colorchecker dE 2000 * | 3.85 | 4.78 -24% | 3.08 20% | 3.39 12% | 4.73 -23% | 3.57 7% |
| Colorchecker dE 2000 max. * | 9.13 | 8.1 11% | 6.32 31% | 5.56 39% | 18.89 -107% | 7.5 18% |
| Colorchecker dE 2000 calibrated * | 3.4 | 2.36 31% | 2.94 14% | 2.14 37% | 4.64 -36% | 1.31 61% |
| Greyscale dE 2000 * | 1.95 | 4.78 -145% | 3.8 -95% | 3.17 -63% | 1.4 28% | 4.51 -131% |
| Gamma | 2.52 87% | 2.43 91% | 2.17 101% | 2.39 92% | 2.16 102% | 2.36 93% |
| CCT | 6371 102% | 7739 84% | 7284 89% | 7098 92% | 6641 98% | 7411 88% |
| Color Space (Percent of AdobeRGB 1998) (%) | 42 | 59 40% | 58 38% | 51 21% | 38.4 -9% | 64 52% |
| Color Space (Percent of sRGB) (%) | 60 | 91 52% | 89.6 49% | 89 48% | 59.3 -1% | 98 63% |
| Toplam Ortalama (Program / Ayarlar) | 43% /
18% | 22% /
17% | 19% /
14% | 7% /
-8% | 46% /
29% |
* ... daha küçük daha iyidir
Renk doğruluğu söz konusu olduğunda durum benzerdir. Gerçek Renk MSI aracı (sRGB standart modu test edildi) CalMAN ekran görüntülerinin kanıtladığı gibi oldukça iyi Delta E değerleri sağlar. IPS teknolojisi ayrıca oldukça yüksek izleme açılarını garanti eder. Oyuncular, çok düzgün bir görüntü üreten FreeSync ve 120 Hz kombinasyonundan özellikle memnun olacaklar.
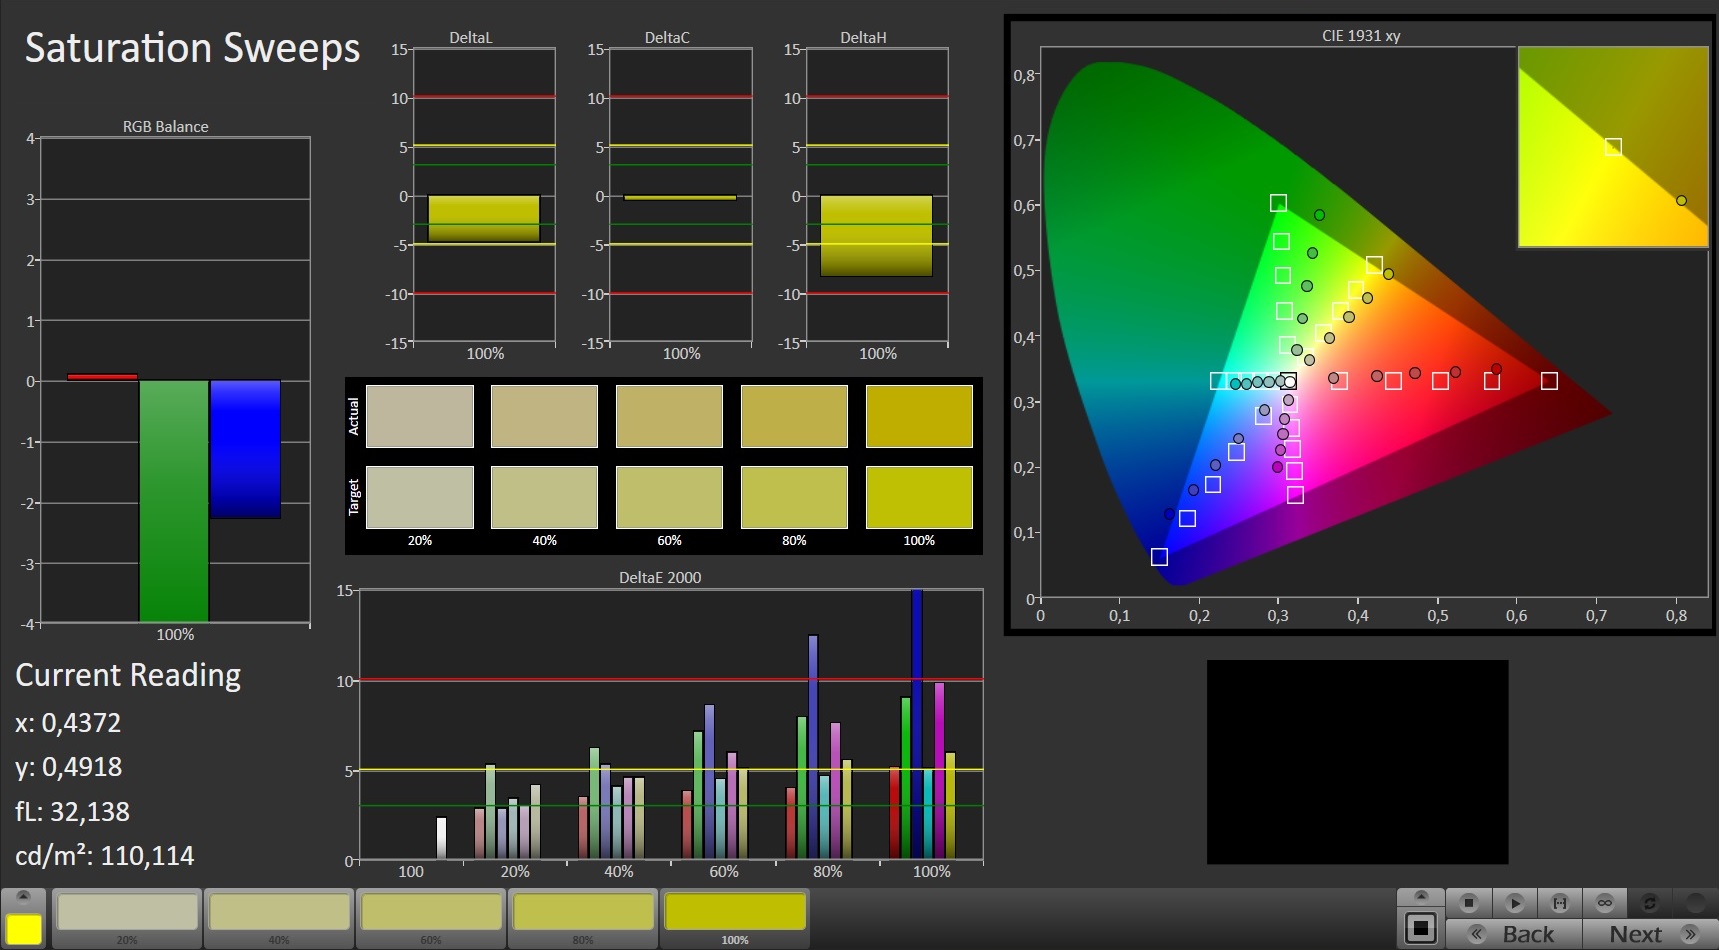
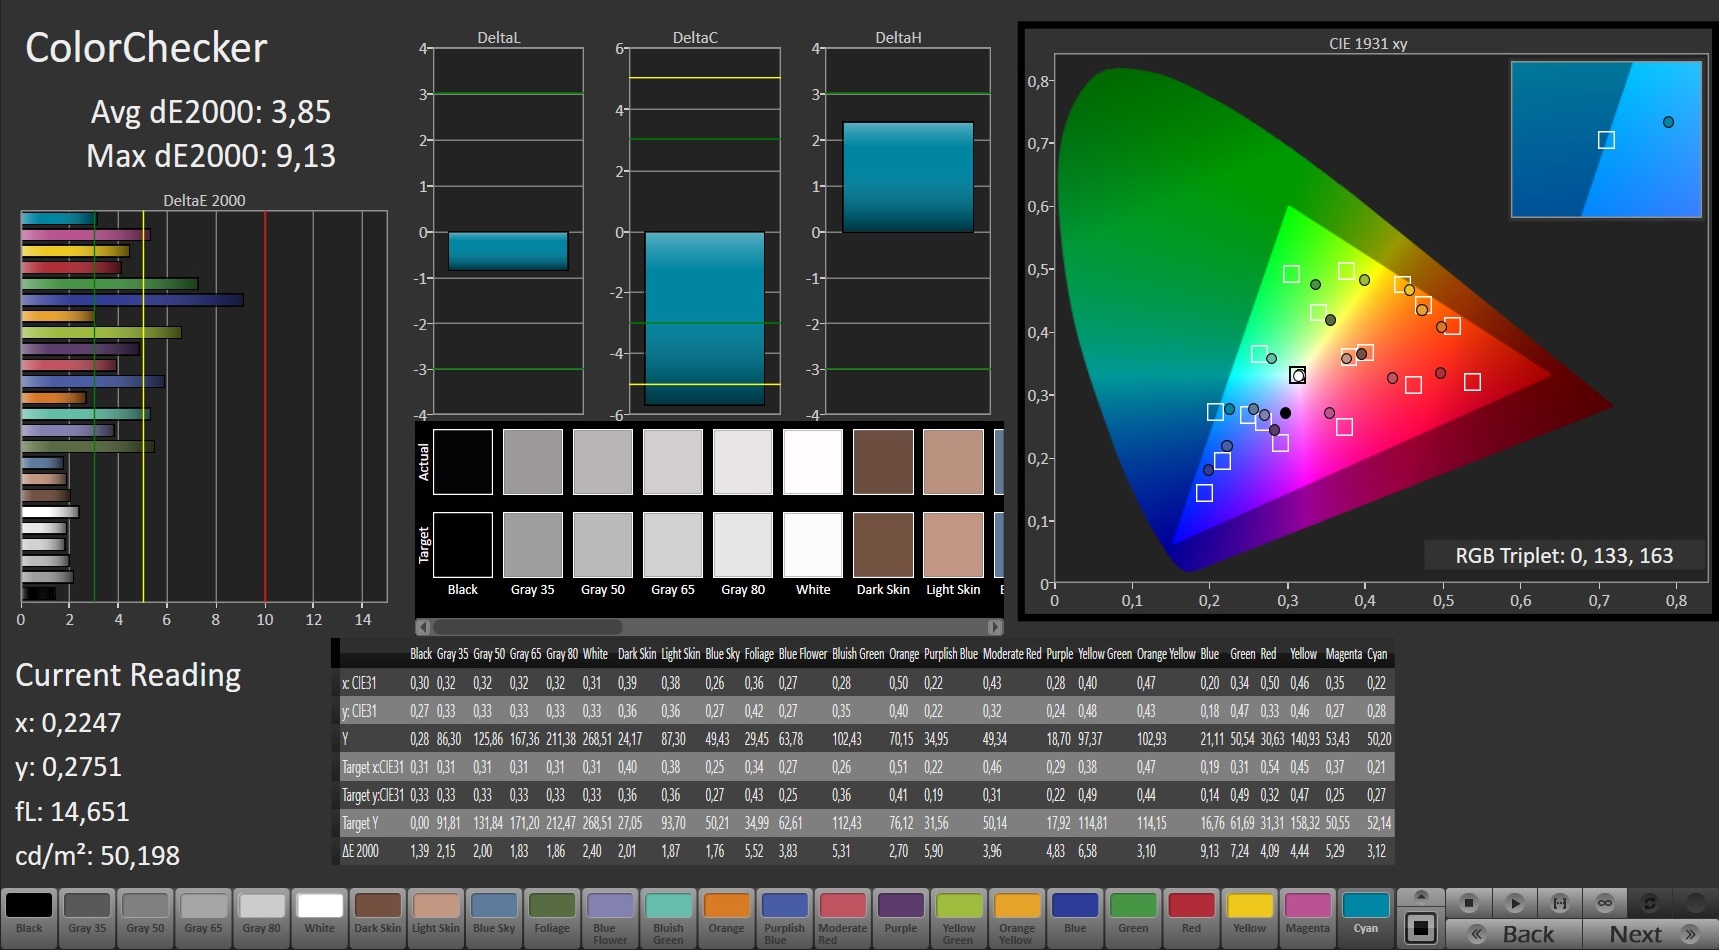
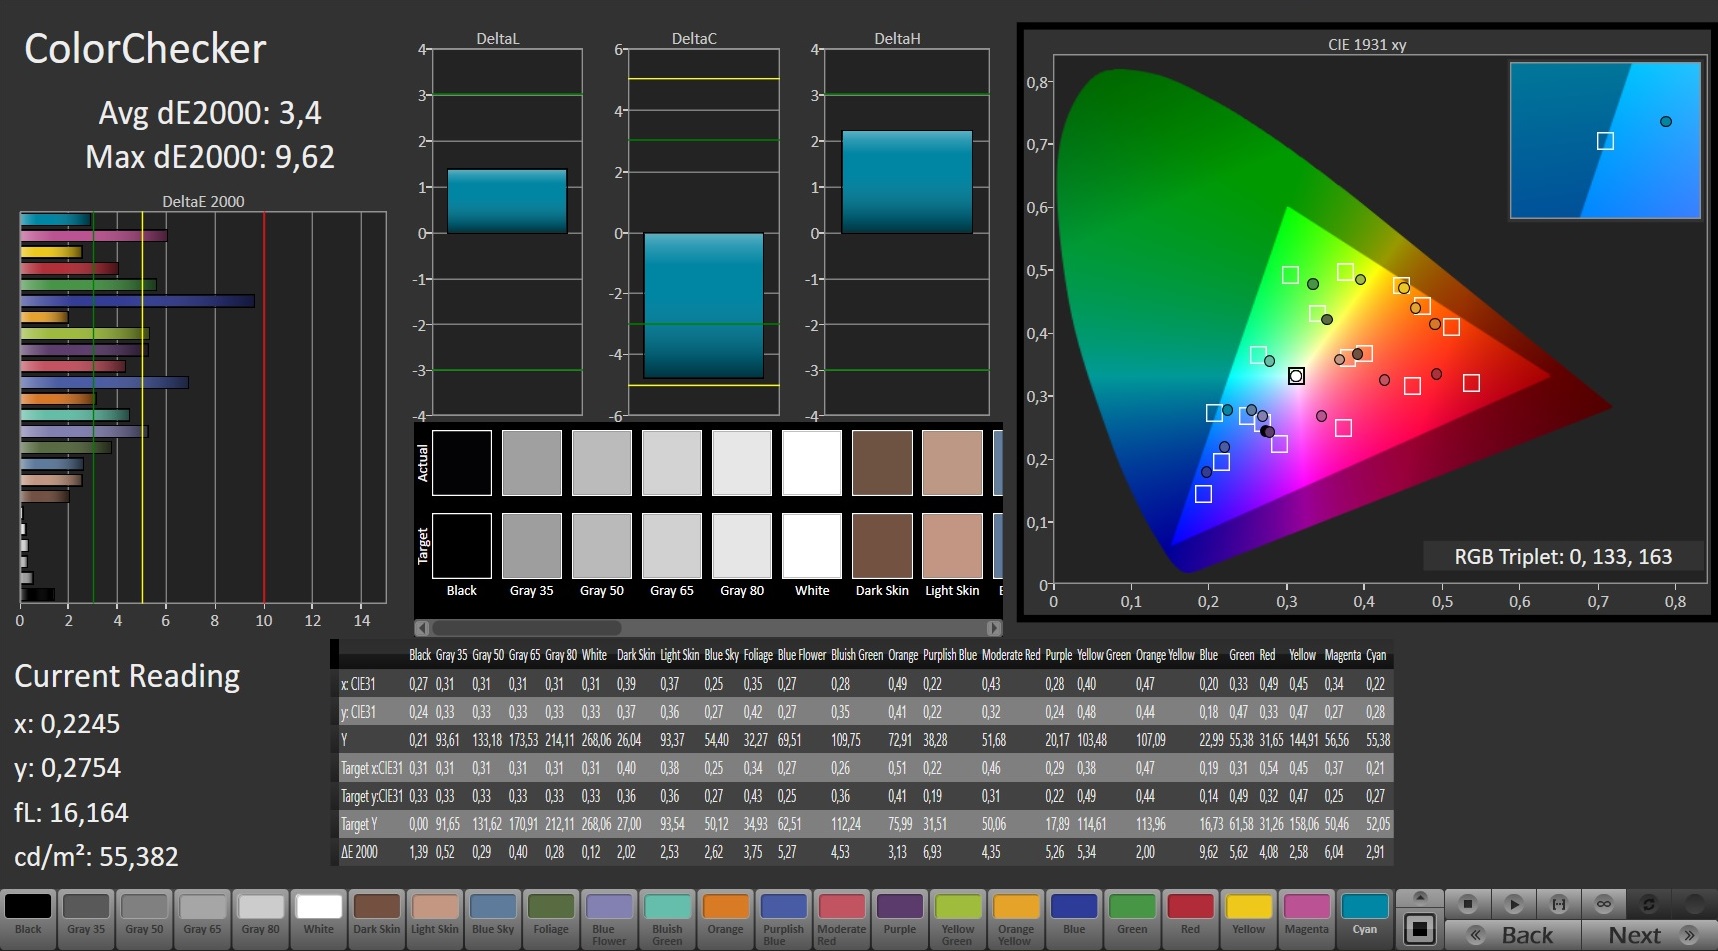
Bununla birlikte, AU Optronics'in (B173HAN04.7) 17 inç panelinin de bazı zayıflıkları var. Yaklaşık 243 cd / m²'lik parlaklık, sRGB renk alanı için kapsama alanının% 60'ı kadar mütevazıdır. Sonuç olarak, görüntü ve video bölümleri söz konusu olduğunda görüntü biraz rahatsız edici olabilir. Bravo 17, zayıf parlaklığı nedeniyle dış mekan kullanımı için de pek uygun değildir.
120 Hz teknolojisine rağmen, tepki süreleri de tam olarak göz kamaştırmıyor. Bahsedilen eksiklikler diğer bütçe oyun dizüstü bilgisayarlarını da etkilemektedir, ancak bizce en fazla 1.000 Euro'ya (~ 1.131 $) mal olan cihazlara daha kaliteli bir panel kurulmalıdır.
Yanıt Sürelerini Görüntüle
| ↔ Tepki Süresi Siyahtan Beyaza | ||
|---|---|---|
| 29.6 ms ... yükseliş ↗ ve sonbahar↘ birleşimi | ↗ 16.4 ms yükseliş | 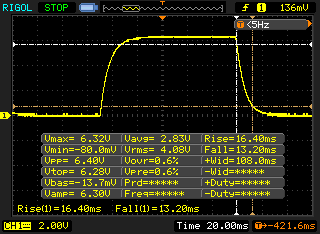 |
| ↘ 13.2 ms sonbahar | ||
| Ekran, testlerimizde nispeten yavaş yanıt oranları gösteriyor ve oyuncular için çok yavaş olabilir. Karşılaştırıldığında, test edilen tüm cihazlar 0.1 (minimum) ile 240 (maksimum) ms arasında değişir. » Tüm cihazların 79 %'si daha iyi. Bu, ölçülen yanıt süresinin test edilen tüm cihazların ortalamasından (19.8 ms) daha kötü olduğu anlamına gelir. | ||
| ↔ Tepki Süresi %50 Griden %80 Griye | ||
| 40 ms ... yükseliş ↗ ve sonbahar↘ birleşimi | ↗ 19.2 ms yükseliş | 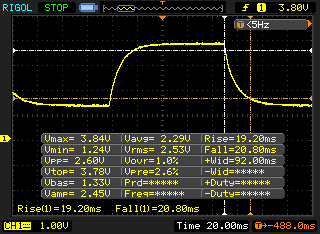 |
| ↘ 20.8 ms sonbahar | ||
| Ekran, testlerimizde yavaş yanıt oranları gösteriyor ve oyuncular için yetersiz olacaktır. Karşılaştırıldığında, test edilen tüm cihazlar 0.165 (minimum) ile 636 (maksimum) ms arasında değişir. » Tüm cihazların 61 %'si daha iyi. Bu, ölçülen yanıt süresinin test edilen tüm cihazların ortalamasından (31 ms) daha kötü olduğu anlamına gelir. | ||
Ekran Titremesi / PWM (Darbe Genişliği Modülasyonu)
| Ekran titriyor / PWM algılanmadı | 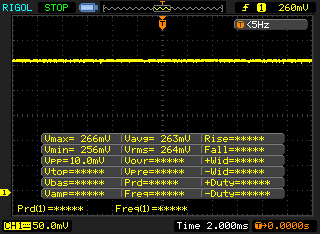 | ||
Karşılaştırıldığında: Test edilen tüm cihazların %52 %'si ekranı karartmak için PWM kullanmıyor. PWM tespit edilirse, ortalama 7754 (minimum: 5 - maksimum: 343500) Hz ölçüldü. | |||
Test koşulları
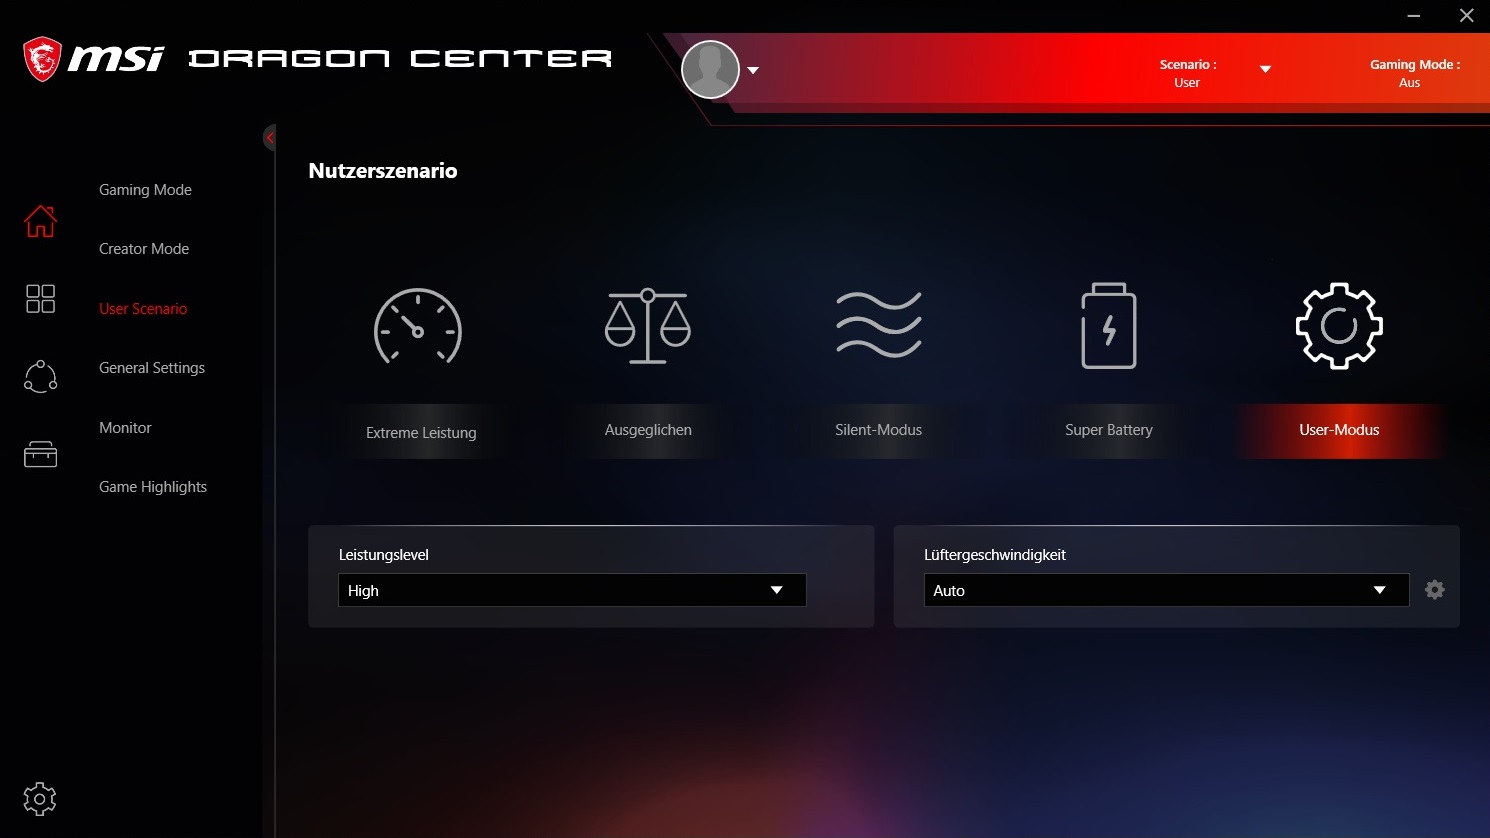
Alıcılar, önceden yüklenmiş Dragon Center'da birçok sistem ayarını yapma olanağına sahiptir. Ölçümlerimiz için, "Yüksek" performans seviyesi ve "Otomatik" fan hızı ile "Kullanıcı" kullanıcı senaryosunu kullandık.
Performance
While the CPU belongs to the high-end segment, the GPU is "only" positioned in the mid-range. Since most games are graphically limited, we would, therefore, speak of an upper mid-range laptop, as mentioned at the beginning.
Processor
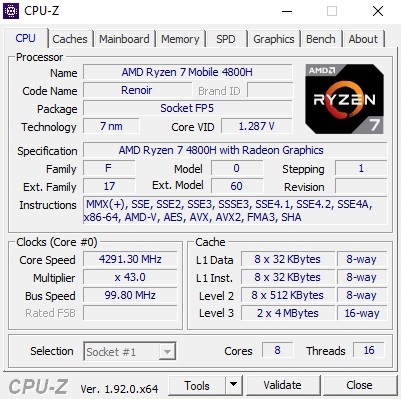
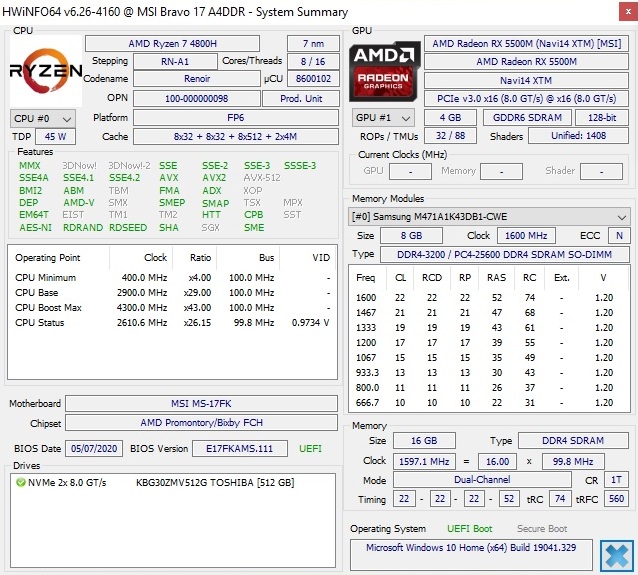
The fact that Intel has rested on its laurels for years is now becoming the doom of the former "processor king". Slowly but surely AMD is taking over the helm or rather the dominance in the CPU segment again, which seemed unthinkable a few years ago, especially for laptops. The best example of the race to catch up is the lightning-fast octa-core Ryzen 7 4800H, which is created with a 7 nm process (Intel is still stuck at 14 nm) and can process up to 16 threads in parallel via SMT. The base clock speed is 2.9 GHz, and the maximum boost speed is 4.2 GHz.
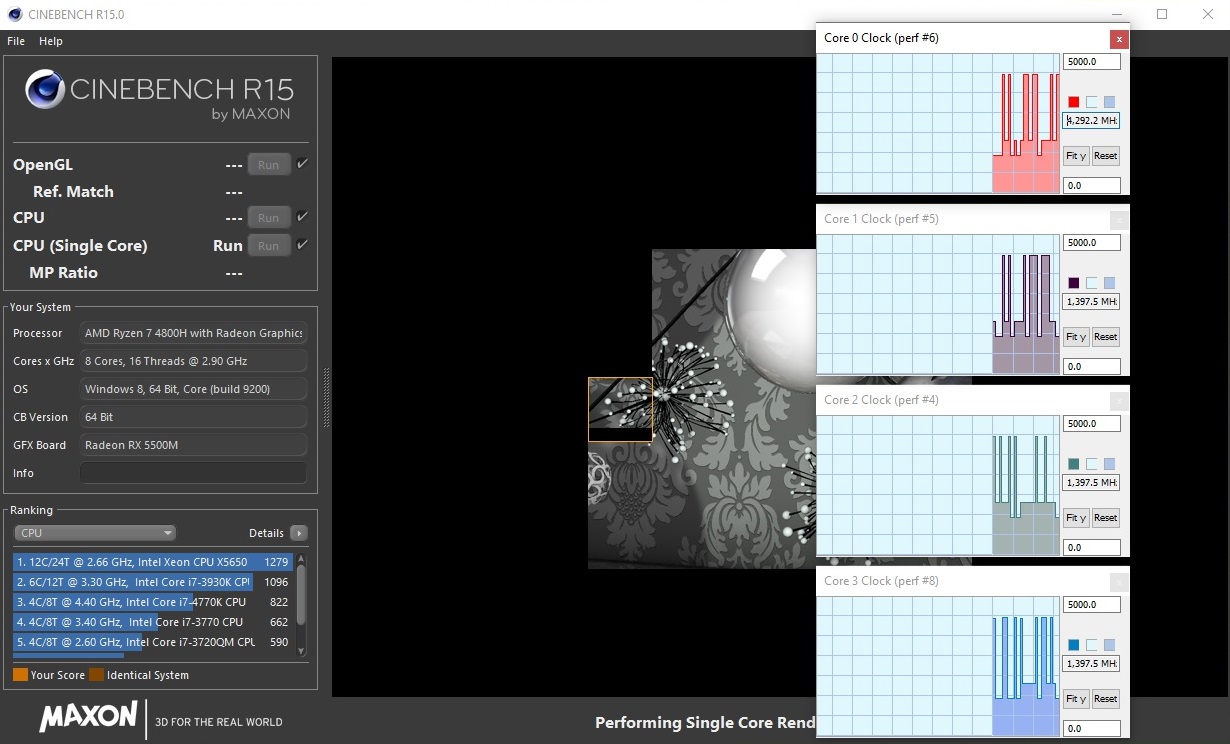
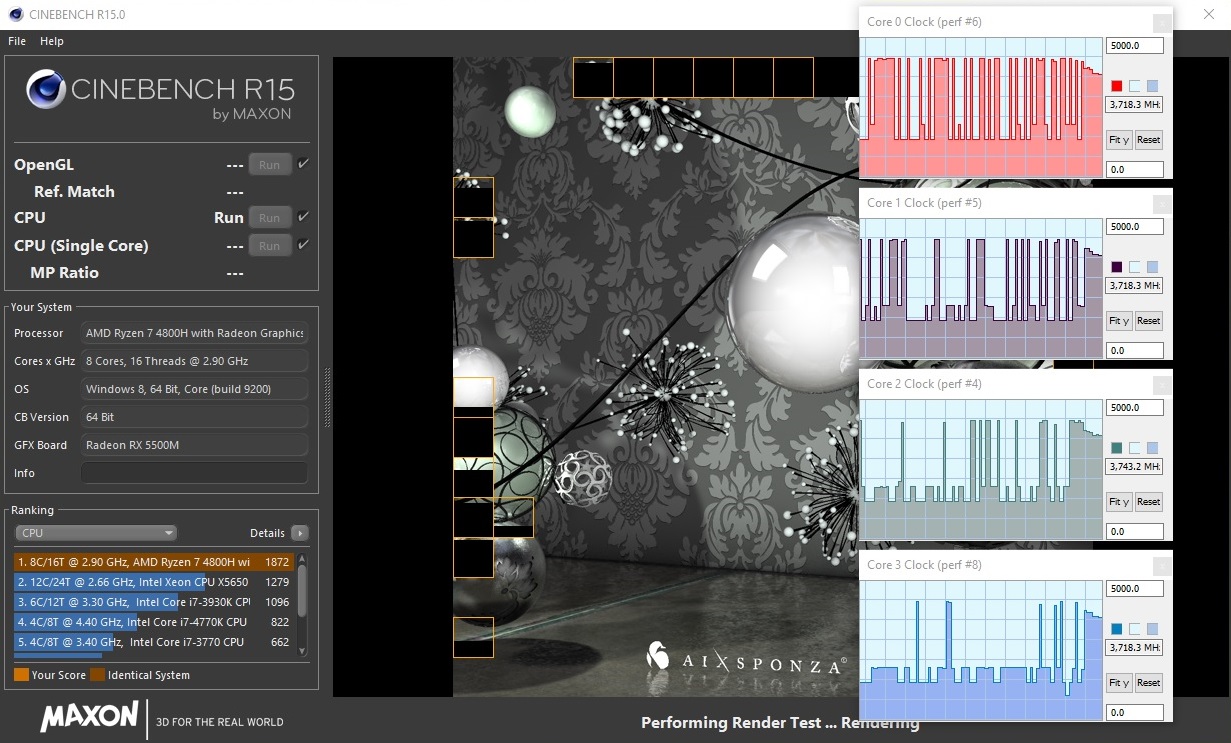
We checked how the Ryzen 7 4800H behaves in practice with the help of the Cinebench R15 benchmark. Around 3.7 GHz in the multi-core test is a good result. In contrast to other laptops, the CPU performance only drops slightly over a longer period of time (less than 5% in the Cinebench loop).
The benchmark results are particularly impressive. With a multi-score of 1,892 points, the Ryzen 7 4800H sprints almost 80% past the hexa-core Core i7-9750H processor in Cinebench R15. The gap to the popular quad-core CPU, the Core i5-9300H, is even over 120%. Ergo: Intel is currently hardly competitive when it comes to budget products and has to prepare itself for the worst in 2020.
| Cinebench R15 | |
| CPU Single 64Bit | |
| MSI GF75 Thin 9SC | |
| Asus TUF A17 FA706IU-AS76 | |
| MSI Bravo 17 A4DDR | |
| Lenovo Legion Y540-17IRH | |
| Asus TUF FX705DT-AU068T | |
| MSI Alpha 15 A3DDK-034 | |
| CPU Multi 64Bit | |
| MSI Bravo 17 A4DDR | |
| Asus TUF A17 FA706IU-AS76 | |
| MSI GF75 Thin 9SC | |
| Lenovo Legion Y540-17IRH | |
| Asus TUF FX705DT-AU068T | |
| MSI Alpha 15 A3DDK-034 | |
| Blender - v2.79 BMW27 CPU | |
| Asus TUF A17 FA706IU-AS76 | |
| MSI Bravo 17 A4DDR | |
| 7-Zip 18.03 | |
| 7z b 4 -mmt1 | |
| Asus TUF A17 FA706IU-AS76 | |
| MSI Bravo 17 A4DDR | |
| 7z b 4 | |
| MSI Bravo 17 A4DDR | |
| Asus TUF A17 FA706IU-AS76 | |
| Cinebench R20 | |
| CPU (Single Core) | |
| MSI Bravo 17 A4DDR | |
| Asus TUF A17 FA706IU-AS76 | |
| Lenovo Legion Y540-17IRH | |
| Asus TUF FX705DT-AU068T | |
| MSI Alpha 15 A3DDK-034 | |
| CPU (Multi Core) | |
| MSI Bravo 17 A4DDR | |
| Asus TUF A17 FA706IU-AS76 | |
| Lenovo Legion Y540-17IRH | |
| Asus TUF FX705DT-AU068T | |
| MSI Alpha 15 A3DDK-034 | |
| Geekbench 5.5 | |
| Single-Core | |
| MSI Bravo 17 A4DDR | |
| Asus TUF A17 FA706IU-AS76 | |
| MSI Alpha 15 A3DDK-034 | |
| Multi-Core | |
| MSI Bravo 17 A4DDR | |
| Asus TUF A17 FA706IU-AS76 | |
| MSI Alpha 15 A3DDK-034 | |
| HWBOT x265 Benchmark v2.2 - 4k Preset | |
| MSI Bravo 17 A4DDR | |
| Asus TUF A17 FA706IU-AS76 | |
| LibreOffice - 20 Documents To PDF | |
| MSI Bravo 17 A4DDR | |
| Asus TUF A17 FA706IU-AS76 | |
| R Benchmark 2.5 - Overall mean | |
| Asus TUF A17 FA706IU-AS76 | |
| MSI Bravo 17 A4DDR | |
* ... daha küçük daha iyidir
System performance
The fast processor also helps put the Bravo 17 in the top position in the system performance category. 5,970 points in PCMark 10 could also come from a genuine and considerably more expensive high-end system. However, the 17-incher has to struggle with short delays in everyday use, which mainly occur when launching a program. The graphics-switching solution, which dynamically switches between the CPU's graphics chip and the dedicated GPU depending on the application, could be to blame.
| PCMark 10 - Score | |
| MSI Bravo 17 A4DDR | |
| Asus TUF A17 FA706IU-AS76 | |
| Lenovo Legion Y540-17IRH | |
| MSI GF75 Thin 9SC | |
| MSI Alpha 15 A3DDK-034 | |
| Asus TUF FX705DT-AU068T | |
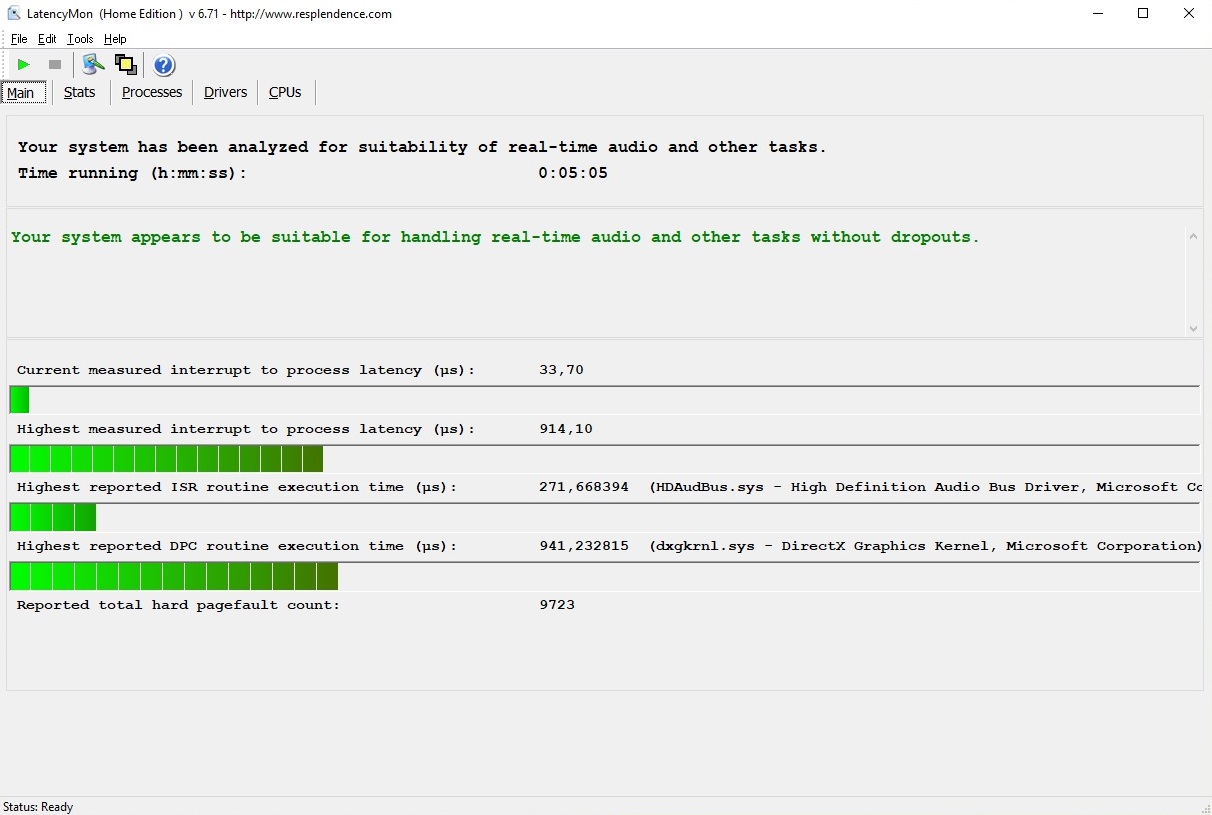
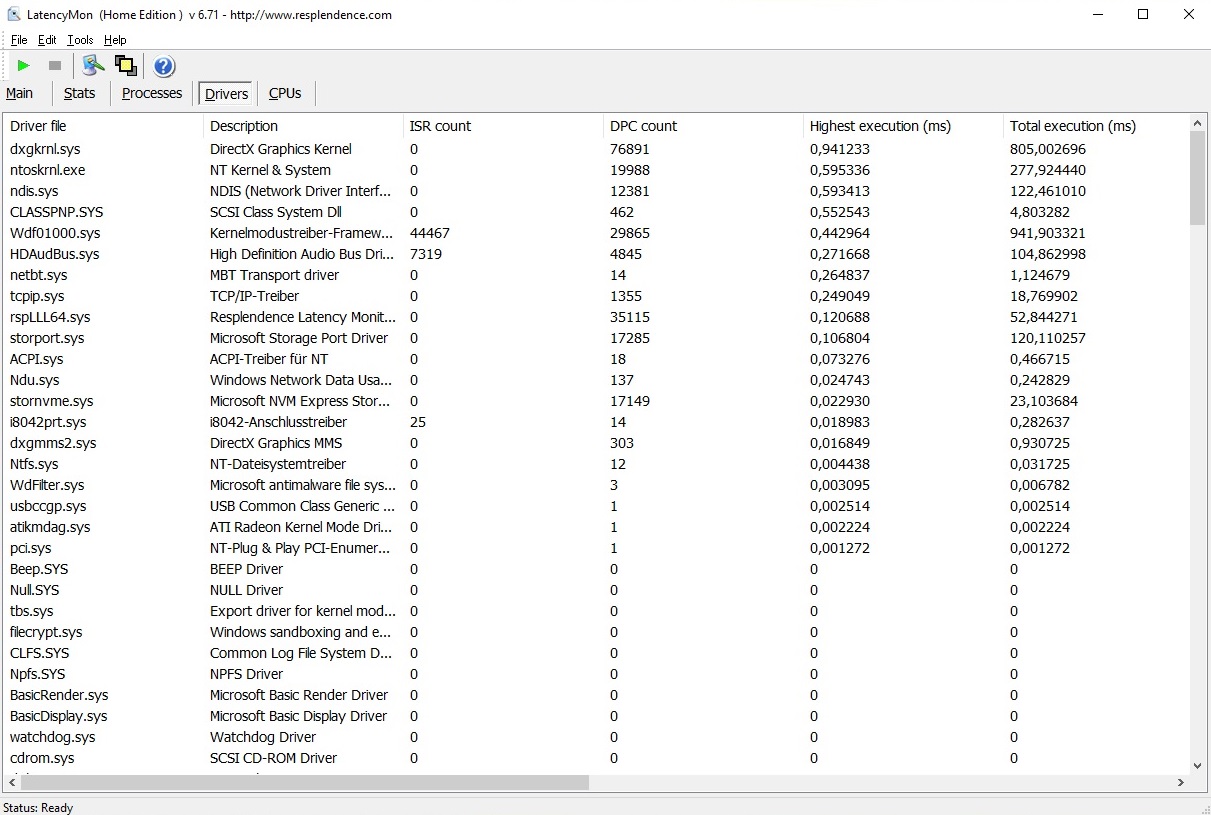
DPC latency
Despite the subjective delays, the Bravo 17 does quite well in the latency test (apart from the stuttery 4K YouTube video). The LatencyMon tool doesn't detect any particularly high values that would indicate a bad driver.
| DPC Latencies / LatencyMon - interrupt to process latency (max), Web, Youtube, Prime95 | |
| Asus TUF A17 FA706IU-AS76 | |
| MSI Bravo 17 A4DDR | |
* ... daha küçük daha iyidir
Storage
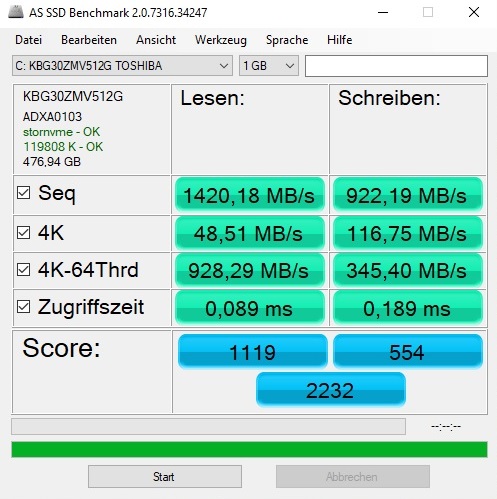
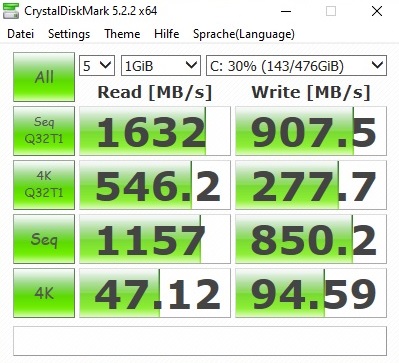
As is appropriate for a modern laptop, the operating system (Windows 10 Home 64-bit) runs on a PCIe SSD. The 512 GB Toshiba KBG30ZMV512G model built into the test device is oriented towards the Kingston SSD of the MSI Alpha 15 and the WDC drive of the Asus TUF FX705 or the Lenovo Legion Y540 in the CrystalDiskMark. On the other hand, the 1 TB models of the MSI GF75 (Crucial) and the Asus TUF A17 (Intel) are able to gain a certain lead - at least on paper.
| MSI Bravo 17 A4DDR Toshiba KBG30ZMV512G | MSI Alpha 15 A3DDK-034 Kingston RBUSNS8154P3512GJ | MSI GF75 Thin 9SC Crucial P1 SSD CT1000P1SSD8 | Asus TUF FX705DT-AU068T WDC PC SN520 SDAPNUW-256G | Asus TUF A17 FA706IU-AS76 Intel SSD 660p 1TB SSDPEKNW010T8 | Lenovo Legion Y540-17IRH WDC PC SN520 SDAPNUW-512G | |
|---|---|---|---|---|---|---|
| CrystalDiskMark 5.2 / 6 | -1% | 43% | 15% | 56% | 8% | |
| Write 4K (MB/s) | 94.6 | 105.4 11% | 133 41% | 145 53% | 189.7 101% | 105.1 11% |
| Read 4K (MB/s) | 47.12 | 33.24 -29% | 55.6 18% | 45.28 -4% | 62.3 32% | 34.41 -27% |
| Write Seq (MB/s) | 850 | 1029 21% | 1623 91% | 1301 53% | 1681 98% | 1298 53% |
| Read Seq (MB/s) | 1157 | 1098 -5% | 1386 20% | 1362 18% | 1608 39% | 1099 -5% |
| Write 4K Q32T1 (MB/s) | 277.7 | 322.1 16% | 501 80% | 249.1 -10% | 468.6 69% | 335.7 21% |
| Read 4K Q32T1 (MB/s) | 546 | 352 -36% | 584 7% | 342.1 -37% | 541 -1% | 231.4 -58% |
| Write Seq Q32T1 (MB/s) | 908 | 1036 14% | 1696 87% | 1301 43% | 1770 95% | 1454 60% |
| Read Seq Q32T1 (MB/s) | 1632 | 1606 -2% | 1572 -4% | 1732 6% | 1898 16% | 1740 7% |

Continuous load read: DiskSpd Read Loop, Queue Depth 8
Graphics card
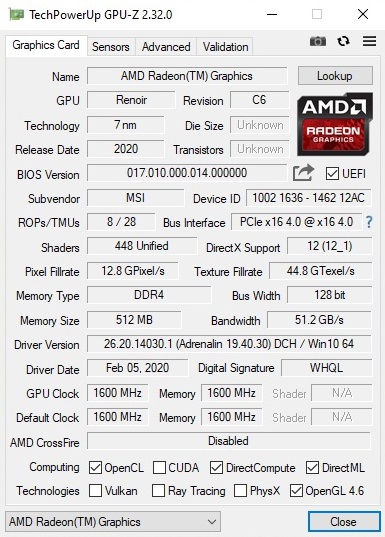
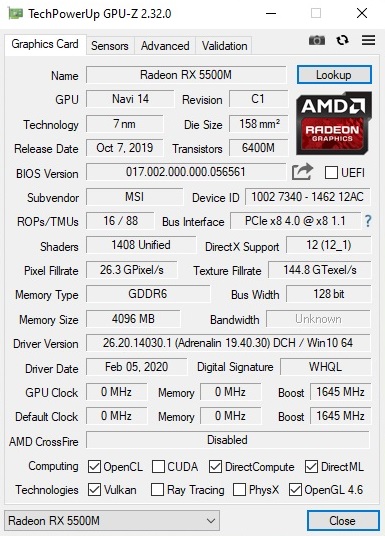
The graphics card is only partially on par with the level of the Ryzen 7 4800H. With the Radeon RX 5500M, AMD has a DirectX 12 accelerator in its portfolio that offers a performance ranging between the GTX 1650 and the GTX 1660 Ti. Depending on the benchmark, the results sometimes tend more towards one direction and sometimes rather towards the other.
| 3DMark | |
| 1920x1080 Fire Strike Graphics | |
| Asus TUF A17 FA706IU-AS76 | |
| Lenovo Legion Y540-17IRH | |
| MSI Bravo 17 A4DDR | |
| MSI Alpha 15 A3DDK-034 | |
| MSI GF75 Thin 9SC | |
| Asus TUF FX705DT-AU068T | |
| 2560x1440 Time Spy Graphics | |
| Asus TUF A17 FA706IU-AS76 | |
| Lenovo Legion Y540-17IRH | |
| MSI Bravo 17 A4DDR | |
| MSI Alpha 15 A3DDK-034 | |
| Asus TUF FX705DT-AU068T | |
| MSI GF75 Thin 9SC | |
| 3DMark 11 - 1280x720 Performance GPU | |
| Asus TUF A17 FA706IU-AS76 | |
| Lenovo Legion Y540-17IRH | |
| MSI Bravo 17 A4DDR | |
| MSI Alpha 15 A3DDK-034 | |
| Asus TUF FX705DT-AU068T | |
| MSI GF75 Thin 9SC | |
Technically, the RX 5500M has access to 1,408 shaders and 4 GB of GDDR6 video memory (128-bit interface). 4 GB is a borderline amount nowadays, since some games crave for at least 6 GB at higher settings.
| 3DMark 11 Performance | 16271 puan | |
| 3DMark Cloud Gate Standard Score | 39492 puan | |
| 3DMark Fire Strike Score | 11461 puan | |
| 3DMark Time Spy Score | 4712 puan | |
Yardım | ||
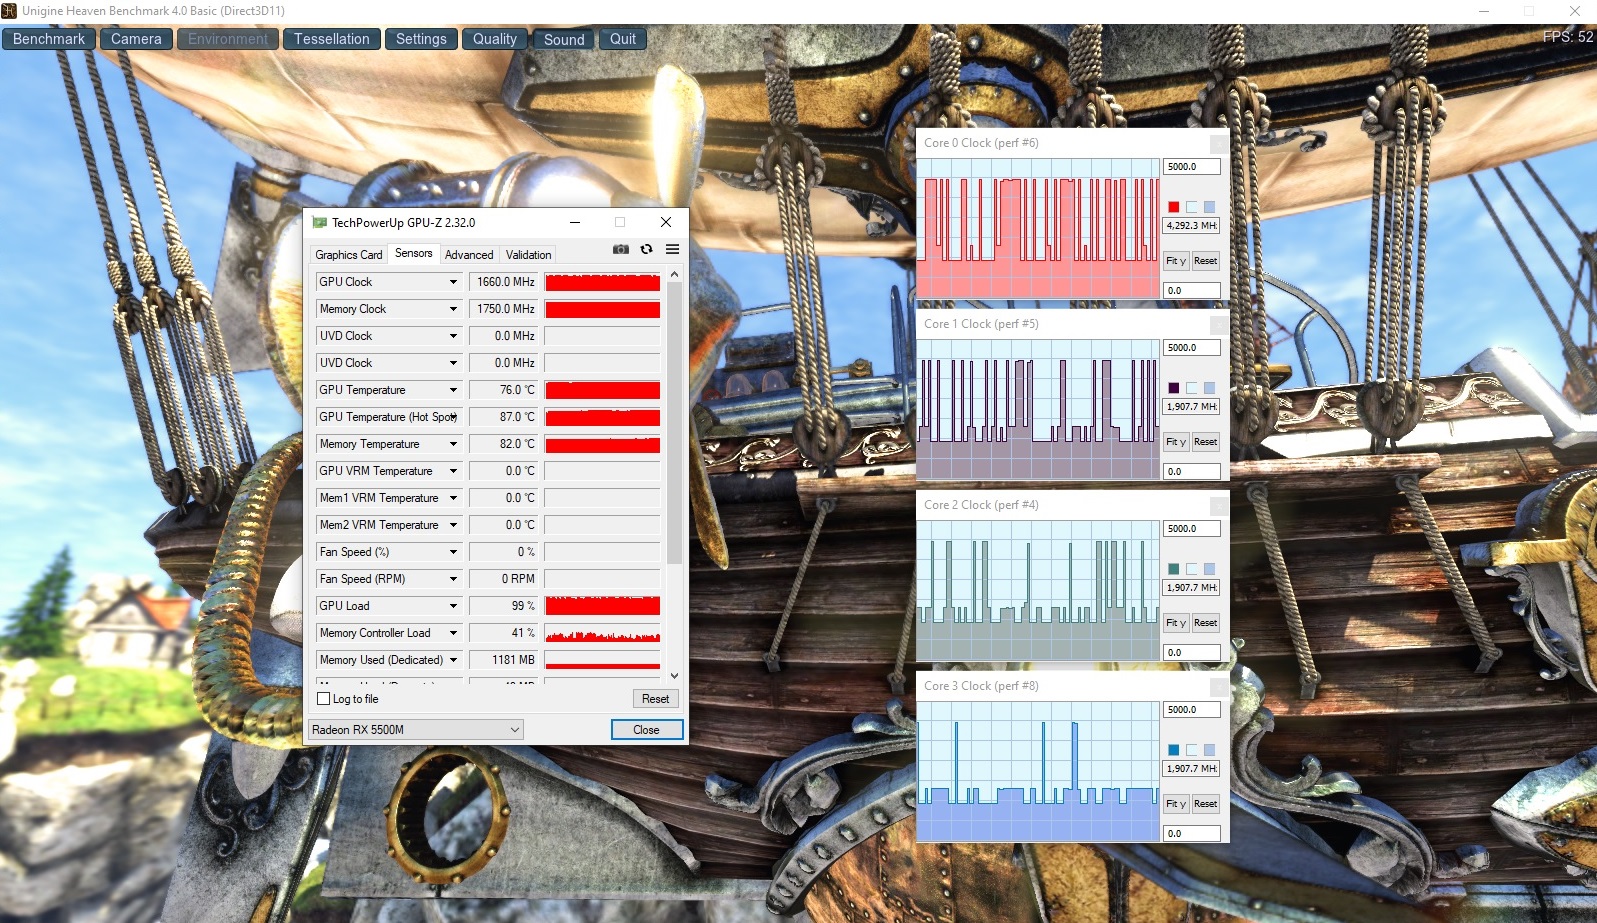
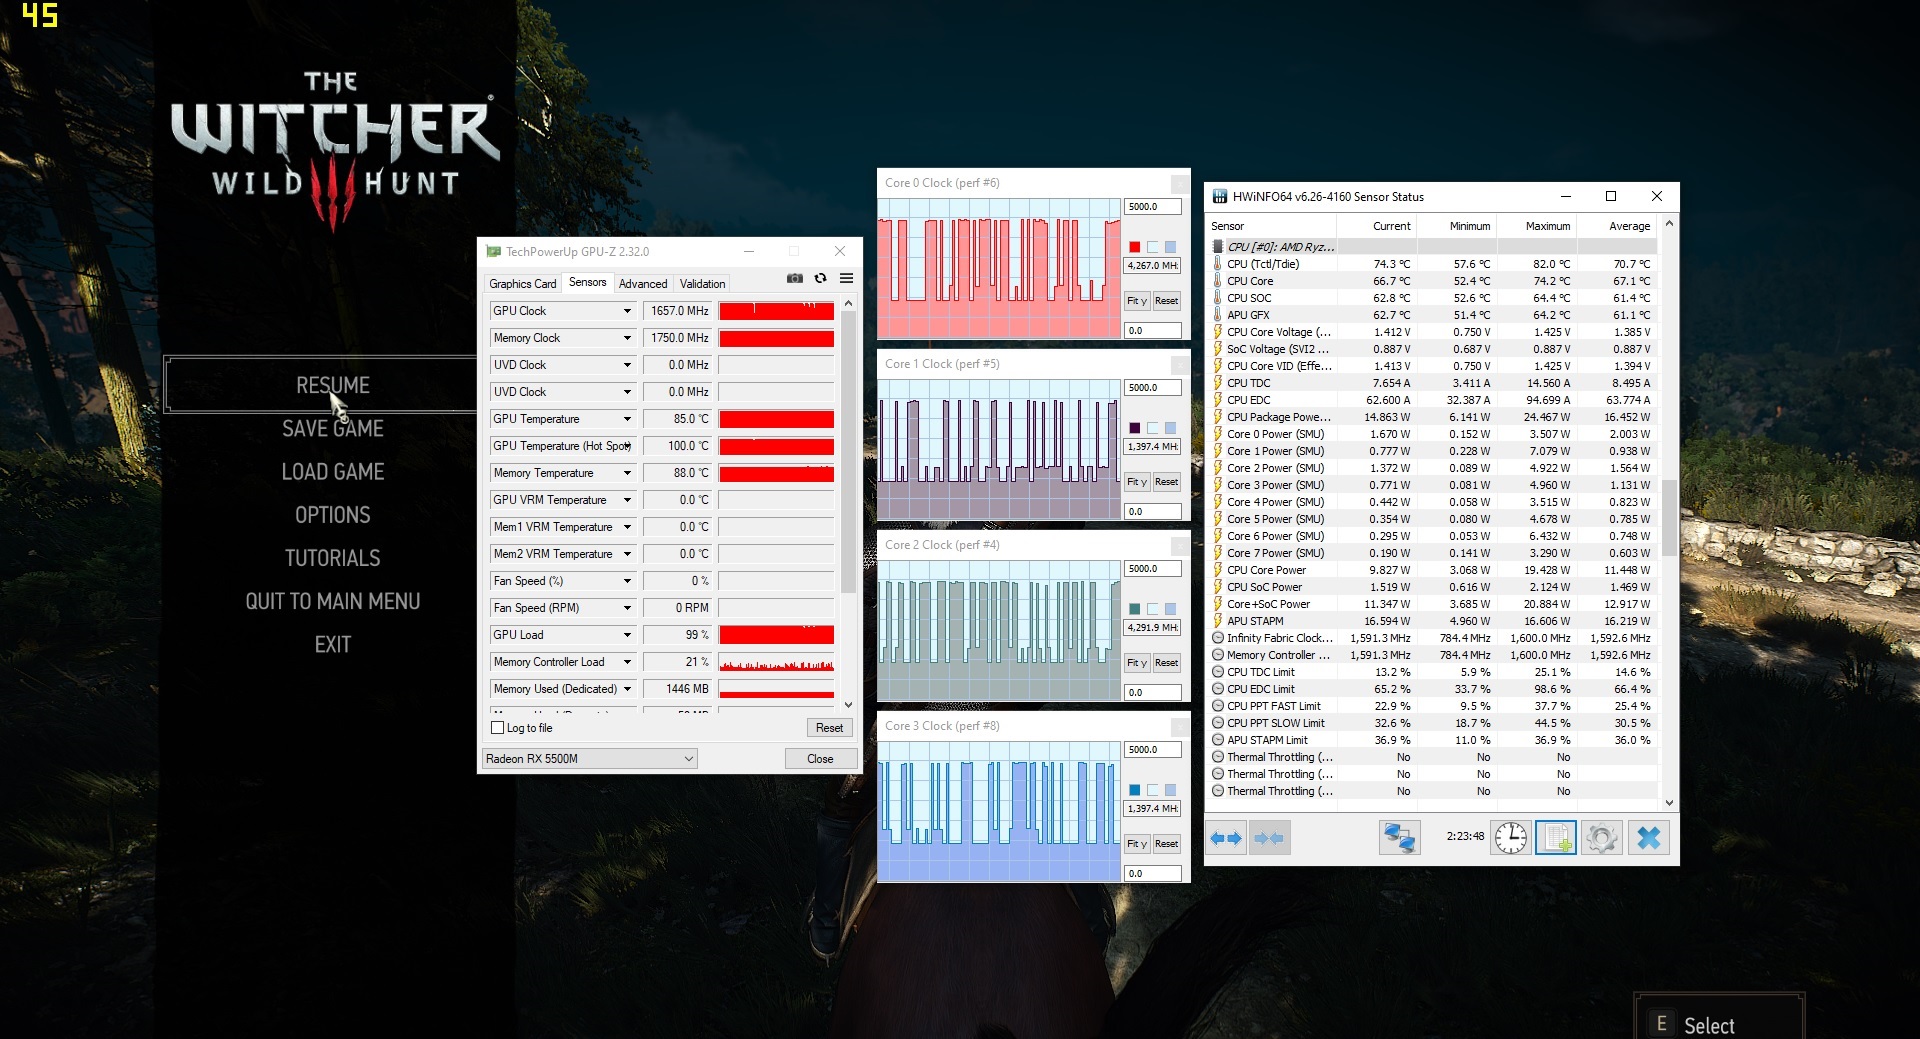
Speaking of games: We tested the clock speeds of the Navi chip for about 60 minutes with the RPG The Witcher 3. Result: The RX 5500M settles at around 1,650 MHz. That is clearly more than the base clock speed of 1,448 MHz. As you can see from the graph below, the frame rate remained very constant over the entire period of time.
Gaming performance
In general, the Radeon RX 5500M runs almost all titles at the native Full HD resolution (1920x1080) at high to maximum details, whereby the display frequency is rather rarely exploited. Stuttering only occurs in very demanding and/or moderately optimized games like Borderlands 3. Small tip: You should absolutely update the graphics driver after purchase. Some titles complained about the version with our test device. Doom Eternal didn't even want to run at all with the preinstalled driver (at least on the dedicated graphics card).
| The Witcher 3 | |
| 1920x1080 High Graphics & Postprocessing (Nvidia HairWorks Off) | |
| Lenovo Legion Y540-17IRH | |
| Asus TUF A17 FA706IU-AS76 | |
| MSI Alpha 15 A3DDK-034 | |
| MSI Bravo 17 A4DDR | |
| MSI GF75 Thin 9SC | |
| Asus TUF FX705DT-AU068T | |
| 1920x1080 Ultra Graphics & Postprocessing (HBAO+) | |
| Asus TUF A17 FA706IU-AS76 | |
| Lenovo Legion Y540-17IRH | |
| MSI Bravo 17 A4DDR | |
| MSI Alpha 15 A3DDK-034 | |
| MSI GF75 Thin 9SC | |
| Asus TUF FX705DT-AU068T | |
| düşük | orta | yüksek | ultra | |
|---|---|---|---|---|
| GTA V (2015) | 168 | 104 | 53.1 | |
| The Witcher 3 (2015) | 72 | 45.4 | ||
| Dota 2 Reborn (2015) | 120 | 113 | 106 | 103 |
| X-Plane 11.11 (2018) | 49.4 | 37.9 | 34.1 | |
| Shadow of the Tomb Raider (2018) | 65 | 54 | ||
| Battlefield V (2018) | 93 | 88.2 | ||
| Borderlands 3 (2019) | 47.9 | 35.9 | ||
| Escape from Tarkov (2020) | 81.5 | 64.5 | ||
| Hunt Showdown (2020) | 56.5 | |||
| Doom Eternal (2020) | 0 | 0 | ||
| Gears Tactics (2020) | 78.5 | 55.1 |
Emissions
Noise emissions
The noise level generated in idle usage is reminiscent of the MSI GF75 with the Core i7-9750H and the GeForce GTX 1650. The two fans aren't extremely quiet, but 33 to 35 dB is still in order.
The noise level increases significantly under load. About 48 dB in The Witcher 3 and 52 dB in the stress test with the FurMark and Prime95 tools tend towards the Asus TUF A17 and the Lenovo Legion Y540, respectively, and they represent a value that ranges from clearly audible to annoyingly loud (without headphones). At least the Bravo 17 runs noticeably quieter than its MSI counterpart, the Alpha 15.
Ses yüksekliği
| Boşta |
| 33 / 34 / 35 dB |
| Çalışırken |
| 39 / 52 dB |
 | ||
30 dB sessiz 40 dB(A) duyulabilirlik 50 dB(A) gürültülü |
||
min: | ||
| MSI Bravo 17 A4DDR R7 4800H, Radeon RX 5500M | MSI Alpha 15 A3DDK-034 R7 3750H, Radeon RX 5500M | MSI GF75 Thin 9SC i7-9750H, GeForce GTX 1650 Mobile | Asus TUF FX705DT-AU068T R5 3550H, GeForce GTX 1650 Mobile | Asus TUF A17 FA706IU-AS76 R7 4800H, GeForce GTX 1660 Ti Mobile | Lenovo Legion Y540-17IRH i5-9300H, GeForce GTX 1660 Ti Mobile | |
|---|---|---|---|---|---|---|
| Noise | -13% | 6% | 6% | 3% | 0% | |
| kapalı / ortam * (dB) | 30 | 29 3% | 28.2 6% | 30.8 -3% | 28.7 4% | 30 -0% |
| Idle Minimum * (dB) | 33 | 36 -9% | 33.6 -2% | 30.8 7% | 28.7 13% | 30 9% |
| Idle Average * (dB) | 34 | 37 -9% | 33.6 1% | 30.8 9% | 30.5 10% | 32 6% |
| Idle Maximum * (dB) | 35 | 46 -31% | 33.8 3% | 32.2 8% | 32.5 7% | 34 3% |
| Load Average * (dB) | 39 | 50 -28% | 37.2 5% | 38.6 1% | 42.5 -9% | 44 -13% |
| Witcher 3 ultra * (dB) | 48 | 51 -6% | 40.6 15% | 50.1 -4% | 50 -4% | |
| Load Maximum * (dB) | 52 | 57 -10% | 44.4 15% | 44.8 14% | 53.4 -3% | 52 -0% |
* ... daha küçük daha iyidir
Temperature
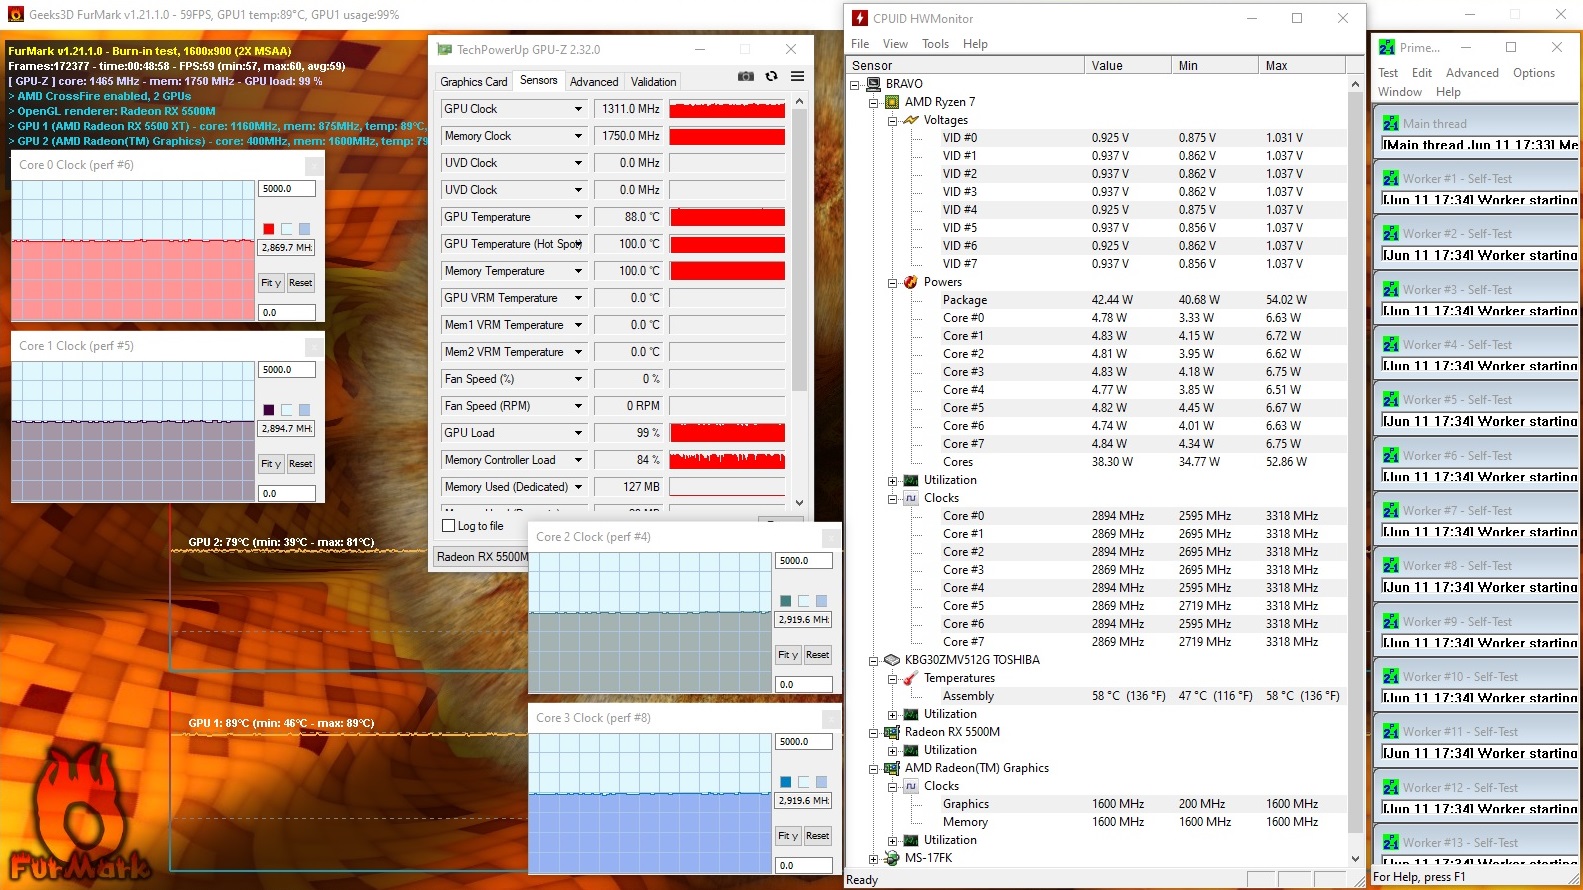
Despite the high volume, the Radeon RX 5500M gets pretty hot with 3D applications. Just under 85 °C (~185 °F) in our The Witcher 3 test and 88 °C (~190 °F) under full load are relatively high for a GPU. The Ryzen 7 4800H also reaches around 90 °C (~194 °F) under extreme conditions (about 70 °C (~158 °F) for The Witcher 3).
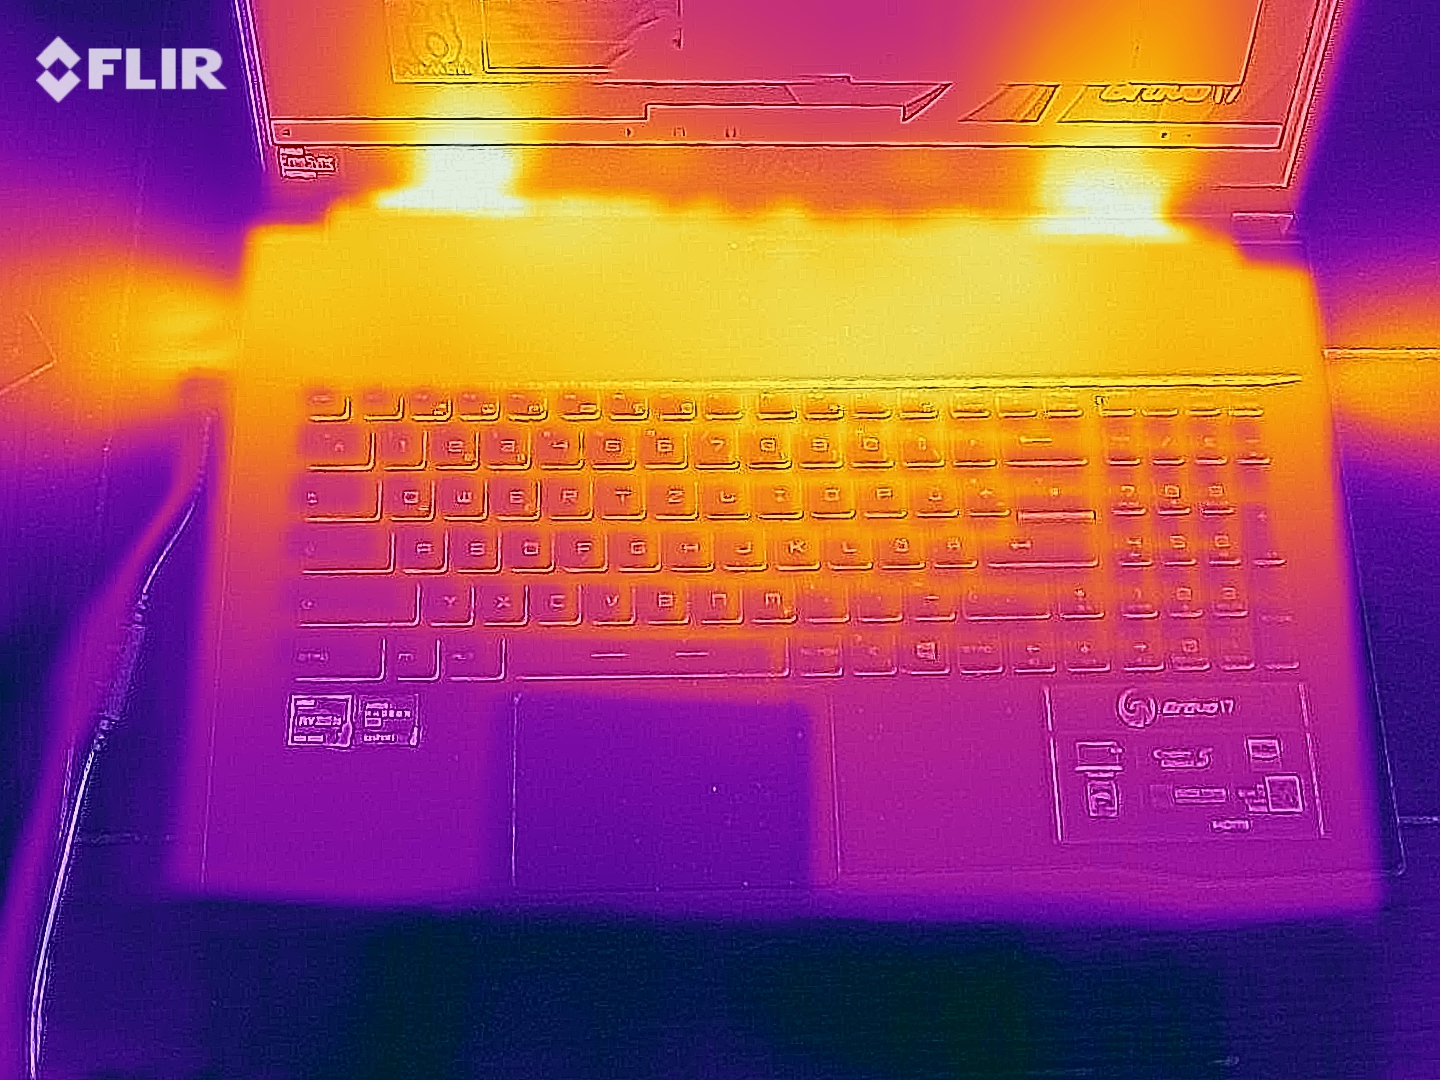
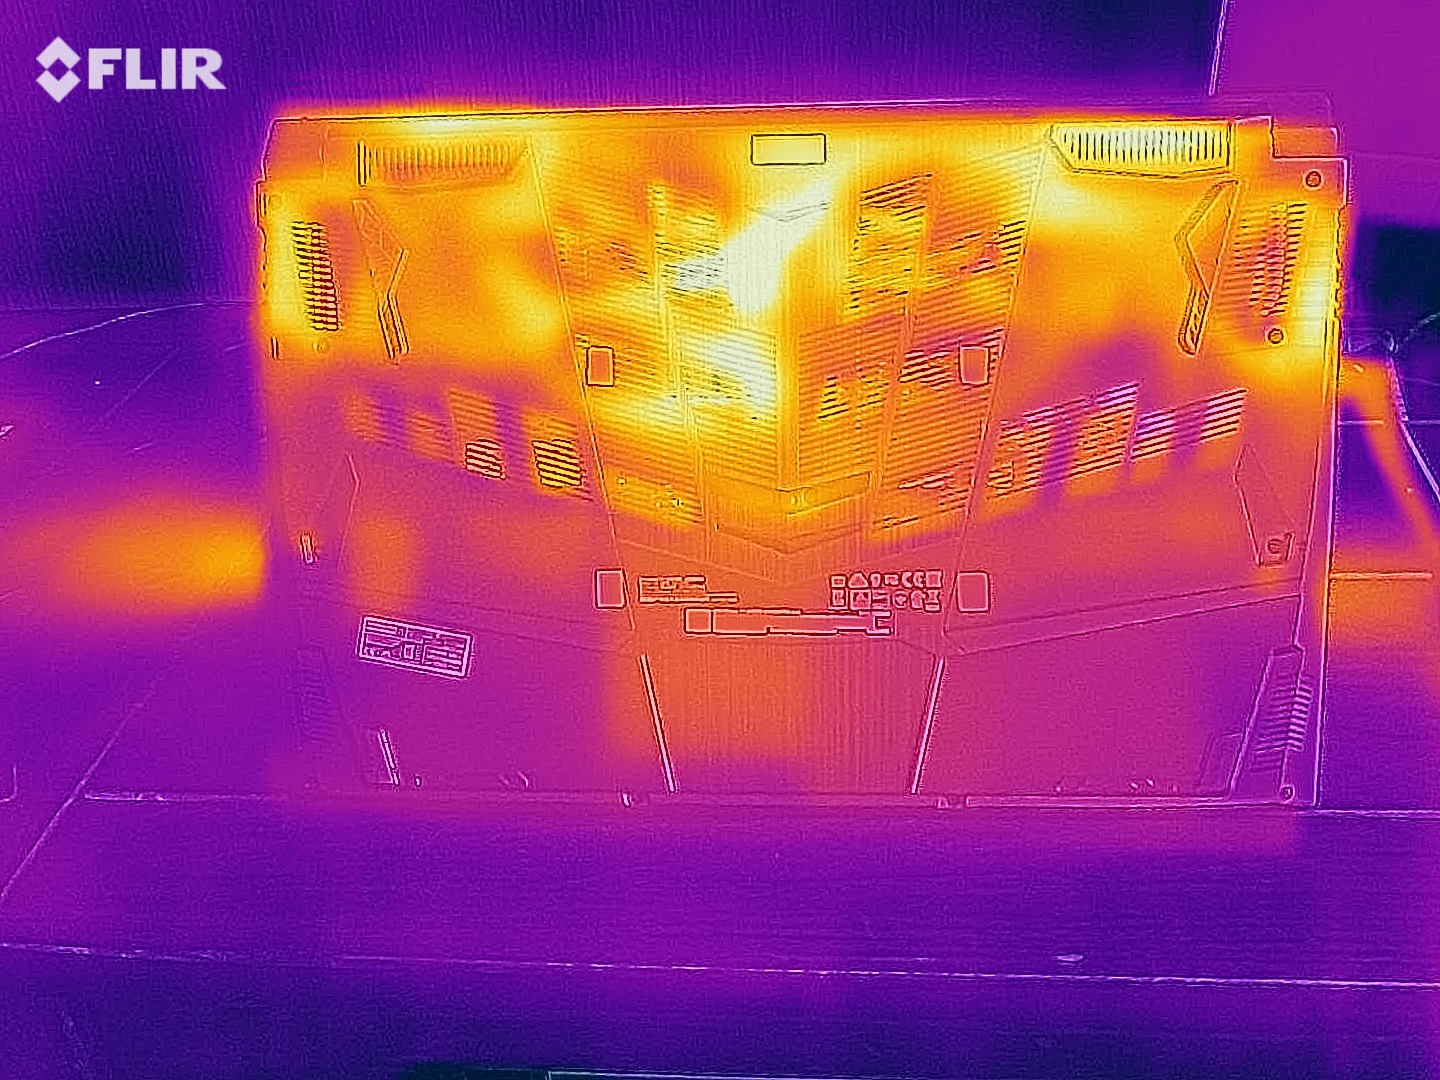
We were able to draw up to 48 °C (~118 °F) from the case's top side and up to 50 °C (~122 °F) from the bottom in the stress test. However, these temperatures primarily apply to the rear third of the laptop. In idle usage, the entire chassis stays pleasantly cool at around 24 °C (75 °F).
(-) Üst taraftaki maksimum sıcaklık, 40.4 °C / 105 F ortalamasına kıyasla 48 °C / 118 F'dir. , Gaming sınıfı için 21.2 ile 68.8 °C arasında değişir.
(-) Alt kısım, 43.2 °C / 110 F ortalamasına kıyasla maksimum 50 °C / 122 F'ye kadar ısınır
(+) Boşta kullanımda, üst tarafın ortalama sıcaklığı 24 °C / 75 F olup, cihazın 33.9 °C / 93 F.
(-) The Witcher 3 oynarken, üst tarafın ortalama sıcaklığı 40.3 °C / 105 F olup, cihazın 33.9 °C / 93 F.
(+) Avuç içi dayanakları ve dokunmatik yüzey maksimum (33 °C / 91.4 F) cilt sıcaklığına ulaşıyor ve bu nedenle sıcak değil.
(-) Benzer cihazların avuç içi dayanağı alanının ortalama sıcaklığı 28.8 °C / 83.8 F (-4.2 °C / -7.6 F) idi.
| MSI Bravo 17 A4DDR R7 4800H, Radeon RX 5500M | MSI Alpha 15 A3DDK-034 R7 3750H, Radeon RX 5500M | MSI GF75 Thin 9SC i7-9750H, GeForce GTX 1650 Mobile | Asus TUF FX705DT-AU068T R5 3550H, GeForce GTX 1650 Mobile | Asus TUF A17 FA706IU-AS76 R7 4800H, GeForce GTX 1660 Ti Mobile | Lenovo Legion Y540-17IRH i5-9300H, GeForce GTX 1660 Ti Mobile | |
|---|---|---|---|---|---|---|
| Heat | -1% | -15% | -1% | -11% | -26% | |
| Maximum Upper Side * (°C) | 48 | 44 8% | 47.8 -0% | 41.6 13% | 47.6 1% | 48 -0% |
| Maximum Bottom * (°C) | 50 | 49 2% | 57 -14% | 38 24% | 50.8 -2% | 56 -12% |
| Idle Upper Side * (°C) | 25 | 26 -4% | 30.2 -21% | 31.7 -27% | 33 -32% | 36 -44% |
| Idle Bottom * (°C) | 26 | 28 -8% | 32 -23% | 29.5 -13% | 29 -12% | 38 -46% |
* ... daha küçük daha iyidir
Speakers
The 2.0 system integrated into the front area offers a good volume of maximum 84 dB and a decent sound pattern with the - other laptops send their regards - usual weaknesses in terms of bass. According to our audio analysis, the sound is better than with the thicker Alpha 15.
MSI Bravo 17 A4DDR ses analizi
(+) | hoparlörler nispeten yüksek sesle çalabilir (84 dB)
Bas 100 - 315Hz
(-) | neredeyse hiç bas yok - ortalama olarak medyandan 18.2% daha düşük
(±) | Bas doğrusallığı ortalamadır (11.7% delta - önceki frekans)
Ortalar 400 - 2000 Hz
(+) | dengeli ortalar - medyandan yalnızca 3.3% uzakta
(+) | orta frekanslar doğrusaldır (3.7% deltadan önceki frekansa)
Yüksekler 2 - 16 kHz
(+) | dengeli yüksekler - medyandan yalnızca 2.7% uzakta
(+) | yüksekler doğrusaldır (4.7% deltadan önceki frekansa)
Toplam 100 - 16.000 Hz
(+) | genel ses doğrusaldır (14.8% ortancaya göre fark)
Aynı sınıfla karşılaştırıldığında
» Bu sınıftaki tüm test edilen cihazların %30%'si daha iyi, 7% benzer, 63% daha kötüydü
» En iyisinin deltası 6% idi, ortalama 18% idi, en kötüsü 132% idi
Test edilen tüm cihazlarla karşılaştırıldığında
» Test edilen tüm cihazların %20'si daha iyi, 4 benzer, % 76 daha kötüydü
» En iyisinin deltası 4% idi, ortalama 23% idi, en kötüsü 134% idi
MSI Alpha 15 A3DDK-034 ses analizi
(+) | hoparlörler nispeten yüksek sesle çalabilir (91 dB)
Bas 100 - 315Hz
(-) | neredeyse hiç bas yok - ortalama olarak medyandan 31.4% daha düşük
(+) | bas doğrusaldır (5.8% delta ile önceki frekans)
Ortalar 400 - 2000 Hz
(±) | azaltılmış orta sesler - ortalama olarak medyandan 7.4% daha düşük
(±) | Ortaların doğrusallığı ortalamadır (9.9% delta - önceki frekans)
Yüksekler 2 - 16 kHz
(+) | dengeli yüksekler - medyandan yalnızca 2.1% uzakta
(+) | yüksekler doğrusaldır (3.7% deltadan önceki frekansa)
Toplam 100 - 16.000 Hz
(±) | Genel sesin doğrusallığı ortalamadır (19.5% ortancaya göre fark)
Aynı sınıfla karşılaştırıldığında
» Bu sınıftaki tüm test edilen cihazların %68%'si daha iyi, 7% benzer, 26% daha kötüydü
» En iyisinin deltası 6% idi, ortalama 18% idi, en kötüsü 132% idi
Test edilen tüm cihazlarla karşılaştırıldığında
» Test edilen tüm cihazların %49'si daha iyi, 7 benzer, % 44 daha kötüydü
» En iyisinin deltası 4% idi, ortalama 23% idi, en kötüsü 134% idi
Energy management
Energy consumption
In comparison to the last CPU generation, AMD seems to have noticeably optimized the energy management. Instead of the 14 to 32 watts that the Alpha 15 required in idle usage (Ryzen 7 3750H), the Bravo 17 only needs 9 to 13 watts. On the other hand, the consumption under load is similar at 69 to 214 watts - but the Ryzen 7 4800H also offers twice as many cores.
| Kapalı / Bekleme modu | |
| Boşta | |
| Çalışırken |
|
Key:
min: | |
| MSI Bravo 17 A4DDR R7 4800H, Radeon RX 5500M | MSI Alpha 15 A3DDK-034 R7 3750H, Radeon RX 5500M | MSI GF75 Thin 9SC i7-9750H, GeForce GTX 1650 Mobile | Asus TUF FX705DT-AU068T R5 3550H, GeForce GTX 1650 Mobile | Asus TUF A17 FA706IU-AS76 R7 4800H, GeForce GTX 1660 Ti Mobile | Lenovo Legion Y540-17IRH i5-9300H, GeForce GTX 1660 Ti Mobile | |
|---|---|---|---|---|---|---|
| Power Consumption | -44% | -13% | 29% | -9% | -63% | |
| Idle Minimum * (Watt) | 9 | 14 -56% | 6.1 32% | 3.9 57% | 7.4 18% | 19 -111% |
| Idle Average * (Watt) | 10 | 18 -80% | 11.2 -12% | 9.6 4% | 10.5 -5% | 22 -120% |
| Idle Maximum * (Watt) | 13 | 32 -146% | 24.5 -88% | 12.2 6% | 17 -31% | 30 -131% |
| Load Average * (Watt) | 69 | 64 7% | 94.7 -37% | 59 14% | 103.7 -50% | 79 -14% |
| Witcher 3 ultra * (Watt) | 128 | 123 4% | 105.8 17% | 128.1 -0% | 134 -5% | |
| Load Maximum * (Watt) | 214 | 193 10% | 192.2 10% | 80 63% | 183.2 14% | 201 6% |
* ... daha küçük daha iyidir
Battery life
With a capacity of 51 Wh, the battery is not designed for particularly long runtimes. Thanks to the graphics-switching solution and the 7 nm components, the Bravo 17 lasts at least 5 hours when surfing the Internet on WLAN (medium brightness). However, even under ideal conditions, it's almost impossible to squeeze more than 7 hours out from the battery.
| MSI Bravo 17 A4DDR R7 4800H, Radeon RX 5500M, 51 Wh | MSI Alpha 15 A3DDK-034 R7 3750H, Radeon RX 5500M, 51 Wh | MSI GF75 Thin 9SC i7-9750H, GeForce GTX 1650 Mobile, 51 Wh | Asus TUF FX705DT-AU068T R5 3550H, GeForce GTX 1650 Mobile, 64 Wh | Asus TUF A17 FA706IU-AS76 R7 4800H, GeForce GTX 1660 Ti Mobile, 90 Wh | Lenovo Legion Y540-17IRH i5-9300H, GeForce GTX 1660 Ti Mobile, 57 Wh | |
|---|---|---|---|---|---|---|
| Pil Çalışma Süresi | -28% | -10% | 63% | 78% | -25% | |
| Reader / Idle (h) | 7.7 | 5.8 -25% | 13.6 77% | 9.1 18% | 5.2 -32% | |
| WiFi v1.3 (h) | 5.2 | 4.1 -21% | 4.7 -10% | 7.8 50% | 8.5 63% | 3.7 -29% |
| Load (h) | 1.3 | 0.8 -38% | 2.1 62% | 3.3 154% | 1.1 -15% | |
| H.264 (h) | 3.9 | 8.1 | 3.4 |
Artılar
Eksiler
Verdict
AMD is back – and with a bang: Not necessarily on the GPU side but definitely on the CPU side.
The Ryzen 7 4800H impresses with a very high performance that puts the price-comparable Intel competition (e.g. the Core i7-9750H) in its place. Such an amount of CPU power was previously reserved for gaming laptops over 1,500 Euros (~$1,696).
With exception of the poor connectivity, the low-brightness display, and the high noise development under load, the rest of the Bravo 17 also makes a good impression. AMD fans, who have to/want to watch out for their budget, can pull the purchase trigger with confidence.
MSI Bravo 17 A4DDR
- 07/02/2020 v7 (old)
Florian Glaser
Price comparison

