MSI Creator 17 A10SGS Dizüstü Bilgisayar İncelemesi: Mini LED ile Kazanma

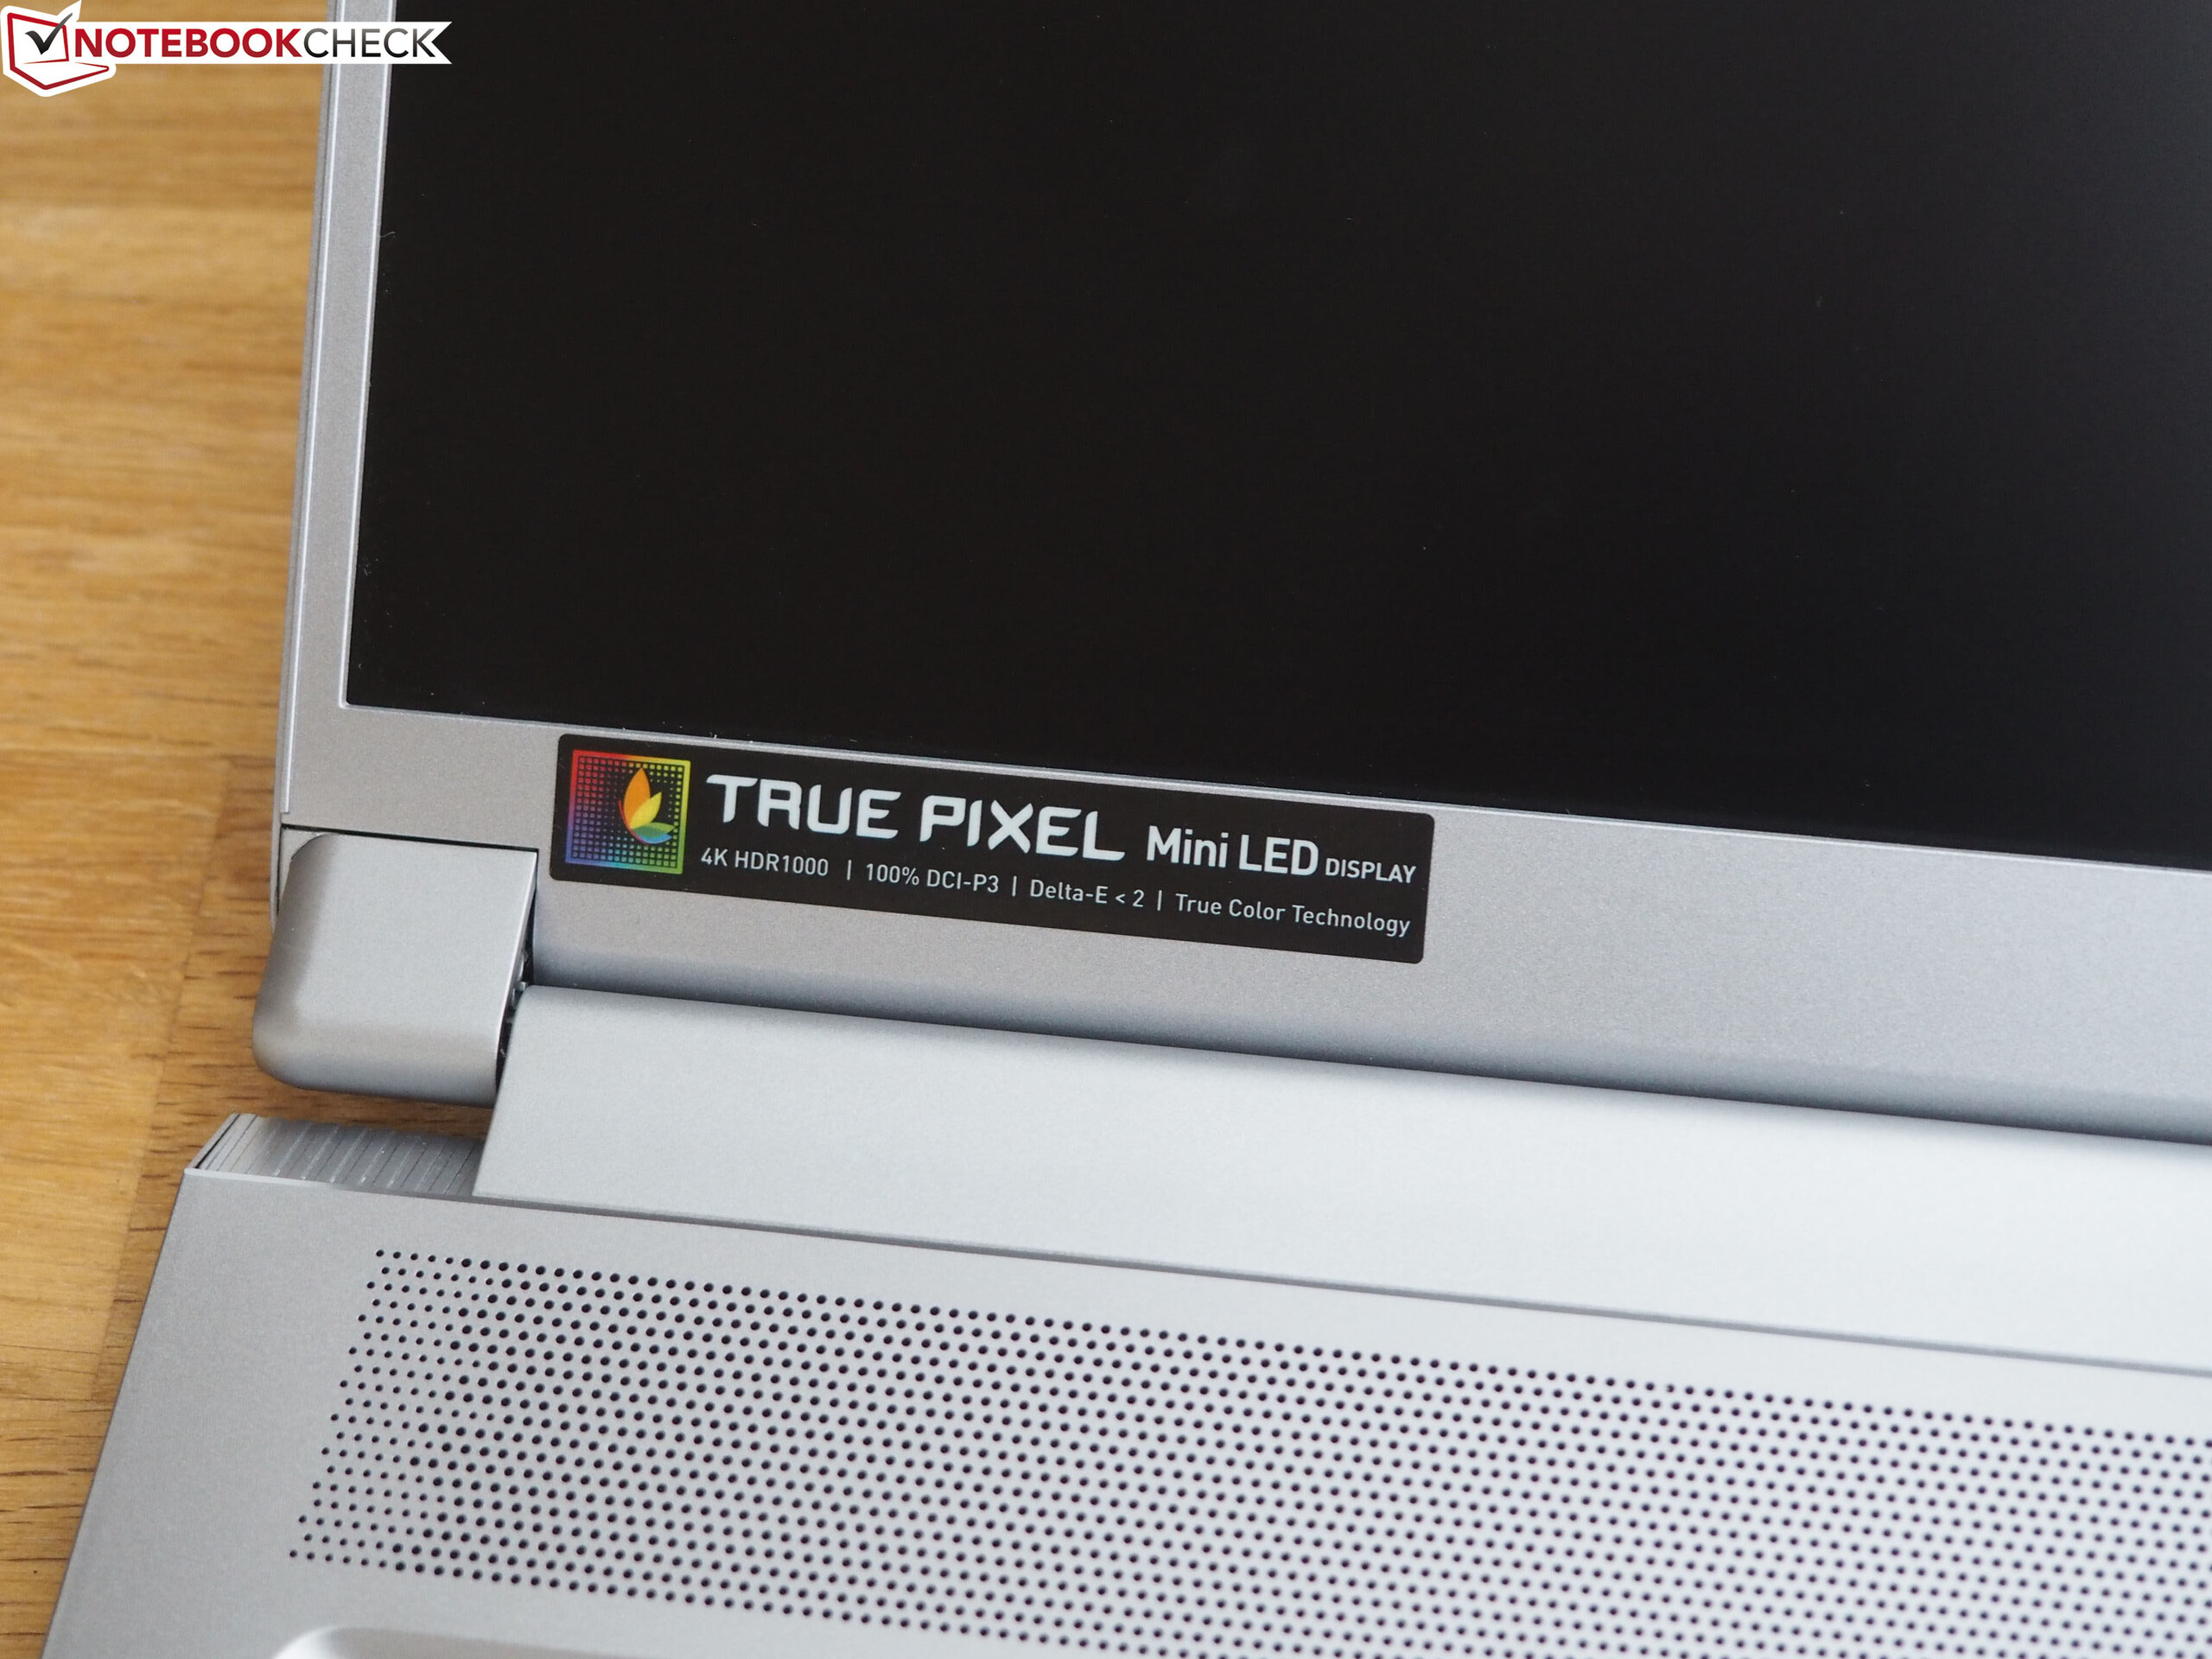
MSI web sitesi şu anda Yaratıcı 17 için dört temel yapılandırma listelemektedir. A10SE modeli bir GeForce RTX 2060 kullanırken, A10SF bir RTX 2070 Max-Q ve RTX 2070 Super Max-Q ile A10SFS ile donatılmıştır. RTX 2080 Super Max-Q kullanan A10SGS modeli test birimimiz özellikle pahalıdır. Ekran açısından, 144 Hz Full HD panel veya 60 Hz UHD panel seçebilirsiniz (Mini LED teknolojisi dahil veya değil). Bununla MSI, Mini LED dizüstü bilgisayarı piyasaya süren ilk üreticidir.
Creator 17'nin rakipleri arasında Razer Blade Pro 17, Asus Zephyrus S GX701GXR, Alienware m17 R2 ve yukarıda bahsettiğimiz MSI GS75 9SG kardeş gibi ince bir yapıya sahip 17 inç yüksek kaliteli diğer dizüstü bilgisayarlar bulunuyor.
Derecelendirme | Tarih | Modeli | Ağırlık | Yükseklik | Boyut | Çözünürlük | Fiyat |
|---|---|---|---|---|---|---|---|
| 82.5 % v7 (old) | 07/2020 | MSI Creator 17 A10SGS i7-10875H, GeForce RTX 2080 Super Max-Q | 2.4 kg | 20 mm | 17.30" | 3840x2160 | |
| 82.9 % v7 (old) | 07/2019 | MSI GS75 Stealth 9SG i7-9750H, GeForce RTX 2080 Max-Q | 2.3 kg | 18.9 mm | 17.30" | 1920x1080 | |
| 87.7 % v7 (old) | 06/2019 | Razer Blade Pro 17 RTX 2080 Max-Q i7-9750H, GeForce RTX 2080 Max-Q | 2.8 kg | 19.9 mm | 17.30" | 1920x1080 | |
| 81.2 % v7 (old) | 12/2019 | Asus ROG Zephyrus S GX701GXR i7-9750H, GeForce RTX 2080 Max-Q | 2.7 kg | 18.7 mm | 17.30" | 1920x1080 | |
| 84.2 % v7 (old) | Alienware m17 R2 P41E i9-9980HK, GeForce RTX 2080 Max-Q | 2.6 kg | 20.5 mm | 17.30" | 1920x1080 |
Durum
Ne yazık ki, dava prim fiyatına adalet vermiyor. Çoğunlukla alüminyumdan yapılmış olsa da, malzeme kasayı çözmeye çalışırken ucuz bir dizüstü bilgisayara benzeyen ve aksi takdirde yüksek kaliteli izlenimi azaltan malzemeler çok fazla gıcırdıyor. GS75'e benzer şekilde MSI, kararlılık açısından arzulanan çok şey bırakıyor. Metal kullanımına rağmen, kapak ve taban ünitesi belirgin bir şekilde bastırılabilir. Diğer MSI modelleri burada belirgin şekilde daha iyi. Ancak en azından işçilik beklenen düzeyde.
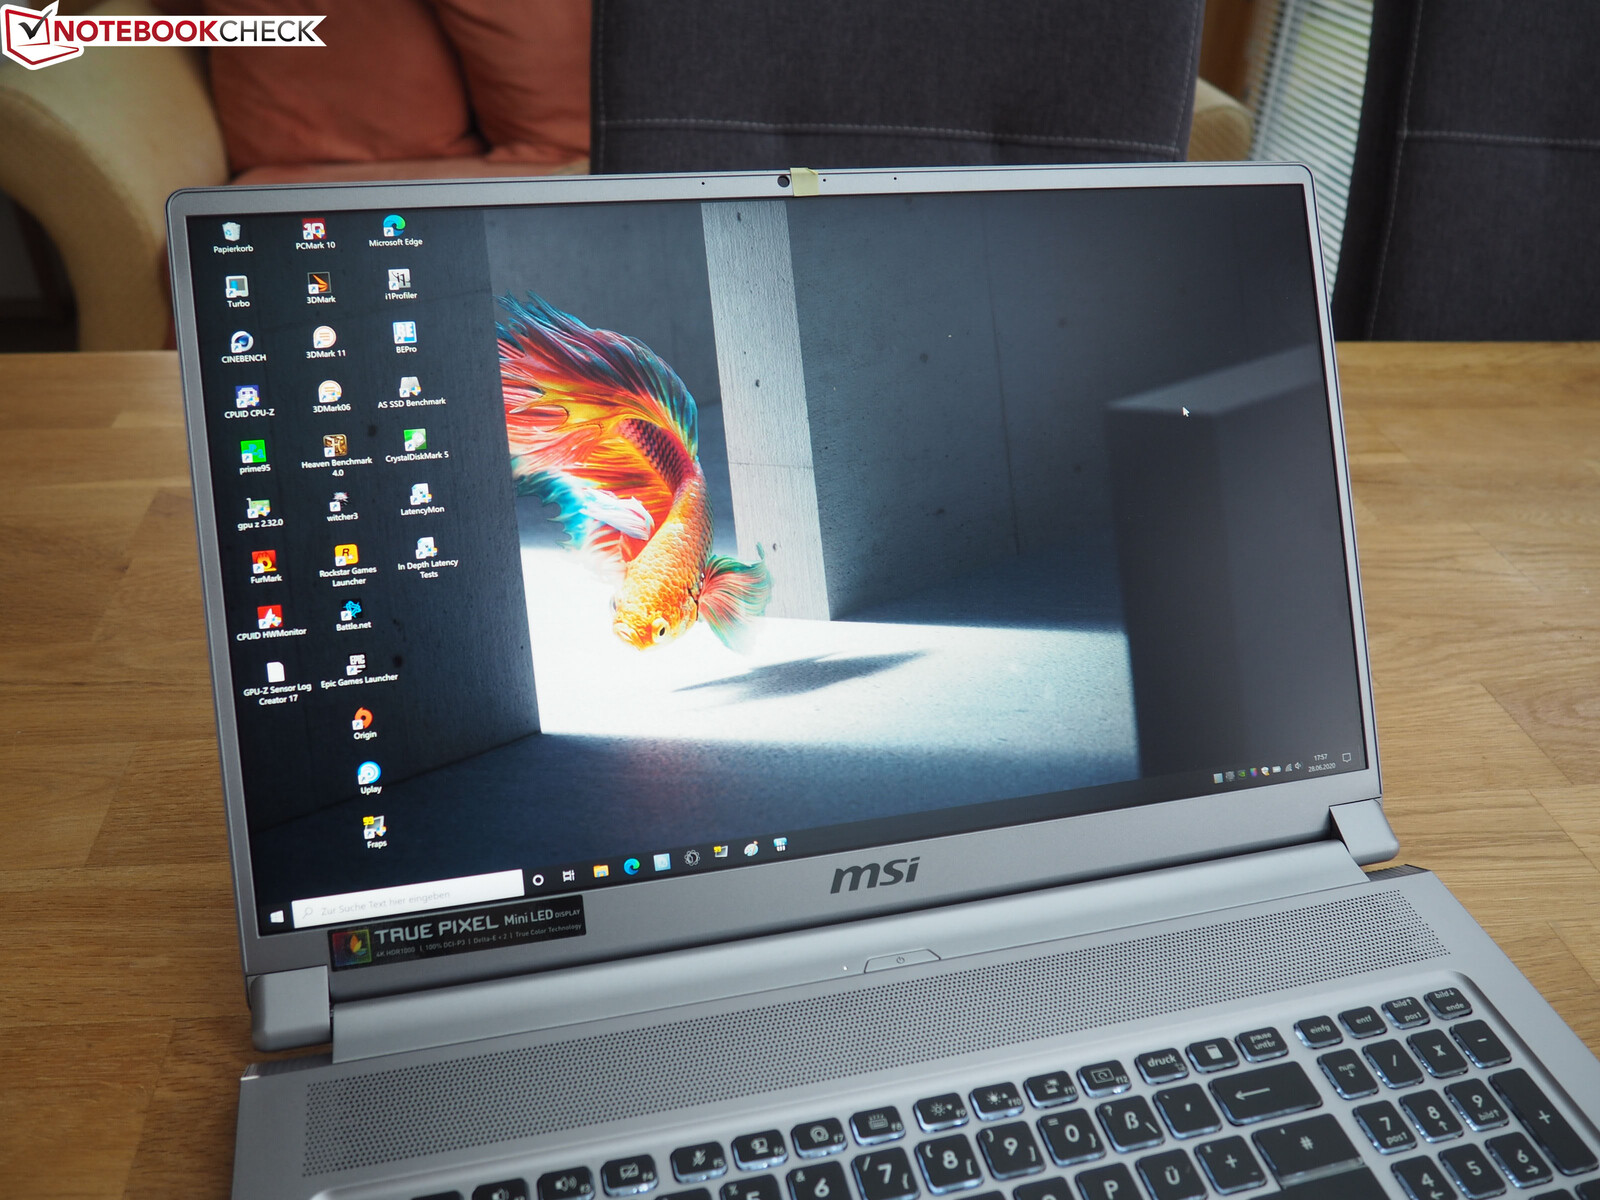
Saf görseller açısından, Yaratan 17 çok iyi bir figür sergiler. Gümüş-gri renk, ince çerçeve tasarımı ve düşük yükseklik (2.0 cm, ~ 0.8 inç) kombinasyonu, ne çok sıkıcı ne de çok eğlenceli olan ve her duruma uyan çok şık ve modern bir görünümü garanti eder. Yaklaşık 2,4 kg (~ 5,3 lb) ağırlık, 17 inçlik dizüstü bilgisayarların ve rakiplerin ölçeğinin alt ucundadır. Buna ek olarak, kullanıcılar 150 ° 'lik nispeten geniş açılma açısından da memnun olacaklardır.
ekipman
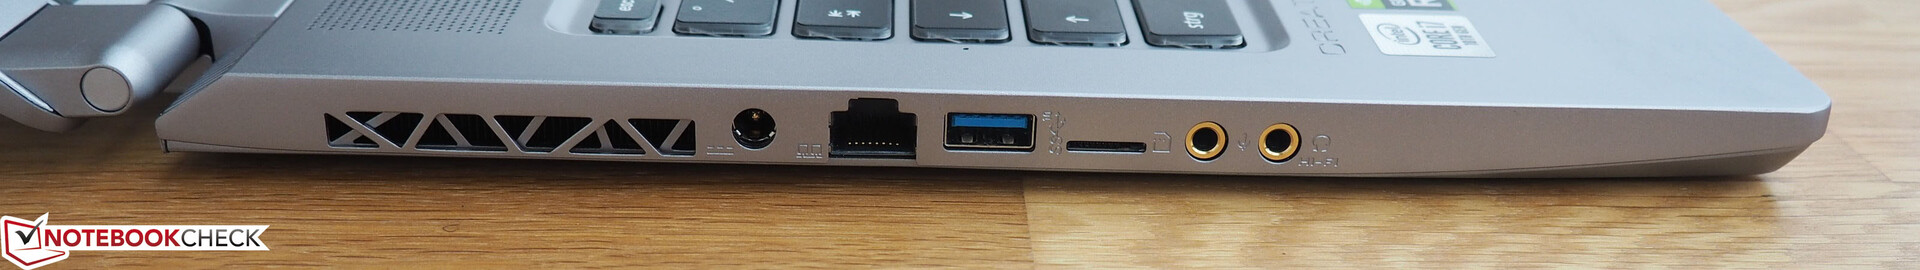
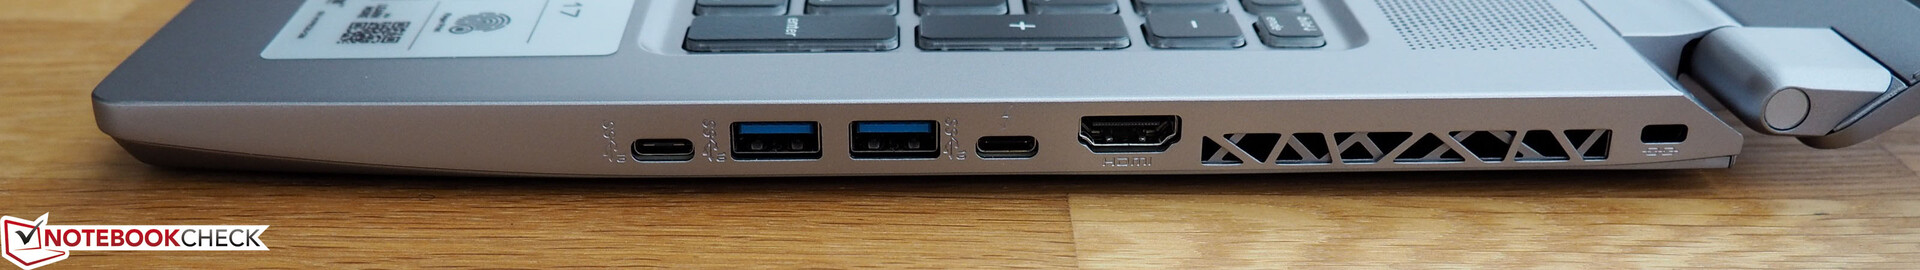
Bağlantılar açısından, MSI neredeyse hiç ödün vermez. MicroSD kart okuyucuyu dikkate almazsanız (burada standart bir modeli tercih ederdik), Creator 17, RJ45 bağlantı noktası, iki ses bağlantı noktası, HDMI-2.0 bağlantı noktası veya Kensington kilit açıklığı gibi geniş bir bağlantı seçeneği sunar . Bunlara bir Thunderbolt-3 bağlantı noktası, bir USB-C 3.1 Gen2 bağlantı noktası ve MSI ana sayfasına göre üç USB-A 3.0 bağlantı noktası eşlik eder (kasadaki etiketler 3.1 Gen2 = SS10 gösterir). Tüm bağlantılar her iki tarafın orta bölgesinde bulunduğundan, bir fare kullanıyorsanız, birçok bağlı kabloyla hareket açısından bazı sınırlamalar olabilir.
İletişim
AC yönlendirici yerine balta yönlendirici kullanan son zamanlarda yapılan test kurulumumuz nedeniyle, test sonuçları yalnızca Asus ROG Zephyrus S ile karşılaştırılabilir. Gönderirken 1270 Mb / s ve elde edilen verileri alırken 1340 Mb / s bir metre mesafedeki İçerik Oluşturucu 17, çok modern bir Wi-Fi yongasının avantajlarını gösterir. Eskiden çok popüler olan Kablosuz AC 9560 yerine, Wi-Fi 6 AX201 burada kablosuz bağlantıları yönetir.
| Networking | |
| iperf3 transmit AX12 | |
| MSI Creator 17 A10SGS | |
| Asus ROG Zephyrus S GX701GXR | |
| Razer Blade Pro 17 RTX 2080 Max-Q | |
| MSI GS75 Stealth 9SG | |
| Alienware m17 R2 P41E | |
| iperf3 receive AX12 | |
| MSI Creator 17 A10SGS | |
| Asus ROG Zephyrus S GX701GXR | |
| Razer Blade Pro 17 RTX 2080 Max-Q | |
| MSI GS75 Stealth 9SG | |
| Alienware m17 R2 P41E | |
Web kamerası
Çoğu üretici gibi, MSI en azından söylemek gerekirse sadece vasat bir web kamerası kullanır. Görüntü netliği ve renk hassasiyeti istenen bir şey bırakıyor.


Güvenlik
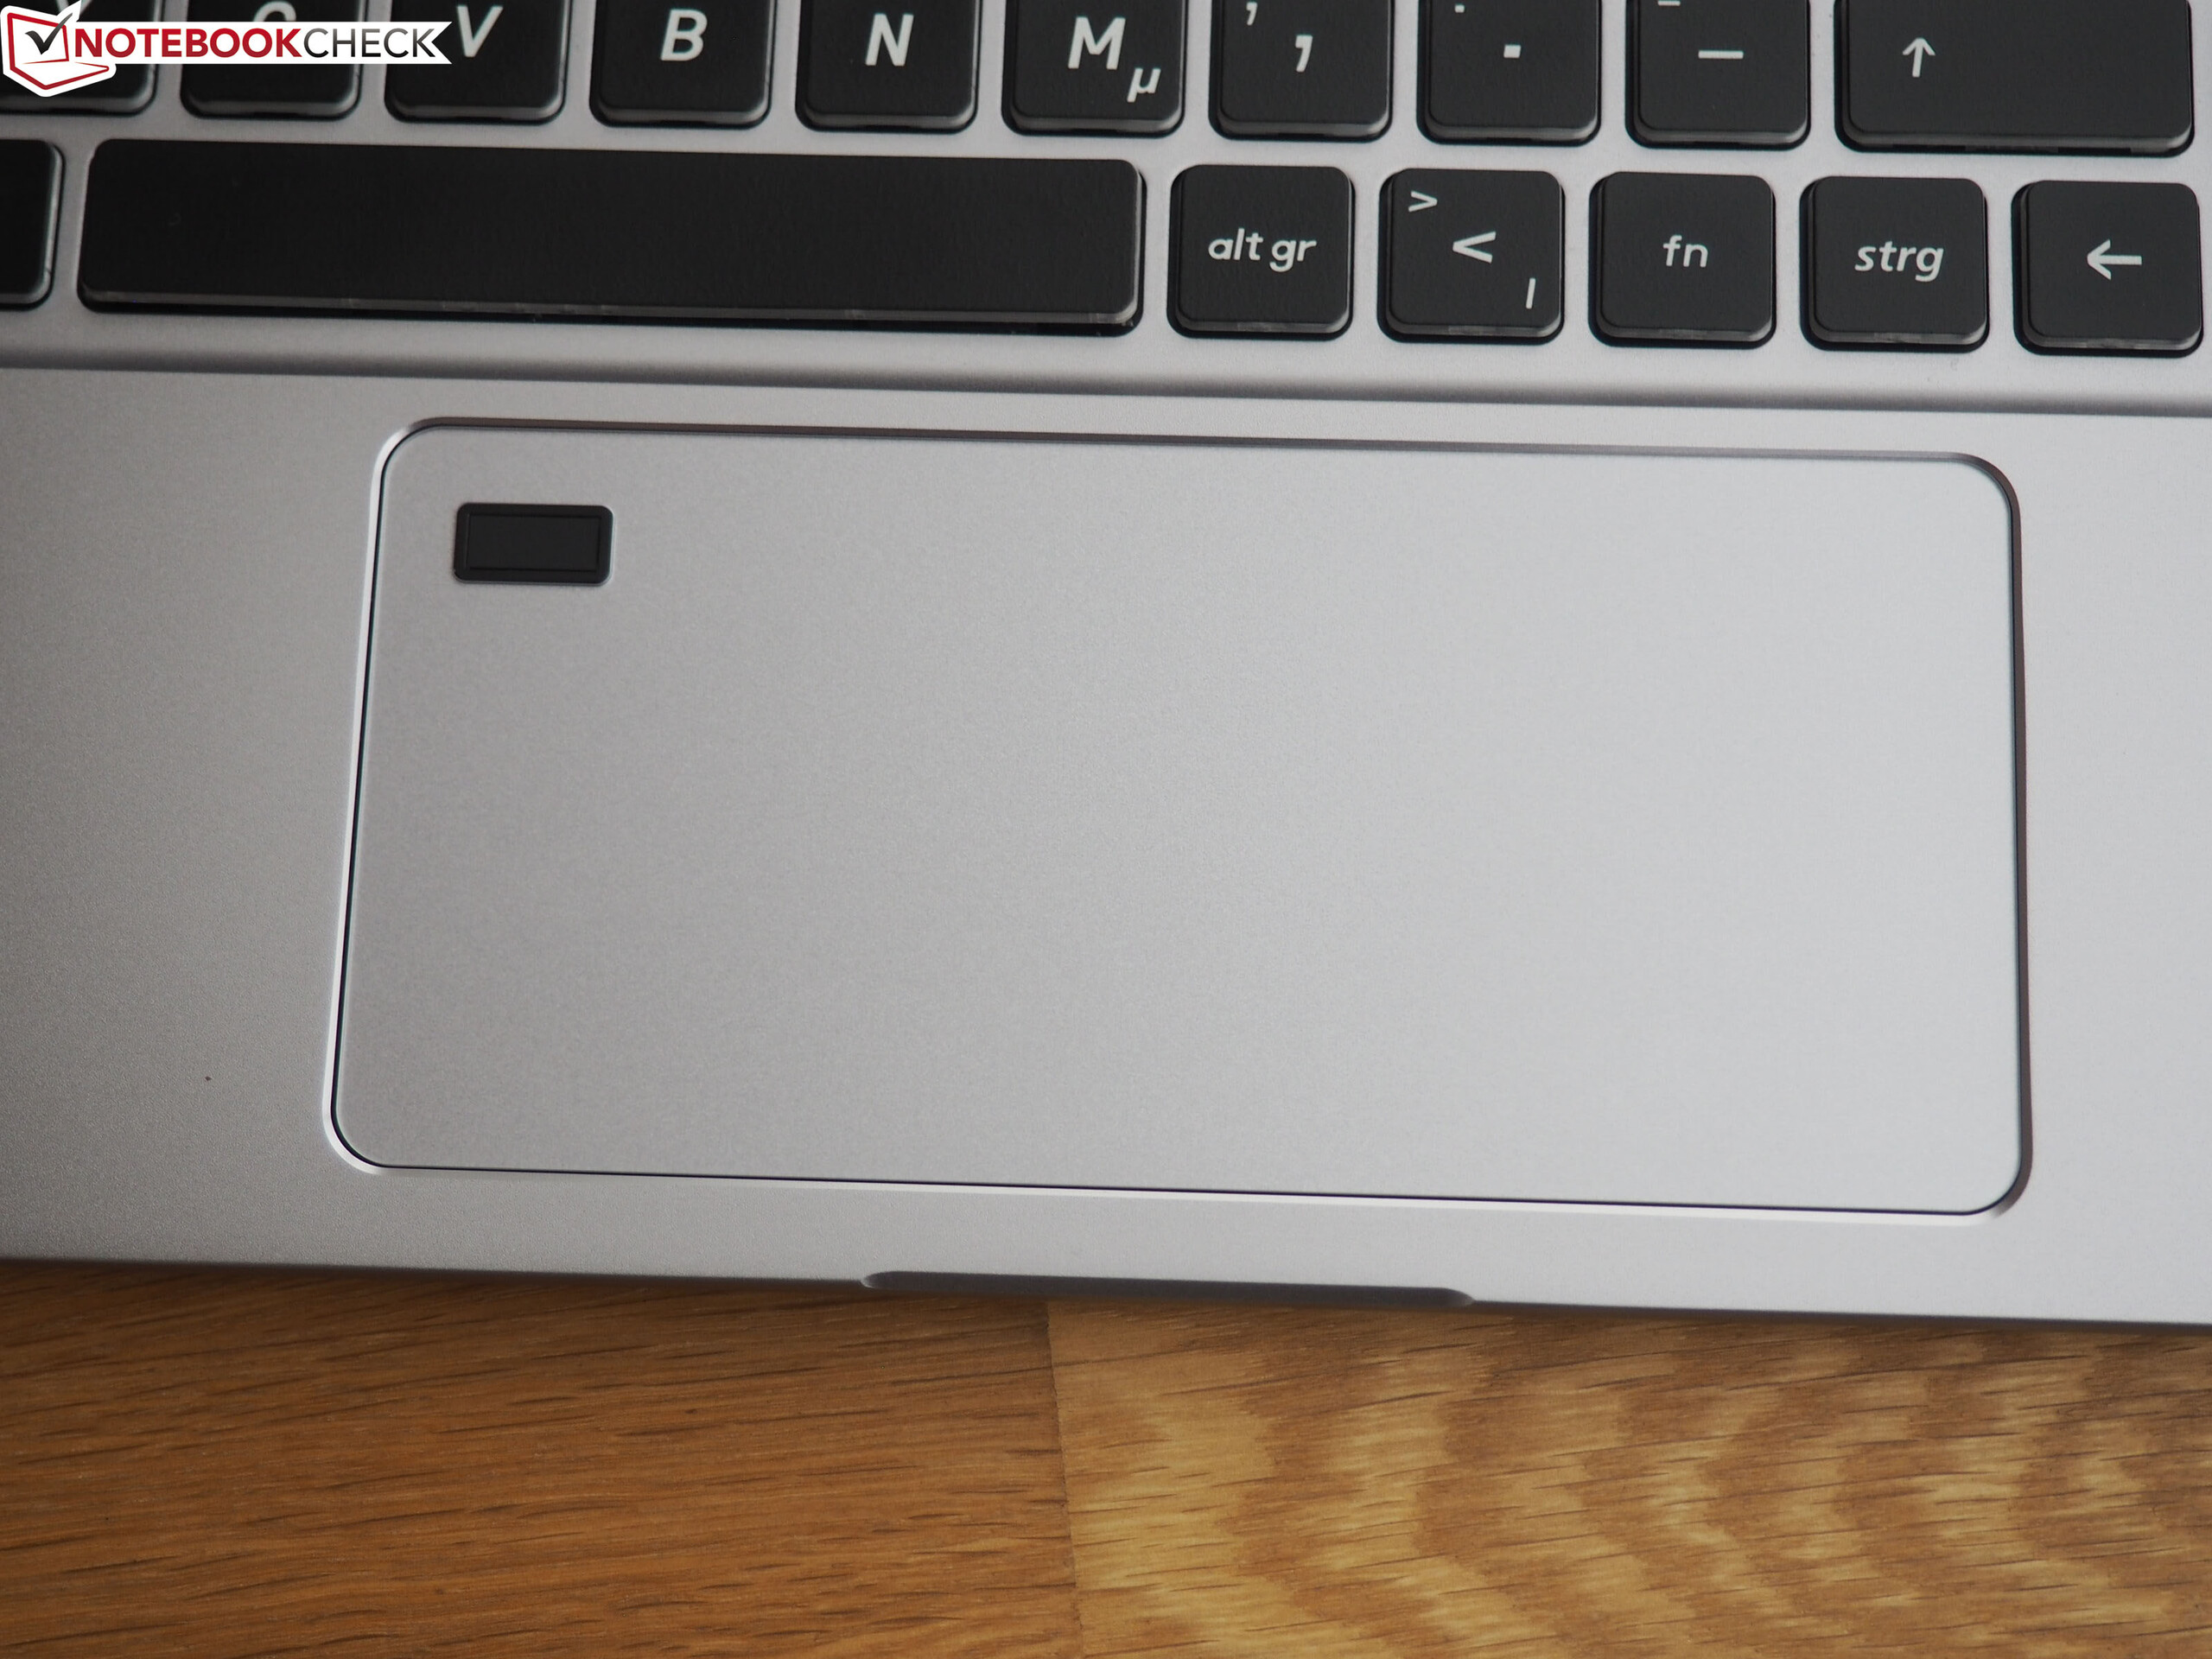
Renk seçiminin yanı sıra, dokunmatik yüzeye entegre parmak izi sensörü GS75'in en önemli farklılıklarından birini temsil ediyor.
Aksesuarlar
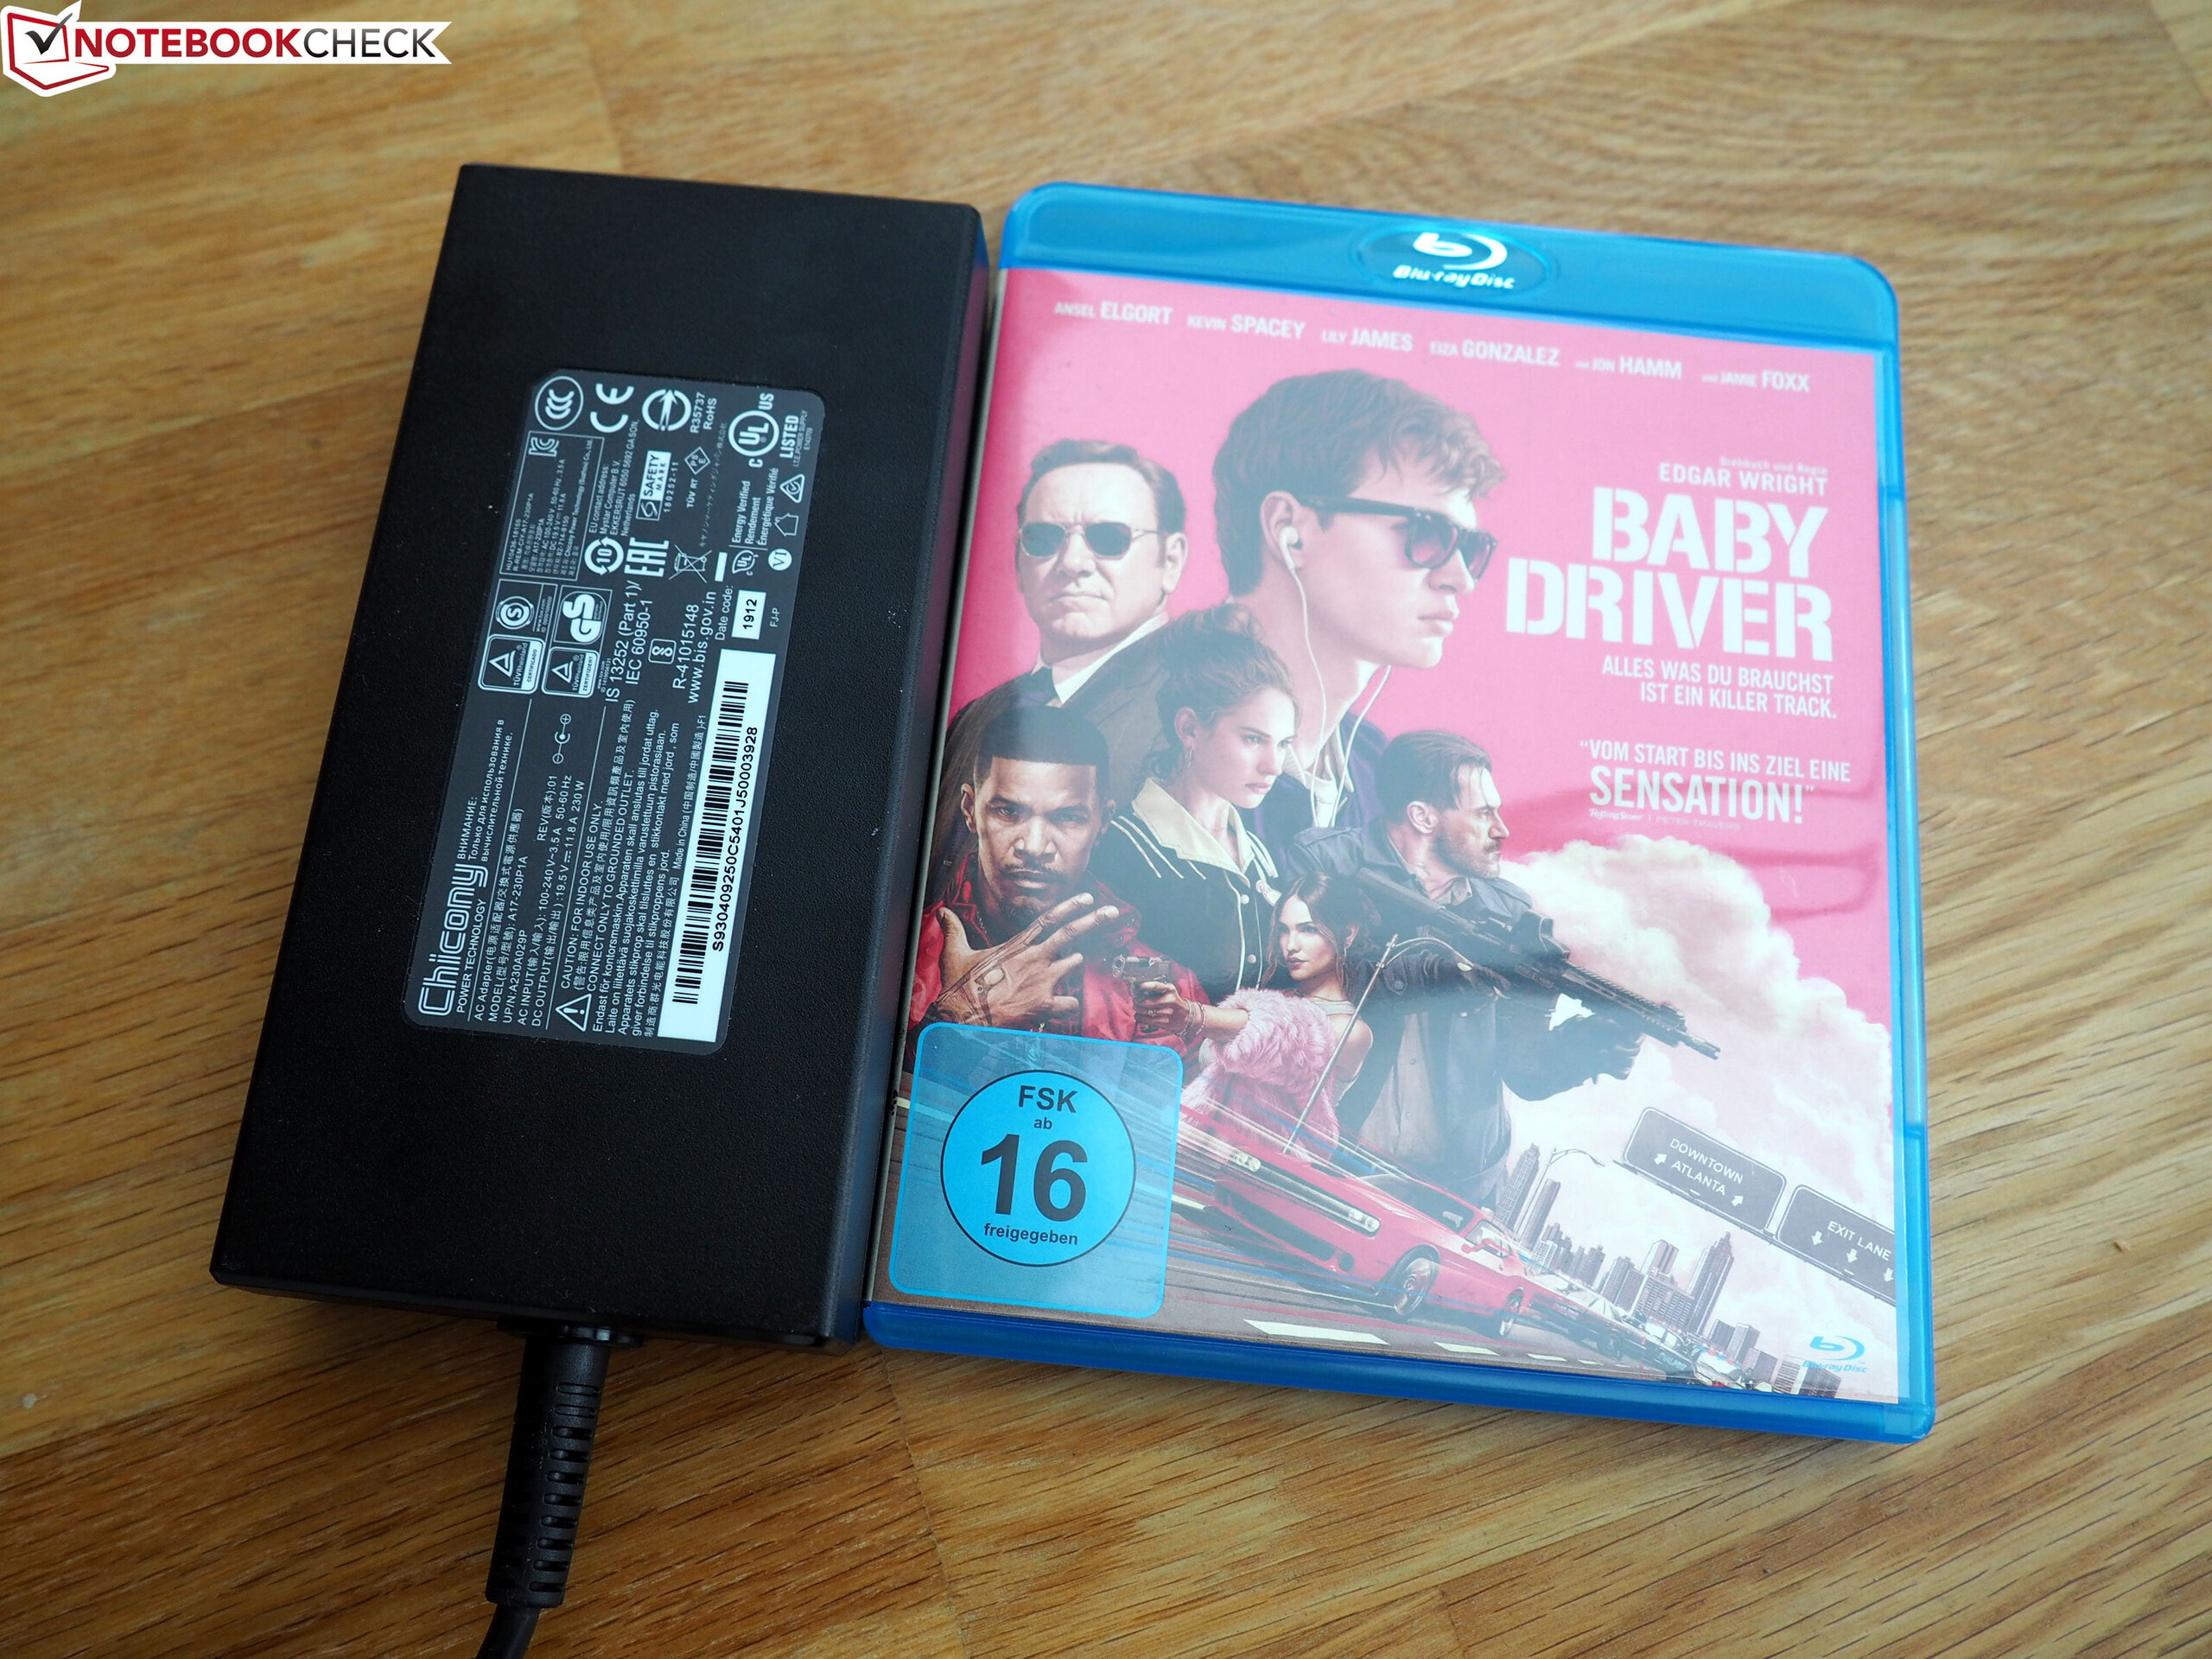
Yaklaşık 0,7 kg (~ 1,5 lb) ağırlığında ve 15 x 7 x 3 cm (~ 5,9 x 2,8 x 1,2 inç) ölçülerinde 230 watt'lık bir güç kaynağı dahildir.
Bakım
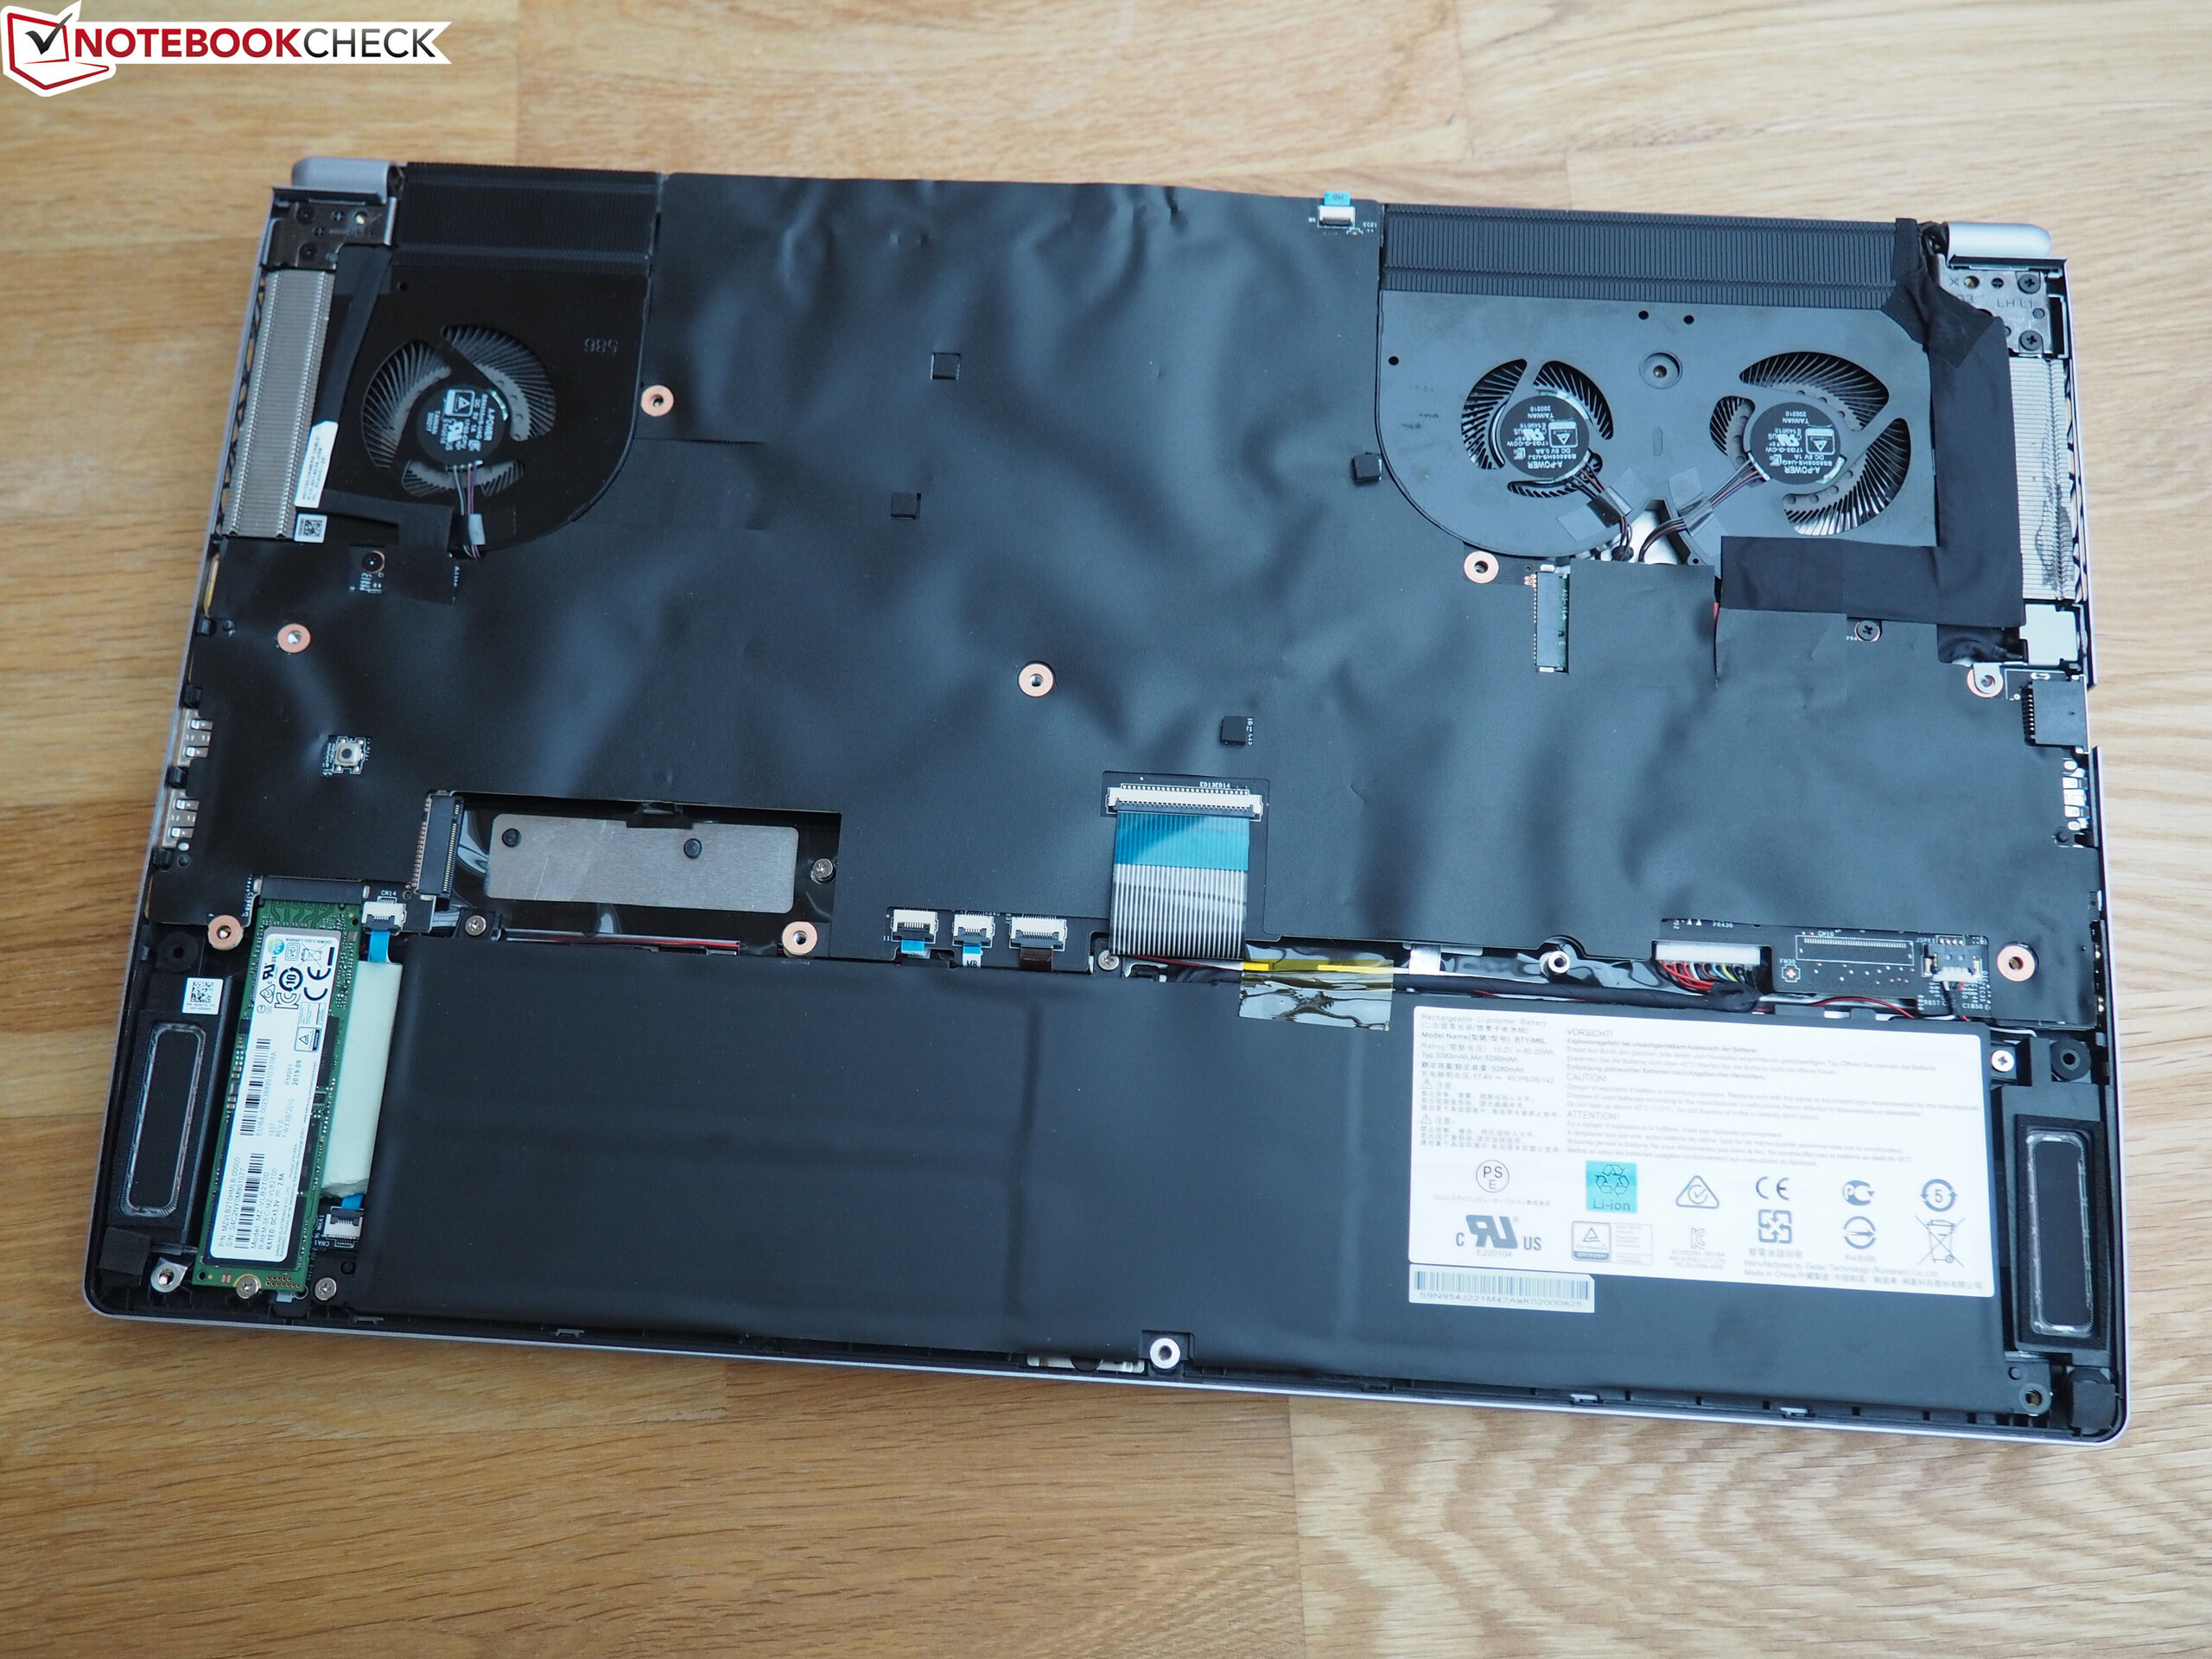
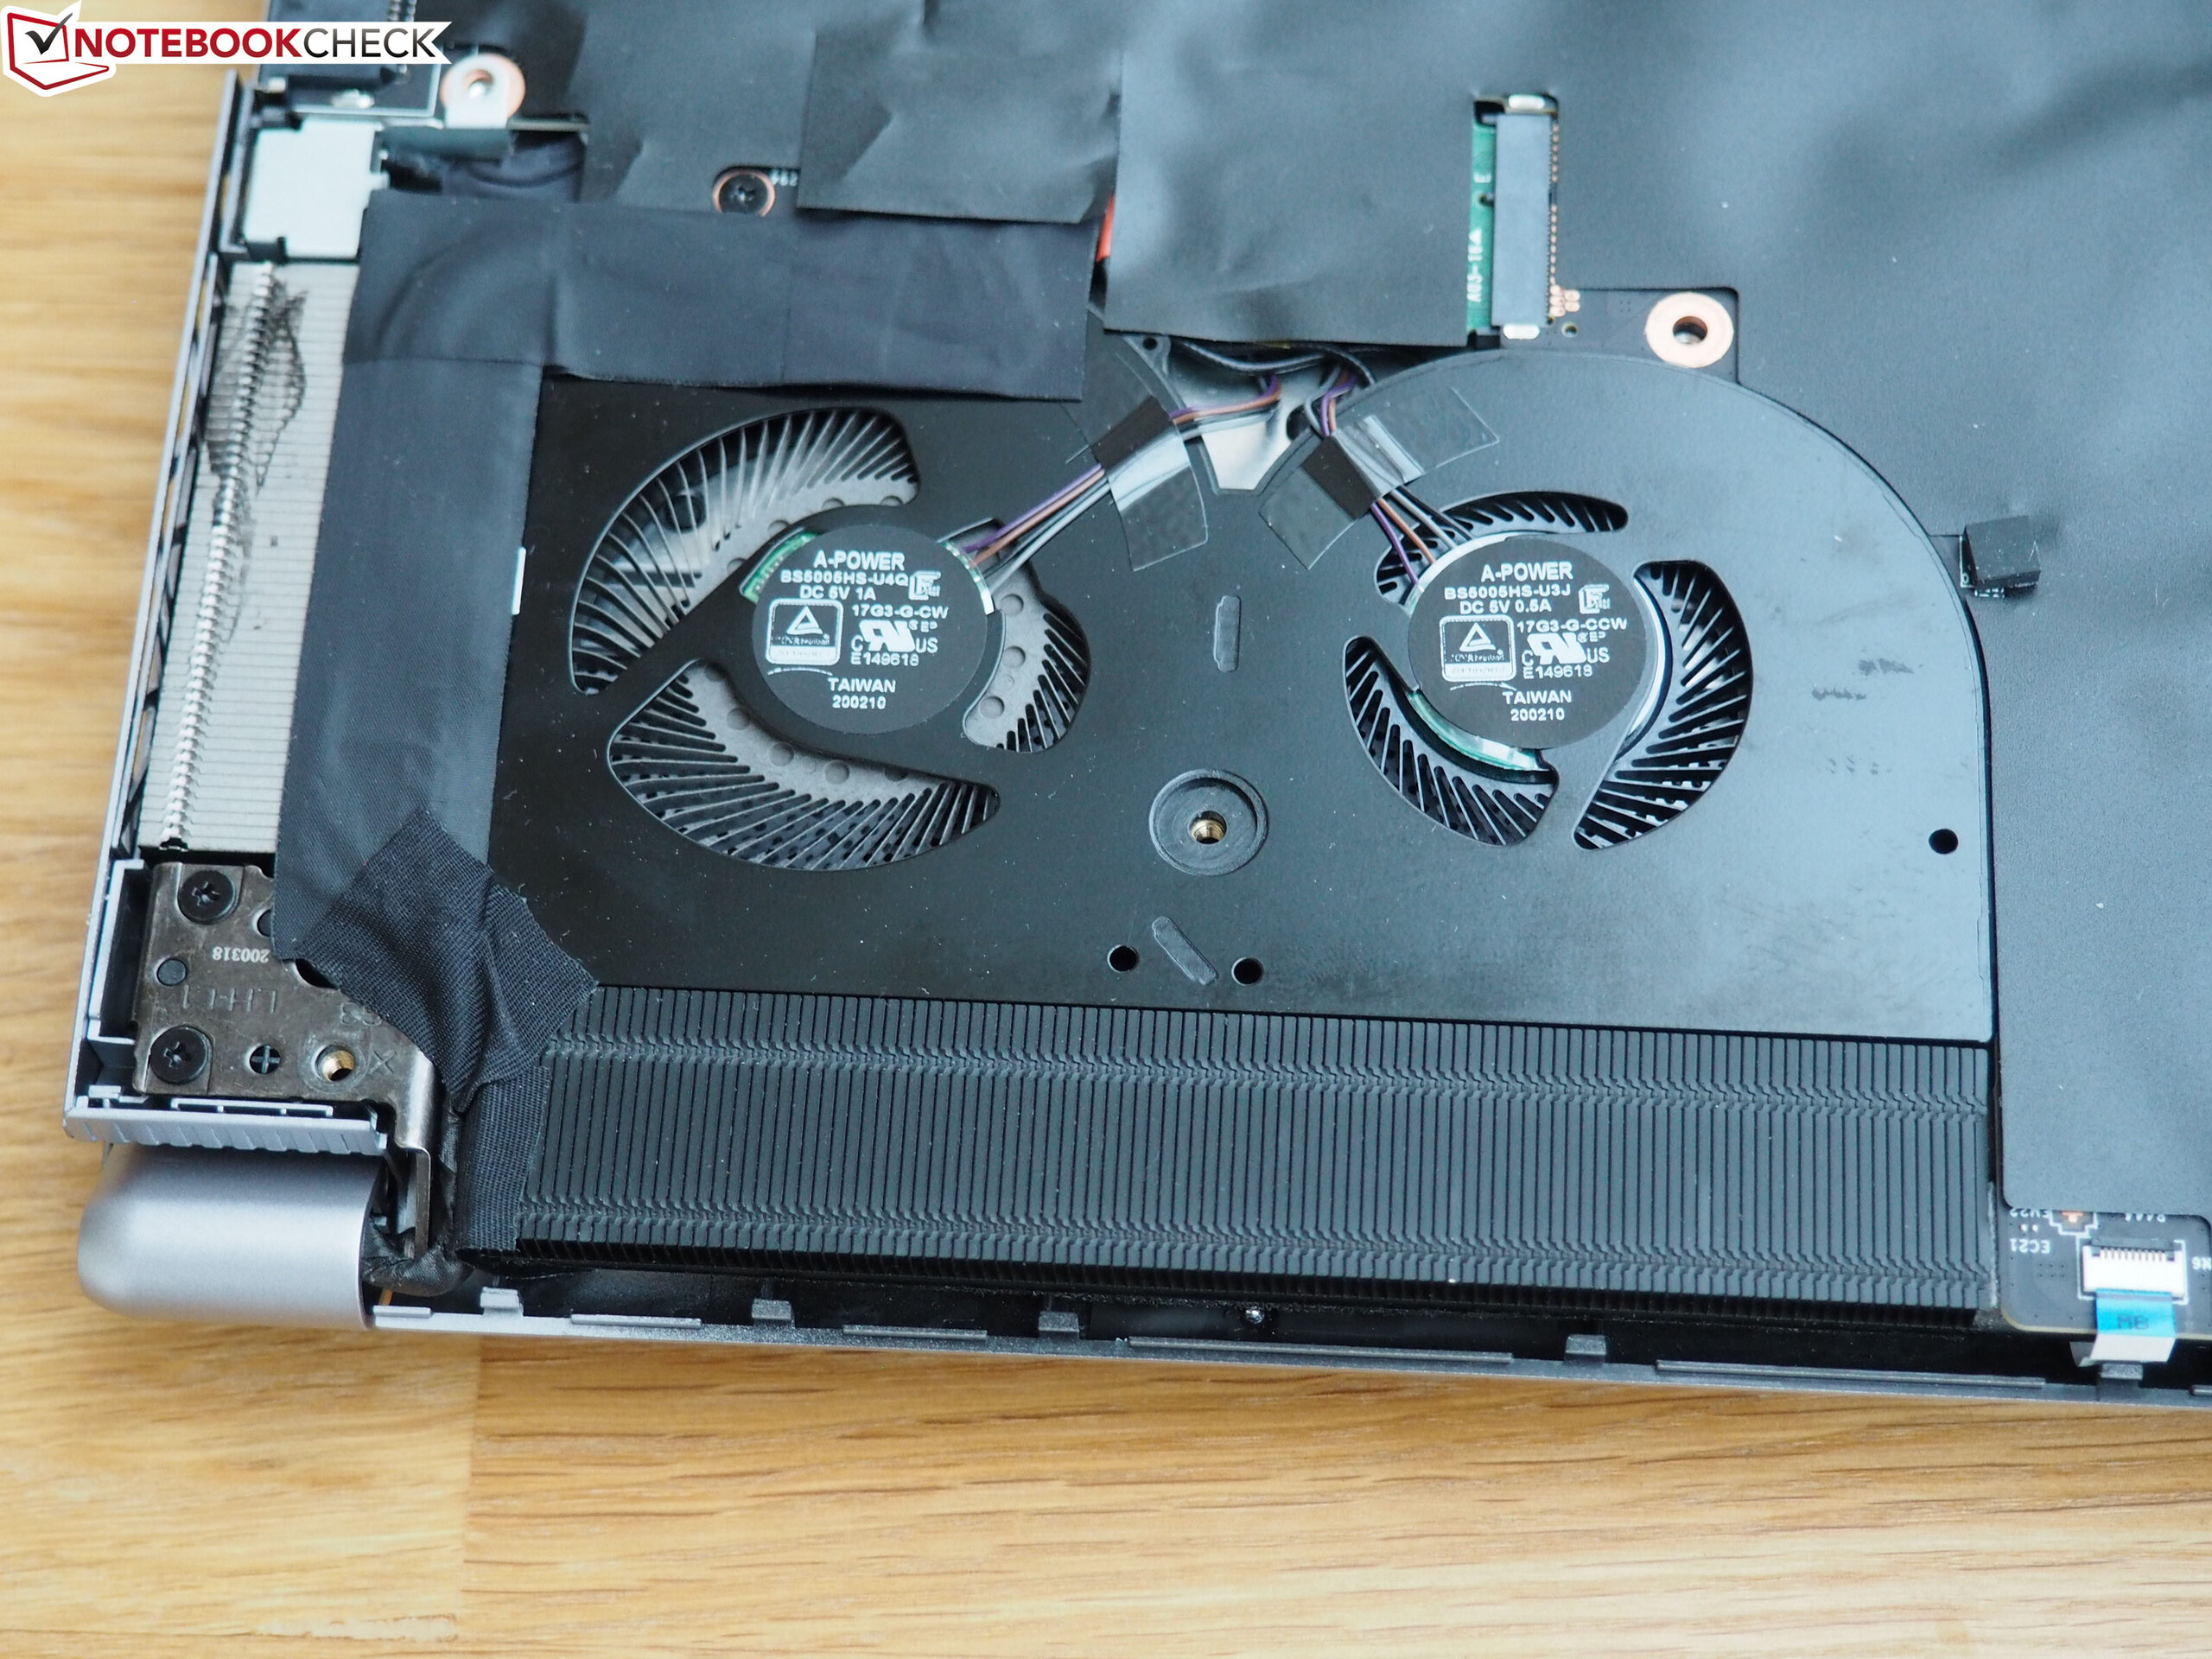
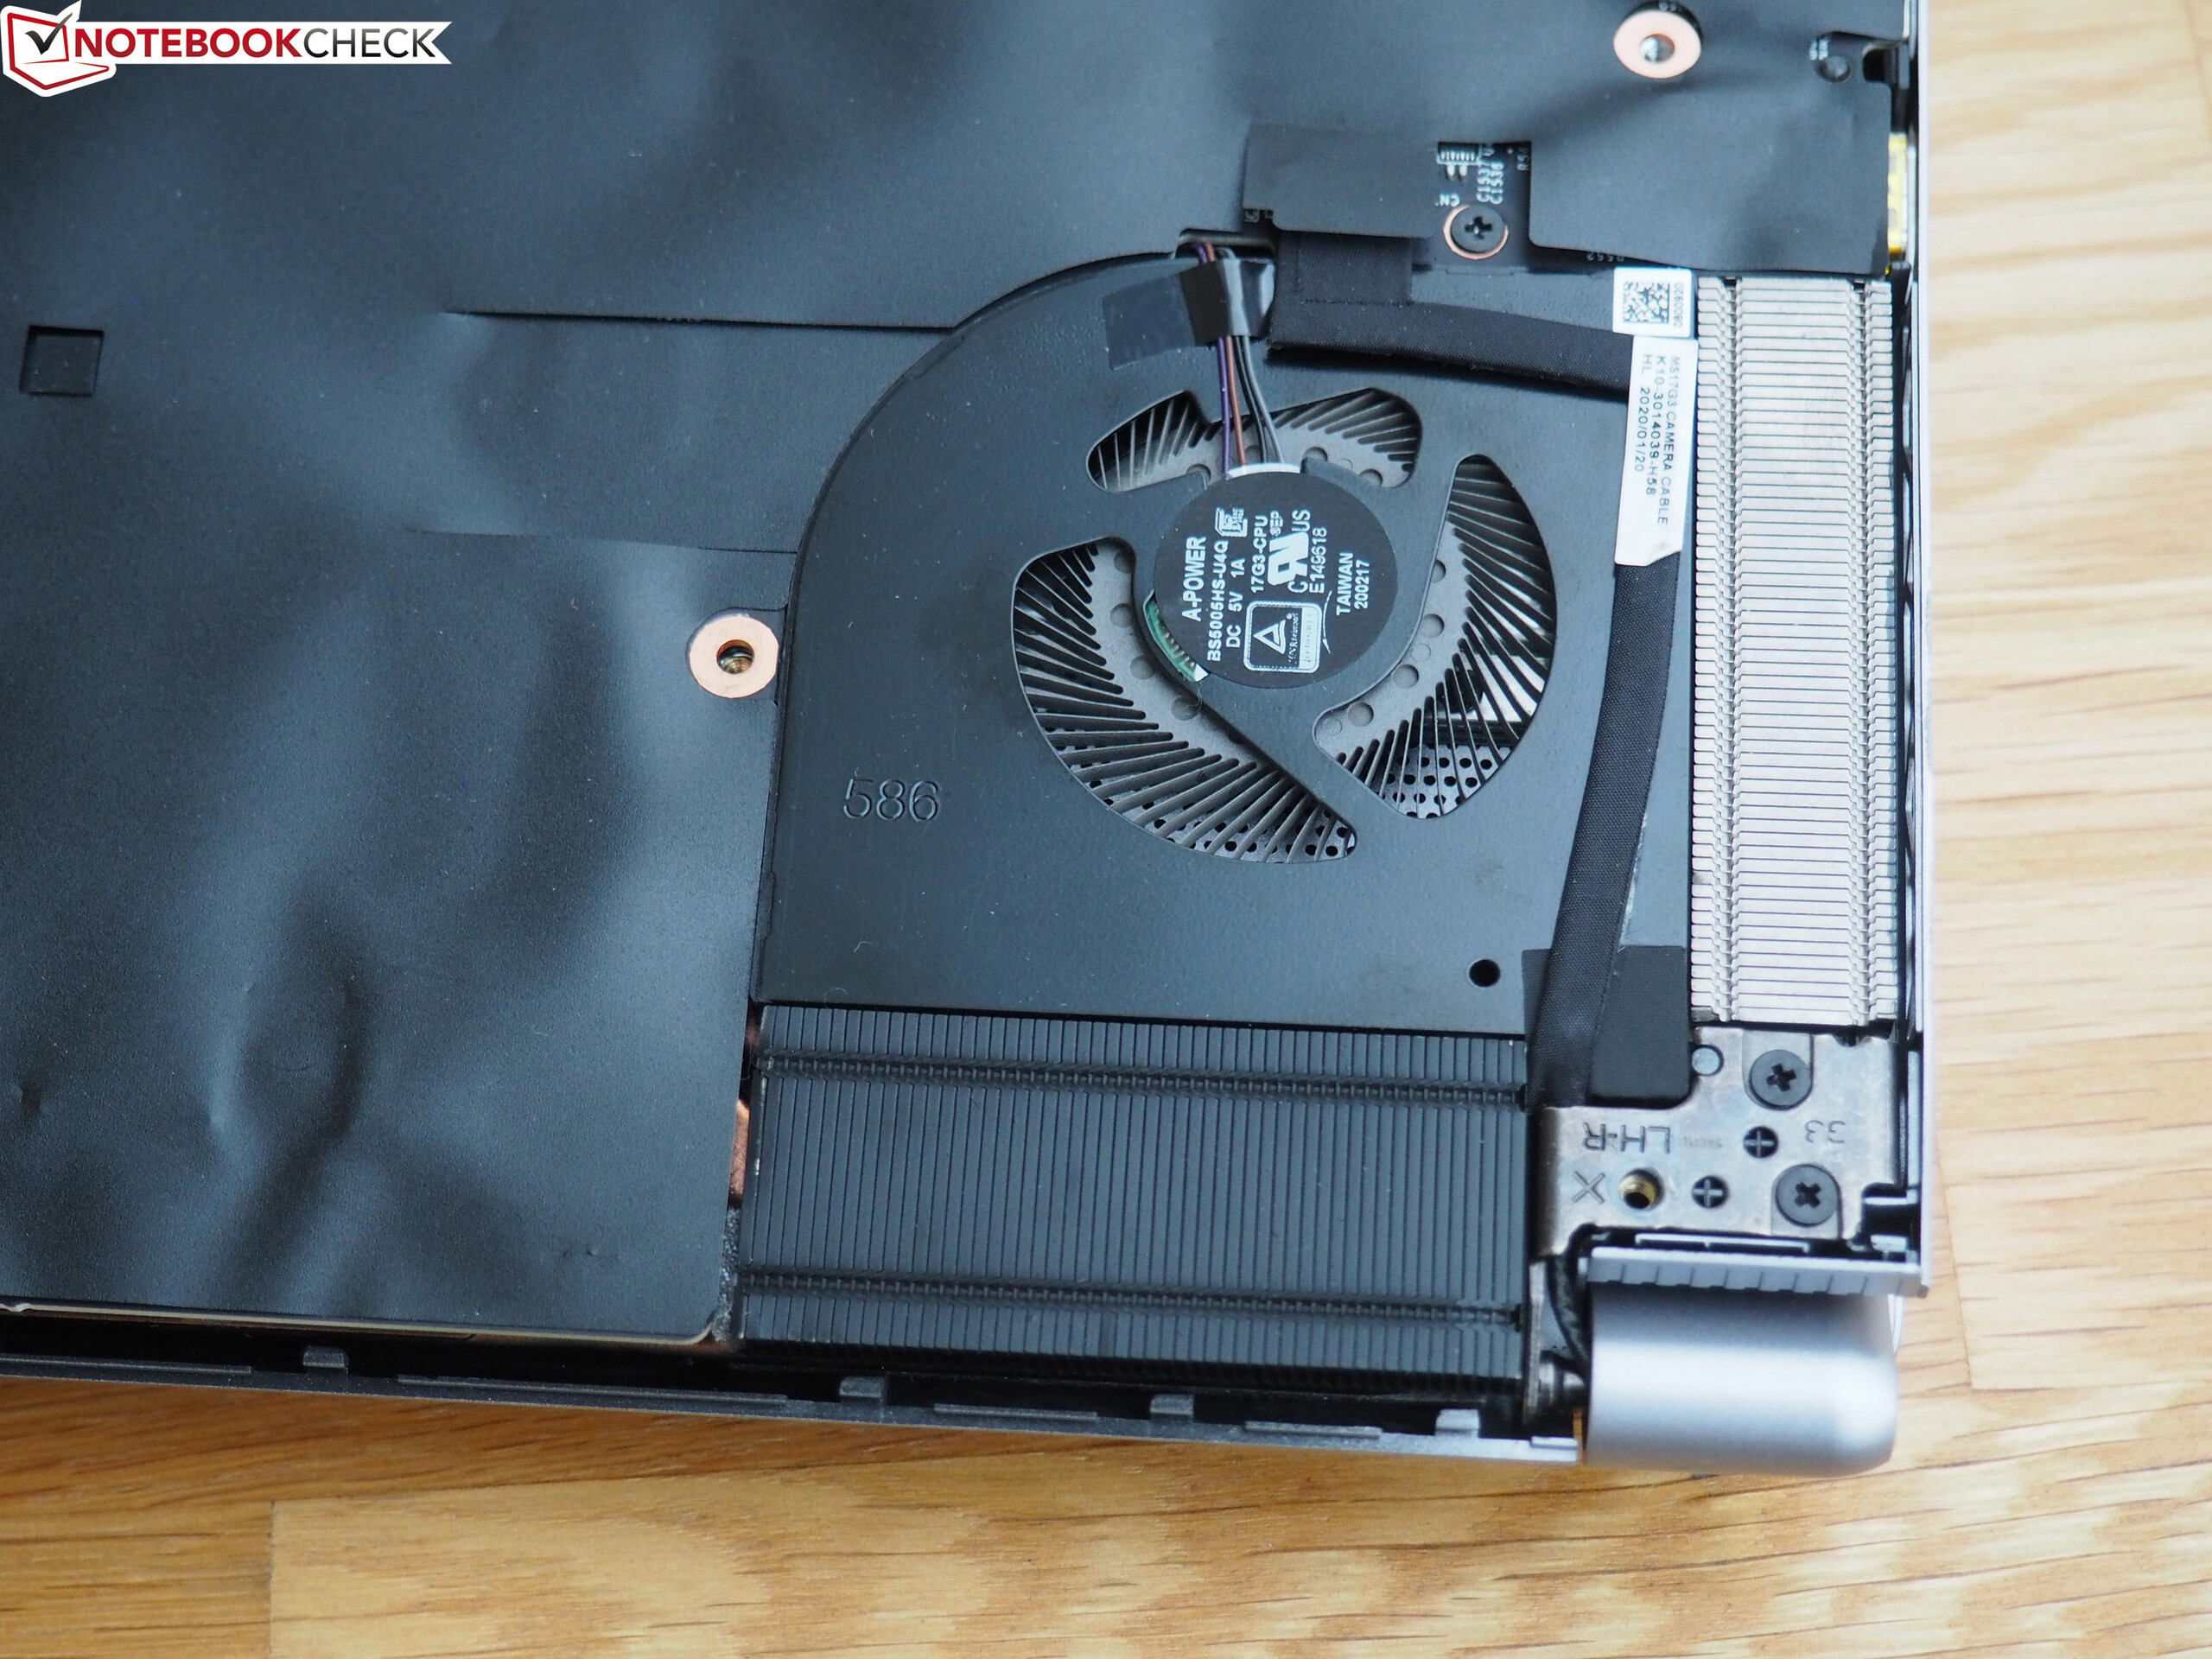
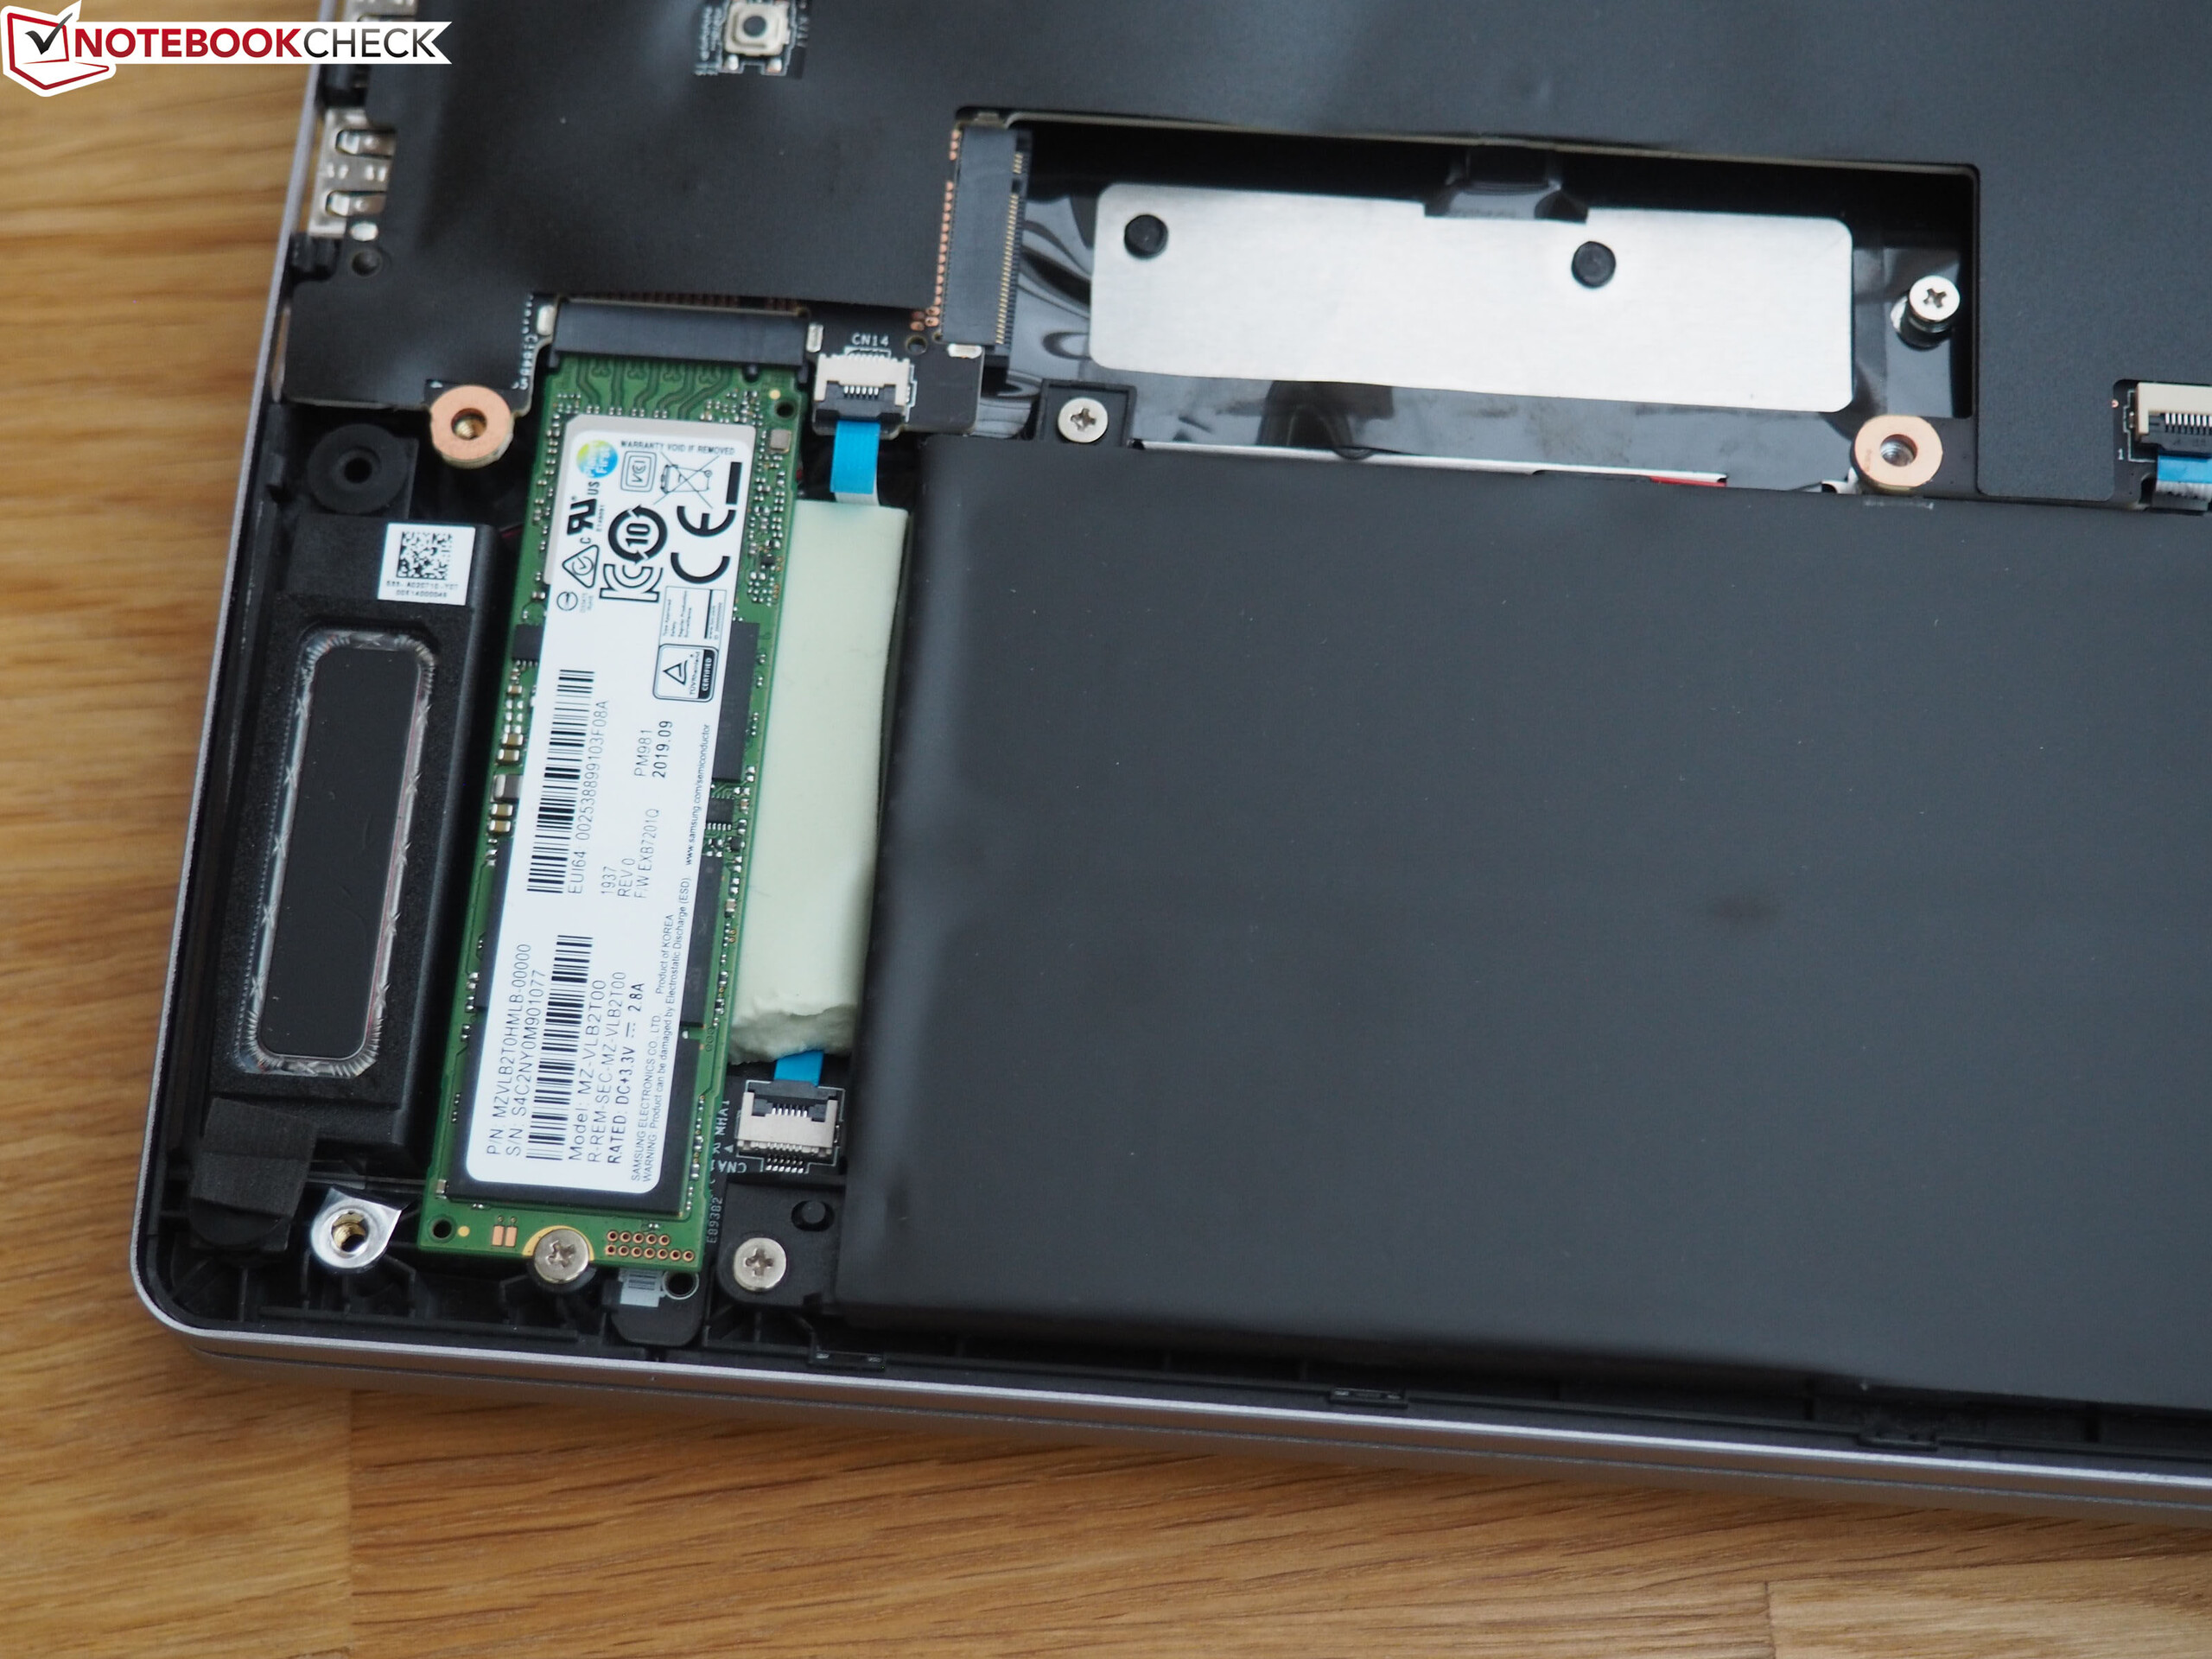
İç kısımlara ulaşmak için, önce kasa tabanından toplam 15 vidayı çıkarmanız ve ardından demirlemelerinden kaldırmanız gerekir. Fotoğraflarda da görebileceğiniz gibi, bileşenlerin bazı kısımları sadece fanlar, pil ve iki M.2 yuvasına doğrudan erişilebilecek şekilde siyah bir folyo ile kaplıdır.
Giriş cihazları
Keyboard
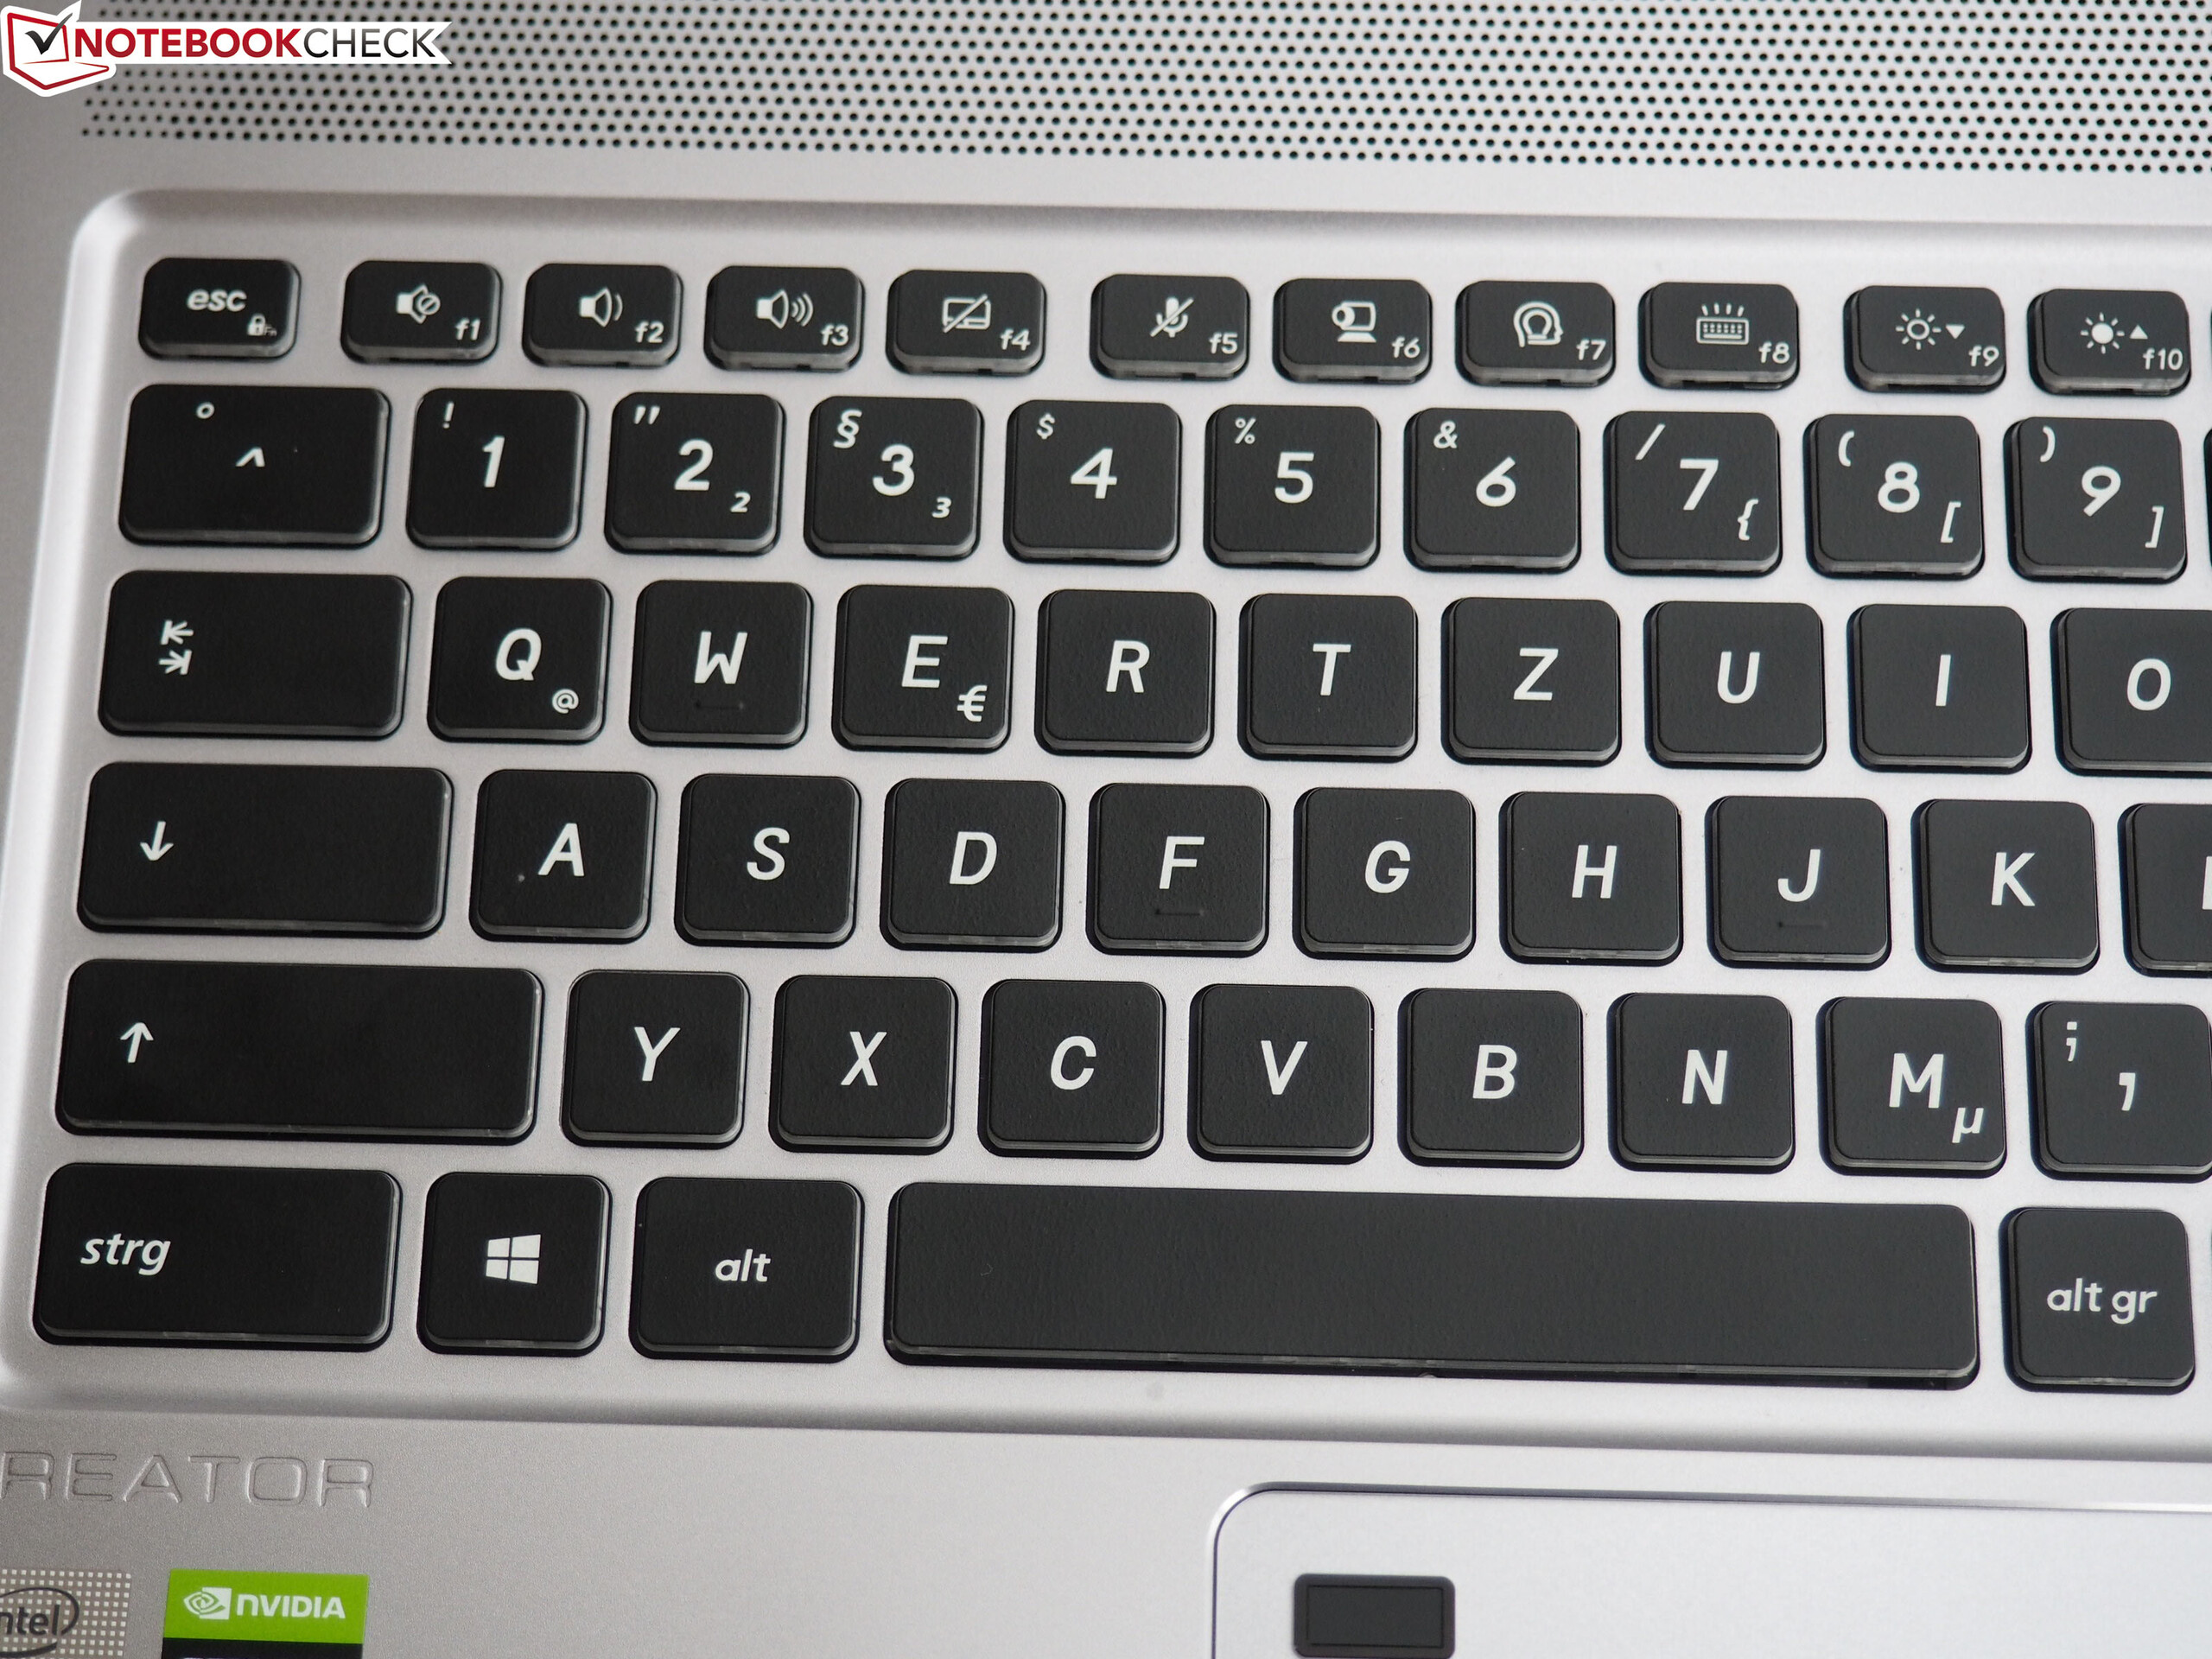
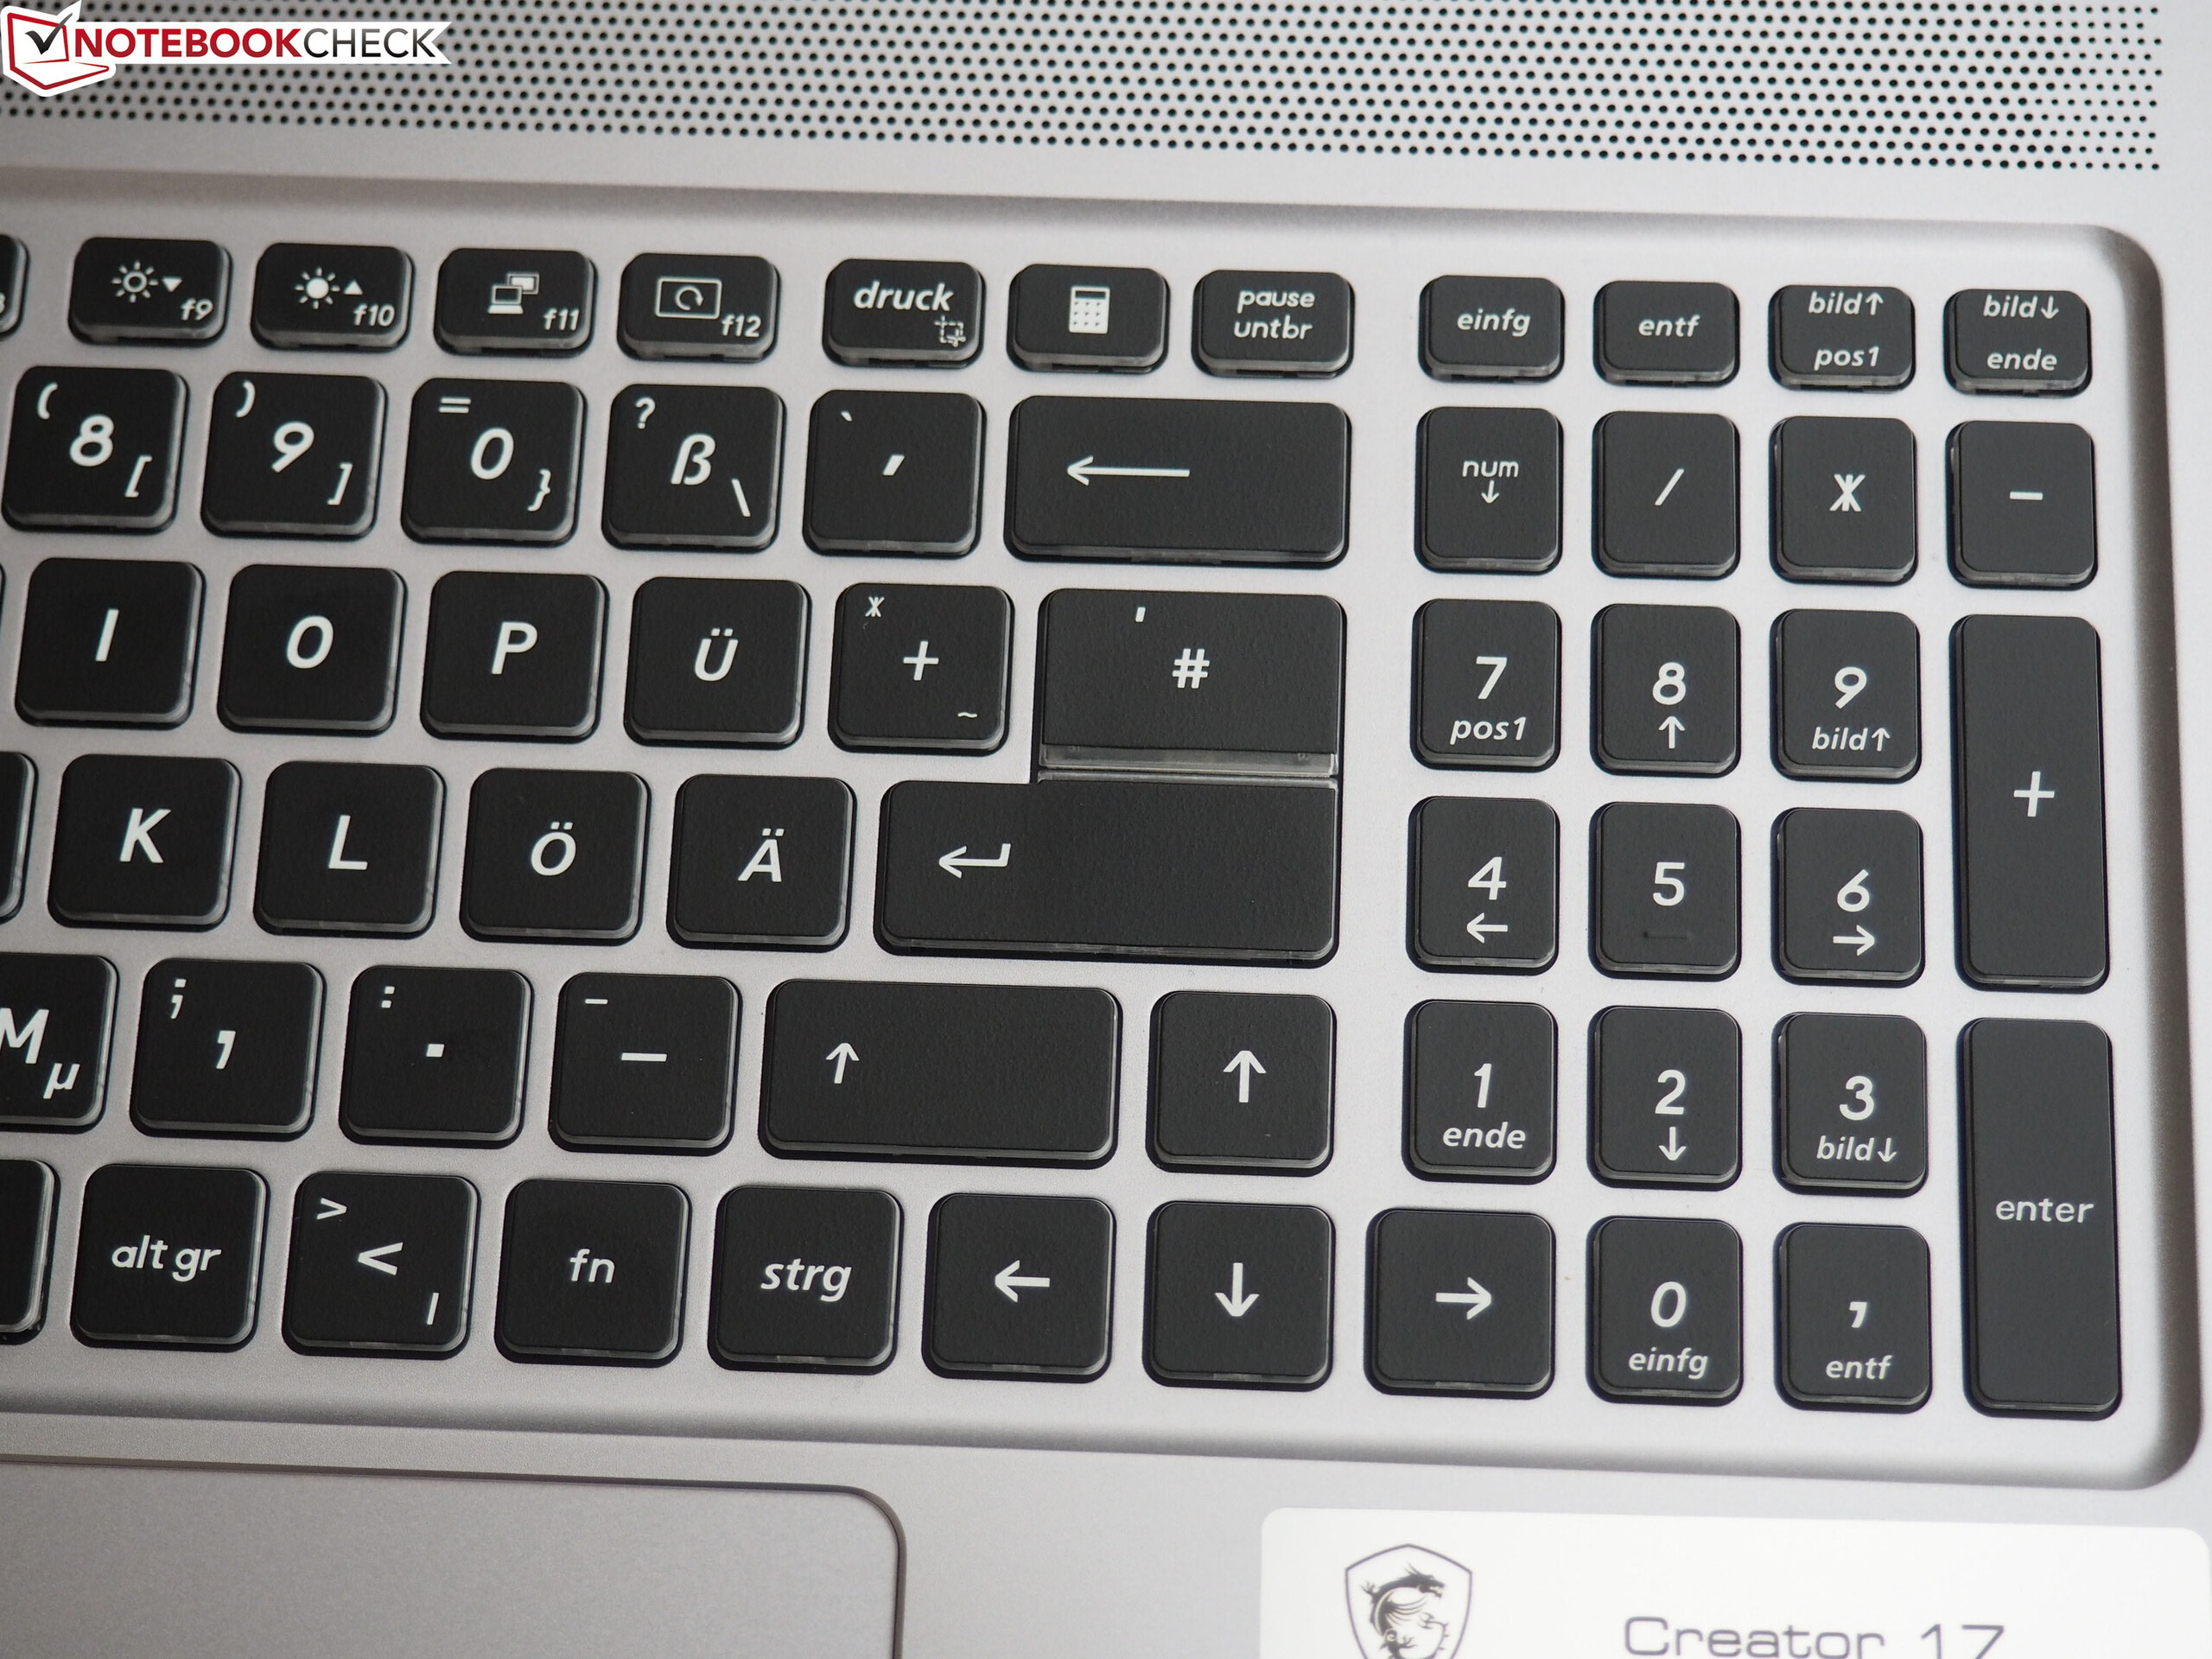
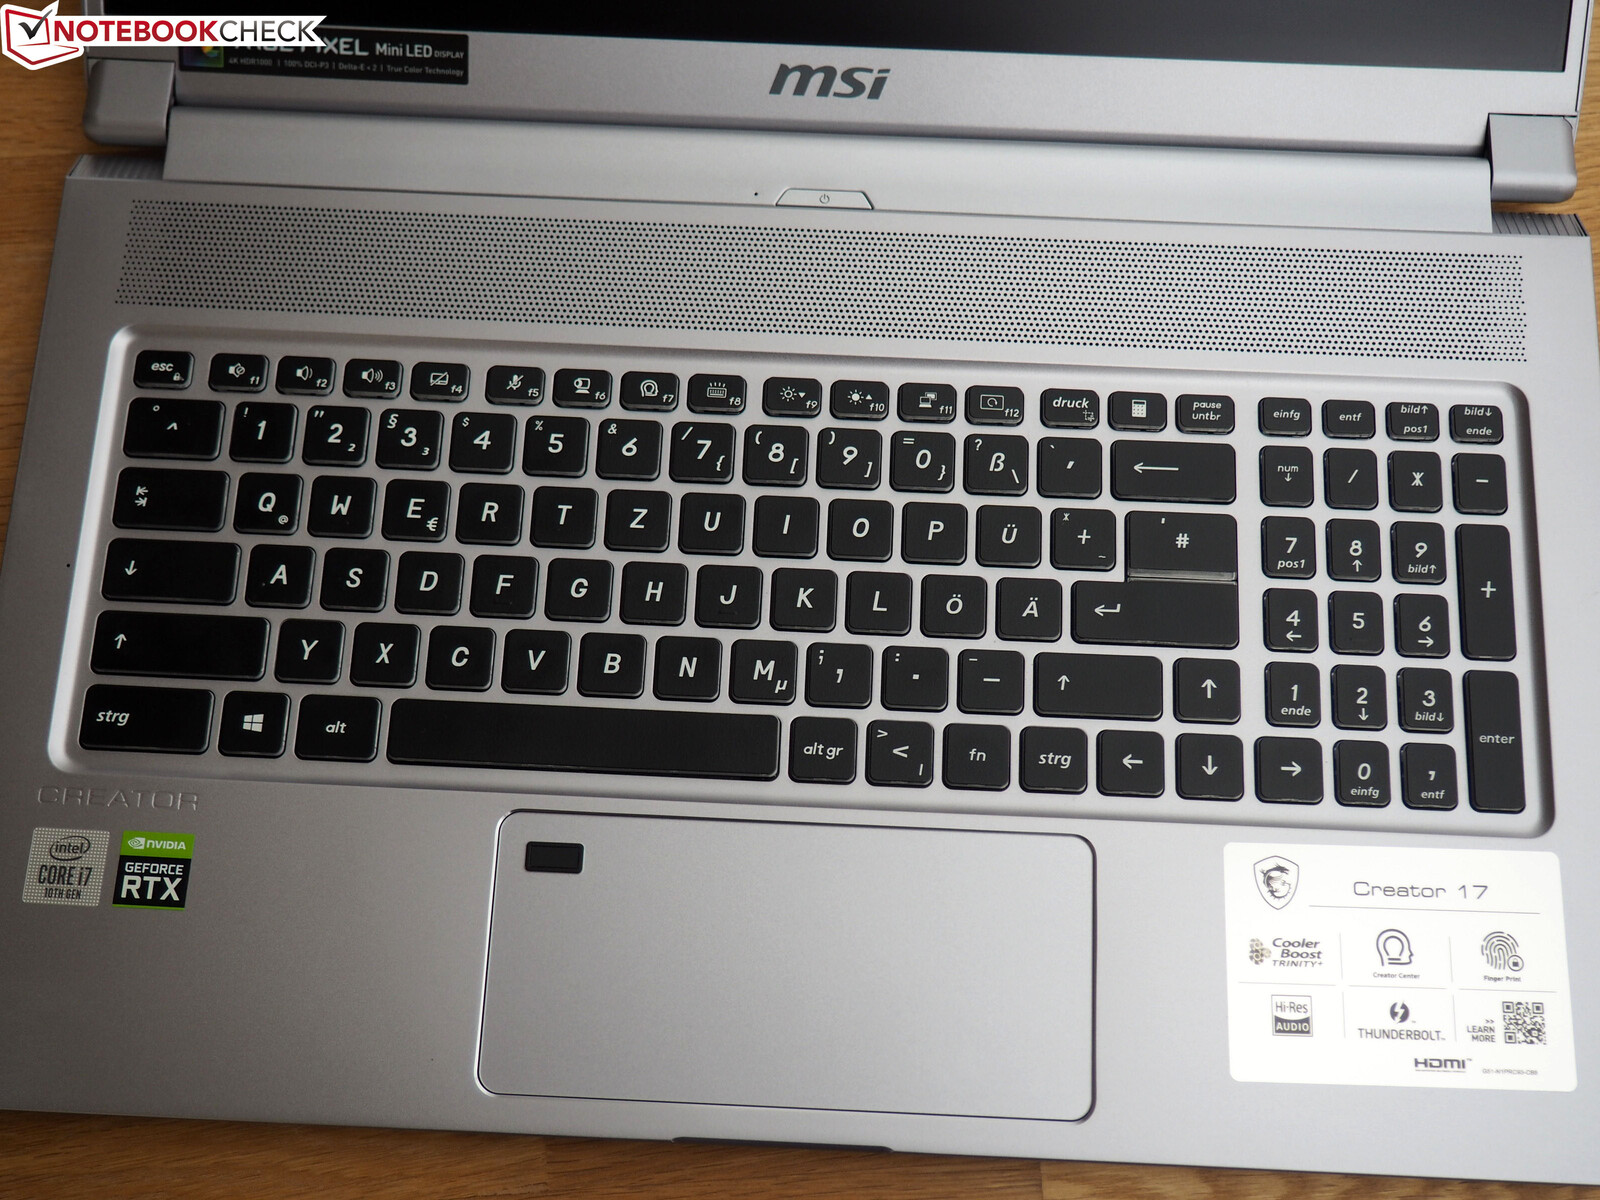
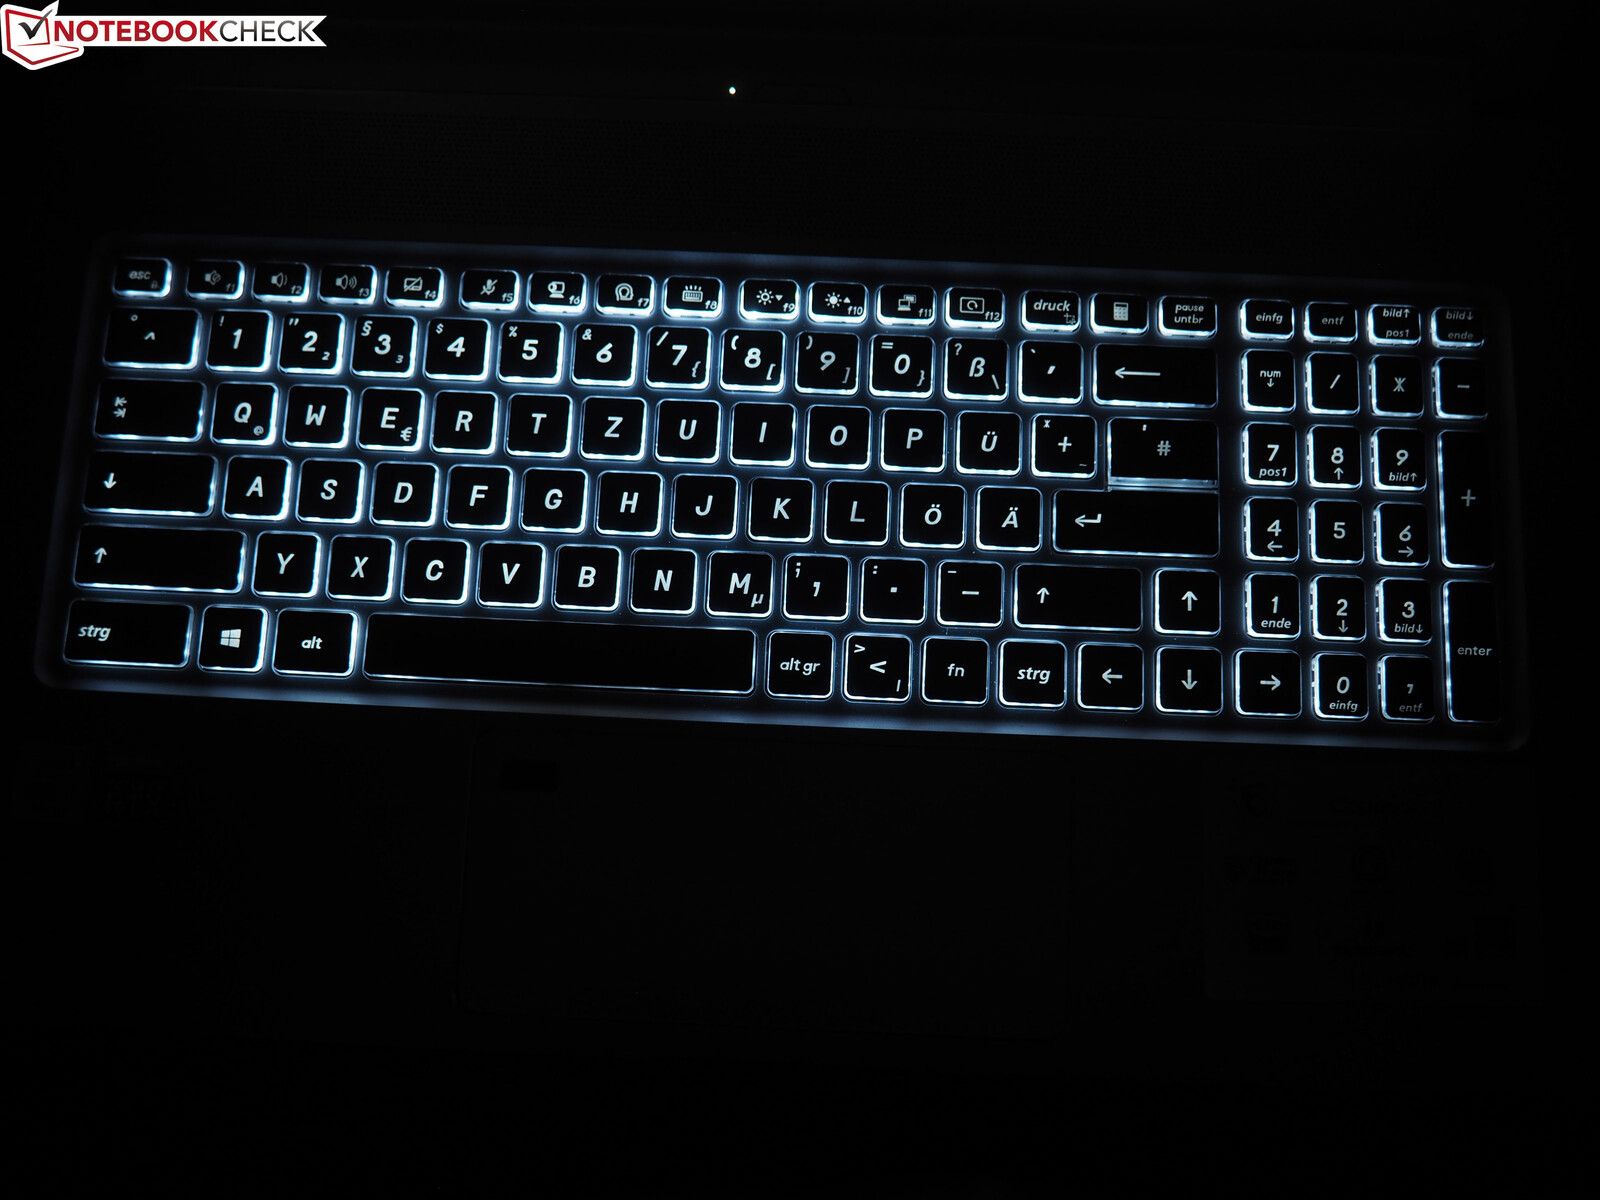
The keyboard reminds us very much of the MSI gaming models. German buyers have to live with a unique layout in the Creator 17 keyboard that requires some getting used to. Among other things, this also concerns the position of the <>| key and the #‘ key. The latter leads to an Enter key of only a single line, which should deter some of those who type frequently. The presence of a dedicated number block is a matter of taste, as usual. We would call the typing experience good. In order to be able to use the 17-incher optimally also at night and in dark surroundings, the keyboard offers a white illumination that can be adjusted in several steps.
Dokunmatik
Dokunmatik yüzey esas olarak genişliği ile dikkat çekiyor. 14 cm (~ 5,5 inç) yatay fare hareketleri için çok fazla alan sunar. Öte yandan, dikey boşluk sadece 6,5 cm'dir (~ 2,6 inç). Pürüzsüz yüzey, parmakların yüzey üzerinde rahat ve hızlı bir şekilde kaymasını sağlar. Hareket desteği (örneğin iki parmağınızla kaydırma ve yakınlaştırma), bu noktada standart olmasına rağmen, bazı olumlu noktalar da kazanır. Dokunmatik yüzeyin alt köşelerindeki sol ve sağ tıklamalar çoğunlukla güvenilir bir şekilde tanınır, ancak oldukça yüksek bir ses çıkarırlar.
Görüntüle
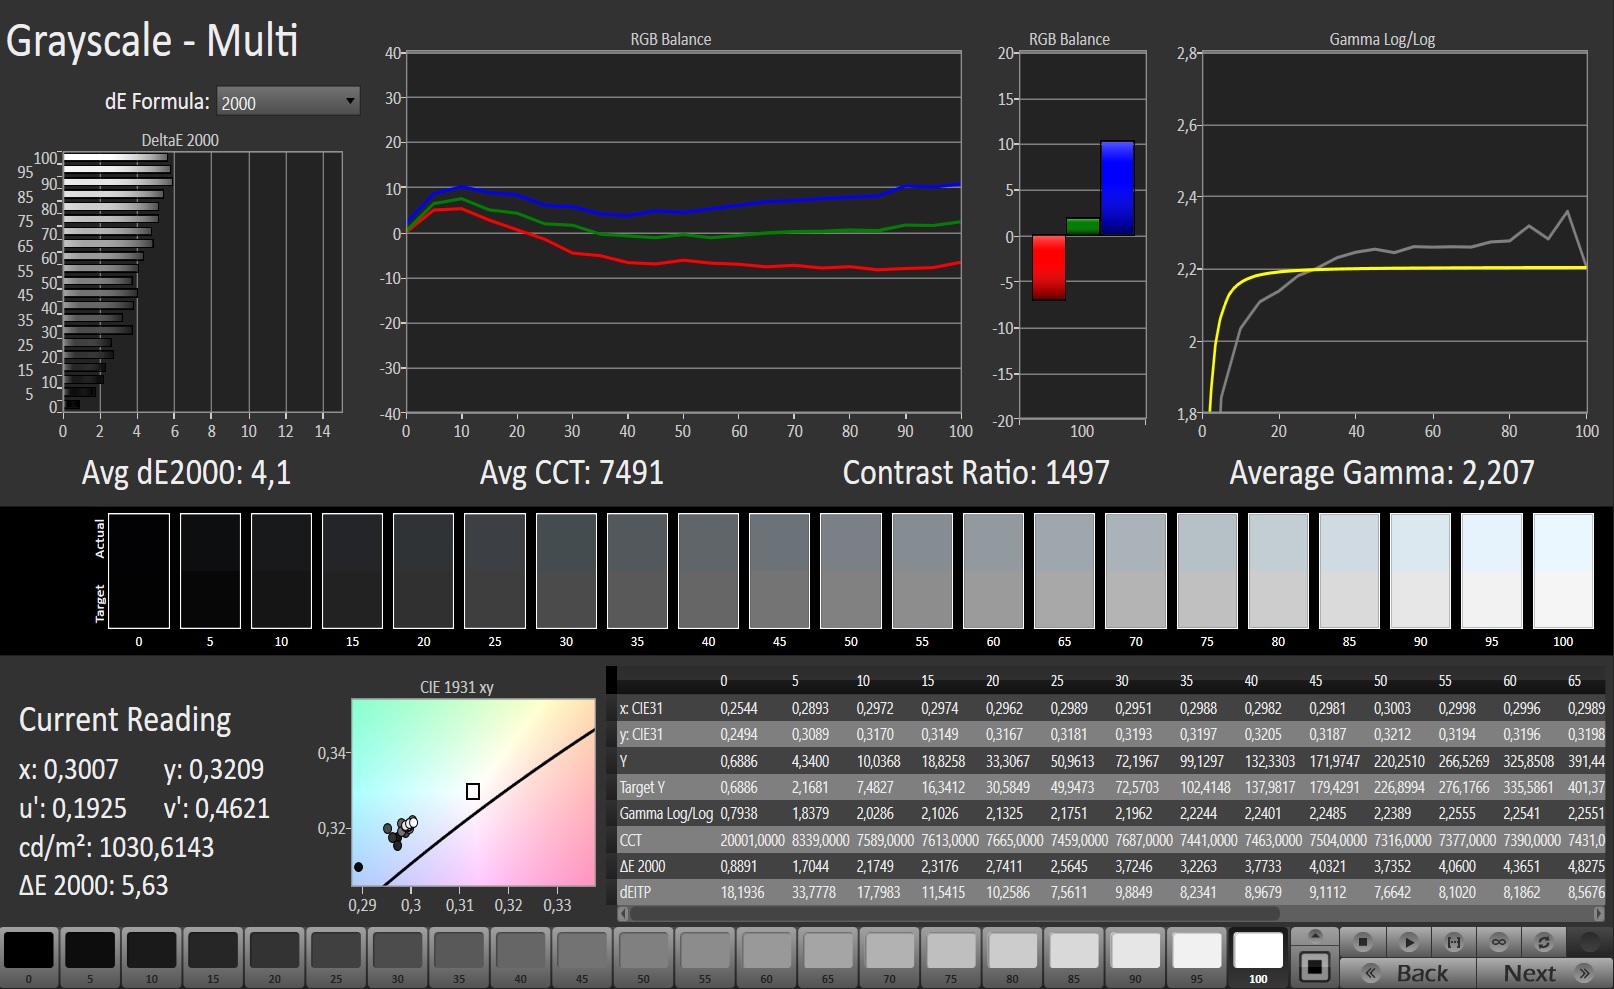
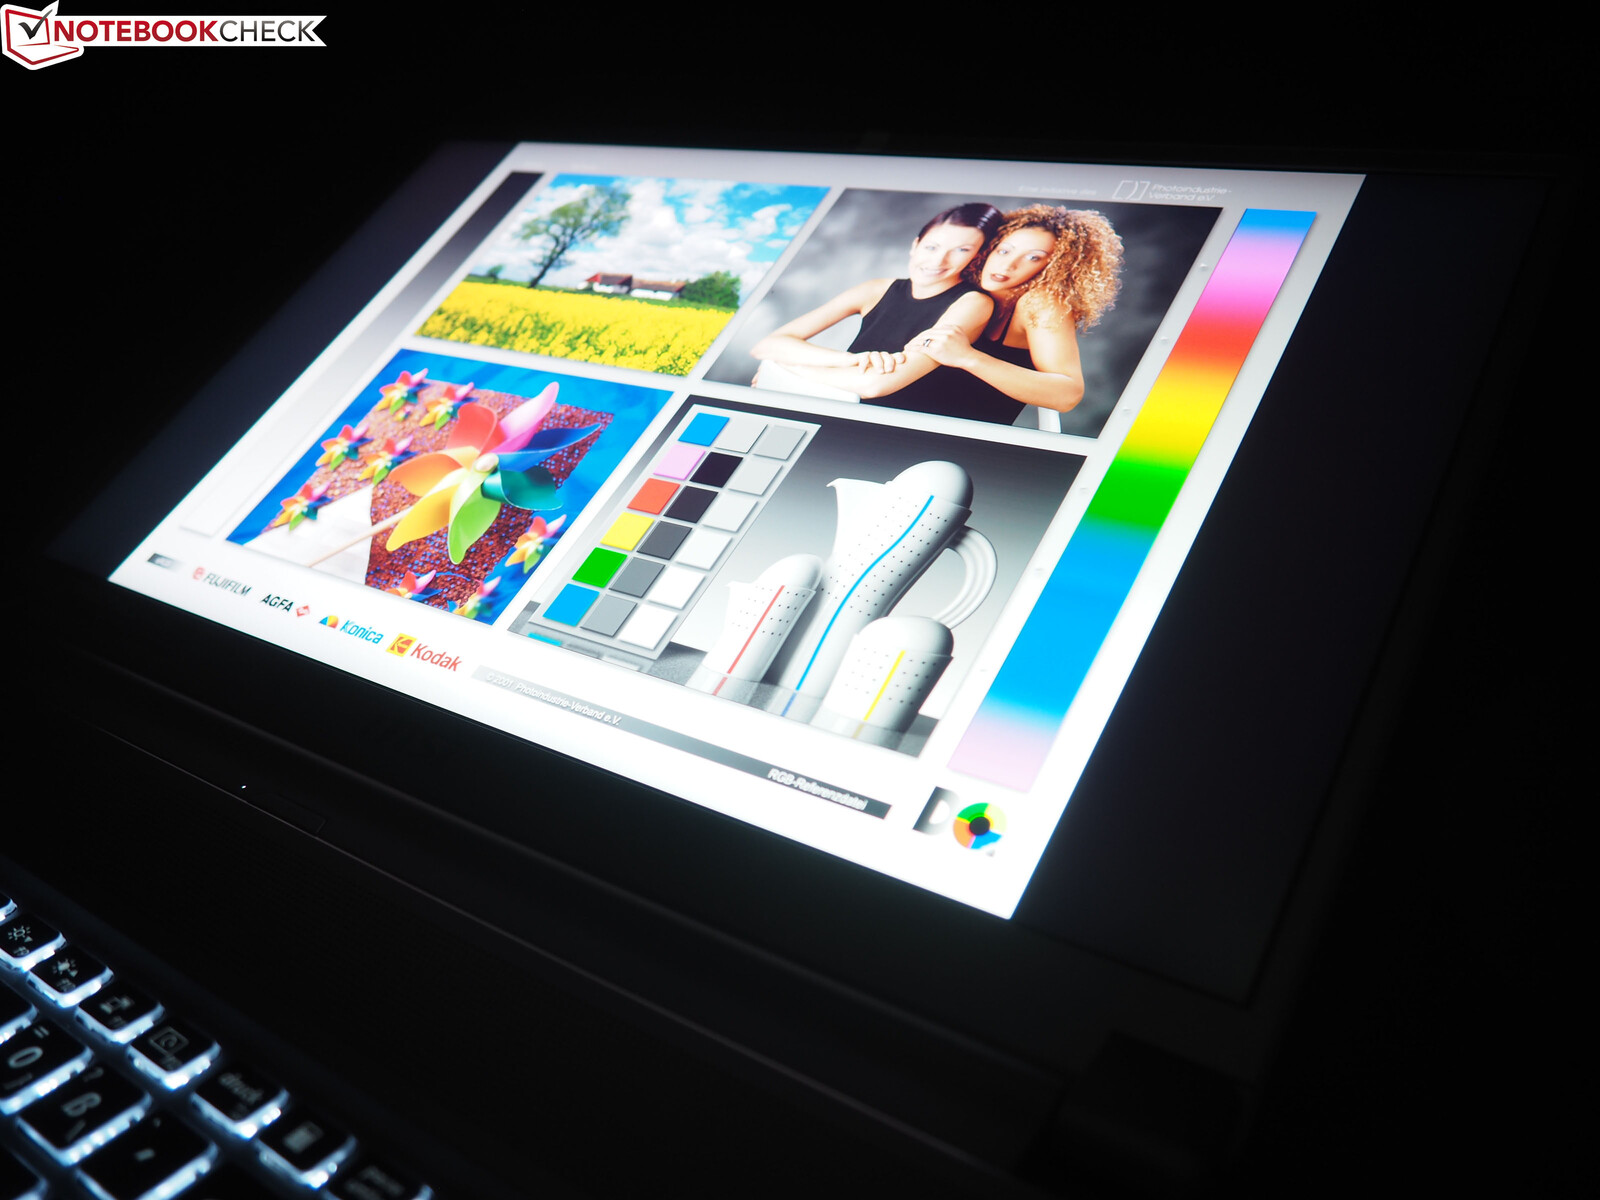
Yeni Mini LED ekran, Yaratıcı 17'nin mutlak vurgulaması olarak ortaya çıkıyor. Aksi belirtilmedikçe, aşağıdaki değerler HDR olmadan üretildi, çünkü HDR kullanılırken MSI renk profilleri olması gerektiği gibi çalışmadı ve ayrıca ölçüm araçlarımızla ilgili bazı yazılım ve donanım sorunları.
| |||||||||||||||||||||||||
Aydınlatma: 93 %
Batarya modunda parlaklık: 996 cd/m²
Kontrast: 1465:1 (Siyah: 0.68 cd/m²)
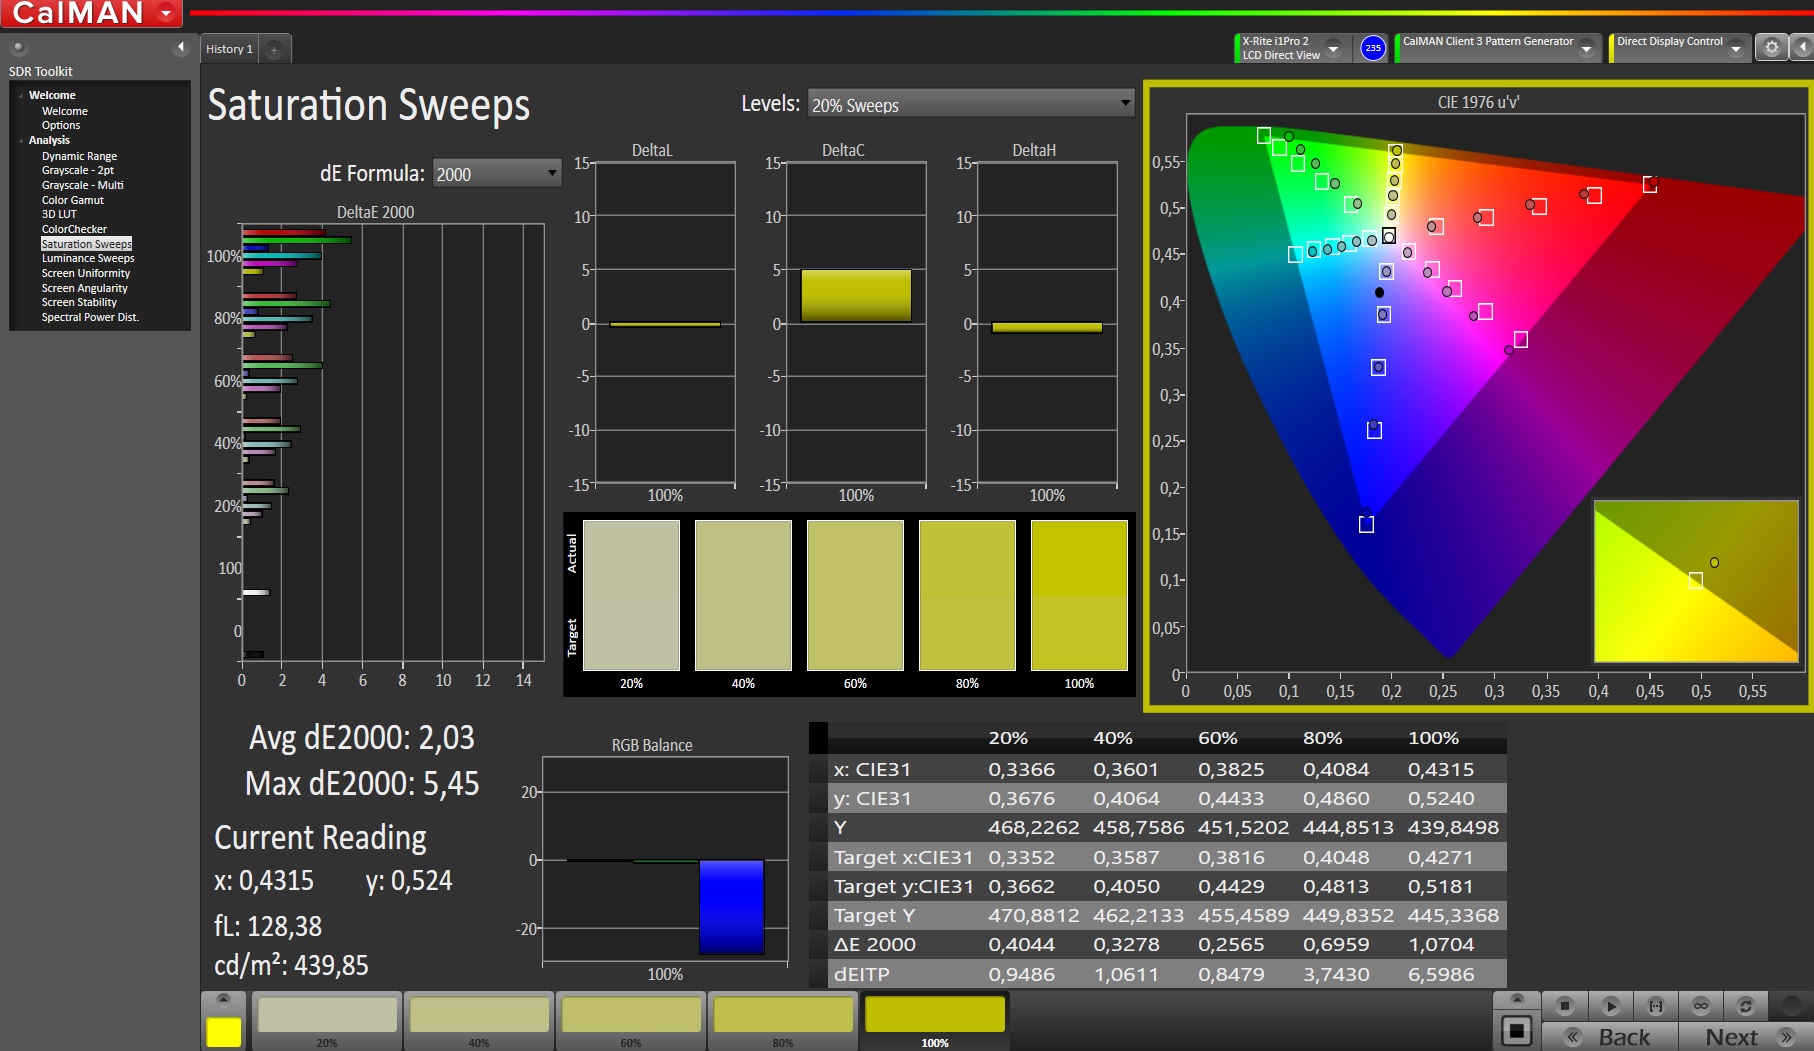
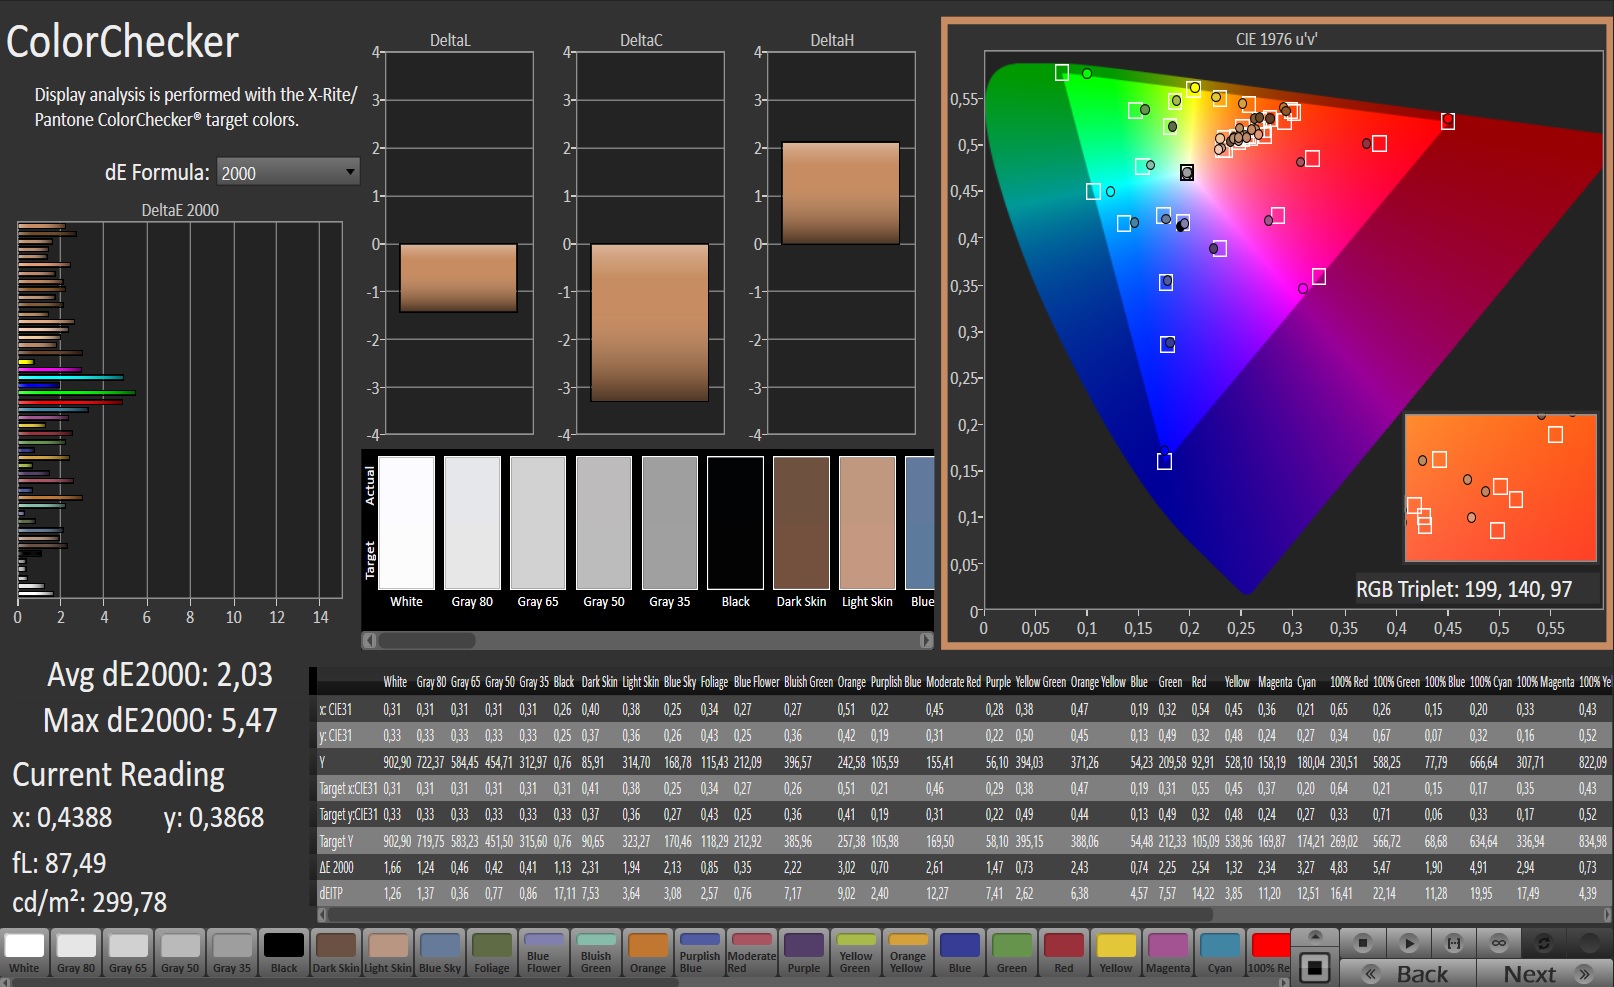
ΔE ColorChecker Calman: 4.21 | ∀{0.5-29.43 Ø4.71}
calibrated: 2.03
ΔE Greyscale Calman: 4.1 | ∀{0.09-98 Ø4.96}
97% sRGB (Argyll 1.6.3 3D)
84% AdobeRGB 1998 (Argyll 1.6.3 3D)
84% AdobeRGB 1998 (Argyll 3D)
97.5% sRGB (Argyll 3D)
82% Display P3 (Argyll 3D)
Gamma: 2.207
CCT: 7491 K
| MSI Creator 17 A10SGS B173ZAN05.0 (AUO278E), Mini-LED IPS-Level, 3840x2160 | MSI Creator 17 A10SGS HDR 3840x2160 | MSI GS75 Stealth 9SG Chi Mei N173HCE-G33 (CMN175C), IPS, 1920x1080 | Razer Blade Pro 17 RTX 2080 Max-Q AU Optronics B173HAN04.0, IPS, 1920x1080 | Asus ROG Zephyrus S GX701GXR AU Optronics B173HAN05.1, IPS, 1920x1080 | Alienware m17 R2 P41E Chi Mei 173HCE, CMN175F, IPS, 1920x1080 | |
|---|---|---|---|---|---|---|
| Display | -17% | -20% | -10% | -9% | ||
| Display P3 Coverage (%) | 82 | 62.6 -24% | 60.6 -26% | 70 -15% | 70.8 -14% | |
| sRGB Coverage (%) | 97.5 | 93.5 -4% | 89 -9% | 96.6 -1% | 98.5 1% | |
| AdobeRGB 1998 Coverage (%) | 84 | 64.7 -23% | 62.1 -26% | 72.3 -14% | 72.2 -14% | |
| Response Times | 0% | -14% | -9% | 14% | -23% | |
| Response Time Grey 50% / Grey 80% * (ms) | 7.2 ? | 6.8 ? | 5.6 ? | 17.2 ? | ||
| Response Time Black / White * (ms) | 8.8 ? | 8.8 ? -0% | 10 ? -14% | 9.6 ? -9% | 7.6 ? 14% | 10.8 ? -23% |
| PWM Frequency (Hz) | 26600 ? | 26600 ? | 25510 ? | 26320 ? | ||
| Screen | 102% | 11% | -10% | 3% | 11% | |
| Brightness middle (cd/m²) | 996 | 770 -23% | 366 -63% | 299.3 -70% | 288 -71% | 384.2 -61% |
| Brightness (cd/m²) | 952 | 759 -20% | 343 -64% | 294 -69% | 276 -71% | 357 -62% |
| Brightness Distribution (%) | 93 | 94 1% | 91 -2% | 94 1% | 93 0% | 90 -3% |
| Black Level * (cd/m²) | 0.68 | 0.07 90% | 0.29 57% | 0.29 57% | 0.24 65% | 0.29 57% |
| Contrast (:1) | 1465 | 11000 651% | 1262 -14% | 1032 -30% | 1200 -18% | 1325 -10% |
| Colorchecker dE 2000 * | 4.21 | 1.51 64% | 2.55 39% | 1.92 54% | 1.35 68% | |
| Colorchecker dE 2000 max. * | 6.79 | 3.22 53% | 4.73 30% | 4.57 33% | 3.45 49% | |
| Colorchecker dE 2000 calibrated * | 2.03 | 0.71 65% | 2.9 -43% | 1.14 44% | 1.42 30% | |
| Greyscale dE 2000 * | 4.1 | 1.93 53% | 3.5 15% | 3.08 25% | 1.2 71% | |
| Gamma | 2.207 100% | 2.38 92% | 2.28 96% | 2.42 91% | 2.23 99% | |
| CCT | 7491 87% | 6881 94% | 7101 92% | 7055 92% | 6580 99% | |
| Color Space (Percent of AdobeRGB 1998) (%) | 84 | 94 12% | 60 -29% | 57 -32% | 65 -23% | 65.5 -22% |
| Color Space (Percent of sRGB) (%) | 97 | 99 2% | 94 -3% | 88.7 -9% | 96 -1% | 98.5 2% |
| Toplam Ortalama (Program / Ayarlar) | 51% /
89% | -7% /
3% | -13% /
-12% | 2% /
1% | -7% /
5% |
* ... daha küçük daha iyidir
Sadece şunu söylemek gerekirse: Yaklaşık 950 cd / m²'lik ortalama parlaklıkla, Creator 17 dışarıda kullanım için mükemmel olmakla kalmaz, aynı zamanda diğer rakipleri gölgede bırakır. Birkaç istisna dışında, klasik dizüstü bilgisayar ekranları, yalnızca 300 ve 400 cd / m² arasındadır. SRGB renk alanının% 97 kapsamı ve AdobeRGB'nin% 84'ü de mükemmeldir ve profesyonel kullanıcıları tatmin etmelidir.
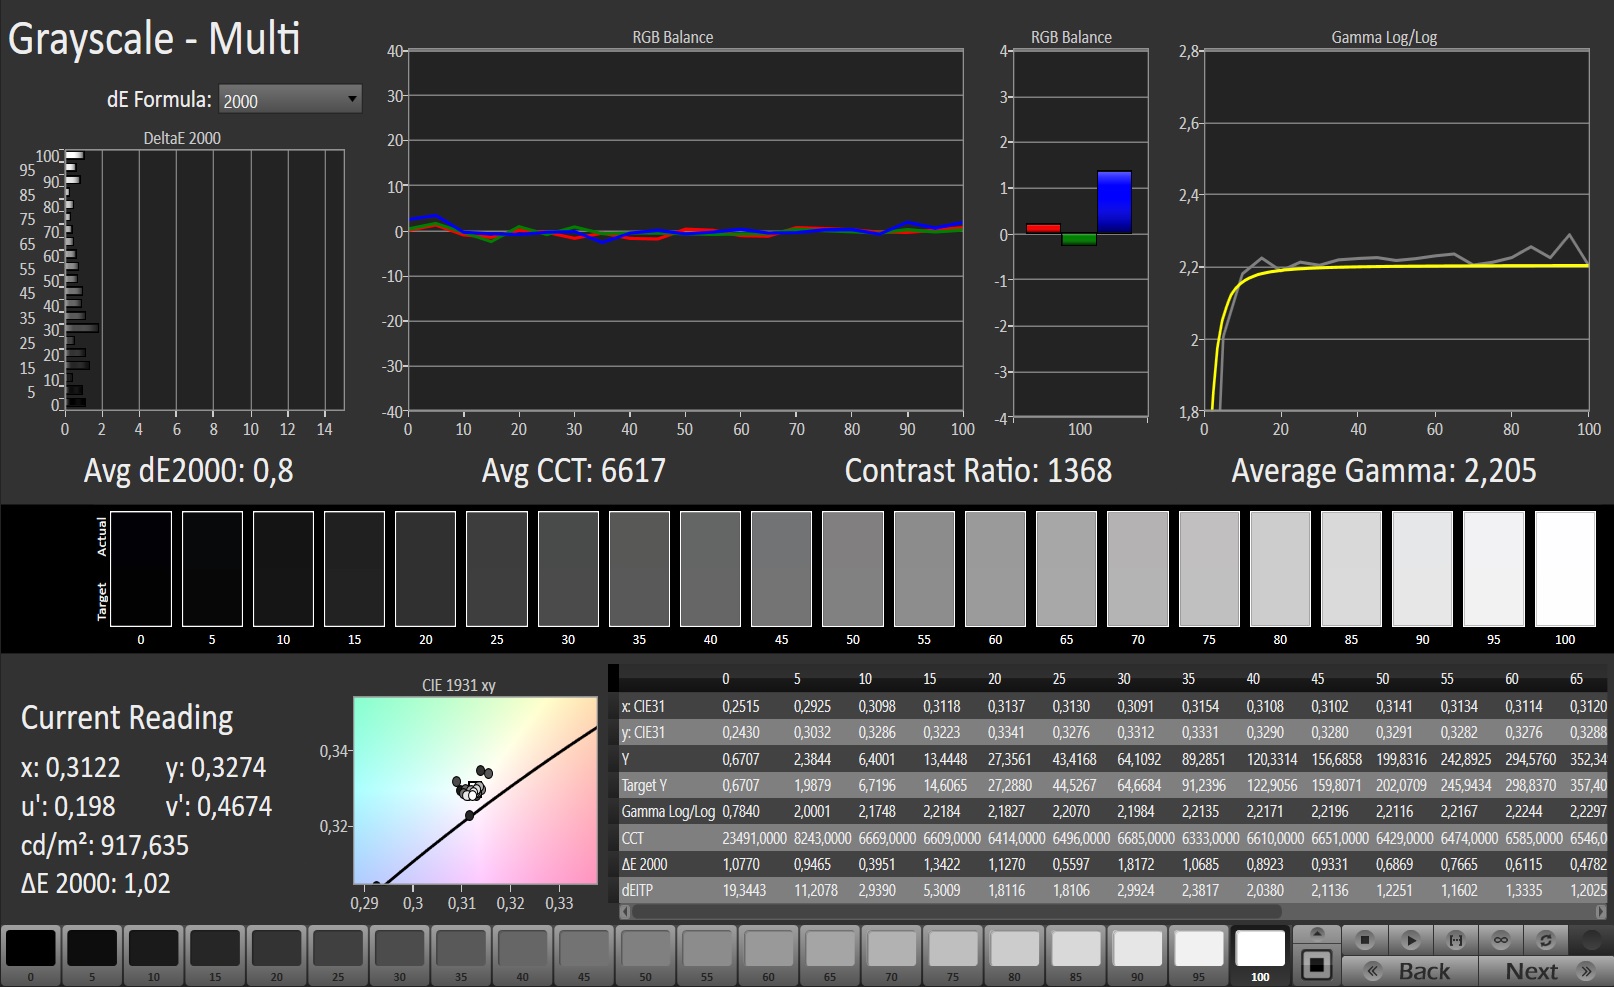
Due to the mediocre black value (0.68 cd/m² at full brightness), the contrast is only slightly above those of the competitors, even though 1465:1 still deserves some respect. With HDR activated, the brightness drops by about 200 cd/m², but the black value improves to 0.07 cd/m², resulting in a contrast of about 11,000:1 – an outstanding value, if you don't look at OLED panels. The viewing angles of the Creator 17 tend towards typical IPS levels.

Despite its relatively good response time (8.8 ms black-to-white), the 4K screen is only suited to a limited extent for gamers, who are not part of the target group anyways. A 60 Hz frame rate is not ideal in 2020 anymore, and at this point, many Full-HD panels support 240 or even 300 Hz. In addition, buyers will have to make do without G-Sync. The fact that the display flickers slightly below a brightness of 83% should not create any problems for sensitive users due to the high PWM frequency (26 kHz).
Yanıt Sürelerini Görüntüle
| ↔ Tepki Süresi Siyahtan Beyaza | ||
|---|---|---|
| 8.8 ms ... yükseliş ↗ ve sonbahar↘ birleşimi | ↗ 1.2 ms yükseliş | 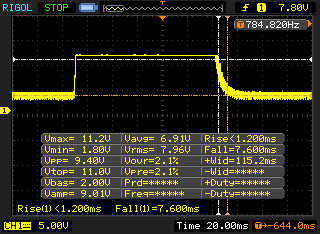 |
| ↘ 7.6 ms sonbahar | ||
| Ekran, testlerimizde hızlı yanıt oranları gösteriyor ve oyun oynamaya uygun olmalı. Karşılaştırıldığında, test edilen tüm cihazlar 0.1 (minimum) ile 240 (maksimum) ms arasında değişir. » Tüm cihazların 25 %'si daha iyi. Bu, ölçülen yanıt süresinin test edilen tüm cihazların ortalamasından (19.8 ms) daha iyi olduğu anlamına gelir. | ||
Ekran Titremesi / PWM (Darbe Genişliği Modülasyonu)
| Ekran titriyor / PWM algılandı | 26600 Hz | ≤ 83 % parlaklık ayarı | 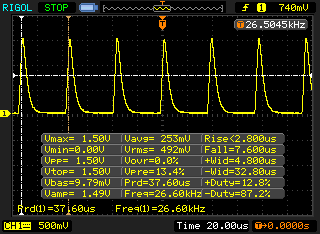 |
Ekran arka ışığı 26600 Hz'de titriyor (en kötü durum, örneğin PWM kullanılması) 83 % ve altındaki parlaklık ayarında titreme algılandı. Bu parlaklık ayarının üzerinde titreme veya PWM olmamalıdır. 26600 Hz frekansı oldukça yüksektir, bu nedenle PWM'ye duyarlı çoğu kullanıcı herhangi bir titremeyi fark etmemelidir. Karşılaştırıldığında: Test edilen tüm cihazların %52 %'si ekranı karartmak için PWM kullanmıyor. PWM tespit edilirse, ortalama 7757 (minimum: 5 - maksimum: 343500) Hz ölçüldü. | |||
Test Conditions
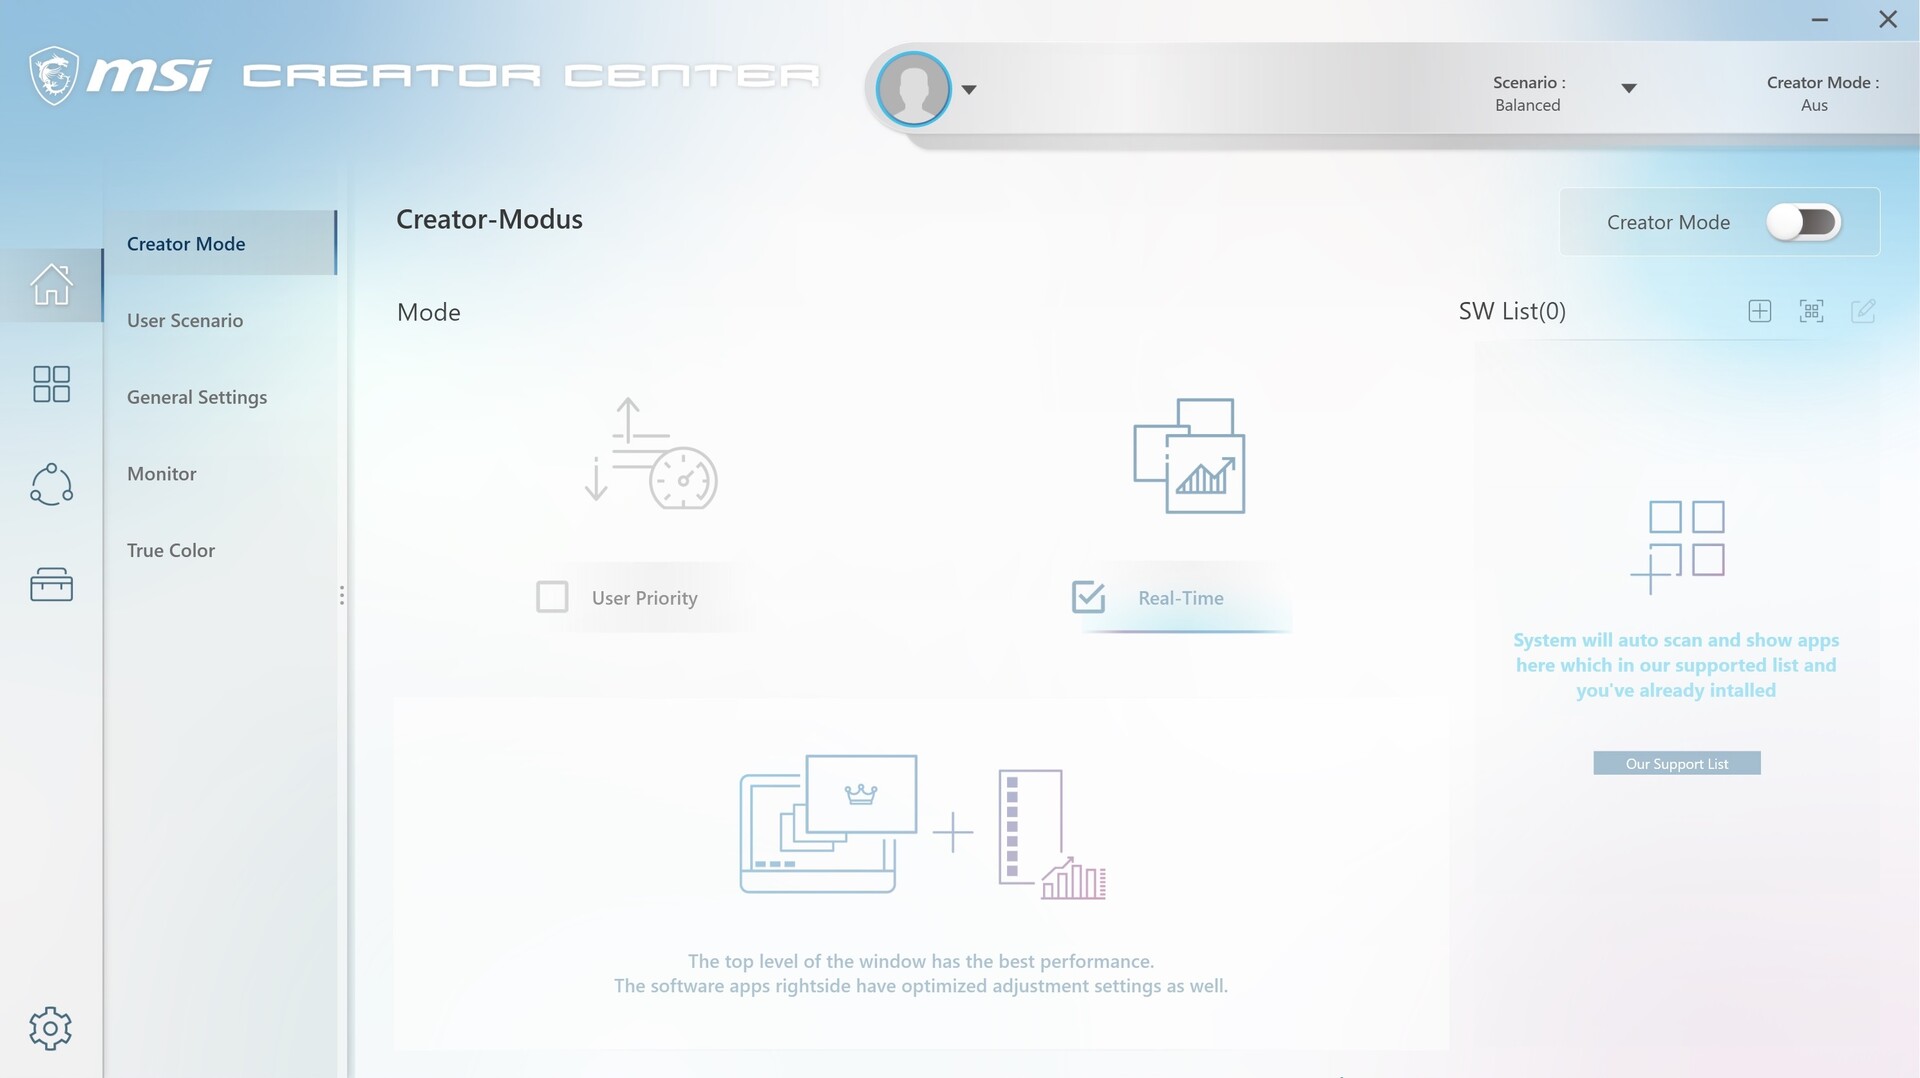
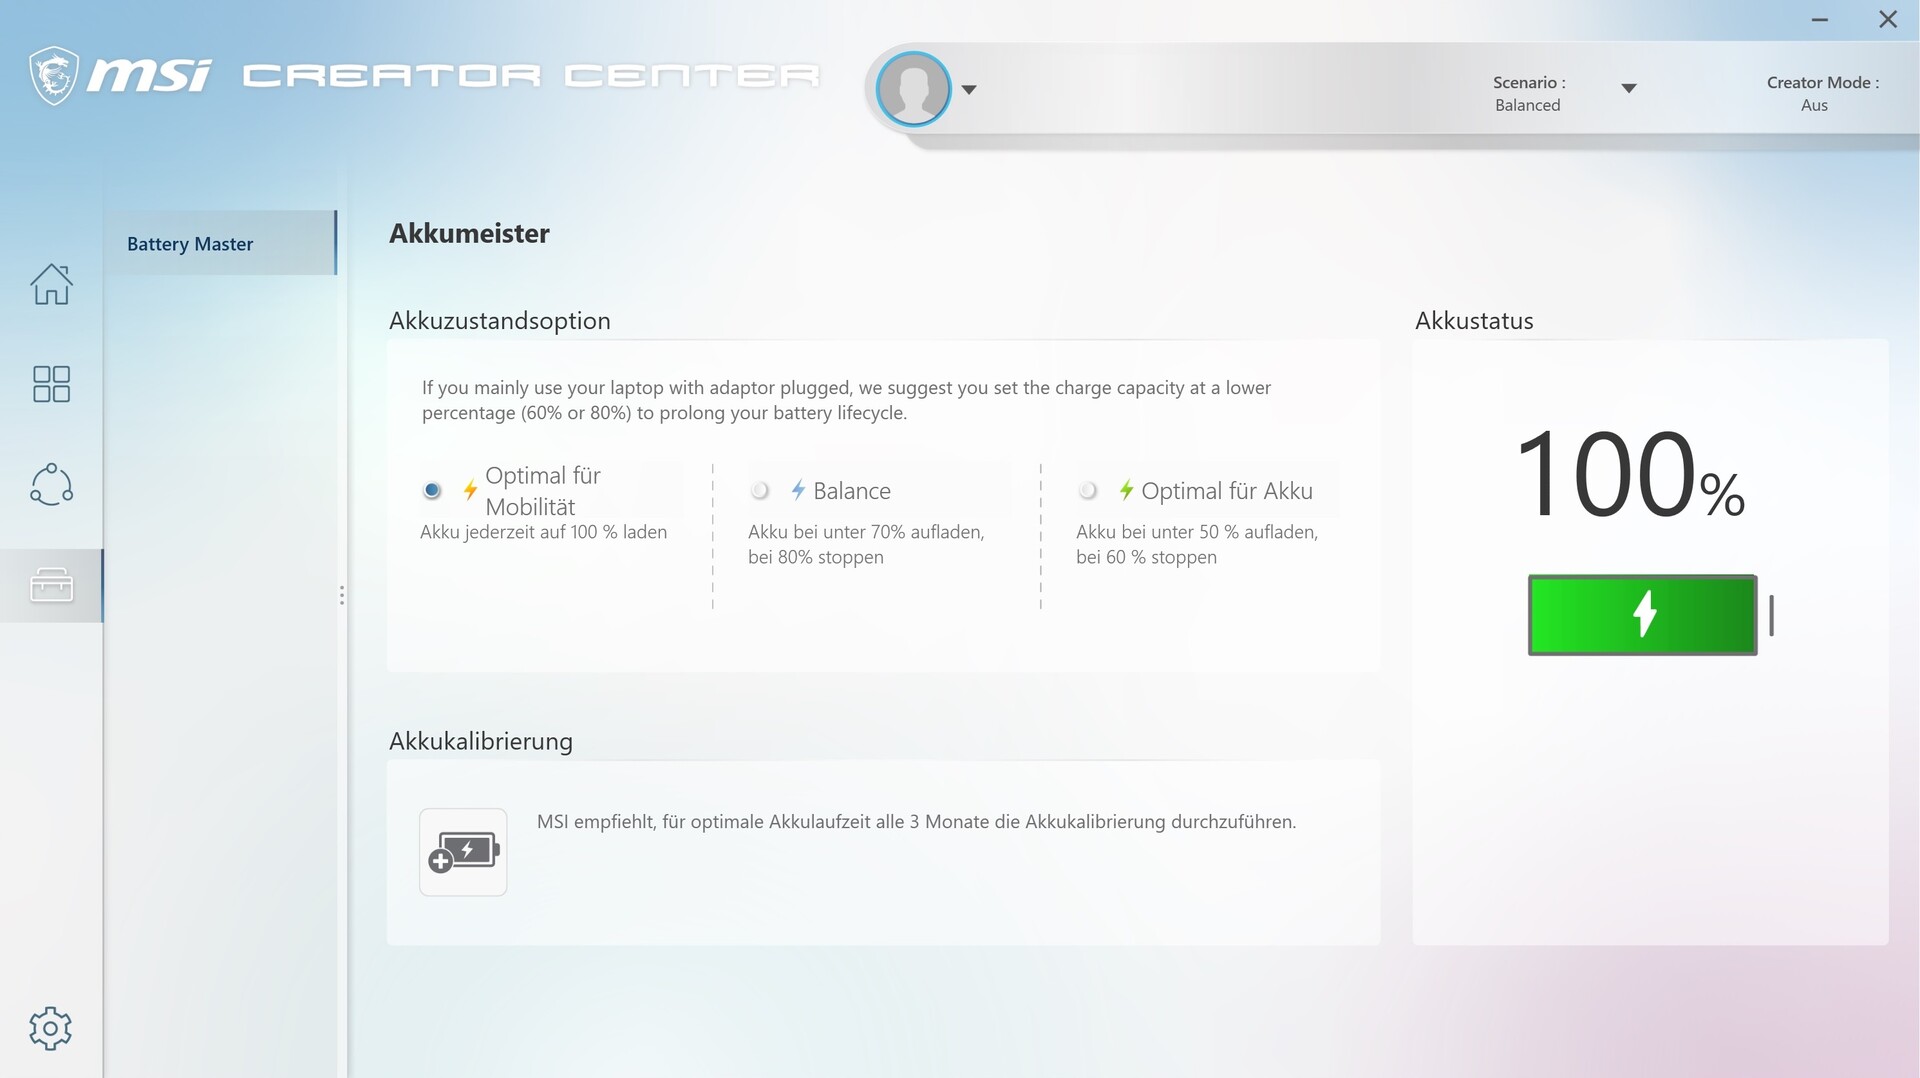
The preinstalled Creator Center resembles the Dragon Center from MSI's gaming laptops (see screenshots). Our measurements were produced with the "Balanced" user mode.
Performance
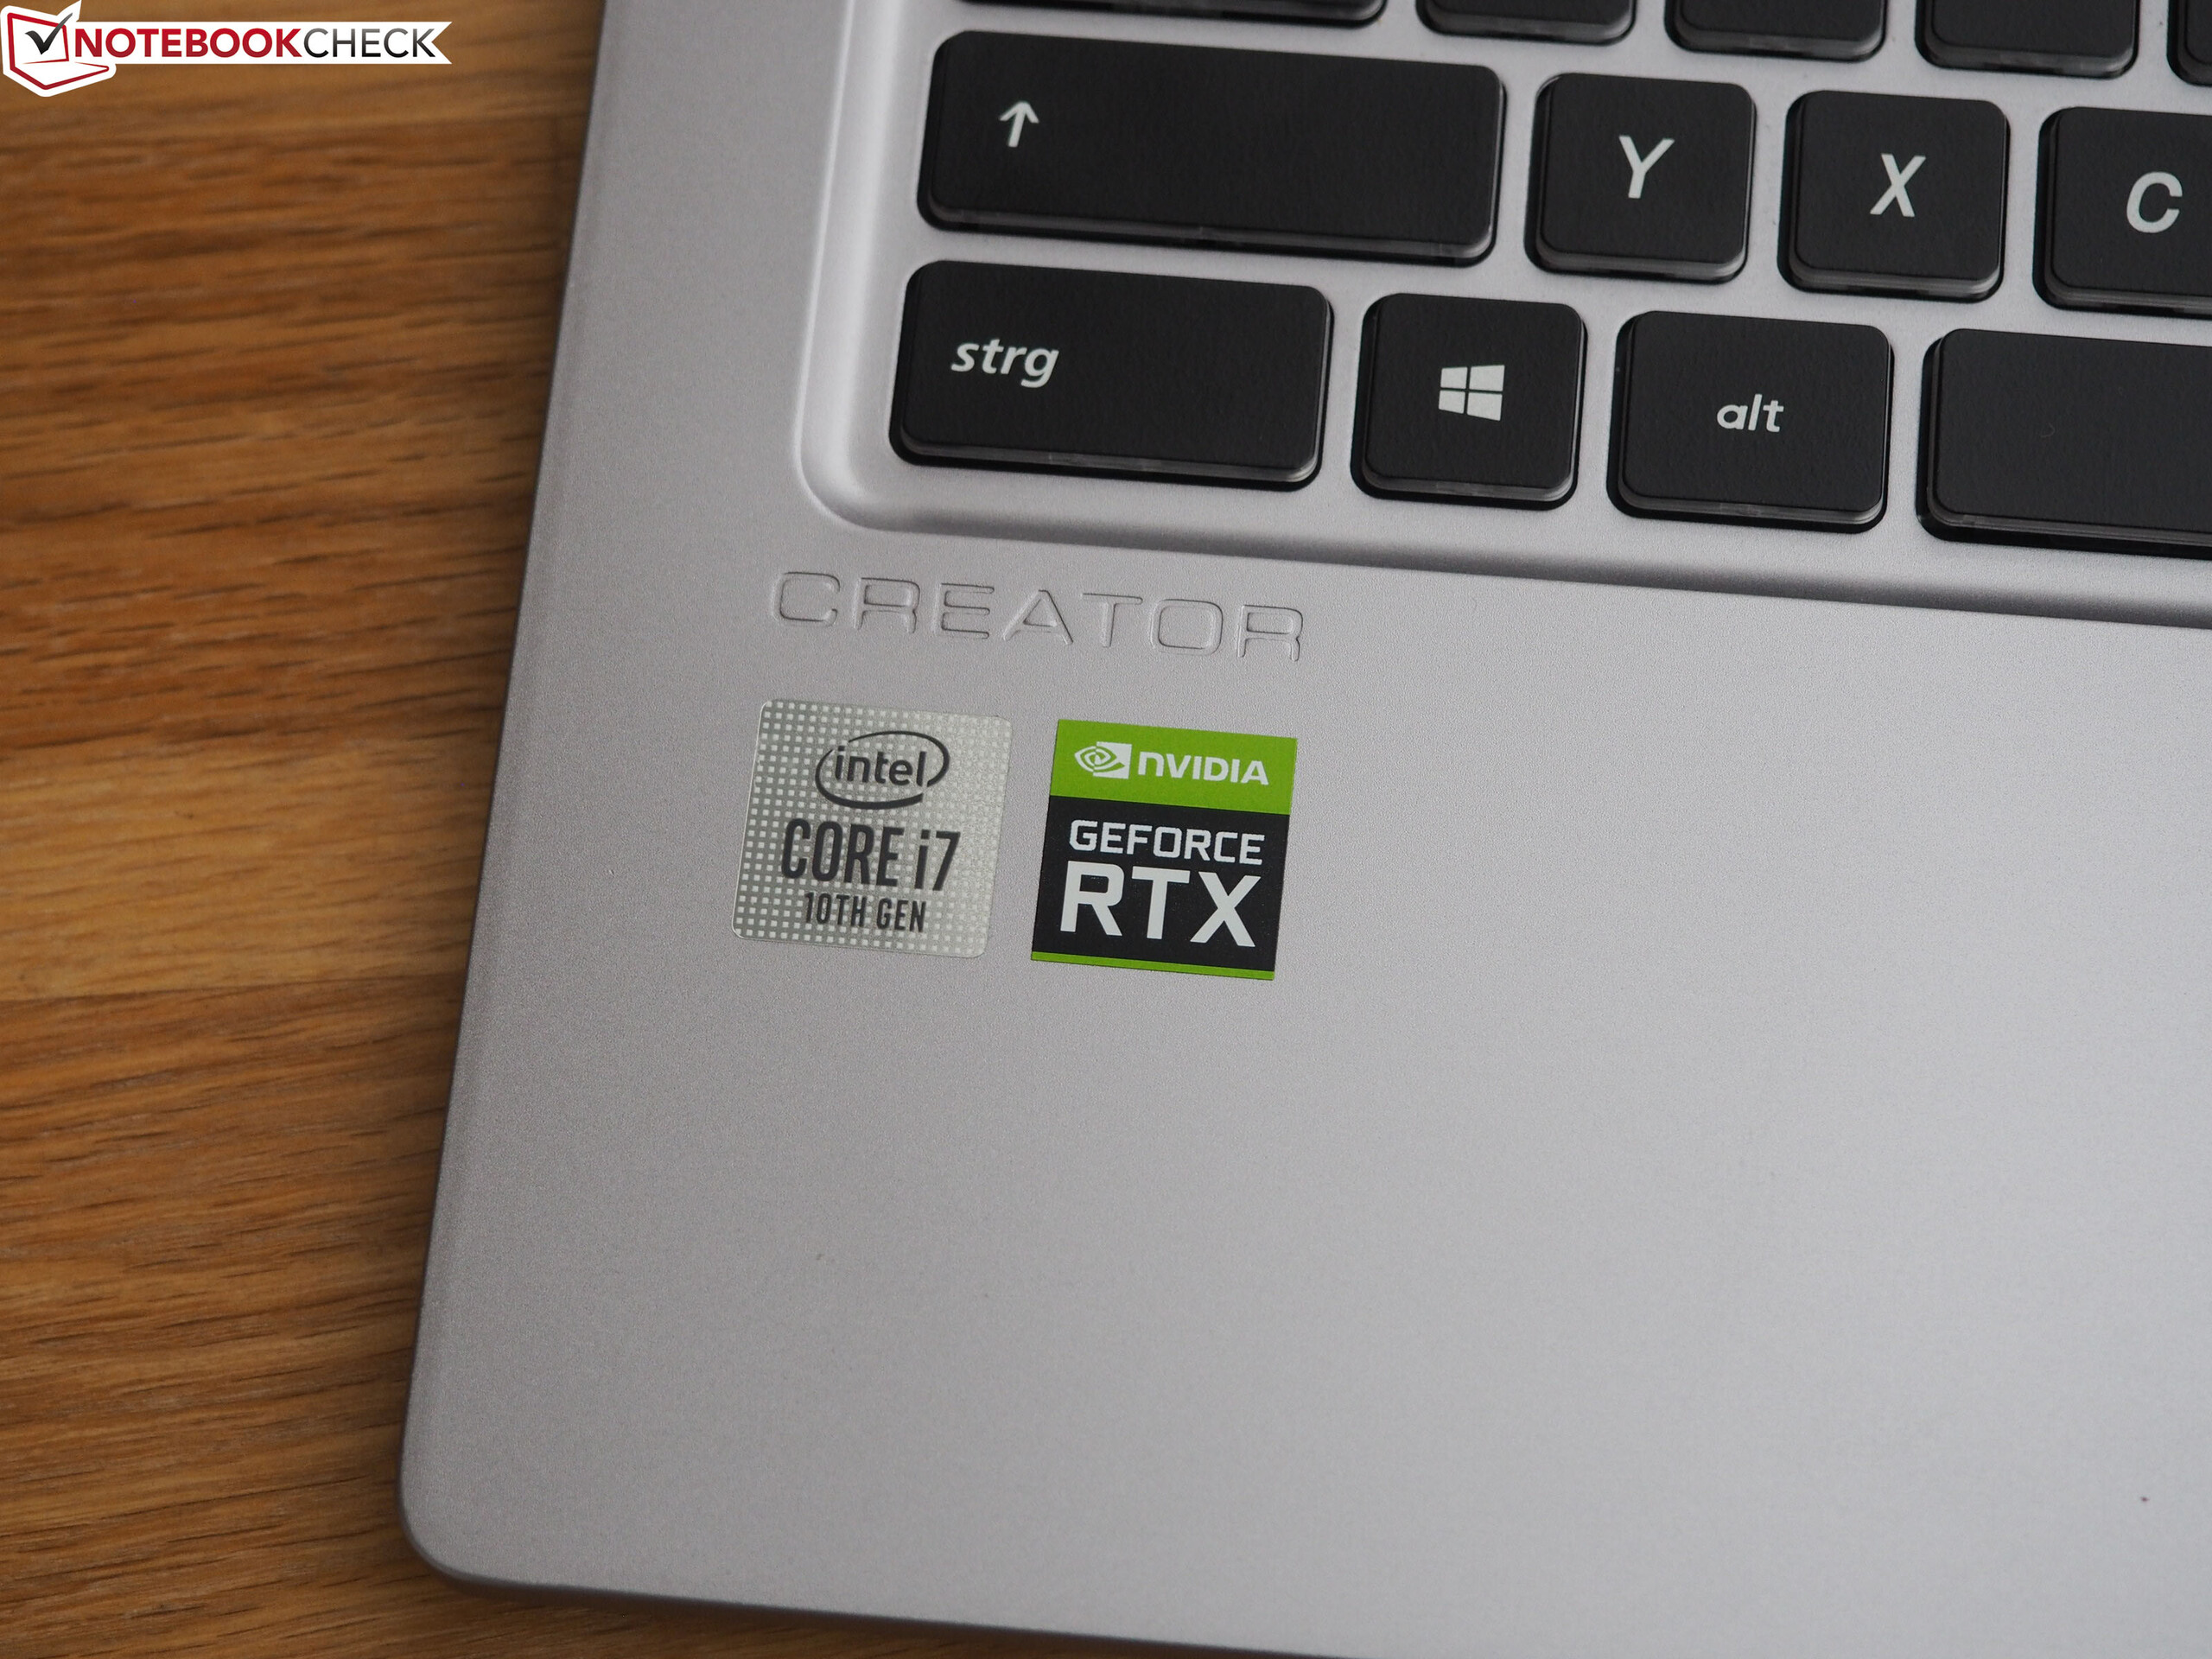
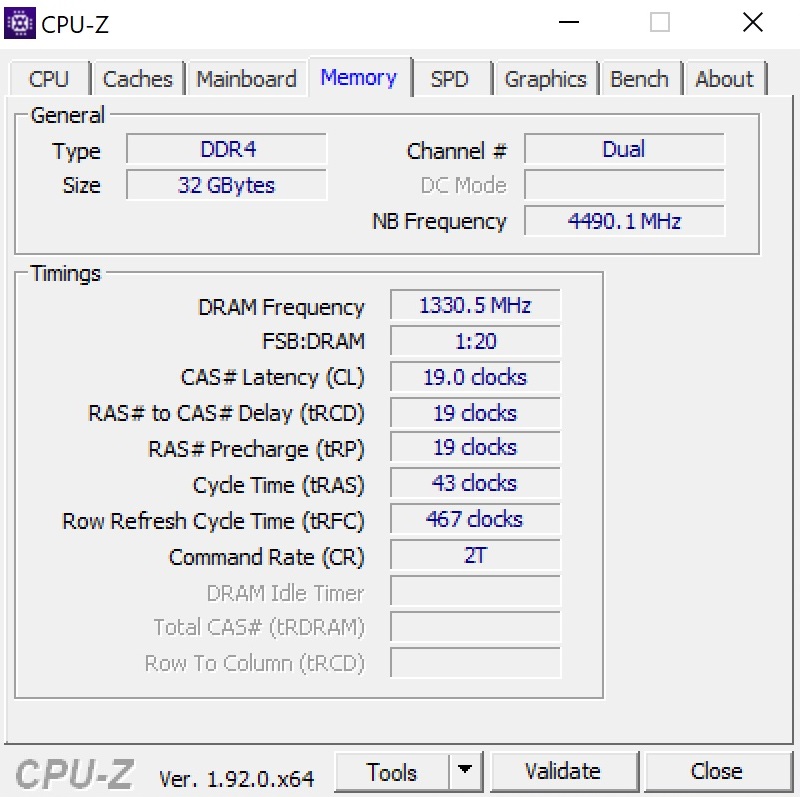
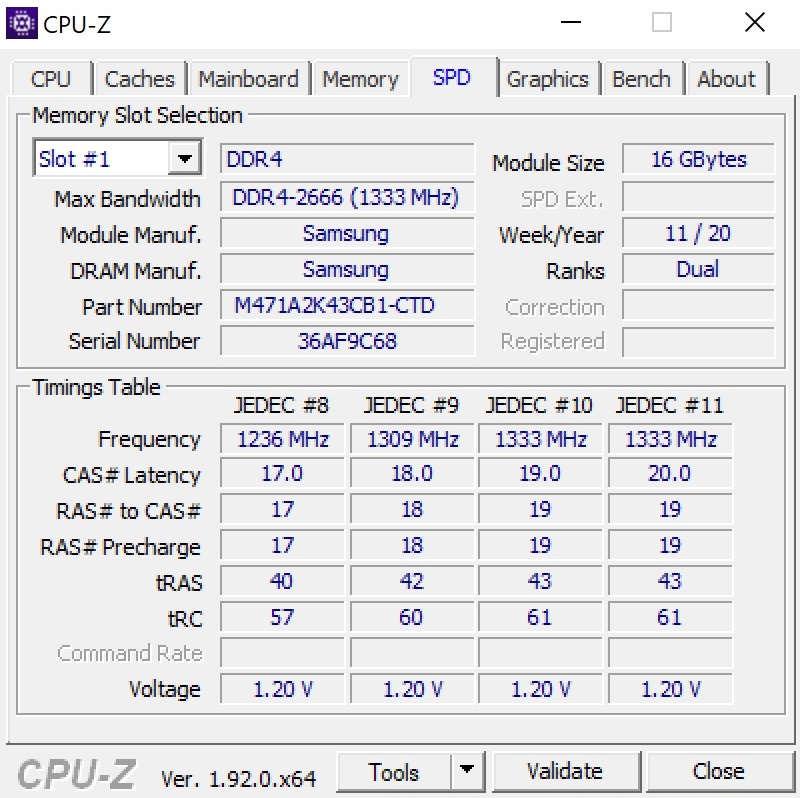
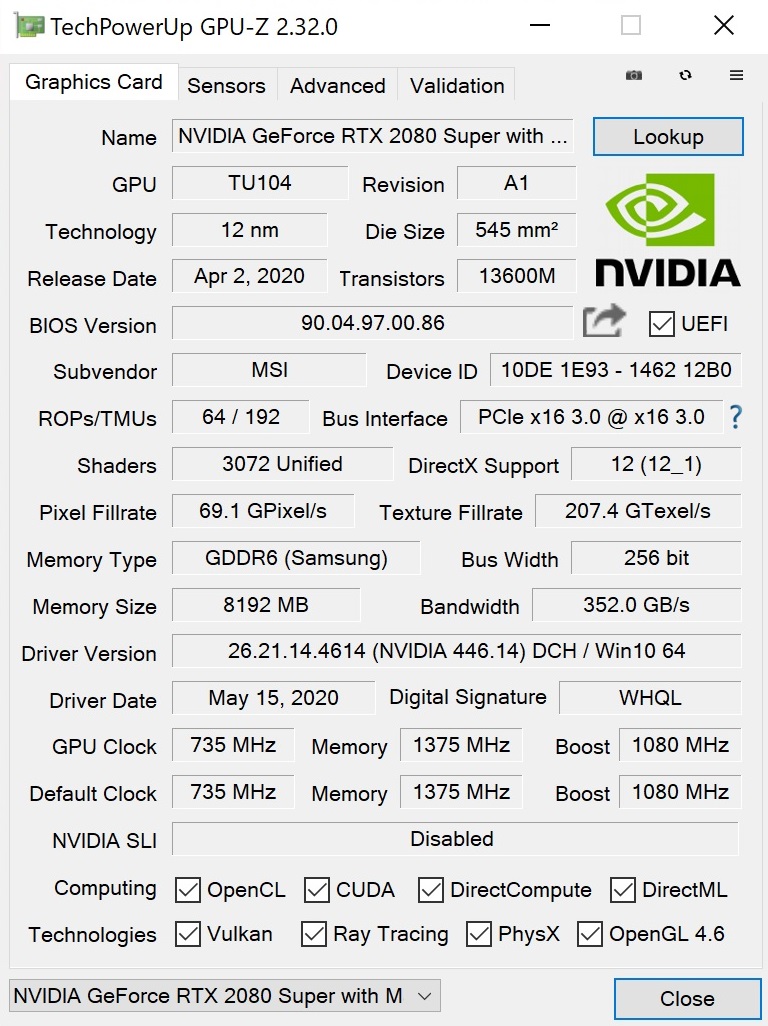
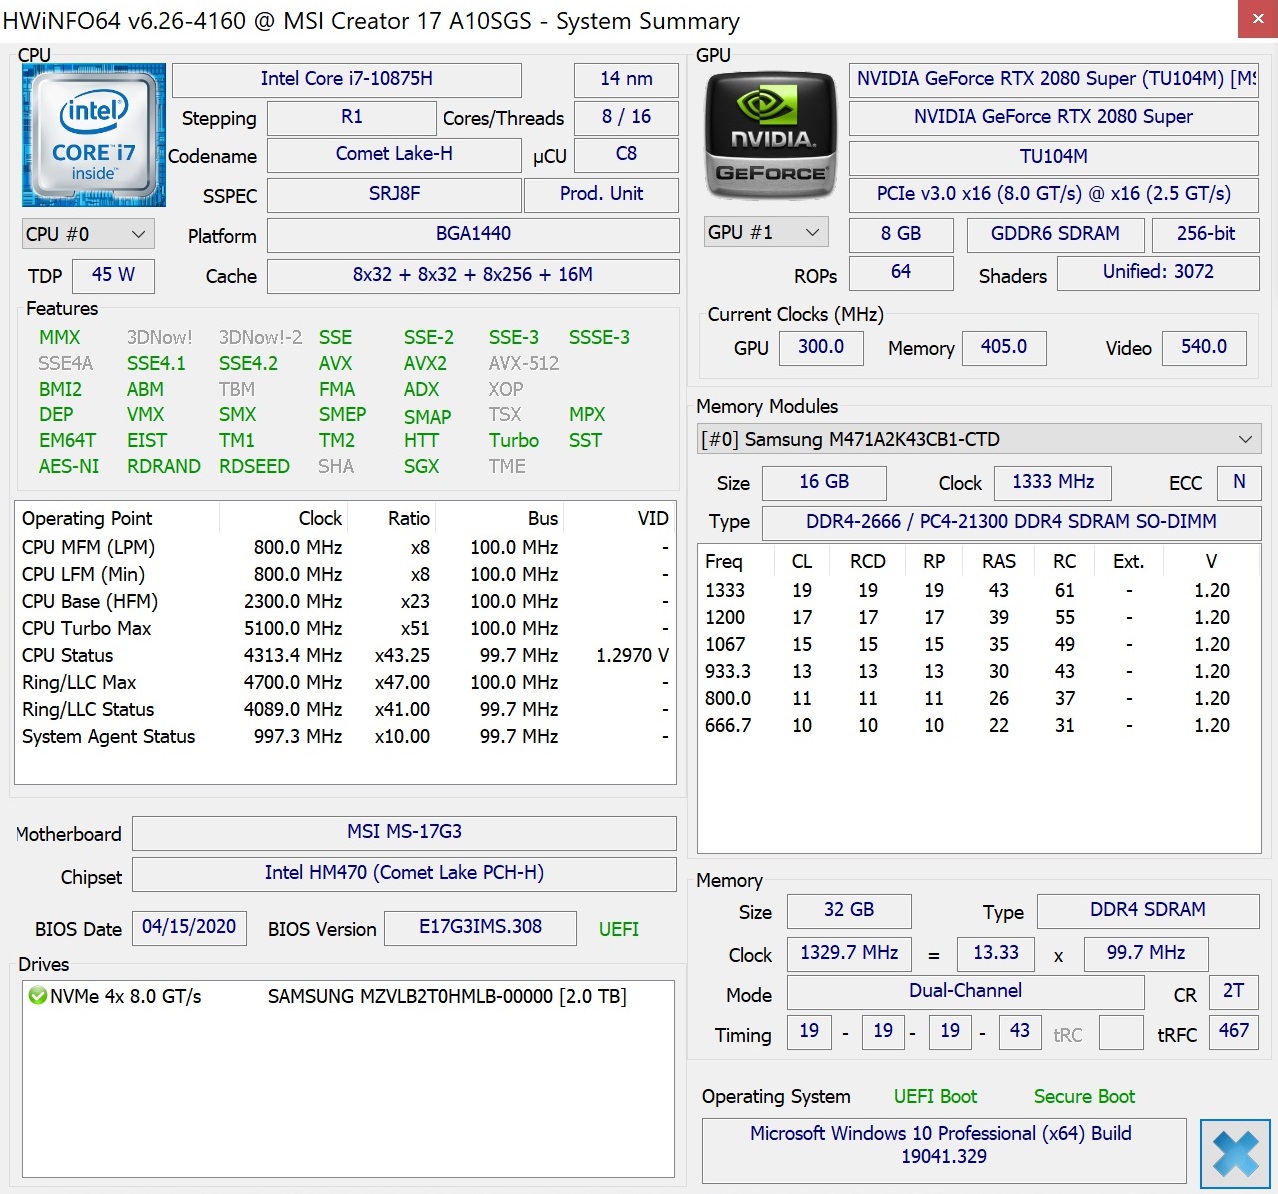
With an octa-core CPU, 32 GB of RAM, a 2 TB SSD, and an 8 GB graphics card, the Creator 17 definitely belongs to the high-end segment and should also offer sufficient reserves for future years – as long as you don't insist on the UHD resolution in 3D applications.
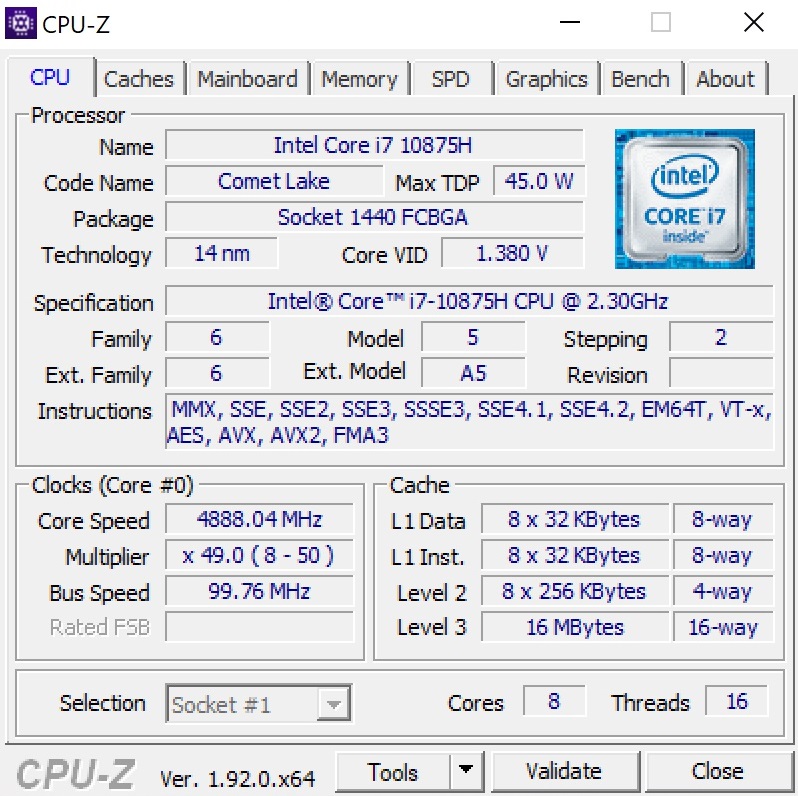
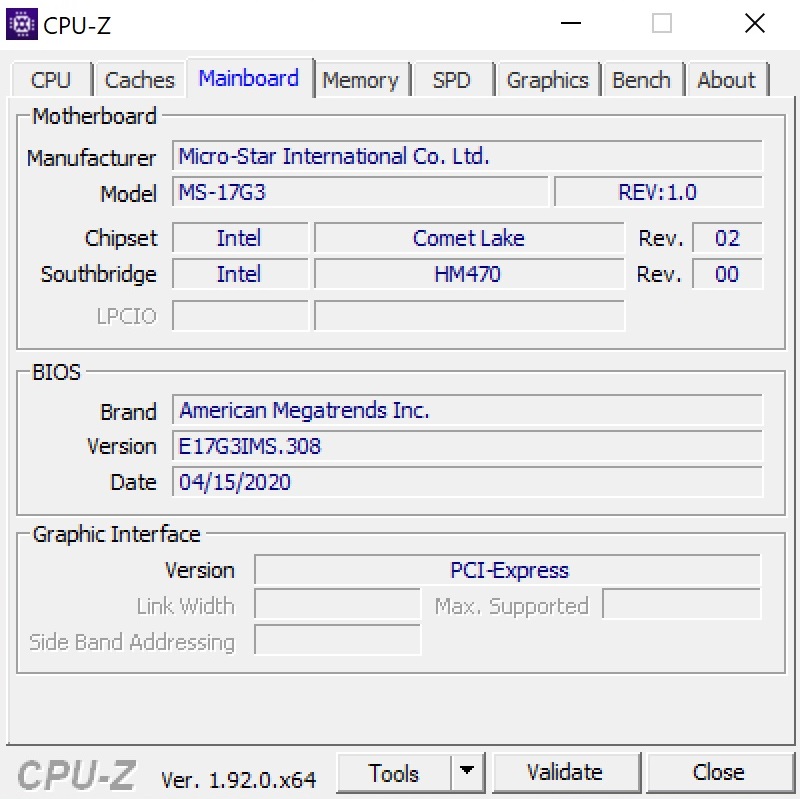
Processor
While in the past, the lead of Intel's mobile Core-i processors remained mostly uncontested, with its Ryzen-4000 series AMD not only caught up but in parts also surpassed the prior laptop champion (the best example is the Ryzen 7 4800H). Correspondingly, despite its high performance we are unable to praise the Core i7-10875H used in the Creator 17 as much as we did a few months ago.
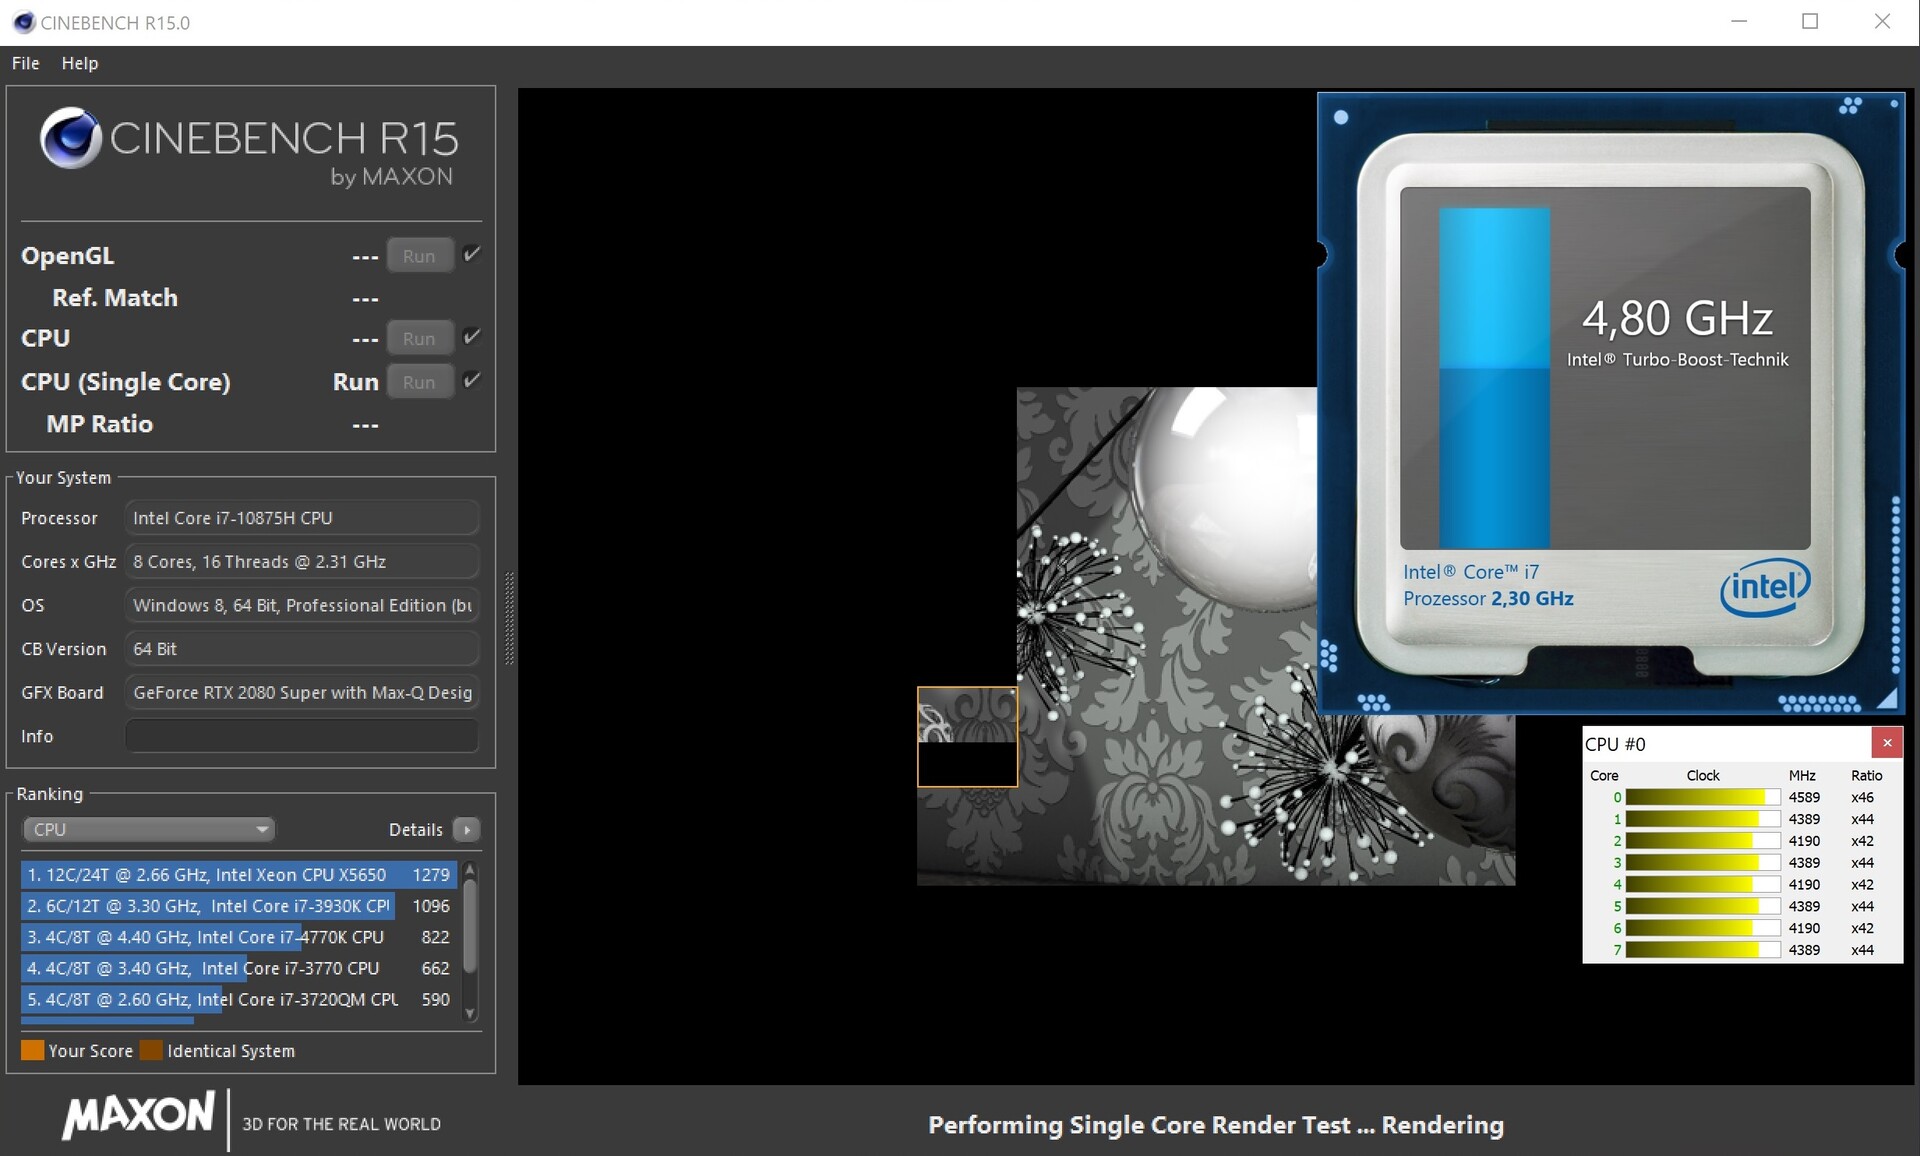
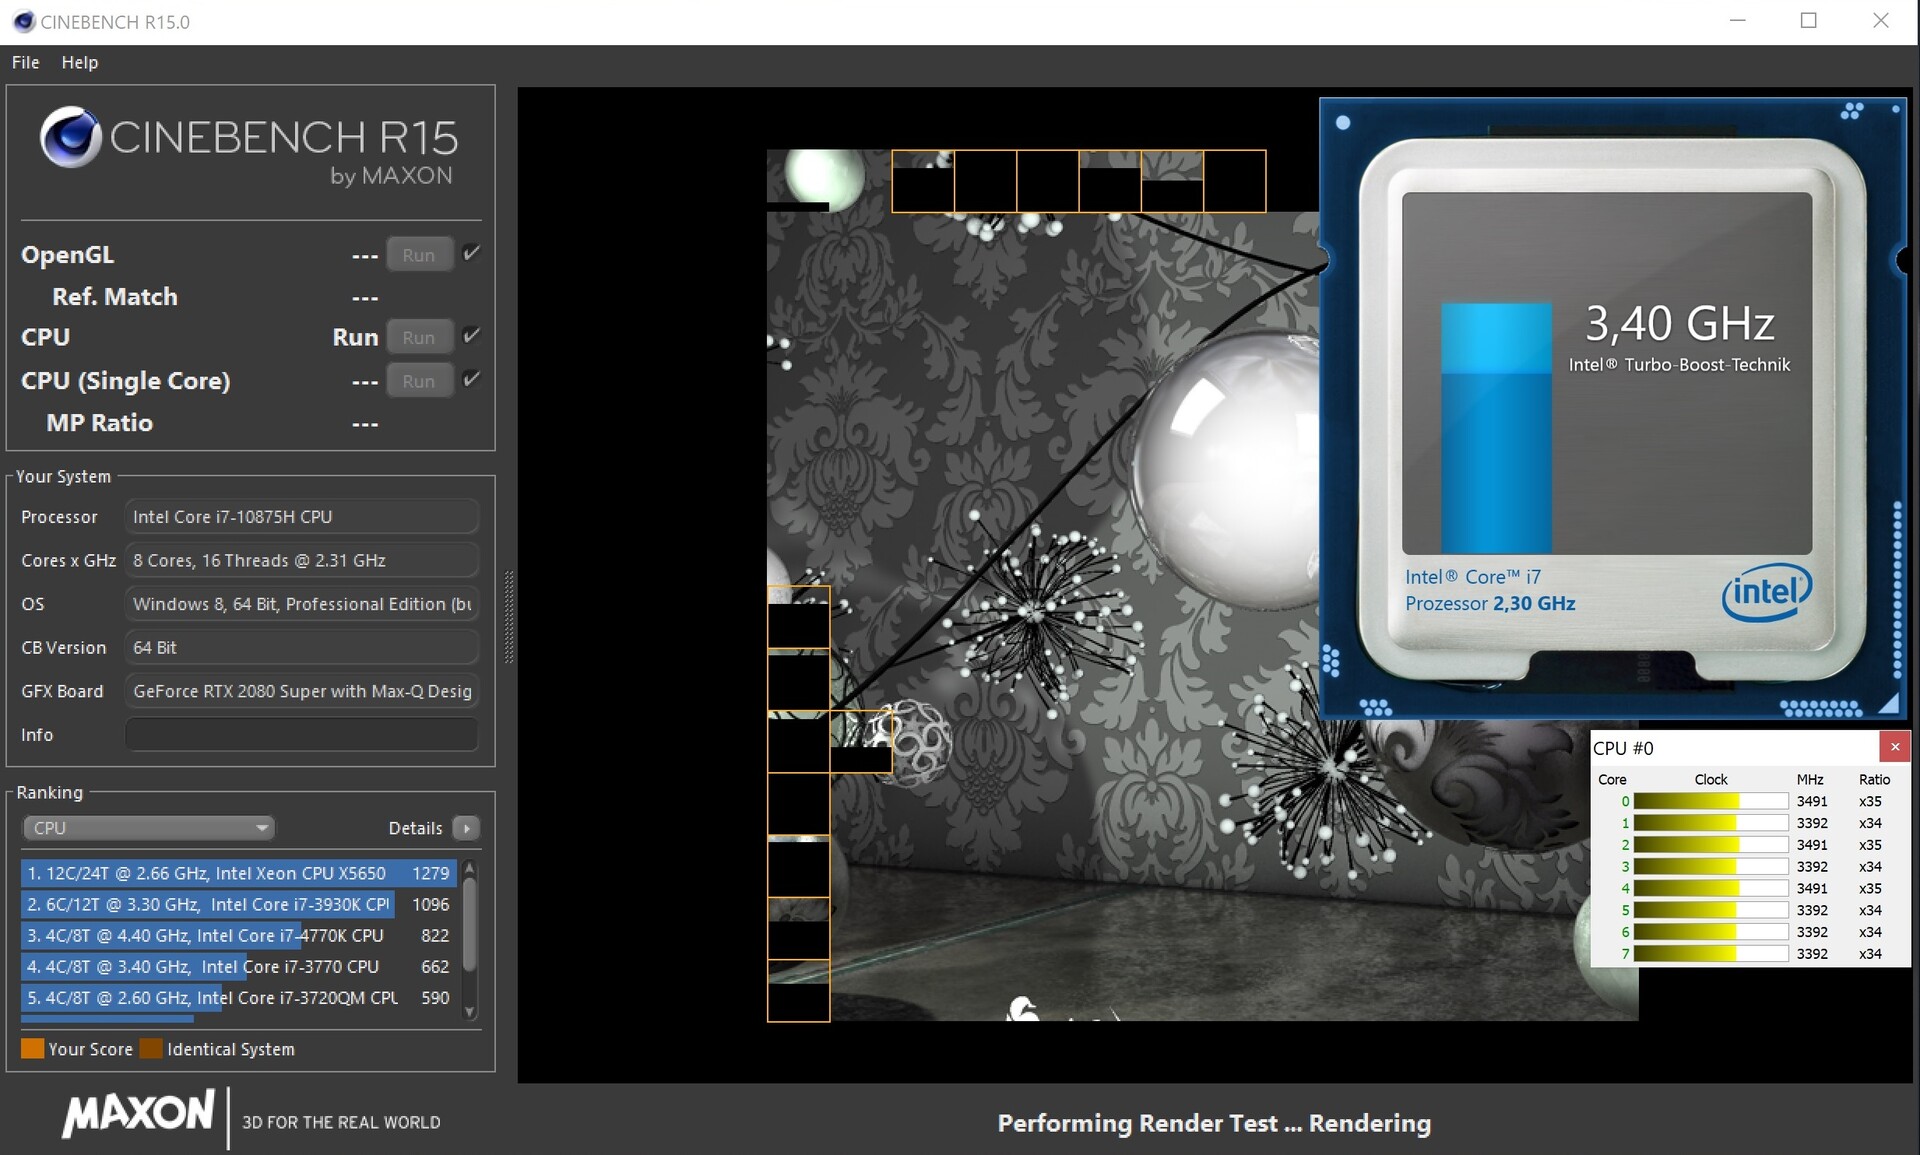
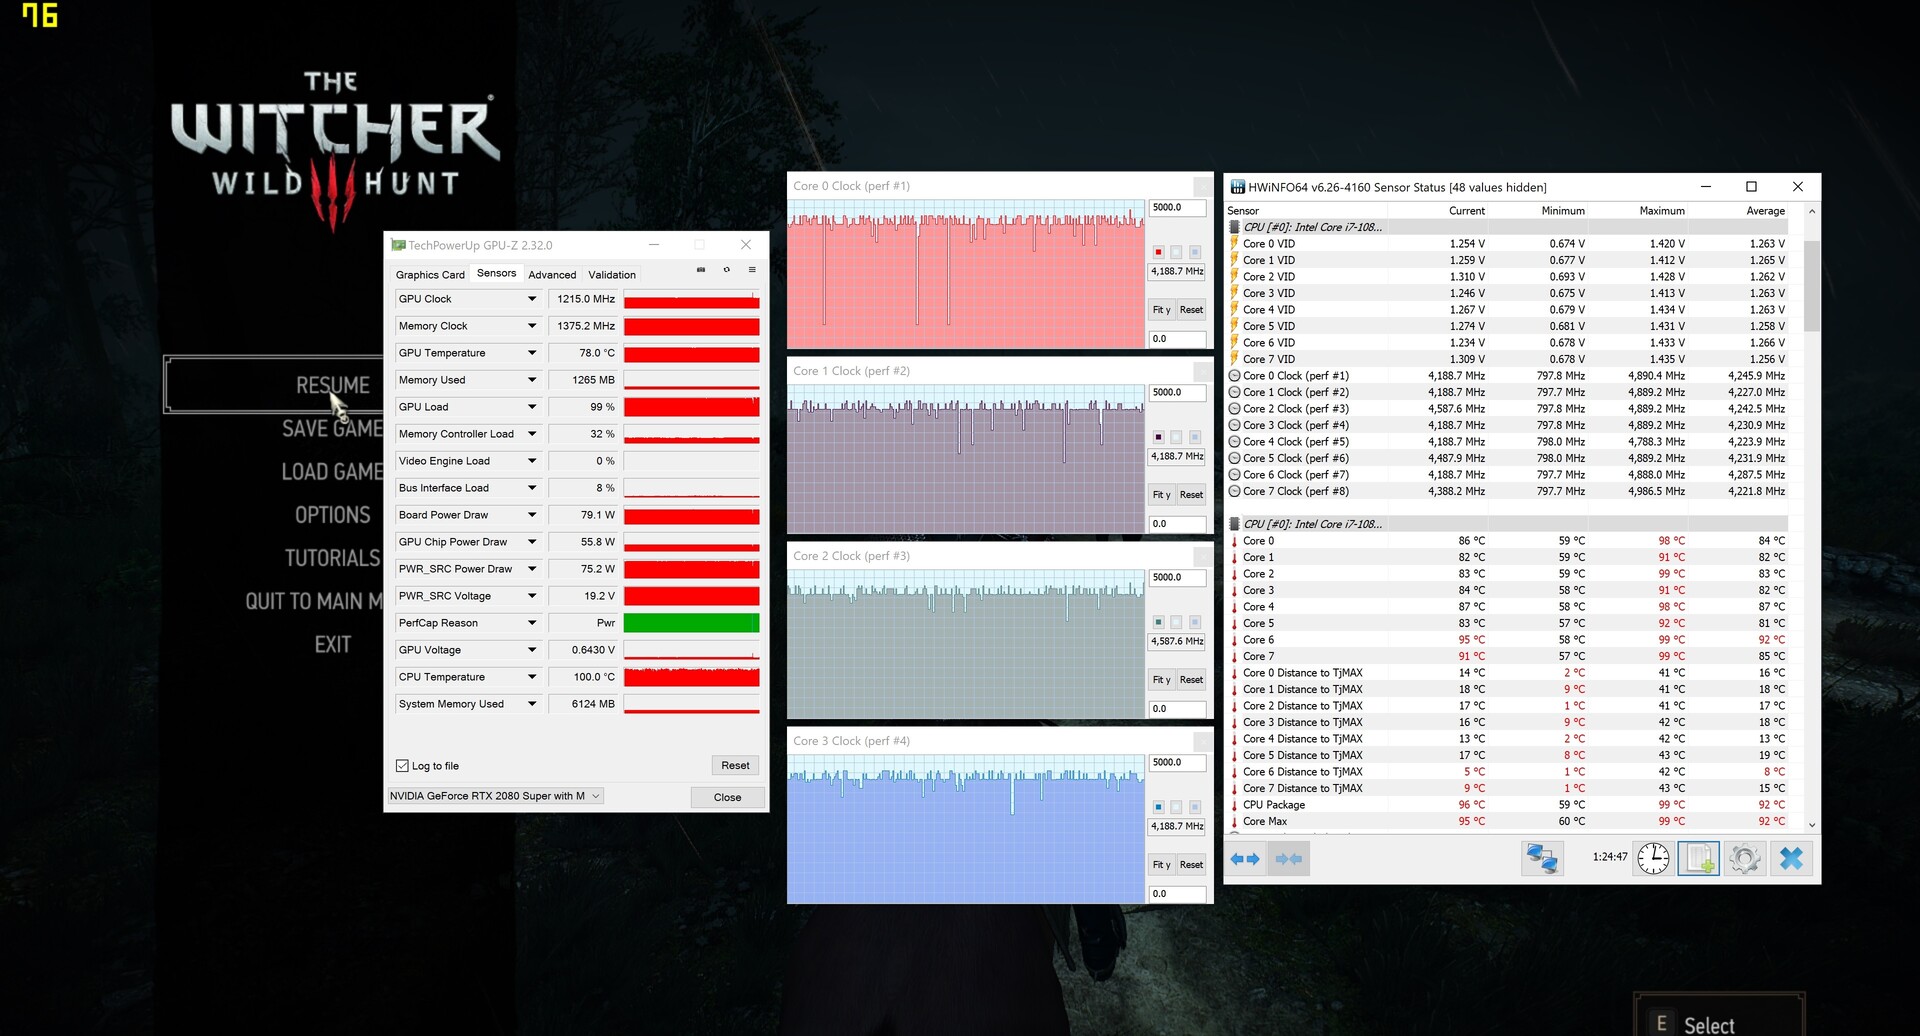
The octa-core model, which comes from the Comet Lake generation and is able to handle up to 16 threads in parallel via Hyper-Threading, offers 16 MB of L3 cache and a basic clock speed of 2.3 GHz. Via Turbo Boost, up to 5.1 GHz is possible under load. However, the Creator 17 is only able to make use of its overclocking potential to a limited extent. About 3.4 GHz under load of all cores (4.2 to 4.8 GHz under single-core load) points to a borderline cooling system.
Despite its limited Turbo, the 10875H is able to move slightly ahead of the old Core i7-9750H hexa-core darling, which is used in many of the competing laptops, as our Cinebench loop and the rest of the CPU benchmarks show.
| Cinebench R20 | |
| CPU (Single Core) | |
| Sınıf ortalaması Multimedia (425 - 853, n=57, son 2 yıl) | |
| MSI Creator 17 A10SGS | |
| Alienware m17 R2 P41E | |
| MSI GS75 Stealth 9SG | |
| Asus ROG Zephyrus S GX701GXR | |
| CPU (Multi Core) | |
| Sınıf ortalaması Multimedia (1887 - 12912, n=57, son 2 yıl) | |
| Alienware m17 R2 P41E | |
| MSI Creator 17 A10SGS | |
| MSI GS75 Stealth 9SG | |
| Asus ROG Zephyrus S GX701GXR | |
| Cinebench R15 | |
| CPU Single 64Bit | |
| Sınıf ortalaması Multimedia (184.8 - 326, n=59, son 2 yıl) | |
| MSI Creator 17 A10SGS | |
| Alienware m17 R2 P41E | |
| MSI GS75 Stealth 9SG | |
| Razer Blade Pro 17 RTX 2080 Max-Q | |
| Asus ROG Zephyrus S GX701GXR | |
| CPU Multi 64Bit | |
| Sınıf ortalaması Multimedia (856 - 5224, n=61, son 2 yıl) | |
| Alienware m17 R2 P41E | |
| MSI Creator 17 A10SGS | |
| MSI GS75 Stealth 9SG | |
| Razer Blade Pro 17 RTX 2080 Max-Q | |
| Asus ROG Zephyrus S GX701GXR | |
| Blender - v2.79 BMW27 CPU | |
| MSI Creator 17 A10SGS | |
| Sınıf ortalaması Multimedia (100 - 557, n=58, son 2 yıl) | |
| 7-Zip 18.03 | |
| 7z b 4 -mmt1 | |
| Sınıf ortalaması Multimedia (3666 - 7545, n=56, son 2 yıl) | |
| MSI Creator 17 A10SGS | |
| 7z b 4 | |
| Sınıf ortalaması Multimedia (26062 - 130368, n=55, son 2 yıl) | |
| MSI Creator 17 A10SGS | |
| Geekbench 5.5 | |
| Single-Core | |
| Sınıf ortalaması Multimedia (805 - 2974, n=56, son 2 yıl) | |
| MSI Creator 17 A10SGS | |
| Multi-Core | |
| Sınıf ortalaması Multimedia (4652 - 20422, n=56, son 2 yıl) | |
| MSI Creator 17 A10SGS | |
| HWBOT x265 Benchmark v2.2 - 4k Preset | |
| Sınıf ortalaması Multimedia (5.26 - 36.1, n=56, son 2 yıl) | |
| MSI Creator 17 A10SGS | |
| LibreOffice - 20 Documents To PDF | |
| MSI Creator 17 A10SGS | |
| Sınıf ortalaması Multimedia (23.9 - 146.7, n=57, son 2 yıl) | |
| R Benchmark 2.5 - Overall mean | |
| MSI Creator 17 A10SGS | |
| Sınıf ortalaması Multimedia (0.3604 - 0.947, n=56, son 2 yıl) | |
* ... daha küçük daha iyidir
System Performance
According to PCMark 10, the Creator 17 lands in third place behind the Asus GX701GXR and the MSI GS75 9SG in the system performance. As expected, the laptop operates very quickly in terms of booting up, starting programs, and other load times.
| PCMark 10 - Score | |
| Sınıf ortalaması Multimedia (4325 - 10386, n=52, son 2 yıl) | |
| Asus ROG Zephyrus S GX701GXR | |
| MSI GS75 Stealth 9SG | |
| MSI Creator 17 A10SGS | |
| Razer Blade Pro 17 RTX 2080 Max-Q | |
| Alienware m17 R2 P41E | |
| V-Ray Benchmark Next 4.10 | |
| CPU | |
| Sınıf ortalaması Multimedia (4772 - 35165, n=53, son 2 yıl) | |
| MSI Creator 17 A10SGS | |
| GPU | |
| Sınıf ortalaması Multimedia (32 - 1191, n=53, son 2 yıl) | |
| MSI Creator 17 A10SGS | |
DPC Latencies
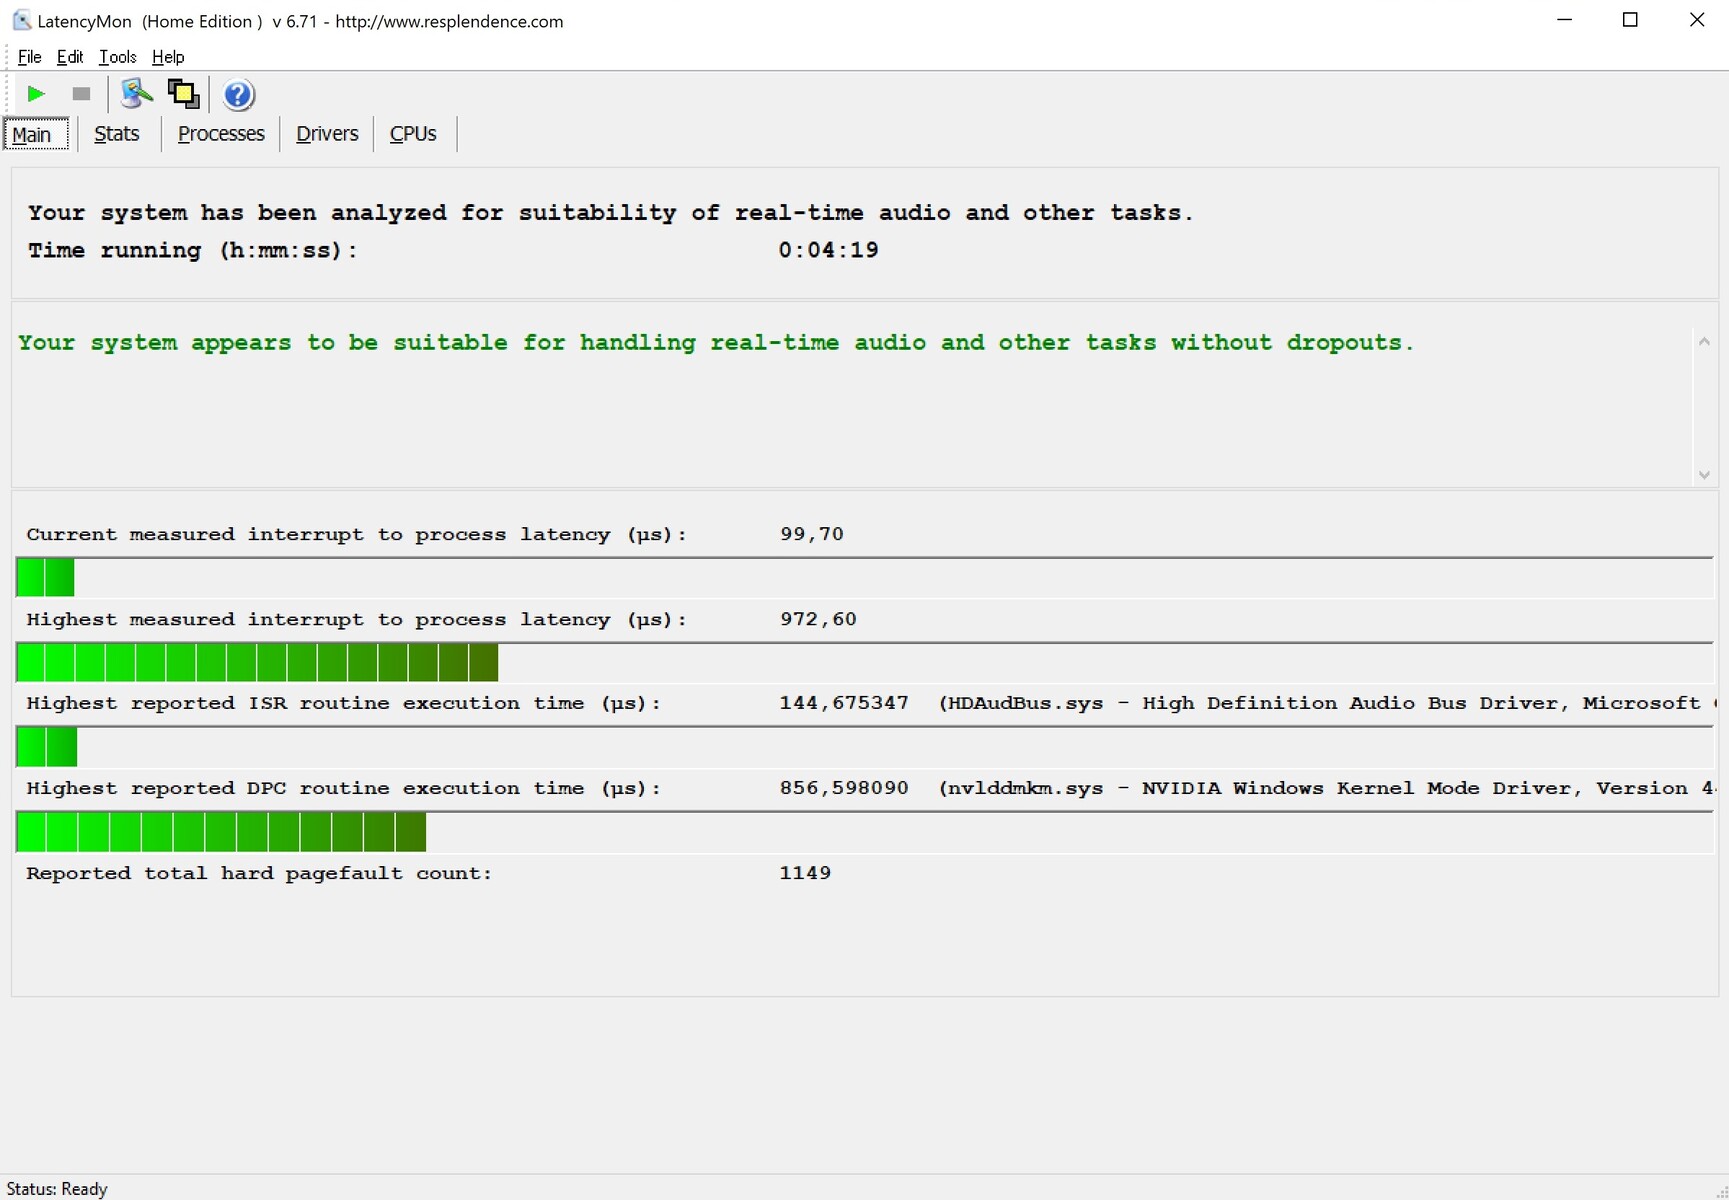
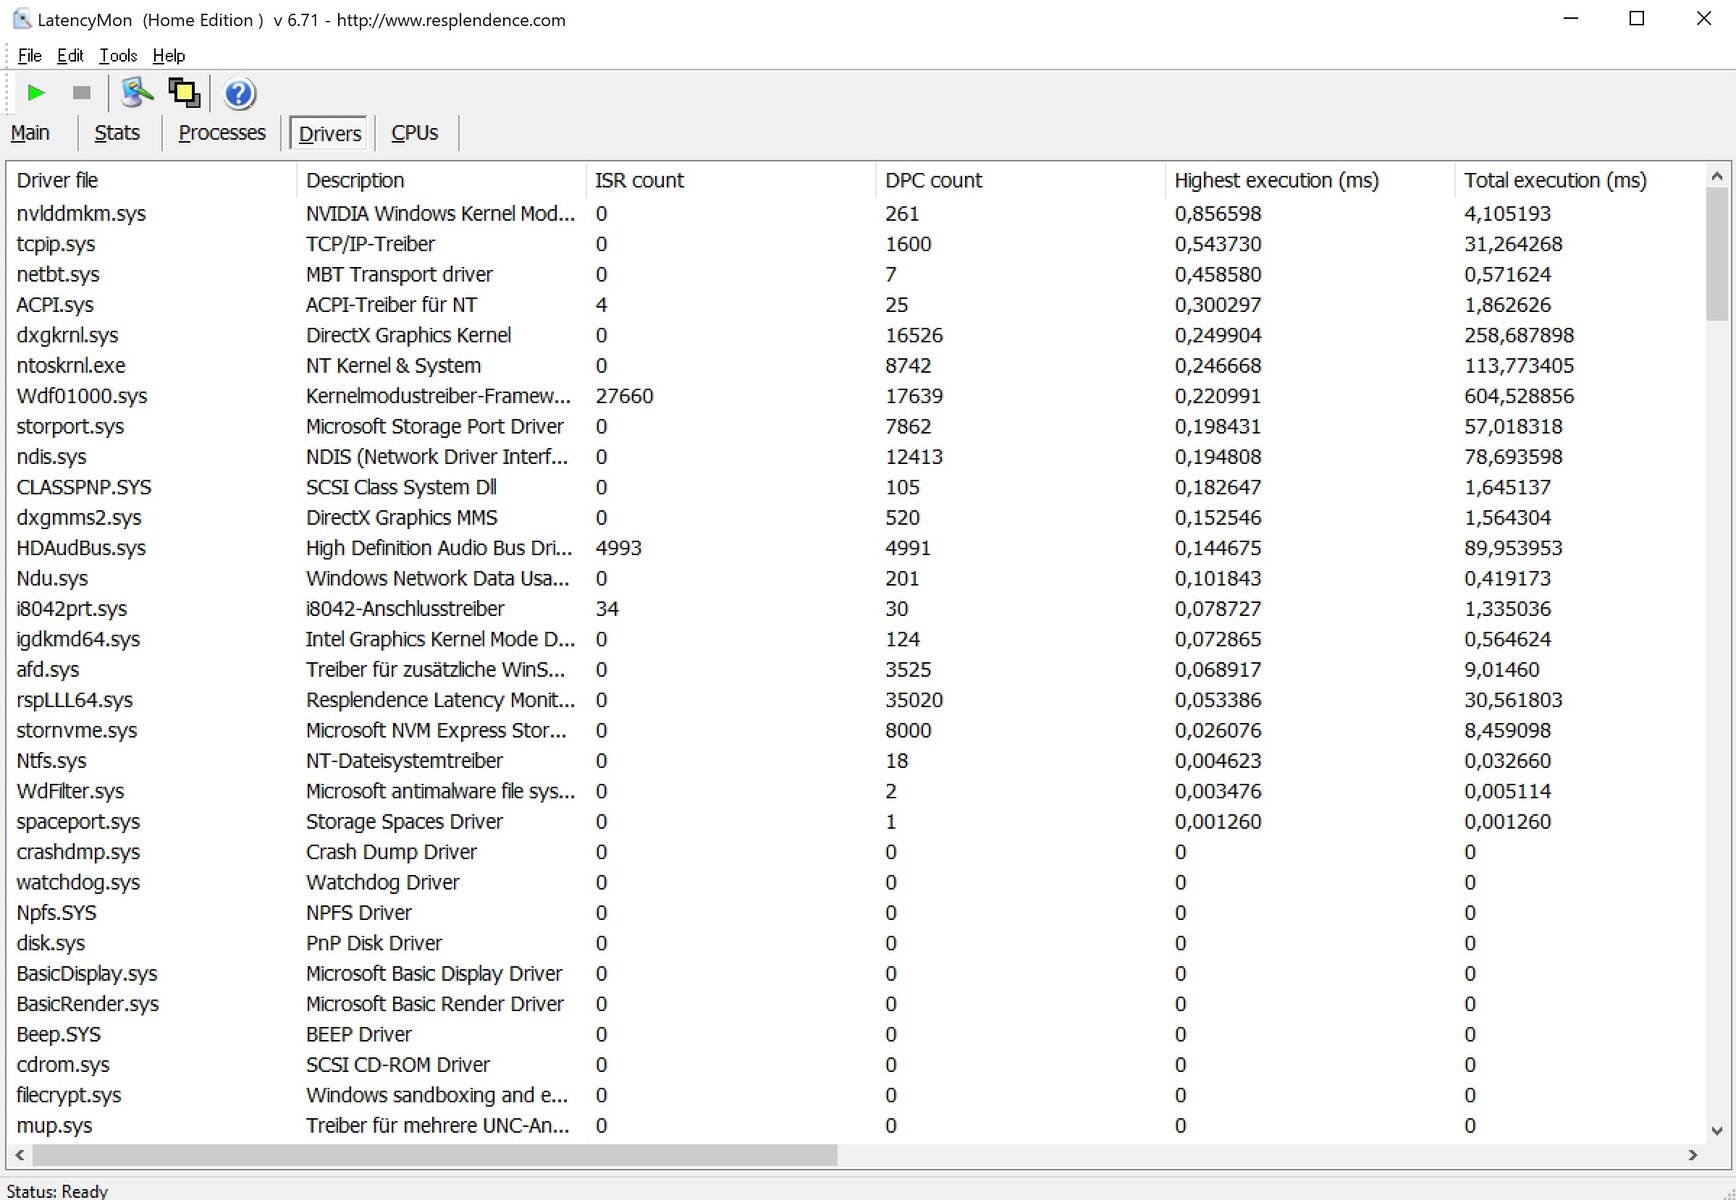
Our LatencyMon tool did not find any latency problems in the Creator 17. However, according to the YouTube statistics, our 4K video test did not run quite cleanly (producing frame drops).
| DPC Latencies / LatencyMon - interrupt to process latency (max), Web, Youtube, Prime95 | |
| MSI Creator 17 A10SGS | |
* ... daha küçük daha iyidir
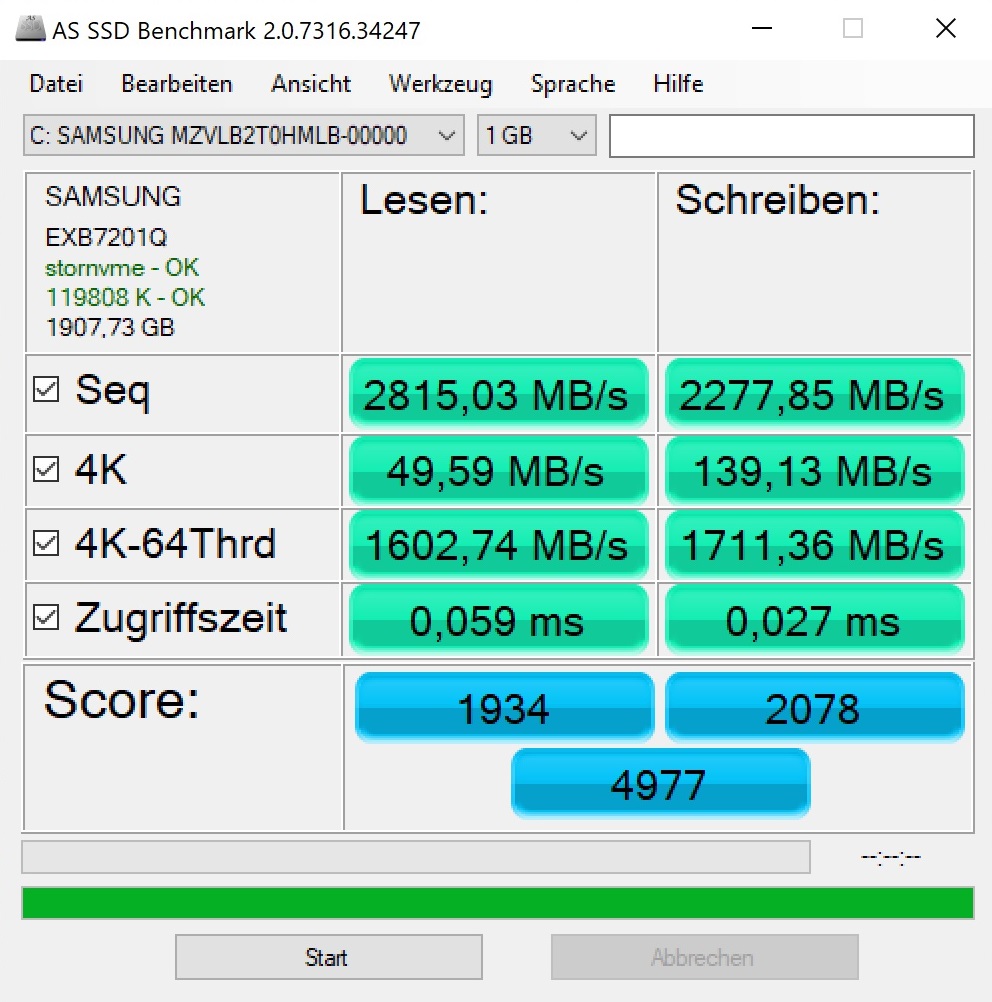
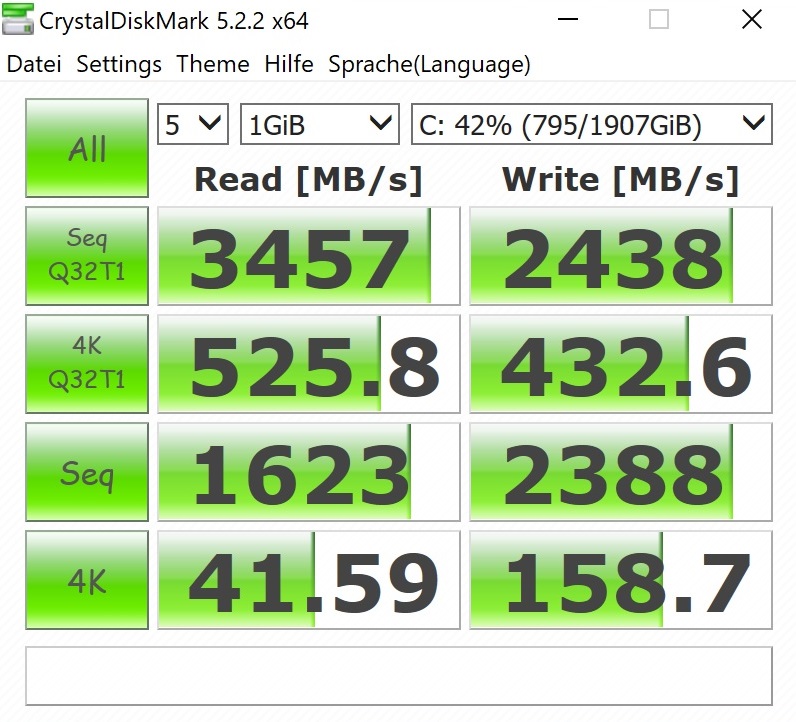
Storage Solution
MSI has equipped our test unit with a 2 TB NVMe SSD from Samsung. The PM981 is known for its high performance, which also goes for the Creator 17. The slightly smaller models in the Razer Blade Pro 17 and Asus ROG Zephyrus S, which come from the same build series, are beaten by about 20% in the CrystalDiskMark test. In contrast, the RAID combinations of the GS75 Stealth and Alienware m17 R2 perform at the same level.
| MSI Creator 17 A10SGS Samsung SSD PM981 MZVLB2T0HMLB | MSI GS75 Stealth 9SG 2x Samsung SSD PM981 MZVLB1T0HALR (RAID 0) | Razer Blade Pro 17 RTX 2080 Max-Q Samsung SSD PM981 MZVLB512HAJQ | Asus ROG Zephyrus S GX701GXR Samsung SSD PM981 MZVLB1T0HALR | Alienware m17 R2 P41E 2x SK Hynix PC601 NVMe 512 GB (RAID 0) | |
|---|---|---|---|---|---|
| CrystalDiskMark 5.2 / 6 | 8% | -23% | -22% | 1% | |
| Write 4K (MB/s) | 158.7 | 95.5 -40% | 100.7 -37% | 96.1 -39% | 110.6 -30% |
| Read 4K (MB/s) | 41.59 | 42.59 2% | 41.03 -1% | 40.86 -2% | 41.46 0% |
| Write Seq (MB/s) | 2388 | 2851 19% | 1146 -52% | 1317 -45% | 2378 0% |
| Read Seq (MB/s) | 1623 | 2696 66% | 1115 -31% | 1030 -37% | 2114 30% |
| Write 4K Q32T1 (MB/s) | 432.6 | 402.6 -7% | 384.6 -11% | 350.4 -19% | 445.4 3% |
| Read 4K Q32T1 (MB/s) | 526 | 443.9 -16% | 429.5 -18% | 404.1 -23% | 509 -3% |
| Write Seq Q32T1 (MB/s) | 2438 | 3420 40% | 1859 -24% | 2396 -2% | 2735 12% |
| Read Seq Q32T1 (MB/s) | 3457 | 3514 2% | 3179 -8% | 3194 -8% | 3206 -7% |

Constant Reads Performance: DiskSpd Read Loop, Queue Depth 8
Graphics Card
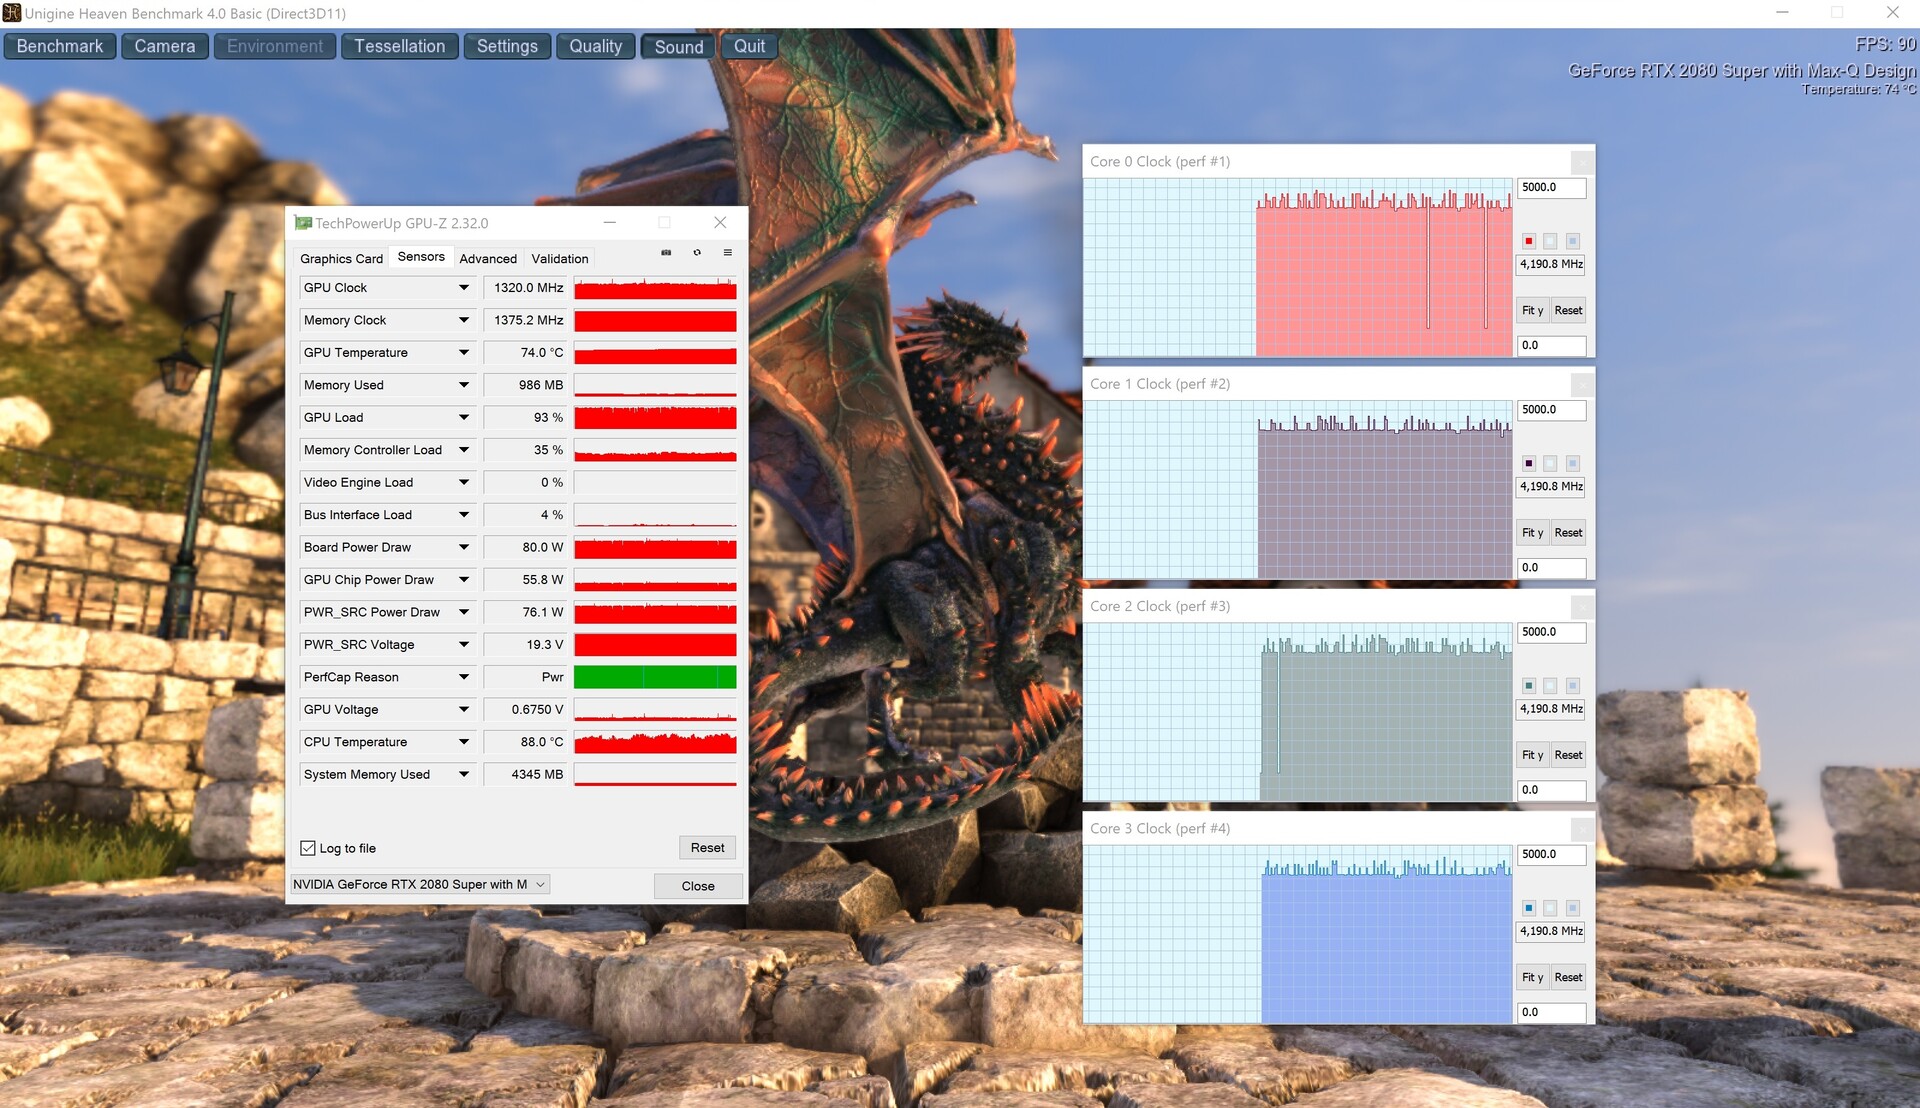
The GeForce RTX 2080 Super Max-Q is a version of the regular RTX 2080 Super that is especially trimmed for efficiency. The RTX 2080 Super is meant for slim laptops designed for mobility. While the amount of shader units (3072) and the size of the video storage (8 GB GDDR6) are identical, the Max-Q version has significantly lower clock speeds. In the case of the Creator 17, the standard clock speed is only 735 instead of 1365 MHz. However, like the CPU, the GPU is able to receive an automatic boost (up to 1845 MHz in the Render test of the GPU-Z tool).
| 3DMark | |
| 1920x1080 Fire Strike Graphics | |
| Razer Blade Pro 17 RTX 2080 Max-Q | |
| Alienware m17 R2 P41E | |
| Asus ROG Zephyrus S GX701GXR | |
| MSI GS75 Stealth 9SG | |
| MSI Creator 17 A10SGS | |
| Sınıf ortalaması Multimedia (2328 - 48907, n=58, son 2 yıl) | |
| 2560x1440 Time Spy Graphics | |
| Razer Blade Pro 17 RTX 2080 Max-Q | |
| Alienware m17 R2 P41E | |
| Asus ROG Zephyrus S GX701GXR | |
| MSI GS75 Stealth 9SG | |
| MSI Creator 17 A10SGS | |
| Sınıf ortalaması Multimedia (696 - 19403, n=59, son 2 yıl) | |
| 2560x1440 Port Royal Graphics | |
| Sınıf ortalaması Multimedia (1707 - 8396, n=14, son 2 yıl) | |
| Razer Blade Pro 17 RTX 2080 Max-Q | |
| Alienware m17 R2 P41E | |
| Asus ROG Zephyrus S GX701GXR | |
| MSI GS75 Stealth 9SG | |
| MSI Creator 17 A10SGS | |
| 3DMark 11 - 1280x720 Performance GPU | |
| Razer Blade Pro 17 RTX 2080 Max-Q | |
| Alienware m17 R2 P41E | |
| Asus ROG Zephyrus S GX701GXR | |
| MSI GS75 Stealth 9SG | |
| MSI Creator 17 A10SGS | |
| Sınıf ortalaması Multimedia (3749 - 60002, n=55, son 2 yıl) | |
| SPECviewperf 13 | |
| 3ds Max (3dsmax-06) | |
| Sınıf ortalaması Multimedia (n=1son 2 yıl) | |
| MSI Creator 17 A10SGS | |
| Catia (catia-05) | |
| Sınıf ortalaması Multimedia (n=1son 2 yıl) | |
| MSI Creator 17 A10SGS | |
| Creo (creo-02) | |
| Sınıf ortalaması Multimedia (n=1son 2 yıl) | |
| MSI Creator 17 A10SGS | |
| Energy (energy-02) | |
| Sınıf ortalaması Multimedia (n=1son 2 yıl) | |
| MSI Creator 17 A10SGS | |
| Maya (maya-05) | |
| Sınıf ortalaması Multimedia (n=1son 2 yıl) | |
| MSI Creator 17 A10SGS | |
| Medical (medical-02) | |
| Sınıf ortalaması Multimedia (n=1son 2 yıl) | |
| MSI Creator 17 A10SGS | |
| Showcase (showcase-02) | |
| Sınıf ortalaması Multimedia (n=1son 2 yıl) | |
| MSI Creator 17 A10SGS | |
| Siemens NX (snx-03) | |
| Sınıf ortalaması Multimedia (n=1son 2 yıl) | |
| MSI Creator 17 A10SGS | |
| Solidworks (sw-04) | |
| Sınıf ortalaması Multimedia (n=1son 2 yıl) | |
| MSI Creator 17 A10SGS | |
Using our The Witcher 3 role-playing game for one hour, we evaluated how the clock speed behaves over a longer time period. On average, the RTX 2080 Super Max-Q maintained 1215 MHz here. With this value, the Creator 17 ends up at the bottom of our field of comparison devices. Depending on the benchmark, the competitors were between 1 and 20% faster – and that without the "Super" addition. This is not surprising, since the Turing chip is also available with a higher TGP, which explains the better results (990 MHz basic clock speed).
But whether with high or low TGP, overall the RTX 2080 (Super) Max-Q does not really deserve its label, since its performance is hardly any different than that of the RTX 2070 (Super). At times, the latter is even faster. Whether you want to blame Nvidia (specifications) or the laptop manufacturer (cooling system) remains up to you.
| 3DMark 11 Performance | 22567 puan | |
| 3DMark Fire Strike Score | 17053 puan | |
| 3DMark Time Spy Score | 7482 puan | |
Yardım | ||
Gaming Performance
In the native UHD resolution of 3840x2160 pixels, the RTX 2080 Super Max-Q is unable to run every current game smoothly and at maximum details. More demanding games such as Red Dead Redemption 2 and Control keep stuttering along. Things look much better in the QHD resolution of 2560x1440. Less than 60 FPS is a rarity here. Unfortunately, this resolution is not supported by the internal display, which is too bad. In Full HD resolution (1920x1080), all the games run smoothly.
To repeat it again: The Creator 17 was not designed for pure gaming. There are more affordable and better adjusted alternatives for that. The target group is clearly professional content creators.
| The Witcher 3 - 1920x1080 Ultra Graphics & Postprocessing (HBAO+) | |
| Razer Blade Pro 17 RTX 2080 Max-Q | |
| Asus ROG Zephyrus S GX701GXR | |
| Alienware m17 R2 P41E | |
| MSI GS75 Stealth 9SG | |
| MSI Creator 17 A10SGS | |
| Sınıf ortalaması Multimedia (11 - 121, n=7, son 2 yıl) | |
| düşük | orta | yüksek | ultra | QHD | 4K | |
|---|---|---|---|---|---|---|
| GTA V (2015) | 180 | 174 | 157 | 85.3 | 71.5 | |
| The Witcher 3 (2015) | 138 | 75.1 | 49.8 | |||
| Dota 2 Reborn (2015) | 155 | 141 | 139 | 125 | 102 | |
| X-Plane 11.11 (2018) | 113 | 99.8 | 84.3 | 67 | ||
| Shadow of the Tomb Raider (2018) | 105 | 92 | 63 | 32 | ||
| Battlefield V (2018) | 127 | 118 | 95.4 | 52.6 | ||
| Far Cry New Dawn (2019) | 98 | 92 | 78 | 43 | ||
| Rage 2 (2019) | 102 | 101 | 63.8 | 30.9 | ||
| Control (2019) | 71.1 | 46.1 | 22 | |||
| Borderlands 3 (2019) | 79.8 | 71.6 | 51.7 | 26.9 | ||
| FIFA 20 (2019) | 217 | 213 | 189 | 114 | ||
| Call of Duty Modern Warfare 2019 (2019) | 114 | 91.8 | 67.3 | 36.8 | ||
| Star Wars Jedi Fallen Order (2019) | 102 | 95.2 | 72.2 | 36.8 | ||
| Red Dead Redemption 2 (2019) | 62.4 | 41 | 35 | 21.5 | ||
| Gears Tactics (2020) | 114 | 78.4 | 54 | 28.1 |
Emissions
Noise Emissions
You should not expect a low noise level when you buy this. At times, the fans even rev up without any reason already during idle mode, producing a noise level of almost 40 dB(A). Under load, the Creator 17 produces between 46 and 48 dB(A). Although this is not louder than the competitors, the use of headphones is still recommended. In general, the noise characteristic of the Creator 17 fans is slightly uncomfortable (a permanent whirring noise).
Ses yüksekliği
| Boşta |
| 32 / 33 / 40 dB |
| Çalışırken |
| 47 / 48 dB |
 | ||
30 dB sessiz 40 dB(A) duyulabilirlik 50 dB(A) gürültülü |
||
min: | ||
| MSI Creator 17 A10SGS i7-10875H, GeForce RTX 2080 Super Max-Q | MSI GS75 Stealth 9SG i7-9750H, GeForce RTX 2080 Max-Q | Razer Blade Pro 17 RTX 2080 Max-Q i7-9750H, GeForce RTX 2080 Max-Q | Asus ROG Zephyrus S GX701GXR i7-9750H, GeForce RTX 2080 Max-Q | Alienware m17 R2 P41E i9-9980HK, GeForce RTX 2080 Max-Q | Sınıf ortalaması Multimedia | |
|---|---|---|---|---|---|---|
| Noise | 1% | 7% | 3% | 3% | 21% | |
| kapalı / ortam * (dB) | 30 | 30 -0% | 28.2 6% | 30 -0% | 29.1 3% | 24.1 ? 20% |
| Idle Minimum * (dB) | 32 | 31 3% | 28.2 12% | 32 -0% | 29.4 8% | 24.3 ? 24% |
| Idle Average * (dB) | 33 | 32 3% | 28.2 15% | 33 -0% | 29.4 11% | 24.7 ? 25% |
| Idle Maximum * (dB) | 40 | 38 5% | 30.8 23% | 34 15% | 31.5 21% | 26.3 ? 34% |
| Load Average * (dB) | 47 | 47 -0% | 42 11% | 40 15% | 49.7 -6% | 37.4 ? 20% |
| Witcher 3 ultra * (dB) | 46 | 48 -4% | 51 -11% | 49 -7% | 49.5 -8% | |
| Load Maximum * (dB) | 48 | 49 -2% | 53 -10% | 50 -4% | 53.3 -11% | 46.2 ? 4% |
* ... daha küçük daha iyidir
Temperature
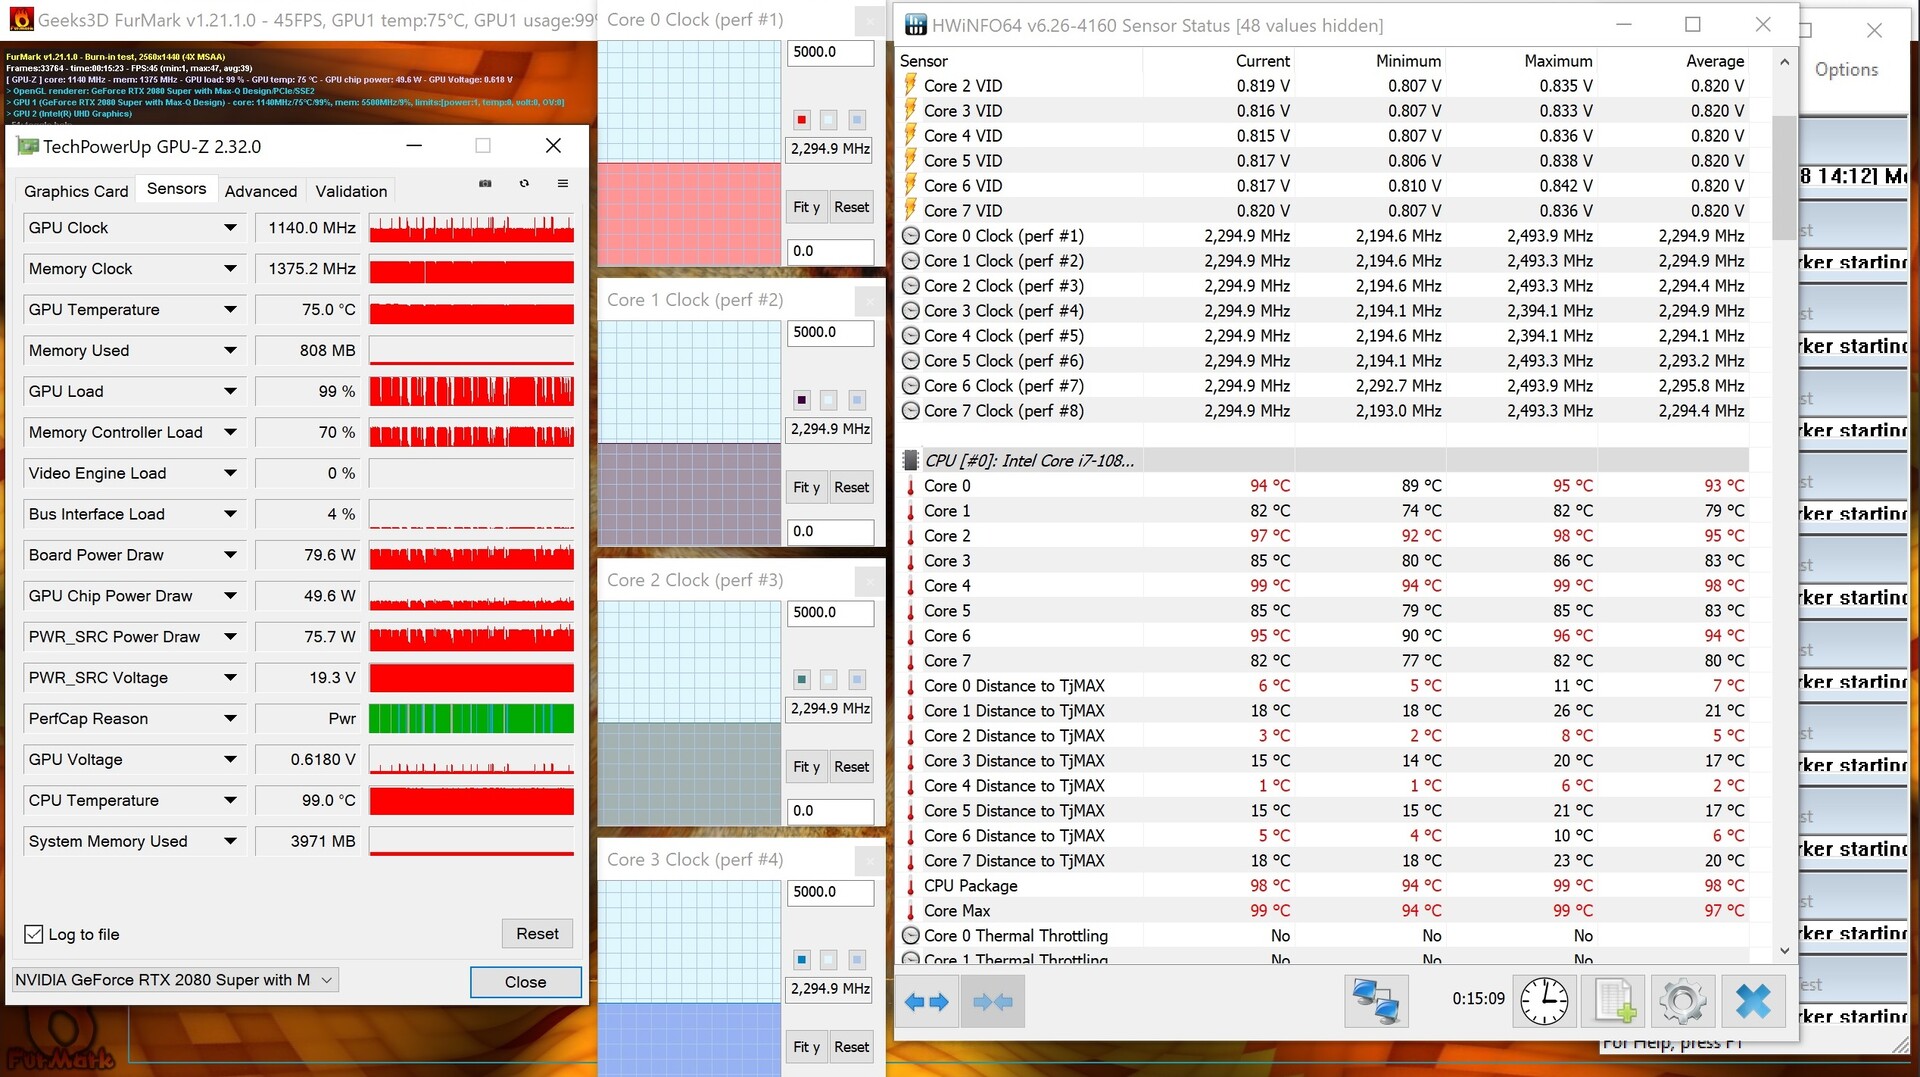
The case temperatures are typical for a high-end notebook that is so fast. At the end of the 60-minute stress test with the FurMark and Prime 95 tools, we measure up to 52 °C (126 °F) on top and 59 °C (138 °F) on the bottom. We would therefore not recommend any 3D sessions holding it on your lap. For the components, our judgment is mixed. While the temperature of the GeForce RTX 2080 Super Max-Q always remains below 80 °C (176 °F), the Core i7-10875H heats up to a maximum of 99 °C (210 °F) according to the HWiNFO tool.
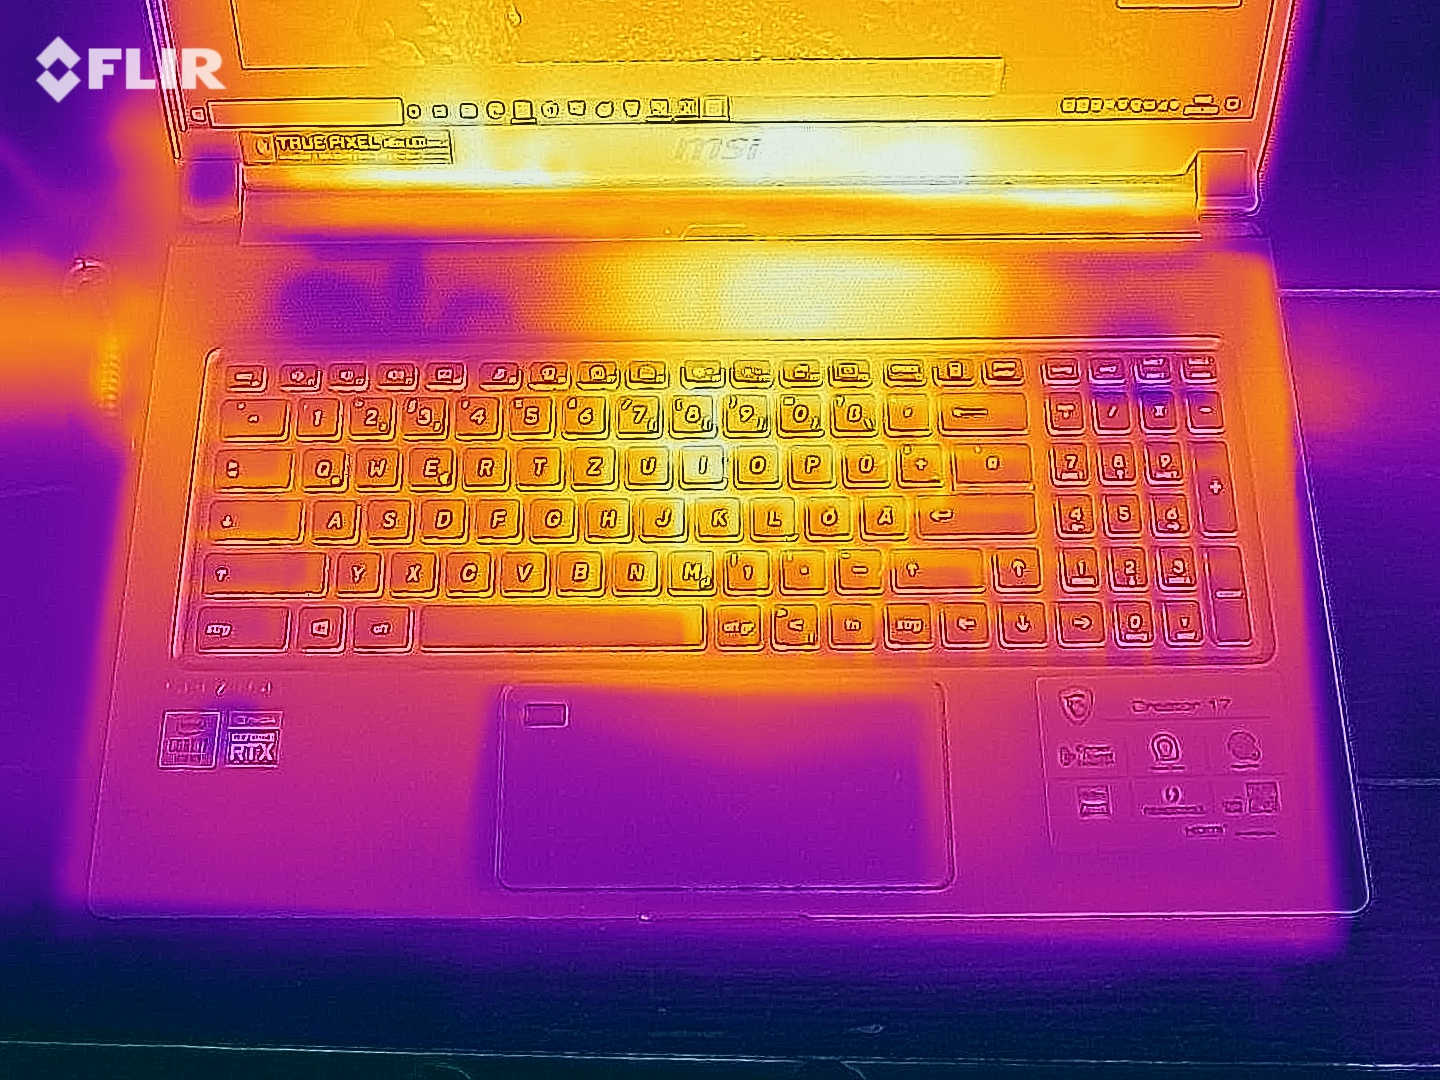
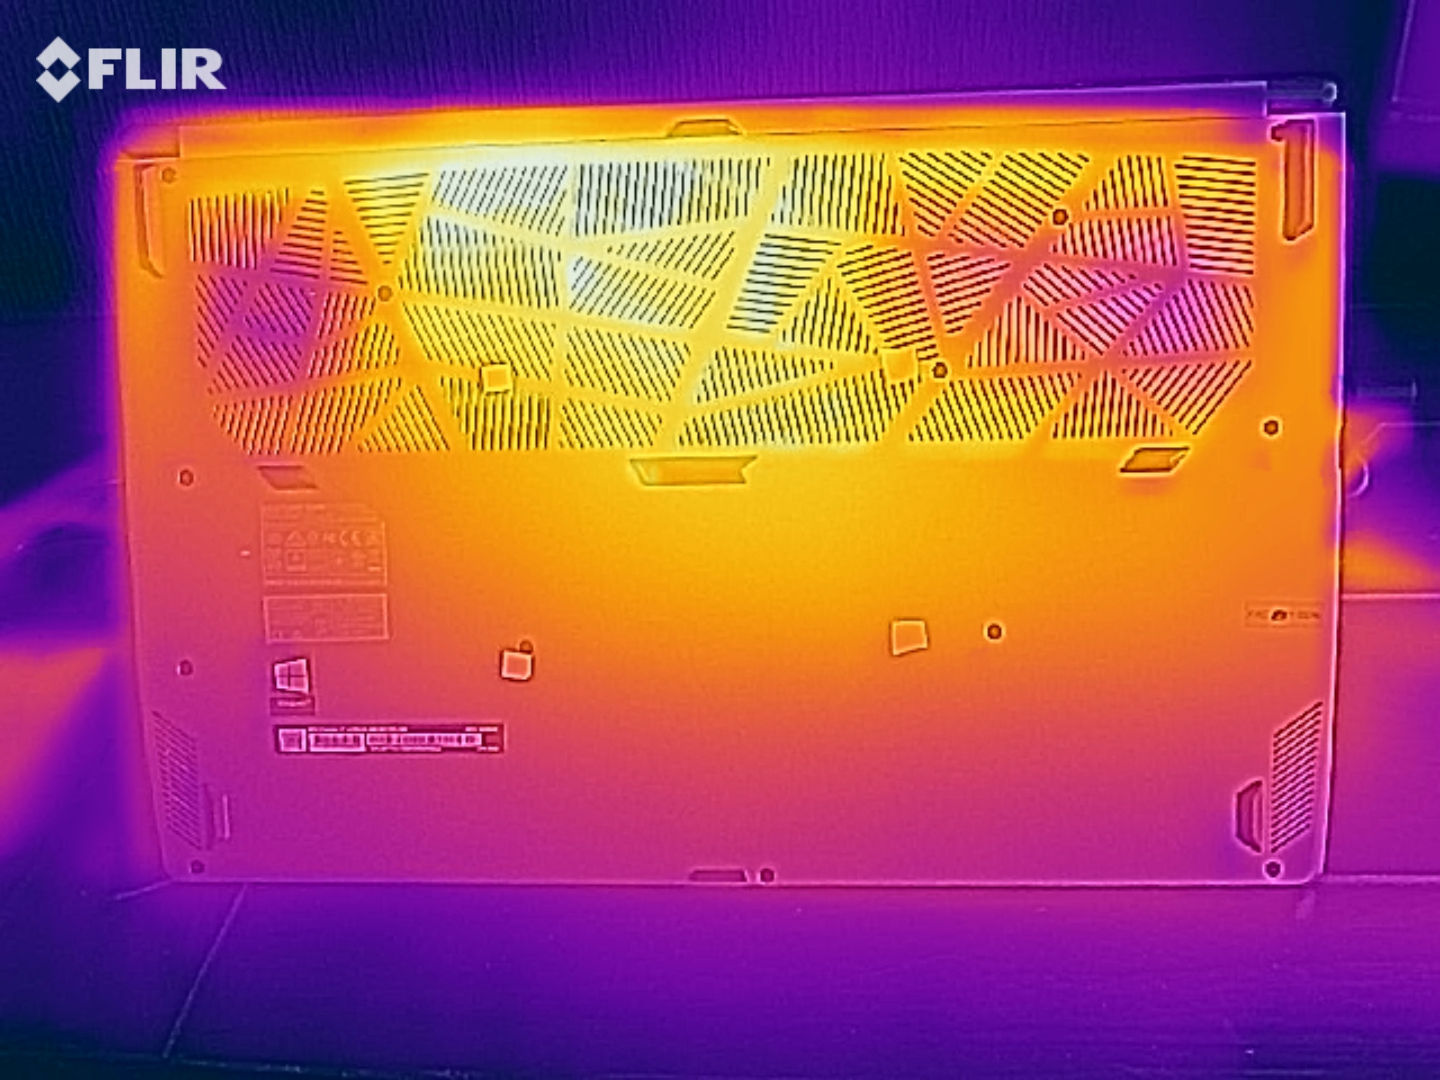
(-) Üst taraftaki maksimum sıcaklık, 36.8 °C / 98 F ortalamasına kıyasla 52 °C / 126 F'dir. , Multimedia sınıfı için 21 ile 71 °C arasında değişir.
(-) Alt kısım, 39.1 °C / 102 F ortalamasına kıyasla maksimum 59 °C / 138 F'ye kadar ısınır
(+) Boşta kullanımda, üst tarafın ortalama sıcaklığı 30.9 °C / 88 F olup, cihazın 31.3 °C / 88 F.
(-) The Witcher 3 oynarken, üst tarafın ortalama sıcaklığı 47.4 °C / 117 F olup, cihazın 31.3 °C / 88 F.
(-) Avuç içi dayanakları ve dokunmatik yüzey maksimum 43 °C / 109.4 F ile dokunulamayacak kadar ısınabilir.
(-) Benzer cihazların avuç içi dayanağı alanının ortalama sıcaklığı 28.7 °C / 83.7 F (-14.3 °C / -25.7 F) idi.
| MSI Creator 17 A10SGS i7-10875H, GeForce RTX 2080 Super Max-Q | MSI GS75 Stealth 9SG i7-9750H, GeForce RTX 2080 Max-Q | Razer Blade Pro 17 RTX 2080 Max-Q i7-9750H, GeForce RTX 2080 Max-Q | Asus ROG Zephyrus S GX701GXR i7-9750H, GeForce RTX 2080 Max-Q | Alienware m17 R2 P41E i9-9980HK, GeForce RTX 2080 Max-Q | Sınıf ortalaması Multimedia | |
|---|---|---|---|---|---|---|
| Heat | -0% | 17% | 6% | -9% | 21% | |
| Maximum Upper Side * (°C) | 52 | 55 -6% | 43 17% | 50 4% | 54.2 -4% | 41.1 ? 21% |
| Maximum Bottom * (°C) | 59 | 65 -10% | 47.2 20% | 47 20% | 61.4 -4% | 43.6 ? 26% |
| Idle Upper Side * (°C) | 34 | 30 12% | 27.2 20% | 33 3% | 37.8 -11% | 26.9 ? 21% |
| Idle Bottom * (°C) | 33 | 32 3% | 30 9% | 34 -3% | 38.6 -17% | 27.8 ? 16% |
* ... daha küçük daha iyidir
Speakers
The sound quality places the laptop in the middle of the field. The Creator 17 has two speakers that are hidden in the front area of the two sides. Since there is no subwoofer, the bass is also lacking. Instead, the 2.0 system is able to score with ample volume (up to 91 dB).
MSI Creator 17 A10SGS ses analizi
(+) | hoparlörler nispeten yüksek sesle çalabilir (91 dB)
Bas 100 - 315Hz
(-) | neredeyse hiç bas yok - ortalama olarak medyandan 33.3% daha düşük
(+) | bas doğrusaldır (6% delta ile önceki frekans)
Ortalar 400 - 2000 Hz
(±) | daha yüksek ortalar - ortalama olarak medyandan 5.1% daha yüksek
(±) | Ortaların doğrusallığı ortalamadır (7.1% delta - önceki frekans)
Yüksekler 2 - 16 kHz
(+) | dengeli yüksekler - medyandan yalnızca 1.8% uzakta
(+) | yüksekler doğrusaldır (3.2% deltadan önceki frekansa)
Toplam 100 - 16.000 Hz
(±) | Genel sesin doğrusallığı ortalamadır (19.7% ortancaya göre fark)
Aynı sınıfla karşılaştırıldığında
» Bu sınıftaki tüm test edilen cihazların %65%'si daha iyi, 6% benzer, 29% daha kötüydü
» En iyisinin deltası 5% idi, ortalama 17% idi, en kötüsü 45% idi
Test edilen tüm cihazlarla karşılaştırıldığında
» Test edilen tüm cihazların %50'si daha iyi, 7 benzer, % 43 daha kötüydü
» En iyisinin deltası 4% idi, ortalama 23% idi, en kötüsü 134% idi
MSI GS75 Stealth 9SG ses analizi
(±) | hoparlör ses yüksekliği ortalama ama iyi (81 dB)
Bas 100 - 315Hz
(-) | neredeyse hiç bas yok - ortalama olarak medyandan 28.4% daha düşük
(±) | Bas doğrusallığı ortalamadır (7.8% delta - önceki frekans)
Ortalar 400 - 2000 Hz
(±) | azaltılmış orta sesler - ortalama olarak medyandan 5.8% daha düşük
(±) | Ortaların doğrusallığı ortalamadır (10% delta - önceki frekans)
Yüksekler 2 - 16 kHz
(+) | dengeli yüksekler - medyandan yalnızca 2.3% uzakta
(+) | yüksekler doğrusaldır (3.9% deltadan önceki frekansa)
Toplam 100 - 16.000 Hz
(±) | Genel sesin doğrusallığı ortalamadır (23.2% ortancaya göre fark)
Aynı sınıfla karşılaştırıldığında
» Bu sınıftaki tüm test edilen cihazların %84%'si daha iyi, 4% benzer, 11% daha kötüydü
» En iyisinin deltası 6% idi, ortalama 18% idi, en kötüsü 132% idi
Test edilen tüm cihazlarla karşılaştırıldığında
» Test edilen tüm cihazların %70'si daha iyi, 5 benzer, % 25 daha kötüydü
» En iyisinin deltası 4% idi, ortalama 23% idi, en kötüsü 134% idi
Power Management
Power Consumption
For a Max-Q device with Optimus technology, the power consumption is quite high in parts (up to 42 watts during idle operation). This is not only related to the octa-core processor but also the bright Mini LED display.
| Kapalı / Bekleme modu | |
| Boşta | |
| Çalışırken |
|
Key:
min: | |
| MSI Creator 17 A10SGS i7-10875H, GeForce RTX 2080 Super Max-Q | MSI GS75 Stealth 9SG i7-9750H, GeForce RTX 2080 Max-Q | Razer Blade Pro 17 RTX 2080 Max-Q i7-9750H, GeForce RTX 2080 Max-Q | Asus ROG Zephyrus S GX701GXR i7-9750H, GeForce RTX 2080 Max-Q | Alienware m17 R2 P41E i9-9980HK, GeForce RTX 2080 Max-Q | Sınıf ortalaması Multimedia | |
|---|---|---|---|---|---|---|
| Power Consumption | 16% | 9% | -19% | -38% | 57% | |
| Idle Minimum * (Watt) | 15 | 13 13% | 16.2 -8% | 32 -113% | 24.7 -65% | 5.66 ? 62% |
| Idle Average * (Watt) | 20 | 17 15% | 20.4 -2% | 34 -70% | 35.9 -80% | 10.2 ? 49% |
| Idle Maximum * (Watt) | 42 | 25 40% | 26.1 38% | 36 14% | 69.6 -66% | 12.5 ? 70% |
| Load Average * (Watt) | 150 | 96 36% | 96.5 36% | 95 37% | 141.8 5% | 65.2 ? 57% |
| Witcher 3 ultra * (Watt) | 170 | 156 8% | 182.9 -8% | 155 9% | 185.8 -9% | |
| Load Maximum * (Watt) | 210 | 239 -14% | 214.3 -2% | 187 11% | 235.4 -12% | 113.5 ? 46% |
* ... daha küçük daha iyidir
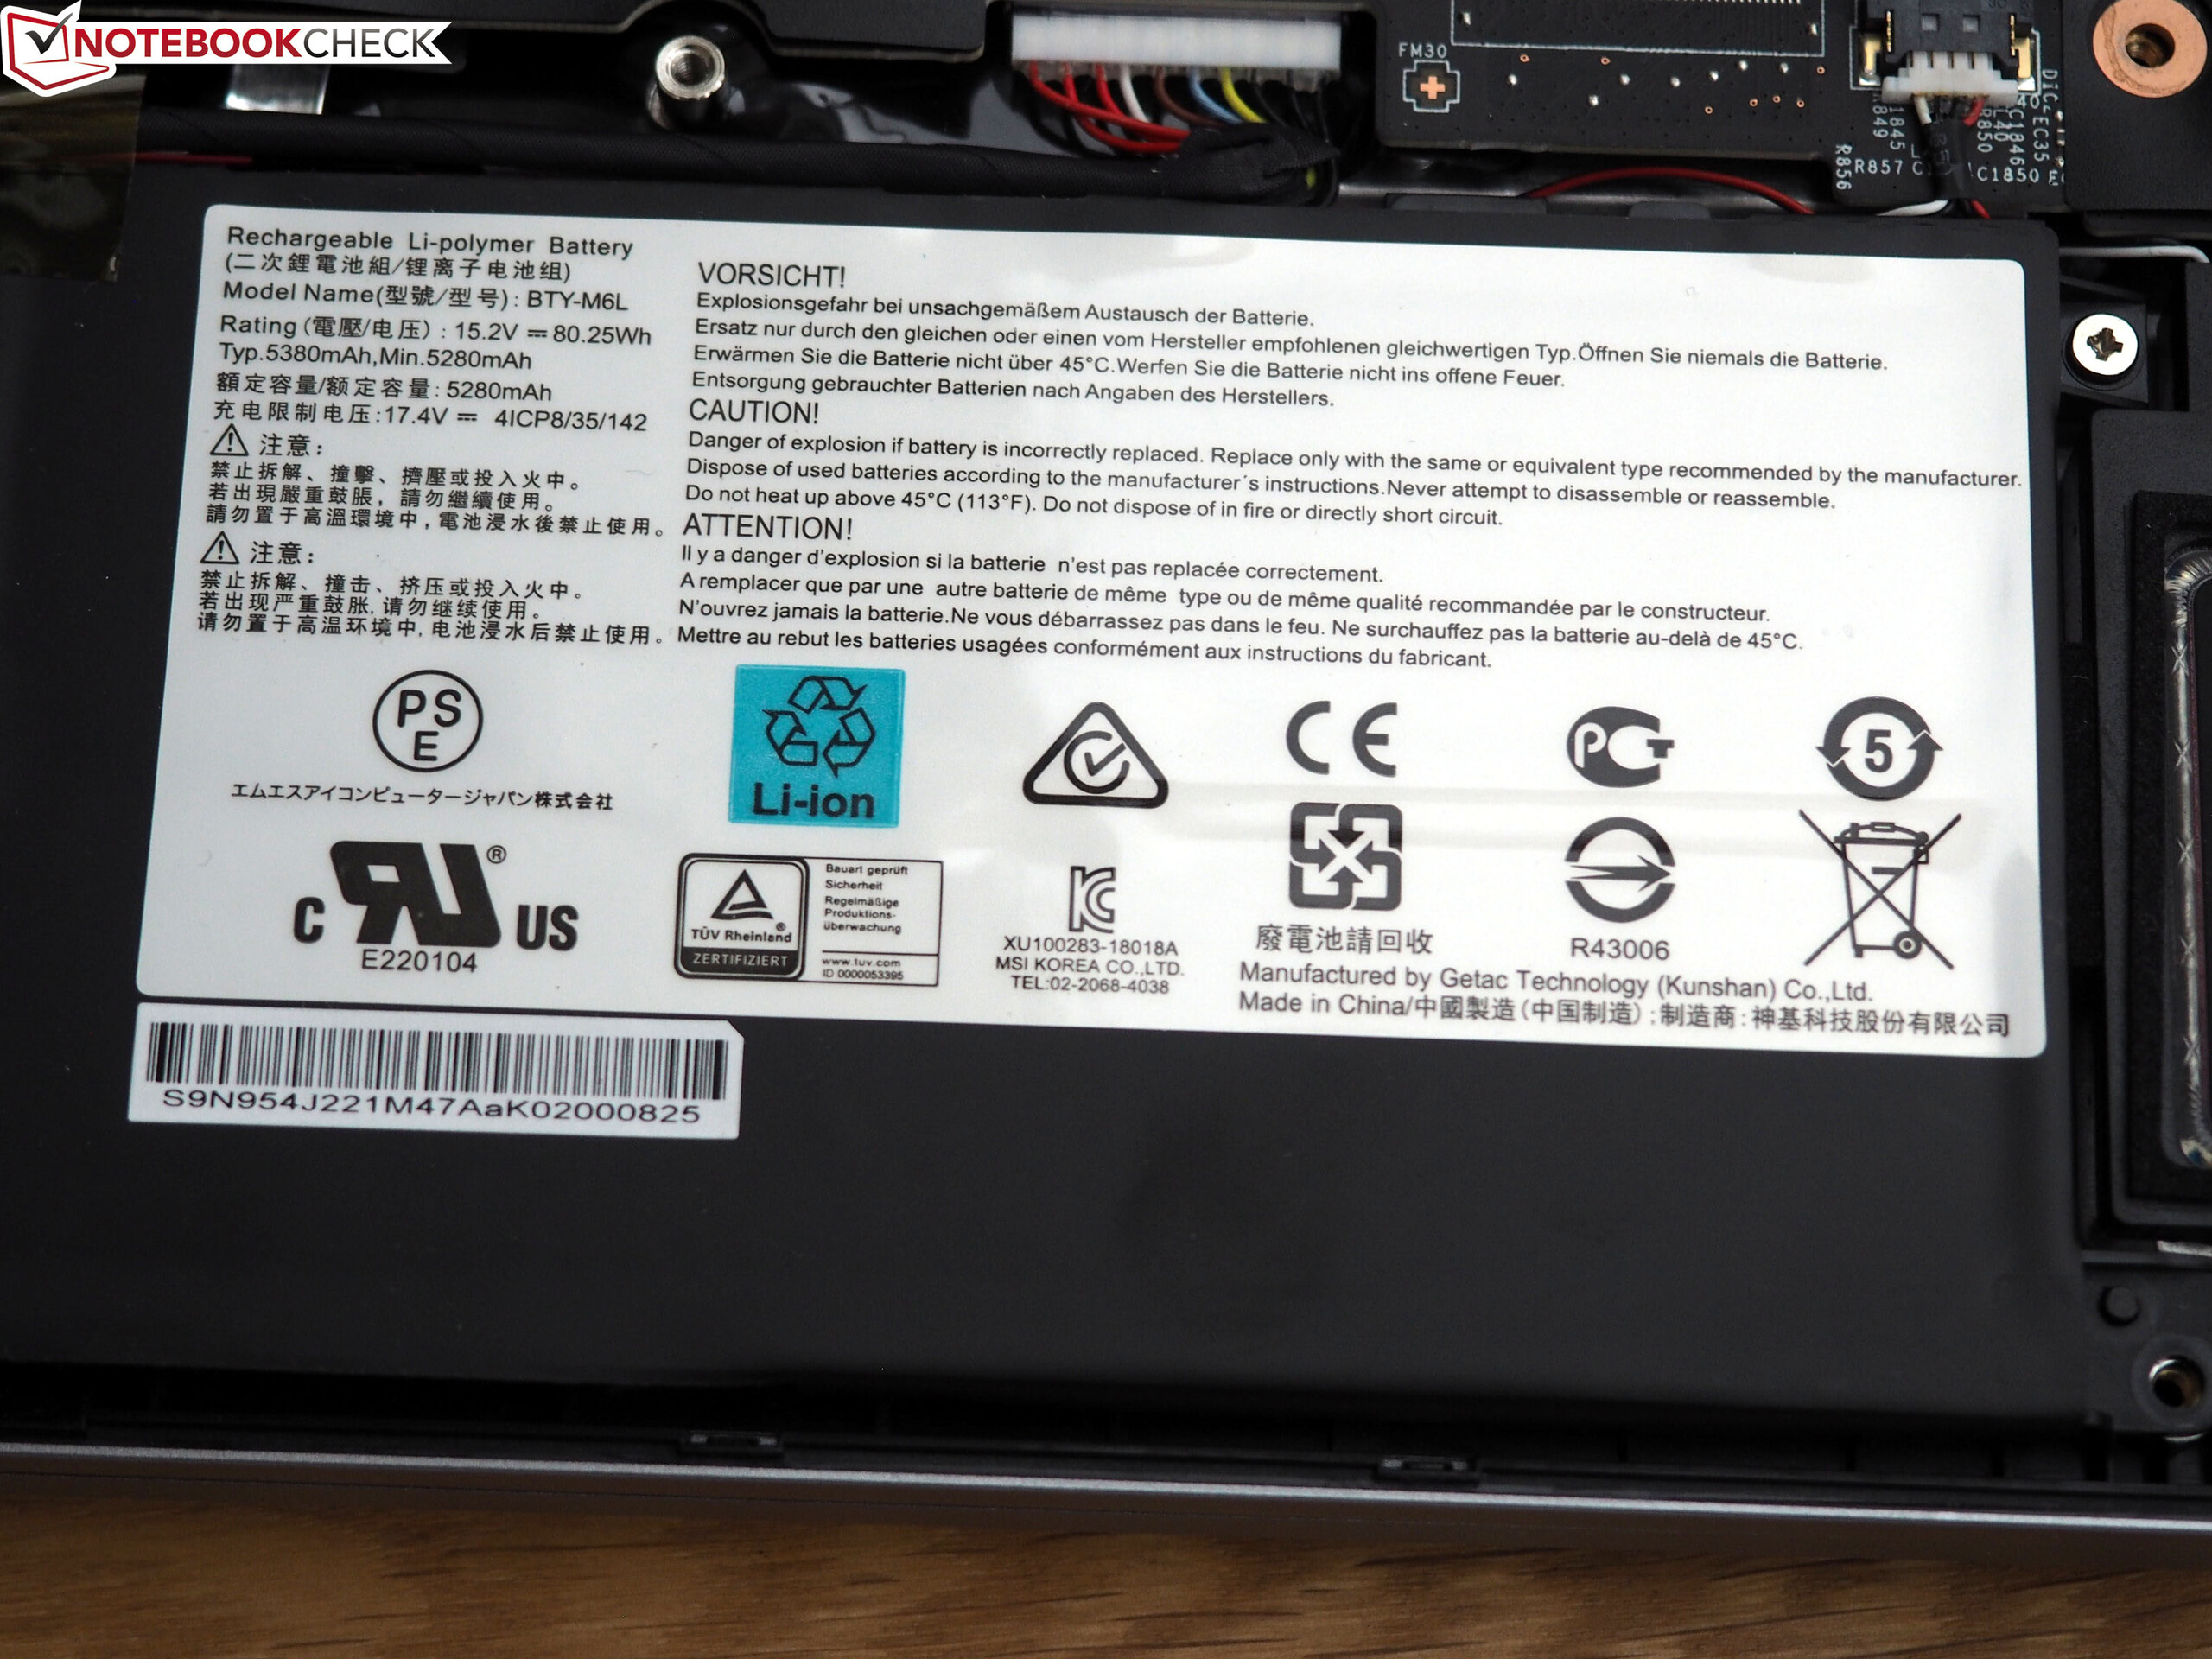
Battery Life
The 82-Wh battery guarantees a solid but not outstanding battery life. Depending on the load and display brightness, the Creator 17 lasts between one and seven hours. When surfing the Internet via WLAN (at medium brightness), you can expect about 4.5 hours.
| MSI Creator 17 A10SGS i7-10875H, GeForce RTX 2080 Super Max-Q, 82 Wh | MSI GS75 Stealth 9SG i7-9750H, GeForce RTX 2080 Max-Q, 80.25 Wh | Razer Blade Pro 17 RTX 2080 Max-Q i7-9750H, GeForce RTX 2080 Max-Q, 70 Wh | Asus ROG Zephyrus S GX701GXR i7-9750H, GeForce RTX 2080 Max-Q, 76 Wh | Alienware m17 R2 P41E i9-9980HK, GeForce RTX 2080 Max-Q, 76 Wh | Sınıf ortalaması Multimedia | |
|---|---|---|---|---|---|---|
| Pil Çalışma Süresi | 17% | 1% | -22% | -16% | 158% | |
| Reader / Idle (h) | 7.2 | 7.7 7% | 4.9 -32% | 4.1 -43% | 7.1 -1% | 24.9 ? 246% |
| WiFi v1.3 (h) | 4.4 | 6 36% | 4.7 7% | 3 -32% | 4.8 9% | 12.2 ? 177% |
| Load (h) | 1.1 | 1.2 9% | 1.4 27% | 1.2 9% | 0.5 -55% | 1.664 ? 51% |
| H.264 (h) | 6.8 | 2.8 | 17.1 ? |
Artılar
Eksiler
Verdict
The most expensive configuration of the Creator 17 delivered a mixed performance in our test. While the Mini LED display, offered as a first by MSI, is able to convince in all aspects, stealing the show from other competitors (almost 1000 cd/m² brightness!), the case offers less than could be expected (stability, quality impression, etc.).
Considering the performance of the RTX 2080 Super Max-Q, which stands in no relation to the price premium, we would recommend the more affordable version with the RTX 2070 (Super) Max-Q to interested buyers. The use of the Core i7-10875H Turbo could also be better.
The fact that the Creator 17 will land in our Top 10 for Photo and Video Editing table despite those weaknesses, is not least due to its rich connection equipment including Thunderbolt 3. For the successor, we would wish for a more robust and less noisy case with a cooling system that does not operate as close to the limits.
MSI Creator 17 A10SGS
- 07/05/2020 v7 (old)
Florian Glaser
Price comparison

