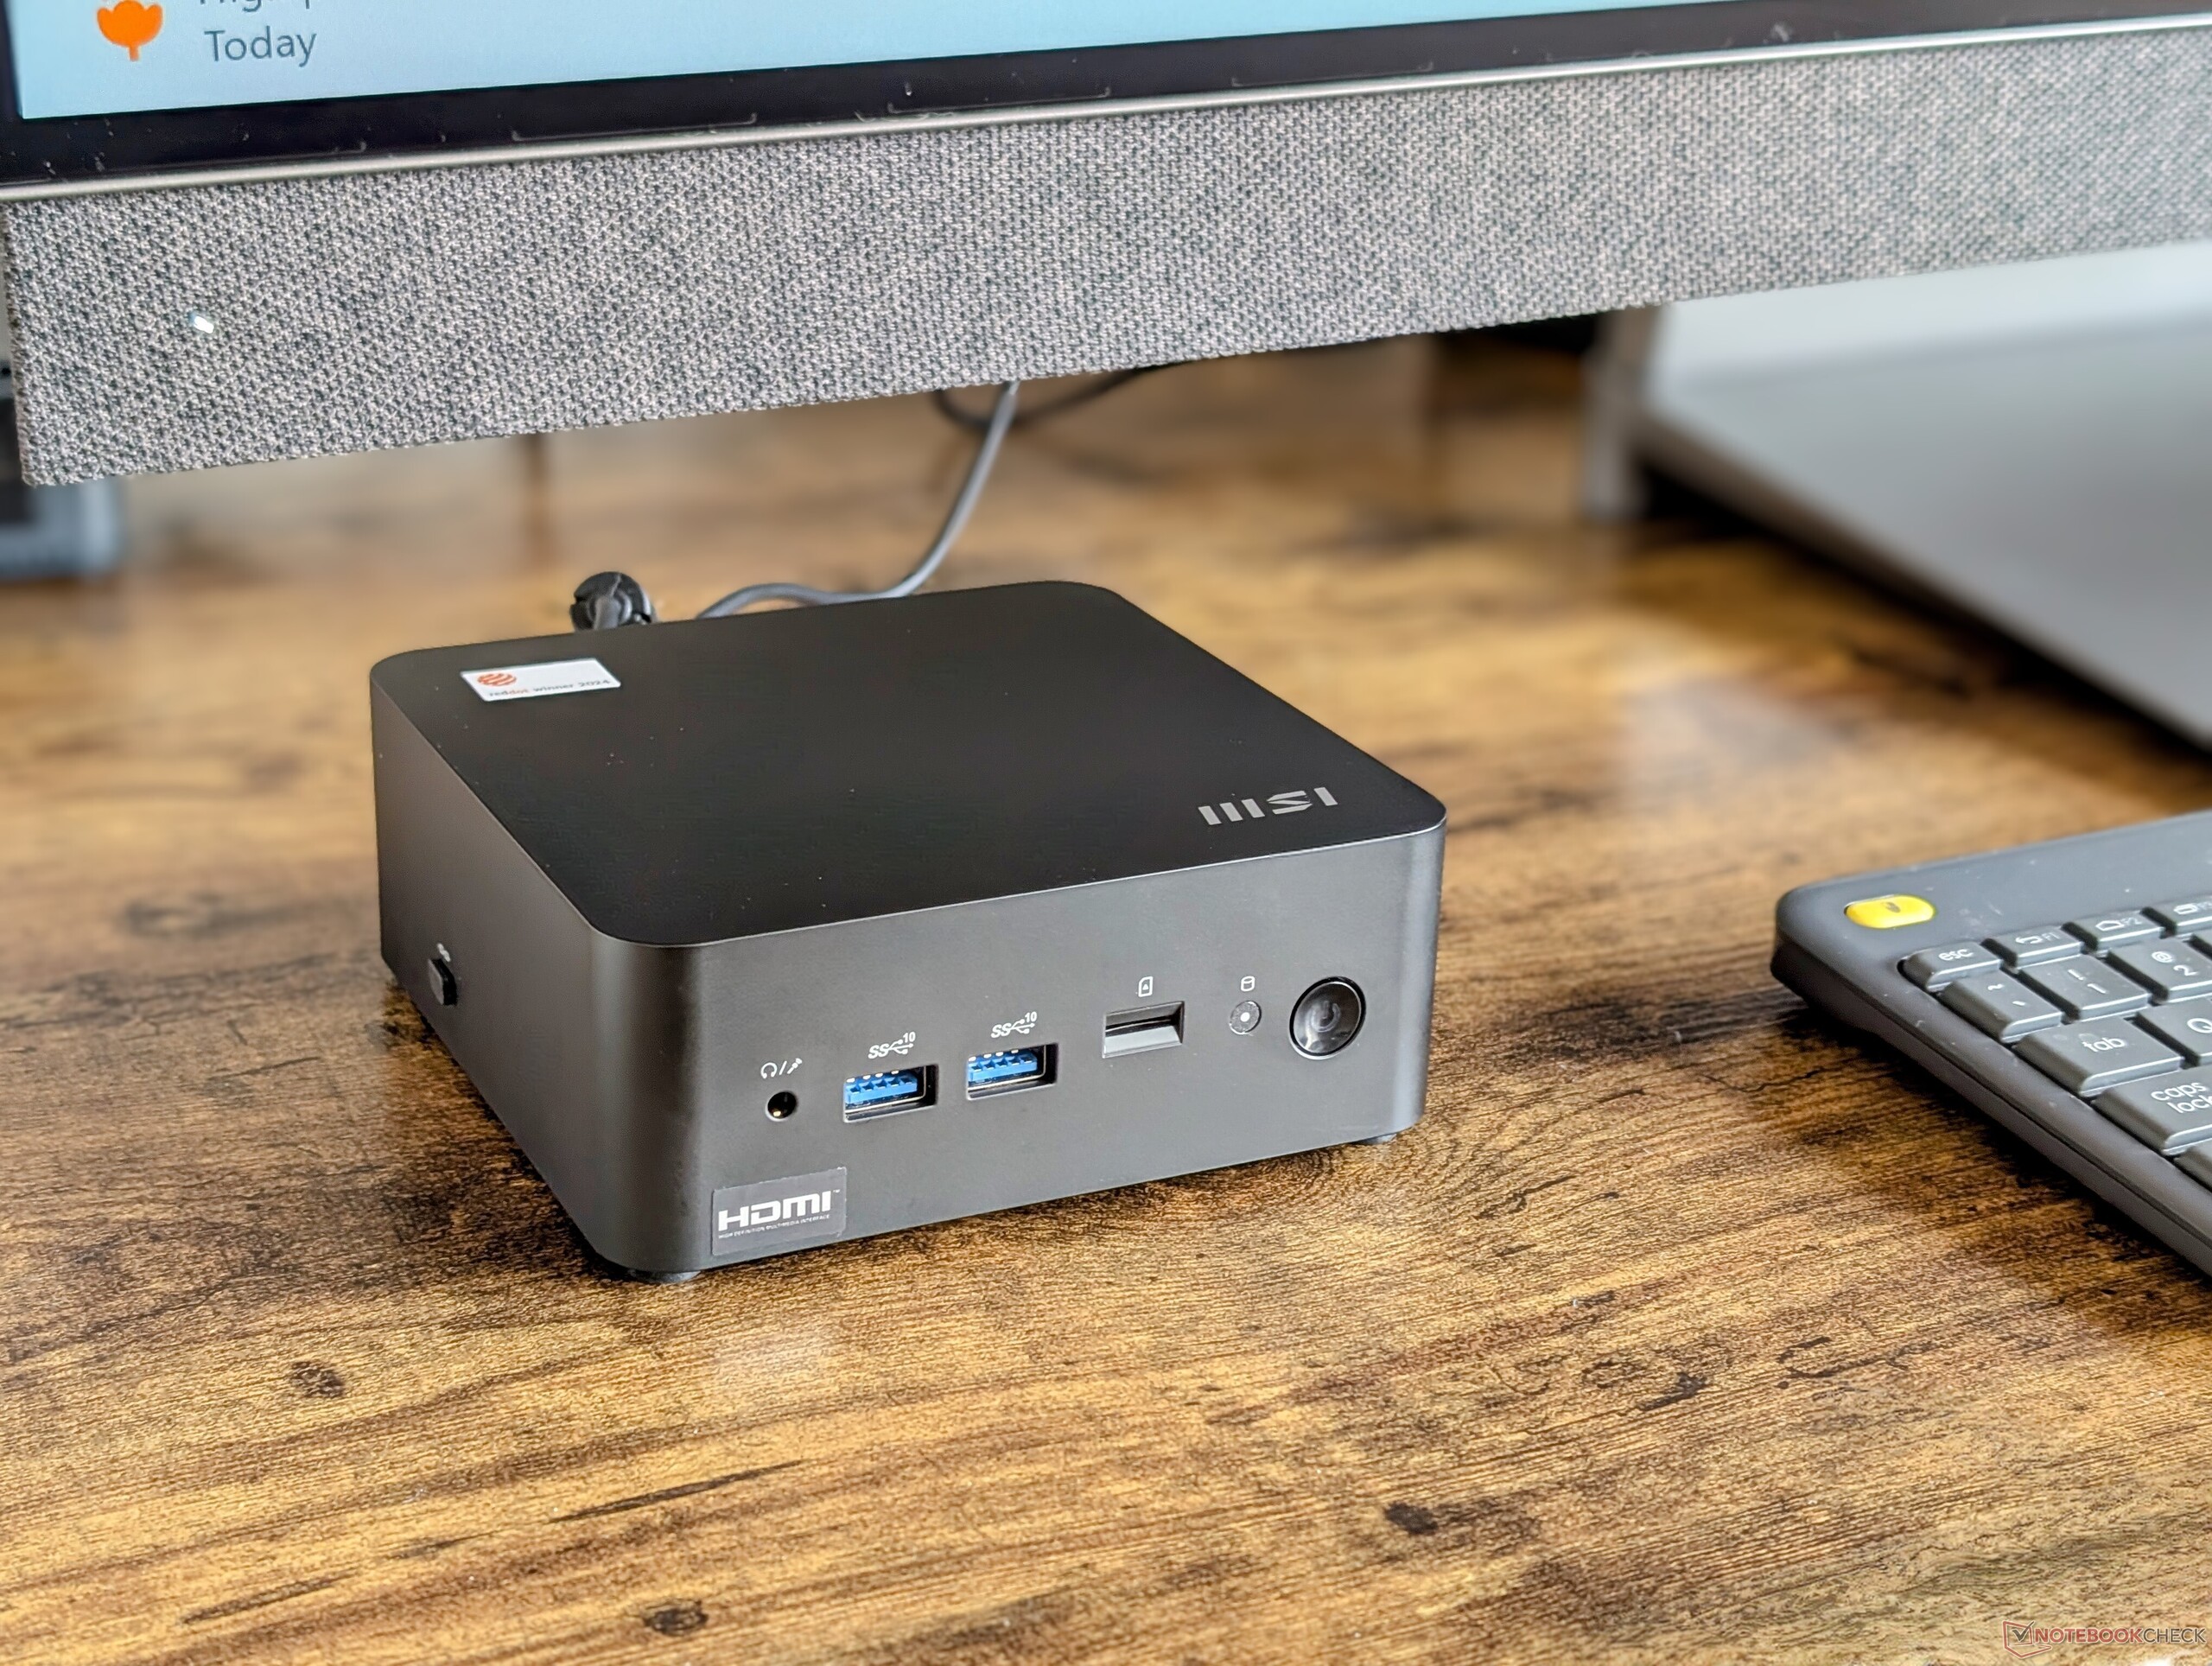
MSI Cubi NUC M1 mini PC incelemesi: Sağlam ama rakiplerinden daha pahalı
Dolar başına performans daha iyi olabilir.
Cubi NUC M1 kötü bir şey yapmıyor, ancak herhangi bir temel kategoride de mükemmel değil. Core 7 konfigürasyonu için 900 USD'nin üzerindeki yüksek fiyatı, daha ucuz ve daha hızlı alternatifler karşısında göze batıyor.Allen Ngo, 👁 Allen Ngo (Çeviren DeepL / Ninh Duy) Yayınlandı 🇺🇸 🇫🇷 ...
Karar - Güvenilir Ama Pahalı
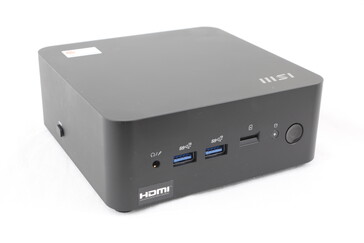
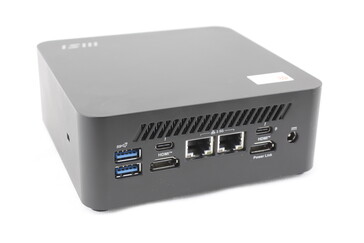
Cubi NUC M1, ofis veya konferans odası uygulamaları için iyi inşa edilmiş bir mini PC'dir. Çift Thunderbolt 4 bağlantı noktası ve bir MicroSD okuyucu içerirken, diğer mini bilgisayarların çoğunda yalnızca bir Thunderbolt bağlantı noktası vardır ve SD okuyucu yoktur. Eğer iş yükünüz bu özelliklerden günlük olarak yararlanabiliyorsa, MSI mini PC değerli bir seçenek olabilir.
Cubi NUC M1, çok da temel olmayan bir MSRP'ye sahip temel bir ofis mini PC'sidir. Entegre MicroSD okuyucuyu kaybetmek istemiyorsanız daha ucuz ve daha hızlı alternatifler mevcuttur.
Artılar
Eksiler
Cubi NUC M1 ile ilgili temel sorun, sadece Core i5 120U yapılandırması için 800 USD veya incelediğimiz Core i7 yapılandırması için neredeyse 1000 USD gibi yüksek bir fiyat olmasıdır. Alternatifler Beelink veya GMK daha hızlı CPU seçenekleri ve benzer kasa boyutları sunarken birkaç yüz dolar daha ucuzdur. Bu nedenle değer, rekabete göre beklenenden daha düşük.
Fiyat ve Bulunabilirlik
Cubi NUC M1 şimdi Amazon 'da Core i5 yapılandırması için 800 $ veya Core i7 seçeneği için 950 $ karşılığında gönderiliyor.
Karşılaştırılan olası alternatifler
Resim | Modeli / incelemeler | Geizhals | Ağırlık | Yükseklik | Ekran |
|---|---|---|---|---|---|
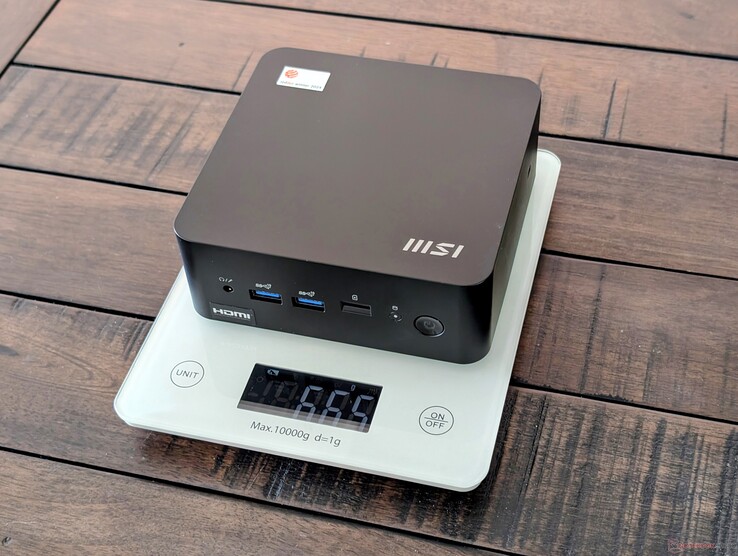
| MSI Cubi NUC 1M Intel Core 7 150U ⎘ Intel Iris Xe Graphics G7 96EUs ⎘ 16 GB Bellek, 1024 GB SSD | Listenpreis 950 USD Geizhals Suche | 660 g | 50.1 mm | x | |
| GMK NucBox K9 Intel Core Ultra 5 125H ⎘ Intel Arc 7-Core iGPU ⎘ 32 GB Bellek, 1024 GB SSD | Listenpreis 560 USD Geizhals Suche | 528 g | 47 mm | x | |
| Asus NUC 14 Pro Intel Core Ultra 5 125H ⎘ Intel Arc 7-Core iGPU ⎘ , 2048 GB SSD | 525 g | 37 mm | x | ||
| Beelink SEi11 Pro Intel Core i5-11320H ⎘ Intel Iris Xe Graphics G7 96EUs ⎘ 16 GB Bellek, 500 GB SSD | Listenpreis 430 USD | 440 g | 40 mm | x | |
| Beelink SER8 AMD Ryzen 7 8845HS ⎘ AMD Radeon 780M ⎘ 32 GB Bellek, 1024 GB SSD | Listenpreis 650 USD | 776 g | 44.7 mm | x | |
| BOSGAME M1 AMD Ryzen 7 7840HS ⎘ AMD Radeon 780M ⎘ 32 GB Bellek, 1024 GB SSD | Listenpreis 690 USD | 766 g | 51 mm | x |
Top 10
» Top 10 Multimedia Notebook listesi
» Top 10 oyun notebooku
» Top 10 bütçeye uygun Ofis/İş Notebook Listesi
» Top 10 Premium Ofis/İş notebookları
» Top 10 Çalışma istasyonu laptopları
» Top 10 Subnotebook listesi
» Top 10 Ultrabooklar
» En iyi 10 dönüştürülebilir modeli
» Seçimi en iyi 10 tablet
» Notebookcheck Top 10 Windows Tabletleri
» Top 10 Subnotebook listesi
» NotebookCheck tarafından incelenen en iyi Notebook ekranları
» Notebookcheck'in 500 Euro altındaki en iyi 10 Notebook listesi
» NotebookCheck tarafından seçilen 300 Euro altındaki en iyi 10 Notebook
» Notebookcheck'in 500 Euro altındaki en iyi 10 Notebook listesi
» Notebookcheck'in Top 10 akıllı telefon listesi
» Notebookcheck'in Top 10 hafif oyun notebookları
MSI Cubi serisi, Intel'in kendi NUC serisi için üretimi sonlandırmaya karar vermesiyle geride kalan boşluğu dolduruyor. Yüksek performanslı alternatifler yerine düşük profilli bilgisayarların tercih edildiği temel iş kullanıcılarını ve ofisleri hedefliyor.
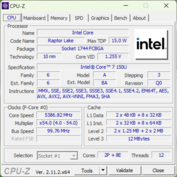
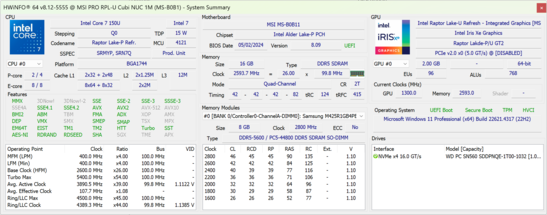
Test ünitemiz Raptor Lake-U Refresh Core 7 150U CPU ile en üst düzey konfigürasyona sahipken, Core 5 120U veya Core 3 100U ile daha düşük seçenekler mevcuttur.
Cubi NUC M1'in alternatifleri arasında diğer düşük profilli U serisi destekli mini PC'ler yer almaktadır GMK NucBox M5 veya Beelink Mini S12 Pro.
Daha fazla MSI incelemesi:
Teknik Özellikler
Dava
Şasi çoğunlukla plastiktir ve yanların iç kaplamasının etrafında metal takviye vardır. Bu, üniteye biraz ağırlık katsa da, özellikle Beelink veya GMK'nın birçok alternatifinde maliyetten tasarruf etmek için çok daha az metal malzeme kullanıldığında daha yüksek bir kalite hissi veriyor.
Pürüzsüz mat siyah yüzey ne yazık ki büyük bir parmak izi mıknatısı. İş odaklı MSI Prestige serisine benzer beyaz veya gümüş renk seçeneği bu sorunu hafifletebilirdi.
Bağlanabilirlik
Sistem, diğer mini bilgisayarların çoğundan farklı olarak, bazı kamera kullanıcılarına ve içerik oluşturuculara hitap edecek oldukça hızlı bir entegre MicroSD kart okuyucu içeriyor. Ayrıca çoğu Beelink mini PC'den farklı olarak iki USB-C bağlantı noktası olmasını da takdir ediyoruz.
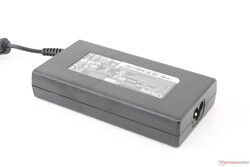
Kutu içeriğindeki fıçı tipi AC adaptörünü kaybetmeniz durumunda sistemin üçüncü parti USB-C AC adaptörleriyle çalıştırılabileceğini belirtmekte fayda var.
SD Kart Okuyucu
| SD Card Reader | |
| average JPG Copy Test (av. of 3 runs) | |
| MSI Cubi NUC 1M (Angelbird AV Pro V60) | |
| maximum AS SSD Seq Read Test (1GB) | |
| MSI Cubi NUC 1M (Angelbird AV Pro V60) | |
İletişim
Wi-Fi 6E ve Bluetooth 5.3 desteği standart olarak geliyor. Wi-Fi 7'yi özellikle bu fiyat noktasında görmek harika olurdu.
| Networking | |
| iperf3 transmit AXE11000 | |
| BOSGAME M1 | |
| Asus NUC 14 Pro | |
| GMK NucBox K9 | |
| Beelink SER8 | |
| MSI Cubi NUC 1M | |
| iperf3 receive AXE11000 | |
| BOSGAME M1 | |
| Asus NUC 14 Pro | |
| Beelink SER8 | |
| GMK NucBox K9 | |
| MSI Cubi NUC 1M | |
| iperf3 transmit AXE11000 6GHz | |
| MSI Cubi NUC 1M | |
| Asus NUC 14 Pro | |
| BOSGAME M1 | |
| Beelink SEi11 Pro | |
| iperf3 receive AXE11000 6GHz | |
| Asus NUC 14 Pro | |
| MSI Cubi NUC 1M | |
| BOSGAME M1 | |
| Beelink SEi11 Pro | |
Bakım
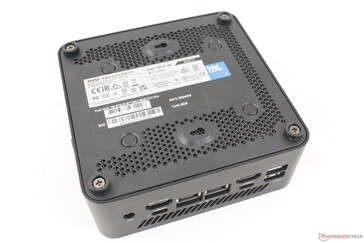
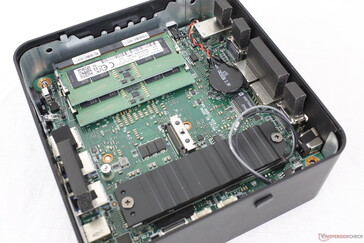
Alt metal plaka, yükseltilebilir bileşenleri ortaya çıkarmak için sadece bir Phillips tornavida ile kolayca çıkarılabilir. Vidaların birçok Intel NUC modelinden farklı olarak kelebek vida olmadığına dikkat edin.
Sürdürülebilirlik
MSI, üretim sırasında yüzde 42,9 oranında tüketici sonrası geri dönüştürülmüş plastik ve ambalaj için sürdürülebilir kaynaklı odun hamuru kullanıyor. Bununla birlikte, AC adaptörü ve aksesuarlar için hala plastik ambalaj kullanılıyor.
Aksesuarlar ve Garanti
Harici bir 2,5 inç SATA III sürücüyü ünitenin sağ tarafındaki özel bir bağlantı noktasına bağlamak isteyen kullanıcılar için çıkarılabilir bir SATA III kablosu dahildir. Çok şık bir çözüm değil, ancak en azından diğer mini PC'lerin çoğu artık 2,5 inç SATA desteğini tamamen atlarken bu seçenek var.
Standart bir yıllık sınırlı üretici garantisi, üç yıla kadar uzatma seçeneğiyle birlikte geçerlidir.
Performans
Test Koşulları
Aşağıdaki kıyaslamaları çalıştırmadan önce Windows ve MSI Center'ı Performans moduna ayarladık.
İşlemci
Bu arada Core 7 150U nispeten yenidir, eski Raptor Lake-U platformunu temel alır ve bu nedenle giden Raptor Lake-U'ya çok benzer bir performans gösterir Core i7-1365U. Meteor Lake platformunun entegre AI özelliklerinden ve geliştirilmiş entegre Arc grafiklerinden yoksundur.
Aşağıya inmek Çekirdek 5 120U i̇ki CPU aynı sayıda çekirdeği ve iş parçacığını paylaştığı için yapılandırmanın işlemci performansını önemli ölçüde etkilemesi beklenmez. paradan tasarruf etmeye çalışıyorsanız, Core 5 SKU bu nedenle dikkate alınmaya değer olabilir.
Cinebench R15 Multi Loop
Cinebench R23: Multi Core | Single Core
Cinebench R20: CPU (Multi Core) | CPU (Single Core)
Cinebench R15: CPU Multi 64Bit | CPU Single 64Bit
Blender: v2.79 BMW27 CPU
7-Zip 18.03: 7z b 4 | 7z b 4 -mmt1
Geekbench 6.5: Multi-Core | Single-Core
Geekbench 5.5: Multi-Core | Single-Core
HWBOT x265 Benchmark v2.2: 4k Preset
LibreOffice : 20 Documents To PDF
R Benchmark 2.5: Overall mean
| CPU Performance rating | |
| Lenovo ThinkStation P3 Tiny-30H0006AGE | |
| Beelink SER8 | |
| GMK NucBox K6 | |
| Geekom AX8 Pro | |
| HP Elite Mini 800 G9-5M9X6EA | |
| Geekom XT13 Pro | |
| GMK NucBox K9 -1! | |
| Khadas Mind 2 | |
| Asus NUC 14 Pro | |
| Beelink SER6 Pro Ryzen 7 7735HS -2! | |
| Ortalama Intel Core 7 150U | |
| Lenovo IdeaPad Slim 3i 15IRU9 | |
| Beelink SER6 Pro -2! | |
| MSI Cubi NUC 1M | |
| GMK NucBox M6 | |
| GMK NucBox M5 | |
| Beelink SEi11 Pro -2! | |
| Cinebench R23 / Multi Core | |
| Lenovo ThinkStation P3 Tiny-30H0006AGE | |
| Beelink SER8 | |
| GMK NucBox K6 | |
| Geekom AX8 Pro | |
| HP Elite Mini 800 G9-5M9X6EA | |
| Asus NUC 14 Pro | |
| Khadas Mind 2 | |
| GMK NucBox K9 | |
| Geekom XT13 Pro | |
| Beelink SER6 Pro Ryzen 7 7735HS | |
| Beelink SER6 Pro | |
| GMK NucBox M6 | |
| Ortalama Intel Core 7 150U (7226 - 9895, n=4) | |
| Lenovo IdeaPad Slim 3i 15IRU9 | |
| MSI Cubi NUC 1M | |
| GMK NucBox M5 | |
| Beelink SEi11 Pro | |
| Cinebench R23 / Single Core | |
| Lenovo ThinkStation P3 Tiny-30H0006AGE | |
| HP Elite Mini 800 G9-5M9X6EA | |
| MSI Cubi NUC 1M | |
| Ortalama Intel Core 7 150U (1698 - 2032, n=4) | |
| Lenovo IdeaPad Slim 3i 15IRU9 | |
| Geekom AX8 Pro | |
| Beelink SER8 | |
| GMK NucBox K6 | |
| GMK NucBox K9 | |
| Asus NUC 14 Pro | |
| Geekom XT13 Pro | |
| Khadas Mind 2 | |
| Beelink SER6 Pro Ryzen 7 7735HS | |
| Beelink SER6 Pro | |
| GMK NucBox M6 | |
| Beelink SEi11 Pro | |
| GMK NucBox M5 | |
| Cinebench R20 / CPU (Multi Core) | |
| Lenovo ThinkStation P3 Tiny-30H0006AGE | |
| Beelink SER8 | |
| GMK NucBox K6 | |
| Geekom AX8 Pro | |
| HP Elite Mini 800 G9-5M9X6EA | |
| Asus NUC 14 Pro | |
| Khadas Mind 2 | |
| GMK NucBox K9 | |
| Geekom XT13 Pro | |
| Beelink SER6 Pro Ryzen 7 7735HS | |
| Beelink SER6 Pro | |
| GMK NucBox M6 | |
| Ortalama Intel Core 7 150U (2821 - 3790, n=4) | |
| Lenovo IdeaPad Slim 3i 15IRU9 | |
| MSI Cubi NUC 1M | |
| GMK NucBox M5 | |
| Beelink SEi11 Pro | |
| Cinebench R20 / CPU (Single Core) | |
| Lenovo ThinkStation P3 Tiny-30H0006AGE | |
| HP Elite Mini 800 G9-5M9X6EA | |
| MSI Cubi NUC 1M | |
| Lenovo IdeaPad Slim 3i 15IRU9 | |
| Ortalama Intel Core 7 150U (652 - 782, n=4) | |
| Geekom AX8 Pro | |
| Beelink SER8 | |
| GMK NucBox K6 | |
| GMK NucBox K9 | |
| Geekom XT13 Pro | |
| Asus NUC 14 Pro | |
| Khadas Mind 2 | |
| Beelink SER6 Pro Ryzen 7 7735HS | |
| Beelink SER6 Pro | |
| GMK NucBox M6 | |
| Beelink SEi11 Pro | |
| GMK NucBox M5 | |
| Cinebench R15 / CPU Multi 64Bit | |
| Lenovo ThinkStation P3 Tiny-30H0006AGE | |
| Beelink SER8 | |
| GMK NucBox K6 | |
| Geekom AX8 Pro | |
| Geekom XT13 Pro | |
| HP Elite Mini 800 G9-5M9X6EA | |
| Khadas Mind 2 | |
| Asus NUC 14 Pro | |
| GMK NucBox K9 | |
| Beelink SER6 Pro Ryzen 7 7735HS | |
| Beelink SER6 Pro | |
| GMK NucBox M6 | |
| Lenovo IdeaPad Slim 3i 15IRU9 | |
| Ortalama Intel Core 7 150U (1040 - 1609, n=4) | |
| GMK NucBox M5 | |
| MSI Cubi NUC 1M | |
| Beelink SEi11 Pro | |
| Cinebench R15 / CPU Single 64Bit | |
| Lenovo ThinkStation P3 Tiny-30H0006AGE | |
| Geekom AX8 Pro | |
| Beelink SER8 | |
| GMK NucBox K6 | |
| HP Elite Mini 800 G9-5M9X6EA | |
| Ortalama Intel Core 7 150U (243 - 290, n=4) | |
| MSI Cubi NUC 1M | |
| Lenovo IdeaPad Slim 3i 15IRU9 | |
| GMK NucBox K9 | |
| Asus NUC 14 Pro | |
| Beelink SER6 Pro Ryzen 7 7735HS | |
| Geekom XT13 Pro | |
| GMK NucBox M6 | |
| Beelink SER6 Pro | |
| Khadas Mind 2 | |
| Beelink SEi11 Pro | |
| GMK NucBox M5 | |
| Blender / v2.79 BMW27 CPU | |
| Beelink SEi11 Pro | |
| MSI Cubi NUC 1M | |
| Lenovo IdeaPad Slim 3i 15IRU9 | |
| GMK NucBox M5 | |
| Ortalama Intel Core 7 150U (344 - 451, n=4) | |
| GMK NucBox M6 | |
| Beelink SER6 Pro | |
| Beelink SER6 Pro Ryzen 7 7735HS | |
| Geekom XT13 Pro | |
| GMK NucBox K9 | |
| Khadas Mind 2 | |
| Asus NUC 14 Pro | |
| HP Elite Mini 800 G9-5M9X6EA | |
| Geekom AX8 Pro | |
| GMK NucBox K6 | |
| Beelink SER8 | |
| Lenovo ThinkStation P3 Tiny-30H0006AGE | |
| 7-Zip 18.03 / 7z b 4 | |
| Lenovo ThinkStation P3 Tiny-30H0006AGE | |
| Beelink SER8 | |
| GMK NucBox K6 | |
| Geekom AX8 Pro | |
| Beelink SER6 Pro Ryzen 7 7735HS | |
| Geekom XT13 Pro | |
| Beelink SER6 Pro | |
| Khadas Mind 2 | |
| HP Elite Mini 800 G9-5M9X6EA | |
| GMK NucBox M6 | |
| Ortalama Intel Core 7 150U (31447 - 39286, n=4) | |
| GMK NucBox M5 | |
| Lenovo IdeaPad Slim 3i 15IRU9 | |
| MSI Cubi NUC 1M | |
| Beelink SEi11 Pro | |
| Asus NUC 14 Pro | |
| 7-Zip 18.03 / 7z b 4 -mmt1 | |
| Lenovo ThinkStation P3 Tiny-30H0006AGE | |
| Beelink SER8 | |
| Geekom AX8 Pro | |
| GMK NucBox K6 | |
| HP Elite Mini 800 G9-5M9X6EA | |
| MSI Cubi NUC 1M | |
| Lenovo IdeaPad Slim 3i 15IRU9 | |
| Geekom XT13 Pro | |
| Ortalama Intel Core 7 150U (5407 - 6261, n=4) | |
| Beelink SER6 Pro Ryzen 7 7735HS | |
| Beelink SER6 Pro | |
| GMK NucBox M6 | |
| Asus NUC 14 Pro | |
| Beelink SEi11 Pro | |
| GMK NucBox K9 | |
| Khadas Mind 2 | |
| GMK NucBox M5 | |
| Geekbench 5.5 / Multi-Core | |
| Lenovo ThinkStation P3 Tiny-30H0006AGE | |
| Beelink SER8 | |
| Geekom AX8 Pro | |
| GMK NucBox K6 | |
| Geekom XT13 Pro | |
| Khadas Mind 2 | |
| Asus NUC 14 Pro | |
| HP Elite Mini 800 G9-5M9X6EA | |
| GMK NucBox K9 | |
| Beelink SER6 Pro Ryzen 7 7735HS | |
| Beelink SER6 Pro | |
| Lenovo IdeaPad Slim 3i 15IRU9 | |
| GMK NucBox M6 | |
| Ortalama Intel Core 7 150U (7178 - 8354, n=4) | |
| MSI Cubi NUC 1M | |
| GMK NucBox M5 | |
| Beelink SEi11 Pro | |
| Geekbench 5.5 / Single-Core | |
| Lenovo ThinkStation P3 Tiny-30H0006AGE | |
| Beelink SER8 | |
| Geekom AX8 Pro | |
| GMK NucBox K6 | |
| MSI Cubi NUC 1M | |
| HP Elite Mini 800 G9-5M9X6EA | |
| Lenovo IdeaPad Slim 3i 15IRU9 | |
| Ortalama Intel Core 7 150U (1631 - 1969, n=4) | |
| Geekom XT13 Pro | |
| Asus NUC 14 Pro | |
| GMK NucBox K9 | |
| Beelink SER6 Pro Ryzen 7 7735HS | |
| Khadas Mind 2 | |
| Beelink SER6 Pro | |
| Beelink SEi11 Pro | |
| GMK NucBox M6 | |
| GMK NucBox M5 | |
| HWBOT x265 Benchmark v2.2 / 4k Preset | |
| Lenovo ThinkStation P3 Tiny-30H0006AGE | |
| Beelink SER8 | |
| Geekom AX8 Pro | |
| GMK NucBox K6 | |
| HP Elite Mini 800 G9-5M9X6EA | |
| Asus NUC 14 Pro | |
| Khadas Mind 2 | |
| Beelink SER6 Pro Ryzen 7 7735HS | |
| Beelink SER6 Pro | |
| Geekom XT13 Pro | |
| GMK NucBox M6 | |
| GMK NucBox K9 | |
| Ortalama Intel Core 7 150U (8.57 - 11.1, n=4) | |
| Lenovo IdeaPad Slim 3i 15IRU9 | |
| MSI Cubi NUC 1M | |
| GMK NucBox M5 | |
| Beelink SEi11 Pro | |
| LibreOffice / 20 Documents To PDF | |
| Khadas Mind 2 | |
| GMK NucBox M5 | |
| Asus NUC 14 Pro | |
| GMK NucBox M6 | |
| Geekom AX8 Pro | |
| Beelink SEi11 Pro | |
| Beelink SER6 Pro | |
| Geekom XT13 Pro | |
| Beelink SER8 | |
| HP Elite Mini 800 G9-5M9X6EA | |
| Beelink SER6 Pro Ryzen 7 7735HS | |
| GMK NucBox K6 | |
| GMK NucBox K9 | |
| Ortalama Intel Core 7 150U (29 - 69.2, n=4) | |
| Lenovo IdeaPad Slim 3i 15IRU9 | |
| Lenovo ThinkStation P3 Tiny-30H0006AGE | |
| MSI Cubi NUC 1M | |
| R Benchmark 2.5 / Overall mean | |
| GMK NucBox M5 | |
| Beelink SEi11 Pro | |
| Khadas Mind 2 | |
| Beelink SER6 Pro Ryzen 7 7735HS | |
| GMK NucBox M6 | |
| Beelink SER6 Pro | |
| Asus NUC 14 Pro | |
| GMK NucBox K9 | |
| Geekom XT13 Pro | |
| Lenovo IdeaPad Slim 3i 15IRU9 | |
| Geekom AX8 Pro | |
| Ortalama Intel Core 7 150U (0.4386 - 0.502, n=4) | |
| MSI Cubi NUC 1M | |
| HP Elite Mini 800 G9-5M9X6EA | |
| GMK NucBox K6 | |
| Beelink SER8 | |
| Lenovo ThinkStation P3 Tiny-30H0006AGE | |
Cinebench R23: Multi Core | Single Core
Cinebench R20: CPU (Multi Core) | CPU (Single Core)
Cinebench R15: CPU Multi 64Bit | CPU Single 64Bit
Blender: v2.79 BMW27 CPU
7-Zip 18.03: 7z b 4 | 7z b 4 -mmt1
Geekbench 6.5: Multi-Core | Single-Core
Geekbench 5.5: Multi-Core | Single-Core
HWBOT x265 Benchmark v2.2: 4k Preset
LibreOffice : 20 Documents To PDF
R Benchmark 2.5: Overall mean
* ... daha küçük daha iyidir
AIDA64: FP32 Ray-Trace | FPU Julia | CPU SHA3 | CPU Queen | FPU SinJulia | FPU Mandel | CPU AES | CPU ZLib | FP64 Ray-Trace | CPU PhotoWorxx
| Performance rating | |
| Beelink SER8 | |
| BOSGAME M1 | |
| Asus NUC 14 Pro | |
| GMK NucBox K9 | |
| Ortalama Intel Core 7 150U | |
| MSI Cubi NUC 1M | |
| Beelink SEi11 Pro | |
| AIDA64 / FP32 Ray-Trace | |
| Beelink SER8 | |
| BOSGAME M1 | |
| Asus NUC 14 Pro | |
| GMK NucBox K9 | |
| Ortalama Intel Core 7 150U (6306 - 7909, n=4) | |
| Beelink SEi11 Pro | |
| MSI Cubi NUC 1M | |
| AIDA64 / FPU Julia | |
| Beelink SER8 | |
| BOSGAME M1 | |
| Asus NUC 14 Pro | |
| GMK NucBox K9 | |
| Ortalama Intel Core 7 150U (32582 - 41382, n=4) | |
| MSI Cubi NUC 1M | |
| Beelink SEi11 Pro | |
| AIDA64 / CPU SHA3 | |
| Beelink SER8 | |
| BOSGAME M1 | |
| Asus NUC 14 Pro | |
| GMK NucBox K9 | |
| Beelink SEi11 Pro | |
| Ortalama Intel Core 7 150U (1656 - 2165, n=4) | |
| MSI Cubi NUC 1M | |
| AIDA64 / CPU Queen | |
| BOSGAME M1 | |
| Beelink SER8 | |
| Asus NUC 14 Pro | |
| GMK NucBox K9 | |
| Ortalama Intel Core 7 150U (58025 - 70820, n=4) | |
| MSI Cubi NUC 1M | |
| Beelink SEi11 Pro | |
| AIDA64 / FPU SinJulia | |
| Beelink SER8 | |
| BOSGAME M1 | |
| Asus NUC 14 Pro | |
| GMK NucBox K9 | |
| Ortalama Intel Core 7 150U (4387 - 5293, n=4) | |
| Beelink SEi11 Pro | |
| MSI Cubi NUC 1M | |
| AIDA64 / FPU Mandel | |
| Beelink SER8 | |
| BOSGAME M1 | |
| Asus NUC 14 Pro | |
| GMK NucBox K9 | |
| Ortalama Intel Core 7 150U (16042 - 20259, n=4) | |
| Beelink SEi11 Pro | |
| MSI Cubi NUC 1M | |
| AIDA64 / CPU AES | |
| Beelink SER8 | |
| BOSGAME M1 | |
| GMK NucBox K9 | |
| Beelink SEi11 Pro | |
| Asus NUC 14 Pro | |
| Ortalama Intel Core 7 150U (33007 - 41731, n=4) | |
| MSI Cubi NUC 1M | |
| AIDA64 / CPU ZLib | |
| Beelink SER8 | |
| BOSGAME M1 | |
| Asus NUC 14 Pro | |
| GMK NucBox K9 | |
| Ortalama Intel Core 7 150U (491 - 695, n=4) | |
| MSI Cubi NUC 1M | |
| Beelink SEi11 Pro | |
| AIDA64 / FP64 Ray-Trace | |
| Beelink SER8 | |
| BOSGAME M1 | |
| Asus NUC 14 Pro | |
| GMK NucBox K9 | |
| Ortalama Intel Core 7 150U (3417 - 4243, n=4) | |
| Beelink SEi11 Pro | |
| MSI Cubi NUC 1M | |
| AIDA64 / CPU PhotoWorxx | |
| Asus NUC 14 Pro | |
| GMK NucBox K9 | |
| BOSGAME M1 | |
| Beelink SER8 | |
| MSI Cubi NUC 1M | |
| Ortalama Intel Core 7 150U (21802 - 38866, n=4) | |
| Beelink SEi11 Pro | |
Stres Testi
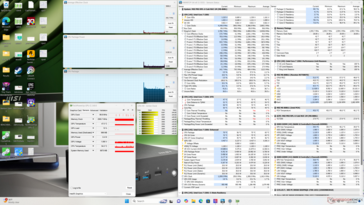
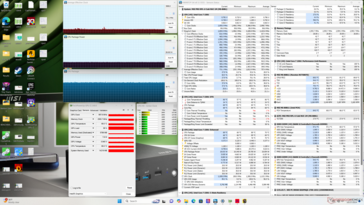
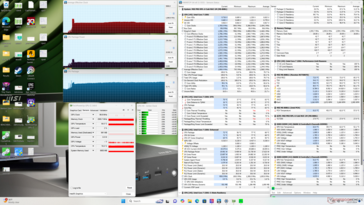
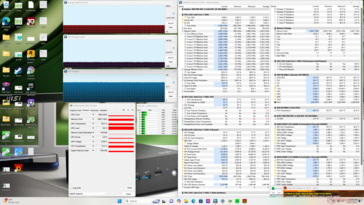
Prime95 stresini başlatırken CPU, aşağıdaki ekran görüntülerinde gösterildiği gibi 1,9 GHz ve 20 W'ta düşüp sabitlenmeden önce sadece birkaç saniye süren 2,6 GHz ve 31 W'a yükselir. Maksimum Turbo Boost, U serisi ile çalışan bir bilgisayardan bekleneceği gibi sürdürülebilir değildir.
Cyberpunk 2077 'yi çalıştırırken çekirdek sıcaklığı 69 C'de sabitlenirken, daha hızlı olan 72 C'de sabitlenmiyor NucBox K9.
| CPU Saati (GHz) | GPU Saati (MHz) | Ortalama CPU Sıcaklığı (°C) | |
| Sistem Boşta | -- | -- | 50 |
| Prime95 Stres | 1.9 | -- | 72 |
| Prime95 + FurMark Stress | 1.4 | 599 | 70 |
| Cyberpunk 2077 Stres | 0.7 | 998 | 69 |
Sistem Performansı
CrossMark: Overall | Productivity | Creativity | Responsiveness
WebXPRT 3: Overall
WebXPRT 4: Overall
Mozilla Kraken 1.1: Total
| PCMark 10 / Score | |
| Beelink SER8 | |
| BOSGAME M1 | |
| GMK NucBox K9 | |
| Asus NUC 14 Pro | |
| Ortalama Intel Core 7 150U, Intel Iris Xe Graphics G7 96EUs (6080 - 6173, n=2) | |
| MSI Cubi NUC 1M | |
| Beelink SEi11 Pro | |
| PCMark 10 / Essentials | |
| Beelink SER8 | |
| BOSGAME M1 | |
| Ortalama Intel Core 7 150U, Intel Iris Xe Graphics G7 96EUs (10856 - 11219, n=2) | |
| MSI Cubi NUC 1M | |
| GMK NucBox K9 | |
| Beelink SEi11 Pro | |
| Asus NUC 14 Pro | |
| PCMark 10 / Productivity | |
| Beelink SER8 | |
| BOSGAME M1 | |
| Ortalama Intel Core 7 150U, Intel Iris Xe Graphics G7 96EUs (8387 - 8399, n=2) | |
| MSI Cubi NUC 1M | |
| GMK NucBox K9 | |
| Asus NUC 14 Pro | |
| Beelink SEi11 Pro | |
| PCMark 10 / Digital Content Creation | |
| Beelink SER8 | |
| BOSGAME M1 | |
| Asus NUC 14 Pro | |
| GMK NucBox K9 | |
| Ortalama Intel Core 7 150U, Intel Iris Xe Graphics G7 96EUs (6701 - 6775, n=2) | |
| MSI Cubi NUC 1M | |
| Beelink SEi11 Pro | |
| CrossMark / Overall | |
| BOSGAME M1 | |
| Beelink SER8 | |
| MSI Cubi NUC 1M | |
| Ortalama Intel Core 7 150U, Intel Iris Xe Graphics G7 96EUs (1660 - 1734, n=2) | |
| GMK NucBox K9 | |
| Asus NUC 14 Pro | |
| Beelink SEi11 Pro | |
| CrossMark / Productivity | |
| BOSGAME M1 | |
| Beelink SER8 | |
| MSI Cubi NUC 1M | |
| Ortalama Intel Core 7 150U, Intel Iris Xe Graphics G7 96EUs (1649 - 1778, n=2) | |
| GMK NucBox K9 | |
| Asus NUC 14 Pro | |
| Beelink SEi11 Pro | |
| CrossMark / Creativity | |
| BOSGAME M1 | |
| Beelink SER8 | |
| Asus NUC 14 Pro | |
| Ortalama Intel Core 7 150U, Intel Iris Xe Graphics G7 96EUs (1708 - 1730, n=2) | |
| GMK NucBox K9 | |
| MSI Cubi NUC 1M | |
| Beelink SEi11 Pro | |
| CrossMark / Responsiveness | |
| BOSGAME M1 | |
| Beelink SER8 | |
| MSI Cubi NUC 1M | |
| Ortalama Intel Core 7 150U, Intel Iris Xe Graphics G7 96EUs (1493 - 1685, n=2) | |
| GMK NucBox K9 | |
| Beelink SEi11 Pro | |
| Asus NUC 14 Pro | |
| WebXPRT 3 / Overall | |
| Beelink SER8 | |
| BOSGAME M1 | |
| MSI Cubi NUC 1M | |
| Ortalama Intel Core 7 150U, Intel Iris Xe Graphics G7 96EUs (307 - 311, n=2) | |
| Beelink SEi11 Pro | |
| GMK NucBox K9 | |
| Asus NUC 14 Pro | |
| WebXPRT 4 / Overall | |
| Ortalama Intel Core 7 150U, Intel Iris Xe Graphics G7 96EUs (271 - 276, n=2) | |
| MSI Cubi NUC 1M | |
| Beelink SER8 | |
| BOSGAME M1 | |
| Asus NUC 14 Pro | |
| GMK NucBox K9 | |
| Beelink SEi11 Pro | |
| Mozilla Kraken 1.1 / Total | |
| Beelink SEi11 Pro | |
| Asus NUC 14 Pro | |
| GMK NucBox K9 | |
| BOSGAME M1 | |
| Beelink SER8 | |
| Ortalama Intel Core 7 150U, Intel Iris Xe Graphics G7 96EUs (489 - 502, n=2) | |
| MSI Cubi NUC 1M | |
* ... daha küçük daha iyidir
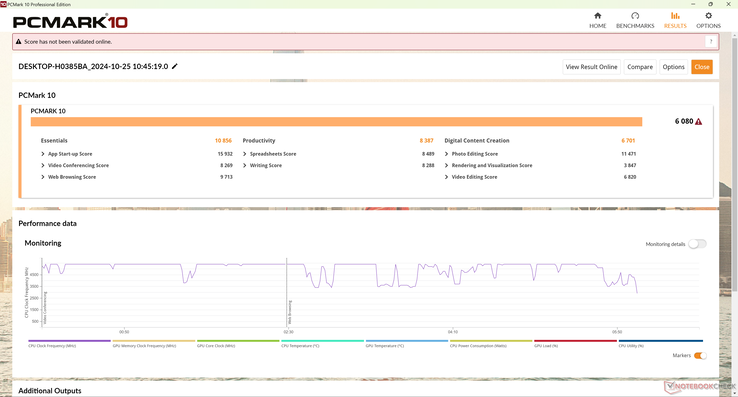
| PCMark 10 Score | 6080 puan | |
Yardım | ||
| AIDA64 / Memory Copy | |
| BOSGAME M1 | |
| Asus NUC 14 Pro | |
| Beelink SER8 | |
| GMK NucBox K9 | |
| MSI Cubi NUC 1M | |
| Ortalama Intel Core 7 150U (36579 - 61190, n=4) | |
| Beelink SEi11 Pro | |
| AIDA64 / Memory Read | |
| Asus NUC 14 Pro | |
| GMK NucBox K9 | |
| MSI Cubi NUC 1M | |
| Beelink SER8 | |
| BOSGAME M1 | |
| Ortalama Intel Core 7 150U (39827 - 68780, n=4) | |
| Beelink SEi11 Pro | |
| AIDA64 / Memory Write | |
| BOSGAME M1 | |
| Beelink SER8 | |
| Asus NUC 14 Pro | |
| GMK NucBox K9 | |
| Ortalama Intel Core 7 150U (44925 - 78327, n=4) | |
| MSI Cubi NUC 1M | |
| Beelink SEi11 Pro | |
| AIDA64 / Memory Latency | |
| GMK NucBox K9 | |
| Asus NUC 14 Pro | |
| BOSGAME M1 | |
| Beelink SER8 | |
| Ortalama Intel Core 7 150U (74.5 - 100, n=4) | |
| Beelink SEi11 Pro | |
| MSI Cubi NUC 1M | |
* ... daha küçük daha iyidir
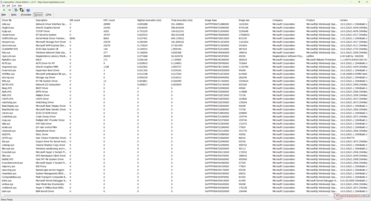
DPC Gecikme Süresi
| DPC Latencies / LatencyMon - interrupt to process latency (max), Web, Youtube, Prime95 | |
| GMK NucBox K9 | |
| MSI Cubi NUC 1M | |
| Asus NUC 14 Pro | |
| BOSGAME M1 | |
| Beelink SER8 | |
| Beelink SEi11 Pro | |
* ... daha küçük daha iyidir
Depolama Cihazları
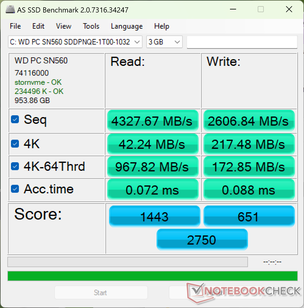
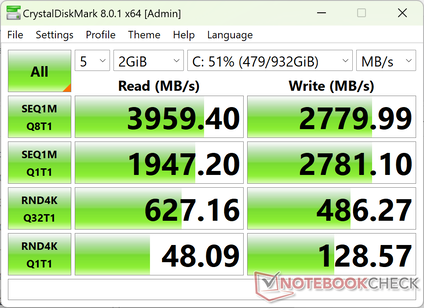
Ünitemiz orta seviye ile birlikte gönderilir WD PC SN560 SDDPNQE-1T00 M.2 PCIe4 x4 NVMe SSD, 5000 MB/sn'ye kadar istikrarlı aktarım hızları sunar. SSD ısı dağıtıcısının standart ve önceden yüklenmiş olarak gelmesini takdir ediyoruz.
| Drive Performance rating - Percent | |
| GMK NucBox K9 | |
| Beelink SER8 | |
| Asus NUC 14 Pro | |
| BOSGAME M1 | |
| MSI Cubi NUC 1M | |
| Beelink SEi11 Pro | |
| DiskSpd | |
| seq read | |
| MSI Cubi NUC 1M | |
| GMK NucBox K9 | |
| Asus NUC 14 Pro | |
| Beelink SER8 | |
| BOSGAME M1 | |
| Beelink SEi11 Pro | |
| seq write | |
| GMK NucBox K9 | |
| Beelink SER8 | |
| MSI Cubi NUC 1M | |
| BOSGAME M1 | |
| Asus NUC 14 Pro | |
| Beelink SEi11 Pro | |
| seq q8 t1 read | |
| Asus NUC 14 Pro | |
| GMK NucBox K9 | |
| Beelink SER8 | |
| MSI Cubi NUC 1M | |
| BOSGAME M1 | |
| Beelink SEi11 Pro | |
| seq q8 t1 write | |
| GMK NucBox K9 | |
| Beelink SER8 | |
| Asus NUC 14 Pro | |
| MSI Cubi NUC 1M | |
| BOSGAME M1 | |
| Beelink SEi11 Pro | |
| 4k q1 t1 read | |
| Beelink SER8 | |
| GMK NucBox K9 | |
| MSI Cubi NUC 1M | |
| BOSGAME M1 | |
| Asus NUC 14 Pro | |
| Beelink SEi11 Pro | |
| 4k q1 t1 write | |
| Beelink SER8 | |
| MSI Cubi NUC 1M | |
| BOSGAME M1 | |
| GMK NucBox K9 | |
| Beelink SEi11 Pro | |
| Asus NUC 14 Pro | |
| 4k q32 t16 read | |
| Beelink SER8 | |
| GMK NucBox K9 | |
| MSI Cubi NUC 1M | |
| BOSGAME M1 | |
| Beelink SEi11 Pro | |
| Asus NUC 14 Pro | |
| 4k q32 t16 write | |
| Beelink SER8 | |
| GMK NucBox K9 | |
| BOSGAME M1 | |
| MSI Cubi NUC 1M | |
| Beelink SEi11 Pro | |
| Asus NUC 14 Pro | |
* ... daha küçük daha iyidir
Disk Throttling: DiskSpd Read Loop, Queue Depth 8
GPU Performansı
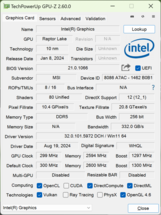
Bu Iris Xe G7 96 EUs artık birkaç yaşında ve bu nedenle Meteor Lake veya Zen 4 veya daha yüksek platformlarda çalışan çoğu yeni mini PC'nin oldukça gerisinde kalıyor. Bu nedenle Cubi NUC M1, yayın akışı ve hafif 2D oyunlar için daha uygundur.
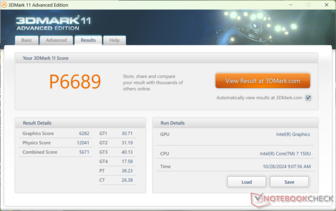
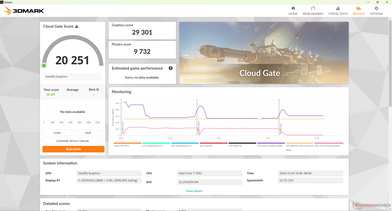
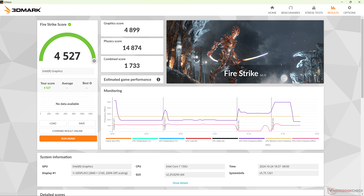
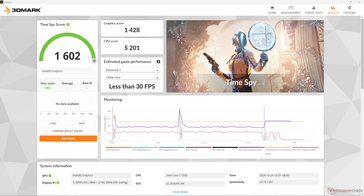
Performans modu yerine Dengeli modda çalıştırmak, 3DMark puanları testlerimizde neredeyse aynı olacağından performansı etkilemiyor gibi görünüyor.
Core 5 CPU daha yavaş entegre CPU ile eşleştirildiği için Core 5 120U konfigürasyonuna düşmenin grafik performansını yaklaşık yüzde 10 ila 20 oranında etkilemesi bekleniyor Iris Xe 80 EUs yerine.
X-Plane, Cubi M1 ünitemizde başlatılamadı ve bu nedenle sonuçları aşağıda mevcut değil.
| 3DMark Performance rating - Percent | |
| Beelink SER8 | |
| GMK NucBox K6 -1! | |
| Lenovo ThinkStation P3 Tiny-30H0006AGE | |
| Geekom AX8 Pro | |
| Khadas Mind 2 | |
| Asus NUC 14 Pro | |
| GMK NucBox K9 | |
| Beelink SER6 Pro | |
| Beelink SER6 Pro Ryzen 7 7735HS -1! | |
| Geekom XT13 Pro | |
| GMK NucBox M6 | |
| MSI Cubi NUC 1M | |
| Ortalama Intel Iris Xe Graphics G7 96EUs | |
| Beelink SEi11 Pro | |
| Lenovo IdeaPad Slim 3i 15IRU9 | |
| GMK NucBox M5 | |
| HP Elite Mini 800 G9-5M9X6EA | |
| 3DMark 11 - 1280x720 Performance GPU | |
| GMK NucBox K6 | |
| Beelink SER8 | |
| Geekom AX8 Pro | |
| Khadas Mind 2 | |
| Lenovo ThinkStation P3 Tiny-30H0006AGE | |
| Asus NUC 14 Pro | |
| Beelink SER6 Pro | |
| GMK NucBox K9 | |
| Beelink SER6 Pro Ryzen 7 7735HS | |
| Geekom XT13 Pro | |
| GMK NucBox M6 | |
| Beelink SEi11 Pro | |
| Ortalama Intel Iris Xe Graphics G7 96EUs (2867 - 7676, n=209) | |
| MSI Cubi NUC 1M | |
| Lenovo IdeaPad Slim 3i 15IRU9 | |
| GMK NucBox M5 | |
| HP Elite Mini 800 G9-5M9X6EA | |
| 3DMark 11 Performance | 6689 puan | |
| 3DMark Cloud Gate Standard Score | 20251 puan | |
| 3DMark Fire Strike Score | 4527 puan | |
| 3DMark Time Spy Score | 1602 puan | |
Yardım | ||
| Blender | |
| v3.3 Classroom HIP/AMD | |
| Beelink SER6 Pro | |
| Beelink SER6 Pro Ryzen 7 7735HS | |
| v3.3 Classroom OPTIX/RTX | |
| Lenovo ThinkStation P3 Tiny-30H0006AGE | |
| v3.3 Classroom CUDA | |
| Lenovo ThinkStation P3 Tiny-30H0006AGE | |
| v3.3 Classroom CPU | |
| Beelink SEi11 Pro | |
| MSI Cubi NUC 1M | |
| GMK NucBox M5 | |
| Ortalama Intel Iris Xe Graphics G7 96EUs (336 - 1259, n=109) | |
| GMK NucBox M6 | |
| Geekom XT13 Pro | |
| Beelink SER6 Pro | |
| Khadas Mind 2 | |
| Beelink SER6 Pro Ryzen 7 7735HS | |
| GMK NucBox K9 | |
| Asus NUC 14 Pro | |
| HP Elite Mini 800 G9-5M9X6EA | |
| GMK NucBox K6 | |
| Geekom AX8 Pro | |
| Beelink SER8 | |
| Lenovo ThinkStation P3 Tiny-30H0006AGE | |
| v3.3 Classroom oneAPI/Intel | |
| GMK NucBox K9 | |
| Khadas Mind 2 | |
* ... daha küçük daha iyidir
| Performance rating - Percent | |
| BOSGAME M1 -1! | |
| Beelink SER8 -1! | |
| Asus NUC 14 Pro -2! | |
| GMK NucBox K9 | |
| Beelink SEi11 Pro -3! | |
| MSI Cubi NUC 1M -2! | |
| Baldur's Gate 3 - 1920x1080 Ultra Preset AA:T | |
| BOSGAME M1 | |
| Beelink SER8 | |
| GMK NucBox K9 | |
| Asus NUC 14 Pro | |
| GTA V - 1920x1080 Highest AA:4xMSAA + FX AF:16x | |
| Asus NUC 14 Pro | |
| GMK NucBox K9 | |
| MSI Cubi NUC 1M | |
| Final Fantasy XV Benchmark - 1920x1080 High Quality | |
| BOSGAME M1 | |
| Beelink SER8 | |
| Asus NUC 14 Pro | |
| GMK NucBox K9 | |
| MSI Cubi NUC 1M | |
| Beelink SEi11 Pro | |
| Strange Brigade - 1920x1080 ultra AA:ultra AF:16 | |
| BOSGAME M1 | |
| Beelink SER8 | |
| GMK NucBox K9 | |
| MSI Cubi NUC 1M | |
| Beelink SEi11 Pro | |
| Dota 2 Reborn - 1920x1080 ultra (3/3) best looking | |
| Beelink SER8 | |
| BOSGAME M1 | |
| GMK NucBox K9 | |
| Asus NUC 14 Pro | |
| MSI Cubi NUC 1M | |
| Beelink SEi11 Pro | |
| X-Plane 11.11 - 1920x1080 high (fps_test=3) | |
| Beelink SER8 | |
| BOSGAME M1 | |
| Beelink SEi11 Pro | |
| GMK NucBox K9 | |
| Asus NUC 14 Pro | |
| Far Cry 5 - 1920x1080 Ultra Preset AA:T | |
| BOSGAME M1 | |
| Beelink SER8 | |
| GMK NucBox K9 | |
| MSI Cubi NUC 1M | |
| X-Plane 11.11 | |
| 1280x720 low (fps_test=1) | |
| Lenovo ThinkStation P3 Tiny-30H0006AGE | |
| Beelink SER6 Pro | |
| GMK NucBox K6 | |
| Beelink SER8 | |
| Beelink SER6 Pro Ryzen 7 7735HS | |
| Geekom AX8 Pro | |
| Beelink SEi11 Pro | |
| GMK NucBox K9 | |
| Khadas Mind 2 | |
| GMK NucBox M6 | |
| Asus NUC 14 Pro | |
| Ortalama Intel Iris Xe Graphics G7 96EUs (13.4 - 88.4, n=213) | |
| GMK NucBox M5 | |
| Lenovo IdeaPad Slim 3i 15IRU9 | |
| 1920x1080 med (fps_test=2) | |
| Lenovo ThinkStation P3 Tiny-30H0006AGE | |
| Beelink SER6 Pro | |
| Beelink SER6 Pro Ryzen 7 7735HS | |
| Beelink SER8 | |
| GMK NucBox K6 | |
| Geekom AX8 Pro | |
| GMK NucBox K9 | |
| Beelink SEi11 Pro | |
| Khadas Mind 2 | |
| GMK NucBox M6 | |
| Asus NUC 14 Pro | |
| Ortalama Intel Iris Xe Graphics G7 96EUs (11.6 - 69.5, n=214) | |
| GMK NucBox M5 | |
| Lenovo IdeaPad Slim 3i 15IRU9 | |
| 1920x1080 high (fps_test=3) | |
| Lenovo ThinkStation P3 Tiny-30H0006AGE | |
| Beelink SER6 Pro | |
| Beelink SER6 Pro Ryzen 7 7735HS | |
| Geekom AX8 Pro | |
| GMK NucBox K6 | |
| Beelink SER8 | |
| Beelink SEi11 Pro | |
| GMK NucBox K9 | |
| Khadas Mind 2 | |
| GMK NucBox M6 | |
| Asus NUC 14 Pro | |
| Ortalama Intel Iris Xe Graphics G7 96EUs (11.1 - 59.8, n=213) | |
| GMK NucBox M5 | |
| Lenovo IdeaPad Slim 3i 15IRU9 | |
Cyberpunk 2077 ultra FPS Chart
| düşük | orta | yüksek | ultra | |
|---|---|---|---|---|
| GTA V (2015) | 100.3 | 86.1 | 23.6 | 9.98 |
| Dota 2 Reborn (2015) | 97.7 | 61.9 | 62.5 | 57.8 |
| Final Fantasy XV Benchmark (2018) | 40.9 | 23 | 16.6 | |
| Far Cry 5 (2018) | 49 | 28 | 26 | 24 |
| Strange Brigade (2018) | 88.2 | 38.9 | 31.1 | 25.2 |
| Tiny Tina's Wonderlands (2022) | 27.5 | 20.3 | 14 | 10.9 |
| F1 22 (2022) | 42.3 | 38.2 | 28.3 | 21.4 |
| Baldur's Gate 3 (2023) | 15.3 | |||
| Cyberpunk 2077 (2023) | 15.4 | 12.4 | 10.8 | 9.46 |
Emisyonlar
Sistem Gürültüsü
Dahili fan her zaman yaklaşık 30 dB(A) ses seviyesinde çalışır. İyi haber şu ki, bu ses tipik bir ofis veya konferans odası ortamında neredeyse duyulamaz. Ayrıca, fan nispeten hareketsizdir ve bu nedenle orta ila orta-yüksek yükleri çalıştırırken bile RPM'lerde ani veya yüksek artışlar olmaz.
Ses yüksekliği
| Boşta |
| 29.9 / 29.9 / 32 dB |
| Çalışırken |
| 33.5 / 40.5 dB |
 | ||
30 dB sessiz 40 dB(A) duyulabilirlik 50 dB(A) gürültülü |
||
min: | ||
| MSI Cubi NUC 1M Iris Xe G7 96EUs, Core 7 150U, WD PC SN560 SDDPNQE-1T00 | GMK NucBox K9 Arc 7-Core, Ultra 5 125H, MasonSemi 1TB MC7000 | Asus NUC 14 Pro Arc 7-Core, Ultra 5 125H, Kingston KC3000 2048G SKC3000D2048G | Beelink SEi11 Pro Iris Xe G7 96EUs, i5-11320H, Kingston NV1 SNVS/500GCN | Beelink SER8 Radeon 780M, R7 8845HS, Crucial P3 Plus CT1000P3PSSD8 | BOSGAME M1 Radeon 780M, R7 7840HS, Kingston OM8PGP41024N-A0 | |
|---|---|---|---|---|---|---|
| Noise | -11% | -4% | 11% | 5% | -6% | |
| kapalı / ortam * (dB) | 23.5 | 23 2% | 24 -2% | 22.8 3% | 23.6 -0% | 23.2 1% |
| Idle Minimum * (dB) | 29.9 | 29.8 -0% | 26 13% | 24.7 17% | 28.8 4% | 32 -7% |
| Idle Average * (dB) | 29.9 | 35.7 -19% | 26.2 12% | 24.7 17% | 28.8 4% | 32 -7% |
| Idle Maximum * (dB) | 32 | 35.7 -12% | 26.2 18% | 25.3 21% | 30.5 5% | 32 -0% |
| Load Average * (dB) | 33.5 | 41.9 -25% | 42.4 -27% | 33.2 1% | 34.6 -3% | 38.7 -16% |
| Cyberpunk 2077 ultra * (dB) | 39.1 | 43.8 -12% | 47.7 -22% | 34.1 13% | ||
| Load Maximum * (dB) | 40.5 | 44 -9% | 47.8 -18% | 37.8 7% | 34.5 15% | 42 -4% |
| Witcher 3 ultra * (dB) | 34.5 | 41.7 |
* ... daha küçük daha iyidir
Sıcaklık
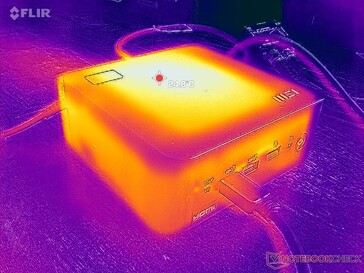
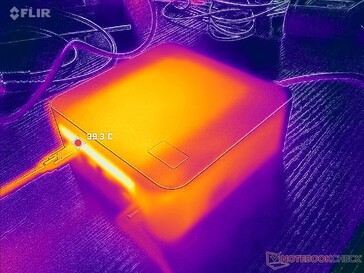
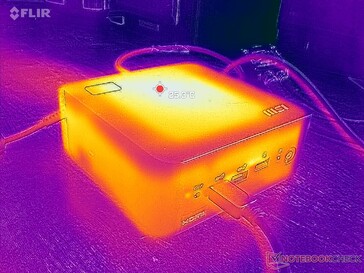
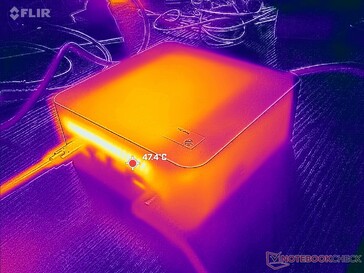
Diğer mini PC'lerin aksine Cubi NUC M1'in alt ve arka kısımları hariç neredeyse tüm kenarlarında havalandırma ızgaraları bulunmuyor. Bununla birlikte, güç tasarruflu U serisi CPU, yüzey sıcaklıklarının ne olursa olsun bir sorun olmayacağı anlamına gelir. Üstteki sıcak nokta, zorlu yükleri uzun süre çalıştırırken bile 30 C'nin altında kalacaktır.
Enerji Yönetimi
Güç Tüketimi
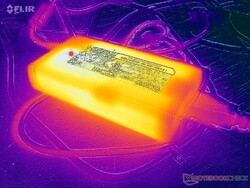
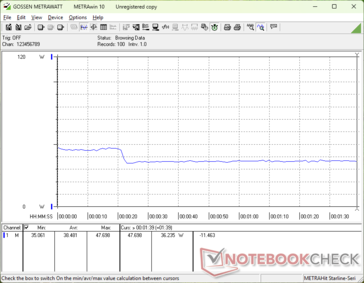
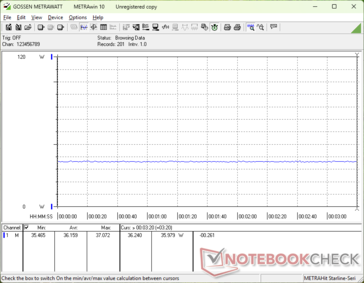
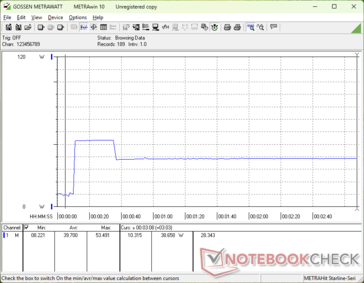
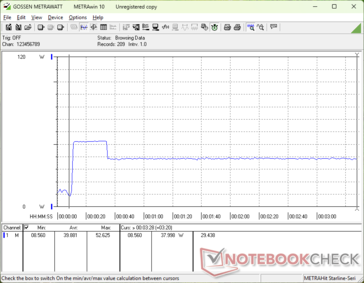
Tüketim, özellikle zorlu yükleri çalıştırırken genellikle çoğu H-güçlü mini PC'den daha düşüktür. En önemlisi, mini PC yüzde 100 CPU kullanımında ancak yarısını çekmesine rağmen sistem oldukça büyük bir 120 W AC adaptörle birlikte gönderilir. Yüksek ek yük, Thunderbolt aksesuarlarına veya diğer harici cihazlara güç sağlamak için kullanılabilir.
Gelecekte, modern U serisi dizüstü bilgisayarlarda olduğu gibi evrensel USB-C AC adaptörlerine geçiş yapıldığını görmek isteriz.
| Kapalı / Bekleme modu | |
| Boşta | |
| Çalışırken |
|
Key:
min: | |
| MSI Cubi NUC 1M Core 7 150U, Iris Xe G7 96EUs, WD PC SN560 SDDPNQE-1T00, , x, | GMK NucBox K9 Ultra 5 125H, Arc 7-Core, MasonSemi 1TB MC7000, , x, | Asus NUC 14 Pro Ultra 5 125H, Arc 7-Core, Kingston KC3000 2048G SKC3000D2048G, , x, | Beelink SEi11 Pro i5-11320H, Iris Xe G7 96EUs, Kingston NV1 SNVS/500GCN, , x, | Beelink SER8 R7 8845HS, Radeon 780M, Crucial P3 Plus CT1000P3PSSD8, , x, | BOSGAME M1 R7 7840HS, Radeon 780M, Kingston OM8PGP41024N-A0, , x, | |
|---|---|---|---|---|---|---|
| Power Consumption | -41% | -34% | -26% | -24% | -32% | |
| Idle Minimum * (Watt) | 6.4 | 10.9 -70% | 5.1 20% | 9.8 -53% | 7.3 -14% | 7.3 -14% |
| Idle Average * (Watt) | 8.3 | 11 -33% | 6.4 23% | 10.3 -24% | 7.3 12% | 7.3 12% |
| Idle Maximum * (Watt) | 10.4 | 11.4 -10% | 14.7 -41% | 10.5 -1% | 8.4 19% | 8.4 19% |
| Load Average * (Watt) | 38.5 | 52.8 -37% | 55.5 -44% | 54.2 -41% | 68.2 -77% | 72.7 -89% |
| Cyberpunk 2077 ultra external monitor * (Watt) | 36.1 | 57.1 -58% | 59.1 -64% | |||
| Load Maximum * (Watt) | 52.5 | 72.2 -38% | 103.3 -97% | 59 -12% | 84.3 -61% | 99.1 -89% |
| Witcher 3 ultra * (Watt) | 53.1 | 75.1 | 80.5 |
* ... daha küçük daha iyidir
Power Consumption Cyberpunk / Stress Test
Power Consumption external Monitor
Notebookcheck Rating
MSI Cubi NUC 1M
- 10/30/2024 v8
Allen Ngo
Şeffaflık
İncelenecek cihazların seçimi editör ekibimiz tarafından yapılır. Test örneği, bu incelemenin amacı doğrultusunda üretici veya perakendeci tarafından yazara ödünç olarak sağlanmıştır. Borç verenin bu inceleme üzerinde herhangi bir etkisi olmadığı gibi, üretici de yayınlanmadan önce bu incelemenin bir kopyasını almamıştır. Bu incelemeyi yayınlama zorunluluğu yoktu. Bağımsız bir medya şirketi olarak Notebookcheck, üreticilerin, perakendecilerin veya yayıncıların otoritesine tabi değildir.
Notebookcheck bu şekilde test yapıyor
Notebookcheck, tüm sonuçların karşılaştırılabilir olmasını sağlamak için her yıl yüzlerce dizüstü bilgisayarı ve akıllı telefonu standart prosedürler kullanarak bağımsız olarak inceliyor. Yaklaşık 20 yıldır test yöntemlerimizi sürekli olarak geliştirdik ve bu süreçte endüstri standartlarını belirledik. Test laboratuvarlarımızda deneyimli teknisyenler ve editörler tarafından yüksek kaliteli ölçüm ekipmanları kullanılmaktadır. Bu testler çok aşamalı bir doğrulama sürecini içerir. Karmaşık derecelendirme sistemimiz, nesnelliği koruyan yüzlerce sağlam temellere dayanan ölçüm ve kıyaslamaya dayanmaktadır.






 Total Sustainability Score:
