MSI Prestige 13 AI Evo dizüstü bilgisayar incelemesi - 1 kg'ın altında Core Ultra 7 ve OLED
MSI Prestige 13 AI Evo, 1 kilogramdan daha hafif kompakt bir subnotebook. Yeni 2024 modeli, Intel'den bir Meteor Lake işlemcinin yanı sıra bir Wi-Fi 7 modülü aldı. Test cihazımız Core Ultra 7 155H, Intel Arc Graphics, 32 GB RAM, 1 TB SSD ve 2,8K OLED ekrana sahip varyant olup yaklaşık 1.300 ABD dolarıdır.
Karşılaştırmalı olarak olası rakipler
Derecelendirme | Tarih | Modeli | Ağırlık | Yükseklik | Boyut | Çözünürlük | Fiyat |
|---|---|---|---|---|---|---|---|
| 86.6 % v7 (old) | 03/2024 | MSI Prestige 13 AI Evo Ultra 7 155H, Arc 8-Core | 967 g | 16.9 mm | 13.30" | 2880x1800 | |
| 89.5 % v7 (old) | 09/2023 | Lenovo ThinkPad X1 Nano Gen 3 i7-1360P, Iris Xe G7 96EUs | 989 g | 14.8 mm | 13.00" | 2160x1350 | |
| 90.2 % v7 (old) | 10/2023 | Dell Latitude 13 7340 i5-1345U i5-1345U, Iris Xe G7 80EUs | 1.1 kg | 18.2 mm | 13.30" | 1920x1200 | |
| 91.9 % v7 (old) | HP Dragonfly G4 i7-1365U, Iris Xe G7 96EUs | 1.1 kg | 16.3 mm | 13.50" | 1920x1280 | ||
| 85.4 % v7 (old) | 05/2023 | Asus ZenBook S13 OLED UX5304 i7-1355U, Iris Xe G7 96EUs | 1 kg | 11.8 mm | 13.30" | 2880x1800 |
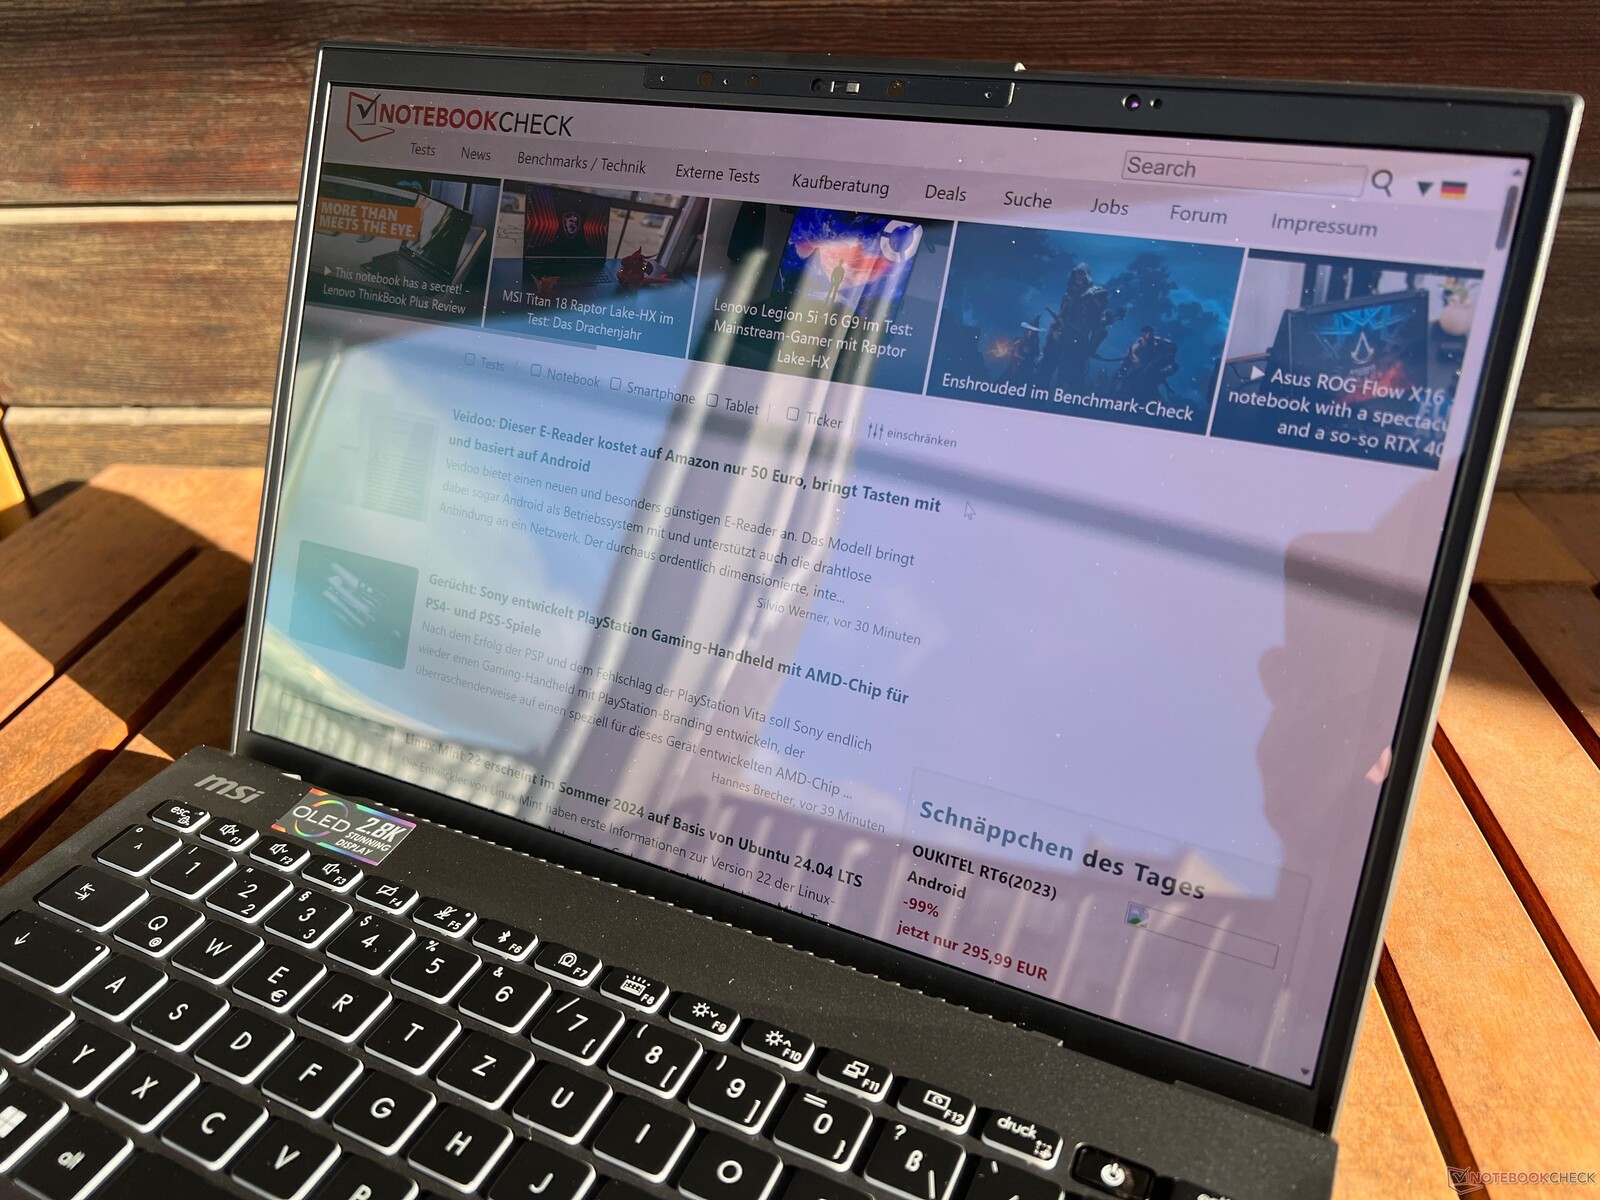
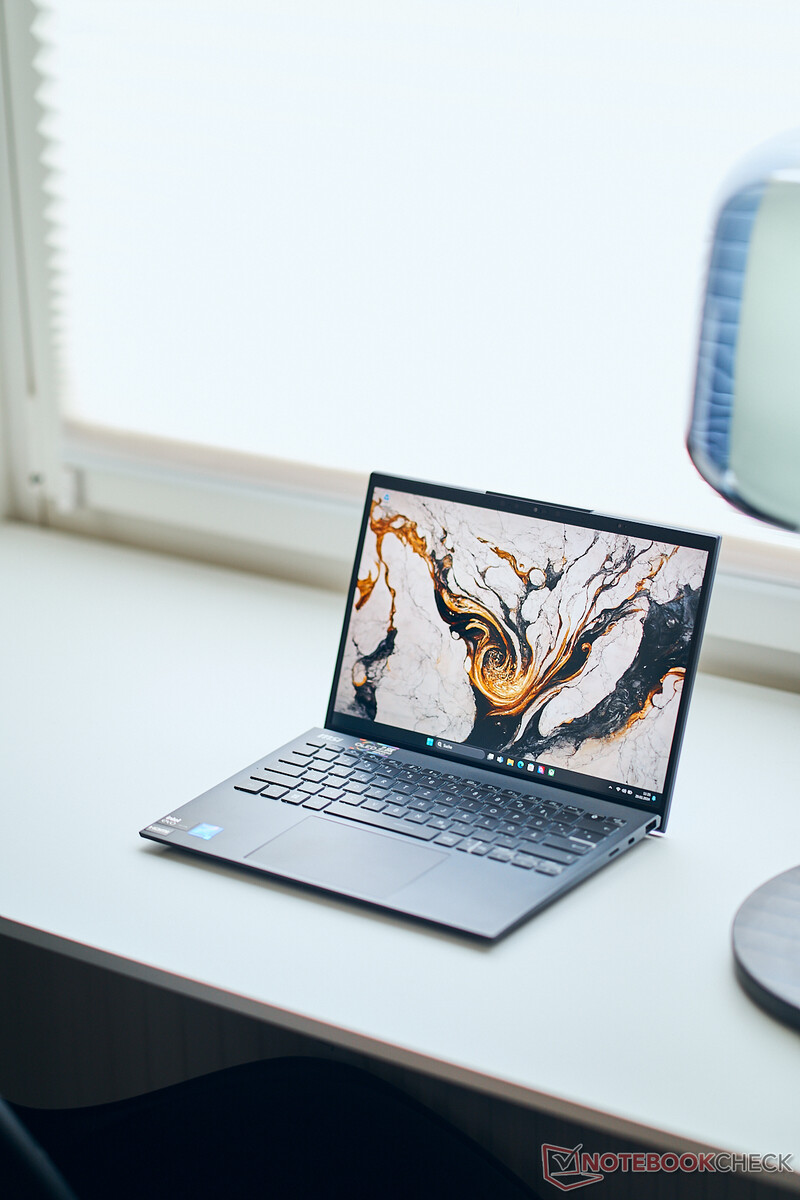
Kasa - Magnezyum alaşımlı kasaya sahip Prestige 13
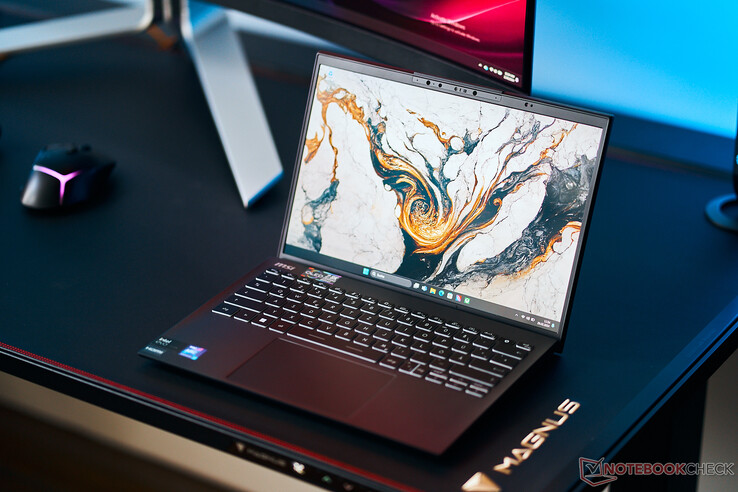
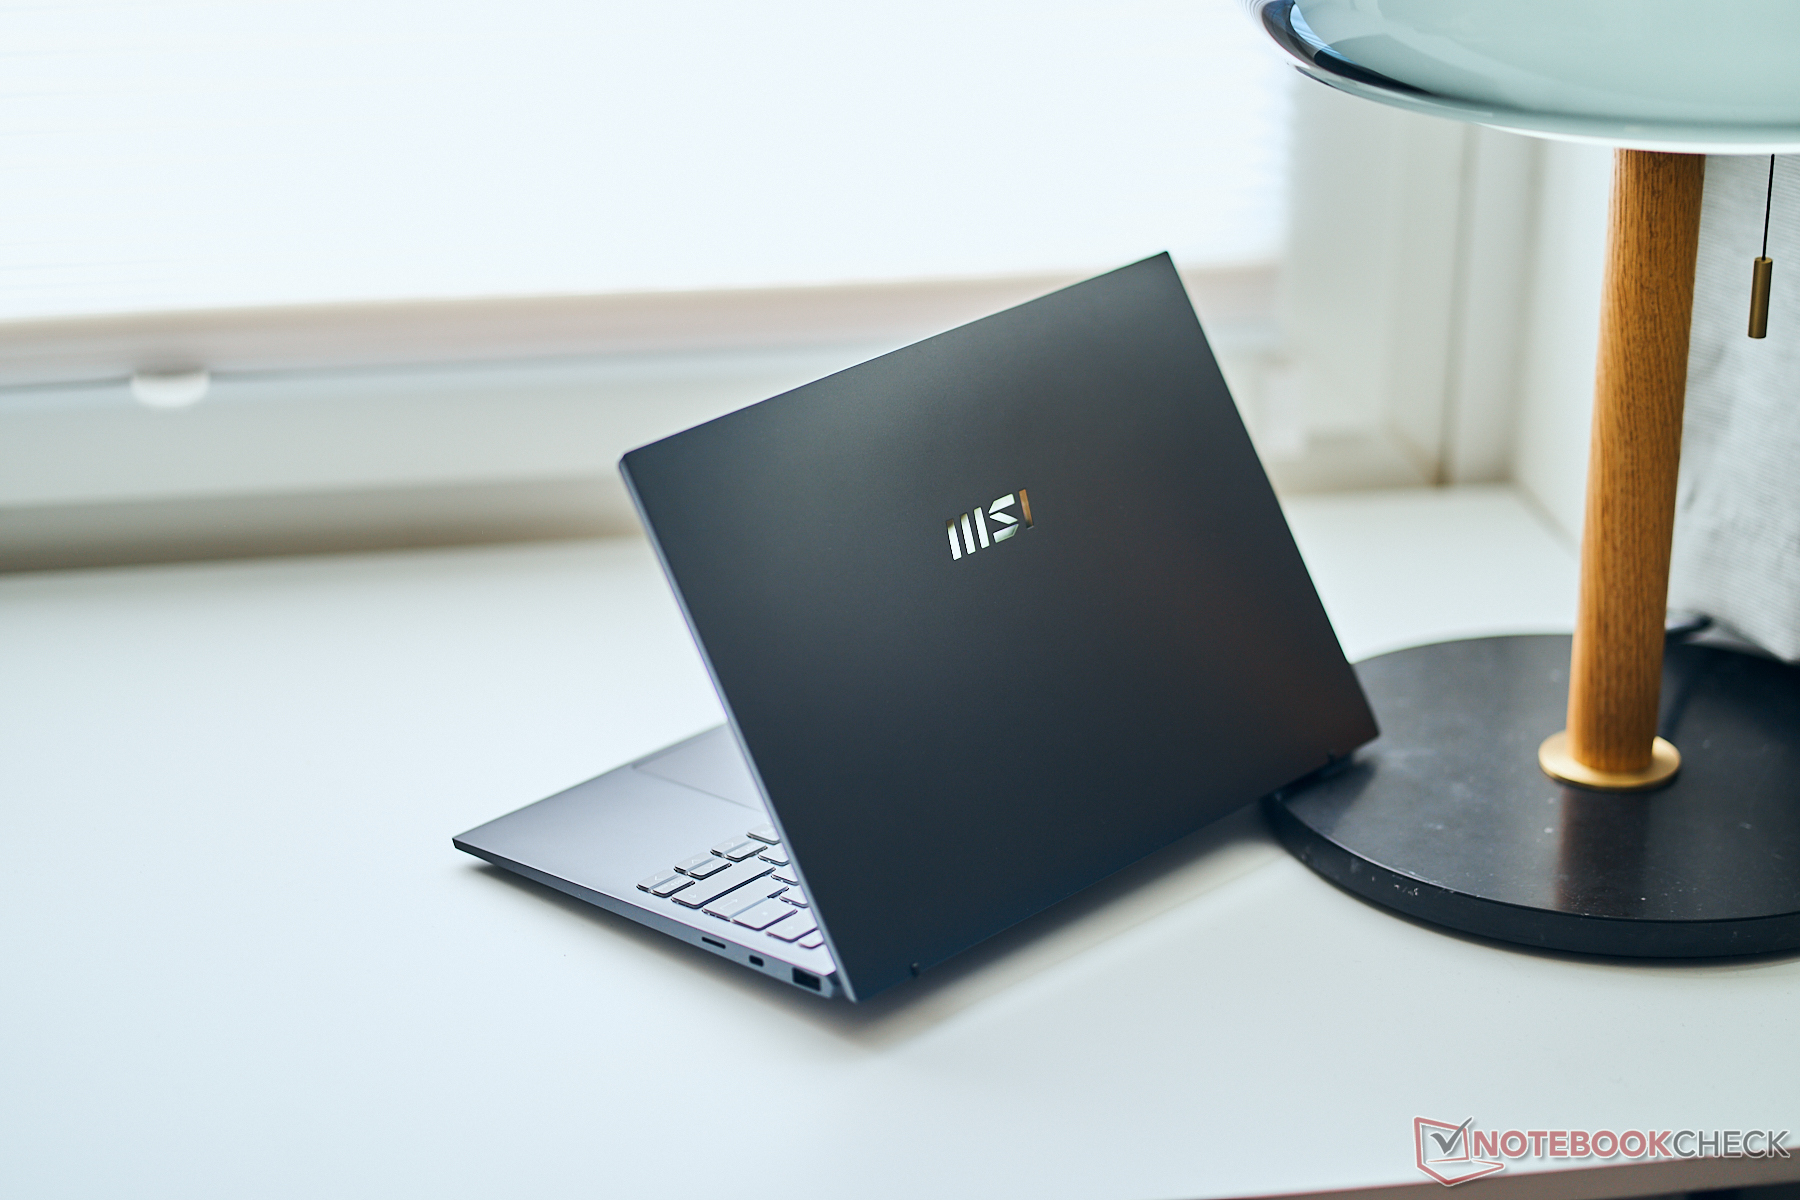
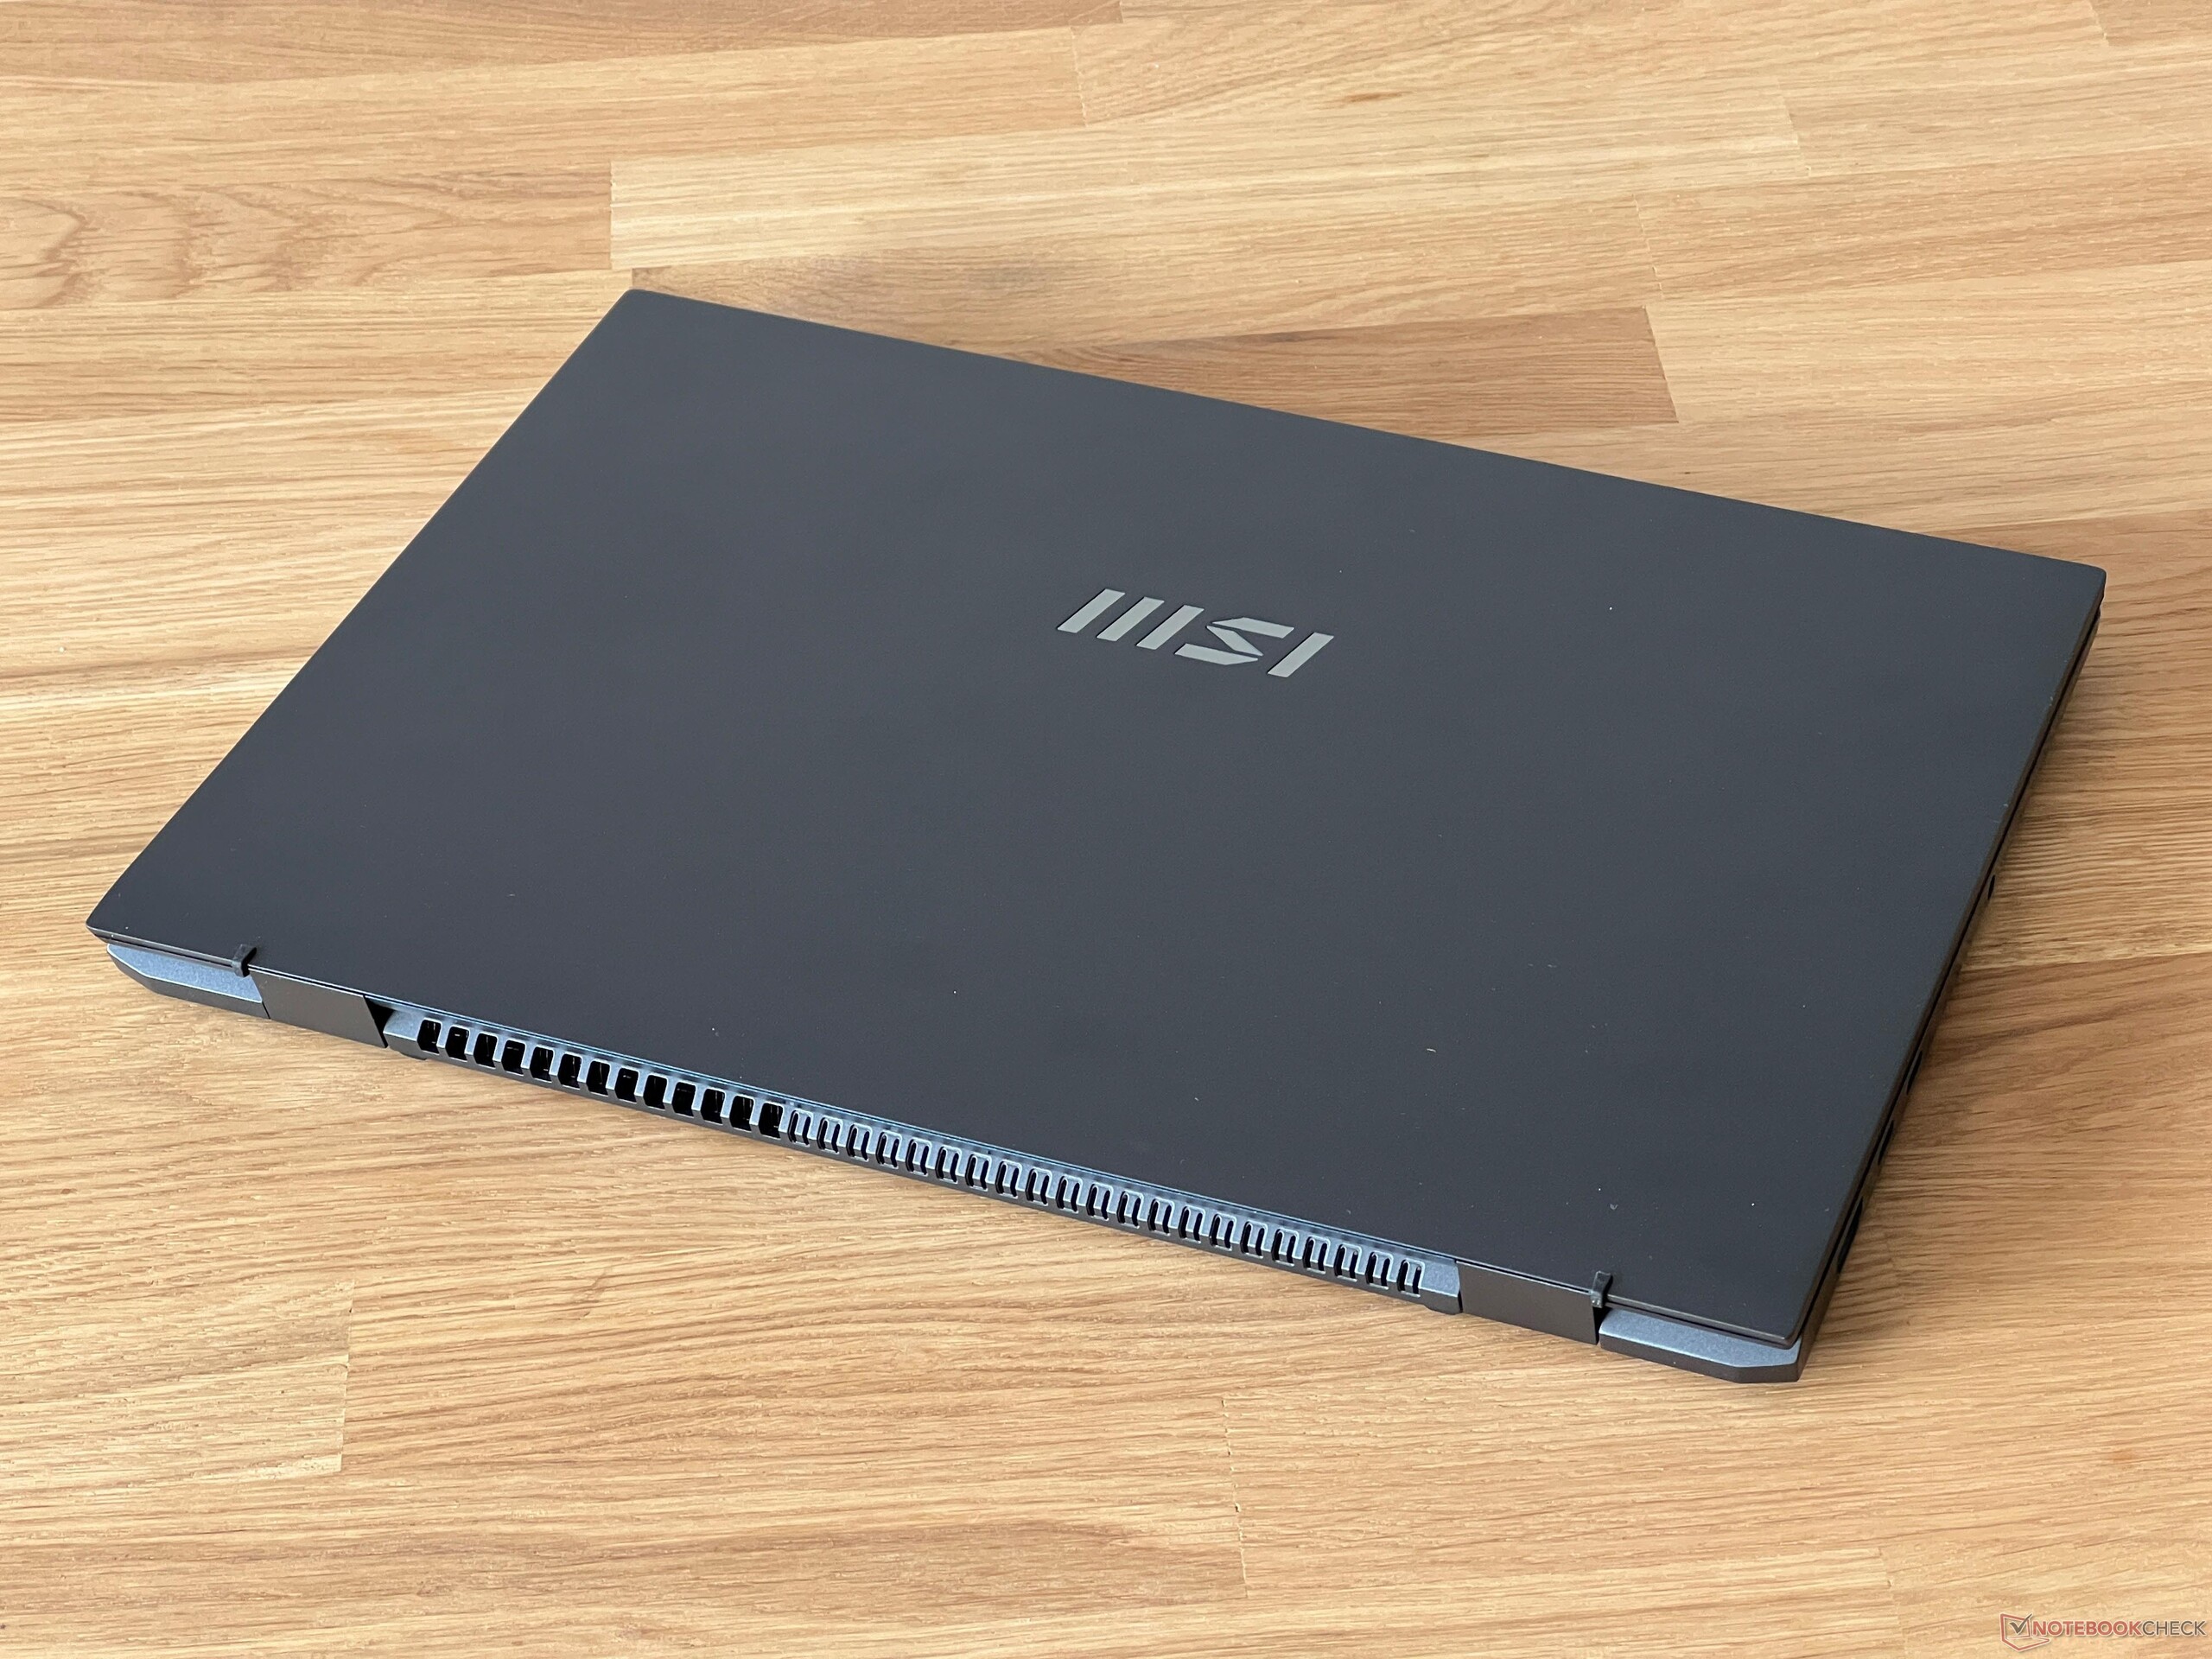
MSI Prestige 13'ü ya test cihazımızla aynı olan koyu gri (Stellar Gray) ya da alternatif olarak beyaz (Pure White) renkte sunuyor. Her iki versiyonda da magnezyum-alüminyum alaşımı kullanılıyor ve bu da muhtemelen cihazın 976 gramlık düşük ağırlığına katkıda bulunuyor. Dizüstü bilgisayarla ilk temasa geçtiğinizde, gerçekten ne kadar hafif olduğuna hemen şaşırıyorsunuz. Yüzeyleri yüksek kaliteli bir his veriyor ve koyu renkli modelde bile parmak izi izleri çok büyük bir sorun gibi görünmüyor. Prestige 13, MSI logosunun yanı sıra herhangi bir ek tasarım öğesine sahip değil. Çerçeveler her iki tarafta da oldukça ince ancak üst kenardaki çerçeve, takılı web kamerası nedeniyle oldukça geniş.
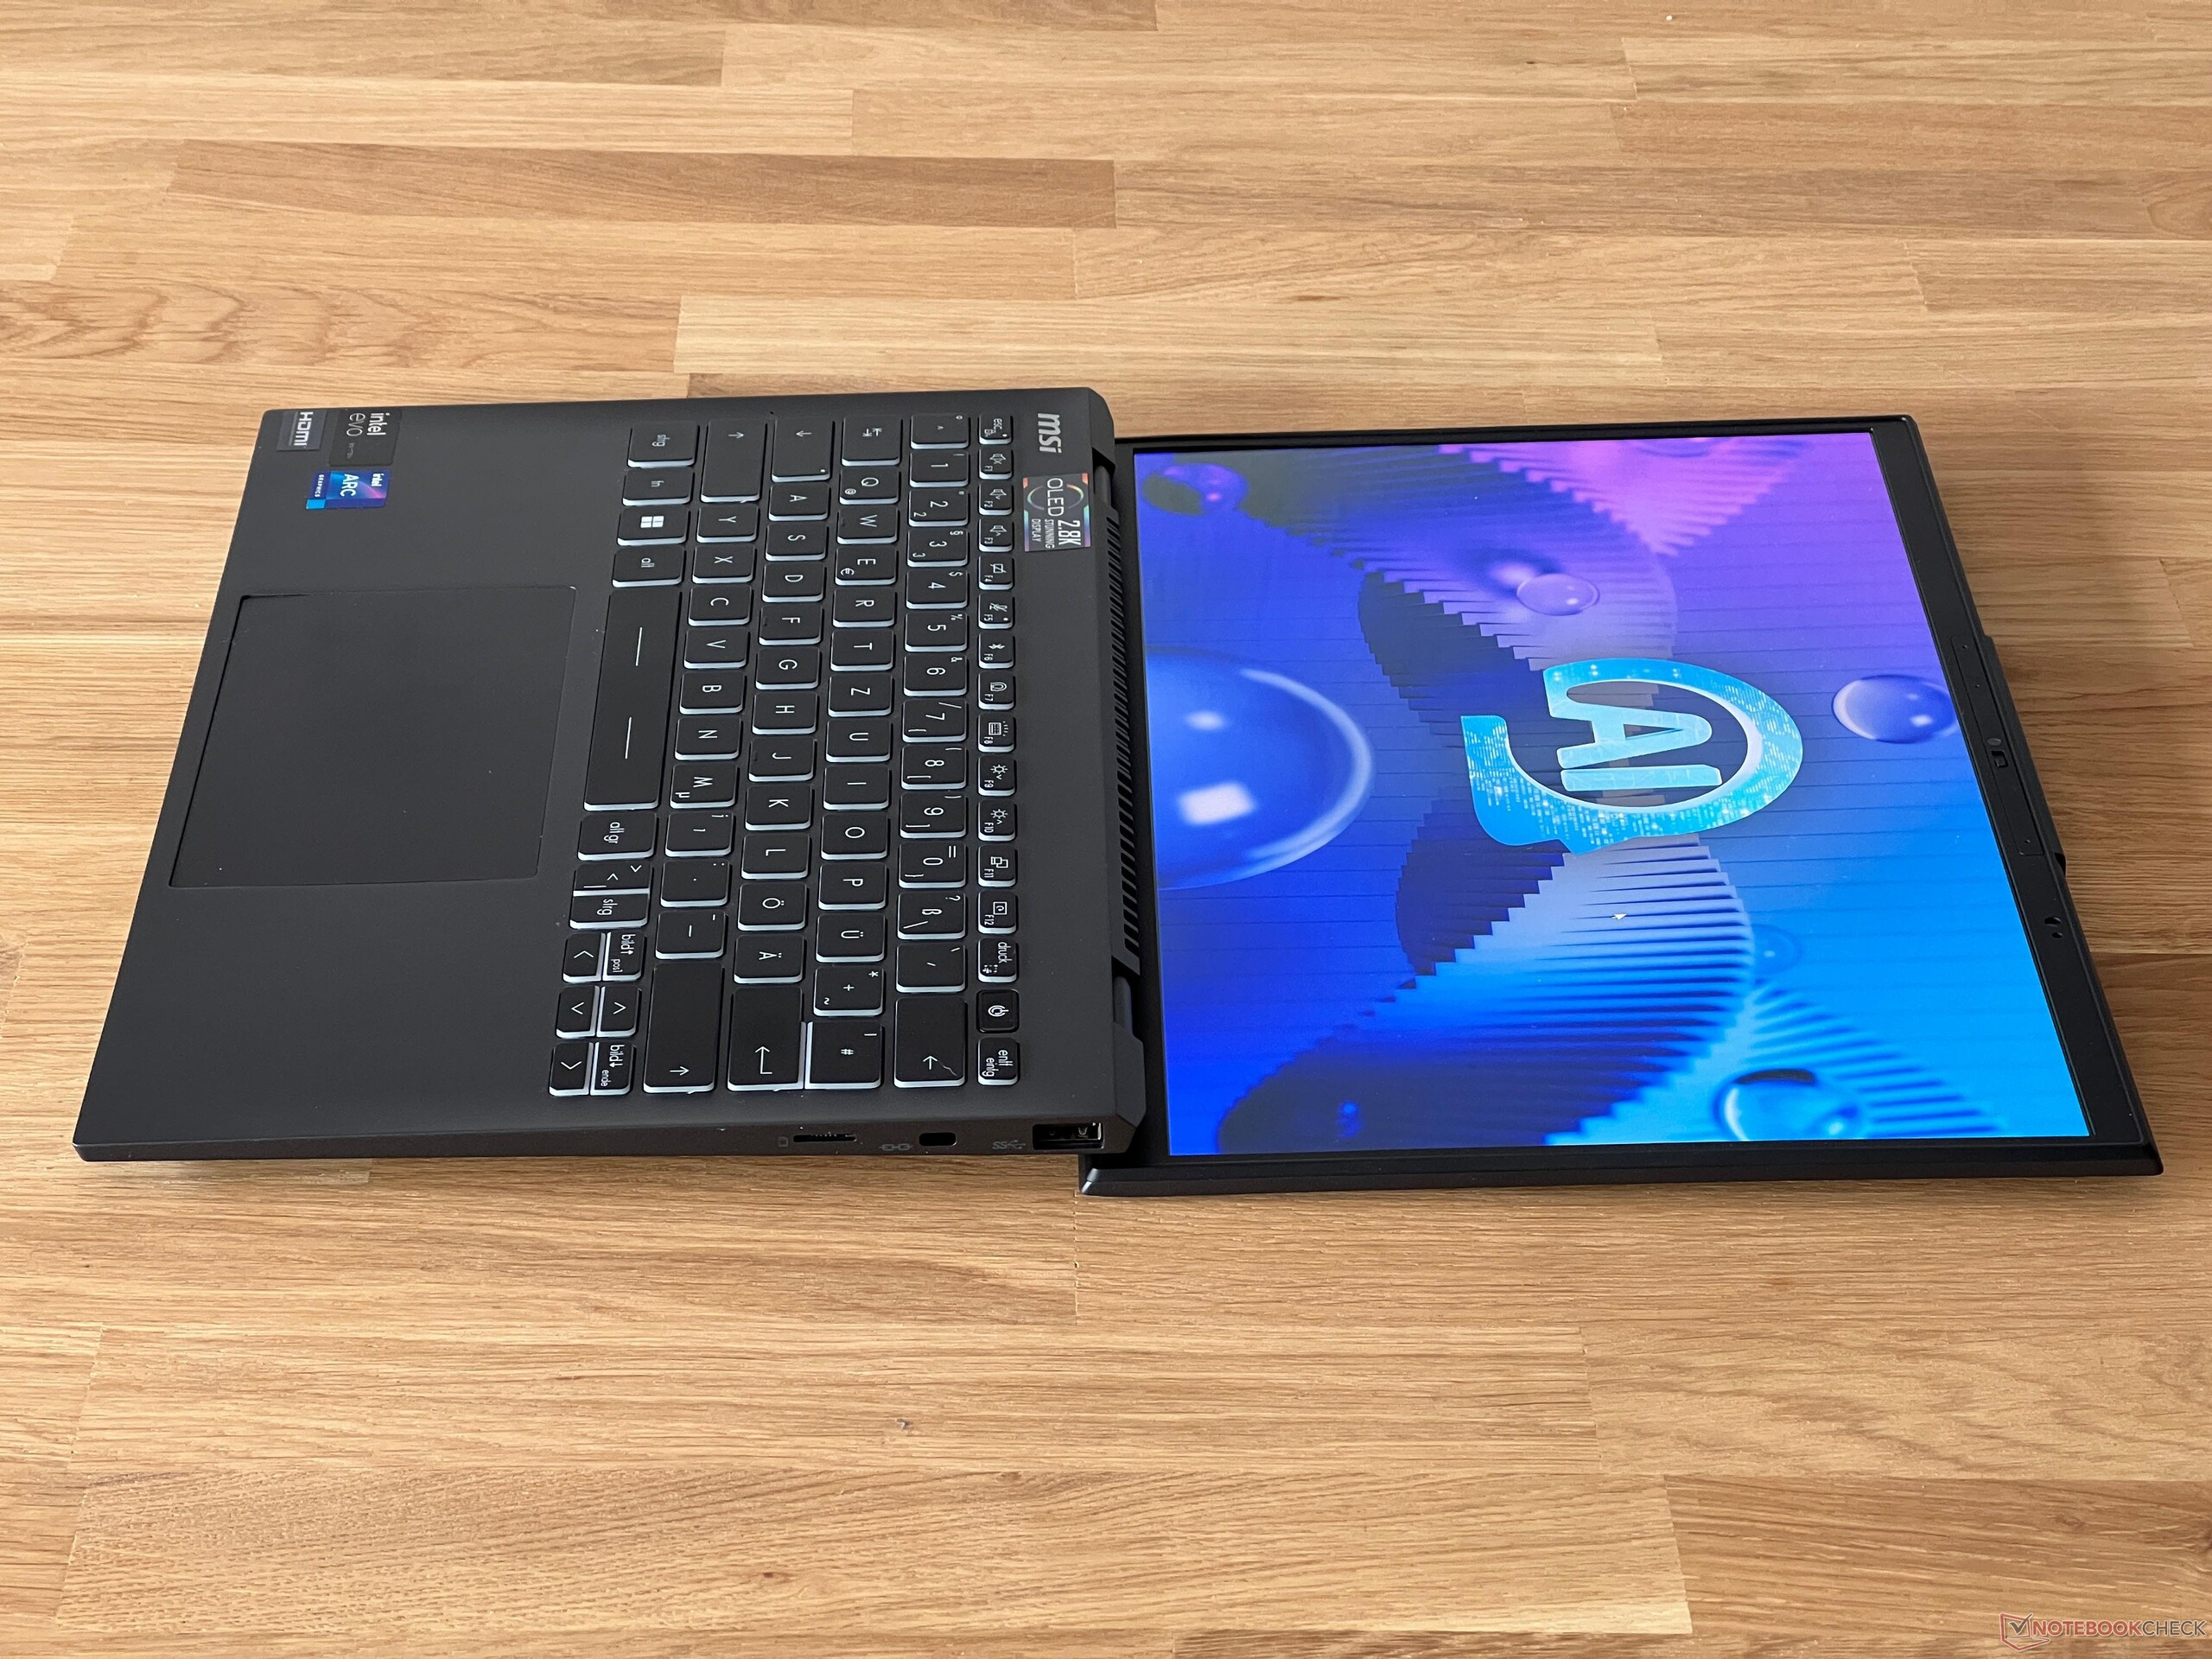
İyi inşa edilmiştir, ancak bazı stabilite sorunlarından muzdariptir. Kapağı açtığınızda ana ünitenin arka kısmı hafifçe kalkıyor ve klavyenin orta kısmı biraz baskı uygulandığında içe doğru bükülebiliyor. Yine de normal şekilde yazarken bu çok büyük bir sorun olmayacaktır. Ana üniteyi hafifçe döndürürseniz, dizüstü bilgisayar fark edilir gıcırtı sesleri çıkarır. Ekran menteşeleri çok sıkı bir şekilde ayarlanmış ve kapağın sallanmasını etkili bir şekilde önlüyor - bu sadece tek elle açmayı biraz zorlaştırıyor. Maksimum açılma açısı 180 derecedir ve kapağın kendisi çok sağlamdır.
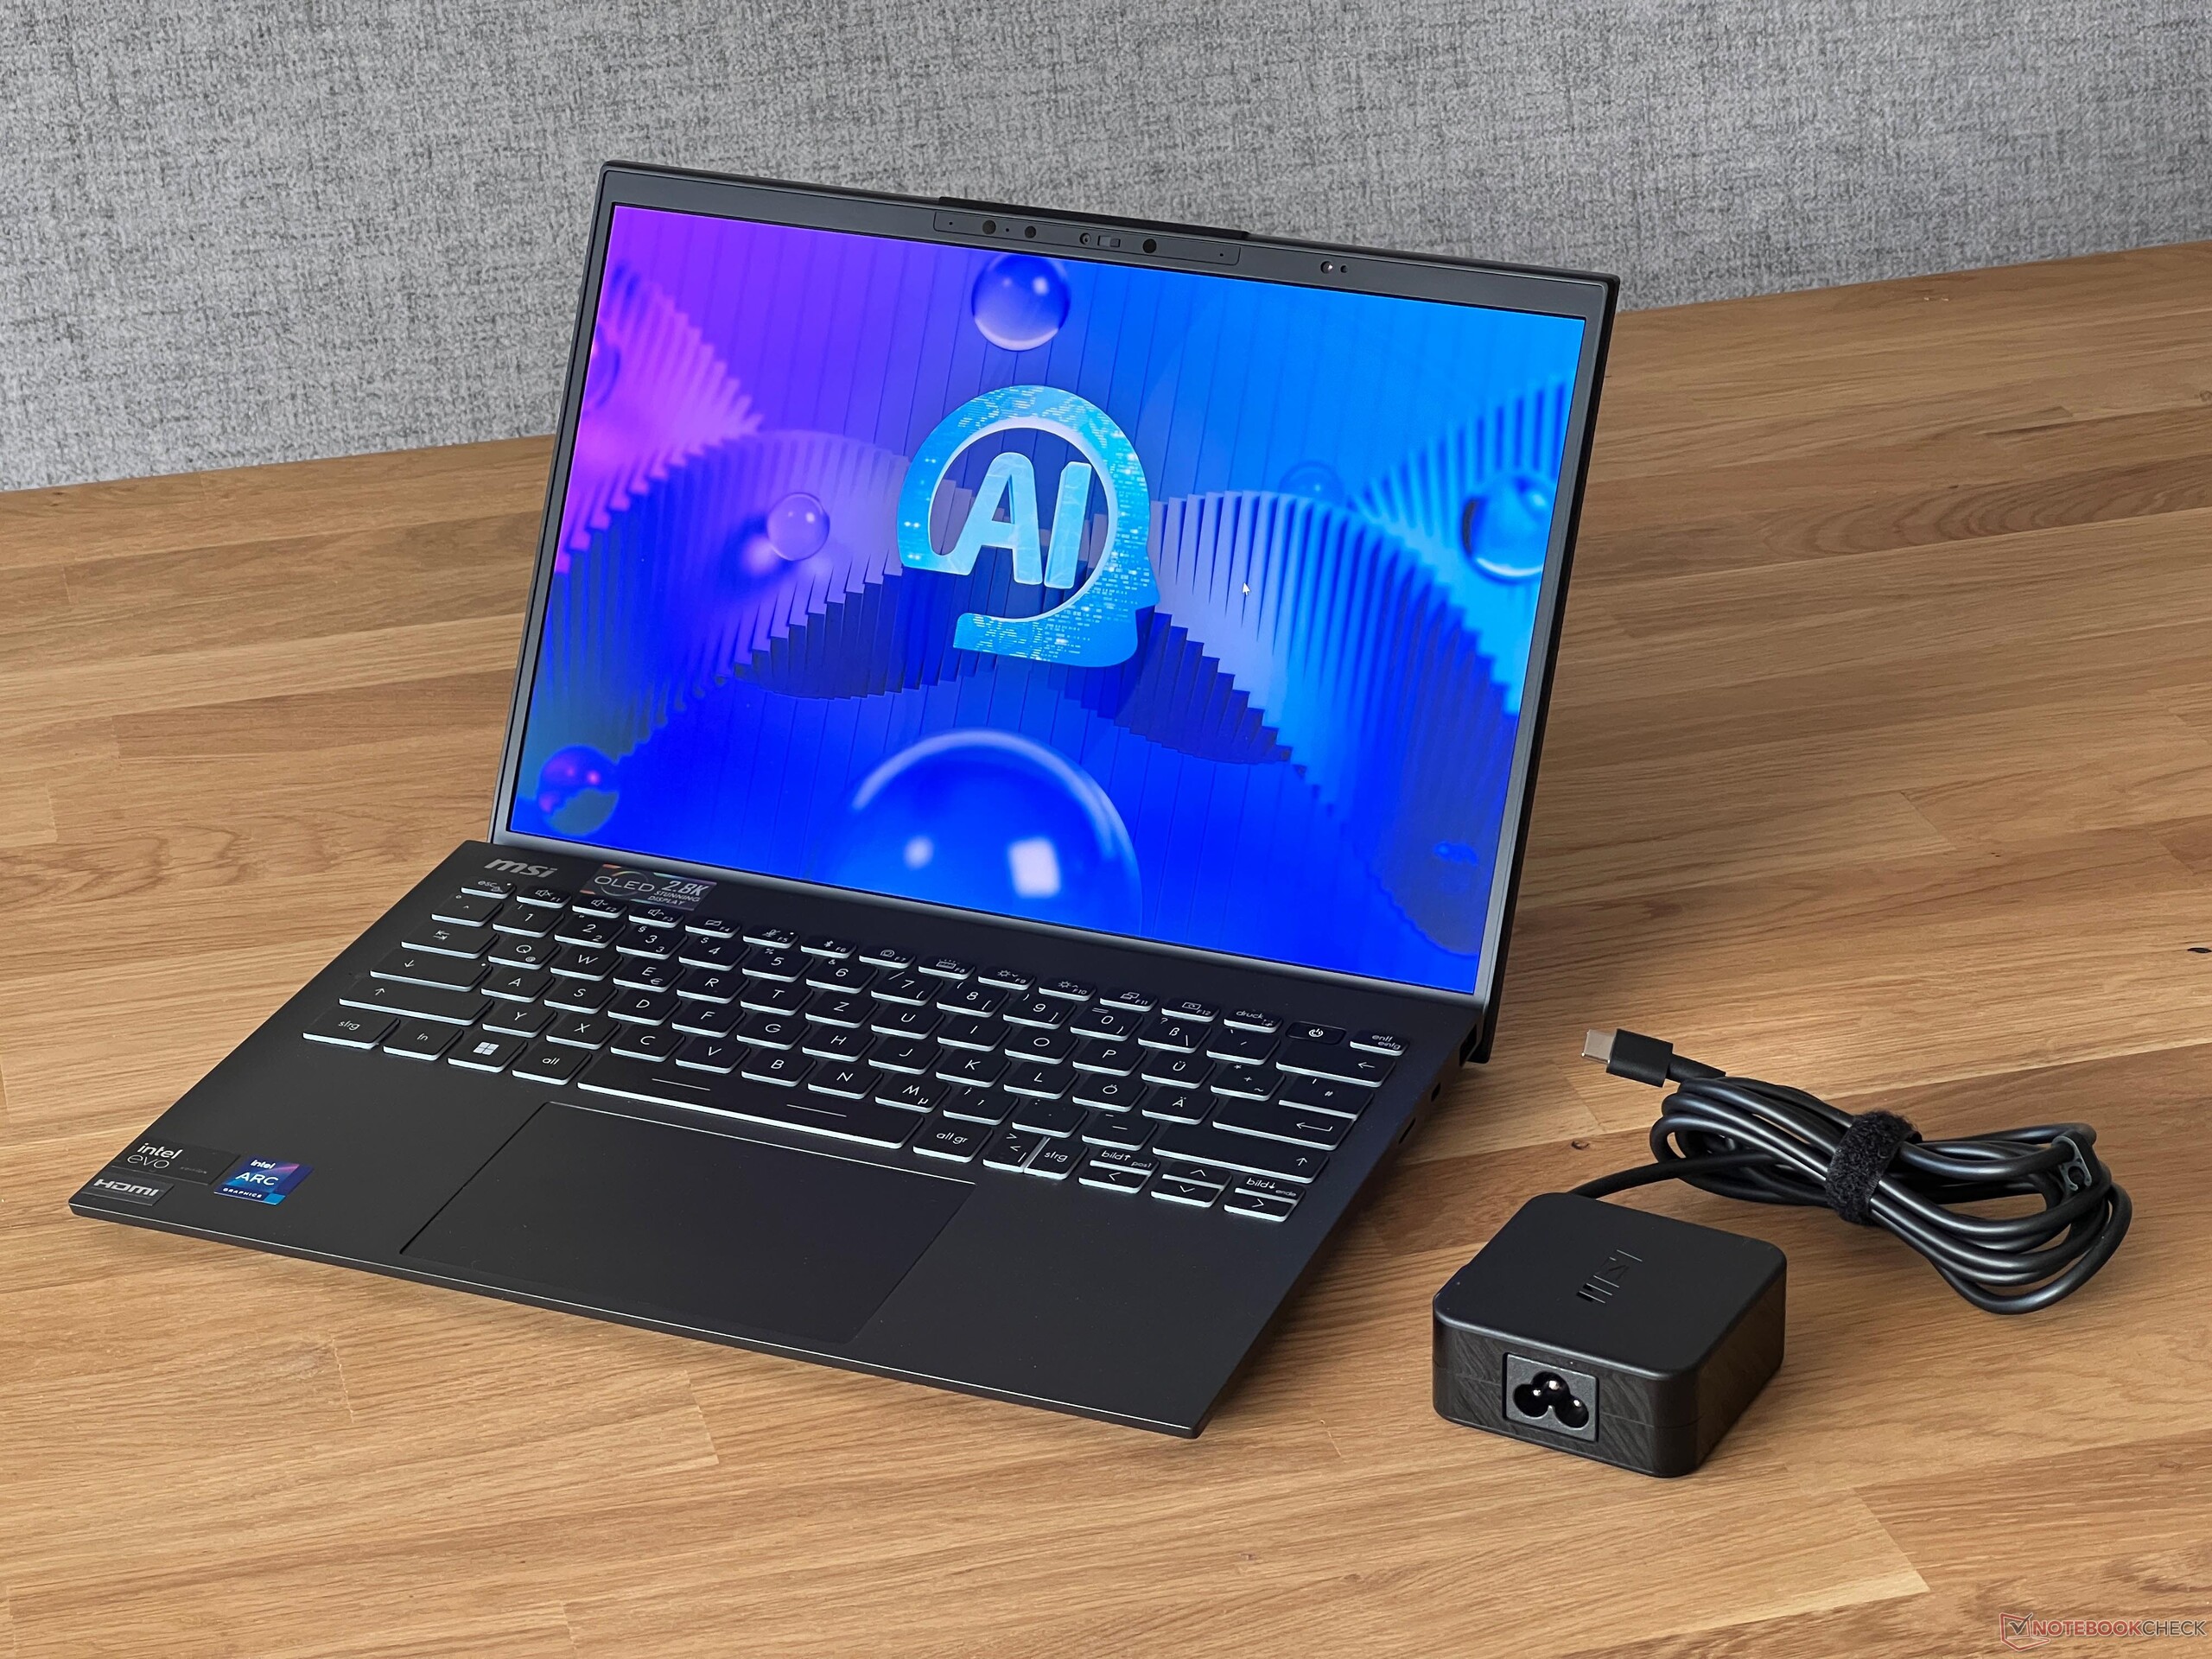
1 kilogramın altındaki ağırlığı ile Prestige 13 son derece hafiftir, ancak aynı şey diğer karşılaştırma cihazları için de söylenebilir. Ayak izleri söz konusu olduğunda, rakipler de fazla yer kaplamıyor. Prestige herhangi bir çantada kolayca saklanabilir. MSI, 65 watt'lık kompakt bir güç kaynağı kullanıyor, ancak bu bir fişli güç kaynağı değil, bu yüzden 341 gram ile oldukça ağır.
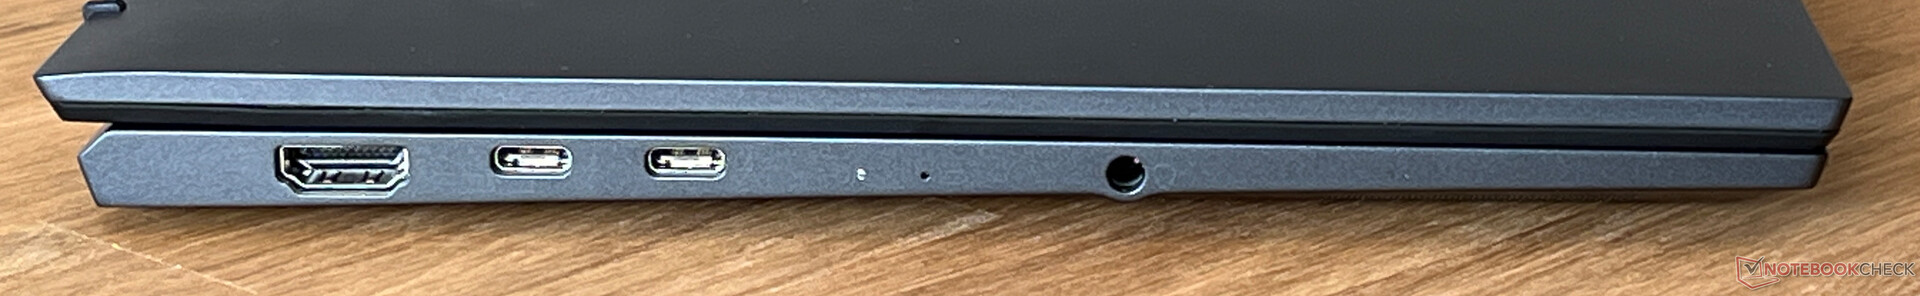
Bağlanabilirlik - Thunderbolt 4 ve HDMI 2.1 özellikli MSI
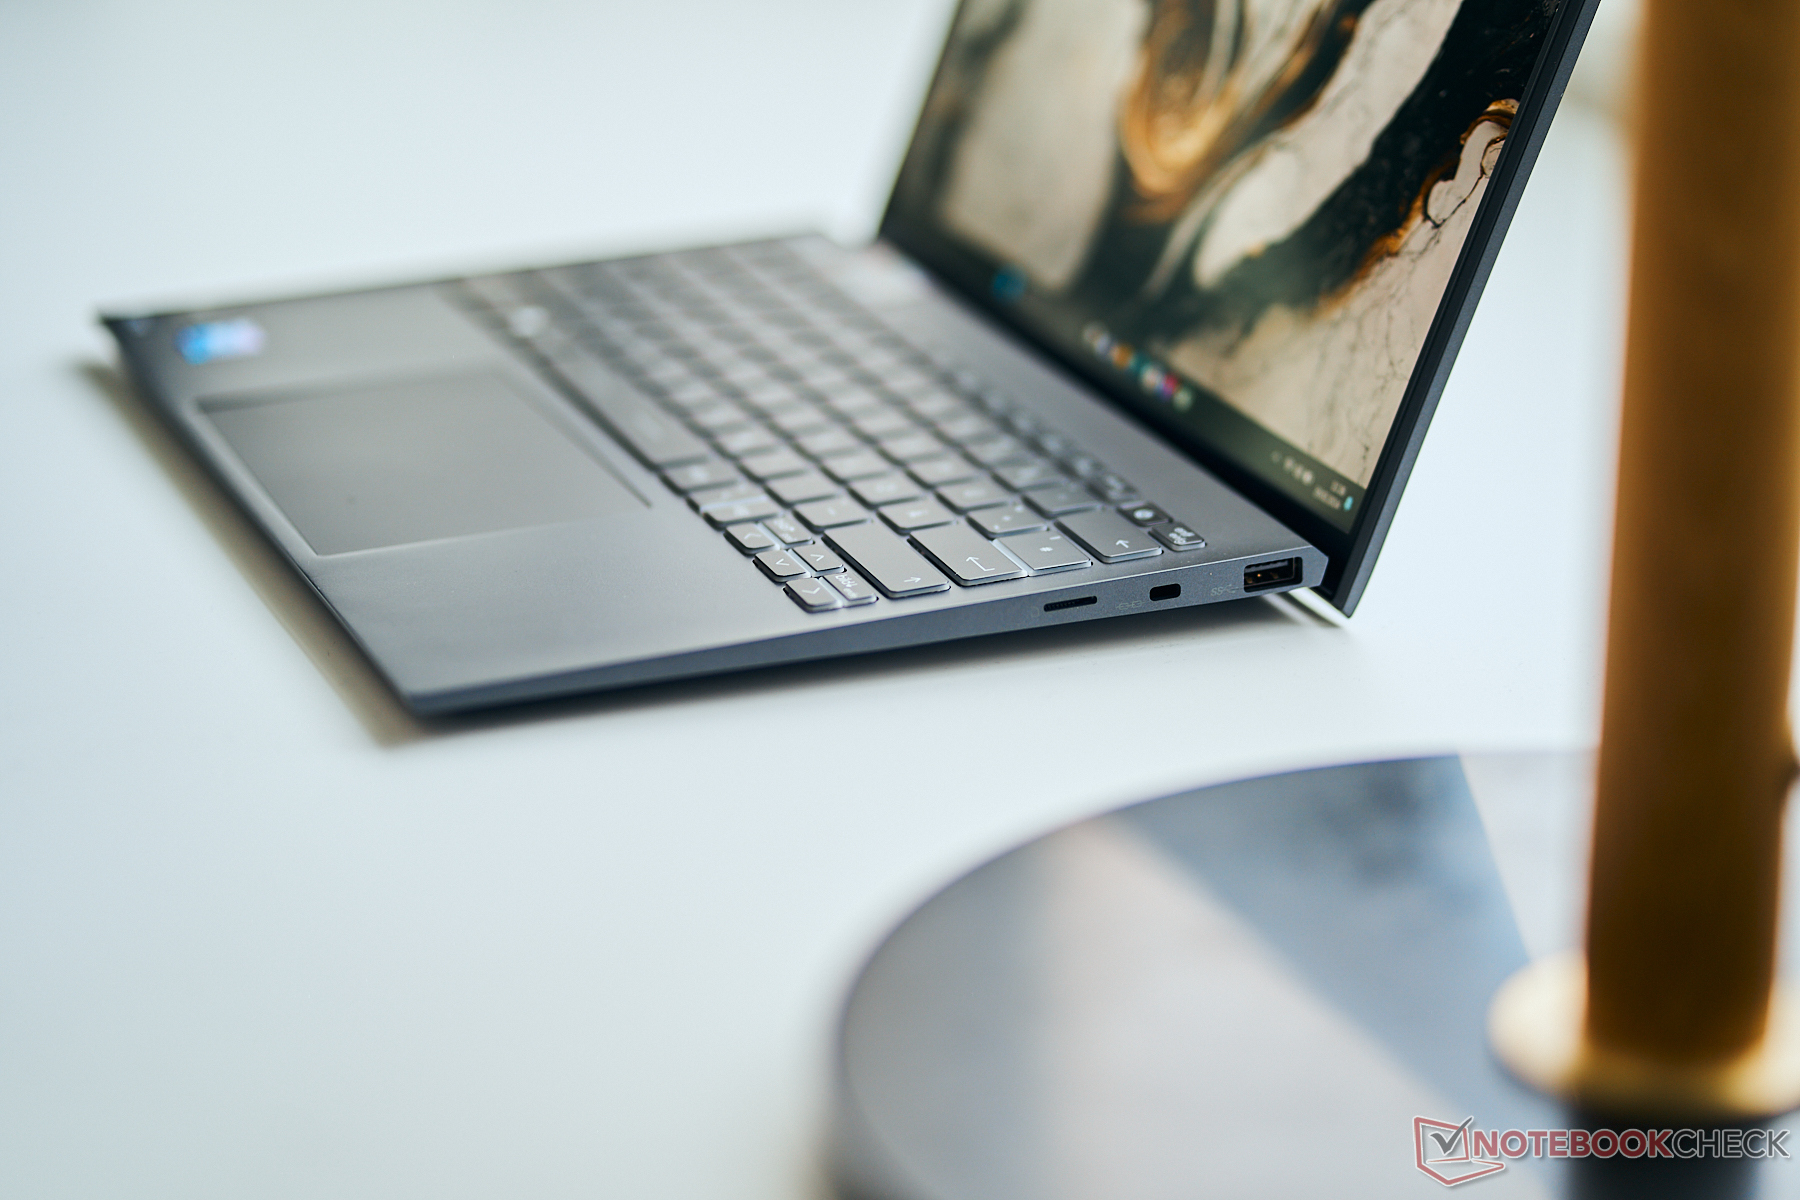
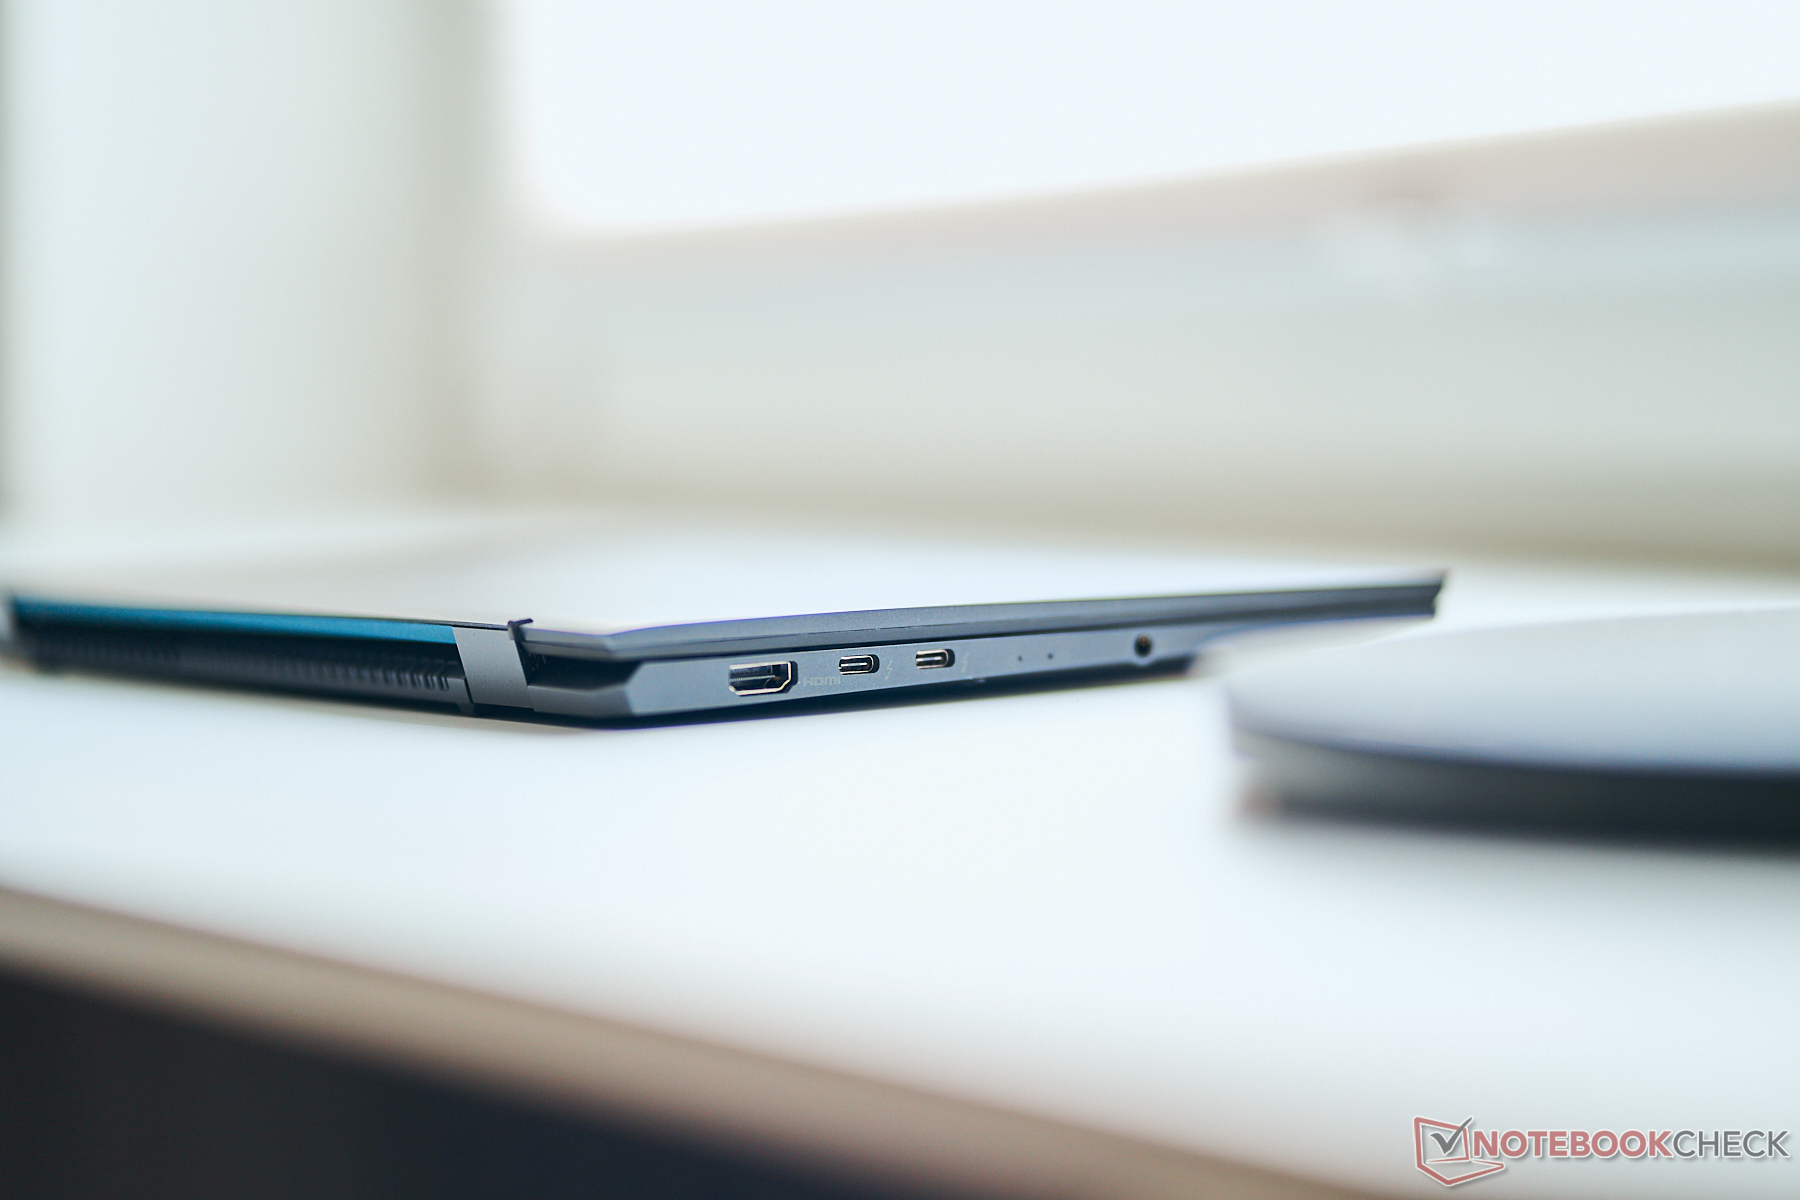
Prestige 13 kompakt olabilir, ancak USB-C, USB-A ve tam özellikli bir HDMI çıkışı da dahil olmak üzere tüm önemli bağlantılara sahiptir. Bağlantı noktalarının dizüstü bilgisayara yayılmış olmasını da seviyoruz ve eleştirecek fazla bir şeyimiz yok.
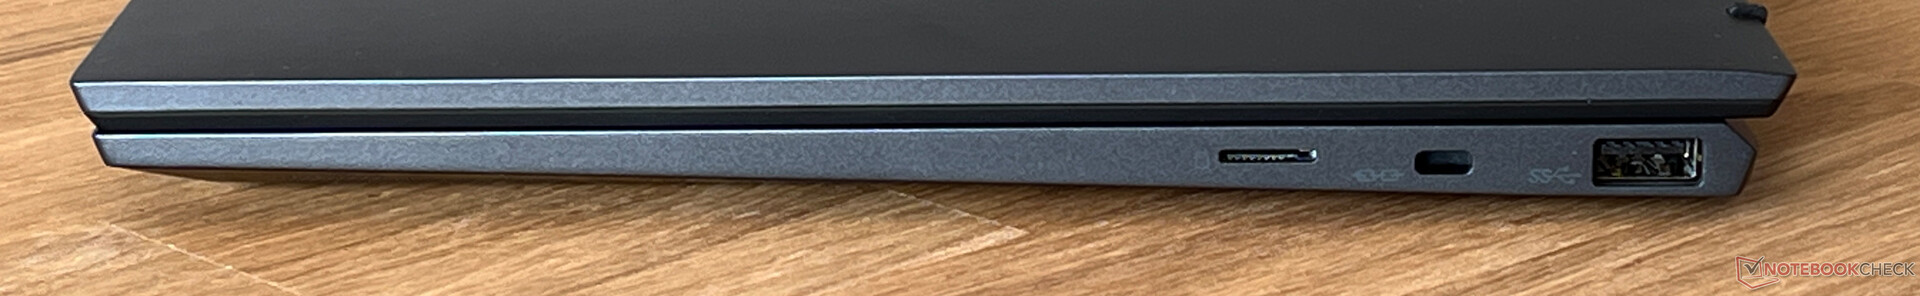
SD kart okuyucu
Cihazın sağ tarafında, referans kartımızla (Angelbird AV Pro V60) birlikte çok iyi aktarım hızlarına ulaşan bir microSD kart okuyucu (yaylı mekanizma) bulunuyor. Görüntüleri kopyalarken ortalama 140 MB/sn'nin üzerinde ve maksimum 200 MB/sn'nin üzerinde bir hız kaydettik. Diğer karşılaştırma cihazlarının hiçbirinde kart okuyucu bulunmuyor.
| SD Card Reader | |
| average JPG Copy Test (av. of 3 runs) | |
| MSI Prestige 13 AI Evo (Angelbird AV Pro V60) | |
| Sınıf ortalaması Subnotebook (23.7 - 188, n=9, son 2 yıl) | |
| maximum AS SSD Seq Read Test (1GB) | |
| MSI Prestige 13 AI Evo (Angelbird AV Pro V60) | |
| Sınıf ortalaması Subnotebook (24.9 - 195, n=8, son 2 yıl) | |
İletişim
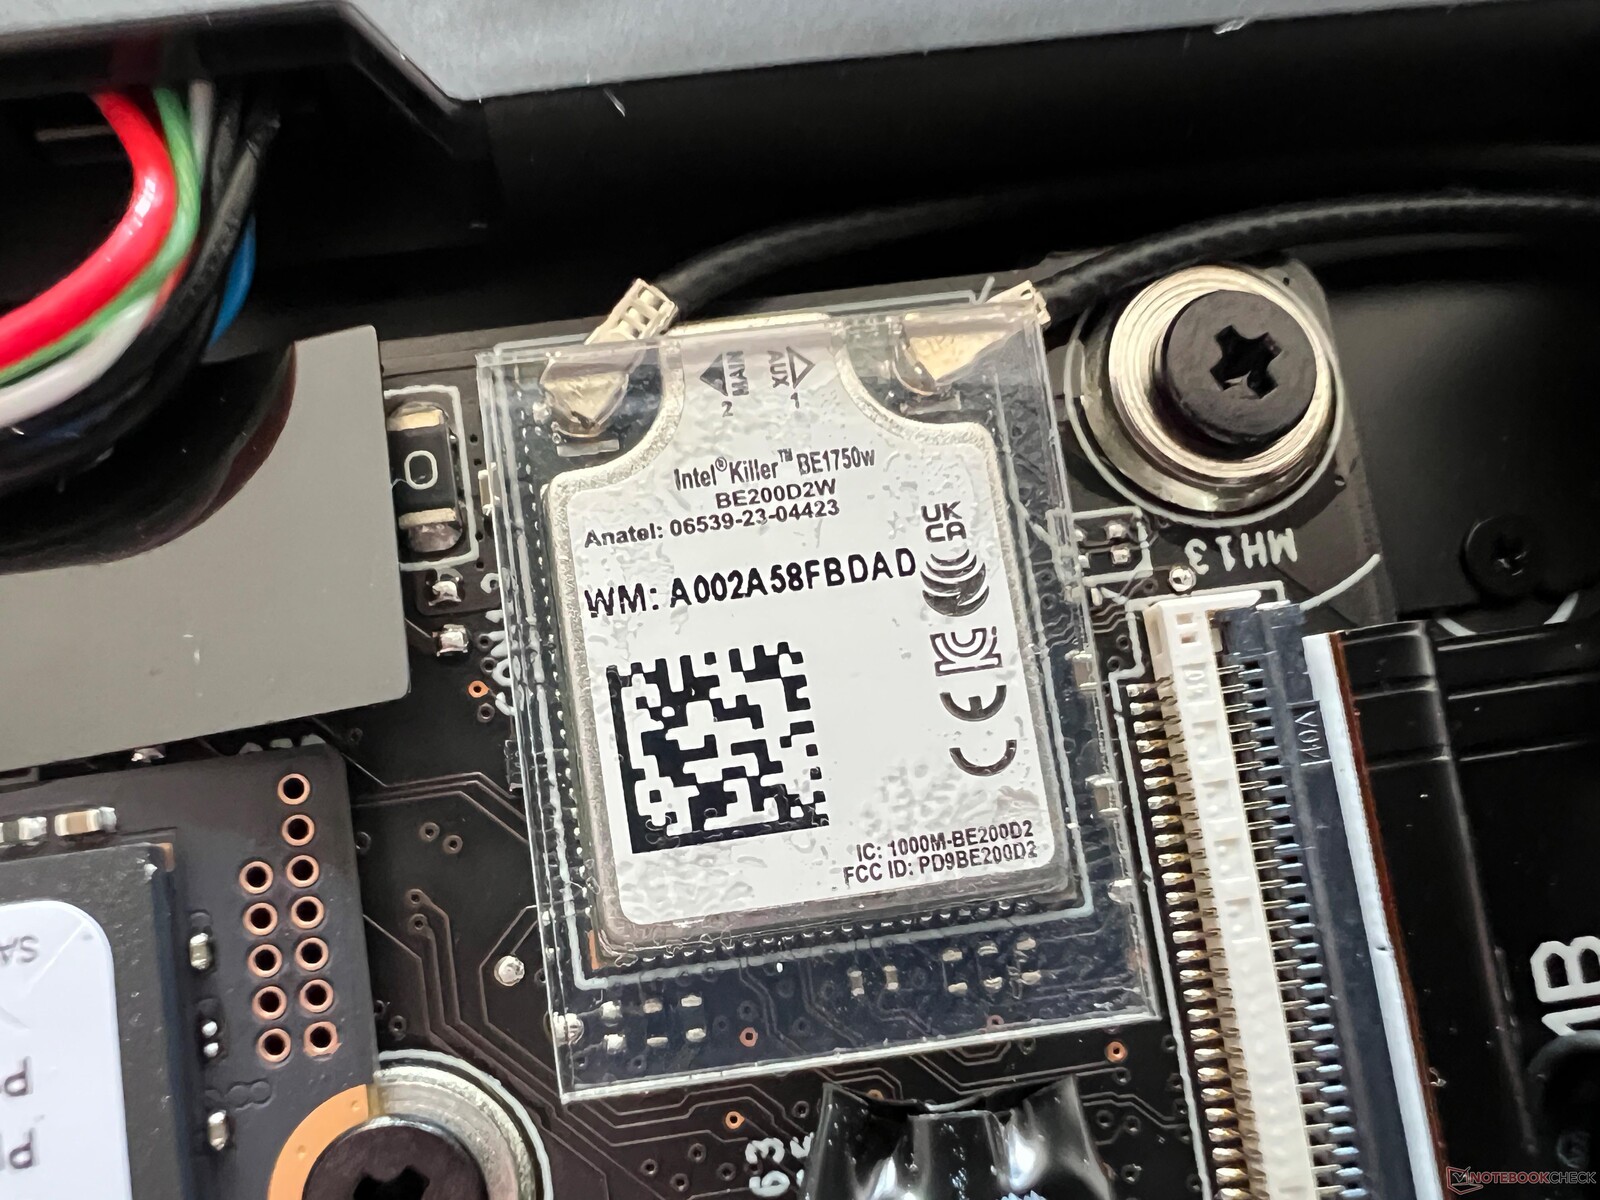
MSI, Intel'in yeni BE1750W (320 MHz) Wi-Fi 7 modülünü dizüstü bilgisayara taktı. Ne yazık ki, mevcut referans yönlendiricimizi kullanarak yeni standardı henüz kullanamıyoruz. Ancak, Wi-Fi 6 üzerinden aktarım hızları çok istikrarlı ve yüksekti.
| Networking | |
| MSI Prestige 13 AI Evo | |
| iperf3 transmit AXE11000 | |
| iperf3 receive AXE11000 | |
| Lenovo ThinkPad X1 Nano Gen 3 | |
| iperf3 transmit AXE11000 | |
| iperf3 receive AXE11000 | |
| iperf3 transmit AXE11000 6GHz | |
| iperf3 receive AXE11000 6GHz | |
| Dell Latitude 13 7340 i5-1345U | |
| iperf3 transmit AXE11000 | |
| iperf3 receive AXE11000 | |
| iperf3 transmit AXE11000 6GHz | |
| iperf3 receive AXE11000 6GHz | |
| HP Dragonfly G4 | |
| iperf3 transmit AXE11000 | |
| iperf3 receive AXE11000 | |
| iperf3 transmit AXE11000 6GHz | |
| iperf3 receive AXE11000 6GHz | |
| Asus ZenBook S13 OLED UX5304 | |
| iperf3 transmit AXE11000 | |
| iperf3 receive AXE11000 | |
Web kamerası
1080p web kamerası, iyi aydınlatma koşullarında iyi görüntü kalitesi sunar ve mekanik bir kapağa sahip değildir. Ayrıca Windows stüdyo efektlerini (yumuşak odak arka planı, göz teması, izleme) destekler. Ek olarak, Windows Hello aracılığıyla yüz tanıma için kurulu bir IR kamerası vardır.


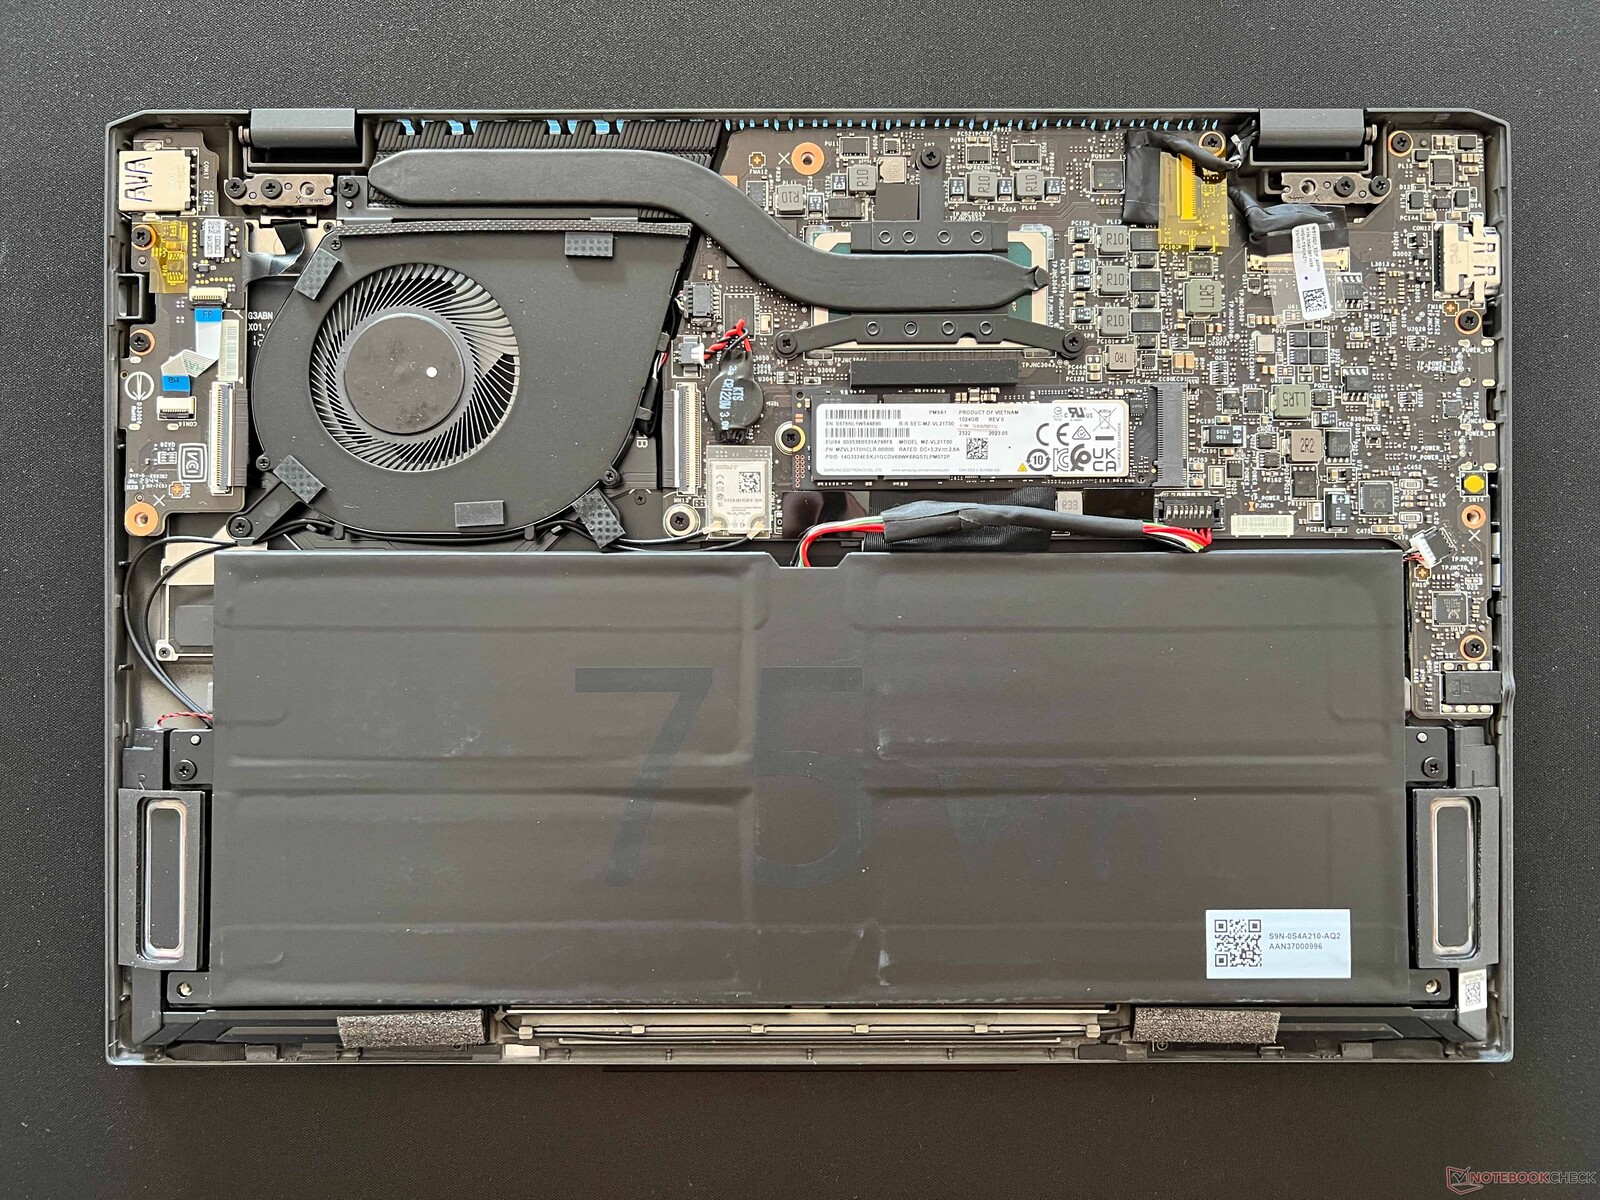
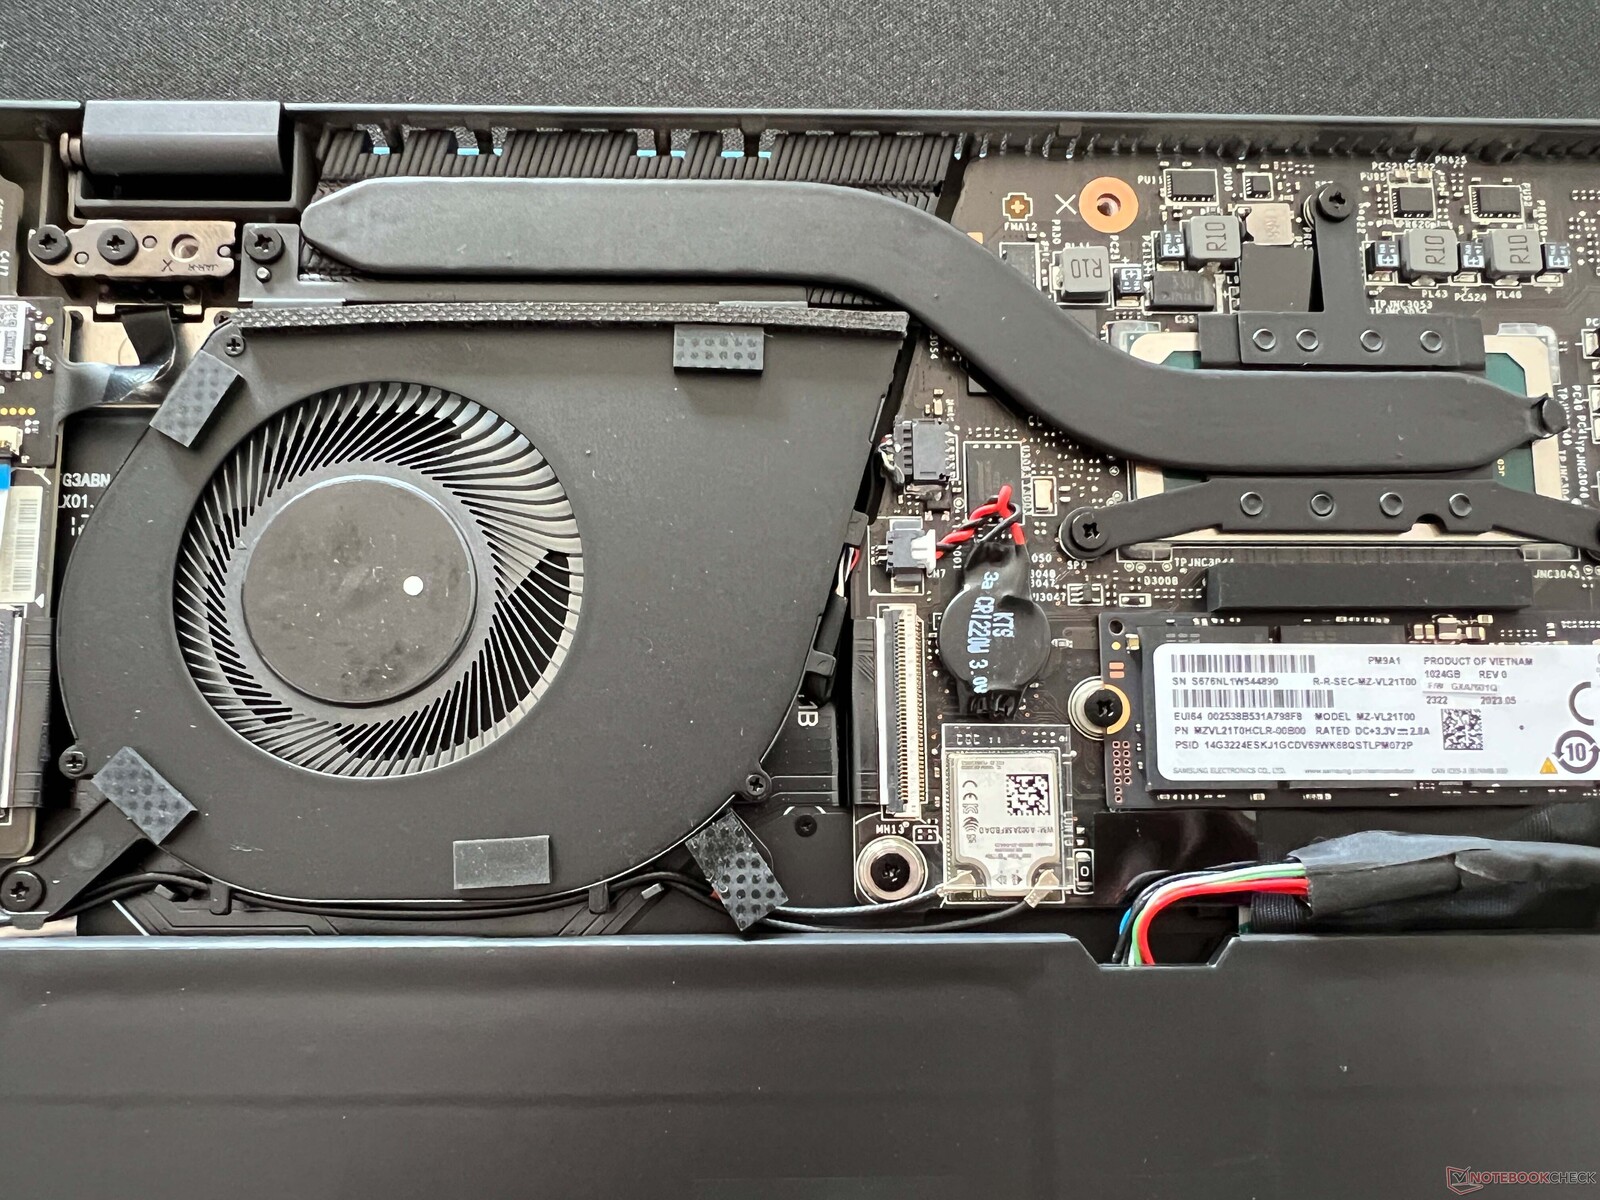
Bakım
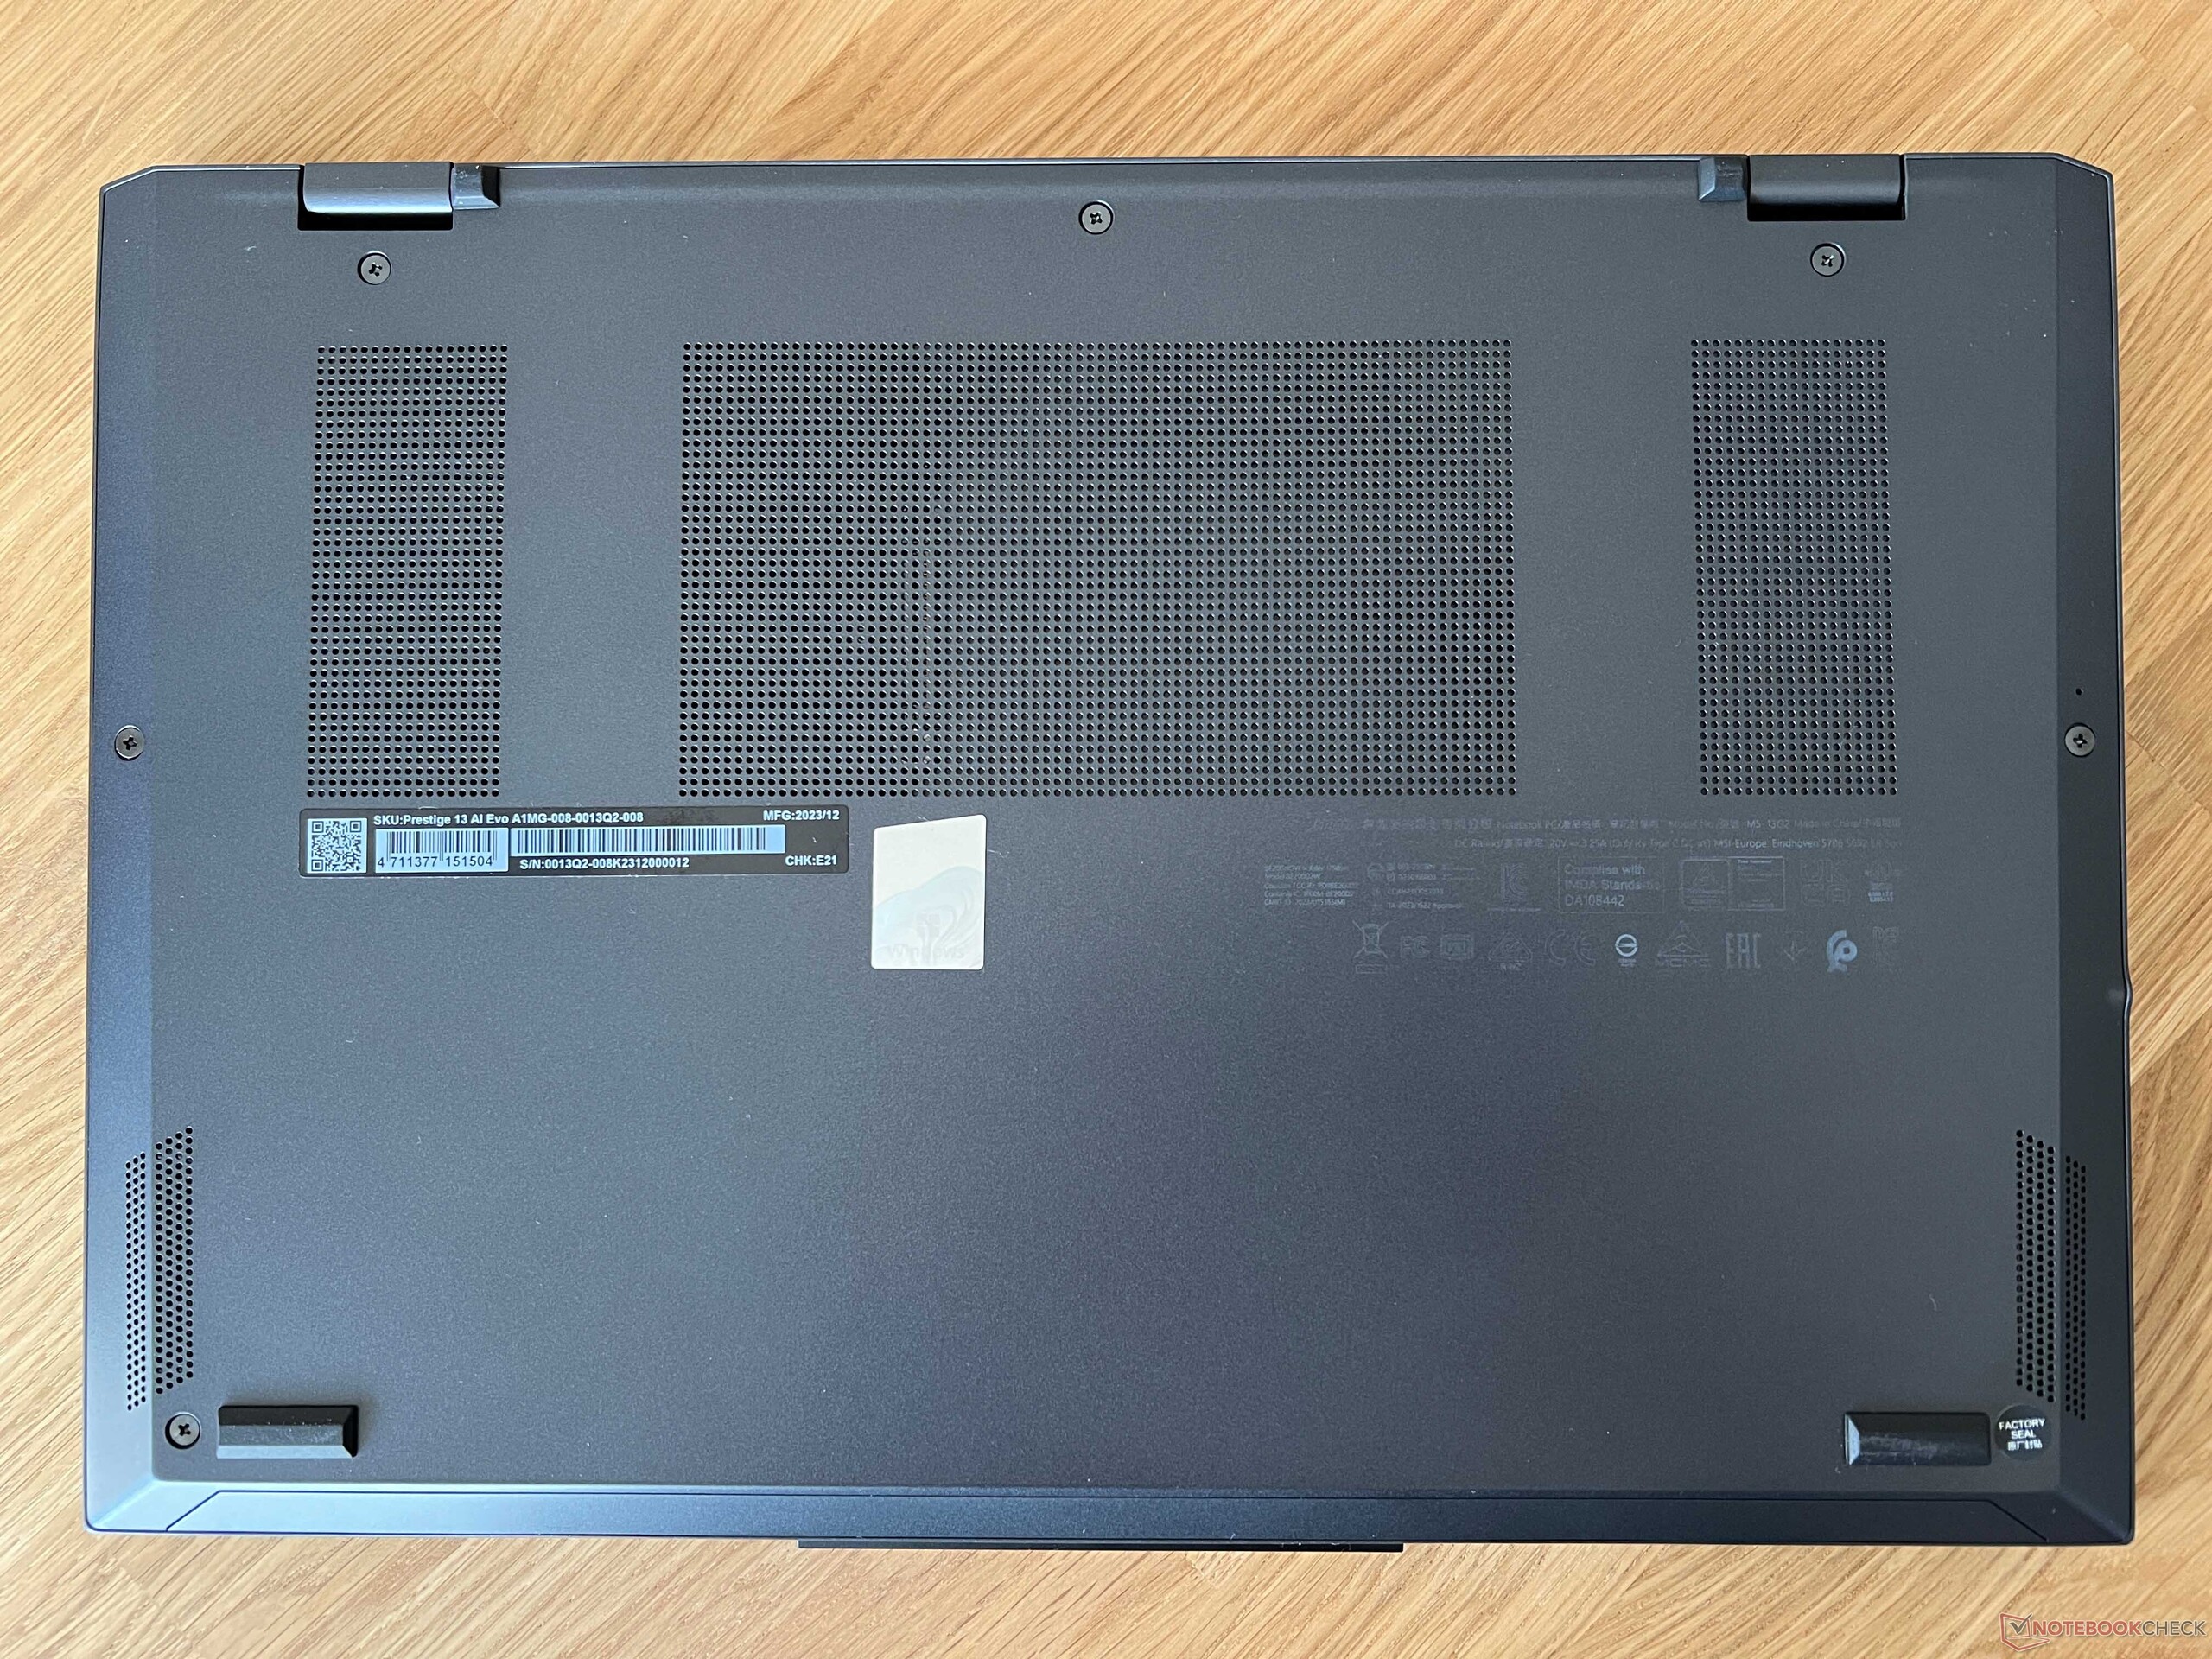
Kasanın alt kısmı normal çapraz başlı vidalarla sabitlenmiştir ve kolayca çıkarılabilir. Böylece fan temizlenebilir ve SSD ile pil değiştirilebilir. Öte yandan diğer tüm bileşenler lehimlenmiştir. Buna RAM ve WLAN modülleri de dahildir.
Giriş aygıtları - Küçültülmüş klavye
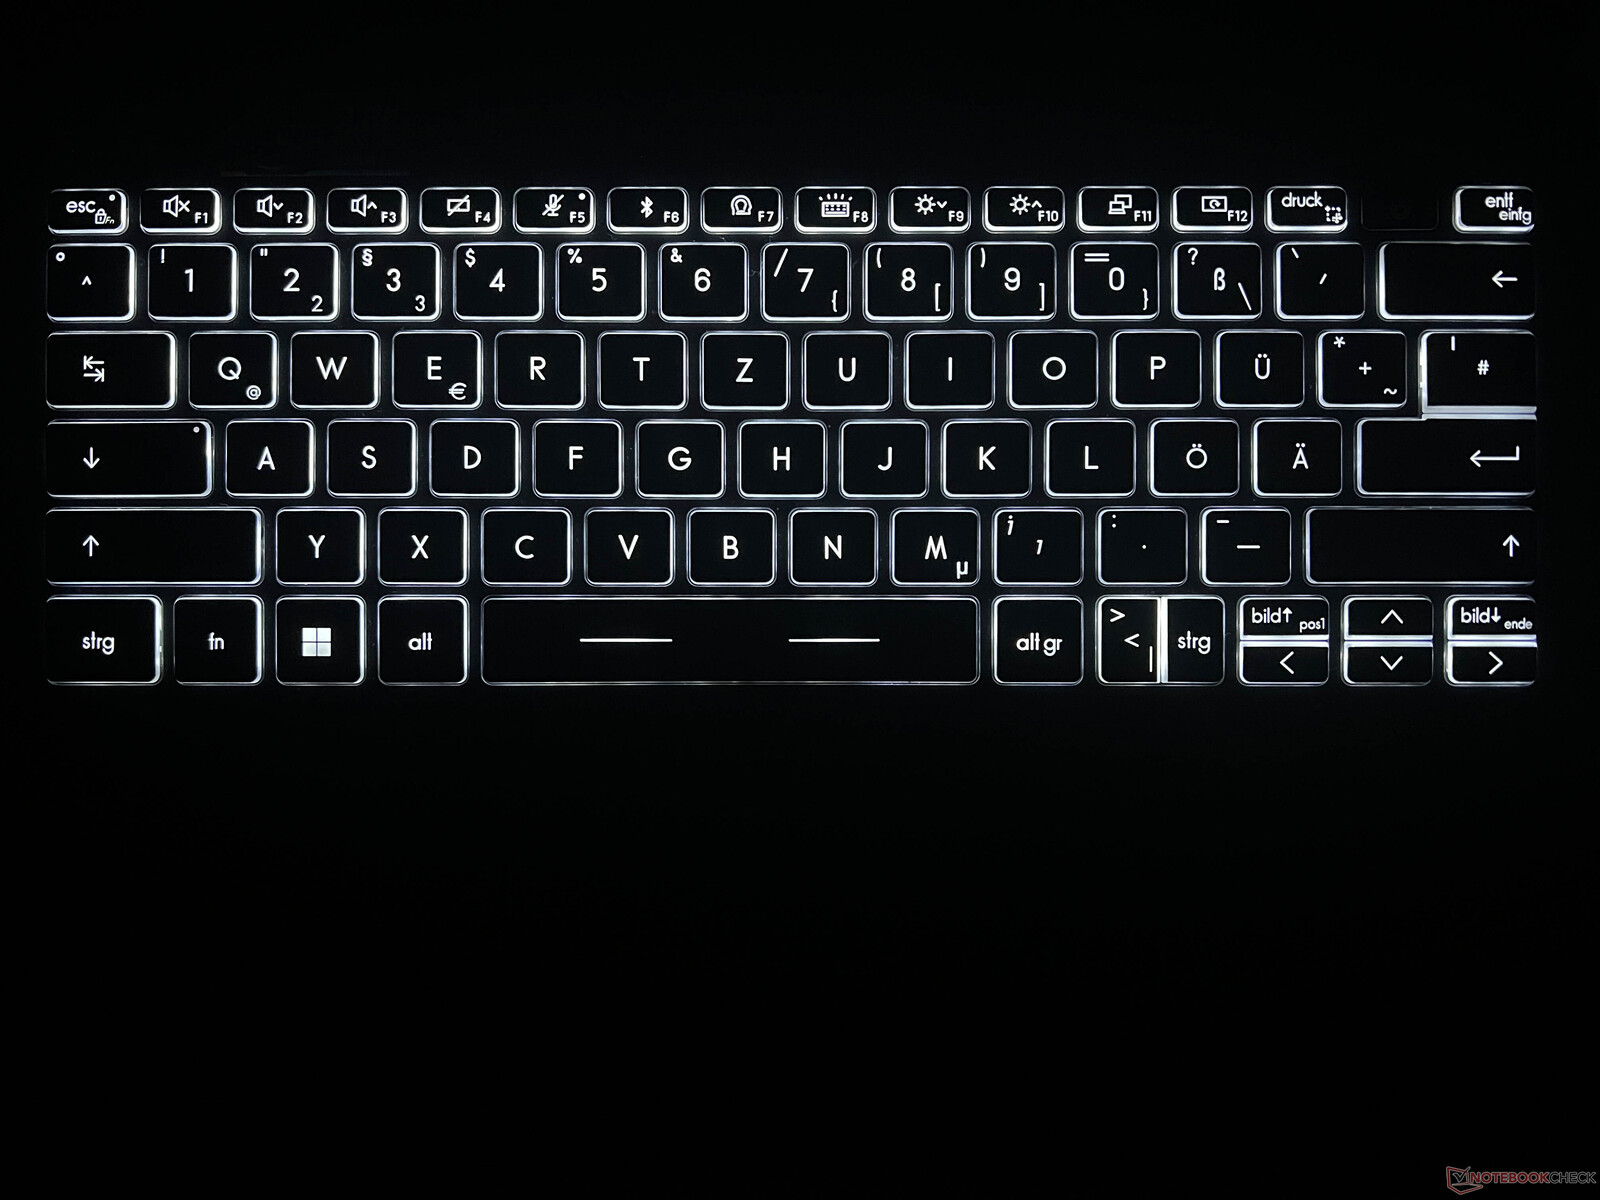
Siyah klavye üzerinde yazmak ortalama bir his veriyor. Mekanikler hassas ancak tuşlar çok yüksek değil (17 mm genişlik, 1,4 mm yükseklik), buna ilk başta alışmanız gerekebilir. Düzeni genel olarak oldukça sıkışık hissettiriyor ama en azından MSI özel resim yukarı / resim aşağı tuşları yerleştirmiş. Güç düğmesi (parmak izi tarayıcısı dahil) sağ üstte yer alıyor ve kasanın içinde daha derine oturuyor, yani kolayca hissedebiliyorsunuz. Silme tuşu en sağda yer alıyor. Klavyenin beyaz arka aydınlatması üç yoğunluk seviyesine sahiptir.
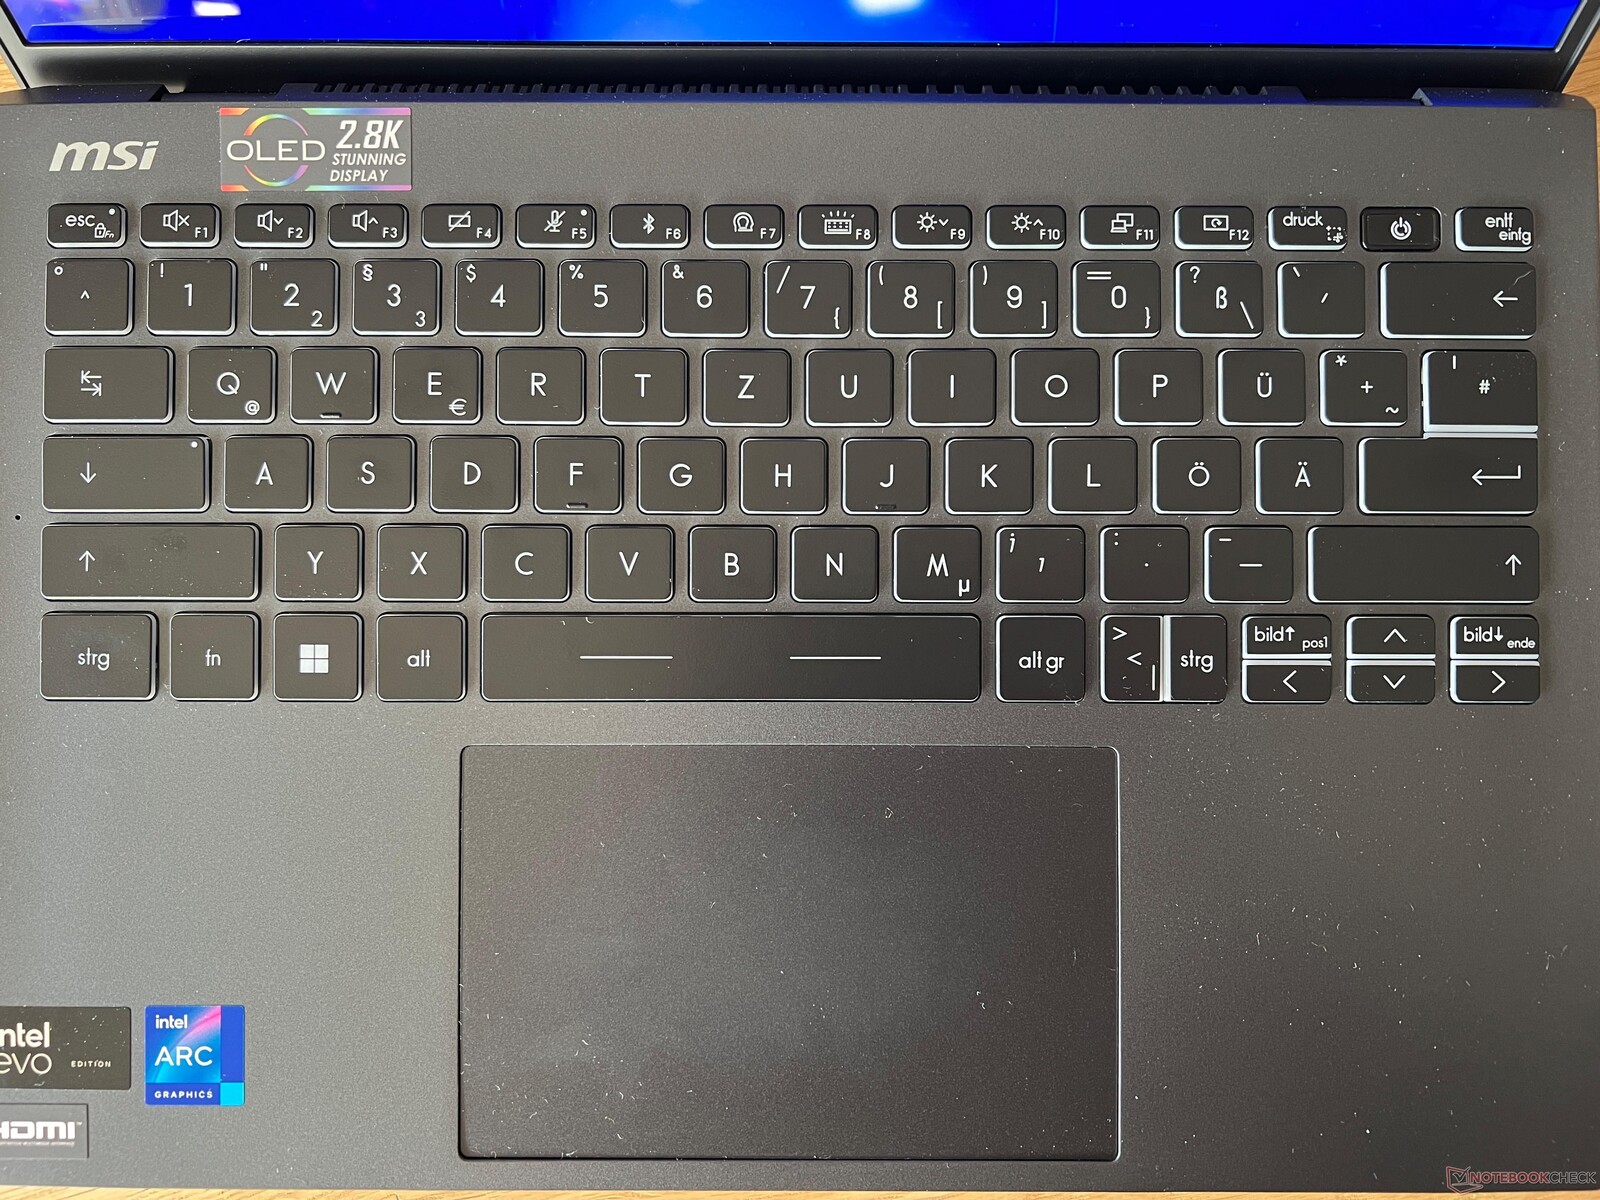
Tıklama yüzeyi (12 x 7,5 cm) güzel ve pürüzsüz ve kullanım sırasında hiçbir sorun yaşamadık. Pedin alt yarısı aşağı doğru bastırılabiliyor ve çıkardığı tıklama sesi çok eşit. Biraz daha sessiz olabilirdi ama hiçbir şekilde ucuz bir ses değil.
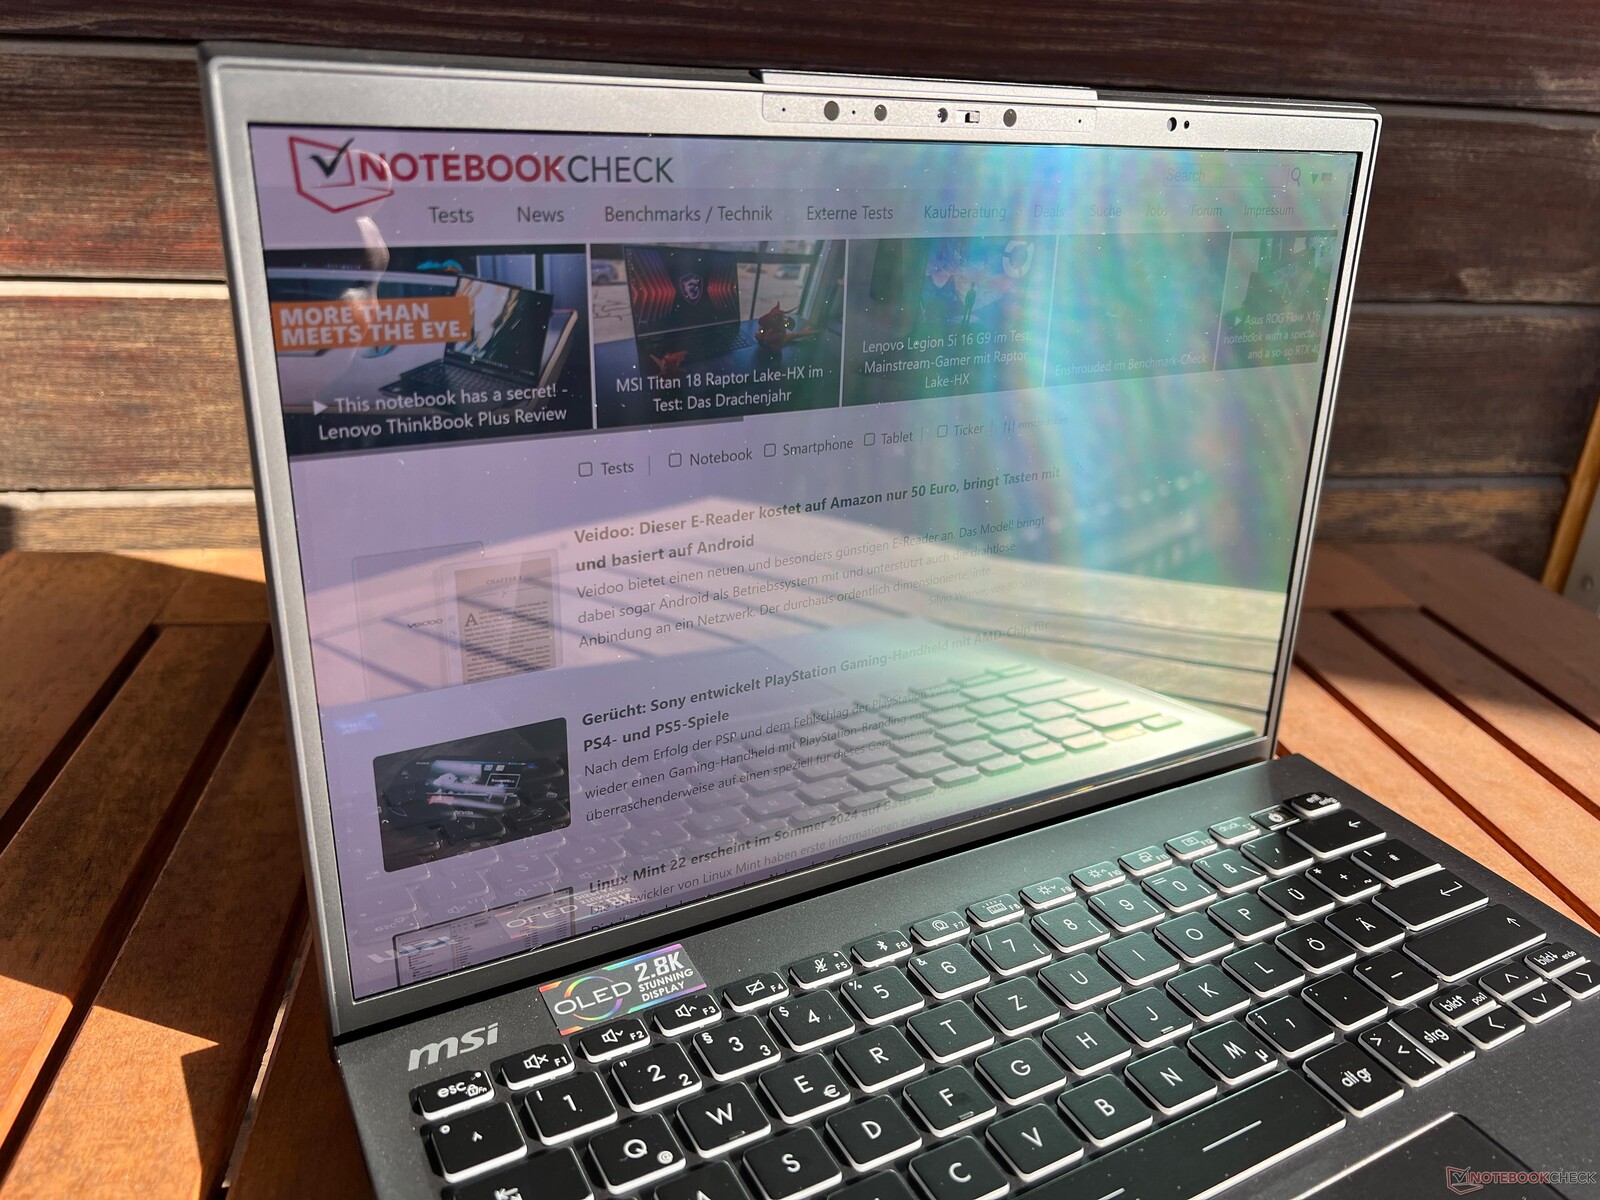
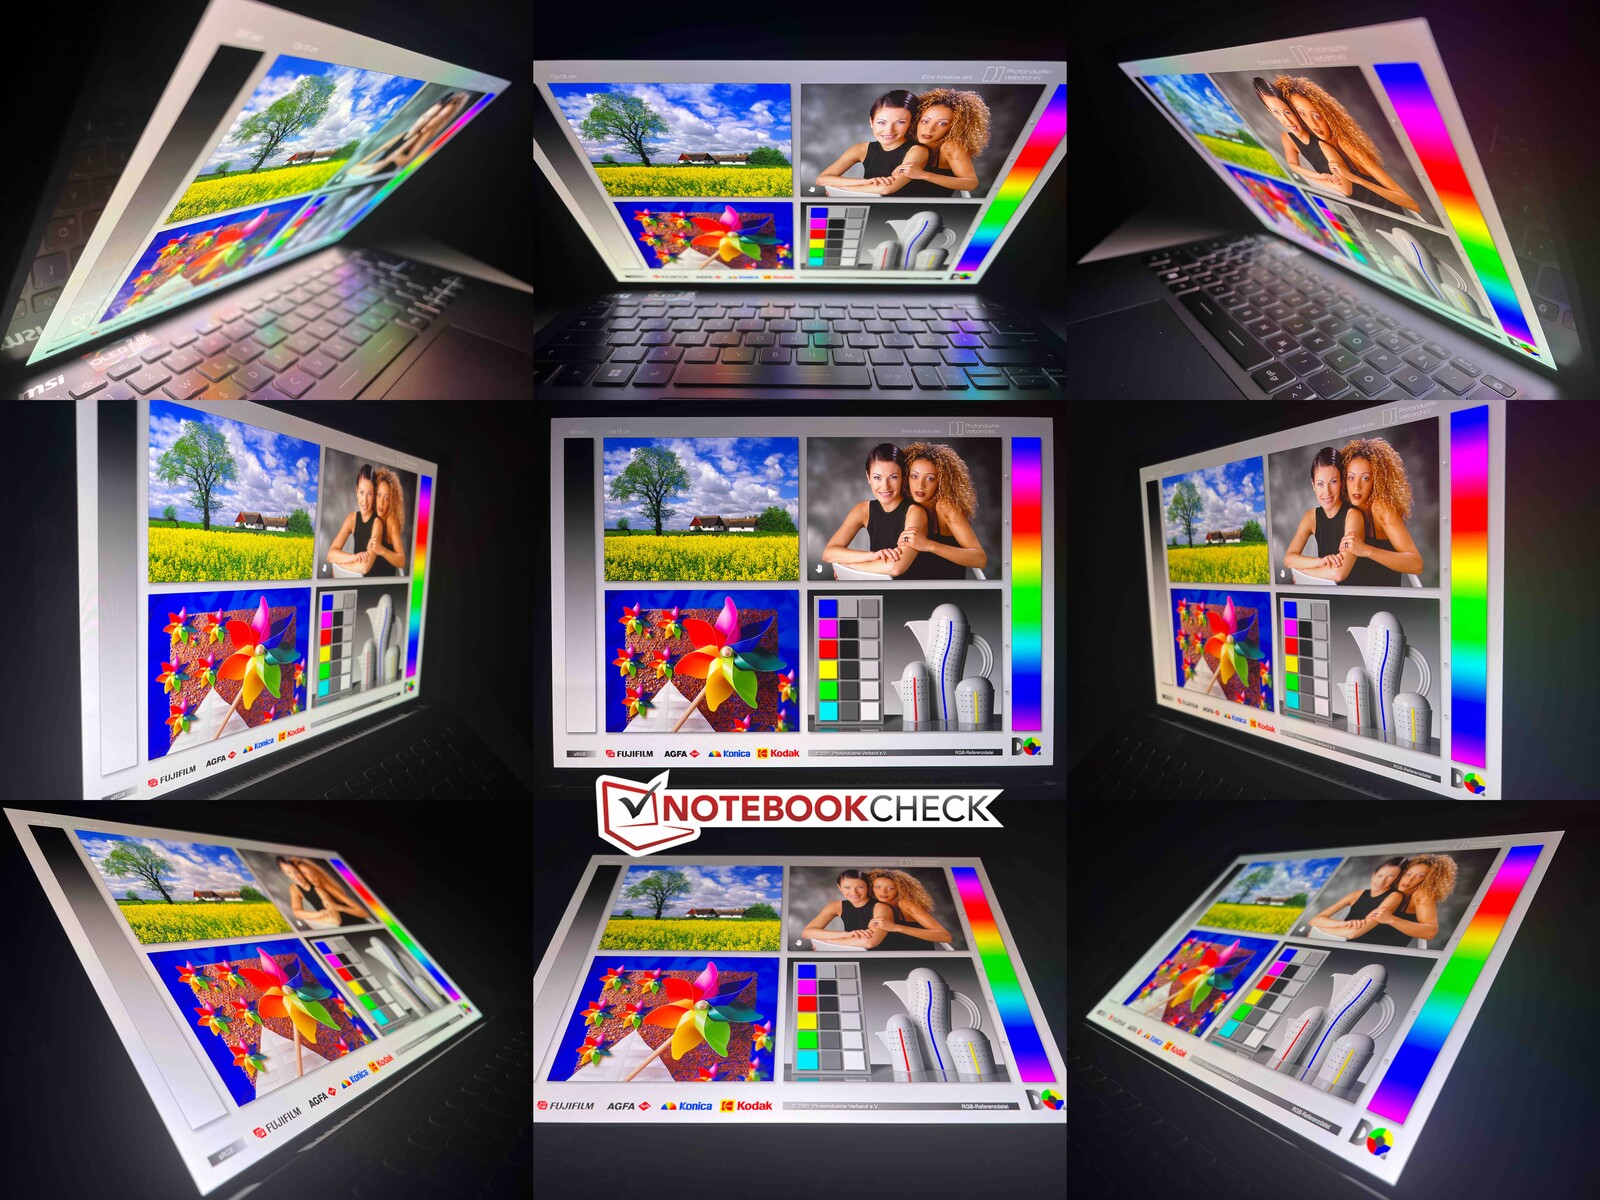
Ekran - Dokunmatik olmayan 2,8K OLED
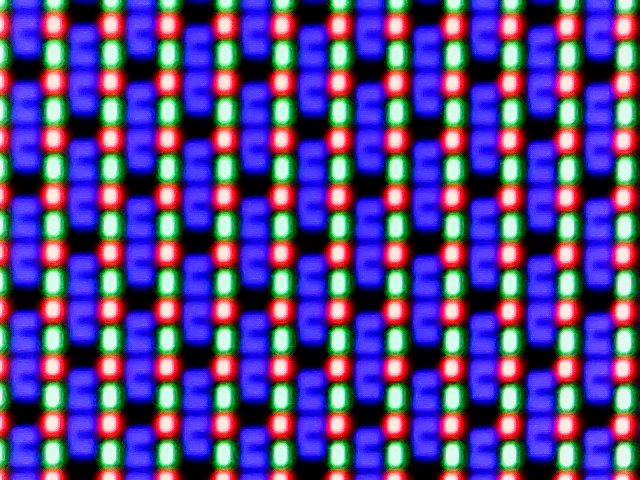
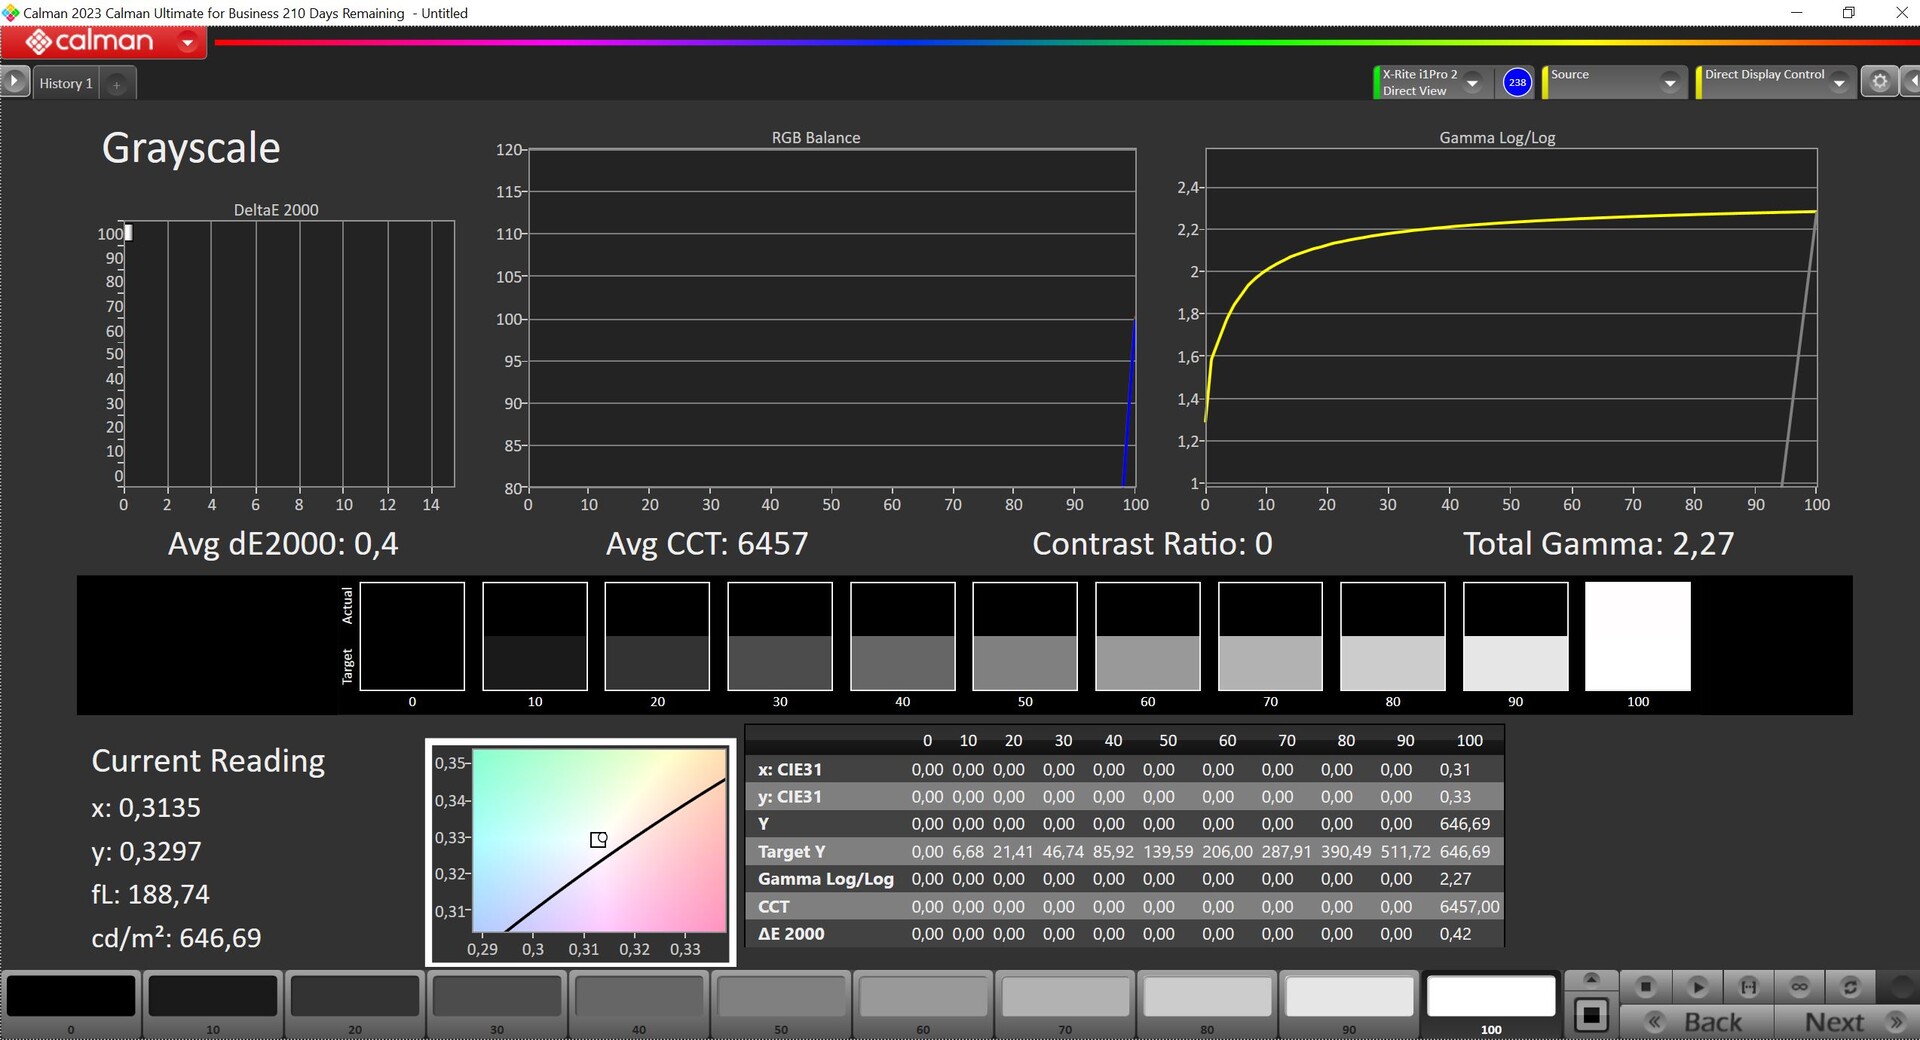
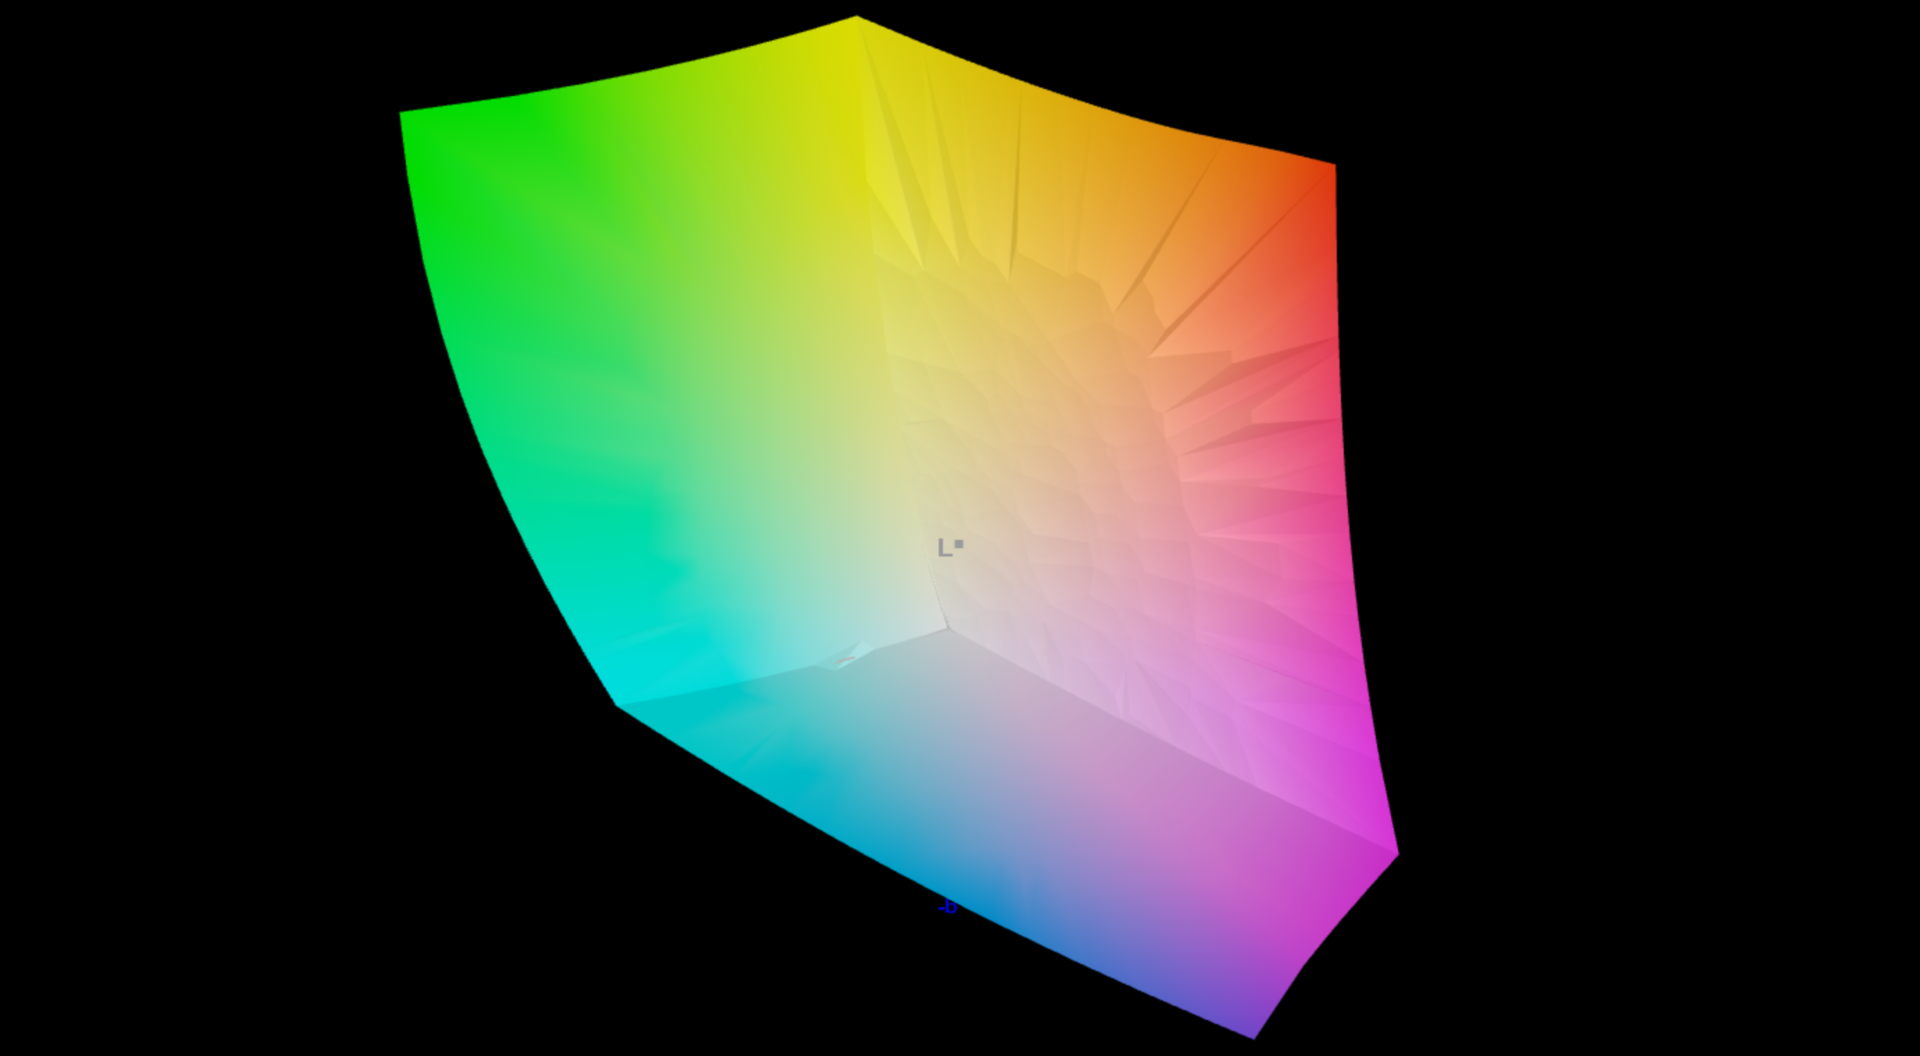
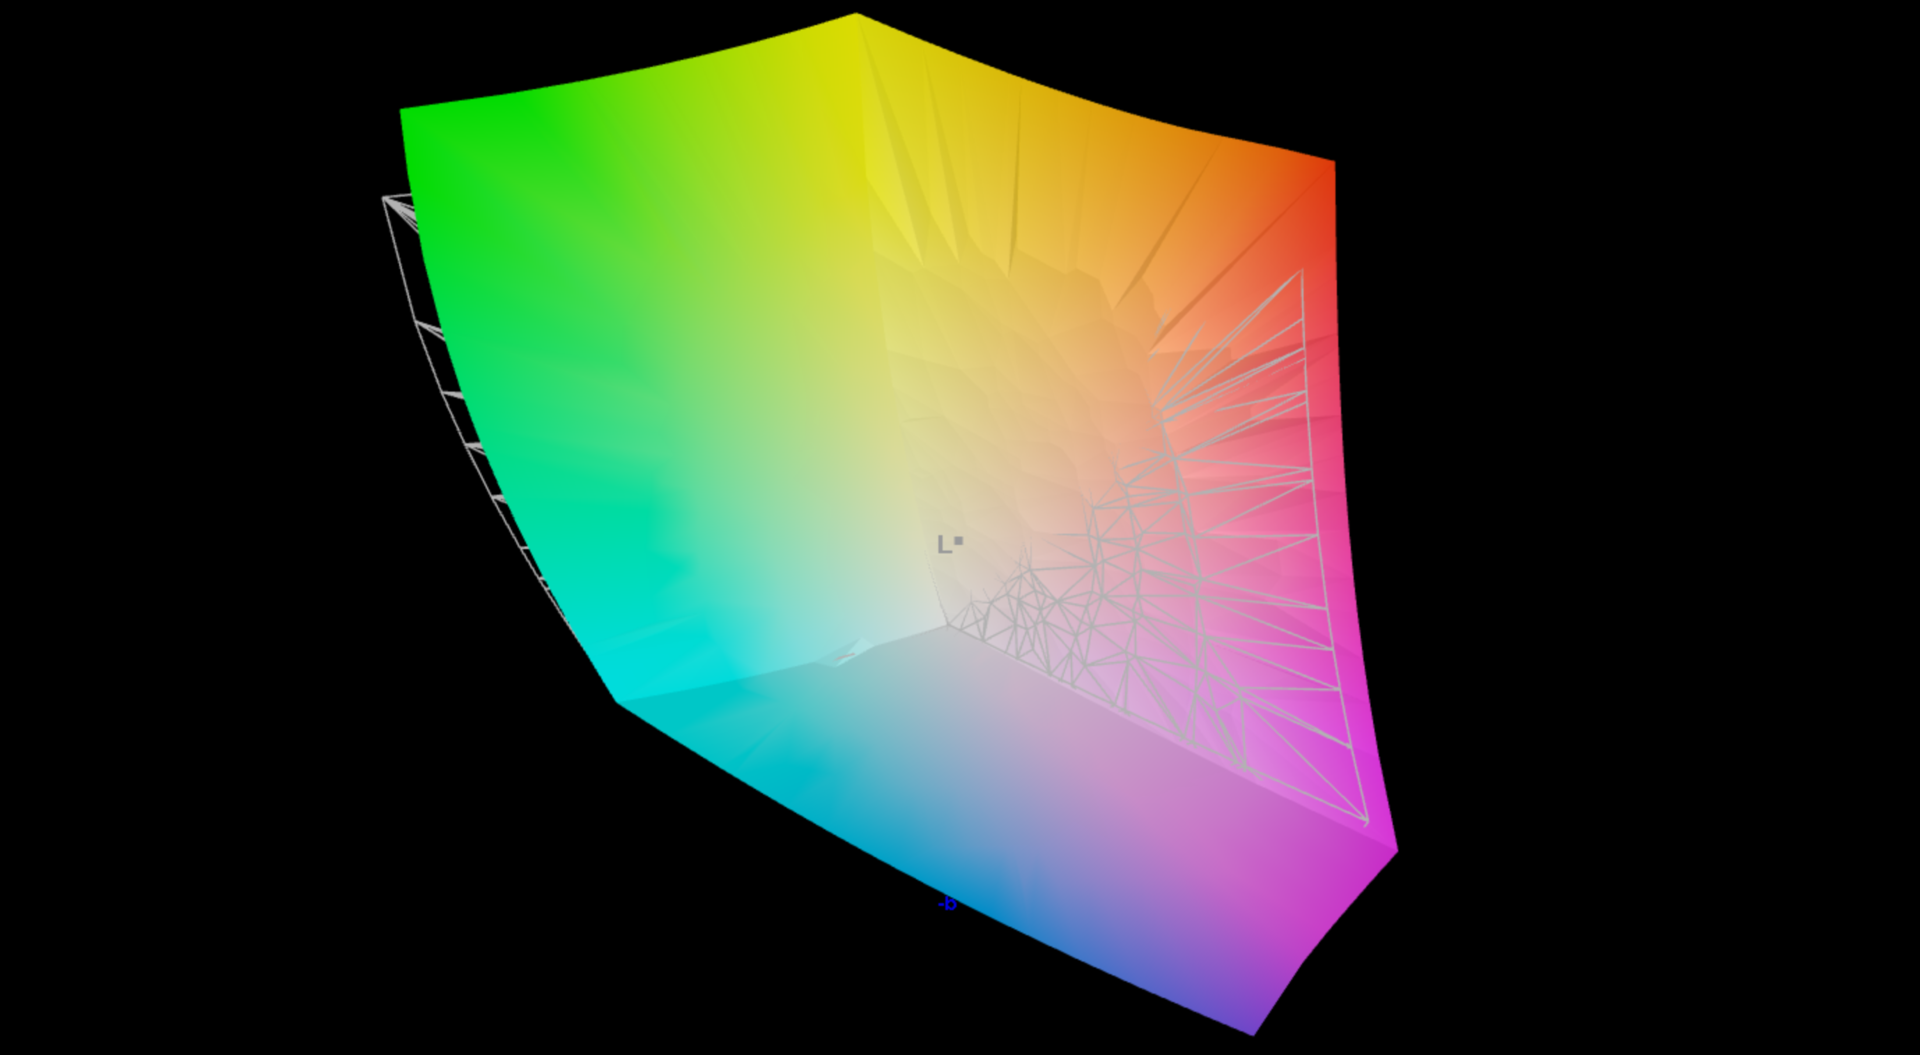
MSI, cihaza 2.880 x 1.800 piksel çözünürlüğe sahip yansıtıcı bir 16:10 13,3 inç OLED panel yerleştirmiştir. Öznel olarak, görüntü kalitesi etkileyici ve renkler süper canlı. Ayrıca, tepki süreleri çok düşük. Maksimum SDR parlaklığı 400 cd/m²'nin biraz üzerinde ve düşük siyah değeri sayesinde yüksek kontrast oranına sahip. Bu da canlı görüntü kalitesine katkıda bulunur. Dokunmatik girişler desteklenmiyor ancak parlaklığı ortamdaki aydınlatma koşullarına göre otomatik olarak ayarlanabiliyor.
HDR kullanımında, maksimum HDR parlaklığı küçük görüntü alıntılarını gösterirken 647 cd/m²'ye kadar yükselir ve neredeyse tamamen beyazı gösterirken 500 cd/m²'nin biraz üzerindedir. Diğer tüm Windows dizüstü bilgisayarlarda da olduğu gibi, renk yönetiminin düzgün çalışmamasını önlemek için önce HDR modunu manuel olarak etkinleştirmeniz gerekir.
| |||||||||||||||||||||||||
Aydınlatma: 98 %
Batarya modunda parlaklık: 405 cd/m²
Kontrast: ∞:1 (Siyah: 0 cd/m²)
ΔE ColorChecker Calman: 2.1 | ∀{0.5-29.43 Ø4.71}
ΔE Greyscale Calman: 1.2 | ∀{0.09-98 Ø4.96}
97.8% AdobeRGB 1998 (Argyll 3D)
100% sRGB (Argyll 3D)
99.9% Display P3 (Argyll 3D)
Gamma: 2.16
CCT: 6465 K
| MSI Prestige 13 AI Evo ATNA33AA07-0, OLED, 2880x1800, 13.3" | Lenovo ThinkPad X1 Nano Gen 3 MND007ZA1-3, IPS, 2160x1350, 13" | Dell Latitude 13 7340 i5-1345U Chi Mei 133JCG, IPS, 1920x1200, 13.3" | HP Dragonfly G4 Chi Mei CMN13C0, IPS, 1920x1280, 13.5" | Asus ZenBook S13 OLED UX5304 SDC417B, OLED, 2880x1800, 13.3" | |
|---|---|---|---|---|---|
| Display | -20% | -23% | -21% | -0% | |
| Display P3 Coverage (%) | 99.9 | 68.5 -31% | 65.9 -34% | 68.4 -32% | 99.7 0% |
| sRGB Coverage (%) | 100 | 99.5 0% | 96.8 -3% | 98.3 -2% | 100 0% |
| AdobeRGB 1998 Coverage (%) | 97.8 | 69.7 -29% | 67.8 -31% | 70.4 -28% | 96.9 -1% |
| Response Times | -2092% | -2565% | -2572% | -21% | |
| Response Time Grey 50% / Grey 80% * (ms) | 1.54 ? | 39.9 ? -2491% | 51 ? -3212% | 48.8 ? -3069% | 2 ? -30% |
| Response Time Black / White * (ms) | 1.44 ? | 25.8 ? -1692% | 29.04 ? -1917% | 31.3 ? -2074% | 1.6 ? -11% |
| PWM Frequency (Hz) | 240 ? | 240 ? | |||
| Screen | -1% | -65% | -14% | 13% | |
| Brightness middle (cd/m²) | 404 | 461.2 14% | 471 17% | 408.8 1% | 361 -11% |
| Brightness (cd/m²) | 407 | 428 5% | 437 7% | 399 -2% | 365 -10% |
| Brightness Distribution (%) | 98 | 86 -12% | 87 -11% | 90 -8% | 98 0% |
| Black Level * (cd/m²) | 0.29 | 0.2033 | 0.32 | ||
| Colorchecker dE 2000 * | 2.1 | 1.79 15% | 3.24 -54% | 2.02 4% | 1.2 43% |
| Colorchecker dE 2000 max. * | 4.3 | 3.3 23% | 7.19 -67% | 3.84 11% | 1.9 56% |
| Greyscale dE 2000 * | 1.2 | 1.8 -50% | 4.6 -283% | 2.3 -92% | 1.2 -0% |
| Gamma | 2.16 102% | 2.24 98% | 2.2 100% | 2.27 97% | |
| CCT | 6465 101% | 6588 99% | 6520 100% | 6203 105% | 6486 100% |
| Contrast (:1) | 1590 | 2317 | 1278 | ||
| Colorchecker dE 2000 calibrated * | 0.47 | 1.08 | 0.61 | ||
| Toplam Ortalama (Program / Ayarlar) | -704% /
-386% | -884% /
-508% | -869% /
-481% | -3% /
3% |
* ... daha küçük daha iyidir
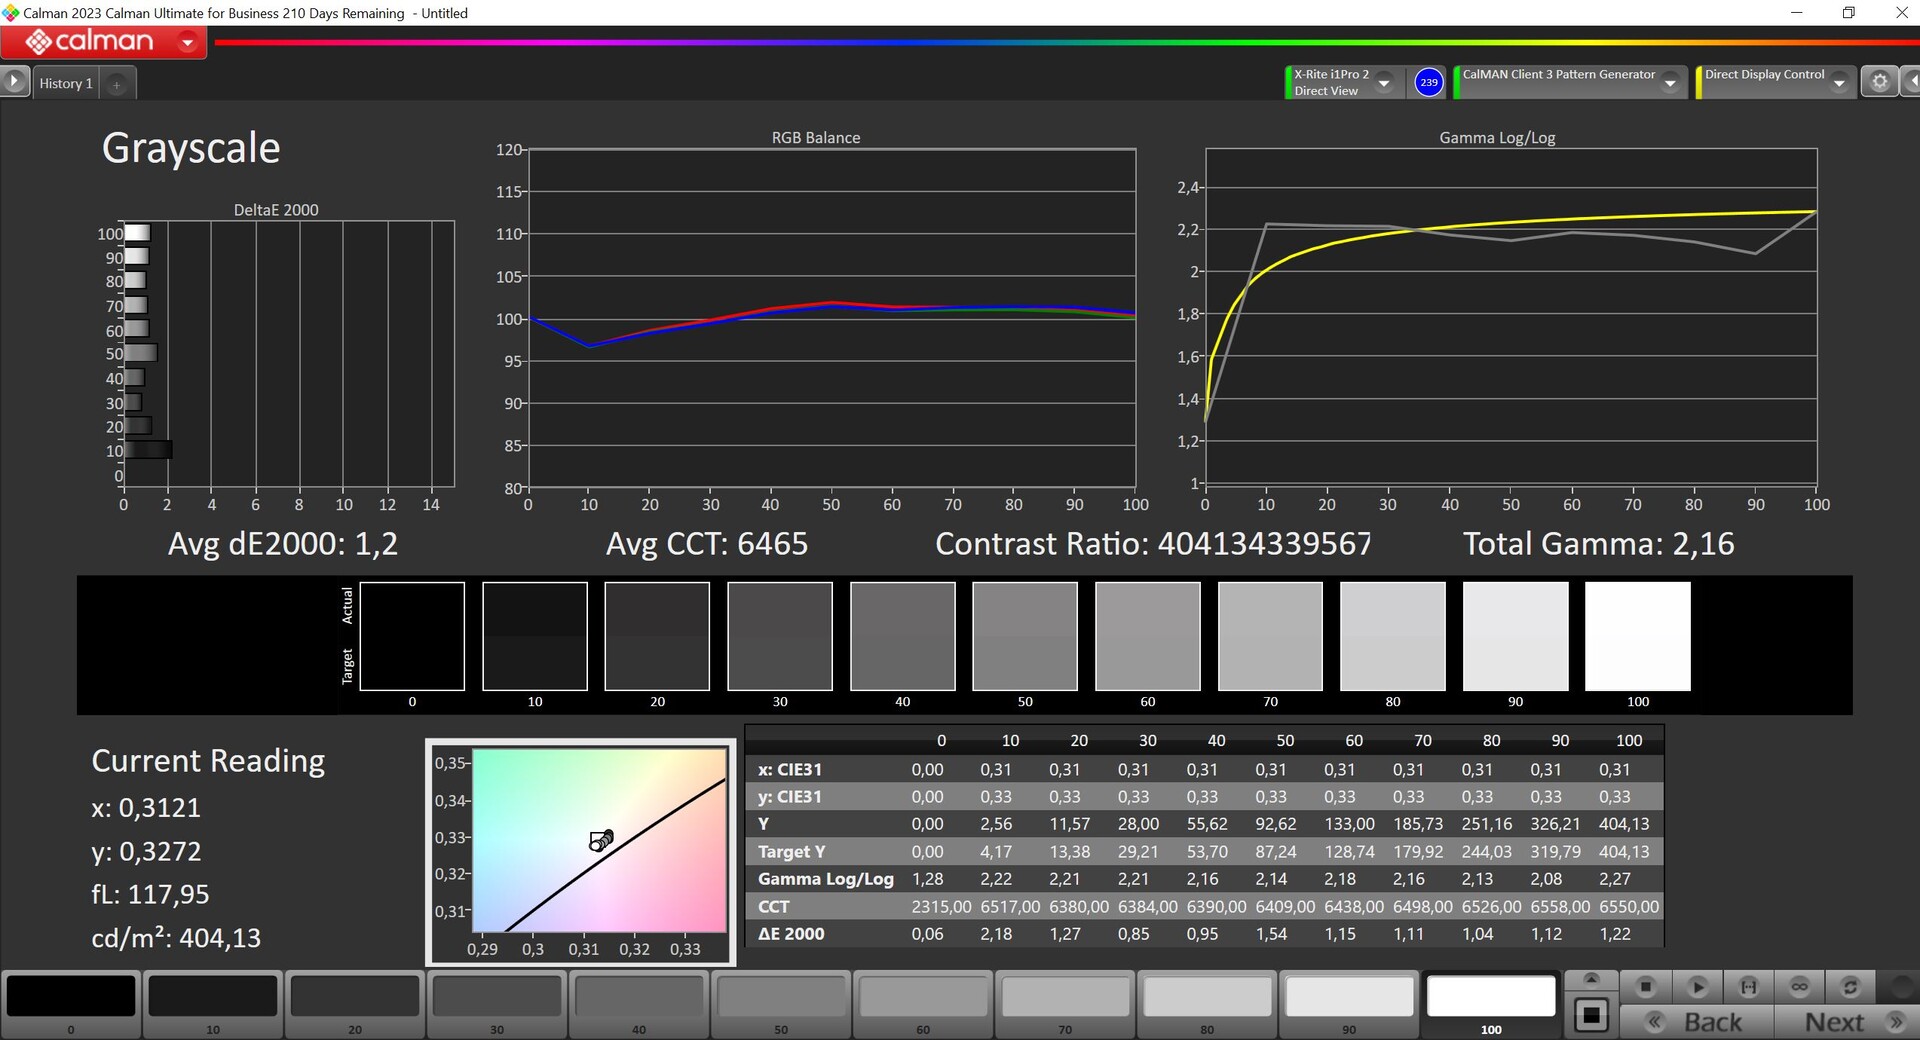
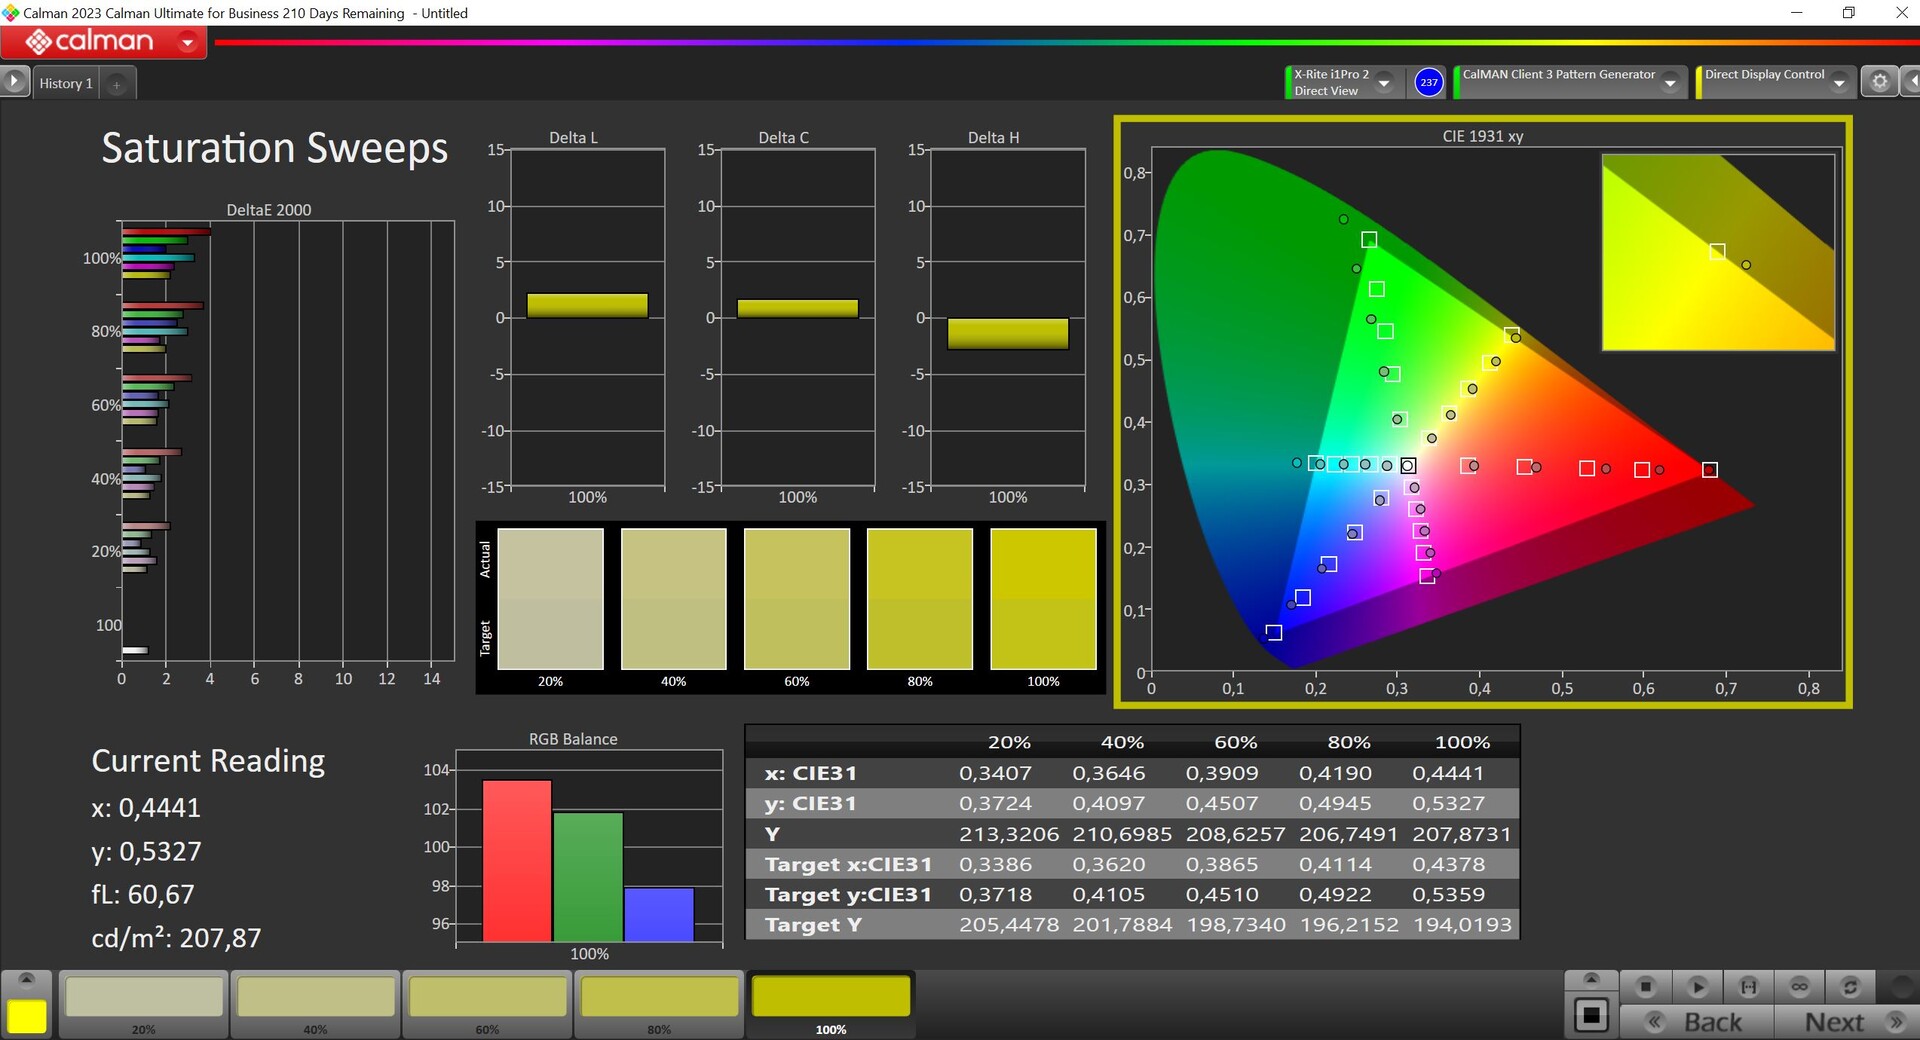
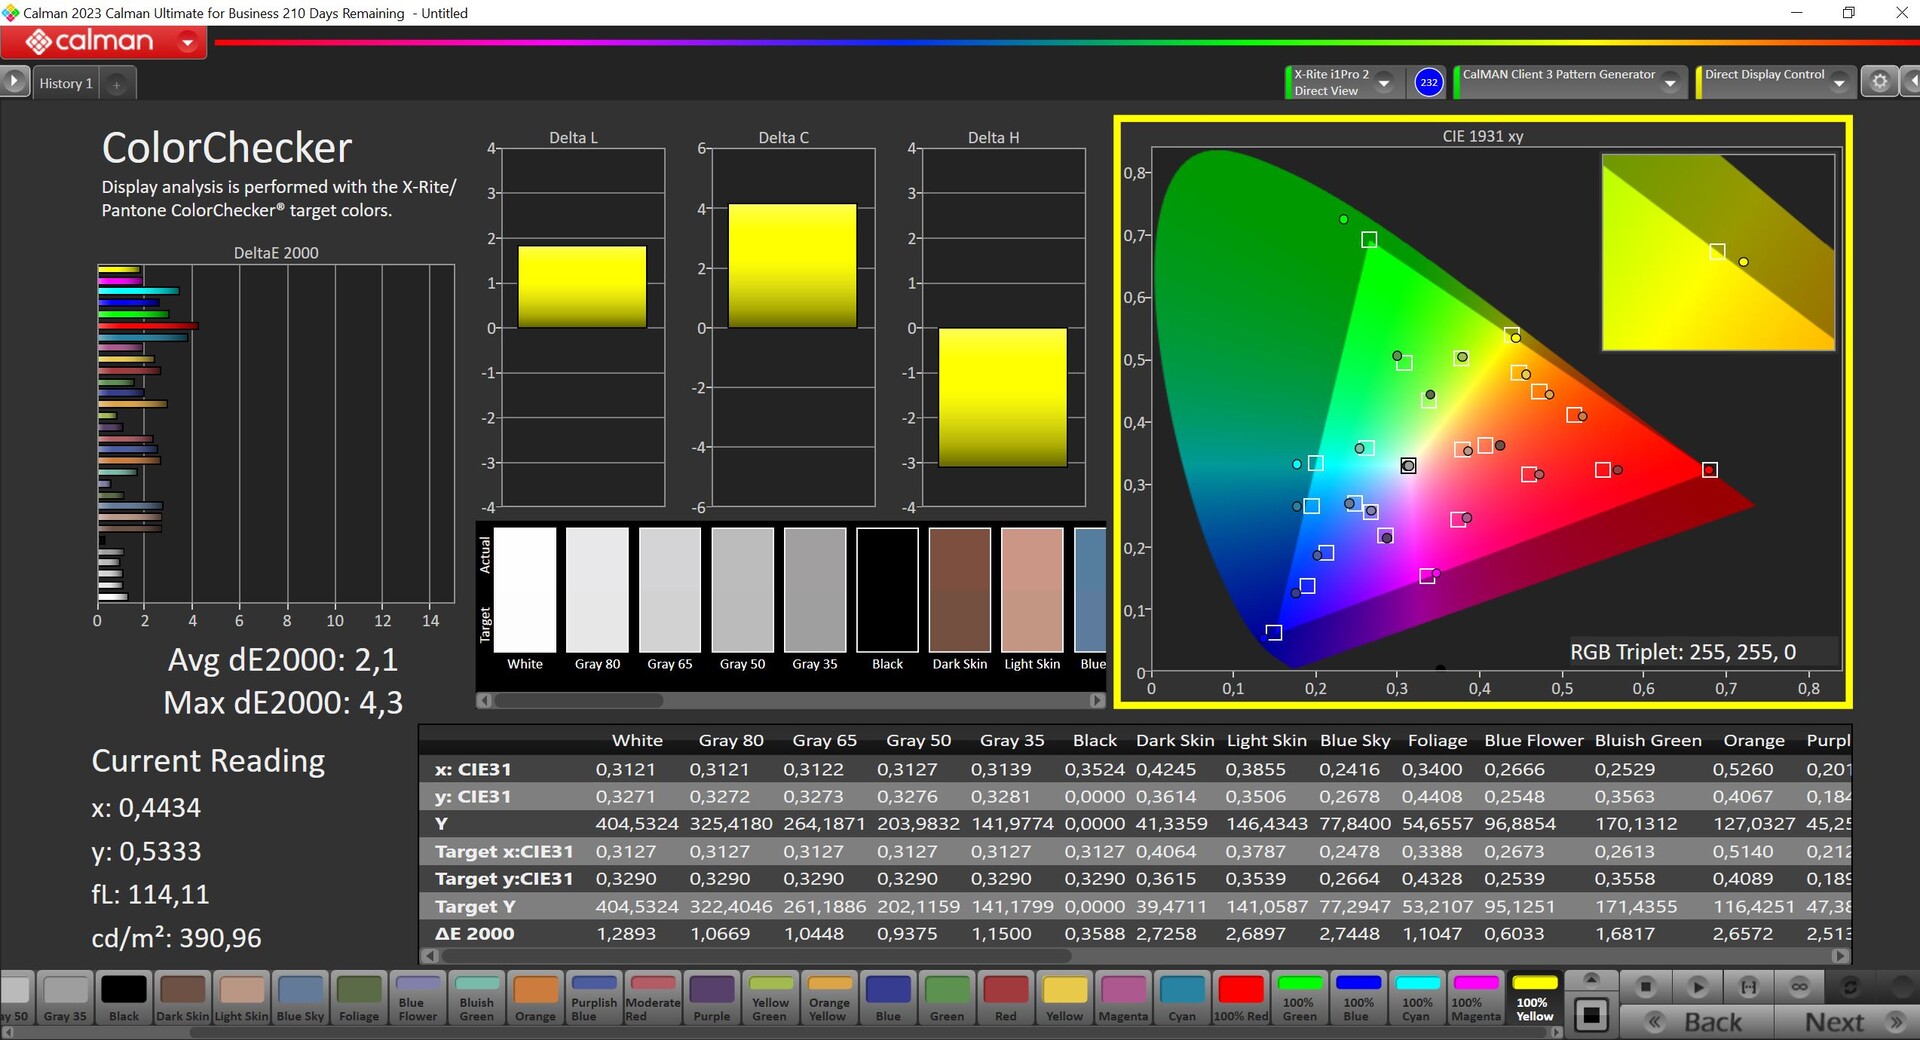
Paneli profesyonel CalMAN yazılımını (X-Rite i1 Pro2) kullanarak analiz ettik ve kutudan çıkar çıkmaz iyi bir tasvir sundu. Renk tonu olmadığını ve renk sıcaklığının da doğru olduğunu gördük; sadece bazı renkler (%100) önemli DeltaE-2000 sapması olan 3'ün üzerindeydi (P3 referansına kıyasla). Bunu kalibrasyon yoluyla düzeltmemiz mümkün olmadı, ayrıca MSI bir sRGB profili sunmuyor. Sonuç olarak, Prestige 13 resim düzenleme için pek uygun değil.

Yanıt Sürelerini Görüntüle
| ↔ Tepki Süresi Siyahtan Beyaza | ||
|---|---|---|
| 1.44 ms ... yükseliş ↗ ve sonbahar↘ birleşimi | ↗ 0.73 ms yükseliş | 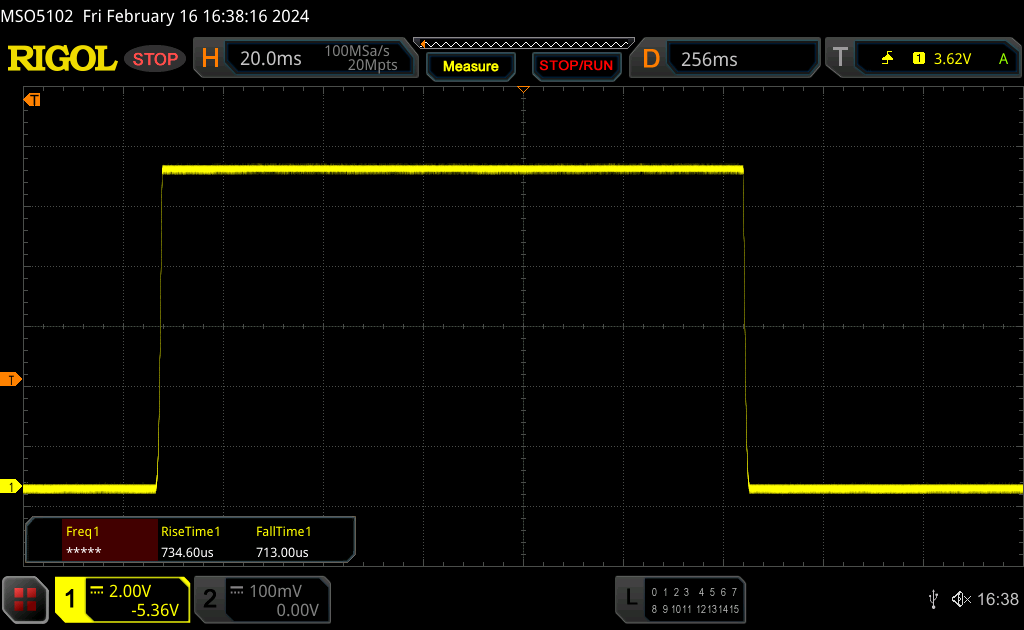 |
| ↘ 0.71 ms sonbahar | ||
| Ekran, testlerimizde çok hızlı yanıt oranları gösteriyor ve hızlı oyun oynamaya çok uygun olmalı. Karşılaştırıldığında, test edilen tüm cihazlar 0.1 (minimum) ile 240 (maksimum) ms arasında değişir. » Tüm cihazların 9 %'si daha iyi. Bu, ölçülen yanıt süresinin test edilen tüm cihazların ortalamasından (19.8 ms) daha iyi olduğu anlamına gelir. | ||
| ↔ Tepki Süresi %50 Griden %80 Griye | ||
| 1.54 ms ... yükseliş ↗ ve sonbahar↘ birleşimi | ↗ 0.79 ms yükseliş | 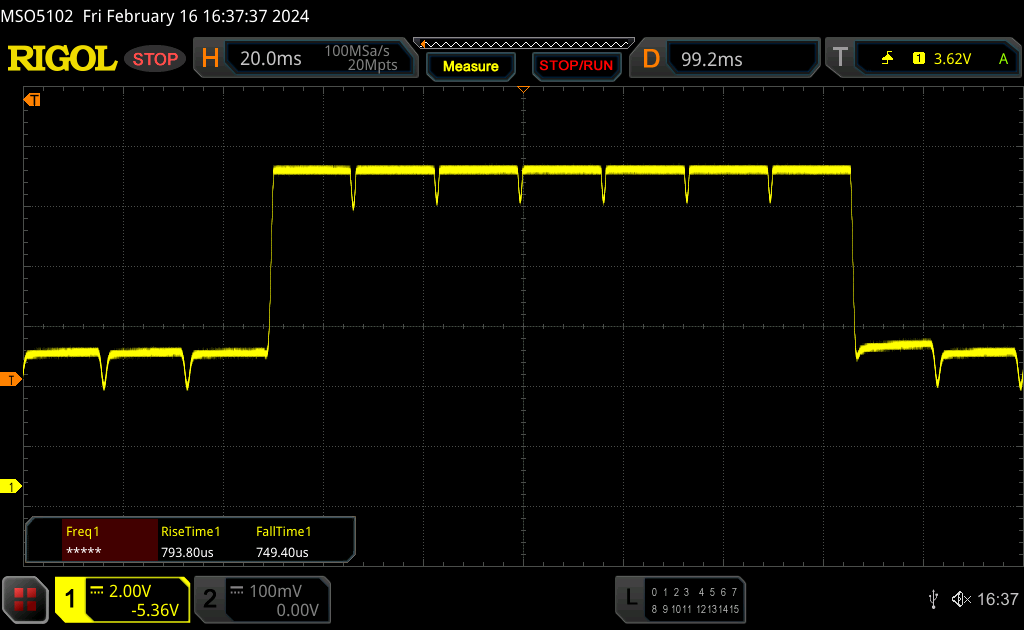 |
| ↘ 0.75 ms sonbahar | ||
| Ekran, testlerimizde çok hızlı yanıt oranları gösteriyor ve hızlı oyun oynamaya çok uygun olmalı. Karşılaştırıldığında, test edilen tüm cihazlar 0.165 (minimum) ile 636 (maksimum) ms arasında değişir. » Tüm cihazların 8 %'si daha iyi. Bu, ölçülen yanıt süresinin test edilen tüm cihazların ortalamasından (31 ms) daha iyi olduğu anlamına gelir. | ||
Ekran Titremesi / PWM (Darbe Genişliği Modülasyonu)
| Ekran titriyor / PWM algılandı | 240 Hz | ≤ 42 % parlaklık ayarı | 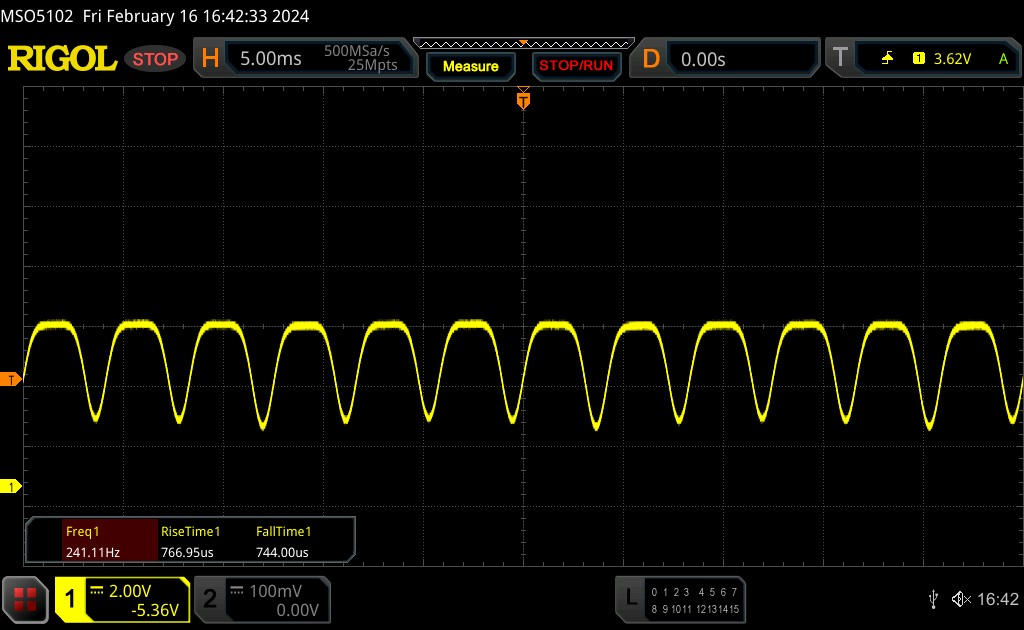 |
Ekran arka ışığı 240 Hz'de titriyor (en kötü durum, örneğin PWM kullanılması) 42 % ve altındaki parlaklık ayarında titreme algılandı. Bu parlaklık ayarının üzerinde titreme veya PWM olmamalıdır. 240 Hz frekansı nispeten düşüktür, bu nedenle hassas kullanıcılar belirtilen parlaklık ayarında ve altında muhtemelen titremeyi fark edecek ve göz yorgunluğu yaşayacaktır. Karşılaştırıldığında: Test edilen tüm cihazların %52 %'si ekranı karartmak için PWM kullanmıyor. PWM tespit edilirse, ortalama 7757 (minimum: 5 - maksimum: 343500) Hz ölçüldü. | |||
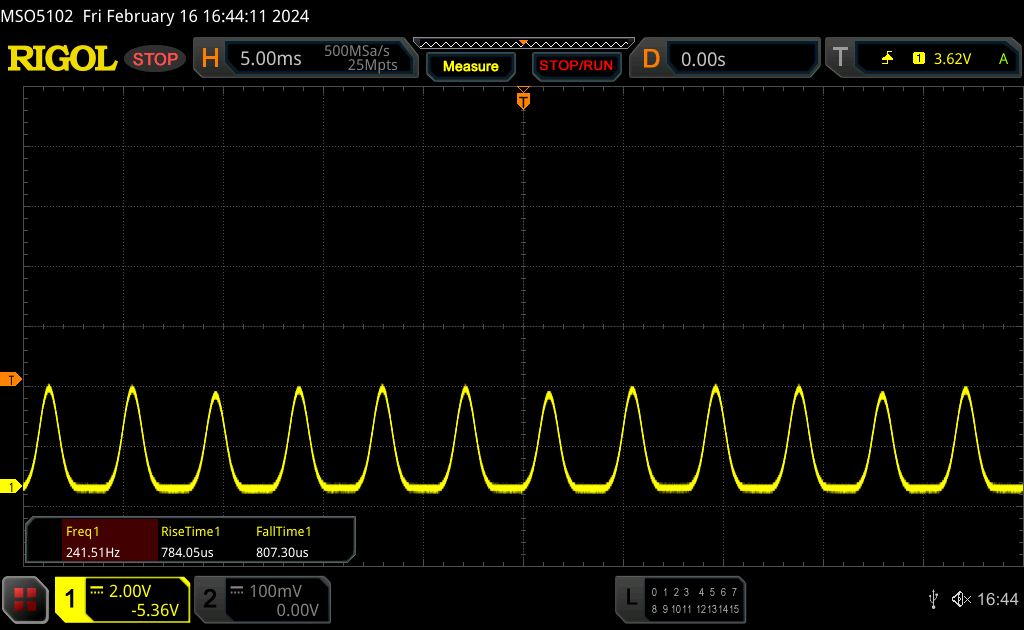
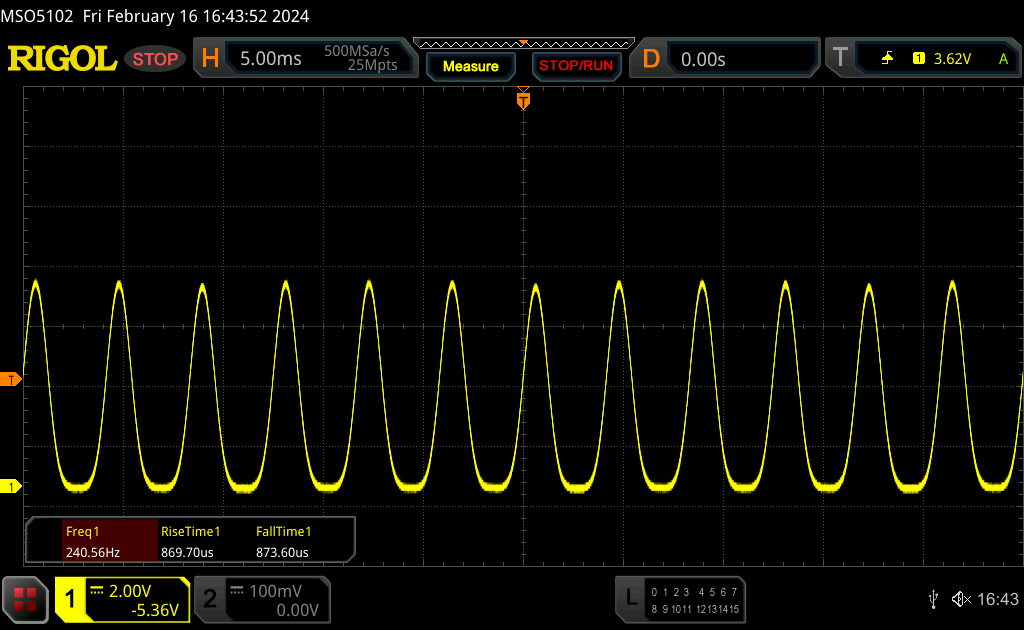
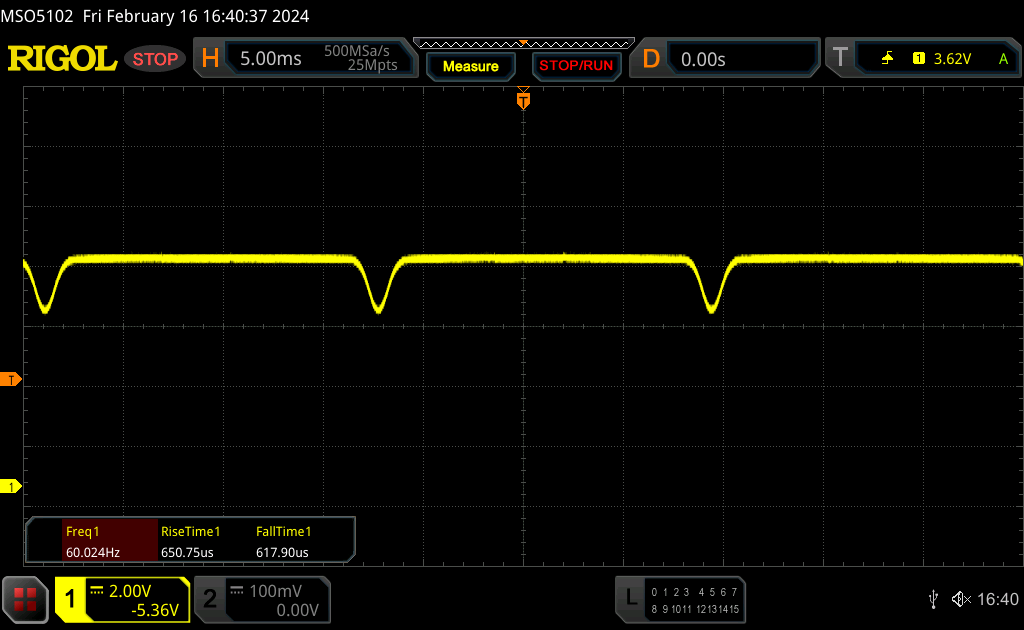
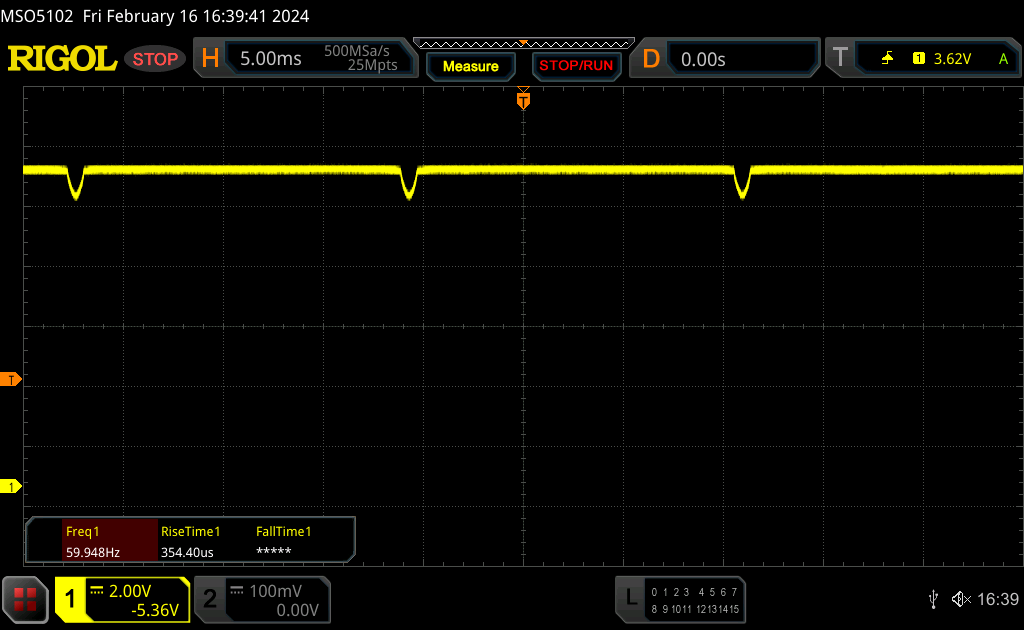
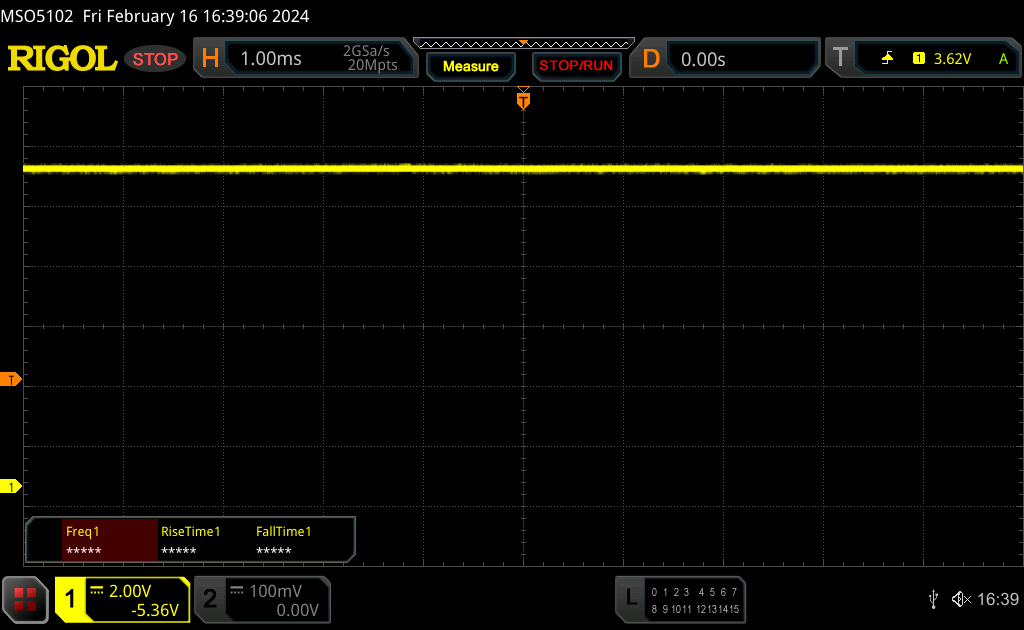
Kullanılan PWM ile, %43-84 parlaklık aralığında 60 Hz'de DC karartma ölçtük; %42 veya daha azında, 240 Hz'de potansiyel olarak daha zararlı PWM titremesi devreye giriyor.
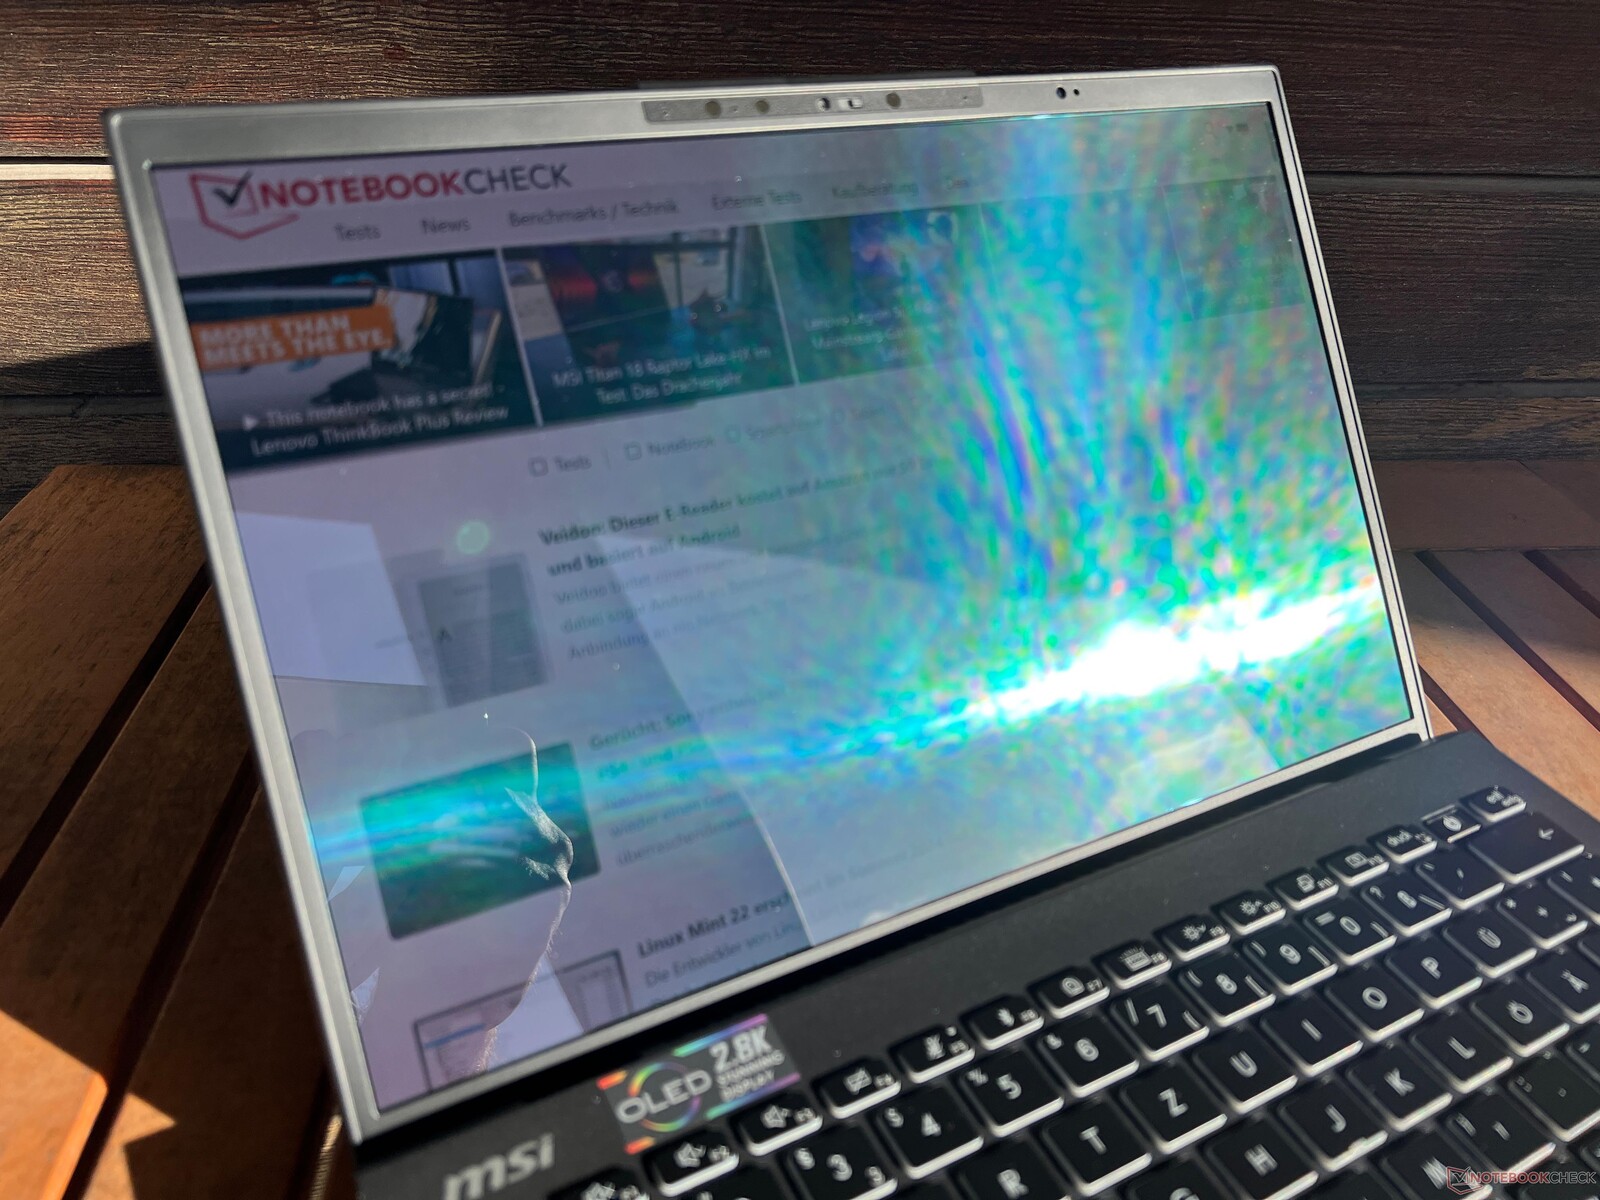
Parlak ortamlarda, yansımalar parlak ekranda hızla bir sorun haline gelir. Görüş açısı kararlılığı harika; yalnızca aşırı açılar OLED'e özgü mavi parıltıya neden oluyor.
Performans - 20 watt'ta Meteor Lake-H
Test koşulları
Önceden yüklenmiş MSI Center birden fazla enerji profili sunuyor, bu sayede tek tek profiller arasında büyük farklar görmedik ( sessiz mod hariç). Daha sonra, standart olarak ayarlanmış olan MSI AI Engine modunu kullanarak aşağıdaki kıyaslamaları ve ölçümleri gerçekleştirdik.
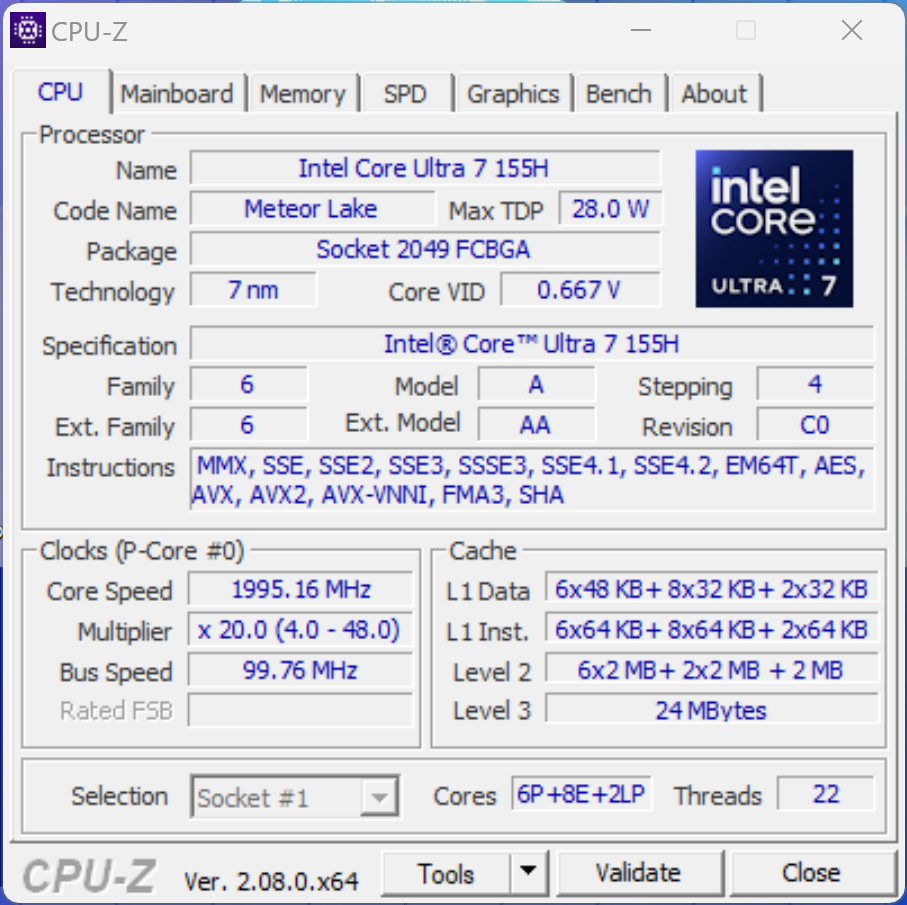
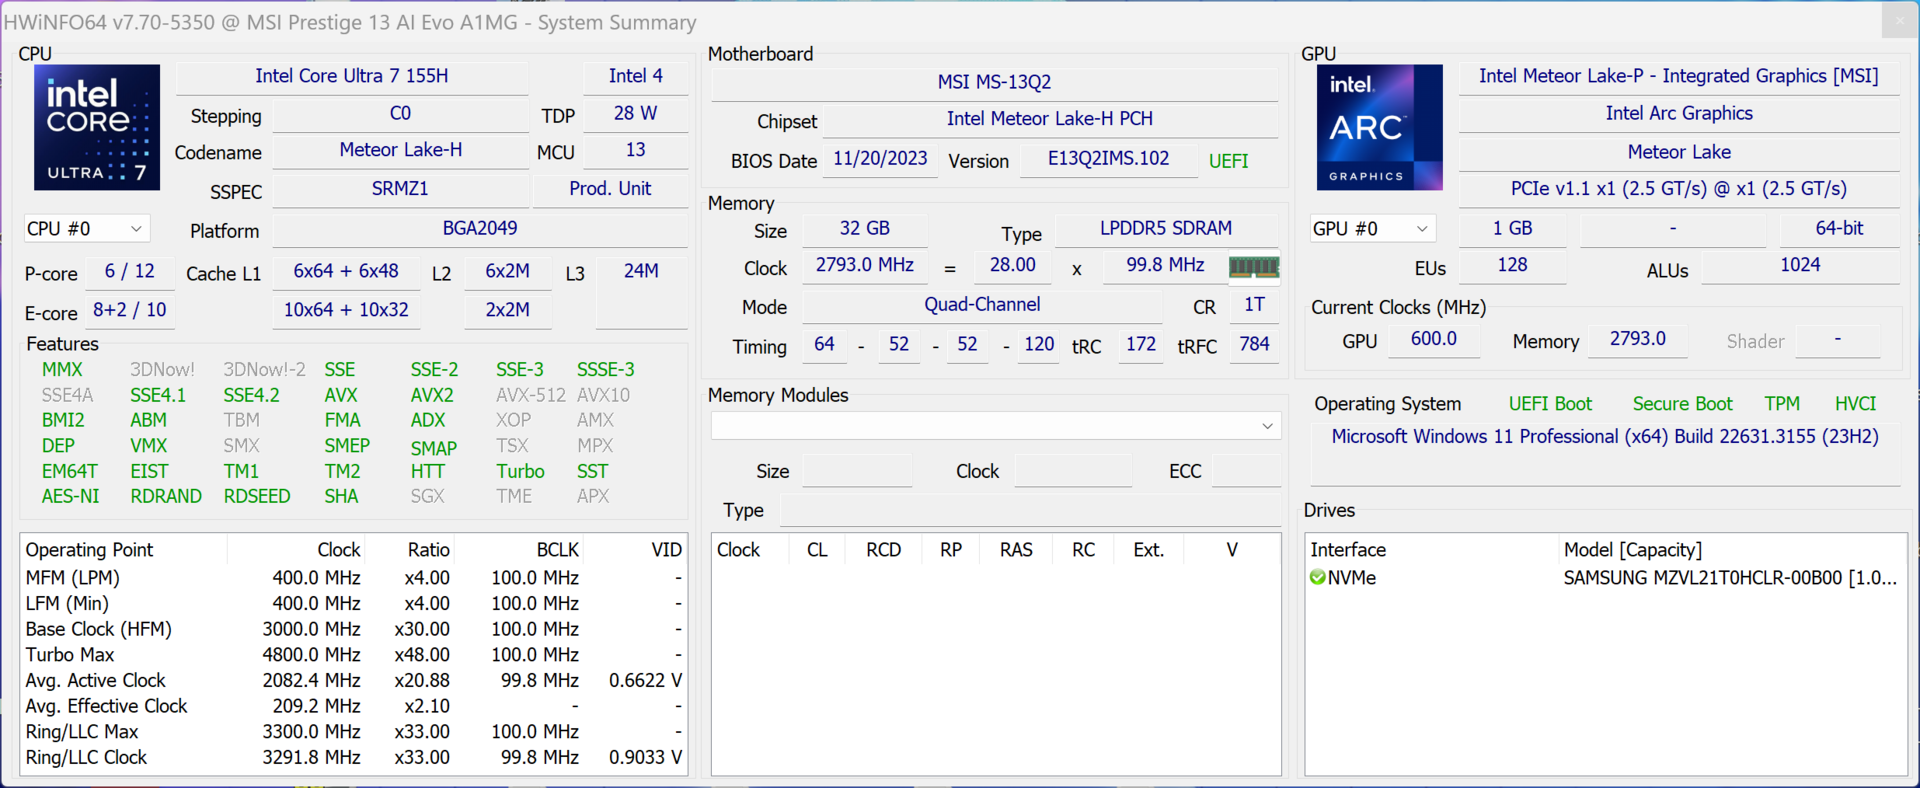
İşlemci - Core Ultra 7 155H
MSI dizüstü bilgisayarı yeni Meteor-Lake ile donattı Core Ultra 7 155H intel'in 28 ila 115 watt arasında bir TDP alanında kullanılabilen çipi. Prestige 13'ün durumunda, cihaz soğukken yaklaşık 30 saniye boyunca maksimum 64 watt'lık bir tüketim kaydettik, ardından tüketimi 20 watt'a düştü. U serisi bir işlemci muhtemelen daha iyi bir seçim olurdu, ancak bu CPU'lar yalnızca 2 hızlı P çekirdeğe sahip olduğundan, performansları oldukça mütevazıdır. Kısa süreli yük altında (ki bu bir subnotebook'ta çok daha olasıdır), çok çekirdekli performansı elbette çok iyi. Tek çekirdek performansı fena değil ancak bu açıdan Meteor-Lake CPU'lar eski Raptor-Lake modellerine göre herhangi bir avantaj göstermiyor. Pil kullanımında CPU performansı sabit kalıyor. Diğer CPU kıyaslamalarını bulabilirsiniz burada.
Cinebench R15 Multi continuous test
Cinebench R23: Multi Core | Single Core
Cinebench R20: CPU (Multi Core) | CPU (Single Core)
Cinebench R15: CPU Multi 64Bit | CPU Single 64Bit
Blender: v2.79 BMW27 CPU
7-Zip 18.03: 7z b 4 | 7z b 4 -mmt1
Geekbench 6.7: Multi-Core | Single-Core
Geekbench 5.5: Multi-Core | Single-Core
HWBOT x265 Benchmark v2.2: 4k Preset
LibreOffice : 20 Documents To PDF
R Benchmark 2.5: Overall mean
| CPU Performance rating | |
| Ortalama Intel Core Ultra 7 155H | |
| Sınıf ortalaması Subnotebook | |
| MSI Prestige 13 AI Evo | |
| Lenovo ThinkPad X1 Nano Gen 3 | |
| HP Dragonfly G4 -2! | |
| Asus ZenBook S13 OLED UX5304 -2! | |
| Dell Latitude 13 7340 i5-1345U -2! | |
| Cinebench R23 / Multi Core | |
| Ortalama Intel Core Ultra 7 155H (9769 - 19007, n=52) | |
| Sınıf ortalaması Subnotebook (1555 - 21812, n=60, son 2 yıl) | |
| MSI Prestige 13 AI Evo | |
| Lenovo ThinkPad X1 Nano Gen 3 | |
| Dell Latitude 13 7340 i5-1345U | |
| HP Dragonfly G4 | |
| Asus ZenBook S13 OLED UX5304 | |
| Cinebench R23 / Single Core | |
| HP Dragonfly G4 | |
| Sınıf ortalaması Subnotebook (358 - 2213, n=61, son 2 yıl) | |
| Asus ZenBook S13 OLED UX5304 | |
| Ortalama Intel Core Ultra 7 155H (1496 - 1815, n=52) | |
| Dell Latitude 13 7340 i5-1345U | |
| Lenovo ThinkPad X1 Nano Gen 3 | |
| MSI Prestige 13 AI Evo | |
| Cinebench R20 / CPU (Multi Core) | |
| Ortalama Intel Core Ultra 7 155H (3798 - 7409, n=50) | |
| Sınıf ortalaması Subnotebook (579 - 8541, n=57, son 2 yıl) | |
| MSI Prestige 13 AI Evo | |
| Lenovo ThinkPad X1 Nano Gen 3 | |
| Dell Latitude 13 7340 i5-1345U | |
| HP Dragonfly G4 | |
| Asus ZenBook S13 OLED UX5304 | |
| Cinebench R20 / CPU (Single Core) | |
| HP Dragonfly G4 | |
| Asus ZenBook S13 OLED UX5304 | |
| Lenovo ThinkPad X1 Nano Gen 3 | |
| Ortalama Intel Core Ultra 7 155H (601 - 696, n=50) | |
| Dell Latitude 13 7340 i5-1345U | |
| Sınıf ortalaması Subnotebook (128 - 832, n=57, son 2 yıl) | |
| MSI Prestige 13 AI Evo | |
| Cinebench R15 / CPU Multi 64Bit | |
| Ortalama Intel Core Ultra 7 155H (1932 - 2880, n=56) | |
| MSI Prestige 13 AI Evo | |
| Sınıf ortalaması Subnotebook (327 - 3345, n=57, son 2 yıl) | |
| Lenovo ThinkPad X1 Nano Gen 3 | |
| Asus ZenBook S13 OLED UX5304 | |
| HP Dragonfly G4 | |
| Dell Latitude 13 7340 i5-1345U | |
| Cinebench R15 / CPU Single 64Bit | |
| Sınıf ortalaması Subnotebook (72.4 - 322, n=57, son 2 yıl) | |
| HP Dragonfly G4 | |
| Ortalama Intel Core Ultra 7 155H (99.6 - 268, n=52) | |
| Asus ZenBook S13 OLED UX5304 | |
| MSI Prestige 13 AI Evo | |
| Dell Latitude 13 7340 i5-1345U | |
| Lenovo ThinkPad X1 Nano Gen 3 | |
| Blender / v2.79 BMW27 CPU | |
| Dell Latitude 13 7340 i5-1345U | |
| Asus ZenBook S13 OLED UX5304 | |
| Asus ZenBook S13 OLED UX5304 | |
| HP Dragonfly G4 | |
| Lenovo ThinkPad X1 Nano Gen 3 | |
| Sınıf ortalaması Subnotebook (159 - 2271, n=58, son 2 yıl) | |
| MSI Prestige 13 AI Evo | |
| Ortalama Intel Core Ultra 7 155H (175 - 381, n=47) | |
| 7-Zip 18.03 / 7z b 4 | |
| Ortalama Intel Core Ultra 7 155H (41739 - 70254, n=50) | |
| Sınıf ortalaması Subnotebook (11668 - 77867, n=57, son 2 yıl) | |
| MSI Prestige 13 AI Evo | |
| HP Dragonfly G4 | |
| Lenovo ThinkPad X1 Nano Gen 3 | |
| Asus ZenBook S13 OLED UX5304 | |
| Dell Latitude 13 7340 i5-1345U | |
| 7-Zip 18.03 / 7z b 4 -mmt1 | |
| HP Dragonfly G4 | |
| Lenovo ThinkPad X1 Nano Gen 3 | |
| Asus ZenBook S13 OLED UX5304 | |
| Sınıf ortalaması Subnotebook (2643 - 6699, n=59, son 2 yıl) | |
| MSI Prestige 13 AI Evo | |
| Ortalama Intel Core Ultra 7 155H (4594 - 5621, n=50) | |
| Dell Latitude 13 7340 i5-1345U | |
| Geekbench 6.7 / Multi-Core | |
| Sınıf ortalaması Subnotebook (2244 - 20325, n=63, son 2 yıl) | |
| Ortalama Intel Core Ultra 7 155H (7732 - 13656, n=55) | |
| Lenovo ThinkPad X1 Nano Gen 3 | |
| MSI Prestige 13 AI Evo | |
| Geekbench 6.7 / Single-Core | |
| Sınıf ortalaması Subnotebook (960 - 4195, n=62, son 2 yıl) | |
| Lenovo ThinkPad X1 Nano Gen 3 | |
| MSI Prestige 13 AI Evo | |
| Ortalama Intel Core Ultra 7 155H (1901 - 2473, n=52) | |
| Geekbench 5.5 / Multi-Core | |
| Ortalama Intel Core Ultra 7 155H (10017 - 13556, n=52) | |
| Sınıf ortalaması Subnotebook (2557 - 17218, n=48, son 2 yıl) | |
| MSI Prestige 13 AI Evo | |
| Lenovo ThinkPad X1 Nano Gen 3 | |
| HP Dragonfly G4 | |
| Asus ZenBook S13 OLED UX5304 | |
| Dell Latitude 13 7340 i5-1345U | |
| Geekbench 5.5 / Single-Core | |
| Sınıf ortalaması Subnotebook (726 - 2224, n=48, son 2 yıl) | |
| HP Dragonfly G4 | |
| Lenovo ThinkPad X1 Nano Gen 3 | |
| Asus ZenBook S13 OLED UX5304 | |
| MSI Prestige 13 AI Evo | |
| Ortalama Intel Core Ultra 7 155H (1462 - 1824, n=52) | |
| Dell Latitude 13 7340 i5-1345U | |
| HWBOT x265 Benchmark v2.2 / 4k Preset | |
| Ortalama Intel Core Ultra 7 155H (9.93 - 21.2, n=50) | |
| Sınıf ortalaması Subnotebook (0.97 - 25.1, n=57, son 2 yıl) | |
| MSI Prestige 13 AI Evo | |
| Lenovo ThinkPad X1 Nano Gen 3 | |
| HP Dragonfly G4 | |
| Asus ZenBook S13 OLED UX5304 | |
| Dell Latitude 13 7340 i5-1345U | |
| LibreOffice / 20 Documents To PDF | |
| Sınıf ortalaması Subnotebook (39.9 - 220, n=56, son 2 yıl) | |
| Lenovo ThinkPad X1 Nano Gen 3 | |
| Ortalama Intel Core Ultra 7 155H (37.5 - 79.2, n=49) | |
| Asus ZenBook S13 OLED UX5304 | |
| HP Dragonfly G4 | |
| MSI Prestige 13 AI Evo | |
| Dell Latitude 13 7340 i5-1345U | |
| R Benchmark 2.5 / Overall mean | |
| Sınıf ortalaması Subnotebook (0.4024 - 1.456, n=58, son 2 yıl) | |
| Dell Latitude 13 7340 i5-1345U | |
| Lenovo ThinkPad X1 Nano Gen 3 | |
| Ortalama Intel Core Ultra 7 155H (0.4457 - 0.53, n=49) | |
| Asus ZenBook S13 OLED UX5304 | |
| MSI Prestige 13 AI Evo | |
| HP Dragonfly G4 | |
* ... daha küçük daha iyidir
AIDA64: FP32 Ray-Trace | FPU Julia | CPU SHA3 | CPU Queen | FPU SinJulia | FPU Mandel | CPU AES | CPU ZLib | FP64 Ray-Trace | CPU PhotoWorxx
| Performance rating | |
| Ortalama Intel Core Ultra 7 155H | |
| Sınıf ortalaması Subnotebook | |
| MSI Prestige 13 AI Evo | |
| Lenovo ThinkPad X1 Nano Gen 3 | |
| HP Dragonfly G4 | |
| Asus ZenBook S13 OLED UX5304 | |
| Dell Latitude 13 7340 i5-1345U | |
| AIDA64 / FP32 Ray-Trace | |
| Sınıf ortalaması Subnotebook (1135 - 32888, n=58, son 2 yıl) | |
| Ortalama Intel Core Ultra 7 155H (6670 - 18470, n=50) | |
| Lenovo ThinkPad X1 Nano Gen 3 | |
| HP Dragonfly G4 | |
| MSI Prestige 13 AI Evo | |
| Asus ZenBook S13 OLED UX5304 | |
| Dell Latitude 13 7340 i5-1345U | |
| AIDA64 / FPU Julia | |
| Ortalama Intel Core Ultra 7 155H (40905 - 93181, n=50) | |
| Sınıf ortalaması Subnotebook (5218 - 123315, n=58, son 2 yıl) | |
| MSI Prestige 13 AI Evo | |
| Lenovo ThinkPad X1 Nano Gen 3 | |
| HP Dragonfly G4 | |
| Asus ZenBook S13 OLED UX5304 | |
| Dell Latitude 13 7340 i5-1345U | |
| AIDA64 / CPU SHA3 | |
| Ortalama Intel Core Ultra 7 155H (1940 - 4436, n=50) | |
| Sınıf ortalaması Subnotebook (444 - 5287, n=58, son 2 yıl) | |
| MSI Prestige 13 AI Evo | |
| Lenovo ThinkPad X1 Nano Gen 3 | |
| HP Dragonfly G4 | |
| Asus ZenBook S13 OLED UX5304 | |
| Dell Latitude 13 7340 i5-1345U | |
| AIDA64 / CPU Queen | |
| Lenovo ThinkPad X1 Nano Gen 3 | |
| Ortalama Intel Core Ultra 7 155H (64698 - 94181, n=50) | |
| HP Dragonfly G4 | |
| Asus ZenBook S13 OLED UX5304 | |
| MSI Prestige 13 AI Evo | |
| Dell Latitude 13 7340 i5-1345U | |
| Sınıf ortalaması Subnotebook (10579 - 95002, n=49, son 2 yıl) | |
| AIDA64 / FPU SinJulia | |
| Ortalama Intel Core Ultra 7 155H (5639 - 10647, n=50) | |
| Sınıf ortalaması Subnotebook (744 - 18418, n=58, son 2 yıl) | |
| MSI Prestige 13 AI Evo | |
| Lenovo ThinkPad X1 Nano Gen 3 | |
| HP Dragonfly G4 | |
| Asus ZenBook S13 OLED UX5304 | |
| Dell Latitude 13 7340 i5-1345U | |
| AIDA64 / FPU Mandel | |
| Ortalama Intel Core Ultra 7 155H (18236 - 47685, n=50) | |
| Sınıf ortalaması Subnotebook (3341 - 65433, n=58, son 2 yıl) | |
| MSI Prestige 13 AI Evo | |
| Lenovo ThinkPad X1 Nano Gen 3 | |
| HP Dragonfly G4 | |
| Asus ZenBook S13 OLED UX5304 | |
| Dell Latitude 13 7340 i5-1345U | |
| AIDA64 / CPU AES | |
| Ortalama Intel Core Ultra 7 155H (45713 - 152179, n=50) | |
| Sınıf ortalaması Subnotebook (638 - 96917, n=58, son 2 yıl) | |
| MSI Prestige 13 AI Evo | |
| Lenovo ThinkPad X1 Nano Gen 3 | |
| HP Dragonfly G4 | |
| Asus ZenBook S13 OLED UX5304 | |
| Dell Latitude 13 7340 i5-1345U | |
| AIDA64 / CPU ZLib | |
| Ortalama Intel Core Ultra 7 155H (557 - 1250, n=50) | |
| Sınıf ortalaması Subnotebook (164.9 - 1379, n=58, son 2 yıl) | |
| MSI Prestige 13 AI Evo | |
| Lenovo ThinkPad X1 Nano Gen 3 | |
| HP Dragonfly G4 | |
| Asus ZenBook S13 OLED UX5304 | |
| Dell Latitude 13 7340 i5-1345U | |
| AIDA64 / FP64 Ray-Trace | |
| Sınıf ortalaması Subnotebook (610 - 17495, n=58, son 2 yıl) | |
| Ortalama Intel Core Ultra 7 155H (3569 - 9802, n=50) | |
| Lenovo ThinkPad X1 Nano Gen 3 | |
| MSI Prestige 13 AI Evo | |
| HP Dragonfly G4 | |
| Asus ZenBook S13 OLED UX5304 | |
| Dell Latitude 13 7340 i5-1345U | |
| AIDA64 / CPU PhotoWorxx | |
| Sınıf ortalaması Subnotebook (6569 - 85600, n=58, son 2 yıl) | |
| Ortalama Intel Core Ultra 7 155H (32719 - 54223, n=50) | |
| Lenovo ThinkPad X1 Nano Gen 3 | |
| MSI Prestige 13 AI Evo | |
| Asus ZenBook S13 OLED UX5304 | |
| HP Dragonfly G4 | |
| Dell Latitude 13 7340 i5-1345U | |
Sistem performansı
Günlük kullanımda, kompakt Prestige 13, kısmen SSD depolama alanı sayesinde hızlı ve hızlı tepki veren bir arkadaştır. Test örneğimizin RAM yapılandırması 32 GB olup önümüzdeki yıllarda kullanıcılar için fazlasıyla yeterli olacaktır. Testlerimiz sırasında sistemin kararlılığıyla ilgili herhangi bir sorun yaşamadık.
CrossMark: Overall | Productivity | Creativity | Responsiveness
WebXPRT 3: Overall
WebXPRT 4: Overall
Mozilla Kraken 1.1: Total
| PCMark 10 / Score | |
| Sınıf ortalaması Subnotebook (4920 - 9939, n=45, son 2 yıl) | |
| Ortalama Intel Core Ultra 7 155H, Intel Arc 8-Core iGPU (4809 - 7529, n=34) | |
| MSI Prestige 13 AI Evo | |
| Lenovo ThinkPad X1 Nano Gen 3 | |
| HP Dragonfly G4 | |
| Asus ZenBook S13 OLED UX5304 | |
| Dell Latitude 13 7340 i5-1345U | |
| PCMark 10 / Essentials | |
| HP Dragonfly G4 | |
| Lenovo ThinkPad X1 Nano Gen 3 | |
| Asus ZenBook S13 OLED UX5304 | |
| Ortalama Intel Core Ultra 7 155H, Intel Arc 8-Core iGPU (7605 - 11289, n=34) | |
| Sınıf ortalaması Subnotebook (8552 - 11646, n=45, son 2 yıl) | |
| Dell Latitude 13 7340 i5-1345U | |
| MSI Prestige 13 AI Evo | |
| PCMark 10 / Productivity | |
| Sınıf ortalaması Subnotebook (5435 - 16606, n=45, son 2 yıl) | |
| Ortalama Intel Core Ultra 7 155H, Intel Arc 8-Core iGPU (6042 - 10591, n=34) | |
| MSI Prestige 13 AI Evo | |
| Lenovo ThinkPad X1 Nano Gen 3 | |
| HP Dragonfly G4 | |
| Asus ZenBook S13 OLED UX5304 | |
| Dell Latitude 13 7340 i5-1345U | |
| PCMark 10 / Digital Content Creation | |
| Sınıf ortalaması Subnotebook (5722 - 13779, n=45, son 2 yıl) | |
| Ortalama Intel Core Ultra 7 155H, Intel Arc 8-Core iGPU (4985 - 10709, n=34) | |
| MSI Prestige 13 AI Evo | |
| Lenovo ThinkPad X1 Nano Gen 3 | |
| HP Dragonfly G4 | |
| Asus ZenBook S13 OLED UX5304 | |
| Dell Latitude 13 7340 i5-1345U | |
| CrossMark / Overall | |
| Lenovo ThinkPad X1 Nano Gen 3 | |
| Sınıf ortalaması Subnotebook (365 - 2356, n=60, son 2 yıl) | |
| Ortalama Intel Core Ultra 7 155H, Intel Arc 8-Core iGPU (1366 - 1903, n=34) | |
| HP Dragonfly G4 | |
| Asus ZenBook S13 OLED UX5304 | |
| Dell Latitude 13 7340 i5-1345U | |
| MSI Prestige 13 AI Evo | |
| CrossMark / Productivity | |
| Lenovo ThinkPad X1 Nano Gen 3 | |
| HP Dragonfly G4 | |
| Ortalama Intel Core Ultra 7 155H, Intel Arc 8-Core iGPU (1291 - 1798, n=33) | |
| Sınıf ortalaması Subnotebook (364 - 2277, n=60, son 2 yıl) | |
| Asus ZenBook S13 OLED UX5304 | |
| Dell Latitude 13 7340 i5-1345U | |
| MSI Prestige 13 AI Evo | |
| CrossMark / Creativity | |
| Lenovo ThinkPad X1 Nano Gen 3 | |
| Sınıf ortalaması Subnotebook (372 - 2743, n=60, son 2 yıl) | |
| Ortalama Intel Core Ultra 7 155H, Intel Arc 8-Core iGPU (1519 - 1929, n=33) | |
| HP Dragonfly G4 | |
| Asus ZenBook S13 OLED UX5304 | |
| Dell Latitude 13 7340 i5-1345U | |
| MSI Prestige 13 AI Evo | |
| CrossMark / Responsiveness | |
| Lenovo ThinkPad X1 Nano Gen 3 | |
| Ortalama Intel Core Ultra 7 155H, Intel Arc 8-Core iGPU (939 - 1802, n=33) | |
| Asus ZenBook S13 OLED UX5304 | |
| HP Dragonfly G4 | |
| Sınıf ortalaması Subnotebook (312 - 1854, n=60, son 2 yıl) | |
| Dell Latitude 13 7340 i5-1345U | |
| MSI Prestige 13 AI Evo | |
| WebXPRT 3 / Overall | |
| Sınıf ortalaması Subnotebook (156 - 530, n=56, son 2 yıl) | |
| Lenovo ThinkPad X1 Nano Gen 3 | |
| HP Dragonfly G4 | |
| Asus ZenBook S13 OLED UX5304 | |
| Ortalama Intel Core Ultra 7 155H, Intel Arc 8-Core iGPU (252 - 299, n=34) | |
| MSI Prestige 13 AI Evo | |
| WebXPRT 4 / Overall | |
| Sınıf ortalaması Subnotebook (132 - 378, n=61, son 2 yıl) | |
| Lenovo ThinkPad X1 Nano Gen 3 | |
| HP Dragonfly G4 | |
| Asus ZenBook S13 OLED UX5304 | |
| Ortalama Intel Core Ultra 7 155H, Intel Arc 8-Core iGPU (166.4 - 309, n=29) | |
| MSI Prestige 13 AI Evo | |
| Mozilla Kraken 1.1 / Total | |
| Dell Latitude 13 7340 i5-1345U | |
| MSI Prestige 13 AI Evo | |
| Ortalama Intel Core Ultra 7 155H, Intel Arc 8-Core iGPU (517 - 614, n=35) | |
| Asus ZenBook S13 OLED UX5304 | |
| Lenovo ThinkPad X1 Nano Gen 3 | |
| HP Dragonfly G4 | |
| Sınıf ortalaması Subnotebook (234 - 1104, n=61, son 2 yıl) | |
* ... daha küçük daha iyidir
| PCMark 10 Score | 5952 puan | |
Yardım | ||
| AIDA64 / Memory Copy | |
| Sınıf ortalaması Subnotebook (14554 - 131023, n=58, son 2 yıl) | |
| Ortalama Intel Core Ultra 7 155H (62397 - 96791, n=50) | |
| MSI Prestige 13 AI Evo | |
| Lenovo ThinkPad X1 Nano Gen 3 | |
| Asus ZenBook S13 OLED UX5304 | |
| HP Dragonfly G4 | |
| Dell Latitude 13 7340 i5-1345U | |
| AIDA64 / Memory Read | |
| Sınıf ortalaması Subnotebook (15948 - 127174, n=58, son 2 yıl) | |
| Ortalama Intel Core Ultra 7 155H (60544 - 90647, n=50) | |
| MSI Prestige 13 AI Evo | |
| Lenovo ThinkPad X1 Nano Gen 3 | |
| Asus ZenBook S13 OLED UX5304 | |
| HP Dragonfly G4 | |
| Dell Latitude 13 7340 i5-1345U | |
| AIDA64 / Memory Write | |
| Lenovo ThinkPad X1 Nano Gen 3 | |
| Sınıf ortalaması Subnotebook (15709 - 135141, n=58, son 2 yıl) | |
| MSI Prestige 13 AI Evo | |
| Ortalama Intel Core Ultra 7 155H (58692 - 93451, n=50) | |
| Asus ZenBook S13 OLED UX5304 | |
| Dell Latitude 13 7340 i5-1345U | |
| HP Dragonfly G4 | |
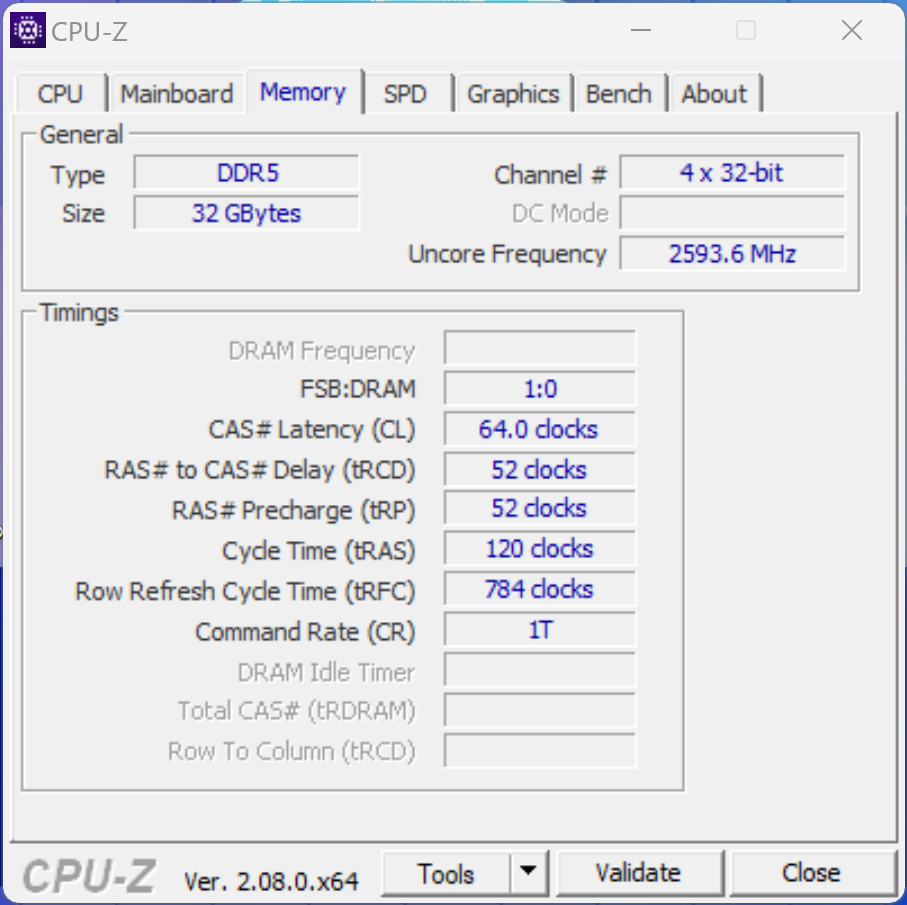
| AIDA64 / Memory Latency | |
| MSI Prestige 13 AI Evo | |
| Ortalama Intel Core Ultra 7 155H (116.2 - 233, n=50) | |
| Dell Latitude 13 7340 i5-1345U | |
| Sınıf ortalaması Subnotebook (6.1 - 159.9, n=56, son 2 yıl) | |
| Lenovo ThinkPad X1 Nano Gen 3 | |
| HP Dragonfly G4 | |
| Asus ZenBook S13 OLED UX5304 | |
* ... daha küçük daha iyidir
DPC gecikme süresi
Standartlaştırılmış gecikme testimizde (internette gezinme, 4K YouTube oynatma, CPU yükü), mevcut BIOS sürümüne sahip test cihazı, gerçek zamanlı ses uygulamalarını kullanırken bazı sınırlamalar gösterdi.
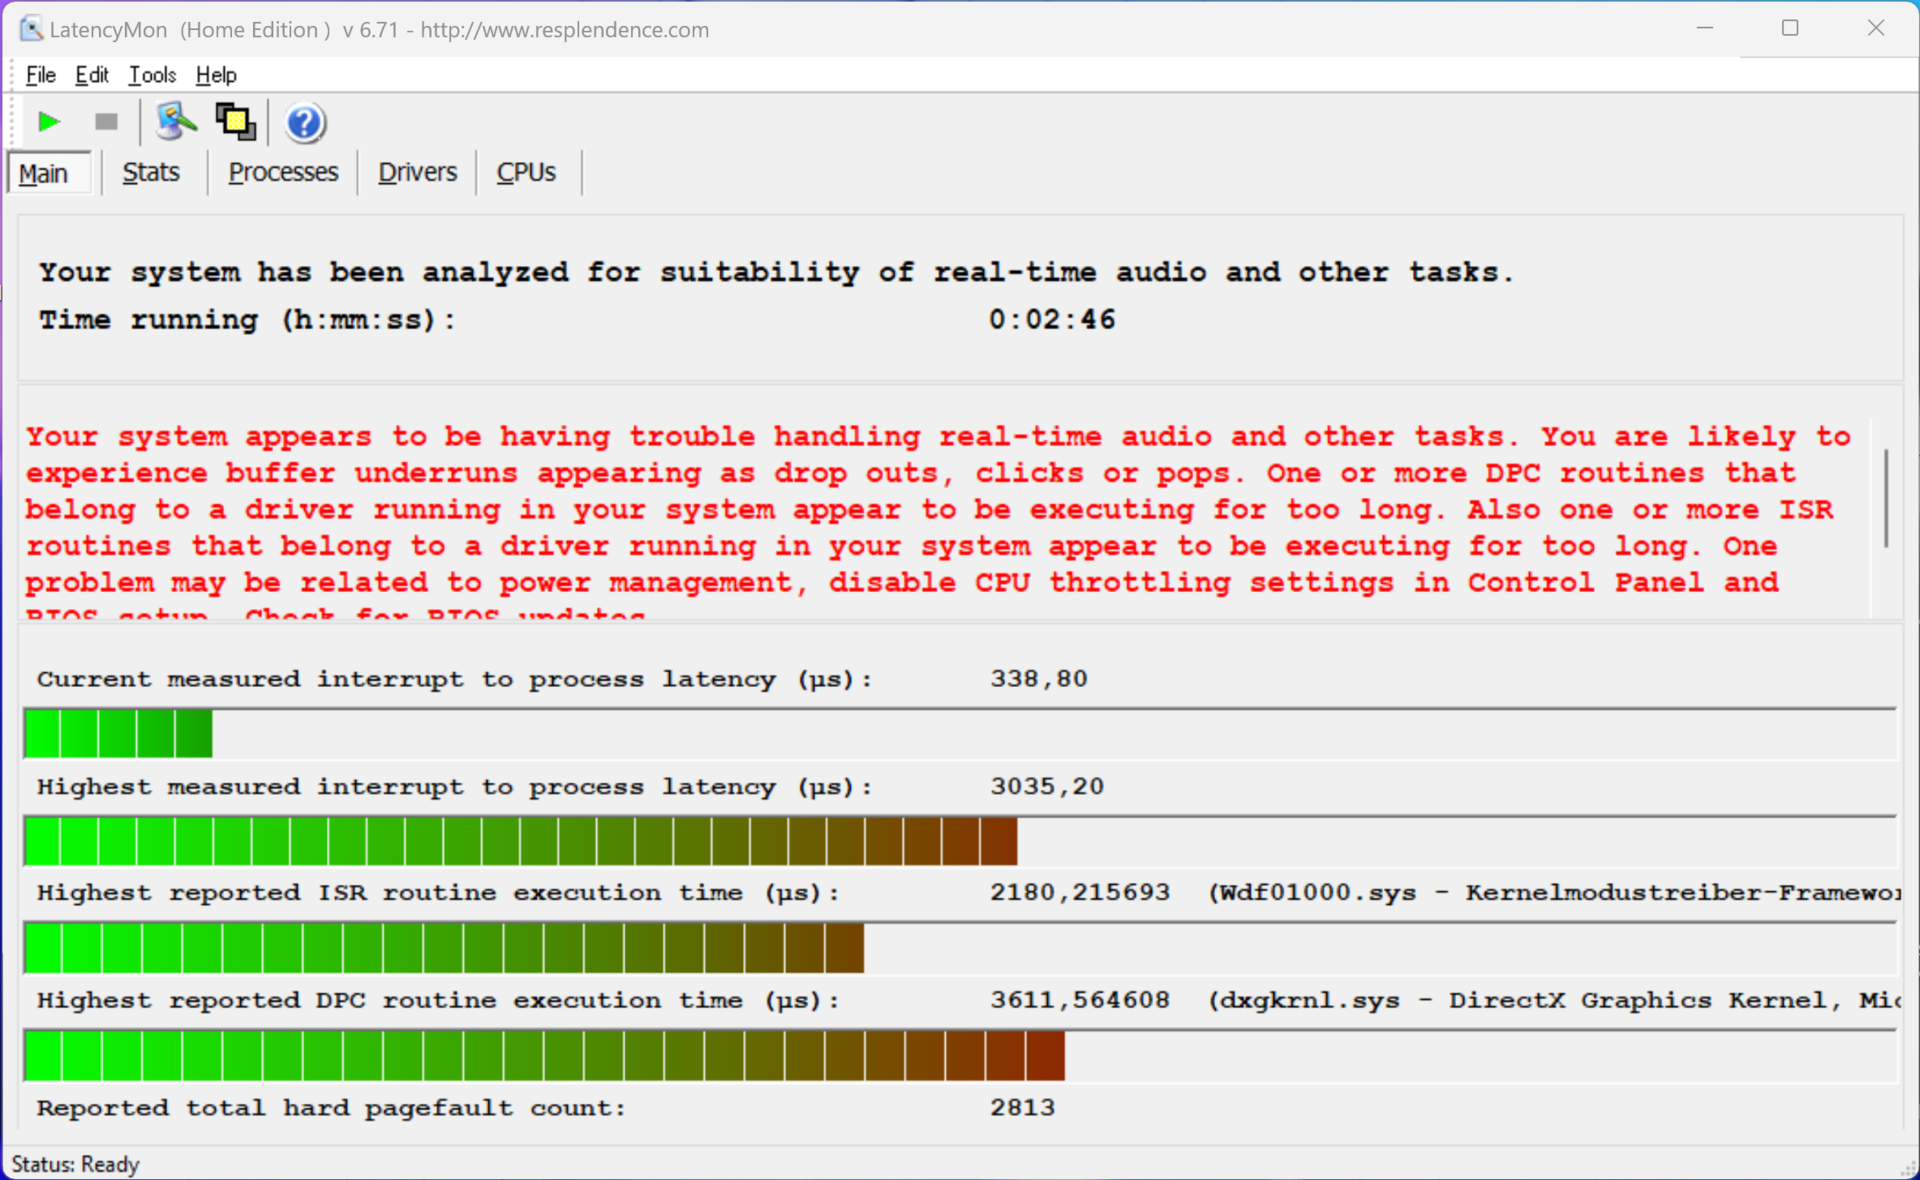
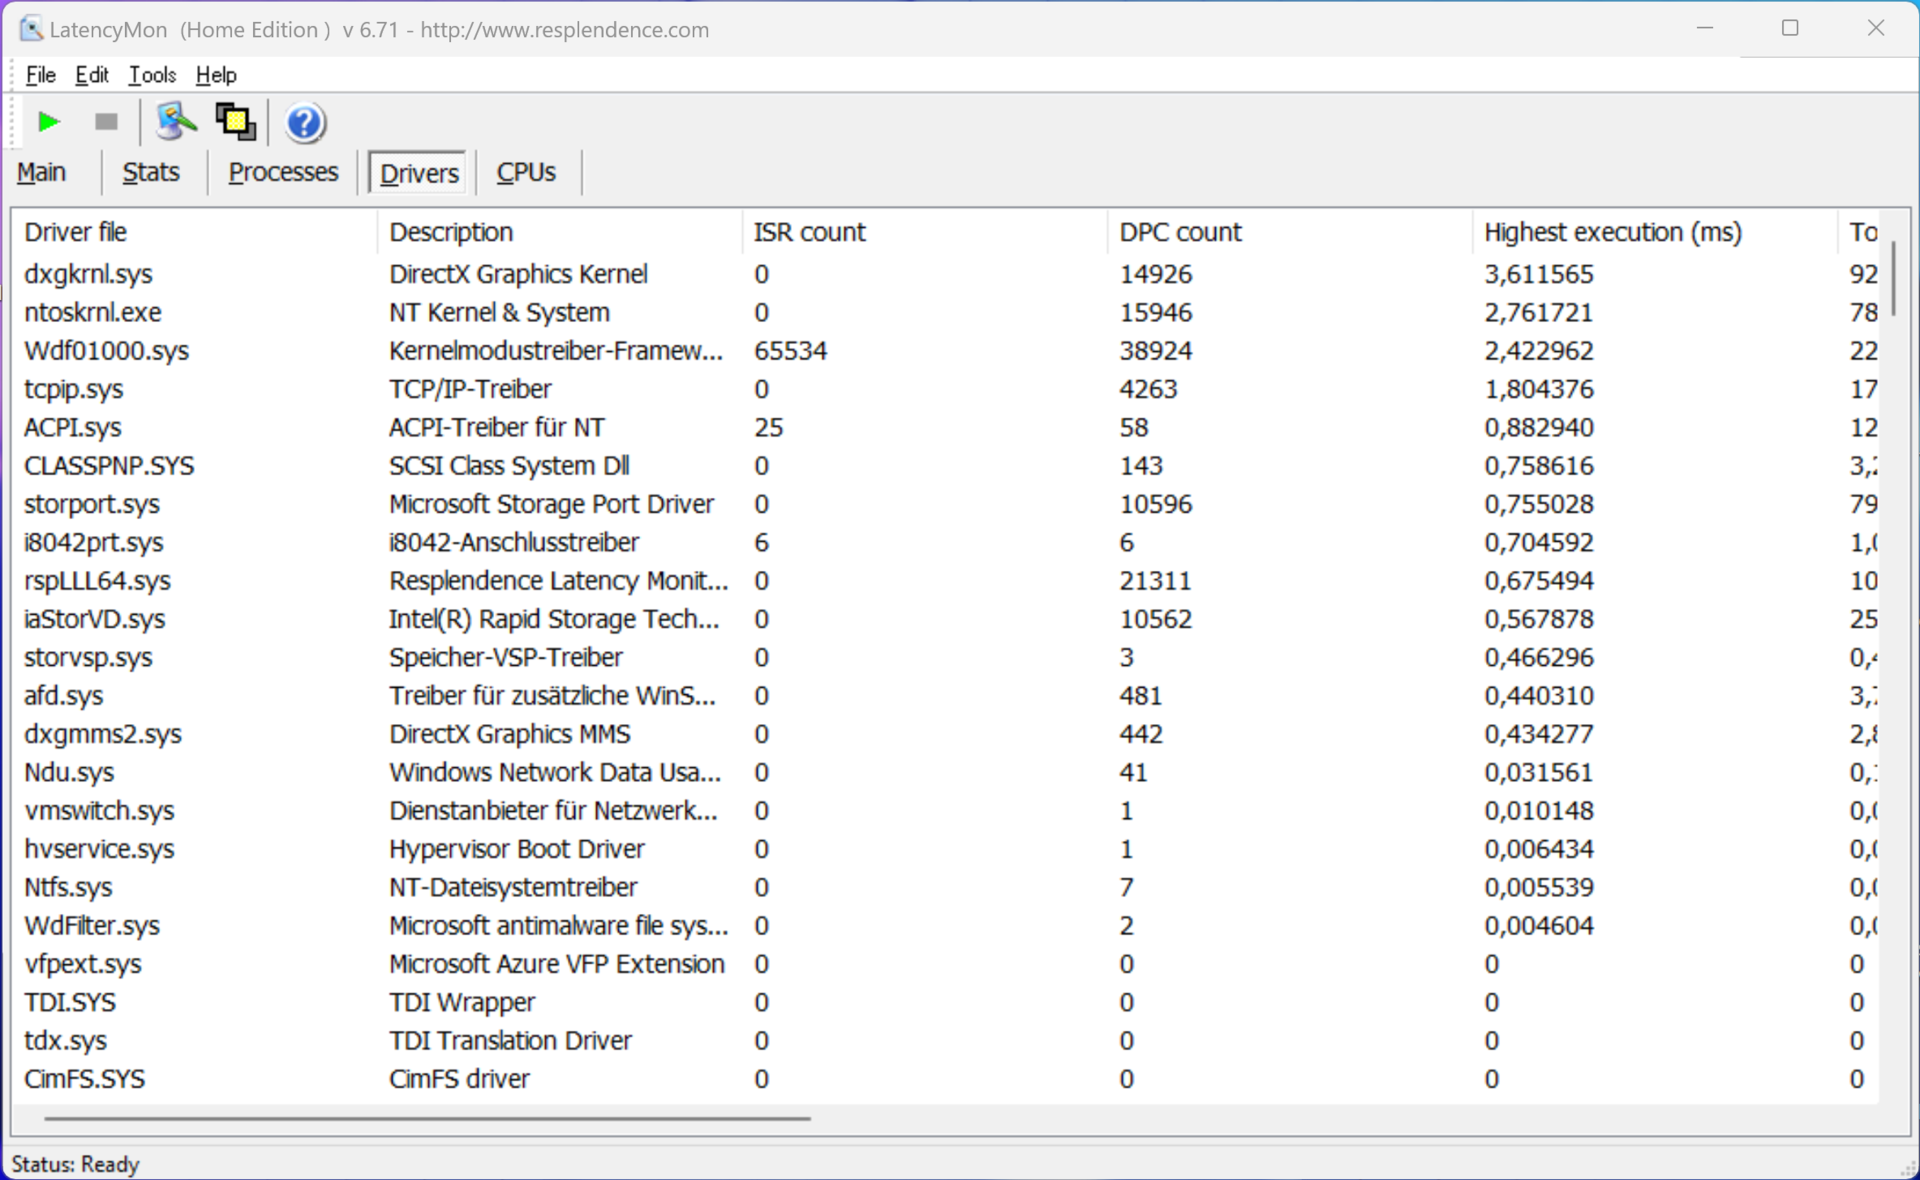
| DPC Latencies / LatencyMon - interrupt to process latency (max), Web, Youtube, Prime95 | |
| MSI Prestige 13 AI Evo | |
| Lenovo ThinkPad X1 Nano Gen 3 | |
| Dell Latitude 13 7340 i5-1345U | |
| Asus ZenBook S13 OLED UX5304 | |
| HP Dragonfly G4 | |
* ... daha küçük daha iyidir
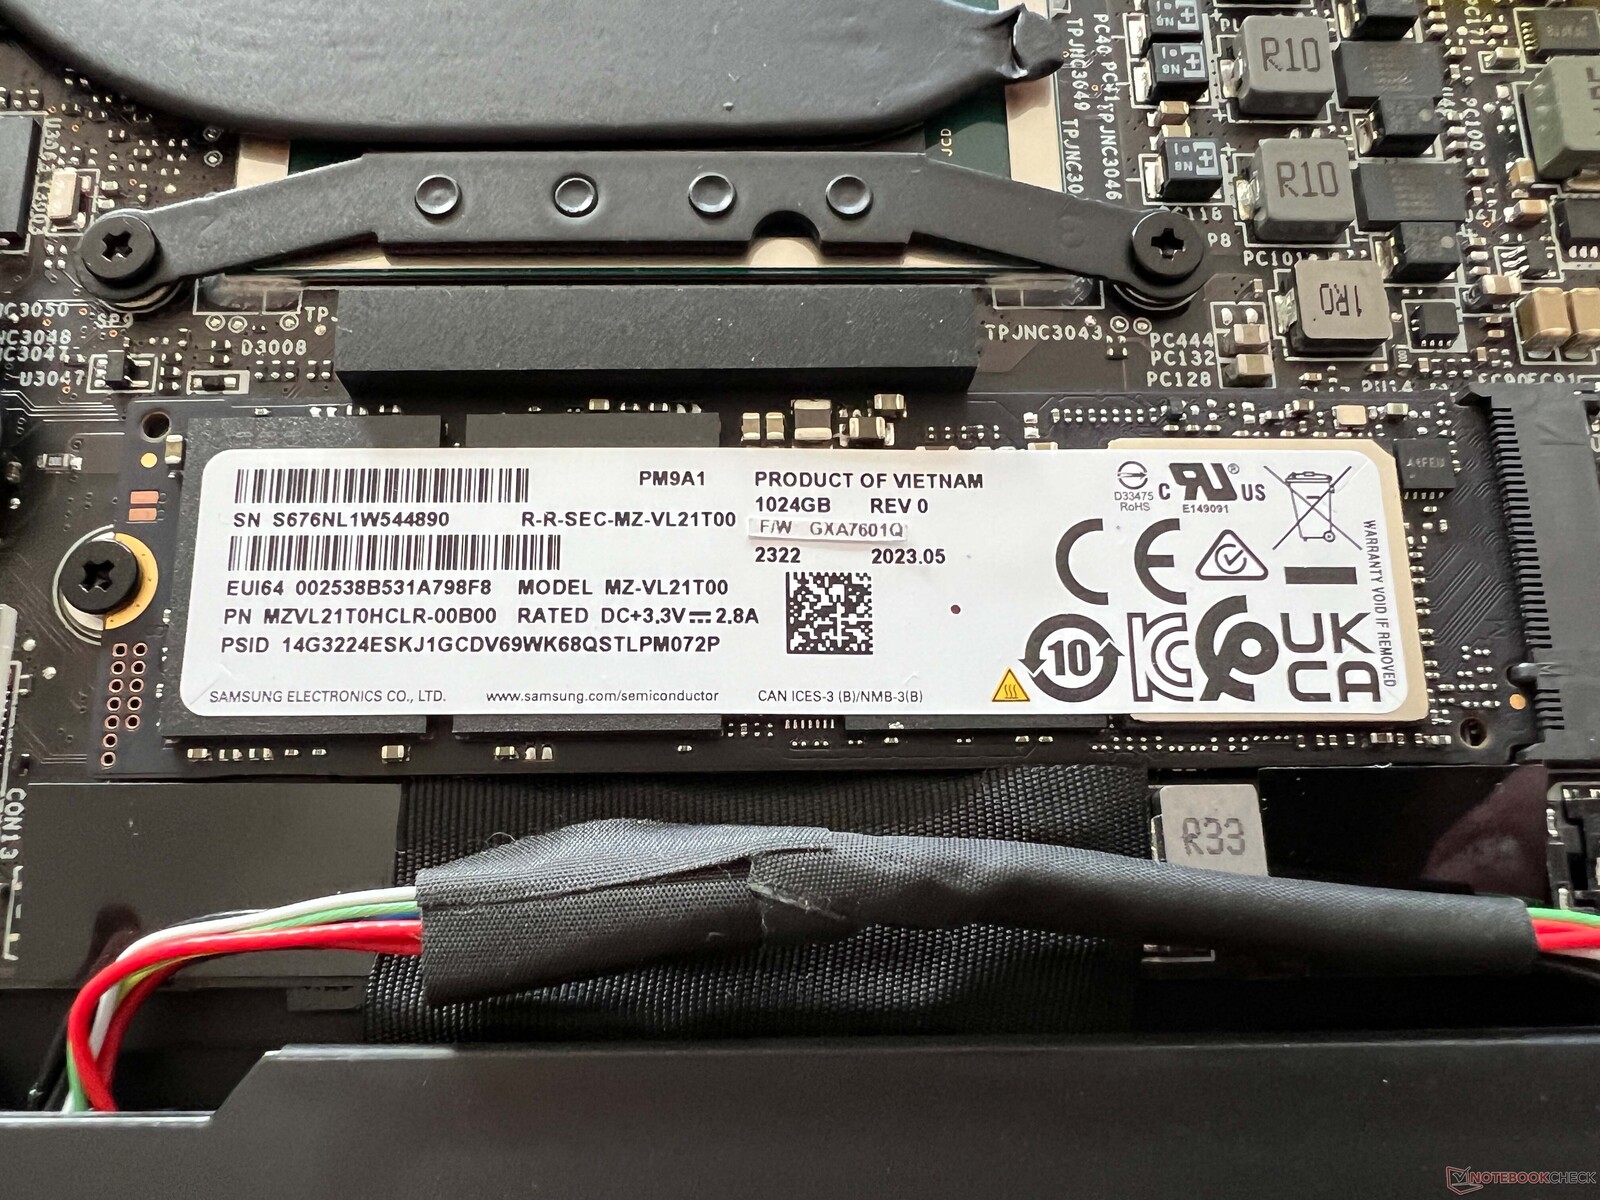
Depolama cihazları
Test cihazımız, çok hızlı bir depolama cihazı olan Samsung PM9A1'in (980 Pro'nun OEM versiyonu) 1 TB'lık versiyonuyla donatılmıştır. Bununla birlikte, performansı sürekli yük altında sabit kalmıyor, ancak bu günlük kullanım sırasında herhangi bir sorun teşkil etmemelidir. Cihaz ilk kez açıldıktan sonra kullanıcıların kullanabileceği 864 GB boş alan vardır. Diğer SSD kıyaslamalarını bulabilirsiniz burada.

| Drive Performance rating - Percent | |
| MSI Prestige 13 AI Evo | |
| Ortalama Samsung PM9A1 MZVL21T0HCLR | |
| Asus ZenBook S13 OLED UX5304 | |
| Sınıf ortalaması Subnotebook | |
| HP Dragonfly G4 | |
| Lenovo ThinkPad X1 Nano Gen 3 | |
| Dell Latitude 13 7340 i5-1345U | |
* ... daha küçük daha iyidir
Reading continuous performance: DiskSpd Read Loop, Queue Depth 8
Grafik kartı
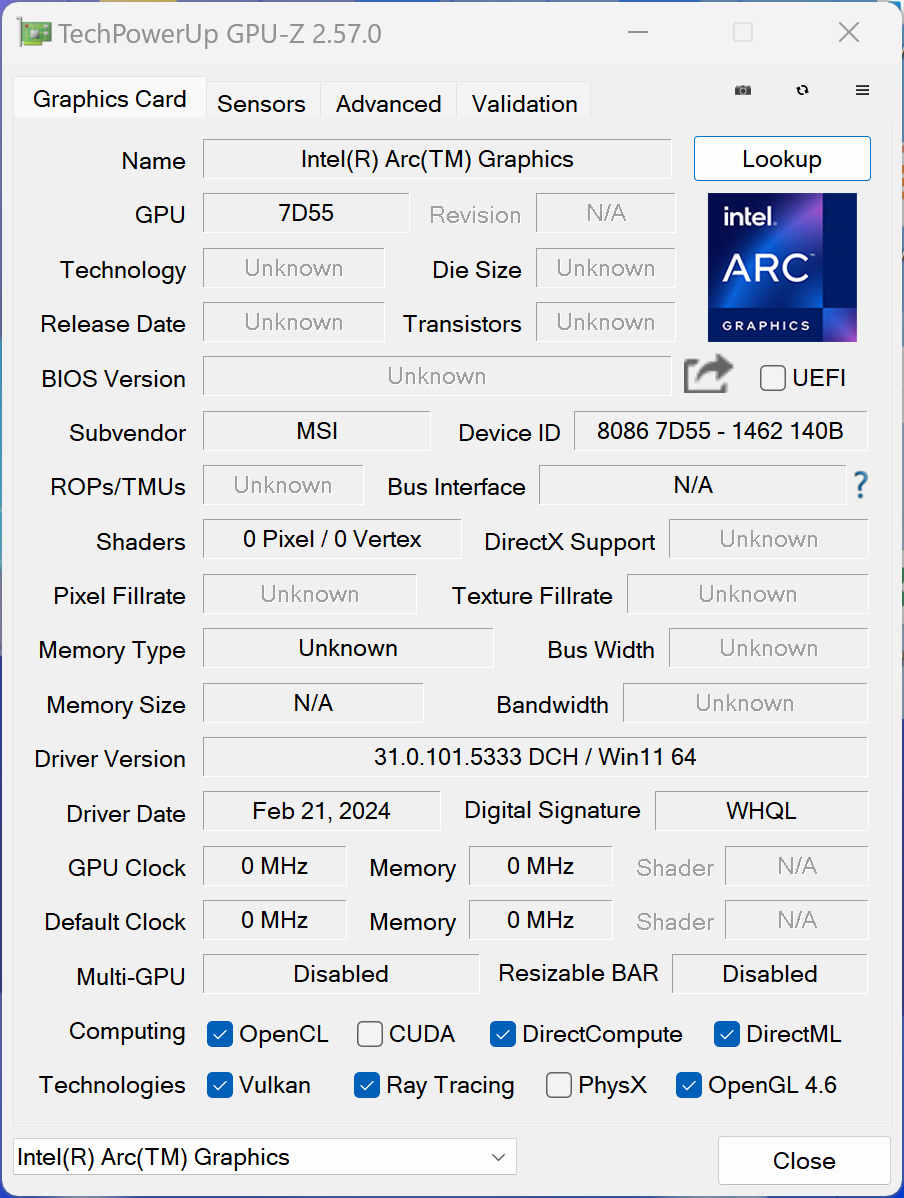
Ile birlikte Core Ultra 7 155H, yeni Intel Ark Grafikleri 8 Xe-çekirdek sunan MSI Prestige 13'ün toplam grafik performansı, şimdiye kadar test ettiğimiz tüm yeni Meteor-Lake dizüstü bilgisayarlar arasında en kötüsüydü (veritabanımızdaki ortalamaya kıyasla -%32). Sentetik kıyaslamalar sırasında bile MSI, eski dizüstü bilgisayarın sadece biraz önünde yer aldı Iris Xe Graphics G7. Yüksek çözünürlüklü video oynatmak gibi günlük görevler söz konusu olduğunda MSI herhangi bir sorun yaşamıyor, ancak yeni iGPU'yu tam potansiyeliyle kullanamıyor.
MSI'ın oyun testleri sırasında Zenbook 14 veya HP Spectre x360 14 ile aynı kare düşüşlerini yaşamaması gibi olumlu bir durumdan bahsetmek istiyoruz. Oyun performansı genel olarak oldukça düşük, ancak en azından istikrarlı. Pil kullanımında da performansı sabit kalıyor ve daha fazla kıyaslamaya buradan ulaşabilirsiniz.
| 3DMark Performance rating - Percent | |
| Ortalama Intel Arc 8-Core iGPU | |
| Sınıf ortalaması Subnotebook | |
| MSI Prestige 13 AI Evo | |
| HP Dragonfly G4 | |
| Asus ZenBook S13 OLED UX5304 | |
| Lenovo ThinkPad X1 Nano Gen 3 | |
| Dell Latitude 13 7340 i5-1345U | |
| 3DMark 11 - 1280x720 Performance GPU | |
| Ortalama Intel Arc 8-Core iGPU (8064 - 13716, n=40) | |
| Sınıf ortalaması Subnotebook (995 - 18489, n=55, son 2 yıl) | |
| MSI Prestige 13 AI Evo | |
| Lenovo ThinkPad X1 Nano Gen 3 | |
| HP Dragonfly G4 | |
| Asus ZenBook S13 OLED UX5304 | |
| Dell Latitude 13 7340 i5-1345U | |
| 3DMark | |
| 1920x1080 Fire Strike Graphics | |
| Ortalama Intel Arc 8-Core iGPU (5568 - 9692, n=44) | |
| Sınıf ortalaması Subnotebook (832 - 16347, n=56, son 2 yıl) | |
| MSI Prestige 13 AI Evo | |
| HP Dragonfly G4 | |
| Asus ZenBook S13 OLED UX5304 | |
| Dell Latitude 13 7340 i5-1345U | |
| Lenovo ThinkPad X1 Nano Gen 3 | |
| 2560x1440 Time Spy Graphics | |
| Ortalama Intel Arc 8-Core iGPU (2018 - 3770, n=47) | |
| Sınıf ortalaması Subnotebook (804 - 6288, n=55, son 2 yıl) | |
| MSI Prestige 13 AI Evo | |
| HP Dragonfly G4 | |
| Asus ZenBook S13 OLED UX5304 | |
| Dell Latitude 13 7340 i5-1345U | |
| Lenovo ThinkPad X1 Nano Gen 3 | |
| 3DMark 11 Performance | 8505 puan | |
| 3DMark Fire Strike Score | 5203 puan | |
| 3DMark Time Spy Score | 2178 puan | |
Yardım | ||
| Blender / v3.3 Classroom CPU | |
| Dell Latitude 13 7340 i5-1345U | |
| Asus ZenBook S13 OLED UX5304 | |
| HP Dragonfly G4 | |
| Lenovo ThinkPad X1 Nano Gen 3 | |
| MSI Prestige 13 AI Evo | |
| Sınıf ortalaması Subnotebook (241 - 861, n=60, son 2 yıl) | |
| Ortalama Intel Arc 8-Core iGPU (294 - 692, n=43) | |
* ... daha küçük daha iyidir
| Performance rating - Percent | |
| Sınıf ortalaması Subnotebook | |
| MSI Prestige 13 AI Evo | |
| HP Dragonfly G4 | |
| Lenovo ThinkPad X1 Nano Gen 3 -1! | |
| Asus ZenBook S13 OLED UX5304 | |
| Dell Latitude 13 7340 i5-1345U | |
| The Witcher 3 - 1920x1080 Ultra Graphics & Postprocessing (HBAO+) | |
| Sınıf ortalaması Subnotebook (13.9 - 34.6, n=13, son 2 yıl) | |
| HP Dragonfly G4 | |
| MSI Prestige 13 AI Evo | |
| Lenovo ThinkPad X1 Nano Gen 3 | |
| Asus ZenBook S13 OLED UX5304 | |
| Dell Latitude 13 7340 i5-1345U | |
| GTA V - 1920x1080 Highest AA:4xMSAA + FX AF:16x | |
| Sınıf ortalaması Subnotebook (10.7 - 43.7, n=56, son 2 yıl) | |
| HP Dragonfly G4 | |
| MSI Prestige 13 AI Evo | |
| Asus ZenBook S13 OLED UX5304 | |
| Dell Latitude 13 7340 i5-1345U | |
| Final Fantasy XV Benchmark - 1920x1080 High Quality | |
| Sınıf ortalaması Subnotebook (11.6 - 54.5, n=54, son 2 yıl) | |
| MSI Prestige 13 AI Evo | |
| HP Dragonfly G4 | |
| Asus ZenBook S13 OLED UX5304 | |
| Lenovo ThinkPad X1 Nano Gen 3 | |
| Dell Latitude 13 7340 i5-1345U | |
| Strange Brigade - 1920x1080 ultra AA:ultra AF:16 | |
| Sınıf ortalaması Subnotebook (19 - 101.3, n=50, son 2 yıl) | |
| MSI Prestige 13 AI Evo | |
| HP Dragonfly G4 | |
| Asus ZenBook S13 OLED UX5304 | |
| Dell Latitude 13 7340 i5-1345U | |
| Lenovo ThinkPad X1 Nano Gen 3 | |
| Dota 2 Reborn - 1920x1080 ultra (3/3) best looking | |
| Sınıf ortalaması Subnotebook (13 - 97, n=61, son 2 yıl) | |
| HP Dragonfly G4 | |
| MSI Prestige 13 AI Evo | |
| Asus ZenBook S13 OLED UX5304 | |
| Dell Latitude 13 7340 i5-1345U | |
| Lenovo ThinkPad X1 Nano Gen 3 | |
| X-Plane 11.11 - 1920x1080 high (fps_test=3) | |
| Sınıf ortalaması Subnotebook (20.7 - 50.5, n=53, son 2 yıl) | |
| MSI Prestige 13 AI Evo | |
| Lenovo ThinkPad X1 Nano Gen 3 | |
| HP Dragonfly G4 | |
| Asus ZenBook S13 OLED UX5304 | |
| Dell Latitude 13 7340 i5-1345U | |
Witcher 3 FPS diagram
| düşük | orta | yüksek | ultra | |
|---|---|---|---|---|
| GTA V (2015) | 99.1 | 93.8 | 26.2 | 9.97 |
| The Witcher 3 (2015) | 92 | 59 | 36 | 14.5 |
| Dota 2 Reborn (2015) | 89.9 | 75.9 | 57.7 | 53.3 |
| Final Fantasy XV Benchmark (2018) | 43.8 | 28 | 17 | |
| X-Plane 11.11 (2018) | 47.4 | 37.7 | 32.1 | |
| Far Cry 5 (2018) | 47 | 33 | 31 | 28 |
| Strange Brigade (2018) | 121 | 53 | 41 | 32 |
| F1 2021 (2021) | 94.8 | 50.8 | 41.3 | 20.3 |
| F1 22 (2022) | 59.1 | 49.6 | 36.8 | 9.33 |
| F1 23 (2023) | 44.1 | 36.3 | 27.1 | 7.45 |
Emisyonlar - Zayıf hoparlörler
Gürültü emisyonları
MSI dizüstü bilgisayar, bir ısı borusu ve bir fandan oluşan ve ne yazık ki cihaz boştayken bile genellikle düşük hızda çalışan bir soğutma ünitesine sahiptir. Vınlama sesi rahatsız edici olmasa da, daha sessiz ortamlarda kesinlikle duyabilirsiniz. Yük altında fan hızla 32 dB(A)'ya ulaştı ve stres testi sırasında 40 dB(A) kaydettik. Bu hiç de sessiz değil ve test örneğimizin karşılaştırma alanındaki en gürültülü örnek olduğu ortaya çıktı. CoolerBooster işlevi kullanıldığında, küçük fan 51 dB(A)'ya bile ulaştı. Herhangi bir ek elektronik ses fark etmedik.
Ses yüksekliği
| Boşta |
| 23.4 / 26.9 / 26.9 dB |
| Çalışırken |
| 32 / 40.3 dB |
 | ||
30 dB sessiz 40 dB(A) duyulabilirlik 50 dB(A) gürültülü |
||
min: | ||
| MSI Prestige 13 AI Evo Arc 8-Core, Ultra 7 155H, Samsung PM9A1 MZVL21T0HCLR | Lenovo ThinkPad X1 Nano Gen 3 Iris Xe G7 96EUs, i7-1360P, Lenovo UMIS AM6A0 RPJTJ512MKP1QDQ | Dell Latitude 13 7340 i5-1345U Iris Xe G7 80EUs, i5-1345U, Kioxia BG5 KBG50ZNS512G | HP Dragonfly G4 Iris Xe G7 96EUs, i7-1365U, Micron 3400 MTFDKBA512TFH 512GB | Asus ZenBook S13 OLED UX5304 Iris Xe G7 96EUs, i7-1355U, Samsung PM9A1 MZVL21T0HCLR | |
|---|---|---|---|---|---|
| Noise | 3% | -1% | 6% | -2% | |
| kapalı / ortam * (dB) | 23.4 | 22.9 2% | 25.02 -7% | 23.3 -0% | 23.3 -0% |
| Idle Minimum * (dB) | 23.4 | 23 2% | 25.02 -7% | 23.5 -0% | 23.3 -0% |
| Idle Average * (dB) | 26.9 | 23 14% | 25.02 7% | 23.5 13% | 23.3 13% |
| Idle Maximum * (dB) | 26.9 | 23 14% | 25.02 7% | 26.8 -0% | 23.3 13% |
| Load Average * (dB) | 32 | 32.8 -2% | 35.07 -10% | 27.2 15% | 37.7 -18% |
| Witcher 3 ultra * (dB) | 32 | 36.9 -15% | 32.7 -2% | 40.1 -25% | |
| Load Maximum * (dB) | 40.3 | 36.9 8% | 38.2 5% | 35 13% | 40.1 -0% |
* ... daha küçük daha iyidir
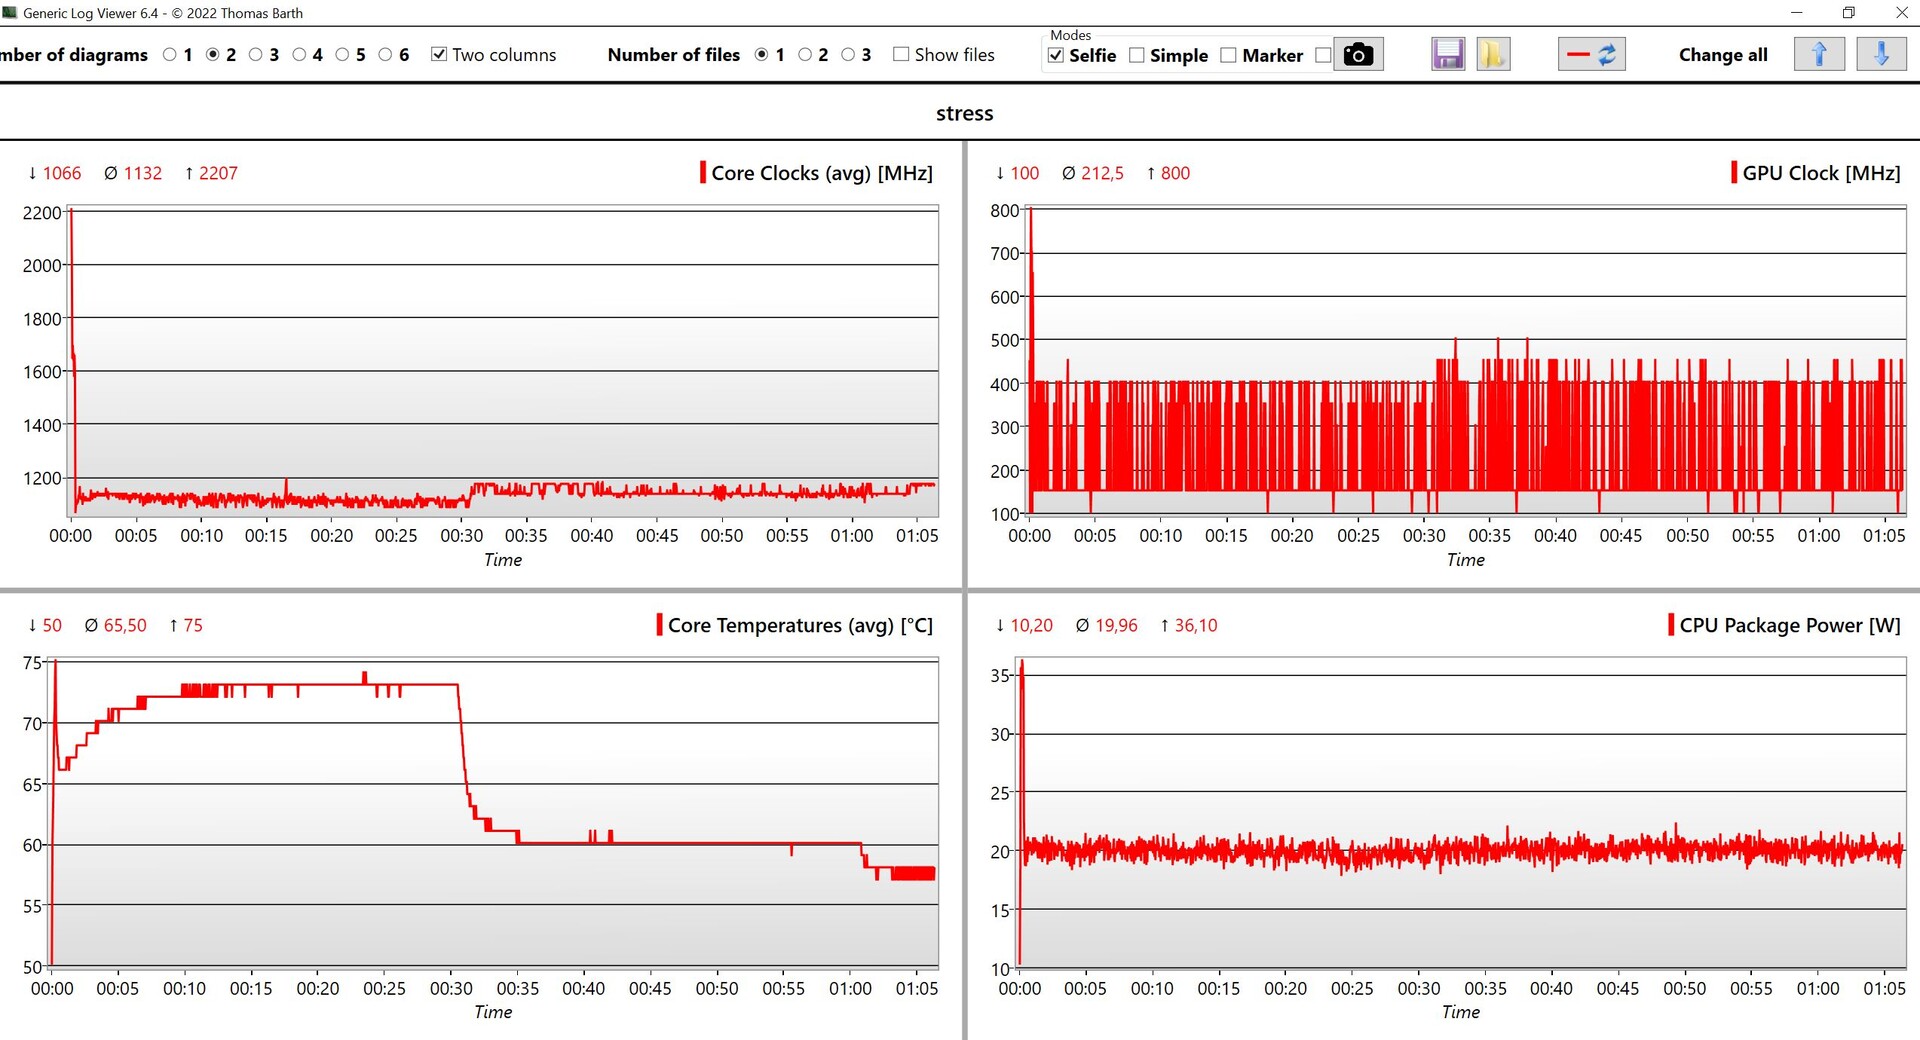
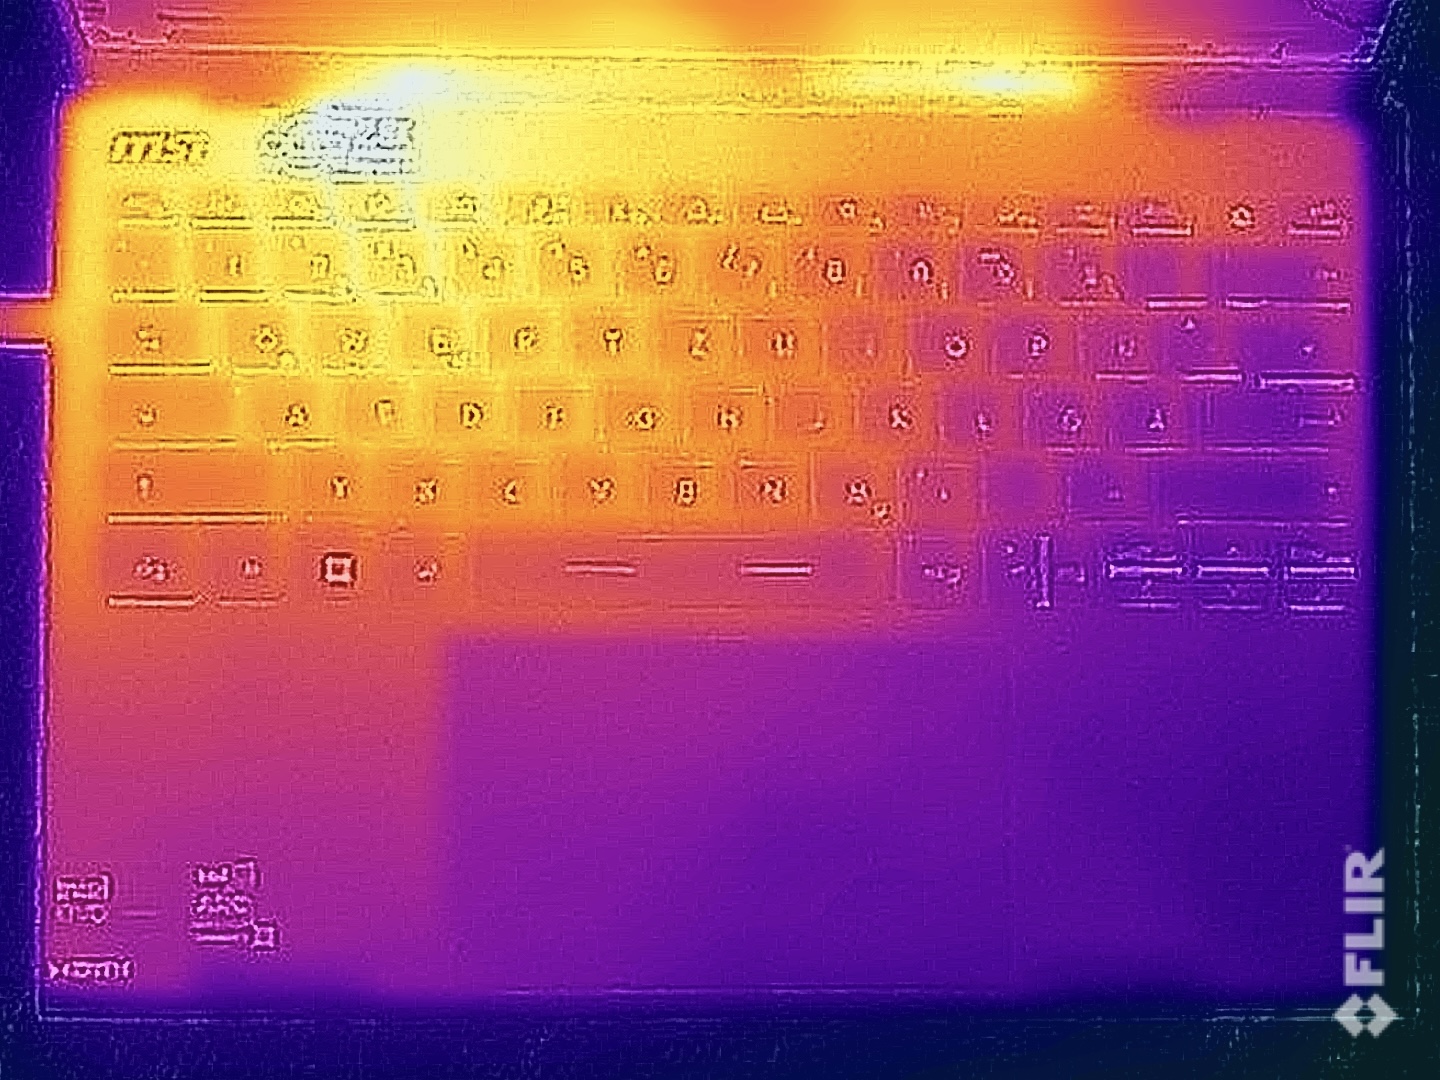
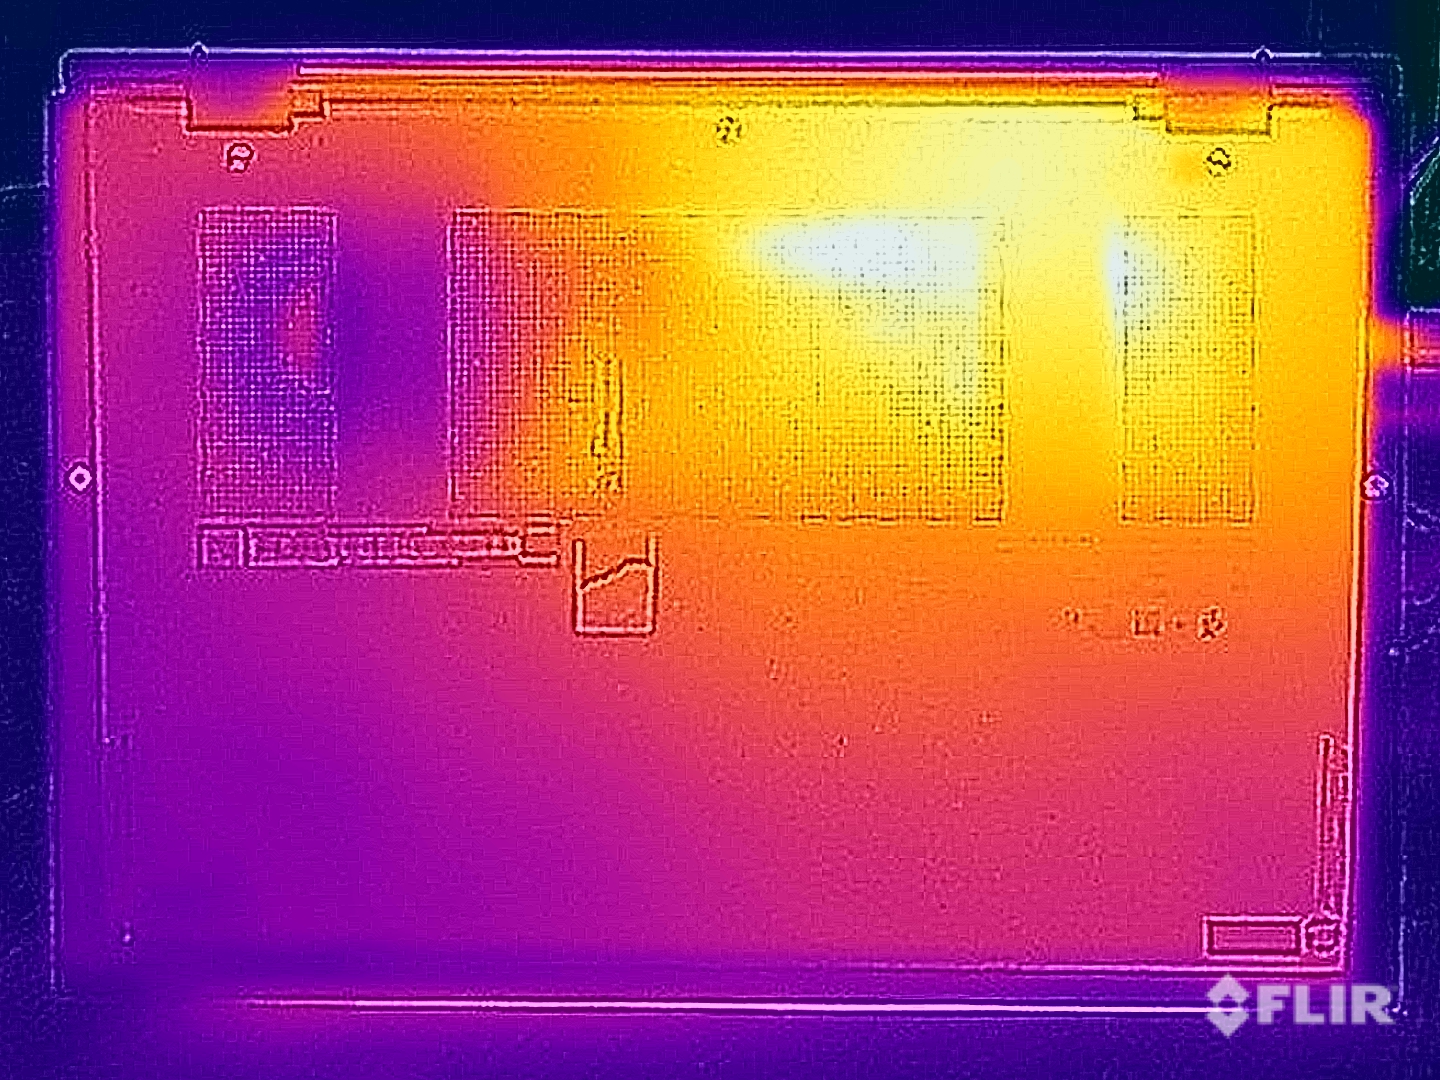
Sıcaklık
Günlük kullanımda Prestige 13 çoğunlukla serin kalıyor ve stres testi sırasında bile ana ünitenin üstünde ve altında maksimum 40 °C ölçtük. Soğutucu sol tarafta yer alıyor, bu yüzden en çok bu alan ısınıyor. Stres testi sırasında CPU'nun güç tüketimi hızla 20 watt'ta dengelendi ve daha sonra bu seviyede kaldı.
(±) Üst taraftaki maksimum sıcaklık, 35.9 °C / 97 F ortalamasına kıyasla 40.9 °C / 106 F'dir. , Subnotebook sınıfı için 21.4 ile 59 °C arasında değişir.
(±) Alt kısım, 39.2 °C / 103 F ortalamasına kıyasla maksimum 40.4 °C / 105 F'ye kadar ısınır
(+) Boşta kullanımda, üst tarafın ortalama sıcaklığı 23.3 °C / 74 F olup, cihazın 30.8 °C / 87 F.
(+) The Witcher 3 oynarken, üst tarafın ortalama sıcaklığı 30.9 °C / 88 F olup, cihazın 30.8 °C / 87 F.
(+) Avuç içi dayanakları ve dokunmatik yüzey, maksimum 27.9 °C / 82.2 F ile cilt sıcaklığından daha soğuktur ve bu nedenle dokunulduğunda soğuktur.
(±) Benzer cihazların avuç içi dayanağı alanının ortalama sıcaklığı 28.2 °C / 82.8 F (+0.3 °C / 0.6 F) idi.
| MSI Prestige 13 AI Evo Intel Core Ultra 7 155H, Intel Arc 8-Core iGPU | Lenovo ThinkPad X1 Nano Gen 3 Intel Core i7-1360P, Intel Iris Xe Graphics G7 96EUs | Dell Latitude 13 7340 i5-1345U Intel Core i5-1345U, Intel Iris Xe Graphics G7 80EUs | HP Dragonfly G4 Intel Core i7-1365U, Intel Iris Xe Graphics G7 96EUs | Asus ZenBook S13 OLED UX5304 Intel Core i7-1355U, Intel Iris Xe Graphics G7 96EUs | |
|---|---|---|---|---|---|
| Heat | -4% | -1% | -5% | -9% | |
| Maximum Upper Side * (°C) | 40.9 | 44 -8% | 34.3 16% | 38.6 6% | 43.1 -5% |
| Maximum Bottom * (°C) | 40.4 | 43.2 -7% | 37.6 7% | 40.4 -0% | 45 -11% |
| Idle Upper Side * (°C) | 25 | 25.6 -2% | 28.4 -14% | 28.2 -13% | 27.3 -9% |
| Idle Bottom * (°C) | 25.5 | 25.6 -0% | 28.8 -13% | 29 -14% | 27.8 -9% |
* ... daha küçük daha iyidir
Konuşmacılar
Stereo hoparlörler, kompakt subnotebook'un zayıf yönlerine aittir. Maksimum ses seviyesi iyi olabilir, ancak sesin kendisi çok fazla boyuta sahip değil ve cihazın rakiplerinin çoğunun sunabildiği şeyleri açıkça kaçırıyorlar.
MSI Prestige 13 AI Evo ses analizi
(±) | hoparlör ses yüksekliği ortalama ama iyi (81.8 dB)
Bas 100 - 315Hz
(-) | neredeyse hiç bas yok - ortalama olarak medyandan 20.5% daha düşük
(±) | Bas doğrusallığı ortalamadır (8.4% delta - önceki frekans)
Ortalar 400 - 2000 Hz
(±) | daha yüksek ortalar - ortalama olarak medyandan 6.1% daha yüksek
(+) | orta frekanslar doğrusaldır (5.9% deltadan önceki frekansa)
Yüksekler 2 - 16 kHz
(+) | dengeli yüksekler - medyandan yalnızca 4.7% uzakta
(+) | yüksekler doğrusaldır (5.4% deltadan önceki frekansa)
Toplam 100 - 16.000 Hz
(±) | Genel sesin doğrusallığı ortalamadır (19% ortancaya göre fark)
Aynı sınıfla karşılaştırıldığında
» Bu sınıftaki tüm test edilen cihazların %58%'si daha iyi, 6% benzer, 36% daha kötüydü
» En iyisinin deltası 5% idi, ortalama 18% idi, en kötüsü 53% idi
Test edilen tüm cihazlarla karşılaştırıldığında
» Test edilen tüm cihazların %45'si daha iyi, 7 benzer, % 48 daha kötüydü
» En iyisinin deltası 4% idi, ortalama 23% idi, en kötüsü 134% idi
Dell Latitude 13 7340 i5-1345U ses analizi
(+) | hoparlörler nispeten yüksek sesle çalabilir (83 dB)
Bas 100 - 315Hz
(±) | azaltılmış bas - ortalama olarak medyandan 6.2% daha düşük
(±) | Bas doğrusallığı ortalamadır (9.6% delta - önceki frekans)
Ortalar 400 - 2000 Hz
(+) | dengeli ortalar - medyandan yalnızca 2.3% uzakta
(+) | orta frekanslar doğrusaldır (5.1% deltadan önceki frekansa)
Yüksekler 2 - 16 kHz
(±) | daha yüksek en yüksekler - ortalama olarak medyandan 5.6% daha yüksek
(±) | Yükseklerin doğrusallığı ortalamadır (7.9% delta - önceki frekans)
Toplam 100 - 16.000 Hz
(+) | genel ses doğrusaldır (9% ortancaya göre fark)
Aynı sınıfla karşılaştırıldığında
» Bu sınıftaki tüm test edilen cihazların %4%'si daha iyi, 1% benzer, 95% daha kötüydü
» En iyisinin deltası 5% idi, ortalama 18% idi, en kötüsü 53% idi
Test edilen tüm cihazlarla karşılaştırıldığında
» Test edilen tüm cihazların %3'si daha iyi, 1 benzer, % 96 daha kötüydü
» En iyisinin deltası 4% idi, ortalama 23% idi, en kötüsü 134% idi
HP Dragonfly G4 ses analizi
(+) | hoparlörler nispeten yüksek sesle çalabilir (84.4 dB)
Bas 100 - 315Hz
(±) | azaltılmış bas - ortalama olarak medyandan 8.4% daha düşük
(±) | Bas doğrusallığı ortalamadır (11.6% delta - önceki frekans)
Ortalar 400 - 2000 Hz
(+) | dengeli ortalar - medyandan yalnızca 2.3% uzakta
(+) | orta frekanslar doğrusaldır (4.8% deltadan önceki frekansa)
Yüksekler 2 - 16 kHz
(+) | dengeli yüksekler - medyandan yalnızca 3.2% uzakta
(+) | yüksekler doğrusaldır (4.6% deltadan önceki frekansa)
Toplam 100 - 16.000 Hz
(+) | genel ses doğrusaldır (9.1% ortancaya göre fark)
Aynı sınıfla karşılaştırıldığında
» Bu sınıftaki tüm test edilen cihazların %4%'si daha iyi, 1% benzer, 95% daha kötüydü
» En iyisinin deltası 5% idi, ortalama 18% idi, en kötüsü 53% idi
Test edilen tüm cihazlarla karşılaştırıldığında
» Test edilen tüm cihazların %3'si daha iyi, 1 benzer, % 96 daha kötüydü
» En iyisinin deltası 4% idi, ortalama 23% idi, en kötüsü 134% idi
Güç yönetimi - 75 Wh pil ile iyi dayanıklılık
Güç tüketimi
Tüketim ölçümleri sırasında göze çarpan herhangi bir sorunla karşılaşmadık ve dizüstü bilgisayarın boştaki maksimum tüketimi yaklaşık 9 watt. Tüm OLED panellerde olduğu gibi, güç tüketimini en aza indirmeye yardımcı olmak için daha koyu arka plan görüntüleri ayarladığınızdan ve Windows'un karanlık modunu kullandığınızdan emin olmalısınız. Yük altında, güç kaynağı kısa bir süre için 65 watt sınırına ulaşıyor, ardından 33 watt'ta hızla dengeleniyor ve stres testi sırasında bu seviyede kalıyor.
| Kapalı / Bekleme modu | |
| Boşta | |
| Çalışırken |
|
Key:
min: | |
| MSI Prestige 13 AI Evo Ultra 7 155H, Arc 8-Core, Samsung PM9A1 MZVL21T0HCLR, OLED, 2880x1800, 13.3" | Lenovo ThinkPad X1 Nano Gen 3 i7-1360P, Iris Xe G7 96EUs, Lenovo UMIS AM6A0 RPJTJ512MKP1QDQ, IPS, 2160x1350, 13" | Dell Latitude 13 7340 i5-1345U i5-1345U, Iris Xe G7 80EUs, Kioxia BG5 KBG50ZNS512G, IPS, 1920x1200, 13.3" | HP Dragonfly G4 i7-1365U, Iris Xe G7 96EUs, Micron 3400 MTFDKBA512TFH 512GB, IPS, 1920x1280, 13.5" | Asus ZenBook S13 OLED UX5304 i7-1355U, Iris Xe G7 96EUs, Samsung PM9A1 MZVL21T0HCLR, OLED, 2880x1800, 13.3" | Ortalama Intel Arc 8-Core iGPU | Sınıf ortalaması Subnotebook | |
|---|---|---|---|---|---|---|---|
| Power Consumption | 6% | 3% | -1% | -3% | -28% | 5% | |
| Idle Minimum * (Watt) | 4.5 | 3.3 27% | 2.37 47% | 4.1 9% | 5.8 -29% | 5.31 ? -18% | 3.76 ? 16% |
| Idle Average * (Watt) | 8 | 6.5 19% | 6.19 23% | 7.5 6% | 8.5 -6% | 8.56 ? -7% | 6.54 ? 18% |
| Idle Maximum * (Watt) | 8.7 | 7.1 18% | 14.1 -62% | 8.2 6% | 8.8 -1% | 11.9 ? -37% | 7.89 ? 9% |
| Load Average * (Watt) | 36.1 | 40.7 -13% | 36.3 -1% | 35.5 2% | 35.1 3% | 53.6 ? -48% | 42 ? -16% |
| Witcher 3 ultra * (Watt) | 29.7 | 37 -25% | 24.9 16% | 37.5 -26% | 27.6 7% | ||
| Load Maximum * (Watt) | 65 | 58.6 10% | 69.13 -6% | 66.5 -2% | 59.5 8% | 84.2 ? -30% | 64.8 ? -0% |
* ... daha küçük daha iyidir
Power consumption Witcher 3 / stress test
Power consumption with external monitor
Çalışma Zamanları
Düşük ağırlığına rağmen MSI, dizüstü bilgisayarın OLED paneline rağmen iyi çalışma süreleri sağlayan 75 Wh'lik bir pil taktı. IPS muadilleri genellikle daha uzun süre çalışsa da, Asus'un Zenbook S13 OLED'ini kısa bir farkla geçmeyi başardı. WLAN testimiz sırasında 150 cd/m²'de (cihazın maksimum SDR parlaklığının %57'si) test örneği ~11,5 saat, tam parlaklıkta ise ~7,5 saat çalıştı. Videoları 16,5 saat (150 cd/m²) oynatmak mümkünken, tam parlaklıkta bir HDR video 6 saat çalıştırılabilir. Cihaz açıkken bir tam şarj 220 dakika sürer ve 114 dakika sonra kapasitesinin %80'i kullanılabilir hale gelir.
| MSI Prestige 13 AI Evo Ultra 7 155H, Arc 8-Core, 75 Wh | Lenovo ThinkPad X1 Nano Gen 3 i7-1360P, Iris Xe G7 96EUs, 49.5 Wh | Dell Latitude 13 7340 i5-1345U i5-1345U, Iris Xe G7 80EUs, 57 Wh | HP Dragonfly G4 i7-1365U, Iris Xe G7 96EUs, 68 Wh | Asus ZenBook S13 OLED UX5304 i7-1355U, Iris Xe G7 96EUs, 63 Wh | Sınıf ortalaması Subnotebook | |
|---|---|---|---|---|---|---|
| Pil Çalışma Süresi | -33% | 17% | 26% | -11% | -6% | |
| H.264 (h) | 16.7 | 13.8 -17% | 15.4 ? -8% | |||
| WiFi v1.3 (h) | 11.6 | 7.8 -33% | 15 29% | 15.9 37% | 11.3 -3% | 14 ? 21% |
| Load (h) | 2.8 | 2.9 4% | 3.2 14% | 2.4 -14% | 1.969 ? -30% |
Artılar
Eksiler
Karar - MSI Prestige 13, düşük ağırlığı ve OLED paneliyle göz dolduruyor

Yeni MSI Prestige 13 AI Evo'nun odak noktası açıkça taşınabilirliktir ve bu açıdan test cihazımız hafif yapısı ve iyi çalışma süreleriyle başarılı olduğunu kanıtlamaktadır. Ayrıca OLED paneli, birçok IPS modeline kıyasla bazı avantajlar da dahil olmak üzere olağanüstü görüntü kalitesi sunuyor - ancak amacınız fotoğraf düzenlemekse hiçbir şekilde mükemmel değil. Sık sık hareket halindeyken çalışıyorsanız, parlak panelin yansımaları da yolunuza çıkabilir.
Yeni Core Ultra 7 155H şeklindeki teknik verileri çok fazla performans vaat ediyor ancak gerçekte bu, şimdiye kadar test ettiğimiz en yavaş Meteor-Lake-H modeli. Günlük kullanım için birçok durumda yeterli olacaktır, ancak cihazın gerçek performans potansiyelinden (CPU ve GPU) ne kadar uzakta kaldığını unutmamalısınız. RAM'i yükseltilemiyor ancak yine de 32 GB çoğu kullanıcı için fazlasıyla yeterli olacaktır (sonuçta bu bir iş istasyonu değil).
MSI Prestige 13 AI Evo 1 kilogramdan daha hafiftir ve buna rağmen harika çalışma süreleri, çok sayıda bağlantı noktası ve OLED panel olmadan idare etmek zorunda değilsiniz. Meteor Lake işlemcisine rağmen, cihazın performansı hala en iyisi değil - ayrıca, soğutucusu günlük kullanımda neredeyse her zaman aktif.
Wi-Fi 7 ve hızlı bir kart okuyucu da dahil olmak üzere dizüstü bilgisayarın bağlantı noktaları ve bağlanabilirliği söz konusu olduğunda, şikayet edecek pek bir şeyimiz yok, ancak kompakt kasası da bazı tavizler verilmesini gerektiriyor. Buna, neredeyse her zaman aktif olan tek bir fandan oluşan soğutma ünitesi de dahil, bu da gerçekten sessiz bir cihazı nadir hale getiriyor. Buna ek olarak, mekaniği iyi olsa bile klavyesi biraz sıkışık hissettiriyor. Son olarak, zayıf hoparlörleri arzulanan daha fazlasını bırakıyor ve rekabet bu açıdan bazı açık avantajlar sunuyor.
The HP Dragonfly G4 prestige 13'ün en büyük rakibidir ve daha iyi hoparlörlerinin yanı sıra daha iyi bir klavyeye ve daha uzun çalışma sürelerine sahiptir - ancak buna karşılık, daha düşük çözünürlüğe ve öznel olarak daha kötü görüntü kalitesine sahip bir IPS panele (PWM olmadan) sahiptir. MRSP'si daha yüksektir ancak şimdiye kadar internette daha düşük fiyata bulmanız mümkün olabilir.
Fiyat ve bulunabilirlik
MSI Prestige 13 AI Evo şu anda Amazon'da 1.280,71 ABD Doları karşılığında bulunabilir.
MSI Prestige 13 AI Evo
- 03/06/2024 v7 (old)
Andreas Osthoff
Şeffaflık
İncelenecek cihazların seçimi editör ekibimiz tarafından yapılır. Test örneği, bu incelemenin amacı doğrultusunda üretici veya perakendeci tarafından yazara ödünç olarak sağlanmıştır. Borç verenin bu inceleme üzerinde herhangi bir etkisi olmadığı gibi, üretici de yayınlanmadan önce bu incelemenin bir kopyasını almamıştır. Bu incelemeyi yayınlama zorunluluğu yoktu. Bağımsız bir medya şirketi olarak Notebookcheck, üreticilerin, perakendecilerin veya yayıncıların otoritesine tabi değildir.
Notebookcheck bu şekilde test yapıyor
Notebookcheck, tüm sonuçların karşılaştırılabilir olmasını sağlamak için her yıl yüzlerce dizüstü bilgisayarı ve akıllı telefonu standart prosedürler kullanarak bağımsız olarak inceliyor. Yaklaşık 20 yıldır test yöntemlerimizi sürekli olarak geliştirdik ve bu süreçte endüstri standartlarını belirledik. Test laboratuvarlarımızda deneyimli teknisyenler ve editörler tarafından yüksek kaliteli ölçüm ekipmanları kullanılmaktadır. Bu testler çok aşamalı bir doğrulama sürecini içerir. Karmaşık derecelendirme sistemimiz, nesnelliği koruyan yüzlerce sağlam temellere dayanan ölçüm ve kıyaslamaya dayanmaktadır.Price comparison

