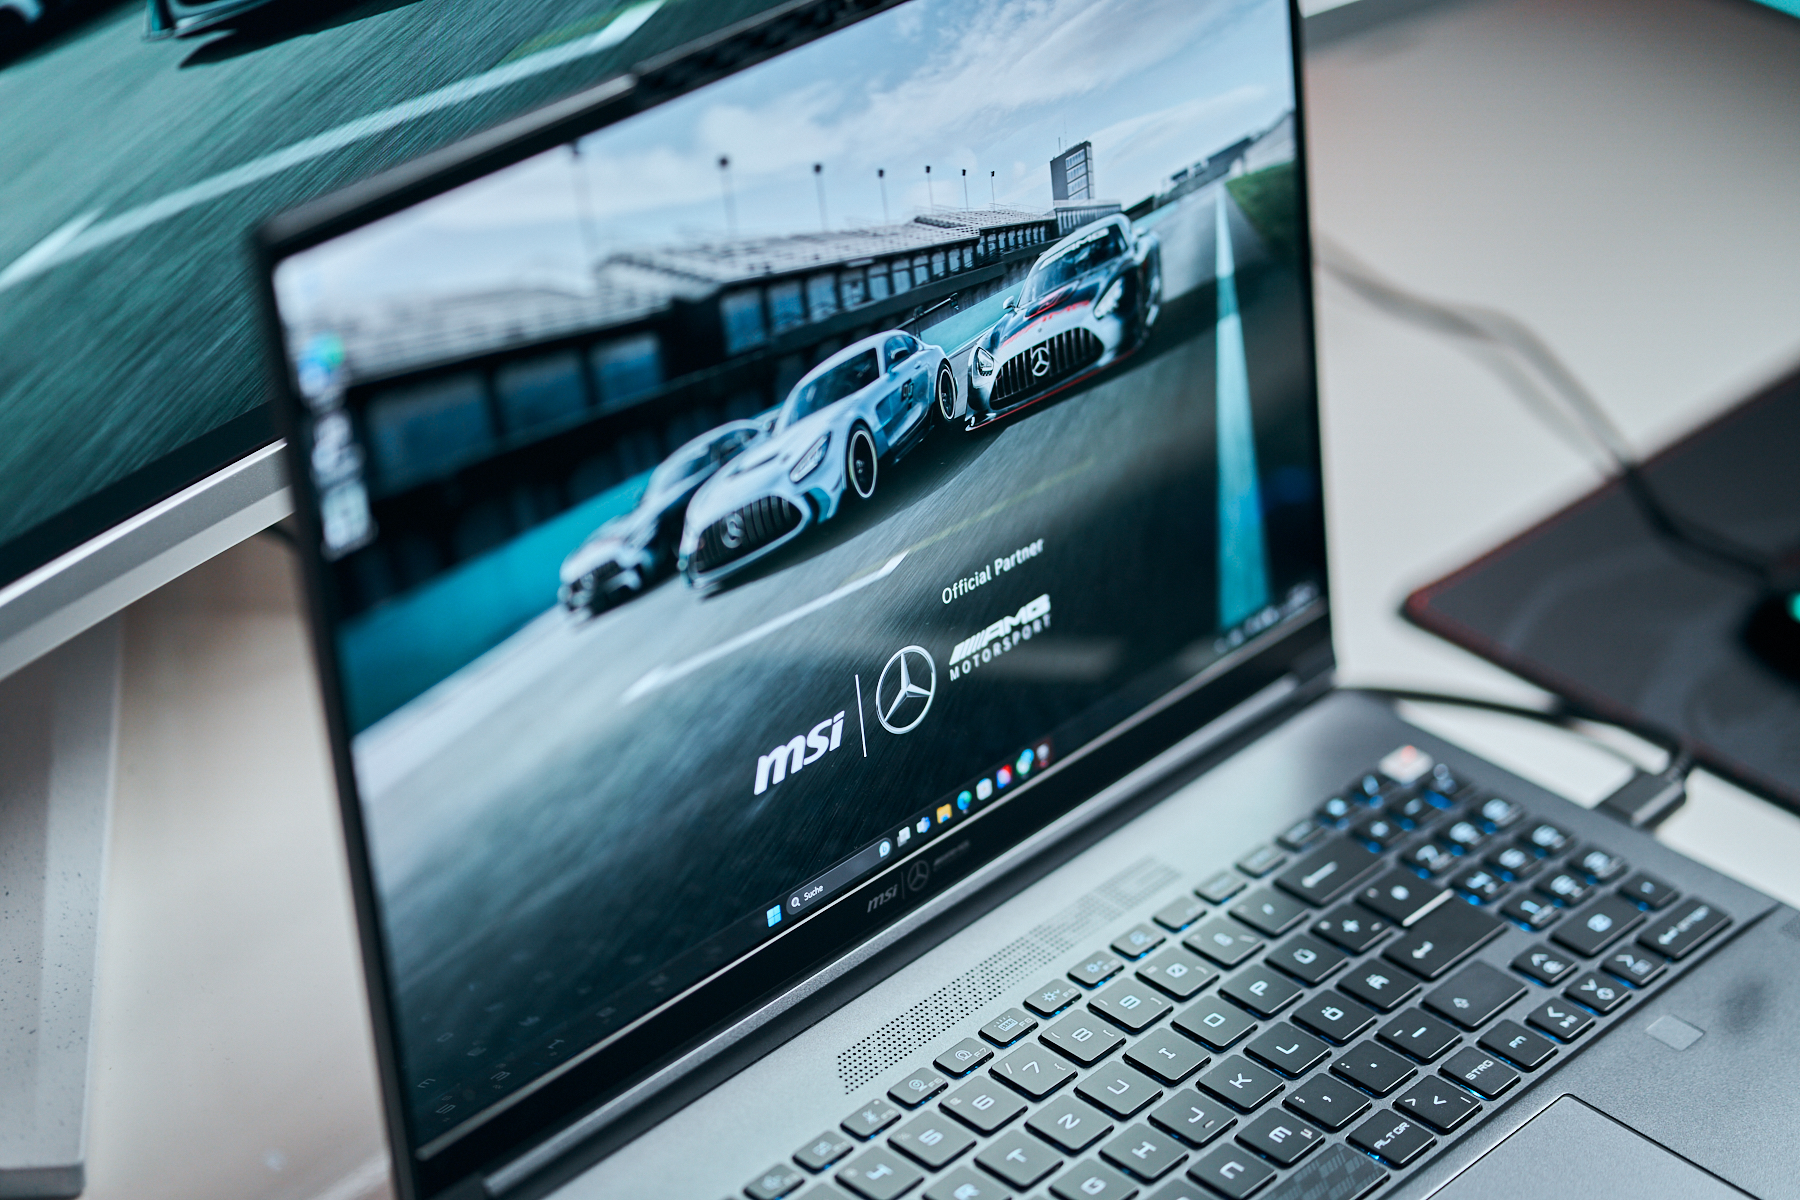
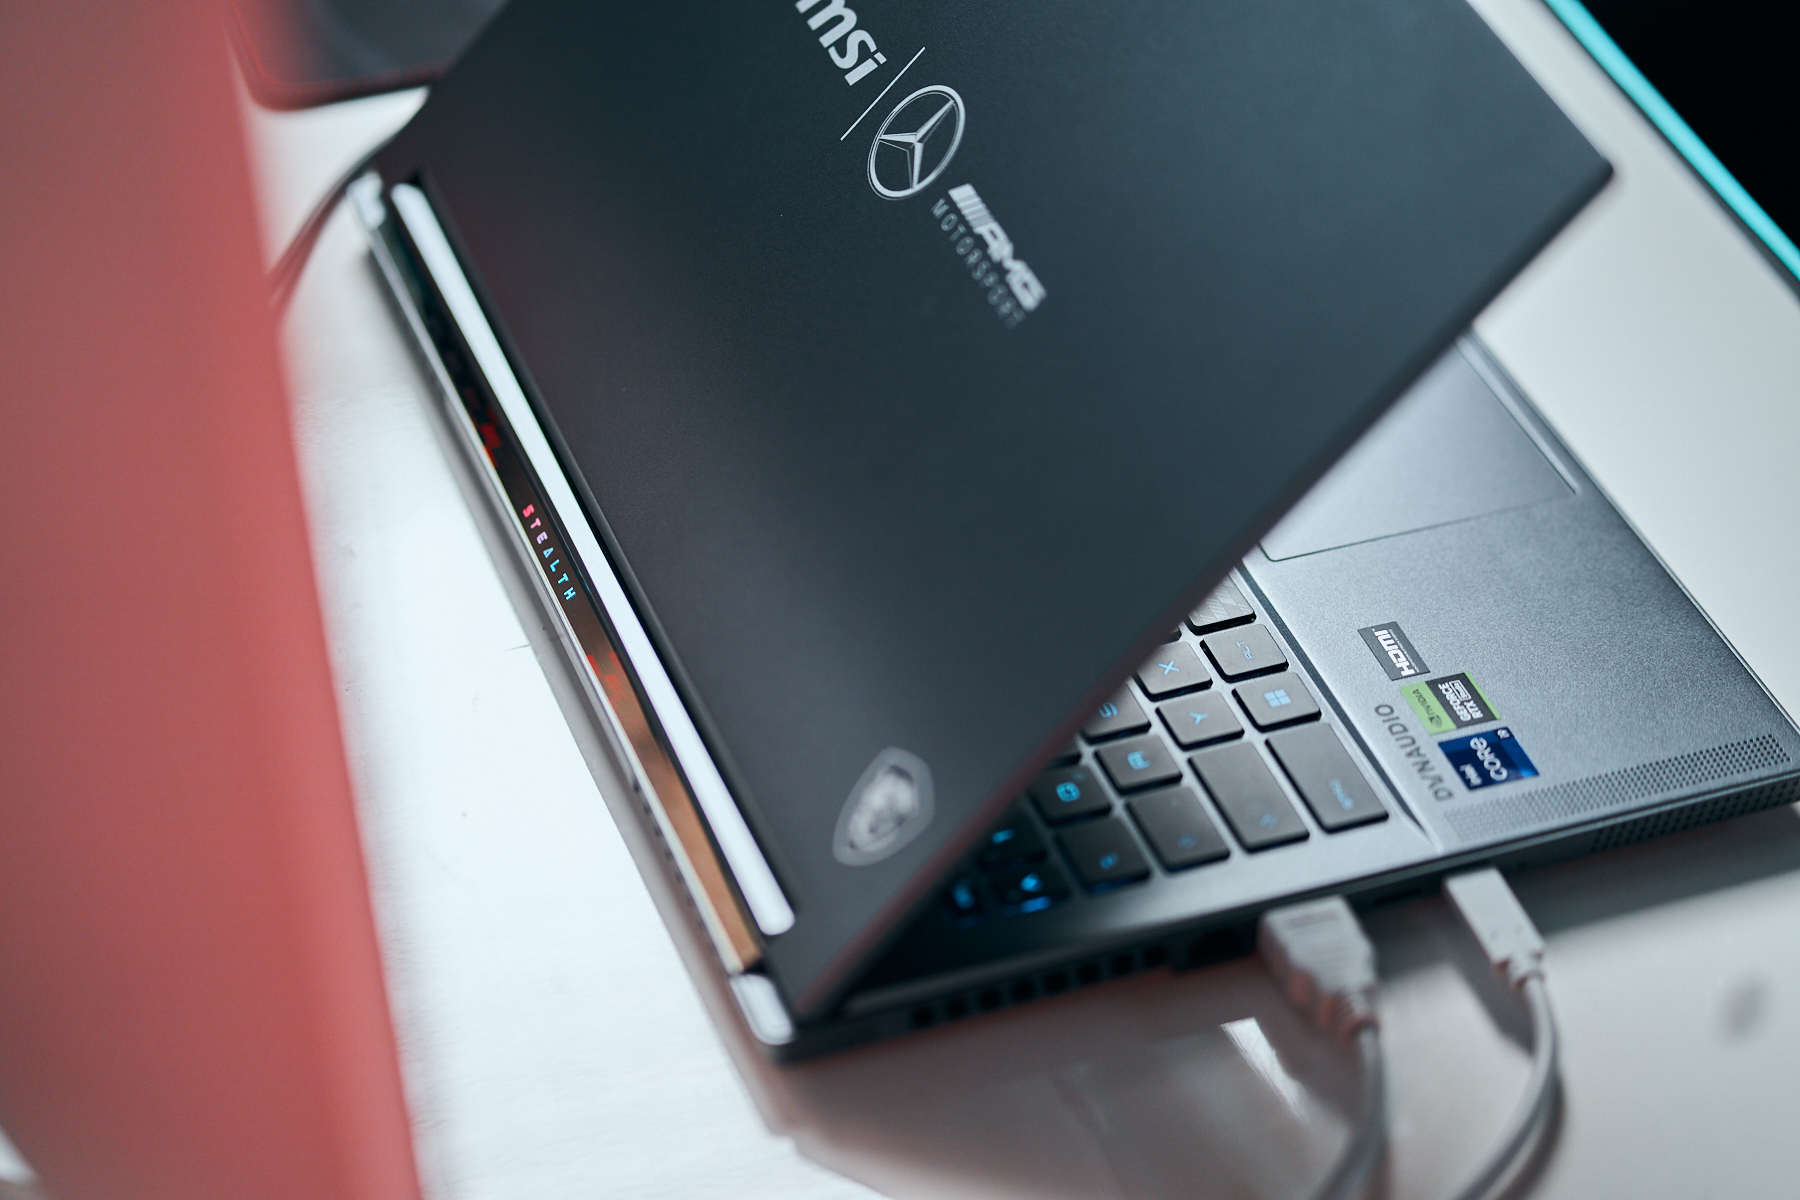
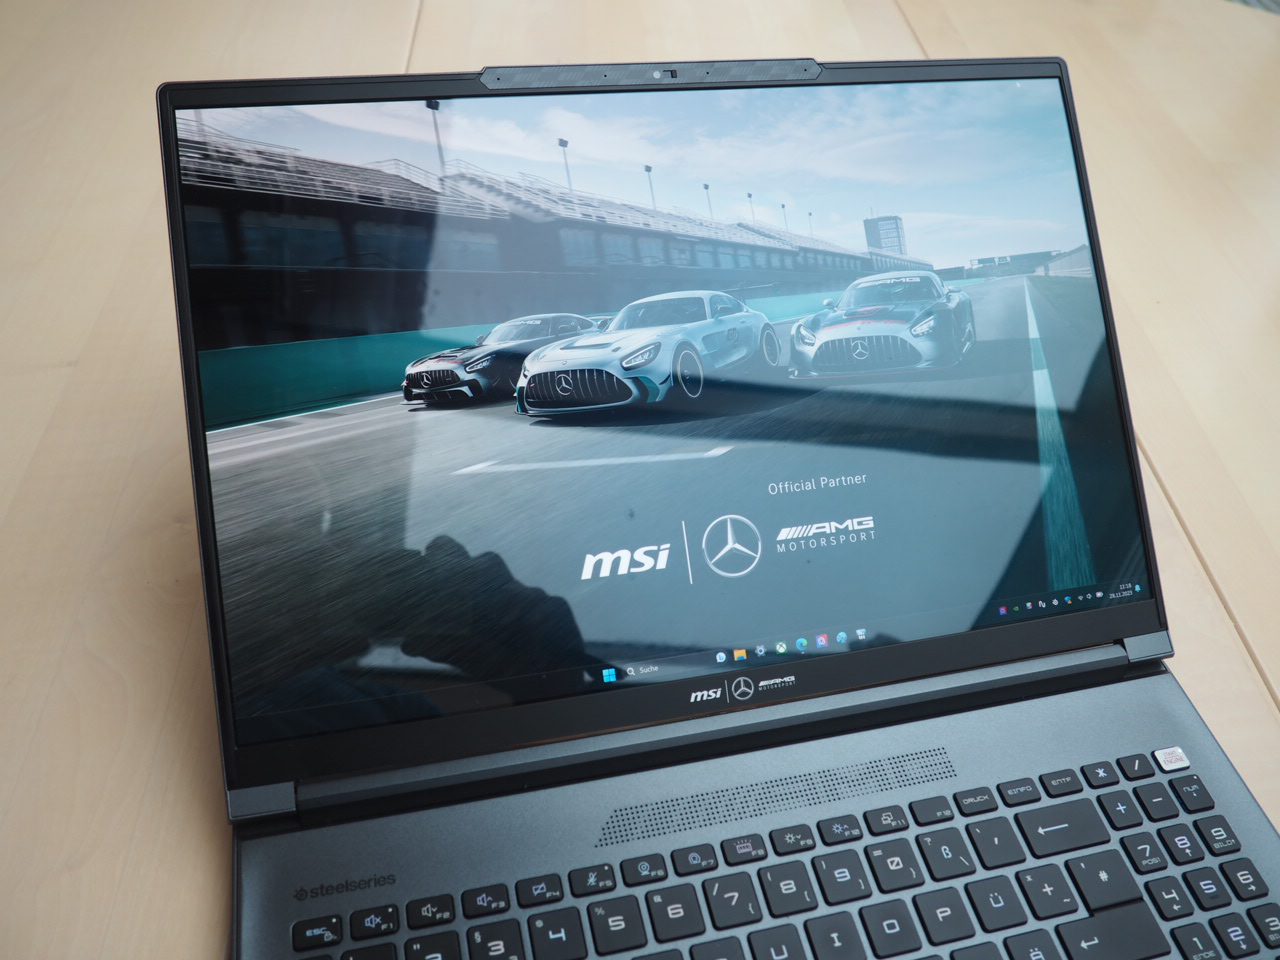
MSI Stealth 16 Mercedes-AMG Motorsport dizüstü bilgisayar incelemede: OLED ekranlı mobil yarış otomobili

'Standart' Stealth 16'da ise Core i7-13700Hmercedes-AMG Motorsport modeli ise biraz daha hızlı olan Core i9-13900H. Motorsport Edition, 240 Hz hızında çalışan mat QHD+ IPS panel yerine 60 Hz yenileme hızına sahip parlak bir UHD+ OLED ekrana sahiptir. Grafik kartı (RTX 4070), RAM (2x 16 GB DDR5) ve SSD kapasitesi (2 TB) üst modelle aynıdır. Kasanın, giriş aygıtlarının ve bağlantıların aynı olduğu ve yalnızca birkaç optik ayrıntının onları ayırdığı göz önüne alındığında, bu makalede belirli kategorileri tekrar gözden geçirmeyeceğiz. İlgili bilgilere şuradan bakabilirsiniz stealth 16 Studio'nun incelemesi. Motorsport Edition'ın fiyatı şu anda 2.899 dolar ve RTX 4070 dizüstü bilgisayar için kayda değer bir yatırım.
Stealth 16'nın rakipleri arasında RTX 4070'e sahip diğer 16 inçlik oyun dizüstü bilgisayarları yer alıyor, örneğin HP Omen Transcend 16, the Lenovo Legion Pro 5 16ARX8ve Schenker dizüstü bilgisayarları XMG Pro 16 Stüdyo ve XMG Çekirdek 16. Bu modeller karşılaştırma için tablolarda listelenmiştir
Karşılaştırmalı olarak olası rakipler
Derecelendirme | Tarih | Modeli | Ağırlık | Yükseklik | Boyut | Çözünürlük | Fiyat |
|---|---|---|---|---|---|---|---|
| 89.1 % v7 (old) | 11/2023 | MSI Stealth 16 Mercedes-AMG Motorsport A13VG i9-13900H, GeForce RTX 4070 Laptop GPU | 1.9 kg | 20 mm | 16.00" | 3840x2400 | |
| 88.8 % v7 (old) | 05/2023 | MSI Stealth 16 Studio A13VG i7-13700H, GeForce RTX 4070 Laptop GPU | 2 kg | 19.95 mm | 16.00" | 2560x1600 | |
| 87.9 % v7 (old) | 10/2023 | Schenker XMG Pro 16 Studio (Mid 23) i9-13900H, GeForce RTX 4070 Laptop GPU | 2.6 kg | 19.9 mm | 16.00" | 2560x1600 | |
| 87.9 % v7 (old) | 09/2023 | HP Omen Transcend 16 i9-13900HX, GeForce RTX 4070 Laptop GPU | 2.3 kg | 19.8 mm | 16.00" | 2560x1600 | |
| 88.4 % v7 (old) | 07/2023 | Lenovo Legion Pro 5 16ARX8 R7 7745HX, GeForce RTX 4070 Laptop GPU | 2.5 kg | 26.8 mm | 16.00" | 2560x1600 | |
| 89.2 % v7 (old) | 10/2023 | Schenker XMG CORE 16 (L23) R7 7840HS, GeForce RTX 4070 Laptop GPU | 2.4 kg | 26.1 mm | 16.00" | 2560x1600 |
Dava
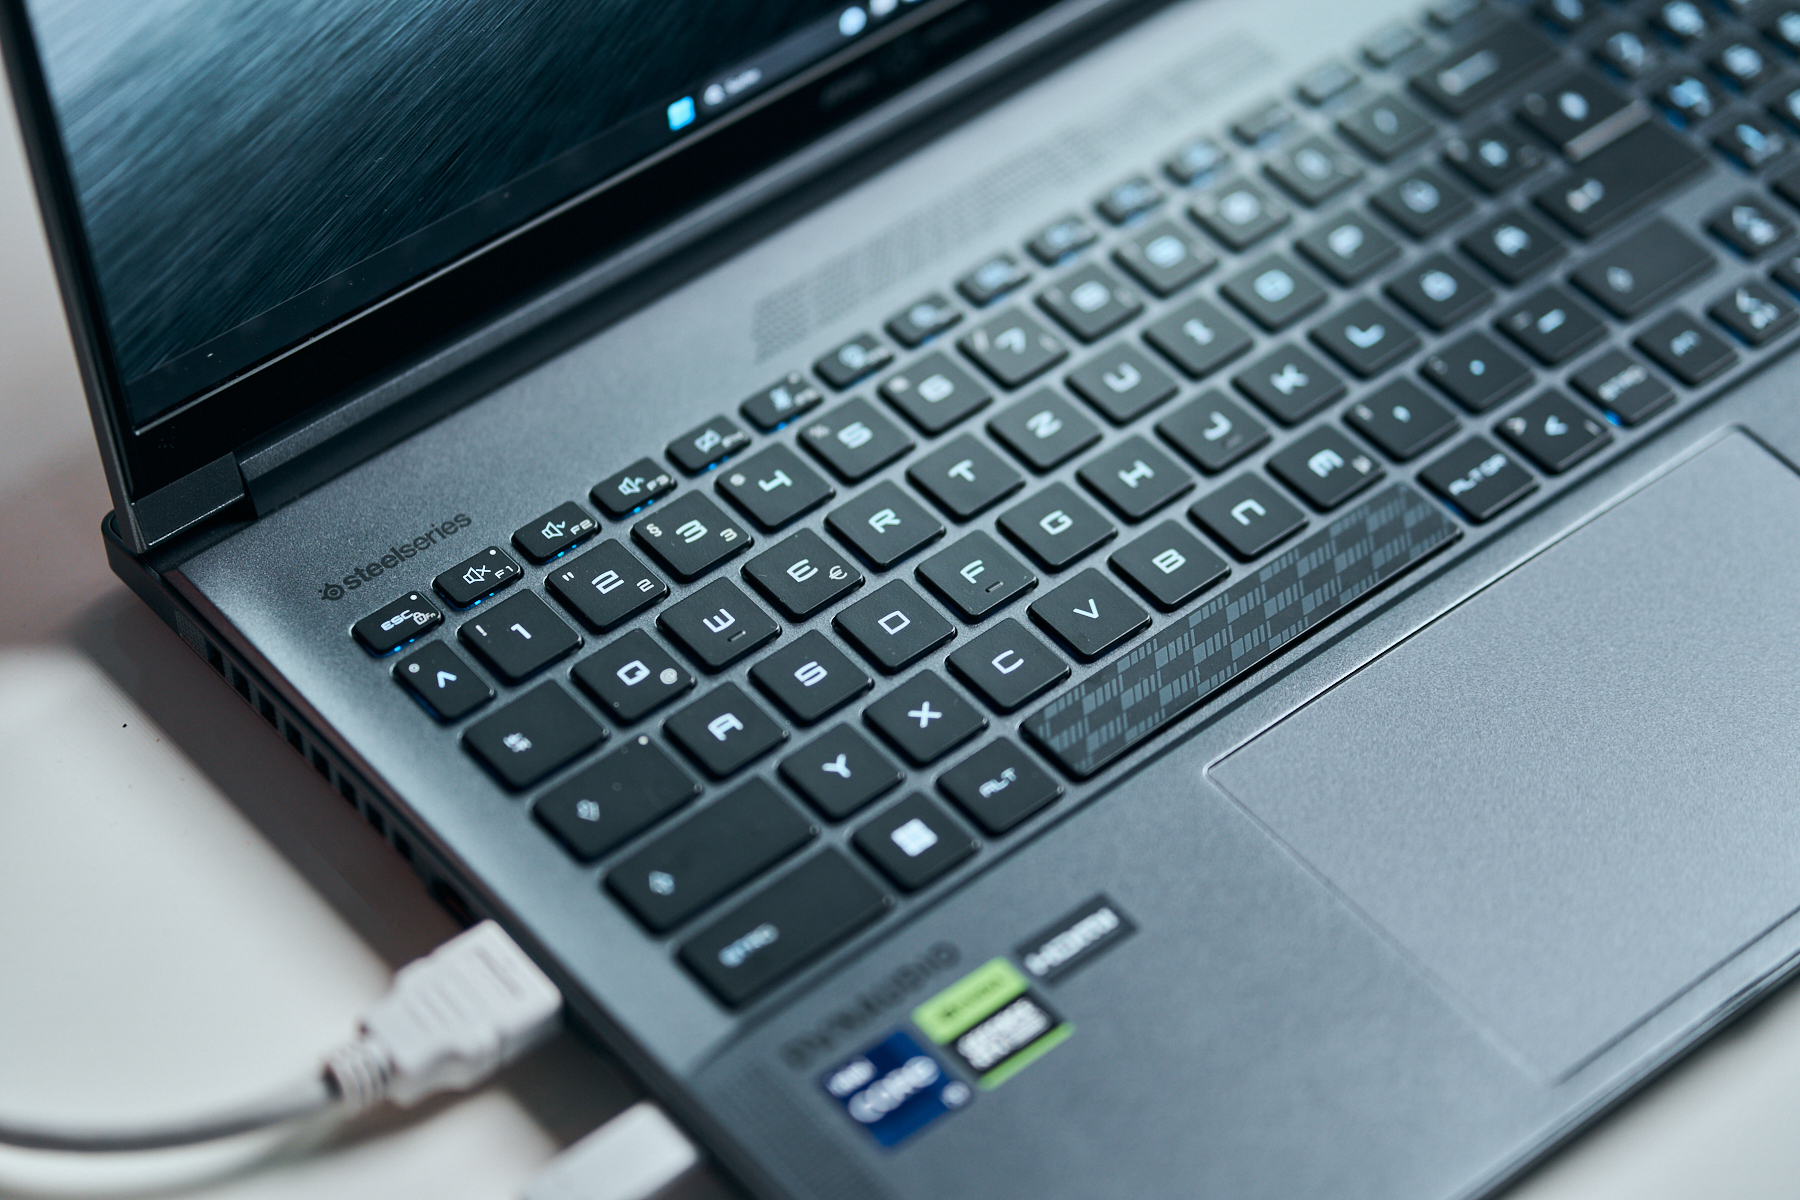
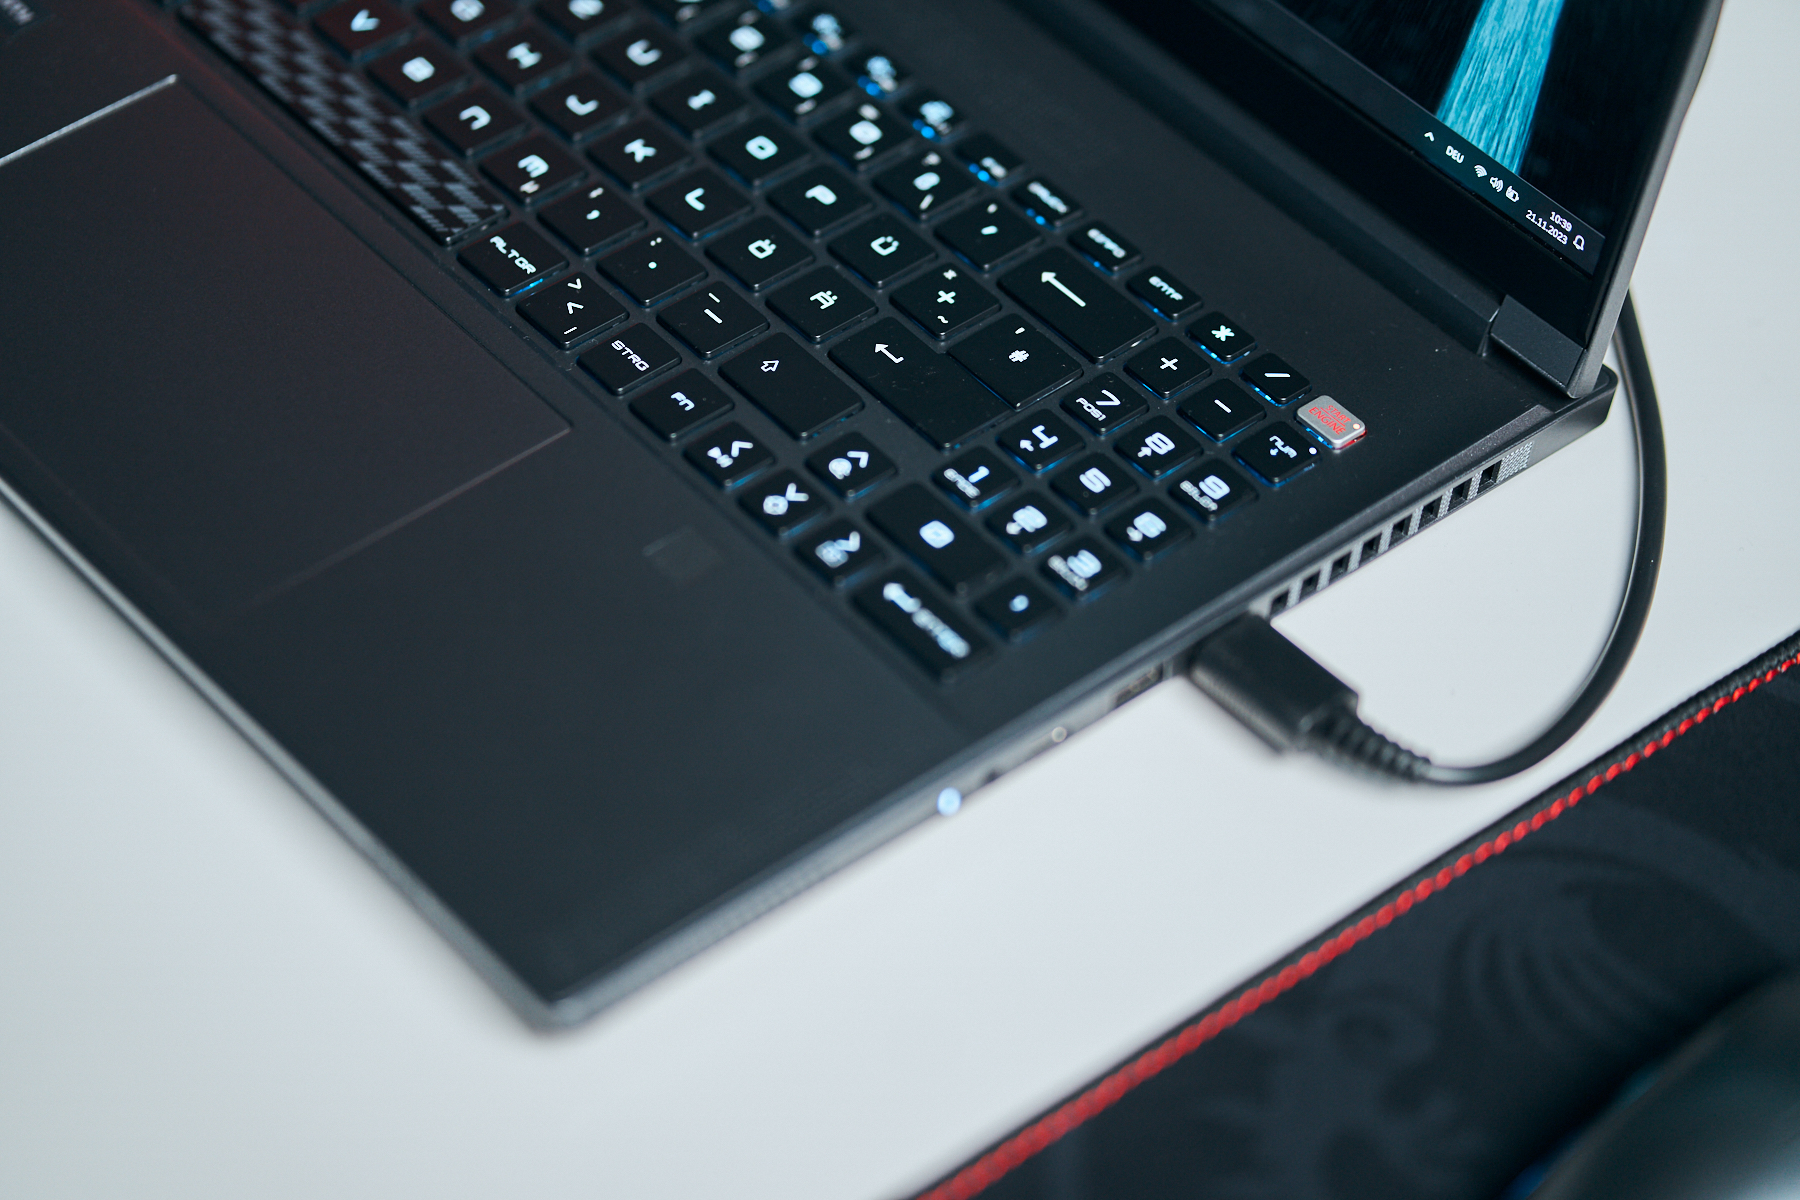
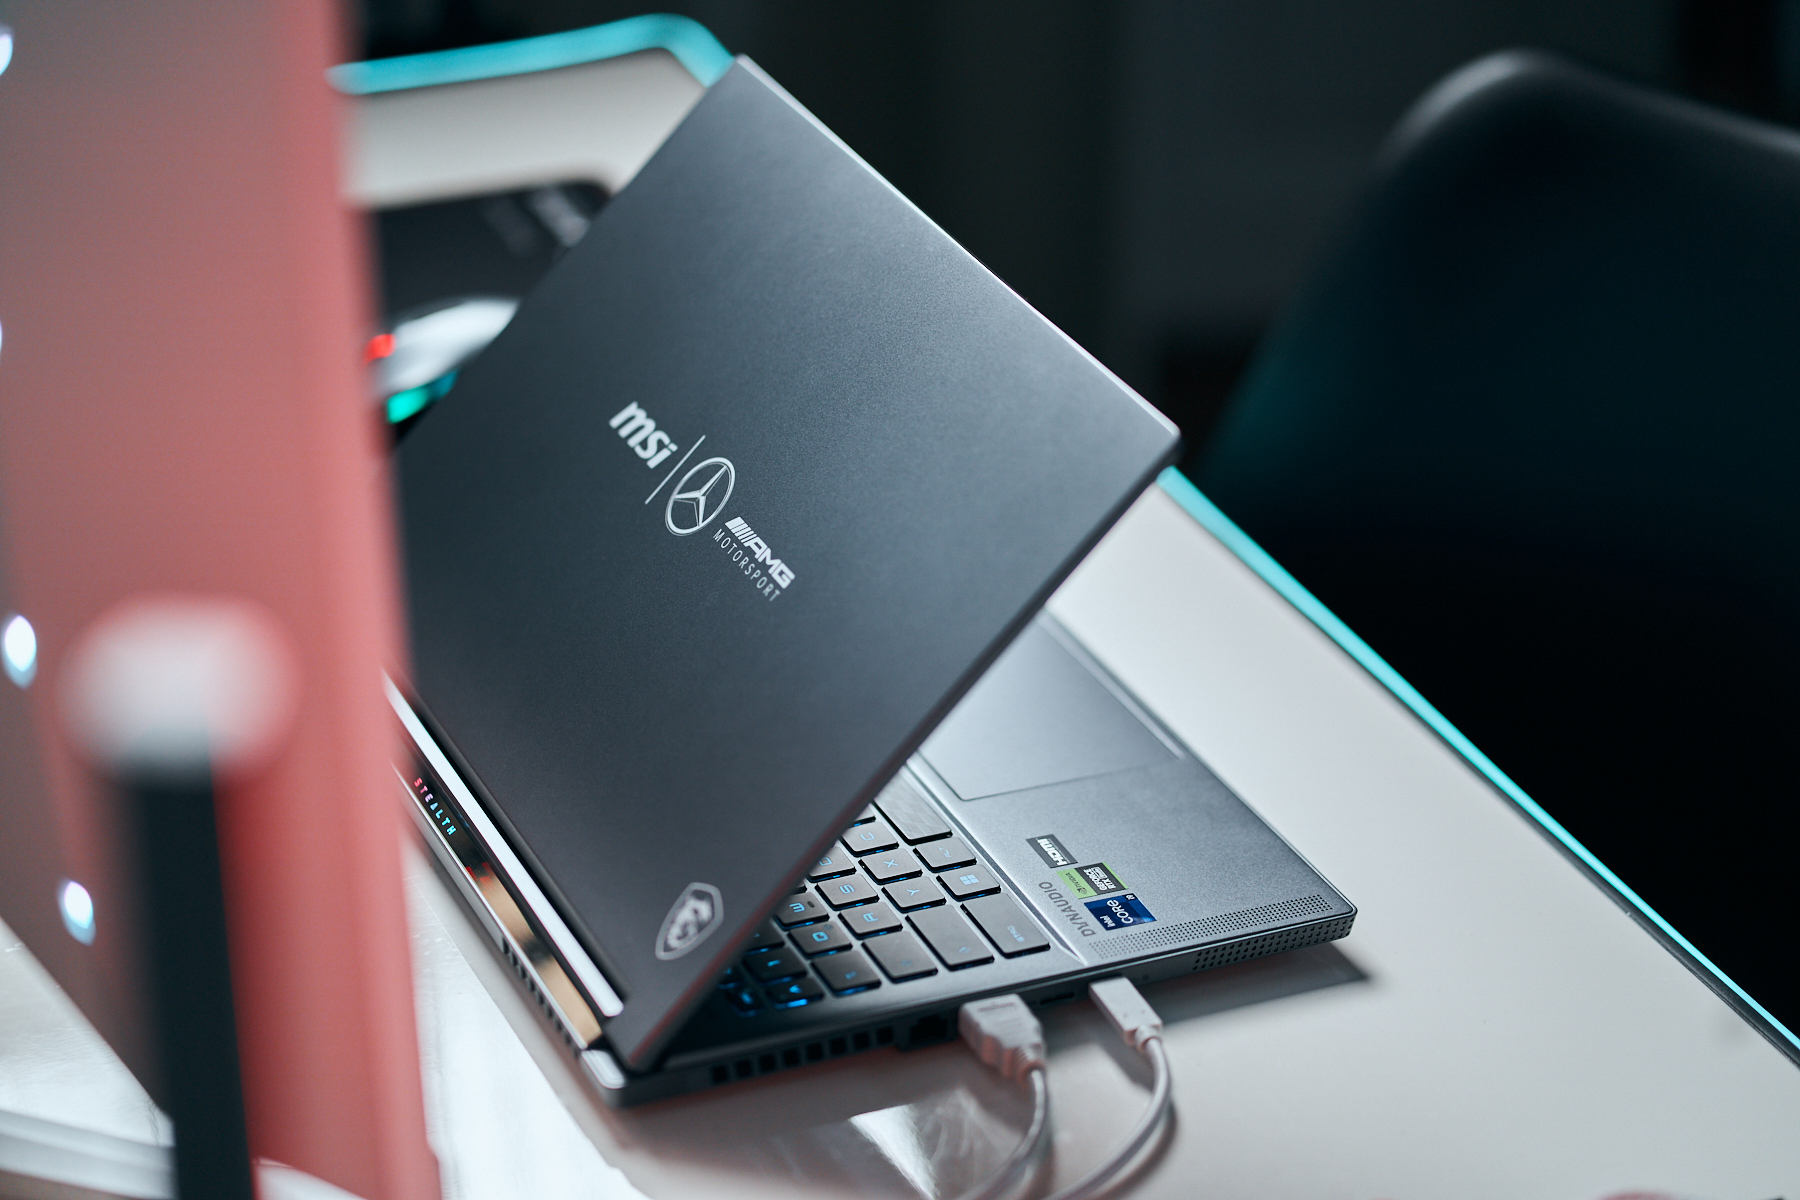
MSI, özel sürümün görsel tasarımı için büyük çaba harcadı ve kasa boyunca otomotiv üreticisine referanslar ekledi. Bunlar arasında çeşitli AMG harf yerleşimleri (kapak, ön, ekran çerçevesi, havalandırma ızgarası, taban) ve motor sporlarını anımsatan diğer tasarım öğeleri yer alıyor. Örnekler arasında web kamerası çubuğunda, boşluk tuşunda ve lastik ayaklarda bayrak benzeri bir tasarımın yanı sıra "Motoru Çalıştır" metnini içeren bir güç düğmesi de yer alıyor.


Bağlanabilirlik
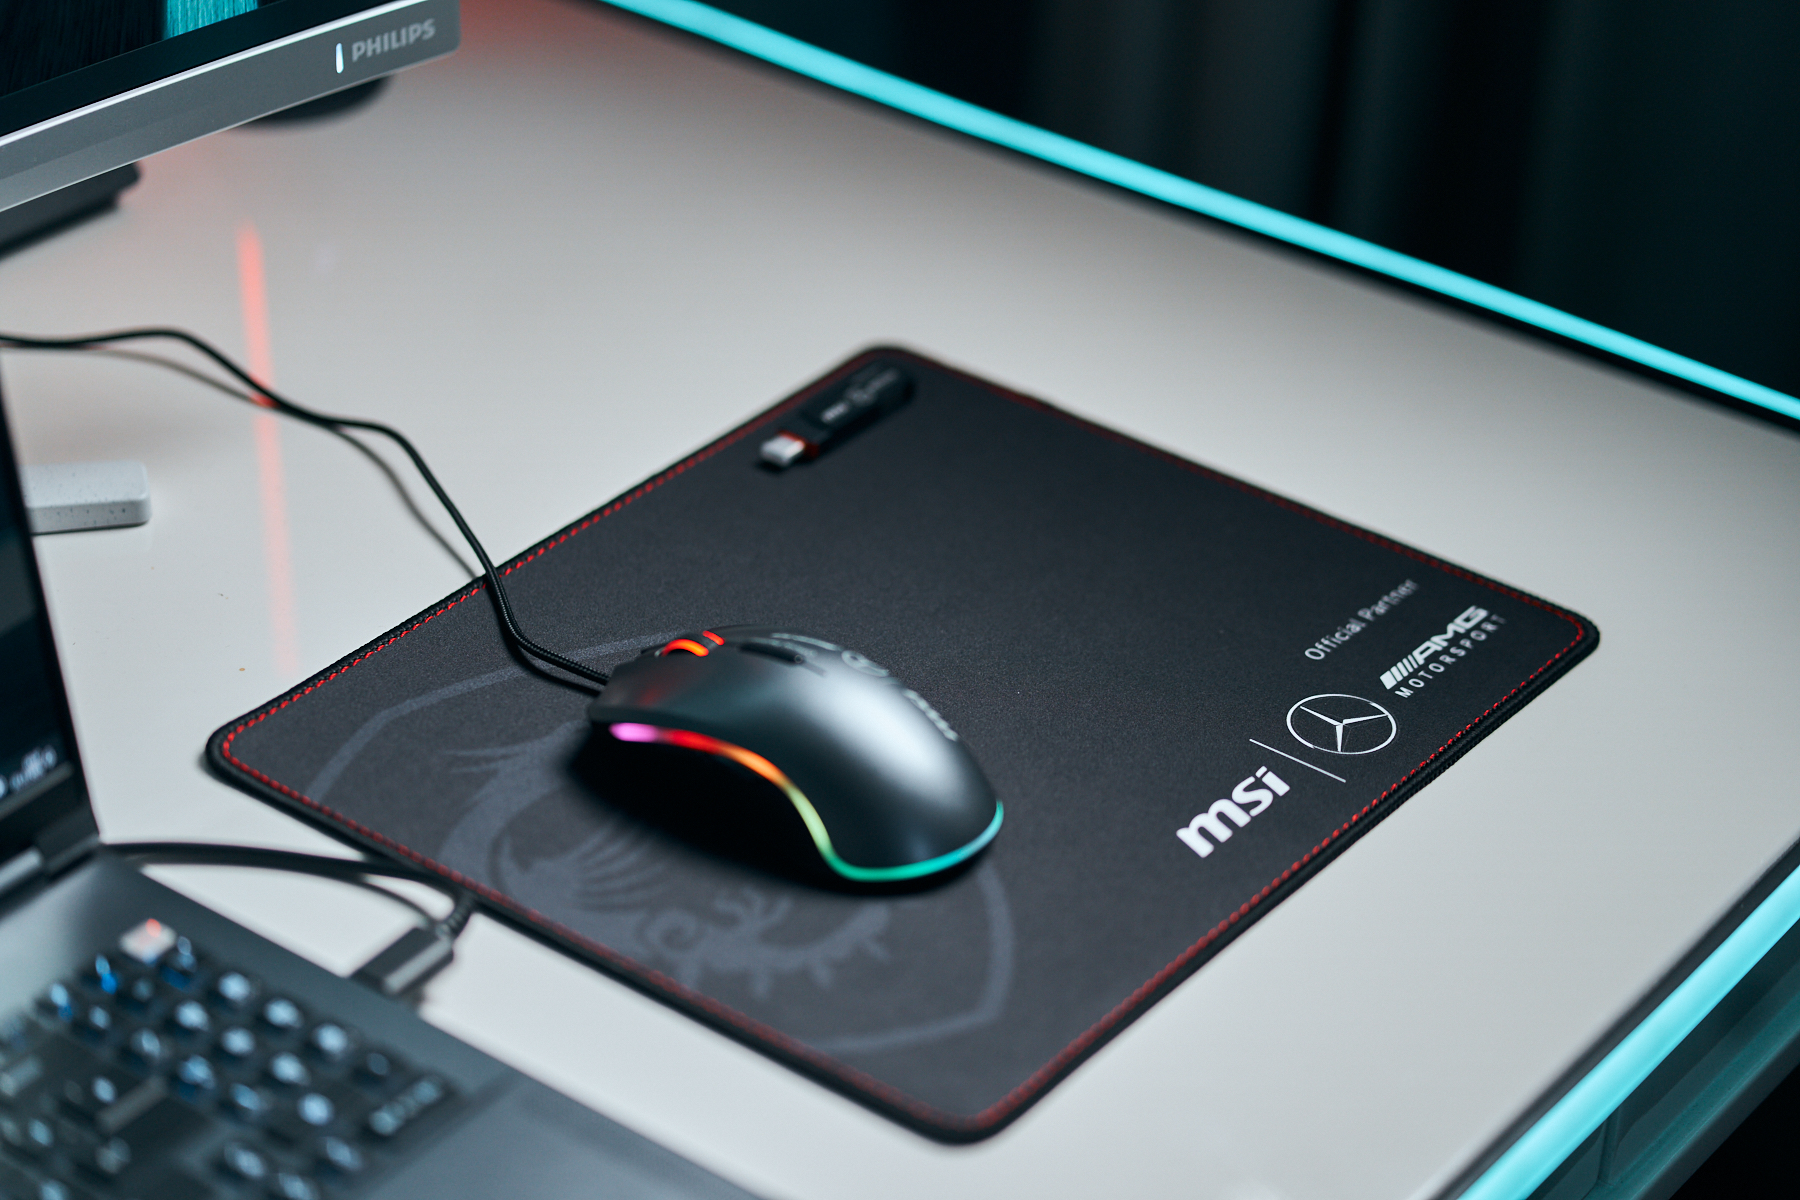
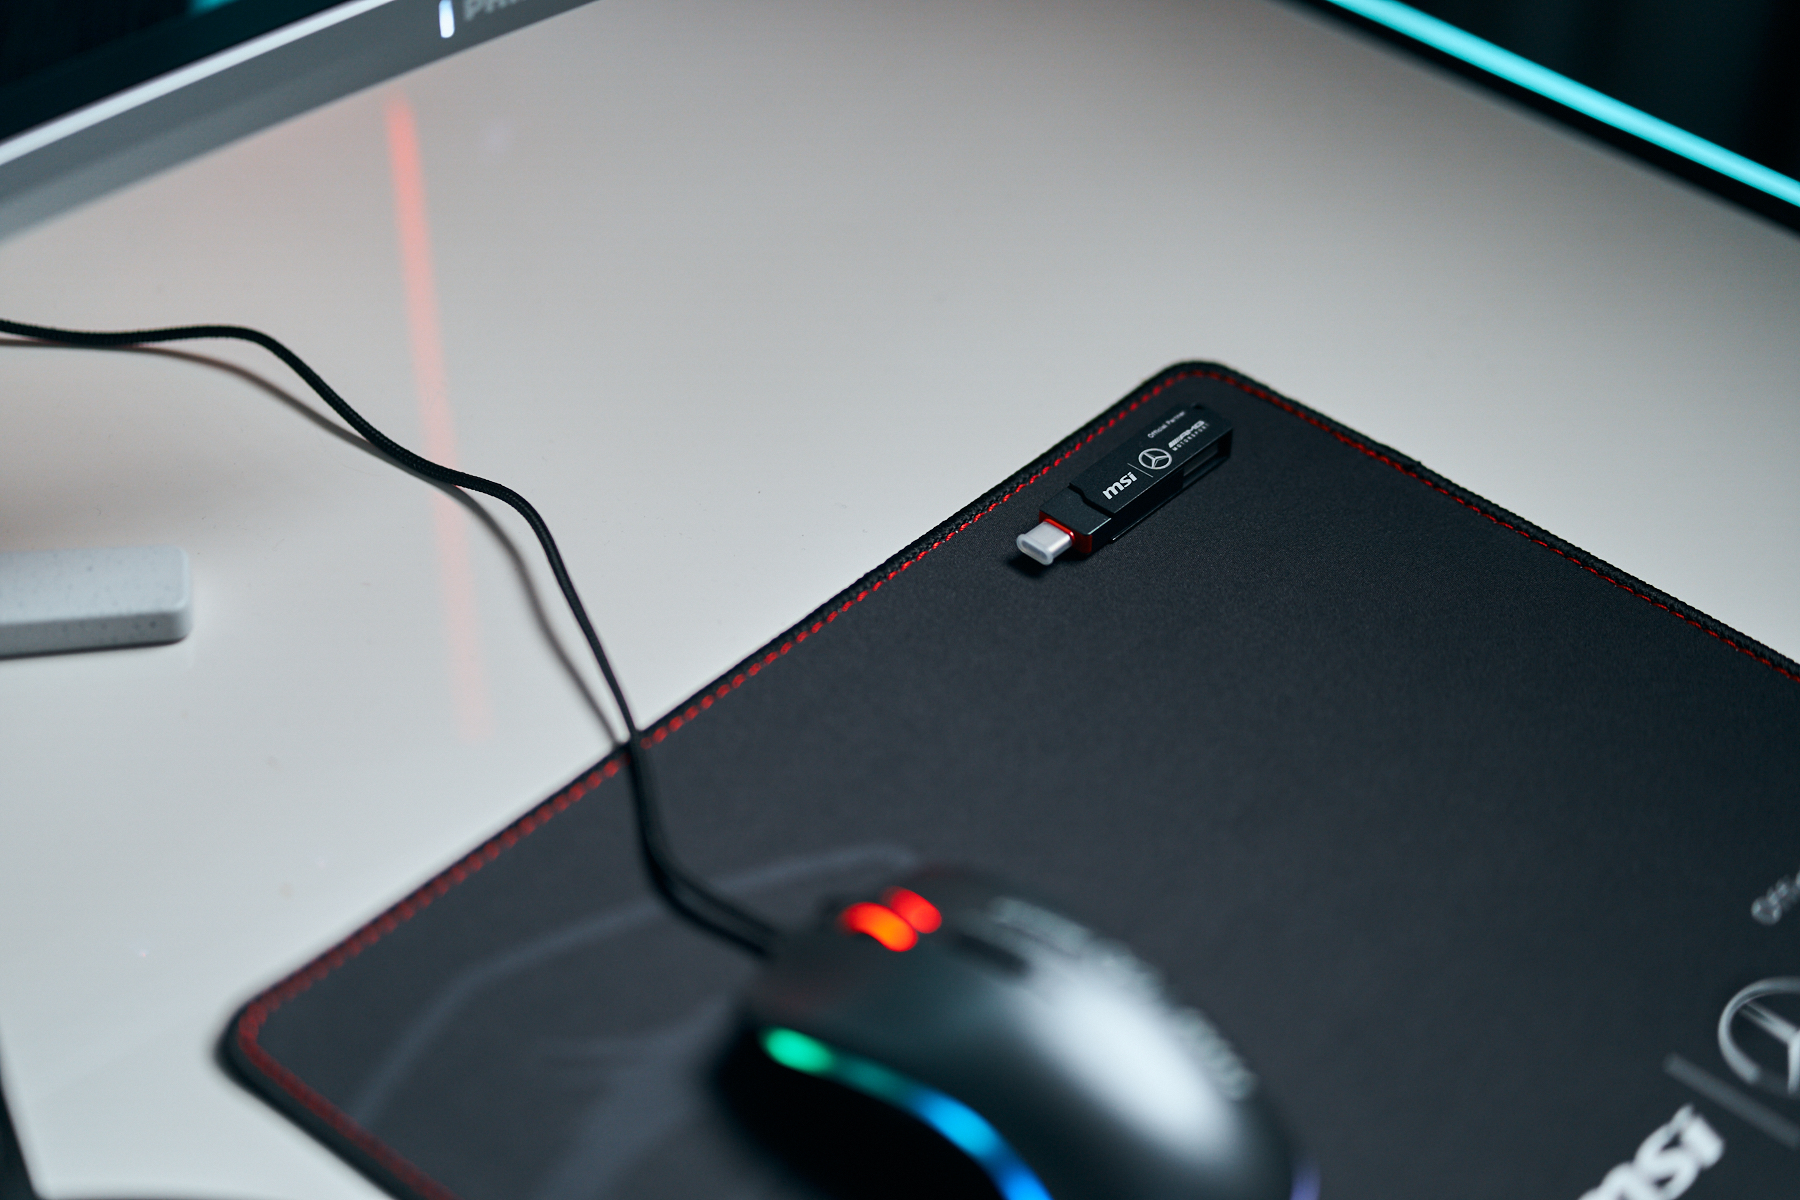
Ekipman açısından, teslimatın cömert kapsamı özellikle dikkat çekicidir. Mercedes versiyonu, dizüstü bilgisayar ve 240 watt'lık güç kaynağı ünitesinin yanı sıra bir fare, bir fare altlığı, bir USB bellek ve bir aksesuar çantası içeriyor.
SD Kart Okuyucu
| SD Card Reader | |
| average JPG Copy Test (av. of 3 runs) | |
| MSI Stealth 16 Mercedes-AMG Motorsport A13VG (AV PRO microSD 128 GB V60) | |
| MSI Stealth 16 Studio A13VG | |
| Sınıf ortalaması Gaming (20.9 - 210, n=53, son 2 yıl) | |
| Schenker XMG Pro 16 Studio (Mid 23) (AV PRO microSD 128 GB V60) | |
| Schenker XMG CORE 16 (L23) | |
| maximum AS SSD Seq Read Test (1GB) | |
| MSI Stealth 16 Mercedes-AMG Motorsport A13VG (AV PRO microSD 128 GB V60) | |
| MSI Stealth 16 Studio A13VG | |
| Sınıf ortalaması Gaming (25.5 - 261, n=50, son 2 yıl) | |
| Schenker XMG Pro 16 Studio (Mid 23) (AV PRO microSD 128 GB V60) | |
| Schenker XMG CORE 16 (L23) | |
İletişim
Web kamerası


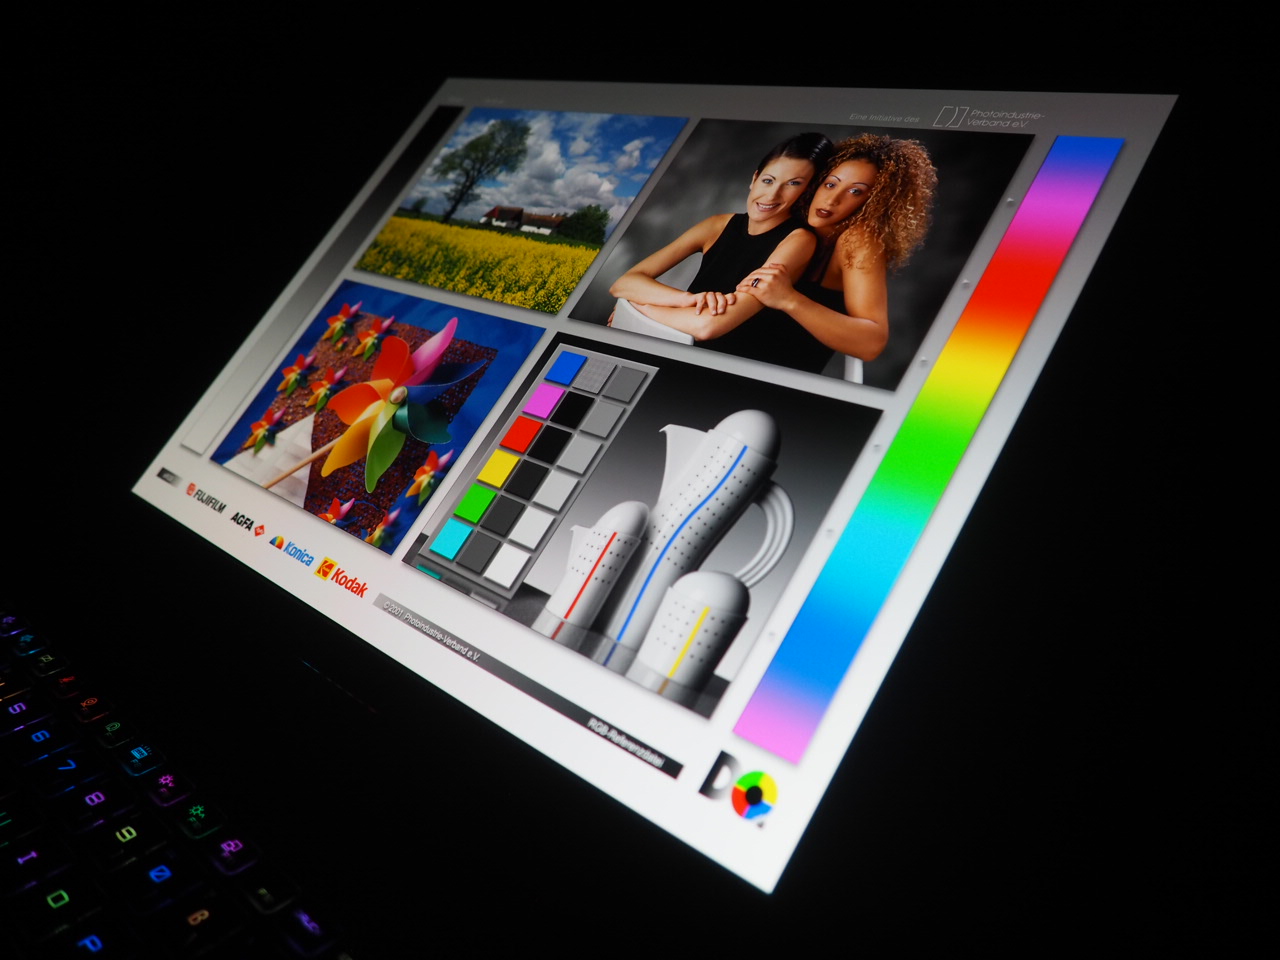
Ekran
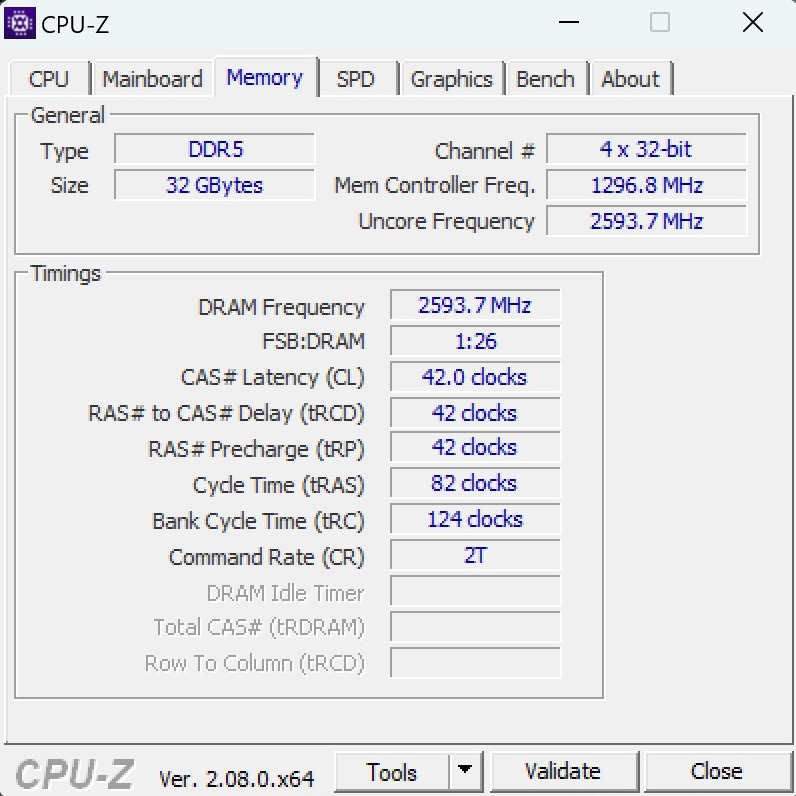
Daha önce de belirtildiği gibi, özel sürüm, 16:10 formatında 3.840 x 2.400 piksel yüksek çözünürlüğü sayesinde son derece keskin bir görüntü sunan bir OLED panele sahiptir.
| |||||||||||||||||||||||||
Aydınlatma: 96 %
Batarya modunda parlaklık: 382 cd/m²
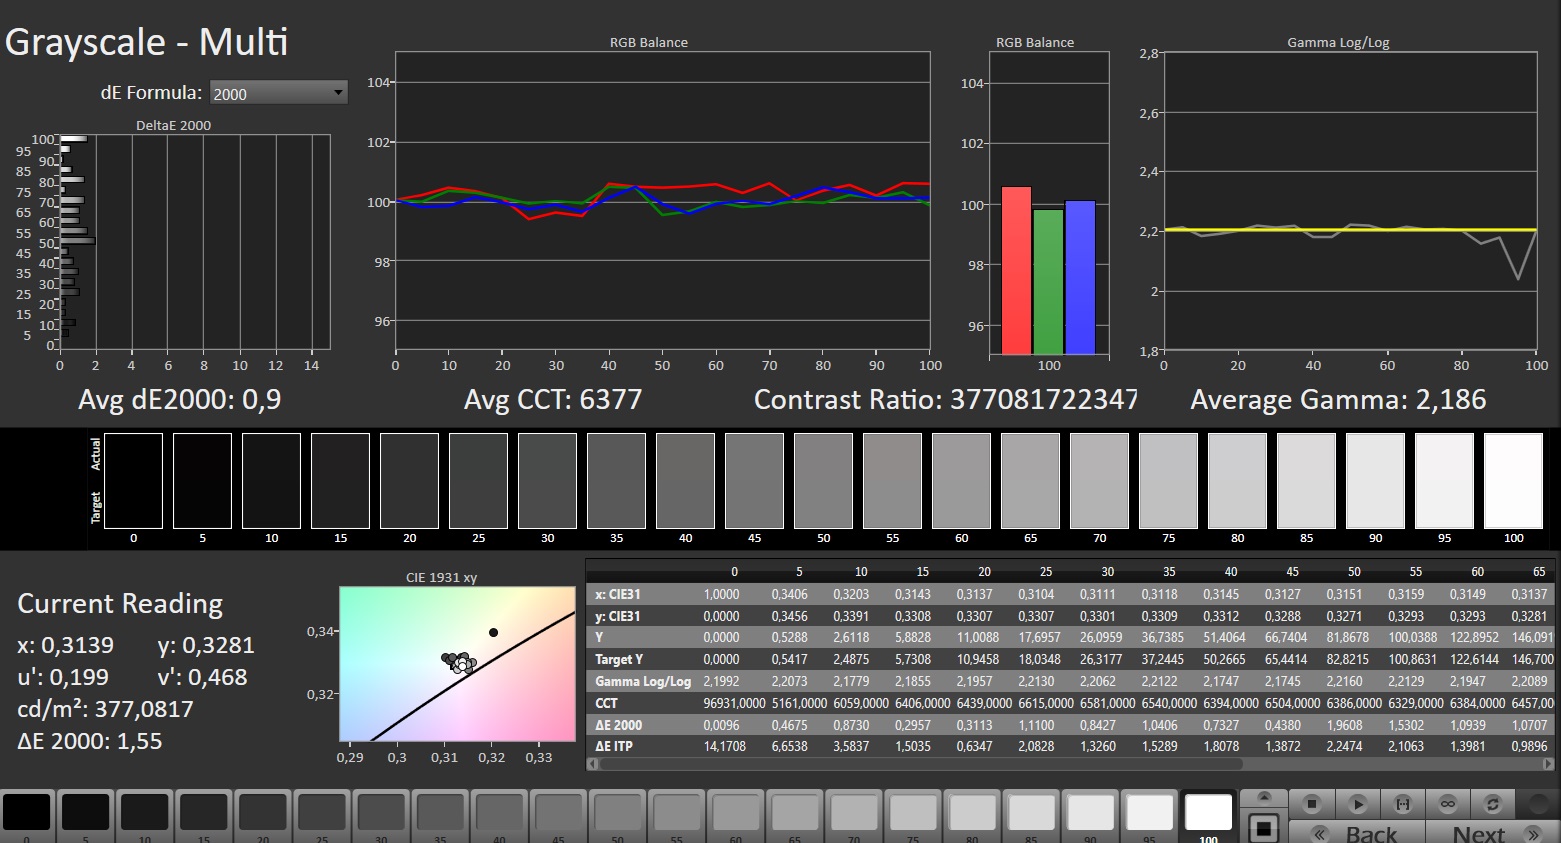
Kontrast: ∞:1 (Siyah: 0 cd/m²)
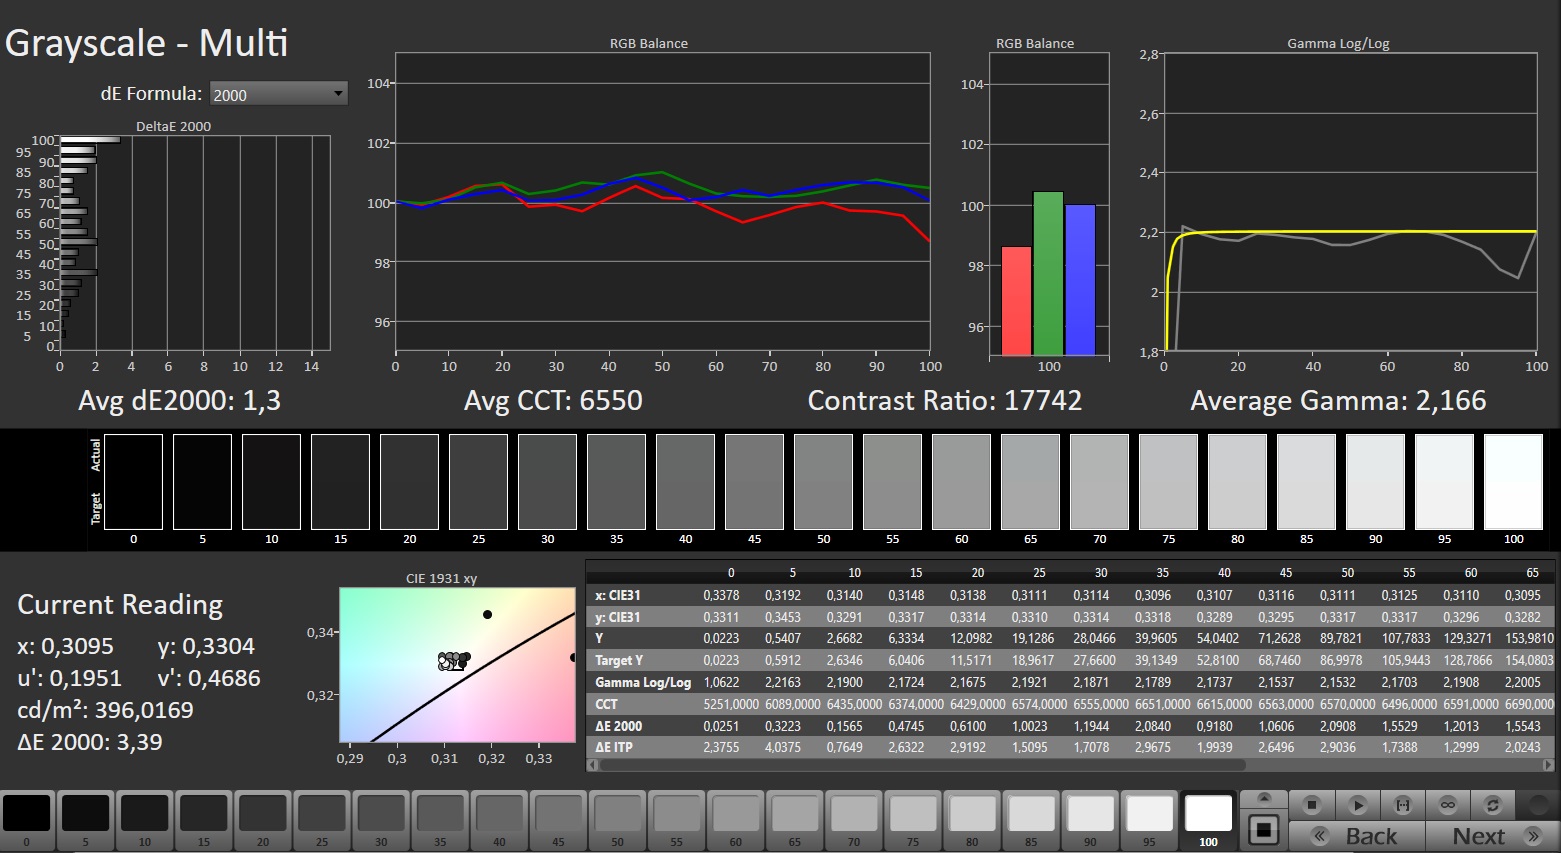
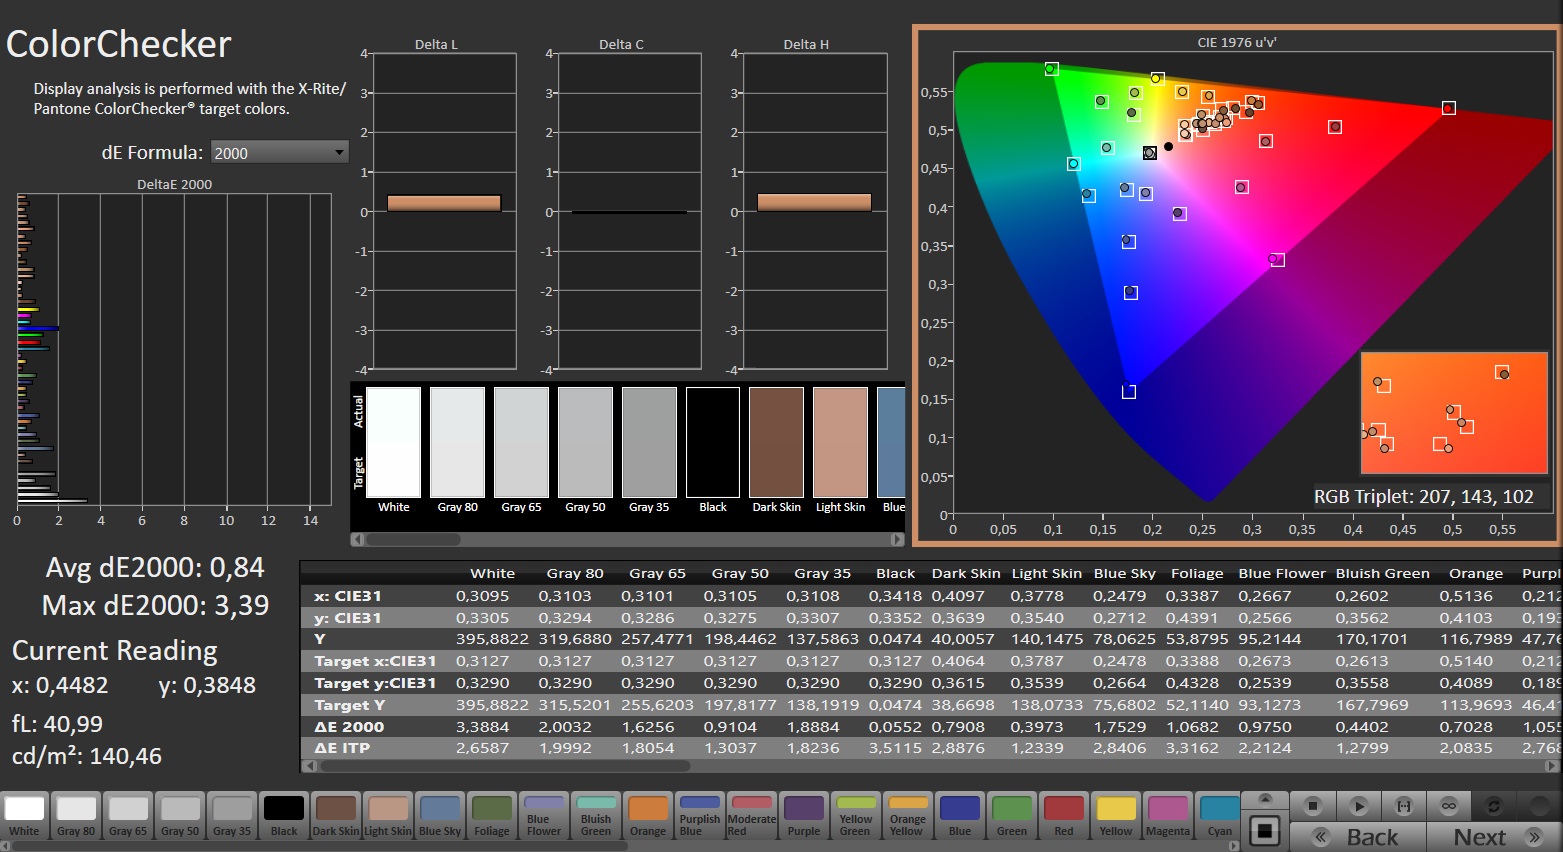
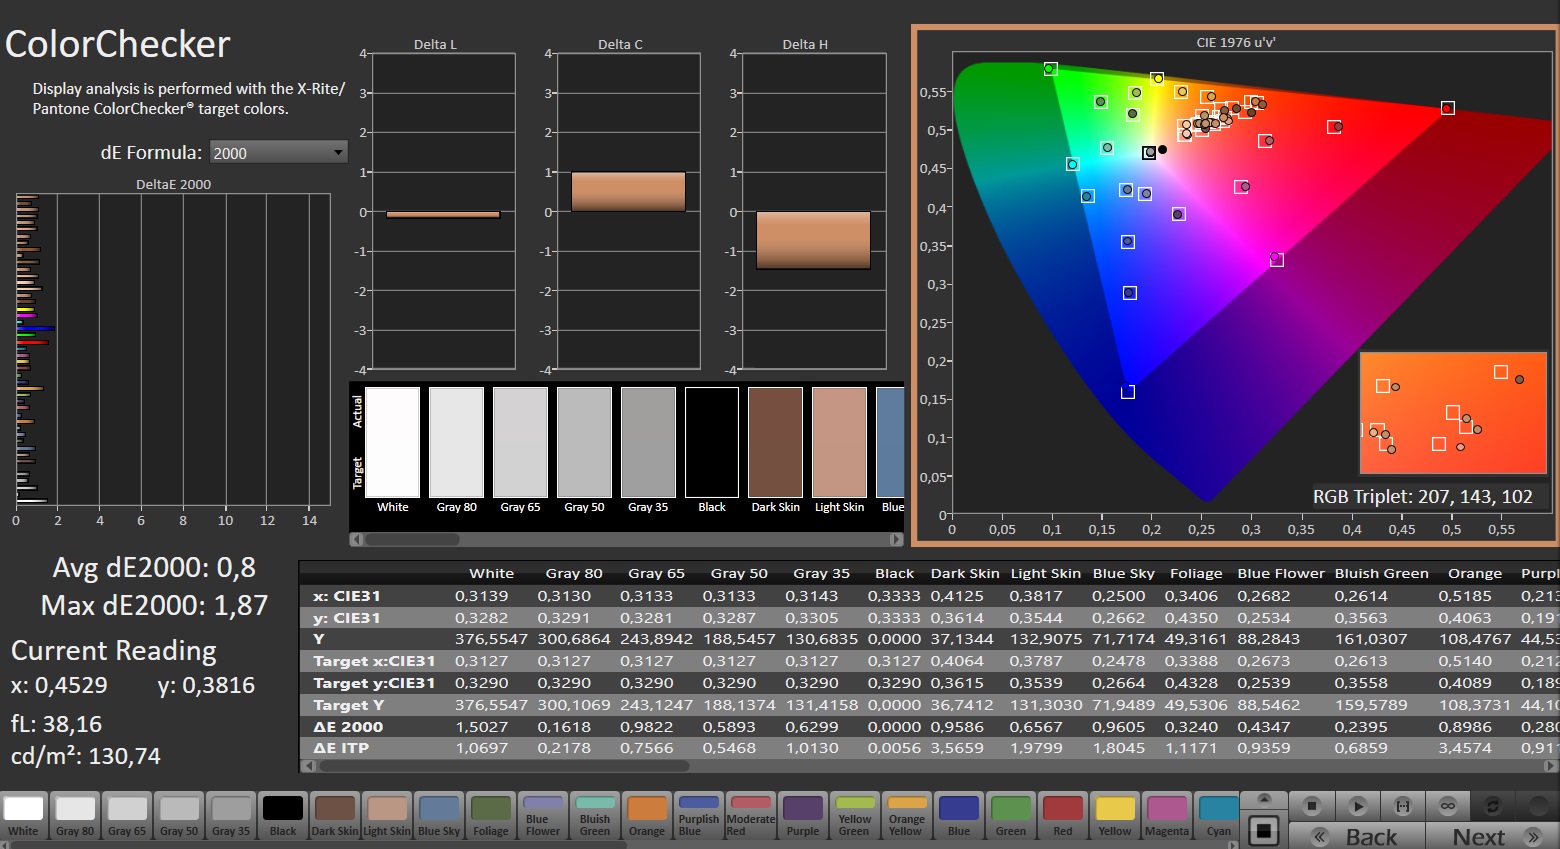
ΔE ColorChecker Calman: 0.84 | ∀{0.5-29.43 Ø4.72}
calibrated: 0.8
ΔE Greyscale Calman: 1.3 | ∀{0.09-98 Ø4.97}
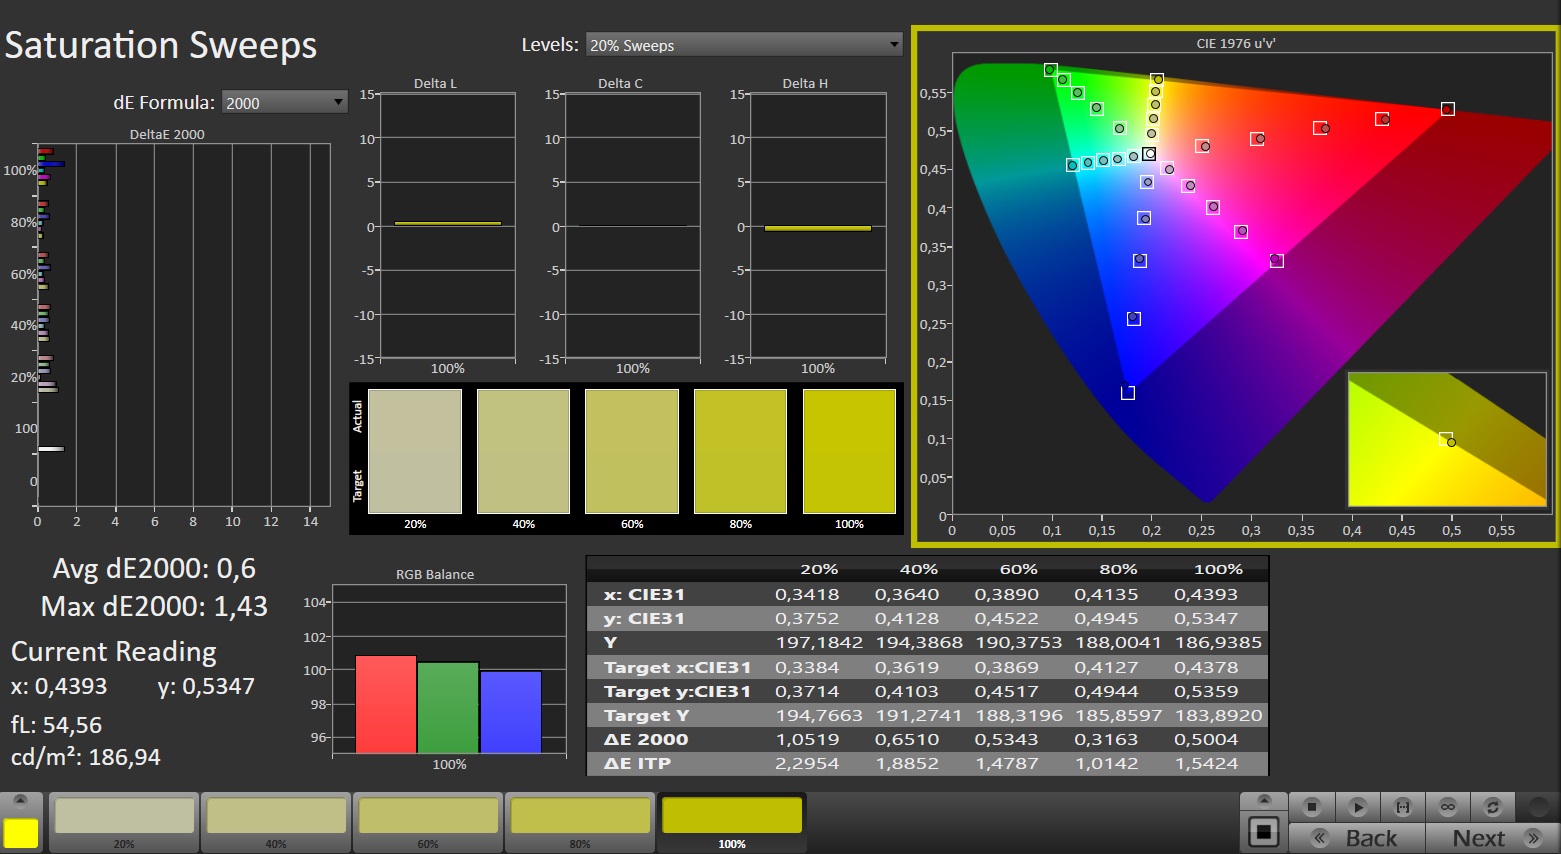
88.4% AdobeRGB 1998 (Argyll 3D)
99.9% sRGB (Argyll 3D)
99.2% Display P3 (Argyll 3D)
Gamma: 2.166
CCT: 6550 K
| MSI Stealth 16 Mercedes-AMG Motorsport A13VG ATNA60YV09-0 (SDC4191), OLED, 3840x2400, 16" | MSI Stealth 16 Studio A13VG AUO26A9, IPS, 2560x1600, 16" | Schenker XMG Pro 16 Studio (Mid 23) BOE CQ NE160QDM-NZ1, IPS, 2560x1600, 16" | HP Omen Transcend 16 AUOA3A6, Mini-LED, 2560x1600, 16" | Lenovo Legion Pro 5 16ARX8 CSOT T3 MNG007DA1-Q, IPS, 2560x1600, 16" | Schenker XMG CORE 16 (L23) BOE0AF0 (), IPS, 2560x1600, 16" | |
|---|---|---|---|---|---|---|
| Display | -2% | -18% | -0% | -16% | -18% | |
| Display P3 Coverage (%) | 99.2 | 96.4 -3% | 69.4 -30% | 99.2 0% | 70.4 -29% | 68.3 -31% |
| sRGB Coverage (%) | 99.9 | 99.7 0% | 98.2 -2% | 100 0% | 99.6 0% | 98.6 -1% |
| AdobeRGB 1998 Coverage (%) | 88.4 | 84.8 -4% | 70.1 -21% | 87.6 -1% | 72.6 -18% | 69.6 -21% |
| Response Times | -280% | -628% | -1955% | -513% | -615% | |
| Response Time Grey 50% / Grey 80% * (ms) | 1.5 ? | 4.4 ? -193% | 12.2 ? -713% | 26.4 ? -1660% | 7 ? -367% | 13.2 ? -780% |
| Response Time Black / White * (ms) | 1.2 ? | 5.6 ? -367% | 7.7 ? -542% | 28.2 ? -2250% | 9.1 ? -658% | 6.6 ? -450% |
| PWM Frequency (Hz) | 60 ? | 3506 ? | ||||
| Screen | -127% | -74% | -120% | 2% | -75% | |
| Brightness middle (cd/m²) | 382 | 424 11% | 349 -9% | 791.1 107% | 355.3 -7% | 376 -2% |
| Brightness (cd/m²) | 383 | 411 7% | 348 -9% | 800 109% | 340 -11% | 358 -7% |
| Brightness Distribution (%) | 96 | 88 -8% | 93 -3% | 95 -1% | 91 -5% | 88 -8% |
| Black Level * (cd/m²) | 0.37 | 0.32 | 0.04 | 0.32 | 0.33 | |
| Colorchecker dE 2000 * | 0.84 | 3.04 -262% | 1.98 -136% | 4.37 -420% | 1.13 -35% | 2.74 -226% |
| Colorchecker dE 2000 max. * | 3.39 | 7.5 -121% | 7.56 -123% | 10.39 -206% | 2.78 18% | 6.78 -100% |
| Colorchecker dE 2000 calibrated * | 0.8 | 3.04 -280% | 1.45 -81% | 1.04 -30% | 0.32 60% | 0.88 -10% |
| Greyscale dE 2000 * | 1.3 | 4.34 -234% | 3.3 -154% | 6.5 -400% | 1.4 -8% | 3.57 -175% |
| Gamma | 2.166 102% | 2.32 95% | 2.137 103% | 2.28 96% | 2.24 98% | 2.4 92% |
| CCT | 6550 99% | 6952 93% | 6672 97% | 6000 108% | 6372 102% | 7246 90% |
| Contrast (:1) | 1146 | 1091 | 19778 | 1110 | 1139 | |
| Toplam Ortalama (Program / Ayarlar) | -136% /
-121% | -240% /
-152% | -692% /
-396% | -176% /
-88% | -236% /
-151% |
* ... daha küçük daha iyidir
Ekran ayrıca çeşitli açılardan iyi ila çok iyi bir performans sunuyor. Neredeyse %100 sRGB veya DCI-P3 kapsamı ve %88 AdobeRGB kapsamı ile renk uzayında üstünlük sağlıyor. Ayrıca, renk doğruluğu birinci sınıftır ve bazı rakiplerin aksine kalibrasyon ihtiyacını ortadan kaldırır. Ekranın neredeyse 0,0 cd/m² olan olağanüstü siyah seviyesi, OLED'lerin etkileyici kontrast özelliğine katkıda bulunarak geleneksel IPS panelleri geride bırakıyor. Aynı üstünlük görüntüleme açısı kararlılığı ve tepki süresine de uzanarak OLED dizüstü bilgisayarları bu açılardan mevcut referans haline getiriyor.

Bununla birlikte, alıcıların düşük frekans ve titreme gibi tipik dezavantajlarla mücadele etmesi gerekir. Ekran %90 parlaklığın altında 60 Hz'de ve %50'nin altında 240 Hz'de titriyor. Bu değerler, bu tür faktörlere duyarlı kişiler için sorun teşkil edebilir.
Zaman zaman önemli yansımalara neden olan parlak yüzey, günlük kullanımda birçok kullanıcı için endişe kaynağı olabilir. Stealth 16'nın 383 cd/m²'lik kayda değer ortalama parlaklığına rağmen, dış mekan veya iyi aydınlatılmış ortamlar için uygunluğu biraz sınırlıdır.
Yanıt Sürelerini Görüntüle
| ↔ Tepki Süresi Siyahtan Beyaza | ||
|---|---|---|
| 1.2 ms ... yükseliş ↗ ve sonbahar↘ birleşimi | ↗ 0.6 ms yükseliş | 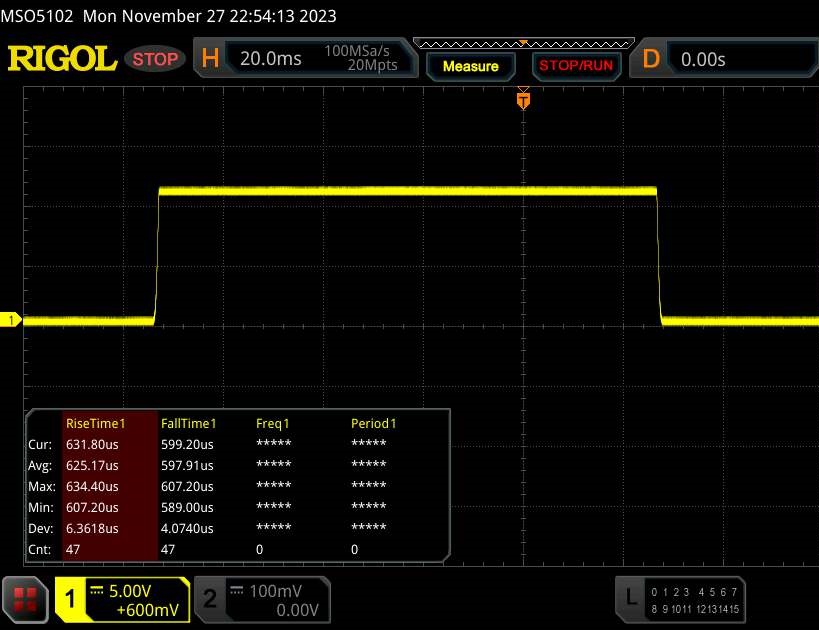 |
| ↘ 0.6 ms sonbahar | ||
| Ekran, testlerimizde çok hızlı yanıt oranları gösteriyor ve hızlı oyun oynamaya çok uygun olmalı. Karşılaştırıldığında, test edilen tüm cihazlar 0.1 (minimum) ile 240 (maksimum) ms arasında değişir. » Tüm cihazların 6 %'si daha iyi. Bu, ölçülen yanıt süresinin test edilen tüm cihazların ortalamasından (19.8 ms) daha iyi olduğu anlamına gelir. | ||
| ↔ Tepki Süresi %50 Griden %80 Griye | ||
| 1.5 ms ... yükseliş ↗ ve sonbahar↘ birleşimi | ↗ 0.8 ms yükseliş | 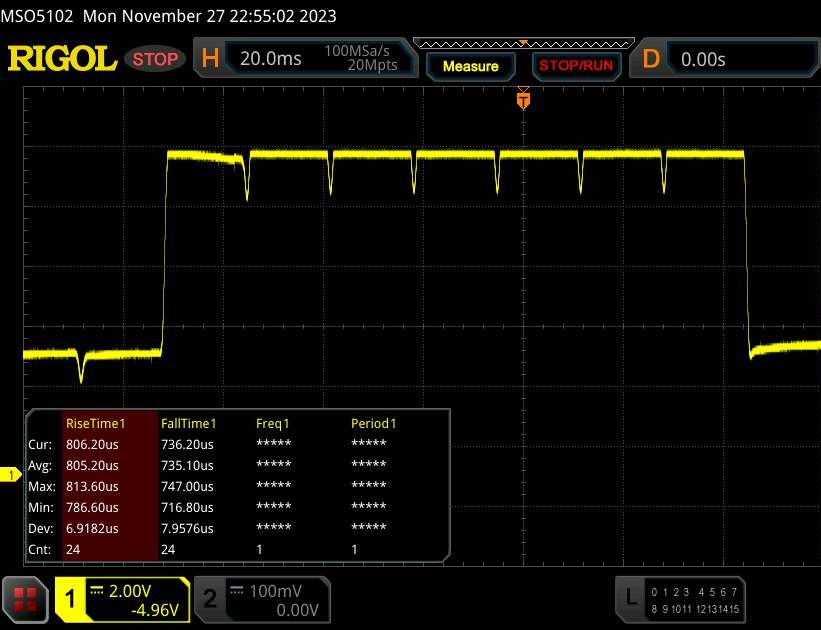 |
| ↘ 0.7 ms sonbahar | ||
| Ekran, testlerimizde çok hızlı yanıt oranları gösteriyor ve hızlı oyun oynamaya çok uygun olmalı. Karşılaştırıldığında, test edilen tüm cihazlar 0.165 (minimum) ile 636 (maksimum) ms arasında değişir. » Tüm cihazların 7 %'si daha iyi. Bu, ölçülen yanıt süresinin test edilen tüm cihazların ortalamasından (31 ms) daha iyi olduğu anlamına gelir. | ||
Ekran Titremesi / PWM (Darbe Genişliği Modülasyonu)
| Ekran titriyor / PWM algılandı | 60 Hz | ≤ 90 % parlaklık ayarı | 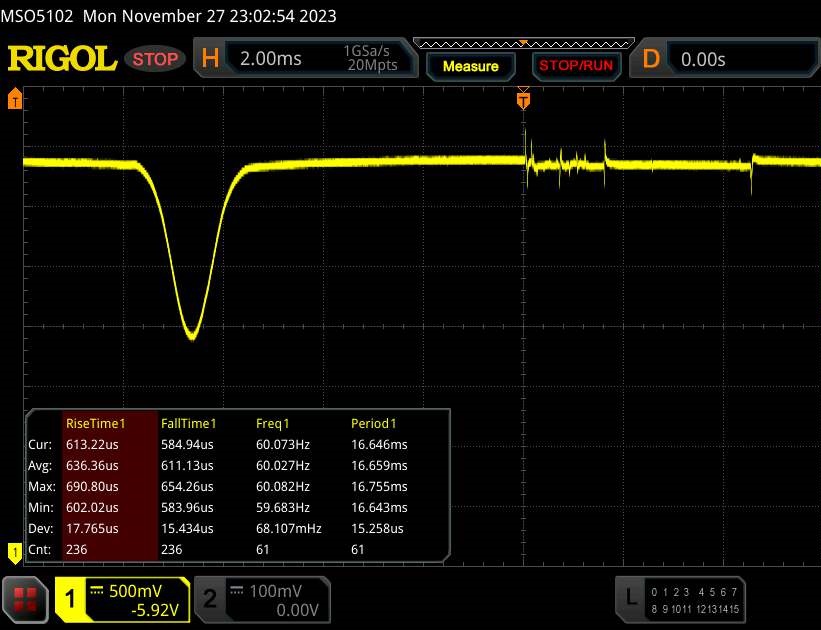 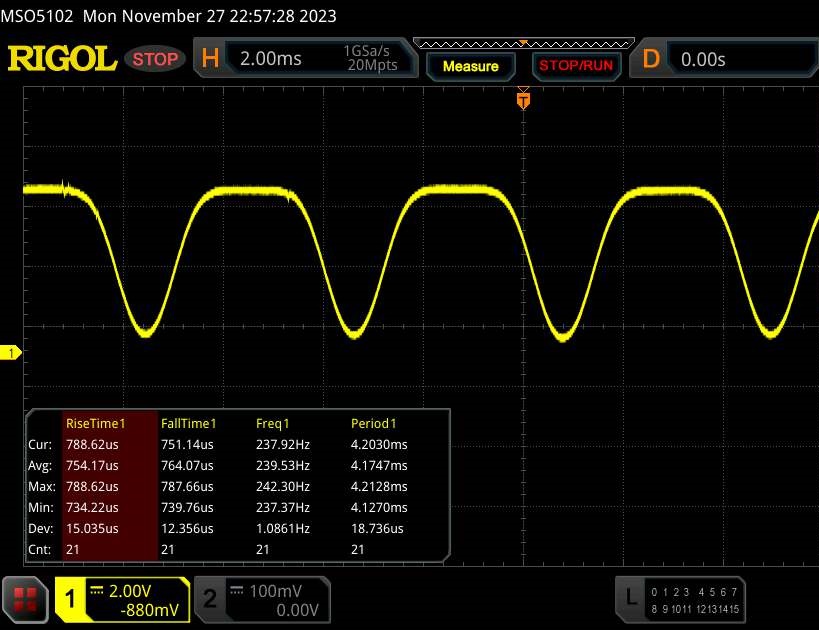 |
Ekran arka ışığı 60 Hz'de titriyor (en kötü durum, örneğin PWM kullanılması) 90 % ve altındaki parlaklık ayarında titreme algılandı. Bu parlaklık ayarının üzerinde titreme veya PWM olmamalıdır. 60 Hz frekansı çok düşüktür, bu nedenle titreme, uzun süreli kullanımdan sonra göz yorgunluğuna ve baş ağrısına neden olabilir. Karşılaştırıldığında: Test edilen tüm cihazların %52 %'si ekranı karartmak için PWM kullanmıyor. PWM tespit edilirse, ortalama 7763 (minimum: 5 - maksimum: 343500) Hz ölçüldü. | |||
Performans
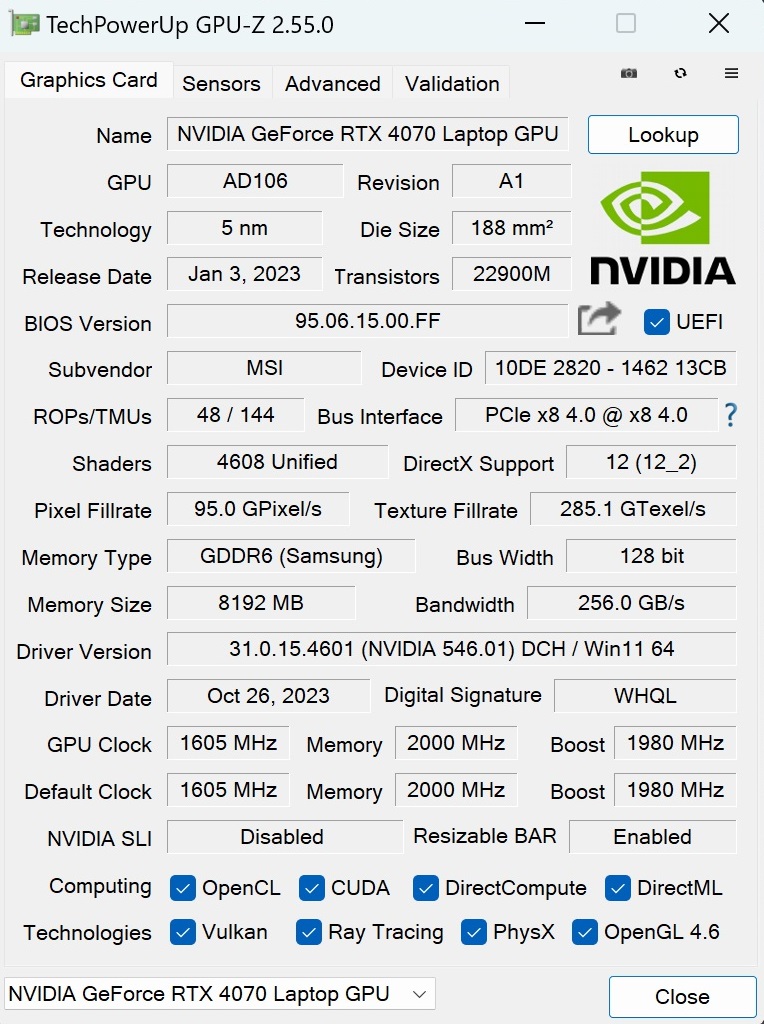
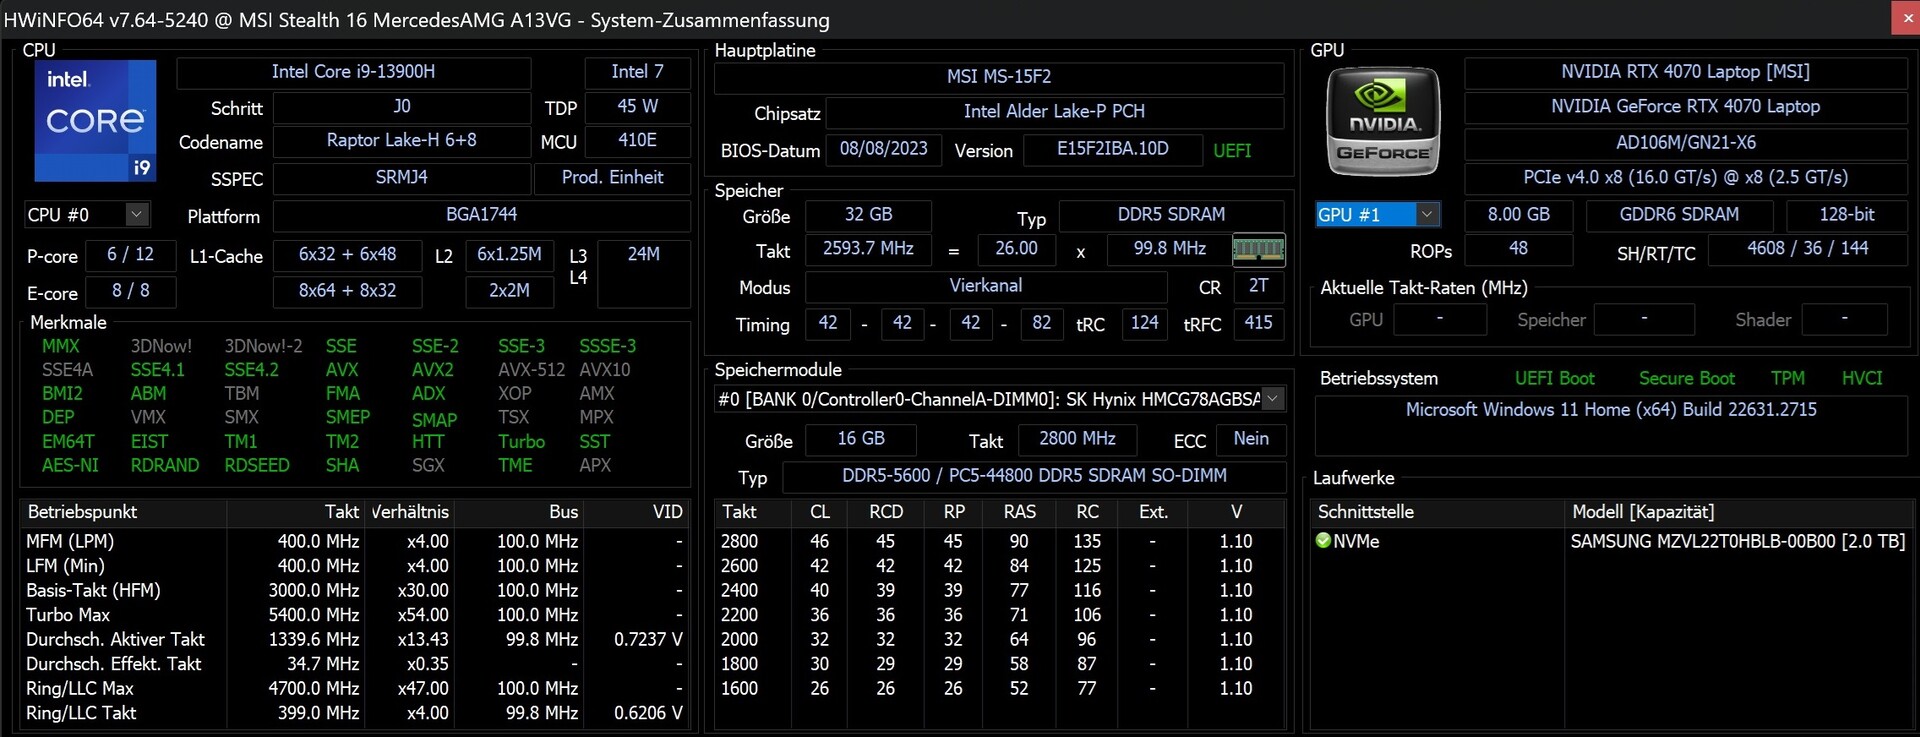
Piyasaya sürüldüğünde bu fiyat segmentinde modası geçmiş olarak kabul edilen GeForce RTX 4070 için yalnızca 8 GB VRAM ile 16-incher, özellikle GPU performansı açısından üst orta aralığa düşüyor. CPU performansı en üst seviyede olan Stealth 16, geniş RAM ve SSD yapılandırmasıyla çoğu kullanıcı için yeterli rezerv sunacaktır.
Test Koşulları
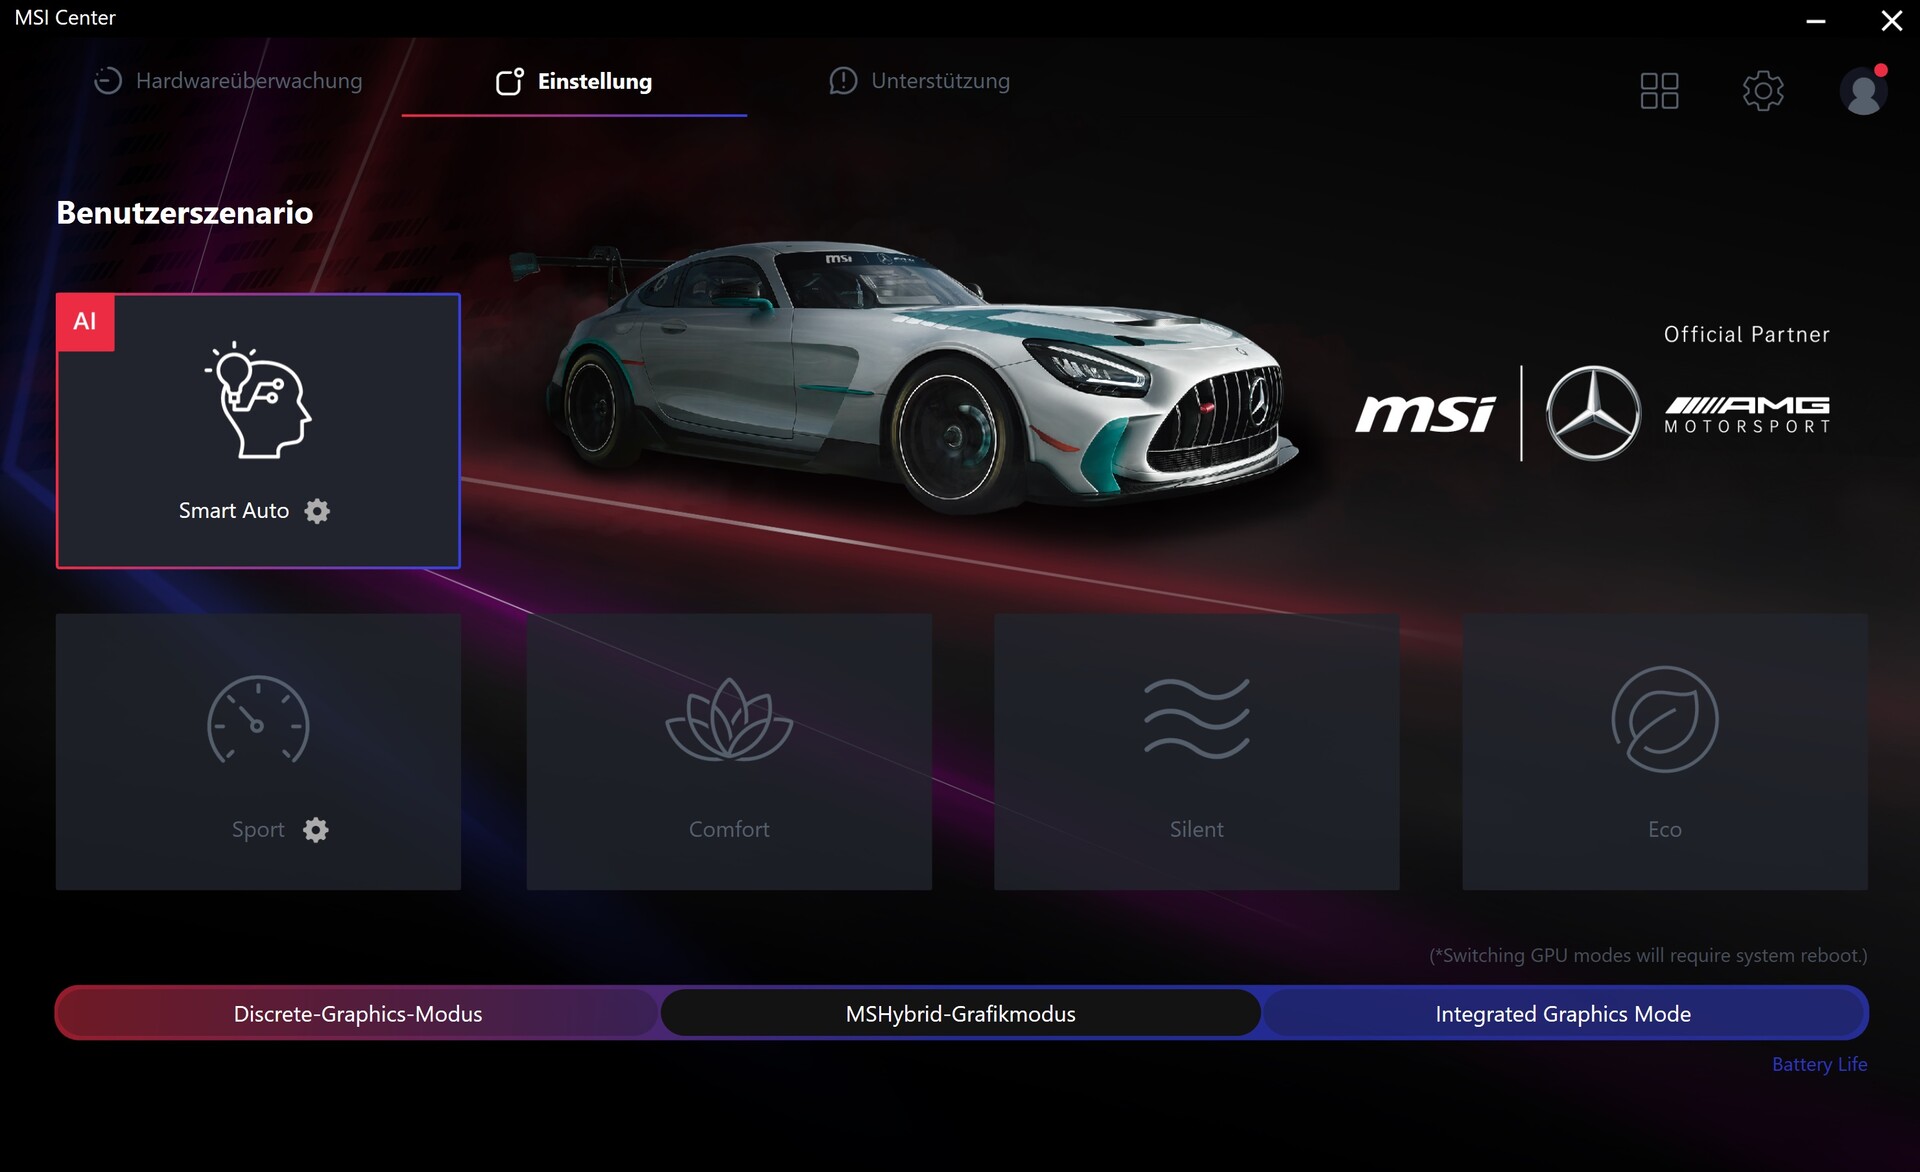
Önceden yüklenmiş MSI Center, Eco'dan Sport'a kadar çeşitli çalışma modları sunuyor. Tüm ölçümler, sistemin ayarları otomatik olarak yaptığı Akıllı Otomatik modda gerçekleştirildi. Grafik anahtarlama (MSHybrid) varsayılan olarak etkinleştirildi.
| Sport | Comfort | Silent | Eco | |
|---|---|---|---|---|
| Performans (Witcher 3, FHD/Ultra) | 120 fps | 110 fps | 90 fps | 90 fps |
| Gürültü (Witcher 3, FHD/Ultra) | 49 dB(A) | 45 dB(A) | 36 dB(A) | 34 dB(A) |
| Güç Sınırı 1 (HWInfo) | 100 w | 45 w | 25 w | 15 w |
| Güç Sınırı 2 (HWInfo) | 160 w | 45 w | 45 w | 15 w |
İşlemci
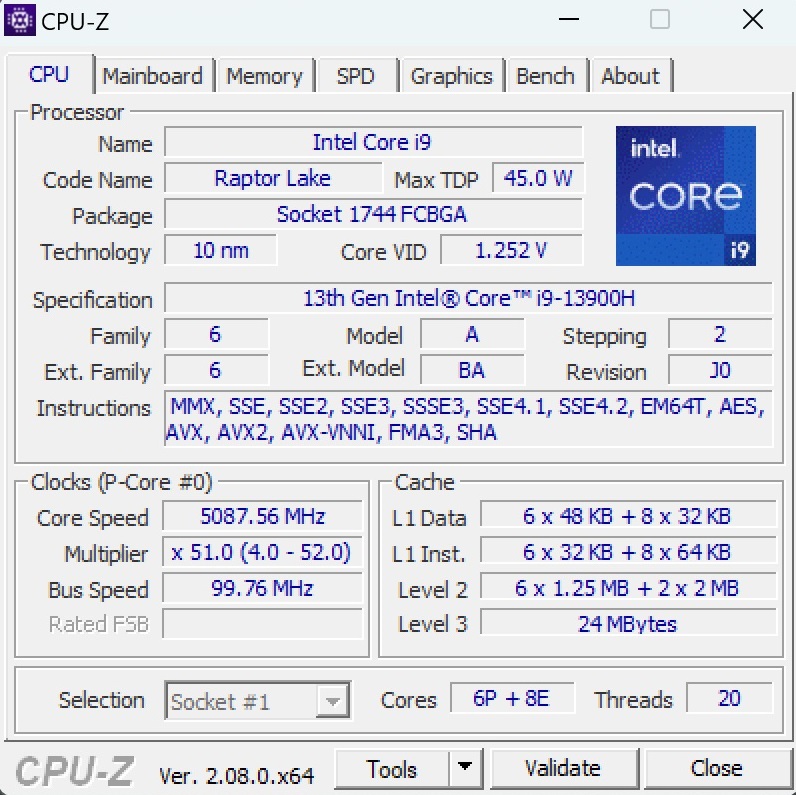
CPU testlerimizde i7-13700H'den i9-13900H'ye yükseltme marjinal performans artışı gösterdi. Benchmark sonuçları standart versiyona benzer kaldı. Cinebench döngüsü sırasında, rakiplerin aksine iki geçici düşüş yaşandı. Core i9-13900H, Hyper-Threading özelliğine sahip 6 performans çekirdeği ve HT'siz 8 verimlilik çekirdeği (toplam 20 iş parçacığı) ile güçlü ancak enerji tüketen üst düzey bir çiptir.
Cinebench R15 Multi Loop
* ... daha küçük daha iyidir
AIDA64: FP32 Ray-Trace | FPU Julia | CPU SHA3 | CPU Queen | FPU SinJulia | FPU Mandel | CPU AES | CPU ZLib | FP64 Ray-Trace | CPU PhotoWorxx
| Performance rating | |
| Sınıf ortalaması Gaming | |
| HP Omen Transcend 16 | |
| Lenovo Legion Pro 5 16ARX8 | |
| Schenker XMG CORE 16 (L23) | |
| MSI Stealth 16 Mercedes-AMG Motorsport A13VG | |
| Schenker XMG Pro 16 Studio (Mid 23) | |
| MSI Stealth 16 Studio A13VG | |
| Ortalama Intel Core i9-13900H | |
| AIDA64 / FP32 Ray-Trace | |
| Sınıf ortalaması Gaming (10227 - 85542, n=106, son 2 yıl) | |
| Lenovo Legion Pro 5 16ARX8 | |
| Schenker XMG CORE 16 (L23) | |
| HP Omen Transcend 16 | |
| MSI Stealth 16 Mercedes-AMG Motorsport A13VG | |
| MSI Stealth 16 Studio A13VG | |
| Schenker XMG Pro 16 Studio (Mid 23) | |
| Ortalama Intel Core i9-13900H (6788 - 19557, n=25) | |
| AIDA64 / FPU Julia | |
| Sınıf ortalaması Gaming (51376 - 238426, n=106, son 2 yıl) | |
| Lenovo Legion Pro 5 16ARX8 | |
| Schenker XMG CORE 16 (L23) | |
| HP Omen Transcend 16 | |
| MSI Stealth 16 Mercedes-AMG Motorsport A13VG | |
| Schenker XMG Pro 16 Studio (Mid 23) | |
| MSI Stealth 16 Studio A13VG | |
| Ortalama Intel Core i9-13900H (22551 - 95579, n=25) | |
| AIDA64 / CPU SHA3 | |
| Sınıf ortalaması Gaming (2180 - 9817, n=106, son 2 yıl) | |
| HP Omen Transcend 16 | |
| Lenovo Legion Pro 5 16ARX8 | |
| Schenker XMG CORE 16 (L23) | |
| MSI Stealth 16 Mercedes-AMG Motorsport A13VG | |
| MSI Stealth 16 Studio A13VG | |
| Schenker XMG Pro 16 Studio (Mid 23) | |
| Ortalama Intel Core i9-13900H (2491 - 4270, n=25) | |
| AIDA64 / CPU Queen | |
| Lenovo Legion Pro 5 16ARX8 | |
| HP Omen Transcend 16 | |
| Sınıf ortalaması Gaming (49785 - 173351, n=93, son 2 yıl) | |
| MSI Stealth 16 Mercedes-AMG Motorsport A13VG | |
| MSI Stealth 16 Studio A13VG | |
| Ortalama Intel Core i9-13900H (65121 - 120936, n=25) | |
| Schenker XMG CORE 16 (L23) | |
| Schenker XMG Pro 16 Studio (Mid 23) | |
| AIDA64 / FPU SinJulia | |
| Lenovo Legion Pro 5 16ARX8 | |
| Schenker XMG CORE 16 (L23) | |
| Sınıf ortalaması Gaming (4424 - 33636, n=106, son 2 yıl) | |
| HP Omen Transcend 16 | |
| MSI Stealth 16 Mercedes-AMG Motorsport A13VG | |
| MSI Stealth 16 Studio A13VG | |
| Schenker XMG Pro 16 Studio (Mid 23) | |
| Ortalama Intel Core i9-13900H (6108 - 11631, n=25) | |
| AIDA64 / FPU Mandel | |
| Sınıf ortalaması Gaming (25115 - 128721, n=106, son 2 yıl) | |
| Lenovo Legion Pro 5 16ARX8 | |
| Schenker XMG CORE 16 (L23) | |
| HP Omen Transcend 16 | |
| MSI Stealth 16 Mercedes-AMG Motorsport A13VG | |
| MSI Stealth 16 Studio A13VG | |
| Schenker XMG Pro 16 Studio (Mid 23) | |
| Ortalama Intel Core i9-13900H (11283 - 48474, n=25) | |
| AIDA64 / CPU AES | |
| Schenker XMG Pro 16 Studio (Mid 23) | |
| HP Omen Transcend 16 | |
| Sınıf ortalaması Gaming (39258 - 247074, n=106, son 2 yıl) | |
| Schenker XMG CORE 16 (L23) | |
| Ortalama Intel Core i9-13900H (3691 - 149377, n=25) | |
| MSI Stealth 16 Mercedes-AMG Motorsport A13VG | |
| MSI Stealth 16 Studio A13VG | |
| Lenovo Legion Pro 5 16ARX8 | |
| AIDA64 / CPU ZLib | |
| HP Omen Transcend 16 | |
| Sınıf ortalaması Gaming (574 - 2531, n=106, son 2 yıl) | |
| MSI Stealth 16 Mercedes-AMG Motorsport A13VG | |
| Lenovo Legion Pro 5 16ARX8 | |
| Schenker XMG CORE 16 (L23) | |
| Schenker XMG Pro 16 Studio (Mid 23) | |
| Ortalama Intel Core i9-13900H (789 - 1254, n=25) | |
| MSI Stealth 16 Studio A13VG | |
| AIDA64 / FP64 Ray-Trace | |
| Sınıf ortalaması Gaming (5509 - 45446, n=106, son 2 yıl) | |
| Lenovo Legion Pro 5 16ARX8 | |
| Schenker XMG CORE 16 (L23) | |
| HP Omen Transcend 16 | |
| MSI Stealth 16 Mercedes-AMG Motorsport A13VG | |
| MSI Stealth 16 Studio A13VG | |
| Schenker XMG Pro 16 Studio (Mid 23) | |
| Ortalama Intel Core i9-13900H (3655 - 10716, n=25) | |
| AIDA64 / CPU PhotoWorxx | |
| HP Omen Transcend 16 | |
| Schenker XMG Pro 16 Studio (Mid 23) | |
| MSI Stealth 16 Mercedes-AMG Motorsport A13VG | |
| MSI Stealth 16 Studio A13VG | |
| Sınıf ortalaması Gaming (12271 - 89891, n=106, son 2 yıl) | |
| Schenker XMG CORE 16 (L23) | |
| Ortalama Intel Core i9-13900H (10871 - 50488, n=25) | |
| Lenovo Legion Pro 5 16ARX8 | |
Sistem Performansı
Çok hızlı bileşenler barındırmasına rağmen Stealth 16'nın sistem performansı, standart Studio versiyonunun hemen önünde, karşılaştırma alanında sondan ikinci sırada yer alıyor. Farklar küçüktür ve pratik kullanımda kullanıcıların önemli farklılıkları fark etmesi pek olası değildir.
CrossMark: Overall | Productivity | Creativity | Responsiveness
| PCMark 10 / Score | |
| Sınıf ortalaması Gaming (5828 - 11574, n=94, son 2 yıl) | |
| Lenovo Legion Pro 5 16ARX8 | |
| Schenker XMG CORE 16 (L23) | |
| HP Omen Transcend 16 | |
| Schenker XMG Pro 16 Studio (Mid 23) | |
| Ortalama Intel Core i9-13900H, NVIDIA GeForce RTX 4070 Laptop GPU (5855 - 8538, n=8) | |
| MSI Stealth 16 Mercedes-AMG Motorsport A13VG | |
| MSI Stealth 16 Studio A13VG | |
| PCMark 10 / Essentials | |
| Schenker XMG Pro 16 Studio (Mid 23) | |
| HP Omen Transcend 16 | |
| Lenovo Legion Pro 5 16ARX8 | |
| Schenker XMG CORE 16 (L23) | |
| MSI Stealth 16 Mercedes-AMG Motorsport A13VG | |
| Ortalama Intel Core i9-13900H, NVIDIA GeForce RTX 4070 Laptop GPU (8835 - 11940, n=8) | |
| Sınıf ortalaması Gaming (8810 - 11935, n=98, son 2 yıl) | |
| MSI Stealth 16 Studio A13VG | |
| PCMark 10 / Productivity | |
| Sınıf ortalaması Gaming (6845 - 21327, n=96, son 2 yıl) | |
| Schenker XMG CORE 16 (L23) | |
| Schenker XMG Pro 16 Studio (Mid 23) | |
| Lenovo Legion Pro 5 16ARX8 | |
| Ortalama Intel Core i9-13900H, NVIDIA GeForce RTX 4070 Laptop GPU (7967 - 10991, n=8) | |
| HP Omen Transcend 16 | |
| MSI Stealth 16 Mercedes-AMG Motorsport A13VG | |
| MSI Stealth 16 Studio A13VG | |
| PCMark 10 / Digital Content Creation | |
| Sınıf ortalaması Gaming (7602 - 19657, n=96, son 2 yıl) | |
| HP Omen Transcend 16 | |
| Lenovo Legion Pro 5 16ARX8 | |
| Schenker XMG CORE 16 (L23) | |
| Ortalama Intel Core i9-13900H, NVIDIA GeForce RTX 4070 Laptop GPU (7738 - 13575, n=8) | |
| Schenker XMG Pro 16 Studio (Mid 23) | |
| MSI Stealth 16 Studio A13VG | |
| MSI Stealth 16 Mercedes-AMG Motorsport A13VG | |
| CrossMark / Overall | |
| Lenovo Legion Pro 5 16ARX8 | |
| Sınıf ortalaması Gaming (1366 - 2409, n=95, son 2 yıl) | |
| HP Omen Transcend 16 | |
| Schenker XMG Pro 16 Studio (Mid 23) | |
| Ortalama Intel Core i9-13900H, NVIDIA GeForce RTX 4070 Laptop GPU (1104 - 1974, n=7) | |
| MSI Stealth 16 Studio A13VG | |
| Schenker XMG CORE 16 (L23) | |
| CrossMark / Productivity | |
| Lenovo Legion Pro 5 16ARX8 | |
| Schenker XMG Pro 16 Studio (Mid 23) | |
| Sınıf ortalaması Gaming (1386 - 2254, n=95, son 2 yıl) | |
| HP Omen Transcend 16 | |
| Ortalama Intel Core i9-13900H, NVIDIA GeForce RTX 4070 Laptop GPU (1058 - 1914, n=7) | |
| MSI Stealth 16 Studio A13VG | |
| Schenker XMG CORE 16 (L23) | |
| CrossMark / Creativity | |
| HP Omen Transcend 16 | |
| Sınıf ortalaması Gaming (1343 - 2729, n=95, son 2 yıl) | |
| Lenovo Legion Pro 5 16ARX8 | |
| Schenker XMG Pro 16 Studio (Mid 23) | |
| Ortalama Intel Core i9-13900H, NVIDIA GeForce RTX 4070 Laptop GPU (1178 - 2254, n=7) | |
| MSI Stealth 16 Studio A13VG | |
| Schenker XMG CORE 16 (L23) | |
| CrossMark / Responsiveness | |
| Schenker XMG Pro 16 Studio (Mid 23) | |
| Lenovo Legion Pro 5 16ARX8 | |
| Sınıf ortalaması Gaming (1226 - 2334, n=95, son 2 yıl) | |
| Ortalama Intel Core i9-13900H, NVIDIA GeForce RTX 4070 Laptop GPU (1037 - 1952, n=7) | |
| MSI Stealth 16 Studio A13VG | |
| HP Omen Transcend 16 | |
| Schenker XMG CORE 16 (L23) | |
| PCMark 10 Score | 7334 puan | |
Yardım | ||
| AIDA64 / Memory Copy | |
| HP Omen Transcend 16 | |
| Sınıf ortalaması Gaming (21750 - 129946, n=106, son 2 yıl) | |
| Schenker XMG Pro 16 Studio (Mid 23) | |
| MSI Stealth 16 Studio A13VG | |
| MSI Stealth 16 Mercedes-AMG Motorsport A13VG | |
| Schenker XMG CORE 16 (L23) | |
| Ortalama Intel Core i9-13900H (37448 - 74486, n=25) | |
| Lenovo Legion Pro 5 16ARX8 | |
| AIDA64 / Memory Read | |
| HP Omen Transcend 16 | |
| Schenker XMG Pro 16 Studio (Mid 23) | |
| MSI Stealth 16 Studio A13VG | |
| MSI Stealth 16 Mercedes-AMG Motorsport A13VG | |
| Sınıf ortalaması Gaming (22956 - 118858, n=106, son 2 yıl) | |
| Ortalama Intel Core i9-13900H (41599 - 75433, n=25) | |
| Schenker XMG CORE 16 (L23) | |
| Lenovo Legion Pro 5 16ARX8 | |
| AIDA64 / Memory Write | |
| Schenker XMG CORE 16 (L23) | |
| HP Omen Transcend 16 | |
| Sınıf ortalaması Gaming (22297 - 135096, n=106, son 2 yıl) | |
| MSI Stealth 16 Mercedes-AMG Motorsport A13VG | |
| Schenker XMG Pro 16 Studio (Mid 23) | |
| MSI Stealth 16 Studio A13VG | |
| Ortalama Intel Core i9-13900H (36152 - 88505, n=25) | |
| Lenovo Legion Pro 5 16ARX8 | |
| AIDA64 / Memory Latency | |
| Sınıf ortalaması Gaming (75.3 - 259, n=106, son 2 yıl) | |
| Ortalama Intel Core i9-13900H (75.8 - 102.3, n=25) | |
| MSI Stealth 16 Mercedes-AMG Motorsport A13VG | |
| Schenker XMG CORE 16 (L23) | |
| HP Omen Transcend 16 | |
| MSI Stealth 16 Studio A13VG | |
| Schenker XMG Pro 16 Studio (Mid 23) | |
| Lenovo Legion Pro 5 16ARX8 | |
* ... daha küçük daha iyidir
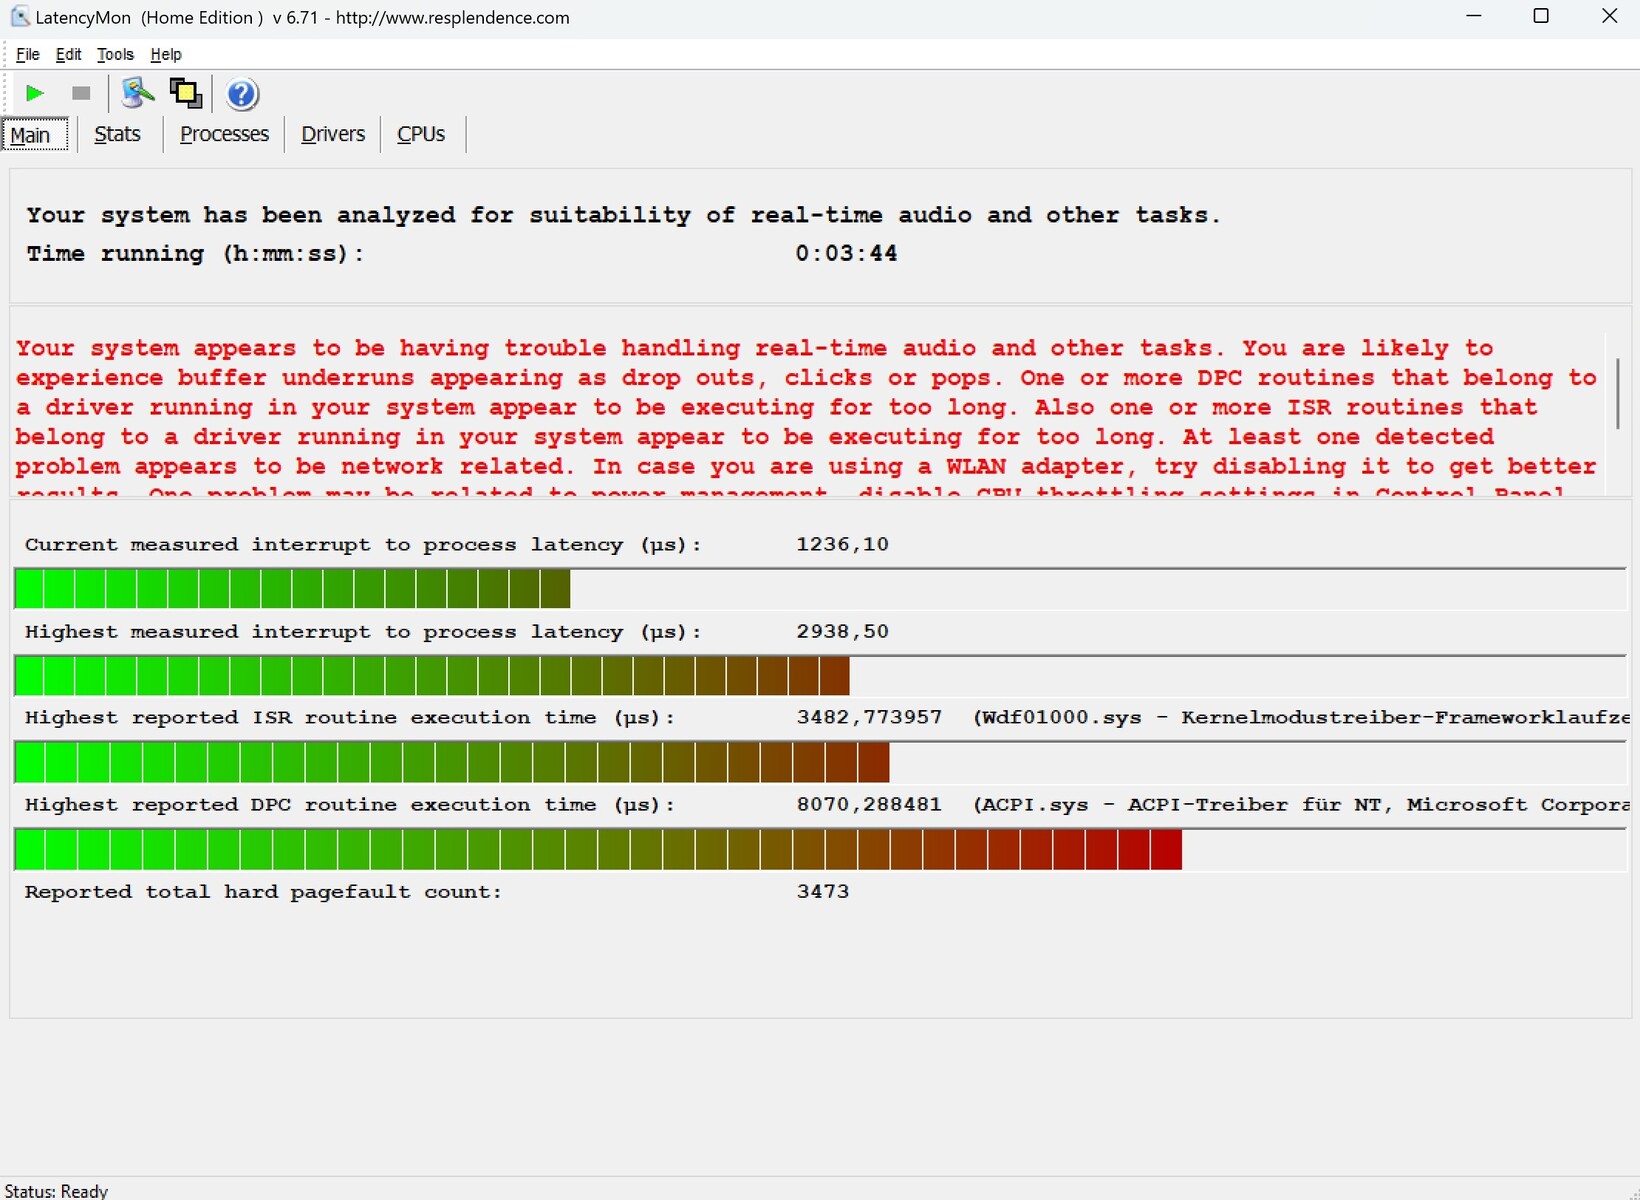
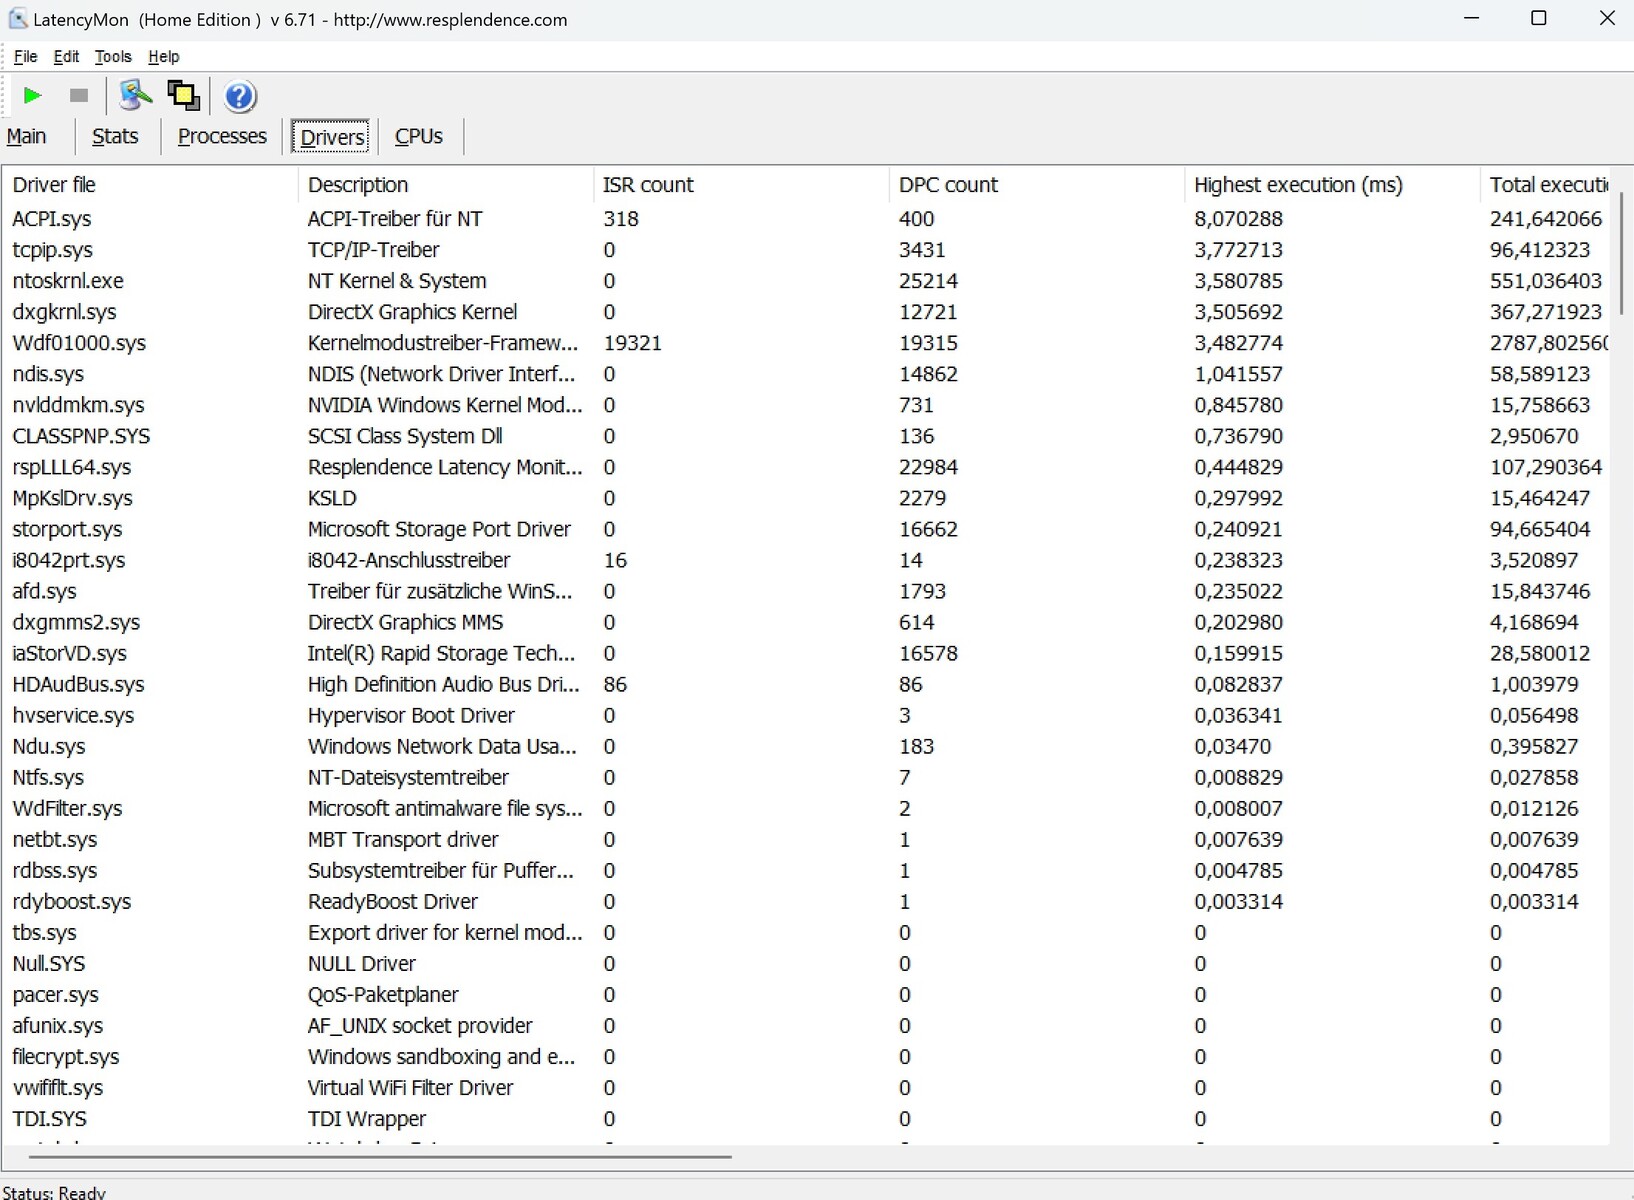
DPC Gecikme Süresi
MSI, Stealth 16'daki gecikme süresini iyileştirebilir. Teslim edildiği şekliyle LatencyMon, gerçek zamanlı ses ve video işlemede potansiyel aksaklıklara işaret ediyor. Ancak bu durum birçok dizüstü bilgisayarı etkiliyor.
| DPC Latencies / LatencyMon - interrupt to process latency (max), Web, Youtube, Prime95 | |
| MSI Stealth 16 Studio A13VG | |
| MSI Stealth 16 Mercedes-AMG Motorsport A13VG | |
| Schenker XMG Pro 16 Studio (Mid 23) | |
| HP Omen Transcend 16 | |
| Schenker XMG CORE 16 (L23) | |
| Lenovo Legion Pro 5 16ARX8 | |
* ... daha küçük daha iyidir
Depolama Cihazları
Test cihazındaki 2 TB Samsung SSD (model PM9A1) başlangıçta iyi performans gösterdi, ancak uzun süreli yük altında ciddi performans düşüşleri veya kısılma yaşadı. Ne yazık ki MSI, standart Stealth 16'da olduğu gibi bu sorunu henüz ele almamıştır. Lenovo Legion Pro 5 haricinde rakiplerin çoğu bu konuda daha iyi performans gösteriyor.

* ... daha küçük daha iyidir
Continuous power read: DiskSpd Read Loop, Queue Depth 8
Grafik kartı
GPU'nun 105 watt'lık TGP'sine rağmen, Stealth 16'daki RTX 4070'in performansı bu grafik kartı için ortalama ile uyumludur.
| 3DMark Ice Storm Standard Score | 99001 puan | |
| 3DMark Cloud Gate Standard Score | 52847 puan | |
| 3DMark Fire Strike Score | 22419 puan | |
| 3DMark Time Spy Score | 11694 puan | |
Yardım | ||
* ... daha küçük daha iyidir
Oyun Performansı
OLED ekran klasik UHD çözünürlüğünü (3.840 x 2.160 piksel) desteklemediğinden, oyun kıyaslamaları için maksimum 2.560 x 1.440 piksel kullandık. Daha yükseğe çıkmak, özellikle yüksek ayarlarda RTX 4070'i aşırı zorluyor.GPU sayfası. Bununla birlikte, Stealth 16 QHD'de takdire şayan bir performans sergiliyor ve OLED panelin 60 Hz kapasitesini, zorlu ve daha az optimize edilmiş olanlar hariç çoğu oyunda tam olarak kullanıyor Alan Wake 2.
| Counter-Strike 2 - 2560x1440 Very High Preset | |
| Sınıf ortalaması Gaming (15.7 - 224, n=5, son 2 yıl) | |
| XMG Pro 15 E23 | |
| Ortalama NVIDIA GeForce RTX 4070 Laptop GPU (87.9 - 100.6, n=2) | |
| MSI Stealth 16 Mercedes-AMG Motorsport A13VG | |
| Alan Wake 2 - 2560x1440 High Preset | |
| Sınıf ortalaması Gaming (31.2 - 93.1, n=33, son 2 yıl) | |
| Ortalama NVIDIA GeForce RTX 4070 Laptop GPU (40.2 - 44.5, n=7) | |
| MSI Stealth 16 Mercedes-AMG Motorsport A13VG | |
| XMG Pro 15 E23 | |
| EA Sports WRC - 2560x1440 Ultra Preset AA:Epic AF:16x | |
| XMG Pro 15 E23 | |
| Ortalama NVIDIA GeForce RTX 4070 Laptop GPU (59.6 - 68.8, n=3) | |
| MSI Stealth 16 Mercedes-AMG Motorsport A13VG | |
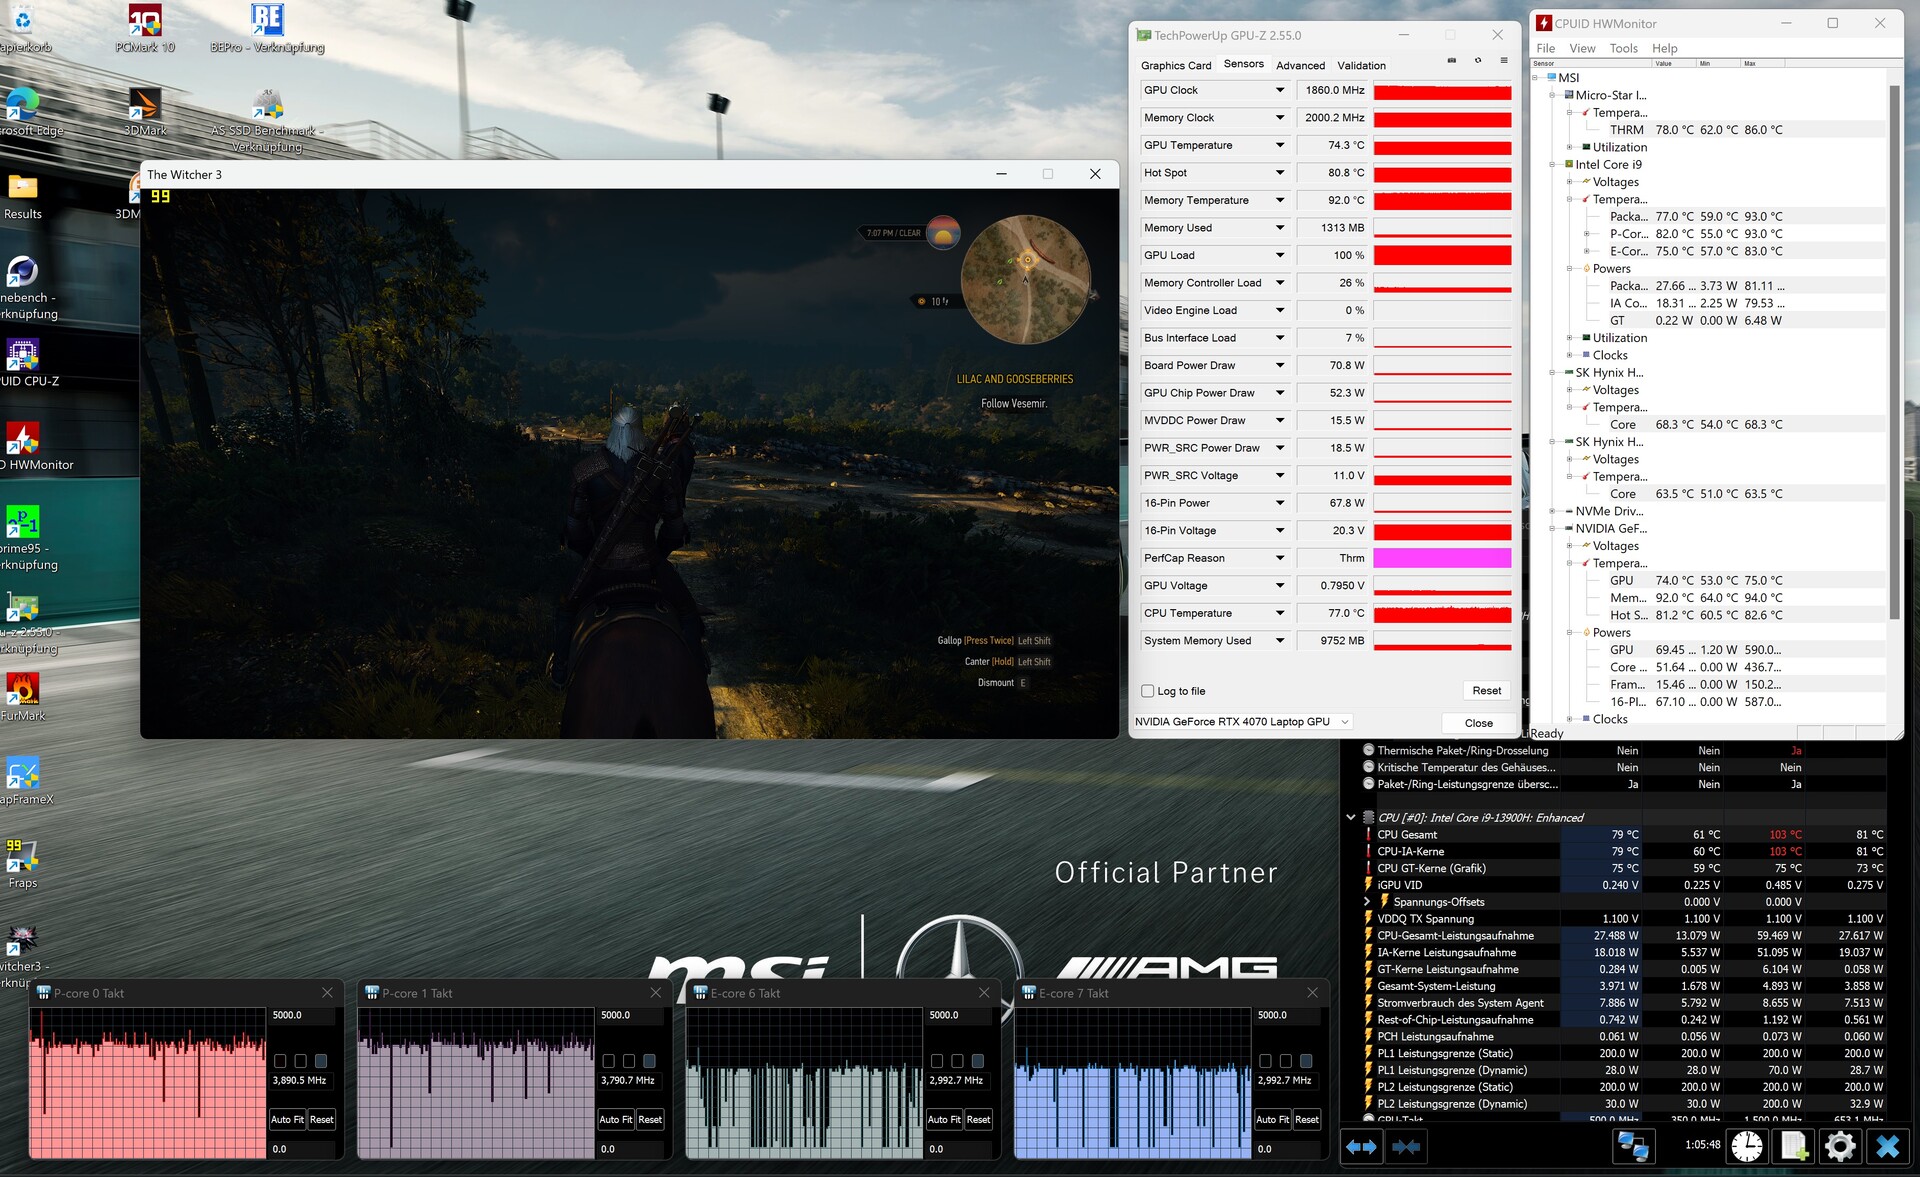
60 dakikalık bir test sırasında The Witcher 3 fHD/Ultra ayarlarında kare hızında düşüş olmadı, ancak hız test boyunca neredeyse %10 düştü.
Witcher 3 FPS chart
| düşük | orta | yüksek | ultra | QHD | |
|---|---|---|---|---|---|
| GTA V (2015) | 176 | 164.9 | 100.3 | 87.6 | |
| The Witcher 3 (2015) | 317 | 205 | 110 | 77.7 | |
| Dota 2 Reborn (2015) | 178.3 | 144.5 | 135.9 | 126.9 | |
| Final Fantasy XV Benchmark (2018) | 138 | 101.4 | 74.1 | ||
| X-Plane 11.11 (2018) | 144.7 | 118.1 | 98 | ||
| Strange Brigade (2018) | 276 | 220 | 190.6 | 126.3 | |
| Counter-Strike 2 (2023) | 160.2 | 151.5 | 121.5 | 87.9 | |
| Alan Wake 2 (2023) | 66.9 | 65.1 | 42.3 | ||
| EA Sports WRC (2023) | 90.6 | 85 | 77.1 | 59.6 |
Emisyonlar
Sistem Gürültüsü
Rölanti gürültü seviyesi standart Stealth 16 ile benzer olsa da Motorsport Edition yük altında biraz daha yüksek. Bununla birlikte, rakipleriyle karşılaştırıldığında, ölçülen değerler makul sınırlar içinde kalırken, HP Omen Transcend 16 3D modunda daha belirgindir.
Ses yüksekliği
| Boşta |
| 25 / 26 / 27 dB |
| Çalışırken |
| 39 / 51 dB |
 | ||
30 dB sessiz 40 dB(A) duyulabilirlik 50 dB(A) gürültülü |
||
min: | ||
| MSI Stealth 16 Mercedes-AMG Motorsport A13VG i9-13900H, GeForce RTX 4070 Laptop GPU | MSI Stealth 16 Studio A13VG i7-13700H, GeForce RTX 4070 Laptop GPU | Schenker XMG Pro 16 Studio (Mid 23) i9-13900H, GeForce RTX 4070 Laptop GPU | HP Omen Transcend 16 i9-13900HX, GeForce RTX 4070 Laptop GPU | Lenovo Legion Pro 5 16ARX8 R7 7745HX, GeForce RTX 4070 Laptop GPU | Schenker XMG CORE 16 (L23) R7 7840HS, GeForce RTX 4070 Laptop GPU | |
|---|---|---|---|---|---|---|
| Noise | 6% | -8% | -10% | 5% | -0% | |
| kapalı / ortam * (dB) | 25 | 24 4% | 25 -0% | 22.9 8% | 23.2 7% | 23 8% |
| Idle Minimum * (dB) | 25 | 24 4% | 26 -4% | 29.1 -16% | 23.2 7% | 23 8% |
| Idle Average * (dB) | 26 | 24 8% | 29 -12% | 29.1 -12% | 23.2 11% | 28.48 -10% |
| Idle Maximum * (dB) | 27 | 24 11% | 34 -26% | 29.1 -8% | 26.2 3% | 28.48 -5% |
| Load Average * (dB) | 39 | 34.81 11% | 43 -10% | 45.7 -17% | 31.4 19% | 30 23% |
| Witcher 3 ultra * (dB) | 45 | 44.05 2% | 48 -7% | 54.3 -21% | 48.4 -8% | 54.12 -20% |
| Load Maximum * (dB) | 51 | 51.57 -1% | 48 6% | 54.3 -6% | 53.8 -5% | 54.12 -6% |
* ... daha küçük daha iyidir
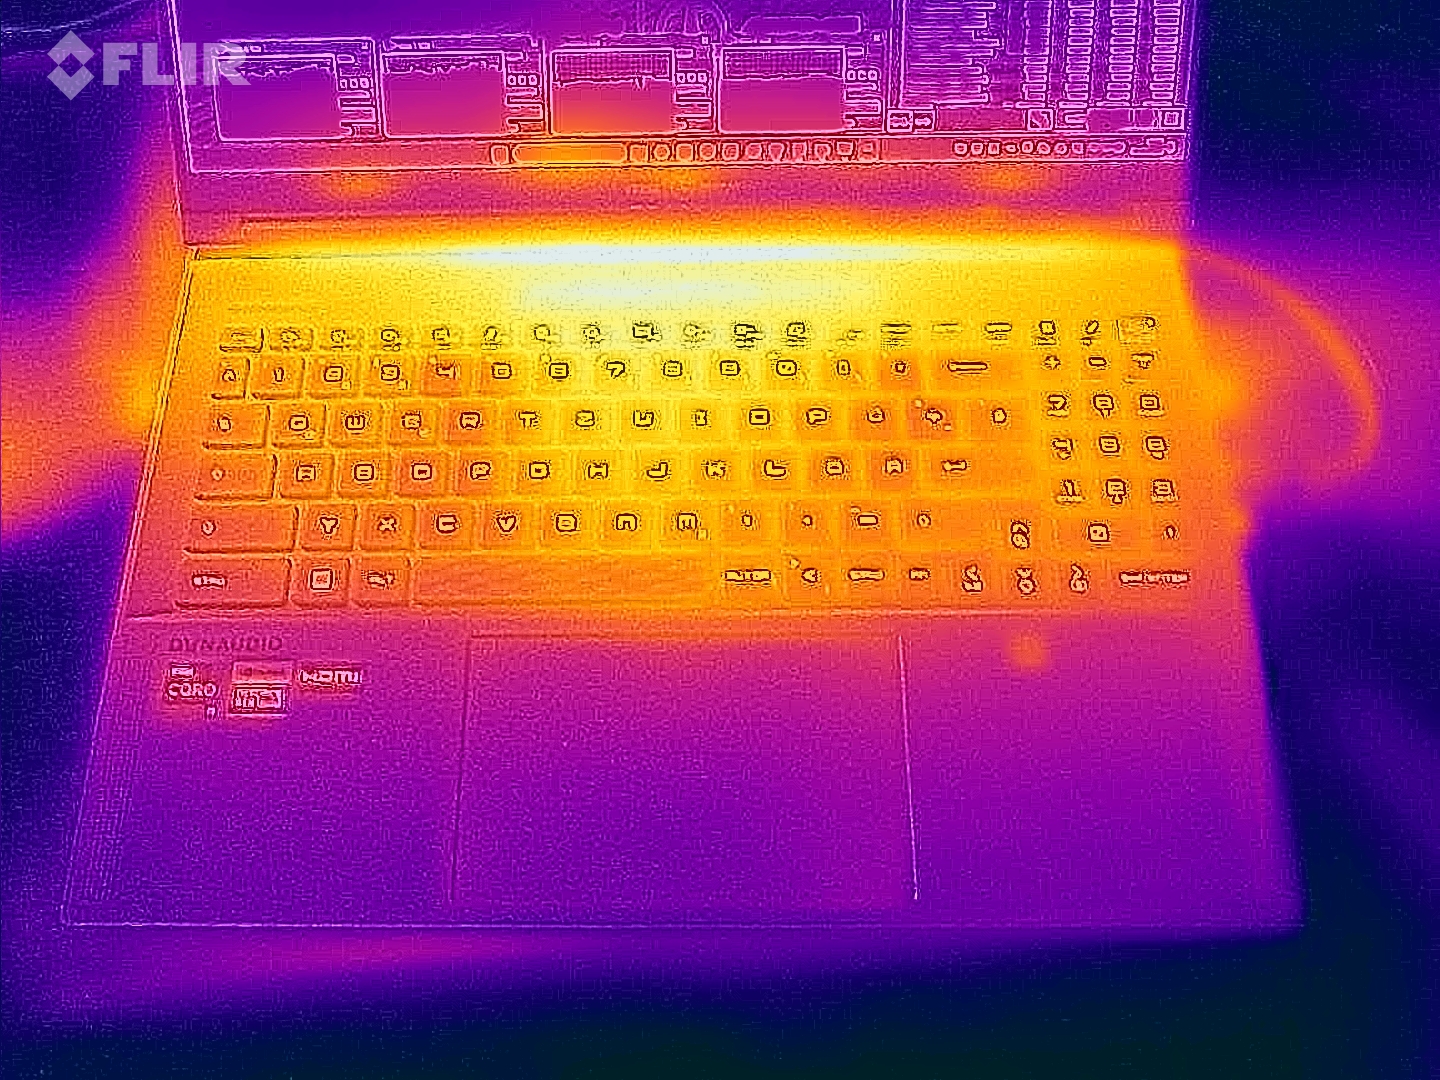
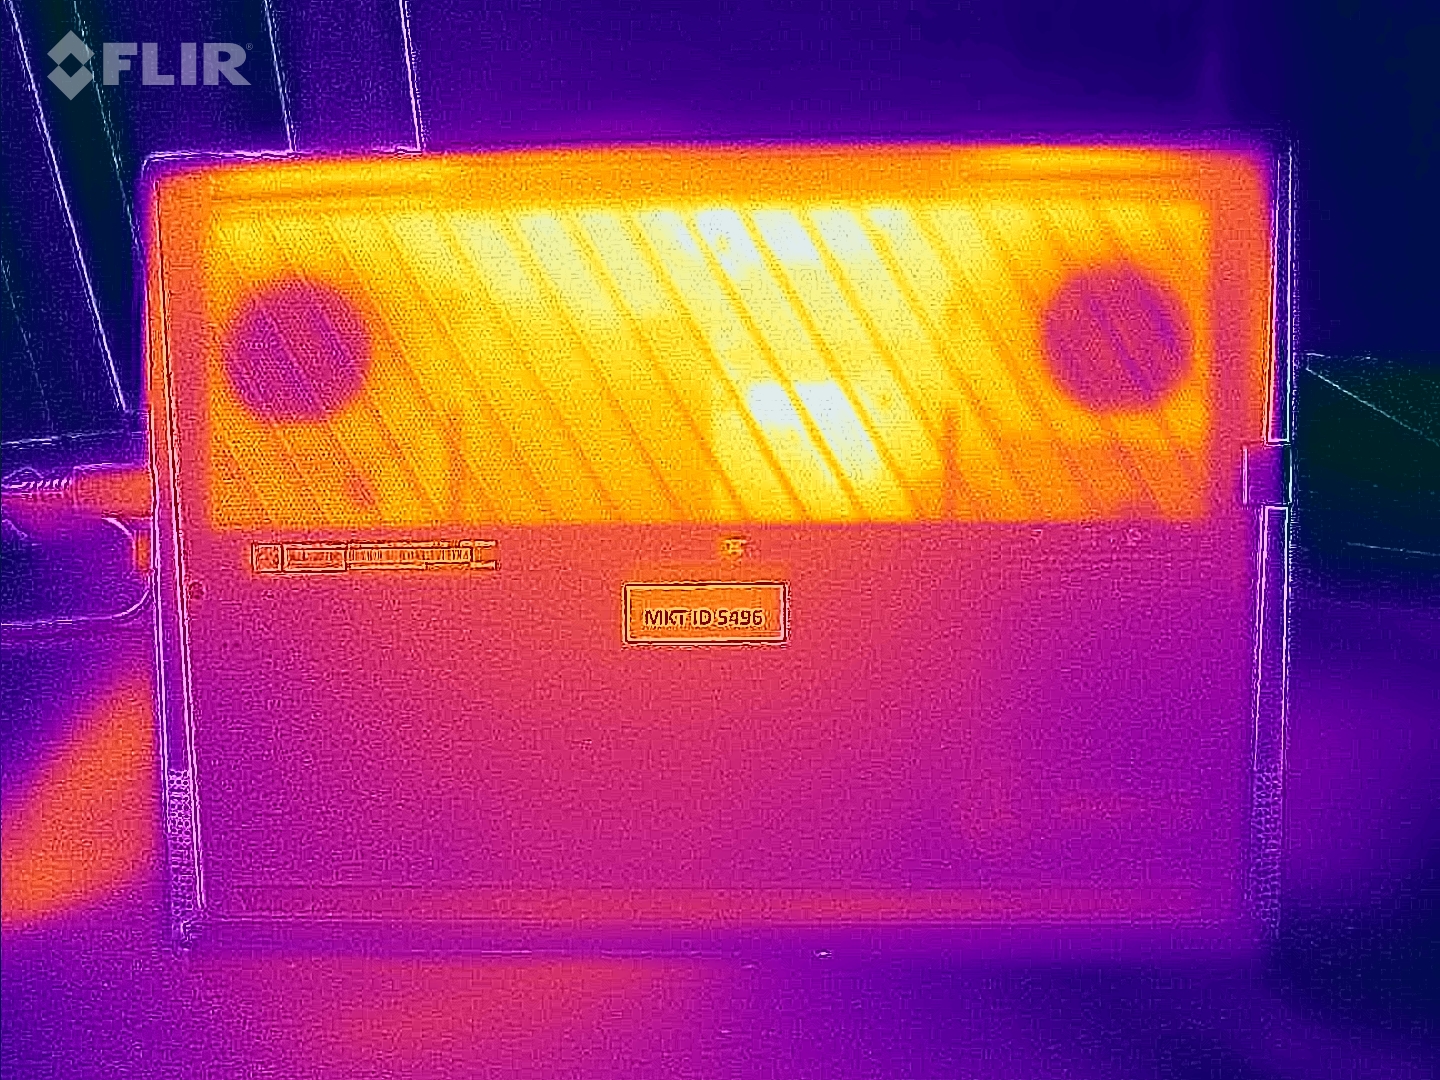
Sıcaklık
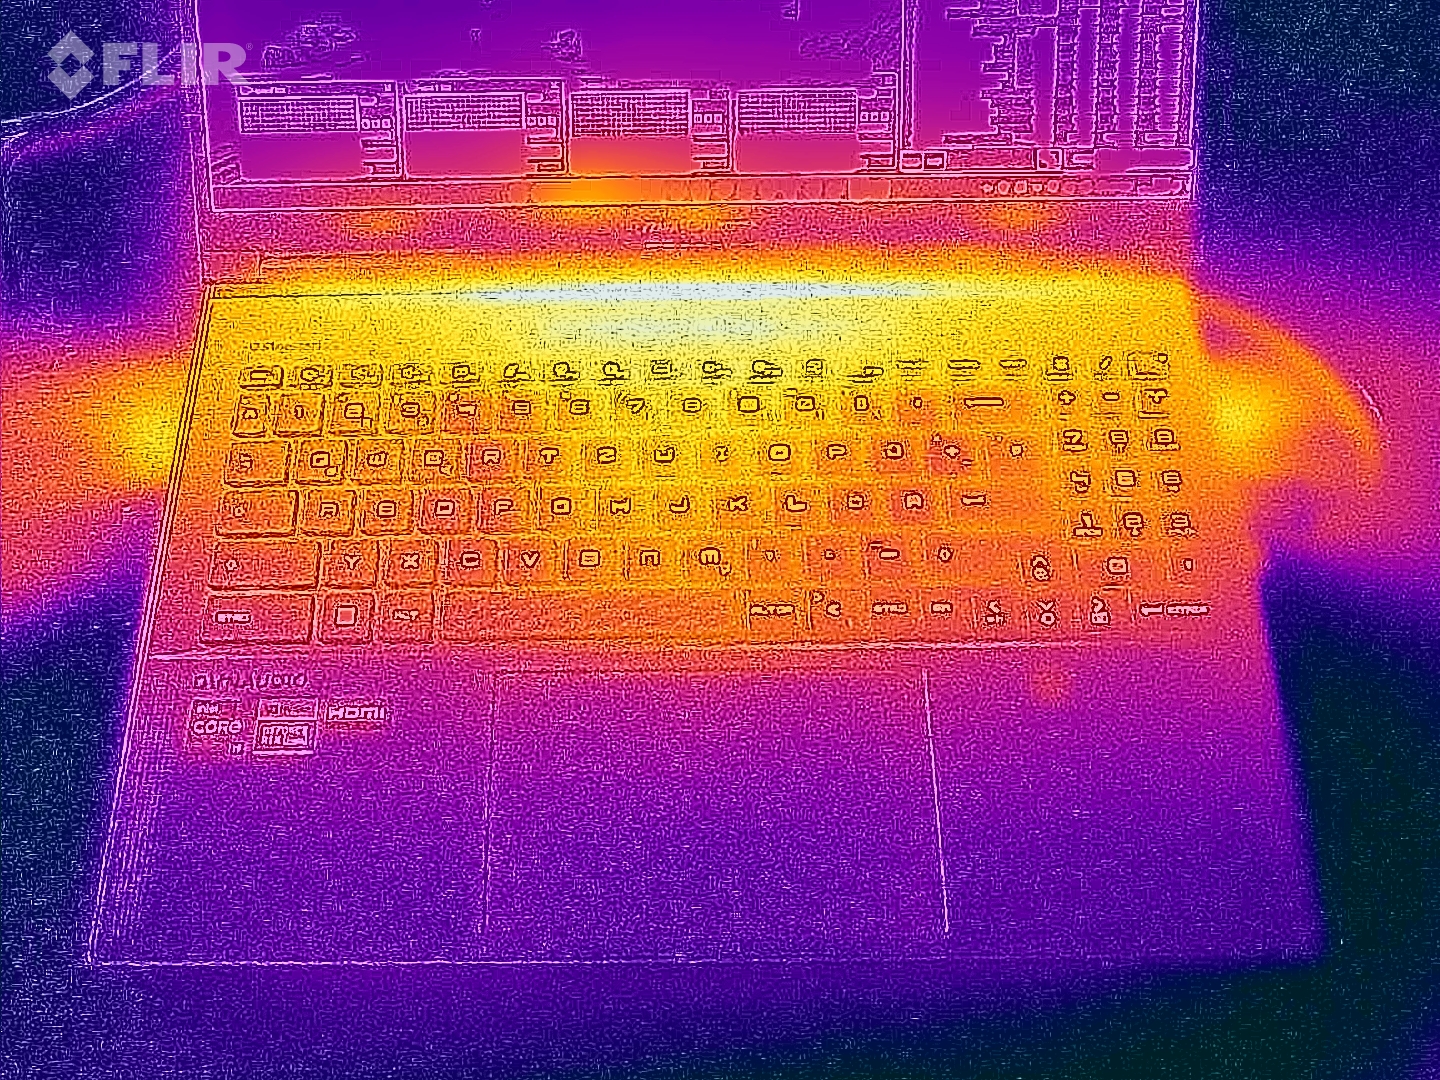
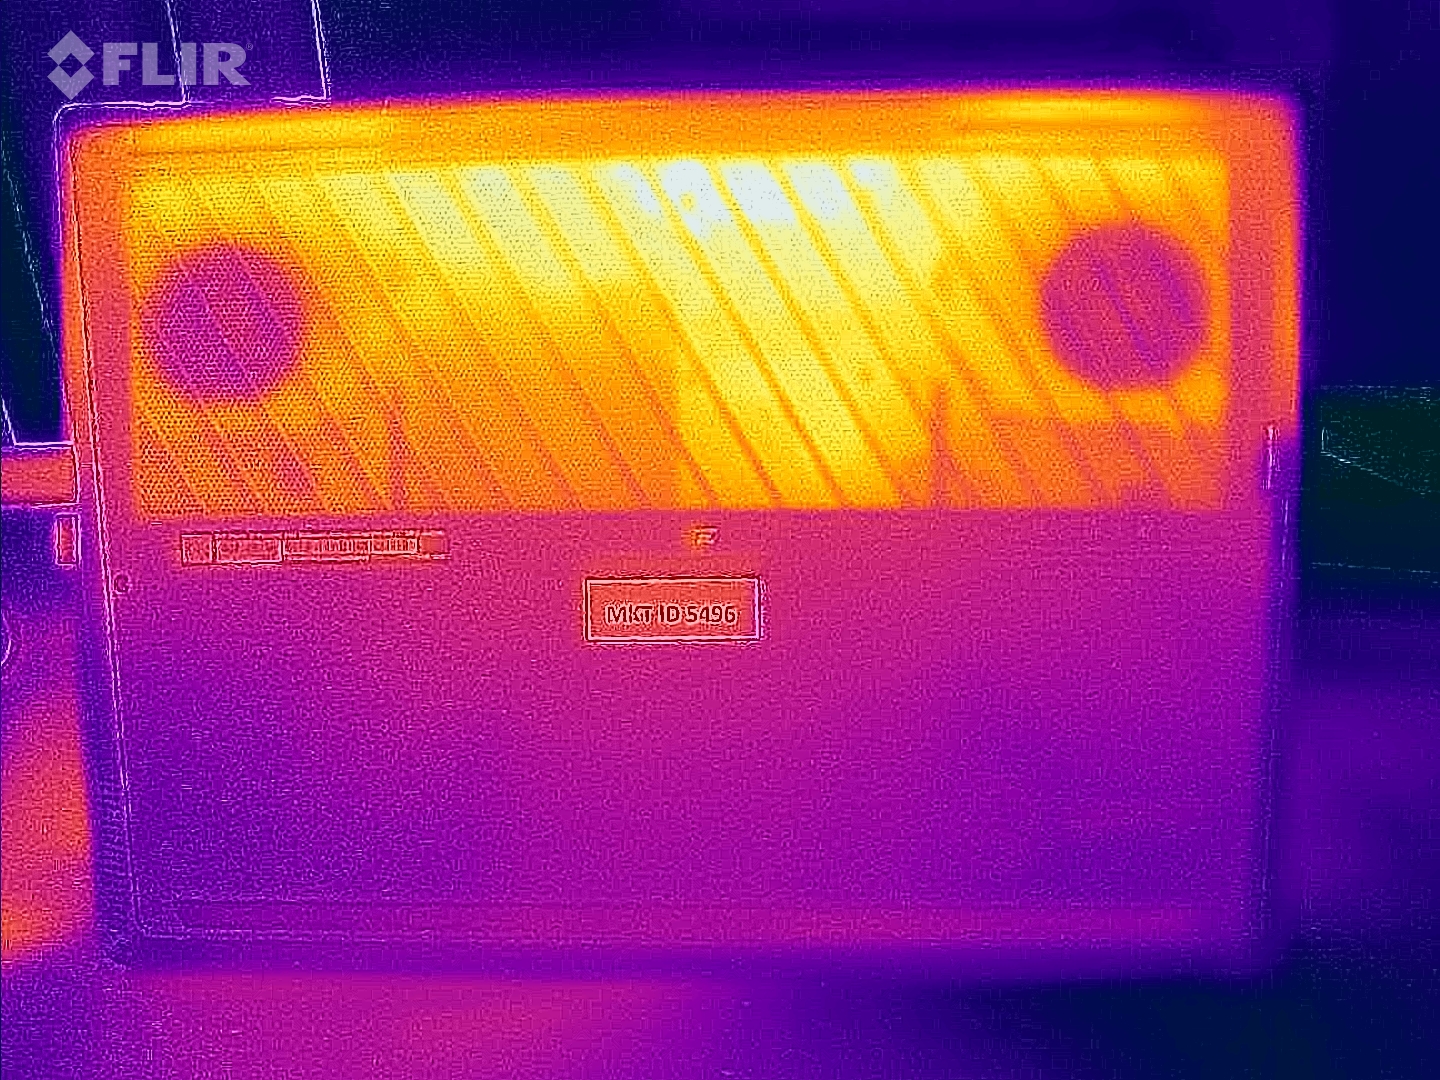
Sıcaklıklar, üstte maksimum 120,2 °F ve altta 125,6 °F ile orta aralıktadır. Bunlar düşük olmamakla birlikte, özellikle avuç içi bölgesi hoş bir şekilde serin kaldığından, kurulu donanım için hala makul derecede kabul edilebilir.
(-) Üst taraftaki maksimum sıcaklık, 40.4 °C / 105 F ortalamasına kıyasla 49 °C / 120 F'dir. , Gaming sınıfı için 21.2 ile 68.8 °C arasında değişir.
(-) Alt kısım, 43.2 °C / 110 F ortalamasına kıyasla maksimum 52 °C / 126 F'ye kadar ısınır
(+) Boşta kullanımda, üst tarafın ortalama sıcaklığı 29.1 °C / 84 F olup, cihazın 33.9 °C / 93 F.
(-) The Witcher 3 oynarken, üst tarafın ortalama sıcaklığı 40 °C / 104 F olup, cihazın 33.9 °C / 93 F.
(+) Avuç içi dayanakları ve dokunmatik yüzey maksimum (32 °C / 89.6 F) cilt sıcaklığına ulaşıyor ve bu nedenle sıcak değil.
(-) Benzer cihazların avuç içi dayanağı alanının ortalama sıcaklığı 28.8 °C / 83.8 F (-3.2 °C / -5.8 F) idi.
| MSI Stealth 16 Mercedes-AMG Motorsport A13VG i9-13900H, GeForce RTX 4070 Laptop GPU | MSI Stealth 16 Studio A13VG i7-13700H, GeForce RTX 4070 Laptop GPU | Schenker XMG Pro 16 Studio (Mid 23) i9-13900H, GeForce RTX 4070 Laptop GPU | HP Omen Transcend 16 i9-13900HX, GeForce RTX 4070 Laptop GPU | Lenovo Legion Pro 5 16ARX8 R7 7745HX, GeForce RTX 4070 Laptop GPU | Schenker XMG CORE 16 (L23) R7 7840HS, GeForce RTX 4070 Laptop GPU | |
|---|---|---|---|---|---|---|
| Heat | -17% | -11% | 6% | 14% | 6% | |
| Maximum Upper Side * (°C) | 49 | 60 -22% | 55 -12% | 47.4 3% | 41.8 15% | 46 6% |
| Maximum Bottom * (°C) | 52 | 61 -17% | 66 -27% | 54.4 -5% | 41.4 20% | 44 15% |
| Idle Upper Side * (°C) | 32 | 38.2 -19% | 33 -3% | 28.4 11% | 29 9% | 32 -0% |
| Idle Bottom * (°C) | 34 | 37.7 -11% | 35 -3% | 29.2 14% | 30.4 11% | 33 3% |
* ... daha küçük daha iyidir
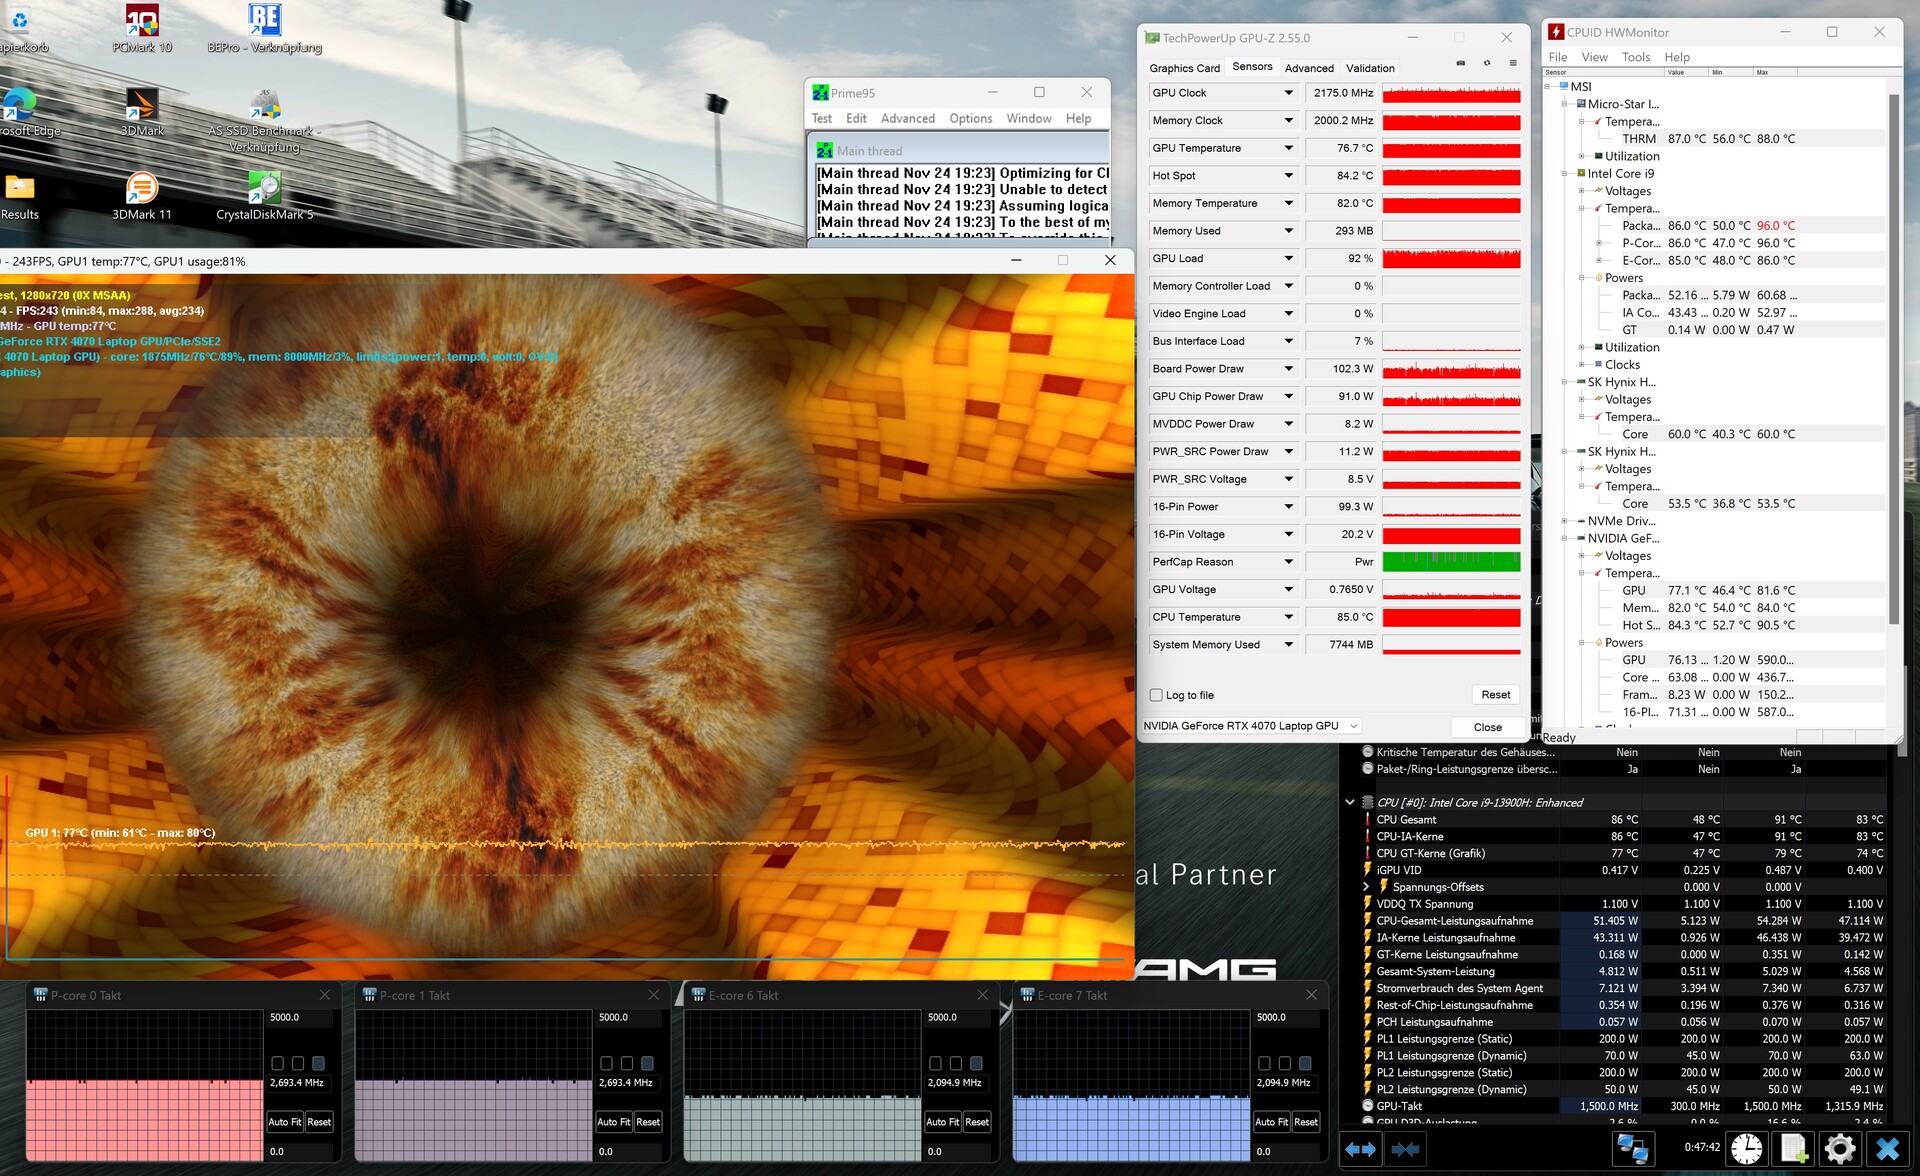
Stres Testi
Furmark ve Prime95 ile yapılan stres testi sırasında RTX 4070 yaklaşık 183,2 °F (GPU saati ~2.175 MHz) ve Core i9-13900H yaklaşık 186,8 °F (P çekirdeği ~2,7 GHz, E çekirdeği ~2,1 GHz) değerlerine ulaşmıştır ve bunların her ikisi de kabul edilebilir düzeydedir.
Konuşmacılar
MSI Stealth 16 Mercedes-AMG Motorsport A13VG ses analizi
(+) | hoparlörler nispeten yüksek sesle çalabilir (91 dB)
Bas 100 - 315Hz
(-) | neredeyse hiç bas yok - ortalama olarak medyandan 18.1% daha düşük
(±) | Bas doğrusallığı ortalamadır (7.3% delta - önceki frekans)
Ortalar 400 - 2000 Hz
(+) | dengeli ortalar - medyandan yalnızca 1.6% uzakta
(+) | orta frekanslar doğrusaldır (3.7% deltadan önceki frekansa)
Yüksekler 2 - 16 kHz
(+) | dengeli yüksekler - medyandan yalnızca 3.2% uzakta
(+) | yüksekler doğrusaldır (2.6% deltadan önceki frekansa)
Toplam 100 - 16.000 Hz
(+) | genel ses doğrusaldır (11.8% ortancaya göre fark)
Aynı sınıfla karşılaştırıldığında
» Bu sınıftaki tüm test edilen cihazların %11%'si daha iyi, 4% benzer, 85% daha kötüydü
» En iyisinin deltası 6% idi, ortalama 18% idi, en kötüsü 132% idi
Test edilen tüm cihazlarla karşılaştırıldığında
» Test edilen tüm cihazların %8'si daha iyi, 3 benzer, % 89 daha kötüydü
» En iyisinin deltası 4% idi, ortalama 23% idi, en kötüsü 134% idi
HP Omen Transcend 16 ses analizi
(+) | hoparlörler nispeten yüksek sesle çalabilir (82.3 dB)
Bas 100 - 315Hz
(-) | neredeyse hiç bas yok - ortalama olarak medyandan 20% daha düşük
(±) | Bas doğrusallığı ortalamadır (14.3% delta - önceki frekans)
Ortalar 400 - 2000 Hz
(±) | daha yüksek ortalar - ortalama olarak medyandan 5.2% daha yüksek
(+) | orta frekanslar doğrusaldır (3.7% deltadan önceki frekansa)
Yüksekler 2 - 16 kHz
(+) | dengeli yüksekler - medyandan yalnızca 2% uzakta
(+) | yüksekler doğrusaldır (6.7% deltadan önceki frekansa)
Toplam 100 - 16.000 Hz
(±) | Genel sesin doğrusallığı ortalamadır (17% ortancaya göre fark)
Aynı sınıfla karşılaştırıldığında
» Bu sınıftaki tüm test edilen cihazların %45%'si daha iyi, 12% benzer, 43% daha kötüydü
» En iyisinin deltası 6% idi, ortalama 18% idi, en kötüsü 132% idi
Test edilen tüm cihazlarla karşılaştırıldığında
» Test edilen tüm cihazların %30'si daha iyi, 8 benzer, % 62 daha kötüydü
» En iyisinin deltası 4% idi, ortalama 23% idi, en kötüsü 134% idi
Enerji Yönetimi
Güç Tüketimi
Grafik anahtarlama sayesinde, 16 inçlik cihaz boş modda verimli bir şekilde çalışıyor ve çoğu rakibiyle tutarlı olarak 11 ila 28 watt (ortalama 14 watt) tüketiyor. AMG sürümü yük altında 83 watt (3DMark 06'da ortalama değer) ile 204 watt (stres testinde maksimum değer) arasında değişen güç çekti. Motor sporları logosuyla süslenmiş 240 watt'lık güç kaynağı bu gereksinimler için uygun boyutlara sahip.
| Kapalı / Bekleme modu | |
| Boşta | |
| Çalışırken |
|
Key:
min: | |
| MSI Stealth 16 Mercedes-AMG Motorsport A13VG i9-13900H, GeForce RTX 4070 Laptop GPU | MSI Stealth 16 Studio A13VG i7-13700H, GeForce RTX 4070 Laptop GPU | Schenker XMG Pro 16 Studio (Mid 23) i9-13900H, GeForce RTX 4070 Laptop GPU | HP Omen Transcend 16 i9-13900HX, GeForce RTX 4070 Laptop GPU | Lenovo Legion Pro 5 16ARX8 R7 7745HX, GeForce RTX 4070 Laptop GPU | Schenker XMG CORE 16 (L23) R7 7840HS, GeForce RTX 4070 Laptop GPU | Sınıf ortalaması Gaming | |
|---|---|---|---|---|---|---|---|
| Power Consumption | -2% | 2% | -63% | -16% | -1% | -18% | |
| Idle Minimum * (Watt) | 11 | 11 -0% | 8 27% | 19.2 -75% | 8.1 26% | 11 -0% | 12.8 ? -16% |
| Idle Average * (Watt) | 14 | 18 -29% | 12 14% | 22.7 -62% | 15.9 -14% | 15.2 -9% | 18.5 ? -32% |
| Idle Maximum * (Watt) | 28 | 19 32% | 23 18% | 55.4 -98% | 37.2 -33% | 16 43% | 24 ? 14% |
| Load Average * (Watt) | 83 | 91 -10% | 94 -13% | 128.4 -55% | 90.9 -10% | 64 23% | 108.2 ? -30% |
| Witcher 3 ultra * (Watt) | 140 | 130 7% | 181.5 -30% | 206 -47% | 189.6 -35% | 179 -28% | |
| Load Maximum * (Watt) | 204 | 228 -12% | 215 -5% | 292 -43% | 263.5 -29% | 280 -37% | 254 ? -25% |
* ... daha küçük daha iyidir
Power consumption Witcher 3 / stress test
Power consumption with external monitor
Pil Ömrü
Core i9-13900H ve OLED panel nedeniyle, Motorsport Edition'ın çalışma süreleri standart versiyona kıyasla biraz daha zayıftır. Parlaklık 150 cd/m²'ye düşürüldüğünde 6,5 saatin biraz altında internette gezinme süresi elde etmek, bir oyun dizüstü bilgisayarı için hala fazlasıyla yeterli. Bu saygın rakamlara 99 Wh'lık cömertçe boyutlandırılmış pil de katkıda bulunuyor.
| MSI Stealth 16 Mercedes-AMG Motorsport A13VG i9-13900H, GeForce RTX 4070 Laptop GPU, 99.99 Wh | MSI Stealth 16 Studio A13VG i7-13700H, GeForce RTX 4070 Laptop GPU, 99.9 Wh | Schenker XMG Pro 16 Studio (Mid 23) i9-13900H, GeForce RTX 4070 Laptop GPU, 73 Wh | HP Omen Transcend 16 i9-13900HX, GeForce RTX 4070 Laptop GPU, 97 Wh | Lenovo Legion Pro 5 16ARX8 R7 7745HX, GeForce RTX 4070 Laptop GPU, 80 Wh | Schenker XMG CORE 16 (L23) R7 7840HS, GeForce RTX 4070 Laptop GPU, 99 Wh | Sınıf ortalaması Gaming | |
|---|---|---|---|---|---|---|---|
| Pil Çalışma Süresi | 20% | 5% | -35% | -38% | 29% | 9% | |
| WiFi v1.3 (h) | 6.5 | 7.8 20% | 6.8 5% | 4.2 -35% | 4 -38% | 8.4 29% | 7.09 ? 9% |
| Reader / Idle (h) | 11 | 6.3 | 6.5 | 8.71 ? | |||
| H.264 (h) | 7.7 | 10.2 | 8.9 ? | ||||
| Load (h) | 2.4 | 1.2 | 1 | 2.4 | 1.51 ? |
Artılar
Eksiler
Karar
Başarılı tasarım unsurlarının ötesinde, Stealth 16'nın Mercedes-AMG Motorsport versiyonu standart versiyonla neredeyse aynı güçlü ve zayıf yönleri paylaşıyor (testin tamamına bakın). Neyse ki, olumlu yönler olumsuzluklardan daha ağır basıyor.
Olumlu tarafı, dizüstü bilgisayarın hoş bir şekilde hafif ve kompakt ancak sağlam bir kasaya, güçlü sese ve nispeten iyi giriş cihazlarına sahip olmasıdır. SSD'nin zaman içinde yavaşlaması ve biraz sınırlı USB bağlantısı (yalnızca bir Tip A bağlantı noktası) nedeniyle kesintiler esas olarak B notu şeklinde gelir.
Motorsport versiyonunun OLED paneli ile IPS ekran arasında seçim yapmak kişisel tercihlere bağlıdır.
OLED panel olağanüstü görüntü değerleri (siyah seviyesi, kontrast, renk alanı, görüş açısı, tepki süresi) sunarken, yansıtıcı bir yüzey, mütevazı bir frekans (60 Hz) ve potansiyel titreme ile birlikte geliyor.
Genel olarak, yine de "çok iyi" derecesini hak ediyor. Alternatifler arasında makalede bahsedilen HP Omen Transcend 16 ve Schenker XMG Pro 16 gibi Intel destekli dizüstü bilgisayarlar yer alıyor. AMD meraklıları için, her ikisi de "çok iyi" notu alan Lenovo Legion Pro 5 ve Schenker XMG Core 16 dikkate değer.
Fiyat & Müsaitlik
MSI Stealth 16 Mercedes-AMG Motorsport A13VG'nin fiyatı 2.899 ABD dolarıdır ve doğrudan MSI adresinden satın alınabilir.
MSI Stealth 16 Mercedes-AMG Motorsport A13VG
- 11/28/2023 v7 (old)
Florian Glaser
Şeffaflık
İncelenecek cihazların seçimi editör ekibimiz tarafından yapılır. Test örneği, bu incelemenin amacı doğrultusunda üretici veya perakendeci tarafından yazara ödünç olarak sağlanmıştır. Borç verenin bu inceleme üzerinde herhangi bir etkisi olmadığı gibi, üretici de yayınlanmadan önce bu incelemenin bir kopyasını almamıştır. Bu incelemeyi yayınlama zorunluluğu yoktu. Bağımsız bir medya şirketi olarak Notebookcheck, üreticilerin, perakendecilerin veya yayıncıların otoritesine tabi değildir.
Notebookcheck bu şekilde test yapıyor
Notebookcheck, tüm sonuçların karşılaştırılabilir olmasını sağlamak için her yıl yüzlerce dizüstü bilgisayarı ve akıllı telefonu standart prosedürler kullanarak bağımsız olarak inceliyor. Yaklaşık 20 yıldır test yöntemlerimizi sürekli olarak geliştirdik ve bu süreçte endüstri standartlarını belirledik. Test laboratuvarlarımızda deneyimli teknisyenler ve editörler tarafından yüksek kaliteli ölçüm ekipmanları kullanılmaktadır. Bu testler çok aşamalı bir doğrulama sürecini içerir. Karmaşık derecelendirme sistemimiz, nesnelliği koruyan yüzlerce sağlam temellere dayanan ölçüm ve kıyaslamaya dayanmaktadır.Price comparison

