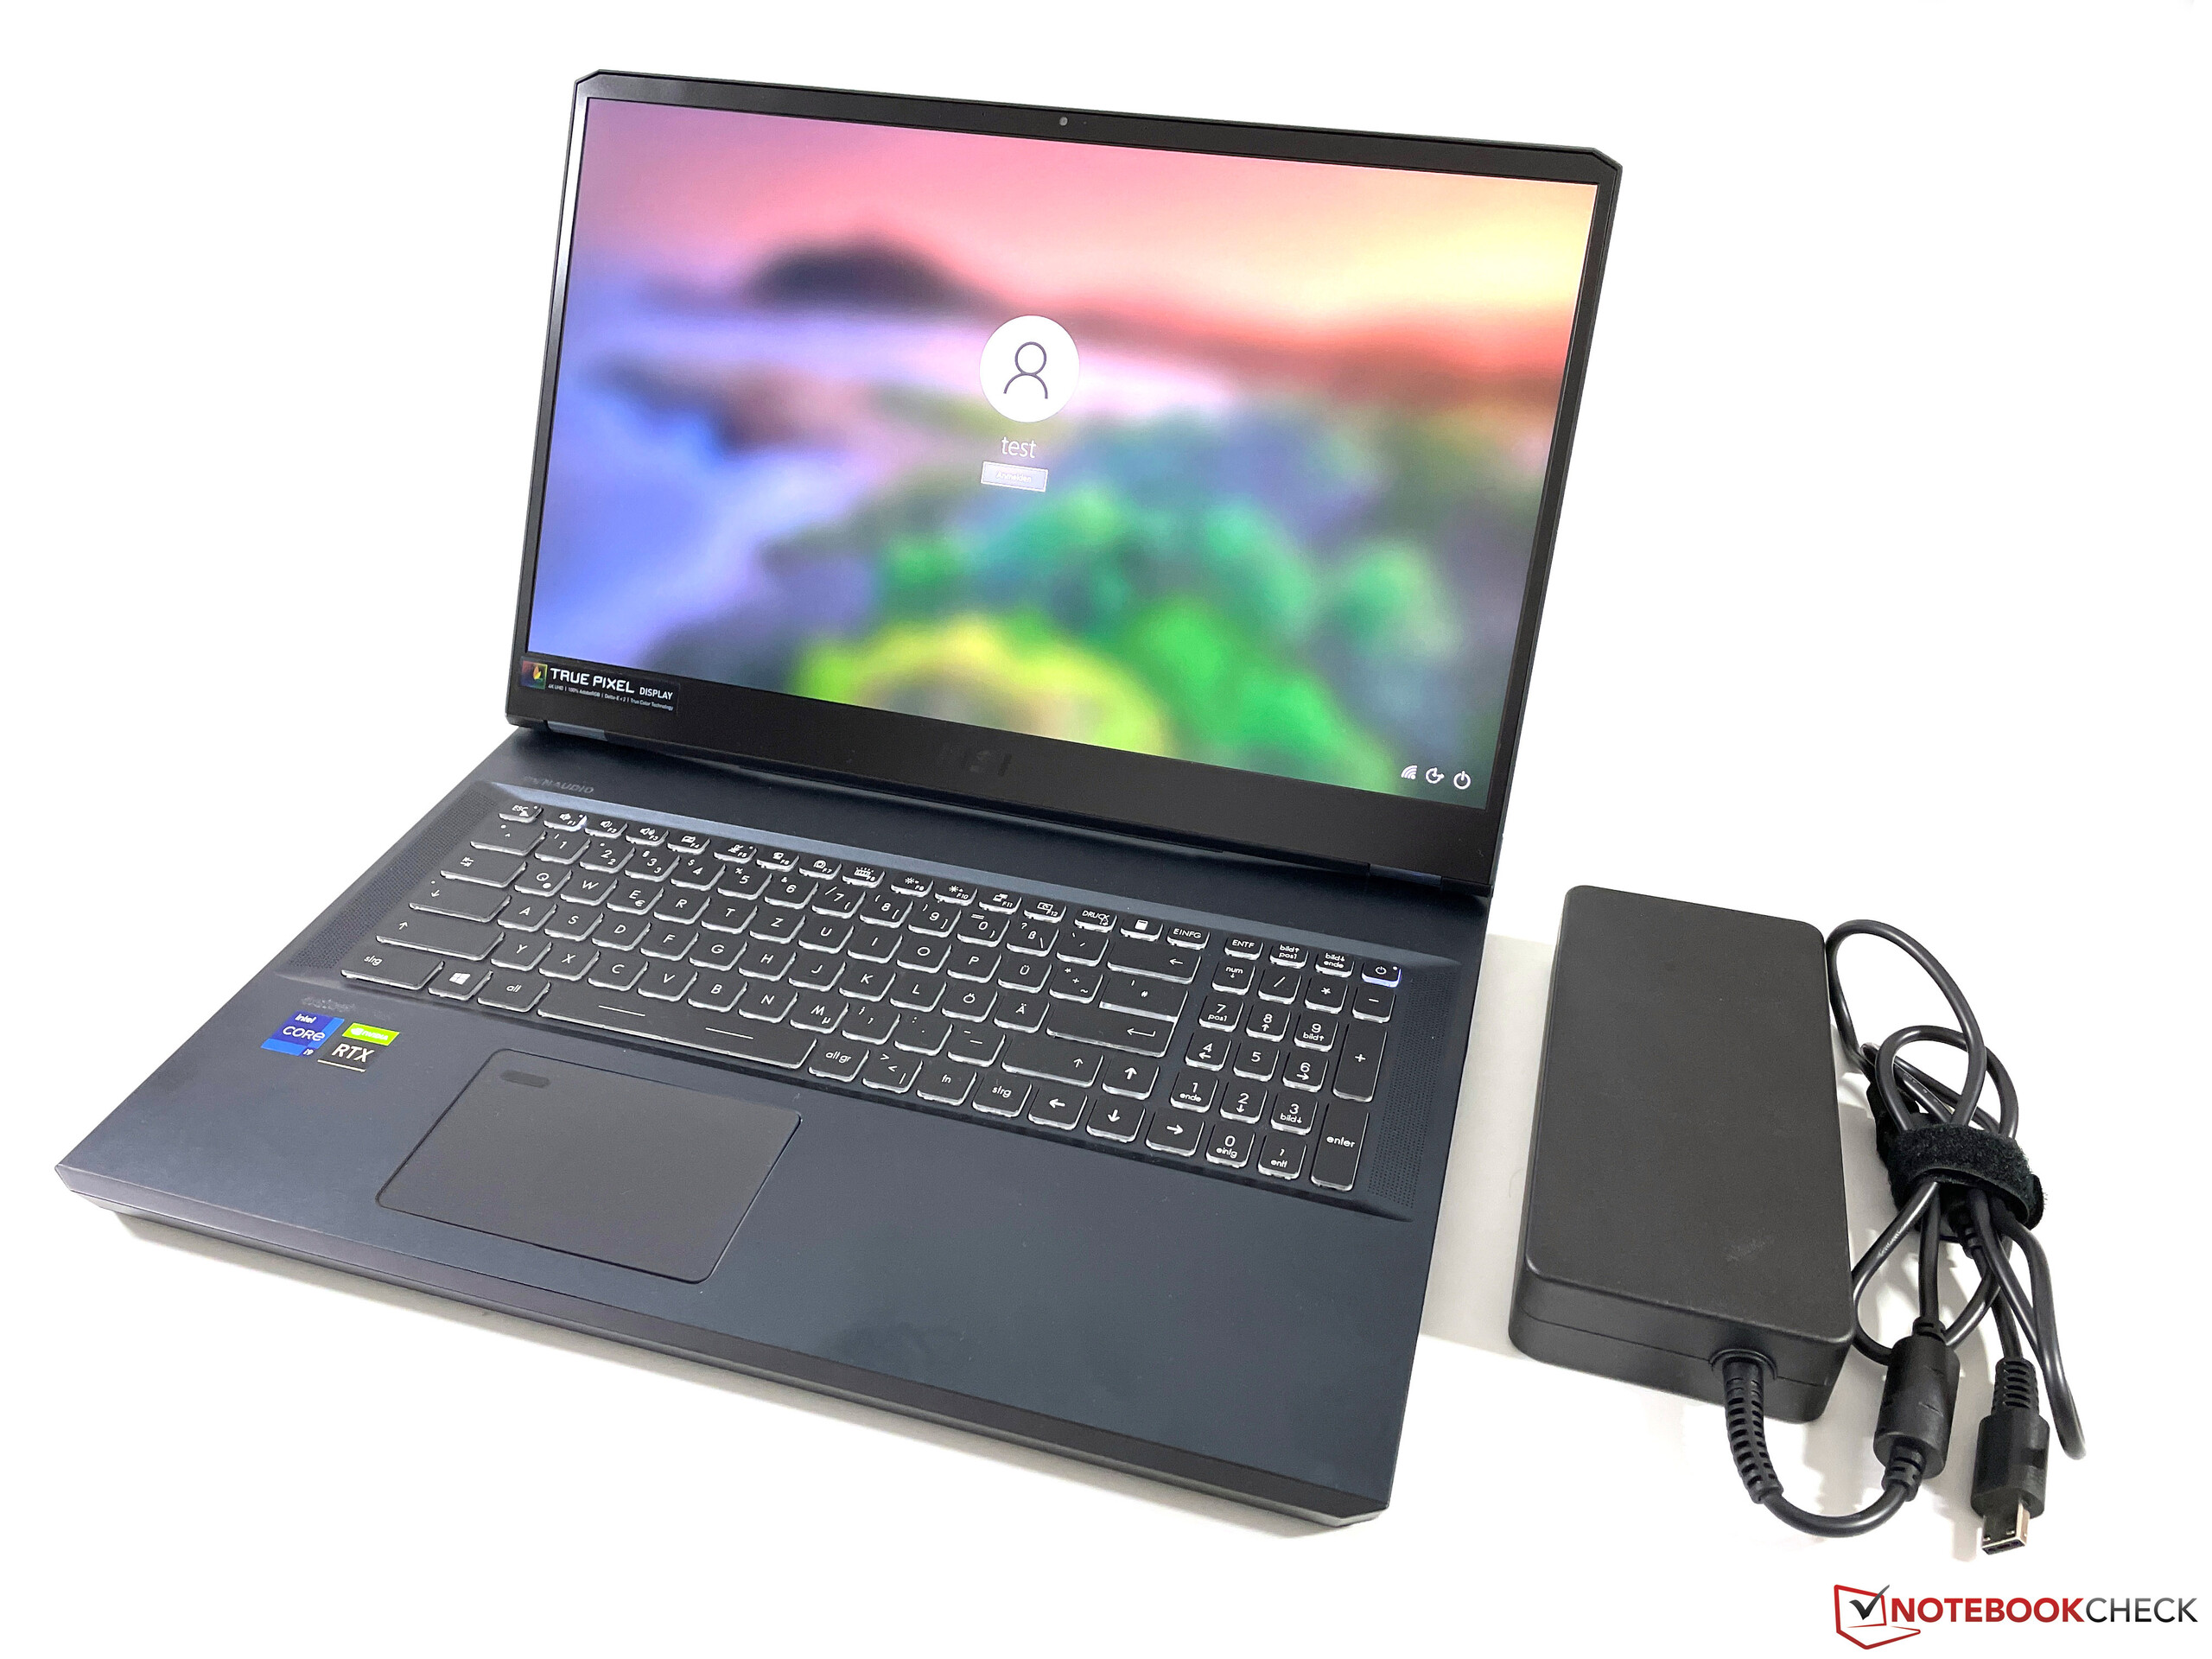
MSI WE76 İncelemede: Mobil iş istasyonu maksimum performansı hedefliyor

MSI, oyun dizüstü bilgisayarlarını geçmişte küçük değişikliklerle mobil iş istasyonları olarak sattı. Dizüstü oyun bilgisayarları da yüksek performans için tasarlandığından, bu hareket mantıklı. Yeni MSI WE76, daha önce incelediğimiz MSI GE76'yı temel alıyor. Ancak, tüketici GeForce grafik birimleri yerine WE76, Nvidia'nın yeni profesyonel RTX A ekran kartlarını kullanıyor ve profesyonel yazılımlar için de sertifikalar sağlıyor.
İnceleme birimimiz, 4,799 Euro'ya (~ 5,419 $) mal olan ve Core i9-11980HK işlemci, profesyonel RTX A5000 GPU ekran kartı, 32 GB RAM, 2 TB PCIe 4.0 SSD ile donatılmış WE76 11UM-456 üst düzey varyantıdır. Ve tam AdobeRGB kapsamına sahip mat 4K panel ile geliyor. Ayrıca Core i7-11800H, RTX A3000 ve 3.099 Euro'ya (~3.499 $) daha küçük 1 TB SSD ile birlikte gelen alternatif WE76 11UK-464 modeli de var.
Karşılaştırmada muhtemel rakipleri
Derece | Tarih | Model | Ağırlık | Yükseklik | Boyut | Çözünürlük | En iyi fiyat |
|---|---|---|---|---|---|---|---|
| 88.6 % v7 (old) | 03/2022 | MSI WE76 11UM-456 i9-11980HK, RTX A5000 Laptop GPU | 2.9 kg | 25.9 mm | 17.30" | 3840x2160 | |
| 89.8 % v7 (old) | 06/2022 | Lenovo ThinkPad P1 G4-20Y4S0KS00 i7-11850H, GeForce RTX 3070 Laptop GPU | 2 kg | 17.7 mm | 16.00" | 3840x2400 | |
| 90.3 % v7 (old) | 12/2021 | HP ZBook Fury 15 G8 i9-11950H, RTX A5000 Laptop GPU | 2.5 kg | 25.9 mm | 15.60" | 3840x2160 | |
v (old) | 03/2022 | Asus ProArt StudioBook 16 W7600H5A-2BL2 W-11955M, RTX A5000 Laptop GPU | 2.4 kg | 21.4 mm | 16.00" | 3840x2400 | |
| 87.8 % v7 (old) | Lenovo ThinkPad P17 G2-20YU0025G i7-11800H, RTX A2000 Laptop GPU | 3.6 kg | 28.38 mm | 17.30" | 1920x1080 | ||
| 89.8 % v7 (old) | 09/2021 | HP ZBook Fury 17 G7 119W5EA i9-10885H, Quadro RTX 4000 Max-Q | 2.9 kg | 26.9 mm | 17.30" | 3840x2160 |
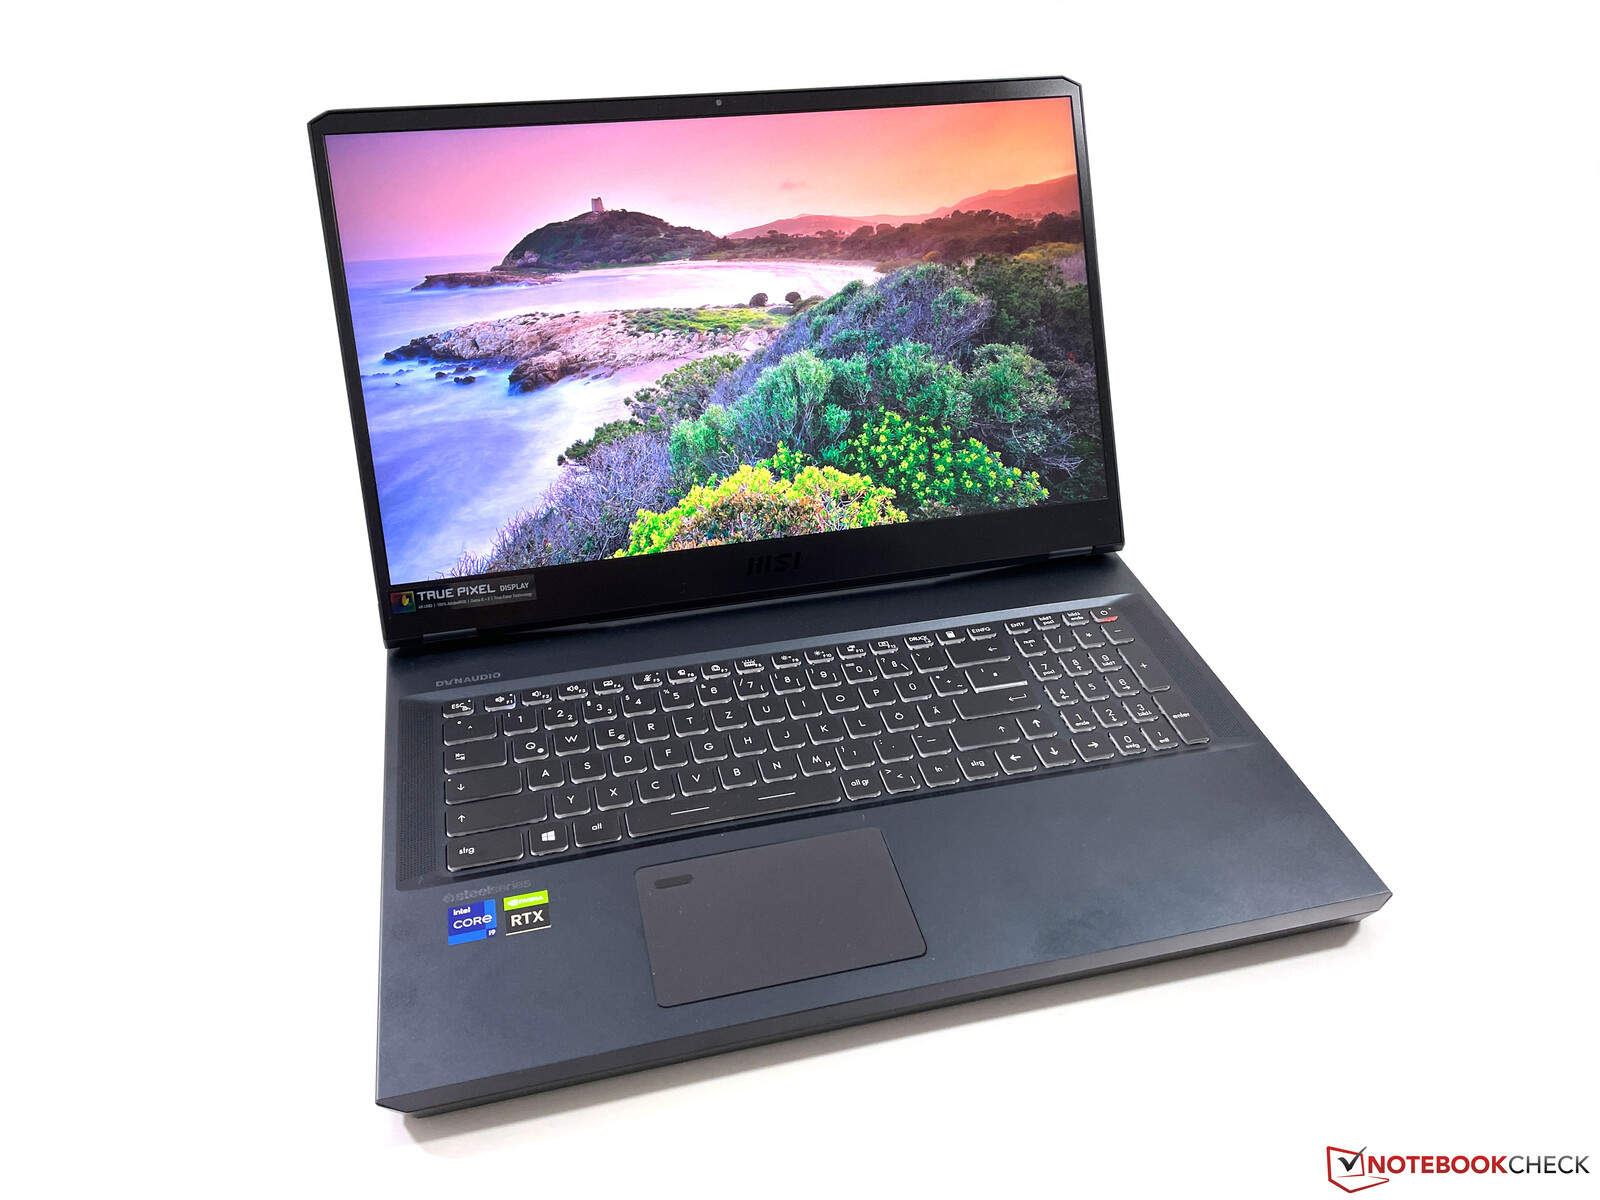
Kasa - MSI aydınlatmasız devam ediyor
MSI WE76'nın kasası GE76 oyun modelinin kasasıyla aynı, ancak üretici ön kenardaki LED şeridi çıkarmış. Tasarım, bir oyun santralini andırıyor, ancak mat siyah ve gri yüzeyler, mobil iş istasyonunun oldukça gizli görünmesini sağlıyor ve bu da ofis ortamına da iyi uyması gerekiyor. 16:9 ekran kullanılması nedeniyle (diğer birçok 17 inç modelde olduğu gibi), ekranın altındaki ekran çerçevesi çok geniş görünüyor ve ekran ile kasa arasındaki oran da sadece %73.
Stabilite ve işçilik açısından inceleme örneğimiz mükemmel; özellikle ana ünite burulmaya karşı son derece dayanıklıdır. Kapak biraz daha esnek ama görüntü bozulmasına neden olamayız. Menteşeler de temelde düzgün ayarlanmış, ancak ekranın sallanmasını bir dereceye kadar engelleyemiyorlar. Ayrıca, bu menteşe tasarımı, maksimum açılma açısını 135 derece ile sınırlar ve bu, diğer bazı rakiplerde olduğu kadar cömert değildir.
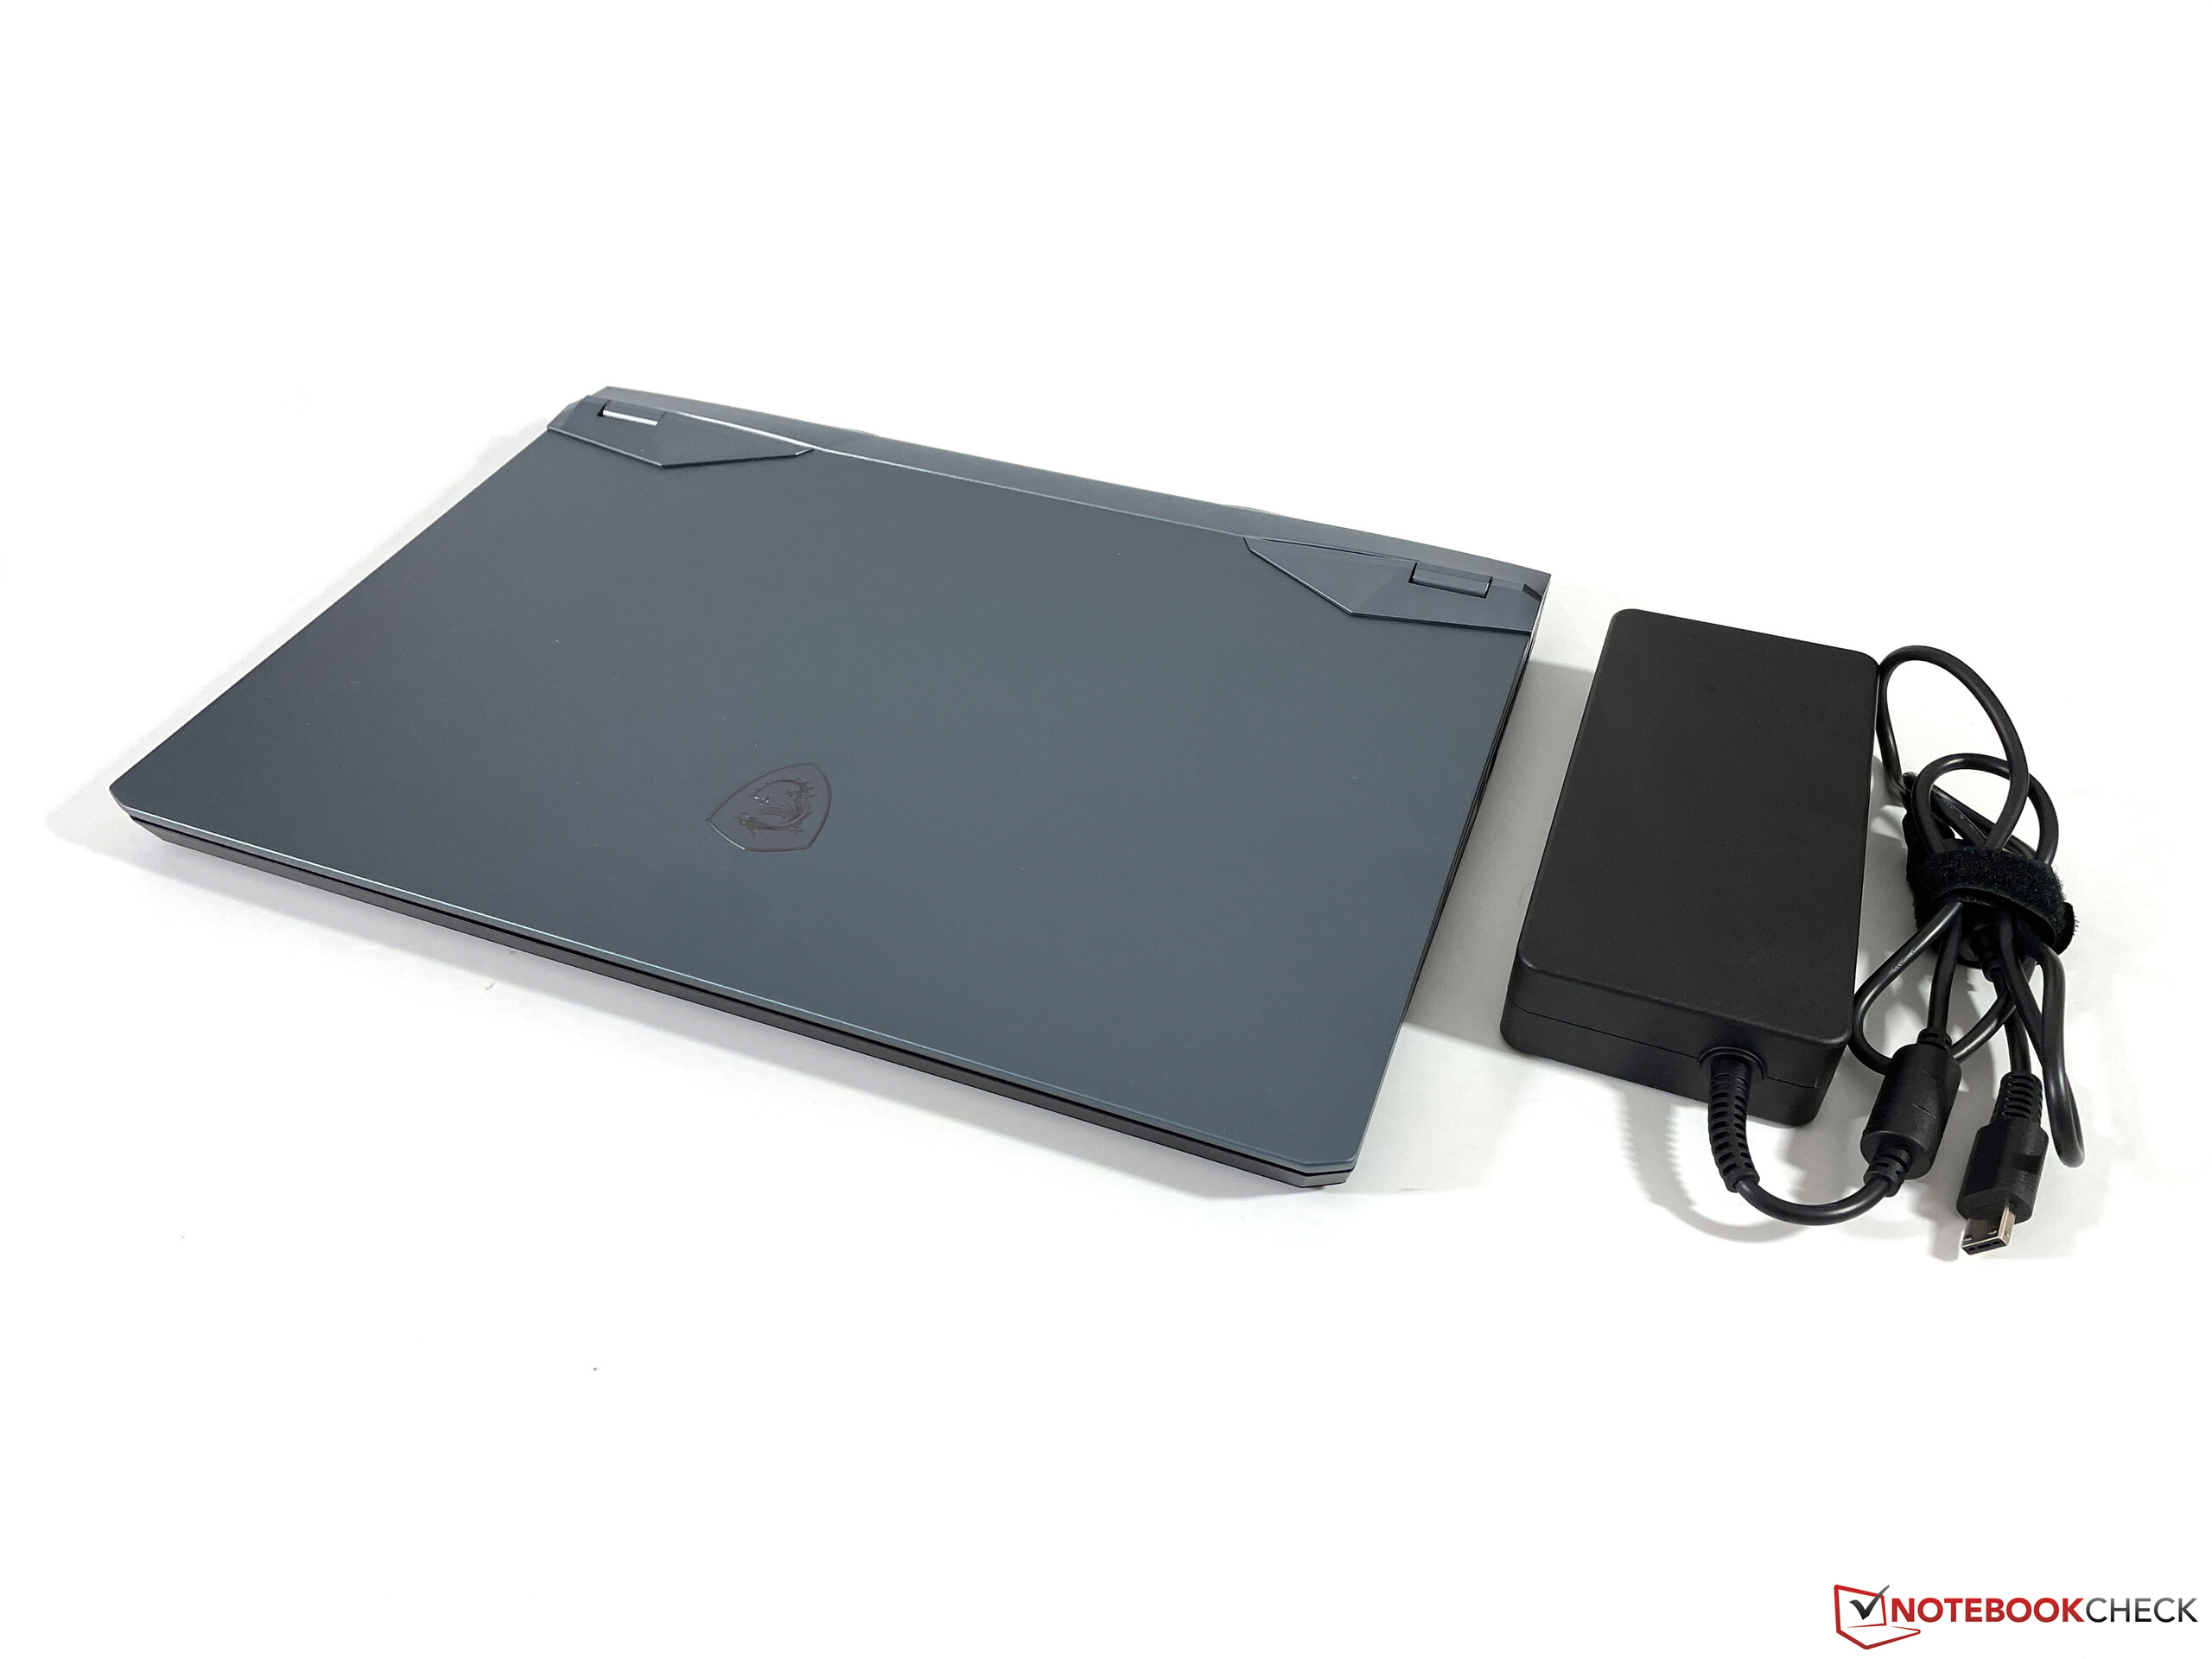
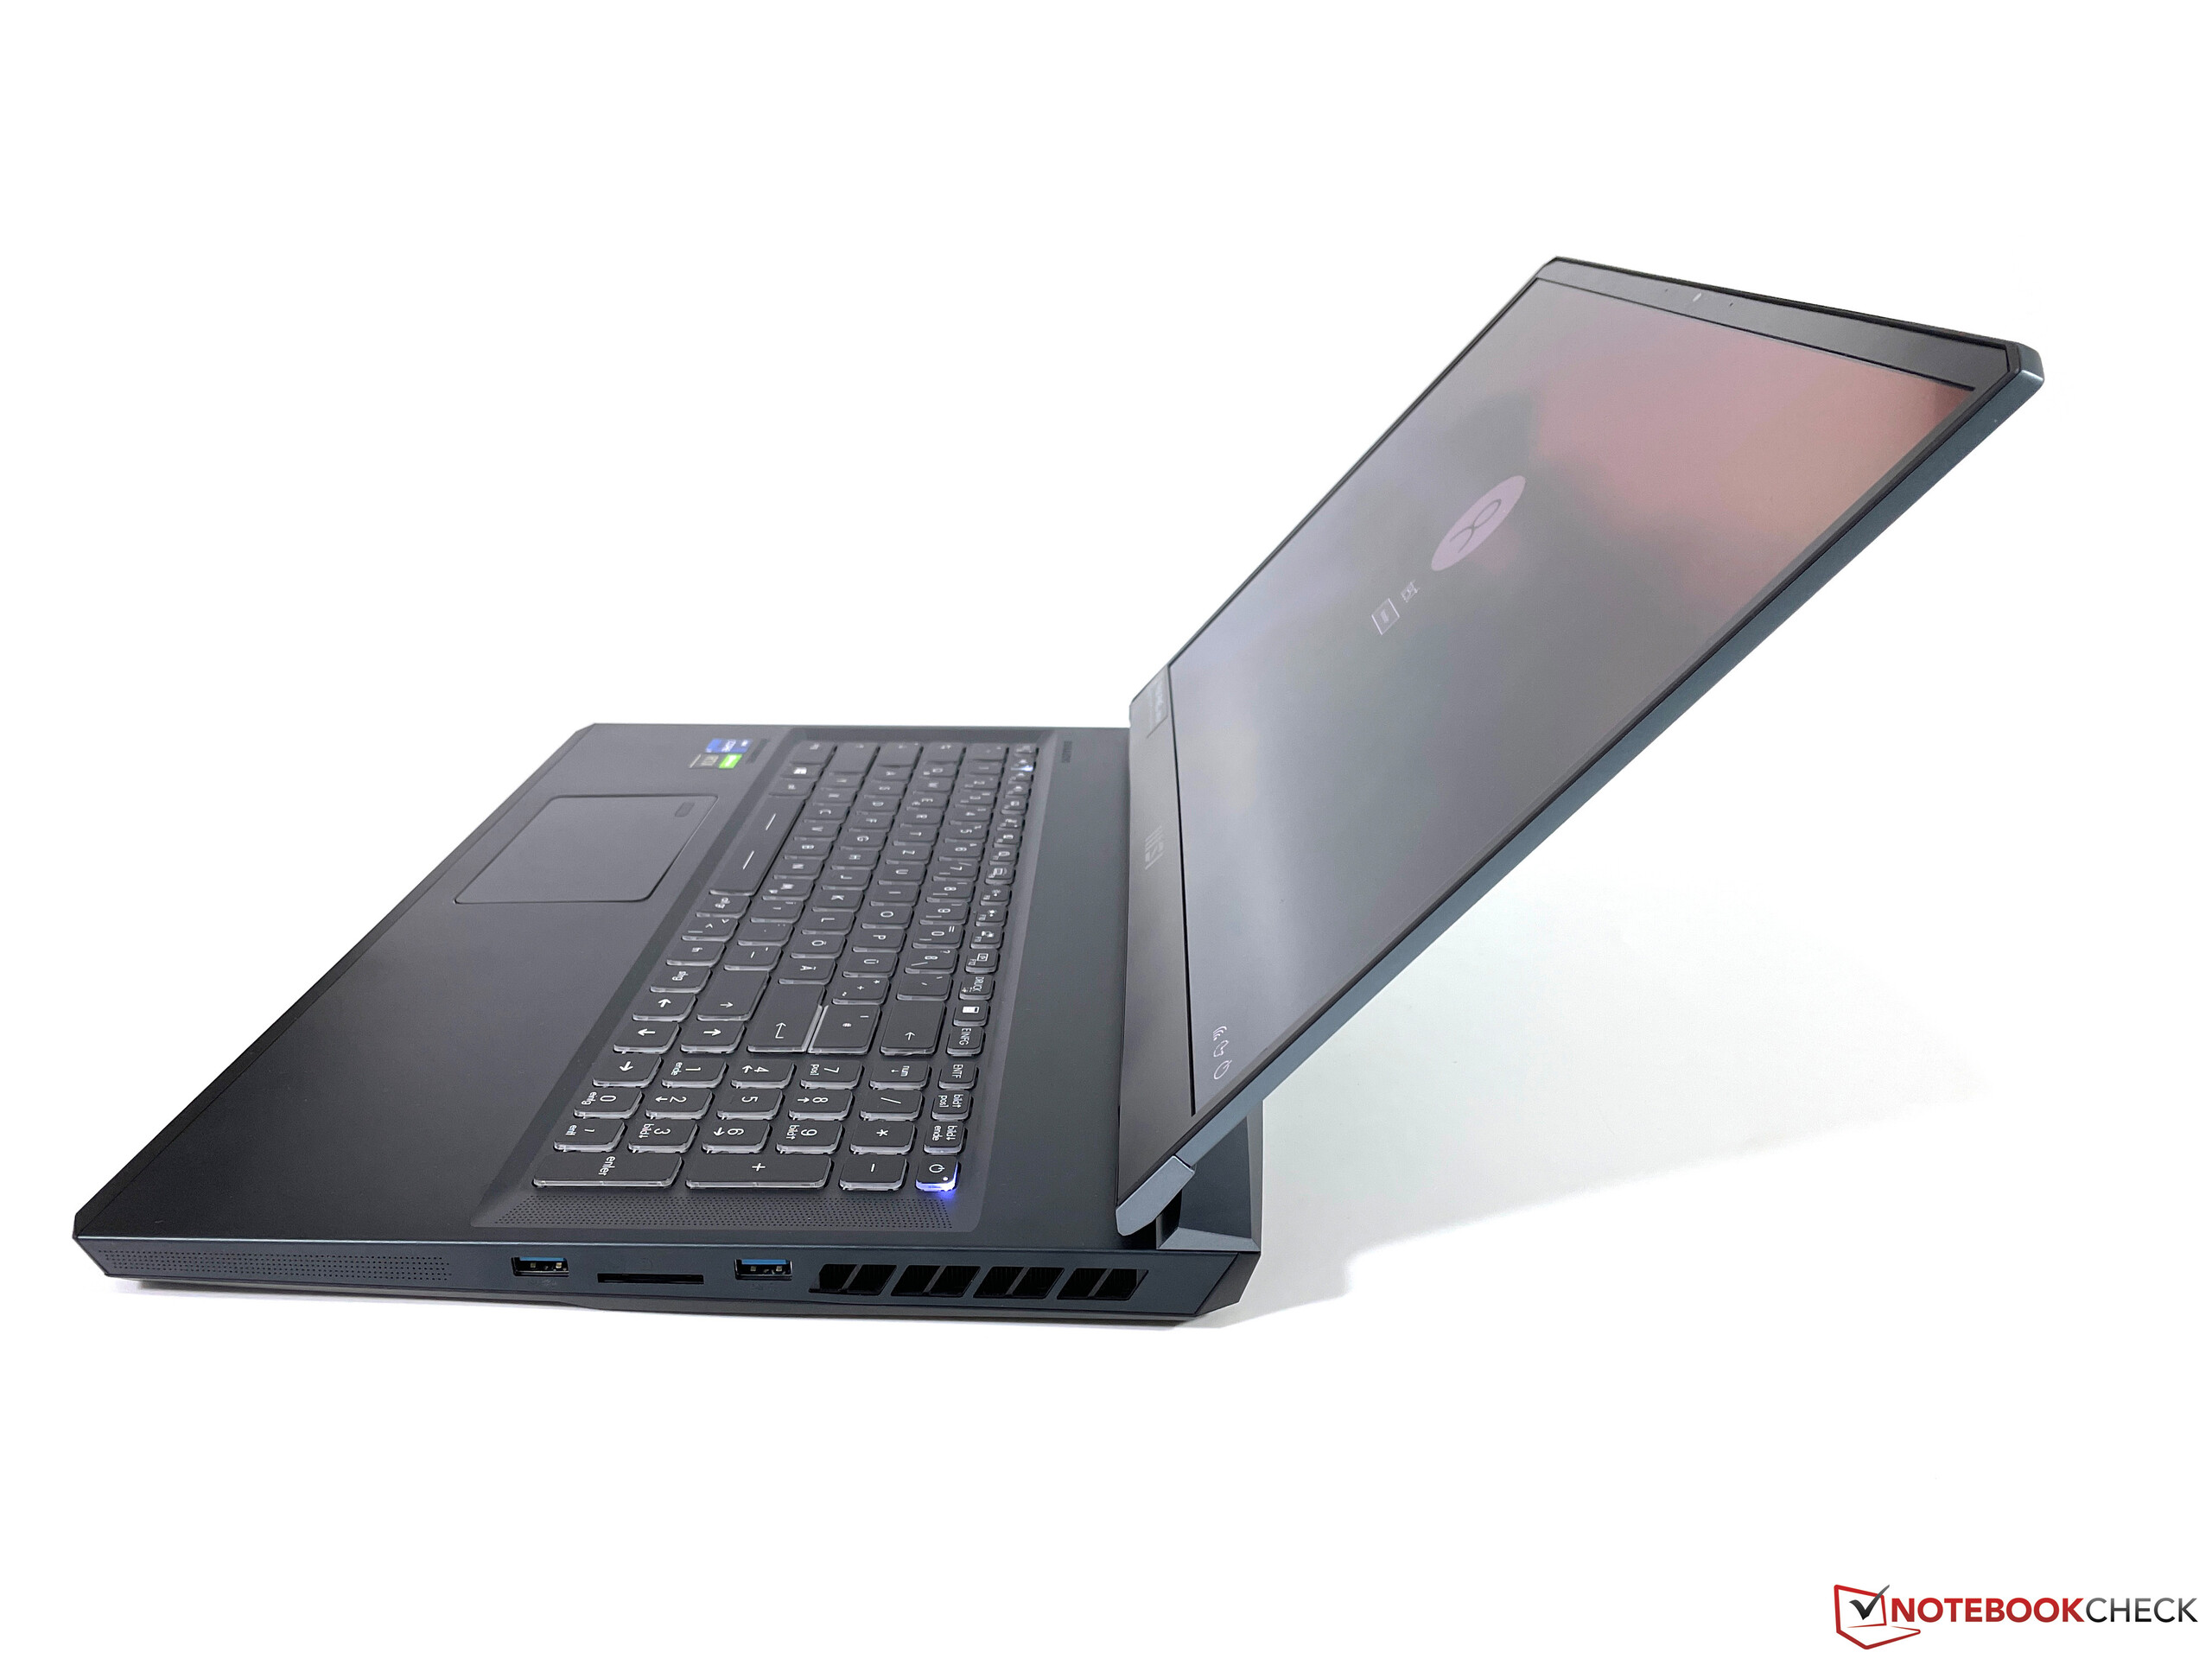
WE76, performansa odaklanan geleneksel bir mobil iş istasyonudur. Sonuç olarak, odak noktası cihazı olabildiğince ince ve ince yapmak değildi. Yine de, 17 inçlik iki rakibimiz ThinkPad P17 ve ZBook Fury 17 ile doğrudan karşılaştırıldığında fark oldukça küçük. Test cihazımız 2.922 gram ağırlığında, ancak dizüstü bilgisayarı taşırken hacimli güç adaptörü için 1.060 gram daha eklemeniz gerekiyor.
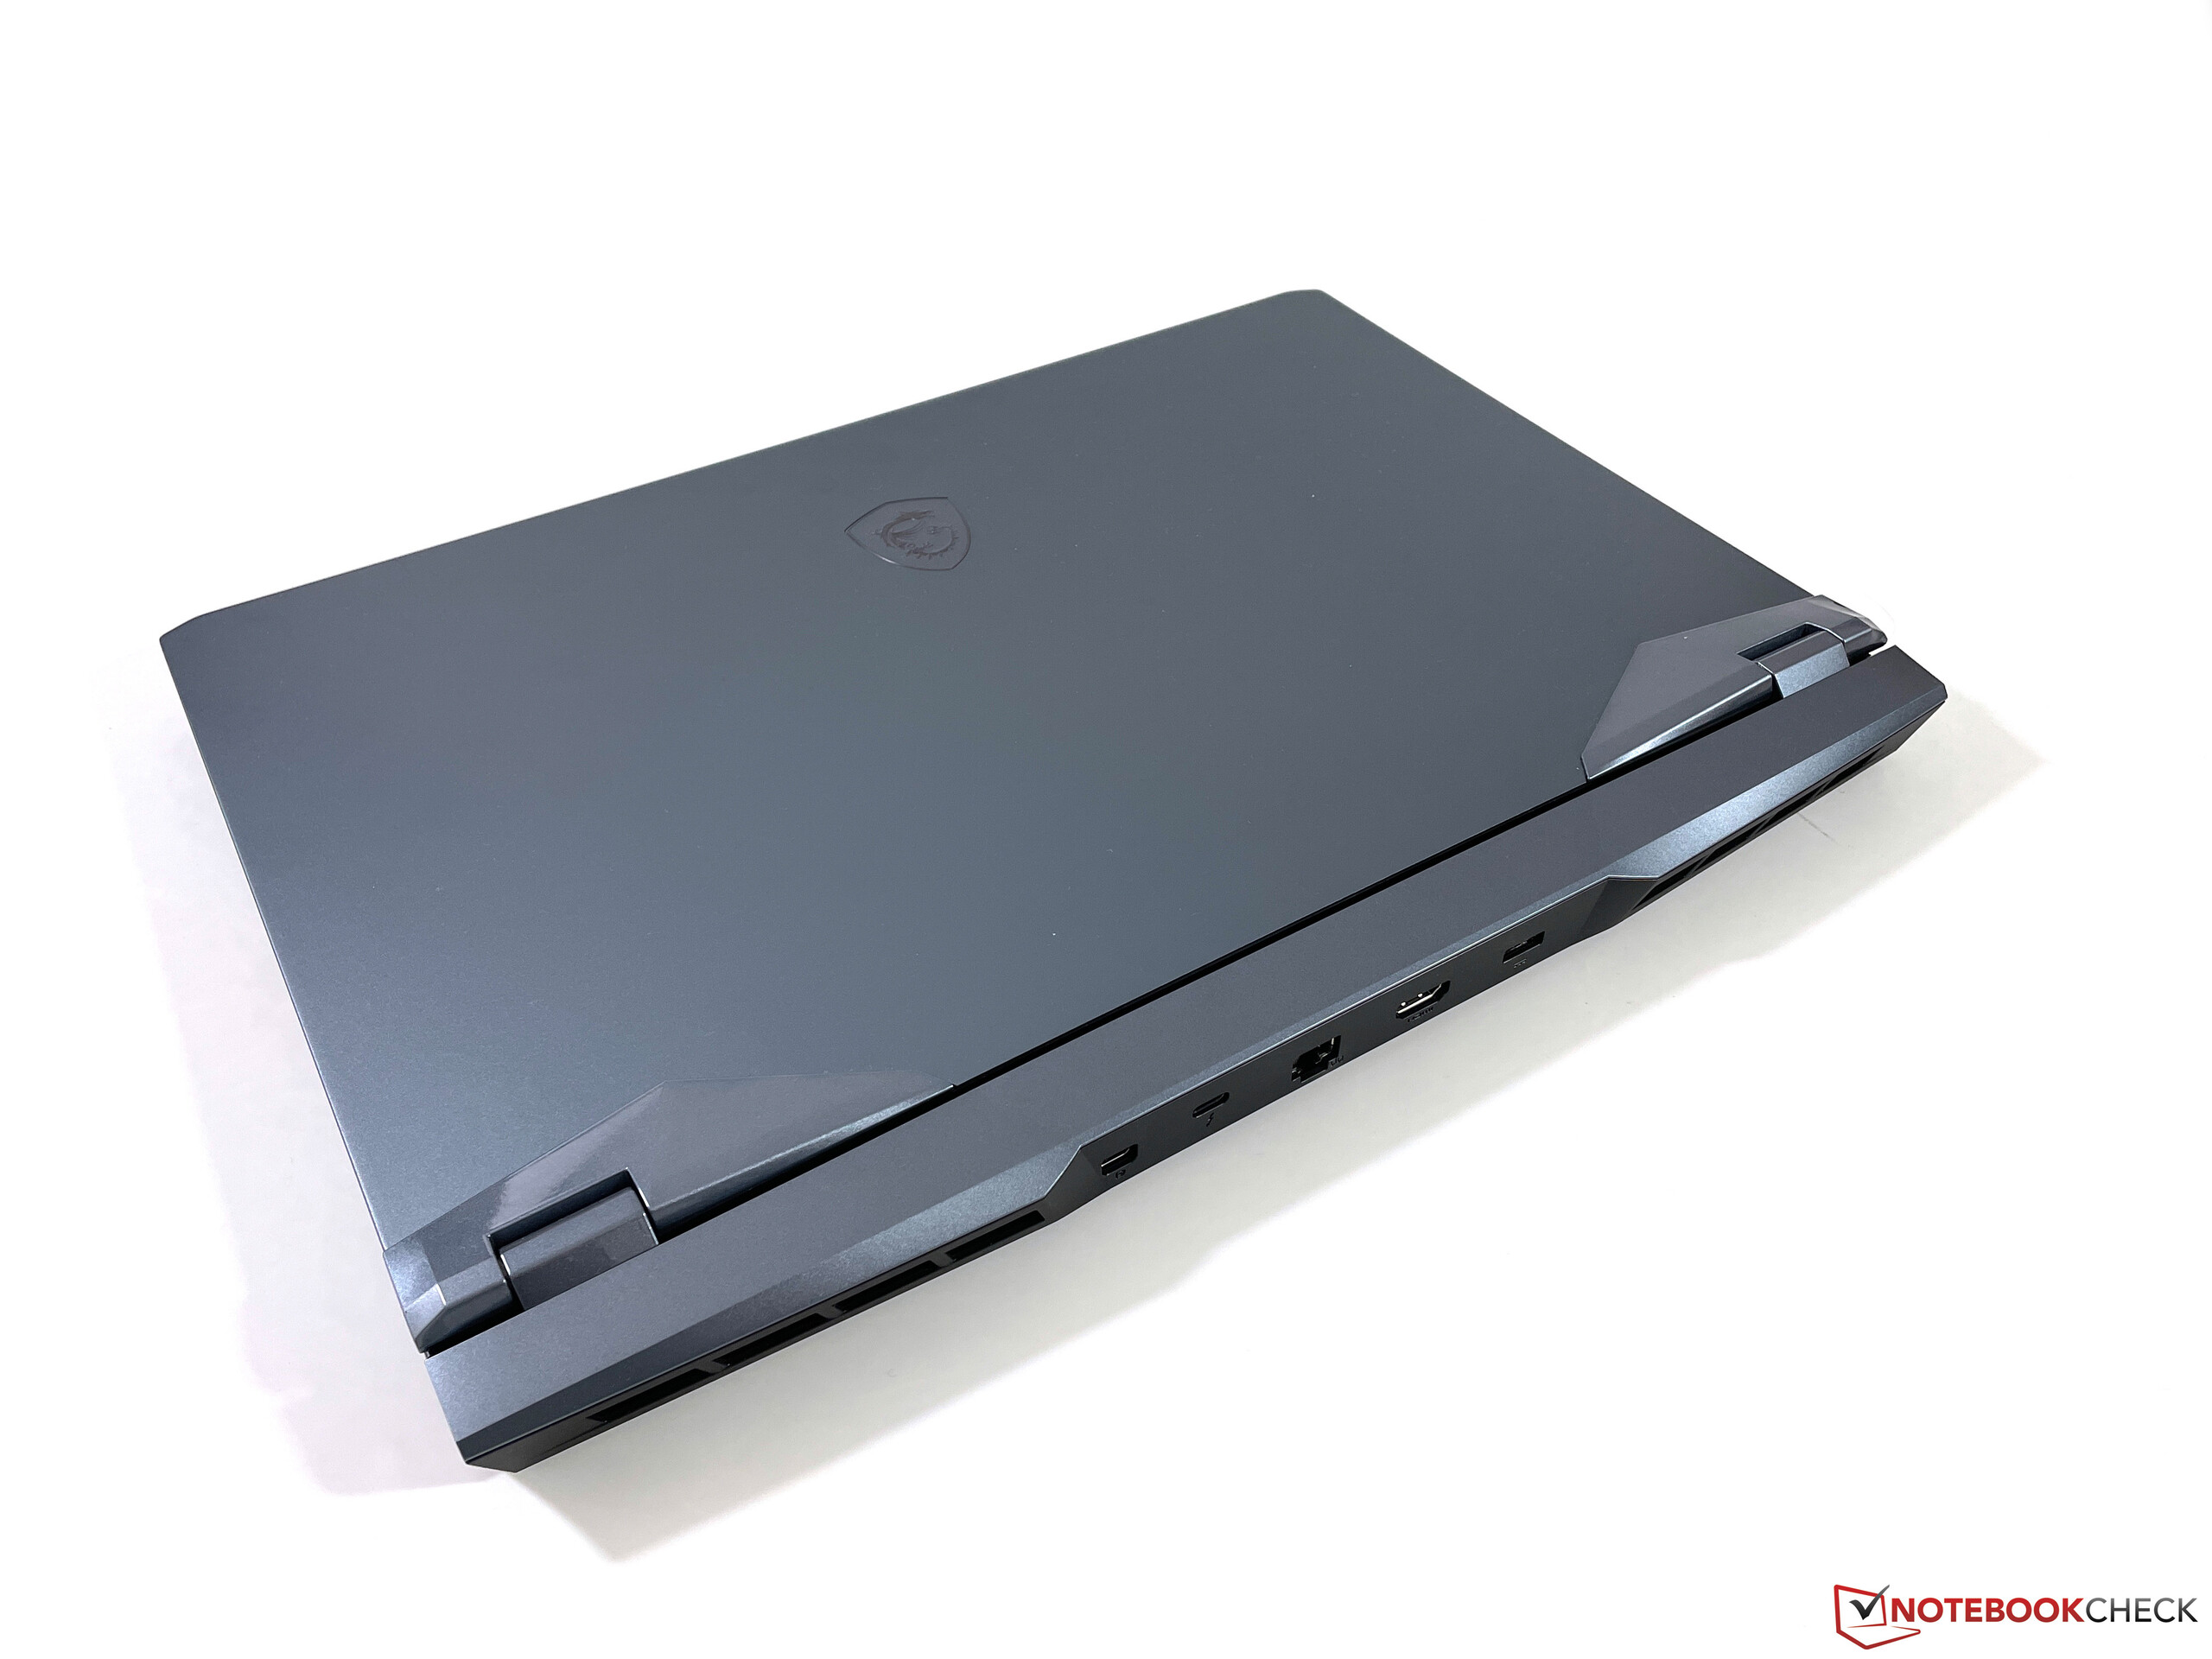
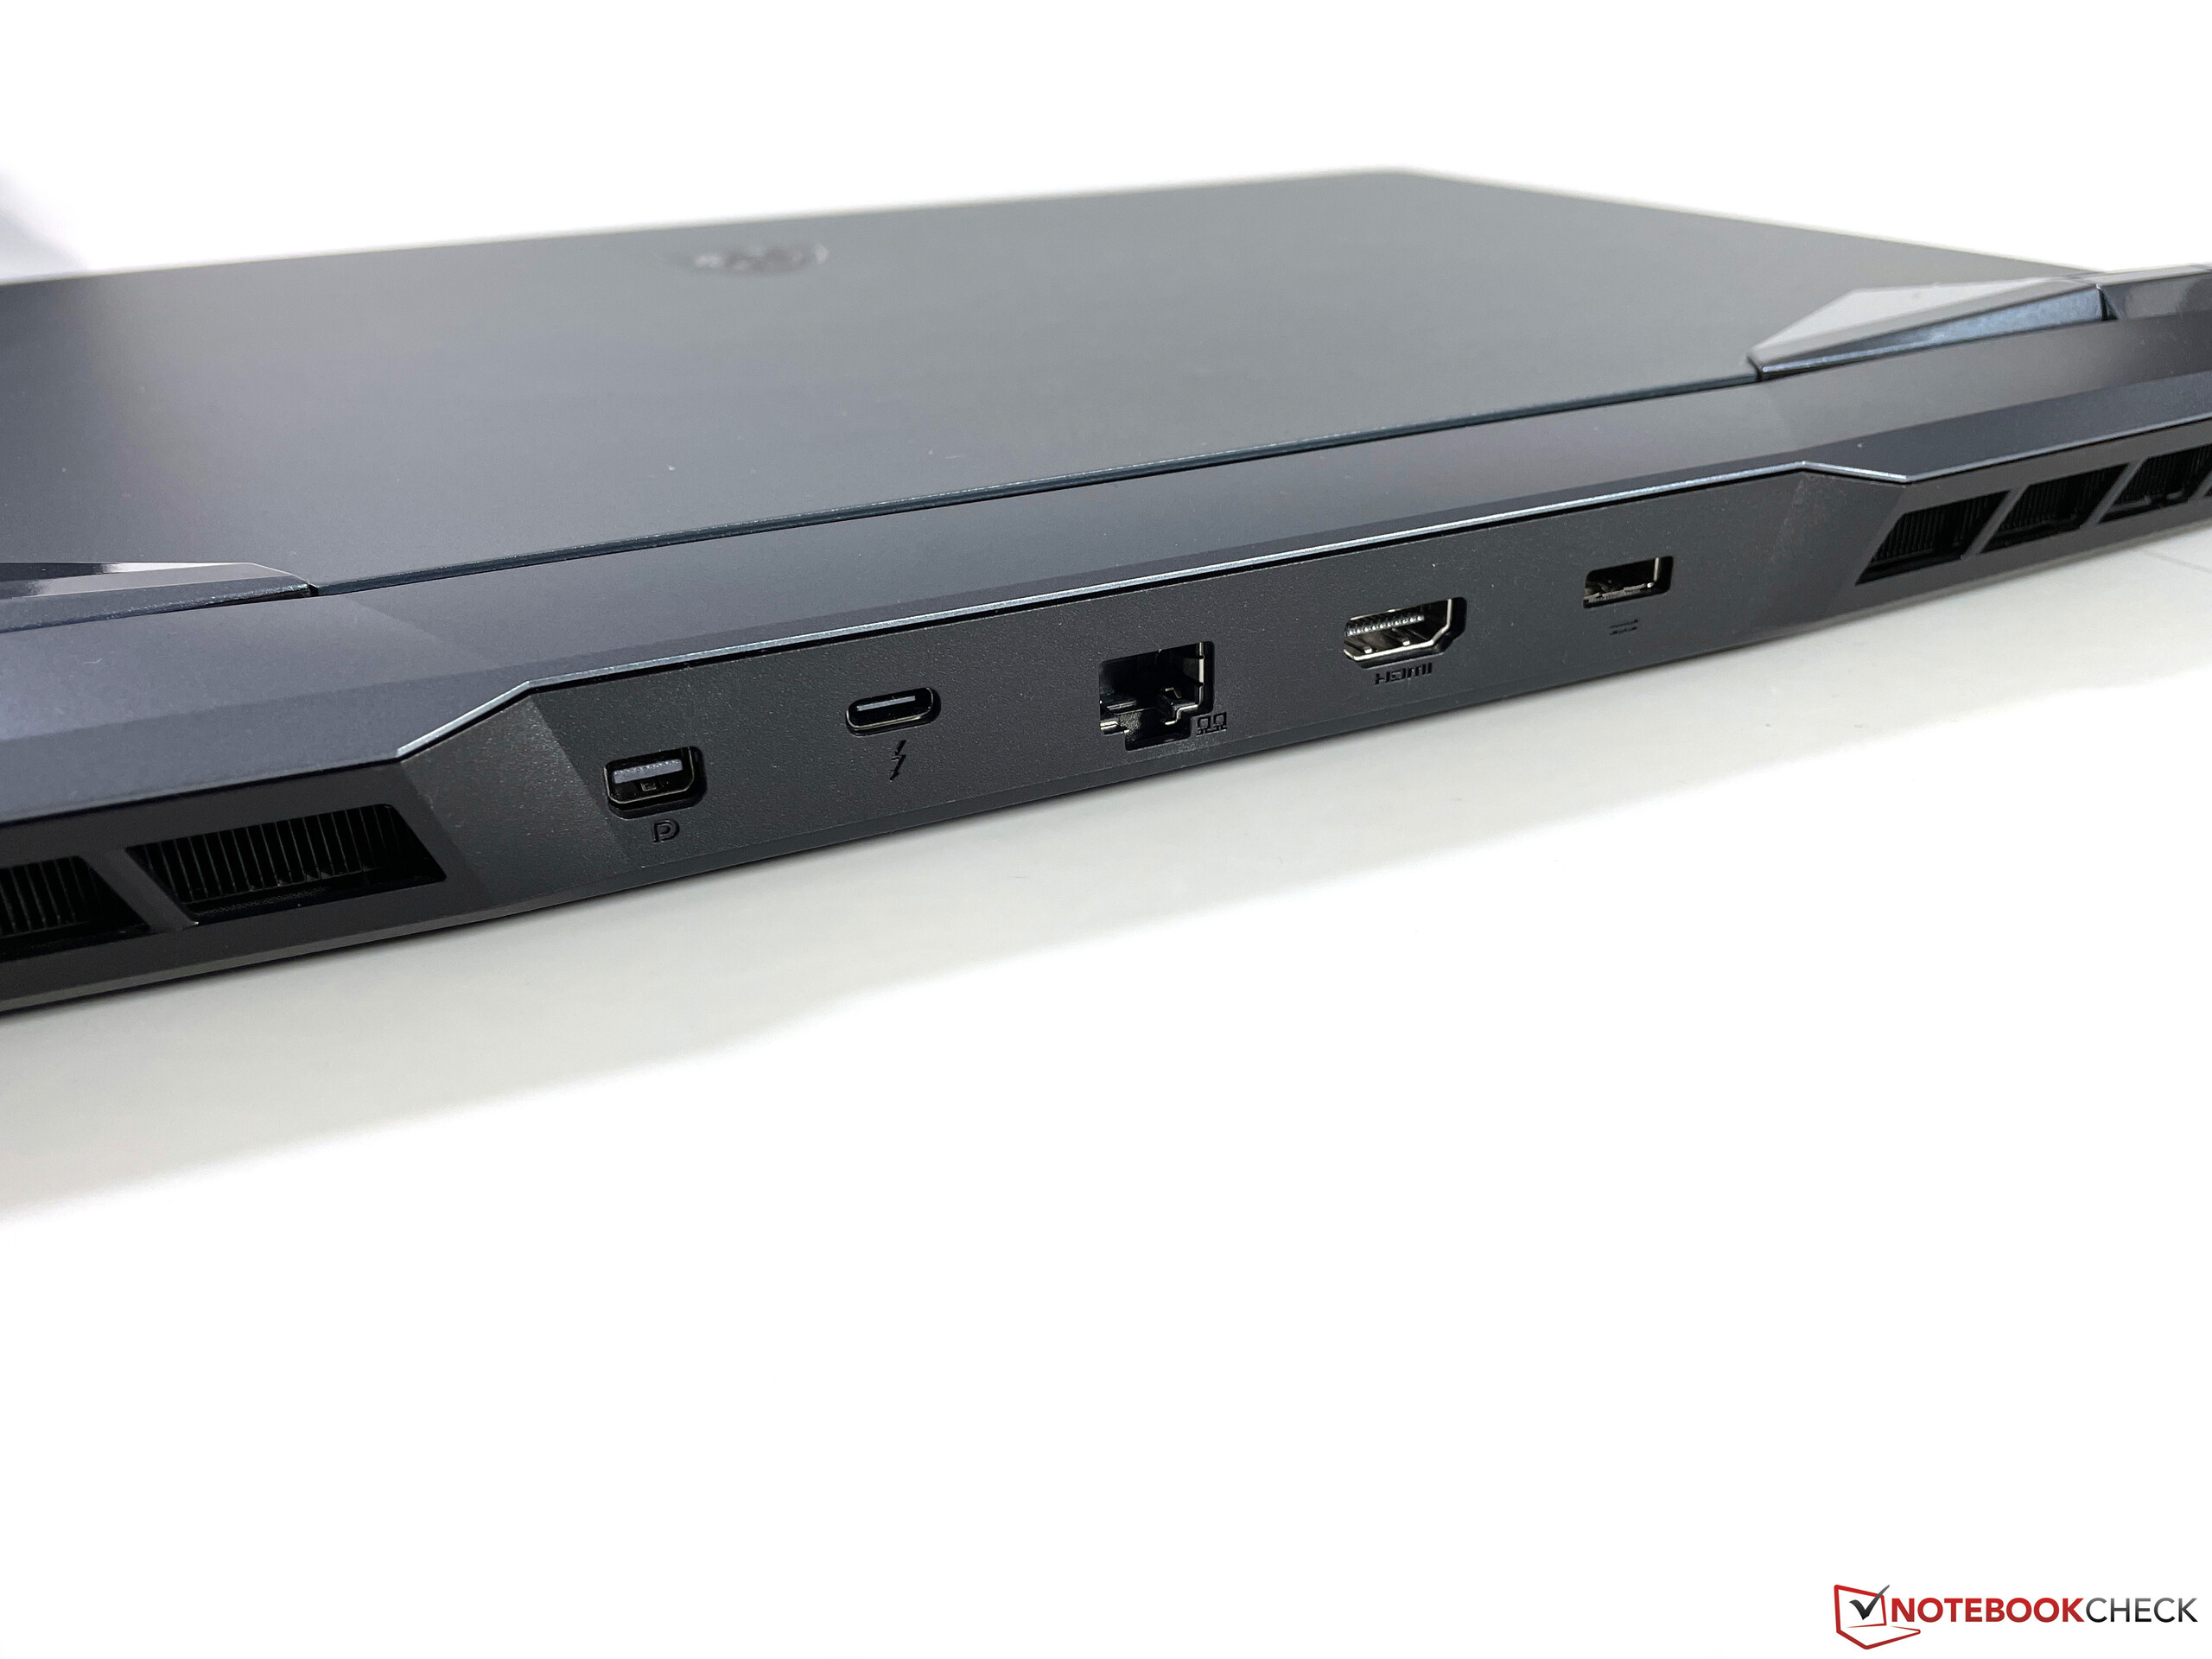
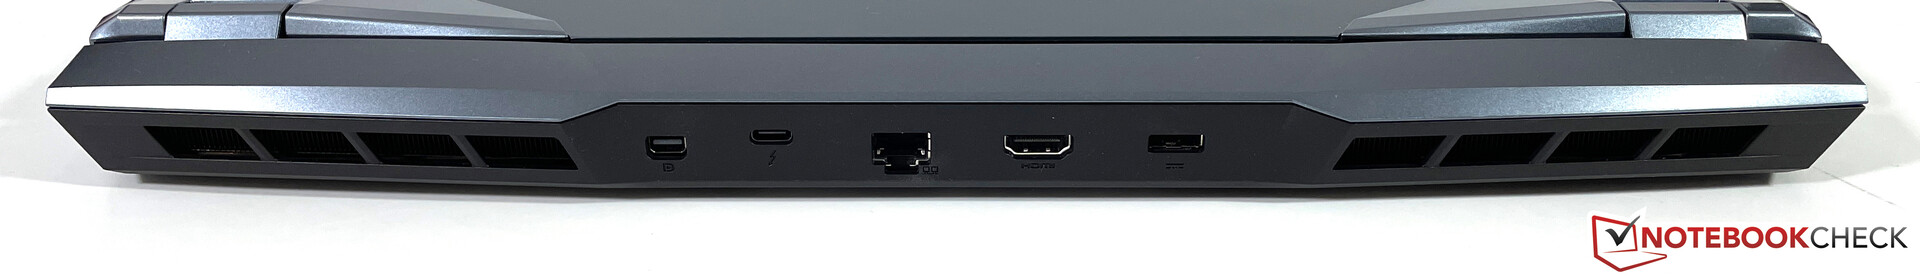
Bağlanabilirlik - Thunderbolt 4/USB 4 ile WE76
Bağlantı noktaları söz konusu olduğunda, yeterli sayıda USB bağlantı noktası ve modern Thunderbolt 4 arabirimi dahil, kalbinizin arzu ettiği her şeyi bulacaksınız. Güç adaptörü, LAN ve harici monitörler (en fazla üç) için bağlantı noktaları arkada bulunurken, USB bağlantı noktalarının yanı sıra kart okuyucu da hızlı erişim için yanlara yerleştirilmiştir. İsteğe bağlı bir akıllı kart okuyucu ise mevcut değildir.
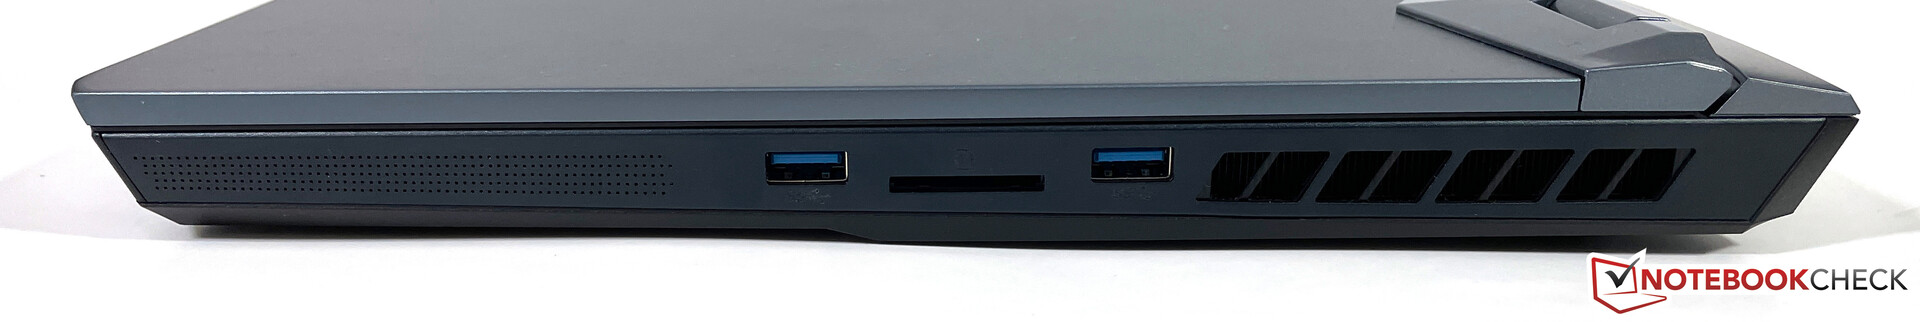
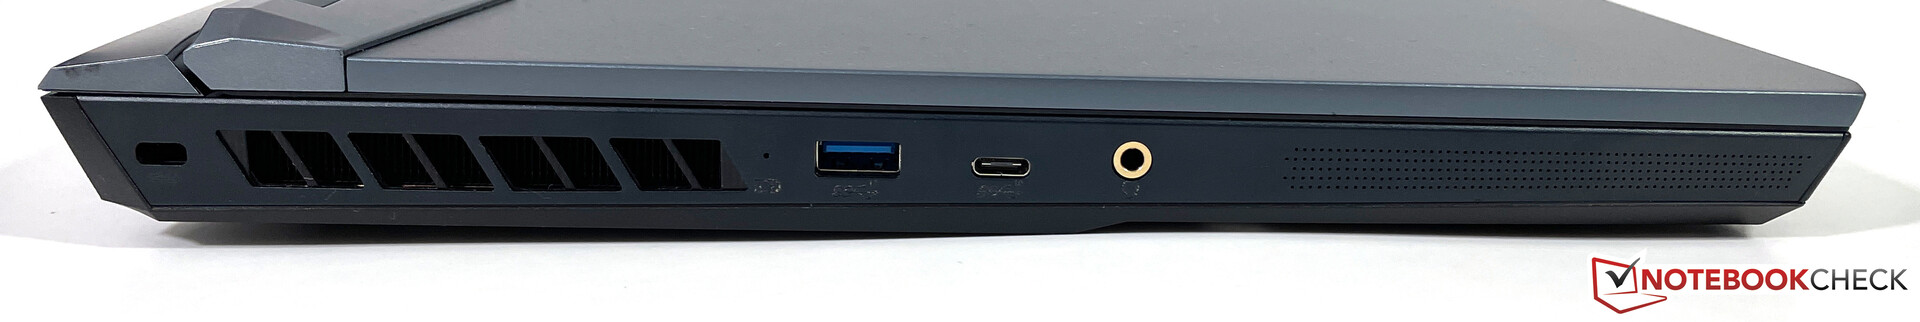
SD kart okuyucu
Sağdaki tam teşekküllü SD kart okuyucu, eski WE75'tekinden daha hızlıdır. Referans kartımız (Angelbird AV Pro V60) ile 80-90 MB/sn aktarım hızlarını belirliyoruz. Bu kabul edilebilir, ancak bazı rakipler önemli ölçüde daha hızlı modüller sunuyor. Takılı bir SD kart, kasadan 4 milimetre dışarı çıkıyor.
| SD Card Reader | |
| average JPG Copy Test (av. of 3 runs) | |
| Lenovo ThinkPad P17 G2-20YU0025G (Toshiba Exceria Pro SDXC 64 GB UHS-II) | |
| HP ZBook Fury 17 G7 119W5EA (AV Pro 60) | |
| Sınıf ortalaması Workstation (49.6 - 681, n=14, son 2 yıl) | |
| MSI WE76 11UM-456 (AV Pro V60) | |
| HP ZBook Fury 15 G8 (AV Pro V60) | |
| Asus ProArt StudioBook 16 W7600H5A-2BL2 (AV Pro SD microSD 128 GB V60) | |
| MSI WE75 9TK (Toshiba Exceria Pro SDXC 64 GB UHS-II) | |
| maximum AS SSD Seq Read Test (1GB) | |
| Sınıf ortalaması Workstation (87.6 - 1455, n=14, son 2 yıl) | |
| Lenovo ThinkPad P17 G2-20YU0025G (Toshiba Exceria Pro SDXC 64 GB UHS-II) | |
| HP ZBook Fury 17 G7 119W5EA (AV Pro 60) | |
| MSI WE76 11UM-456 (AV Pro V60) | |
| HP ZBook Fury 15 G8 (AV Pro V60) | |
| Asus ProArt StudioBook 16 W7600H5A-2BL2 (AV Pro SD microSD 128 GB V60) | |
| MSI WE75 9TK (Toshiba Exceria Pro SDXC 64 GB UHS-II) | |
İletişim
MSI, modern Wi-Fi 6E standardını ve Bluetooth 5.2'yi destekleyen hızlı Killer AX1675x modülünü kullanır. Netgear Nighthawk RAX120 yönlendirici ile standart Wi-Fi testimizde aktarım hızları çok iyi ve karşılaştırma alanımızın en üstünde.
| Networking | |
| iperf3 transmit AX12 | |
| MSI WE76 11UM-456 | |
| HP ZBook Fury 17 G7 119W5EA | |
| Ortalama Intel Killer Wi-Fi 6E AX1675x (210NGW) (1066 - 1499, n=8) | |
| HP ZBook Fury 15 G8 | |
| Asus ProArt StudioBook 16 W7600H5A-2BL2 | |
| Lenovo ThinkPad P17 G2-20YU0025G | |
| iperf3 receive AX12 | |
| MSI WE76 11UM-456 | |
| HP ZBook Fury 17 G7 119W5EA | |
| Lenovo ThinkPad P17 G2-20YU0025G | |
| Ortalama Intel Killer Wi-Fi 6E AX1675x (210NGW) (1037 - 1469, n=8) | |
| HP ZBook Fury 15 G8 | |
| Asus ProArt StudioBook 16 W7600H5A-2BL2 | |
Web kamerası
Ekranın üzerindeki 1080p web kamerası, normal 720p modüllerinden biraz daha yüksek çözünürlük sunsa da, görüntü kalitesi hala özellikle iyi değil. Özellikle kayıtlarımız sırasında nispeten yüksek miktarda gürültü ile uğraşmak zorunda kaldık. Full HD videolar 30 FPS'de çekilebilir.


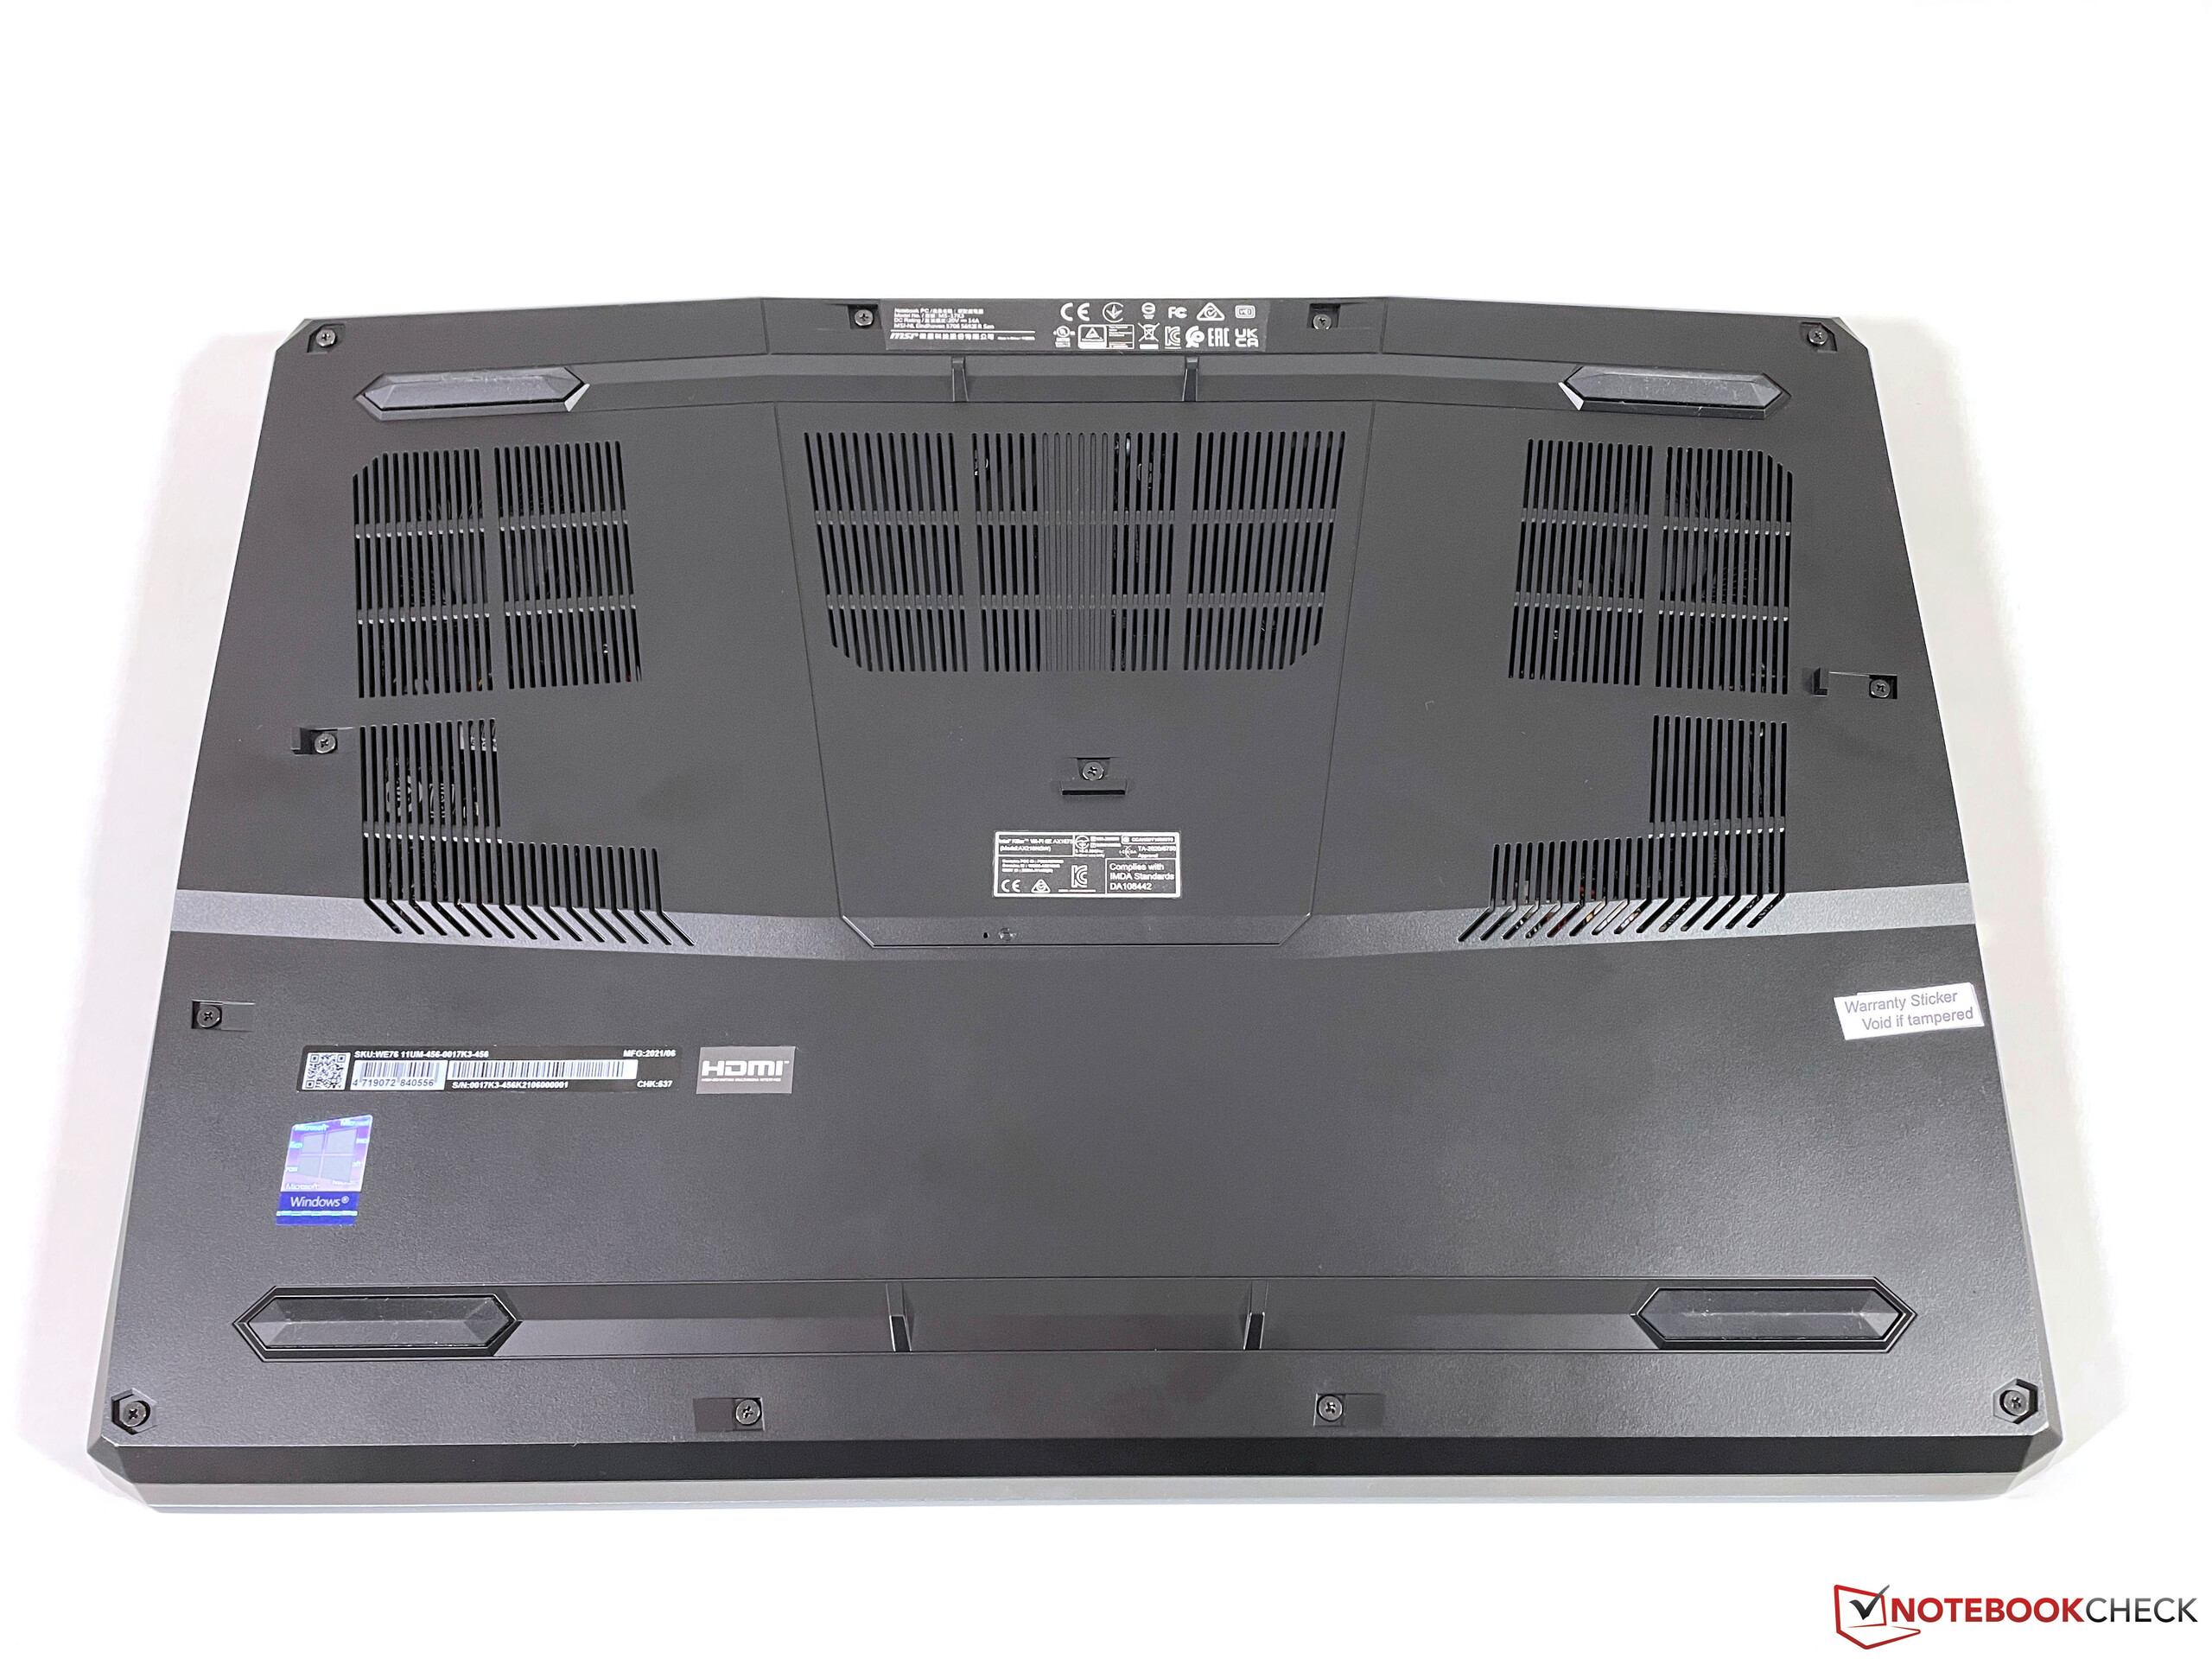
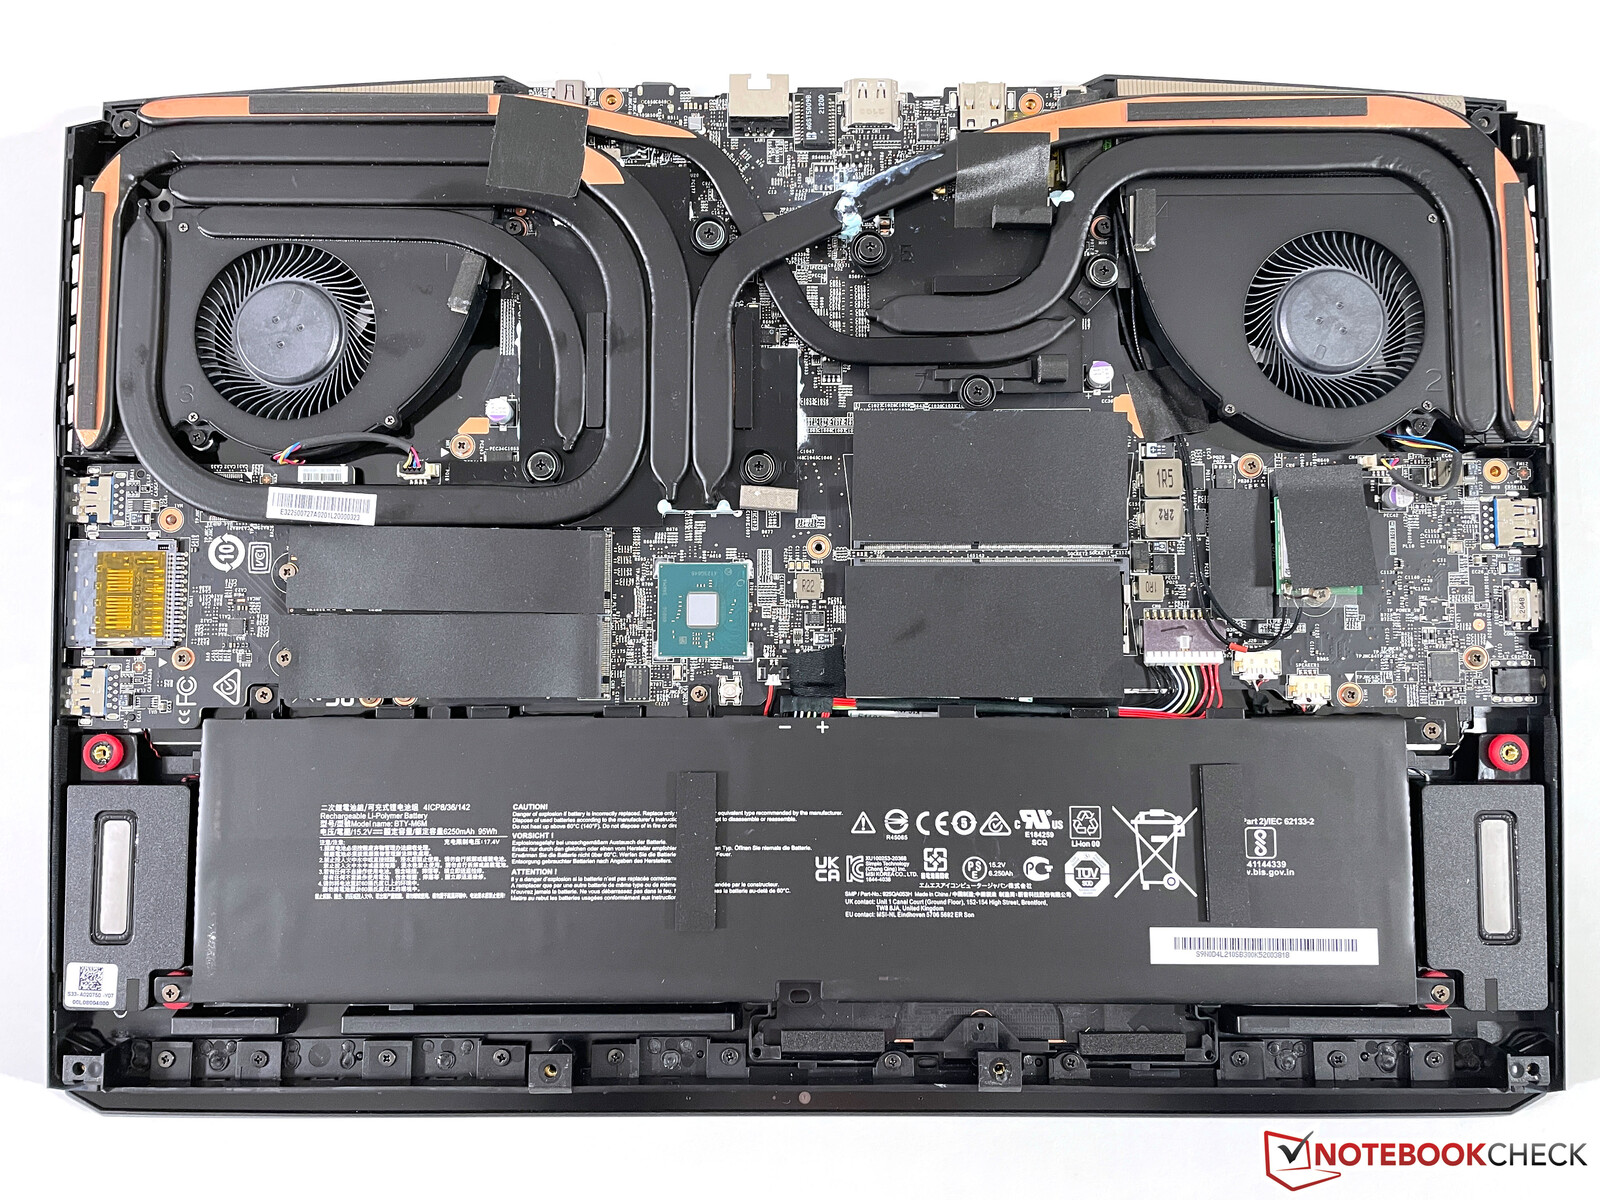
Bakım
Tüm çapraz vidaları gevşettikten sonra, alt kapağın tamamı çıkarılabilir. İki SODIMM yuvasının yanı sıra iki M.2-2280 yuvası da mevcuttur (1x PCIe 4.0 ve 1x PCIe 3.0). Wi-Fi modülü de değiştirilebilir.
Giriş Birimleri - Sayısal tuş takımlı SteelSeries
Klavye
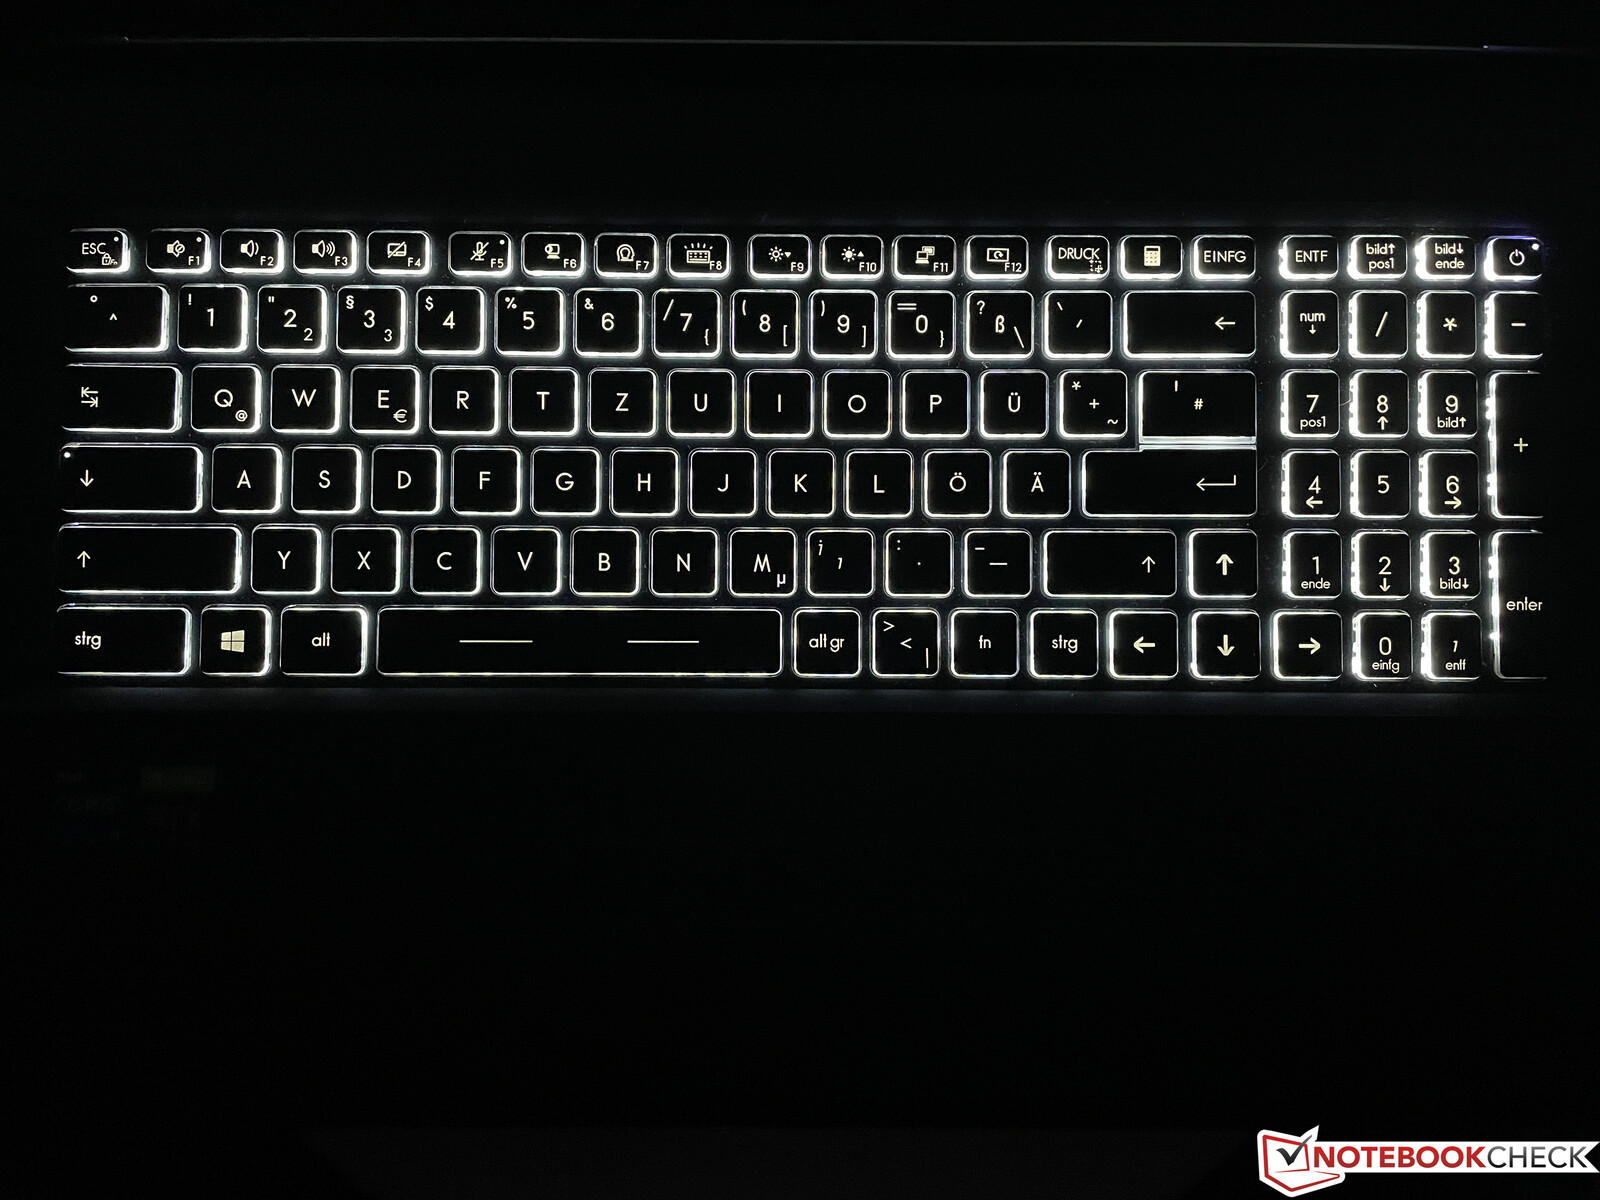
Oyun kardeşleri gibi, WE76 iş istasyonu muadili de bir SteelSeries klavyeye sahiptir. Ancak, renkli arka ışık çıkarılmış; bunun yerine yalnızca beyaz bir arka ışık mevcut. Tuşlar nispeten uzun bir yolculuk sunuyor ve yazma hissi çok iyi ve yerleşik iş istasyonu yarışmasının en iyi klavyeleriyle kolayca rekabet edebiliyor. Ek olarak, sağ tarafa tam teşekküllü bir sayısal tuş takımı entegre edilmiştir. Anahtarları biraz daha dardır, ancak bu pratikte bir sorun teşkil etmemiştir.
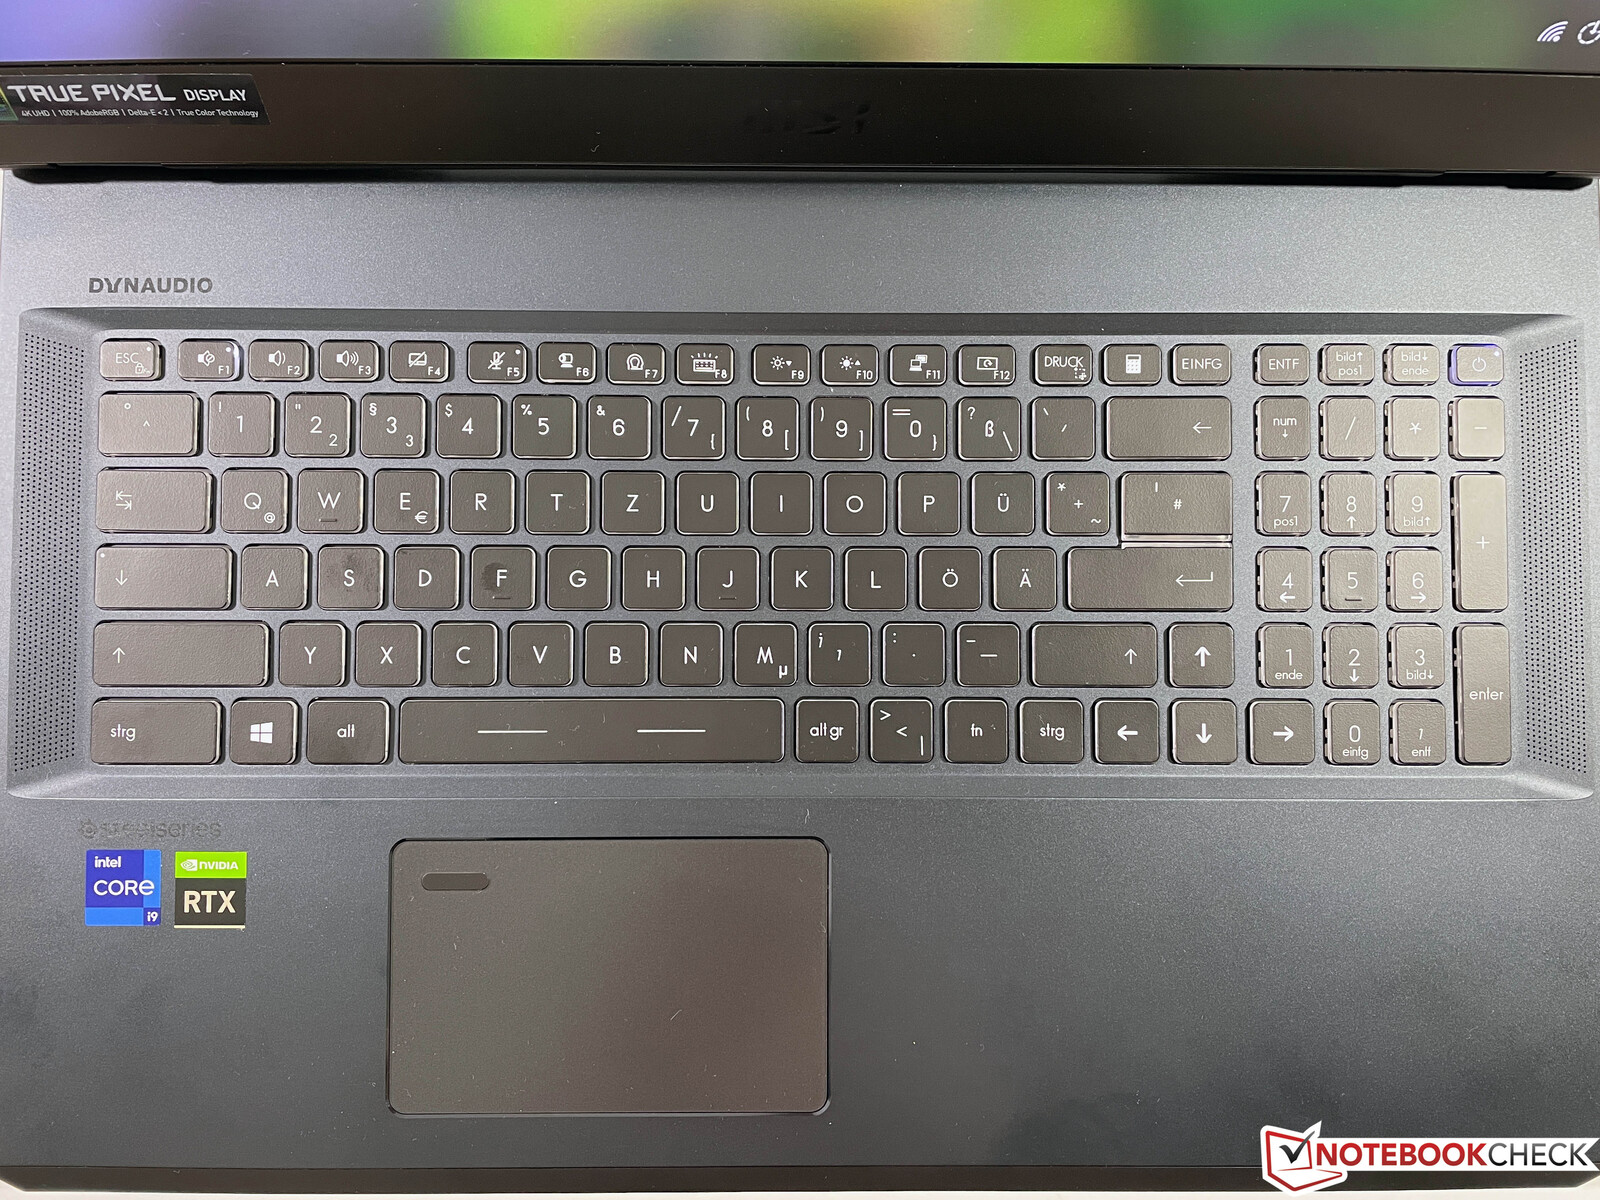
Dokunmatik yüzey
10,5 x 6,5 cm boyutlarındaki dokunmatik yüzey günümüz standartlarına göre özellikle büyük değil, ancak fare kontrolü sorunsuz çalışıyor. Pürüzsüz yüzey iyi kayma özellikleri sunar ve sol üst köşede bulunan yerleşik parmak izi tarayıcısı engel olmaz. Gerçek tıklama mekanizmasına ulaşmadan önce hafif bir boşluk olduğu için dokunmatik yüzey biraz takırtı hissi veriyor. Bu, bir tıklama tetiklenmeden alt yarının belirgin şekilde aşağı bastırılabileceği anlamına gelir. Ayrıca, gerçek tıklama çok yüksek, bu da onu ucuz hissettiriyor.
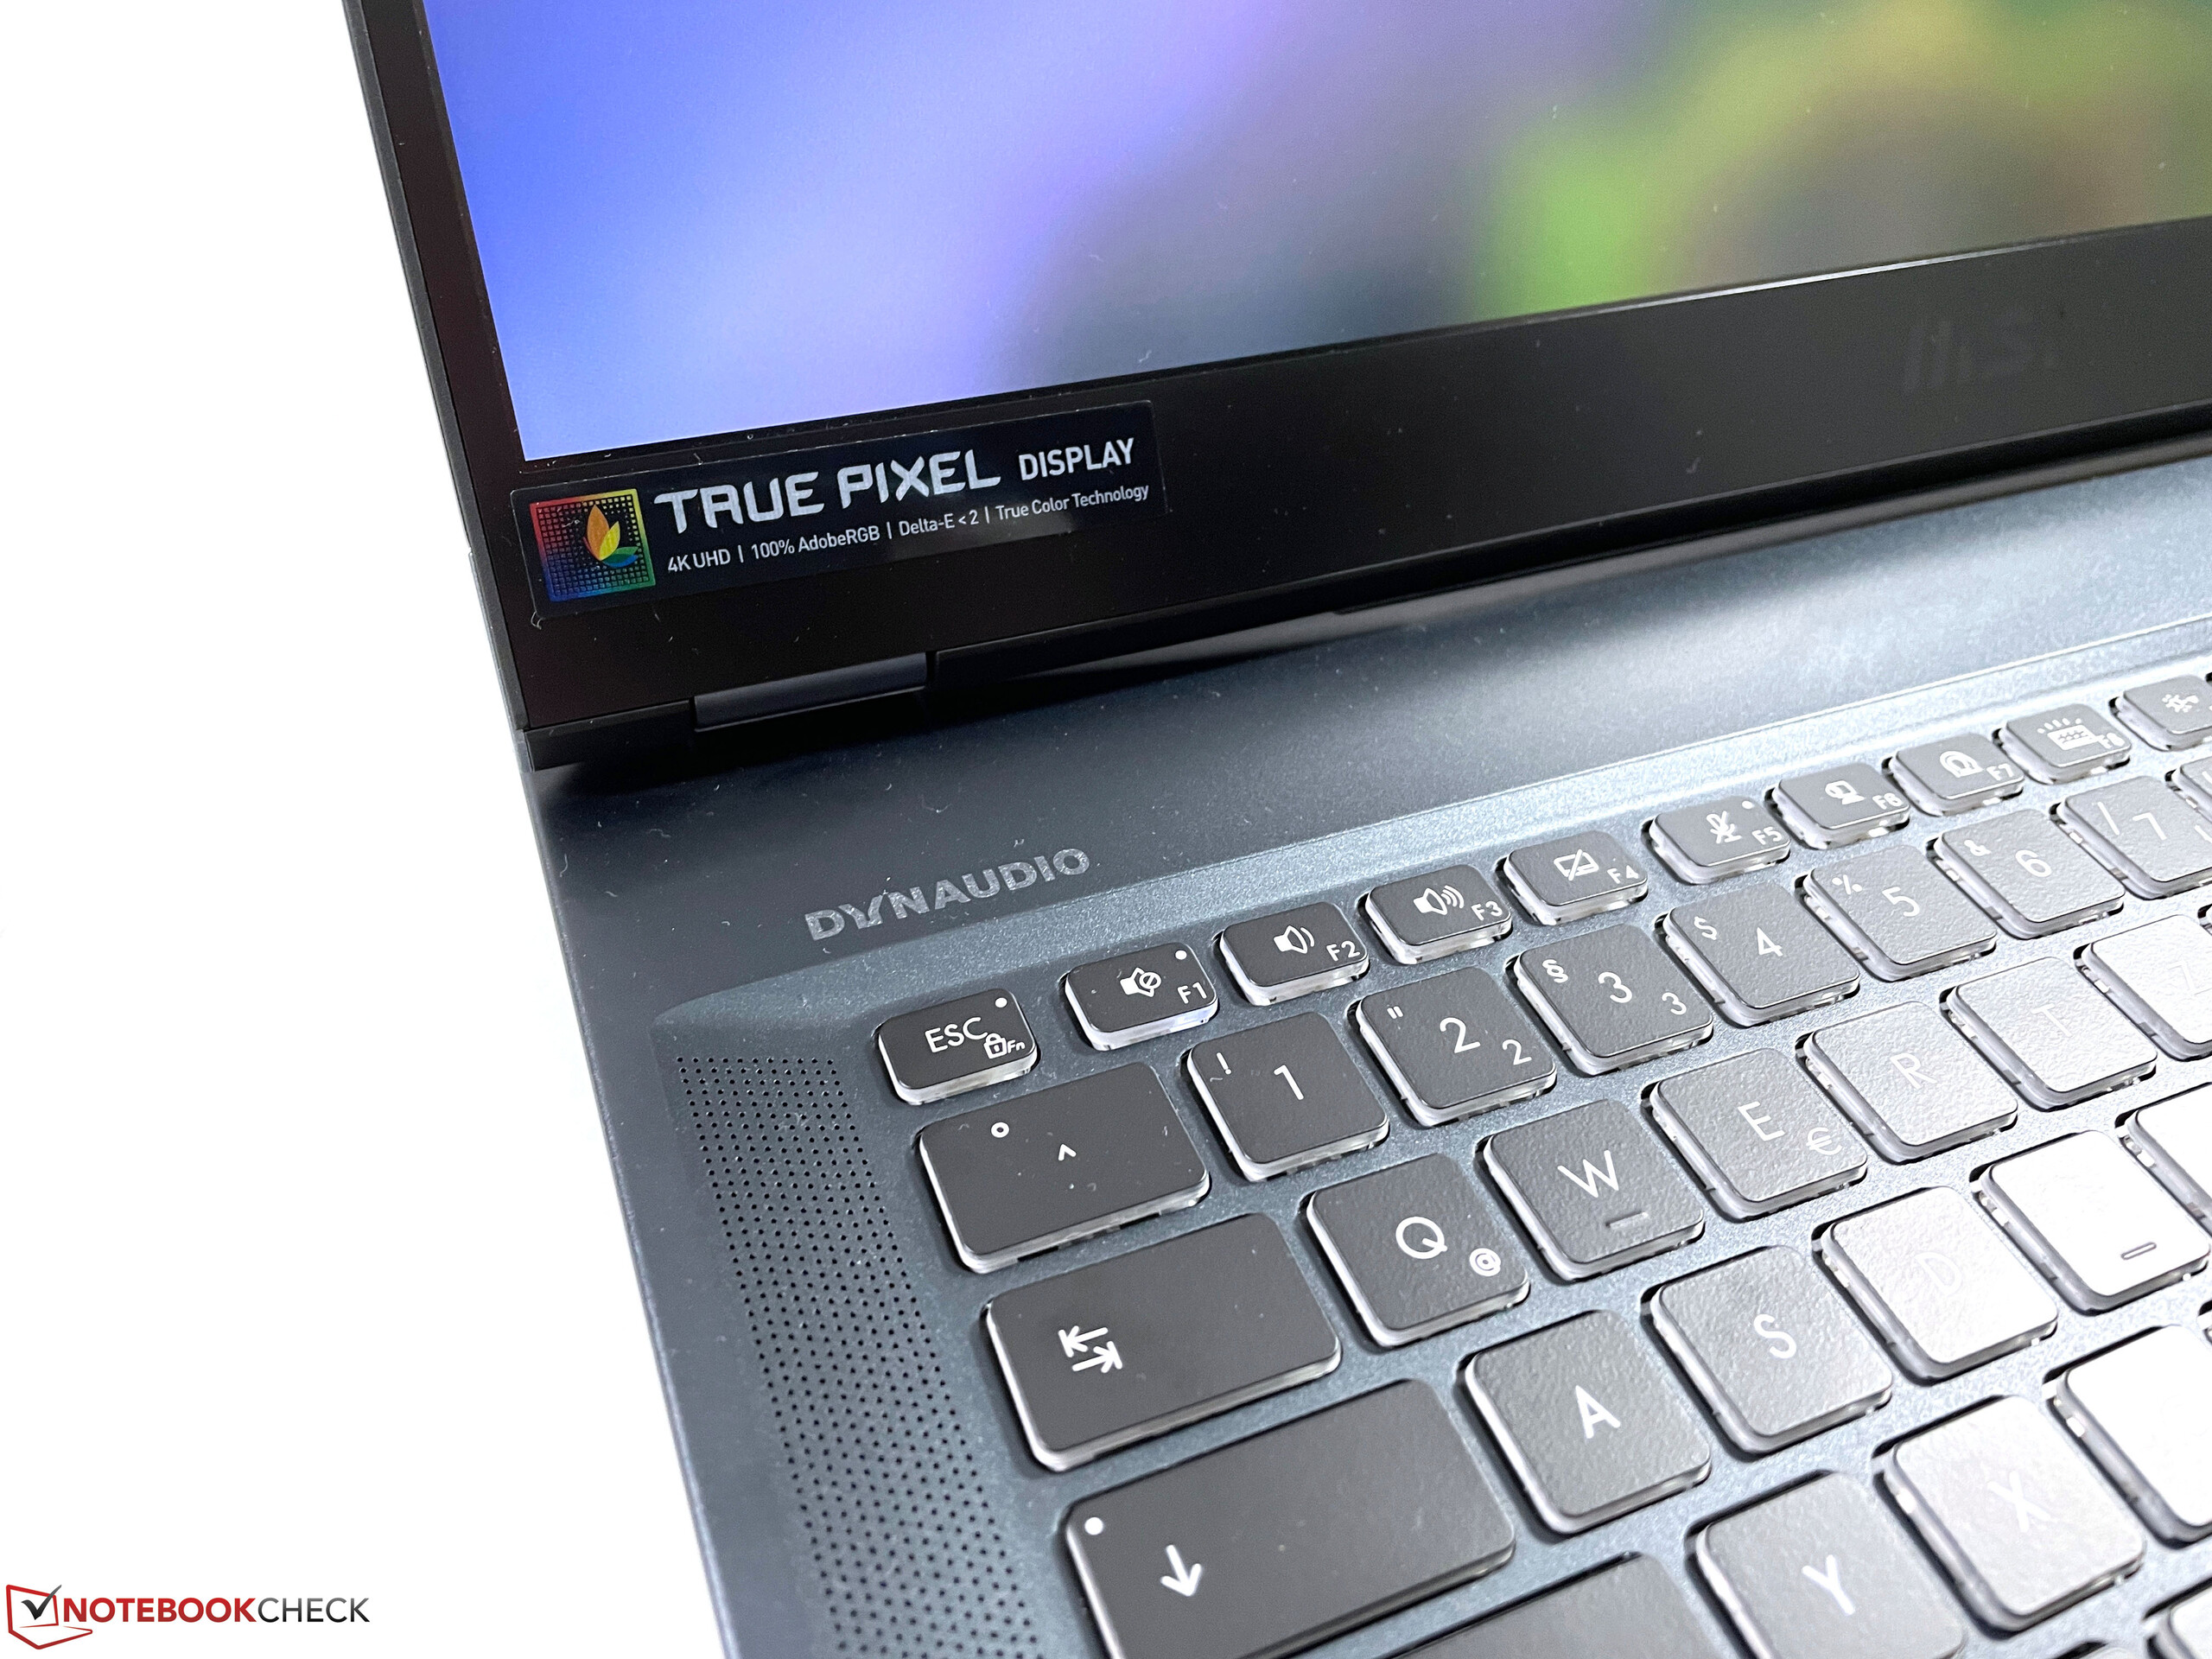
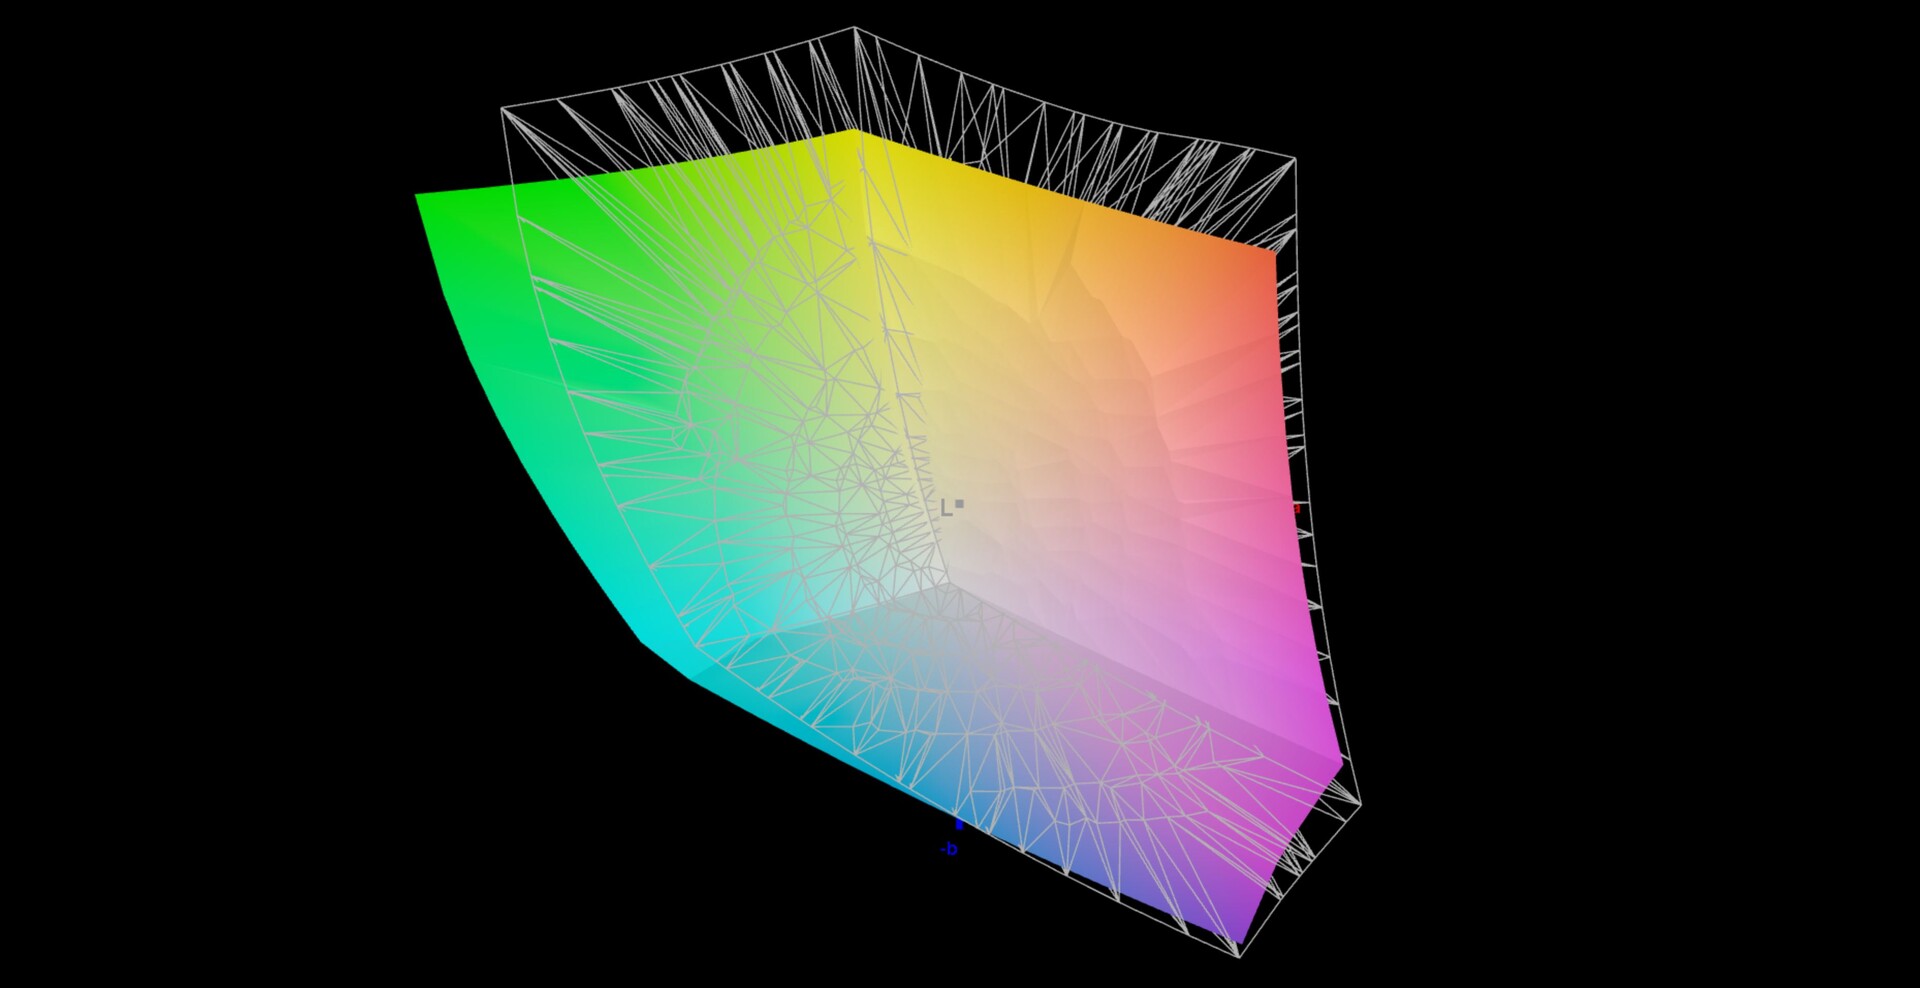
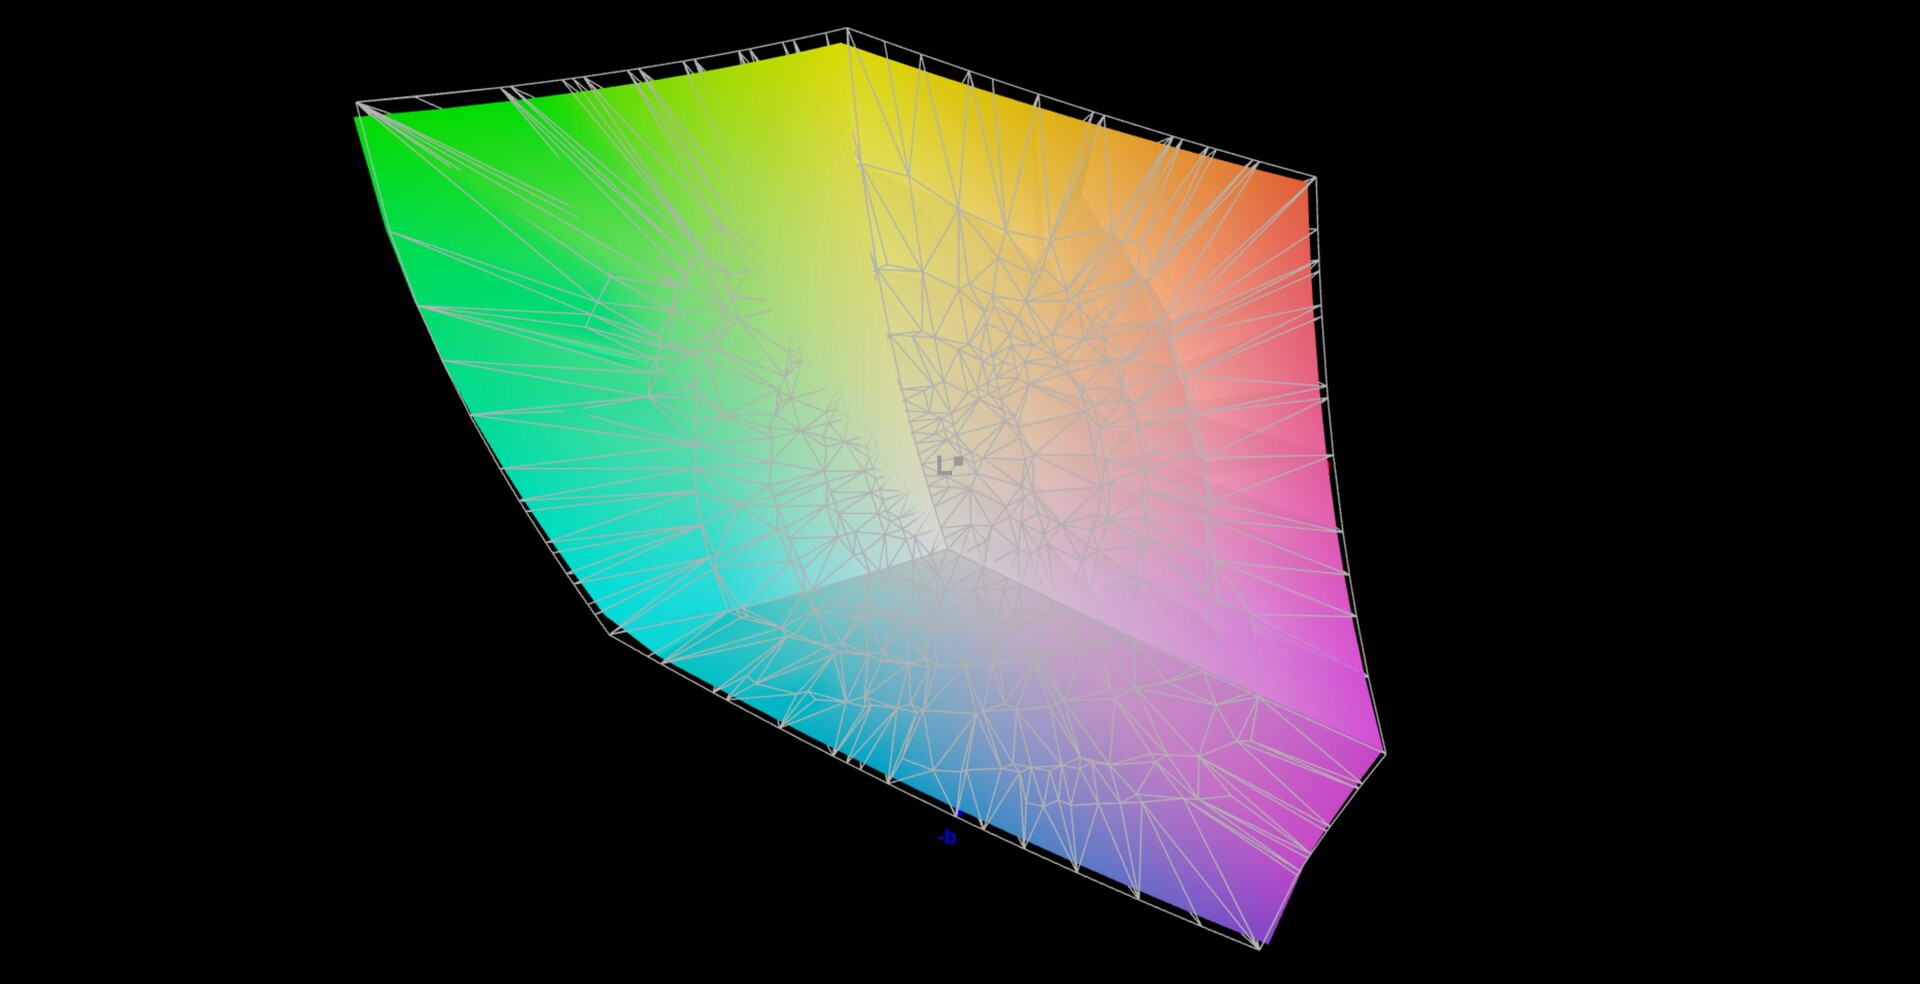
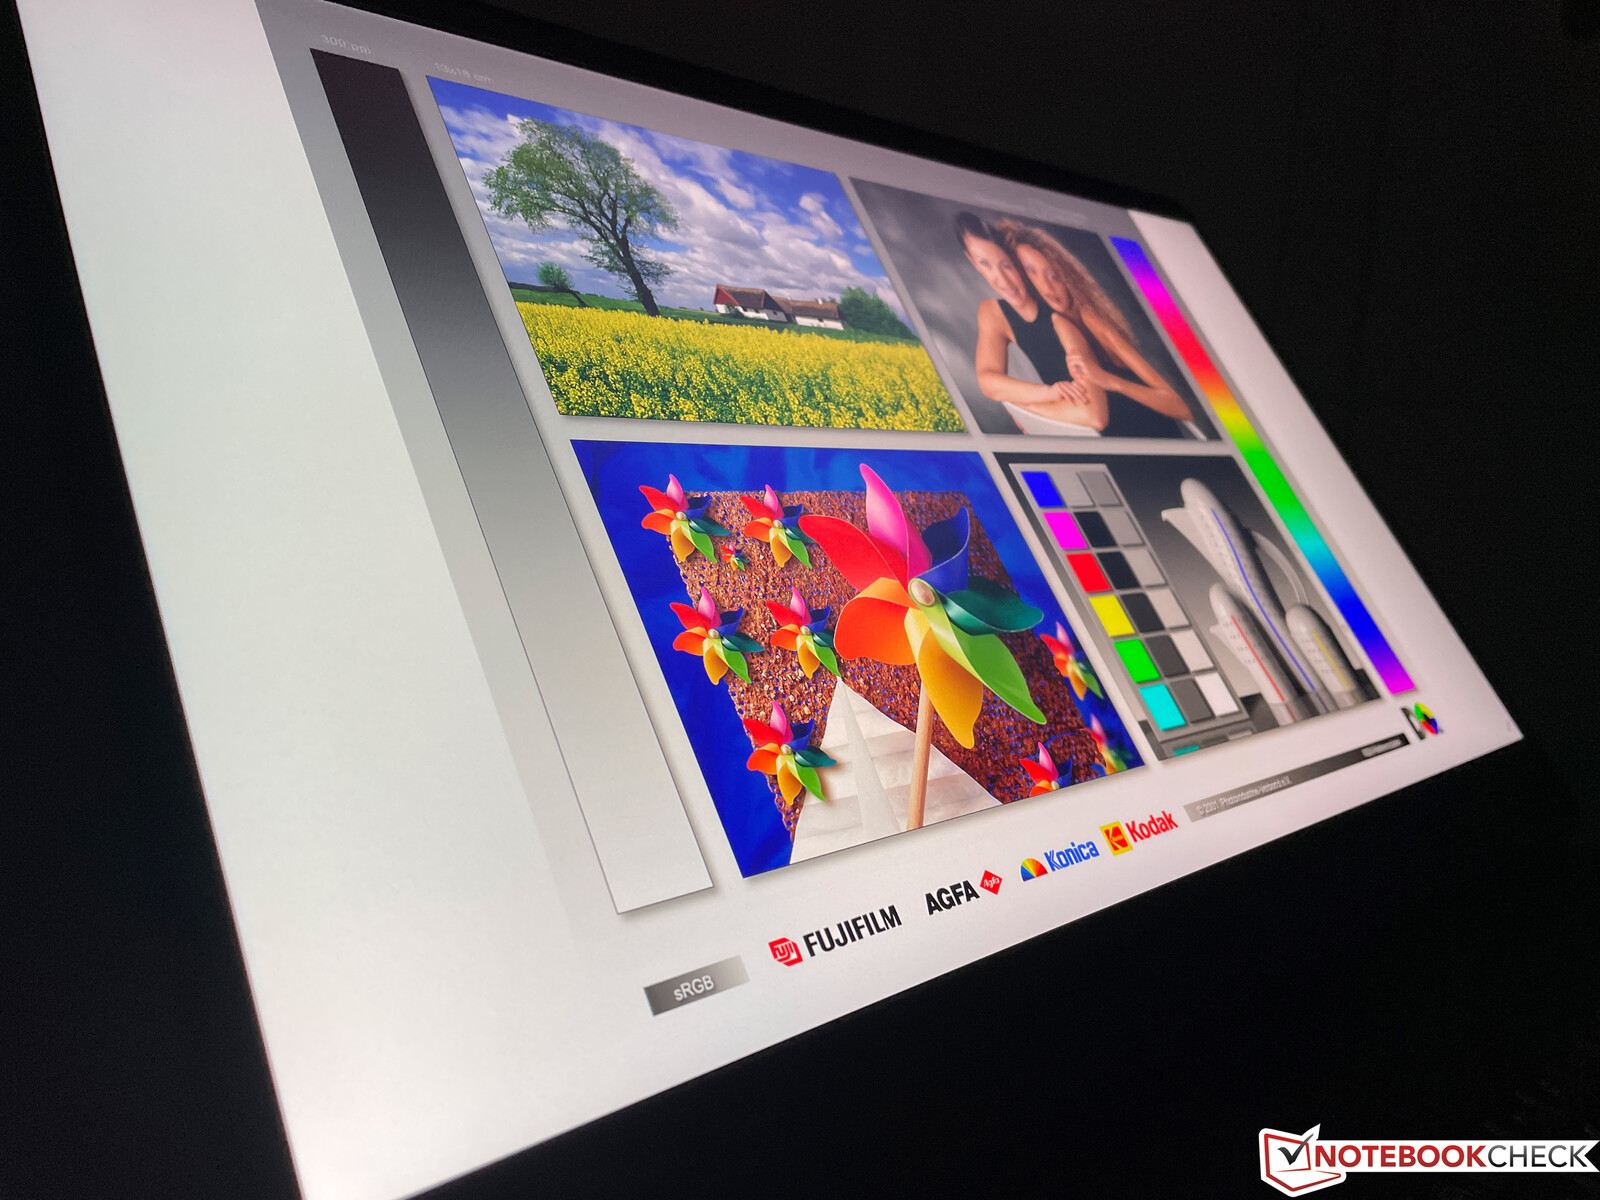
Ekran - 120 Hz ve AdobeRGB’li Mat 4K panel
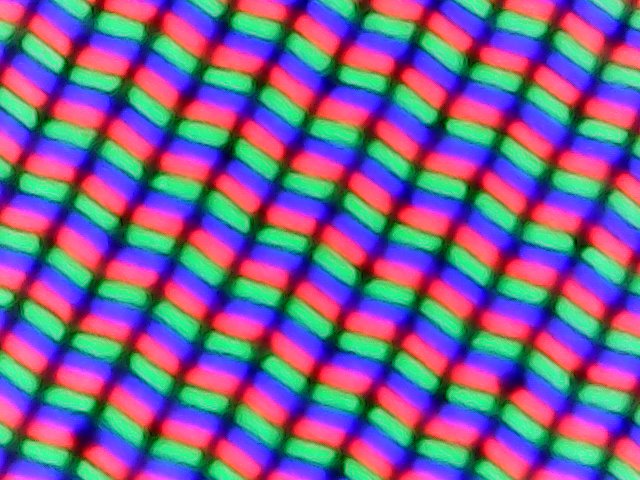
WE76, yalnızca 16:9 en boy oranında mat 4K panel ile sunulur. MSI'ye göre, ekran aynı zamanda AdobeRGB renk alanını bütünüyle kapsıyor ve 120 Hz'lik yenileme hızı da varsayılan olarak etkin olan düzgün bir görüntü sağlıyor. MSI, burada oyun sürümlerinin daha da hızlı panellerini kullanmaktan kaçınıyor, bu da mantıklı.
Panelin öznel görüntü izlenimi mükemmel. Resimler son derece keskin ve parlak alanlar bile grenli görünmüyor. Ancak renkler, yüksek kaliteli OLED veya mini LED panellere kıyasla pek canlı değil. Ortalama parlaklık 400 cd/m²'nin biraz üzerinde ve kontrast oranı 1.200:1'i aşıyor. Genel olarak, eski MSI WE75'in 1080p ekranına göre gözle görülür bir gelişme, ancak rekabetteki bazı yüksek çözünürlüklü paneller daha iyi puanlar sağlıyor.
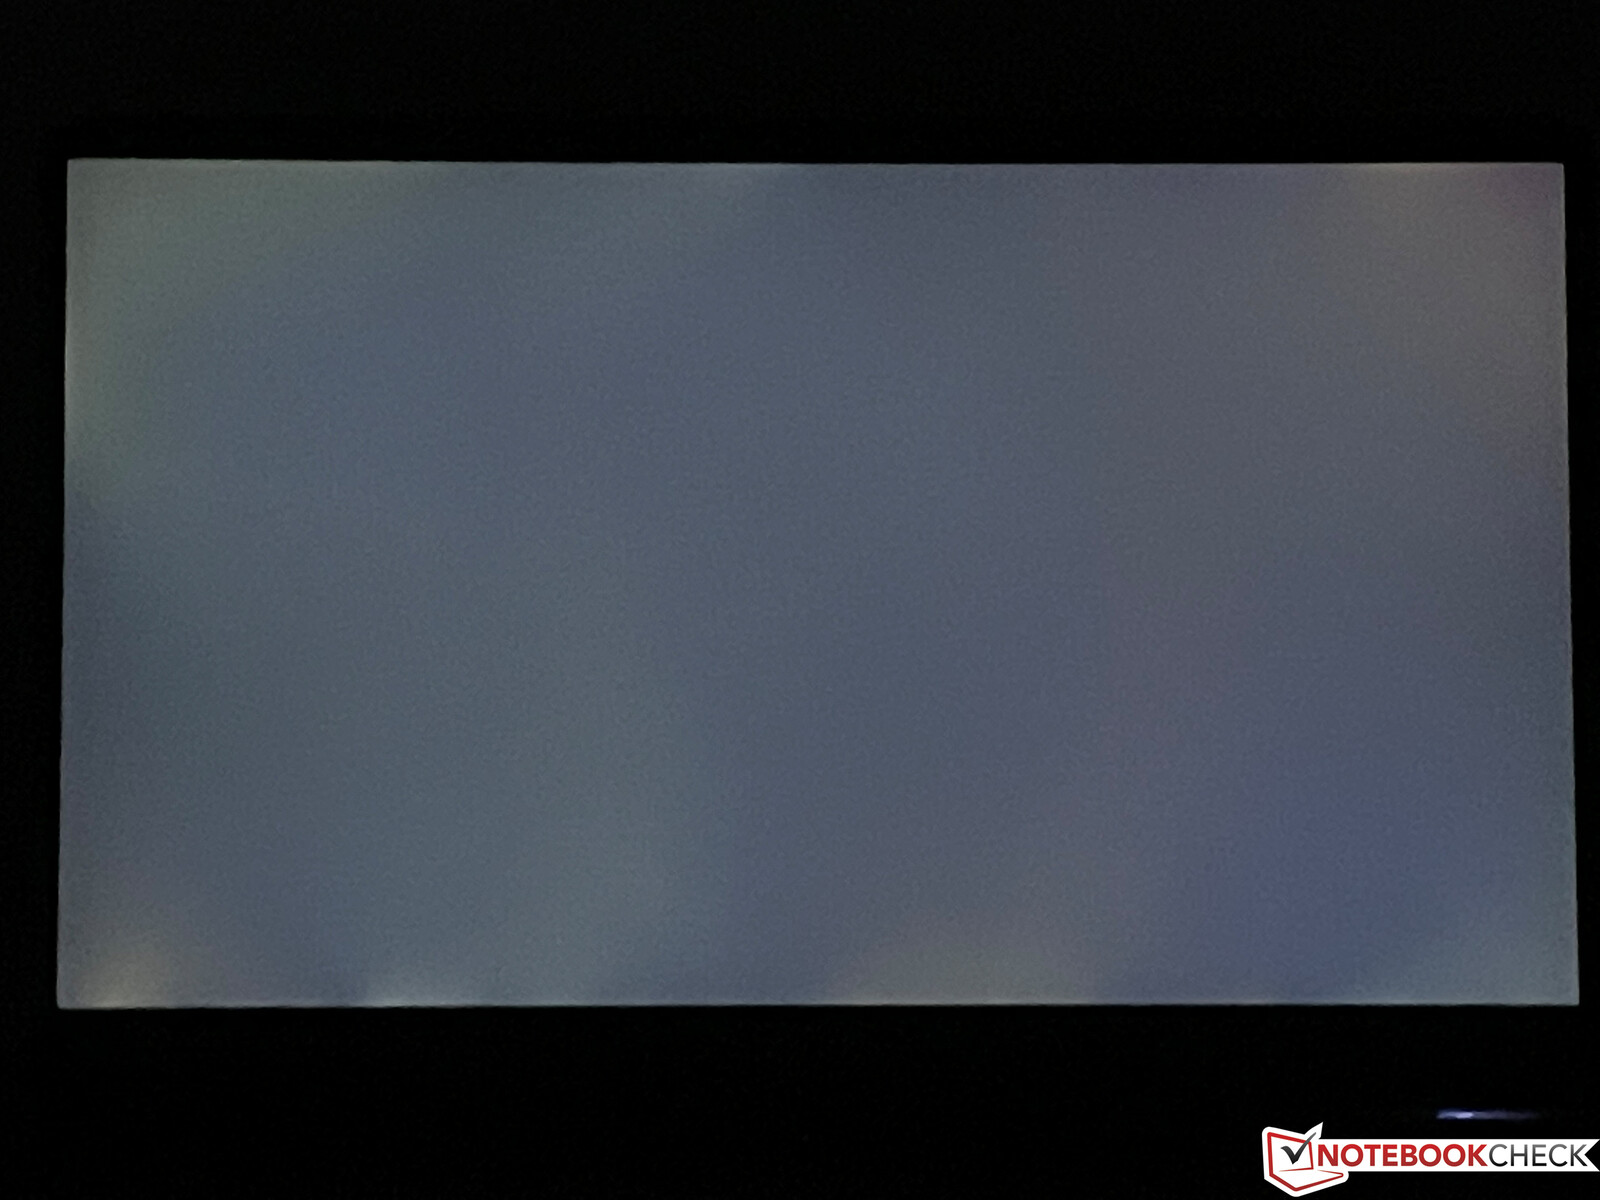
PWM kullanılmaz ve tepki süreleri çok hızlıdır, bu da gölgelenme etkisinin olmadığı anlamına gelir. Maksimum parlaklıkta, koyu bir arka plan kullanırken kenarlarda hafif ekran kanaması fark edebilirsiniz, ancak bu pratikte fark edilmez.
| |||||||||||||||||||||||||
Aydınlatma: 93 %
Batarya modunda parlaklık: 420 cd/m²
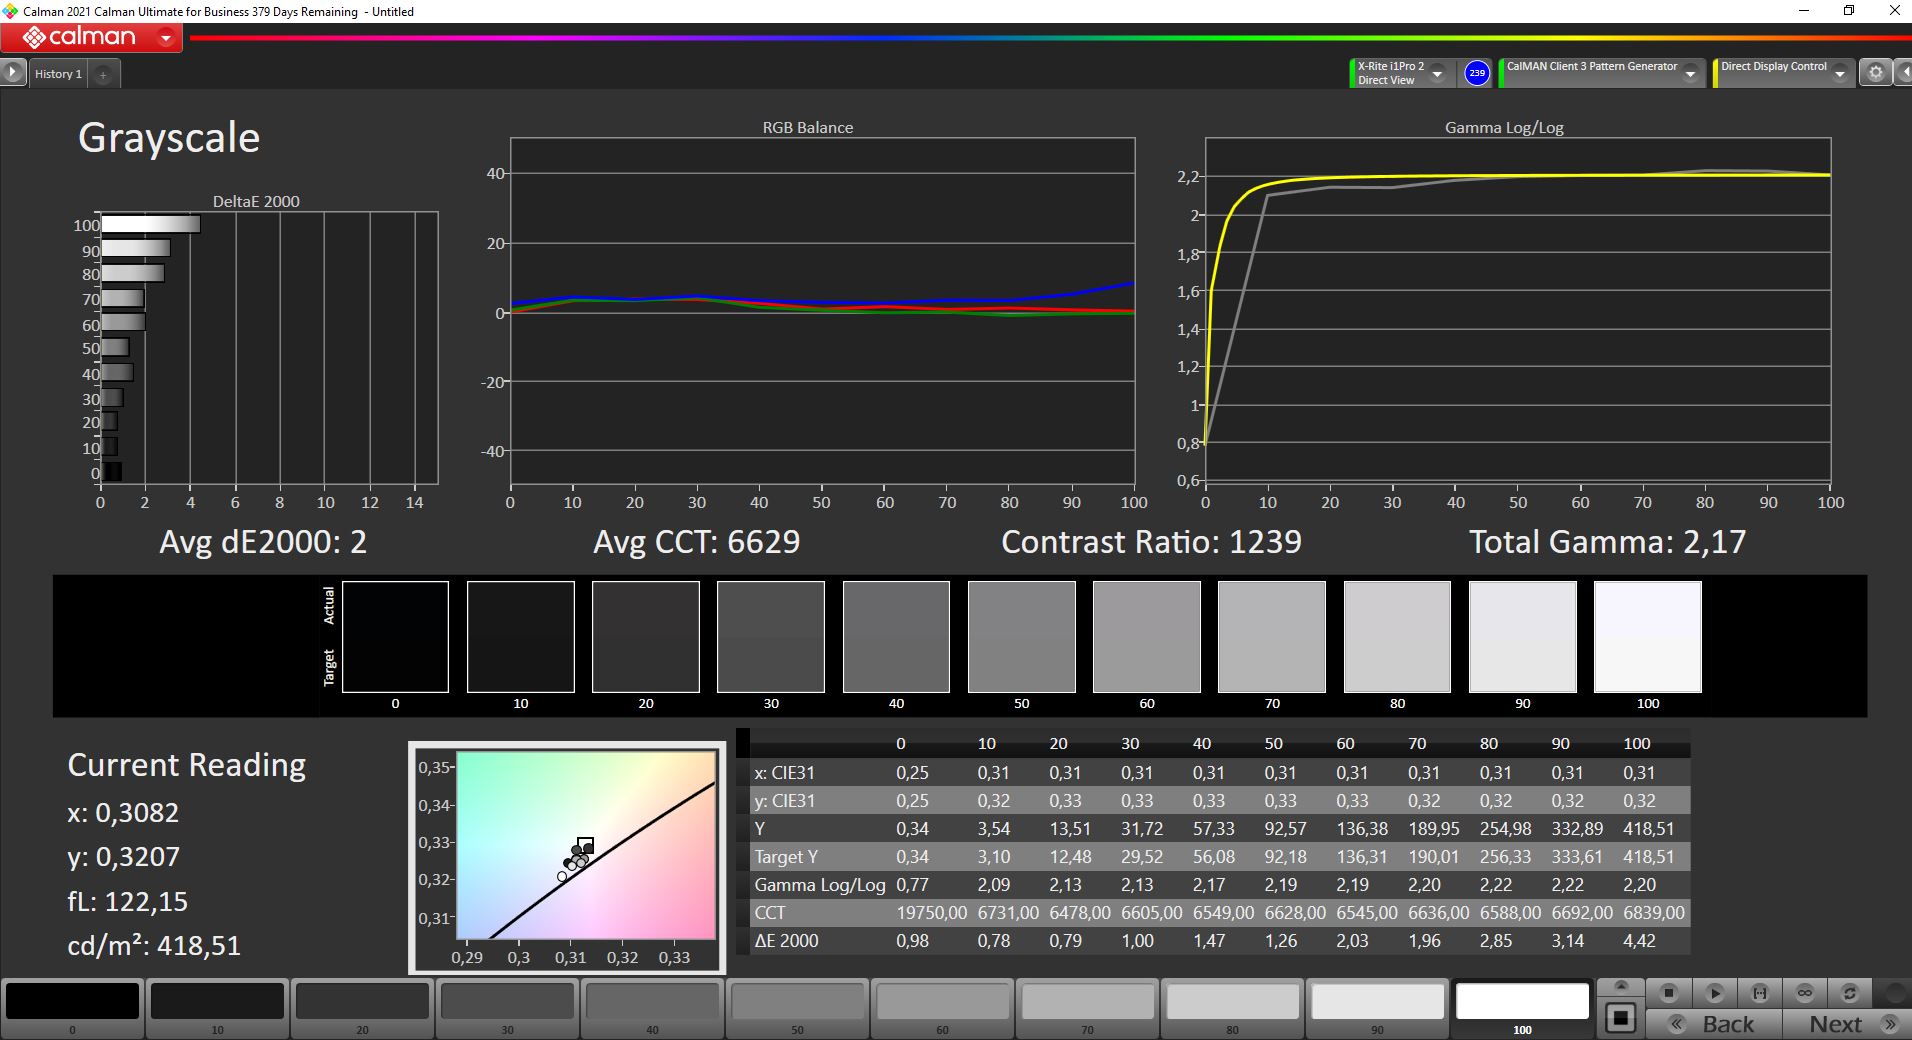
Kontrast: 1232:1 (Siyah: 0.34 cd/m²)
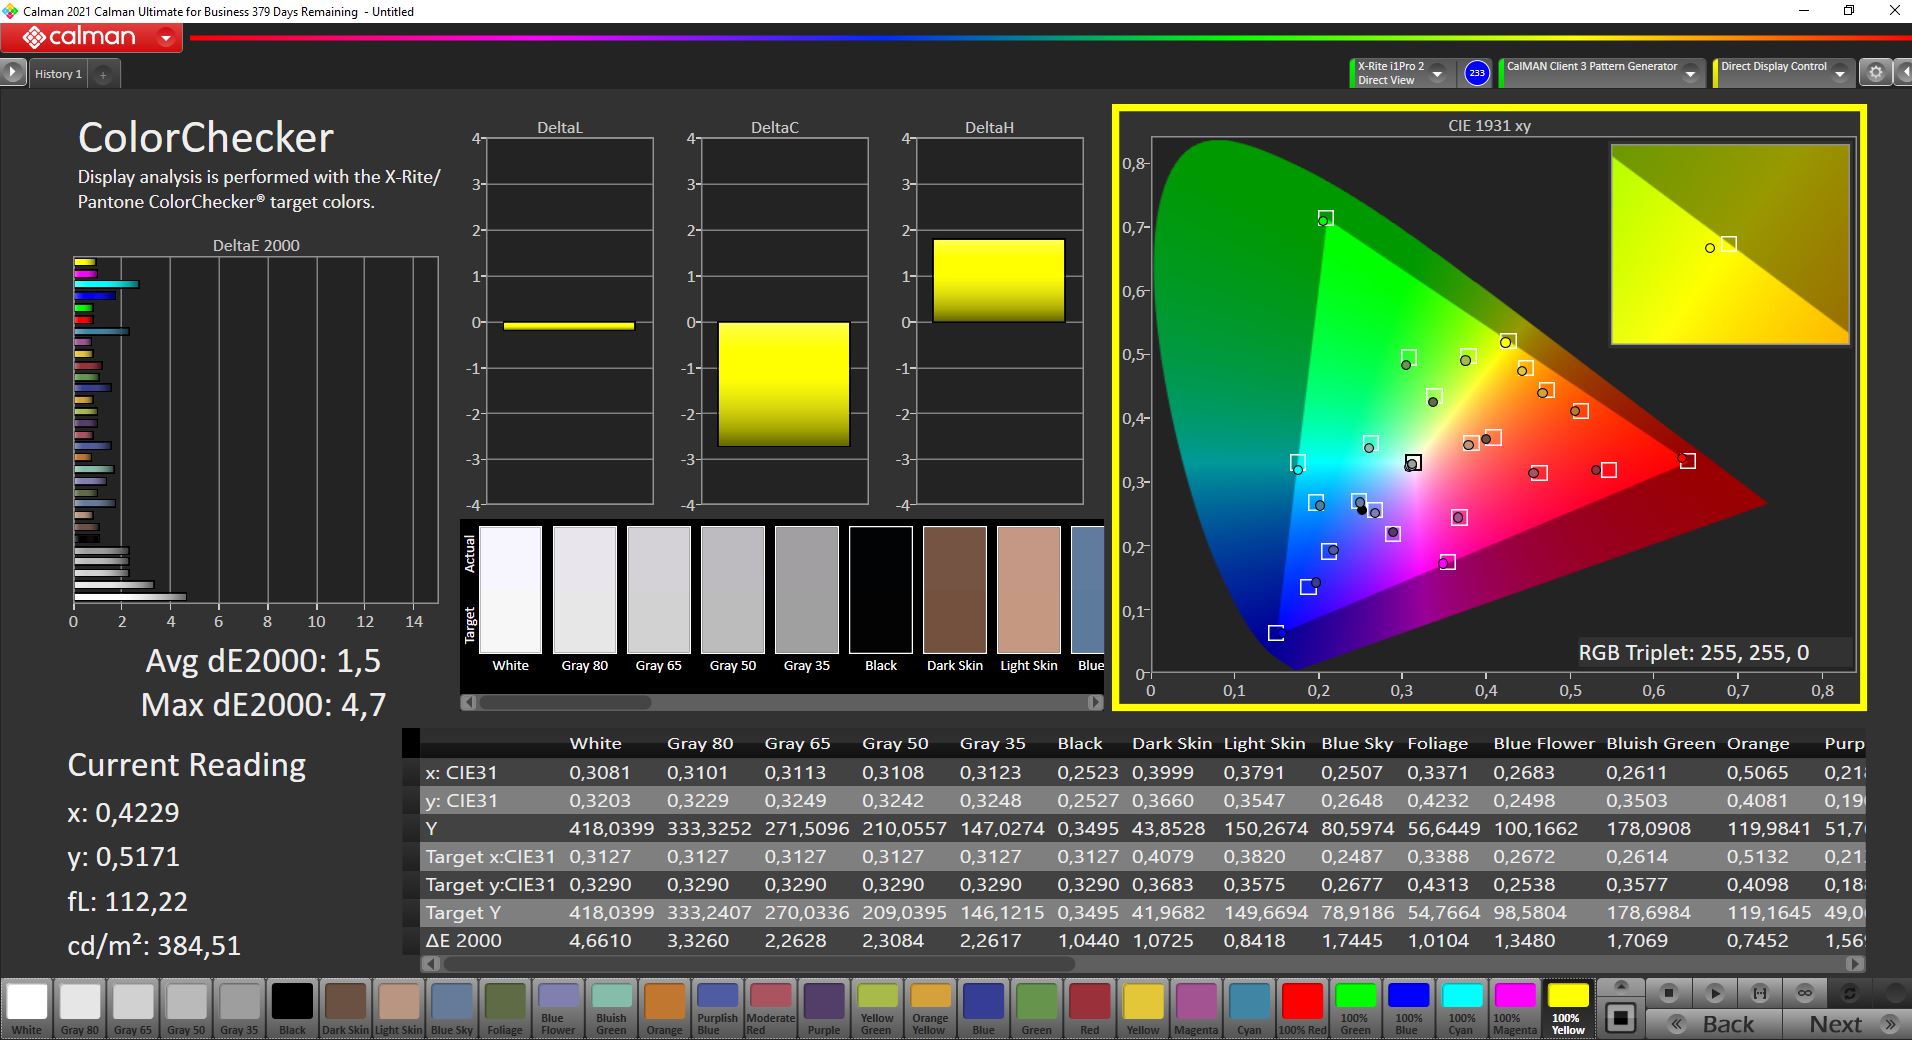
ΔE ColorChecker Calman: 1.5 | ∀{0.5-29.43 Ø4.72}
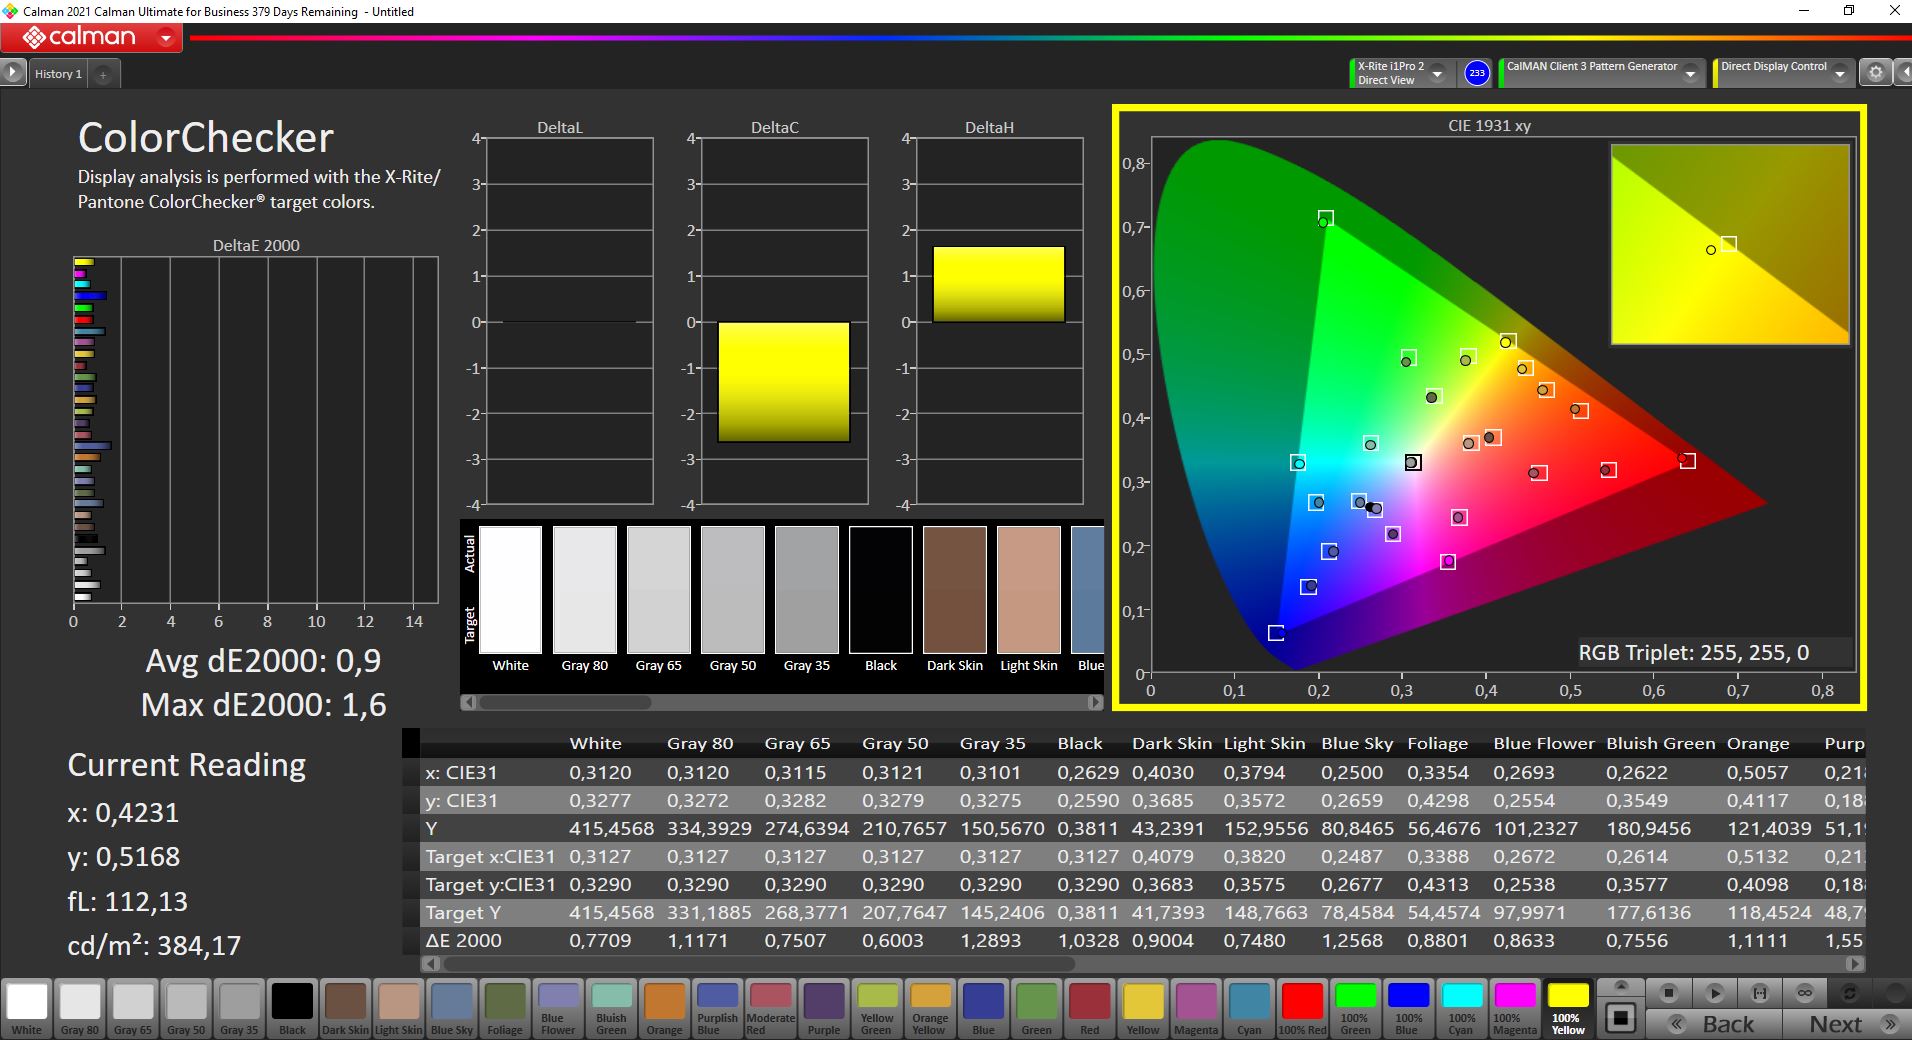
calibrated: 0.9
ΔE Greyscale Calman: 2 | ∀{0.09-98 Ø4.97}
96% AdobeRGB 1998 (Argyll 3D)
99.3% sRGB (Argyll 3D)
82.1% Display P3 (Argyll 3D)
Gamma: 2.17
CCT: 6629 K
| MSI WE76 11UM-456 B173ZAN03.3, IPS, 3840x2160, 17.3" | Lenovo ThinkPad P1 G4-20Y4S0KS00 LP160UQ1-SPB1, IPS LED, 3840x2400, 16" | HP ZBook Fury 15 G8 BOE0969, IPS, 3840x2160, 15.6" | Asus ProArt StudioBook 16 W7600H5A-2BL2 ATNA60YV02-0, OLED, 3840x2400, 16" | Lenovo ThinkPad P17 G2-20YU0025G LP173WF4-SPF7, IPS LED, 1920x1080, 17.3" | HP ZBook Fury 17 G7 119W5EA AUOCD8C, , 3840x2160, 17.3" | MSI WE75 9TK AU Optronics B173HAN04.2, IPS, 1920x1080, 17.3" | |
|---|---|---|---|---|---|---|---|
| Display | 2% | 3% | 9% | -21% | 4% | -22% | |
| Display P3 Coverage (%) | 82.1 | 85.7 4% | 95.9 17% | 99.9 22% | 67.9 -17% | 99.3 21% | 63.2 -23% |
| sRGB Coverage (%) | 99.3 | 99.4 0% | 100 1% | 100 1% | 87.3 -12% | 99.9 1% | 89.9 -9% |
| AdobeRGB 1998 Coverage (%) | 96 | 98.9 3% | 87.3 -9% | 98.6 3% | 63.9 -33% | 86.9 -9% | 64.3 -33% |
| Response Times | -202% | 7% | 85% | -115% | -244% | -132% | |
| Response Time Grey 50% / Grey 80% * (ms) | 17.6 ? | 55.2 ? -214% | 14.8 ? 16% | 2 ? 89% | 39.2 ? -123% | 56 ? -218% | 30.8 ? -75% |
| Response Time Black / White * (ms) | 10.8 ? | 31.2 ? -189% | 11 ? -2% | 2 ? 81% | 22.4 ? -107% | 40 ? -270% | 31.2 ? -189% |
| PWM Frequency (Hz) | 240 ? | ||||||
| Screen | 0% | -59% | -39% | -101% | 5% | -50% | |
| Brightness middle (cd/m²) | 419 | 630 50% | 626 49% | 353 -16% | 361 -14% | 573 37% | 287.3 -31% |
| Brightness (cd/m²) | 416 | 622 50% | 589 42% | 360 -13% | 334 -20% | 586 41% | 280 -33% |
| Brightness Distribution (%) | 93 | 90 -3% | 87 -6% | 96 3% | 87 -6% | 91 -2% | 89 -4% |
| Black Level * (cd/m²) | 0.34 | 0.41 -21% | 0.58 -71% | 0.35 -3% | 0.38 -12% | 0.26 24% | |
| Contrast (:1) | 1232 | 1537 25% | 1079 -12% | 1031 -16% | 1508 22% | 1105 -10% | |
| Colorchecker dE 2000 * | 1.5 | 2.2 -47% | 5.41 -261% | 2.45 -63% | 5.4 -260% | 1.9 -27% | 2.98 -99% |
| Colorchecker dE 2000 max. * | 4.7 | 5 -6% | 9.05 -93% | 3.75 20% | 9.9 -111% | 4.2 11% | 5.08 -8% |
| Colorchecker dE 2000 calibrated * | 0.9 | 1 -11% | 0.6 33% | 2.77 -208% | 3.2 -256% | 0.7 22% | 3.06 -240% |
| Greyscale dE 2000 * | 2 | 2.7 -35% | 6.2 -210% | 1.88 6% | 6.5 -225% | 2.9 -45% | 3 -50% |
| Gamma | 2.17 101% | 2.26 97% | 2.66 83% | 2.31 95% | 2.23 99% | 2.1 105% | 2.28 96% |
| CCT | 6629 98% | 6886 94% | 6101 107% | 6441 101% | 7351 88% | 6217 105% | 6993 93% |
| Color Space (Percent of AdobeRGB 1998) (%) | 77.6 | 58.1 | |||||
| Color Space (Percent of sRGB) (%) | 100 | 89.5 | |||||
| Toplam Ortalama (Program / Ayarlar) | -67% /
-28% | -16% /
-36% | 18% /
-6% | -79% /
-86% | -78% /
-31% | -68% /
-56% |
* ... daha küçük daha iyidir
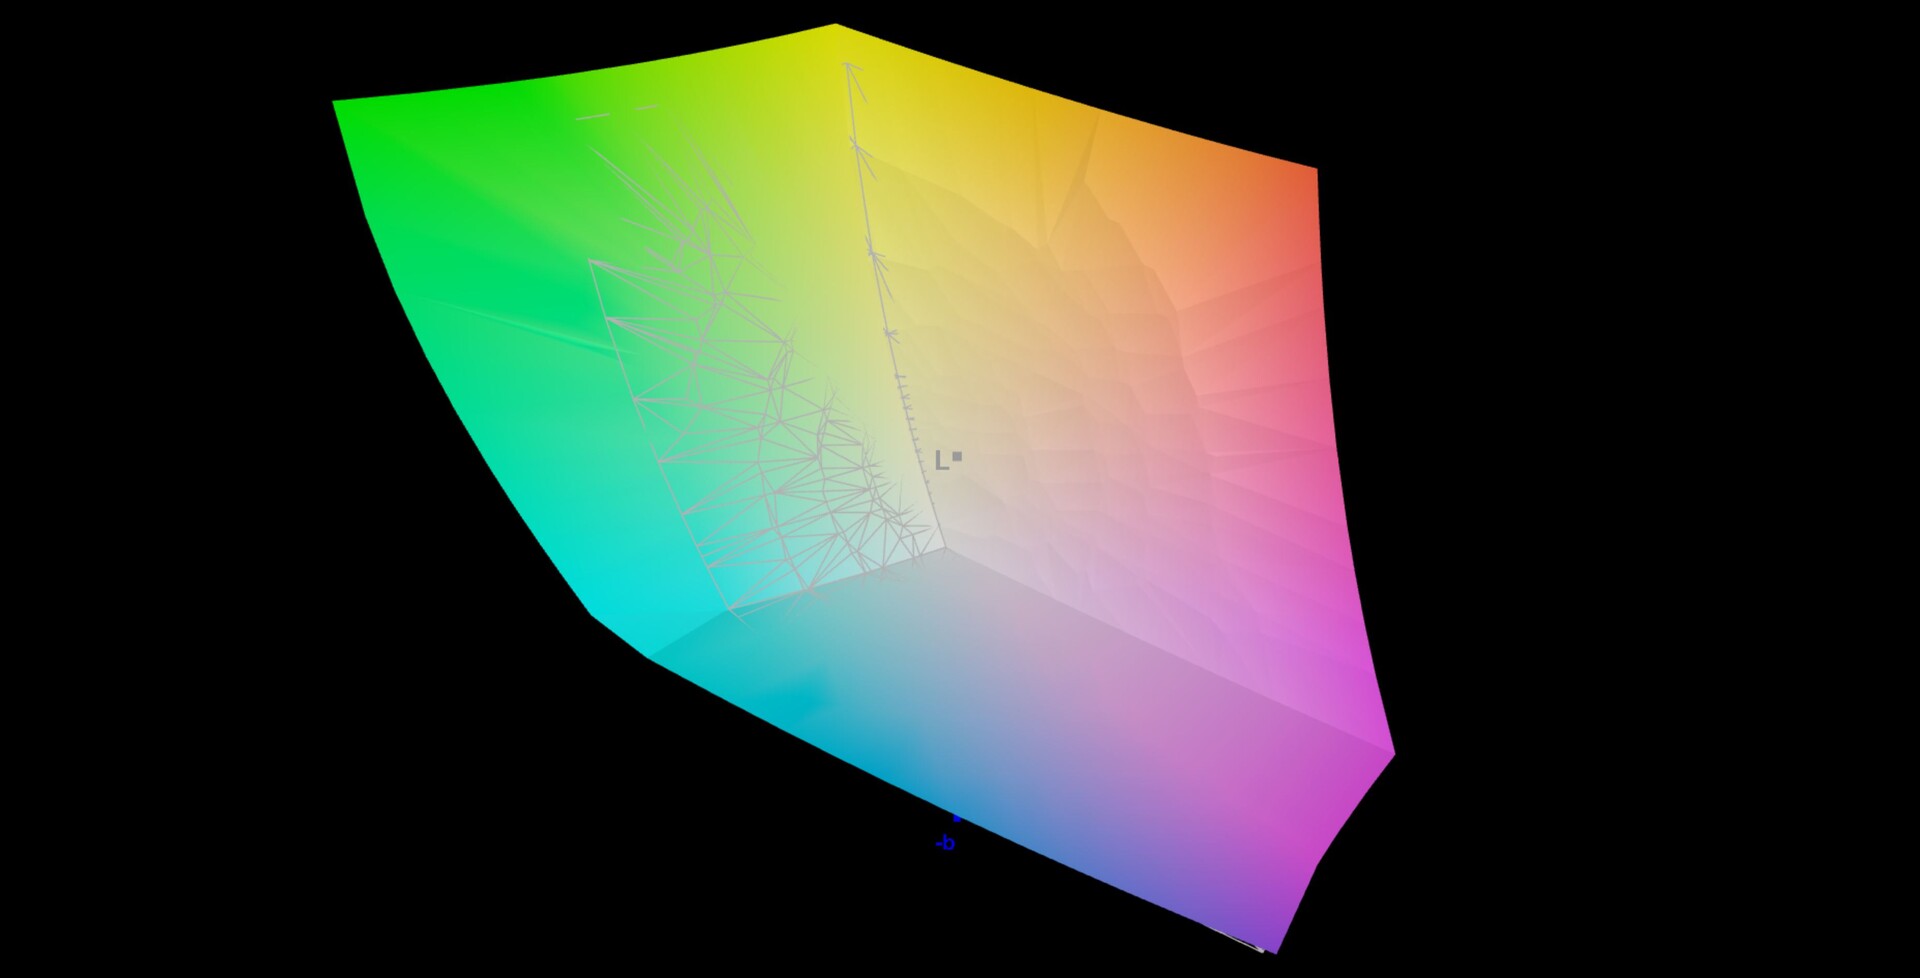
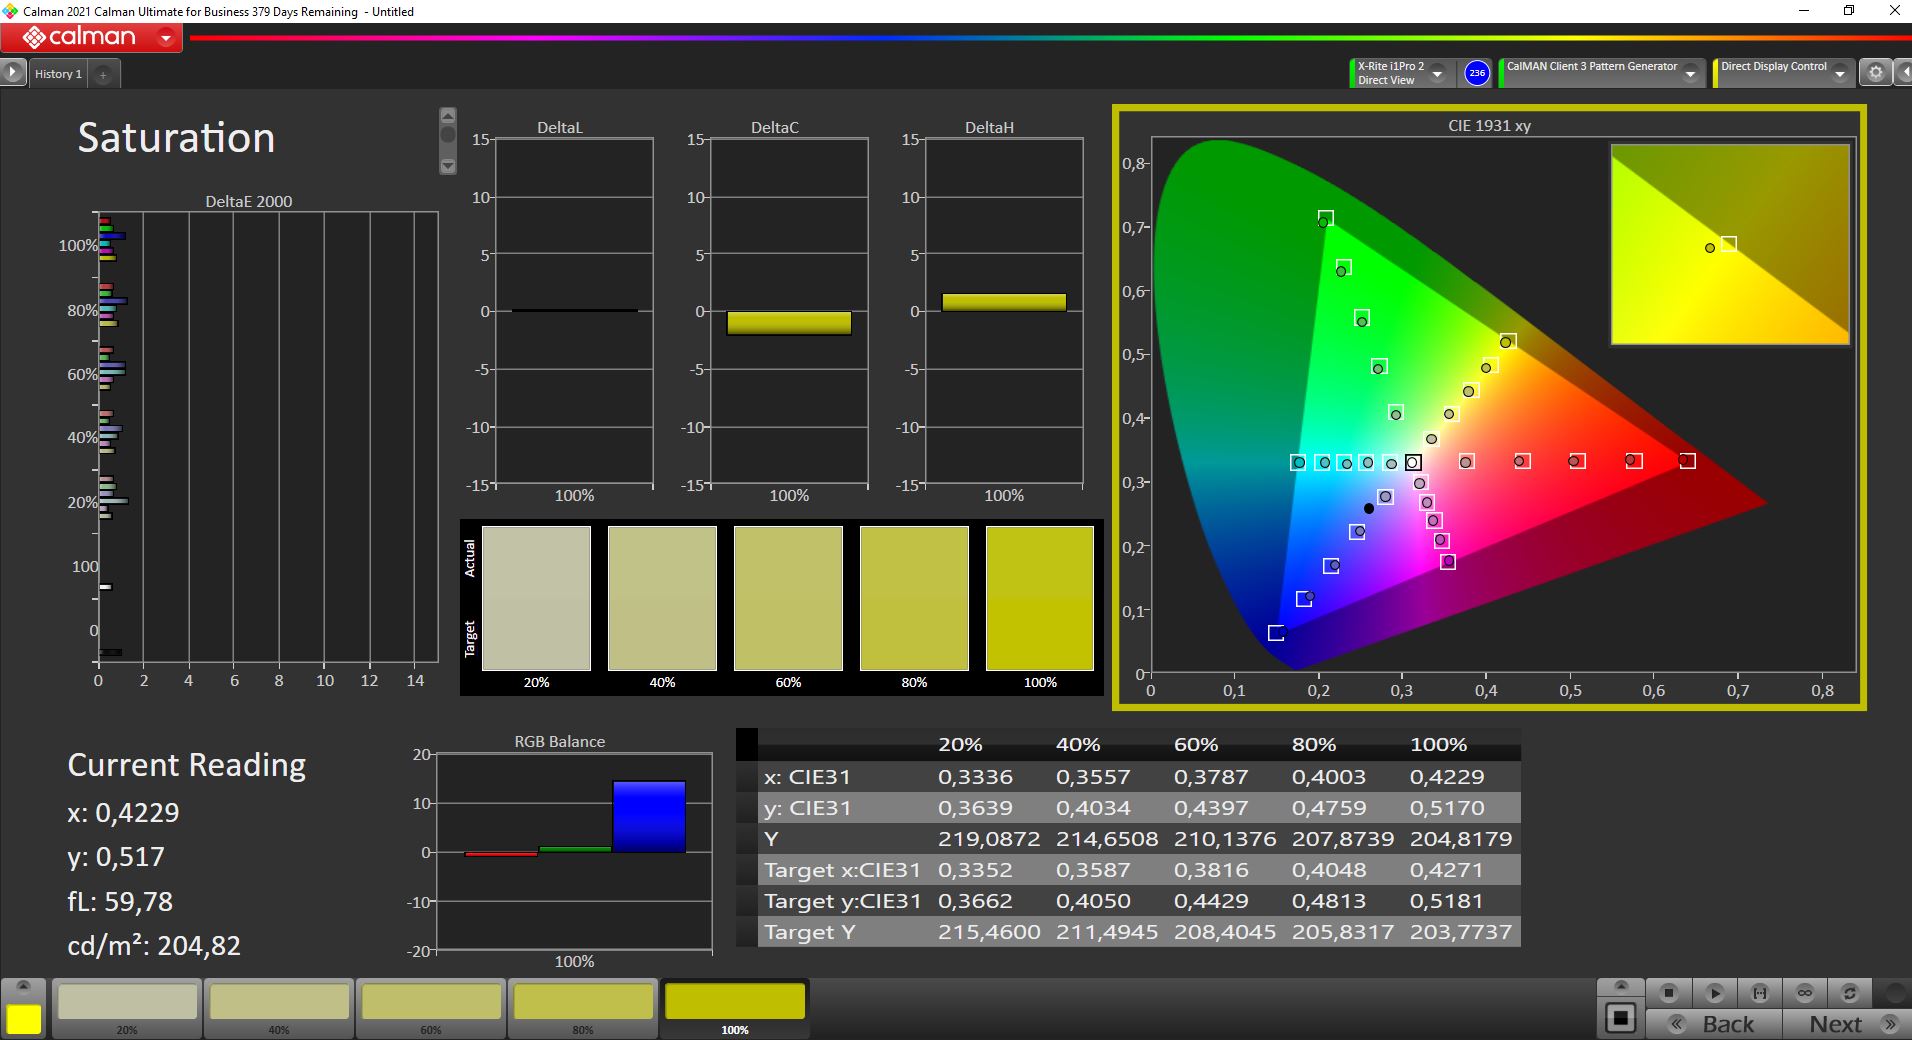
Üreticiye göre, 4K ekran AdobeRGB renk alanını bütünüyle kapsıyor; %96'lık bir oran ölçtük. MSI, renk alanını değiştirmek için kullanılabilecek TrueColor yazılımını kurdu. Varsayılan AdobeRGB modunu kullandık.
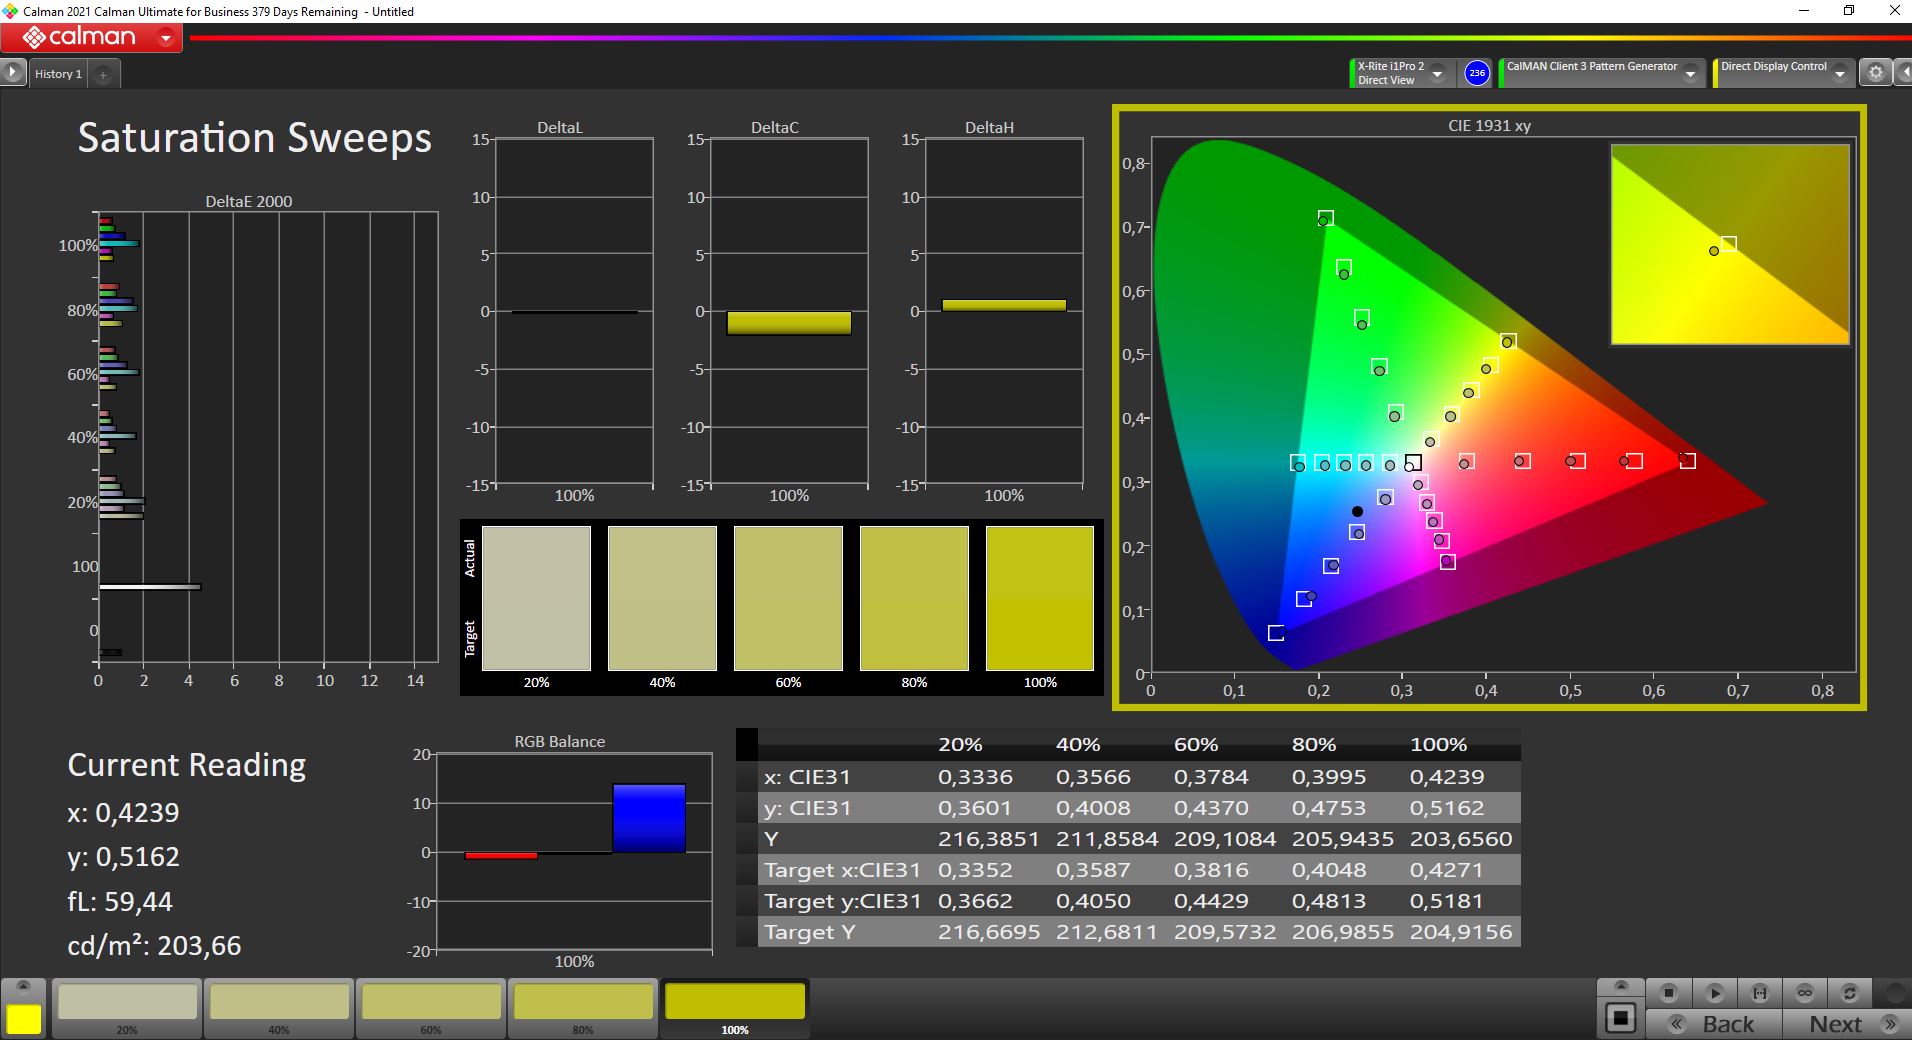
Analizimiz (CalMAN ve X-Rite i1 Pro 2), tüm renklerin kutudan çıkar çıkmaz bile 3'lük önemli sapmanın altında olduğunu gösteriyor. Ancak, kalibrasyonumuzla gri tonlamalı çoğaltmayı yine de biraz iyileştirebildik (ilgili profil yukarıda indirilebilir). Bu nedenle, 4K panel, resimleri/videoları sorunsuz bir şekilde düzenlemek için uygundur, ancak HDR içeriği desteklenmez.

Yanıt Sürelerini Görüntüle
| ↔ Tepki Süresi Siyahtan Beyaza | ||
|---|---|---|
| 10.8 ms ... yükseliş ↗ ve sonbahar↘ birleşimi | ↗ 5.6 ms yükseliş | 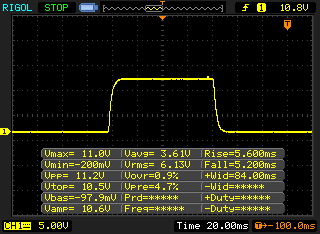 |
| ↘ 5.2 ms sonbahar | ||
| Ekran, testlerimizde iyi yanıt oranları gösteriyor ancak rekabetçi oyuncular için çok yavaş olabilir. Karşılaştırıldığında, test edilen tüm cihazlar 0.1 (minimum) ile 240 (maksimum) ms arasında değişir. » Tüm cihazların 29 %'si daha iyi. Bu, ölçülen yanıt süresinin test edilen tüm cihazların ortalamasından (19.8 ms) daha iyi olduğu anlamına gelir. | ||
| ↔ Tepki Süresi %50 Griden %80 Griye | ||
| 17.6 ms ... yükseliş ↗ ve sonbahar↘ birleşimi | ↗ 8.4 ms yükseliş | 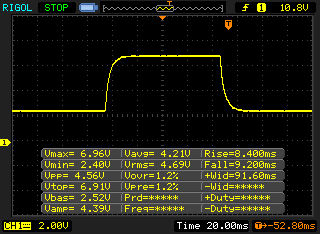 |
| ↘ 9.2 ms sonbahar | ||
| Ekran, testlerimizde iyi yanıt oranları gösteriyor ancak rekabetçi oyuncular için çok yavaş olabilir. Karşılaştırıldığında, test edilen tüm cihazlar 0.165 (minimum) ile 636 (maksimum) ms arasında değişir. » Tüm cihazların 32 %'si daha iyi. Bu, ölçülen yanıt süresinin test edilen tüm cihazların ortalamasından (31 ms) daha iyi olduğu anlamına gelir. | ||
Ekran Titremesi / PWM (Darbe Genişliği Modülasyonu)
| Ekran titriyor / PWM algılanmadı | 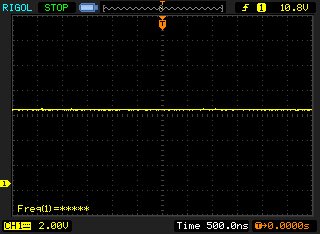 | ||
Karşılaştırıldığında: Test edilen tüm cihazların %52 %'si ekranı karartmak için PWM kullanmıyor. PWM tespit edilirse, ortalama 7747 (minimum: 5 - maksimum: 343500) Hz ölçüldü. | |||
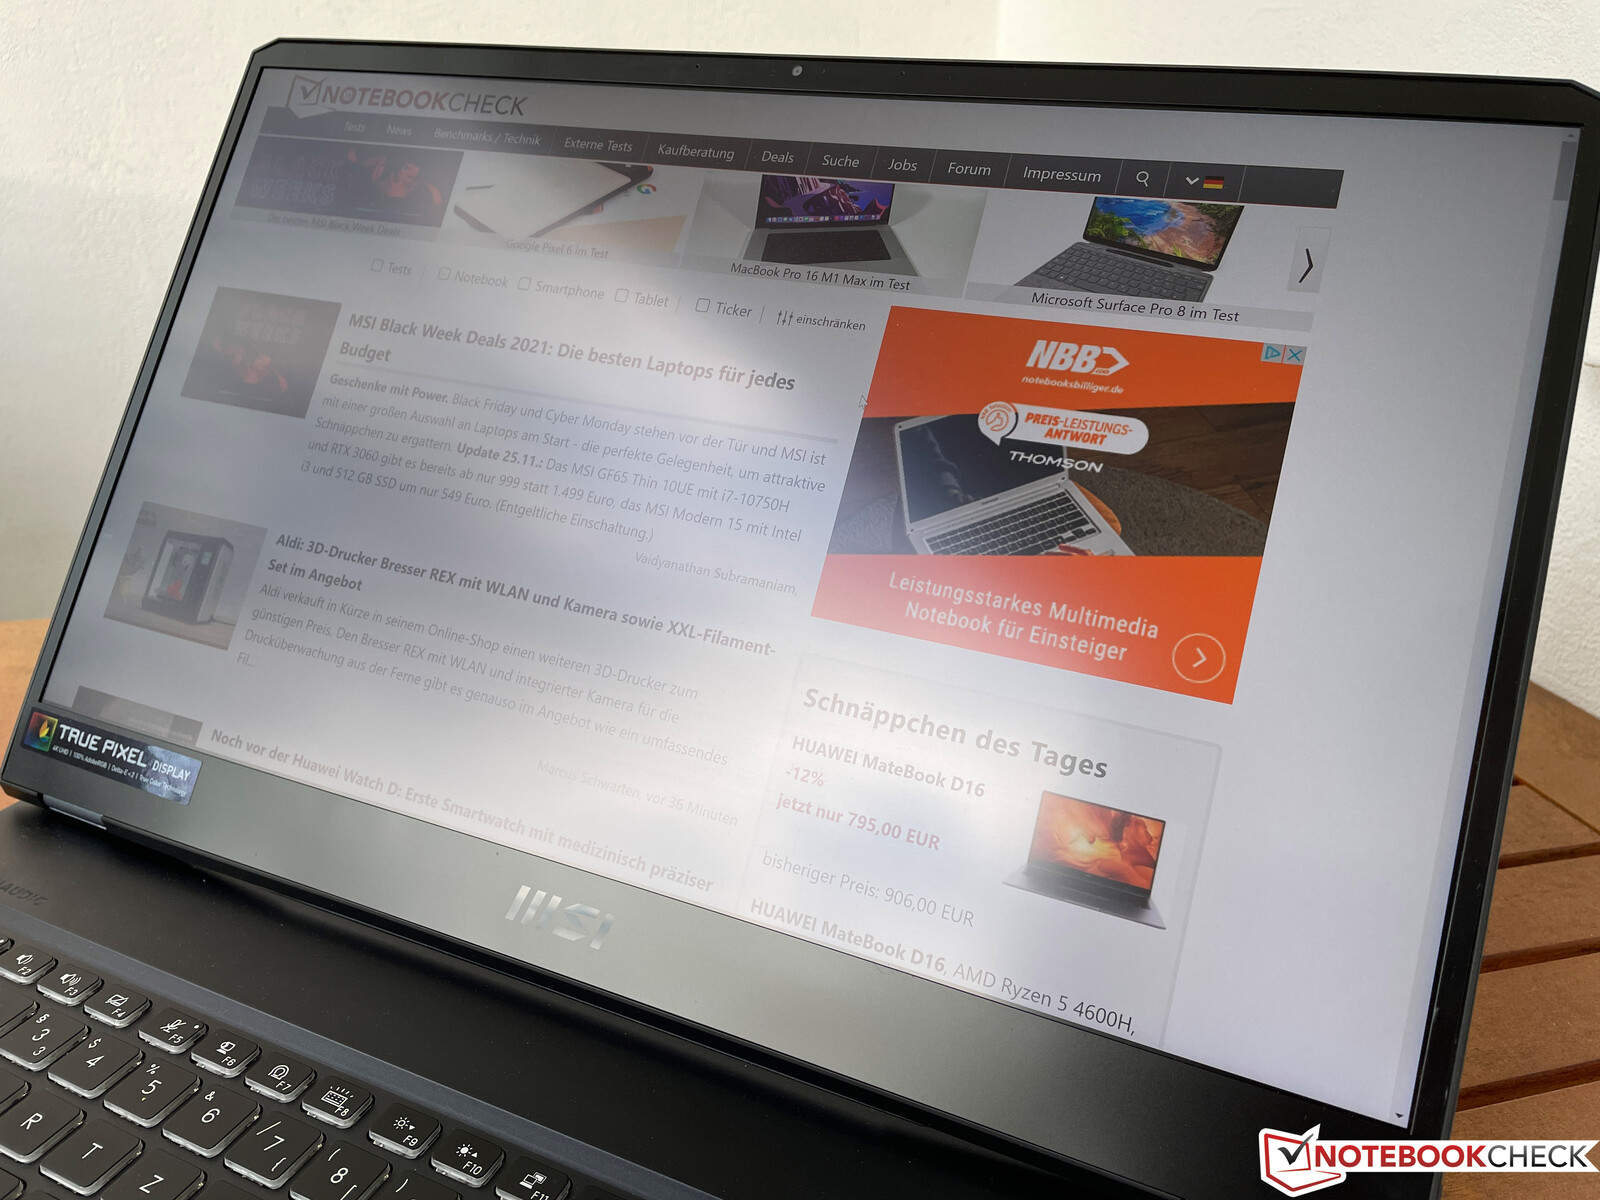
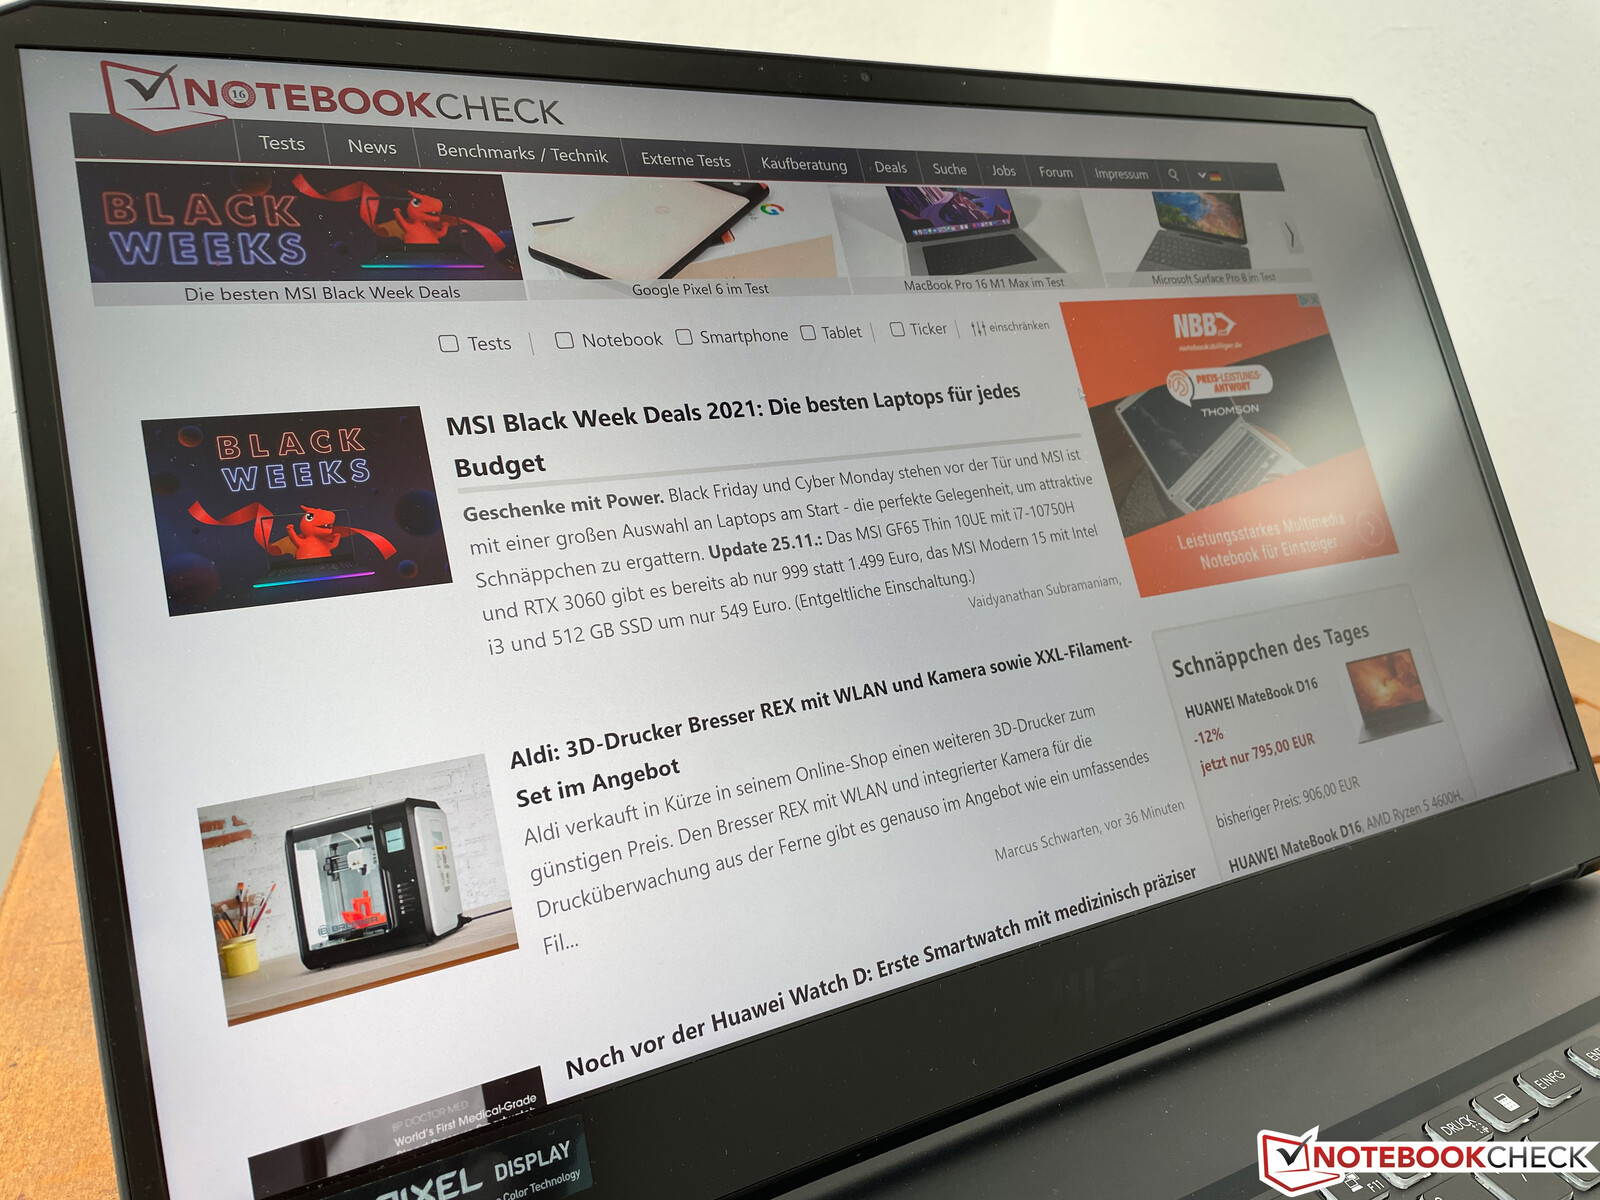
WE76 kesinlikle hareket halindeyken kullanılacak bir cihaz değil, ancak panelin mat yüzeyi doğal olarak açık havada faydalıdır ve en azından bulutlu günlerde kullanmak çok rahat. IPS ekranın görüş açısı kararlılığı eleştiriye yer bırakmıyor.
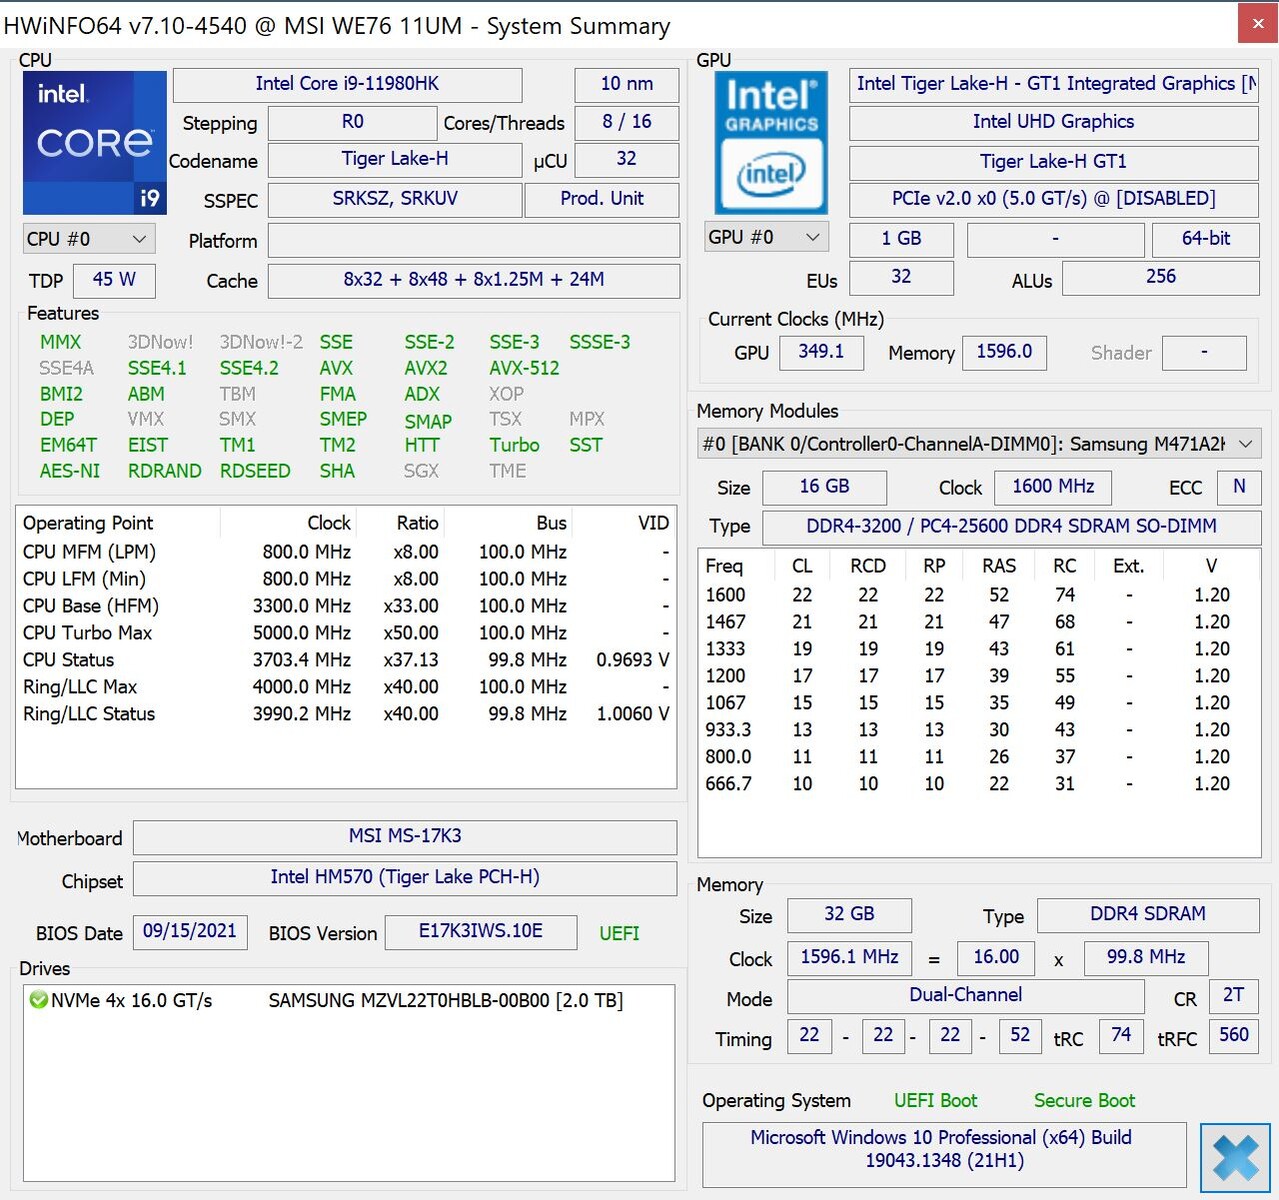
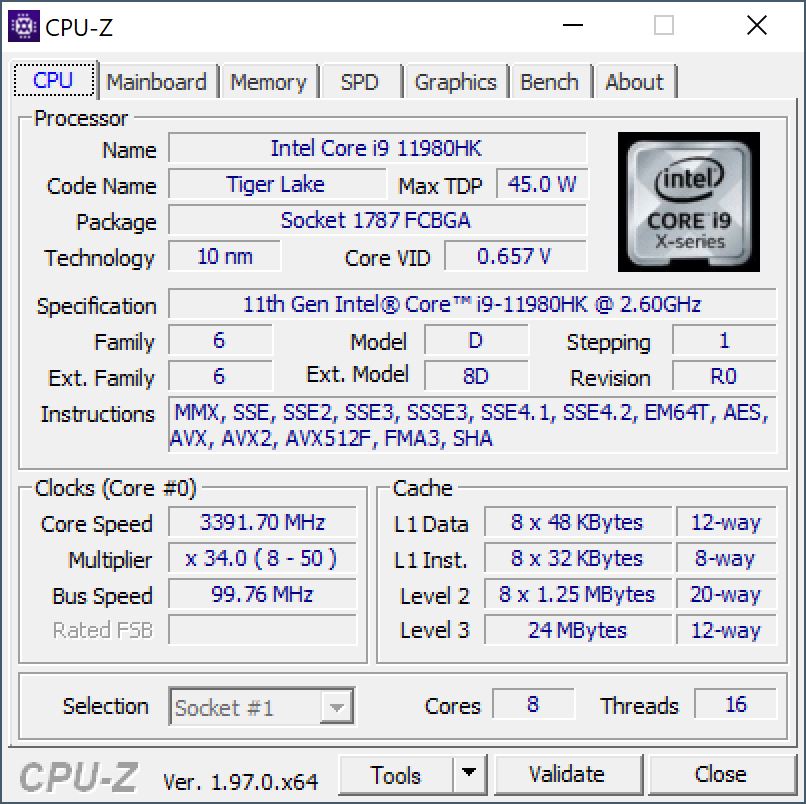
Performans - Core i9 ve RTX A5000 ile WE76
Test koşulları
Normal Windows ayarlarına ek olarak MSI, önceden yüklenmiş MSI Center Pro ile farklı performans ayarları sunar. Dengeli ön ayarı kullanarak aşağıdaki testleri yaptık, ancak bazı yönlerden diğer performans modlarının etkilerine de göz atacağız. Yüksek Performans modu öncelikle stres testindeki, yani hem işlemciyi hem de ekran kartını vurguladığınızda performansı etkiler.
İşlemci
MSI, testlerimizde çok iyi performans gösteren ve genellikle kendisini karşılaştırma alanının en üstüne yerleştirebilen Intel Core i9-11980HK işlemciyi tercih etti. İşlemci maksimum 84 watt tüketebilir, ancak 70 watt'ta ve daha sonra ~ 62 watt'ta hızla dengelenir. Bu, ThinkPad P17 Gen 2'de gördüğümüz gibi normal bir Core i7-11800H ile de mümkün olabilir. Bununla birlikte, Ryzen 9 5900HX, karşılaştırılabilir bir TDP yapılandırması altında biraz daha hızlıdır (Asus ROG Zephyrus Duo 15 durumunda ~ 64 watt).
TDP hızla sadece 45 watt'a ve ardından 35 watt'a düştüğünden, işlemci performansı pil gücünde gözle görülür şekilde azalır. Dolayısıyla tüm çekirdekleri kullanırken %30-40 civarında bir açık beklemelisiniz. Daha fazla karşılaştırma, İşlemci Karşılaştırmaları makalemizde mevcuttur.
Cinebench R15 Multi endurance test
Cinebench R23: Multi Core | Single Core
Cinebench R20: CPU (Multi Core) | CPU (Single Core)
Cinebench R15: CPU Multi 64Bit | CPU Single 64Bit
Blender: v2.79 BMW27 CPU
7-Zip 18.03: 7z b 4 | 7z b 4 -mmt1
Geekbench 5.5: Multi-Core | Single-Core
HWBOT x265 Benchmark v2.2: 4k Preset
LibreOffice : 20 Documents To PDF
R Benchmark 2.5: Overall mean
| CPU Performance rating | |
| Sınıf ortalaması Workstation | |
| MSI WE76 11UM-456 -1! | |
| Lenovo ThinkPad P1 G4-20Y4S0KS00 | |
| Ortalama Intel Core i9-11980HK | |
| Asus ProArt StudioBook 16 W7600H5A-2BL2 | |
| Lenovo ThinkPad P17 G2-20YU0025G | |
| HP ZBook Fury 15 G8 -2! | |
| MSI WE75 9TK -10! | |
| HP ZBook Fury 17 G7 119W5EA | |
| Cinebench R23 / Multi Core | |
| Sınıf ortalaması Workstation (14621 - 38520, n=23, son 2 yıl) | |
| MSI WE76 11UM-456 | |
| Lenovo ThinkPad P17 G2-20YU0025G | |
| HP ZBook Fury 15 G8 | |
| Lenovo ThinkPad P1 G4-20Y4S0KS00 | |
| Ortalama Intel Core i9-11980HK (8459 - 13387, n=2) | |
| Asus ProArt StudioBook 16 W7600H5A-2BL2 | |
| HP ZBook Fury 17 G7 119W5EA | |
| Cinebench R23 / Single Core | |
| Sınıf ortalaması Workstation (1712 - 2228, n=23, son 2 yıl) | |
| MSI WE76 11UM-456 | |
| HP ZBook Fury 15 G8 | |
| Ortalama Intel Core i9-11980HK (1505 - 1613, n=2) | |
| Lenovo ThinkPad P1 G4-20Y4S0KS00 | |
| Lenovo ThinkPad P17 G2-20YU0025G | |
| Asus ProArt StudioBook 16 W7600H5A-2BL2 | |
| HP ZBook Fury 17 G7 119W5EA | |
| Cinebench R20 / CPU (Multi Core) | |
| Sınıf ortalaması Workstation (5760 - 15043, n=23, son 2 yıl) | |
| Lenovo ThinkPad P17 G2-20YU0025G | |
| HP ZBook Fury 15 G8 | |
| Lenovo ThinkPad P1 G4-20Y4S0KS00 | |
| Ortalama Intel Core i9-11980HK (3779 - 5256, n=8) | |
| MSI WE76 11UM-456 | |
| Asus ProArt StudioBook 16 W7600H5A-2BL2 | |
| HP ZBook Fury 17 G7 119W5EA | |
| MSI WE75 9TK | |
| Cinebench R20 / CPU (Single Core) | |
| Sınıf ortalaması Workstation (671 - 857, n=23, son 2 yıl) | |
| MSI WE76 11UM-456 | |
| HP ZBook Fury 15 G8 | |
| Lenovo ThinkPad P1 G4-20Y4S0KS00 | |
| Ortalama Intel Core i9-11980HK (572 - 622, n=7) | |
| Lenovo ThinkPad P17 G2-20YU0025G | |
| Asus ProArt StudioBook 16 W7600H5A-2BL2 | |
| HP ZBook Fury 17 G7 119W5EA | |
| MSI WE75 9TK | |
| Cinebench R15 / CPU Multi 64Bit | |
| Sınıf ortalaması Workstation (2489 - 5810, n=23, son 2 yıl) | |
| MSI WE76 11UM-456 | |
| Lenovo ThinkPad P17 G2-20YU0025G | |
| Ortalama Intel Core i9-11980HK (1696 - 2287, n=7) | |
| Lenovo ThinkPad P1 G4-20Y4S0KS00 | |
| Asus ProArt StudioBook 16 W7600H5A-2BL2 | |
| HP ZBook Fury 15 G8 | |
| HP ZBook Fury 17 G7 119W5EA | |
| MSI WE75 9TK | |
| Cinebench R15 / CPU Single 64Bit | |
| Sınıf ortalaması Workstation (191.4 - 328, n=23, son 2 yıl) | |
| MSI WE76 11UM-456 | |
| HP ZBook Fury 15 G8 | |
| Lenovo ThinkPad P1 G4-20Y4S0KS00 | |
| Lenovo ThinkPad P17 G2-20YU0025G | |
| Ortalama Intel Core i9-11980HK (224 - 244, n=6) | |
| Asus ProArt StudioBook 16 W7600H5A-2BL2 | |
| HP ZBook Fury 17 G7 119W5EA | |
| MSI WE75 9TK | |
| Blender / v2.79 BMW27 CPU | |
| HP ZBook Fury 17 G7 119W5EA | |
| Asus ProArt StudioBook 16 W7600H5A-2BL2 | |
| HP ZBook Fury 15 G8 | |
| Lenovo ThinkPad P1 G4-20Y4S0KS00 | |
| Ortalama Intel Core i9-11980HK (231 - 284, n=4) | |
| Lenovo ThinkPad P17 G2-20YU0025G | |
| Sınıf ortalaması Workstation (91 - 222, n=23, son 2 yıl) | |
| 7-Zip 18.03 / 7z b 4 | |
| Sınıf ortalaması Workstation (60489 - 116969, n=23, son 2 yıl) | |
| MSI WE76 11UM-456 | |
| Ortalama Intel Core i9-11980HK (45226 - 56759, n=5) | |
| Lenovo ThinkPad P1 G4-20Y4S0KS00 | |
| HP ZBook Fury 15 G8 | |
| Lenovo ThinkPad P17 G2-20YU0025G | |
| Asus ProArt StudioBook 16 W7600H5A-2BL2 | |
| HP ZBook Fury 17 G7 119W5EA | |
| 7-Zip 18.03 / 7z b 4 -mmt1 | |
| Sınıf ortalaması Workstation (5126 - 6960, n=23, son 2 yıl) | |
| Lenovo ThinkPad P1 G4-20Y4S0KS00 | |
| HP ZBook Fury 15 G8 | |
| MSI WE76 11UM-456 | |
| Ortalama Intel Core i9-11980HK (5428 - 5735, n=5) | |
| HP ZBook Fury 17 G7 119W5EA | |
| Lenovo ThinkPad P17 G2-20YU0025G | |
| Asus ProArt StudioBook 16 W7600H5A-2BL2 | |
| Geekbench 5.5 / Multi-Core | |
| Sınıf ortalaması Workstation (11542 - 25554, n=23, son 2 yıl) | |
| MSI WE76 11UM-456 | |
| Ortalama Intel Core i9-11980HK (8786 - 10081, n=5) | |
| Lenovo ThinkPad P1 G4-20Y4S0KS00 | |
| Asus ProArt StudioBook 16 W7600H5A-2BL2 | |
| Lenovo ThinkPad P17 G2-20YU0025G | |
| HP ZBook Fury 17 G7 119W5EA | |
| Geekbench 5.5 / Single-Core | |
| Sınıf ortalaması Workstation (1783 - 2183, n=23, son 2 yıl) | |
| MSI WE76 11UM-456 | |
| Lenovo ThinkPad P1 G4-20Y4S0KS00 | |
| Ortalama Intel Core i9-11980HK (1561 - 1679, n=5) | |
| Lenovo ThinkPad P17 G2-20YU0025G | |
| Asus ProArt StudioBook 16 W7600H5A-2BL2 | |
| HP ZBook Fury 17 G7 119W5EA | |
| HWBOT x265 Benchmark v2.2 / 4k Preset | |
| Sınıf ortalaması Workstation (17.8 - 40.5, n=23, son 2 yıl) | |
| MSI WE76 11UM-456 | |
| Ortalama Intel Core i9-11980HK (13.1 - 16.3, n=5) | |
| Lenovo ThinkPad P17 G2-20YU0025G | |
| Lenovo ThinkPad P1 G4-20Y4S0KS00 | |
| HP ZBook Fury 15 G8 | |
| Asus ProArt StudioBook 16 W7600H5A-2BL2 | |
| HP ZBook Fury 17 G7 119W5EA | |
| LibreOffice / 20 Documents To PDF | |
| HP ZBook Fury 17 G7 119W5EA | |
| HP ZBook Fury 15 G8 | |
| Lenovo ThinkPad P17 G2-20YU0025G | |
| Sınıf ortalaması Workstation (37.1 - 74.7, n=23, son 2 yıl) | |
| MSI WE76 11UM-456 | |
| Lenovo ThinkPad P1 G4-20Y4S0KS00 | |
| Ortalama Intel Core i9-11980HK (40.6 - 47.7, n=5) | |
| Asus ProArt StudioBook 16 W7600H5A-2BL2 | |
| R Benchmark 2.5 / Overall mean | |
| HP ZBook Fury 17 G7 119W5EA | |
| Asus ProArt StudioBook 16 W7600H5A-2BL2 | |
| Lenovo ThinkPad P17 G2-20YU0025G | |
| Ortalama Intel Core i9-11980HK (0.545 - 0.565, n=5) | |
| MSI WE76 11UM-456 | |
| HP ZBook Fury 15 G8 | |
| Lenovo ThinkPad P1 G4-20Y4S0KS00 | |
| Sınıf ortalaması Workstation (0.3825 - 0.603, n=23, son 2 yıl) | |
* ... daha küçük daha iyidir
AIDA64: FP32 Ray-Trace | FPU Julia | CPU SHA3 | CPU Queen | FPU SinJulia | FPU Mandel | CPU AES | CPU ZLib | FP64 Ray-Trace | CPU PhotoWorxx
| Performance rating | |
| Sınıf ortalaması Workstation | |
| MSI WE76 11UM-456 | |
| Ortalama Intel Core i9-11980HK | |
| HP ZBook Fury 15 G8 | |
| HP ZBook Fury 17 G7 119W5EA | |
| Lenovo ThinkPad P1 G4-20Y4S0KS00 -9! | |
| Asus ProArt StudioBook 16 W7600H5A-2BL2 -9! | |
| Lenovo ThinkPad P17 G2-20YU0025G -9! | |
| AIDA64 / FP32 Ray-Trace | |
| Sınıf ortalaması Workstation (16730 - 61611, n=23, son 2 yıl) | |
| MSI WE76 11UM-456 | |
| Ortalama Intel Core i9-11980HK (14180 - 15661, n=2) | |
| HP ZBook Fury 15 G8 | |
| HP ZBook Fury 17 G7 119W5EA | |
| AIDA64 / FPU Julia | |
| Sınıf ortalaması Workstation (89597 - 186971, n=23, son 2 yıl) | |
| MSI WE76 11UM-456 | |
| Ortalama Intel Core i9-11980HK (59177 - 64043, n=2) | |
| HP ZBook Fury 15 G8 | |
| HP ZBook Fury 17 G7 119W5EA | |
| AIDA64 / CPU SHA3 | |
| Sınıf ortalaması Workstation (4178 - 8975, n=23, son 2 yıl) | |
| MSI WE76 11UM-456 | |
| Ortalama Intel Core i9-11980HK (3928 - 4220, n=2) | |
| HP ZBook Fury 15 G8 | |
| HP ZBook Fury 17 G7 119W5EA | |
| AIDA64 / CPU Queen | |
| Sınıf ortalaması Workstation (60778 - 144411, n=23, son 2 yıl) | |
| MSI WE76 11UM-456 | |
| Ortalama Intel Core i9-11980HK (97901 - 98443, n=2) | |
| HP ZBook Fury 15 G8 | |
| HP ZBook Fury 17 G7 119W5EA | |
| AIDA64 / FPU SinJulia | |
| Sınıf ortalaması Workstation (8165 - 29343, n=23, son 2 yıl) | |
| MSI WE76 11UM-456 | |
| Ortalama Intel Core i9-11980HK (10028 - 10494, n=2) | |
| HP ZBook Fury 17 G7 119W5EA | |
| HP ZBook Fury 15 G8 | |
| AIDA64 / FPU Mandel | |
| Sınıf ortalaması Workstation (44497 - 98153, n=23, son 2 yıl) | |
| MSI WE76 11UM-456 | |
| Ortalama Intel Core i9-11980HK (35500 - 38635, n=2) | |
| HP ZBook Fury 15 G8 | |
| HP ZBook Fury 17 G7 119W5EA | |
| AIDA64 / CPU AES | |
| Ortalama Intel Core i9-11980HK (90742 - 141352, n=2) | |
| Sınıf ortalaması Workstation (73133 - 187841, n=23, son 2 yıl) | |
| MSI WE76 11UM-456 | |
| HP ZBook Fury 15 G8 | |
| HP ZBook Fury 17 G7 119W5EA | |
| AIDA64 / CPU ZLib | |
| Sınıf ortalaması Workstation (929 - 2148, n=23, son 2 yıl) | |
| MSI WE76 11UM-456 | |
| HP ZBook Fury 15 G8 | |
| HP ZBook Fury 17 G7 119W5EA | |
| Ortalama Intel Core i9-11980HK (769 - 839, n=5) | |
| Lenovo ThinkPad P17 G2-20YU0025G | |
| Asus ProArt StudioBook 16 W7600H5A-2BL2 | |
| Asus ProArt StudioBook 16 W7600H5A-2BL2 | |
| Lenovo ThinkPad P1 G4-20Y4S0KS00 | |
| AIDA64 / FP64 Ray-Trace | |
| Sınıf ortalaması Workstation (8545 - 32891, n=23, son 2 yıl) | |
| MSI WE76 11UM-456 | |
| Ortalama Intel Core i9-11980HK (7662 - 8566, n=2) | |
| HP ZBook Fury 15 G8 | |
| HP ZBook Fury 17 G7 119W5EA | |
| AIDA64 / CPU PhotoWorxx | |
| Sınıf ortalaması Workstation (37151 - 93684, n=23, son 2 yıl) | |
| HP ZBook Fury 15 G8 | |
| MSI WE76 11UM-456 | |
| Ortalama Intel Core i9-11980HK (23047 - 25908, n=2) | |
| HP ZBook Fury 17 G7 119W5EA | |
Sistem performansı
Beklendiği gibi, genel sistem performansı son derece yüksektir. Bu, hem performansın öznel izleniminden hem de kıyaslama sonuçlarından doğrulanabilir. Önümüzdeki yıllarda burada herhangi bir darboğaz olmayacak.
| PCMark 10 / Score | |
| Sınıf ortalaması Workstation (6563 - 10409, n=19, son 2 yıl) | |
| Lenovo ThinkPad P1 G4-20Y4S0KS00 | |
| MSI WE76 11UM-456 | |
| Ortalama Intel Core i9-11980HK, NVIDIA RTX A5000 Laptop GPU (n=1) | |
| Asus ProArt StudioBook 16 W7600H5A-2BL2 | |
| HP ZBook Fury 15 G8 | |
| Lenovo ThinkPad P17 G2-20YU0025G | |
| MSI WE75 9TK | |
| HP ZBook Fury 17 G7 119W5EA | |
| PCMark 10 / Essentials | |
| Lenovo ThinkPad P1 G4-20Y4S0KS00 | |
| Sınıf ortalaması Workstation (9622 - 11157, n=19, son 2 yıl) | |
| Asus ProArt StudioBook 16 W7600H5A-2BL2 | |
| Lenovo ThinkPad P17 G2-20YU0025G | |
| HP ZBook Fury 15 G8 | |
| MSI WE75 9TK | |
| MSI WE76 11UM-456 | |
| Ortalama Intel Core i9-11980HK, NVIDIA RTX A5000 Laptop GPU (n=1) | |
| HP ZBook Fury 17 G7 119W5EA | |
| PCMark 10 / Productivity | |
| Sınıf ortalaması Workstation (8789 - 20616, n=19, son 2 yıl) | |
| MSI WE76 11UM-456 | |
| Ortalama Intel Core i9-11980HK, NVIDIA RTX A5000 Laptop GPU (n=1) | |
| Asus ProArt StudioBook 16 W7600H5A-2BL2 | |
| Lenovo ThinkPad P1 G4-20Y4S0KS00 | |
| HP ZBook Fury 15 G8 | |
| Lenovo ThinkPad P17 G2-20YU0025G | |
| MSI WE75 9TK | |
| HP ZBook Fury 17 G7 119W5EA | |
| PCMark 10 / Digital Content Creation | |
| Sınıf ortalaması Workstation (8108 - 15631, n=19, son 2 yıl) | |
| Lenovo ThinkPad P1 G4-20Y4S0KS00 | |
| MSI WE76 11UM-456 | |
| Ortalama Intel Core i9-11980HK, NVIDIA RTX A5000 Laptop GPU (n=1) | |
| Asus ProArt StudioBook 16 W7600H5A-2BL2 | |
| HP ZBook Fury 15 G8 | |
| Lenovo ThinkPad P17 G2-20YU0025G | |
| HP ZBook Fury 17 G7 119W5EA | |
| MSI WE75 9TK | |
| PCMark 10 Score | 7023 puan | |
Yardım | ||
| AIDA64 / Memory Copy | |
| Sınıf ortalaması Workstation (56003 - 164795, n=23, son 2 yıl) | |
| MSI WE76 11UM-456 | |
| Ortalama Intel Core i9-11980HK (42653 - 47204, n=2) | |
| AIDA64 / Memory Read | |
| Sınıf ortalaması Workstation (55795 - 121563, n=23, son 2 yıl) | |
| Ortalama Intel Core i9-11980HK (46298 - 47729, n=2) | |
| MSI WE76 11UM-456 | |
| AIDA64 / Memory Write | |
| Sınıf ortalaması Workstation (55663 - 214520, n=23, son 2 yıl) | |
| MSI WE76 11UM-456 | |
| Ortalama Intel Core i9-11980HK (45456 - 45563, n=2) | |
| AIDA64 / Memory Latency | |
| Sınıf ortalaması Workstation (84.5 - 165.2, n=23, son 2 yıl) | |
| MSI WE76 11UM-456 | |
| Ortalama Intel Core i9-11980HK (91.1 - 98.1, n=5) | |
* ... daha küçük daha iyidir
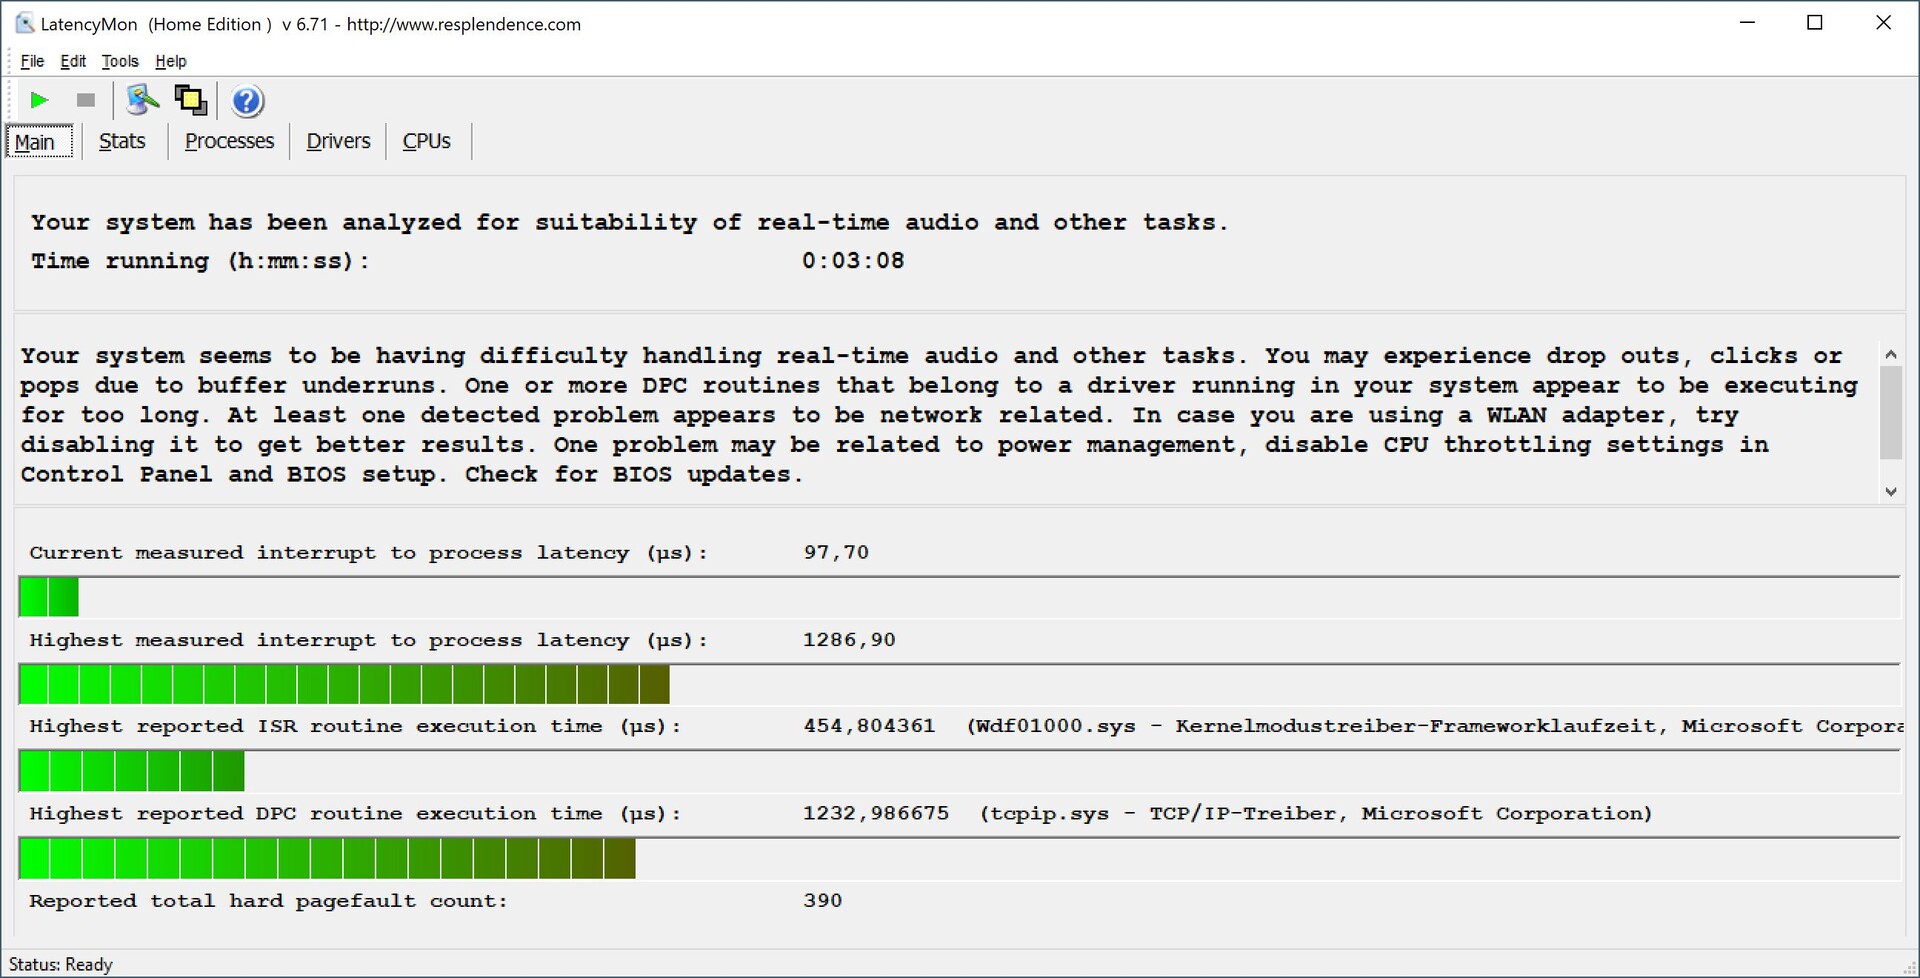
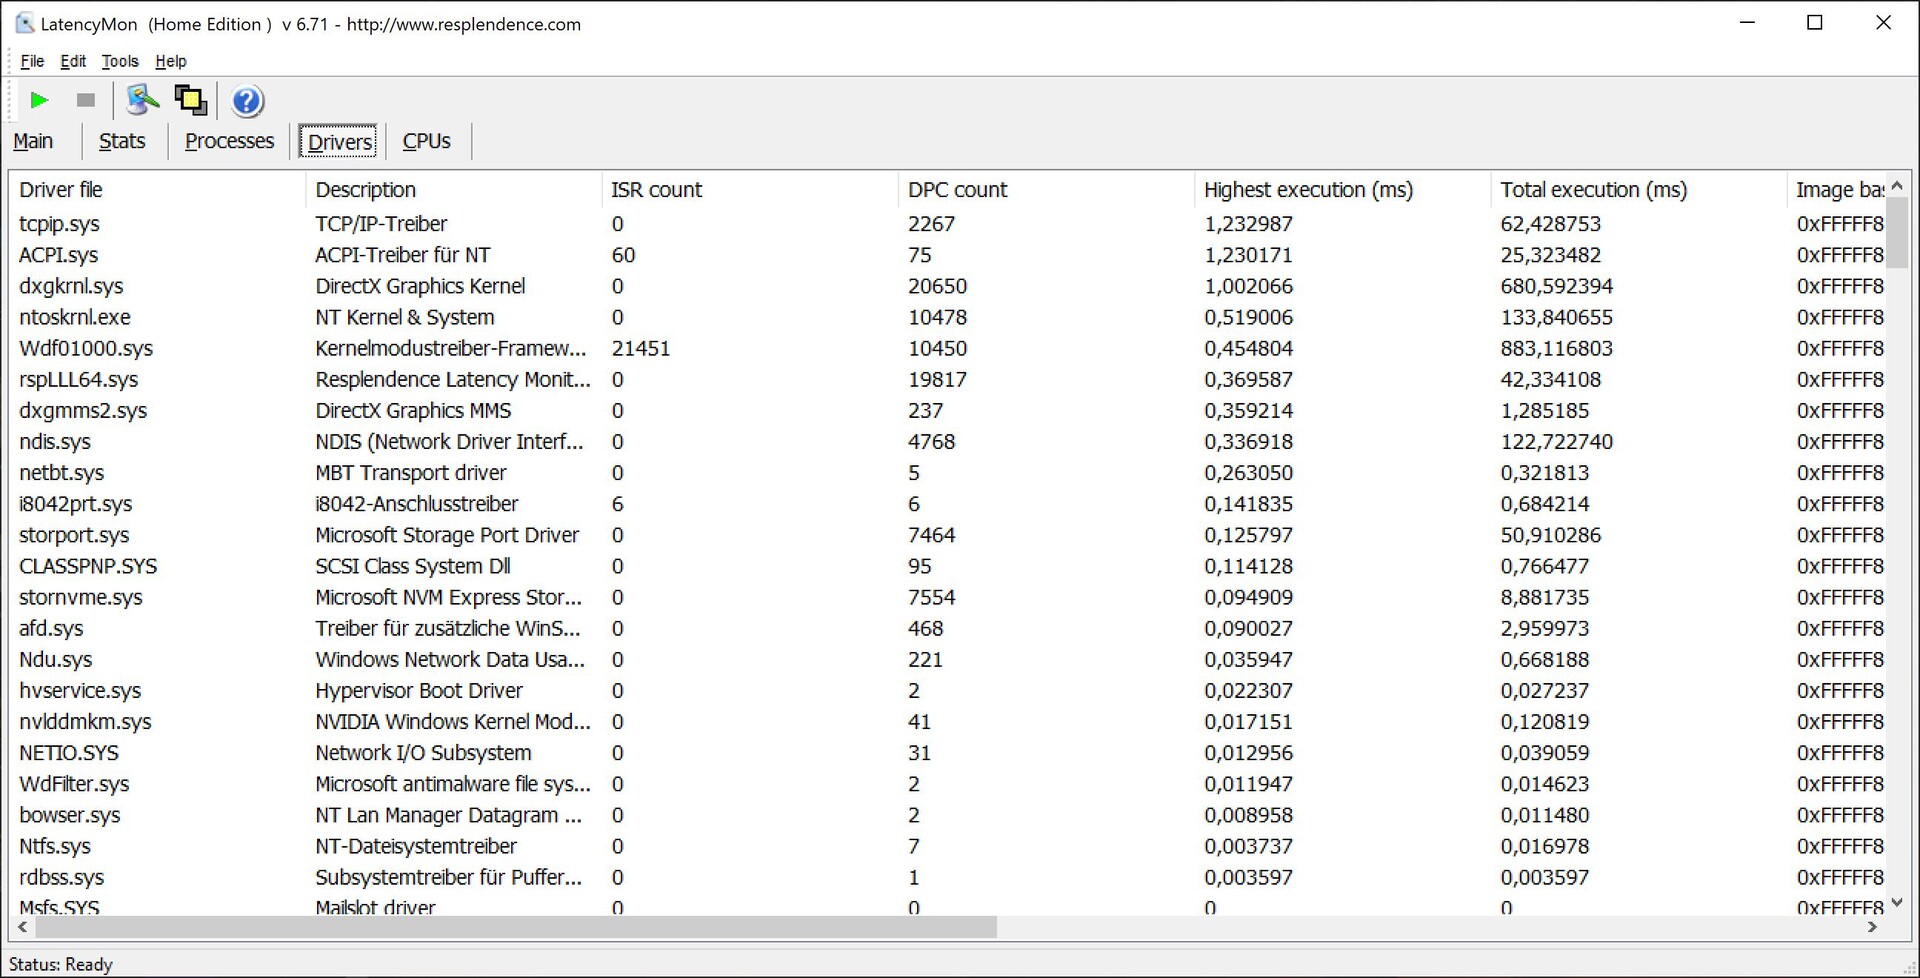
DPC gecikmeleri
WE76'nın inceleme örneğimiz, mevcut BIOS sürümüyle yaptığımız testlerde biraz yüksek gecikmeler gösteriyor ve 4K'da bir YouTube videosu oynatılırken bazı atlanan kareler (atlanan kareler) de vardı. Bu, cihazın gerçek zamanlı ses uygulamaları için ideal olmadığı, ancak gelecekteki güncellemelerin durumu iyileştirebileceği anlamına gelir.
| DPC Latencies / LatencyMon - interrupt to process latency (max), Web, Youtube, Prime95 | |
| Lenovo ThinkPad P17 G2-20YU0025G | |
| HP ZBook Fury 17 G7 119W5EA | |
| Asus ProArt StudioBook 16 W7600H5A-2BL2 | |
| MSI WE76 11UM-456 | |
| Lenovo ThinkPad P1 G4-20Y4S0KS00 | |
| HP ZBook Fury 15 G8 | |
* ... daha küçük daha iyidir
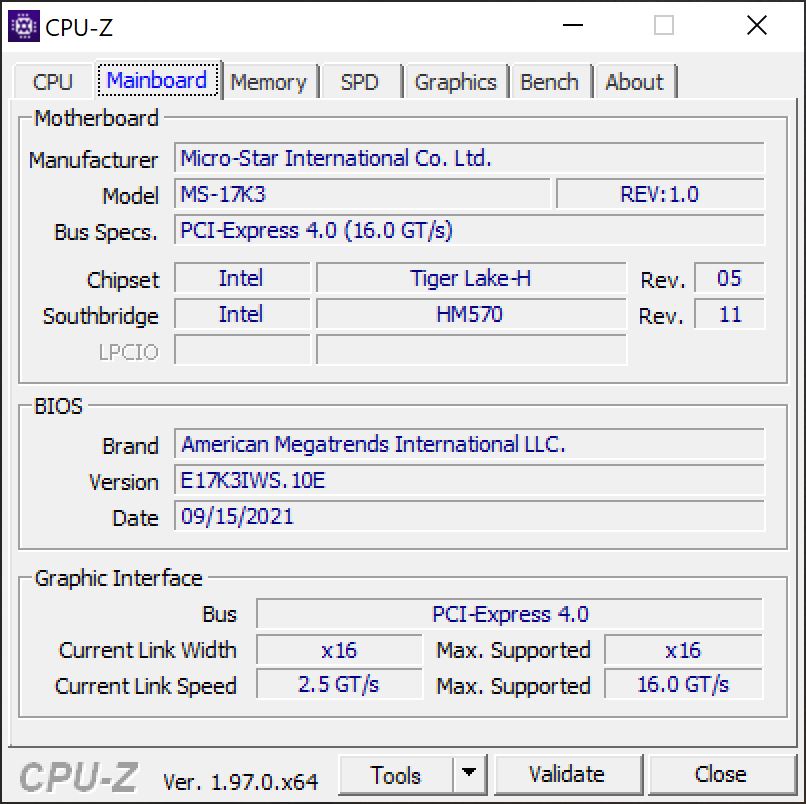
Depolama
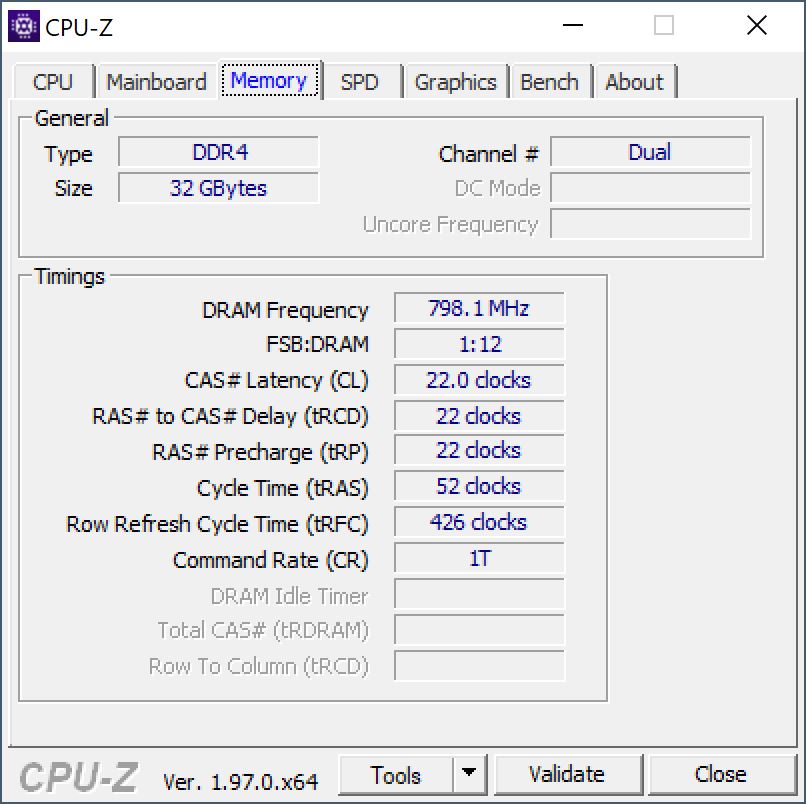
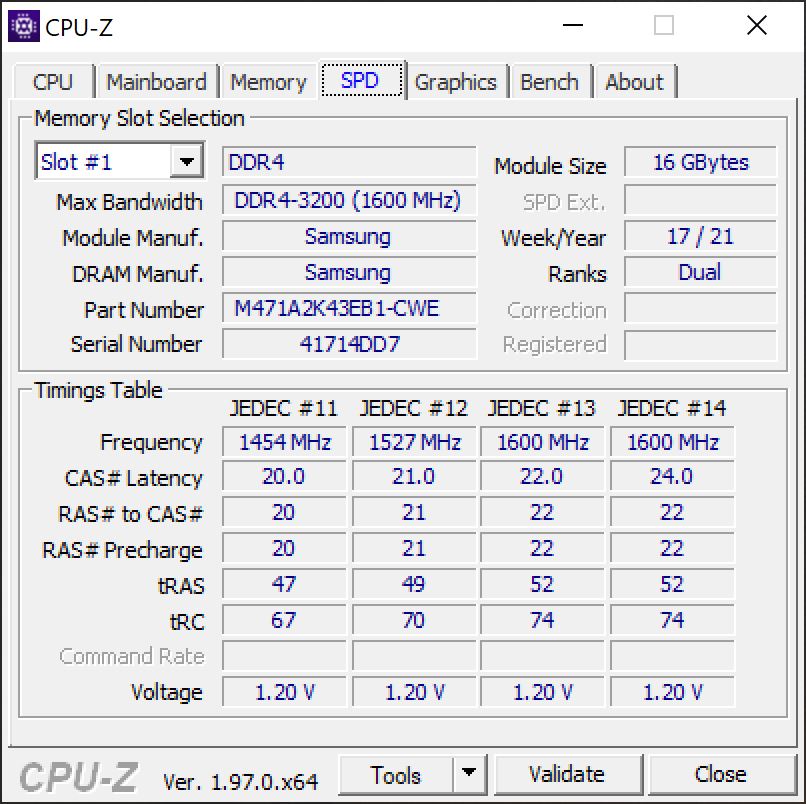
Test cihazımız, 2 TB depolama kapasitesine sahip bir Samsung PM9A1 ile donatılmıştır ve bunun 1,78 TB'ı ilk çalıştırmadan sonra hala kullanılabilir durumdadır. Bu, çok hızlı bir PCIe 4.0 sürücüsüdür ve aynı zamanda WE76 tarafından uygun bir şekilde yararlanılabilir, çünkü kıyaslamalarda çok iyi aktarım hızları ile etkileyicidir. Ek olarak, WE76, depolamayı genişletmenin kolay bir yolu için başka bir M.2-2280 yuvası sunar, ancak "yalnızca" ikinci yuva, PCIe 3.0 x4 arabirimini kullanır. Ek SSD kıyaslamalarını burada bulabilirsiniz.

| Drive Performance rating - Percent | |
| Lenovo ThinkPad P1 G4-20Y4S0KS00 | |
| MSI WE76 11UM-456 | |
| Ortalama Samsung PM9A1 MZVL22T0HBLB | |
| Sınıf ortalaması Workstation | |
| Lenovo ThinkPad P17 G2-20YU0025G | |
| HP ZBook Fury 17 G7 119W5EA | |
| Asus ProArt StudioBook 16 W7600H5A-2BL2 | |
| MSI WE75 9TK -8! | |
| HP ZBook Fury 15 G8 | |
* ... daha küçük daha iyidir
Sürekli yük okuması: DiskSpd Okuma Döngüsü, Sıra uzunluğu 8
Ekran Kartı
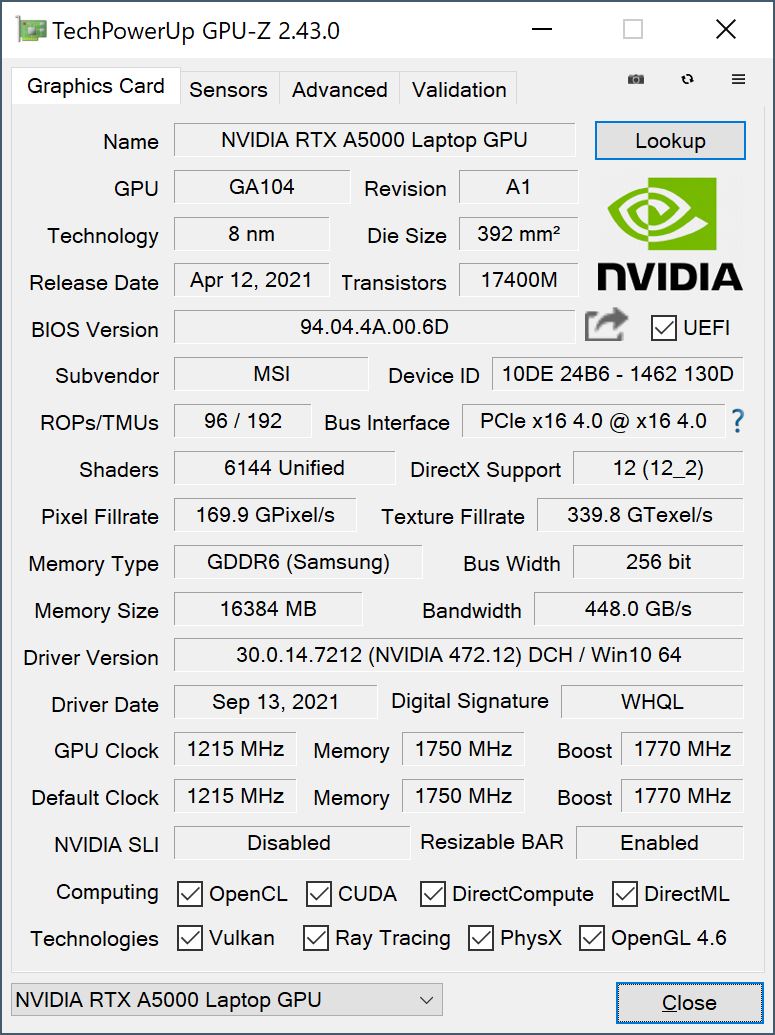
Nvidia RTX A5000 ile (Nvidia bu arada isimlerinden "Quadro" çıkardı), MSI şu anda piyasada bulunan en güçlü profesyonel mobil ekran kartını kurdu. 16 GB RAM ve profesyonel yazılım sertifikaları dahil profesyonel sürücüler ile WE76, özellikle karmaşık CAD/CAM uygulamaları veya ışın izleme içeren büyük grafik projeleri için uygundur. Maksimum 155 watt TDP ile (zaman zaman 180 watt'a kadar çıkan artışlar görmüş olsak bile), ekran kartı açıkça piyasadaki en hızlı modellerden biridir. Nvidia'nın Optimus grafik değiştirme çözümü destekleniyor, bu da işlemcinin entegre ekran kartını basit görevler için kullanıldığı anlamına geliyor.
Bu durumu, WE76'nın kendisini rekabette öne çıkarmayı başardığı kıyaslamalarda da görebiliriz. Örneğin, HP ZBook Fury 15 G'deki RTX A5000 , kıyaslamaya bağlı olarak %10-30 daha yavaştır. İsteğe bağlı Yüksek Performans modu, ekran kartı performansını doğrudan etkilemez ve performans her iki modda da sabittir. Ancak, pil gücünde güç tüketimi 55 watt ile sınırlıdır ve bu da yaklaşık %50 performans kaybına neden olur. Daha fazla karşılaştırma için lütfen ekran kartı karşılaştırmaları makalemize bakın.
| 3DMark Performance rating - Percent | |
| Sınıf ortalaması Workstation -1! | |
| Asus ProArt StudioBook 16 W7600H5A-2BL2 -10! | |
| MSI WE76 11UM-456 | |
| Ortalama NVIDIA RTX A5000 Laptop GPU | |
| HP ZBook Fury 15 G8 | |
| Lenovo ThinkPad P17 G2-20YU0025G -8! | |
| MSI WE75 9TK -16! | |
| Lenovo ThinkPad P1 G4-20Y4S0KS00 | |
| HP ZBook Fury 17 G7 119W5EA | |
| 3DMark 11 - 1280x720 Performance GPU | |
| MSI WE76 11UM-456 | |
| Sınıf ortalaması Workstation (12535 - 69594, n=23, son 2 yıl) | |
| Ortalama NVIDIA RTX A5000 Laptop GPU (30423 - 41904, n=2) | |
| HP ZBook Fury 15 G8 | |
| Lenovo ThinkPad P1 G4-20Y4S0KS00 | |
| HP ZBook Fury 17 G7 119W5EA | |
| MSI WE75 9TK | |
| Lenovo ThinkPad P17 G2-20YU0025G | |
| 3DMark | |
| 1920x1080 Fire Strike Graphics | |
| MSI WE76 11UM-456 | |
| Sınıf ortalaması Workstation (8293 - 52560, n=23, son 2 yıl) | |
| Asus ProArt StudioBook 16 W7600H5A-2BL2 | |
| Ortalama NVIDIA RTX A5000 Laptop GPU (23579 - 29610, n=3) | |
| HP ZBook Fury 15 G8 | |
| Lenovo ThinkPad P1 G4-20Y4S0KS00 | |
| HP ZBook Fury 17 G7 119W5EA | |
| MSI WE75 9TK | |
| Lenovo ThinkPad P17 G2-20YU0025G | |
| 2560x1440 Time Spy Graphics | |
| Sınıf ortalaması Workstation (2725 - 24806, n=23, son 2 yıl) | |
| MSI WE76 11UM-456 | |
| Asus ProArt StudioBook 16 W7600H5A-2BL2 | |
| Ortalama NVIDIA RTX A5000 Laptop GPU (8242 - 11580, n=3) | |
| Lenovo ThinkPad P1 G4-20Y4S0KS00 | |
| HP ZBook Fury 15 G8 | |
| HP ZBook Fury 17 G7 119W5EA | |
| MSI WE75 9TK | |
| Lenovo ThinkPad P17 G2-20YU0025G | |
| 3DMark 11 Performance | 32211 puan | |
| 3DMark Cloud Gate Standard Score | 35295 puan | |
| 3DMark Fire Strike Score | 24155 puan | |
| 3DMark Time Spy Score | 11185 puan | |
Yardım | ||
Oyun performansı
WE76'nın oyun performansı da olağanüstü ve testlerimiz sırasında profesyonel sürücülerle herhangi bir sorun yaşamadık. Çoğu başlık, 4K ve maksimum ayrıntılarda bile sorunsuz bir şekilde oynatılabilir. Yalnızca Cyberpunk 2077 gibi çok zorlu oyunlar, sorunsuz çalışabilmek için çözünürlükte veya ayrıntılarda bir azalma gerektirir. Oyun performansı pil gücüyle daha düşüktür; örneğin The Witcher 3'te ( Ultra ayarlar), performans 98'den 67 FPS'ye düşer. Daha fazla oyun testi burada mevcuttur.
| The Witcher 3 | |
| 1920x1080 High Graphics & Postprocessing (Nvidia HairWorks Off) | |
| MSI WE76 11UM-456 | |
| Lenovo ThinkPad P1 G4-20Y4S0KS00 | |
| Sınıf ortalaması Workstation (n=1son 2 yıl) | |
| Ortalama NVIDIA RTX A5000 Laptop GPU (124 - 179, n=3) | |
| HP ZBook Fury 15 G8 | |
| Asus ProArt StudioBook 16 W7600H5A-2BL2 | |
| MSI WE75 9TK | |
| HP ZBook Fury 17 G7 119W5EA | |
| Lenovo ThinkPad P17 G2-20YU0025G | |
| 1920x1080 Ultra Graphics & Postprocessing (HBAO+) | |
| MSI WE76 11UM-456 | |
| Sınıf ortalaması Workstation (n=1son 2 yıl) | |
| Ortalama NVIDIA RTX A5000 Laptop GPU (81.7 - 98.3, n=3) | |
| Asus ProArt StudioBook 16 W7600H5A-2BL2 | |
| Lenovo ThinkPad P1 G4-20Y4S0KS00 | |
| HP ZBook Fury 15 G8 | |
| HP ZBook Fury 17 G7 119W5EA | |
| MSI WE75 9TK | |
| Lenovo ThinkPad P17 G2-20YU0025G | |
| GTA V | |
| 1920x1080 High/On (Advanced Graphics Off) AA:2xMSAA + FX AF:8x | |
| Lenovo ThinkPad P1 G4-20Y4S0KS00 | |
| MSI WE76 11UM-456 | |
| Asus ProArt StudioBook 16 W7600H5A-2BL2 | |
| Ortalama NVIDIA RTX A5000 Laptop GPU (131 - 161, n=3) | |
| Sınıf ortalaması Workstation (44.4 - 179.4, n=21, son 2 yıl) | |
| HP ZBook Fury 15 G8 | |
| Lenovo ThinkPad P17 G2-20YU0025G | |
| 1920x1080 Highest AA:4xMSAA + FX AF:16x | |
| Sınıf ortalaması Workstation (18.1 - 156.1, n=23, son 2 yıl) | |
| MSI WE76 11UM-456 | |
| Lenovo ThinkPad P1 G4-20Y4S0KS00 | |
| Asus ProArt StudioBook 16 W7600H5A-2BL2 | |
| Ortalama NVIDIA RTX A5000 Laptop GPU (76.1 - 94.6, n=3) | |
| HP ZBook Fury 15 G8 | |
| Lenovo ThinkPad P17 G2-20YU0025G | |
| Final Fantasy XV Benchmark | |
| 1920x1080 High Quality | |
| MSI WE76 11UM-456 | |
| Sınıf ortalaması Workstation (26.4 - 197.6, n=23, son 2 yıl) | |
| Ortalama NVIDIA RTX A5000 Laptop GPU (81.1 - 108, n=3) | |
| Asus ProArt StudioBook 16 W7600H5A-2BL2 | |
| HP ZBook Fury 15 G8 | |
| HP ZBook Fury 17 G7 119W5EA | |
| Lenovo ThinkPad P17 G2-20YU0025G | |
| 2560x1440 High Quality | |
| Sınıf ortalaması Workstation (20.1 - 169.7, n=18, son 2 yıl) | |
| MSI WE76 11UM-456 | |
| Ortalama NVIDIA RTX A5000 Laptop GPU (62.6 - 83.6, n=3) | |
| Asus ProArt StudioBook 16 W7600H5A-2BL2 | |
| HP ZBook Fury 15 G8 | |
| HP ZBook Fury 17 G7 119W5EA | |
| Cyberpunk 2077 1.0 | |
| 1920x1080 Ultra Preset | |
| MSI WE76 11UM-456 | |
| Ortalama NVIDIA RTX A5000 Laptop GPU (58.6 - 78, n=2) | |
| Asus ProArt StudioBook 16 W7600H5A-2BL2 | |
| 1920x1080 High Preset | |
| MSI WE76 11UM-456 | |
| Ortalama NVIDIA RTX A5000 Laptop GPU (68.1 - 90, n=2) | |
| Asus ProArt StudioBook 16 W7600H5A-2BL2 | |
| F1 2021 | |
| 1920x1080 High Preset AA:T AF:16x | |
| MSI WE76 11UM-456 | |
| Asus ProArt StudioBook 16 W7600H5A-2BL2 | |
| Ortalama NVIDIA RTX A5000 Laptop GPU (122 - 161, n=3) | |
| HP ZBook Fury 15 G8 | |
| Lenovo ThinkPad P17 G2-20YU0025G | |
| 1920x1080 Ultra High Preset + Raytracing AA:T AF:16x | |
| MSI WE76 11UM-456 | |
| Asus ProArt StudioBook 16 W7600H5A-2BL2 | |
| Ortalama NVIDIA RTX A5000 Laptop GPU (85 - 109, n=3) | |
| HP ZBook Fury 15 G8 | |
| Lenovo ThinkPad P17 G2-20YU0025G | |
| Far Cry 6 | |
| 1920x1080 High Graphics Quality AA:T | |
| MSI WE76 11UM-456 | |
| Ortalama NVIDIA RTX A5000 Laptop GPU (n=1) | |
| 1920x1080 Ultra Graphics Quality + HD Textures AA:T | |
| MSI WE76 11UM-456 | |
| Ortalama NVIDIA RTX A5000 Laptop GPU (n=1) | |
The Witcher 3 FPS diagram
| düşük | orta | yüksek | ultra | QHD | 4K | |
|---|---|---|---|---|---|---|
| GTA V (2015) | 181 | 175 | 161 | 94.6 | 84.3 | 92.5 |
| The Witcher 3 (2015) | 354 | 271 | 179 | 98.3 | 74 | |
| Final Fantasy XV Benchmark (2018) | 184 | 144 | 108 | 83.6 | 51.1 | |
| X-Plane 11.11 (2018) | 136 | 114 | 90.5 | 65.3 | ||
| Far Cry 5 (2018) | 121 | 113 | 103 | 92 | 50 | |
| Strange Brigade (2018) | 412 | 251 | 213 | 191 | 146 | 86.8 |
| Cyberpunk 2077 1.0 (2020) | 118 | 104 | 90 | 78 | 51 | 25 |
| F1 2021 (2021) | 257 | 187 | 161 | 109 | 88.2 | 53.6 |
| Far Cry 6 (2021) | 120 | 103 | 95 | 89 | 79 | 51 |
Emisyonlar - Güçlü soğutmalı WE76
Gürültü emisyonları
Fan kontrolü kesinlikle WE76'nın zayıf noktalarından biridir. Düşük yükte bile fanlar ara sıra duyulabilir bir şekilde yükselir, bu nedenle günlük işler için her zaman Sessiz modu kullanmanızı öneririz, çünkü o sırada fanlar genellikle devre dışı kalır. Daha fazla performansa ihtiyacınız varsa (özellikle ekran kartı açısından), yine de Performans modunu değiştirebilirsiniz. Bununla birlikte, genel olarak, MSI'ın mobil iş istasyonu, genellikle daha zayıf bileşenlerle donatılmış olan rekabetten ya daha yüksek değil ya da yük altında yalnızca marjinal olarak daha yüksek sesle. Yüksek Performans profili, maksimum fan gürültüsünü 48'in hemen altından yaklaşık 54 dB(A)'ya yükseltir, bu da can sıkıcı bir şekilde yüksek olarak tanımlanabilmektedir. CoolerBooster modu ile 58,9 dB(A) değerine ulaşan en yüksek fan hızını da etkinleştirebilirsiniz. Oyun oynarken performansı Sessiz modda kontrol etmenizi öneririz. Örneğin The Witcher 3'te sadece 38.6 dB(A) ölçebildiğimiz için, bu da kulaklıklara başvurmanıza gerek olmadığı anlamına geliyor. Yine de başka herhangi bir elektronik gürültü tespit edemedik.
Ses yüksekliği
| Boşta |
| 24.7 / 24.7 / 27.5 dB |
| Çalışırken |
| 43.7 / 47.7 dB |
 | ||
30 dB sessiz 40 dB(A) duyulabilirlik 50 dB(A) gürültülü |
||
min: | ||
| MSI WE76 11UM-456 RTX A5000 Laptop GPU, i9-11980HK, Samsung PM9A1 MZVL22T0HBLB | Lenovo ThinkPad P1 G4-20Y4S0KS00 GeForce RTX 3070 Laptop GPU, i7-11850H, Samsung PM9A1 MZVL21T0HCLR | HP ZBook Fury 15 G8 RTX A5000 Laptop GPU, i9-11950H, Samsung PM981a MZVLB1T0HBLR | Asus ProArt StudioBook 16 W7600H5A-2BL2 RTX A5000 Laptop GPU, W-11955M, 2x Micron 2300 2TB MTFDHBA2T0TDV (RAID 0) | Lenovo ThinkPad P17 G2-20YU0025G RTX A2000 Laptop GPU, i7-11800H, Kioxia XG7 KXG7AZNV512G | HP ZBook Fury 17 G7 119W5EA Quadro RTX 4000 Max-Q, i9-10885H, WDC PC SN730 SDBPNTY-1T00 | MSI WE75 9TK Quadro RTX 3000 (Laptop), i7-9750H, Samsung SSD PM981 MZVLB512HAJQ | |
|---|---|---|---|---|---|---|---|
| Noise | 3% | 6% | 1% | 3% | -1% | -7% | |
| kapalı / ortam * (dB) | 24.7 | 23.8 4% | 24.1 2% | 26 -5% | 26.4 -7% | 24.4 1% | 28.5 -15% |
| Idle Minimum * (dB) | 24.7 | 23.8 4% | 24.1 2% | 26 -5% | 26.4 -7% | 24.4 1% | 29 -17% |
| Idle Average * (dB) | 24.7 | 23.8 4% | 24.1 2% | 26 -5% | 26.4 -7% | 26.6 -8% | 29 -17% |
| Idle Maximum * (dB) | 27.5 | 28.3 -3% | 24.8 10% | 26.5 4% | 26.4 4% | 29 -5% | 31.5 -15% |
| Load Average * (dB) | 43.7 | 38.6 12% | 37.8 14% | 42 4% | 38.1 13% | 40.2 8% | 32 27% |
| Witcher 3 ultra * (dB) | 46.6 | 47.4 -2% | 44.2 5% | 38.1 18% | 48 -3% | 44.7 4% | |
| Load Maximum * (dB) | 47.7 | 47.4 1% | 44.2 7% | 43 10% | 45 6% | 48 -1% | 56.5 -18% |
* ... daha küçük daha iyidir
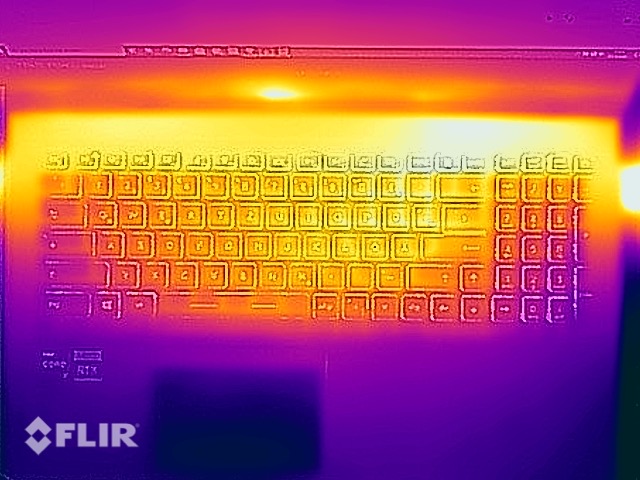
Sıcaklıklar
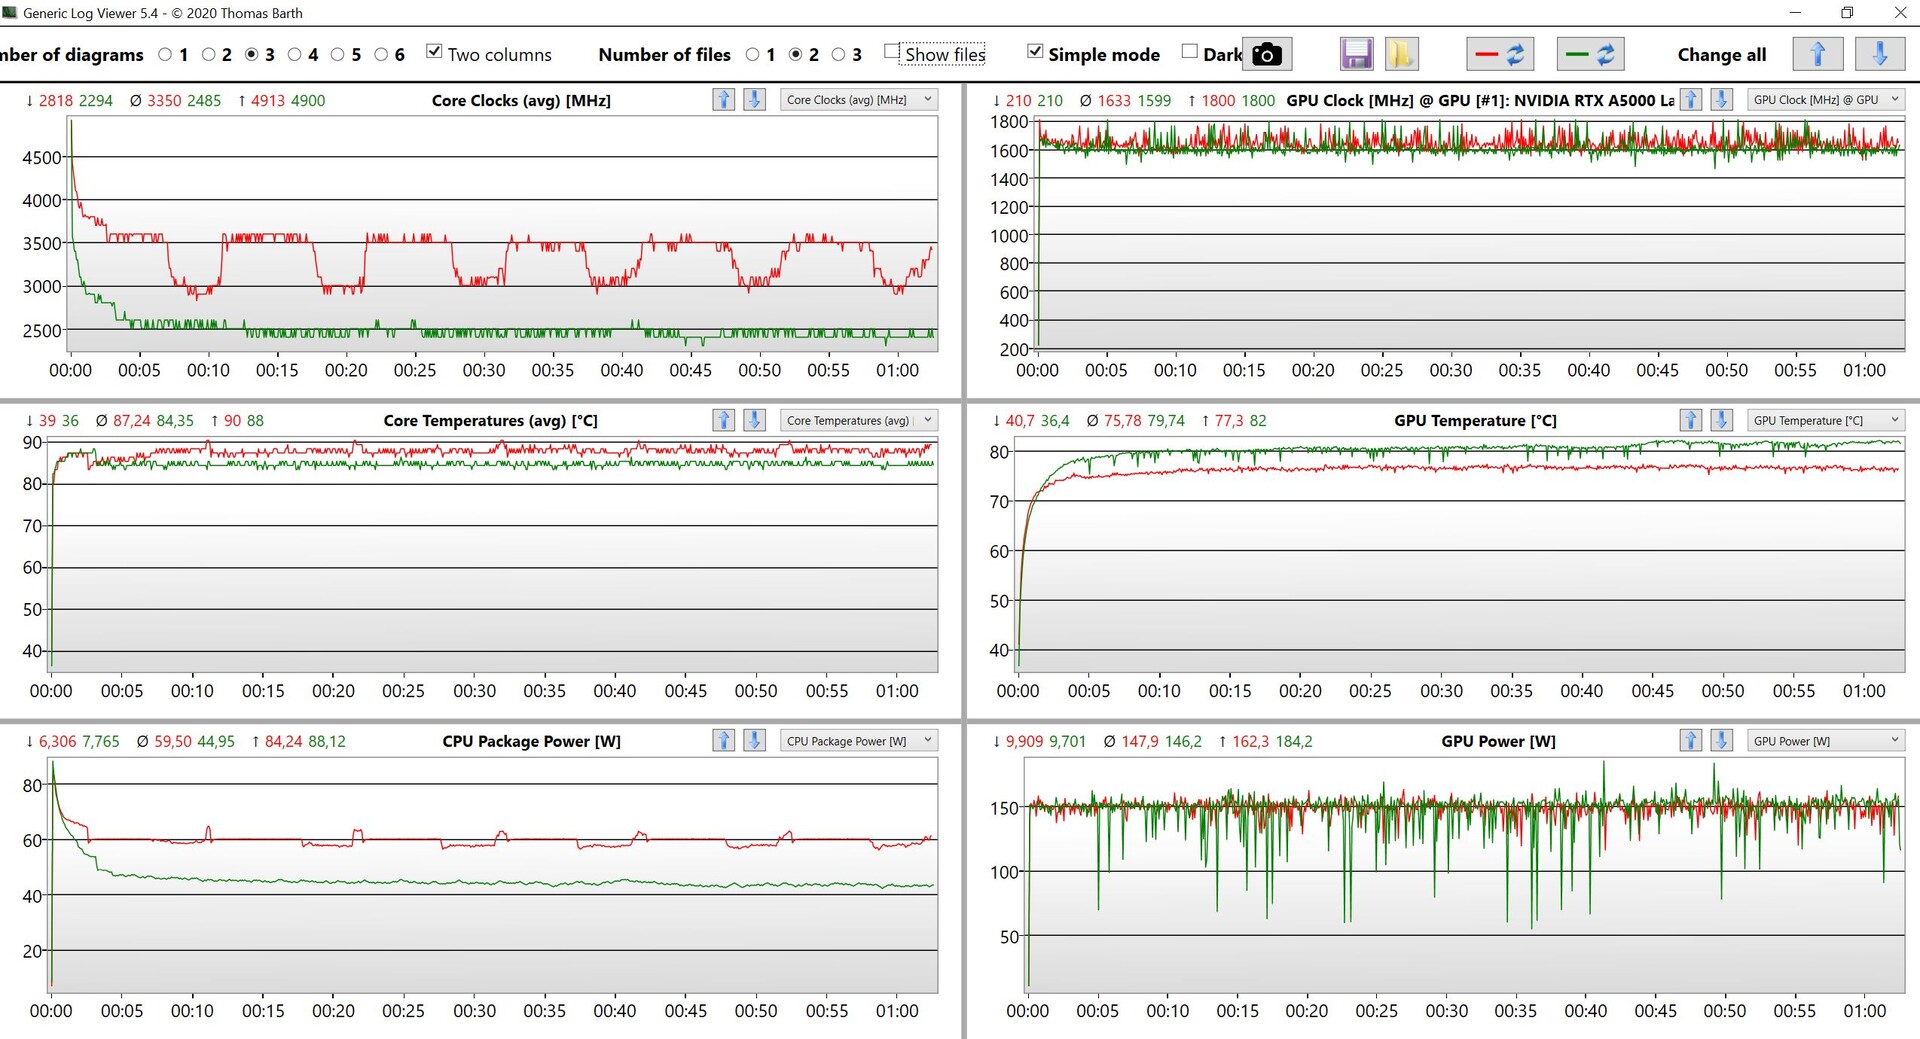
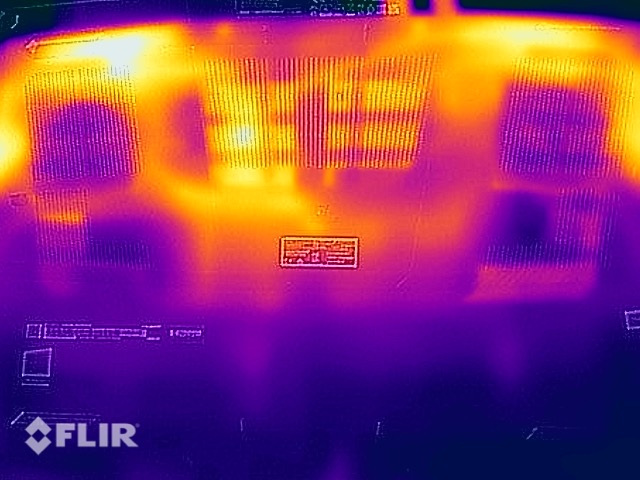
Basit görevler sırasında kasanın tamamı çok soğuk kaldığından WE76'nın herhangi bir sıcaklık sorunu yoktur. Yük altındayken alt kısmın arka sol tarafında 55 °C'den (~131 °F) fazla ölçüm yapabildiğimiz bir alan olmasına rağmen, bu mobil iş istasyonunu kucağınızda neredeyse hiç kullanmayacağınız için bunu bir sorun olarak görmüyoruz. Klavye ayrıca yüksek yük altında belirgin şekilde ısınır, ancak burada yazma işlemi etkilenmez.
İsteğe bağlı Yüksek Performans modu işlemcinin güç tüketimini ~42'den 60 watt'a çıkardığından, performans modları arasındaki farkı stres testinde görebilirsiniz. Yine de ekran kartı güç tüketimi ~150 watt'ta sabit ve sonuçlar genel olarak çok iyi.
(-) Üst taraftaki maksimum sıcaklık, 38.2 °C / 101 F ortalamasına kıyasla 48.4 °C / 119 F'dir. , Workstation sınıfı için 22.2 ile 69.8 °C arasında değişir.
(-) Alt kısım, 41.1 °C / 106 F ortalamasına kıyasla maksimum 56.2 °C / 133 F'ye kadar ısınır
(+) Boşta kullanımda, üst tarafın ortalama sıcaklığı 26 °C / 79 F olup, cihazın 32 °C / 90 F.
(±) The Witcher 3 oynarken, üst tarafın ortalama sıcaklığı 37.6 °C / 100 F olup, cihazın 32 °C / 90 F.
(+) Avuç içi dayanakları ve dokunmatik yüzey, maksimum 27.5 °C / 81.5 F ile cilt sıcaklığından daha soğuktur ve bu nedenle dokunulduğunda soğuktur.
(±) Benzer cihazların avuç içi dayanağı alanının ortalama sıcaklığı 27.8 °C / 82 F (+0.3 °C / 0.5 F) idi.
| MSI WE76 11UM-456 Intel Core i9-11980HK, NVIDIA RTX A5000 Laptop GPU | Lenovo ThinkPad P1 G4-20Y4S0KS00 Intel Core i7-11850H, NVIDIA GeForce RTX 3070 Laptop GPU | HP ZBook Fury 15 G8 Intel Core i9-11950H, NVIDIA RTX A5000 Laptop GPU | Asus ProArt StudioBook 16 W7600H5A-2BL2 Intel Xeon W-11955M, NVIDIA RTX A5000 Laptop GPU | Lenovo ThinkPad P17 G2-20YU0025G Intel Core i7-11800H, NVIDIA RTX A2000 Laptop GPU | HP ZBook Fury 17 G7 119W5EA Intel Core i9-10885H, NVIDIA Quadro RTX 4000 Max-Q | MSI WE75 9TK Intel Core i7-9750H, NVIDIA Quadro RTX 3000 (Laptop) | |
|---|---|---|---|---|---|---|---|
| Heat | 2% | 6% | -3% | 7% | 12% | 8% | |
| Maximum Upper Side * (°C) | 48.4 | 51 -5% | 45.6 6% | 45.7 6% | 49.6 -2% | 46.1 5% | 40.6 16% |
| Maximum Bottom * (°C) | 56.2 | 53.5 5% | 57.6 -2% | 48.3 14% | 52.1 7% | 57.6 -2% | 46 18% |
| Idle Upper Side * (°C) | 28.6 | 28.8 -1% | 26 9% | 35.3 -23% | 26 9% | 23.4 18% | 29.2 -2% |
| Idle Bottom * (°C) | 31.8 | 29.3 8% | 28.8 9% | 34.4 -8% | 27.6 13% | 23.4 26% | 32.4 -2% |
* ... daha küçük daha iyidir
Hoparlörler
MSI, kabul edilebilir bir performansa sahip bir stereo ses sistemi kurmuştur. Ancak, özellikle bileşenler yüksek yük altındayken (profesyonel uygulamaların veya oyunların kullanımda olup olmadığına bakılmaksızın) fan gürültüsü baskındır, bu nedenle hoparlörleri çok iyi duyamazsınız. Bu yüzden burada kulaklık kullanmanızı tavsiye ederiz.
MSI WE76 11UM-456 ses analizi
(+) | hoparlörler nispeten yüksek sesle çalabilir (84.6 dB)
Bas 100 - 315Hz
(±) | azaltılmış bas - ortalama olarak medyandan 14.7% daha düşük
(±) | Bas doğrusallığı ortalamadır (7.8% delta - önceki frekans)
Ortalar 400 - 2000 Hz
(±) | daha yüksek ortalar - ortalama olarak medyandan 5% daha yüksek
(+) | orta frekanslar doğrusaldır (3.9% deltadan önceki frekansa)
Yüksekler 2 - 16 kHz
(±) | daha yüksek en yüksekler - ortalama olarak medyandan 5.6% daha yüksek
(±) | Yükseklerin doğrusallığı ortalamadır (9.1% delta - önceki frekans)
Toplam 100 - 16.000 Hz
(±) | Genel sesin doğrusallığı ortalamadır (16.3% ortancaya göre fark)
Aynı sınıfla karşılaştırıldığında
» Bu sınıftaki tüm test edilen cihazların %44%'si daha iyi, 9% benzer, 47% daha kötüydü
» En iyisinin deltası 7% idi, ortalama 17% idi, en kötüsü 35% idi
Test edilen tüm cihazlarla karşılaştırıldığında
» Test edilen tüm cihazların %27'si daha iyi, 6 benzer, % 68 daha kötüydü
» En iyisinin deltası 4% idi, ortalama 23% idi, en kötüsü 134% idi
HP ZBook Fury 17 G7 119W5EA ses analizi
(±) | hoparlör ses yüksekliği ortalama ama iyi (78.6 dB)
Bas 100 - 315Hz
(±) | azaltılmış bas - ortalama olarak medyandan 7.9% daha düşük
(±) | Bas doğrusallığı ortalamadır (11.1% delta - önceki frekans)
Ortalar 400 - 2000 Hz
(+) | dengeli ortalar - medyandan yalnızca 2.8% uzakta
(+) | orta frekanslar doğrusaldır (3.9% deltadan önceki frekansa)
Yüksekler 2 - 16 kHz
(+) | dengeli yüksekler - medyandan yalnızca 2.7% uzakta
(+) | yüksekler doğrusaldır (4.8% deltadan önceki frekansa)
Toplam 100 - 16.000 Hz
(+) | genel ses doğrusaldır (10.9% ortancaya göre fark)
Aynı sınıfla karşılaştırıldığında
» Bu sınıftaki tüm test edilen cihazların %11%'si daha iyi, 4% benzer, 85% daha kötüydü
» En iyisinin deltası 7% idi, ortalama 17% idi, en kötüsü 35% idi
Test edilen tüm cihazlarla karşılaştırıldığında
» Test edilen tüm cihazların %6'si daha iyi, 2 benzer, % 92 daha kötüydü
» En iyisinin deltası 4% idi, ortalama 23% idi, en kötüsü 134% idi
Lenovo ThinkPad P17 G2-20YU0025G ses analizi
(±) | hoparlör ses yüksekliği ortalama ama iyi (76.6 dB)
Bas 100 - 315Hz
(±) | azaltılmış bas - ortalama olarak medyandan 14.5% daha düşük
(±) | Bas doğrusallığı ortalamadır (9.6% delta - önceki frekans)
Ortalar 400 - 2000 Hz
(±) | daha yüksek ortalar - ortalama olarak medyandan 6.9% daha yüksek
(±) | Ortaların doğrusallığı ortalamadır (7.7% delta - önceki frekans)
Yüksekler 2 - 16 kHz
(+) | dengeli yüksekler - medyandan yalnızca 2.6% uzakta
(+) | yüksekler doğrusaldır (6.6% deltadan önceki frekansa)
Toplam 100 - 16.000 Hz
(±) | Genel sesin doğrusallığı ortalamadır (20.1% ortancaya göre fark)
Aynı sınıfla karşılaştırıldığında
» Bu sınıftaki tüm test edilen cihazların %71%'si daha iyi, 6% benzer, 23% daha kötüydü
» En iyisinin deltası 7% idi, ortalama 17% idi, en kötüsü 35% idi
Test edilen tüm cihazlarla karşılaştırıldığında
» Test edilen tüm cihazların %52'si daha iyi, 8 benzer, % 40 daha kötüydü
» En iyisinin deltası 4% idi, ortalama 23% idi, en kötüsü 134% idi
Enerji Yönetimi - Yüksek güç tüketimi
Enerji tüketimi
Mobil iş istasyonunun çok fazla güç gerektirmesi şaşırtıcı değil. Otomatik grafik değiştirme sayesinde, boşta kalma oranları hala maksimum 20 watt ile sınırlar içinde, ancak yük altında 281 watt'a ulaşılıyor, bu da daha sonra 245 watt'a oldukça hızlı bir şekilde yerleşiyor (Yüksek Performans modunda ~ 260 watt). Oyun oynarken yaklaşık 230 watt bekleyebilirsiniz. Bu, birlikte verilen 280 watt'lık güç adaptörünün yeterli kapasiteye sahip olduğu anlamına gelir.
| Kapalı / Bekleme modu | |
| Boşta | |
| Çalışırken |
|
Key:
min: | |
| MSI WE76 11UM-456 i9-11980HK, RTX A5000 Laptop GPU, Samsung PM9A1 MZVL22T0HBLB, IPS, 3840x2160, 17.3" | Lenovo ThinkPad P1 G4-20Y4S0KS00 i7-11850H, GeForce RTX 3070 Laptop GPU, Samsung PM9A1 MZVL21T0HCLR, IPS LED, 3840x2400, 16" | HP ZBook Fury 15 G8 i9-11950H, RTX A5000 Laptop GPU, Samsung PM981a MZVLB1T0HBLR, IPS, 3840x2160, 15.6" | Asus ProArt StudioBook 16 W7600H5A-2BL2 W-11955M, RTX A5000 Laptop GPU, 2x Micron 2300 2TB MTFDHBA2T0TDV (RAID 0), OLED, 3840x2400, 16" | Lenovo ThinkPad P17 G2-20YU0025G i7-11800H, RTX A2000 Laptop GPU, Kioxia XG7 KXG7AZNV512G, IPS LED, 1920x1080, 17.3" | HP ZBook Fury 17 G7 119W5EA i9-10885H, Quadro RTX 4000 Max-Q, WDC PC SN730 SDBPNTY-1T00, , 3840x2160, 17.3" | MSI WE75 9TK i7-9750H, Quadro RTX 3000 (Laptop), Samsung SSD PM981 MZVLB512HAJQ, IPS, 1920x1080, 17.3" | Ortalama NVIDIA RTX A5000 Laptop GPU | Sınıf ortalaması Workstation | |
|---|---|---|---|---|---|---|---|---|---|
| Power Consumption | 19% | 15% | 11% | 38% | 24% | 15% | 5% | 23% | |
| Idle Minimum * (Watt) | 10.5 | 8.1 23% | 8.3 21% | 12.4 -18% | 6.1 42% | 5.8 45% | 12.1 -15% | 10.4 ? 1% | 9.11 ? 13% |
| Idle Average * (Watt) | 18.6 | 20.2 -9% | 19.9 -7% | 16.5 11% | 10.9 41% | 14.8 20% | 18.4 1% | 18.3 ? 2% | 13.8 ? 26% |
| Idle Maximum * (Watt) | 20 | 21.9 -10% | 21.8 -9% | 25 -25% | 12.3 38% | 17 15% | 18.8 6% | 22.3 ? -12% | 17.9 ? 11% |
| Load Average * (Watt) | 132.4 | 88.2 33% | 110.9 16% | 132 -0% | 106.3 20% | 120.4 9% | 95.1 28% | 125.1 ? 6% | 96 ? 27% |
| Witcher 3 ultra * (Watt) | 232 | 149 36% | 165 29% | 132 43% | 124 47% | 168.4 27% | 135.5 42% | ||
| Load Maximum * (Watt) | 281.6 | 170.6 39% | 171.8 39% | 134 52% | 168.9 40% | 199.8 29% | 203.7 28% | 195.8 ? 30% | 180.3 ? 36% |
* ... daha küçük daha iyidir
Energy consumption during our The Witcher 3 test / stress test
Harici bir monitörle enerji tüketimi
Pil ömrü
99,9 Wh pil, hala uçaklarda taşınabilecek maksimum kapasitedir. Pil çalışma süreleri performans ve bileşenler için uygundur. 150 cd/m²'de Wi-Fi testinde 6 saatten biraz fazla (veya tam parlaklıkta 4:30 saat) ve video testinde 7 saatin biraz altındayken, bir elektrik prizine ihtiyaç duymadan kesinlikle biraz daha uzun toplantılarda hayatta kalabilirsiniz. Yük altında 80 dakikanın hemen altında bir süre mümkündür, ancak bu yalnızca önemli ölçüde azaltılmış performans nedeniyle mümkündür.
| MSI WE76 11UM-456 i9-11980HK, RTX A5000 Laptop GPU, 99.9 Wh | Lenovo ThinkPad P1 G4-20Y4S0KS00 i7-11850H, GeForce RTX 3070 Laptop GPU, 90 Wh | HP ZBook Fury 15 G8 i9-11950H, RTX A5000 Laptop GPU, 94 Wh | Asus ProArt StudioBook 16 W7600H5A-2BL2 W-11955M, RTX A5000 Laptop GPU, 90 Wh | Lenovo ThinkPad P17 G2-20YU0025G i7-11800H, RTX A2000 Laptop GPU, 94 Wh | HP ZBook Fury 17 G7 119W5EA i9-10885H, Quadro RTX 4000 Max-Q, 94 Wh | MSI WE75 9TK i7-9750H, Quadro RTX 3000 (Laptop), 65 Wh | Sınıf ortalaması Workstation | |
|---|---|---|---|---|---|---|---|---|
| Pil Çalışma Süresi | 2% | -2% | -48% | 34% | 34% | -23% | 31% | |
| H.264 (h) | 6.9 | 7.2 4% | 1.8 -74% | 9.5 38% | 10.3 49% | 10.1 ? 46% | ||
| WiFi v1.3 (h) | 6.3 | 7 11% | 6.2 -2% | 5 -21% | 9.8 56% | 7.6 21% | 4.9 -22% | 8.55 ? 36% |
| Load (h) | 1.3 | 1.2 -8% | 1.4 8% | 1.7 31% | 1 -23% | 1.441 ? 11% | ||
| Witcher 3 ultra (h) | 1.6 | |||||||
| Reader / Idle (h) | 11 | 26.1 ? |
Artılar
Eksiler
Son Görüş - MSI çok fazla performans sunuyor
WE76 ile MSI, çok fazla performans sağlayan ve doğrudan Dell Precision 7770, HP ZBook Fury 17 ve Lenovo ThinkPad P17 Gen 2 gibi modellerle rekabet eden geleneksel bir mobil iş istasyonu sunuyor . Mobilite bu cihazlarda yalnızca ikincil bir rol oynar ve bunun yerine MSI iş istasyonunun üstün olduğu performansa odaklanılır.
Üreticinin referans olarak bir oyun dizüstü bilgisayarı (GE76) kullanması bizce bir sorun teşkil etmiyor. Kapsamlı aydınlatma atlandı ve hedef kitleye hiç uymayan 360 Hz ekran modelleri de yok. Bunun yerine, doğru renklere, neredeyse tam AdobeRGB kapsamına ve 120 Hz'e sahip mat bir 4K panel var ve bu da günlük kullanımda gözle görülür şekilde daha pürüzsüz bir resim izlenimi sağlıyor. Ayrıca, özel bir sayısal tuş takımı içeren çok iyi bir klavye var.
Özellikle, profesyonel Nvidia RTX A5000 (eski adıyla Quadro) grafik kartının performansı baştan sona etkileyici. İşlemci performansı da çok iyi, ancak burada şunu söylemek gerekiyor ki AMD'nin mobil işlemcileri şu anda daha iyi, ancak bunlar henüz iş istasyonlarında uygulanmadı (bu tüm üreticiler için geçerlidir).
Son derece hızlı grafik kartı, yüksek sistem performansı, mat 4K ekran ve harika klavye: MSI WE76, esas olarak performansa odaklanan bir mobil iş istasyonudur.
Son derece hızlı grafik kartı, yüksek sistem performansı, mat 4K ekran ve harika klavye: MSI WE76, esas olarak performansa odaklanan bir mobil iş istasyonudur.
Fan davranışı birkaç zayıf noktadan biridir, çünkü normal günlük kullanım sırasında bile sık sık devreye girerler ve bu da biraz düzensiz görünmelerine neden olur. Cihazı çok daha sessiz tuttuğu için burada isteğe bağlı Sessiz mod önerilir. Bununla birlikte, yük altında maksimum fan hacmi mükemmel bir şekilde rekabet eder ve aşırı yüksek değildir.
Maksimum performansa ihtiyaç duyan kullanıcılar WE76 ile yanılmazlar ve MSI'ın burada yukarıda bahsedilen rakiplere göre avantajları da var. Biraz daha küçük 16 inçlik modeller (örneğin ThinkPad P1 Gen 4 veya Asus ProArt StudioBook 16) kuşkusuz daha kompakt ve daha mobildir, ancak karşılığında daha az performans sunarlar.
Fiyat ve stok durumu
Yazım esnasında, Core i9-11980HK, Quadro RTX A5000, 64 GB RAM, 1 TB NVME SSD ve Windows 10 Pro ile MSI WE76'yı Amazon'da yaklaşık 4.300 dolardan başlayan fiyatlarla bulabilirsiniz.
MSI WE76 11UM-456
- 12/06/2021 v7 (old)
Andreas Osthoff
Price comparison

