RTX 3060 ile Lenovo Legion 5 17 İncelemede: Güncel Nesil AMD Ryzen İşlemcili Güçlü Dizüstü Oyun Bilgisayarı

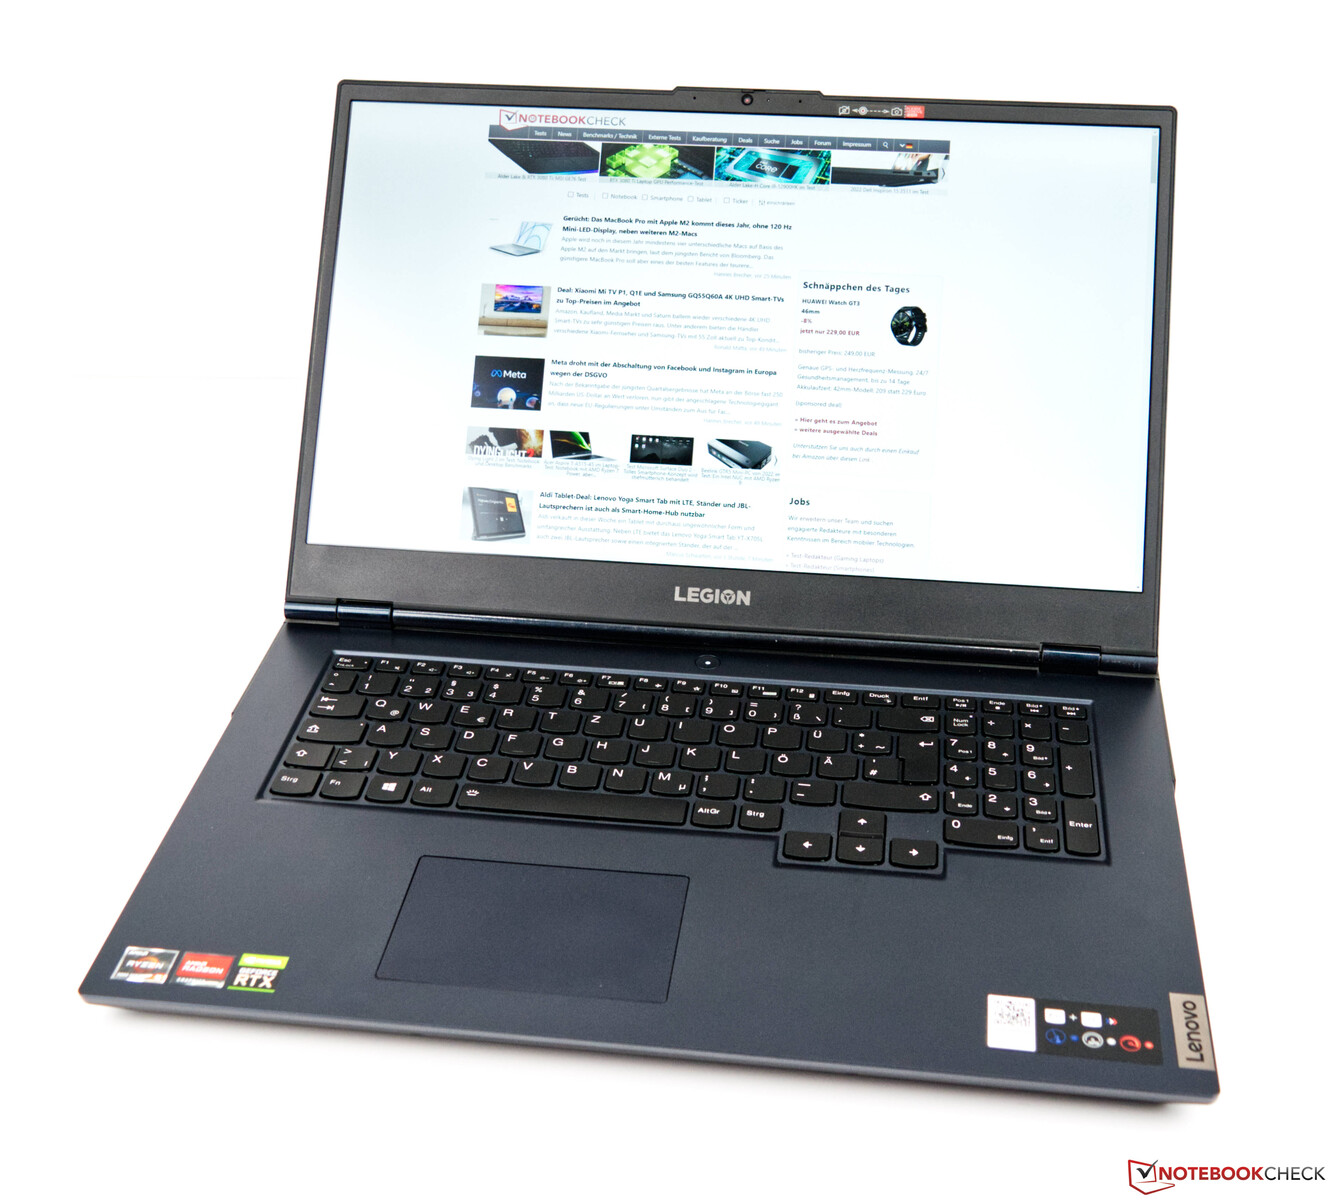
Lenovo'nun Legion serisi, oyun sahnesinde uzun süredir bir ev ismi olmuştur. Legion 5, çarpıcı tasarımı aynı zamanda AMD APU'ya dayalı en son 2022 modeline de ulaştığı için görsel olarak göze çarpmıyor.
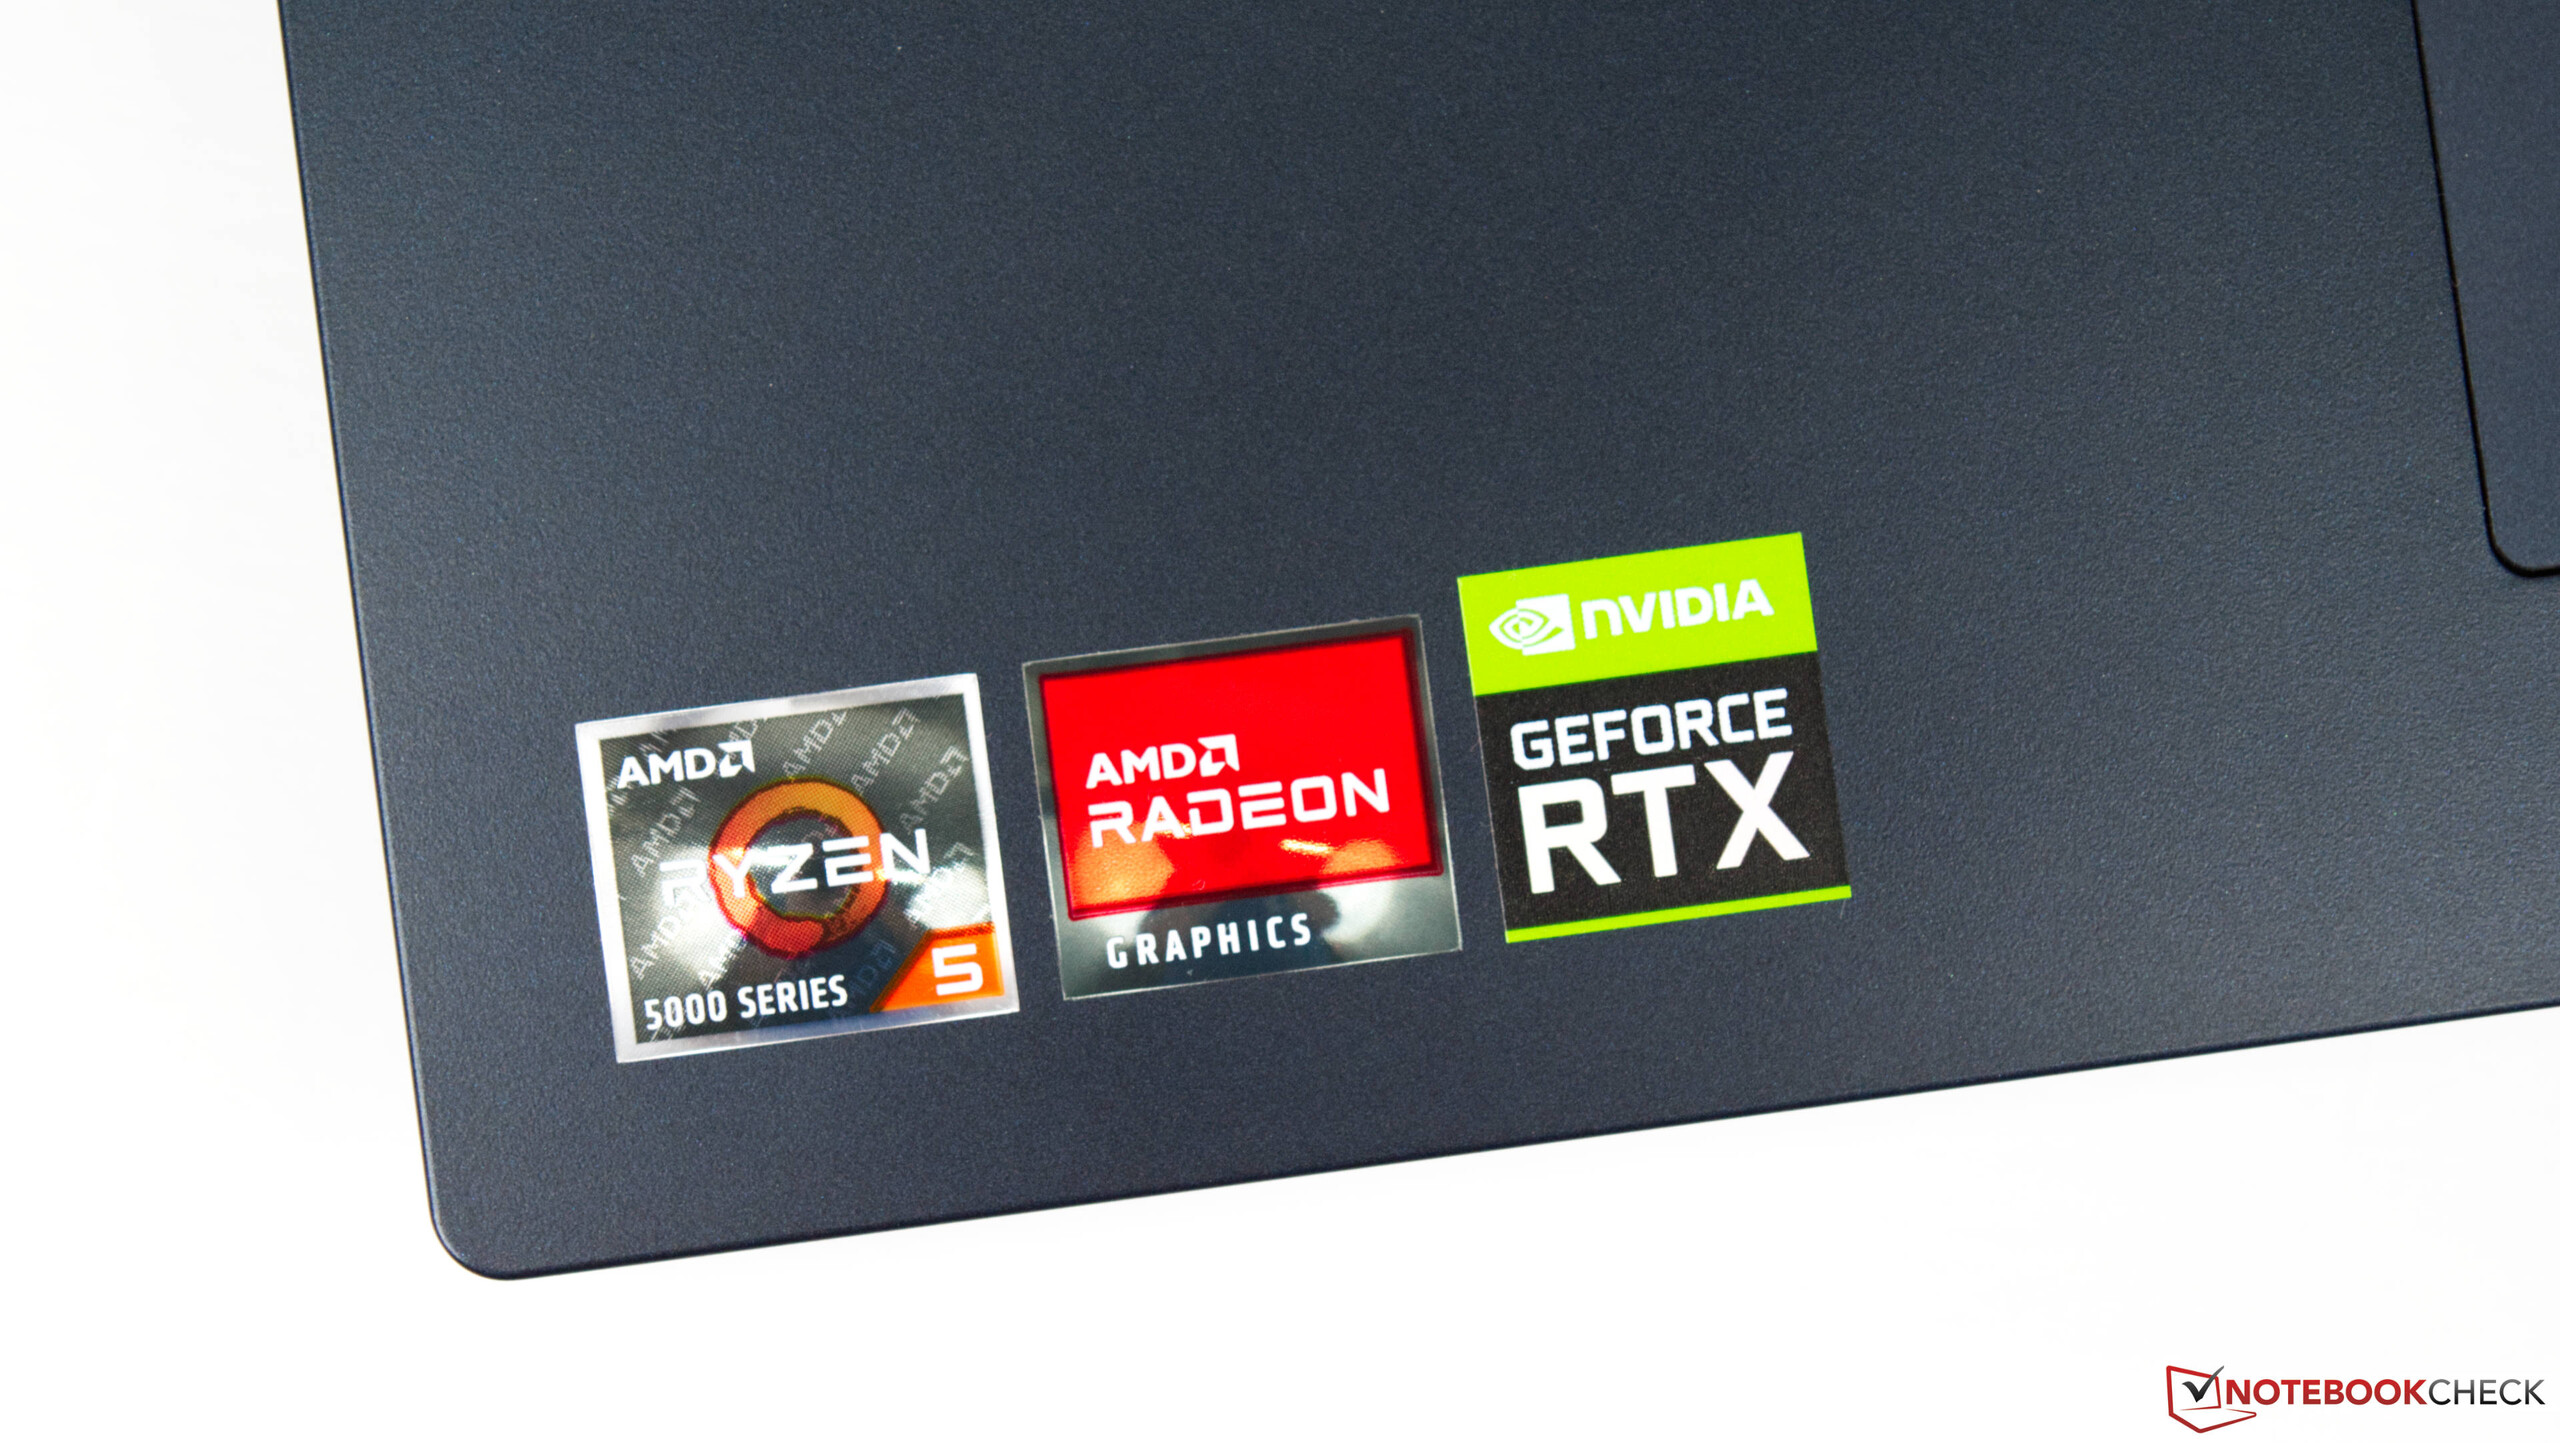
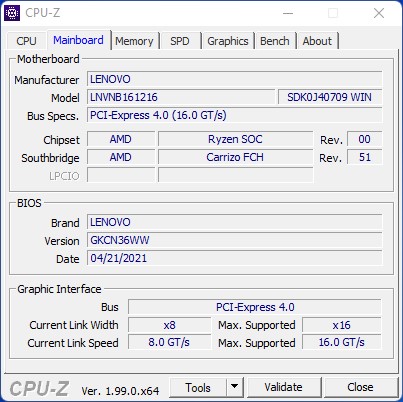
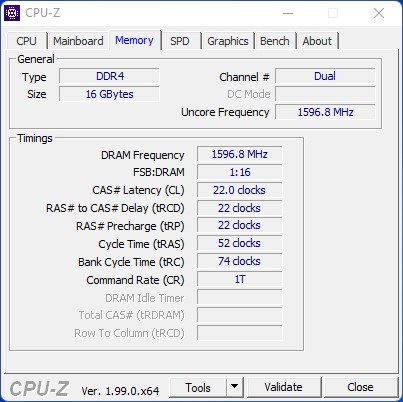
AMD Ryzen 5 5600H ve AMD Ryzen 7 5800H'ye ek olarak, kullanıcılar üç farklı Nvidia ekran kartı arasından seçim yapabilir. Lenovo Legion 5 17'nin GeForce RTX 3050 temel modeli 1150 USD'den başlarken, GeForce RTX 3060 mobil ekran kartlı test yapılandırmamız yaklaşık 1220 USD'ye mevcuttur. Fiyat için kullanıcılar ayrıca 144 Hz 1080p ekran, 16 GB RAM ve 512 GB NVMe SSD alırlar. Windows 11 Home sürümü varsayılan olarak dahildir. Sistem, Lenovo'nun çevrimiçi mağazası aracılığıyla tercihlerinize göre yapılandırılabilir.
Karşılaştırma amacıyla benzer donanıma sahip cihazlar kullandık. Aşağıdaki tablo seçtiğimiz rakipleri göstermektedir.
Karşılaştırmada muhtemel rakipleri
Derece | Tarih | Model | Ağırlık | Yükseklik | Boyut | Çözünürlük | En iyi fiyat |
|---|---|---|---|---|---|---|---|
| 85.2 % v7 (old) | 05/2022 | Lenovo Legion 5 17ACH6H-82JY0003GE R5 5600H, GeForce RTX 3060 Laptop GPU | 3.1 kg | 24.3 mm | 17.30" | 1920x1080 | |
| 83.9 % v7 (old) | Schenker XMG Core 17 (Early 2021) i7-10870H, GeForce RTX 3060 Laptop GPU | 2.5 kg | 30.05 mm | 17.30" | 2560x1440 | ||
| 82.8 % v7 (old) | 07/2021 | Asus TUF Gaming F17 FX706HM i9-11900H, GeForce RTX 3060 Laptop GPU | 2.7 kg | 26 mm | 17.30" | 1920x1080 | |
| 80.4 % v7 (old) | 07/2021 | MSI Katana GF76 11UE i7-11800H, GeForce RTX 3060 Laptop GPU | 2.7 kg | 25.2 mm | 17.30" | 1920x1080 | |
| 83.4 % v7 (old) | Schenker XMG Apex 17 M21 R7 5800H, GeForce RTX 3070 Laptop GPU | 2.6 kg | 32.4 mm | 17.30" | 1920x1080 | ||
| 83.2 % v7 (old) | 09/2021 | Gigabyte A7 X1 R9 5900HX, GeForce RTX 3070 Laptop GPU | 2.5 kg | 34 mm | 17.30" | 1920x1080 |
Kasa
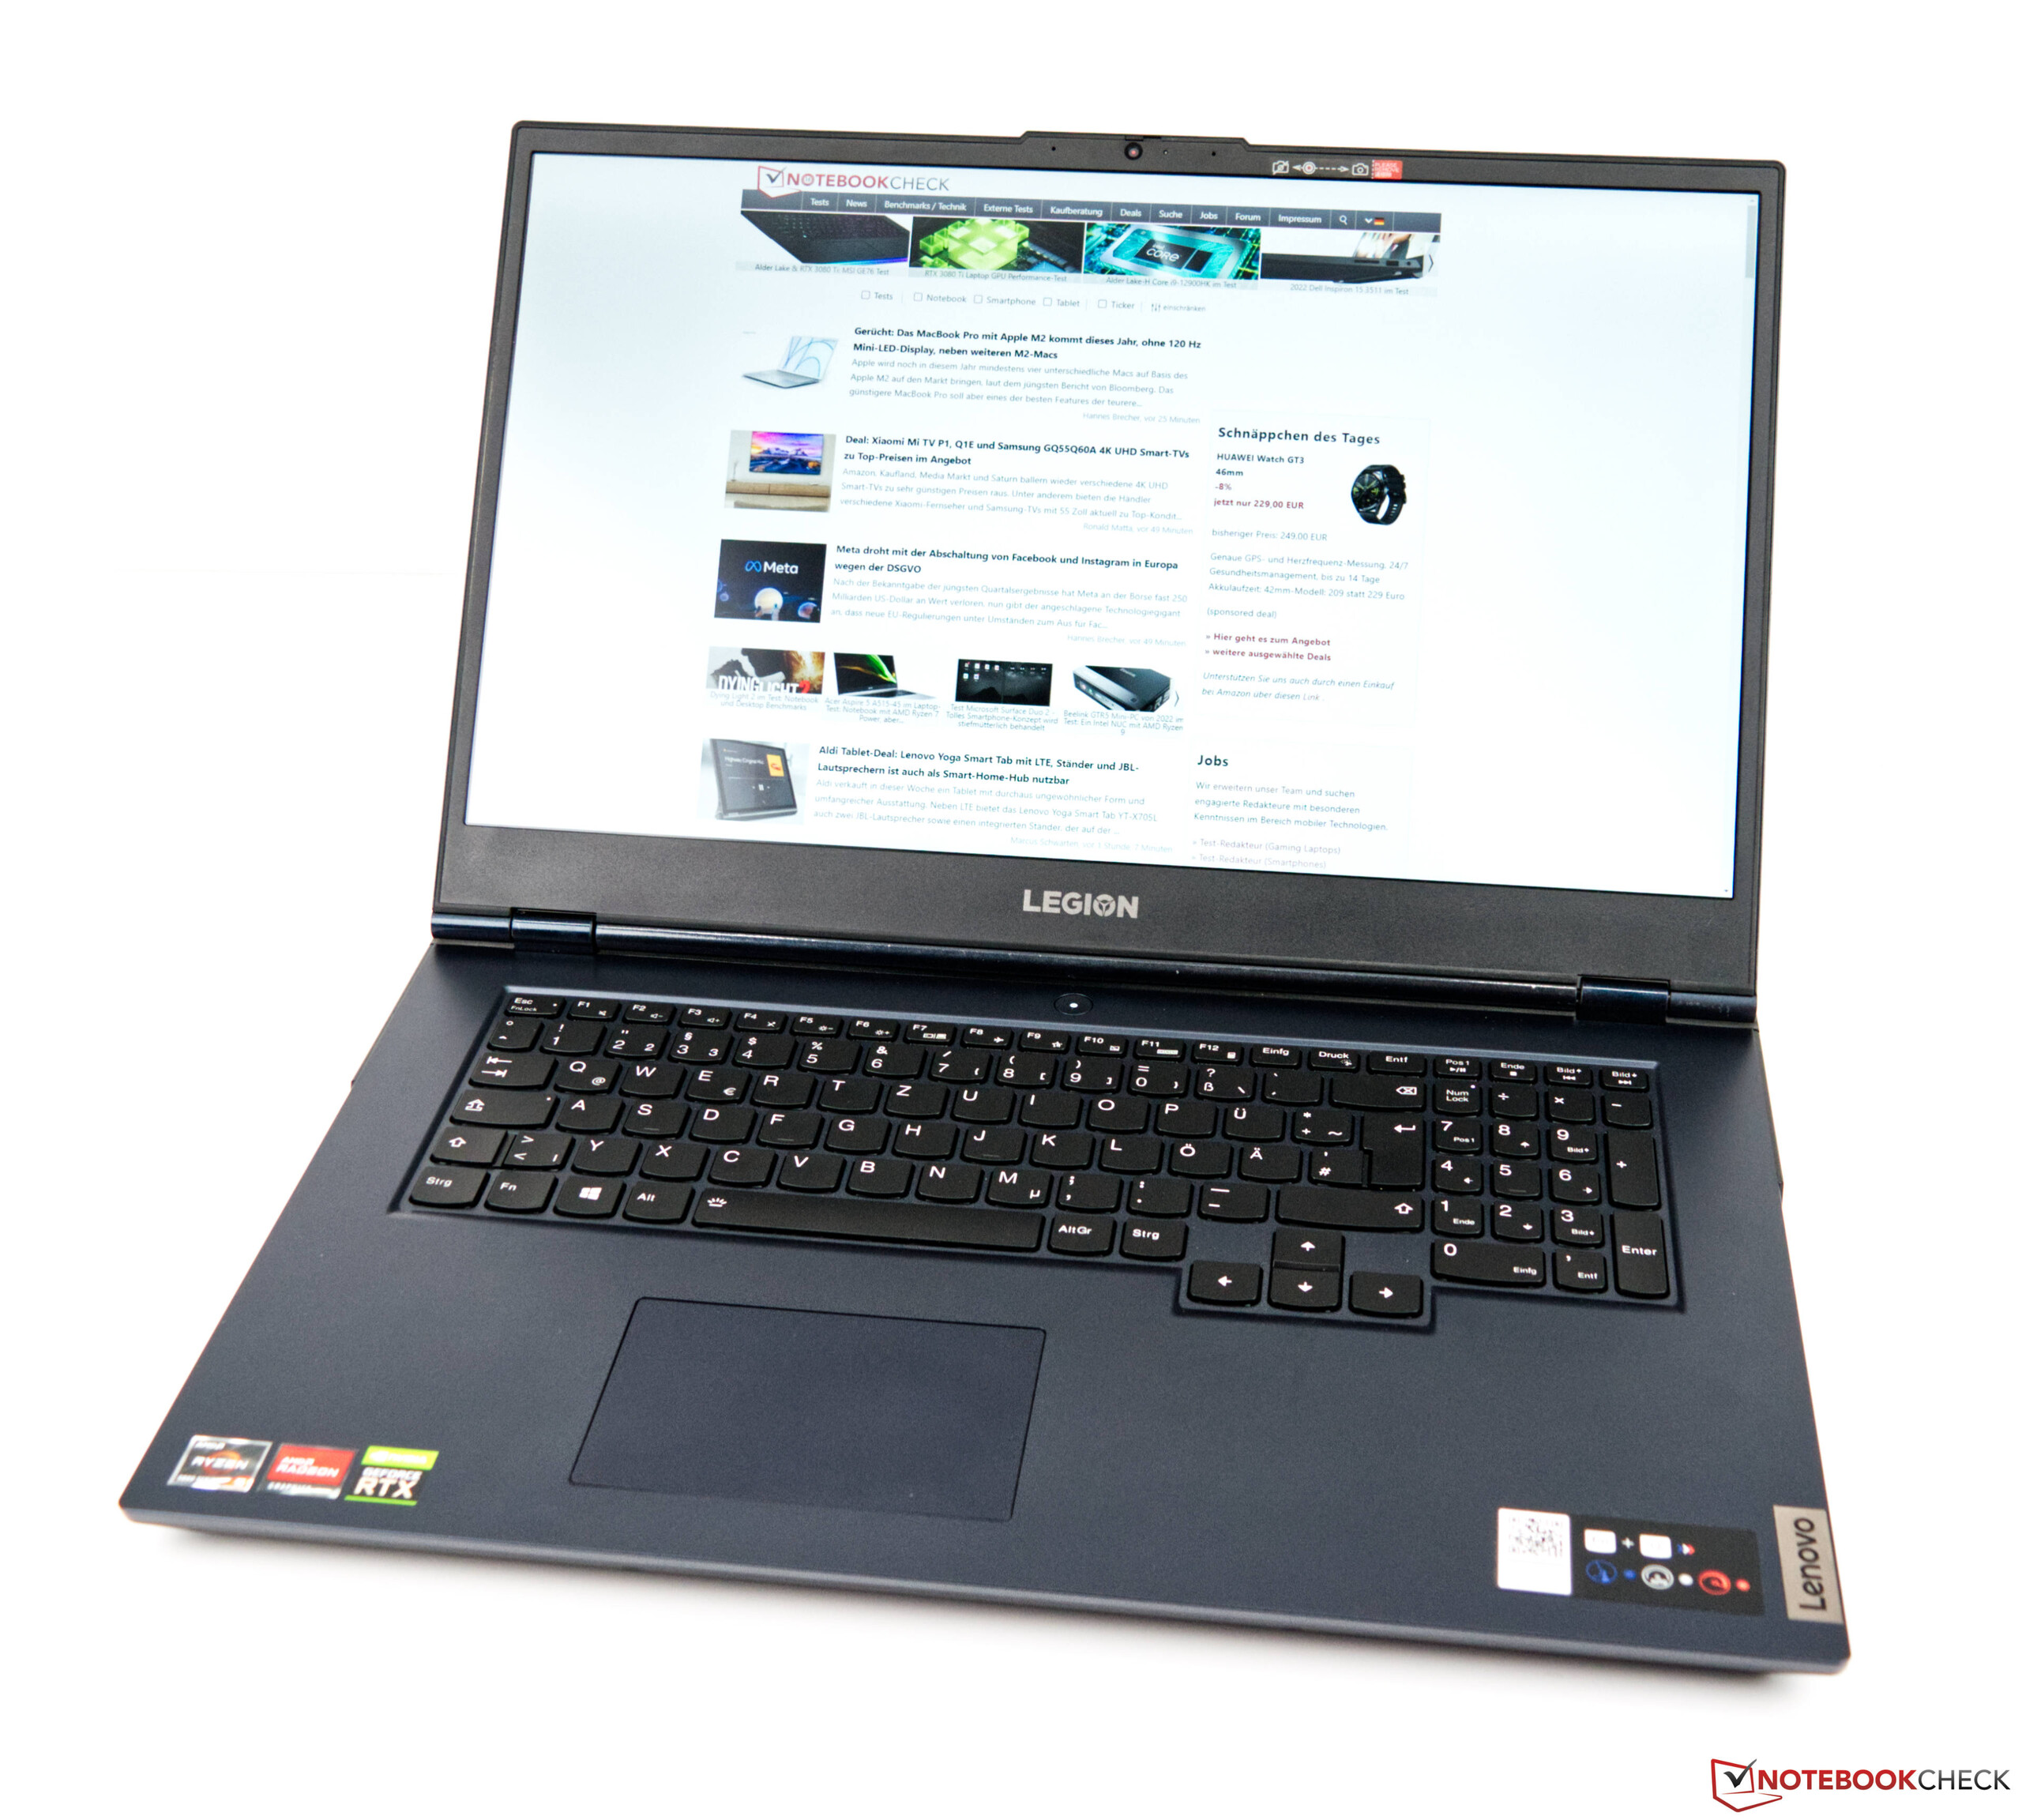
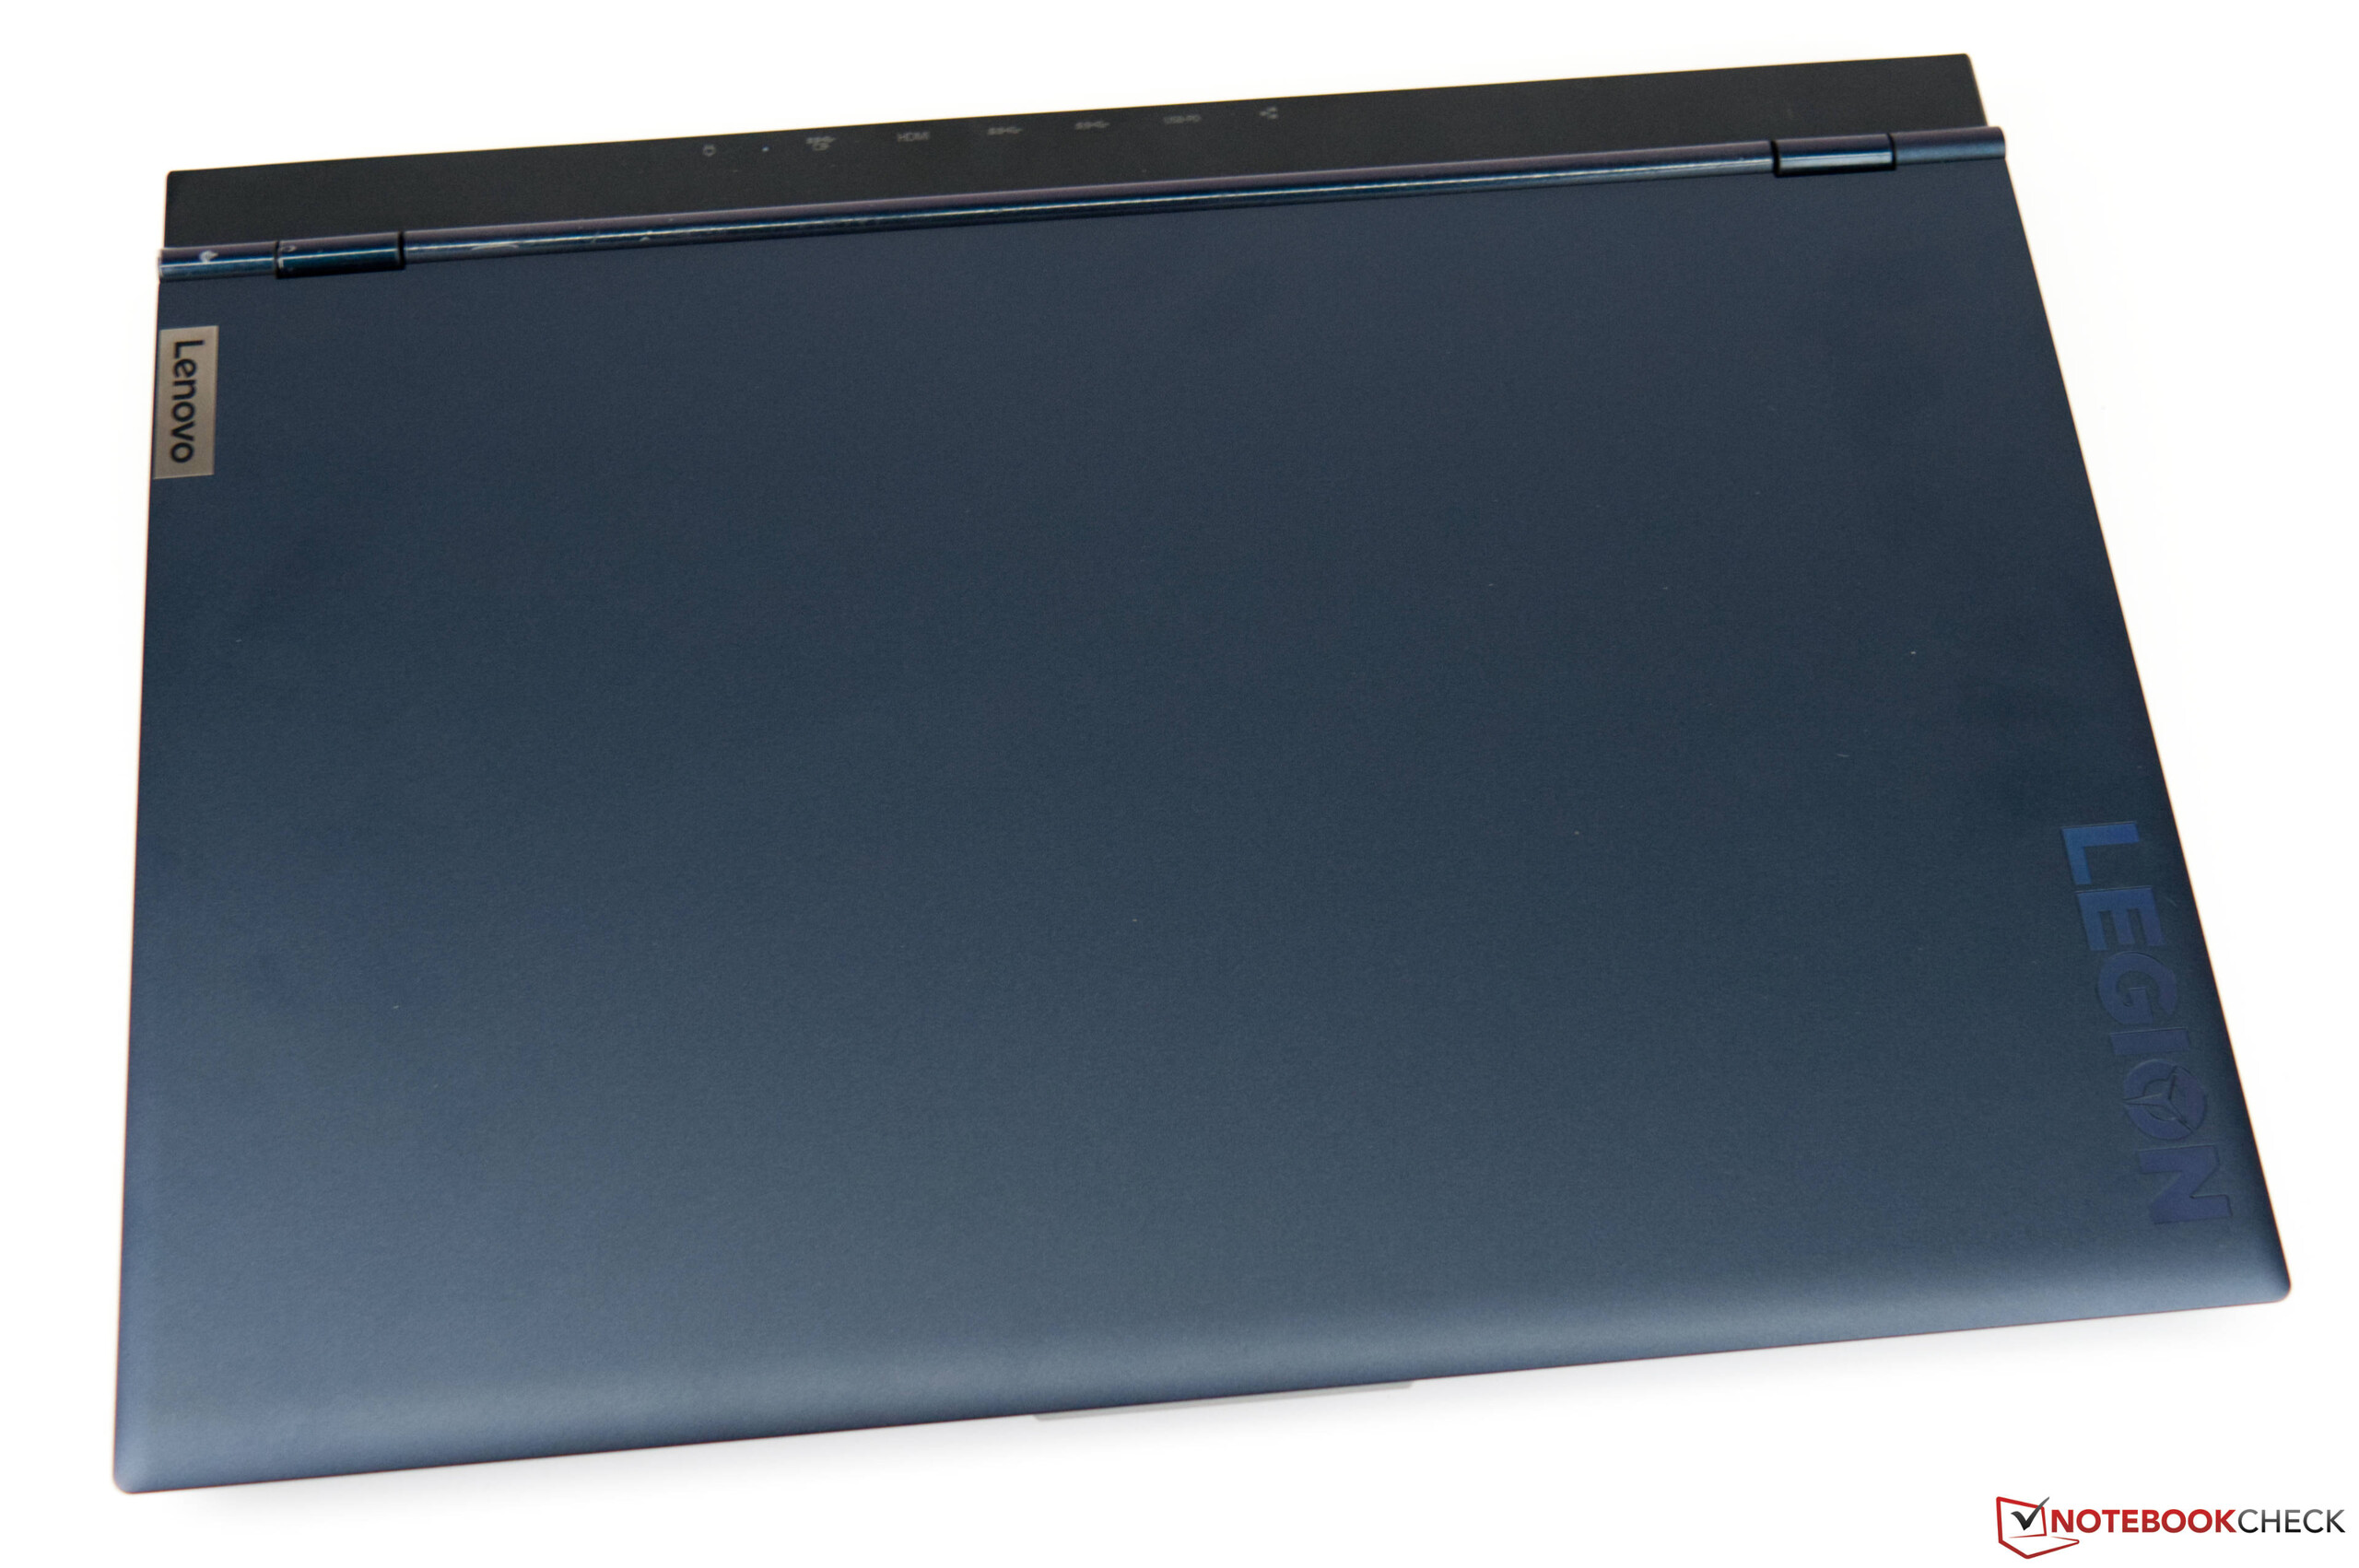
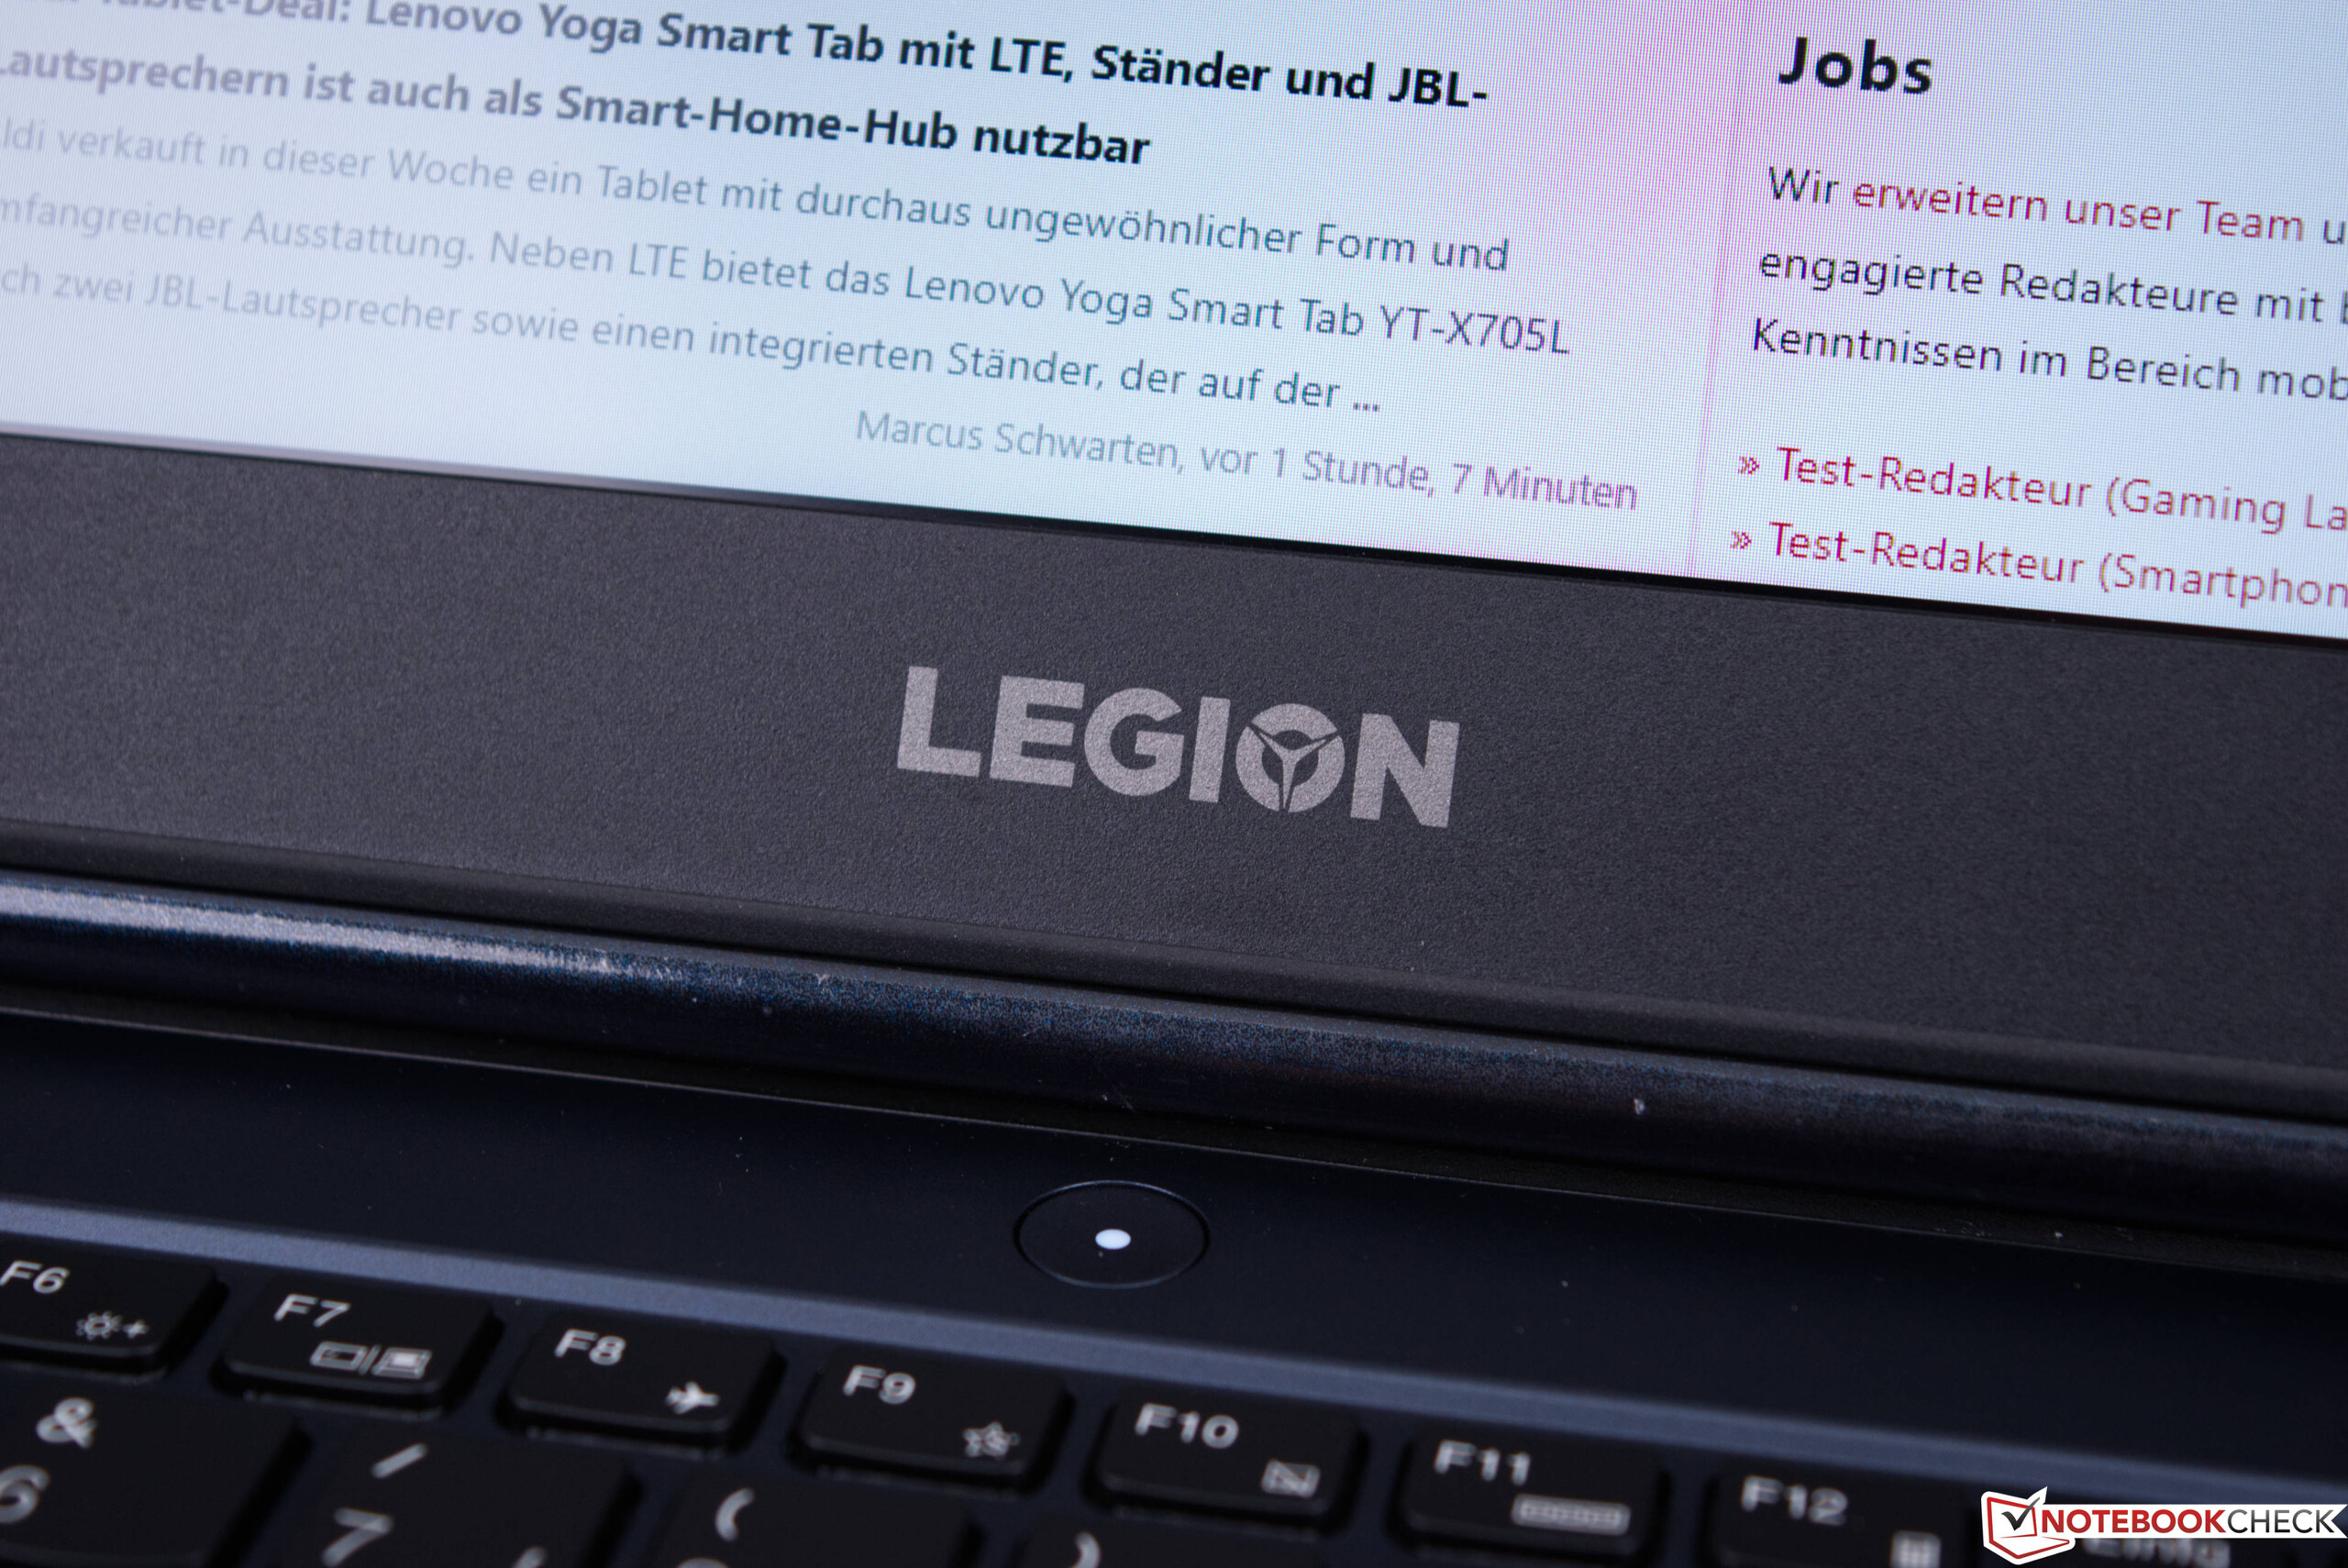
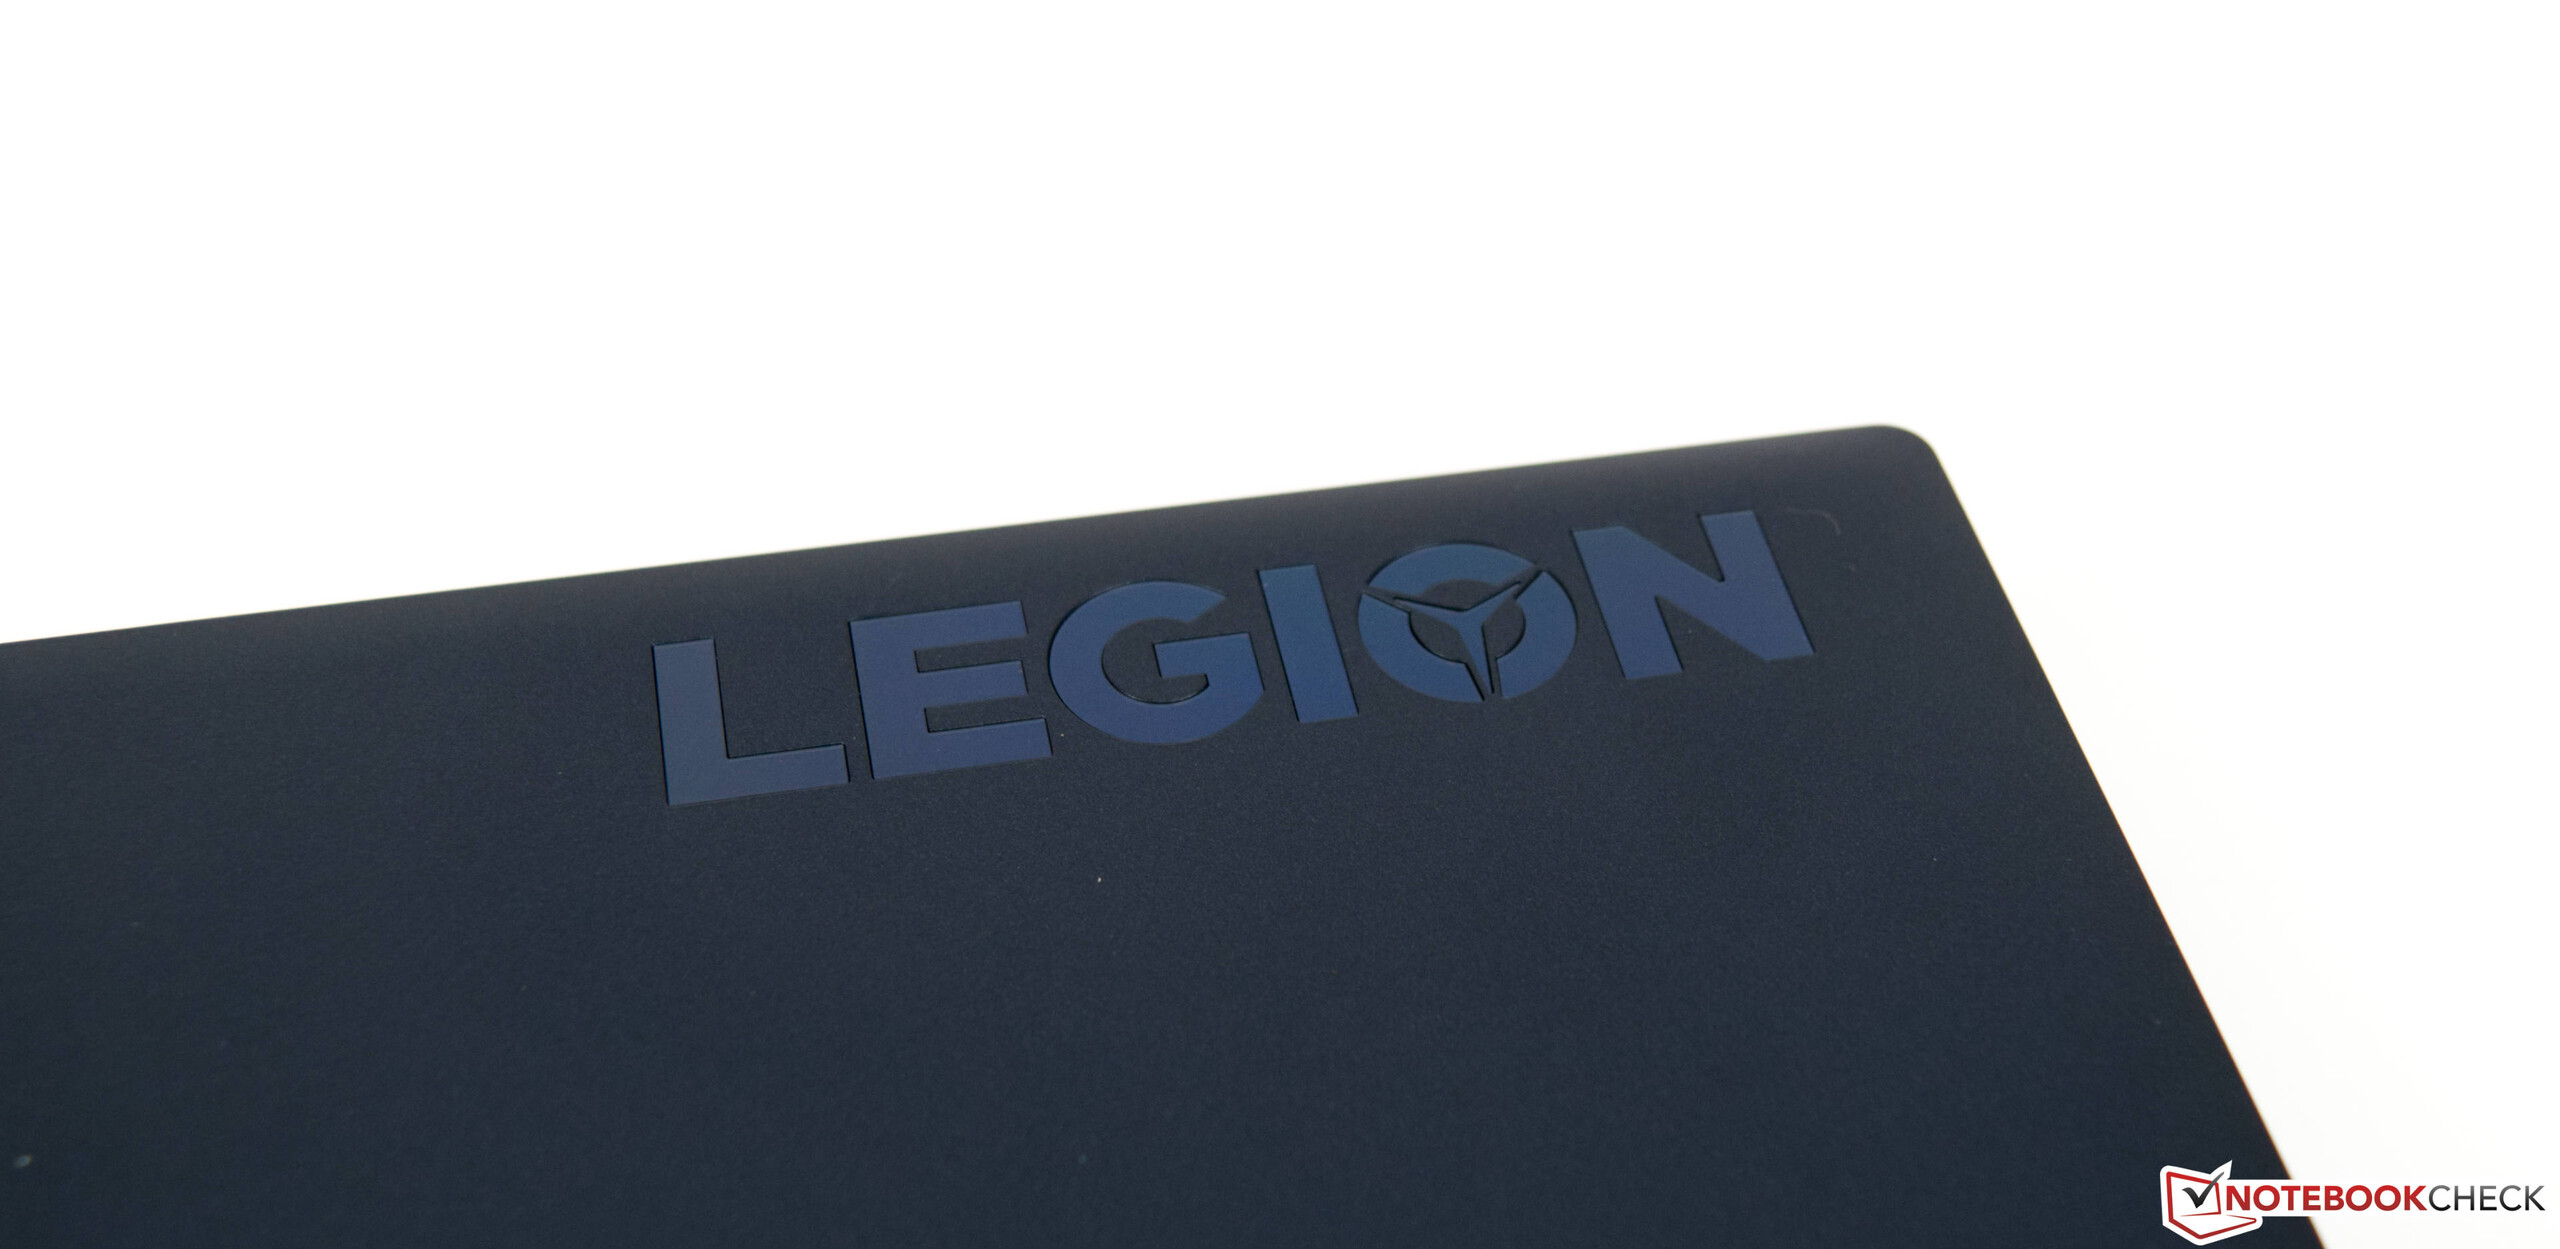
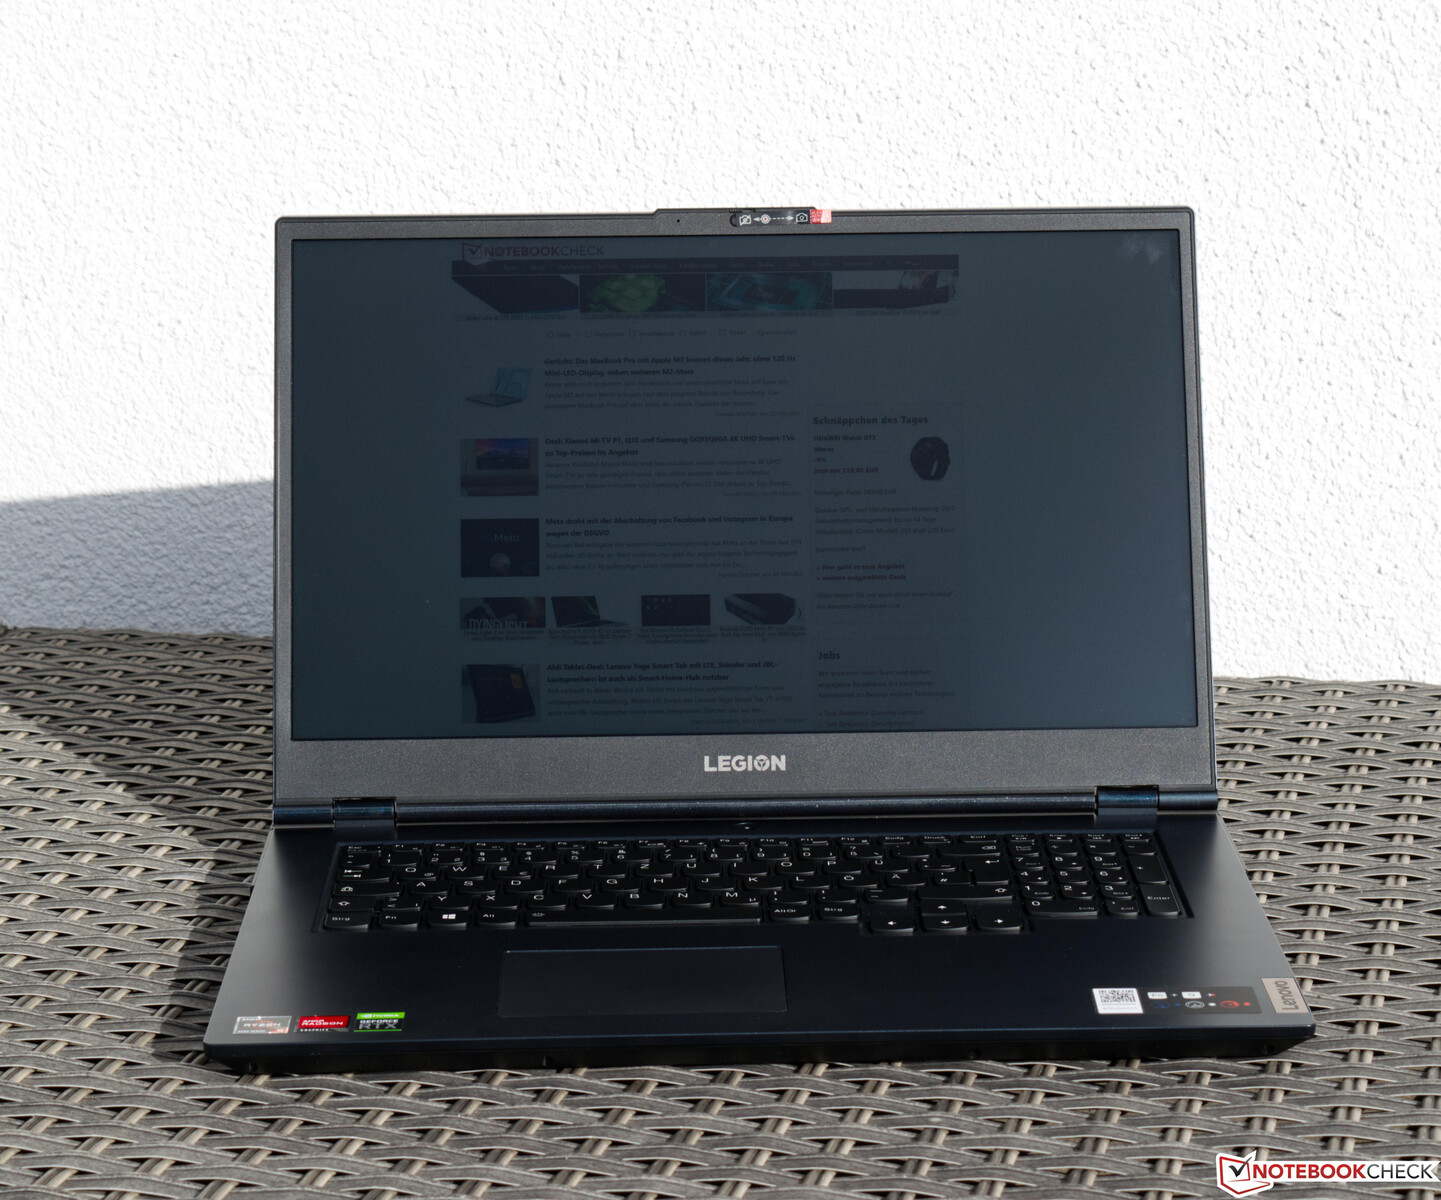
Estetik olarak, Lenovo Legion 5 17, çok açık bir şekilde bir oyun dizüstü bilgisayarıdır. Kapak, Legion logosu şeklindeki görsel vurgularla süslenmiştir. Lenovo Legion 5 17, herhangi bir RGB aydınlatması olmadan gelir. Malzeme seçimi iyi, çünkü cihaz plastik tabanlı yapıya rağmen çok kaliteli hissettiriyor. Taban oldukça sert olmasına rağmen, klavye alanının merkezi baskı altında hafifçe eğiliyor. Ancak bu çok belirgin değil. Maalesef bükülmeye karşı çok hassas olan kapak için de benzer bir sertlik seviyesi görmek isterdik. En azından yoğun basınç uygulamalarına karşı oldukça dayanıklıdır. Kapak, maksimum 180 ° 'lik geniş bir açıya kadar açılabilir. İki menteşe sallanmayı güvenilir bir şekilde önler. Ek olarak, taban tek elle açılmak için yeterince ağırdır.
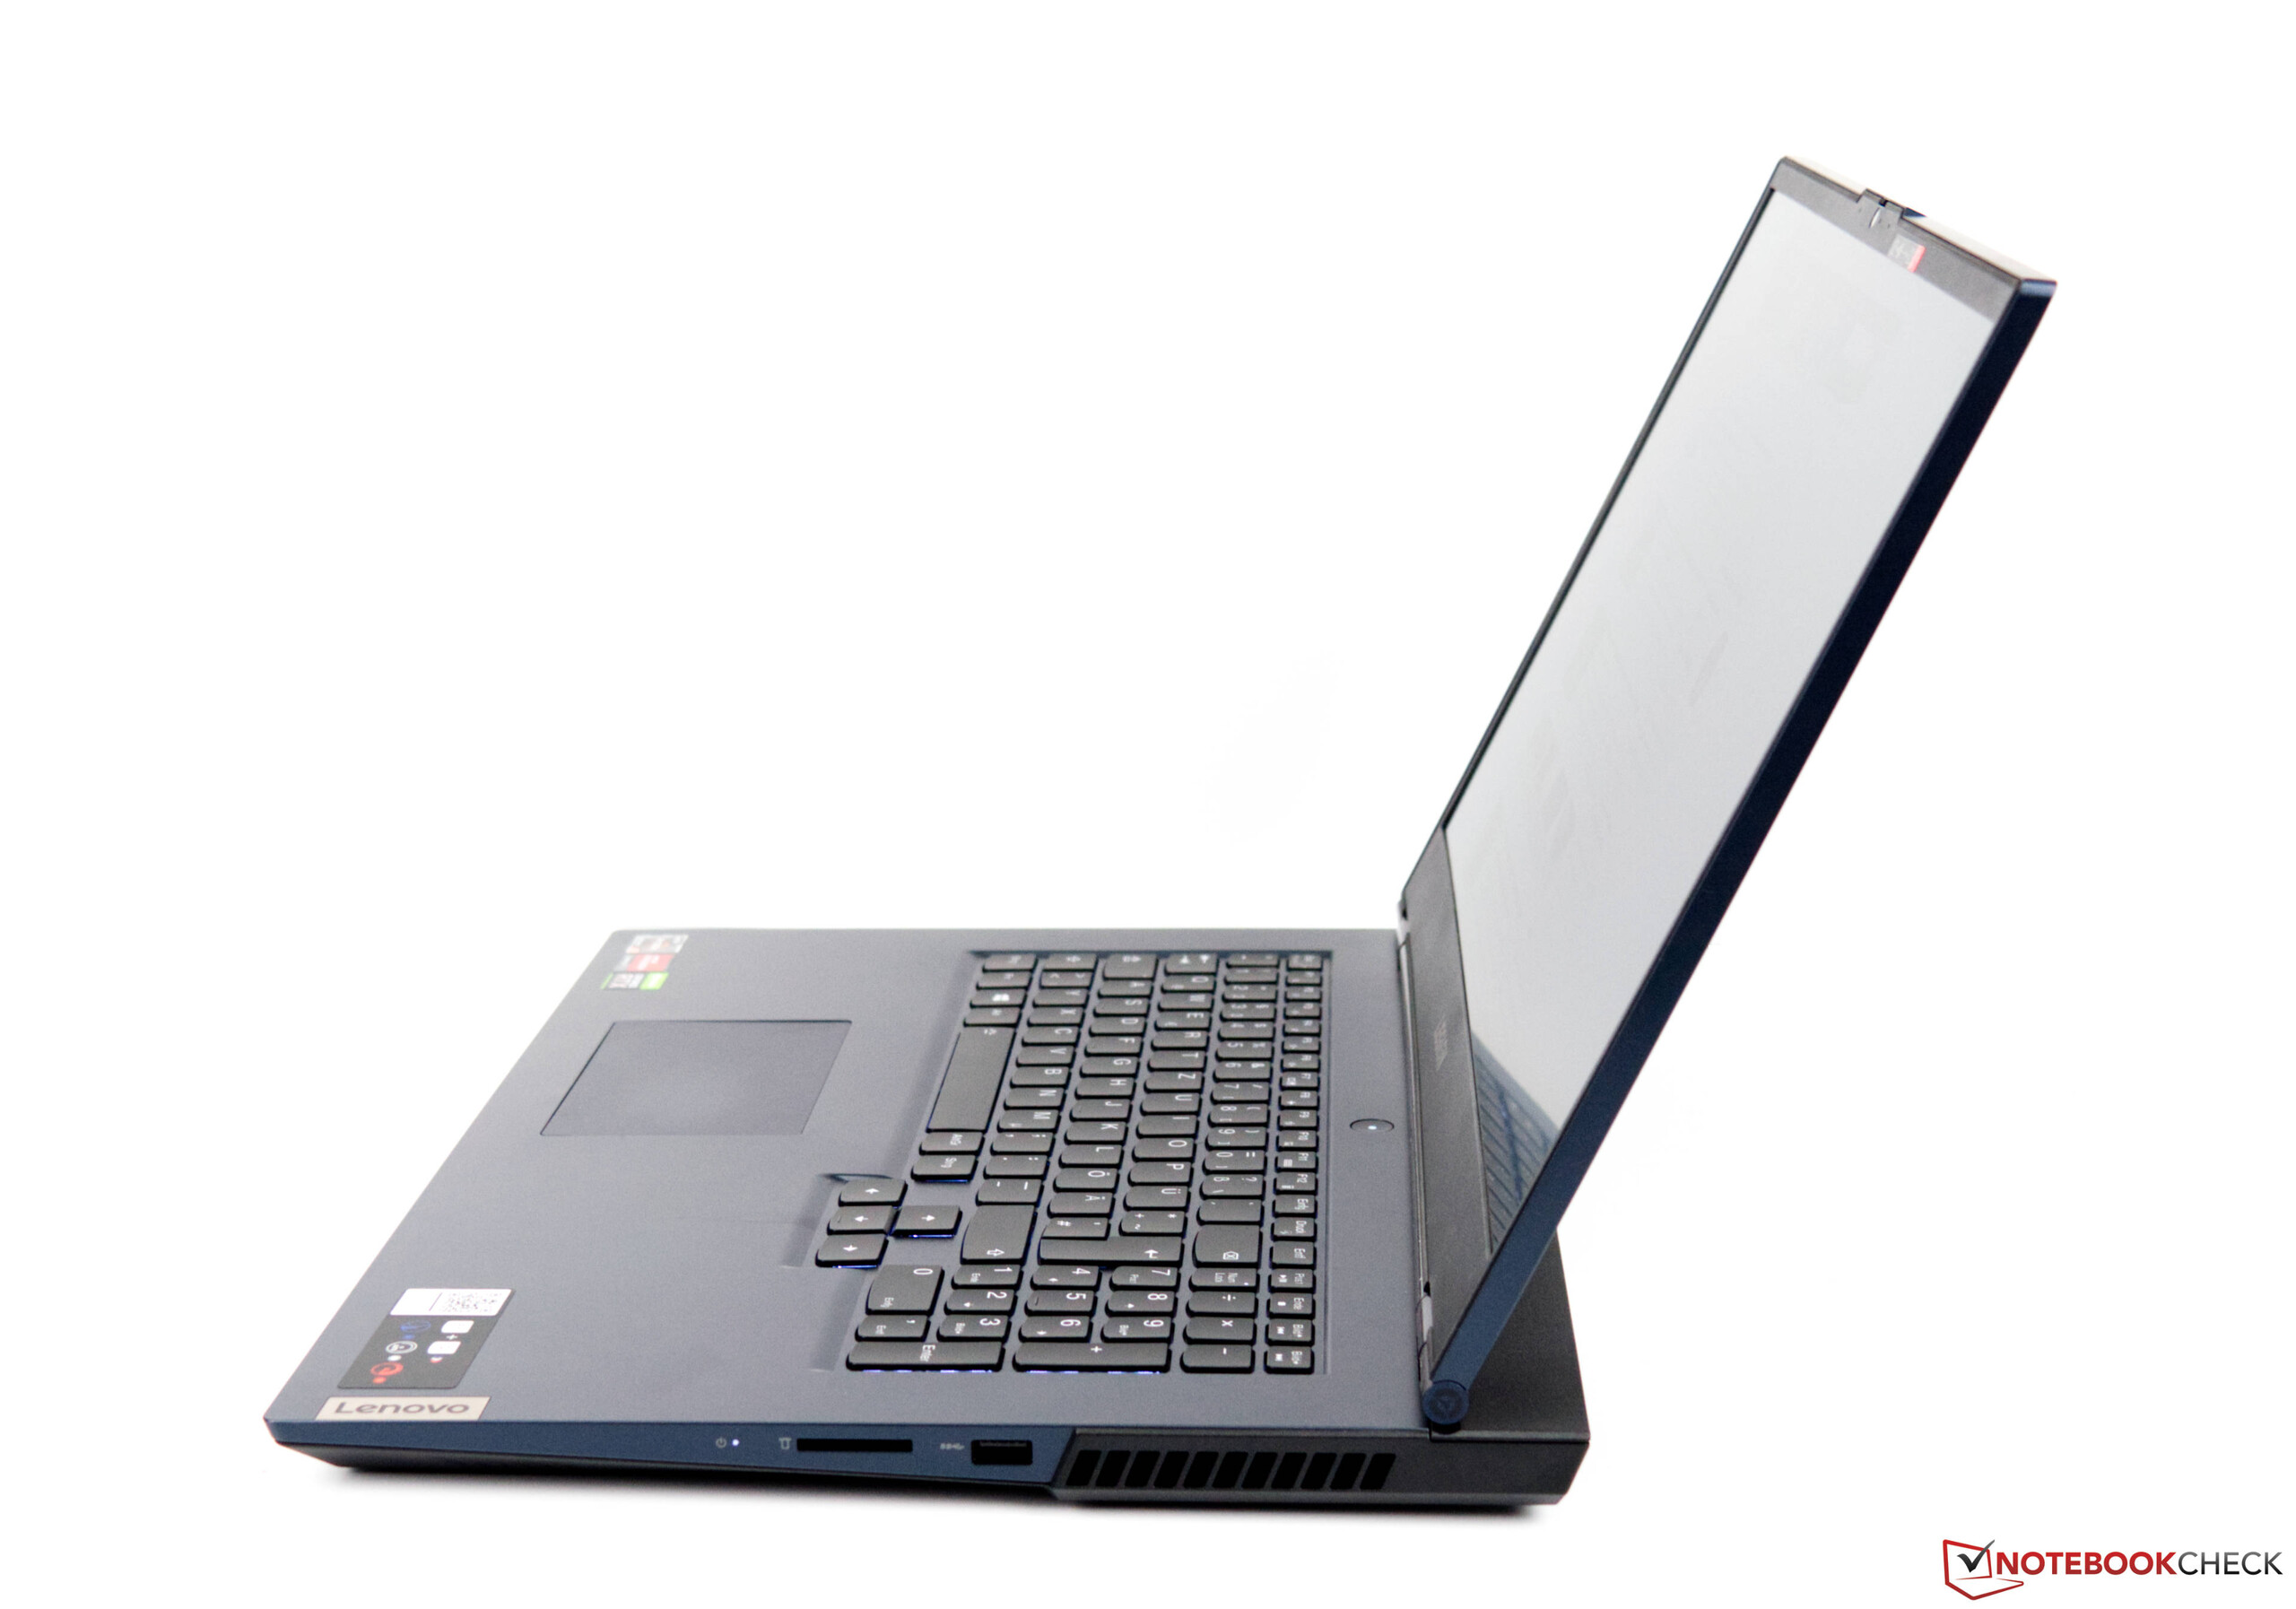
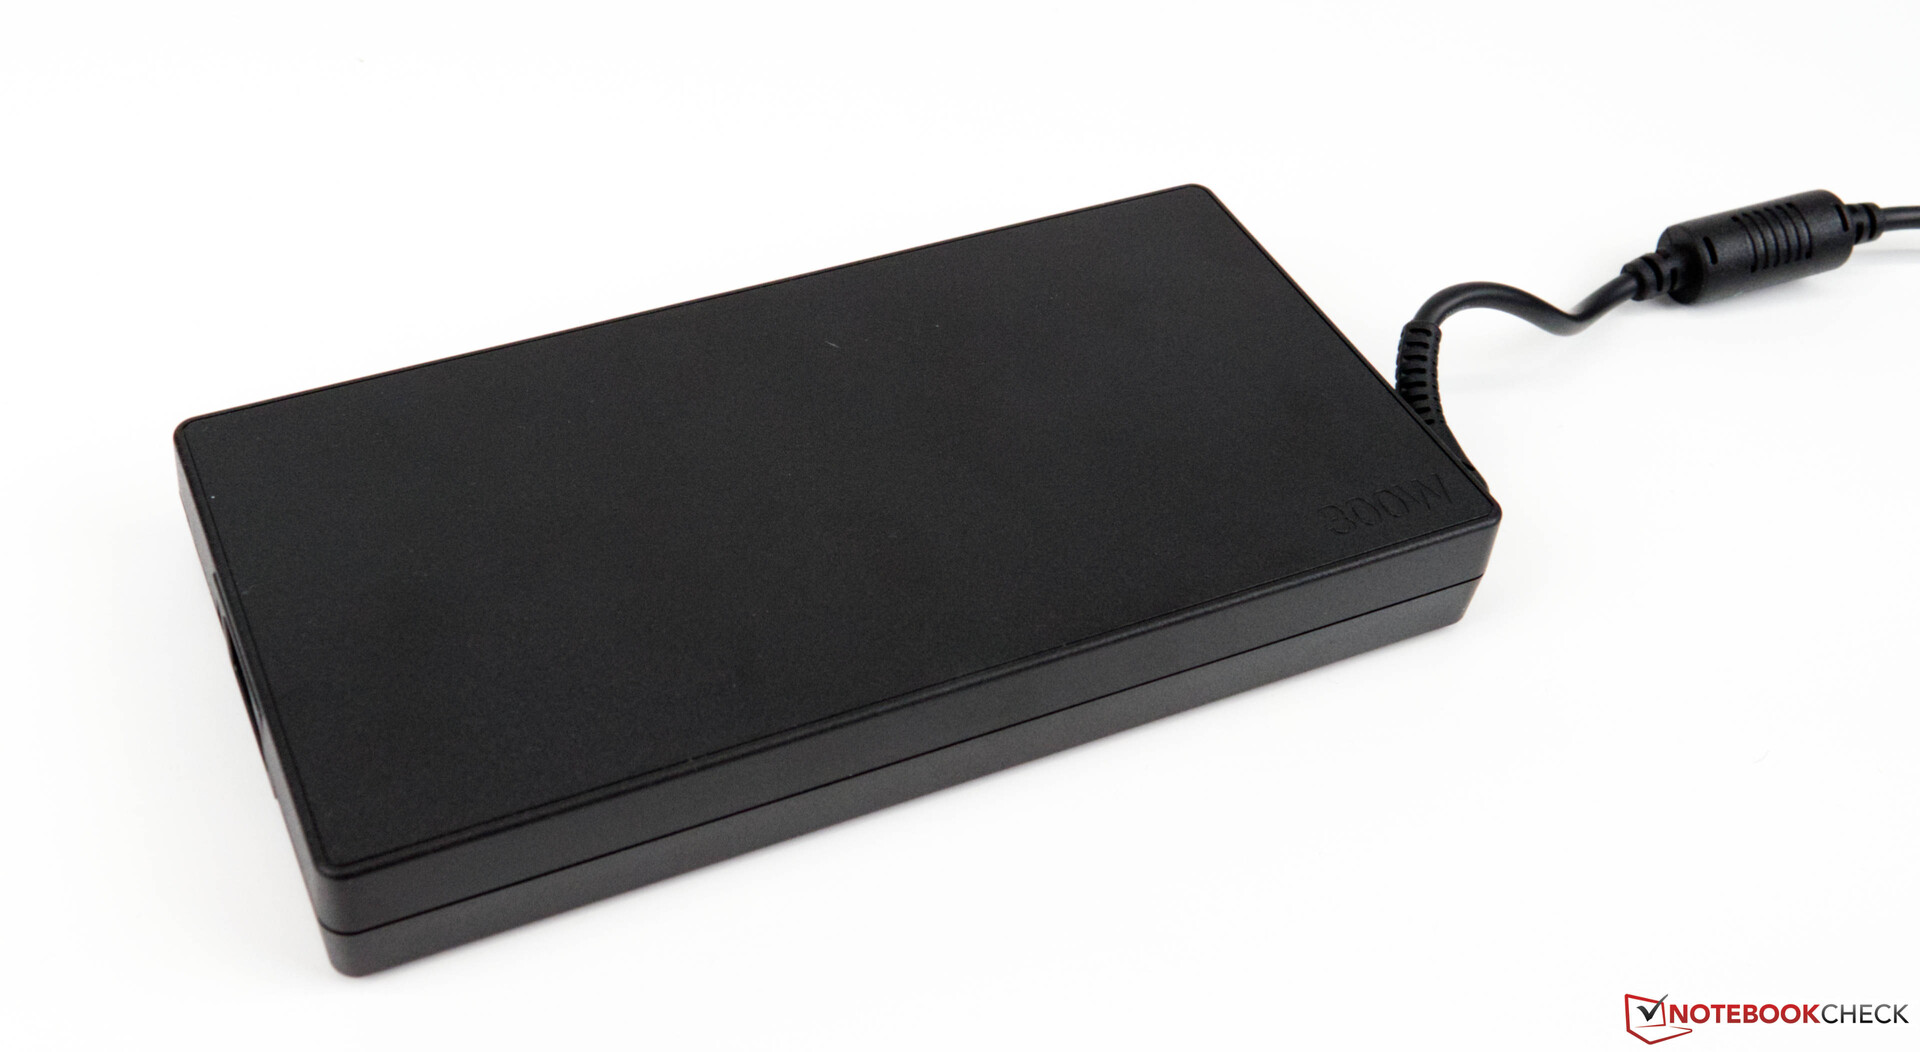
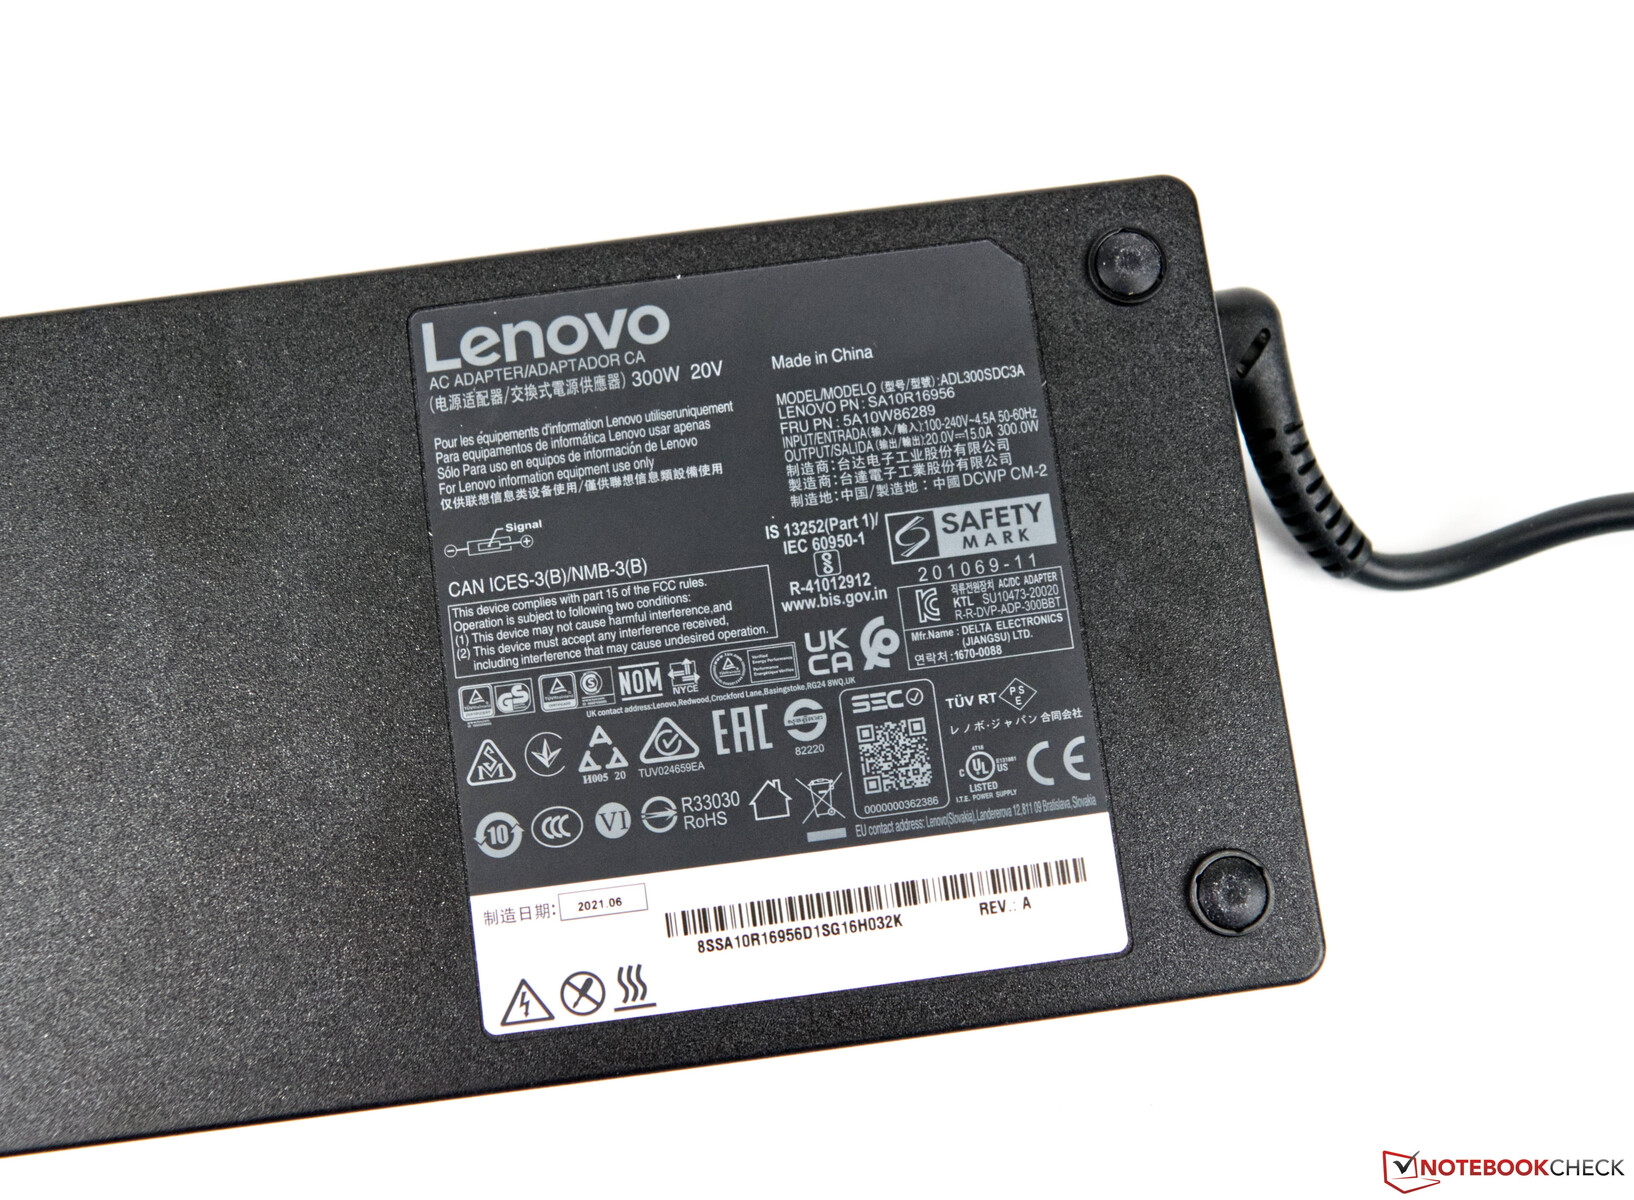
3,1 kg (~6,83 lbs) ağırlığıyla Lenovo Legion 5 17, rakiplerinden önemli ölçüde daha ağırdır. Benzer şekilde, test birimimizin kapladığı alan daha büyüktür. Hem ince hem de güçlü olan 300 watt'lık AC adaptör, bir kilogramın (~ 2,2 lbs) biraz üzerindedir.
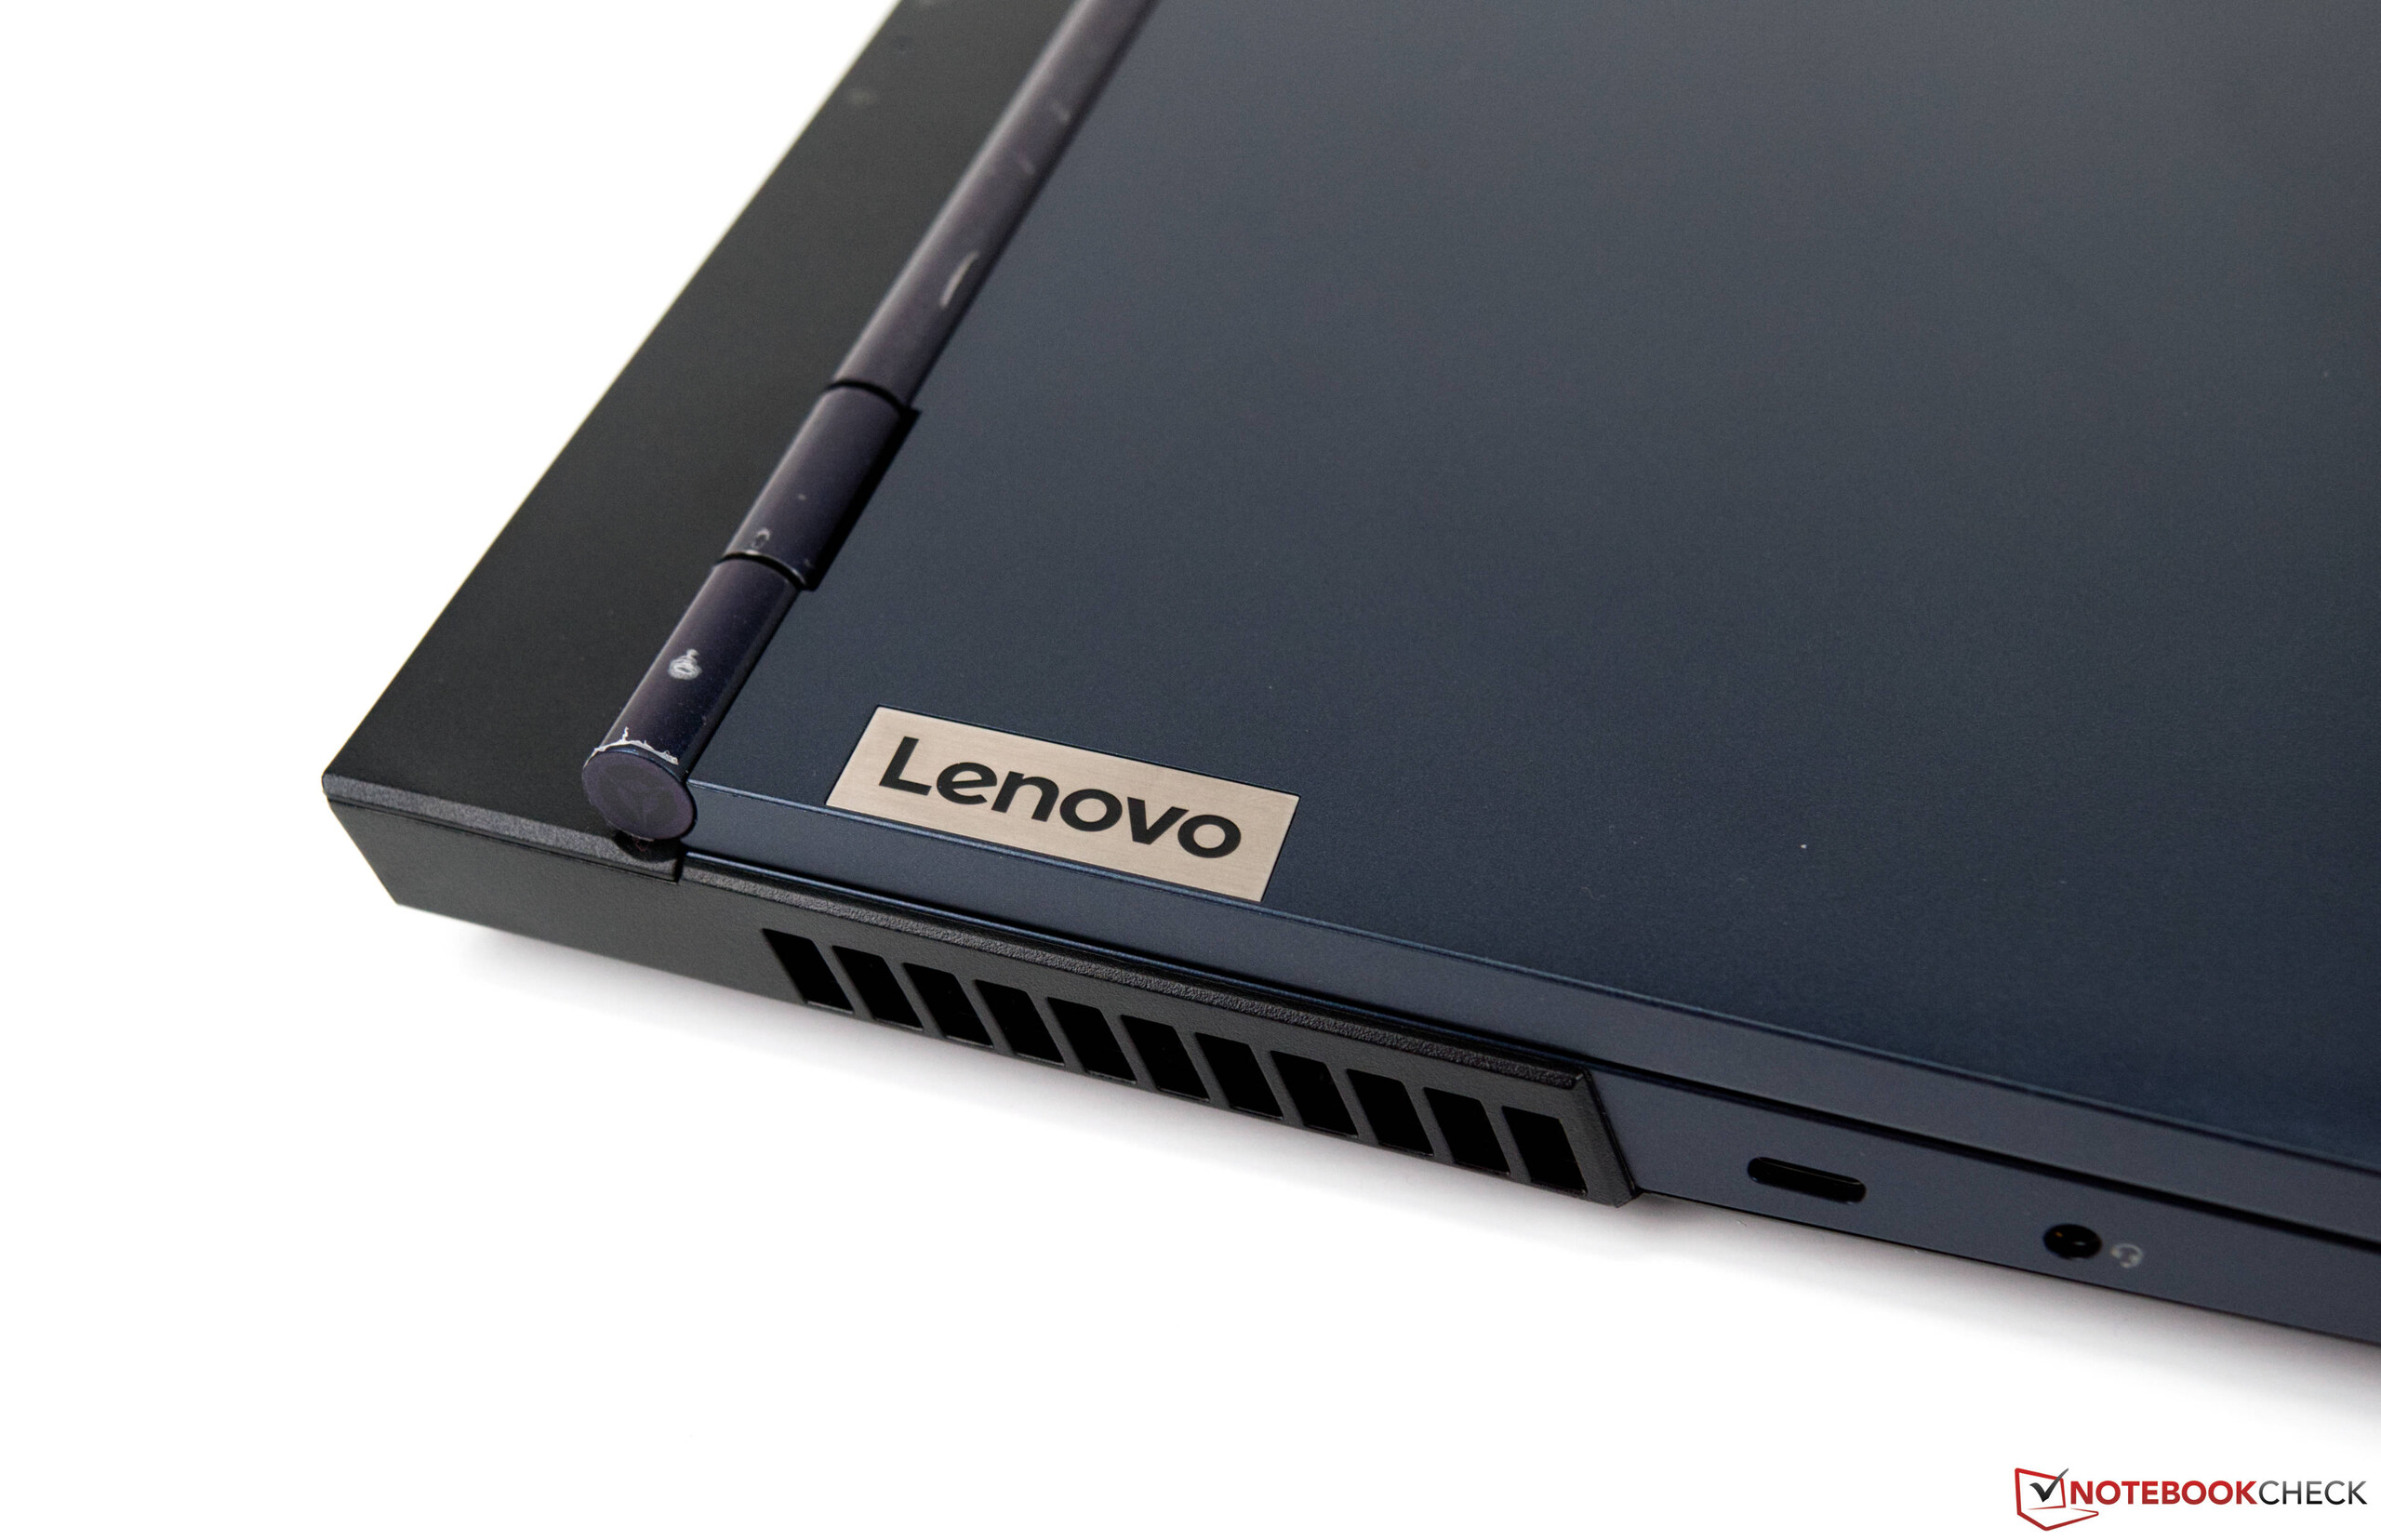
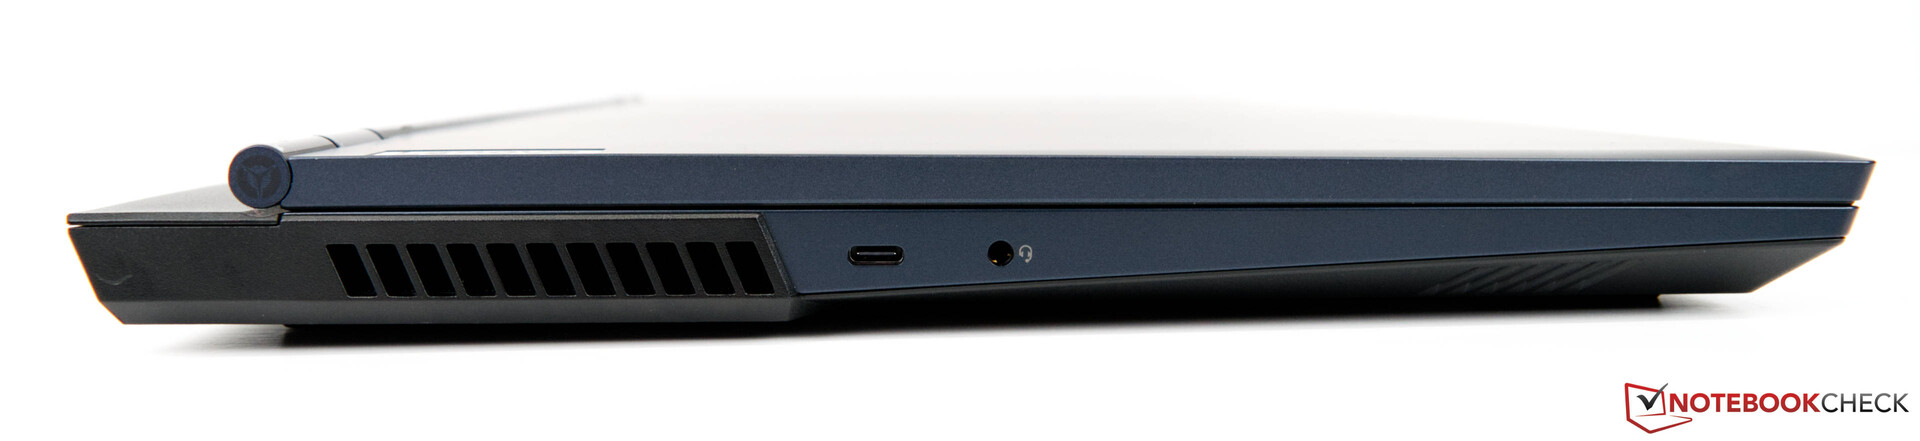
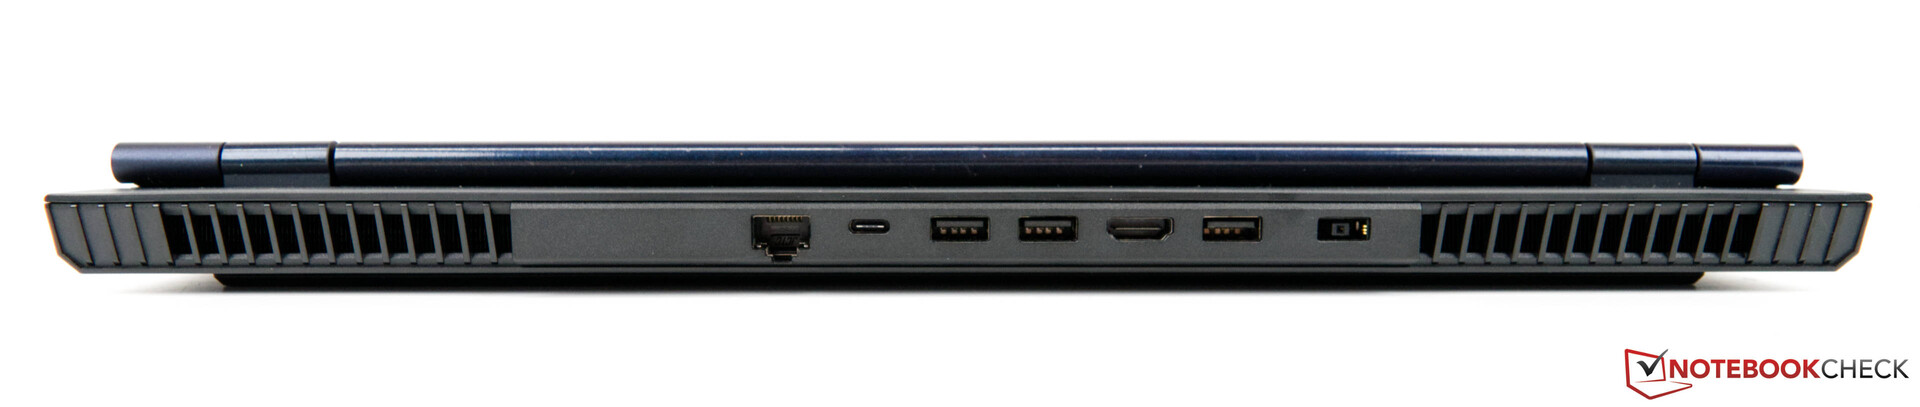
Bağlanabilirlik
Bağlantı noktası seçimi söz konusu olduğunda, Lenovo Legion 5 17, çok çeşitli bağlantı noktaları ve mantıklı bir düzen sunar. Bağlantı noktalarının çoğu arkada. Ancak yine de her iki tarafta birer USB bağlantı noktası ve bir SD kart okuyucu var. Cihazın arkasındaki alan, bağlantı noktalarını daha uzak tutmak ve özellikle USB bağlantı noktalarına nefes almak için biraz daha fazla alan sağlamak için kullanılmış olabileceğinden, iyileştirme için hala biraz alan var.
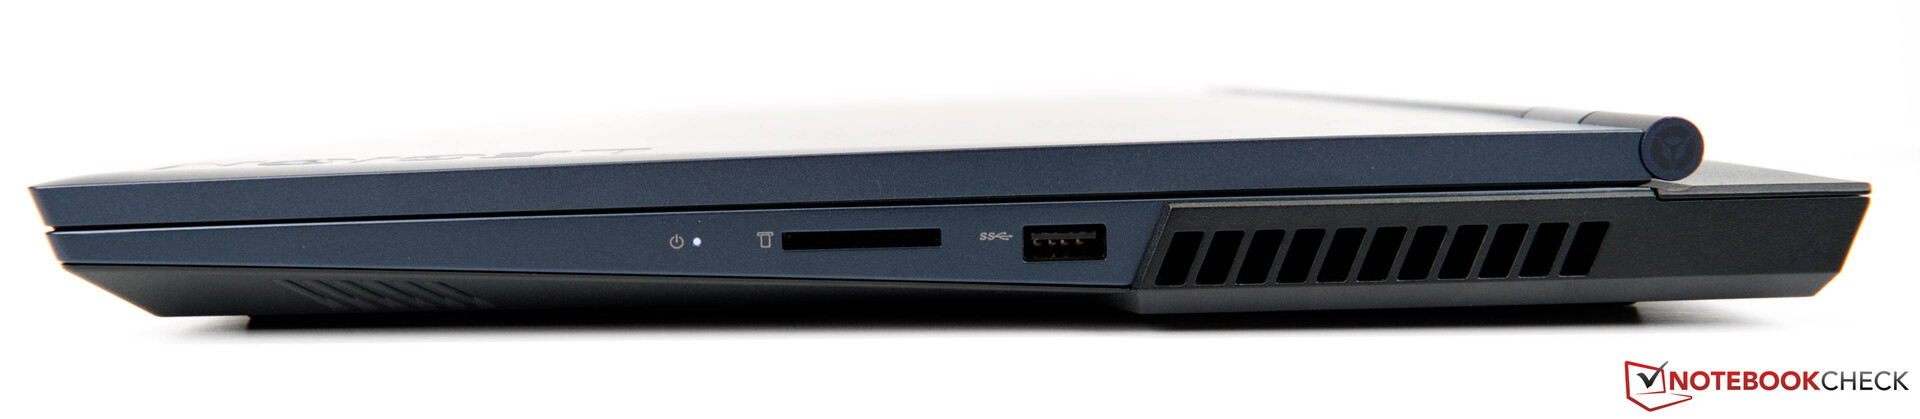
SD Kart Okuyucu
Lenovo Legion Y740-17IRHg'den farklı olarak Lenovo, Legion 5 17'yi bir kez daha tam boyutlu bir SD kart okuyucu ile donattı. USB 3.0 hızları sunar ve sıralı okuma karşılaştırmamız sırasında 90 MB/sn'ye yakındır. Bu amaçla referans kartımızı (Angelbird AV Pro V60) kullandık.
| SD Card Reader | |
| average JPG Copy Test (av. of 3 runs) | |
| Sınıf ortalaması Gaming (20.9 - 210, n=54, son 2 yıl) | |
| Lenovo Legion 5 17ACH6H-82JY0003GE (AV Pro SD microSD 128 GB V60) | |
| Schenker XMG Core 17 (Early 2021) (AV PRO microSD 128 GB V60) | |
| maximum AS SSD Seq Read Test (1GB) | |
| Sınıf ortalaması Gaming (25.5 - 261, n=51, son 2 yıl) | |
| Lenovo Legion 5 17ACH6H-82JY0003GE (AV Pro SD microSD 128 GB V60) | |
| Schenker XMG Core 17 (Early 2021) (AV PRO microSD 128 GB V60) | |
İletişim
Lenovo Legion 5 17, bir Realtek Wi-Fi modülü ile donatılmıştır. Testimizde, Wi-Fi modülü günlük kullanım için yeterince iyi performans gösteriyor. Hızlı Intel modülleriyle donatılmış rakiplerle karşılaştırıldığında, test örneğimiz önemli ölçüde daha kötü performans gösteriyor. Genel olarak, Realtek Wi-Fi modülünün performansı, oyun sınıfı ortalama sonuçlarına kıyasla geride kalıyor.
| Networking | |
| iperf3 transmit AX12 | |
| Schenker XMG Core 17 (Early 2021) | |
| MSI Katana GF76 11UE | |
| Gigabyte A7 X1 | |
| Lenovo Legion 5 17ACH6H-82JY0003GE | |
| Schenker XMG Apex 17 M21 | |
| Ortalama RealTek Semiconductor RTL8852AE (424 - 928, n=20) | |
| Asus TUF Gaming F17 FX706HM | |
| iperf3 receive AX12 | |
| Schenker XMG Core 17 (Early 2021) | |
| Gigabyte A7 X1 | |
| MSI Katana GF76 11UE | |
| Schenker XMG Apex 17 M21 | |
| Ortalama RealTek Semiconductor RTL8852AE (621 - 877, n=20) | |
| Lenovo Legion 5 17ACH6H-82JY0003GE | |
| Asus TUF Gaming F17 FX706HM | |
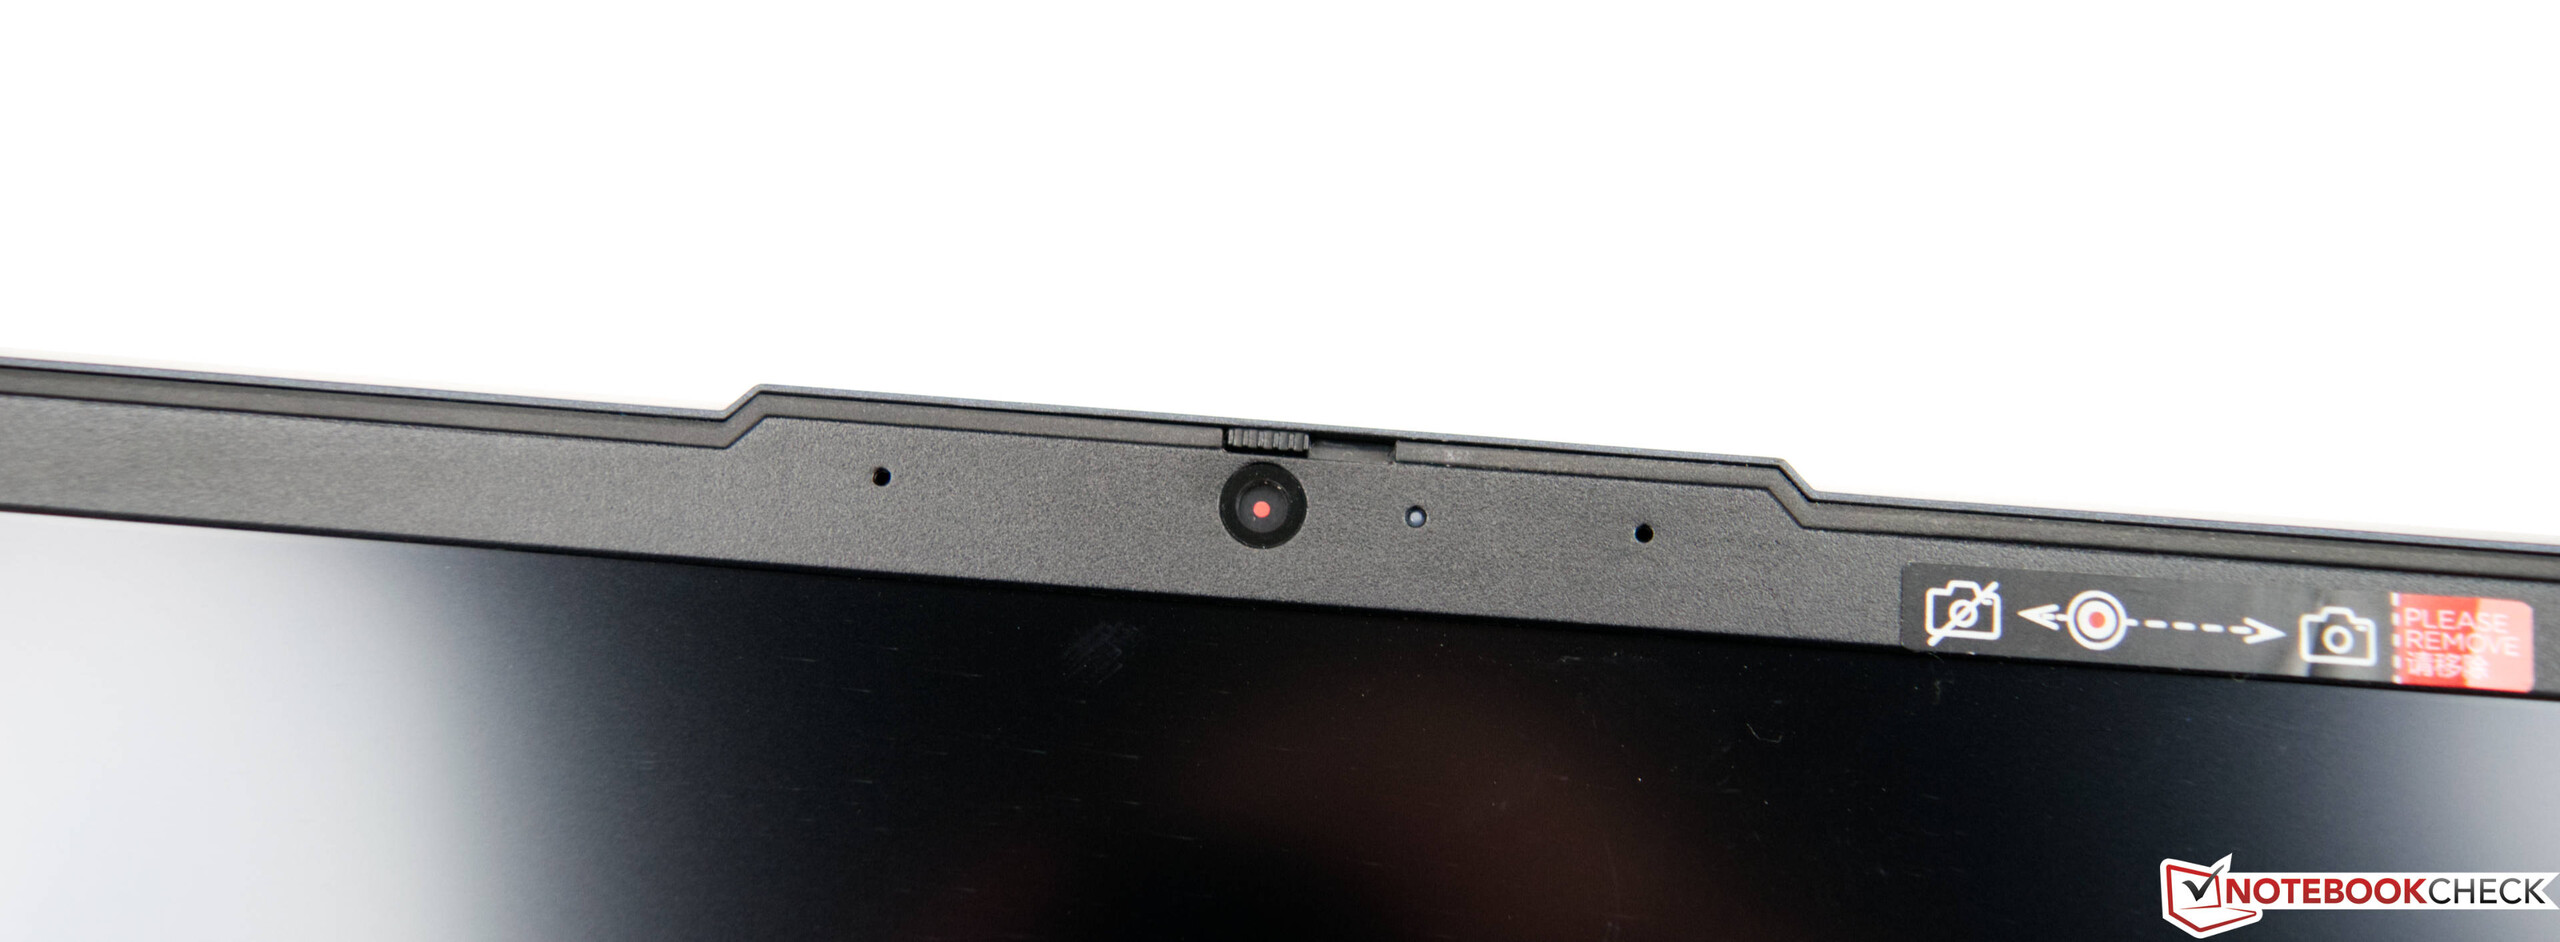
Kamera
Piyasada iyi web kamerası kalitesine sahip oyun dizüstü bilgisayarları yok denecek kadar azdır. Sonuç olarak, Lenovo Legion 5 17, resimlerde görüldüğü gibi renk doğruluğu ve keskinliği açısından eksiktir.


Aksesuarlar
Kutu, 1 kg'a (~ 2,2 lbs) yakın ağırlığa sahip 300 watt'lık bir AC adaptörü ve birkaç broşür içerir.
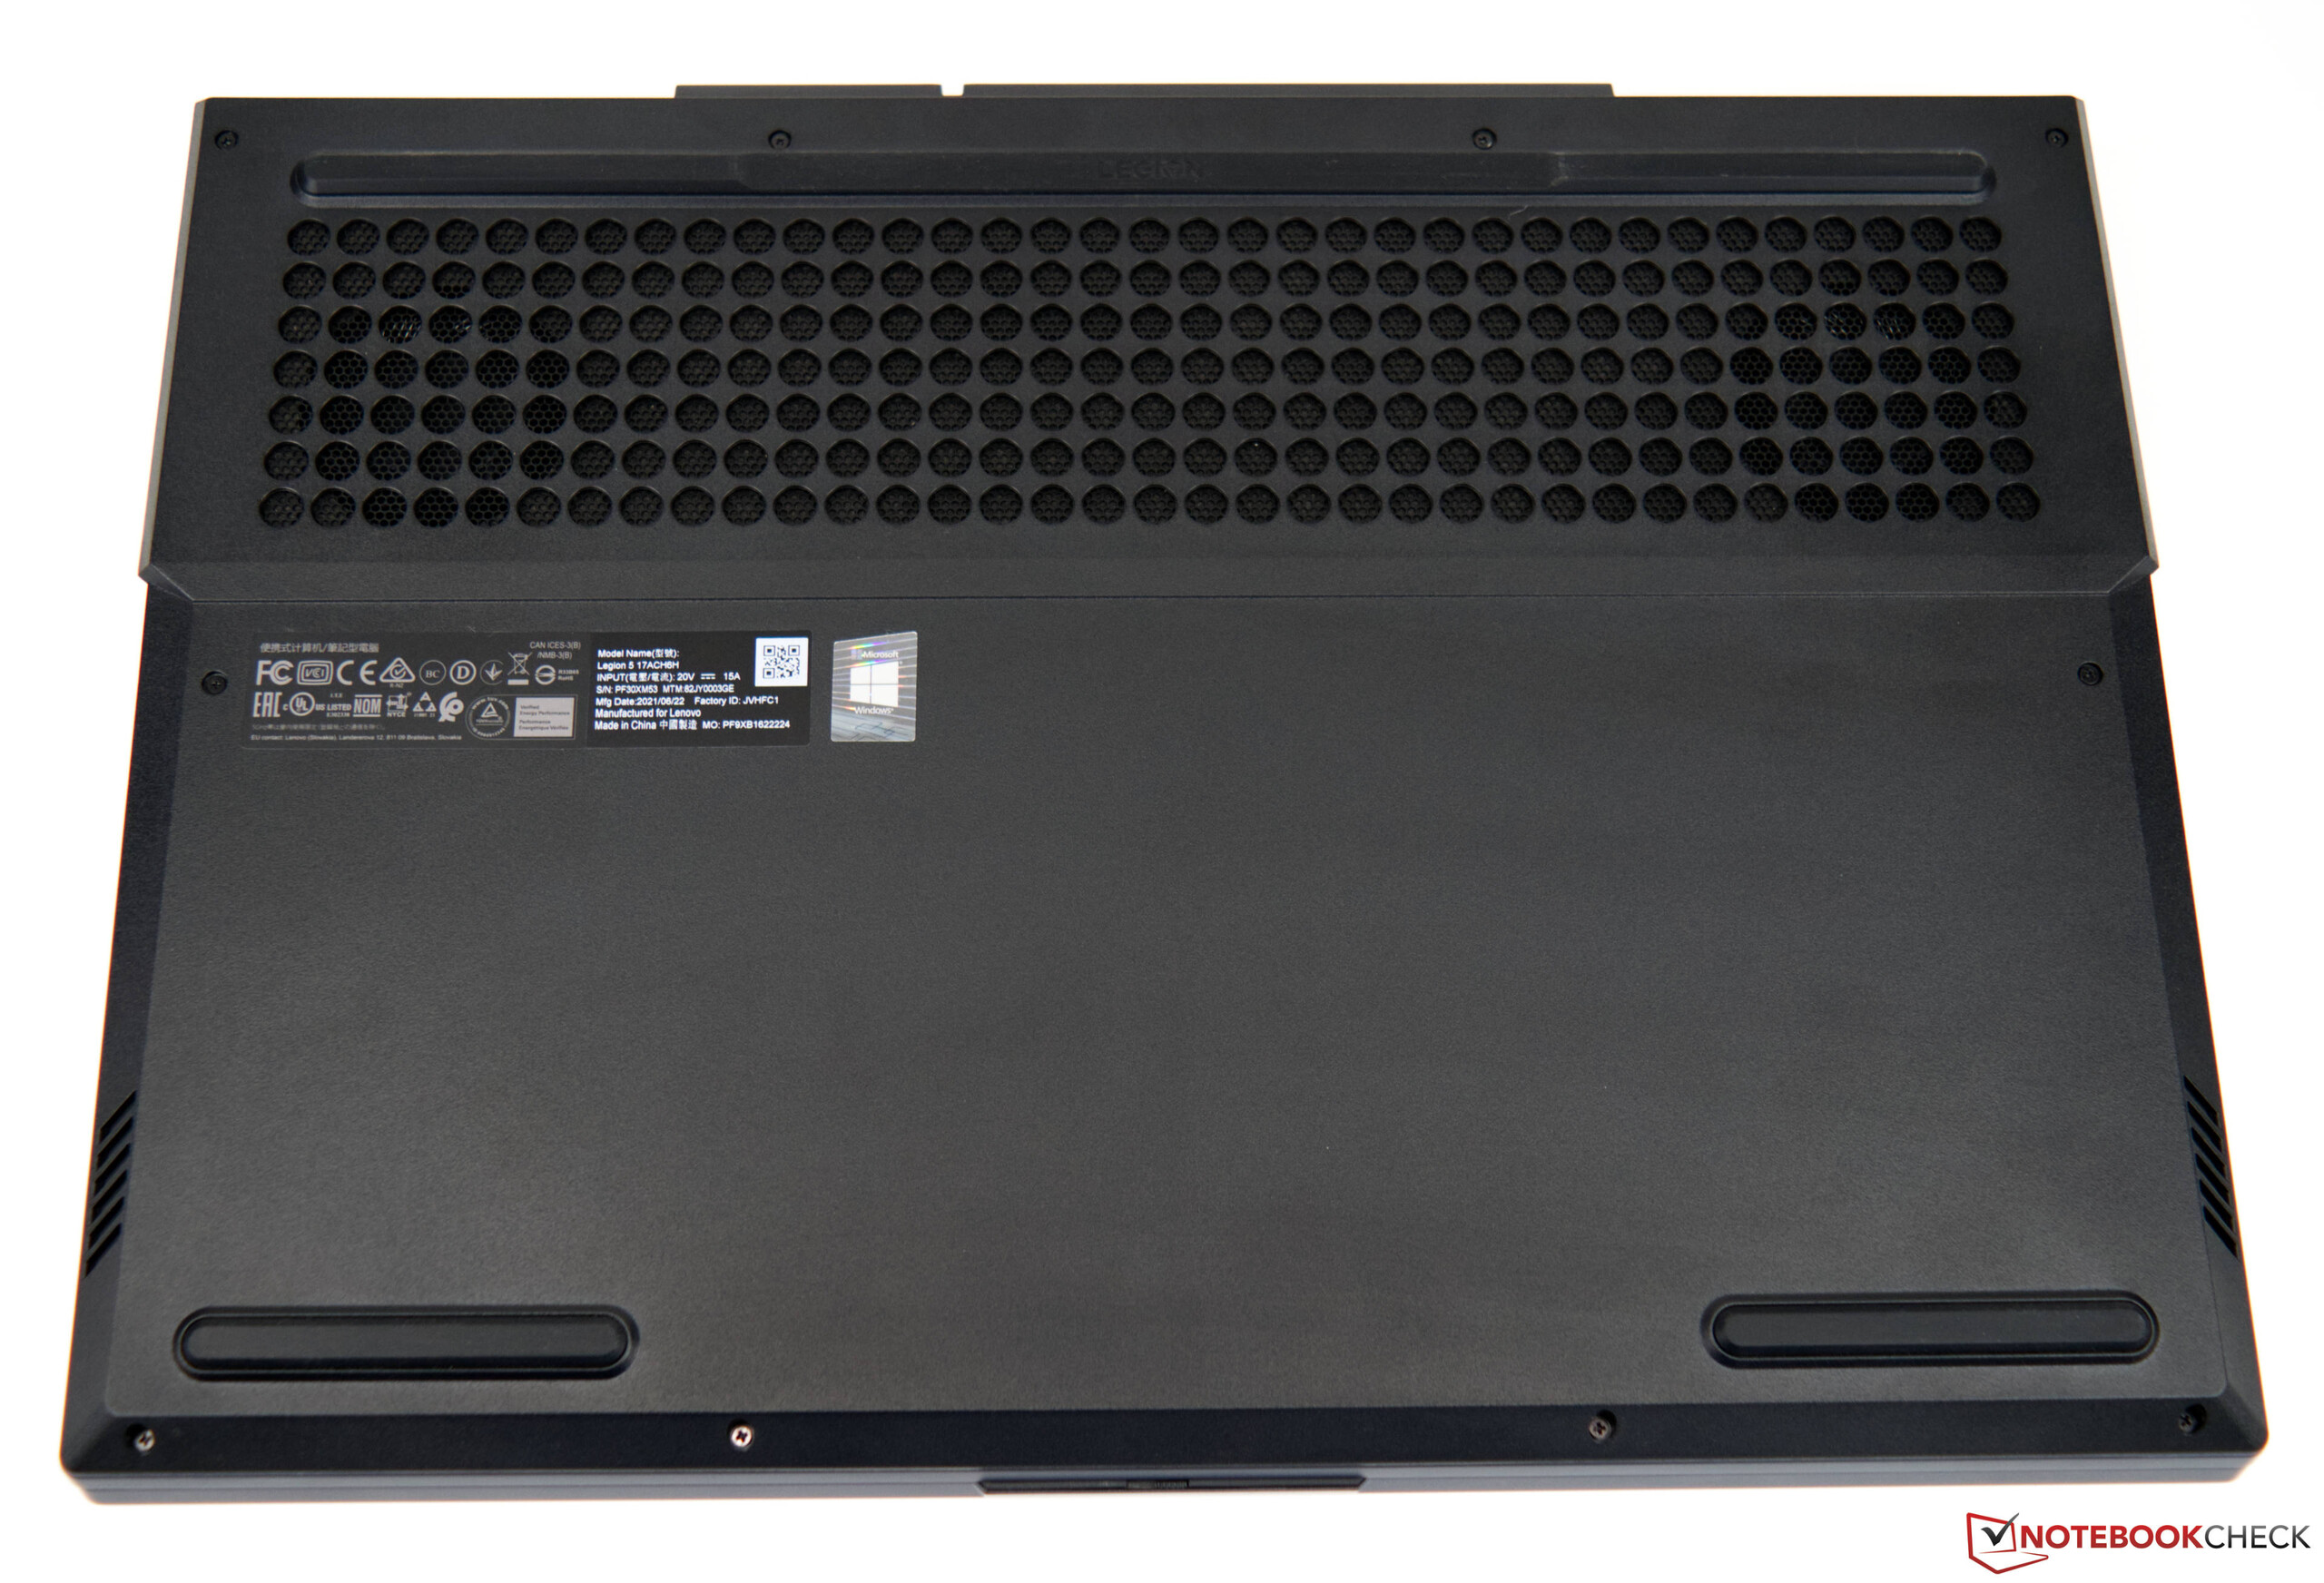
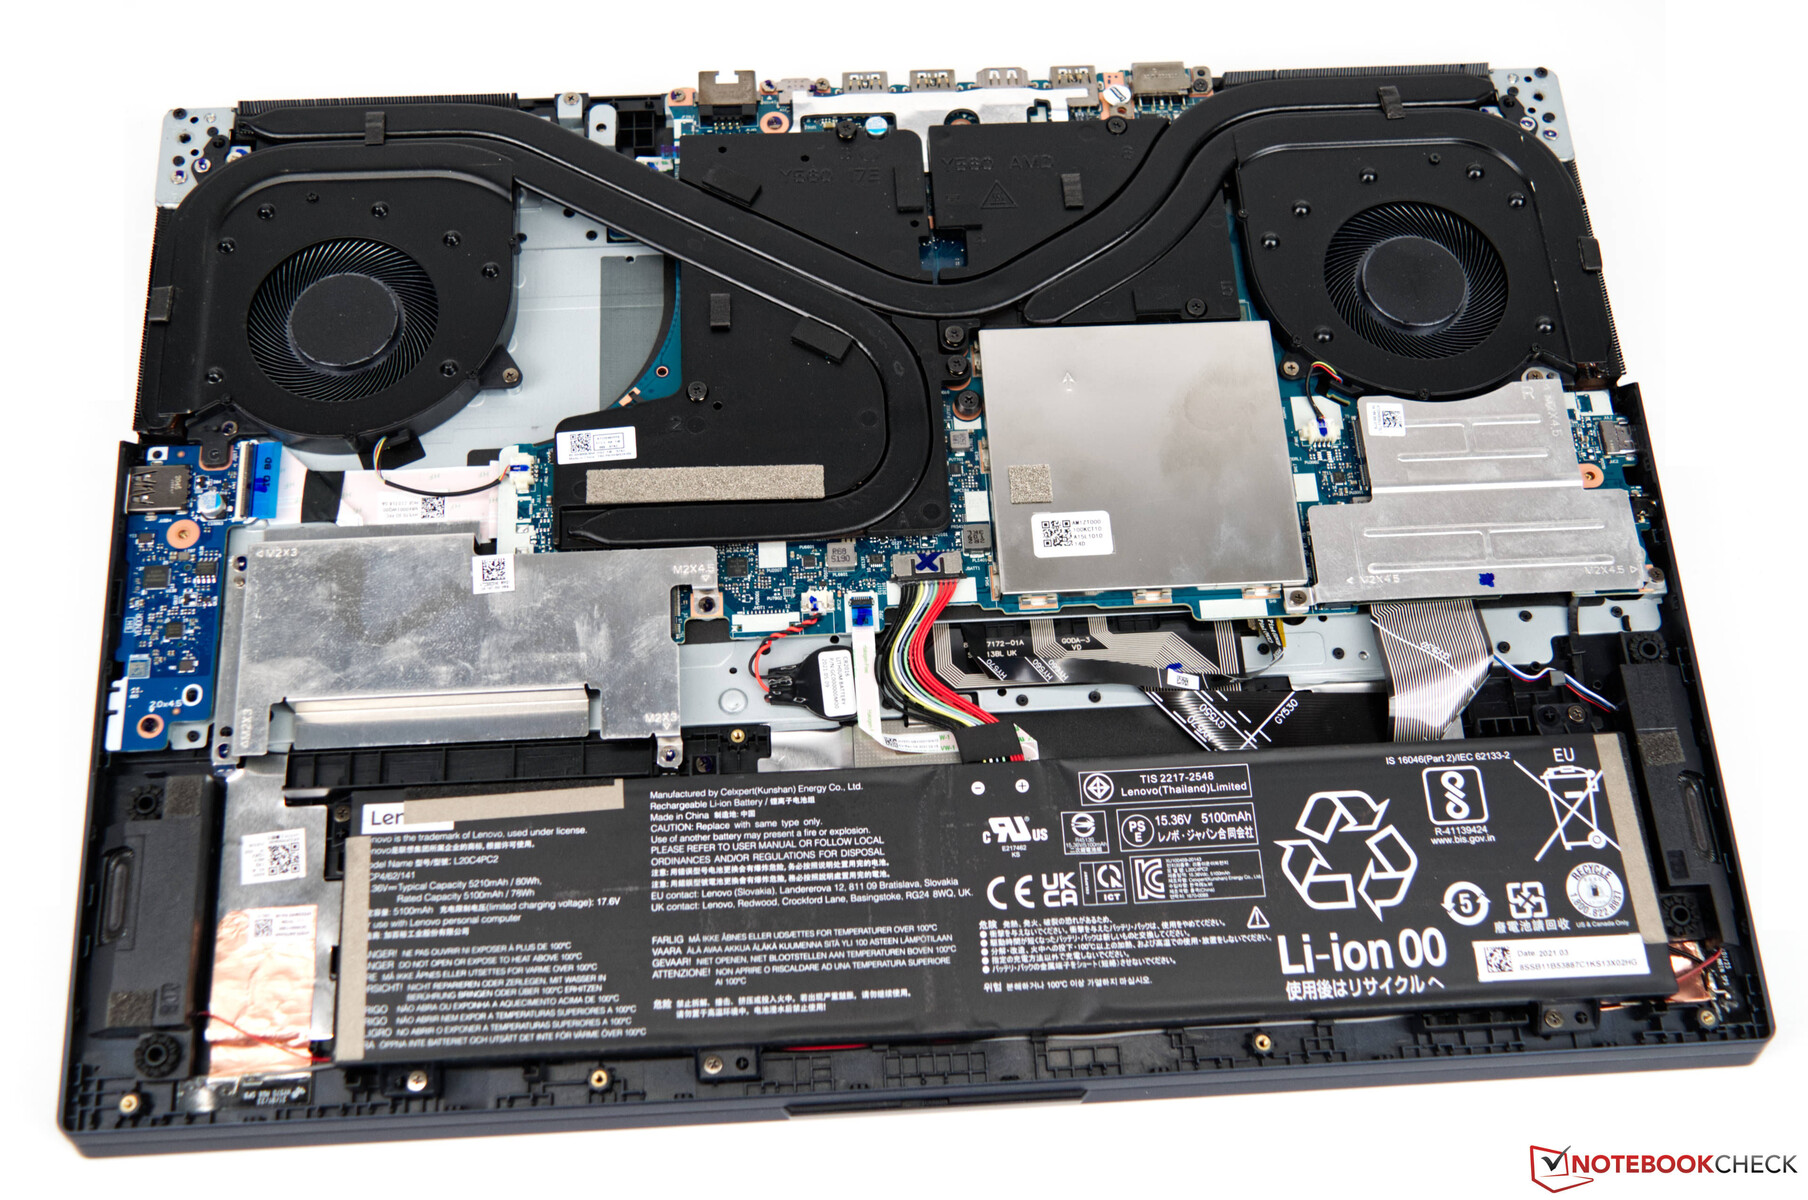
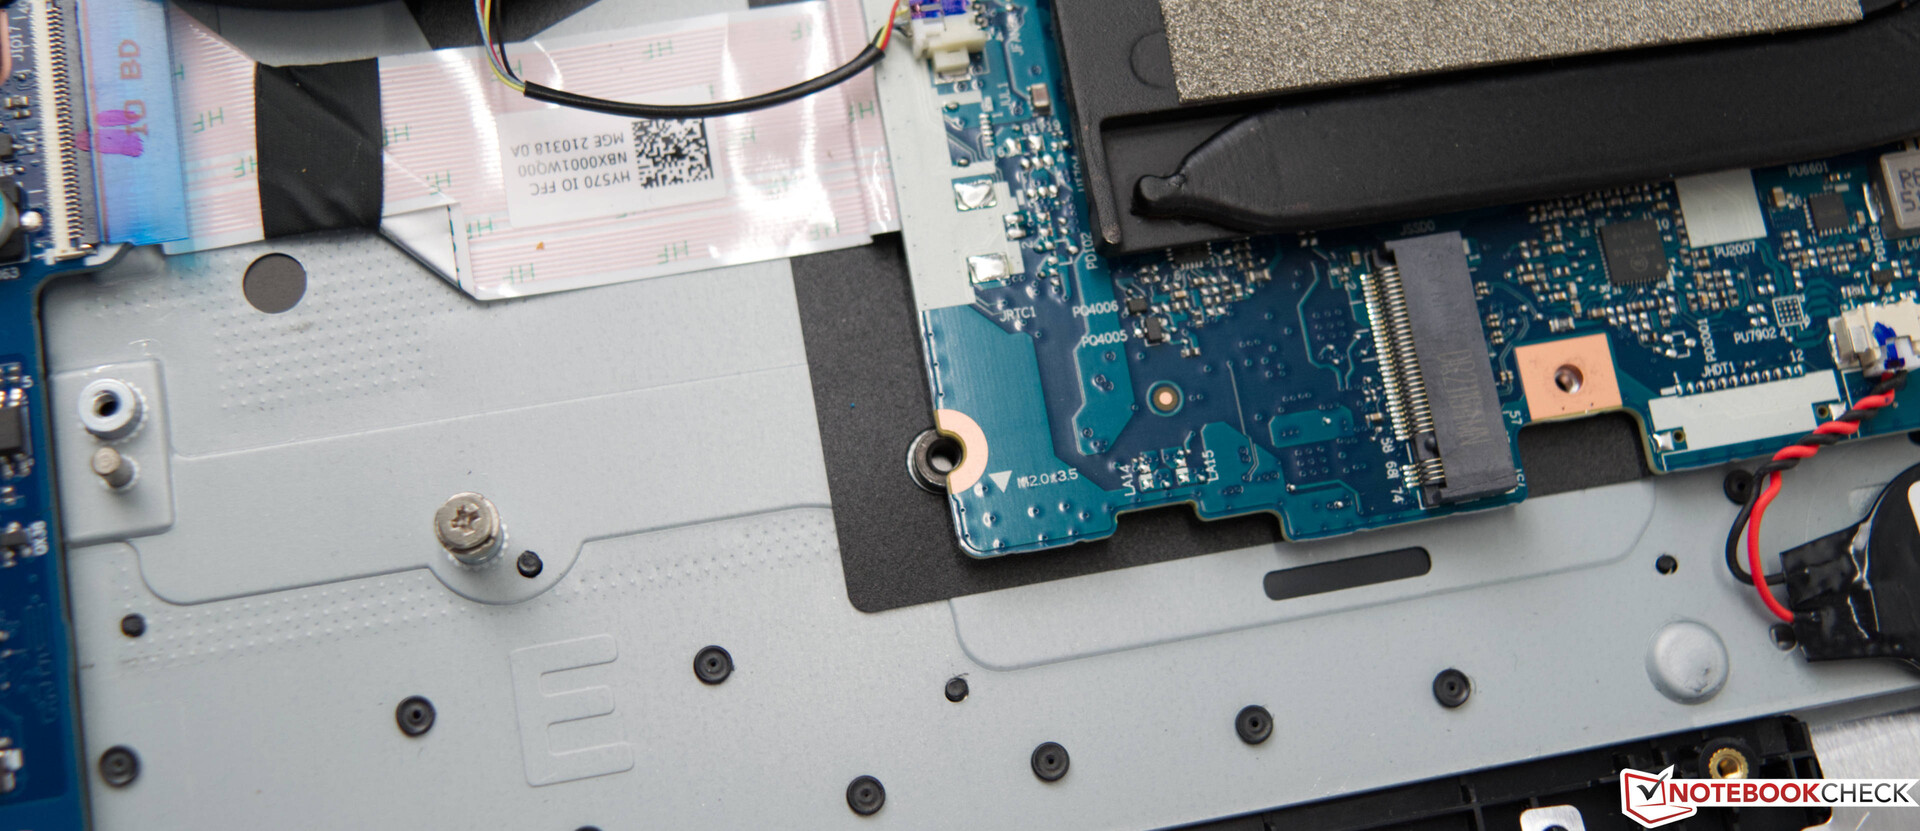
Bakım
Kullanıcıların bileşenlere erişebilmesi için alt plakanın çıkarılması gerekir. Dizüstü bilgisayara yanlışlıkla zarar vermemek için uygun araçların kullanılması önerilir. Ek bir kapak hem RAM modüllerini hem de iki SSD yuvasını korur. 80 Wh pil ve üç ısı borusu ve iki fandan oluşan soğutma çözümü, odanın çoğunluğunu kaplıyor.
Garanti
Lenovo, çevrimiçi mağazasından satın alırken garanti uzatma seçenekleriyle 1 yıllık depo veya elden teslim garantisi sunar.
Giriş Birimleri
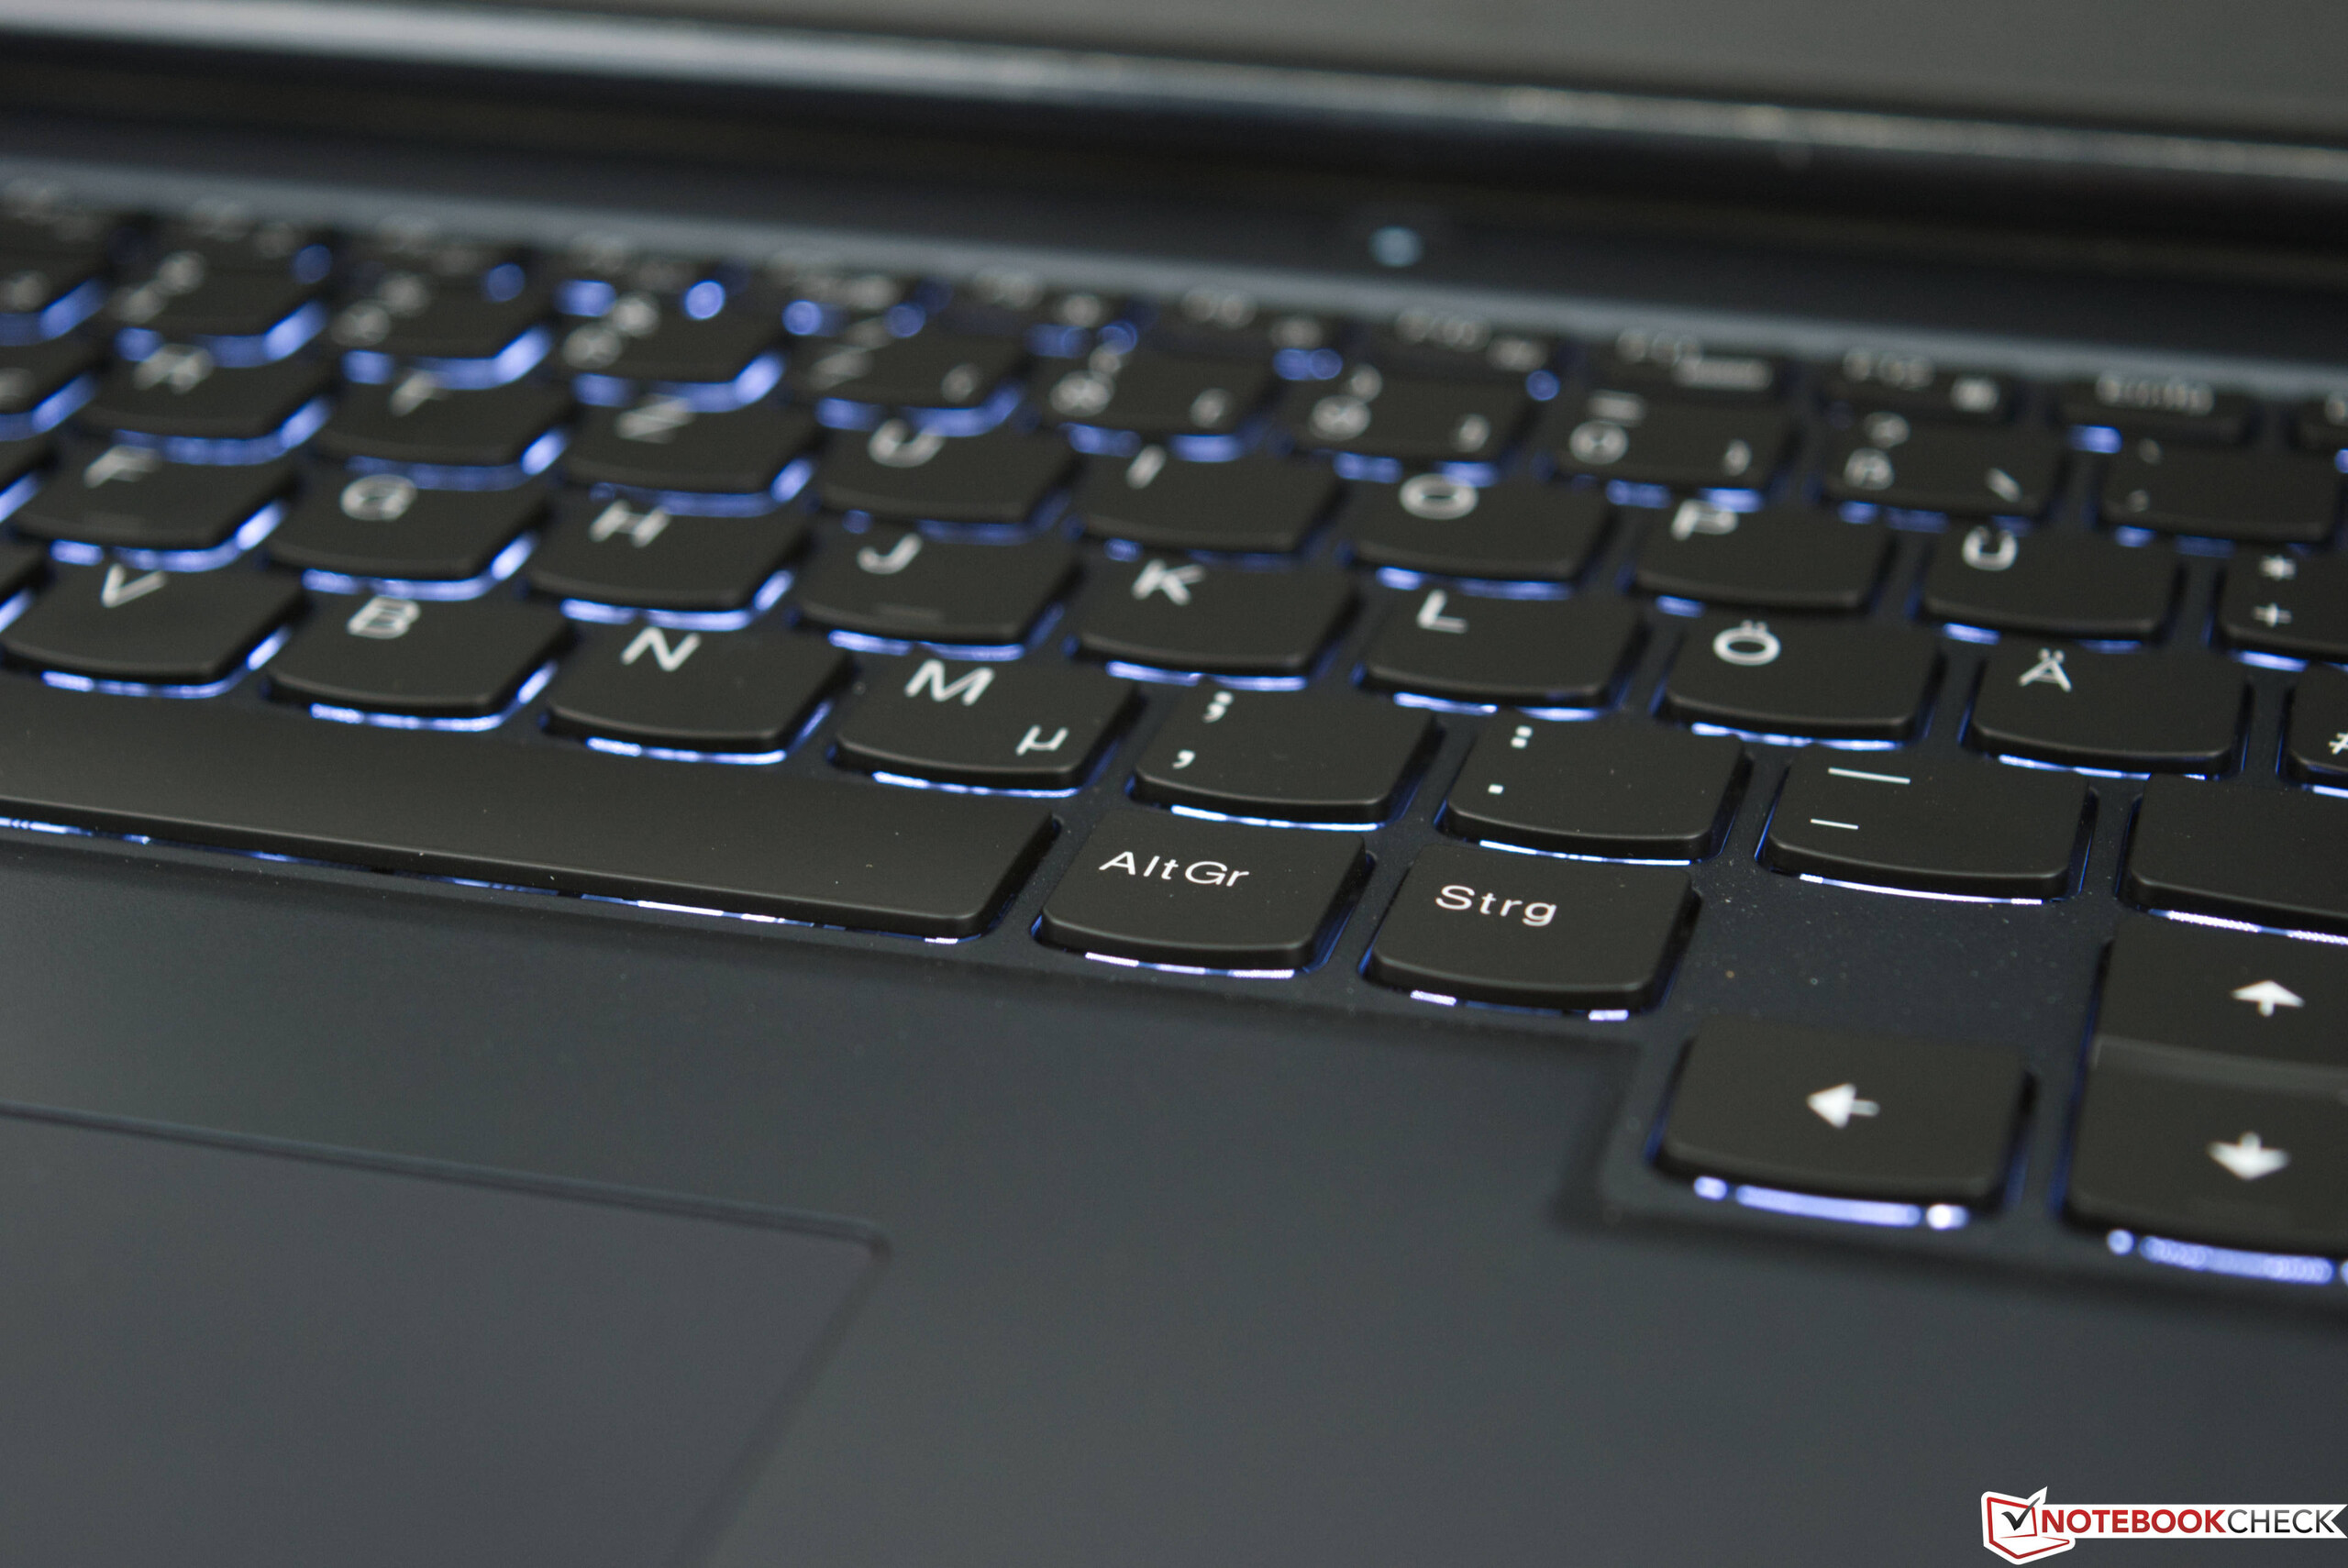
Klavye
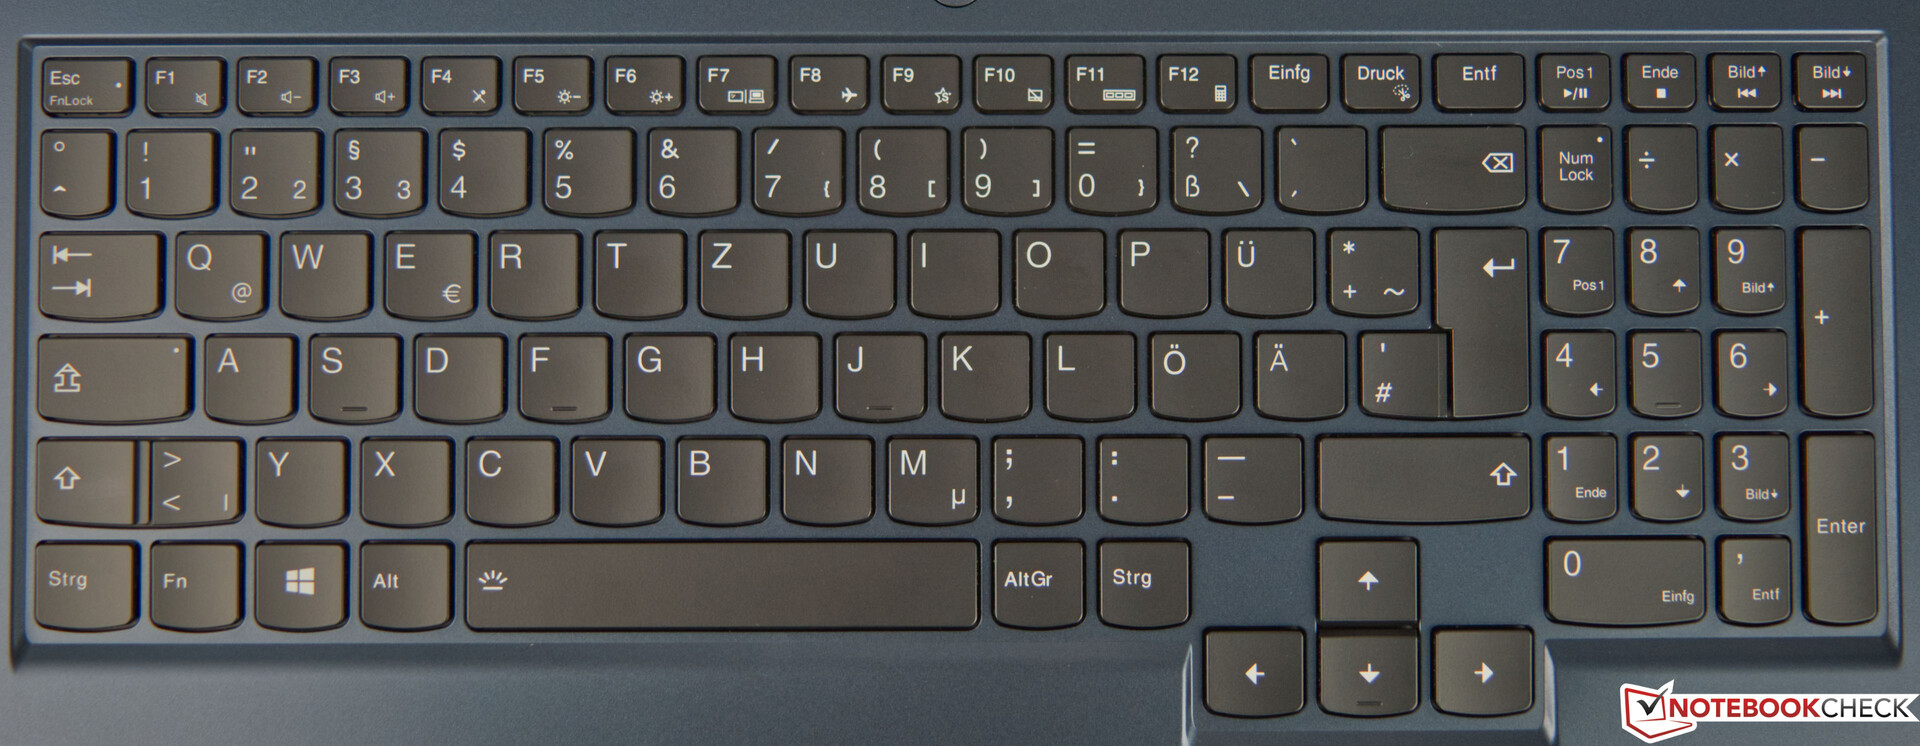
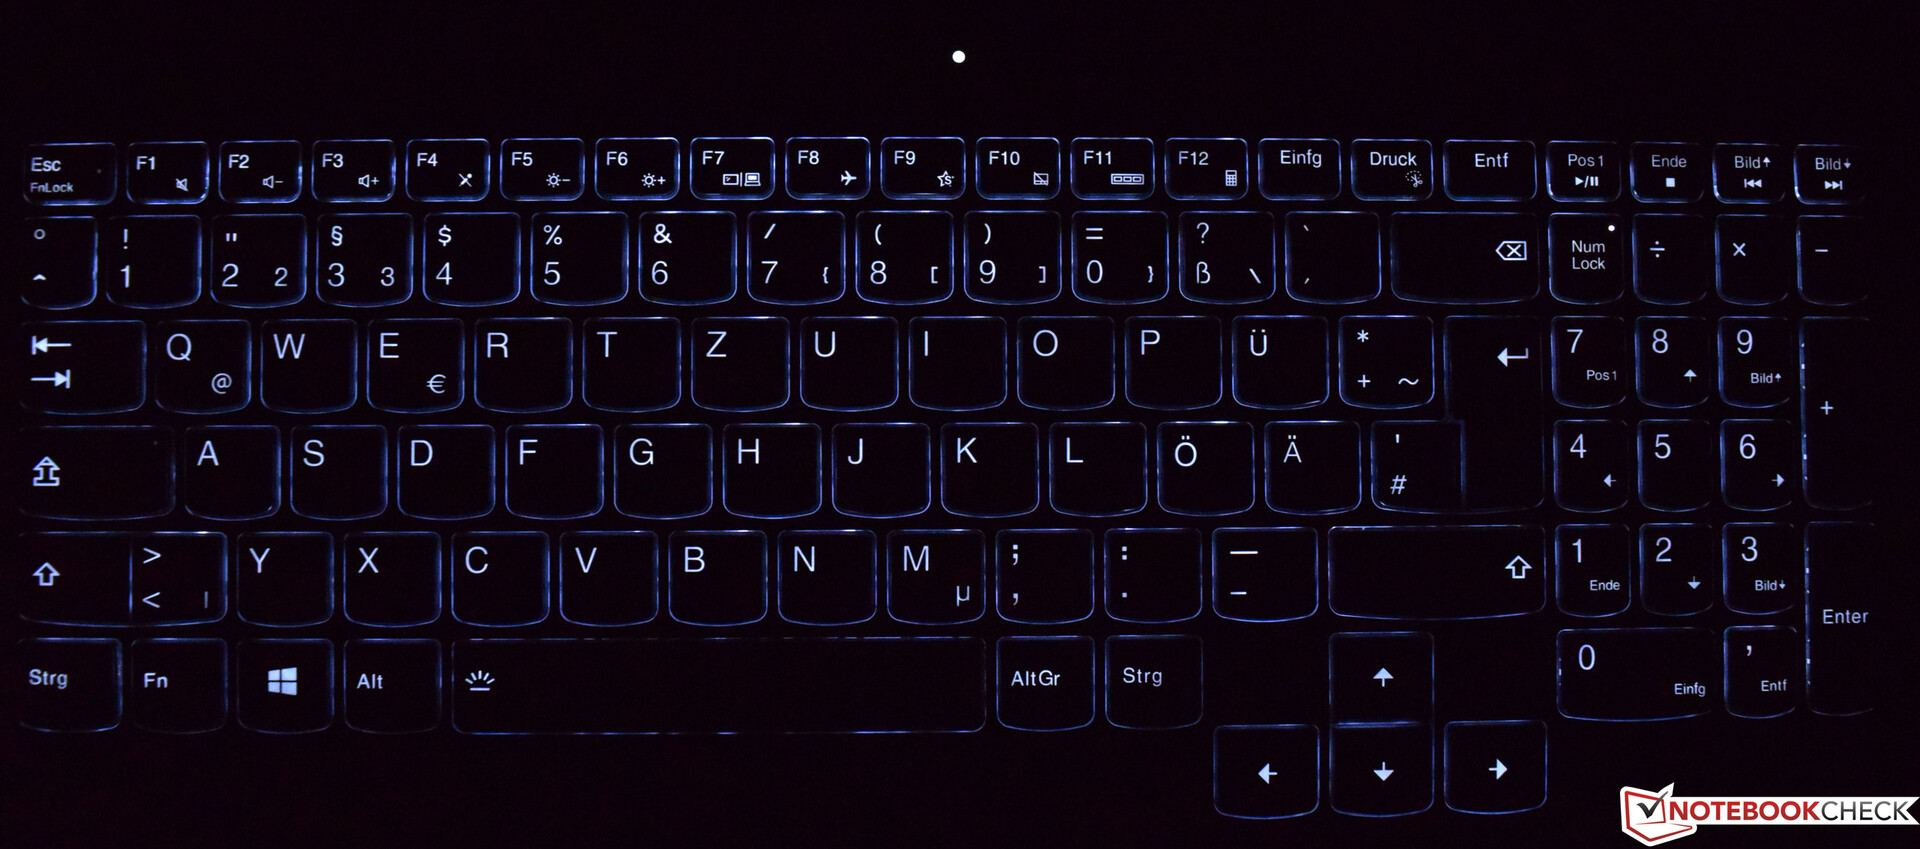
Lenovo, Legion 5 17'yi ince arkadan aydınlatmalı ve iki parlaklık düzeyine sahip 6 sıralı şık klavyeyle donatıyor. İstenirse, arka ışık da tamamen devre dışı bırakılabilir. Tuşlar yeterince büyük ve ok tuşları normal boyutta. Sadece 1,5 mm'lik sığ hareket, biraz donuk bir geri bildirim ve belirgin bir çalıştırma noktası ile birlikte gelir. Sonuç olarak, tuşlar süngerimsi bir his vermiyor.
Dokunmatik Yüzey
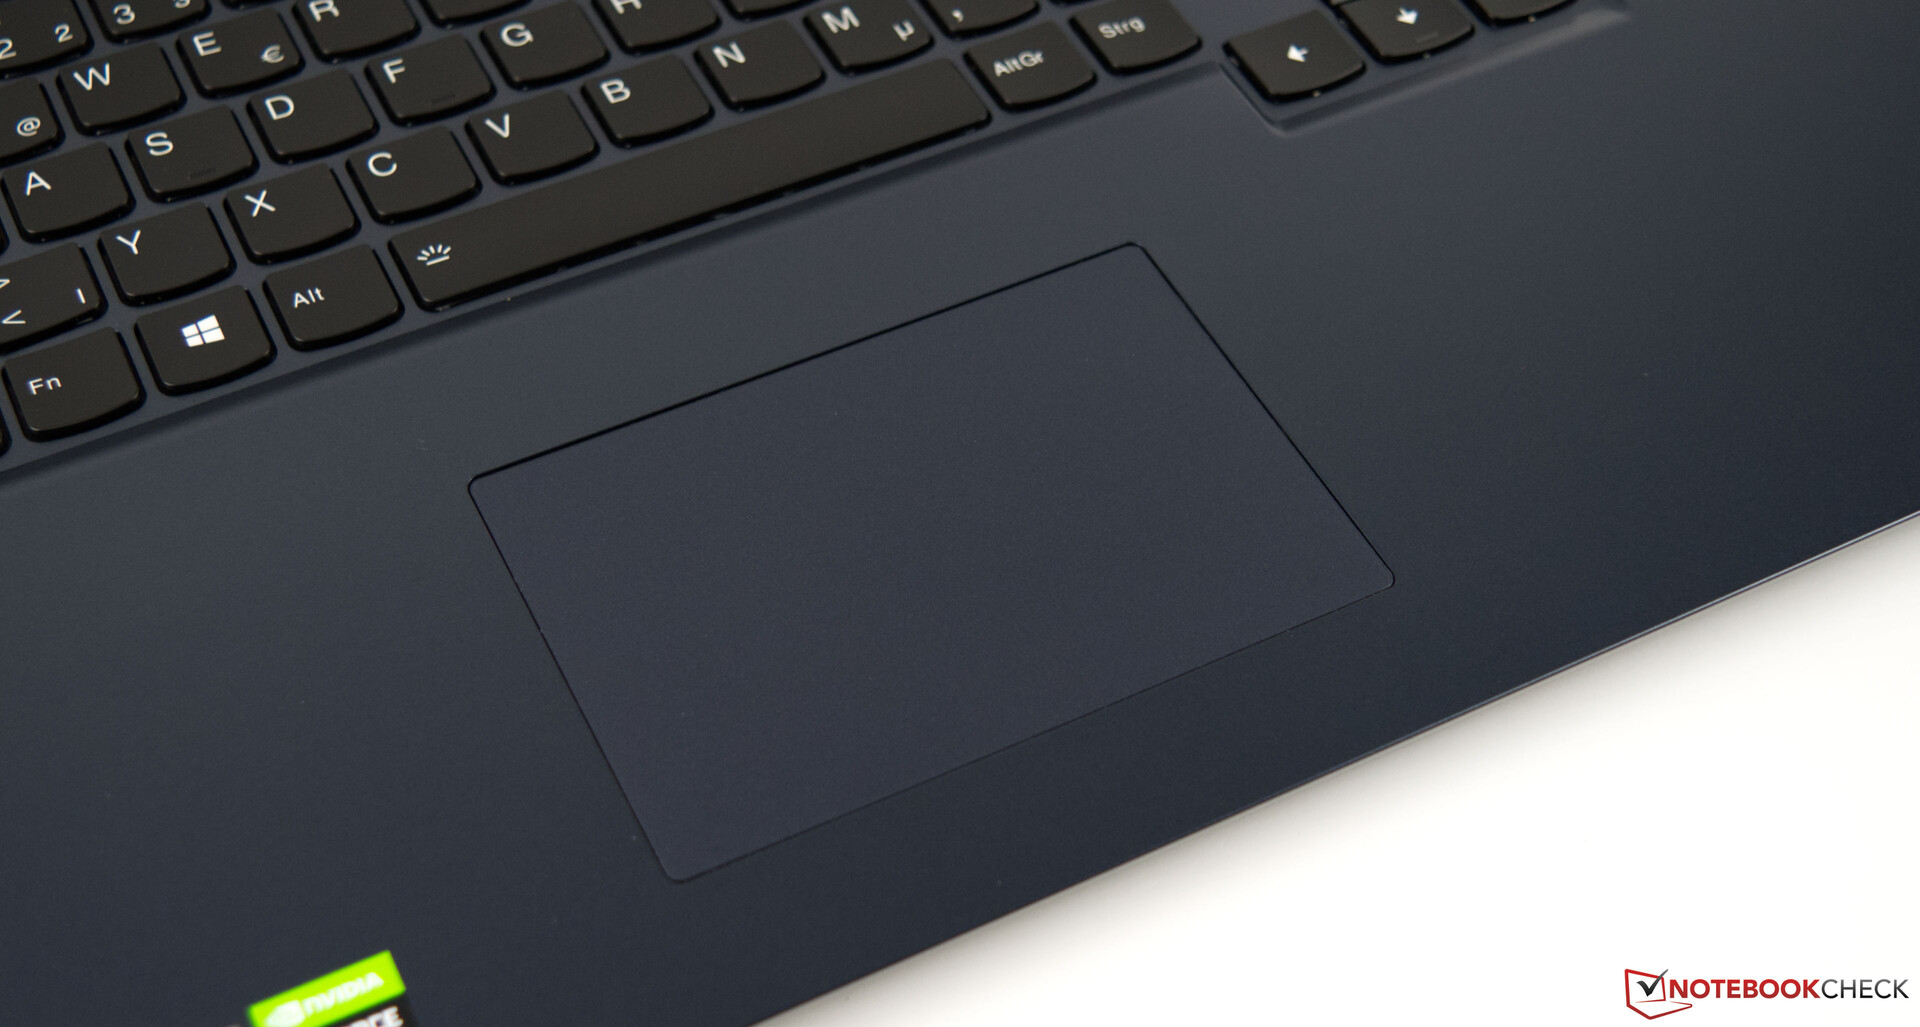
Entegre dokunmatik yüzey 7 x 10,5 cm (2,8 x 4,1 inç)'lik bir alanı kaplar ve geniş avuç içi dayanağında biraz kaybolmuş gibi görünür. Pürüzsüz yüzey çok duyarlıdır ve girdilere çok hızlı yanıt verir. Test ünitemizin dokunmatik yüzeyinin herhangi bir alanında tutarsız davranışlarla karşılaşmadık. İki düğme altta bulunur ve basıldığında belirgin bir sesli tıklama üretir. Dokunmatik yüzeyin konumunun biraz fazla sola doğru olduğunu görüyoruz. Günlük kullanım sırasında genellikle yanlışlıkla sol tuş yerine sağ tuşa basardık.
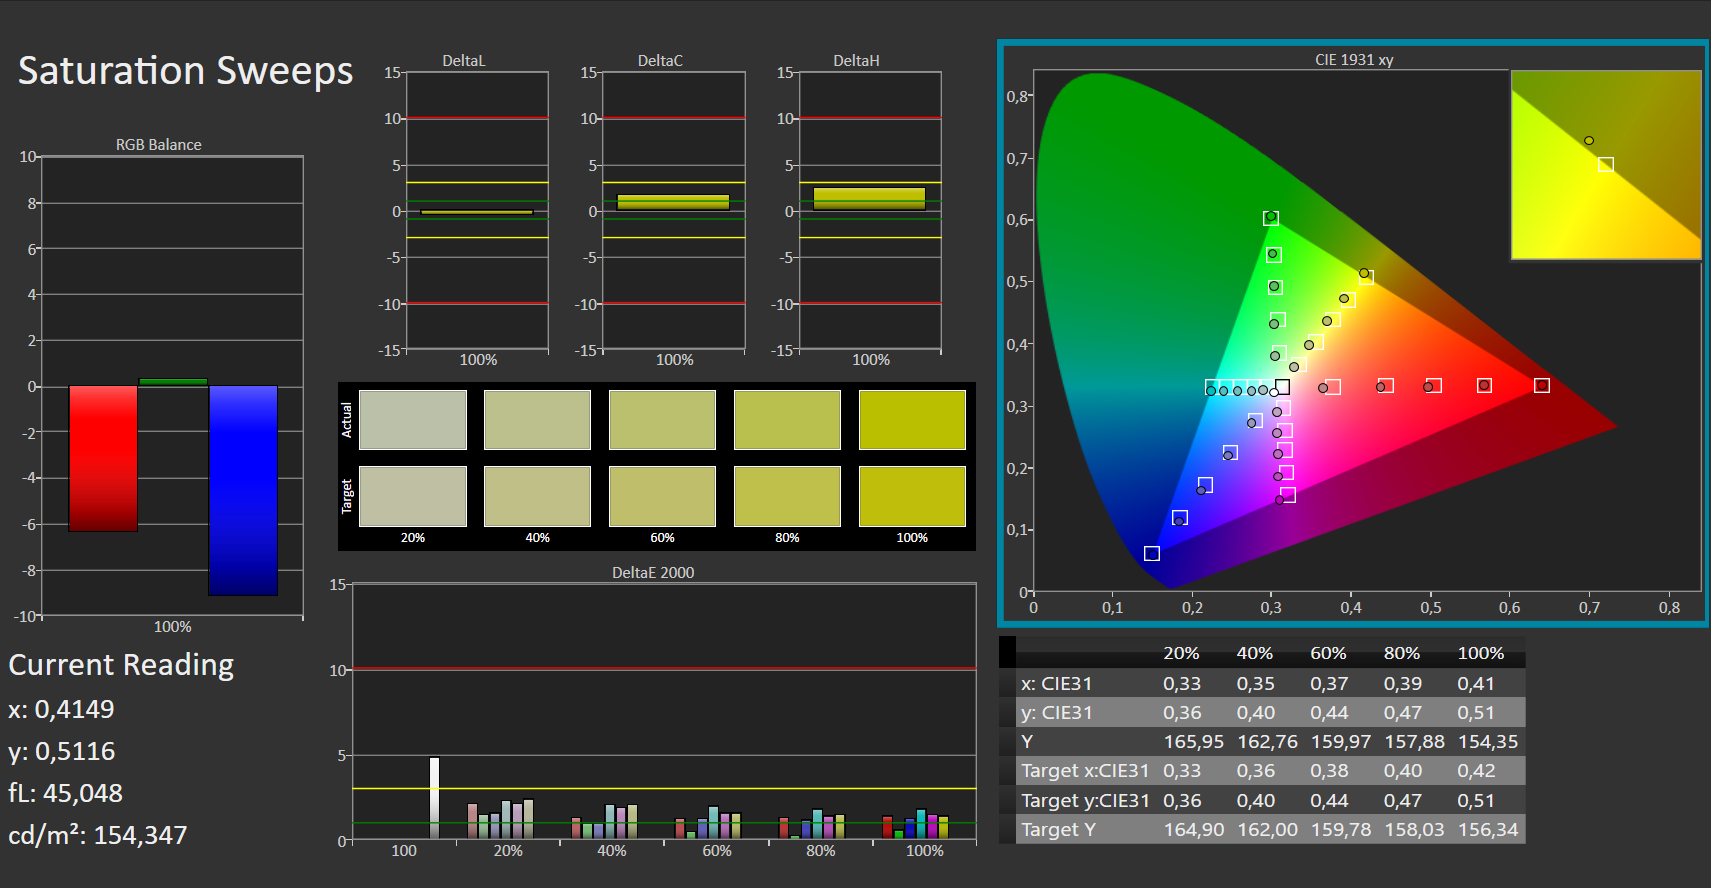
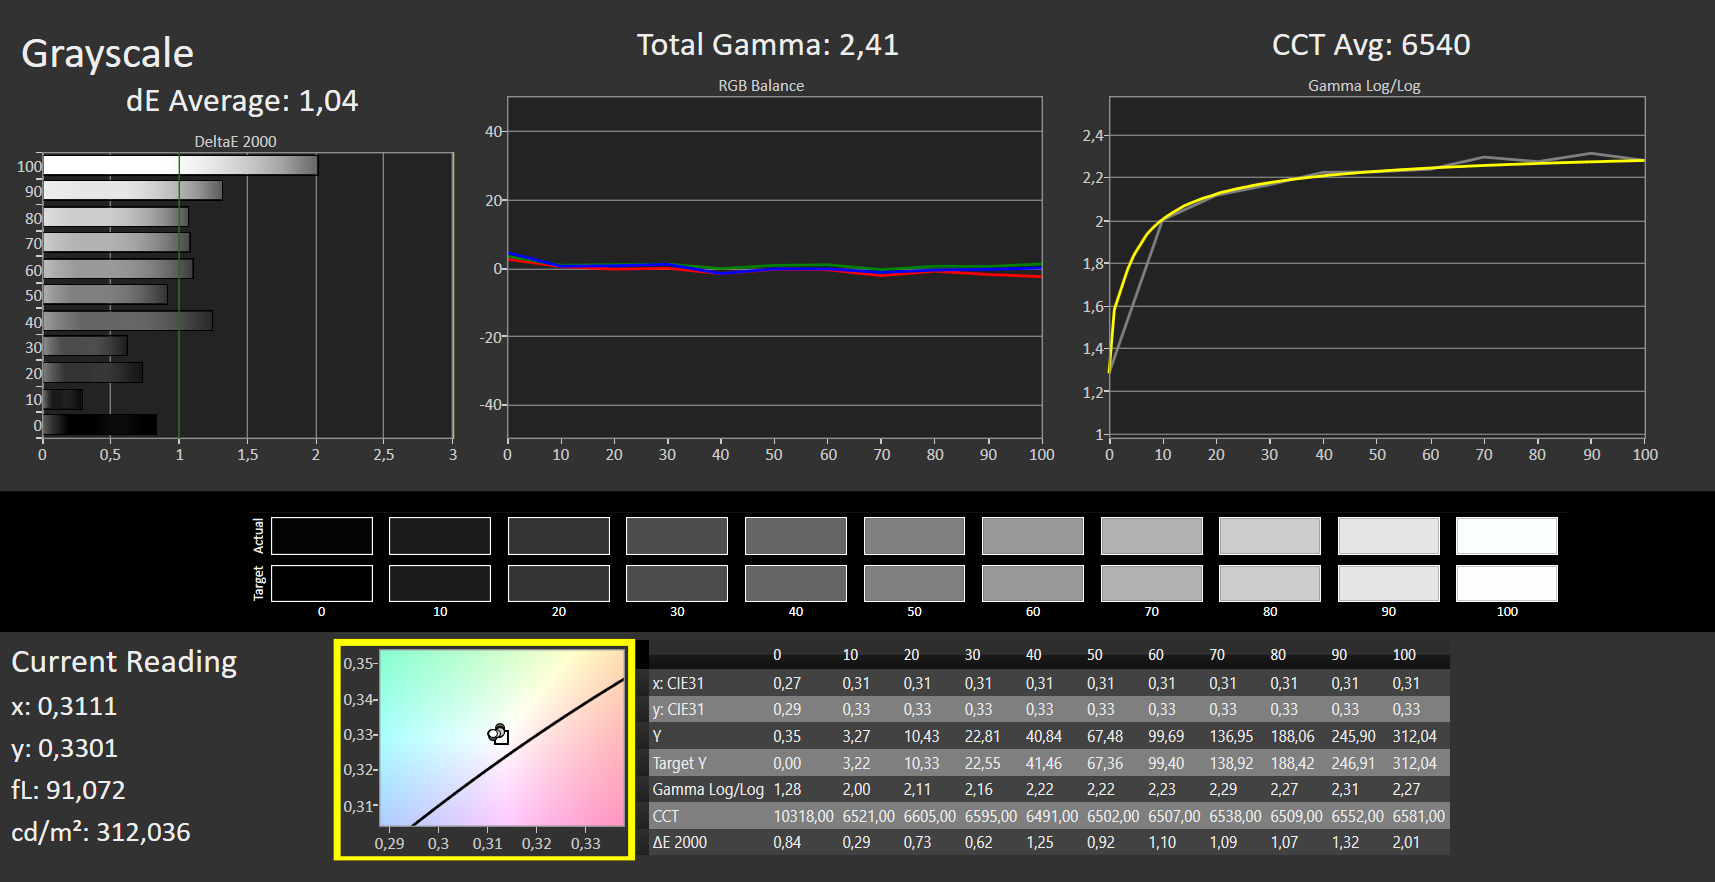
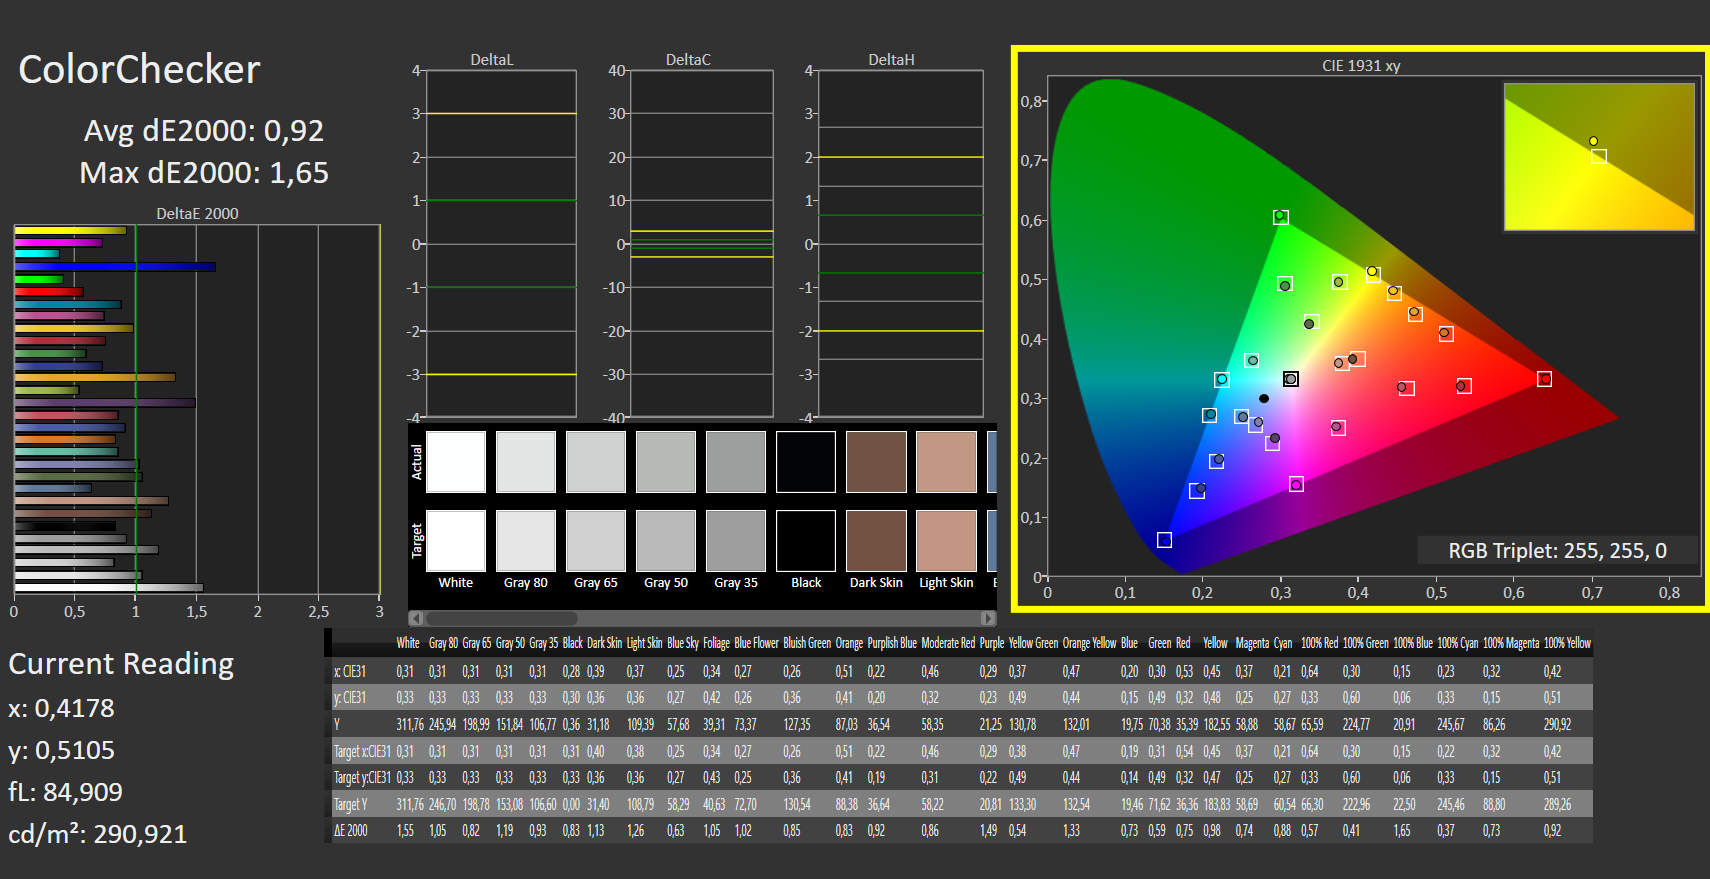
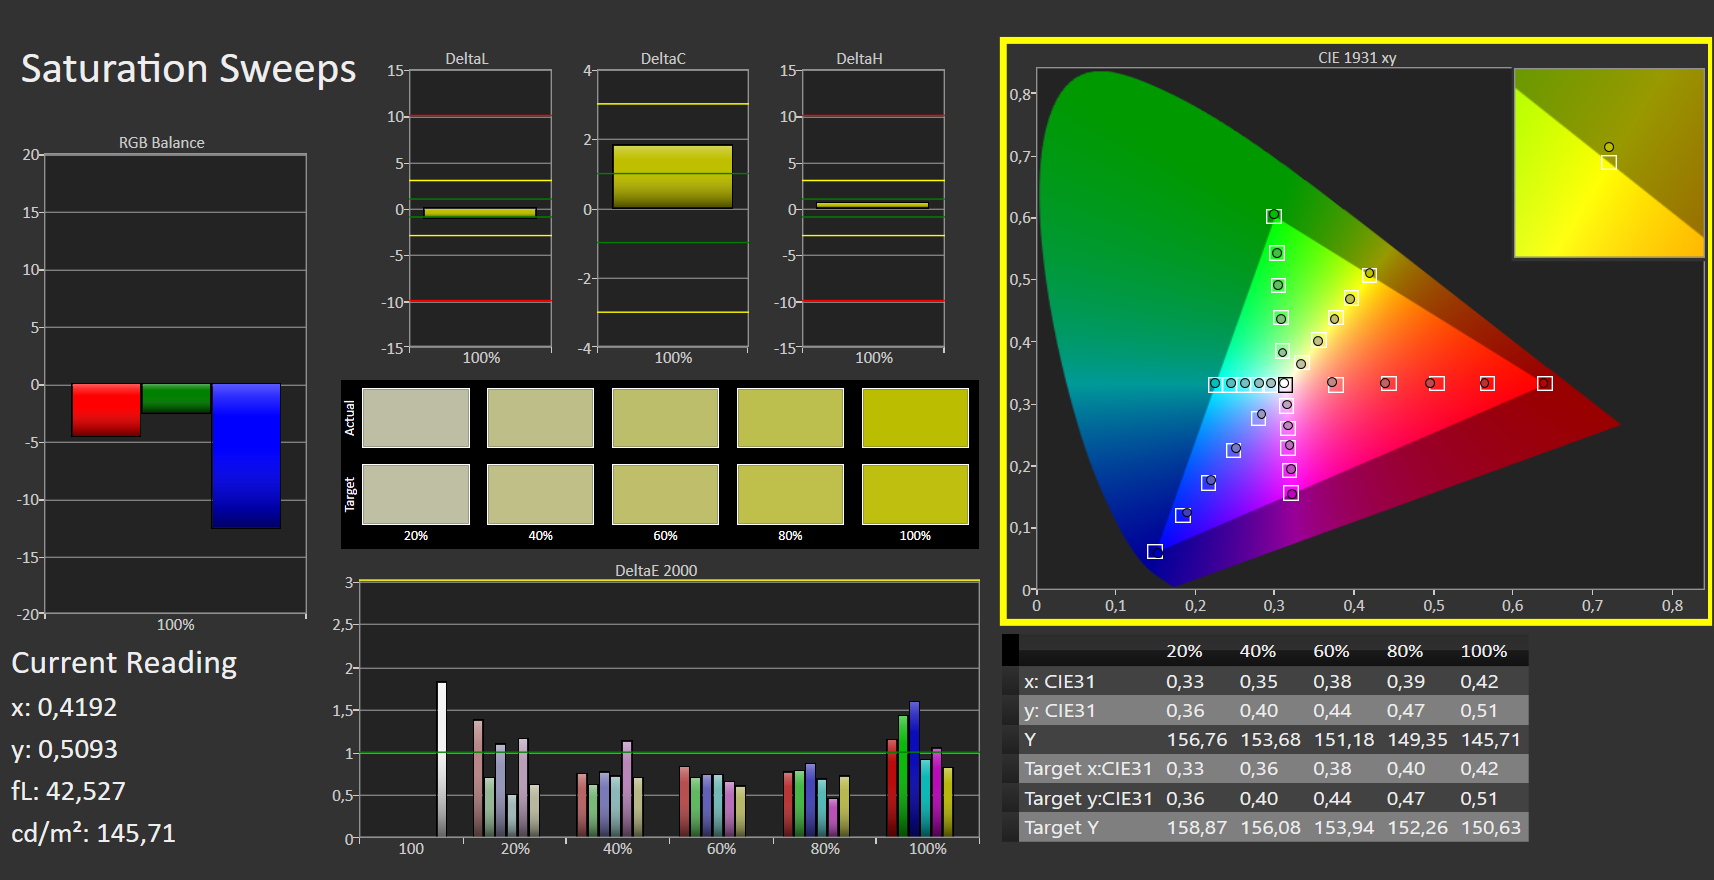
Ekran - 144 Hz ve PWM Yok
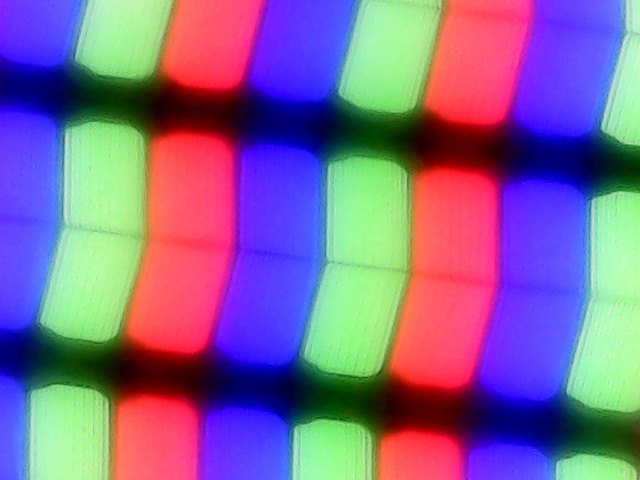
Lenovo Legion 5 17, mat Dolby Vision panel ve 144 Hz yenileme hızı ile birlikte gelir. 17 inçlik ekran, 127 PPI piksel yoğunluğu için 1920 x 1080 piksel doğal çözünürlüğe sahiptir. Alternatif olarak Legion 5 17, geleneksel 60 Hz panel ile de mevcuttur.
Panelin reklamı yapılan parlaklığını kendi ölçümlerimizle teyit edebildik. 305 nit ile taahhüt edilen değeri (300 nit) çok az aşıyor. 1292:1 kontrast oranı, bir IPS paneli için beklentilerimizi karşılıyor. Ancak, rakipler biraz daha kötü siyah değerleri nedeniyle buna tam olarak ayak uyduramıyorlar.
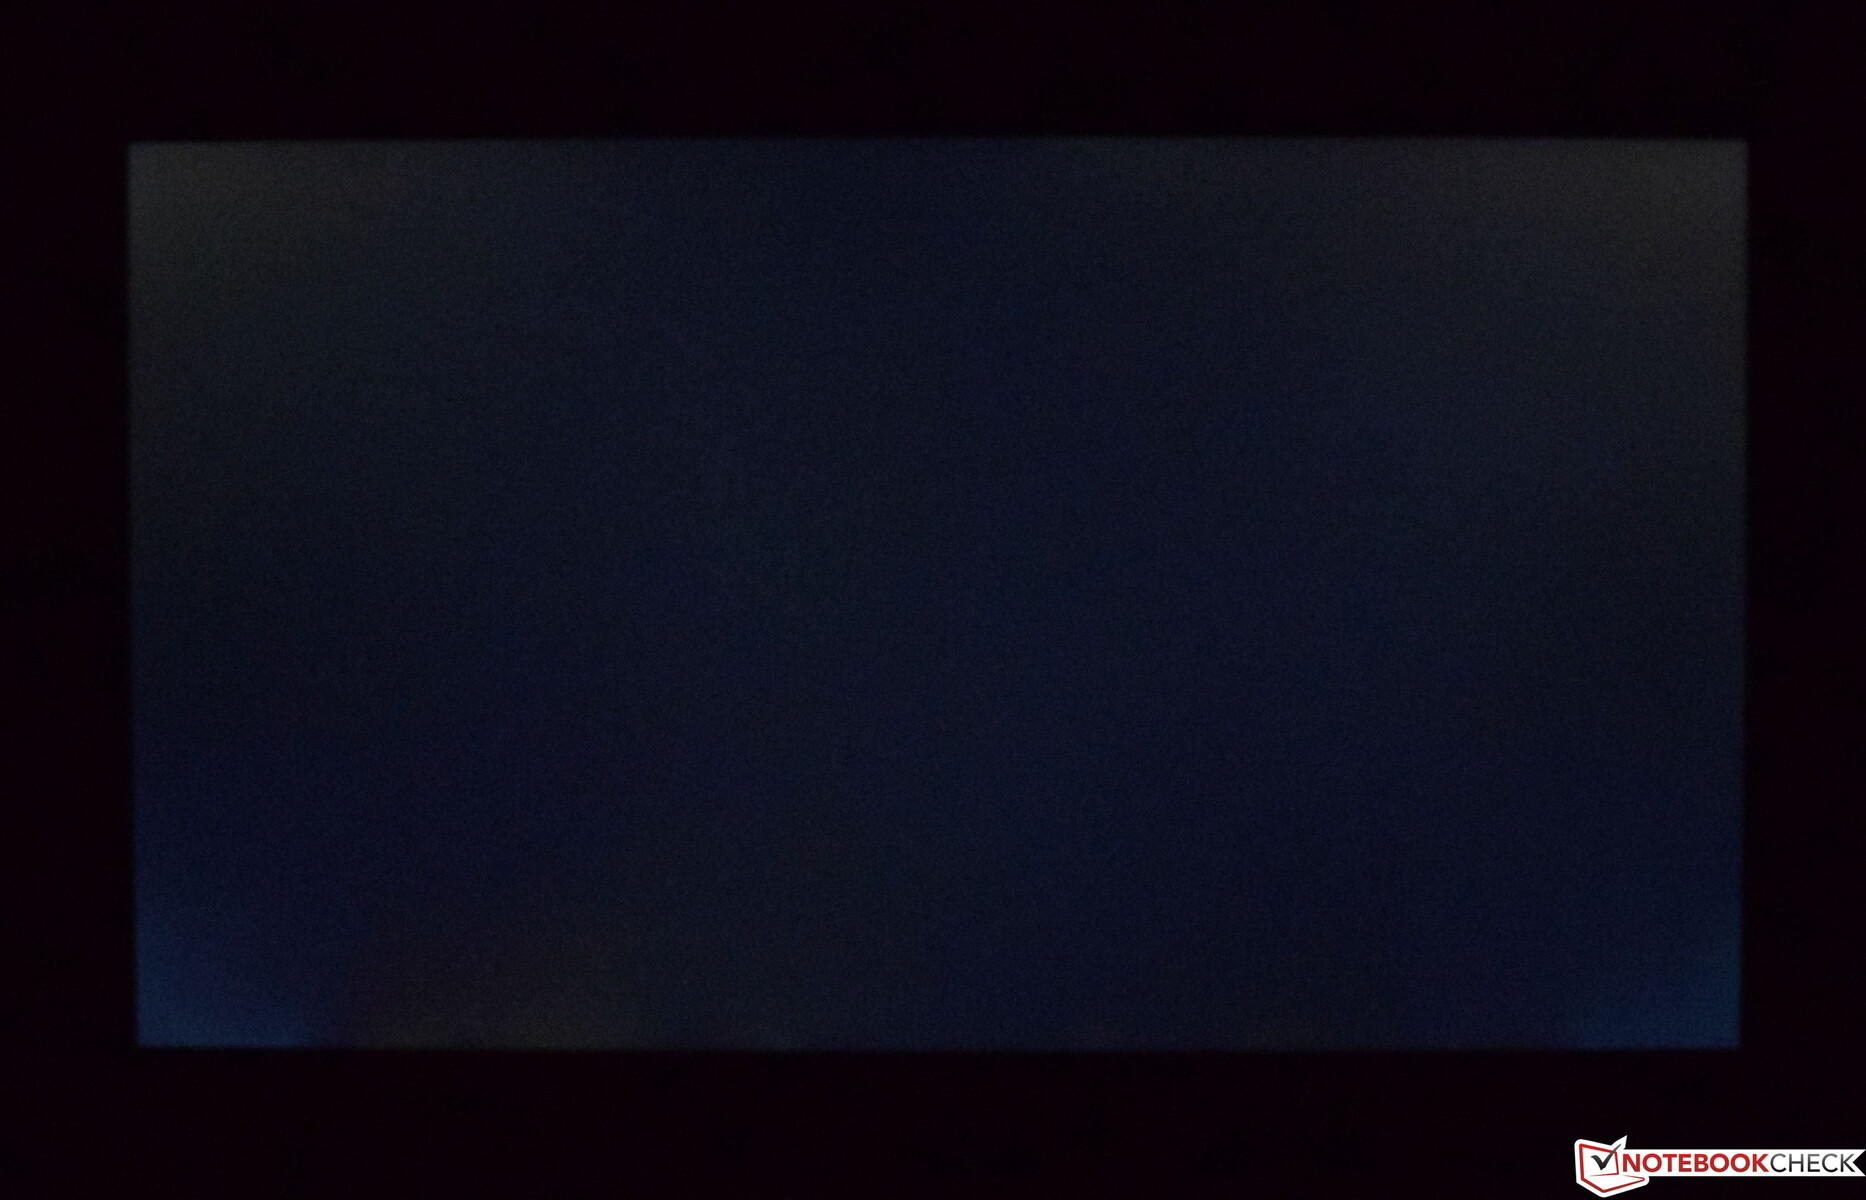
Lenovo Legion 5 17 kullanıcıları, ekranın parlaklığını kontrol etmek için PWM'ye güvenmediğinden, PWM'nin göz yorgunluğu konusunda endişelenmelerine gerek kalmayacak. Ne yazık ki, test cihazımızda arka ışık kanaması var. Karanlık sahnelerde kenarlarda önemli miktarda ekran kanaması oluyor.
| |||||||||||||||||||||||||
Aydınlatma: 89 %
Batarya modunda parlaklık: 325 cd/m²
Kontrast: 1292:1 (Siyah: 0.25 cd/m²)
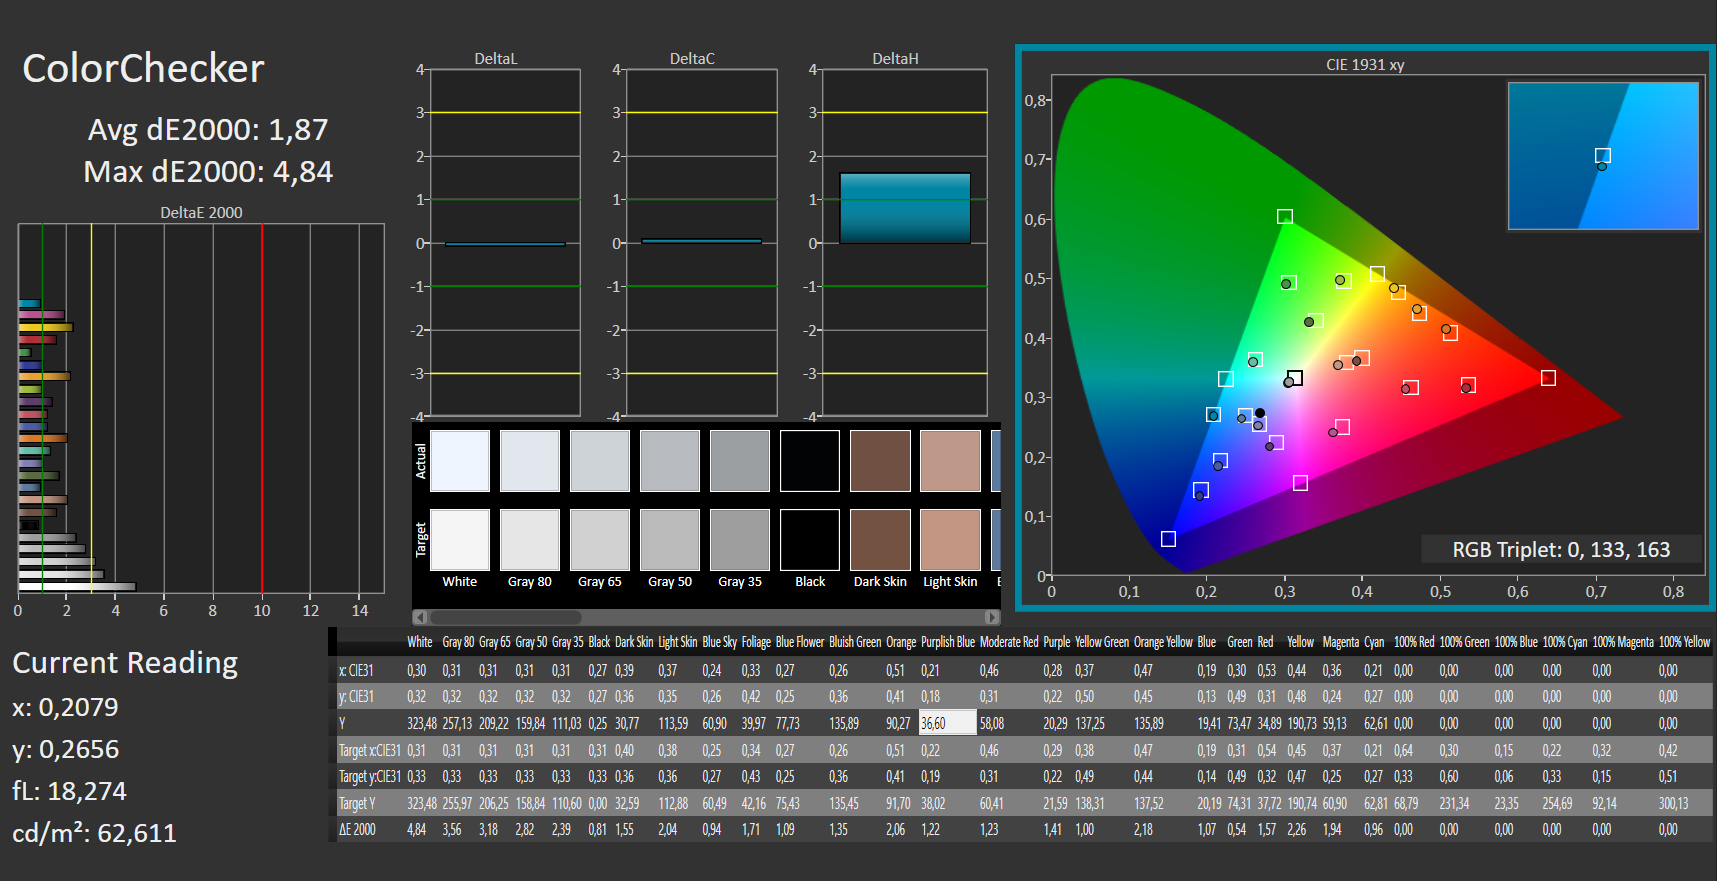
ΔE ColorChecker Calman: 1.87 | ∀{0.5-29.43 Ø4.73}
calibrated: 0.92
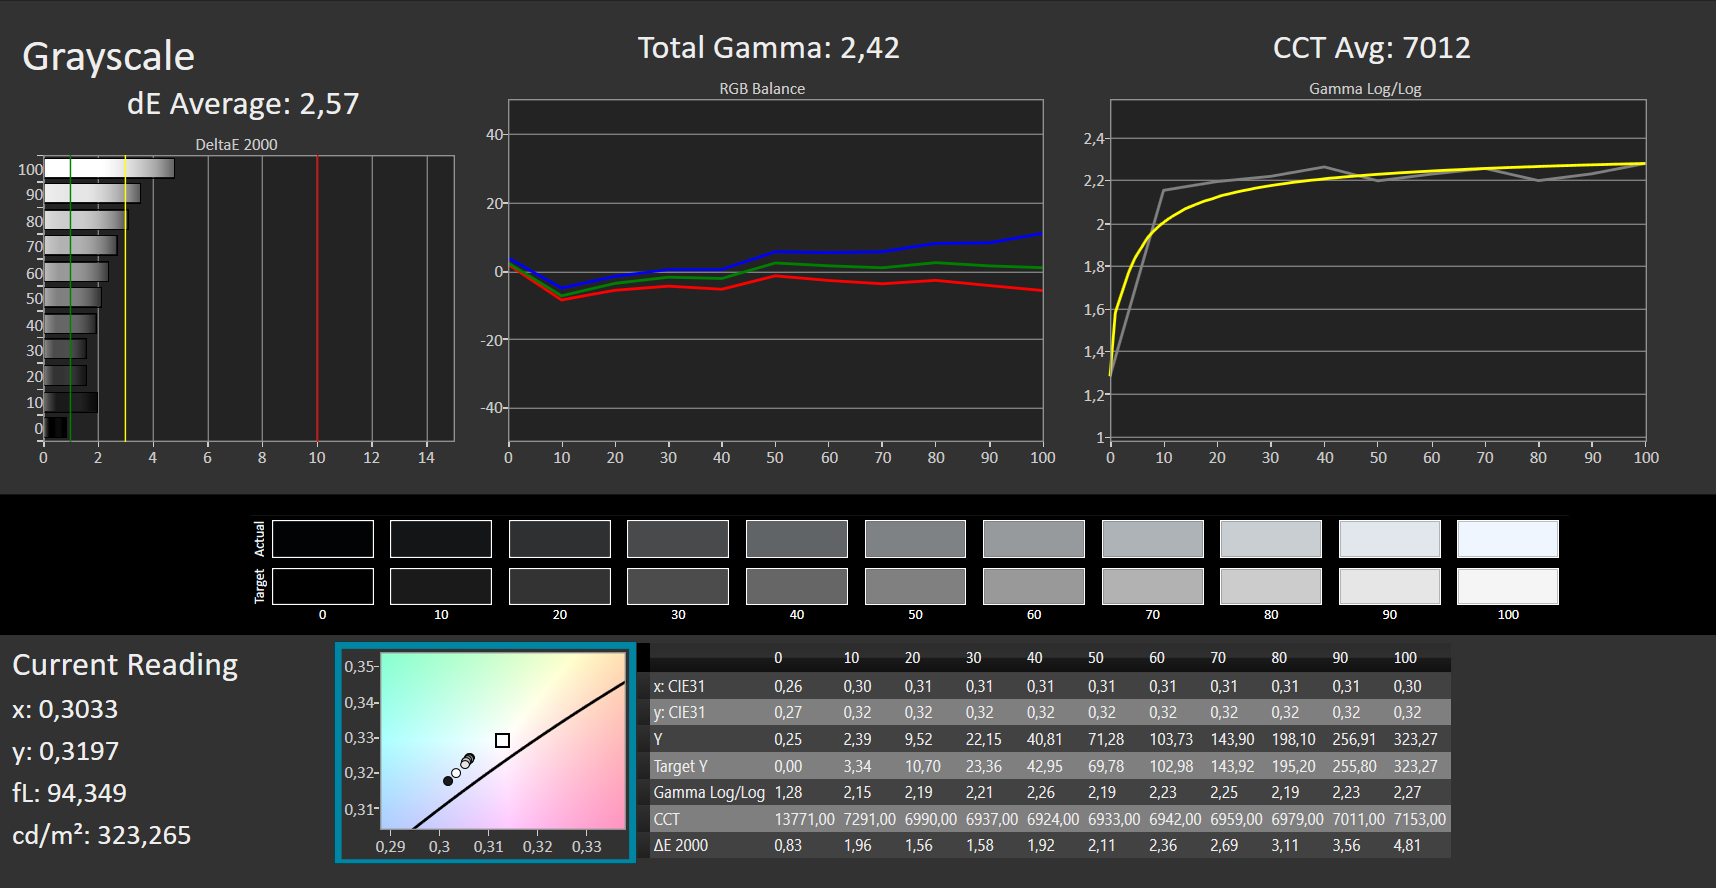
ΔE Greyscale Calman: 2.57 | ∀{0.09-98 Ø4.97}
66.7% AdobeRGB 1998 (Argyll 3D)
97.2% sRGB (Argyll 3D)
64.8% Display P3 (Argyll 3D)
Gamma: 2.42
CCT: 7012 K
| Lenovo Legion 5 17ACH6H-82JY0003GE LEN173FHD, IPS, 1920x1080, 17.3" | Schenker XMG Core 17 (Early 2021) BOE CQ NE173QHM-NY2, IPS, 2560x1440, 17.3" | Asus TUF Gaming F17 FX706HM AU Optronics AUI8294 (B173HAN04.9), IPS, 1920x1080, 17.3" | MSI Katana GF76 11UE AU Optronics B173HAN04.9, IPS, 1920x1080, 17.3" | Schenker XMG Apex 17 M21 LG Philips LP173WFG-SPB3, IPS, 1920x1080, 17.3" | Gigabyte A7 X1 AU Optronics AUO8E8D, IPS, 1920x1080, 17.3" | |
|---|---|---|---|---|---|---|
| Display | 3% | -38% | -39% | -1% | -5% | |
| Display P3 Coverage (%) | 64.8 | 68.1 5% | 40.1 -38% | 39.8 -39% | 65 0% | 61.5 -5% |
| sRGB Coverage (%) | 97.2 | 98.5 1% | 60 -38% | 59.5 -39% | 95.9 -1% | 90.9 -6% |
| AdobeRGB 1998 Coverage (%) | 66.7 | 69.3 4% | 41.4 -38% | 41.12 -38% | 65.8 -1% | 63.2 -5% |
| Response Times | -12% | -133% | -167% | -9% | -14% | |
| Response Time Grey 50% / Grey 80% * (ms) | 15 ? | 16.8 ? -12% | 32.4 -116% | 36.8 ? -145% | 15.2 ? -1% | 16 ? -7% |
| Response Time Black / White * (ms) | 9 ? | 10 ? -11% | 22.4 -149% | 26 ? -189% | 10.4 ? -16% | 10.8 ? -20% |
| PWM Frequency (Hz) | ||||||
| Screen | -24% | -61% | -85% | -30% | -50% | |
| Brightness middle (cd/m²) | 323 | 370 15% | 266 -18% | 260 -20% | 292 -10% | 325 1% |
| Brightness (cd/m²) | 305 | 333 9% | 264 -13% | 251 -18% | 285 -7% | 318 4% |
| Brightness Distribution (%) | 89 | 84 -6% | 79 -11% | 85 -4% | 94 6% | 95 7% |
| Black Level * (cd/m²) | 0.25 | 0.38 -52% | 0.32 -28% | 0.26 -4% | 0.355 -42% | 0.29 -16% |
| Contrast (:1) | 1292 | 974 -25% | 831 -36% | 1000 -23% | 823 -36% | 1121 -13% |
| Colorchecker dE 2000 * | 1.87 | 2.41 -29% | 3.97 -112% | 3.9 -109% | 2.47 -32% | 4.33 -132% |
| Colorchecker dE 2000 max. * | 4.84 | 7.32 -51% | 8.93 -85% | 20.64 -326% | 8.69 -80% | 8.6 -78% |
| Colorchecker dE 2000 calibrated * | 0.92 | 1.19 -29% | 3.5 -280% | 3.71 -303% | 0.96 -4% | 1.95 -112% |
| Greyscale dE 2000 * | 2.57 | 3.9 -52% | 1.8 30% | 1.6 38% | 4.3 -67% | 5.5 -114% |
| Gamma | 2.42 91% | 2.287 96% | 2.31 95% | 2.068 106% | 2.298 96% | 2.142 103% |
| CCT | 7012 93% | 7302 89% | 6754 96% | 6511 100% | 7000 93% | 7893 82% |
| Color Space (Percent of AdobeRGB 1998) (%) | 69 | 41.4 | ||||
| Color Space (Percent of sRGB) (%) | 93 | 60 | ||||
| Toplam Ortalama (Program / Ayarlar) | -11% /
-17% | -77% /
-67% | -97% /
-87% | -13% /
-21% | -23% /
-35% |
* ... daha küçük daha iyidir
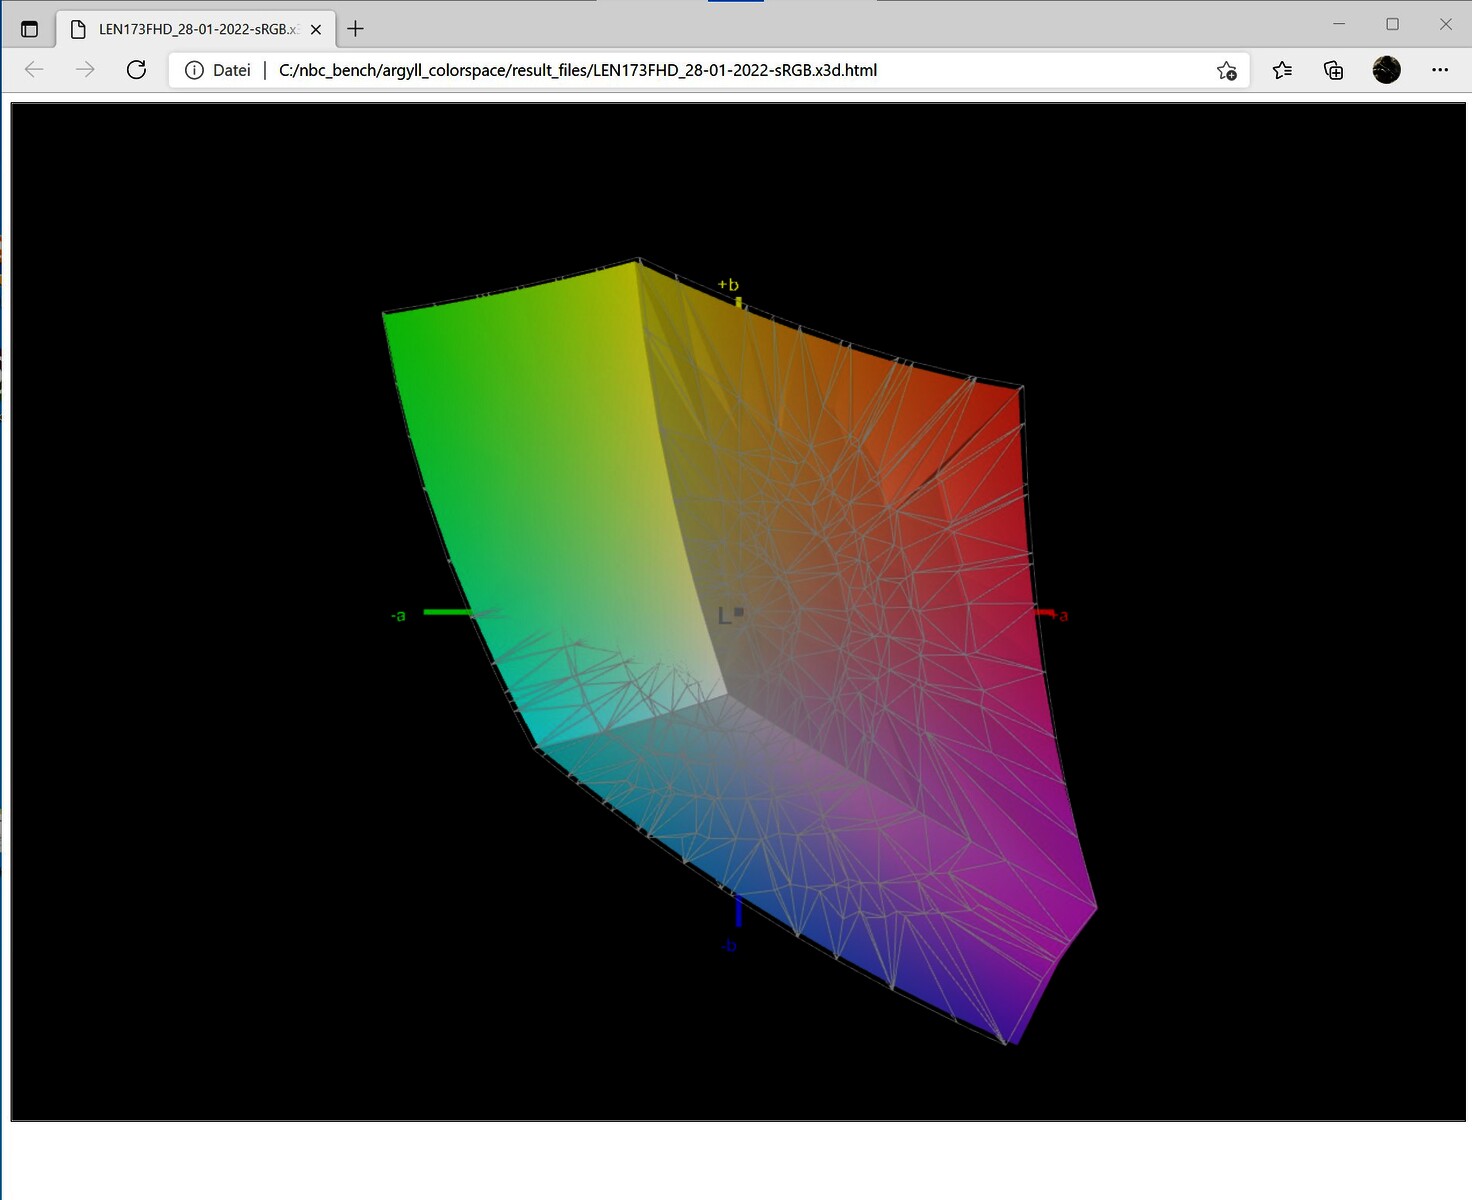
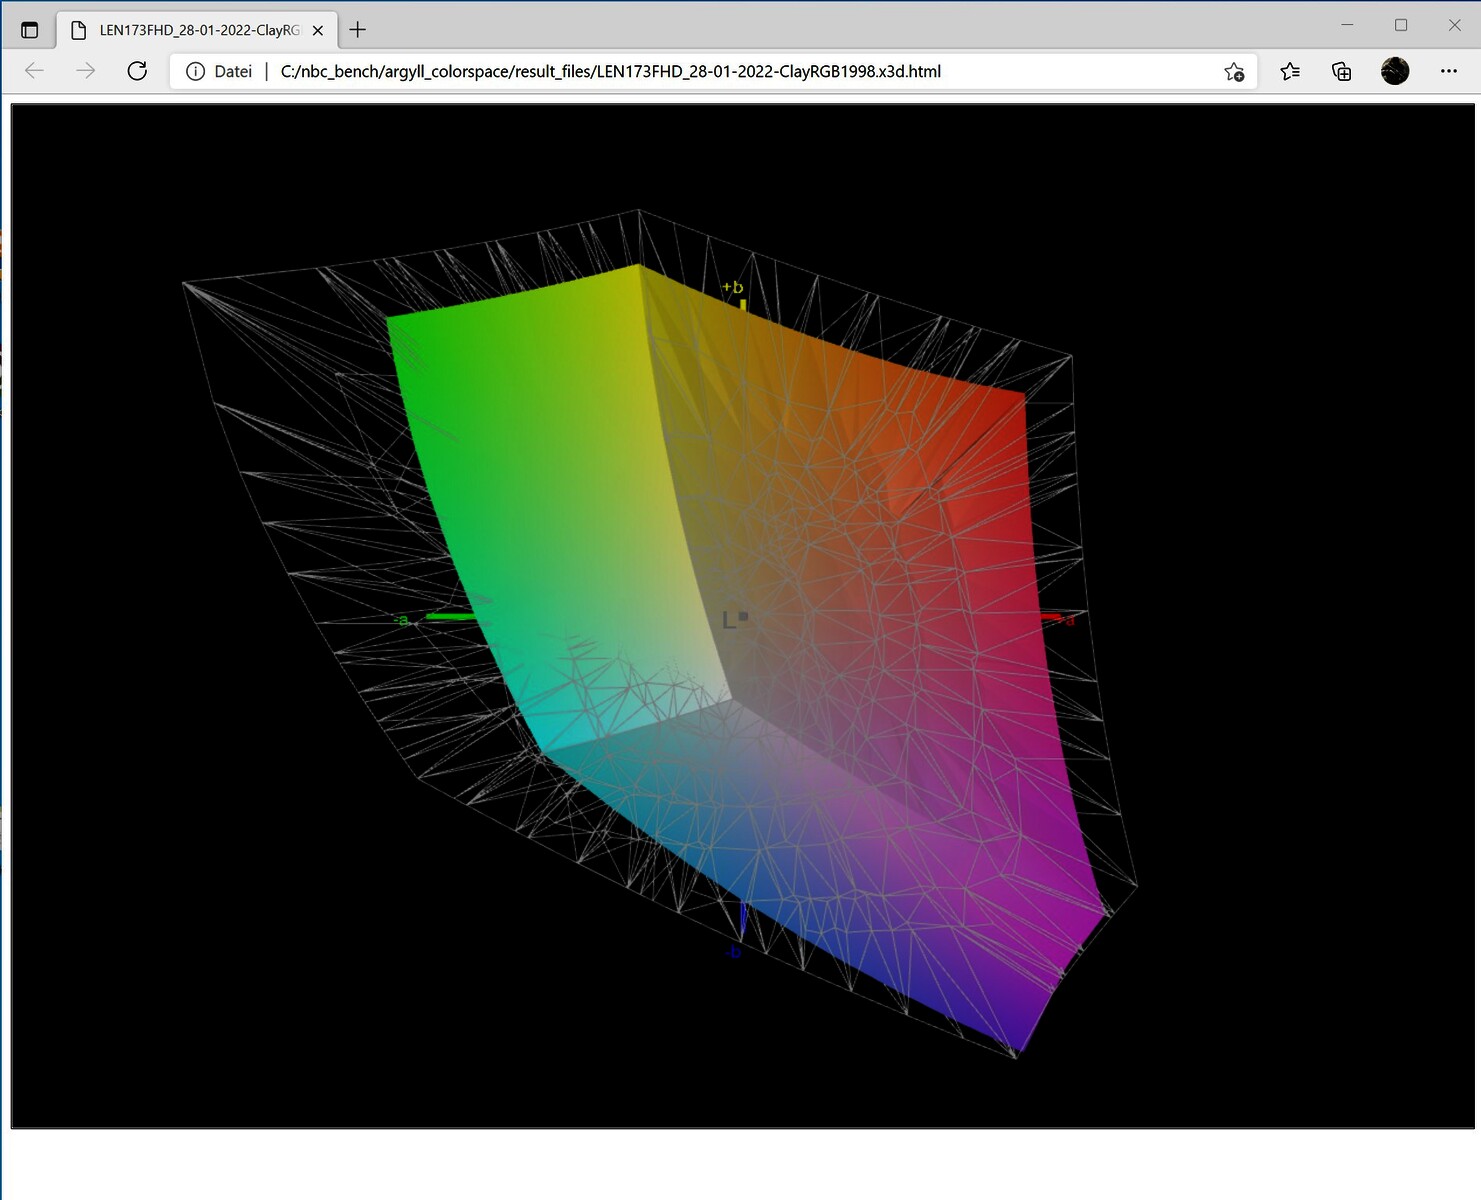
Görüntü kalitesi her açıdan sürekli olarak iyidir. Mat yüzeye rağmen, grenlilik yoktur. Ayrıca, sRGB renk alanına göre gri tonlama ve renklerin deltaE-2000 değerleri 3'ten daha düşük ideal aralık içinde olduğundan, Lenovo, Lenovo Legion 5 17'nin ekranını önceden kalibre etmiş görünmektedir. , bu IPS ekranlar için çok yaygındır. Ne olursa olsun, manuel kalibrasyonumuzla bunu en aza indirmeyi başardık. Ek olarak, düşük deltaE-2000 değerlerini küçük bir farkla daha da iyileştirebildik.
Yanıt Sürelerini Görüntüle
| ↔ Tepki Süresi Siyahtan Beyaza | ||
|---|---|---|
| 9 ms ... yükseliş ↗ ve sonbahar↘ birleşimi | ↗ 5 ms yükseliş |  |
| ↘ 4 ms sonbahar | ||
| Ekran, testlerimizde hızlı yanıt oranları gösteriyor ve oyun oynamaya uygun olmalı. Karşılaştırıldığında, test edilen tüm cihazlar 0.1 (minimum) ile 240 (maksimum) ms arasında değişir. » Tüm cihazların 25 %'si daha iyi. Bu, ölçülen yanıt süresinin test edilen tüm cihazların ortalamasından (19.9 ms) daha iyi olduğu anlamına gelir. | ||
| ↔ Tepki Süresi %50 Griden %80 Griye | ||
| 15 ms ... yükseliş ↗ ve sonbahar↘ birleşimi | ↗ 7 ms yükseliş |  |
| ↘ 8 ms sonbahar | ||
| Ekran, testlerimizde iyi yanıt oranları gösteriyor ancak rekabetçi oyuncular için çok yavaş olabilir. Karşılaştırıldığında, test edilen tüm cihazlar 0.165 (minimum) ile 636 (maksimum) ms arasında değişir. » Tüm cihazların 29 %'si daha iyi. Bu, ölçülen yanıt süresinin test edilen tüm cihazların ortalamasından (31.1 ms) daha iyi olduğu anlamına gelir. | ||
Ekran Titremesi / PWM (Darbe Genişliği Modülasyonu)
| Ekran titriyor / PWM algılanmadı |  | ||
Karşılaştırıldığında: Test edilen tüm cihazların %52 %'si ekranı karartmak için PWM kullanmıyor. PWM tespit edilirse, ortalama 7791 (minimum: 5 - maksimum: 343500) Hz ölçüldü. | |||
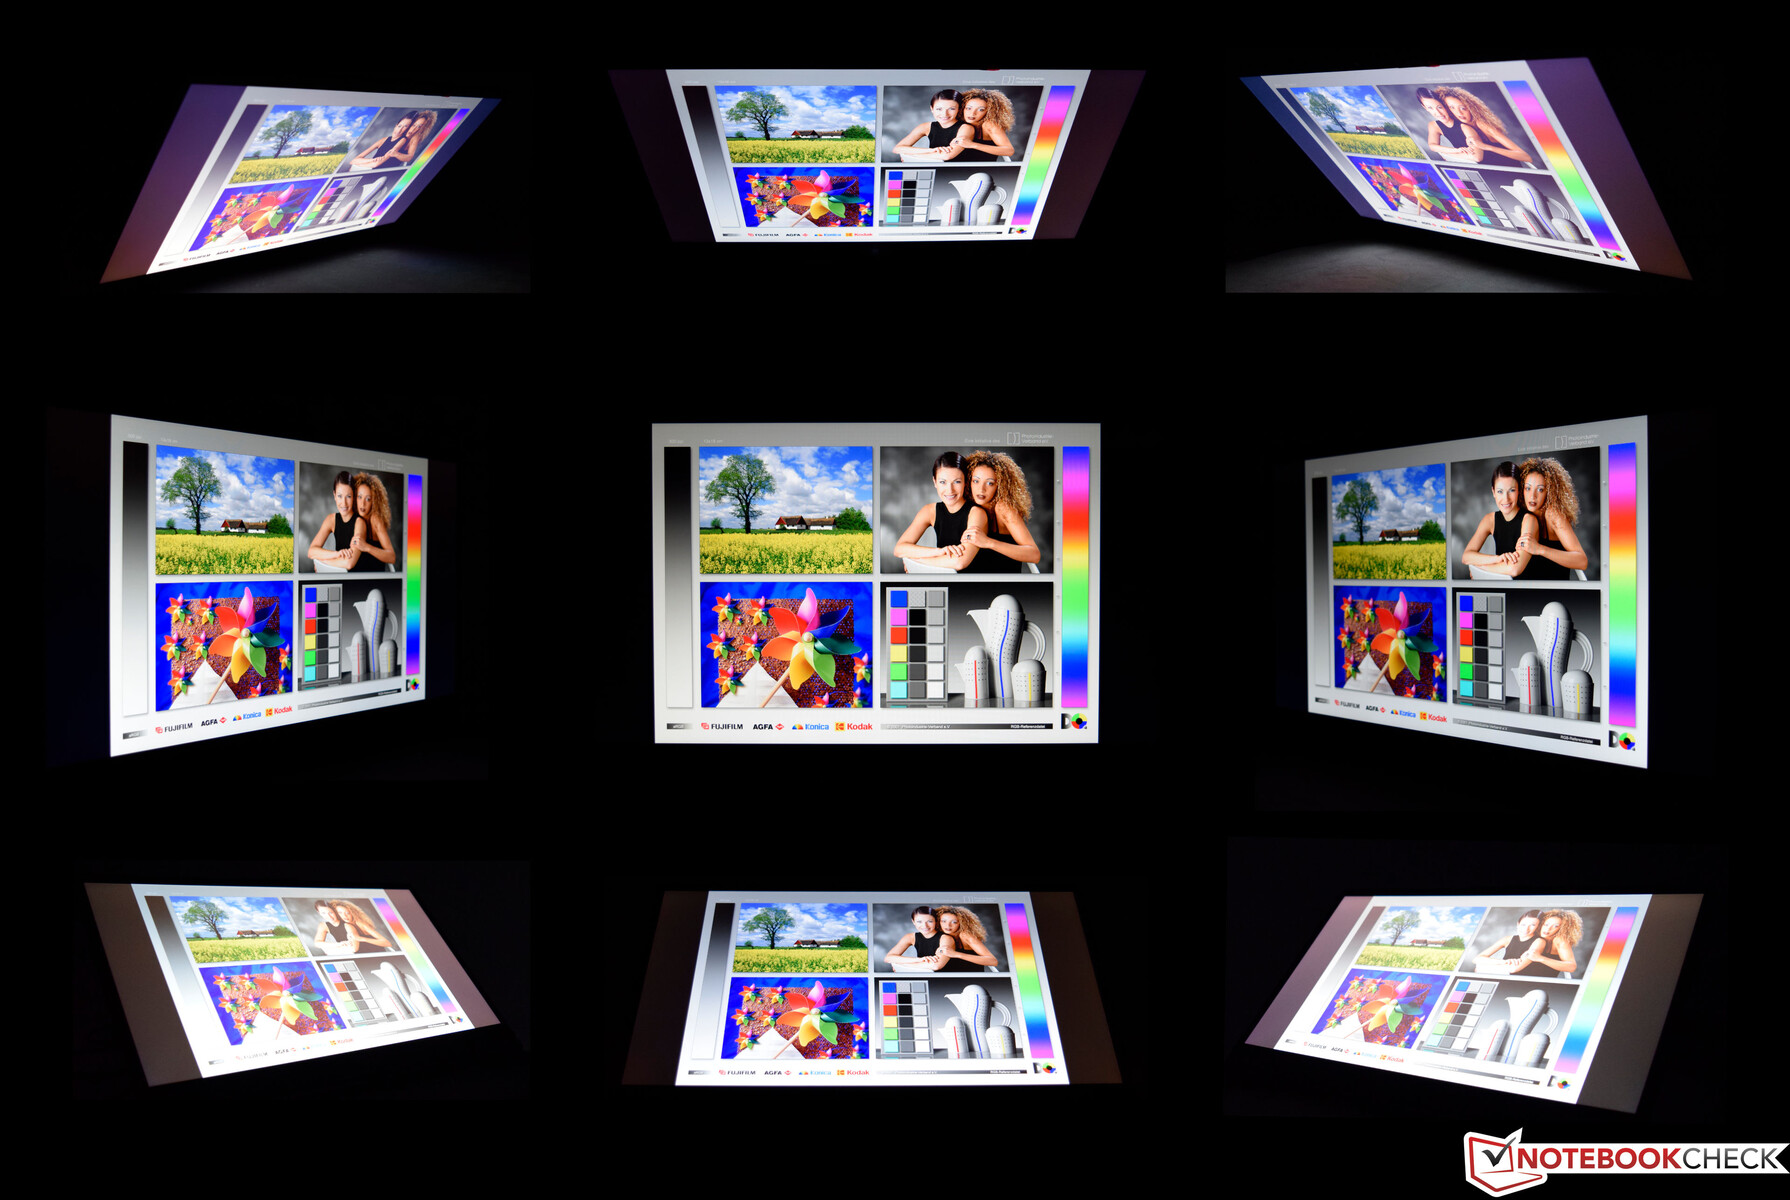
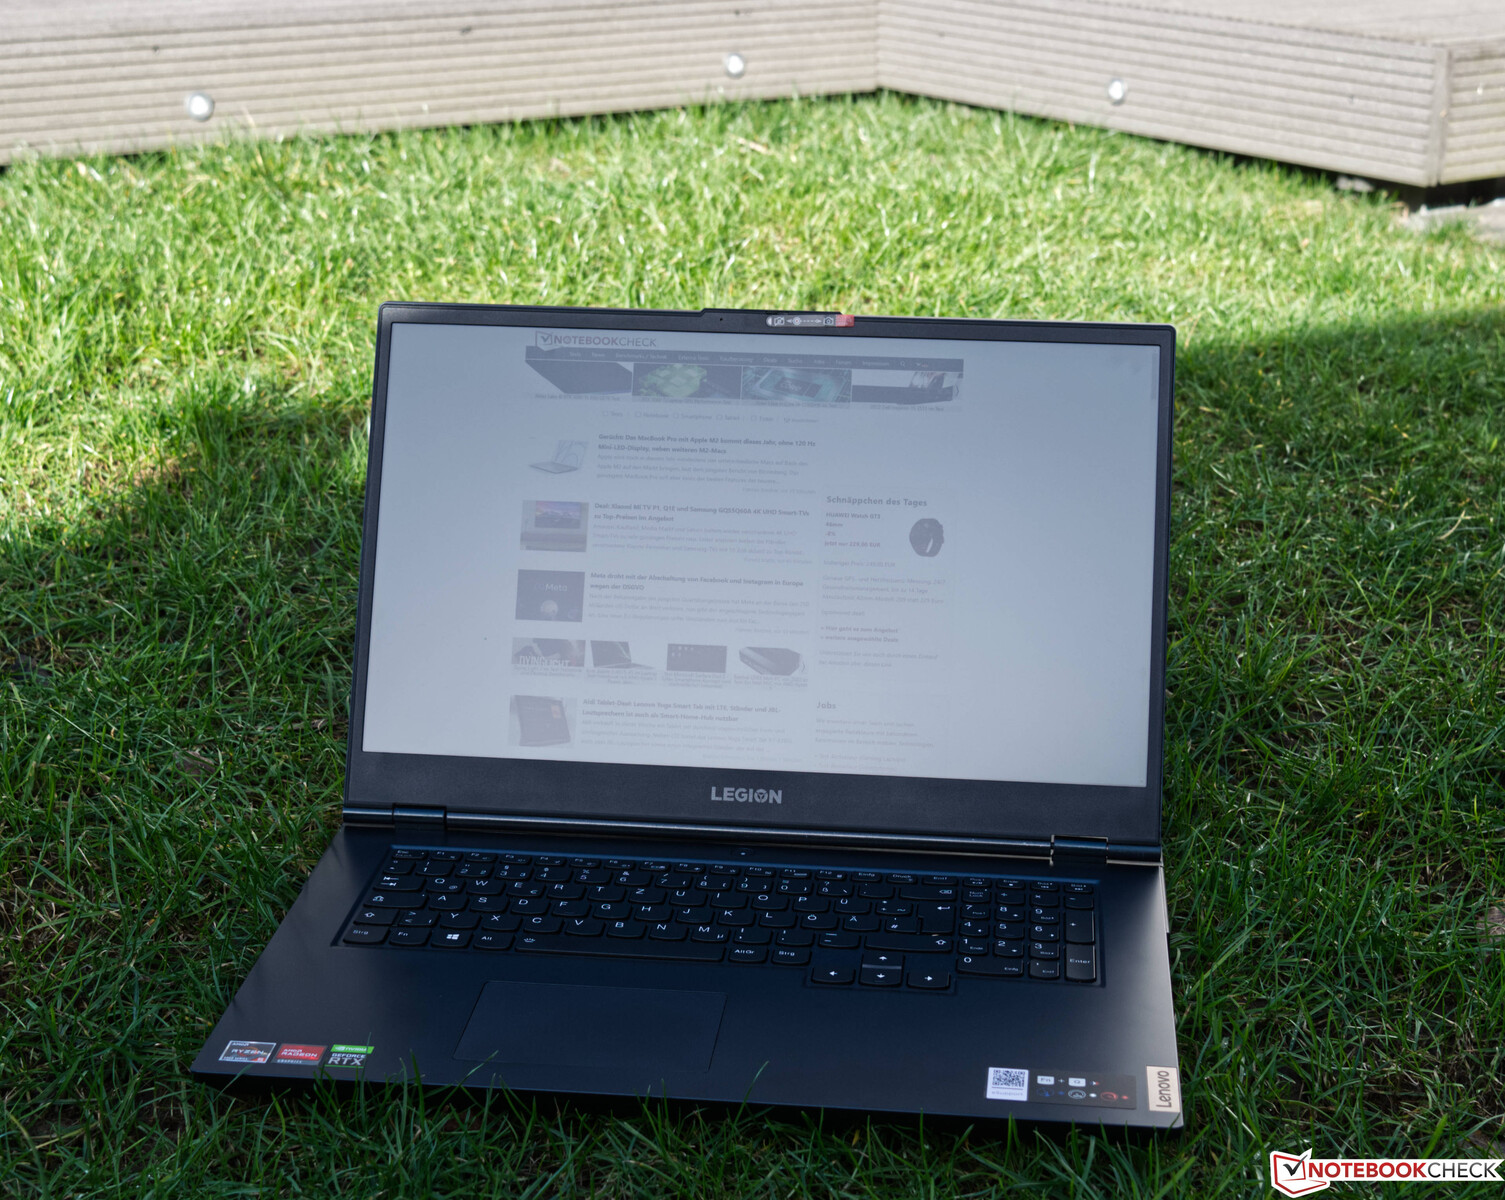
Lenovo Legion 5 17'nin dış mekan uygunluğu sınırlıdır. Dizüstü bilgisayarı yine de dışarıda kullanmayı seçerseniz, gölgede kalmanız önerilir. Bu durumda parlaklık seviyesi çoğu görev için yeterlidir. Görüş açısı testimiz, bir IPS paneli için tipik olan bir sonucu gösterir. Yalnızca dört köşedeki resimlerde soluk bir perde görülüyor. Normal kullanım sırasında bu görünmez.
Performans
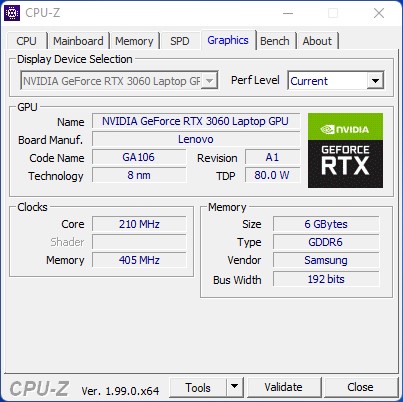
Bir oyun dizüstü bilgisayarı için CPU ve ekran kartı performansı en yüksek önceliktir. AMD Ryzen 5 5600H ve Nvidia GeForce RTX 3060 mobile GPU mobil ekran kartı , yerel 1080p oyun için tamamen yeterli olan sağlam bir oyun performansı için birlikte iyi çalıştığından , tüm yollar sonunda Legion 5 17'ye çıkar. Hâlâ daha hızlı performans arayanlar, Lenovo Legion 5 17'yi AMD Ryzen 7 5800H ve Nvidia GeForce RTX 3070 mobile GPU mobil ekran kartı ile yapılandırabilir. Doğal olarak, bu seçenekler bir fiyat primi ile gelir.
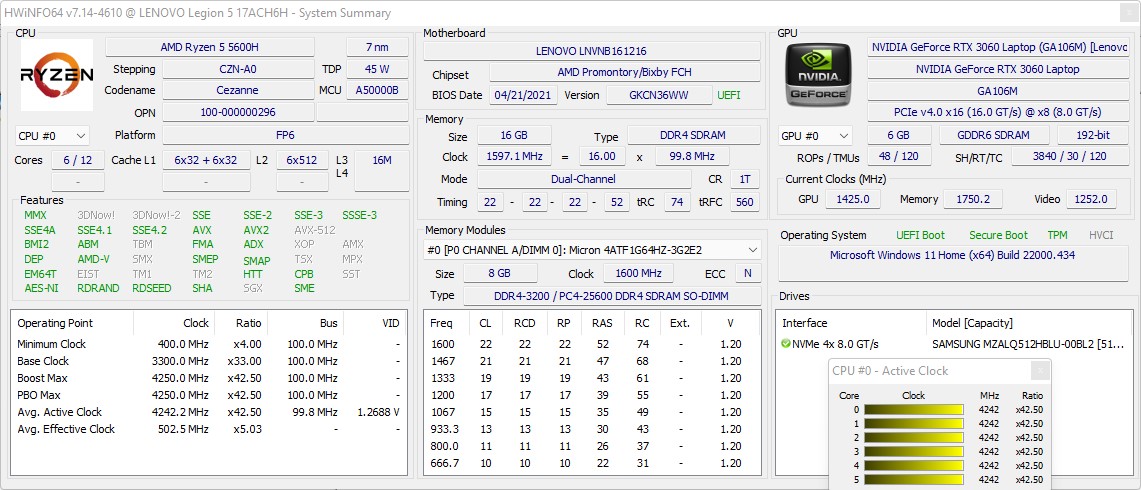
Test Koşulları
Önceden yüklenmiş Lenovo Vantage Center, kullanıcıların çeşitli sistem ayarlarını özelleştirmesine olanak tanır. Örneğin ekran kartı performansı, önceden tanımlanmış enerji profilleri ile ayarlanabilir. Tüm kıyaslamalar, performans profili etkinleştirilerek çalıştırıldı. Bu, Nvidia GeForce RTX 3060'ın 130 watt'lık tam güç bütçesine erişmesini sağlar.
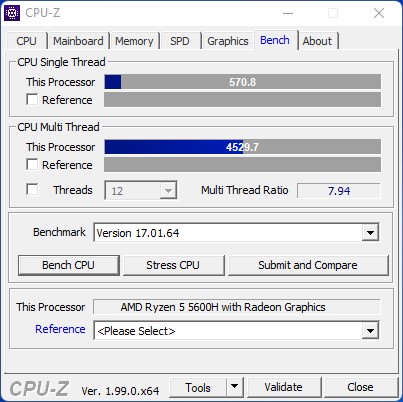
İşlemci
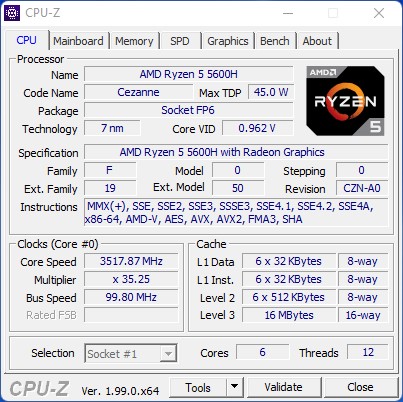
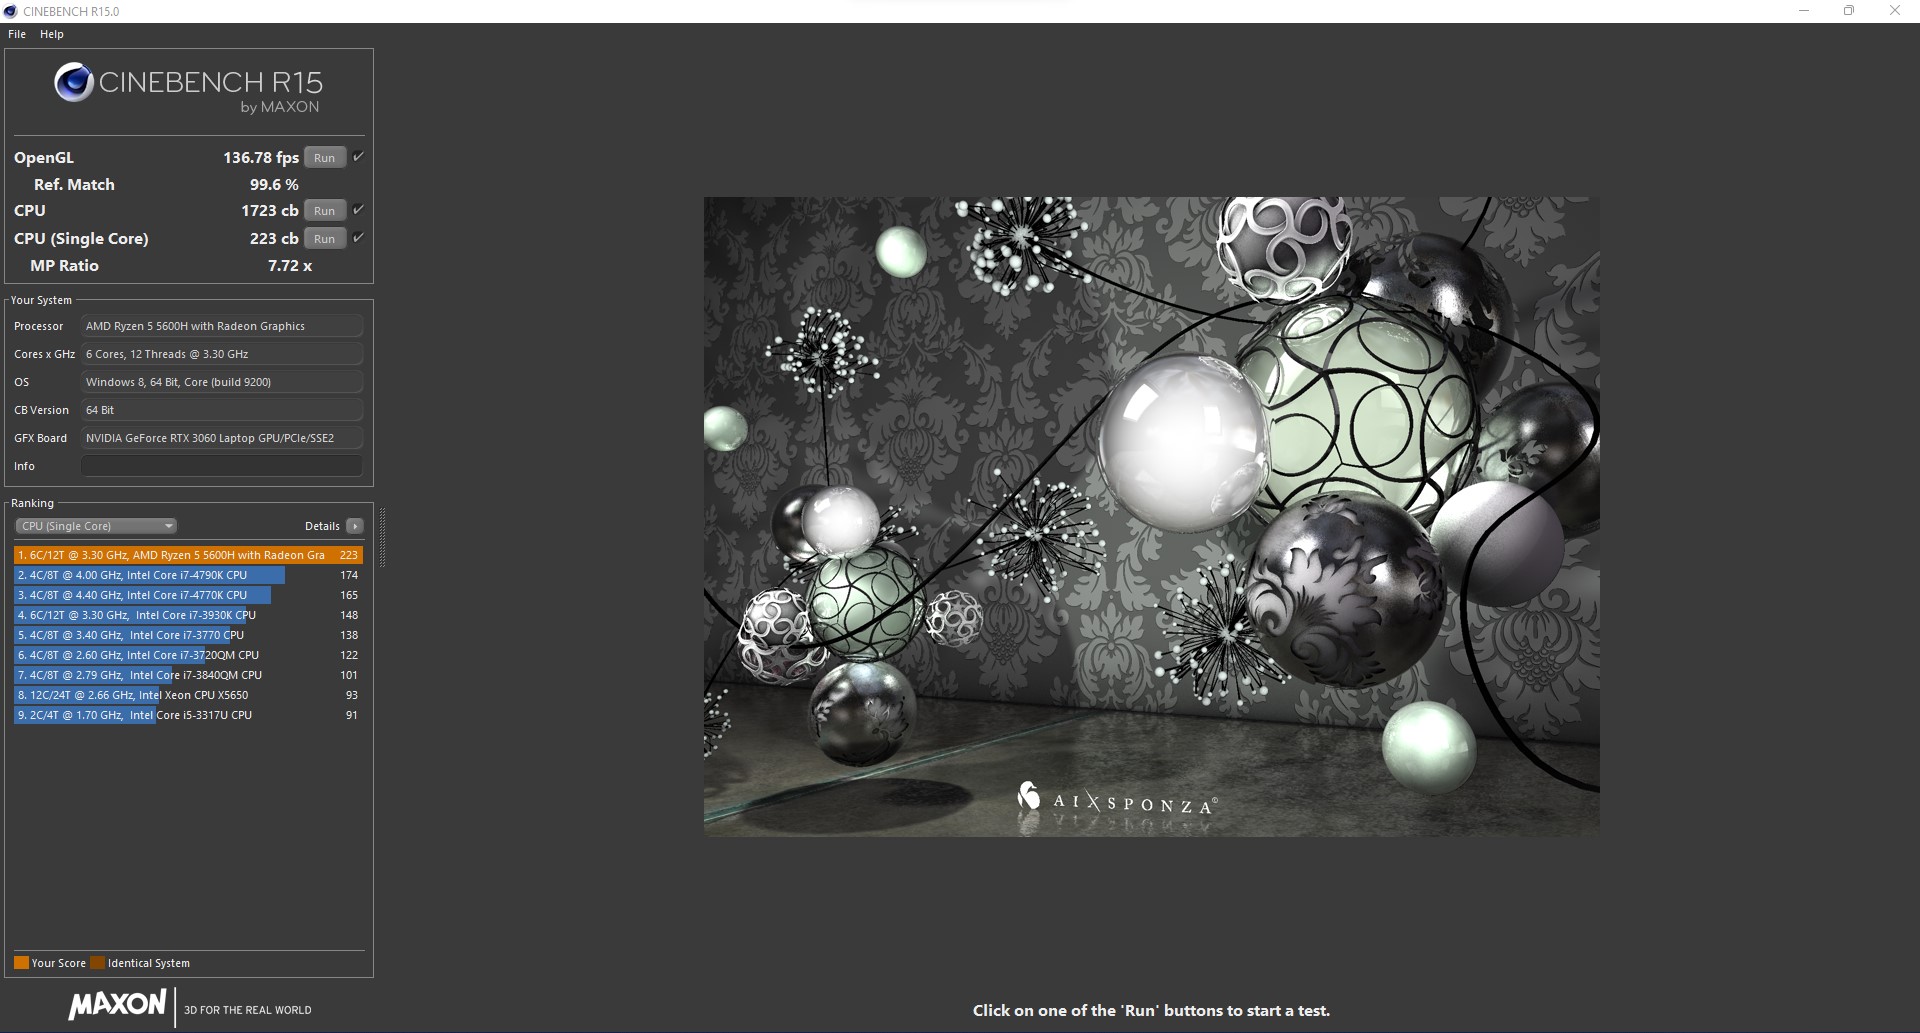
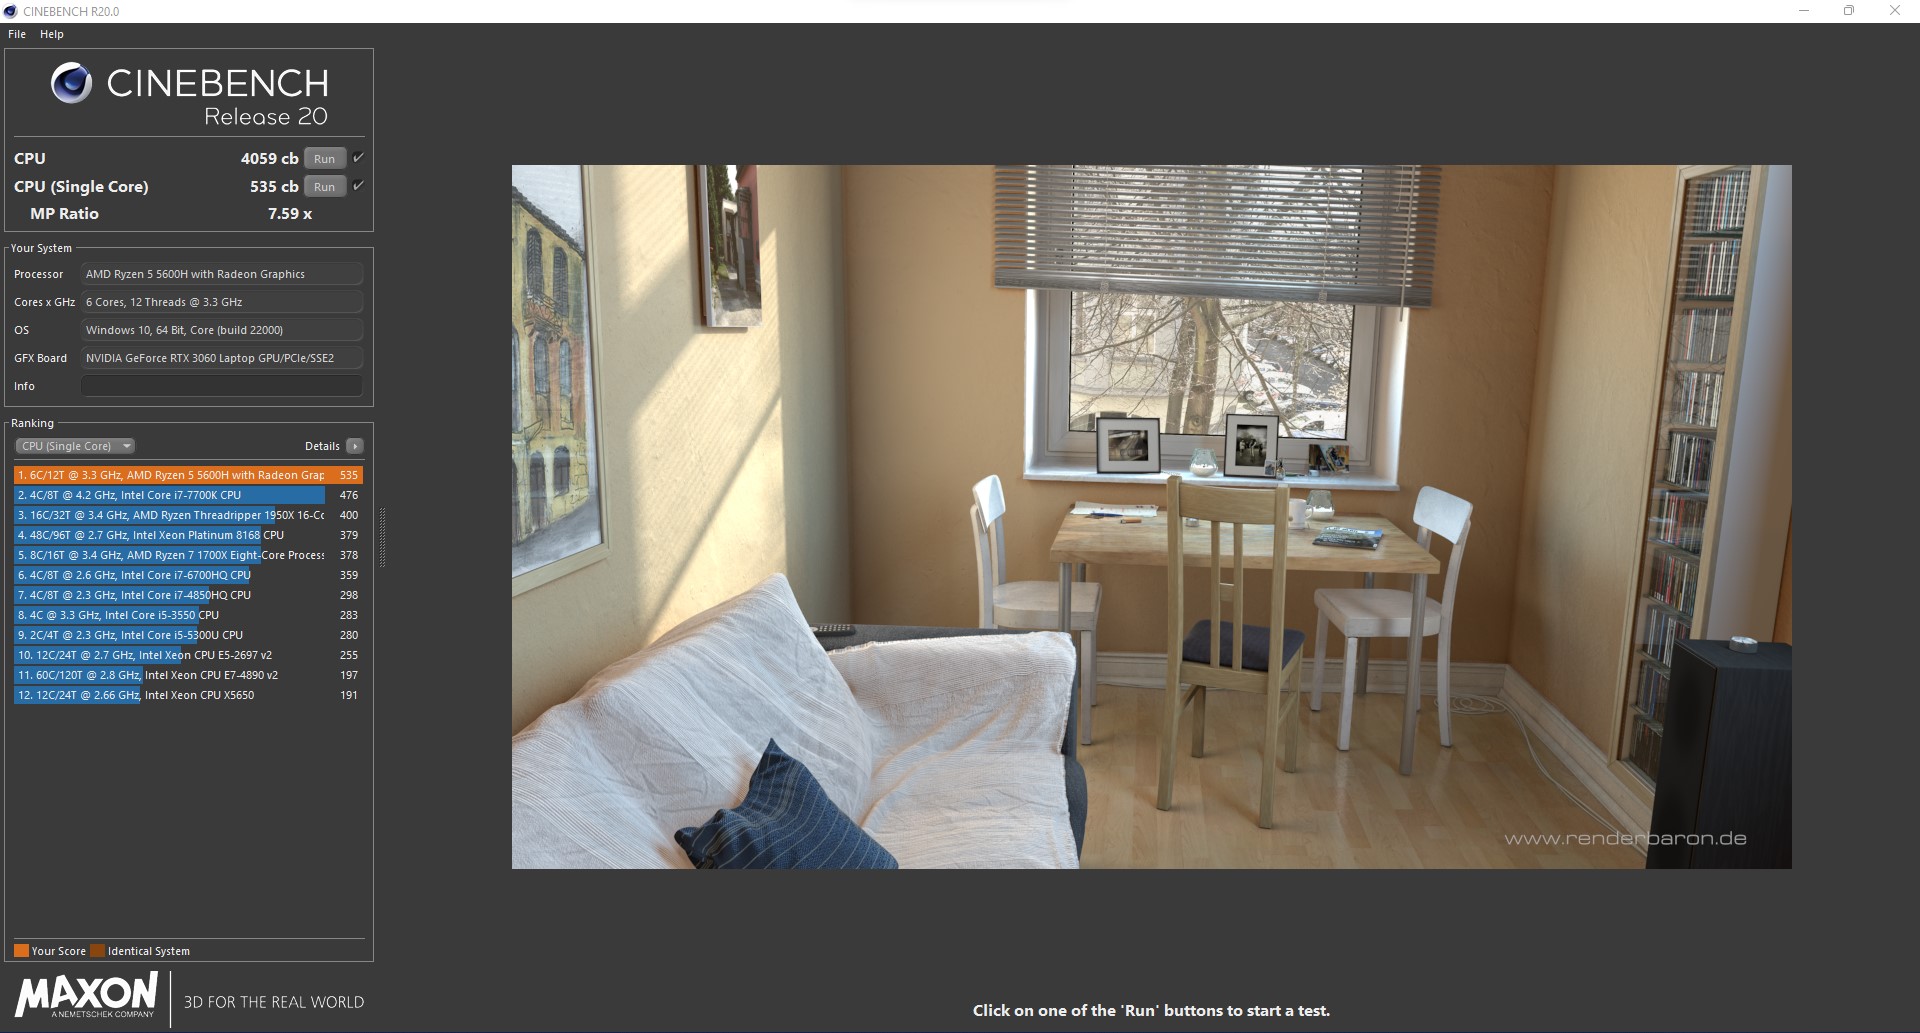
Altı çekirdek ve on iki iş parçacığı ile AMD Ryzen 5 5600H, oldukça hızlı performans sunar. Ancak Lenovo Legion 5 17, sekiz çekirdekli rakiplerine ayak uyduramıyor. AMD Ryzen 5 5600H hala iyi performans gösteriyor ve sonuçlar bu işlemci için ortalamanın üzerinde.
Lenovo Legion 5 17, Cinebench R15 multi'yi bir döngüde çalıştırmaktan oluşan stres testimizde nispeten iyi bir performans sergiliyor. Performans tutarlı kalıyor ve herhangi bir düşüş gözlemlemedik.
CPU karşılaştırma tablomuzda daha fazla karşılaştırma ve kıyaslama bulunabilir.
Cinebench R15 Multi Loop
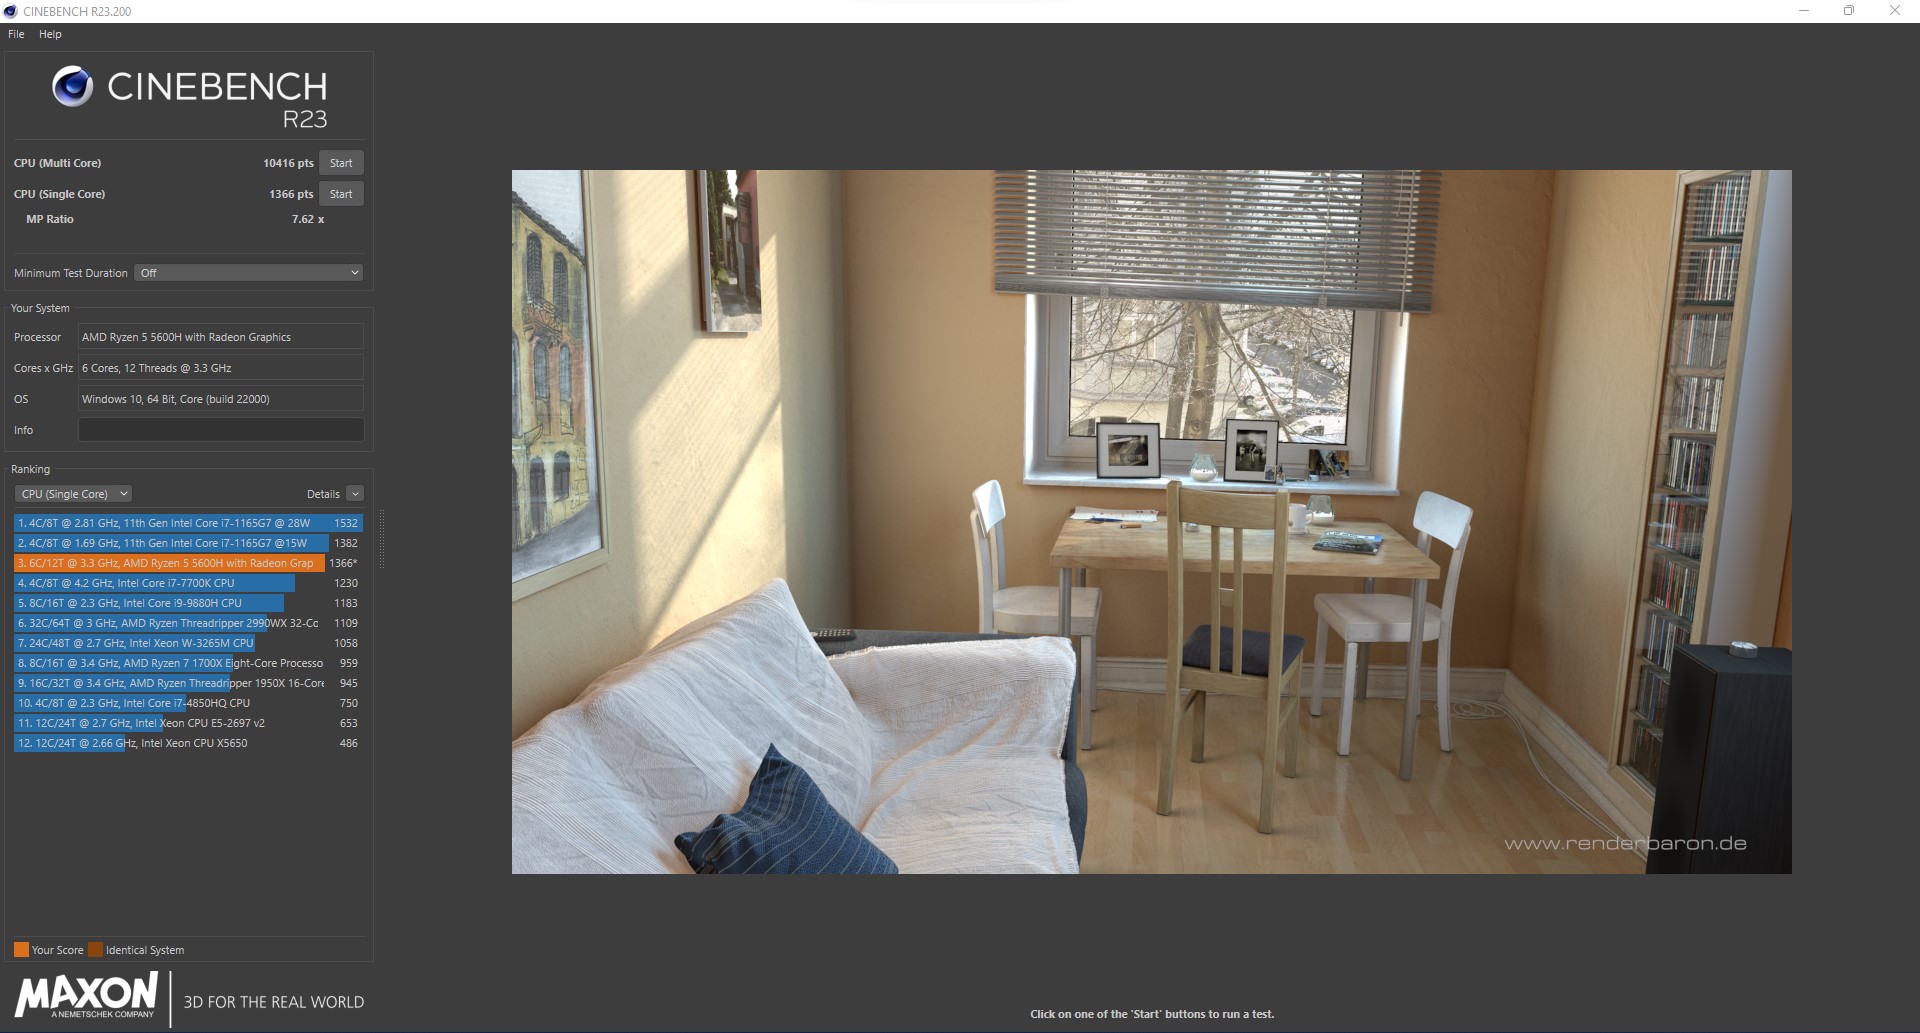
Cinebench R23: Multi Core | Single Core
Cinebench R20: CPU (Multi Core) | CPU (Single Core)
Cinebench R15: CPU Multi 64Bit | CPU Single 64Bit
Blender: v2.79 BMW27 CPU
7-Zip 18.03: 7z b 4 | 7z b 4 -mmt1
Geekbench 5.5: Multi-Core | Single-Core
HWBOT x265 Benchmark v2.2: 4k Preset
LibreOffice : 20 Documents To PDF
R Benchmark 2.5: Overall mean
| CPU Performance rating | |
| Sınıf ortalaması Gaming | |
| Schenker XMG Apex 17 M21 | |
| Asus TUF Gaming F17 FX706HM | |
| Gigabyte A7 X1 | |
| MSI Katana GF76 11UE | |
| Lenovo Legion 5 17ACH6H-82JY0003GE | |
| Ortalama AMD Ryzen 5 5600H | |
| Schenker XMG Core 17 (Early 2021) | |
| Cinebench R23 / Multi Core | |
| Sınıf ortalaması Gaming (10488 - 40970, n=110, son 2 yıl) | |
| Schenker XMG Apex 17 M21 | |
| Gigabyte A7 X1 | |
| Asus TUF Gaming F17 FX706HM | |
| MSI Katana GF76 11UE | |
| Lenovo Legion 5 17ACH6H-82JY0003GE | |
| Ortalama AMD Ryzen 5 5600H (7945 - 10416, n=13) | |
| Schenker XMG Core 17 (Early 2021) | |
| Cinebench R23 / Single Core | |
| Sınıf ortalaması Gaming (1166 - 2356, n=110, son 2 yıl) | |
| Asus TUF Gaming F17 FX706HM | |
| MSI Katana GF76 11UE | |
| Gigabyte A7 X1 | |
| Schenker XMG Apex 17 M21 | |
| Lenovo Legion 5 17ACH6H-82JY0003GE | |
| Ortalama AMD Ryzen 5 5600H (1316 - 1381, n=13) | |
| Schenker XMG Core 17 (Early 2021) | |
| Cinebench R20 / CPU (Multi Core) | |
| Sınıf ortalaması Gaming (4029 - 16108, n=109, son 2 yıl) | |
| Schenker XMG Apex 17 M21 | |
| Gigabyte A7 X1 | |
| Asus TUF Gaming F17 FX706HM | |
| MSI Katana GF76 11UE | |
| Lenovo Legion 5 17ACH6H-82JY0003GE | |
| Ortalama AMD Ryzen 5 5600H (3074 - 4059, n=16) | |
| Schenker XMG Core 17 (Early 2021) | |
| Cinebench R20 / CPU (Single Core) | |
| Sınıf ortalaması Gaming (442 - 895, n=109, son 2 yıl) | |
| Asus TUF Gaming F17 FX706HM | |
| Gigabyte A7 X1 | |
| MSI Katana GF76 11UE | |
| Schenker XMG Apex 17 M21 | |
| Lenovo Legion 5 17ACH6H-82JY0003GE | |
| Ortalama AMD Ryzen 5 5600H (527 - 538, n=15) | |
| Schenker XMG Core 17 (Early 2021) | |
| Cinebench R15 / CPU Multi 64Bit | |
| Sınıf ortalaması Gaming (1578 - 6271, n=109, son 2 yıl) | |
| Gigabyte A7 X1 | |
| Schenker XMG Apex 17 M21 | |
| Asus TUF Gaming F17 FX706HM | |
| MSI Katana GF76 11UE | |
| Lenovo Legion 5 17ACH6H-82JY0003GE | |
| Ortalama AMD Ryzen 5 5600H (1319 - 1723, n=16) | |
| Schenker XMG Core 17 (Early 2021) | |
| Cinebench R15 / CPU Single 64Bit | |
| Sınıf ortalaması Gaming (188.8 - 343, n=109, son 2 yıl) | |
| Asus TUF Gaming F17 FX706HM | |
| Gigabyte A7 X1 | |
| Schenker XMG Apex 17 M21 | |
| MSI Katana GF76 11UE | |
| Lenovo Legion 5 17ACH6H-82JY0003GE | |
| Ortalama AMD Ryzen 5 5600H (218 - 225, n=14) | |
| Schenker XMG Core 17 (Early 2021) | |
| Blender / v2.79 BMW27 CPU | |
| Schenker XMG Core 17 (Early 2021) | |
| Ortalama AMD Ryzen 5 5600H (300 - 384, n=14) | |
| Lenovo Legion 5 17ACH6H-82JY0003GE | |
| MSI Katana GF76 11UE | |
| Gigabyte A7 X1 | |
| Asus TUF Gaming F17 FX706HM | |
| Schenker XMG Apex 17 M21 | |
| Sınıf ortalaması Gaming (80 - 330, n=107, son 2 yıl) | |
| 7-Zip 18.03 / 7z b 4 | |
| Sınıf ortalaması Gaming (33491 - 148086, n=108, son 2 yıl) | |
| Schenker XMG Apex 17 M21 | |
| Gigabyte A7 X1 | |
| Asus TUF Gaming F17 FX706HM | |
| Lenovo Legion 5 17ACH6H-82JY0003GE | |
| MSI Katana GF76 11UE | |
| Ortalama AMD Ryzen 5 5600H (36315 - 46562, n=14) | |
| Schenker XMG Core 17 (Early 2021) | |
| 7-Zip 18.03 / 7z b 4 -mmt1 | |
| Sınıf ortalaması Gaming (4199 - 7436, n=108, son 2 yıl) | |
| Asus TUF Gaming F17 FX706HM | |
| Gigabyte A7 X1 | |
| Schenker XMG Apex 17 M21 | |
| MSI Katana GF76 11UE | |
| Schenker XMG Core 17 (Early 2021) | |
| Lenovo Legion 5 17ACH6H-82JY0003GE | |
| Ortalama AMD Ryzen 5 5600H (5213 - 5446, n=14) | |
| Geekbench 5.5 / Multi-Core | |
| Sınıf ortalaması Gaming (6460 - 27010, n=108, son 2 yıl) | |
| Schenker XMG Apex 17 M21 | |
| MSI Katana GF76 11UE | |
| Asus TUF Gaming F17 FX706HM | |
| Gigabyte A7 X1 | |
| Schenker XMG Core 17 (Early 2021) | |
| Lenovo Legion 5 17ACH6H-82JY0003GE | |
| Ortalama AMD Ryzen 5 5600H (4990 - 7253, n=14) | |
| Geekbench 5.5 / Single-Core | |
| Sınıf ortalaması Gaming (986 - 2474, n=108, son 2 yıl) | |
| Asus TUF Gaming F17 FX706HM | |
| MSI Katana GF76 11UE | |
| Gigabyte A7 X1 | |
| Schenker XMG Apex 17 M21 | |
| Lenovo Legion 5 17ACH6H-82JY0003GE | |
| Ortalama AMD Ryzen 5 5600H (1365 - 1445, n=14) | |
| Schenker XMG Core 17 (Early 2021) | |
| HWBOT x265 Benchmark v2.2 / 4k Preset | |
| Sınıf ortalaması Gaming (11.5 - 44.3, n=108, son 2 yıl) | |
| Schenker XMG Apex 17 M21 | |
| Asus TUF Gaming F17 FX706HM | |
| Gigabyte A7 X1 | |
| MSI Katana GF76 11UE | |
| Lenovo Legion 5 17ACH6H-82JY0003GE | |
| Ortalama AMD Ryzen 5 5600H (9.92 - 13.3, n=14) | |
| Schenker XMG Core 17 (Early 2021) | |
| LibreOffice / 20 Documents To PDF | |
| Ortalama AMD Ryzen 5 5600H (52.2 - 81.5, n=14) | |
| Gigabyte A7 X1 | |
| Schenker XMG Core 17 (Early 2021) | |
| Lenovo Legion 5 17ACH6H-82JY0003GE | |
| MSI Katana GF76 11UE | |
| Sınıf ortalaması Gaming (19 - 88.8, n=108, son 2 yıl) | |
| Schenker XMG Apex 17 M21 | |
| Asus TUF Gaming F17 FX706HM | |
| R Benchmark 2.5 / Overall mean | |
| Schenker XMG Core 17 (Early 2021) | |
| MSI Katana GF76 11UE | |
| Ortalama AMD Ryzen 5 5600H (0.526 - 0.596, n=14) | |
| Lenovo Legion 5 17ACH6H-82JY0003GE | |
| Asus TUF Gaming F17 FX706HM | |
| Schenker XMG Apex 17 M21 | |
| Gigabyte A7 X1 | |
| Sınıf ortalaması Gaming (0.3439 - 0.759, n=109, son 2 yıl) | |
* ... daha küçük daha iyidir
AIDA64: FP32 Ray-Trace | FPU Julia | CPU SHA3 | CPU Queen | FPU SinJulia | FPU Mandel | CPU AES | CPU ZLib | FP64 Ray-Trace | CPU PhotoWorxx
| Performance rating | |
| Sınıf ortalaması Gaming | |
| Lenovo Legion 5 17ACH6H-82JY0003GE | |
| Ortalama AMD Ryzen 5 5600H | |
| AIDA64 / FP32 Ray-Trace | |
| Sınıf ortalaması Gaming (10227 - 85542, n=107, son 2 yıl) | |
| Lenovo Legion 5 17ACH6H-82JY0003GE | |
| Ortalama AMD Ryzen 5 5600H (9181 - 12636, n=14) | |
| AIDA64 / FPU Julia | |
| Sınıf ortalaması Gaming (51376 - 238426, n=107, son 2 yıl) | |
| Lenovo Legion 5 17ACH6H-82JY0003GE | |
| Ortalama AMD Ryzen 5 5600H (51994 - 78250, n=14) | |
| AIDA64 / CPU SHA3 | |
| Sınıf ortalaması Gaming (2180 - 9817, n=107, son 2 yıl) | |
| Lenovo Legion 5 17ACH6H-82JY0003GE | |
| Ortalama AMD Ryzen 5 5600H (1587 - 2675, n=14) | |
| AIDA64 / CPU Queen | |
| Sınıf ortalaması Gaming (49785 - 173351, n=98, son 2 yıl) | |
| Lenovo Legion 5 17ACH6H-82JY0003GE | |
| Ortalama AMD Ryzen 5 5600H (66699 - 77213, n=14) | |
| AIDA64 / FPU SinJulia | |
| Sınıf ortalaması Gaming (4424 - 33636, n=107, son 2 yıl) | |
| Lenovo Legion 5 17ACH6H-82JY0003GE | |
| Ortalama AMD Ryzen 5 5600H (8340 - 9159, n=14) | |
| AIDA64 / FPU Mandel | |
| Sınıf ortalaması Gaming (25115 - 128721, n=107, son 2 yıl) | |
| Lenovo Legion 5 17ACH6H-82JY0003GE | |
| Ortalama AMD Ryzen 5 5600H (28268 - 43274, n=14) | |
| AIDA64 / CPU AES | |
| Sınıf ortalaması Gaming (39258 - 247074, n=107, son 2 yıl) | |
| Lenovo Legion 5 17ACH6H-82JY0003GE | |
| Ortalama AMD Ryzen 5 5600H (39852 - 98939, n=14) | |
| AIDA64 / CPU ZLib | |
| Sınıf ortalaması Gaming (574 - 2531, n=107, son 2 yıl) | |
| Lenovo Legion 5 17ACH6H-82JY0003GE | |
| Ortalama AMD Ryzen 5 5600H (507 - 649, n=14) | |
| AIDA64 / FP64 Ray-Trace | |
| Sınıf ortalaması Gaming (5509 - 45446, n=107, son 2 yıl) | |
| Lenovo Legion 5 17ACH6H-82JY0003GE | |
| Ortalama AMD Ryzen 5 5600H (4811 - 6652, n=14) | |
| AIDA64 / CPU PhotoWorxx | |
| Sınıf ortalaması Gaming (12271 - 89891, n=107, son 2 yıl) | |
| Ortalama AMD Ryzen 5 5600H (7419 - 24746, n=14) | |
| Lenovo Legion 5 17ACH6H-82JY0003GE | |
Sistem performansı
Sistem performans testleri açısından, Lenovo Legion 5 17 iyi sonuçlar elde ediyor. Rakiplerine kıyasla çekirdek eksikliğine rağmen, hayranlık uyandıran bir şekilde devam ediyor. Burada performans, sınıf ortalamasından bir kez daha önemli ölçüde daha hızlıdır.
CrossMark: Overall | Productivity | Creativity | Responsiveness
| PCMark 10 / Score | |
| Sınıf ortalaması Gaming (5828 - 11574, n=94, son 2 yıl) | |
| Schenker XMG Apex 17 M21 | |
| Asus TUF Gaming F17 FX706HM | |
| Gigabyte A7 X1 | |
| Lenovo Legion 5 17ACH6H-82JY0003GE | |
| MSI Katana GF76 11UE | |
| Ortalama AMD Ryzen 5 5600H, NVIDIA GeForce RTX 3060 Laptop GPU (6341 - 6615, n=2) | |
| Schenker XMG Core 17 (Early 2021) | |
| PCMark 10 / Essentials | |
| Sınıf ortalaması Gaming (8810 - 12600, n=98, son 2 yıl) | |
| Asus TUF Gaming F17 FX706HM | |
| Schenker XMG Apex 17 M21 | |
| Gigabyte A7 X1 | |
| Ortalama AMD Ryzen 5 5600H, NVIDIA GeForce RTX 3060 Laptop GPU (9639 - 10127, n=2) | |
| MSI Katana GF76 11UE | |
| Lenovo Legion 5 17ACH6H-82JY0003GE | |
| Schenker XMG Core 17 (Early 2021) | |
| PCMark 10 / Productivity | |
| Sınıf ortalaması Gaming (6845 - 18766, n=96, son 2 yıl) | |
| Gigabyte A7 X1 | |
| Schenker XMG Apex 17 M21 | |
| Asus TUF Gaming F17 FX706HM | |
| Lenovo Legion 5 17ACH6H-82JY0003GE | |
| Ortalama AMD Ryzen 5 5600H, NVIDIA GeForce RTX 3060 Laptop GPU (8829 - 9027, n=2) | |
| MSI Katana GF76 11UE | |
| Schenker XMG Core 17 (Early 2021) | |
| PCMark 10 / Digital Content Creation | |
| Sınıf ortalaması Gaming (7602 - 19657, n=96, son 2 yıl) | |
| Schenker XMG Apex 17 M21 | |
| Gigabyte A7 X1 | |
| Asus TUF Gaming F17 FX706HM | |
| Lenovo Legion 5 17ACH6H-82JY0003GE | |
| MSI Katana GF76 11UE | |
| Ortalama AMD Ryzen 5 5600H, NVIDIA GeForce RTX 3060 Laptop GPU (7740 - 9026, n=2) | |
| Schenker XMG Core 17 (Early 2021) | |
| CrossMark / Overall | |
| Sınıf ortalaması Gaming (1366 - 2409, n=96, son 2 yıl) | |
| Lenovo Legion 5 17ACH6H-82JY0003GE | |
| Ortalama AMD Ryzen 5 5600H, NVIDIA GeForce RTX 3060 Laptop GPU (n=1) | |
| CrossMark / Productivity | |
| Sınıf ortalaması Gaming (1386 - 2254, n=96, son 2 yıl) | |
| Lenovo Legion 5 17ACH6H-82JY0003GE | |
| Ortalama AMD Ryzen 5 5600H, NVIDIA GeForce RTX 3060 Laptop GPU (n=1) | |
| CrossMark / Creativity | |
| Sınıf ortalaması Gaming (1343 - 2729, n=96, son 2 yıl) | |
| Lenovo Legion 5 17ACH6H-82JY0003GE | |
| Ortalama AMD Ryzen 5 5600H, NVIDIA GeForce RTX 3060 Laptop GPU (n=1) | |
| CrossMark / Responsiveness | |
| Sınıf ortalaması Gaming (1226 - 2334, n=96, son 2 yıl) | |
| Lenovo Legion 5 17ACH6H-82JY0003GE | |
| Ortalama AMD Ryzen 5 5600H, NVIDIA GeForce RTX 3060 Laptop GPU (n=1) | |
| PCMark 10 Score | 6615 puan | |
Yardım | ||
| AIDA64 / Memory Copy | |
| Sınıf ortalaması Gaming (21750 - 129946, n=107, son 2 yıl) | |
| Lenovo Legion 5 17ACH6H-82JY0003GE | |
| Ortalama AMD Ryzen 5 5600H (20549 - 42141, n=14) | |
| AIDA64 / Memory Read | |
| Sınıf ortalaması Gaming (22956 - 118858, n=107, son 2 yıl) | |
| Lenovo Legion 5 17ACH6H-82JY0003GE | |
| Ortalama AMD Ryzen 5 5600H (22917 - 47595, n=14) | |
| AIDA64 / Memory Write | |
| Sınıf ortalaması Gaming (22297 - 135096, n=107, son 2 yıl) | |
| Lenovo Legion 5 17ACH6H-82JY0003GE | |
| Ortalama AMD Ryzen 5 5600H (20226 - 44872, n=14) | |
| AIDA64 / Memory Latency | |
| Sınıf ortalaması Gaming (75.3 - 259, n=107, son 2 yıl) | |
| Ortalama AMD Ryzen 5 5600H (75 - 89.1, n=14) | |
| Lenovo Legion 5 17ACH6H-82JY0003GE | |
* ... daha küçük daha iyidir
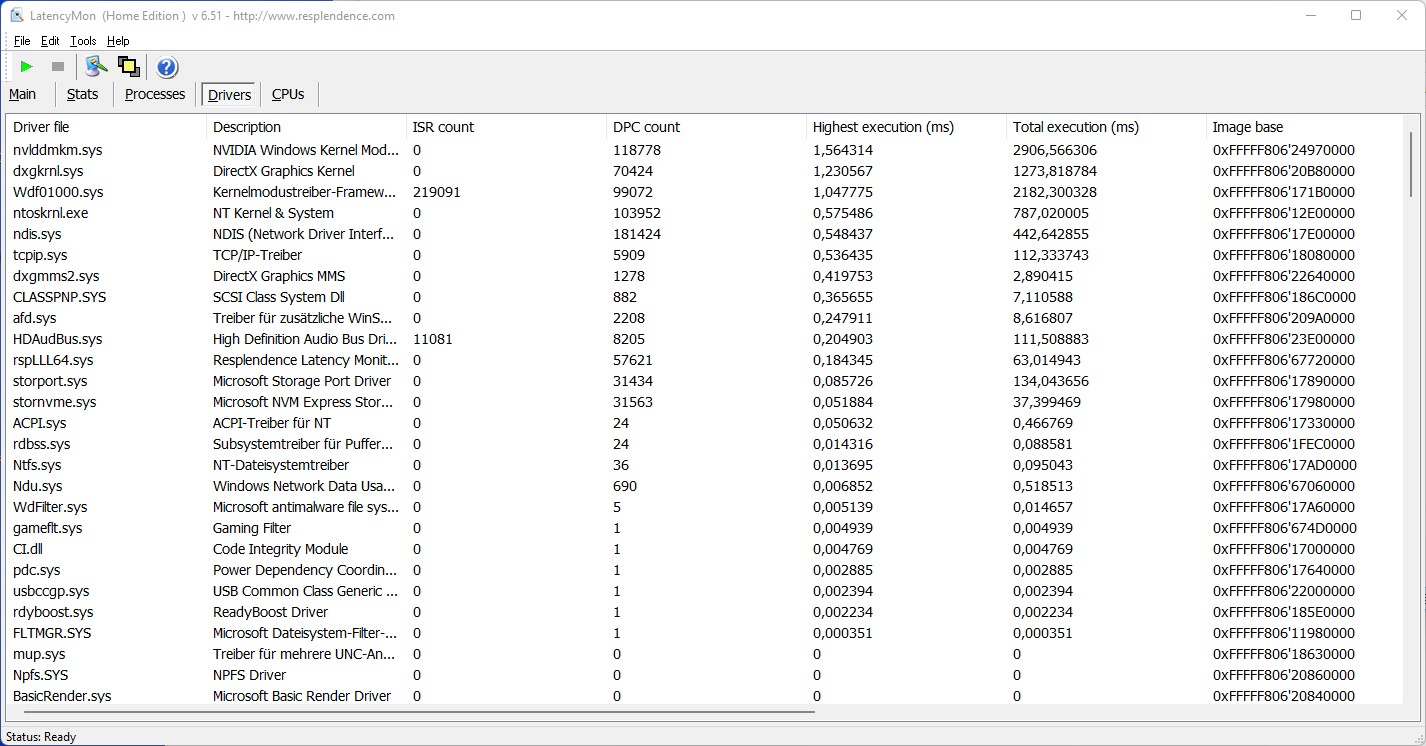
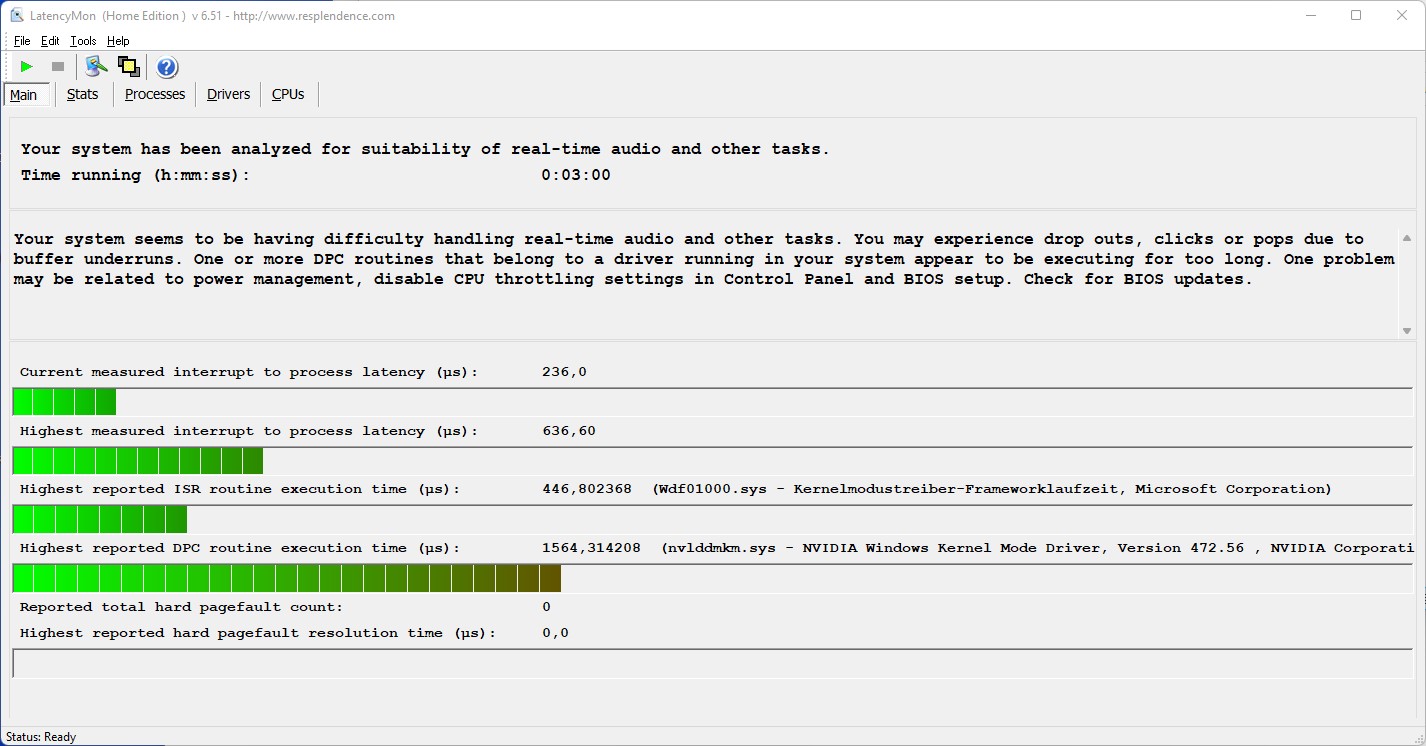
DPC Gecikmeleri
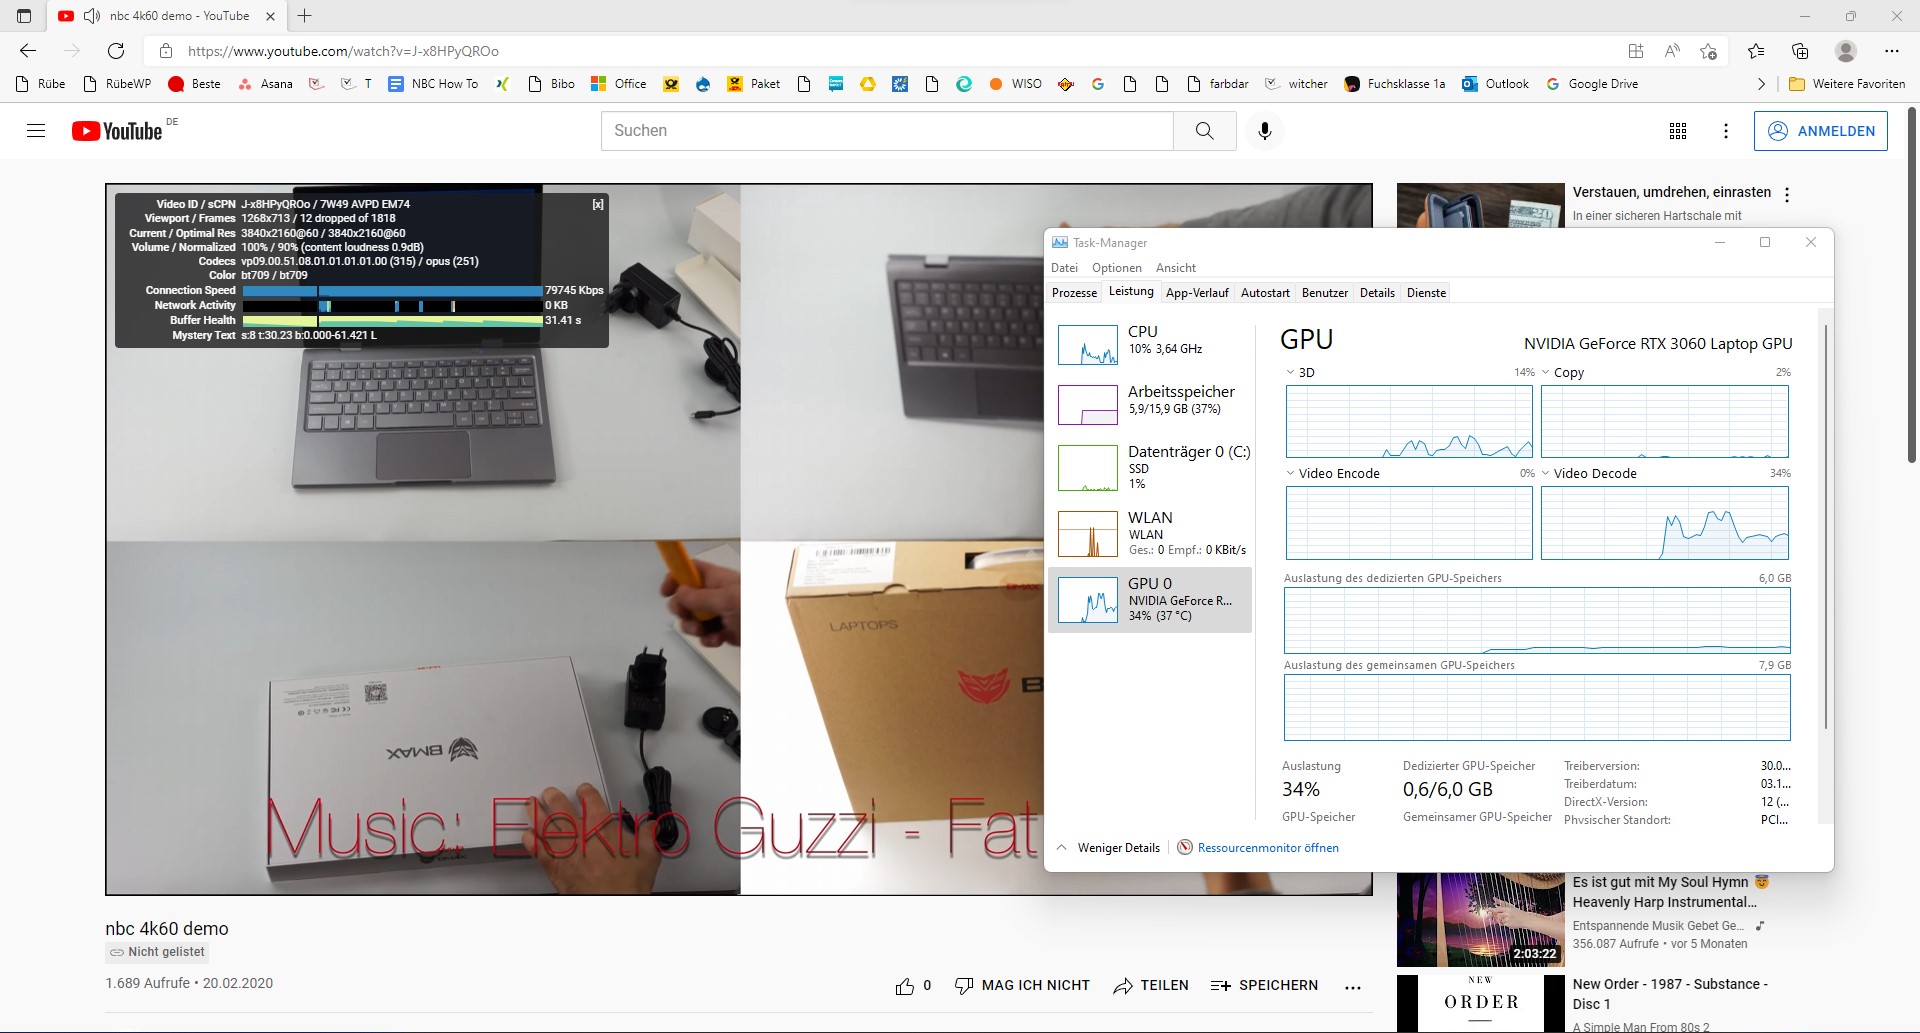
Edge'de birden fazla tarayıcı sekmesi açmak ve 4K YouTube videosunu oynatmak sorunlu sonuçlar vermedi. Gecikmeler, Prime95'i çalıştırdıktan sonra yalnızca biraz artar. Test videomuz sırasında ekran kartı yükü yaklaşık %30'dur.
| DPC Latencies / LatencyMon - interrupt to process latency (max), Web, Youtube, Prime95 | |
| MSI Katana GF76 11UE | |
| Lenovo Legion 5 17ACH6H-82JY0003GE | |
| Schenker XMG Apex 17 M21 | |
| Asus TUF Gaming F17 FX706HM | |
| Gigabyte A7 X1 | |
| Schenker XMG Core 17 (Early 2021) | |
* ... daha küçük daha iyidir
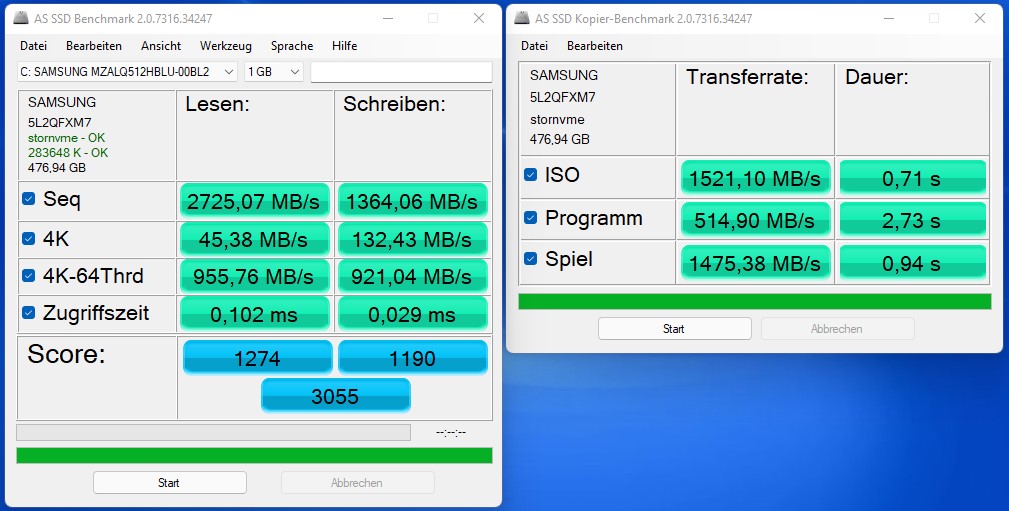
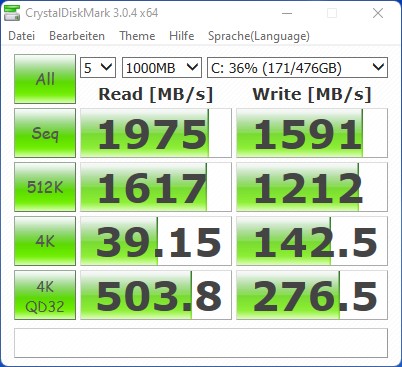
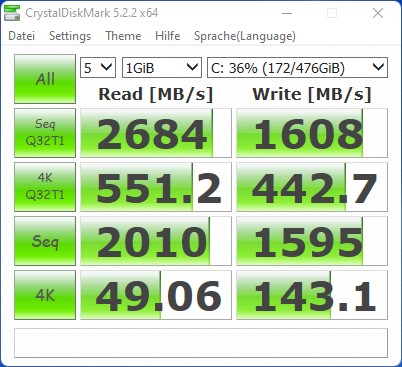
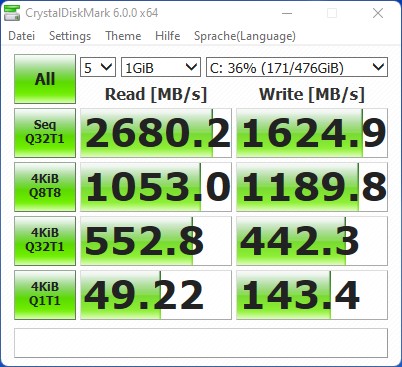
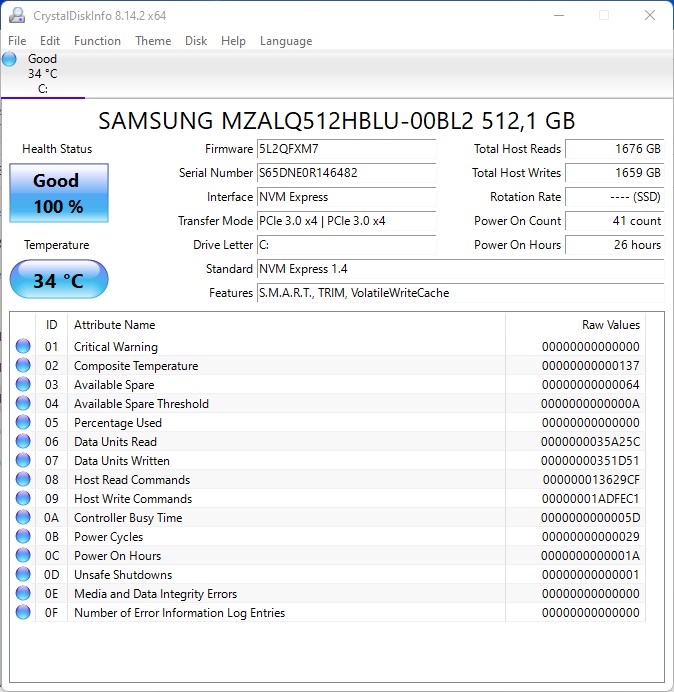
Depolama
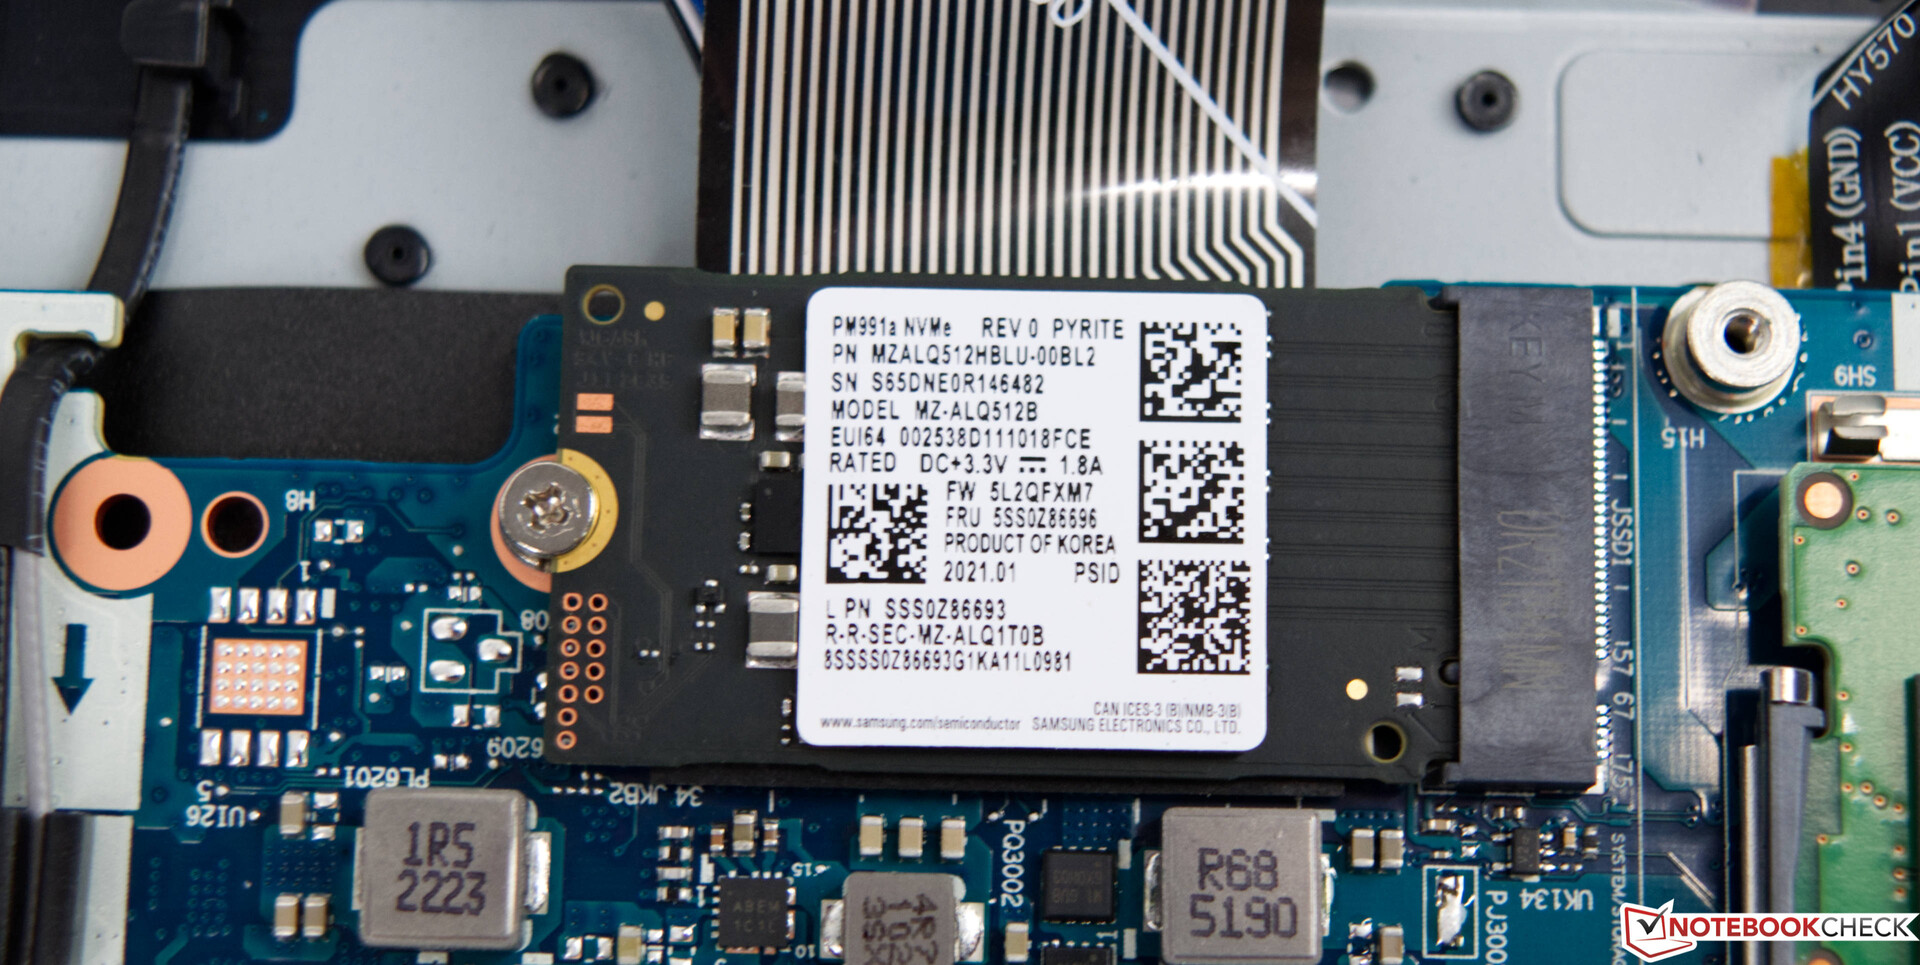
Legion 5 17 için Lenovo, hızlı bir Samsung SSD'ye güveniyor. Bu durumda 512 GB kapasiteye sahiptir ve veri aktarımları için hızlı M.2 PCIe arayüzünü kullanır. Ancak sonuçlarımızın gösterdiği gibi, bu kurulum rekabete tam olarak ayak uyduramıyor. 512 GB'de kapasite de tam olarak büyük değil. Bir oyun dizüstü bilgisayarında en az 1 TB depolama alanı bekliyoruz.
Karşılaştırma tablomuzda aha fazla karşılaştırma ve kıyaslama bulunabilir.

| Drive Performance rating - Percent | |
| Sınıf ortalaması Gaming | |
| Schenker XMG Apex 17 M21 | |
| Schenker XMG Core 17 (Early 2021) | |
| Asus TUF Gaming F17 FX706HM | |
| Gigabyte A7 X1 | |
| Lenovo Legion 5 17ACH6H-82JY0003GE | |
| Ortalama Samsung PM991a MZALQ512HBLU | |
| MSI Katana GF76 11UE | |
* ... daha küçük daha iyidir
Sürekli yük okuması: DiskSpd Okuma Döngüsü, Sıra uzunluğu 8
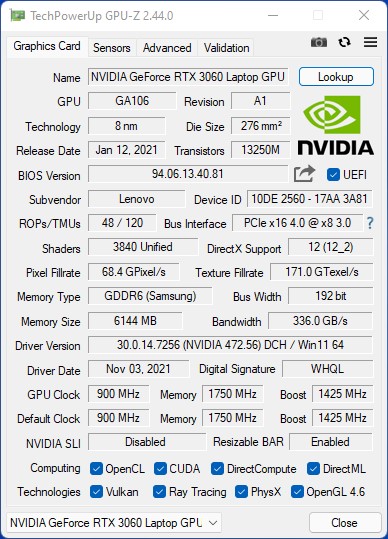
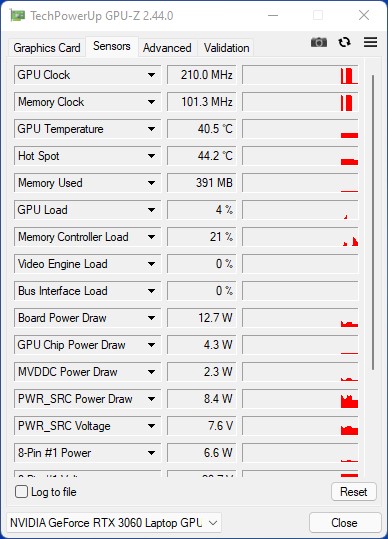
Ekran Kartı Performansı
Test cihazımız için Nvidia GeForce RTX 3060 mobile GPU mobil ekran kartı , grafik kartı görevi görmektedir. 80 ila 130 watt'lık yapılandırılabilir güç sınırı nedeniyle, farklı modellerin performansı büyük ölçüde değişebilir. Burada Nvidia GeForce RTX 3060 mobil ekran kartı, Lenovo Vantage aracı aracılığıyla performans moduna ayarlandığında 130 watt'a kadar tüketebilir. Sonuç olarak, sentetik kıyaslamalarda mükemmel sonuçlar elde eder. Lenovo Legion 5 17, çok daha güçlü Schenker XMG Apex 17 M21 ile karşılaştırıldığında yalnızca birkaç puan geride.
Ekran Kartı karşılaştırma tablomuzdaMobile Graphics Cards - Benchmark List. daha fazla karşılaştırma ve kıyaslama bulunabilir.
| 3DMark Performance rating - Percent | |
| Sınıf ortalaması Gaming | |
| Gigabyte A7 X1 | |
| Schenker XMG Apex 17 M21 | |
| Lenovo Legion 5 17ACH6H-82JY0003GE | |
| Asus TUF Gaming F17 FX706HM | |
| MSI Katana GF76 11UE | |
| Ortalama NVIDIA GeForce RTX 3060 Laptop GPU | |
| Schenker XMG Core 17 (Early 2021) | |
| 3DMark | |
| 1280x720 Cloud Gate Standard Graphics | |
| Sınıf ortalaması Gaming (86886 - 223650, n=61, son 2 yıl) | |
| Gigabyte A7 X1 | |
| Lenovo Legion 5 17ACH6H-82JY0003GE | |
| MSI Katana GF76 11UE | |
| Asus TUF Gaming F17 FX706HM | |
| Schenker XMG Core 17 (Early 2021) | |
| Schenker XMG Apex 17 M21 | |
| Ortalama NVIDIA GeForce RTX 3060 Laptop GPU (33126 - 136826, n=38) | |
| 1920x1080 Fire Strike Graphics | |
| Sınıf ortalaması Gaming (12242 - 62849, n=118, son 2 yıl) | |
| Schenker XMG Apex 17 M21 | |
| Gigabyte A7 X1 | |
| Lenovo Legion 5 17ACH6H-82JY0003GE | |
| Ortalama NVIDIA GeForce RTX 3060 Laptop GPU (16354 - 23109, n=49) | |
| Schenker XMG Core 17 (Early 2021) | |
| Asus TUF Gaming F17 FX706HM | |
| MSI Katana GF76 11UE | |
| 2560x1440 Time Spy Graphics | |
| Sınıf ortalaması Gaming (5012 - 26212, n=117, son 2 yıl) | |
| Schenker XMG Apex 17 M21 | |
| Gigabyte A7 X1 | |
| Lenovo Legion 5 17ACH6H-82JY0003GE | |
| Ortalama NVIDIA GeForce RTX 3060 Laptop GPU (6285 - 9235, n=49) | |
| Schenker XMG Core 17 (Early 2021) | |
| Asus TUF Gaming F17 FX706HM | |
| MSI Katana GF76 11UE | |
| 3DMark Ice Storm Standard Score | 201496 puan | |
| 3DMark Cloud Gate Standard Score | 44638 puan | |
| 3DMark Fire Strike Score | 19801 puan | |
| 3DMark Fire Strike Extreme Score | 10073 puan | |
| 3DMark Time Spy Score | 8579 puan | |
Yardım | ||
Oyun Performansı
Oyun performansı açısından, karşılaştırmamızda Lenovo 5 17 çoğu cihazın gerisinde kalıyor. Intel SoC'lere dayalı rakipler, oyunlarda daha iyi sonuçlara ulaşıyor gibi görünüyor. Ne olursa olsun, test cihazımızın mutlak performansını küçümsemek istemiyoruz. Kare hızları yüksektir ve Far Cry 6 gibi güncel oyunlar bile doğal ekran çözünürlüğünde ve maksimum ayrıntılarla sorunsuz çalışır.
| The Witcher 3 | |
| 1920x1080 High Graphics & Postprocessing (Nvidia HairWorks Off) | |
| Sınıf ortalaması Gaming (181 - 341, n=3, son 2 yıl) | |
| Schenker XMG Apex 17 M21 | |
| Ortalama NVIDIA GeForce RTX 3060 Laptop GPU (81 - 186.8, n=41) | |
| Schenker XMG Core 17 (Early 2021) | |
| Asus TUF Gaming F17 FX706HM | |
| MSI Katana GF76 11UE | |
| Lenovo Legion 5 17ACH6H-82JY0003GE | |
| 1920x1080 Ultra Graphics & Postprocessing (HBAO+) | |
| Sınıf ortalaması Gaming (95 - 240, n=8, son 2 yıl) | |
| Schenker XMG Apex 17 M21 | |
| Gigabyte A7 X1 | |
| Lenovo Legion 5 17ACH6H-82JY0003GE | |
| Schenker XMG Core 17 (Early 2021) | |
| Ortalama NVIDIA GeForce RTX 3060 Laptop GPU (58.2 - 91.5, n=48) | |
| Asus TUF Gaming F17 FX706HM | |
| MSI Katana GF76 11UE | |
Ultra ayarlarda The Witcher 3 stres testimiz sırasında performans tutarlı kalır . Bu nedenle, uzun süreli oyun oturumlarından sonra bile kare hızlarının oynanamaz seviyelere düşmesini beklemiyoruz.
Witcher 3 FPS Chart
| düşük | orta | yüksek | ultra | |
|---|---|---|---|---|
| GTA V (2015) | 172 | 167 | 149 | 78.6 |
| The Witcher 3 (2015) | 281 | 221 | 125 | 81.4 |
| Dota 2 Reborn (2015) | 138.8 | 127.8 | 119.3 | 117.6 |
| Final Fantasy XV Benchmark (2018) | 157 | 113 | 85.2 | |
| X-Plane 11.11 (2018) | 95 | 86.3 | 71.3 | |
| Far Cry 5 (2018) | 125 | 111 | 106 | 99 |
| Strange Brigade (2018) | 353 | 225 | 180 | 155 |
| Far Cry New Dawn (2019) | 107 | 96 | 94 | 86 |
| Metro Exodus (2019) | 151 | 104 | 79.8 | 62.3 |
| Borderlands 3 (2019) | 116 | 102 | 90.3 | 74.3 |
| F1 2020 (2020) | 239 | 204 | 193 | 142 |
| F1 2021 (2021) | 257 | 233 | 198 | 107 |
| Far Cry 6 (2021) | 102 | 90.8 | 81.2 | 59.8 |
Emisyonlar
Sistem Gürültüsü
Oyun dizüstü bilgisayarları için soğutma çözümünün gürültü seviyesi genellikle büyük bir sorundur. Yüksek performans özelliklerine genellikle gürültülü bir sistem eşlik eder. Lenovo Legioin 5 17 iyi bir denge kuruyor. Üç ısı borusu ve iki fandan oluşan soğutma çözümü, çoğu durumda etkili ve nispeten sessizdir. Rölantideyken, cihaz genellikle tamamen sessizdir. 37,5 dB(A) ile Lenovo Legion 5 17, daha sessiz oyun dizüstü bilgisayarlarından biridir. En kötü ihtimalle, stres testimiz sırasında 51 dB(A)'ya kadar ölçtük.
Ses yüksekliği
| Boşta |
| 25 / 25 / 30.5 dB |
| Çalışırken |
| 37.5 / 51 dB |
 | ||
30 dB sessiz 40 dB(A) duyulabilirlik 50 dB(A) gürültülü |
||
min: | ||
| Lenovo Legion 5 17ACH6H-82JY0003GE GeForce RTX 3060 Laptop GPU, R5 5600H, Samsung PM991a MZALQ512HBLU | Schenker XMG Core 17 (Early 2021) GeForce RTX 3060 Laptop GPU, i7-10870H, Samsung SSD 970 EVO Plus 1TB | Asus TUF Gaming F17 FX706HM GeForce RTX 3060 Laptop GPU, i9-11900H, SK Hynix HFM001TD3JX013N | MSI Katana GF76 11UE GeForce RTX 3060 Laptop GPU, i7-11800H, Kingston OM8PCP3512F-AB | Schenker XMG Apex 17 M21 GeForce RTX 3070 Laptop GPU, R7 5800H, Samsung SSD 970 EVO Plus 1TB | Gigabyte A7 X1 GeForce RTX 3070 Laptop GPU, R9 5900HX, ESR512GTLCG-EAC-4 | |
|---|---|---|---|---|---|---|
| Noise | -19% | -10% | -23% | -14% | -16% | |
| kapalı / ortam * (dB) | 25 | 25 -0% | 25 -0% | 25 -0% | 25 -0% | 24 4% |
| Idle Minimum * (dB) | 25 | 30 -20% | 26 -4% | 33 -32% | 25 -0% | 25 -0% |
| Idle Average * (dB) | 25 | 32 -28% | 31 -24% | 34 -36% | 28 -12% | 29 -16% |
| Idle Maximum * (dB) | 30.5 | 36 -18% | 33 -8% | 35 -15% | 31 -2% | 35 -15% |
| Load Average * (dB) | 37.5 | 53 -41% | 48 -28% | 53 -41% | 57 -52% | 58 -55% |
| Load Maximum * (dB) | 51 | 54 -6% | 49 4% | 57 -12% | 59 -16% | 59 -16% |
| Witcher 3 ultra * (dB) | 51 | 47 | 49 | 57 | 57 |
* ... daha küçük daha iyidir
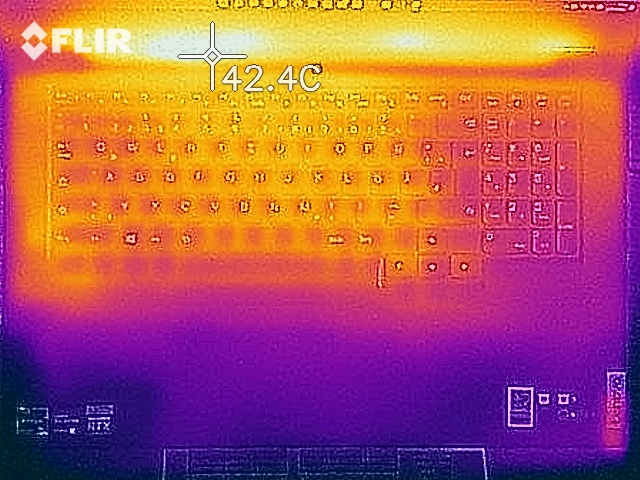
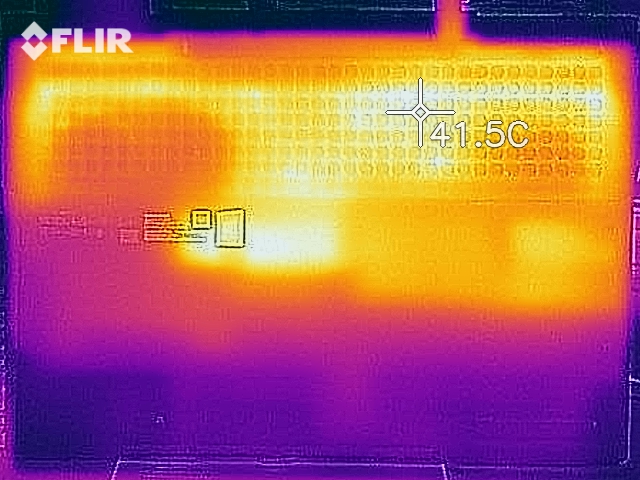
Sıcaklıklar
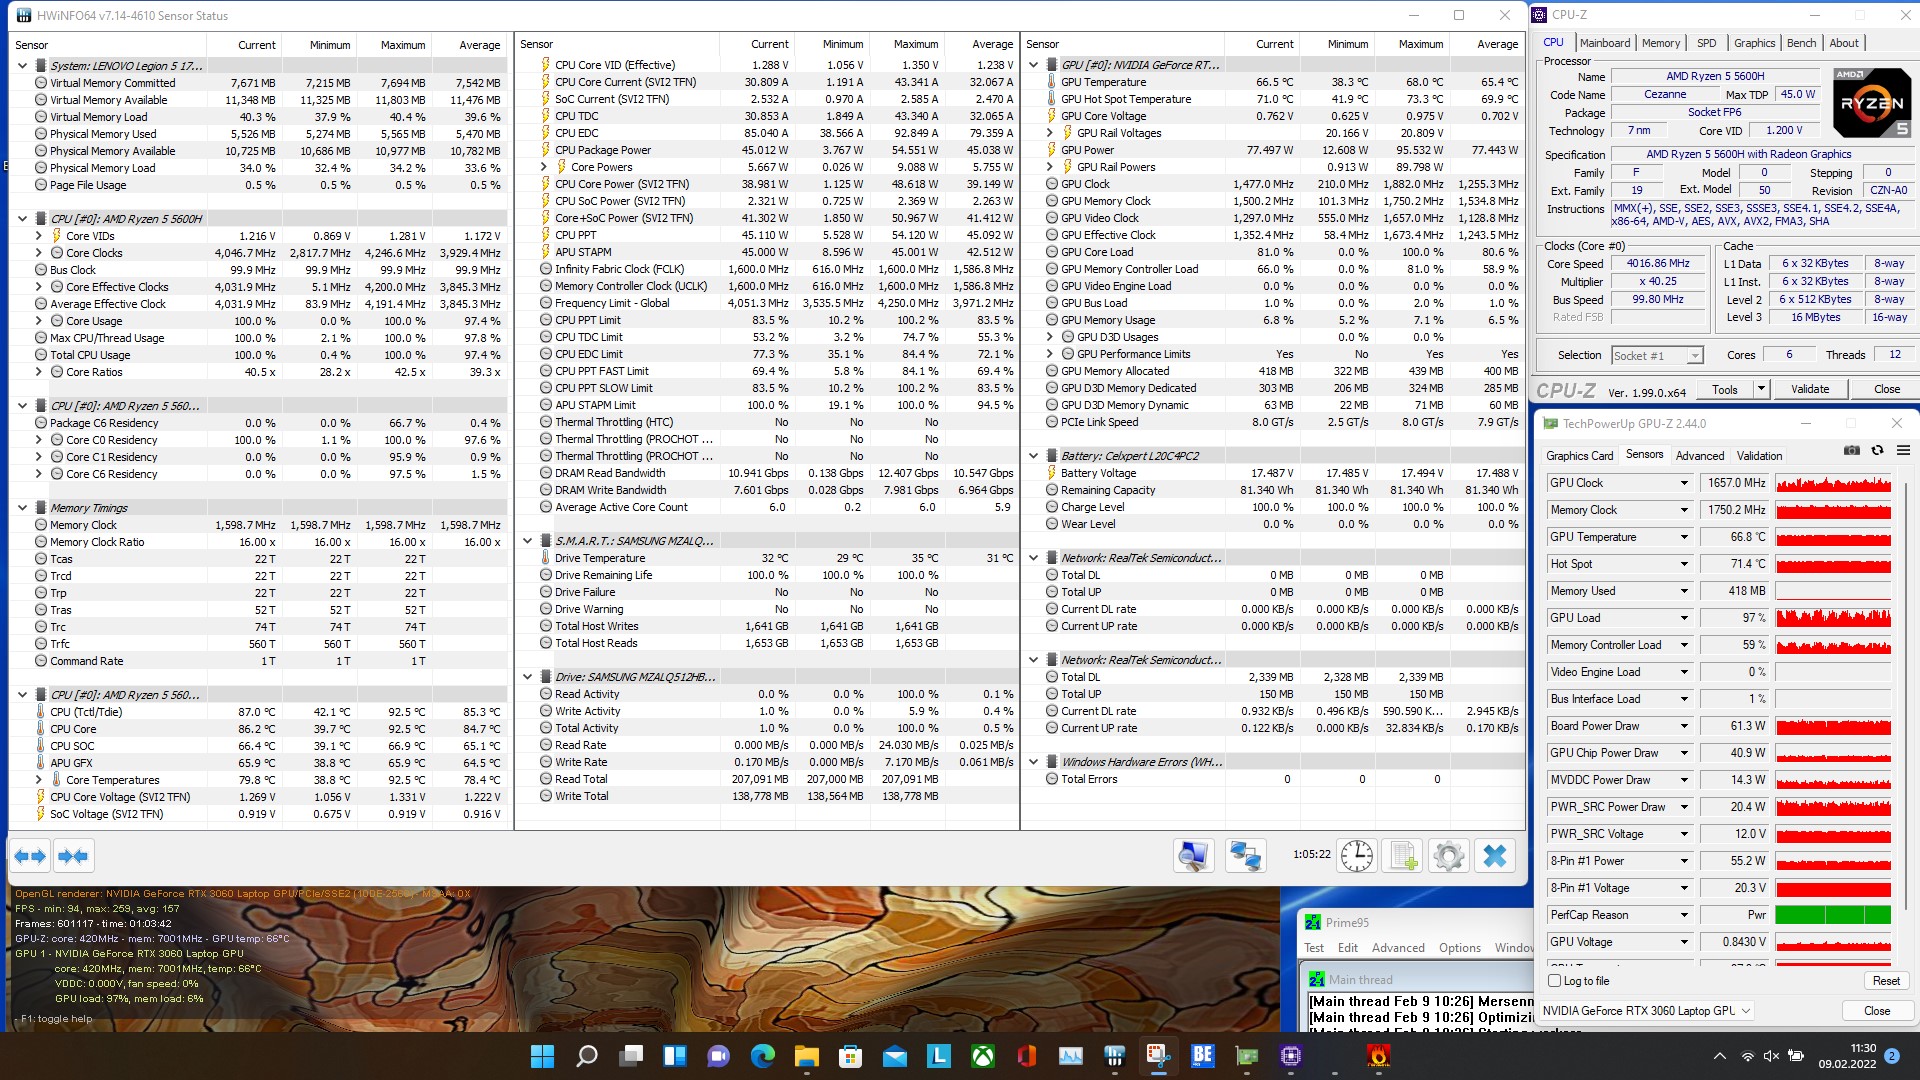
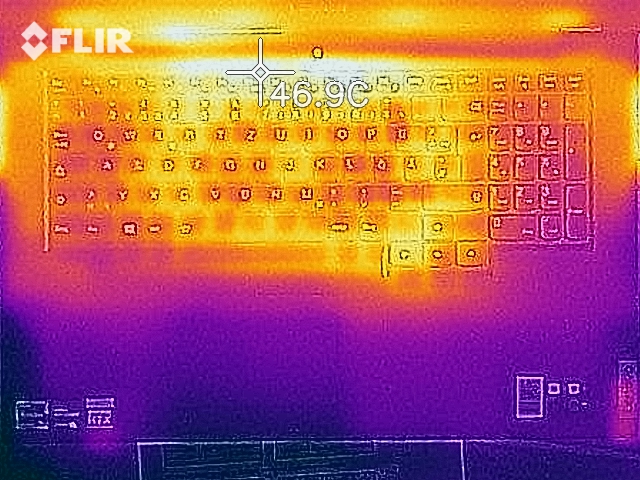
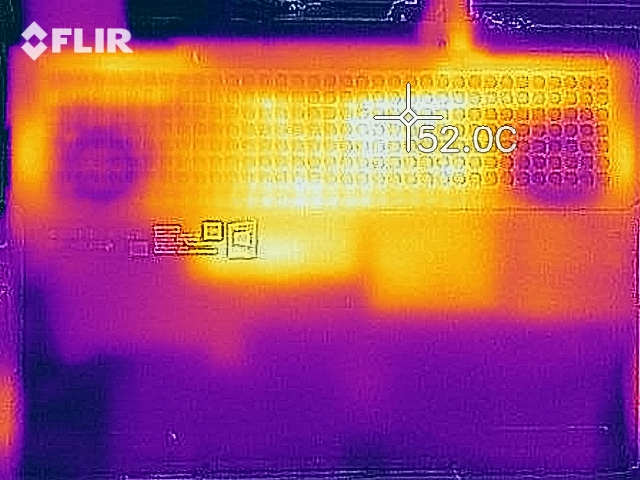
Lenovo Legion 5 17, genel olarak ısı gelişimini çok iyi idare ediyor. Maksimum 51 °C (123.8 °F) sıcaklık ile yüzey sıcaklıkları da sorun teşkil etmez. Bu kategoride çok daha kötülerini gördük. Hava akışını olumsuz etkileyebileceğinden, cihazı yine de bacaklarınız üzerinde kullanmamanızı tavsiye ederiz. SoC ve ekran kartı, stres testimiz sırasında sırasıyla 92.5 °C (198.5 °F) ve 73,3 °C (163.94 °F) değerine ulaşır. Bu değerlerin tümü kritik değildir; bu, yükleme senaryolarımız sırasında Lenovo Legion 5 17'nin neden kısmak zorunda olmadığını açıklar (örn: Cinebench R15 çoklu döngü ve The Witcher 3 ).
(±) Üst taraftaki maksimum sıcaklık, 40.4 °C / 105 F ortalamasına kıyasla 42.2 °C / 108 F'dir. , Gaming sınıfı için 21.2 ile 68.8 °C arasında değişir.
(-) Alt kısım, 43.2 °C / 110 F ortalamasına kıyasla maksimum 50.9 °C / 124 F'ye kadar ısınır
(+) Boşta kullanımda, üst tarafın ortalama sıcaklığı 29.1 °C / 84 F olup, cihazın 33.9 °C / 93 F.
(+) Avuç içi dayanakları ve dokunmatik yüzey, maksimum 25.6 °C / 78.1 F ile cilt sıcaklığından daha soğuktur ve bu nedenle dokunulduğunda soğuktur.
(+) Benzer cihazların avuç içi dayanağı alanının ortalama sıcaklığı 28.8 °C / 83.8 F (+3.2 °C / 5.7 F) idi.
| Lenovo Legion 5 17ACH6H-82JY0003GE AMD Ryzen 5 5600H, NVIDIA GeForce RTX 3060 Laptop GPU | Schenker XMG Core 17 (Early 2021) Intel Core i7-10870H, NVIDIA GeForce RTX 3060 Laptop GPU | Asus TUF Gaming F17 FX706HM Intel Core i9-11900H, NVIDIA GeForce RTX 3060 Laptop GPU | MSI Katana GF76 11UE Intel Core i7-11800H, NVIDIA GeForce RTX 3060 Laptop GPU | Schenker XMG Apex 17 M21 AMD Ryzen 7 5800H, NVIDIA GeForce RTX 3070 Laptop GPU | Gigabyte A7 X1 AMD Ryzen 9 5900HX, NVIDIA GeForce RTX 3070 Laptop GPU | |
|---|---|---|---|---|---|---|
| Heat | -1% | -22% | -2% | 6% | 7% | |
| Maximum Upper Side * (°C) | 42.2 | 44 -4% | 58.5 -39% | 51 -21% | 45 -7% | 44 -4% |
| Maximum Bottom * (°C) | 50.9 | 50 2% | 58.5 -15% | 52 -2% | 49 4% | 49 4% |
| Idle Upper Side * (°C) | 34.3 | 30 13% | 38 -11% | 32 7% | 27 21% | 27 21% |
| Idle Bottom * (°C) | 32 | 36 -13% | 39 -22% | 29 9% | 30 6% | 30 6% |
* ... daha küçük daha iyidir
Hoparlörler
Sistem iki stereo hoparlör ile birlikte gelir. Ses genel olarak dengelidir ve tam bir bas eksikliği yoktur. Ne yazık ki Lenovo, Legion 5 17'yi özel bir subwoofer ile donatmamaya karar verdi. İdeal bir ses deneyimi için bir kulaklık öneririz. Uygun modeller 3,5 mm ses jakı veya USB üzerinden bağlanabilir.
Lenovo Legion 5 17ACH6H-82JY0003GE ses analizi
(±) | hoparlör ses yüksekliği ortalama ama iyi (78.3 dB)
Bas 100 - 315Hz
(-) | neredeyse hiç bas yok - ortalama olarak medyandan 19.1% daha düşük
(±) | Bas doğrusallığı ortalamadır (13.8% delta - önceki frekans)
Ortalar 400 - 2000 Hz
(+) | dengeli ortalar - medyandan yalnızca 3% uzakta
(+) | orta frekanslar doğrusaldır (5% deltadan önceki frekansa)
Yüksekler 2 - 16 kHz
(+) | dengeli yüksekler - medyandan yalnızca 4.8% uzakta
(+) | yüksekler doğrusaldır (6.7% deltadan önceki frekansa)
Toplam 100 - 16.000 Hz
(±) | Genel sesin doğrusallığı ortalamadır (15.8% ortancaya göre fark)
Aynı sınıfla karşılaştırıldığında
» Bu sınıftaki tüm test edilen cihazların %37%'si daha iyi, 7% benzer, 56% daha kötüydü
» En iyisinin deltası 6% idi, ortalama 18% idi, en kötüsü 132% idi
Test edilen tüm cihazlarla karşılaştırıldığında
» Test edilen tüm cihazların %24'si daha iyi, 5 benzer, % 71 daha kötüydü
» En iyisinin deltası 4% idi, ortalama 24% idi, en kötüsü 134% idi
Gigabyte A7 X1 ses analizi
(+) | hoparlörler nispeten yüksek sesle çalabilir (85 dB)
Bas 100 - 315Hz
(-) | neredeyse hiç bas yok - ortalama olarak medyandan 30.3% daha düşük
(±) | Bas doğrusallığı ortalamadır (13.4% delta - önceki frekans)
Ortalar 400 - 2000 Hz
(±) | daha yüksek ortalar - ortalama olarak medyandan 6.8% daha yüksek
(±) | Ortaların doğrusallığı ortalamadır (11.3% delta - önceki frekans)
Yüksekler 2 - 16 kHz
(+) | dengeli yüksekler - medyandan yalnızca 4.4% uzakta
(+) | yüksekler doğrusaldır (5.4% deltadan önceki frekansa)
Toplam 100 - 16.000 Hz
(±) | Genel sesin doğrusallığı ortalamadır (23.5% ortancaya göre fark)
Aynı sınıfla karşılaştırıldığında
» Bu sınıftaki tüm test edilen cihazların %85%'si daha iyi, 5% benzer, 10% daha kötüydü
» En iyisinin deltası 6% idi, ortalama 18% idi, en kötüsü 132% idi
Test edilen tüm cihazlarla karşılaştırıldığında
» Test edilen tüm cihazların %70'si daha iyi, 6 benzer, % 24 daha kötüydü
» En iyisinin deltası 4% idi, ortalama 24% idi, en kötüsü 134% idi
Enerji yönetimi
Enerji tüketimi
Lenovo Legion 5 17'nin boştayken güç tüketimi önemli ölçüde daha iyi olabilirdi. Bu, sıralamamızda önemli puanlara mal oluyor. Bu kategori için iyi bir örnek Asus TUF Gaming F17'dir . Buna karşılık, Legion 5 17, yük altında ve oyun oynarken hoş bir şekilde ekonomiktir. Maksimum tüketimi 170 watt ölçtük. Bu, 300 watt'lık AC adaptörünün neredeyse aşırı görünmesini sağlar.
| Kapalı / Bekleme modu | |
| Boşta | |
| Çalışırken |
|
Key:
min: | |
| Lenovo Legion 5 17ACH6H-82JY0003GE R5 5600H, GeForce RTX 3060 Laptop GPU, Samsung PM991a MZALQ512HBLU, IPS, 1920x1080, 17.3" | Schenker XMG Core 17 (Early 2021) i7-10870H, GeForce RTX 3060 Laptop GPU, Samsung SSD 970 EVO Plus 1TB, IPS, 2560x1440, 17.3" | Asus TUF Gaming F17 FX706HM i9-11900H, GeForce RTX 3060 Laptop GPU, SK Hynix HFM001TD3JX013N, IPS, 1920x1080, 17.3" | MSI Katana GF76 11UE i7-11800H, GeForce RTX 3060 Laptop GPU, Kingston OM8PCP3512F-AB, IPS, 1920x1080, 17.3" | Schenker XMG Apex 17 M21 R7 5800H, GeForce RTX 3070 Laptop GPU, Samsung SSD 970 EVO Plus 1TB, IPS, 1920x1080, 17.3" | Gigabyte A7 X1 R9 5900HX, GeForce RTX 3070 Laptop GPU, ESR512GTLCG-EAC-4, IPS, 1920x1080, 17.3" | Ortalama NVIDIA GeForce RTX 3060 Laptop GPU | Sınıf ortalaması Gaming | |
|---|---|---|---|---|---|---|---|---|
| Power Consumption | -3% | 19% | 16% | 2% | -1% | 13% | -2% | |
| Idle Minimum * (Watt) | 15.6 | 13 17% | 10.3 34% | 9 42% | 10 36% | 12 23% | 10.4 ? 33% | 13.2 ? 15% |
| Idle Average * (Watt) | 20.7 | 16 23% | 13.1 37% | 13 37% | 14 32% | 14 32% | 14.5 ? 30% | 18.9 ? 9% |
| Idle Maximum * (Watt) | 22.9 | 29 -27% | 14.1 38% | 20 13% | 20 13% | 19 17% | 21.4 ? 7% | 24.3 ? -6% |
| Load Average * (Watt) | 134 | 100 25% | 110 18% | 102 24% | 112 16% | 118 12% | 109.3 ? 18% | 108.3 ? 19% |
| Witcher 3 ultra * (Watt) | 135 | 173 -28% | 138 -2% | 149 -10% | 202 -50% | 205 -52% | ||
| Load Maximum * (Watt) | 170 | 213 -25% | 190 -12% | 187 -10% | 231 -36% | 229 -35% | 206 ? -21% | 254 ? -49% |
* ... daha küçük daha iyidir
Witcher 3 enerji tüketimi / Stress test
Harici bir monitörle enerji tüketimi
Pil ömrü
80 Wh sabit pili ile Lenovo Legion 5 17, Wi-Fi testimizde yalnızca 4,5 saat dayanır. Bununla birlikte, birkaç rakip de bu durumda çok daha iyisini yapmıyor. Burada yalnızca Asus TUF Gaming F17, önemli ölçüde daha uzun pil ömrüyle kendini farklılaştırabilir. Lenovo Legion 5 17, karşılaştırmamızdaki en büyük ikinci pil ile donatıldığından, yine de daha fazlasını bekliyorduk. En azından pil ömrü, tam olarak şarj edildiğinde bir film gecesi için yeterlidir.
Pil modunda işlemci ve ekran kartı performansının biraz kısıldığına dikkat edilmelidir. Ancak bu, neredeyse tüm mevcut oyun dizüstü bilgisayarları için geçerlidir.

| Lenovo Legion 5 17ACH6H-82JY0003GE R5 5600H, GeForce RTX 3060 Laptop GPU, 80 Wh | Schenker XMG Core 17 (Early 2021) i7-10870H, GeForce RTX 3060 Laptop GPU, 62 Wh | Asus TUF Gaming F17 FX706HM i9-11900H, GeForce RTX 3060 Laptop GPU, 90 Wh | MSI Katana GF76 11UE i7-11800H, GeForce RTX 3060 Laptop GPU, 53 Wh | Schenker XMG Apex 17 M21 R7 5800H, GeForce RTX 3070 Laptop GPU, 49 Wh | Gigabyte A7 X1 R9 5900HX, GeForce RTX 3070 Laptop GPU, 48.96 Wh | Sınıf ortalaması Gaming | |
|---|---|---|---|---|---|---|---|
| Pil Çalışma Süresi | 13% | 83% | -13% | -3% | -15% | 58% | |
| Reader / Idle (h) | 5.5 | 7.7 40% | 4.8 -13% | 7 27% | 8.71 ? 58% | ||
| H.264 (h) | 3.5 | 4.7 34% | 8.5 143% | 3.9 11% | 8.26 ? 136% | ||
| WiFi v1.3 (h) | 4.4 | 4.9 11% | 7.6 73% | 3.7 -16% | 4.9 11% | 4.7 7% | 7.04 ? 60% |
| Load (h) | 1.9 | 1.3 -32% | 2.5 32% | 1.3 -32% | 1 -47% | 1.2 -37% | 1.47 ? -23% |
| Witcher 3 ultra (h) | 0.8 |
Artılar
Eksiler
Son Görüş - Önemli Zayıf Yönleri Olmayan Sağlam Oyun Makinesi
Lenovo Legion 5 17, mevcut nesil 17 inçlik bir oyun dizüstü bilgisayarıdır ve en yeni AMD işlemci ve tam potansiyeline ulaşmayı başaran güçlü bir ekran kartı ile donatılmıştır. AMD Ryzen 5 5600H bu dizüstü bilgisayar için çok iyi bir seçim ve performans seviyesini uzun süre koruyabiliyor. Test modelimiz, genellikle sekiz çekirdek ve 16 iş parçacığı ile donatılmış rakipleriyle doğrudan karşılaştırmada yalnızca tutarlı bir şekilde geride kalıyor. Buna rağmen, Legion 5 17 mükemmel bir izlenim bırakıyor ve sınırsız Nvidia GeForce RTX 3060 mobil ekran kartı sayesinde sentetik kıyaslamalarda Nvidia GeForce RTX 3070 mobil ekran kartı'na neredeyse ayak uydurabiliyor.. Ayrıca fabrikada önceden kalibre edilmiş 17 inçlik ekrandan da memnun kaldık. Bu daha çok görmek istediğimiz bir şey. 144 Hz yenileme hızı, Lenovo'yu oyun için açıkça belirtir. Ancak, düşük deltaE-2000 değerleri sayesinde video veya fotoğraf düzenlemeye de çok uygundur.
Lenovo Legion 5 17, güncel bir AMD Ryzen işlemciye ve yapay sınırlamalar olmadan Nvidia GeForce ekran kartı’na sahip genel olarak sağlam bir oyun dizüstü bilgisayarıdır.
Genel olarak, Lenovo Legion 5 17, geniş bir bağlantı noktası seçimine sahip sağlam bir oyun dizüstü bilgisayarıdır. Ne yazık ki Thunderbolt eksik, ancak hızlı ekran kartı performansı bunu telafi edebilir. Gerçekten büyük bir zayıflık yok. Büyük pil kapasitesi nedeniyle daha fazla pil ömrü bekliyorduk. Dokunmatik yüzeyin boyutu ve konumu potansiyel olarak yeniden gözden geçirilmelidir. Bununla birlikte, çoğu kullanıcı çoğu durumda harici bir fare bağlayacağından, dokunmatik yüzey muhtemelen sonradan düşünüldüğünden biraz daha fazla olacaktır. Ayrıca, sistem yük altında yalnızca orta düzeyde gürültü üretir. Bu anlamda çok daha kötü sonuçlara alışığız. Depolama seçenekleri konusunda cimri davranmamanızı tavsiye ederiz. Bir oyun dizüstü bilgisayarı için en az 1 TB depolama alanı norm olmalıdır. Neyse ki, cihazda ikincil bir sürücü için bir yuva var.
Fiyat ve Stok Durumu
Yazma sırasında, dizüstü bilgisayar doğrudan Lenovo'nun çevrimiçi mağazasından yaklaşık 1500 USD yerine yaklaşık 1220 USD'ye satılıyor ve "premium" model olarak listeleniyor. Ancak, nakliyenin en az 2 ay süreceğini belirtmek gerekir.
Lenovo Legion 5 17ACH6H-82JY0003GE
- 02/21/2022 v7 (old)
Sebastian Bade
Price comparison

