SCHENKER Key 17 Pro (M24) incelemesi - ultra hızlı çift Thunderbolt 5 konnektörleri ve i9-14900HX gücü
Bogdan Solca, 👁 Bogdan Solca (Çeviren DeepL / Ninh Duy) Yayınlandı 🇺🇸 🇫🇷 ...
Karar
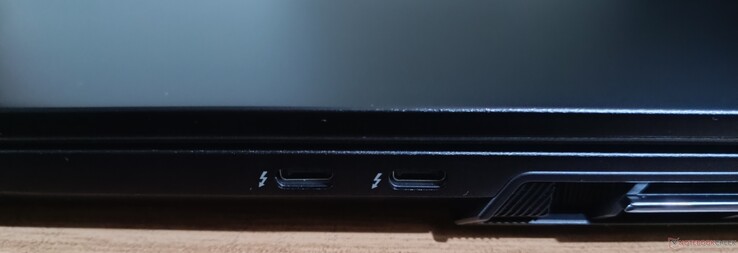
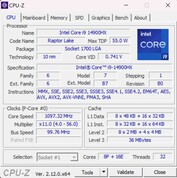
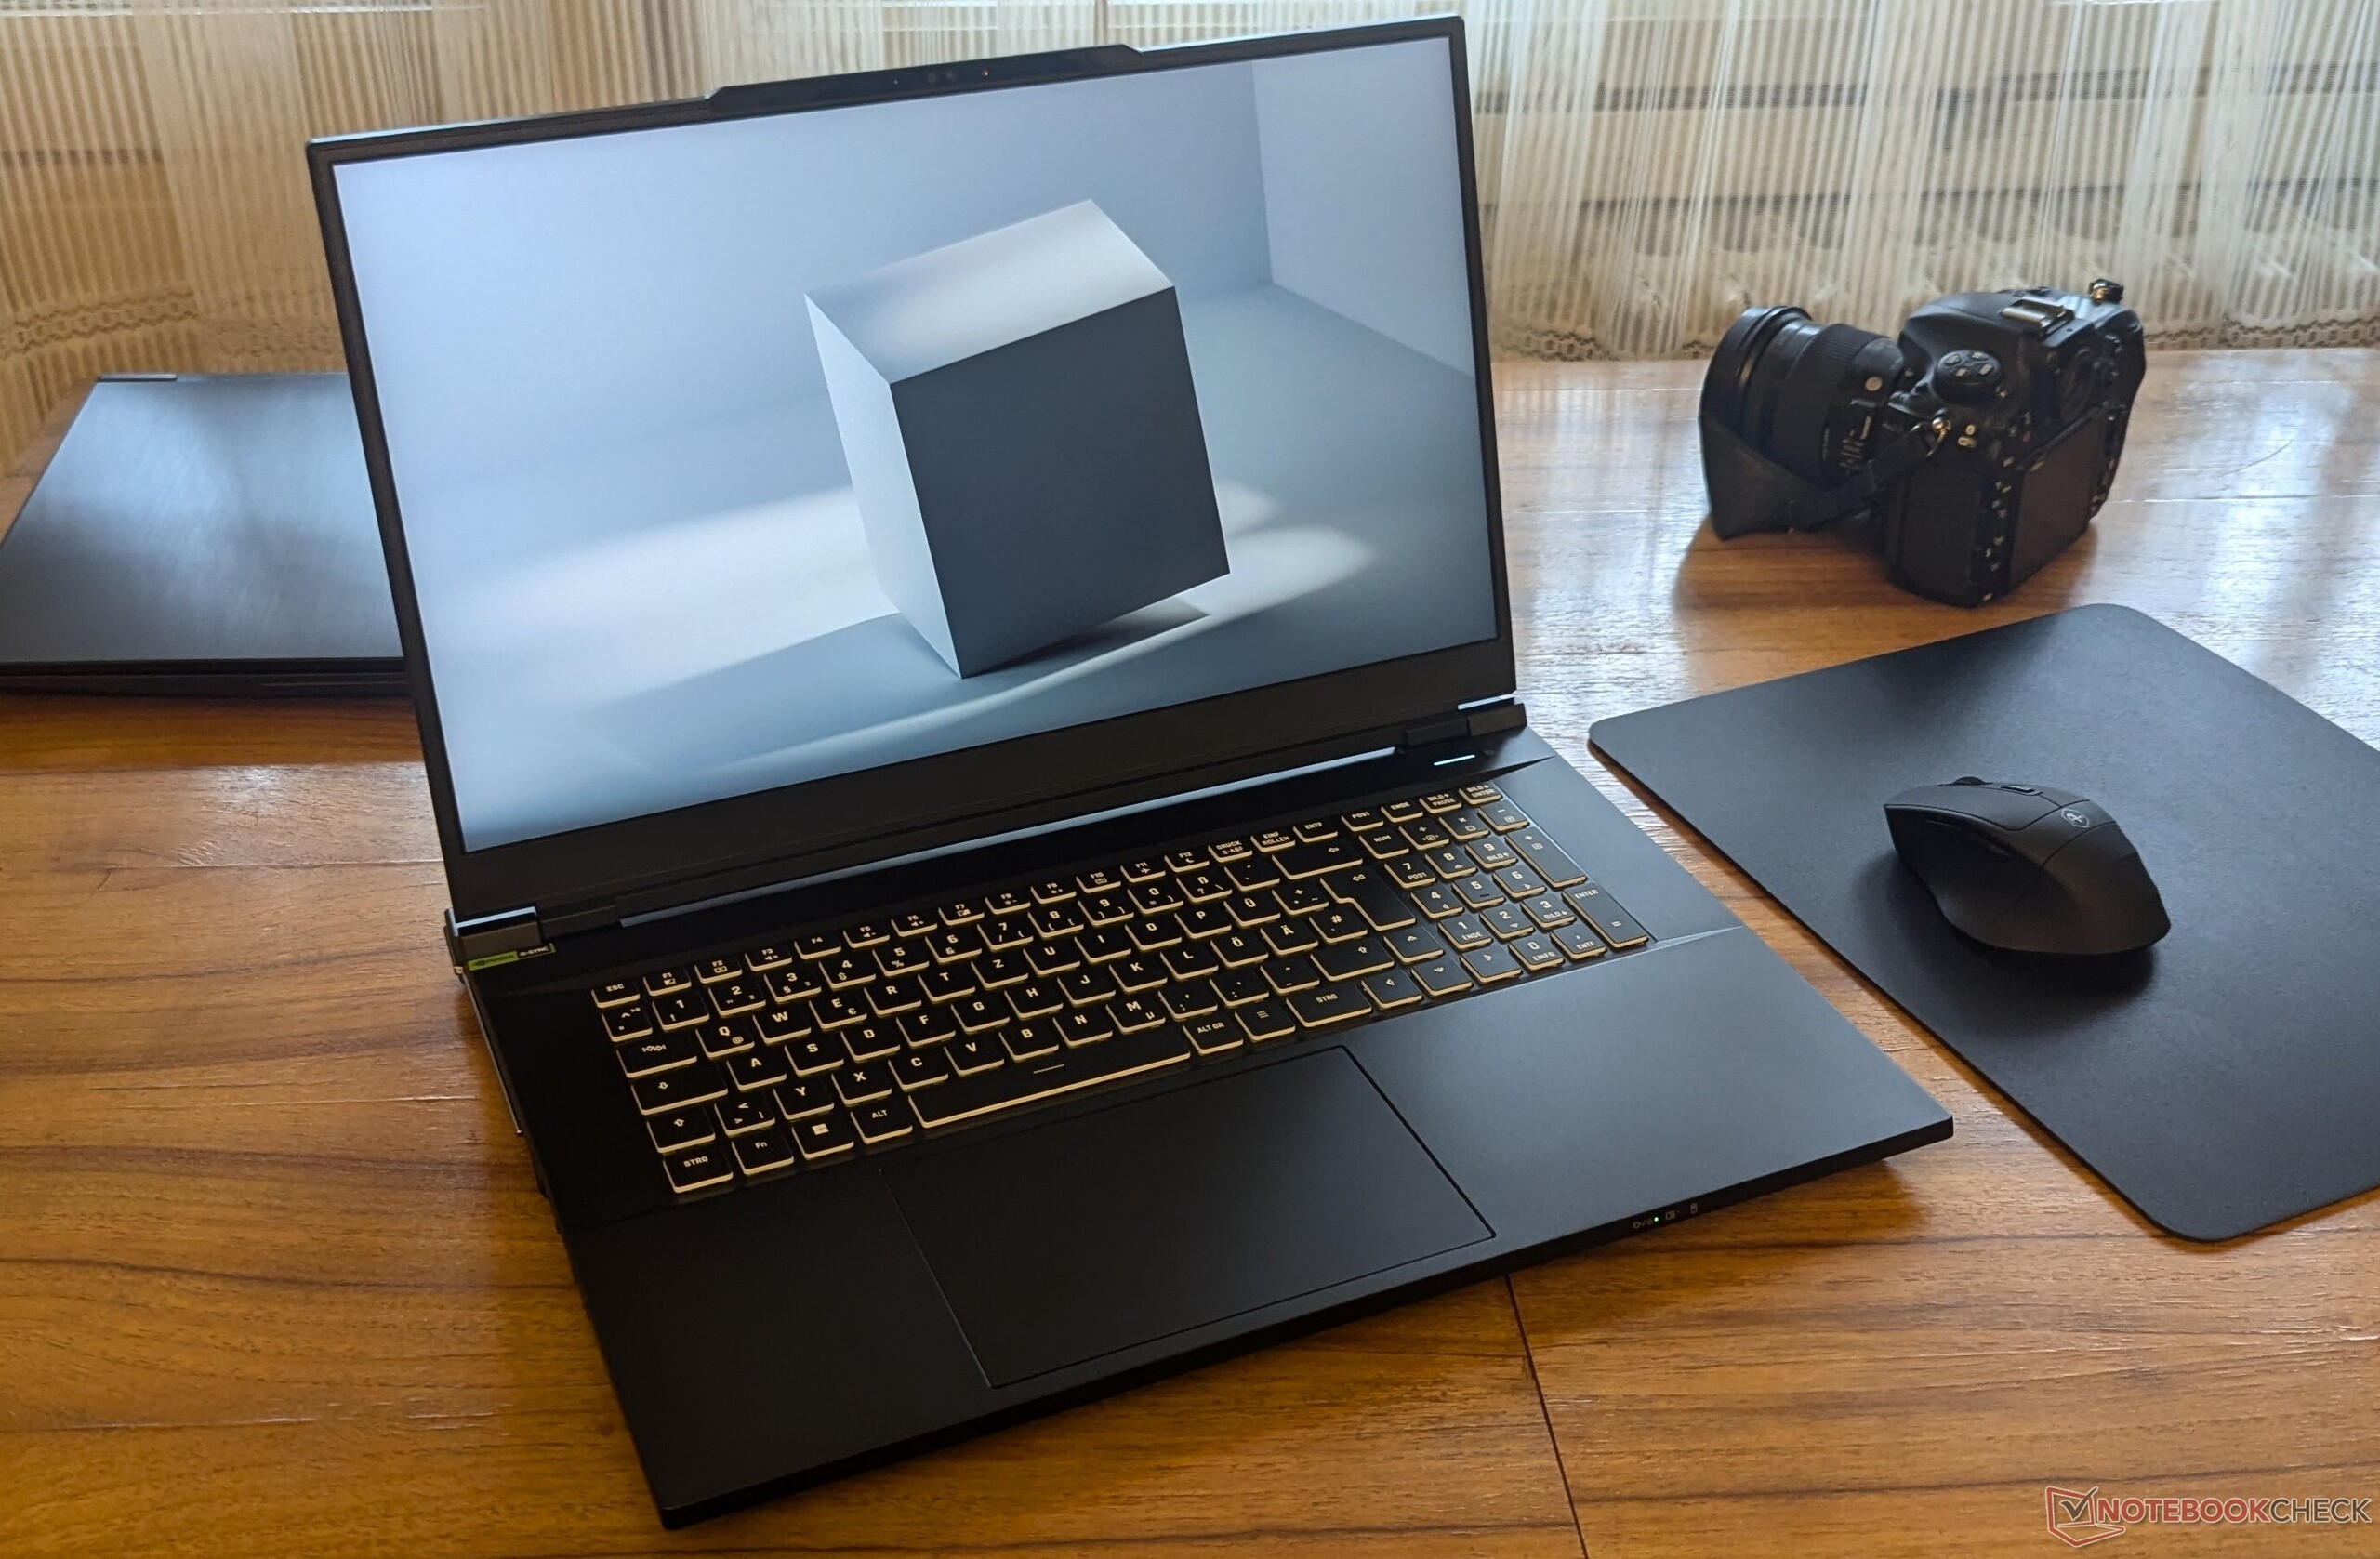
Schenker'in Key 17 Pro iş istasyonu sınıfı dizüstü bilgisayarları için 2024 güncellemesi, bir CPU yükseltmesi ve birkaç etkileyici eklemeyle birlikte geliyor. En son iş istasyonu yinelemesi, geçen yılki modelle aynı Clevo kasasını koruyor, ancak i9-13900HX daha hızlı i9-14900HXşu anda Intel'in en hızlı mobil çözümü olmaya devam ediyor. Schenker ayrıca şunları ekledi Wi-Fi 7 destek ve iki Thunderbolt 5 her biri 80 Gbps bant genişliğine sahip bağlantı noktaları ve bu özellikler profesyonellere kolayca eklenebilir.
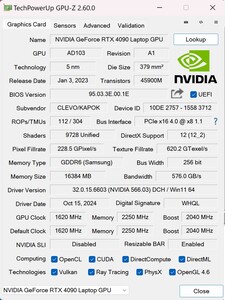
RAM ve depolama alanı önceki varyantla aynı olsa da, yine de mükemmel performans sağlıyorlar. Bu RTX 4090 mobil GPU her zaman harika bir eklentidir, ancak testlerimiz Schenker'in uygulamasının piyasadaki en iyi uygulama olmadığını ortaya koyuyor. Genel olarak, performans harika.
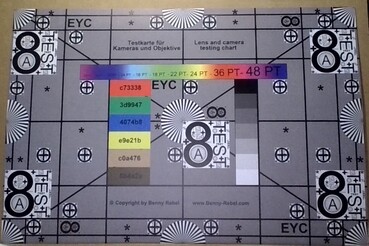
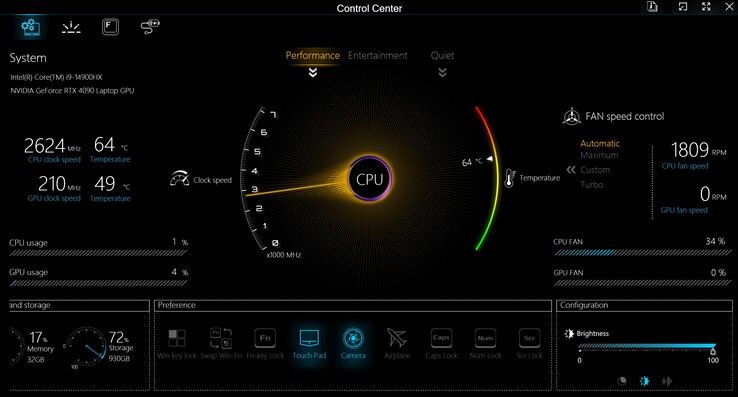
Eksiler tarafında Schenker, özellikle performans profilinde orta yükte bile hala gürültülü olan soğutma sistemini iyileştirmedi. Kontrol merkezi uygulaması özel fan eğrilerine izin veriyor, ancak bunun uygulama başına ayarlanması gerekiyor. Geçen yılki versiyona göre bir düşüş de, aynı 99 Wh kapasiteye sahip olmasına rağmen önemli ölçüde azalmış görünen pil çalışma süresi. Bu nedenle Key 17 Pro M24 masaüstü yerine ya da en fazla hibrit iş akışlarında kullanılabilir. 4K IPS ekran yeterince parlak, ancak kontrast ve siyah seviyesi bu fiyat noktası için düşük görünüyor, ayrıca birlikte verilen 1080p web kamerası oldukça vasat.
Artılar
Eksiler
Fiyat ve Bulunabilirlik
Test edilen konfigürasyon 4273 Euro karşılığında doğrudan Bestware'den sipariş edilebilir.
Karşılaştırılan olası alternatifler
Resim | Modeli / incelemeler | Geizhals | Ağırlık | Yükseklik | Ekran |
|---|---|---|---|---|---|
| Schenker Key 17 Pro (M24) Intel Core i9-14900HX ⎘ NVIDIA GeForce RTX 4090 Laptop GPU ⎘ 32 GB Bellek, 1024 GB SSD | Listenpreis 4273€ | 3.4 kg | 24.9 mm | 17.30" 3840x2160 255 PPI IPS | |
| Asus ROG Strix Scar 17 G733PYV-LL053X AMD Ryzen 9 7945HX3D ⎘ NVIDIA GeForce RTX 4090 Laptop GPU ⎘ 32 GB Bellek, 1024 GB SSD | Geizhals Suche | 2.9 kg | 28.3 mm | 17.30" 2560x1440 170 PPI IPS | |
| Eurocom Raptor X17 Core i9-14900HX Intel Core i9-14900HX ⎘ NVIDIA GeForce RTX 4090 Laptop GPU ⎘ 32 GB Bellek, 2048 GB SSD | Listenpreis 4500 USD | 3.4 kg | 24.9 mm | 17.30" 3840x2160 255 PPI IPS | |
| HP ZBook Fury 16 G11 Intel Core i9-14900HX ⎘ NVIDIA RTX 3500 Ada Generation Laptop ⎘ 64 GB Bellek, 1024 GB SSD | 2.6 kg | 28.5 mm | 16.00" 3840x2400 283 PPI IPS | ||
| Aorus 17X AZF Intel Core i9-13900HX ⎘ NVIDIA GeForce RTX 4090 Laptop GPU ⎘ 32 GB Bellek, 1024 GB SSD | Listenpreis 3800 EUR Geizhals Suche | 2.9 kg | 21.8 mm | 17.30" 2560x1440 170 PPI IPS |
Schenker Key 17 Pro'yu (M24) üst düzey bir iş istasyonu olarak tanıtıyor, bu nedenle testlerimiz bunu yansıtacak. Daha önce, şu konuları incelemiştik E23 versiyonu bir oyun dizüstü bilgisayarı olarak, ancak i9-14900HX CPU'ya yükseltme ile M24 varyantı artık bir iş istasyonu olarak önerilmektedir. Ancak, Key 17 Pro RTX 4090 GPU ile güçlendirildiğinden ve profesyonel bir GPU olmadığından, bunu yalnızca iş istasyonlarıyla karşılaştıramadık. Bu nedenle, seçilen rakipler arasında RTX 4090 ve benzer veya aynı CPU'lara sahip oyun dizüstü bilgisayarları yer alıyor.
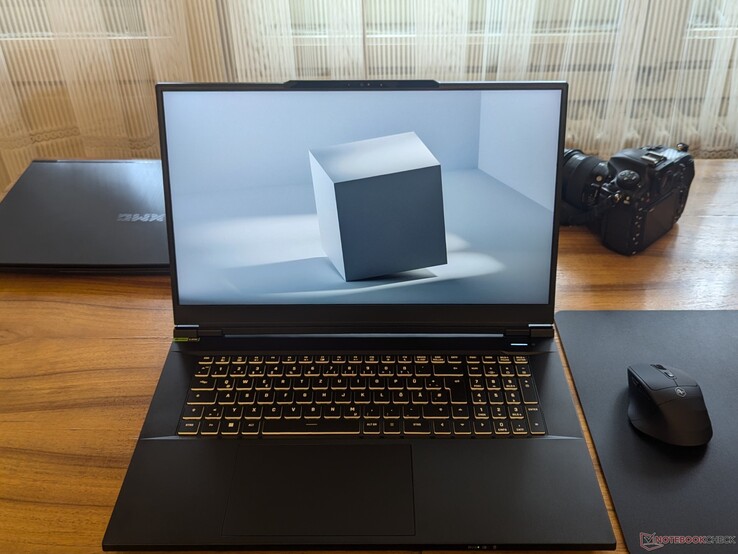
Kasa, aynı Clevo barebone ile önceki iterasyondan değişmemiş gibi görünüyor. Bununla birlikte, daha güçlü CPU'nun yanı sıra M24, Wi-Fi 7 ve iki Thunderbolt 5 konektörü gibi bazı önemli yükseltmeler sunuyor. Yükseltilmiş CPU ve yeni eklemelerle, M24 bataryası maalesef bir darbe alıyor ve E23 kadar uzun süre dayanmıyor.
Teknik Özellikler
Top 10
» Top 10 Multimedia Notebook listesi
» Top 10 oyun notebooku
» Top 10 bütçeye uygun Ofis/İş Notebook Listesi
» Top 10 Premium Ofis/İş notebookları
» Top 10 Çalışma istasyonu laptopları
» Top 10 Subnotebook listesi
» Top 10 Ultrabooklar
» En iyi 10 dönüştürülebilir modeli
» Seçimi en iyi 10 tablet
» Notebookcheck Top 10 Windows Tabletleri
» Top 10 Subnotebook listesi
» NotebookCheck tarafından incelenen en iyi Notebook ekranları
» Notebookcheck'in 500 Euro altındaki en iyi 10 Notebook listesi
» NotebookCheck tarafından seçilen 300 Euro altındaki en iyi 10 Notebook
» Notebookcheck'in 500 Euro altındaki en iyi 10 Notebook listesi
» Notebookcheck'in Top 10 akıllı telefon listesi
» Notebookcheck'in Top 10 hafif oyun notebookları
Kasa ve Bağlantı
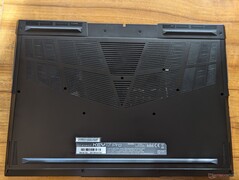
Sistem, performans karşılaştırması için dahil ettiğimiz Eurocom dizüstü bilgisayarla da kullanılan Clevo tarafından sağlanan bir barebone üzerine inşa edilmiştir. Kolayca çıkarılabilen arka plaka sayesinde RAM ve depolama alanı gerektiğinde yükseltilebilir.
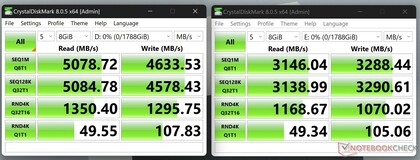
Bağlanabilirlik söz konusu olduğunda Key 17 Pro, geleceğe dönük sağlam bağlantı noktası seçimi ve güncel İnternet hızları ile etkileyicidir. Bu model, sağ tarafta her biri tam 80 Gbps bant genişliğine sahip iki Thunderbolt 5 konektörü sunan seçkin birkaç model arasında yer alıyor. Ne yazık ki, Nvidia RTX 4090 ve Intel'in iGPU'su DP 1.4 / HDMI 2.1 hızlarıyla sınırlı olduğu için 120 Gbps artırma seçeneği mevcut değil. Ayrıca, Barlow Ridge Thunderbolt 5 denetleyicisi her zaman PCIe 4.0 x4 hızlarıyla sınırlıdır, bu nedenle her iki bağlantı noktası aynı anda kullanıldığında bile toplam bant genişliği ~8 GB/s'yi geçemez. Bunu iki OWC Envoy Ultra harici SSD ile test ettik, bir birim her zaman diğerinden daha hızlı sonuçlandı ancak toplam bant genişliği en iyi ihtimalle 8 GB/s civarında kaldı. Görünüşe göre yeni Lunar Lake platformu bu sorunu çözmüyor.
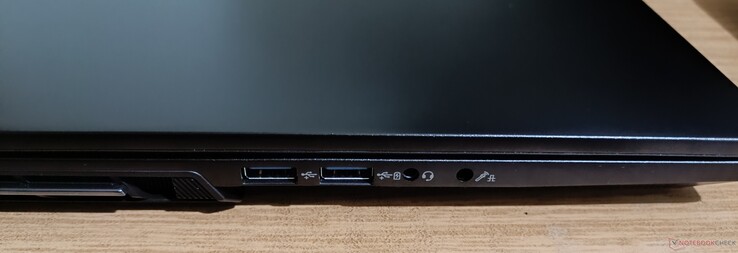
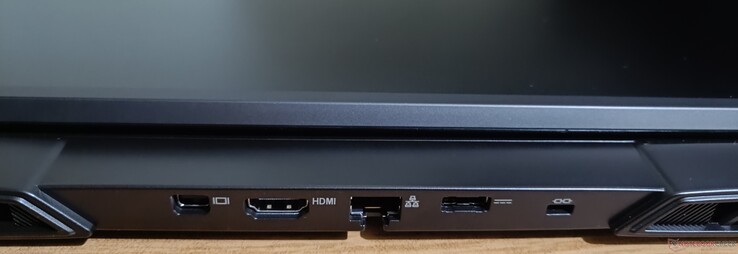
Yine de, çift 80 Gbps bant genişliği PCIe 5.0 harici SSD'lerle iyi bir şekilde kullanılabilir. Sol tarafta, iki USB-A 3.2 Gen 2 bağlantı noktası (yalnızca biri güç dağıtımlı), mikrofon girişi veya S / PDIF optik ve kulaklık çıkışı ses jakları vardır. Arka kısımda bir güç konektörü, LAN jakı ve HDMI 2.1 tam bant genişliği ile mini DisplayPort 1.4a video çıkışları bulunur.
İnternet bağlantısı hızlıdır, 5G bağlantısı 900+ Mb/s'ye ulaşırken, 6G hızları alıcı modunda 1,7 Gb/s'ye kadar test ettiğimiz en yüksek hızlar arasındadır.
Giriş Aygıtları
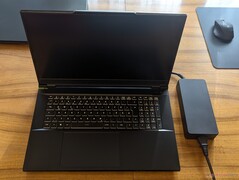
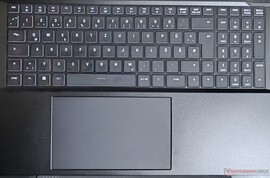
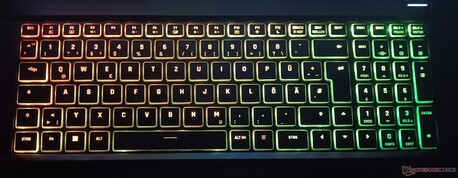
Bu 17 inçlik bir dizüstü bilgisayar olduğundan, sayısal tuş takımı ve ok tuşlarına sahip tam boyutlu bir klavye içerir. Chiclet mekanizması, yeterince rahat bir yazma deneyimi sunan orta hareketliliğe izin verir. Test edilen model Alman düzeniyle geldi, ancak Schenker diğer Avrupa düzenlerini ve ABD EN varsayılanını sunuyor. Tuşlar, özel kontrol merkezi uygulamasında özelleştirilebilen piksel başına RGB aydınlatmaya sahiptir.
Dokunmatik yüzey 150 x 90 mm ile yeterince büyük ve kaymayı iyileştiren yenilikçi yüzey sayesinde ipeksi bir pürüzsüzlük hissi veriyor. Ayrıca avuç içi tanıma özelliği sayesinde avuç içini dokunmatik yüzeye dayayarak yanlışlıkla yapılan girişleri önlüyor.
Ekran
Test edilen ünite BOE tarafından üretilen 3840 X 2160 IPS LCD ekran ile donatılmıştır. Maksimum 144 Hz yenilemeye sahip ve G-SYNC'i destekliyor. Ayrıca 2560 X 1440 240 Hz 300 nit varyantı da mevcut.
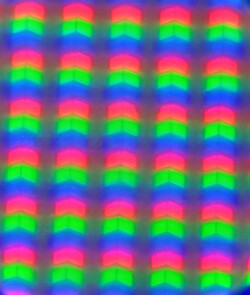
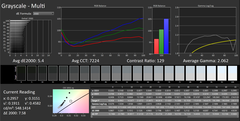
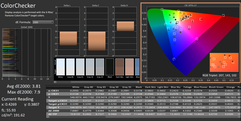
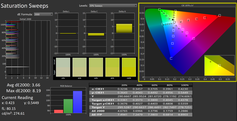
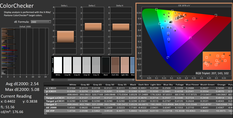
sRGB renk üretimi gerçekten de reklamı yapıldığı gibi %99, ancak DCI-P3 gamutu reklamı yapılan %99 yerine %93. Parlak olmayan kaplama nedeniyle, 0,54 cd/m²'lik hafif yükseltilmiş siyah seviyeleri ile kontrast biraz zarar görüyor. Ancak, daha parlak ekran düşük kontrastı telafi ediyor. Kutudan çıktığı andaki renk doğruluğu biraz düşük ve DCI-P3 gamında dE'yi 3.81'den 2.54'e düşürebildik.
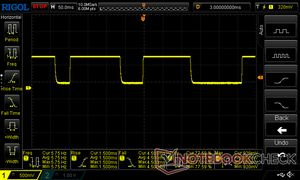
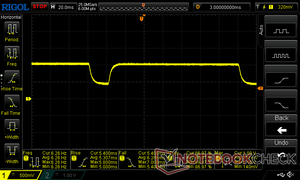
Tepki süreleri genel kullanım ve içerik oluşturma için iyi, ancak 11,6 ms ile daha hızlı tempolu çekim oyunları için biraz yavaş kalabilir. PWM veya ekran titremesi tespit edilmedi.
| |||||||||||||||||||||||||
Aydınlatma: 86 %
Batarya modunda parlaklık: 555 cd/m²
Kontrast: 1015:1 (Siyah: 0.54 cd/m²)
ΔE ColorChecker Calman: 3.81 | ∀{0.5-29.43 Ø4.76}
calibrated: 2.54
ΔE Greyscale Calman: 5.4 | ∀{0.09-98 Ø5}
84.33% AdobeRGB 1998 (Argyll 3D)
99.86% sRGB (Argyll 3D)
93.51% Display P3 (Argyll 3D)
Gamma: 2.062
CCT: 7224 K
| Schenker Key 17 Pro (M24) BOE, IPS, 3840x2160, 17.3", 144 Hz | Eurocom Raptor X17 Core i9-14900HX BOE CQ NE173QUM-NY1, IPS, 3840x2160, 17.3", 144 Hz | HP ZBook Fury 16 G11 AUO87A8, IPS, 3840x2400, 16", 120 Hz | Aorus 17X AZF BOE09F9, IPS, 2560x1440, 17.3", 240 Hz | |
|---|---|---|---|---|
| Display | 1% | 2% | 1% | |
| Display P3 Coverage (%) | 93.51 | 95.9 3% | 98.4 5% | 96.7 3% |
| sRGB Coverage (%) | 99.86 | 99.8 0% | 99.9 0% | 99.9 0% |
| AdobeRGB 1998 Coverage (%) | 84.33 | 84.2 0% | 86 2% | 84.5 0% |
| Response Times | -59% | -19% | -45% | |
| Response Time Grey 50% / Grey 80% * (ms) | 11.593 ? | 14.8 ? -28% | 11.4 ? 2% | 14 ? -21% |
| Response Time Black / White * (ms) | 6 ? | 11.4 ? -90% | 8.4 ? -40% | 10.1 ? -68% |
| PWM Frequency (Hz) | ||||
| PWM Amplitude * (%) | ||||
| Screen | 12% | 18% | 14% | |
| Brightness middle (cd/m²) | 548 | 544.6 -1% | 457.6 -16% | 294 -46% |
| Brightness (cd/m²) | 505 | 507 0% | 466 -8% | 276 -45% |
| Brightness Distribution (%) | 86 | 77 -10% | 83 -3% | 90 5% |
| Black Level * (cd/m²) | 0.54 | 0.48 11% | 0.43 20% | 0.28 48% |
| Contrast (:1) | 1015 | 1135 12% | 1064 5% | 1050 3% |
| Colorchecker dE 2000 * | 3.81 | 3.38 11% | 2.78 27% | 2.81 26% |
| Colorchecker dE 2000 max. * | 7.9 | 7.13 10% | 5.53 30% | 5.7 28% |
| Colorchecker dE 2000 calibrated * | 2.54 | 1.03 59% | 1.37 46% | 0.86 66% |
| Greyscale dE 2000 * | 5.4 | 4.3 20% | 2 63% | 3.4 37% |
| Gamma | 2.062 107% | 2.42 91% | 2.28 96% | 2.301 96% |
| CCT | 7224 90% | 7356 88% | 6806 96% | 7389 88% |
| Toplam Ortalama (Program / Ayarlar) | -15% /
-0% | 0% /
10% | -10% /
3% |
* ... daha küçük daha iyidir
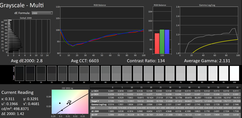
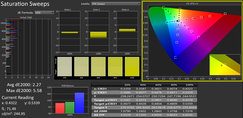
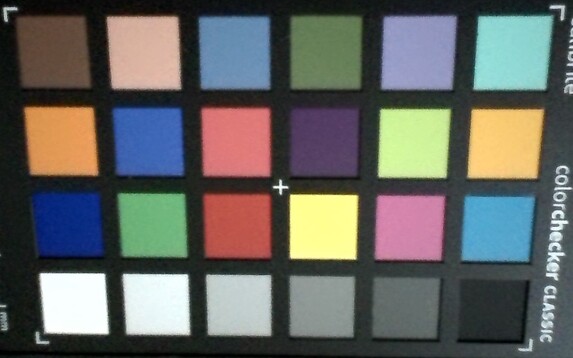
Varsayılan gri tonlama maviye doğru kaymış ve bu da ortalama deltaE değerini 5,4'e çıkarmıştır. X-Rite i1Pro 3 renk ölçer ile DCI-P3 için kalibre edildiğinde deltaE 2,8'e düşüyor, ancak mavi, kırmızı ve daha az derecede mor tonlar biraz kapalı kalıyor, bu nedenle ekran daha hassas renkler gerektiren içerik oluşturma için önerilmeyebilir. Elde edilen kalibre edilmiş ICM profili yukarıda ücretsiz olarak indirilebilir.
Yanıt Sürelerini Görüntüle
| ↔ Tepki Süresi Siyahtan Beyaza | ||
|---|---|---|
| 6 ms ... yükseliş ↗ ve sonbahar↘ birleşimi | ↗ 1.5 ms yükseliş | |
| ↘ 4.5 ms sonbahar | ||
| Ekran, testlerimizde çok hızlı yanıt oranları gösteriyor ve hızlı oyun oynamaya çok uygun olmalı. Karşılaştırıldığında, test edilen tüm cihazlar 0.1 (minimum) ile 240 (maksimum) ms arasında değişir. » Tüm cihazların 18 %'si daha iyi. Bu, ölçülen yanıt süresinin test edilen tüm cihazların ortalamasından (20.1 ms) daha iyi olduğu anlamına gelir. | ||
| ↔ Tepki Süresi %50 Griden %80 Griye | ||
| 11.593 ms ... yükseliş ↗ ve sonbahar↘ birleşimi | ↗ 5.307 ms yükseliş | |
| ↘ 6.286 ms sonbahar | ||
| Ekran, testlerimizde iyi yanıt oranları gösteriyor ancak rekabetçi oyuncular için çok yavaş olabilir. Karşılaştırıldığında, test edilen tüm cihazlar 0.165 (minimum) ile 636 (maksimum) ms arasında değişir. » Tüm cihazların 24 %'si daha iyi. Bu, ölçülen yanıt süresinin test edilen tüm cihazların ortalamasından (31.5 ms) daha iyi olduğu anlamına gelir. | ||
Ekran Titremesi / PWM (Darbe Genişliği Modülasyonu)
| Ekran titriyor / PWM algılanmadı | ||
Karşılaştırıldığında: Test edilen tüm cihazların %53 %'si ekranı karartmak için PWM kullanmıyor. PWM tespit edilirse, ortalama 8023 (minimum: 5 - maksimum: 343500) Hz ölçüldü. | ||
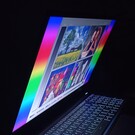
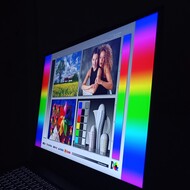
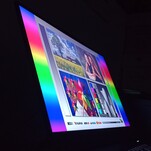
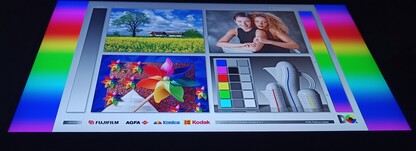
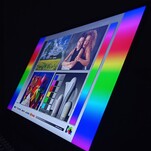
Görüntüleme açıları diğer IPS ekranlarla uyumludur, yani kontrast eksen dışına kaymaya başlar. Yine de, IPS ekranlar TN ve VA panellere kıyasla bu konuda daha iyi, ki zaten bu günlerde dizüstü bilgisayarlarda pek popüler değiller.
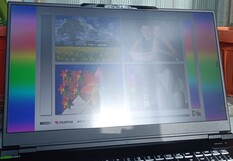
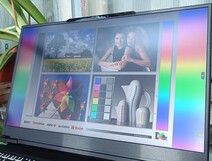
Arka ışık homojenliği üst köşelerde orta derecede kanama gösteriyor. Ne yazık ki, mat kaplama doğrudan veya dolaylı ışığı önemli ölçüde dağıttığı için dış mekan kullanımında çok fazla yardımcı olmuyor. Ancak 500+ nit maksimum parlaklık dolaylı güneş ışığında yardımcı oluyor.
Performans
Test Koşulları
İşlemci
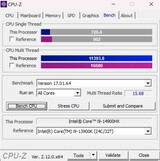
Birleşik CPU performans derecelendirmemiz, Schenker'in i9-14900HX uygulamasının test edilen Intel modelleri arasında ikinci en hızlı olduğunu, Eurocom'un %4 gerisinde kaldığını ve Aorus'un %2 önünde yer aldığını ortaya koyuyor. Beklendiği gibi, AMD Ryzen 9 7945HX3D, tek çekirdek performansı çoğu zaman tüm Intel CPU'lardan daha düşük olmasına rağmen, Intel paketinden en az %10 oranında önemli ölçüde önde. Cinebench R15 kısma döngüsünde Schenker i9-14900HX, Eurocom uygulamasıyla yaklaşık aynı seviyede başlıyor, ancak sonraki iki çalıştırmada %15 düşüyor ve ardından döngünün geri kalanında artan ve azalan varyasyonlar sergileyen tek model oluyor, bu da turbo modunun verimlilik için çok iyi ayarlanmadığını gösteriyor.
Batarya üzerindeki CPU performansı Cinebench R23 testinde en az %66 oranında azalmıştır ve bu durum GPU performansı için de geçerlidir.
Cinebench R15 Multi Loop
Cinebench R23: Multi Core | Single Core
Cinebench R20: CPU (Multi Core) | CPU (Single Core)
Cinebench R15: CPU Multi 64Bit | CPU Single 64Bit
Blender: v2.79 BMW27 CPU
7-Zip 18.03: 7z b 4 | 7z b 4 -mmt1
Geekbench 6.5: Multi-Core | Single-Core
Geekbench 5.5: Multi-Core | Single-Core
HWBOT x265 Benchmark v2.2: 4k Preset
LibreOffice : 20 Documents To PDF
R Benchmark 2.5: Overall mean
| CPU Performance rating | |
| Asus ROG Strix Scar 17 G733PYV-LL053X | |
| Ortalama Intel Core i9-14900HX | |
| Eurocom Raptor X17 Core i9-14900HX | |
| HP ZBook Fury 16 G11 | |
| Schenker Key 17 Pro (M24) | |
| Aorus 17X AZF -2! | |
| Sınıf ortalaması Workstation | |
| Cinebench R23 / Multi Core | |
| Asus ROG Strix Scar 17 G733PYV-LL053X | |
| Eurocom Raptor X17 Core i9-14900HX | |
| Ortalama Intel Core i9-14900HX (17078 - 36249, n=37) | |
| Aorus 17X AZF | |
| Schenker Key 17 Pro (M24) | |
| HP ZBook Fury 16 G11 | |
| Sınıf ortalaması Workstation (14055 - 38520, n=28, son 2 yıl) | |
| Cinebench R23 / Single Core | |
| HP ZBook Fury 16 G11 | |
| Ortalama Intel Core i9-14900HX (1720 - 2245, n=37) | |
| Eurocom Raptor X17 Core i9-14900HX | |
| Aorus 17X AZF | |
| Schenker Key 17 Pro (M24) | |
| Sınıf ortalaması Workstation (1712 - 2228, n=28, son 2 yıl) | |
| Asus ROG Strix Scar 17 G733PYV-LL053X | |
| Cinebench R20 / CPU (Multi Core) | |
| Asus ROG Strix Scar 17 G733PYV-LL053X | |
| Eurocom Raptor X17 Core i9-14900HX | |
| Ortalama Intel Core i9-14900HX (6579 - 13832, n=37) | |
| Aorus 17X AZF | |
| Schenker Key 17 Pro (M24) | |
| HP ZBook Fury 16 G11 | |
| Sınıf ortalaması Workstation (5471 - 15043, n=28, son 2 yıl) | |
| Cinebench R20 / CPU (Single Core) | |
| HP ZBook Fury 16 G11 | |
| Ortalama Intel Core i9-14900HX (657 - 859, n=37) | |
| Aorus 17X AZF | |
| Eurocom Raptor X17 Core i9-14900HX | |
| Schenker Key 17 Pro (M24) | |
| Sınıf ortalaması Workstation (671 - 857, n=28, son 2 yıl) | |
| Asus ROG Strix Scar 17 G733PYV-LL053X | |
| Cinebench R15 / CPU Multi 64Bit | |
| Asus ROG Strix Scar 17 G733PYV-LL053X | |
| Eurocom Raptor X17 Core i9-14900HX | |
| Aorus 17X AZF | |
| Ortalama Intel Core i9-14900HX (3263 - 5589, n=38) | |
| Schenker Key 17 Pro (M24) | |
| HP ZBook Fury 16 G11 | |
| Sınıf ortalaması Workstation (2404 - 5810, n=28, son 2 yıl) | |
| Cinebench R15 / CPU Single 64Bit | |
| Asus ROG Strix Scar 17 G733PYV-LL053X | |
| Ortalama Intel Core i9-14900HX (247 - 323, n=37) | |
| Aorus 17X AZF | |
| Eurocom Raptor X17 Core i9-14900HX | |
| HP ZBook Fury 16 G11 | |
| Sınıf ortalaması Workstation (191.4 - 328, n=28, son 2 yıl) | |
| Schenker Key 17 Pro (M24) | |
| Blender / v2.79 BMW27 CPU | |
| Sınıf ortalaması Workstation (91 - 261, n=28, son 2 yıl) | |
| Aorus 17X AZF | |
| HP ZBook Fury 16 G11 | |
| Ortalama Intel Core i9-14900HX (91 - 206, n=37) | |
| Schenker Key 17 Pro (M24) | |
| Eurocom Raptor X17 Core i9-14900HX | |
| Asus ROG Strix Scar 17 G733PYV-LL053X | |
| 7-Zip 18.03 / 7z b 4 | |
| Asus ROG Strix Scar 17 G733PYV-LL053X | |
| Eurocom Raptor X17 Core i9-14900HX | |
| Ortalama Intel Core i9-14900HX (66769 - 136645, n=37) | |
| Schenker Key 17 Pro (M24) | |
| HP ZBook Fury 16 G11 | |
| Aorus 17X AZF | |
| Sınıf ortalaması Workstation (53407 - 116969, n=28, son 2 yıl) | |
| 7-Zip 18.03 / 7z b 4 -mmt1 | |
| Asus ROG Strix Scar 17 G733PYV-LL053X | |
| Aorus 17X AZF | |
| Ortalama Intel Core i9-14900HX (5452 - 7545, n=37) | |
| HP ZBook Fury 16 G11 | |
| Schenker Key 17 Pro (M24) | |
| Eurocom Raptor X17 Core i9-14900HX | |
| Sınıf ortalaması Workstation (4981 - 6960, n=28, son 2 yıl) | |
| Geekbench 6.5 / Multi-Core | |
| Eurocom Raptor X17 Core i9-14900HX | |
| Ortalama Intel Core i9-14900HX (13158 - 19665, n=37) | |
| Asus ROG Strix Scar 17 G733PYV-LL053X | |
| Schenker Key 17 Pro (M24) | |
| Sınıf ortalaması Workstation (12196 - 20887, n=28, son 2 yıl) | |
| HP ZBook Fury 16 G11 | |
| Geekbench 6.5 / Single-Core | |
| Ortalama Intel Core i9-14900HX (2419 - 3129, n=37) | |
| HP ZBook Fury 16 G11 | |
| Asus ROG Strix Scar 17 G733PYV-LL053X | |
| Eurocom Raptor X17 Core i9-14900HX | |
| Sınıf ortalaması Workstation (2384 - 3065, n=28, son 2 yıl) | |
| Schenker Key 17 Pro (M24) | |
| Geekbench 5.5 / Multi-Core | |
| Asus ROG Strix Scar 17 G733PYV-LL053X | |
| Ortalama Intel Core i9-14900HX (8618 - 23194, n=37) | |
| Schenker Key 17 Pro (M24) | |
| Aorus 17X AZF | |
| HP ZBook Fury 16 G11 | |
| Sınıf ortalaması Workstation (11542 - 25554, n=28, son 2 yıl) | |
| Eurocom Raptor X17 Core i9-14900HX | |
| Geekbench 5.5 / Single-Core | |
| Asus ROG Strix Scar 17 G733PYV-LL053X | |
| Ortalama Intel Core i9-14900HX (1669 - 2210, n=37) | |
| Aorus 17X AZF | |
| HP ZBook Fury 16 G11 | |
| Sınıf ortalaması Workstation (1759 - 2183, n=28, son 2 yıl) | |
| Schenker Key 17 Pro (M24) | |
| Eurocom Raptor X17 Core i9-14900HX | |
| HWBOT x265 Benchmark v2.2 / 4k Preset | |
| Asus ROG Strix Scar 17 G733PYV-LL053X | |
| Eurocom Raptor X17 Core i9-14900HX | |
| Ortalama Intel Core i9-14900HX (16.8 - 38.9, n=37) | |
| Schenker Key 17 Pro (M24) | |
| HP ZBook Fury 16 G11 | |
| Sınıf ortalaması Workstation (14.4 - 40.5, n=28, son 2 yıl) | |
| Aorus 17X AZF | |
| LibreOffice / 20 Documents To PDF | |
| HP ZBook Fury 16 G11 | |
| Sınıf ortalaması Workstation (37.1 - 74.7, n=28, son 2 yıl) | |
| Schenker Key 17 Pro (M24) | |
| Aorus 17X AZF | |
| Ortalama Intel Core i9-14900HX (19 - 85.1, n=37) | |
| Asus ROG Strix Scar 17 G733PYV-LL053X | |
| Eurocom Raptor X17 Core i9-14900HX | |
| R Benchmark 2.5 / Overall mean | |
| Sınıf ortalaması Workstation (0.3825 - 0.603, n=28, son 2 yıl) | |
| Schenker Key 17 Pro (M24) | |
| Asus ROG Strix Scar 17 G733PYV-LL053X | |
| Aorus 17X AZF | |
| Ortalama Intel Core i9-14900HX (0.3604 - 0.4859, n=37) | |
| Eurocom Raptor X17 Core i9-14900HX | |
| HP ZBook Fury 16 G11 | |
* ... daha küçük daha iyidir
AIDA64: FP32 Ray-Trace | FPU Julia | CPU SHA3 | CPU Queen | FPU SinJulia | FPU Mandel | CPU AES | CPU ZLib | FP64 Ray-Trace | CPU PhotoWorxx
| Performance rating | |
| Asus ROG Strix Scar 17 G733PYV-LL053X | |
| Eurocom Raptor X17 Core i9-14900HX | |
| Ortalama Intel Core i9-14900HX | |
| Schenker Key 17 Pro (M24) | |
| Sınıf ortalaması Workstation | |
| Aorus 17X AZF | |
| HP ZBook Fury 16 G11 | |
| AIDA64 / FP32 Ray-Trace | |
| Asus ROG Strix Scar 17 G733PYV-LL053X | |
| Eurocom Raptor X17 Core i9-14900HX | |
| Sınıf ortalaması Workstation (10658 - 61611, n=28, son 2 yıl) | |
| Ortalama Intel Core i9-14900HX (13098 - 33474, n=36) | |
| Schenker Key 17 Pro (M24) | |
| HP ZBook Fury 16 G11 | |
| Aorus 17X AZF | |
| AIDA64 / FPU Julia | |
| Asus ROG Strix Scar 17 G733PYV-LL053X | |
| Eurocom Raptor X17 Core i9-14900HX | |
| Ortalama Intel Core i9-14900HX (67573 - 166040, n=36) | |
| Sınıf ortalaması Workstation (56664 - 186971, n=28, son 2 yıl) | |
| Schenker Key 17 Pro (M24) | |
| HP ZBook Fury 16 G11 | |
| Aorus 17X AZF | |
| AIDA64 / CPU SHA3 | |
| Asus ROG Strix Scar 17 G733PYV-LL053X | |
| Eurocom Raptor X17 Core i9-14900HX | |
| Ortalama Intel Core i9-14900HX (3589 - 7979, n=36) | |
| Sınıf ortalaması Workstation (2608 - 8975, n=28, son 2 yıl) | |
| Schenker Key 17 Pro (M24) | |
| HP ZBook Fury 16 G11 | |
| Aorus 17X AZF | |
| AIDA64 / CPU Queen | |
| Asus ROG Strix Scar 17 G733PYV-LL053X | |
| Eurocom Raptor X17 Core i9-14900HX | |
| Schenker Key 17 Pro (M24) | |
| Ortalama Intel Core i9-14900HX (118405 - 148966, n=36) | |
| HP ZBook Fury 16 G11 | |
| Aorus 17X AZF | |
| Sınıf ortalaması Workstation (60778 - 144411, n=28, son 2 yıl) | |
| AIDA64 / FPU SinJulia | |
| Asus ROG Strix Scar 17 G733PYV-LL053X | |
| Eurocom Raptor X17 Core i9-14900HX | |
| Ortalama Intel Core i9-14900HX (10475 - 18517, n=36) | |
| Schenker Key 17 Pro (M24) | |
| HP ZBook Fury 16 G11 | |
| Aorus 17X AZF | |
| Sınıf ortalaması Workstation (7906 - 29343, n=28, son 2 yıl) | |
| AIDA64 / FPU Mandel | |
| Asus ROG Strix Scar 17 G733PYV-LL053X | |
| Eurocom Raptor X17 Core i9-14900HX | |
| Sınıf ortalaması Workstation (27301 - 98153, n=28, son 2 yıl) | |
| Ortalama Intel Core i9-14900HX (32543 - 83662, n=36) | |
| Schenker Key 17 Pro (M24) | |
| HP ZBook Fury 16 G11 | |
| Aorus 17X AZF | |
| AIDA64 / CPU AES | |
| Asus ROG Strix Scar 17 G733PYV-LL053X | |
| Eurocom Raptor X17 Core i9-14900HX | |
| Aorus 17X AZF | |
| Ortalama Intel Core i9-14900HX (86964 - 241777, n=36) | |
| Schenker Key 17 Pro (M24) | |
| Sınıf ortalaması Workstation (56077 - 187841, n=28, son 2 yıl) | |
| HP ZBook Fury 16 G11 | |
| AIDA64 / CPU ZLib | |
| Asus ROG Strix Scar 17 G733PYV-LL053X | |
| Eurocom Raptor X17 Core i9-14900HX | |
| Ortalama Intel Core i9-14900HX (1054 - 2292, n=36) | |
| Schenker Key 17 Pro (M24) | |
| HP ZBook Fury 16 G11 | |
| Sınıf ortalaması Workstation (742 - 2148, n=28, son 2 yıl) | |
| Aorus 17X AZF | |
| AIDA64 / FP64 Ray-Trace | |
| Asus ROG Strix Scar 17 G733PYV-LL053X | |
| Eurocom Raptor X17 Core i9-14900HX | |
| Sınıf ortalaması Workstation (5580 - 32891, n=28, son 2 yıl) | |
| Ortalama Intel Core i9-14900HX (6809 - 18349, n=36) | |
| Schenker Key 17 Pro (M24) | |
| HP ZBook Fury 16 G11 | |
| Aorus 17X AZF | |
| AIDA64 / CPU PhotoWorxx | |
| Eurocom Raptor X17 Core i9-14900HX | |
| Sınıf ortalaması Workstation (37151 - 93684, n=28, son 2 yıl) | |
| Schenker Key 17 Pro (M24) | |
| Aorus 17X AZF | |
| Ortalama Intel Core i9-14900HX (23903 - 54702, n=36) | |
| HP ZBook Fury 16 G11 | |
| Asus ROG Strix Scar 17 G733PYV-LL053X | |
Sistem Performansı
Diğer iki i9-14900HX ile karşılaştırıldığında Key 17 Pro, PCMark 10'daki en hızlı Intel modeli gibi görünüyor, ancak Asus dizüstü bilgisayardaki AMD Ryzen 9 7945HX3D en fazla %10 farkla önde. Aorus modelindeki eski i9-13900HX, Zbook Fury i9-14900HX'e kıyasla şaşırtıcı bir şekilde küçük bir farkla daha hızlı.
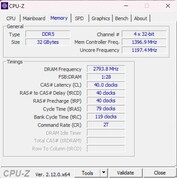
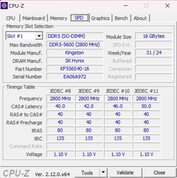
Bununla birlikte, Schenker modelinde bulunan Kingston DDR5-5600 RAM en hızlı ortalamayı kanıtladı. AIDA64 Bellek Kopyalama ve Bellek Yazma testlerinde ilk sırayı alırken, bellek Okuma için ikinci ve gecikme için üçüncü sırada yer alıyor.
CrossMark: Overall | Productivity | Creativity | Responsiveness
WebXPRT 3: Overall
WebXPRT 4: Overall
Mozilla Kraken 1.1: Total
| PCMark 10 / Score | |
| Asus ROG Strix Scar 17 G733PYV-LL053X | |
| Ortalama Intel Core i9-14900HX, NVIDIA GeForce RTX 4090 Laptop GPU (8230 - 9234, n=13) | |
| Schenker Key 17 Pro (M24) | |
| Sınıf ortalaması Workstation (6436 - 10409, n=23, son 2 yıl) | |
| Aorus 17X AZF | |
| HP ZBook Fury 16 G11 | |
| PCMark 10 / Essentials | |
| Asus ROG Strix Scar 17 G733PYV-LL053X | |
| Aorus 17X AZF | |
| Ortalama Intel Core i9-14900HX, NVIDIA GeForce RTX 4090 Laptop GPU (10778 - 11628, n=13) | |
| Schenker Key 17 Pro (M24) | |
| Sınıf ortalaması Workstation (9622 - 11157, n=23, son 2 yıl) | |
| HP ZBook Fury 16 G11 | |
| PCMark 10 / Productivity | |
| Asus ROG Strix Scar 17 G733PYV-LL053X | |
| Sınıf ortalaması Workstation (8789 - 20616, n=23, son 2 yıl) | |
| Ortalama Intel Core i9-14900HX, NVIDIA GeForce RTX 4090 Laptop GPU (9458 - 11759, n=13) | |
| Aorus 17X AZF | |
| HP ZBook Fury 16 G11 | |
| Schenker Key 17 Pro (M24) | |
| PCMark 10 / Digital Content Creation | |
| Asus ROG Strix Scar 17 G733PYV-LL053X | |
| Schenker Key 17 Pro (M24) | |
| Ortalama Intel Core i9-14900HX, NVIDIA GeForce RTX 4090 Laptop GPU (13219 - 16462, n=13) | |
| HP ZBook Fury 16 G11 | |
| Sınıf ortalaması Workstation (7744 - 15631, n=23, son 2 yıl) | |
| Aorus 17X AZF | |
| CrossMark / Overall | |
| Eurocom Raptor X17 Core i9-14900HX | |
| Aorus 17X AZF | |
| Ortalama Intel Core i9-14900HX, NVIDIA GeForce RTX 4090 Laptop GPU (1877 - 2344, n=10) | |
| Asus ROG Strix Scar 17 G733PYV-LL053X | |
| HP ZBook Fury 16 G11 | |
| Sınıf ortalaması Workstation (1307 - 2267, n=27, son 2 yıl) | |
| CrossMark / Productivity | |
| Eurocom Raptor X17 Core i9-14900HX | |
| Aorus 17X AZF | |
| Ortalama Intel Core i9-14900HX, NVIDIA GeForce RTX 4090 Laptop GPU (1738 - 2162, n=10) | |
| Asus ROG Strix Scar 17 G733PYV-LL053X | |
| HP ZBook Fury 16 G11 | |
| Sınıf ortalaması Workstation (1130 - 2122, n=27, son 2 yıl) | |
| CrossMark / Creativity | |
| Asus ROG Strix Scar 17 G733PYV-LL053X | |
| Ortalama Intel Core i9-14900HX, NVIDIA GeForce RTX 4090 Laptop GPU (2195 - 2660, n=10) | |
| Eurocom Raptor X17 Core i9-14900HX | |
| Aorus 17X AZF | |
| HP ZBook Fury 16 G11 | |
| Sınıf ortalaması Workstation (1657 - 2725, n=27, son 2 yıl) | |
| CrossMark / Responsiveness | |
| Eurocom Raptor X17 Core i9-14900HX | |
| Aorus 17X AZF | |
| Ortalama Intel Core i9-14900HX, NVIDIA GeForce RTX 4090 Laptop GPU (1478 - 2327, n=10) | |
| HP ZBook Fury 16 G11 | |
| Asus ROG Strix Scar 17 G733PYV-LL053X | |
| Sınıf ortalaması Workstation (993 - 2096, n=27, son 2 yıl) | |
| WebXPRT 3 / Overall | |
| Asus ROG Strix Scar 17 G733PYV-LL053X | |
| Aorus 17X AZF | |
| Eurocom Raptor X17 Core i9-14900HX | |
| Ortalama Intel Core i9-14900HX, NVIDIA GeForce RTX 4090 Laptop GPU (279 - 339, n=10) | |
| HP ZBook Fury 16 G11 | |
| Sınıf ortalaması Workstation (260 - 360, n=28, son 2 yıl) | |
| Schenker Key 17 Pro (M24) | |
| WebXPRT 4 / Overall | |
| Asus ROG Strix Scar 17 G733PYV-LL053X | |
| Eurocom Raptor X17 Core i9-14900HX | |
| HP ZBook Fury 16 G11 | |
| Aorus 17X AZF | |
| Ortalama Intel Core i9-14900HX, NVIDIA GeForce RTX 4090 Laptop GPU (246 - 309, n=8) | |
| Sınıf ortalaması Workstation (189.2 - 326, n=29, son 2 yıl) | |
| Schenker Key 17 Pro (M24) | |
| Mozilla Kraken 1.1 / Total | |
| Schenker Key 17 Pro (M24) | |
| Aorus 17X AZF | |
| Sınıf ortalaması Workstation (411 - 538, n=28, son 2 yıl) | |
| Eurocom Raptor X17 Core i9-14900HX | |
| Ortalama Intel Core i9-14900HX, NVIDIA GeForce RTX 4090 Laptop GPU (428 - 535, n=11) | |
| HP ZBook Fury 16 G11 | |
| Asus ROG Strix Scar 17 G733PYV-LL053X | |
* ... daha küçük daha iyidir
| PCMark 10 Score | 8277 puan | |
Yardım | ||
| AIDA64 / Memory Copy | |
| Sınıf ortalaması Workstation (56003 - 164795, n=28, son 2 yıl) | |
| Schenker Key 17 Pro (M24) | |
| Aorus 17X AZF | |
| Eurocom Raptor X17 Core i9-14900HX | |
| Ortalama Intel Core i9-14900HX (38028 - 83392, n=36) | |
| HP ZBook Fury 16 G11 | |
| Asus ROG Strix Scar 17 G733PYV-LL053X | |
| AIDA64 / Memory Read | |
| Aorus 17X AZF | |
| Schenker Key 17 Pro (M24) | |
| Ortalama Intel Core i9-14900HX (43306 - 87568, n=36) | |
| Eurocom Raptor X17 Core i9-14900HX | |
| Sınıf ortalaması Workstation (55795 - 121563, n=28, son 2 yıl) | |
| Asus ROG Strix Scar 17 G733PYV-LL053X | |
| HP ZBook Fury 16 G11 | |
| AIDA64 / Memory Write | |
| Sınıf ortalaması Workstation (55663 - 214520, n=28, son 2 yıl) | |
| Schenker Key 17 Pro (M24) | |
| Aorus 17X AZF | |
| Eurocom Raptor X17 Core i9-14900HX | |
| Ortalama Intel Core i9-14900HX (37146 - 80589, n=36) | |
| Asus ROG Strix Scar 17 G733PYV-LL053X | |
| HP ZBook Fury 16 G11 | |
| AIDA64 / Memory Latency | |
| Sınıf ortalaması Workstation (84.5 - 165.2, n=28, son 2 yıl) | |
| HP ZBook Fury 16 G11 | |
| Asus ROG Strix Scar 17 G733PYV-LL053X | |
| Eurocom Raptor X17 Core i9-14900HX | |
| Ortalama Intel Core i9-14900HX (76.1 - 105, n=36) | |
| Schenker Key 17 Pro (M24) | |
| Aorus 17X AZF | |
* ... daha küçük daha iyidir
DPC Gecikme Süresi
Schenker'in Key 17 Pro M24'ü, bu karşılaştırmadaki tüm i9-14900HX uygulamaları arasında ikinci en yüksek gecikme süresine sahiptir, ancak daha iyi uygulamalar yalnızca 1000 mikrosaniye aralığında olduğu için önemli ölçüde daha yüksek değildir. Gigabyte'ın i9-13900HX'i ve Zbook Fury'deki i9-14900HX, 11000 - 12000+ mikrosaniye gecikme ile önemli ölçüde daha kötü görünüyor. Latencymon, 1,9K μs gecikmenin diğer görevlerle birlikte gerçek zamanlı ses için çok yüksek olduğunu, bu nedenle video düzenleme gibi içerik oluşturmayı olumsuz etkileyebileceğini öne sürüyor. Yine de, Youtube'dan 4K@60 fps video oynatımında kare düşmesi yok ve nispeten düşük CPU kullanımı görülüyor.
| DPC Latencies / LatencyMon - interrupt to process latency (max), Web, Youtube, Prime95 | |
| Aorus 17X AZF | |
| HP ZBook Fury 16 G11 | |
| Schenker Key 17 Pro (M24) | |
| Eurocom Raptor X17 Core i9-14900HX | |
| Asus ROG Strix Scar 17 G733PYV-LL053X | |
* ... daha küçük daha iyidir
Depolama Cihazları
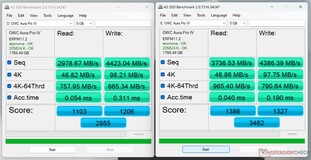
Samsung'un 990 Pro'su PCIe 4.0 1 TB SSD, diğer tüm SSD modellerine kıyasla ortalama olarak daha hızlı çıkmaktadır Corsair MP700ki bu bir PCIe 5.0 çözümüne sahiptir. Samsung SSD, kendisiyle donatılmış diğer dizüstü bilgisayar modelleri arasında kaydedilen ortalamadan da %14 daha hızlıdır. Azaltma döngüsünde, Samsung 990 Pro, maksimum hız diğer PCIe 4.0 SSD'lere kıyasla % birkaç daha düşük görünse de, ilk birkaç çalıştırma göz ardı edildiğinde önemli bir değişiklik göstermemektedir.
| Drive Performance rating - Percent | |
| Eurocom Raptor X17 Core i9-14900HX | |
| Schenker Key 17 Pro (M24) | |
| Ortalama Samsung 990 Pro 1 TB | |
| Aorus 17X AZF | |
| HP ZBook Fury 16 G11 | |
| Sınıf ortalaması Workstation | |
| Asus ROG Strix Scar 17 G733PYV-LL053X | |
* ... daha küçük daha iyidir
Disk Throttling: DiskSpd Read Loop, Queue Depth 8
GPU Performansı
Genel oyun performansı, Schenker RTX 4090 uygulamasını son sıraya yerleştiriyor, ancak yine de en hızlı Intel tabanlı rakiplere kıyasla çok fazla (en fazla% 9) geride kalmıyor. AMD tabanlı Asus dizüstü bilgisayar ise %16 daha hızlı.
Cyberpunk 2077 1080p ultra 30 dakikalık çalıştırmada, Schenker RTX 4090'ın her 5 dakikada bir 20 fps'nin altına düştüğü, ancak ortalama fps'nin 100'ün üzerinde kaldığı garip bir davranış kaydedildi.
Ek olarak, GPU performansı pil modunda büyük ölçüde düşüyor. Örneğin, Furmark stres testi ortalama sadece 30 fps kaydederken, güç adaptörü bağlıyken 581 fps kaydediyor. Benzer şekilde, Cyberpunk 2077 1080p ultra ve Fire Strike pilde yaklaşık 30 fps'de çalışır. GPU performansı, Fire Strike kıyaslamasında ortaya çıktığı gibi gücü dengeli (eğlence) veya güç tasarrufu (sessiz) moduyla sınırlandırırken de oldukça düşüyor.
| Güç Profili | Grafik Puanı | Fizik Puanı | Birleşik Puan |
| Performans Modu | 45600 | 30619 | 10857 |
| Eğlence Modu | 34723 (-24%) | 19943 (-35%) | 6499 (-41%) |
| Sessiz Mod | 30603 (-33%) | 17142 (-44%) | 4452 (-59%) |
| Akü Gücü | 6899 (-85%) | 9512 (-69%) | 3095 (-72%) |
| 3DMark Performance rating - Percent | |
| Asus ROG Strix Scar 17 G733PYV-LL053X -1! | |
| Ortalama NVIDIA GeForce RTX 4090 Laptop GPU | |
| Eurocom Raptor X17 Core i9-14900HX -1! | |
| Aorus 17X AZF | |
| Schenker Key 17 Pro (M24) | |
| HP ZBook Fury 16 G11 -1! | |
| Sınıf ortalaması Workstation | |
| 3DMark 11 - 1280x720 Performance GPU | |
| Ortalama NVIDIA GeForce RTX 4090 Laptop GPU (54073 - 73027, n=42) | |
| Asus ROG Strix Scar 17 G733PYV-LL053X | |
| Eurocom Raptor X17 Core i9-14900HX | |
| Aorus 17X AZF | |
| Schenker Key 17 Pro (M24) | |
| HP ZBook Fury 16 G11 | |
| Sınıf ortalaması Workstation (10748 - 69594, n=27, son 2 yıl) | |
| 3DMark | |
| 1280x720 Cloud Gate Standard Graphics | |
| Ortalama NVIDIA GeForce RTX 4090 Laptop GPU (95671 - 164399, n=14) | |
| Schenker Key 17 Pro (M24) | |
| Aorus 17X AZF | |
| Sınıf ortalaması Workstation (46927 - 152418, n=16, son 2 yıl) | |
| 1920x1080 Fire Strike Graphics | |
| Asus ROG Strix Scar 17 G733PYV-LL053X | |
| Aorus 17X AZF | |
| Ortalama NVIDIA GeForce RTX 4090 Laptop GPU (40259 - 53059, n=41) | |
| Eurocom Raptor X17 Core i9-14900HX | |
| Schenker Key 17 Pro (M24) | |
| HP ZBook Fury 16 G11 | |
| Sınıf ortalaması Workstation (7578 - 52560, n=27, son 2 yıl) | |
| 2560x1440 Time Spy Graphics | |
| Eurocom Raptor X17 Core i9-14900HX | |
| Asus ROG Strix Scar 17 G733PYV-LL053X | |
| Aorus 17X AZF | |
| Ortalama NVIDIA GeForce RTX 4090 Laptop GPU (16950 - 23292, n=43) | |
| Schenker Key 17 Pro (M24) | |
| HP ZBook Fury 16 G11 | |
| Sınıf ortalaması Workstation (2725 - 24806, n=27, son 2 yıl) | |
| 3DMark 11 Performance | 40366 puan | |
| 3DMark Cloud Gate Standard Score | 59382 puan | |
| 3DMark Fire Strike Score | 32725 puan | |
| 3DMark Time Spy Score | 18674 puan | |
Yardım | ||
| Blender | |
| v3.3 Classroom OPTIX/RTX | |
| Sınıf ortalaması Workstation (10 - 95, n=22, son 2 yıl) | |
| HP ZBook Fury 16 G11 | |
| Aorus 17X AZF | |
| Schenker Key 17 Pro (M24) | |
| Ortalama NVIDIA GeForce RTX 4090 Laptop GPU (9 - 19, n=39) | |
| Eurocom Raptor X17 Core i9-14900HX | |
| Asus ROG Strix Scar 17 G733PYV-LL053X | |
| v3.3 Classroom CUDA | |
| Sınıf ortalaması Workstation (16 - 150, n=23, son 2 yıl) | |
| HP ZBook Fury 16 G11 | |
| Aorus 17X AZF | |
| Eurocom Raptor X17 Core i9-14900HX | |
| Ortalama NVIDIA GeForce RTX 4090 Laptop GPU (16 - 24, n=39) | |
| Asus ROG Strix Scar 17 G733PYV-LL053X | |
| Schenker Key 17 Pro (M24) | |
* ... daha küçük daha iyidir
| Performance rating - Percent | |
| Asus ROG Strix Scar 17 G733PYV-LL053X -1! | |
| Eurocom Raptor X17 Core i9-14900HX -2! | |
| Aorus 17X AZF -3! | |
| Schenker Key 17 Pro (M24) | |
| HP ZBook Fury 16 G11 -1! | |
| Sınıf ortalaması Workstation | |
| Cyberpunk 2077 - 1920x1080 Ultra Preset (FSR off) | |
| Asus ROG Strix Scar 17 G733PYV-LL053X | |
| Eurocom Raptor X17 Core i9-14900HX | |
| Schenker Key 17 Pro (M24) | |
| HP ZBook Fury 16 G11 | |
| Sınıf ortalaması Workstation (19.6 - 152.4, n=28, son 2 yıl) | |
| The Witcher 3 v4 - 1920x1080 Ultra Preset / On AA:FX | |
| Schenker Key 17 Pro (M24) | |
| Sınıf ortalaması Workstation (n=1son 2 yıl) | |
| Baldur's Gate 3 - 1920x1080 Ultra Preset AA:T | |
| Eurocom Raptor X17 Core i9-14900HX | |
| Asus ROG Strix Scar 17 G733PYV-LL053X | |
| Schenker Key 17 Pro (M24) | |
| HP ZBook Fury 16 G11 | |
| Sınıf ortalaması Workstation (23.7 - 205, n=29, son 2 yıl) | |
| GTA V - 1920x1080 Highest AA:4xMSAA + FX AF:16x | |
| Asus ROG Strix Scar 17 G733PYV-LL053X | |
| Eurocom Raptor X17 Core i9-14900HX | |
| Aorus 17X AZF | |
| Schenker Key 17 Pro (M24) | |
| HP ZBook Fury 16 G11 | |
| Sınıf ortalaması Workstation (18.1 - 156.1, n=25, son 2 yıl) | |
| Final Fantasy XV Benchmark - 1920x1080 High Quality | |
| Asus ROG Strix Scar 17 G733PYV-LL053X | |
| Aorus 17X AZF | |
| Schenker Key 17 Pro (M24) | |
| HP ZBook Fury 16 G11 | |
| Sınıf ortalaması Workstation (26.4 - 197.6, n=28, son 2 yıl) | |
| Strange Brigade - 1920x1080 ultra AA:ultra AF:16 | |
| Asus ROG Strix Scar 17 G733PYV-LL053X | |
| Eurocom Raptor X17 Core i9-14900HX | |
| Aorus 17X AZF | |
| Schenker Key 17 Pro (M24) | |
| HP ZBook Fury 16 G11 | |
| Sınıf ortalaması Workstation (53.6 - 418, n=21, son 2 yıl) | |
| Dota 2 Reborn - 1920x1080 ultra (3/3) best looking | |
| Asus ROG Strix Scar 17 G733PYV-LL053X | |
| Eurocom Raptor X17 Core i9-14900HX | |
| Schenker Key 17 Pro (M24) | |
| Aorus 17X AZF | |
| HP ZBook Fury 16 G11 | |
| Sınıf ortalaması Workstation (50.7 - 178.4, n=28, son 2 yıl) | |
| X-Plane 11.11 - 1920x1080 high (fps_test=3) | |
| Asus ROG Strix Scar 17 G733PYV-LL053X | |
| Eurocom Raptor X17 Core i9-14900HX | |
| Schenker Key 17 Pro (M24) | |
| Aorus 17X AZF | |
| HP ZBook Fury 16 G11 | |
| Sınıf ortalaması Workstation (30.5 - 139.7, n=28, son 2 yıl) | |


