Schenker Work 14 Base incelemesi - Çok sayıda bağlantı noktası ve parlak IPS ekrana sahip uygun fiyatlı ofis dizüstü bilgisayarı
Schenker'in Work 14 Base modeli, parlak ve mat IPS ekranının yanı sıra çok iyi yükseltme seçenekleri ve Ethernet de dahil olmak üzere çok çeşitli bağlantı noktaları sunan kompakt bir ofis dizüstü bilgisayarıdır. Work 14'ün fiyatları 750 ABD dolarından başlıyor ve 16 GB RAM'li test cihazımız şu anda yaklaşık 770 ABD dolarına bulunabiliyor.
Karşılaştırmalı olarak olası rakipler
Derecelendirme | Tarih | Modeli | Ağırlık | Yükseklik | Boyut | Çözünürlük | Fiyat |
|---|---|---|---|---|---|---|---|
| 82 % v7 (old) | 05/2024 | Schenker Work 14 Base i5-1235U, Iris Xe G7 80EUs | 1.3 kg | 20.2 mm | 14.00" | 1920x1080 | |
| 85.6 % v7 (old) | 11/2023 | Acer Swift Go 14 SFG14-71 i5-1335U, Iris Xe G7 80EUs | 1.3 kg | 14.9 mm | 14.00" | 2880x1800 | |
| 84.6 % v7 (old) | 10/2023 | HP ProBook 445 G10 R5 7530U, Vega 7 | 1.3 kg | 20 mm | 14.00" | 1920x1080 | |
| 85.3 % v7 (old) | Dell Latitude 3440 i5-1345U, Iris Xe G7 80EUs | 1.5 kg | 19.4 mm | 14.00" | 1920x1080 | ||
| 88.6 % v7 (old) | Lenovo ThinkPad L14 G4 21H6S00900 R5 7530U, Vega 7 | 1.5 kg | 19.83 mm | 14.00" | 1920x1080 |
Kasa ve bağlantı
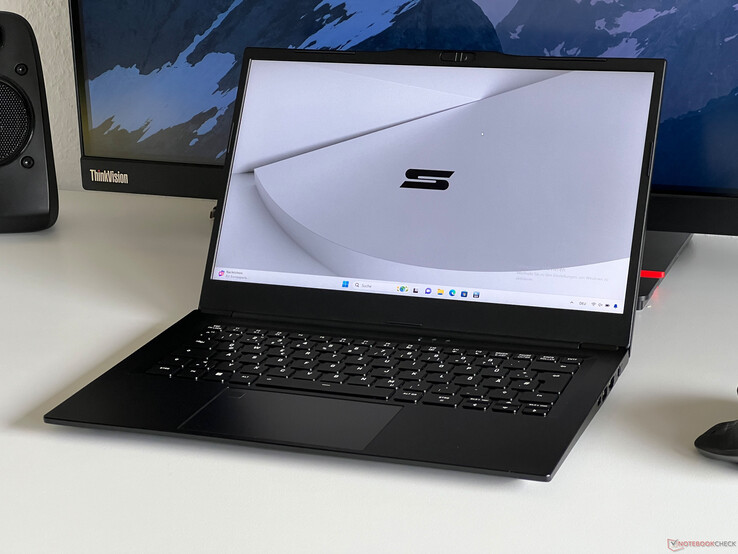
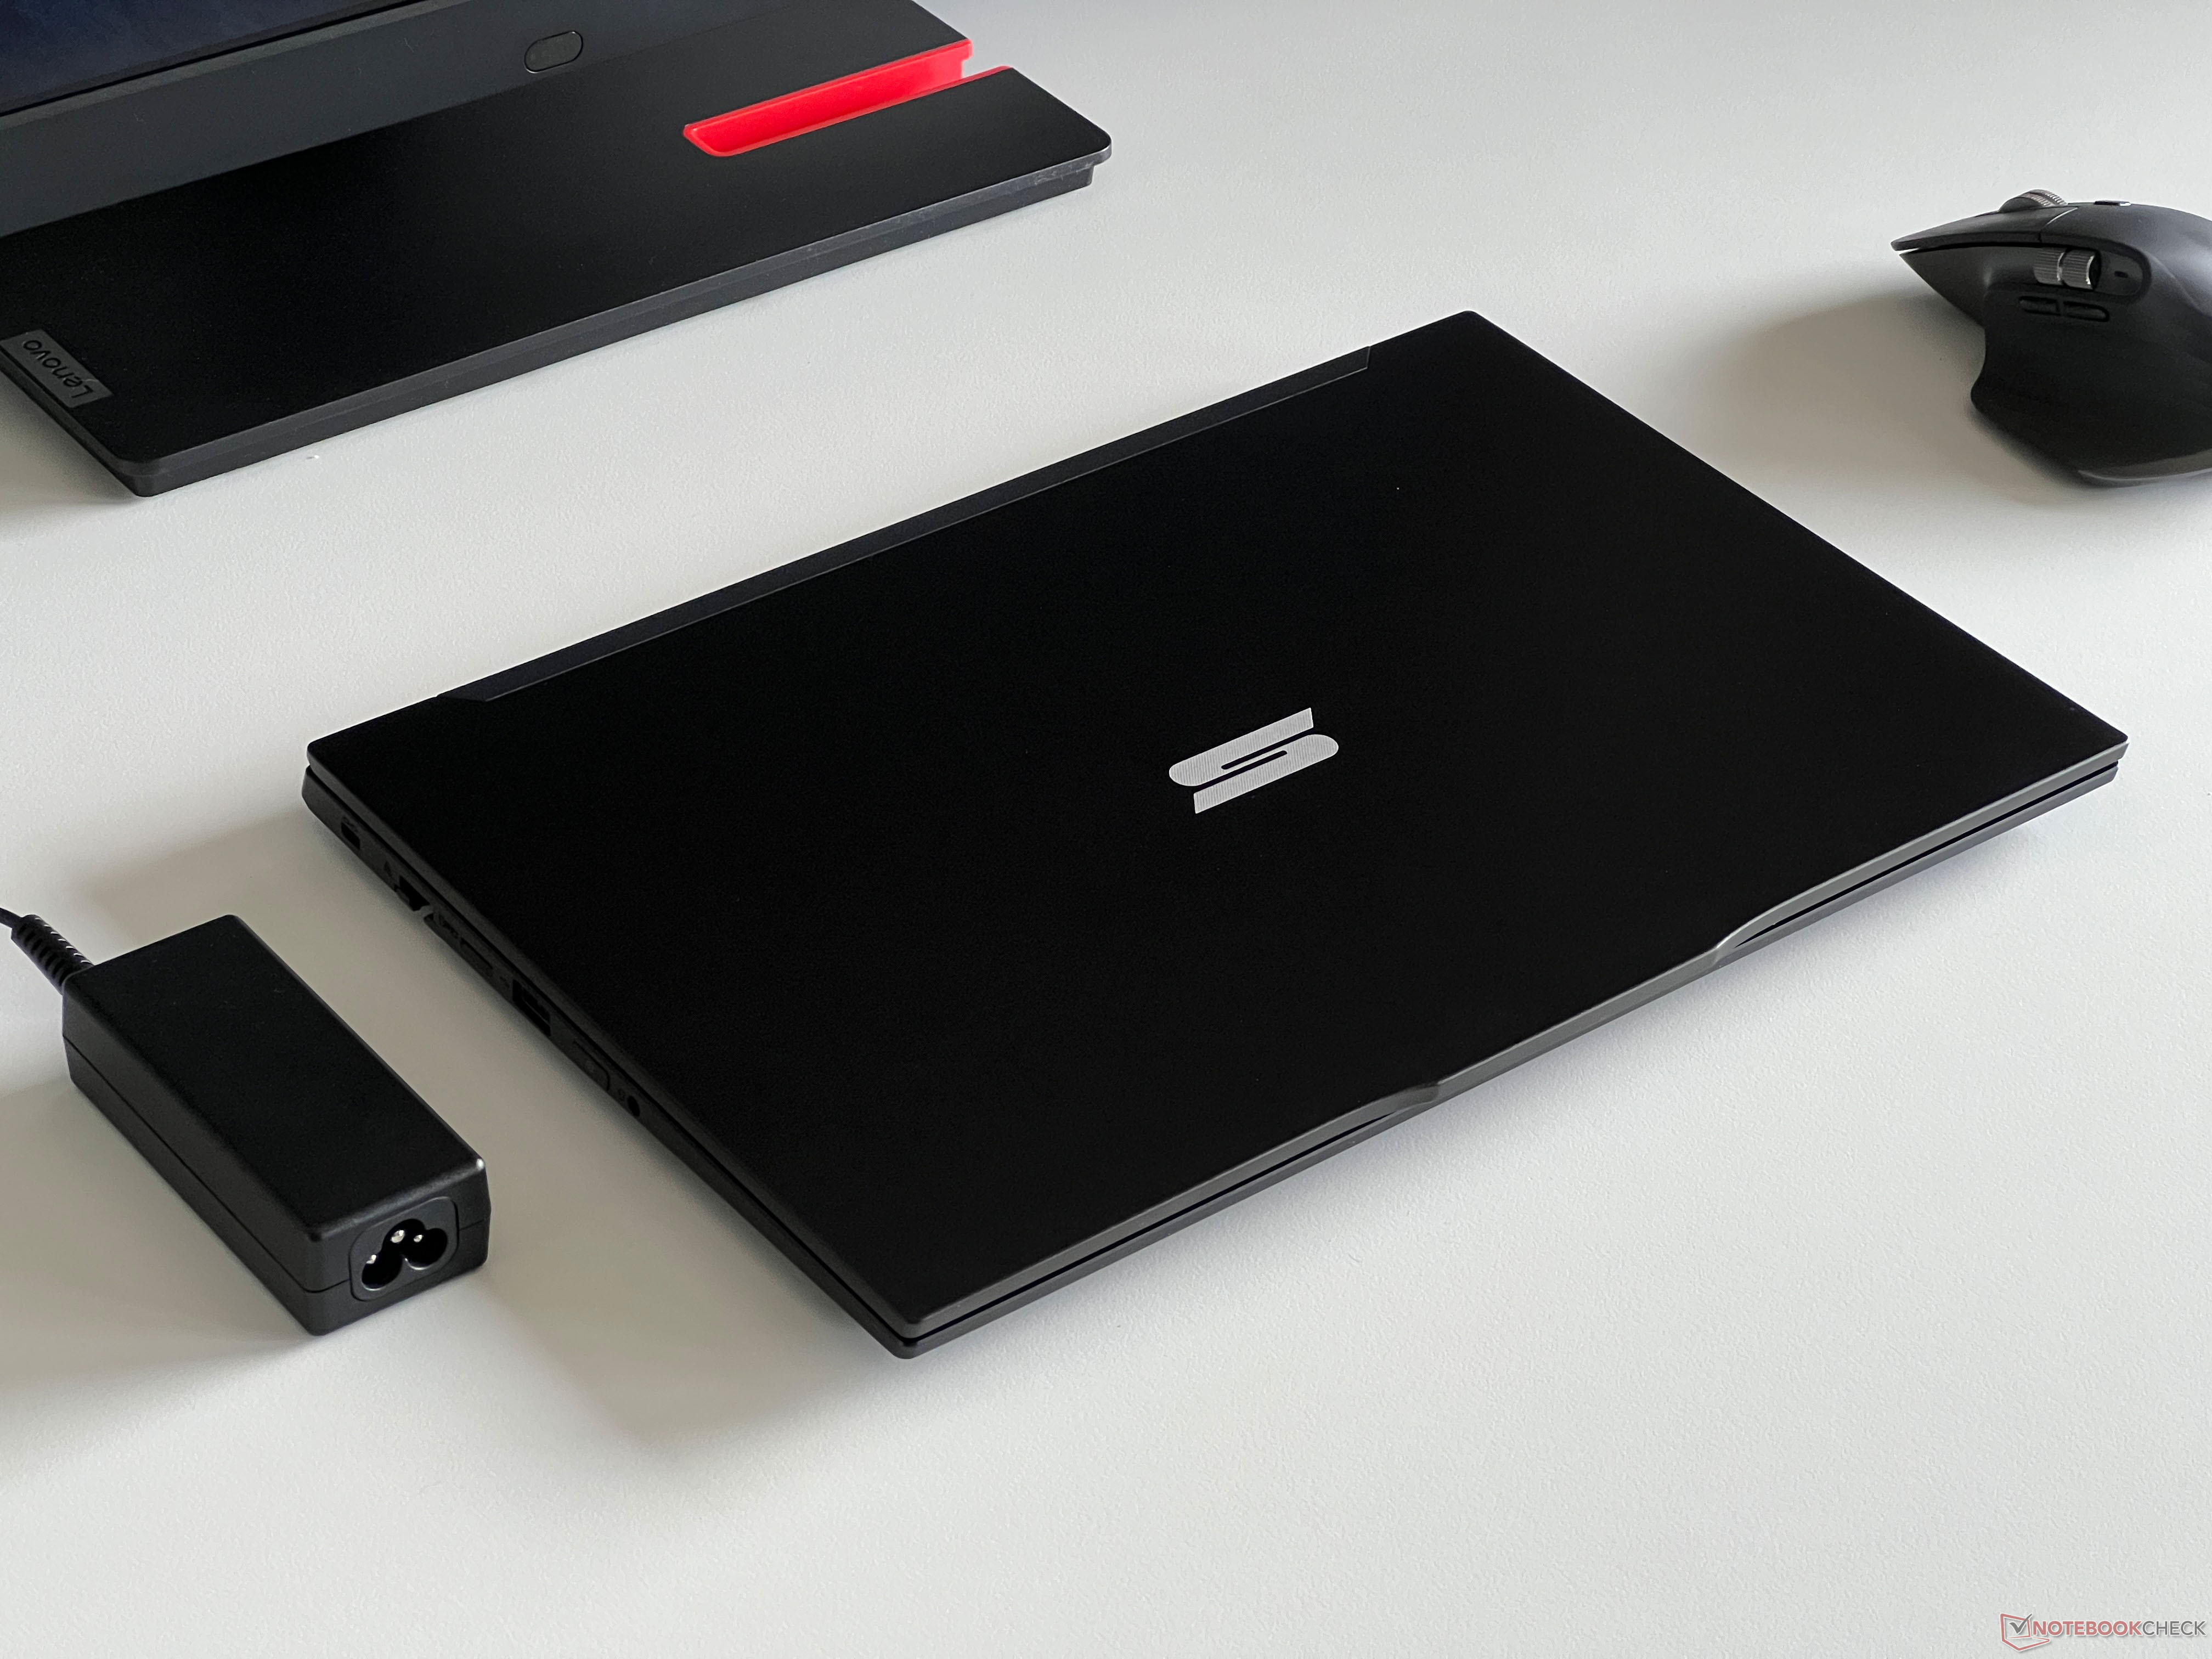
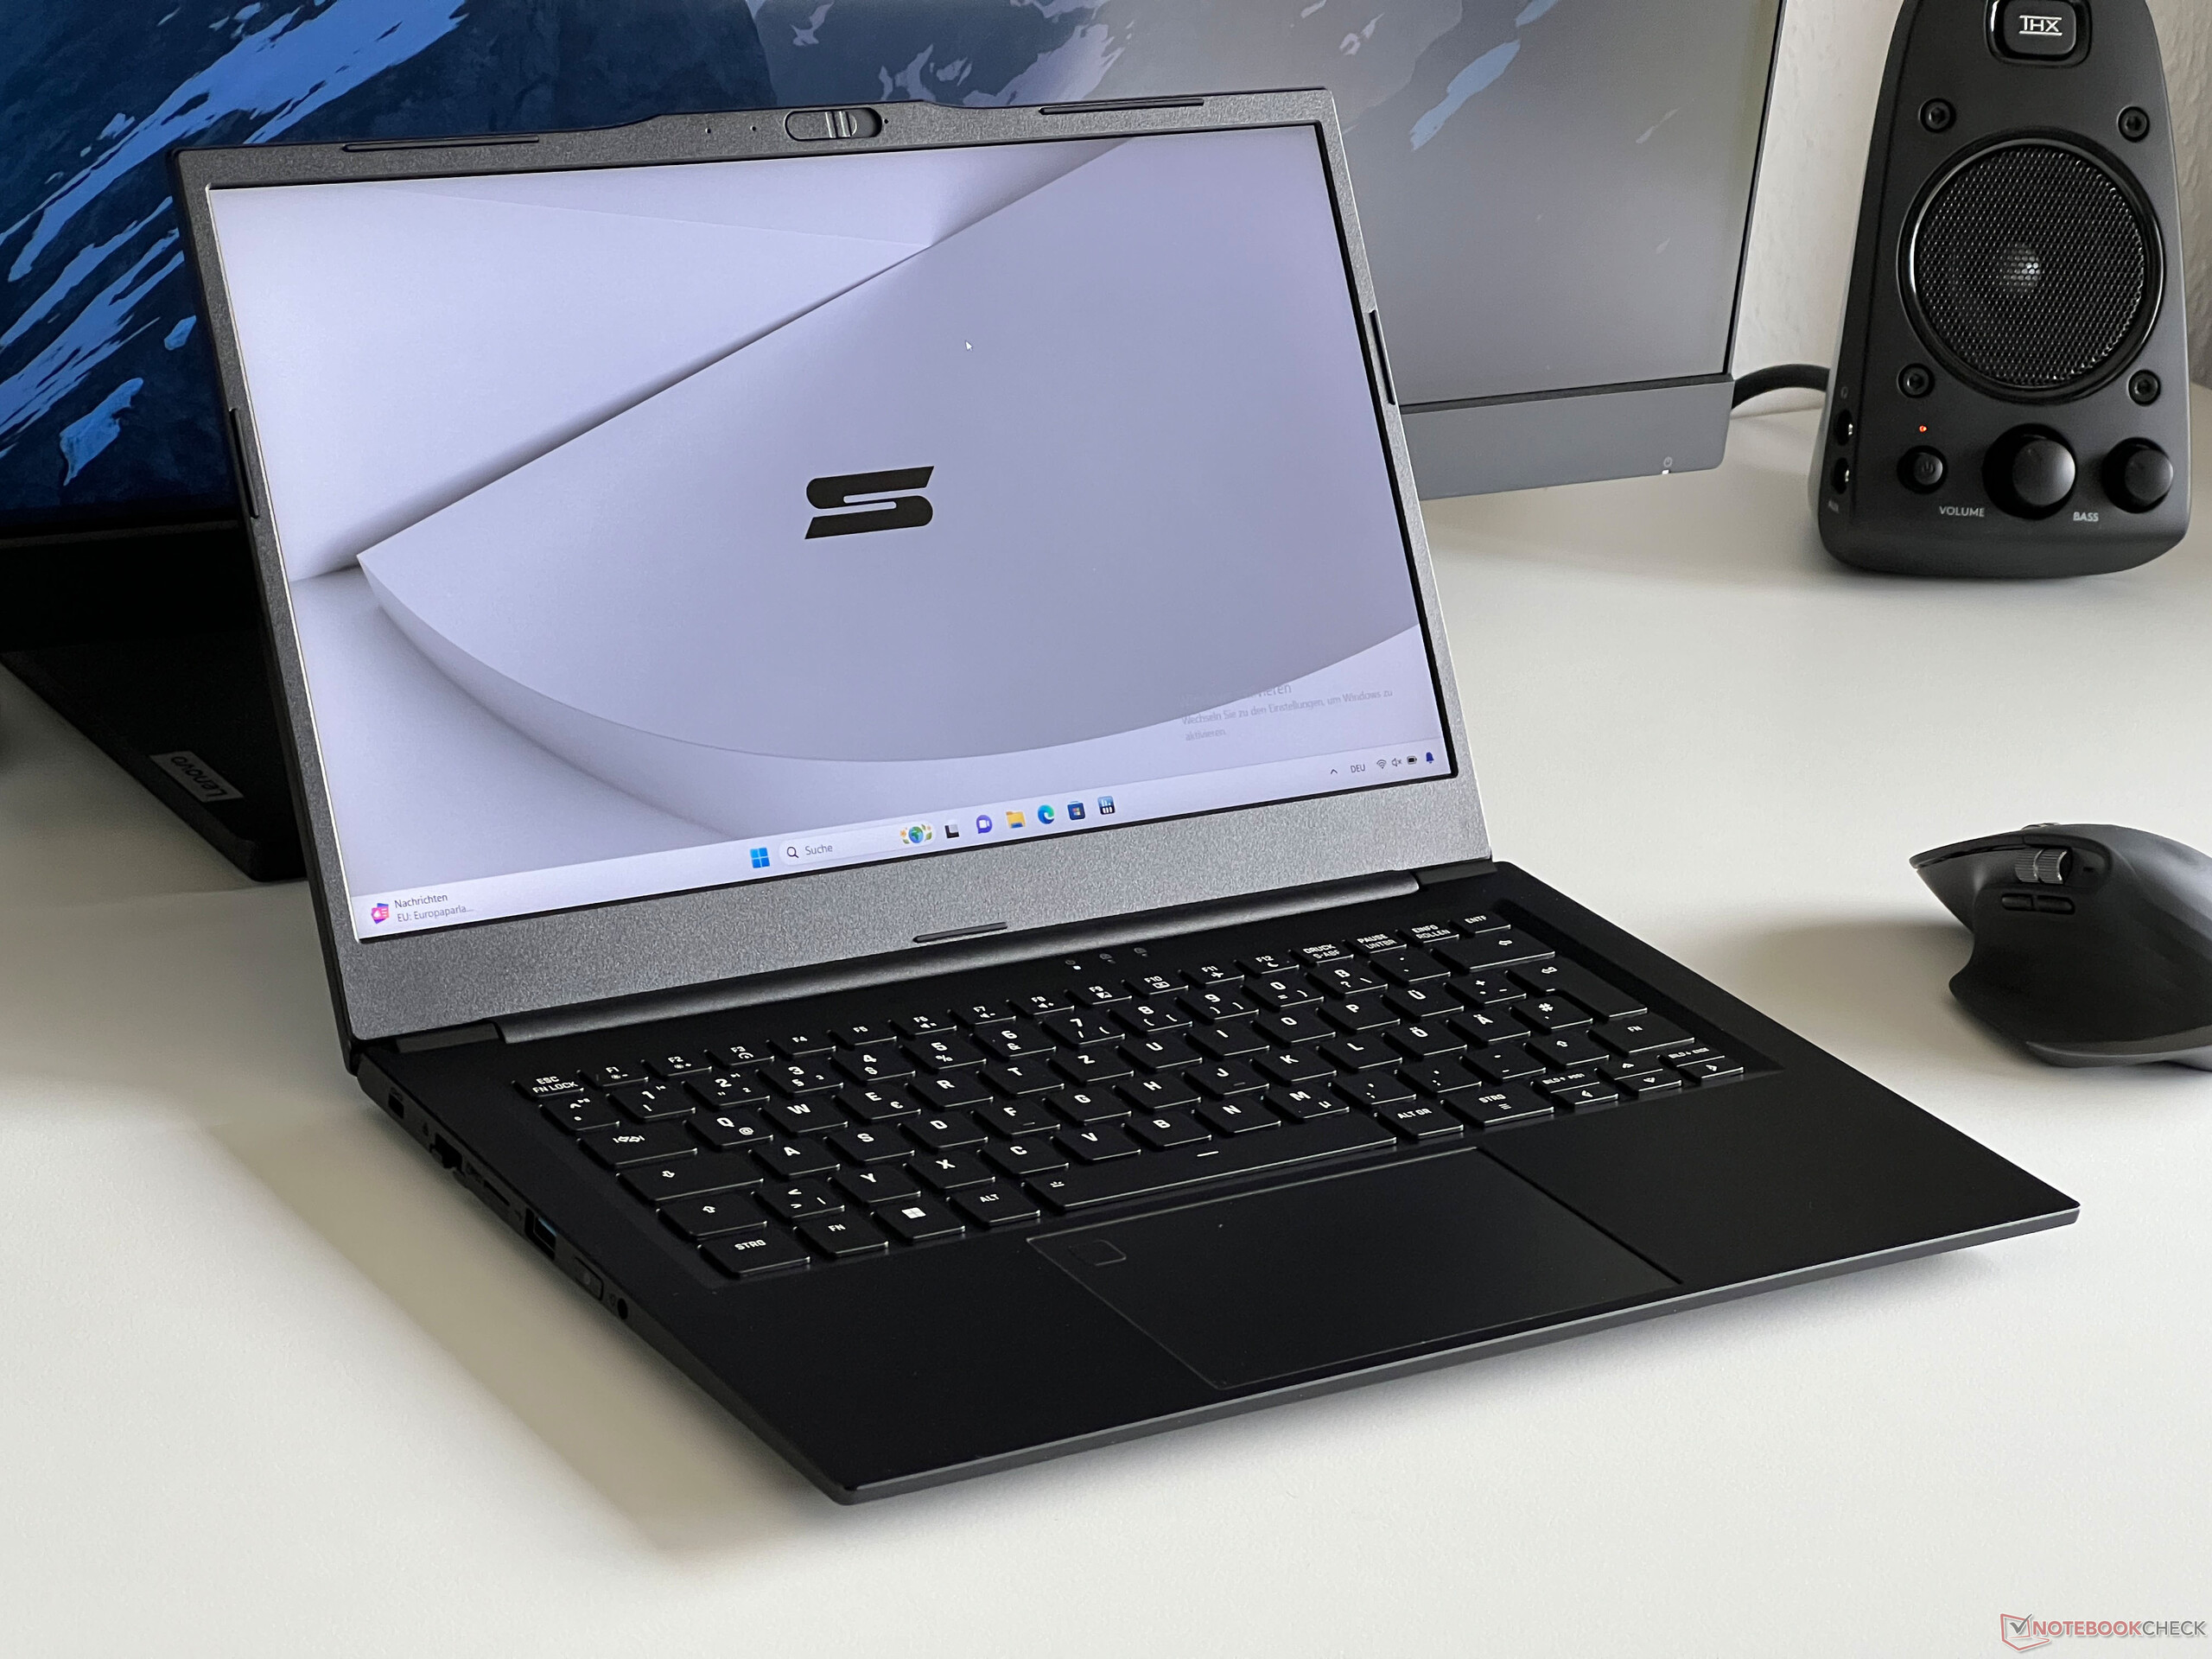
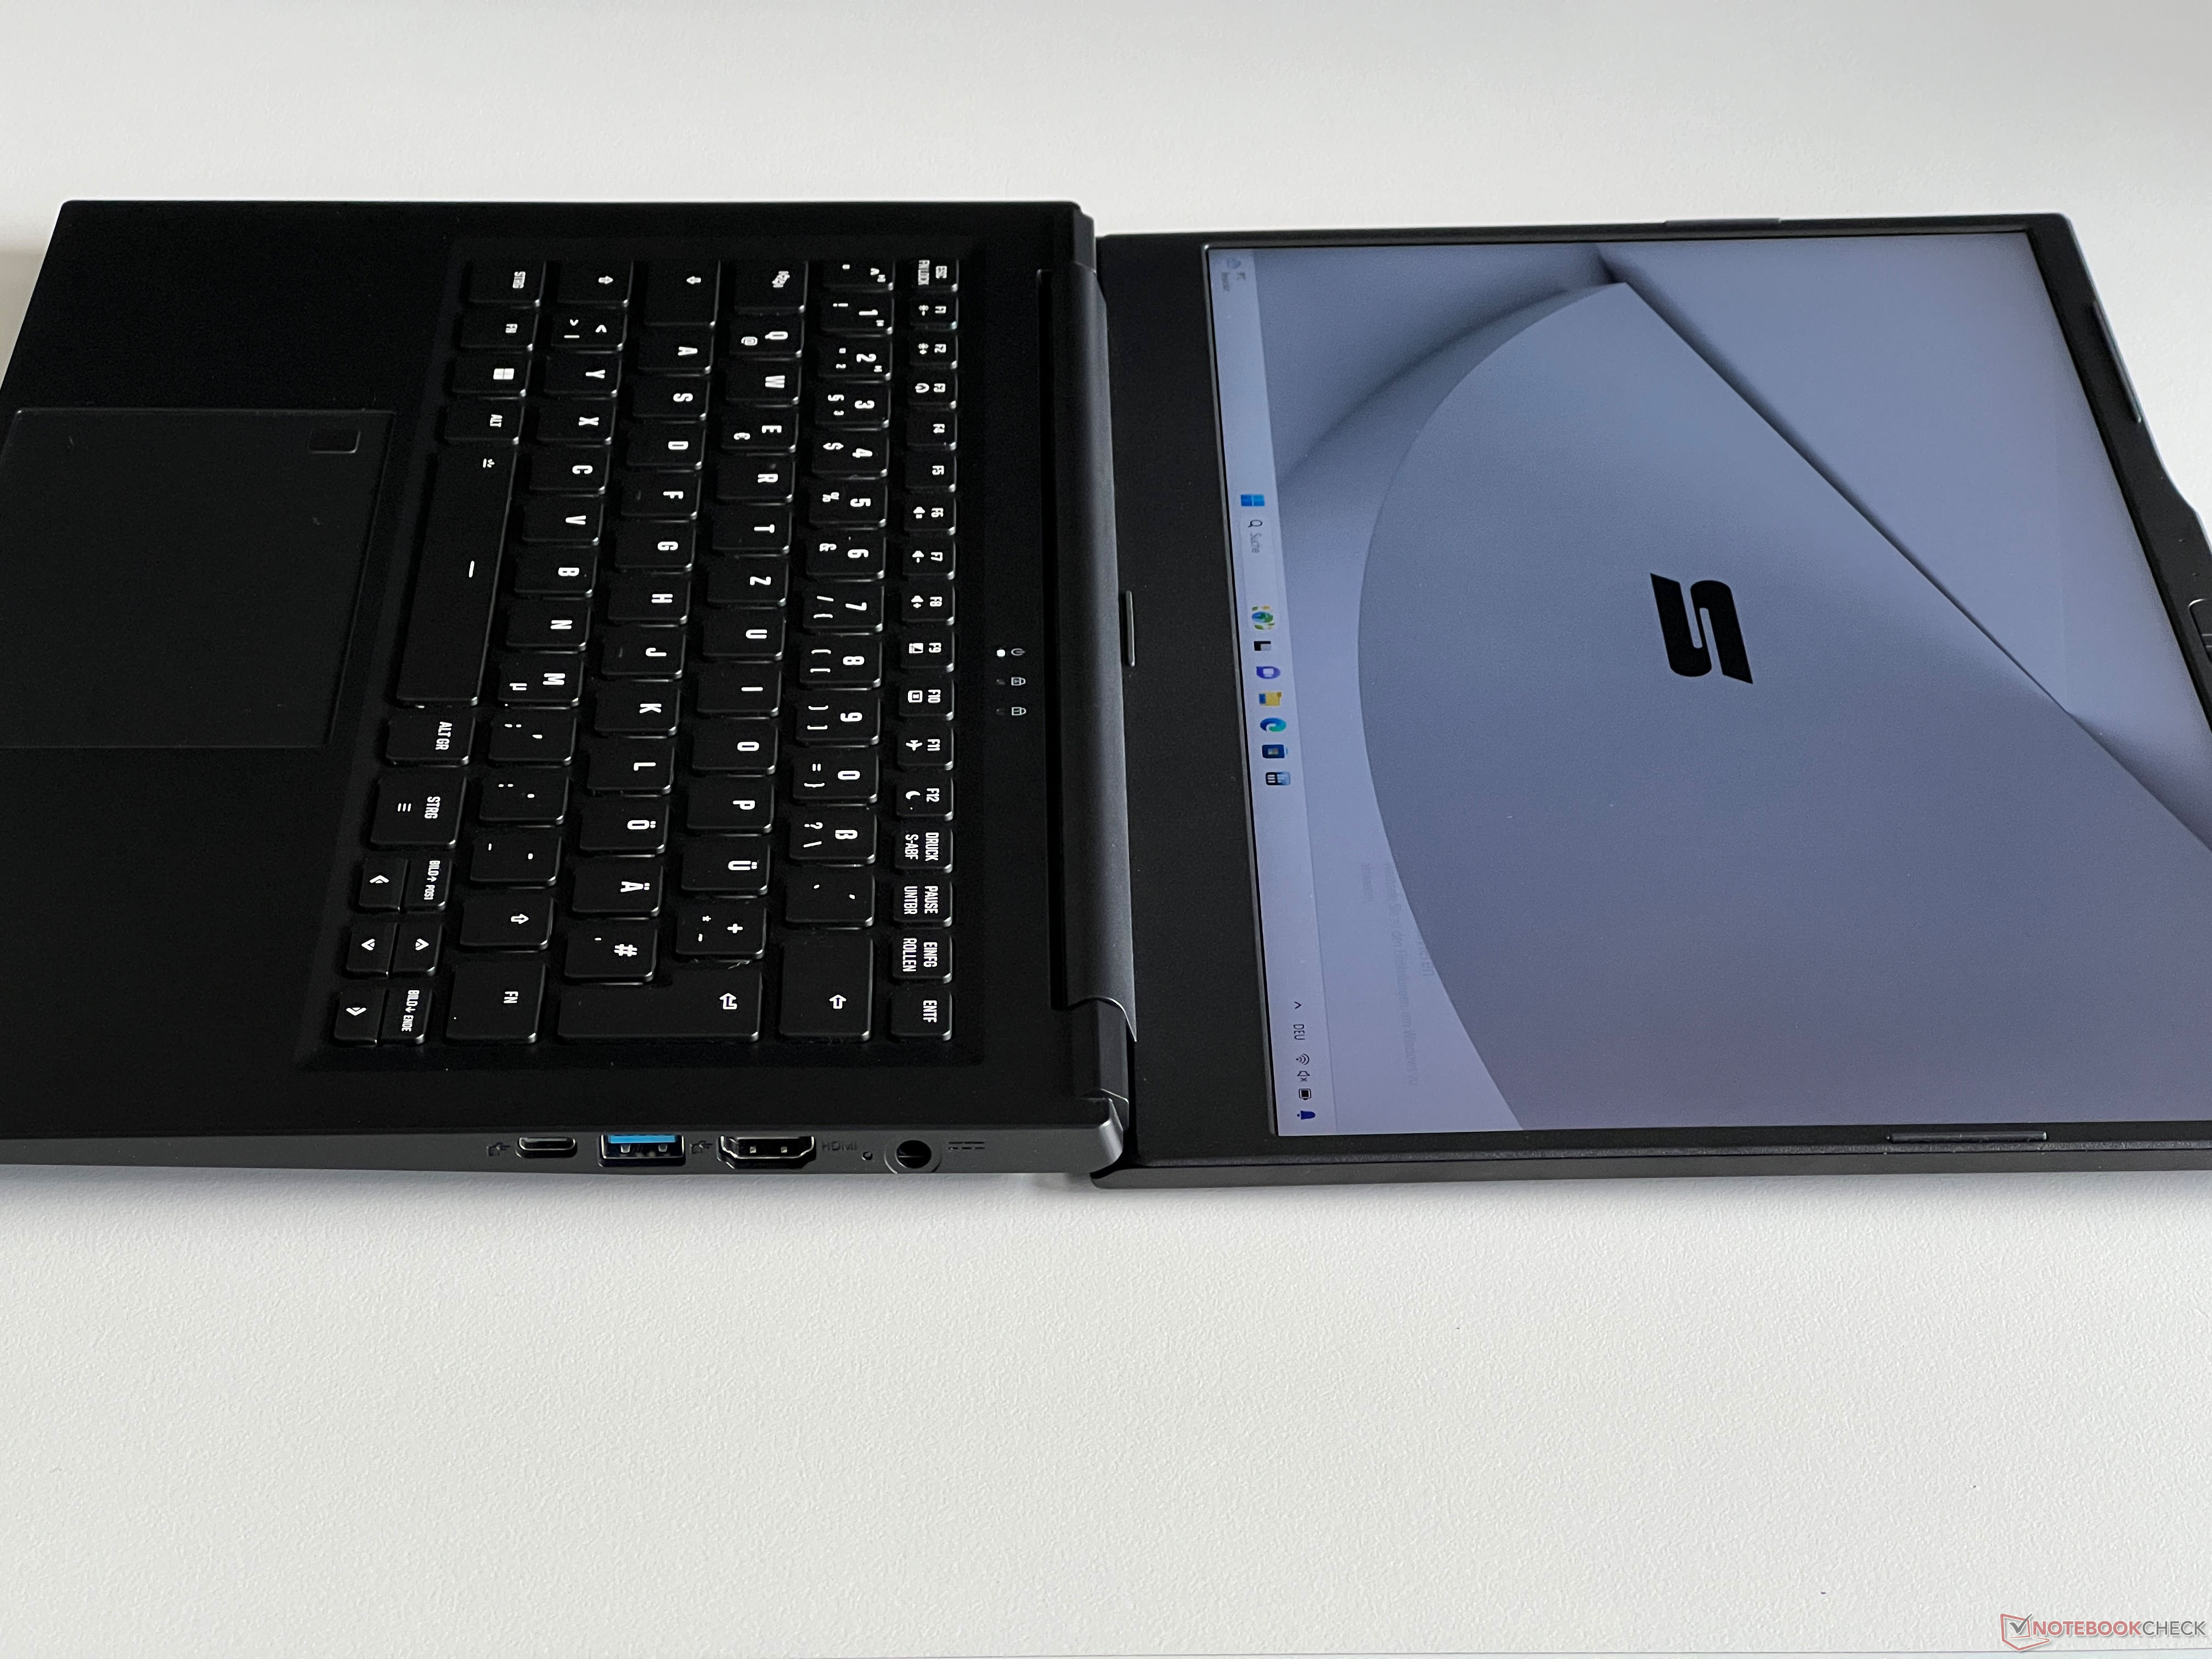
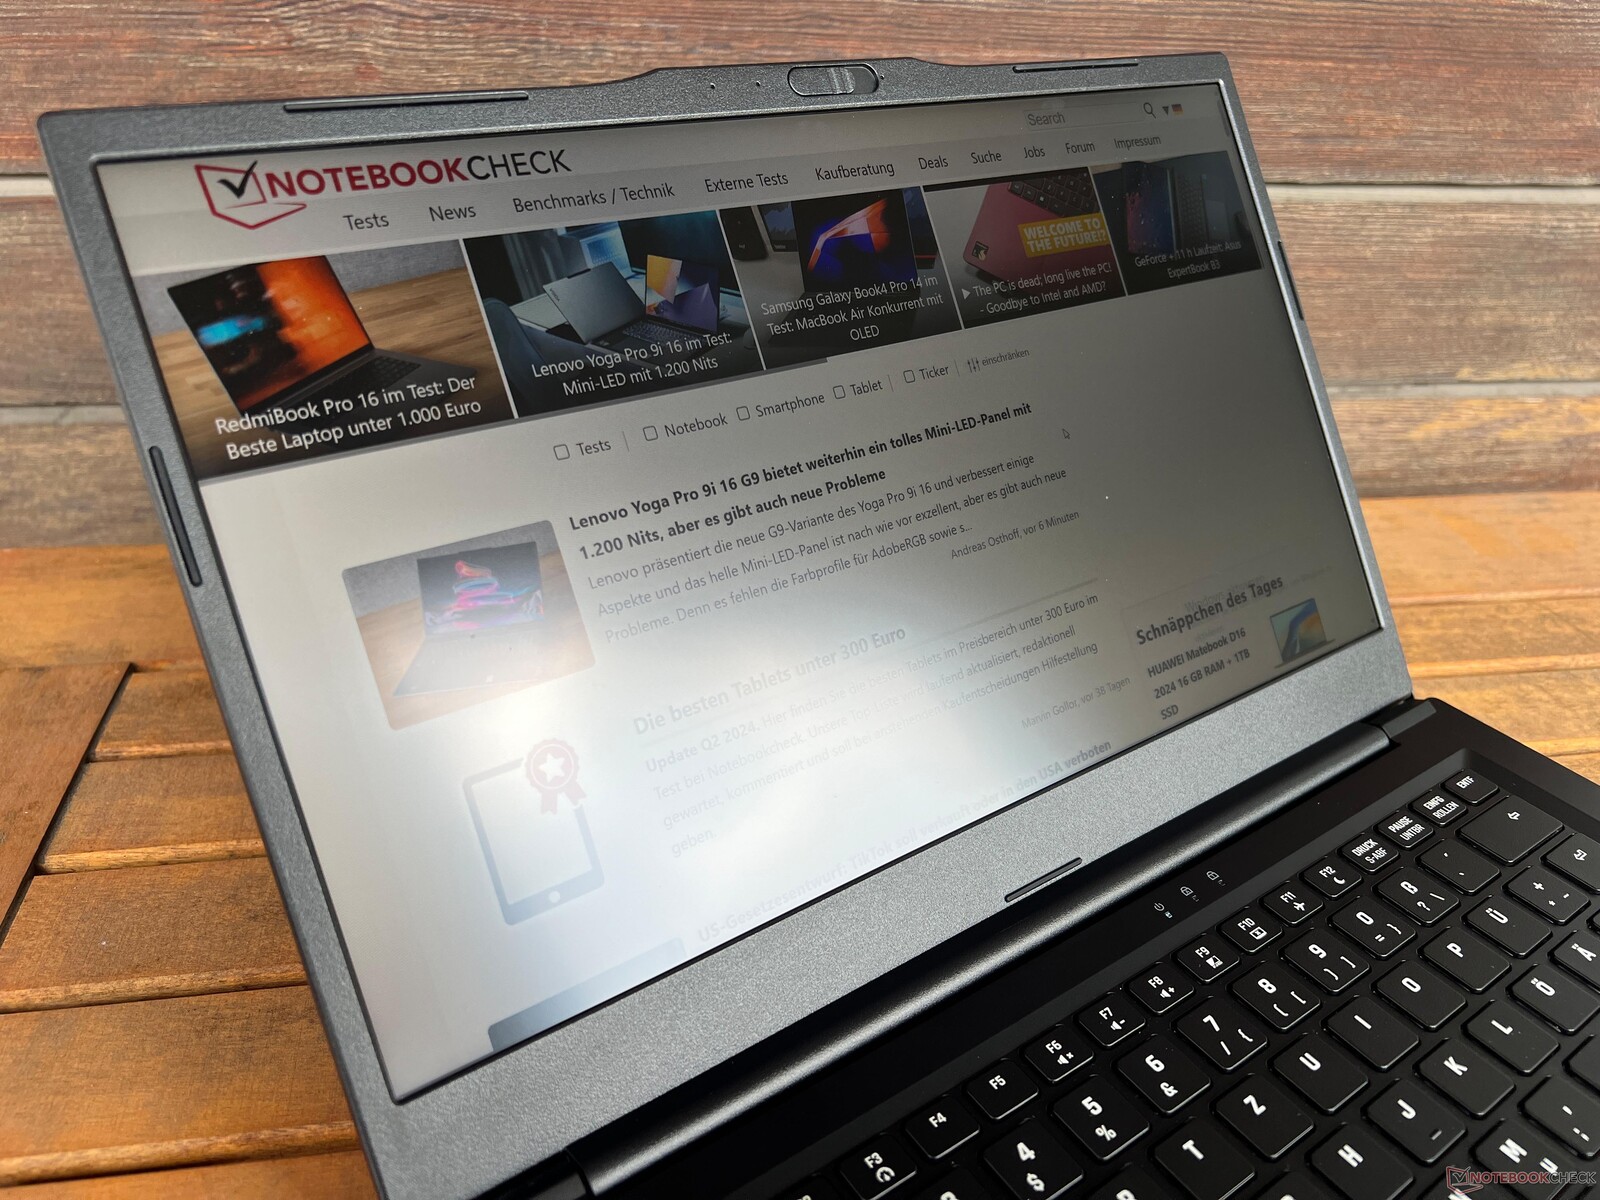
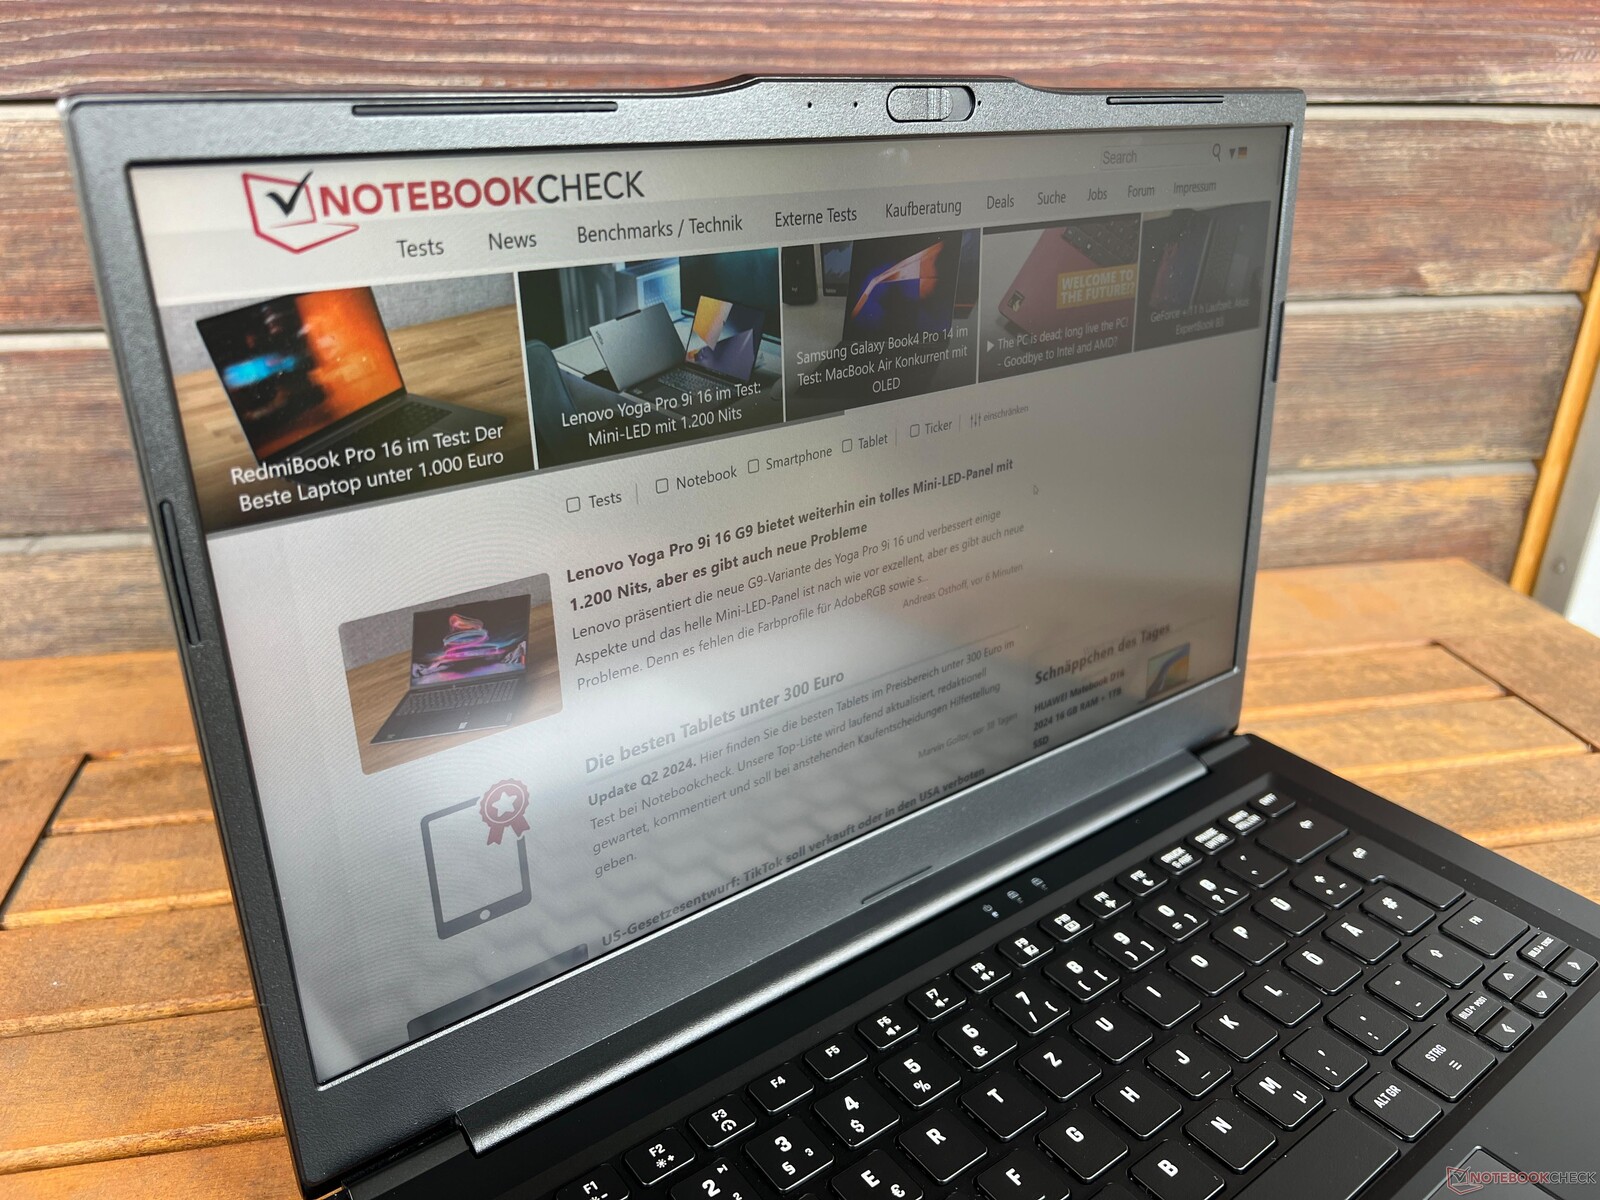
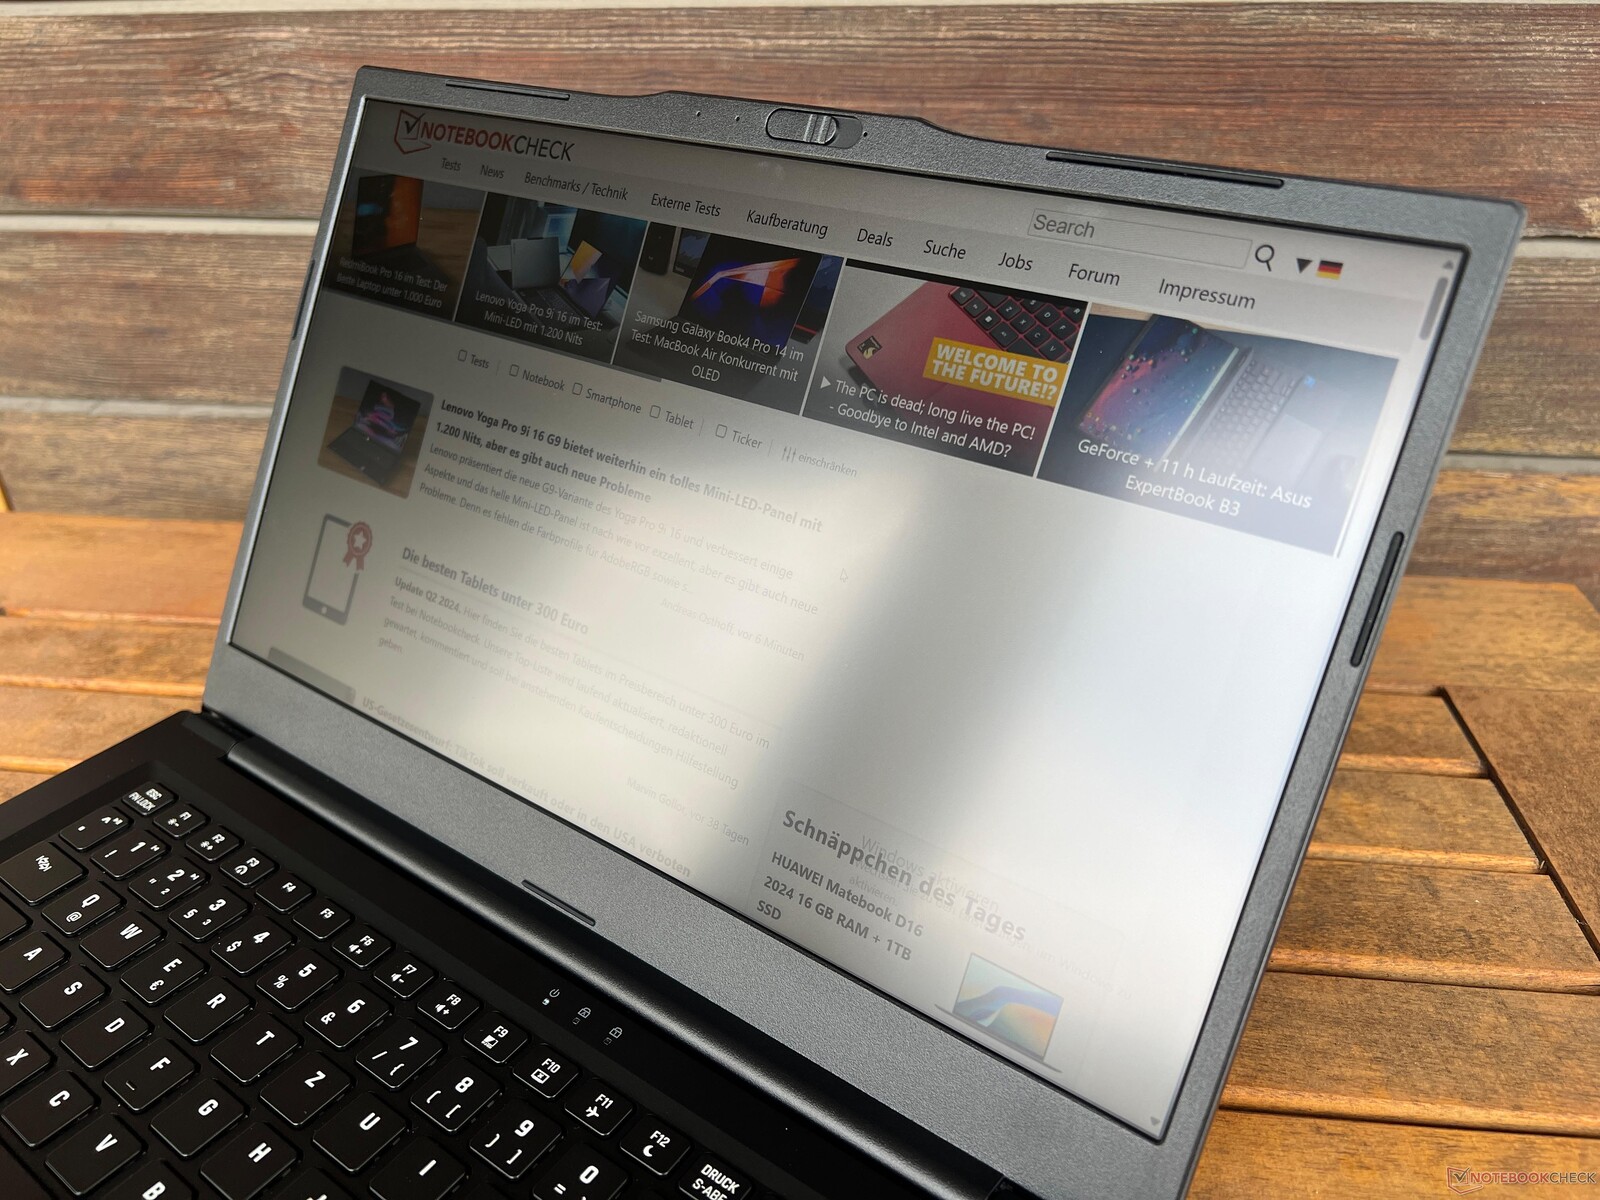
Work 14 Base siyah alüminyum bir kasa kullanıyor ve ilk bakışta oldukça yüksek kaliteli bir izlenim bırakıyor. Bununla birlikte, pürüzsüz yüzeyleri aşırı parmak izi mıknatısıdır ve sık sık temizlenmesi gerekir. Ek bir ücret karşılığında dizüstü bilgisayarı kapakta Schenker logosu olmadan alabilirsiniz. Pek de çekici olmayan kamera çıkıntısı sayesinde çok kolay çalışan kapağı açar açmaz, sizi kaba plastikten yapılmış, alt kısmı boyunca geniş bir çerçeveye sahip 16:9 bir panel karşılıyor. Bu artık özellikle modern görünmüyor. Sağlamlığı iyi, ancak dizüstü bilgisayarı döndürürken ve daha da önemlisi ekranı açarken (maksimum açılma açısı 180 derece) bazı hafif gıcırdama sesleri fark ettik.
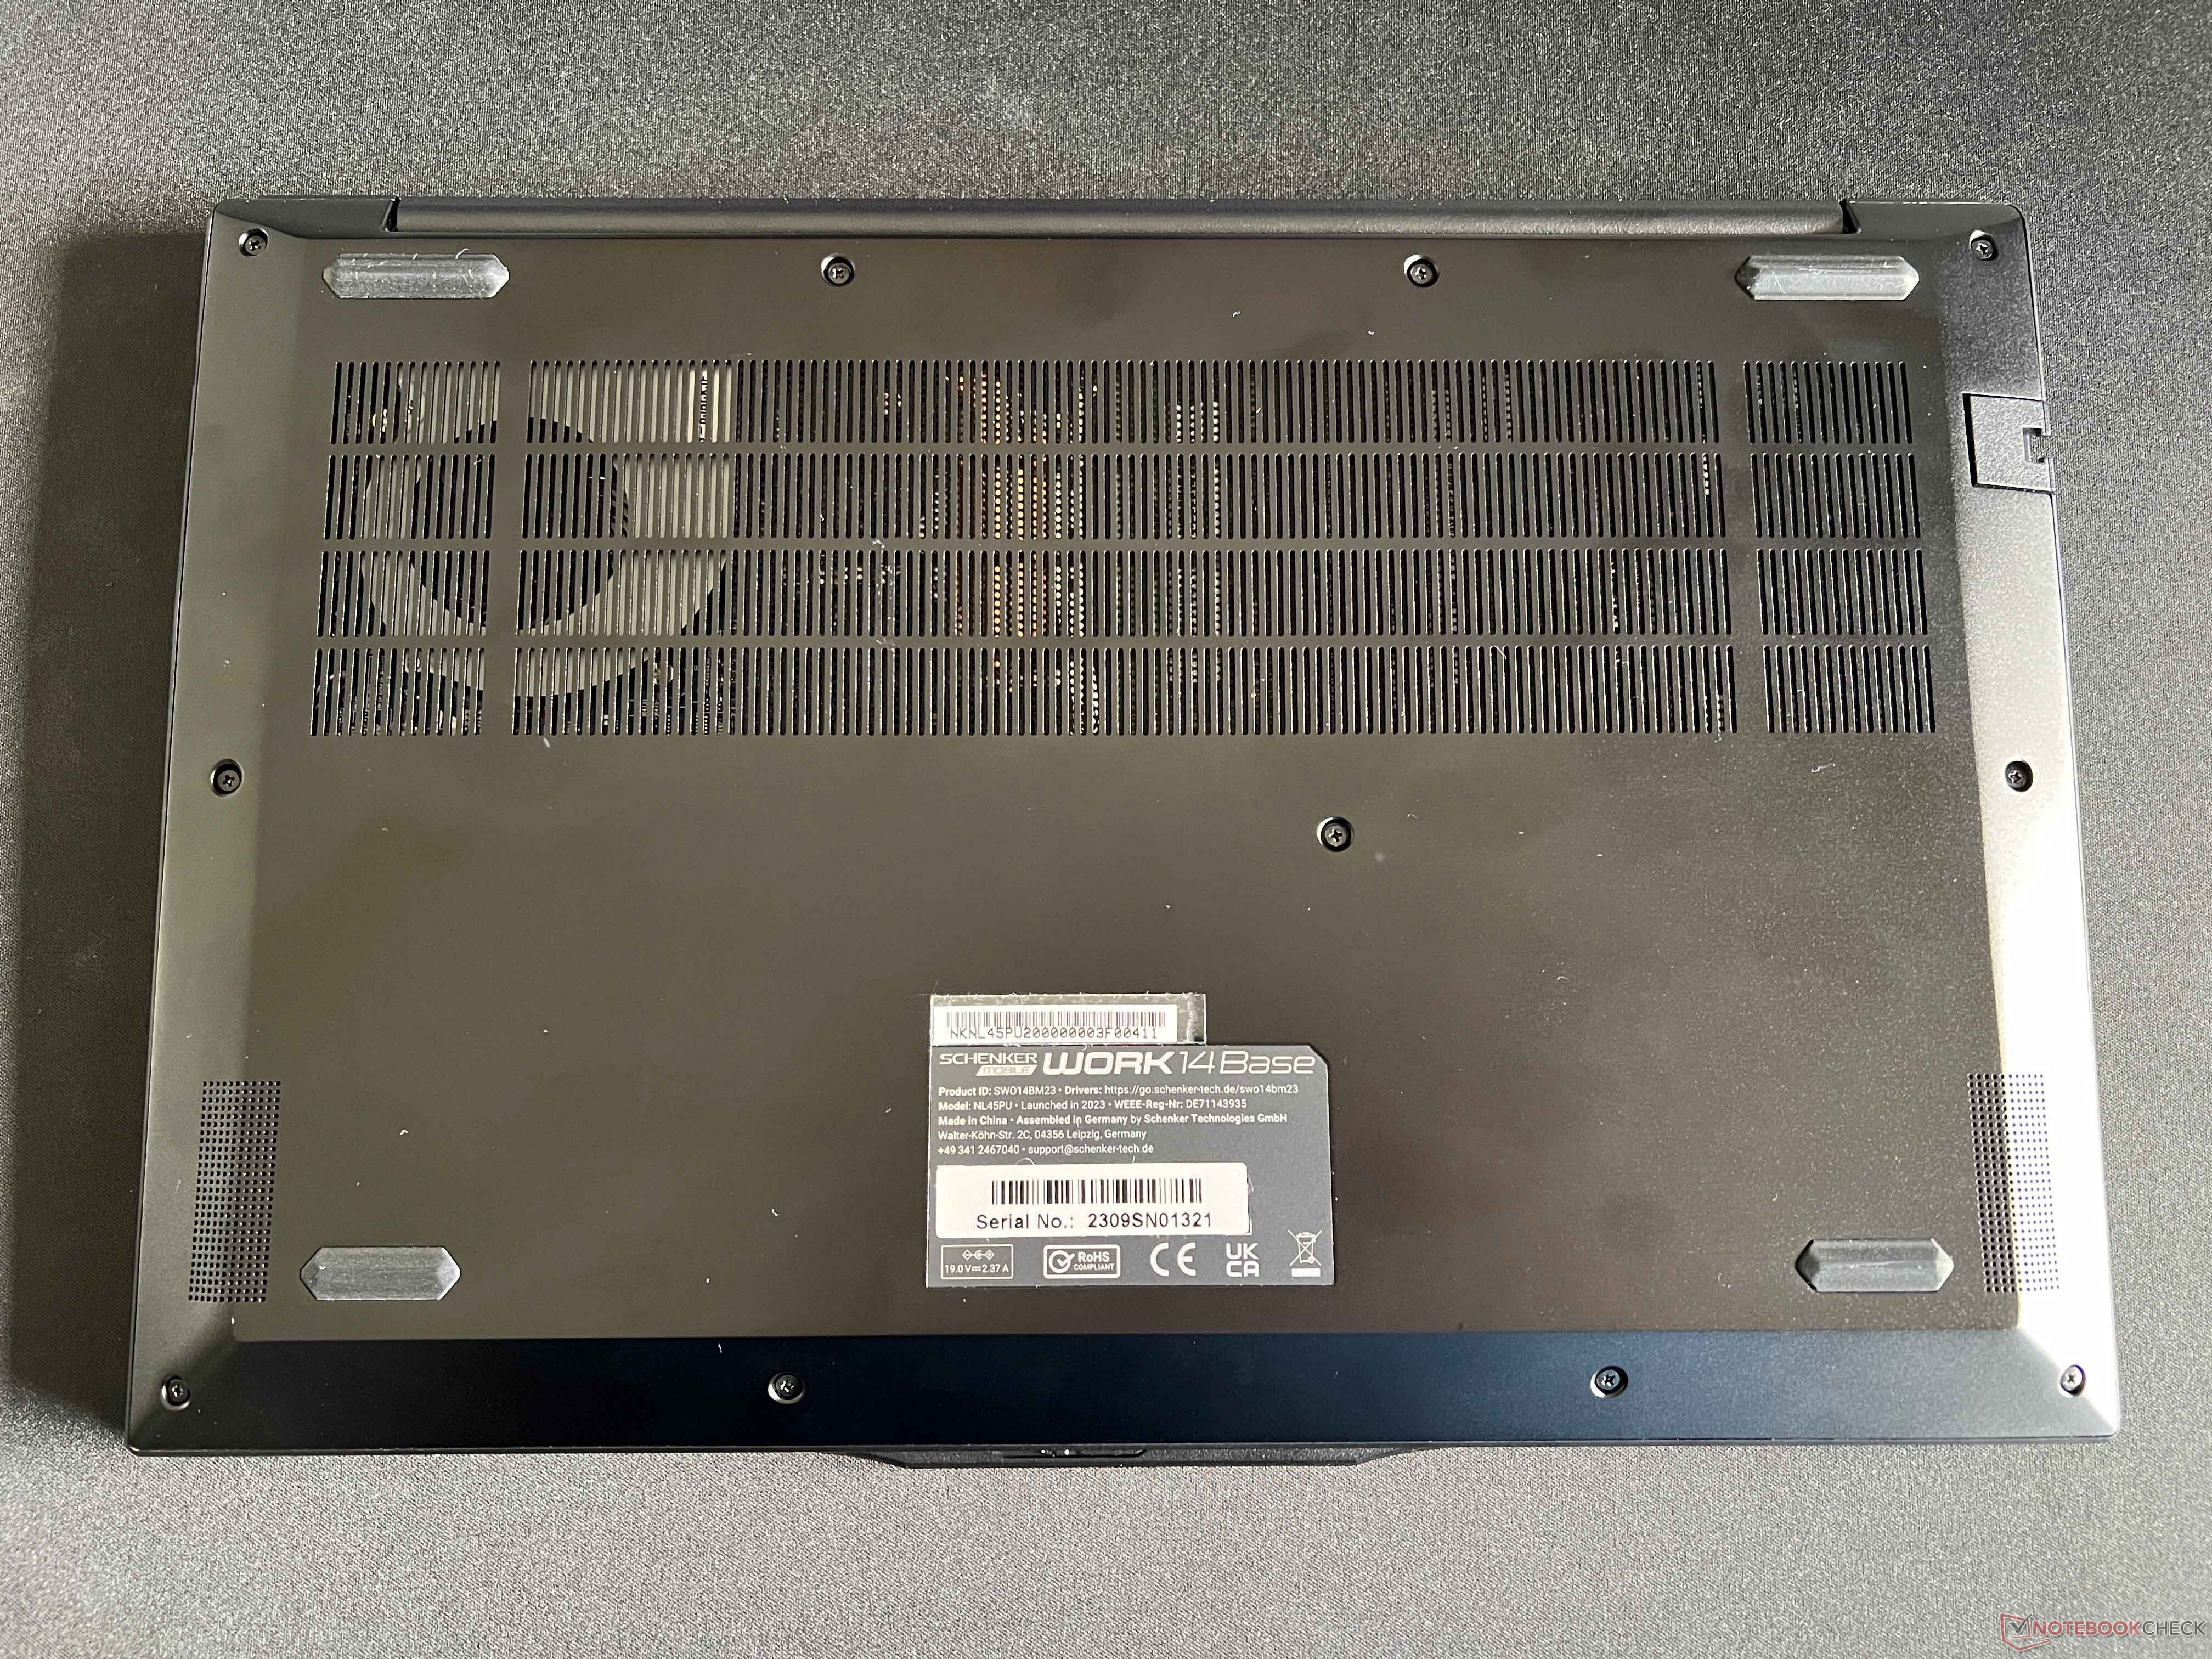
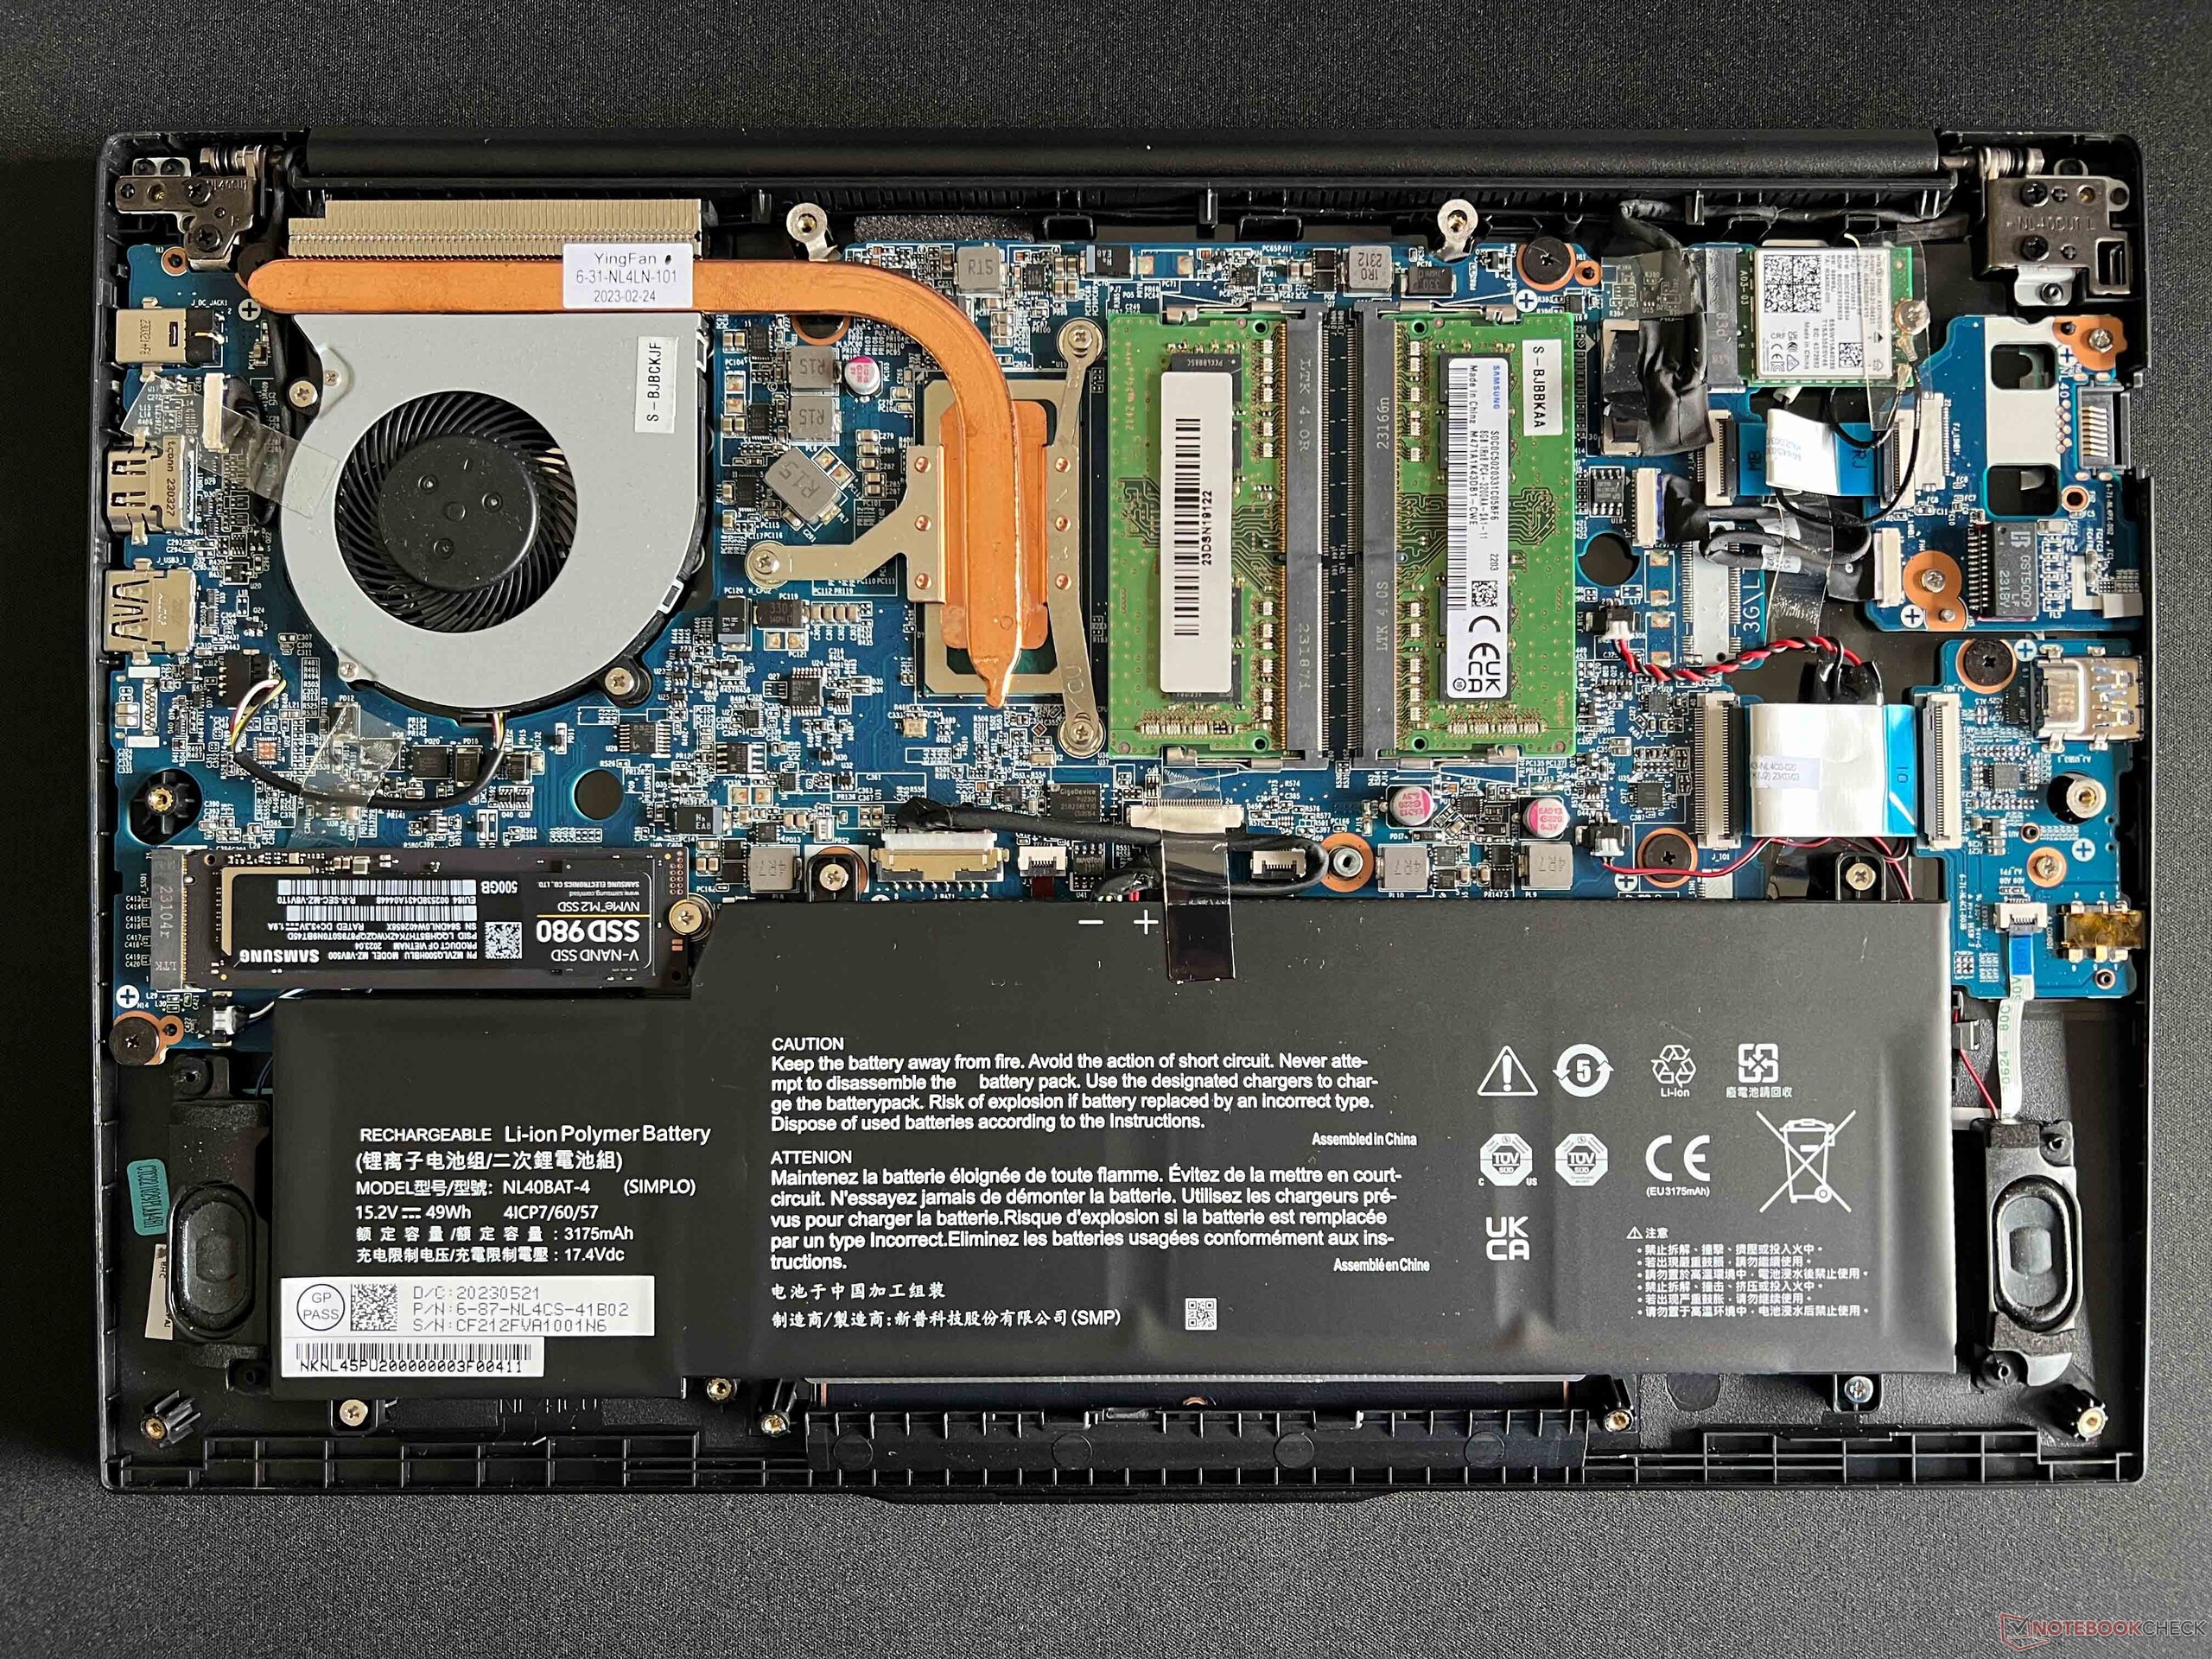
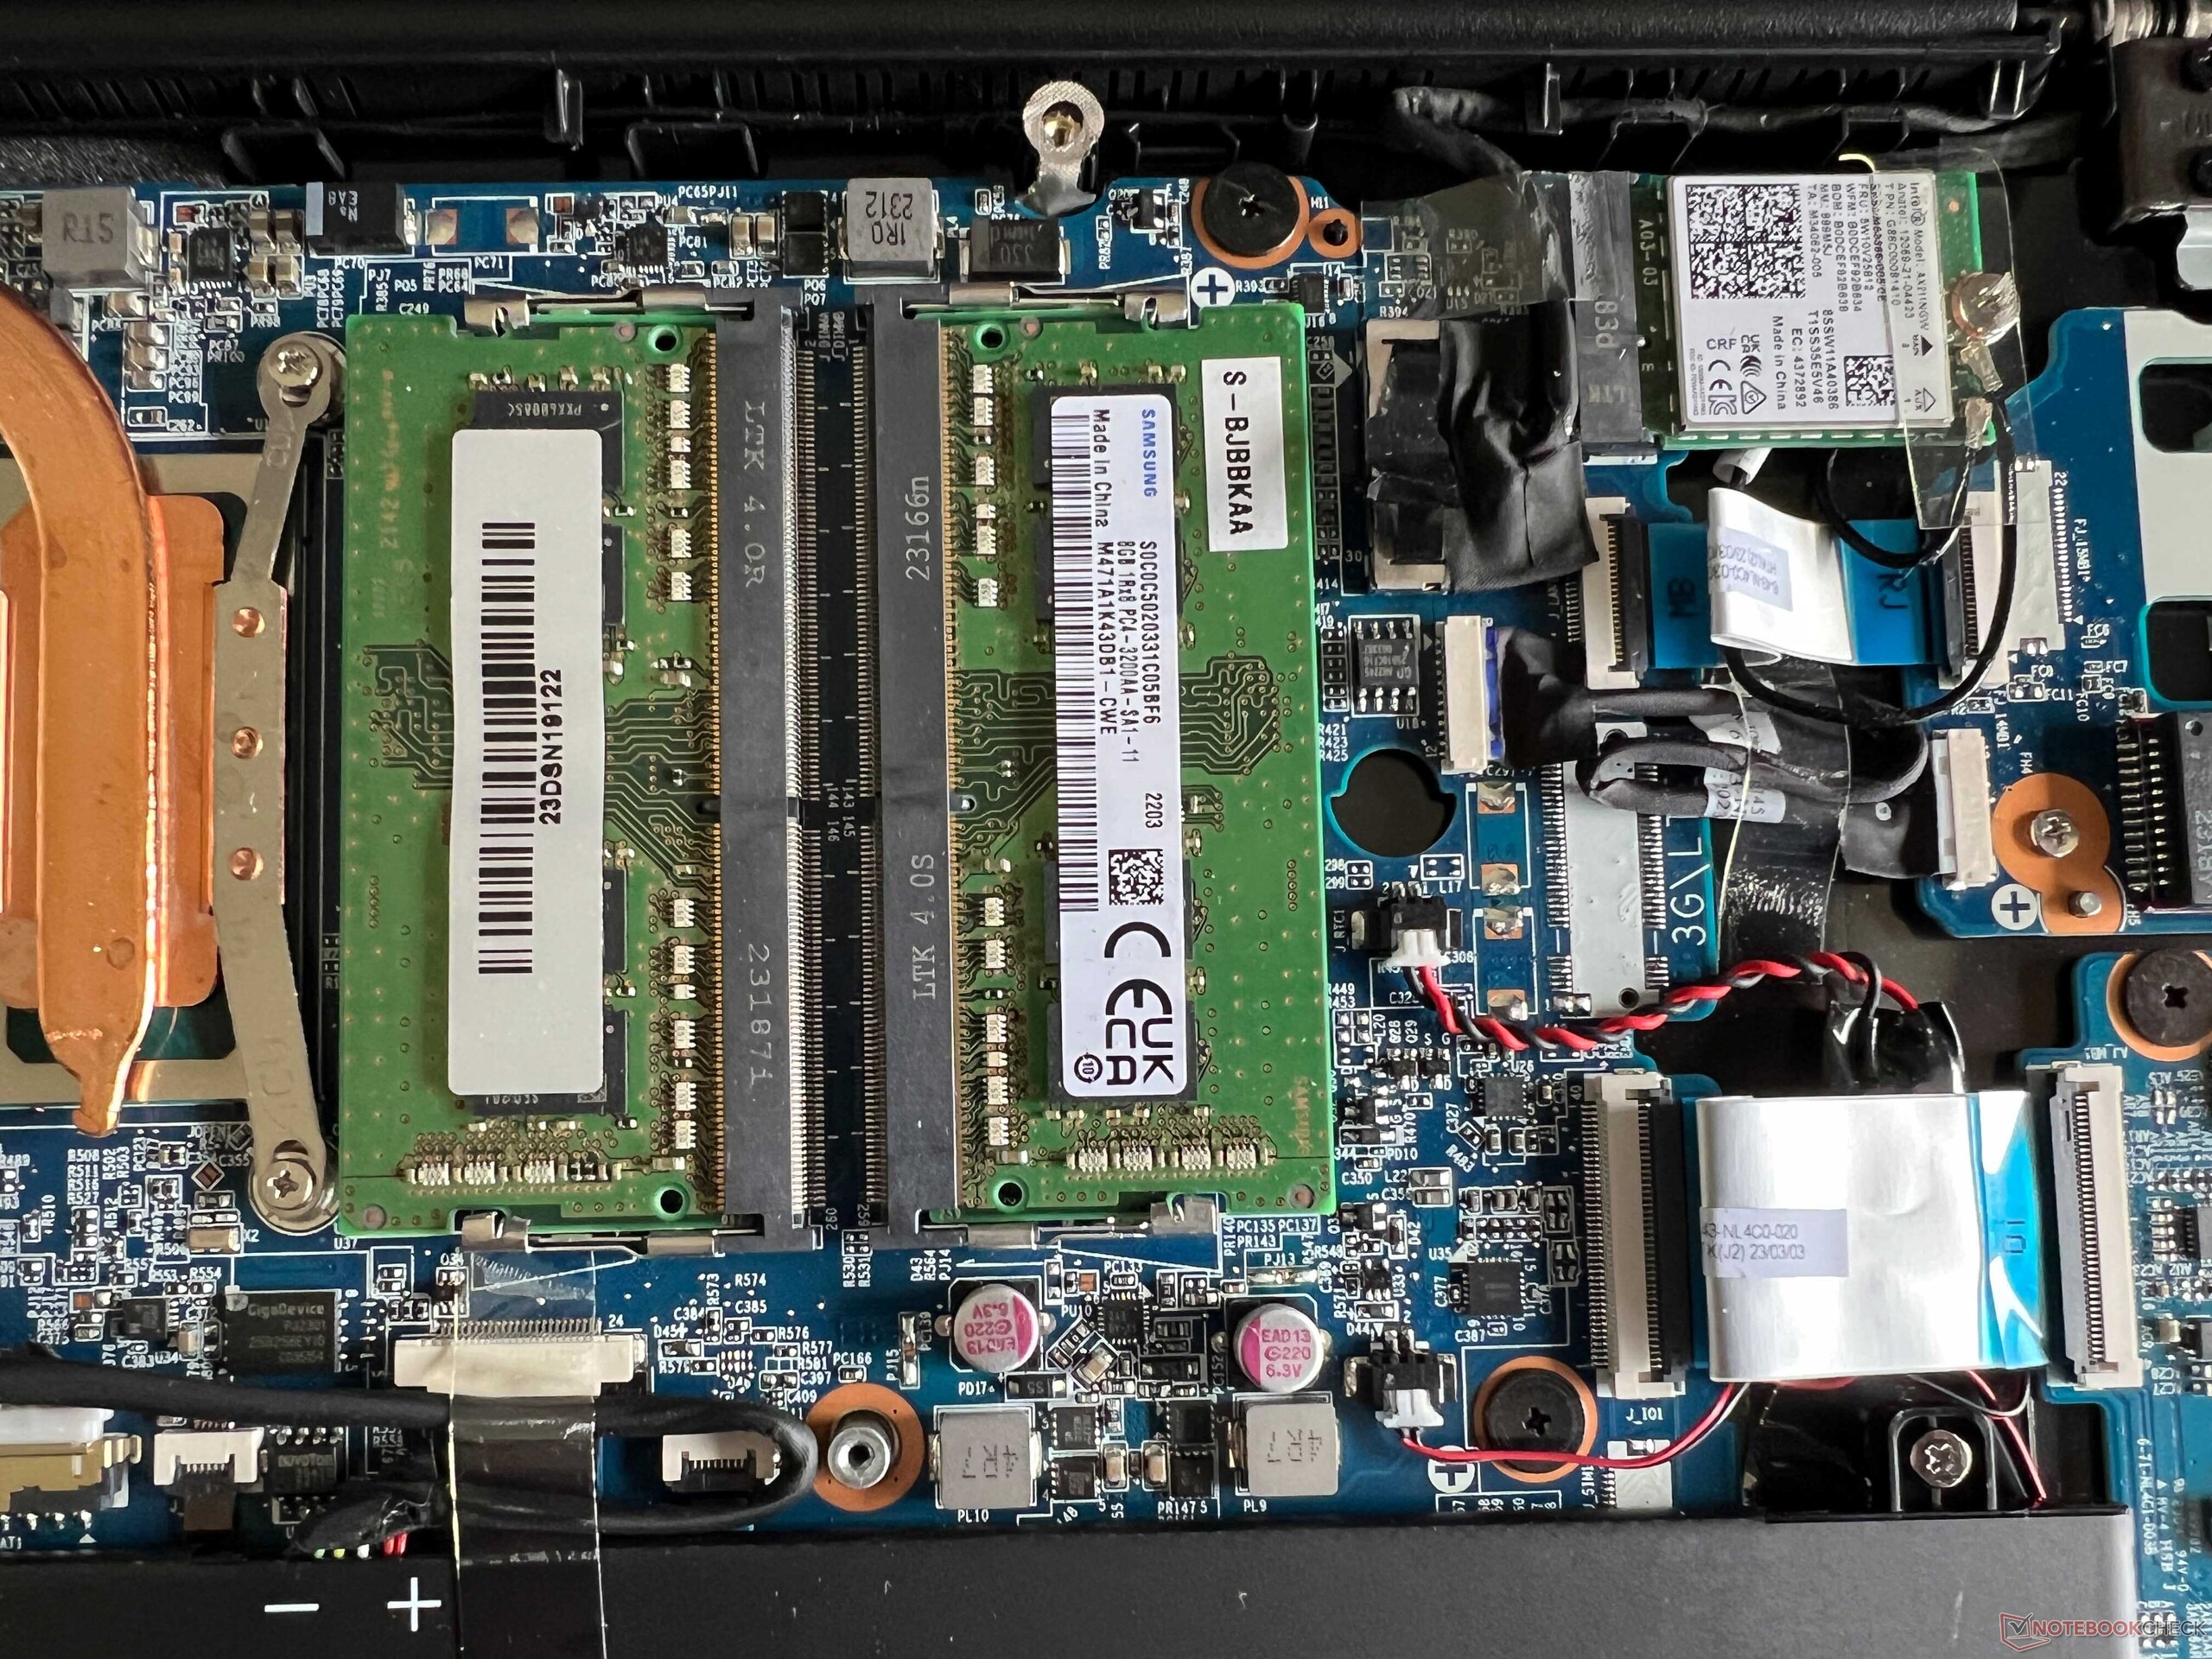
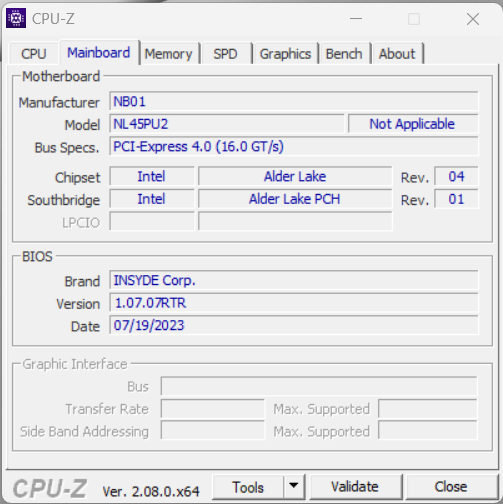
Alt kapak normal Philips vidalarla sabitlenmiş ve kolayca çıkarılabiliyor. Dizüstü bilgisayarın yükseltme seçenekleri mükemmel, çünkü iki RAM yuvası mevcut ve tabii ki SSD ve WLAN modelleri de yükseltilebiliyor. Bu cihaz aslında Intel'in oldukça modern bir WLAN modülü (AX211) ile donatılmıştır ve aktarım hızları da mükemmeldir.
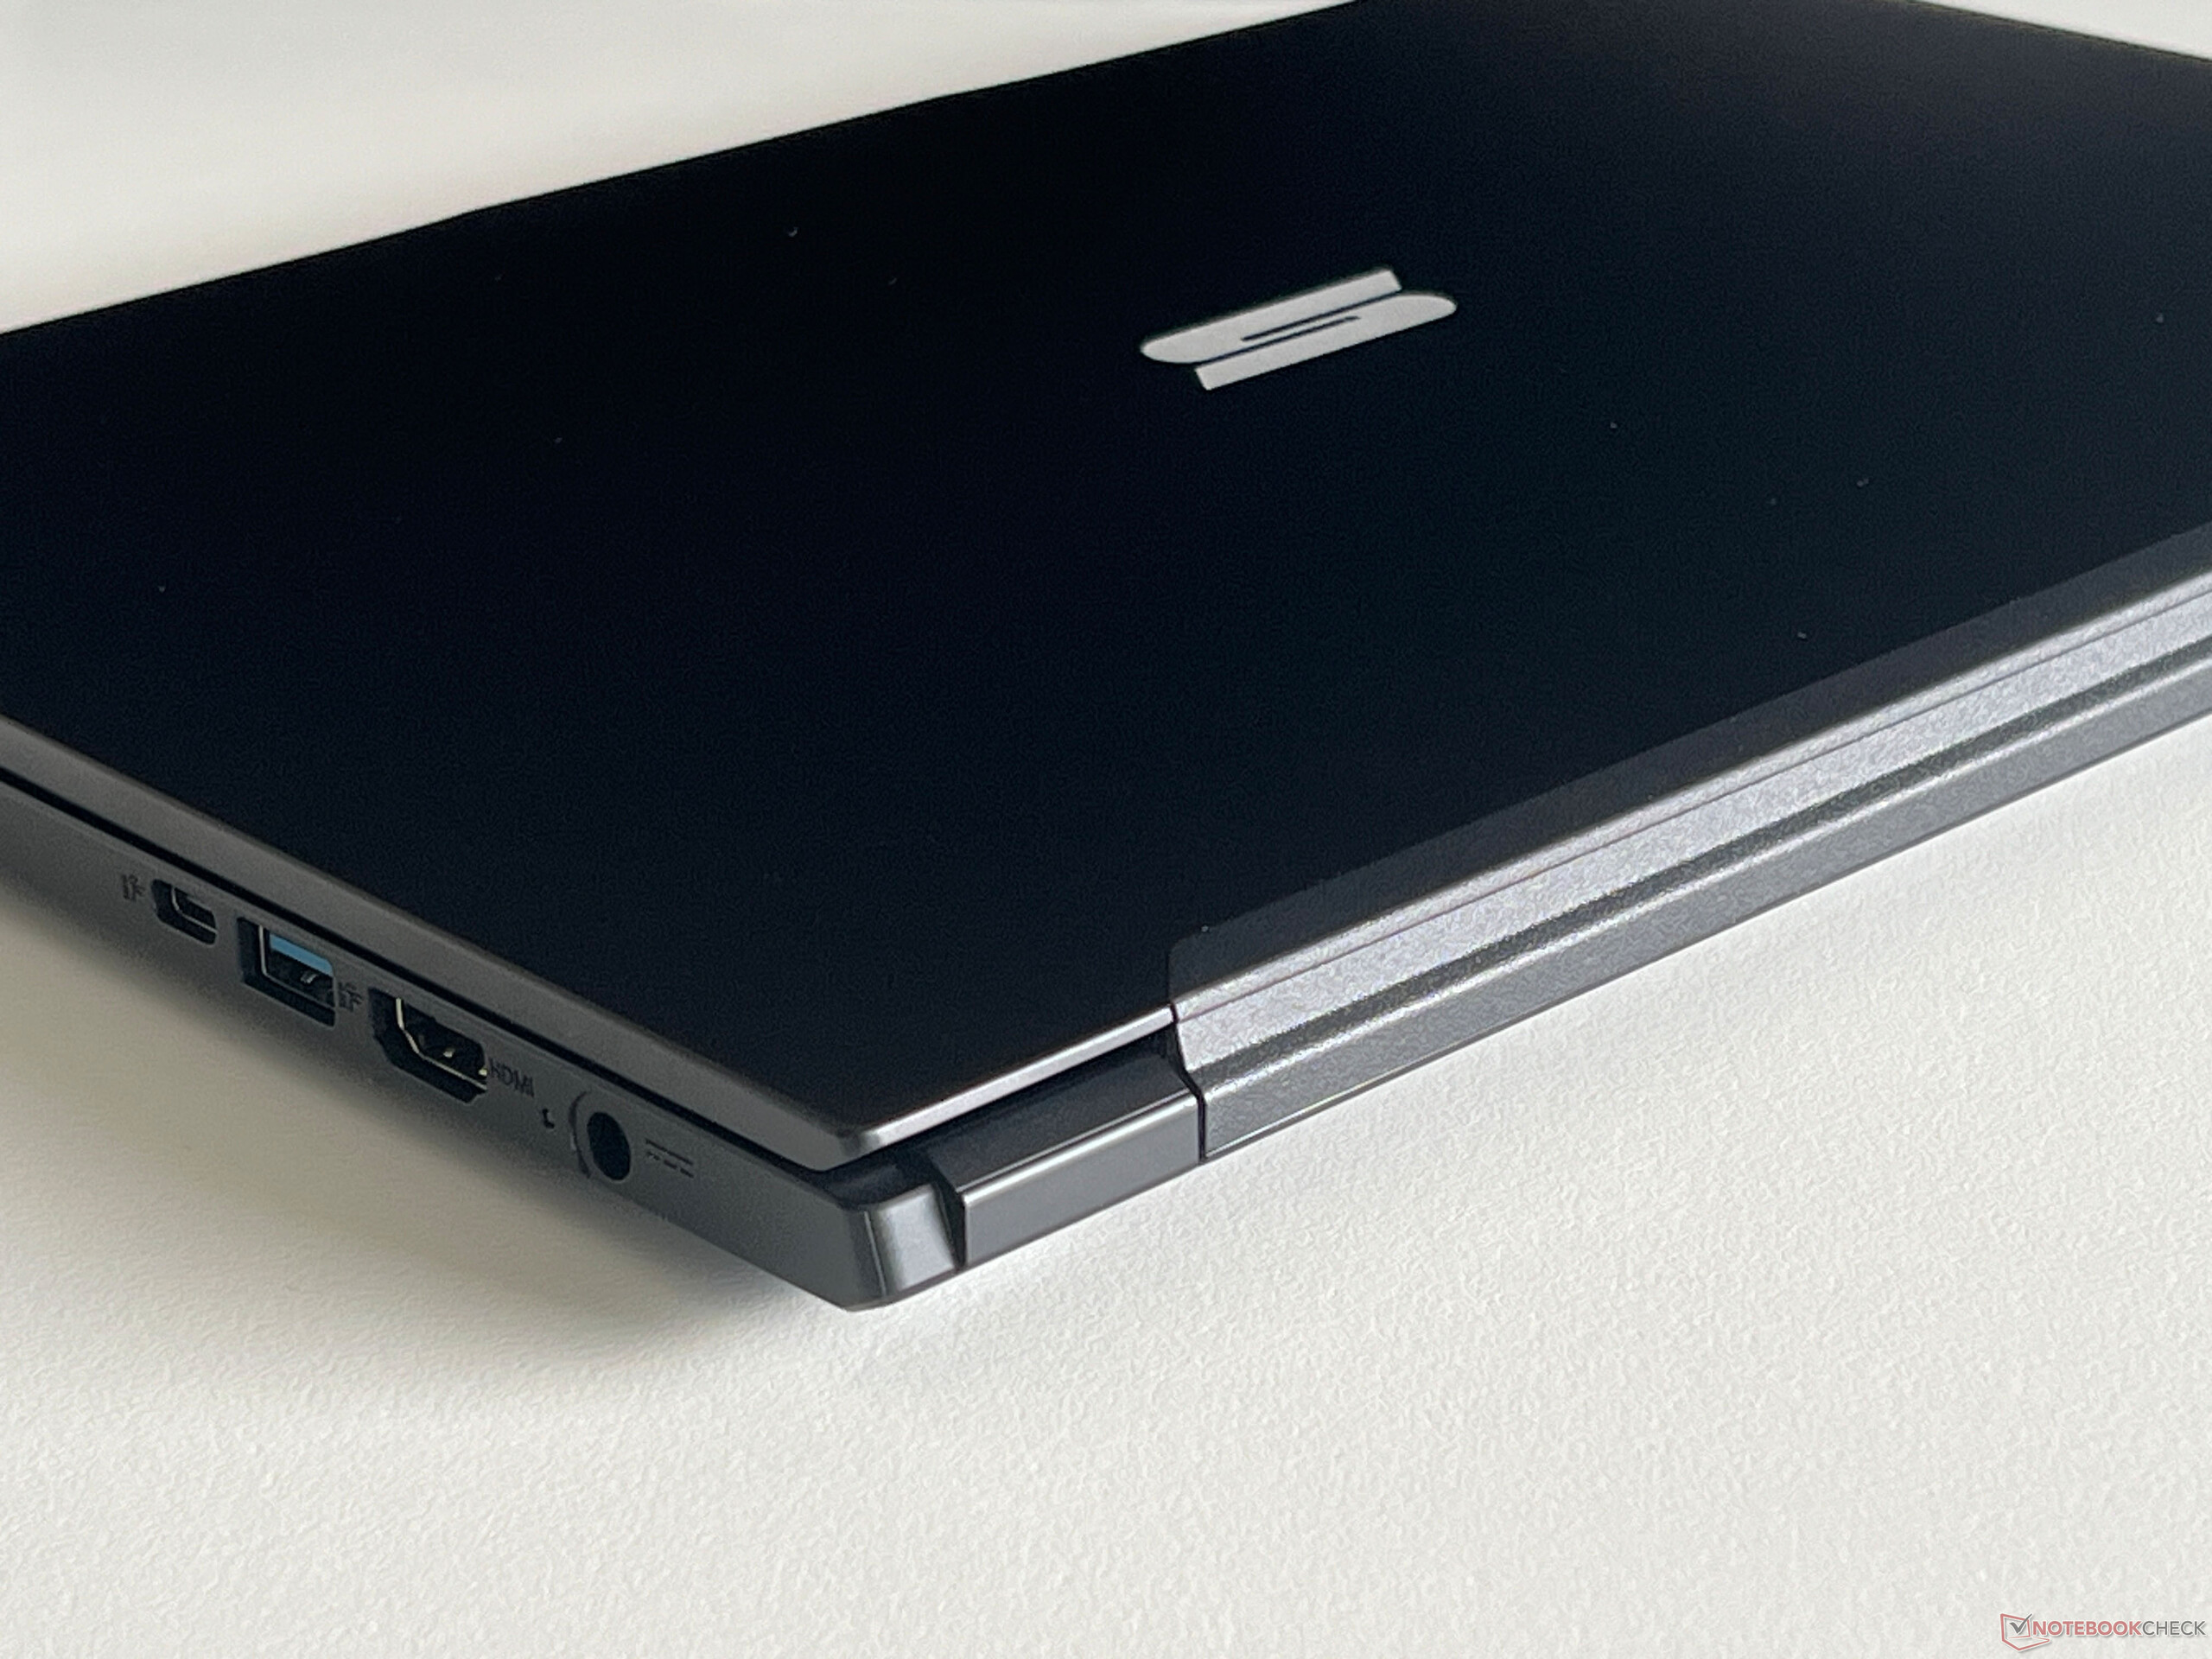
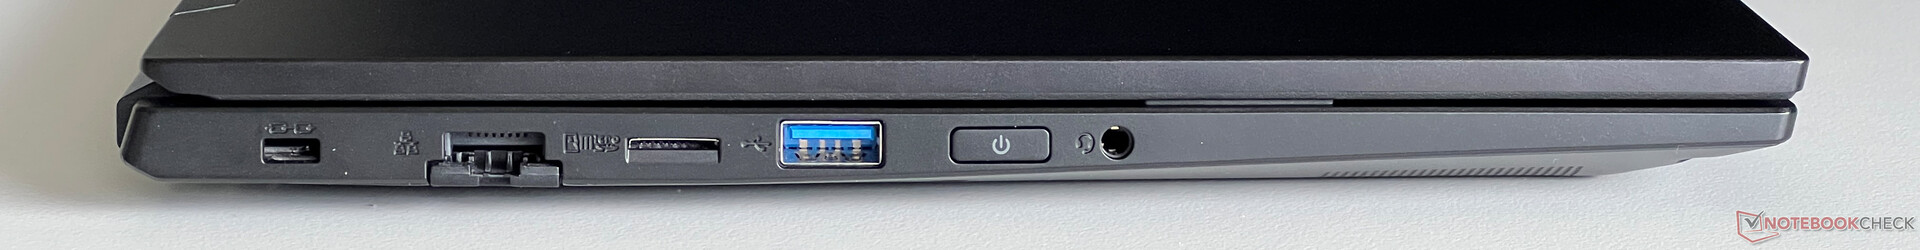
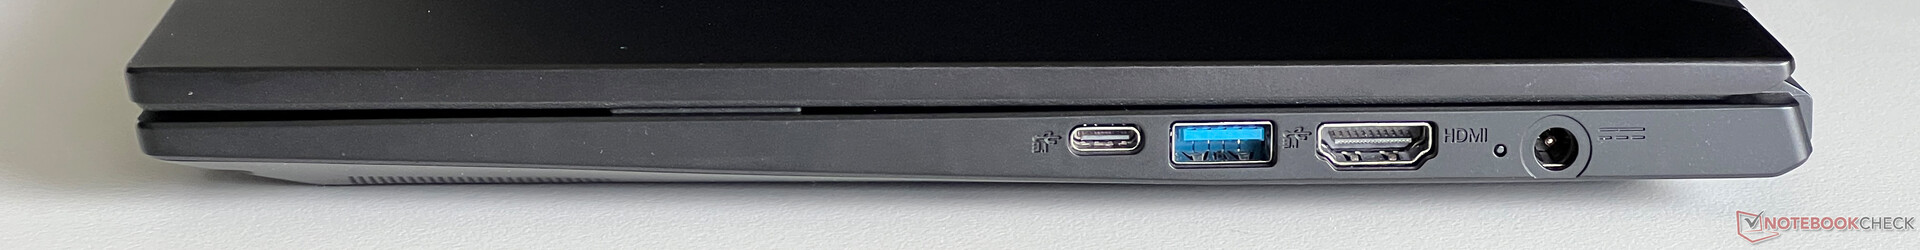
Bağlantı seçenekleri Work 14'ün güçlü yanlarından bir diğeridir. USB 4.0 ve Thunderbolt'tan yoksun olsanız da, yeterli USB bağlantısına sahip ve USB-C yerleştirme istasyonlarını da sorunsuz bir şekilde kullanabilirsiniz. Ayrıca, bir Gigabit Ethernet portuna sahiptir. Mekanik bir kapak içeren 1080p web kamerası ortalama görünümlü fotoğraflar çeker.
| SD Card Reader | |
| average JPG Copy Test (av. of 3 runs) | |
| Schenker Work 14 Base (Angelbird AV Pro V60) | |
| Lenovo ThinkPad L14 G4 21H6S00900 | |
| Sınıf ortalaması Office (19.8 - 198.5, n=22, son 2 yıl) | |
| Acer Swift Go 14 SFG14-71 | |
| maximum AS SSD Seq Read Test (1GB) | |
| Lenovo ThinkPad L14 G4 21H6S00900 (AV Pro V60) | |
| Schenker Work 14 Base (Angelbird AV Pro V60) | |
| Sınıf ortalaması Office (27.4 - 249, n=21, son 2 yıl) | |
| Acer Swift Go 14 SFG14-71 (AV Pro SD microSD 128 GB V60) | |
| Networking | |
| Schenker Work 14 Base | |
| iperf3 transmit AXE11000 | |
| iperf3 receive AXE11000 | |
| Acer Swift Go 14 SFG14-71 | |
| iperf3 transmit AXE11000 | |
| iperf3 receive AXE11000 | |
| iperf3 transmit AXE11000 6GHz | |
| iperf3 receive AXE11000 6GHz | |
| HP ProBook 445 G10 | |
| iperf3 transmit AXE11000 | |
| iperf3 receive AXE11000 | |
| Dell Latitude 3440 | |
| iperf3 transmit AXE11000 | |
| iperf3 receive AXE11000 | |
| iperf3 transmit AXE11000 6GHz | |
| iperf3 receive AXE11000 6GHz | |
| Lenovo ThinkPad L14 G4 21H6S00900 | |
| iperf3 transmit AXE11000 | |
| iperf3 receive AXE11000 | |
| iperf3 transmit AXE11000 6GHz | |
| iperf3 receive AXE11000 6GHz | |

")
")
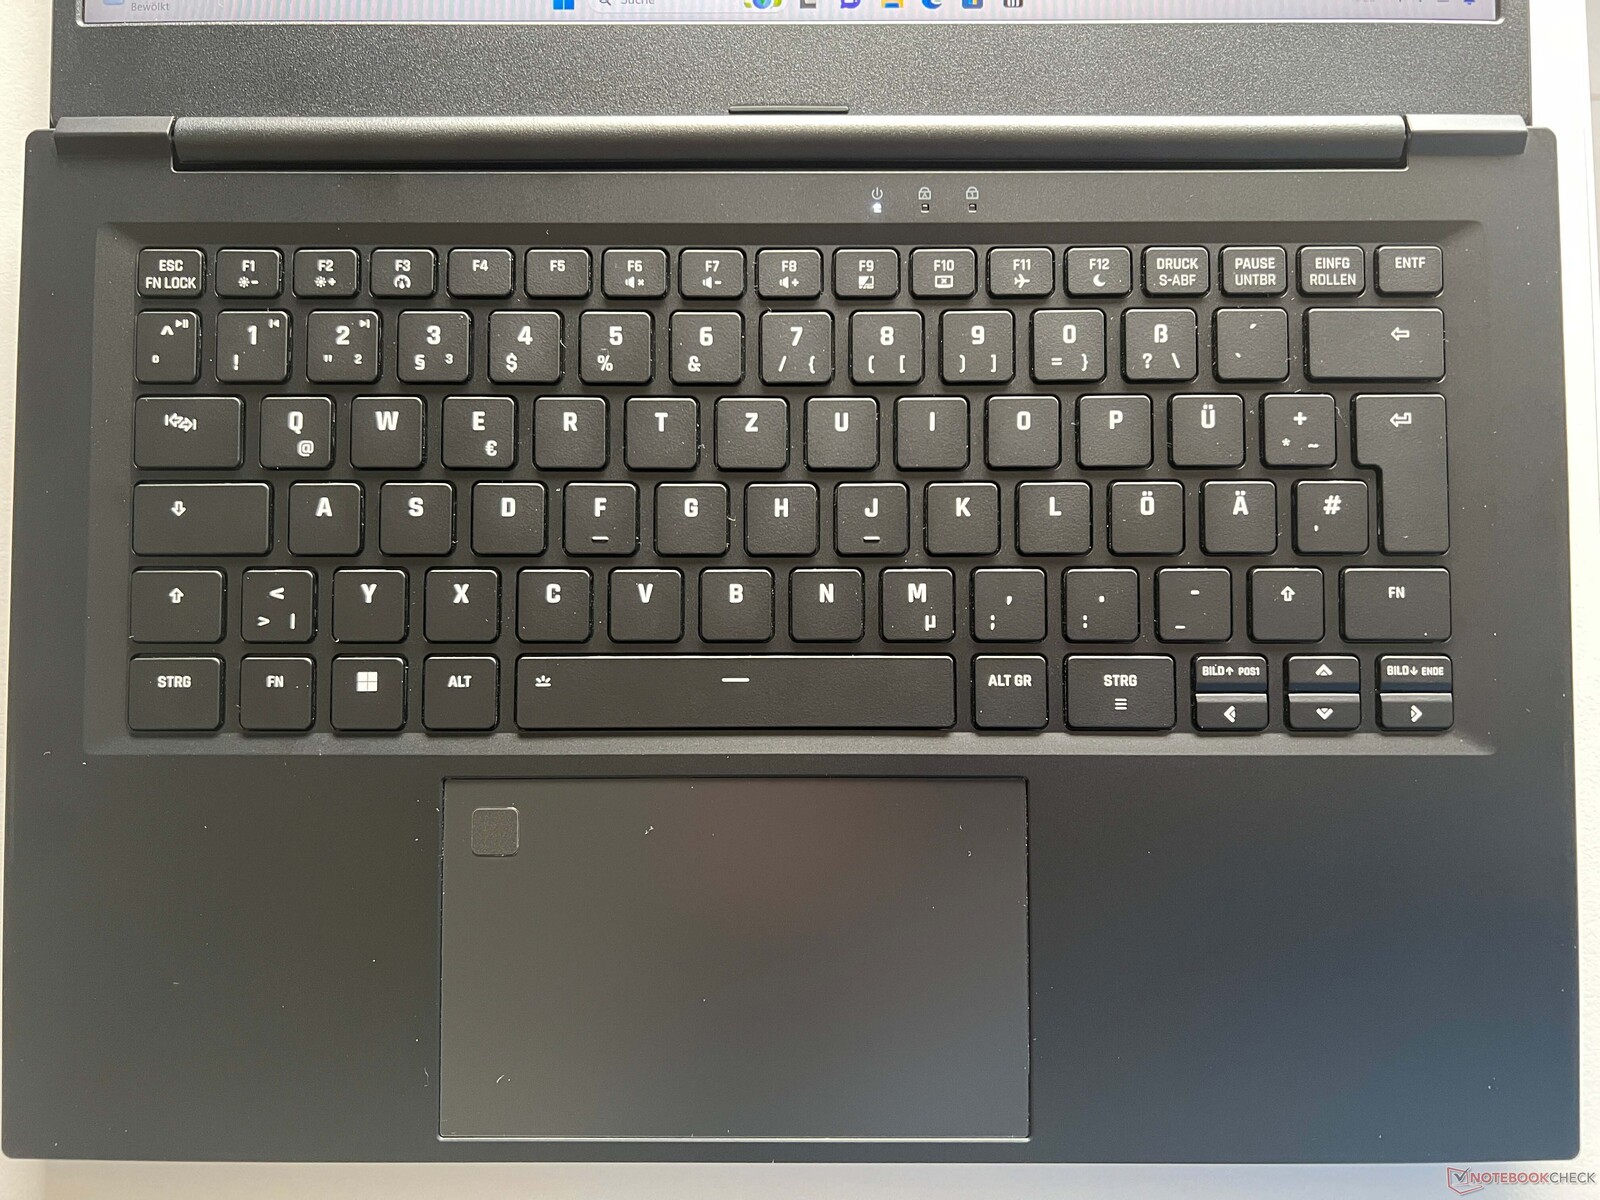
Giriş cihazları
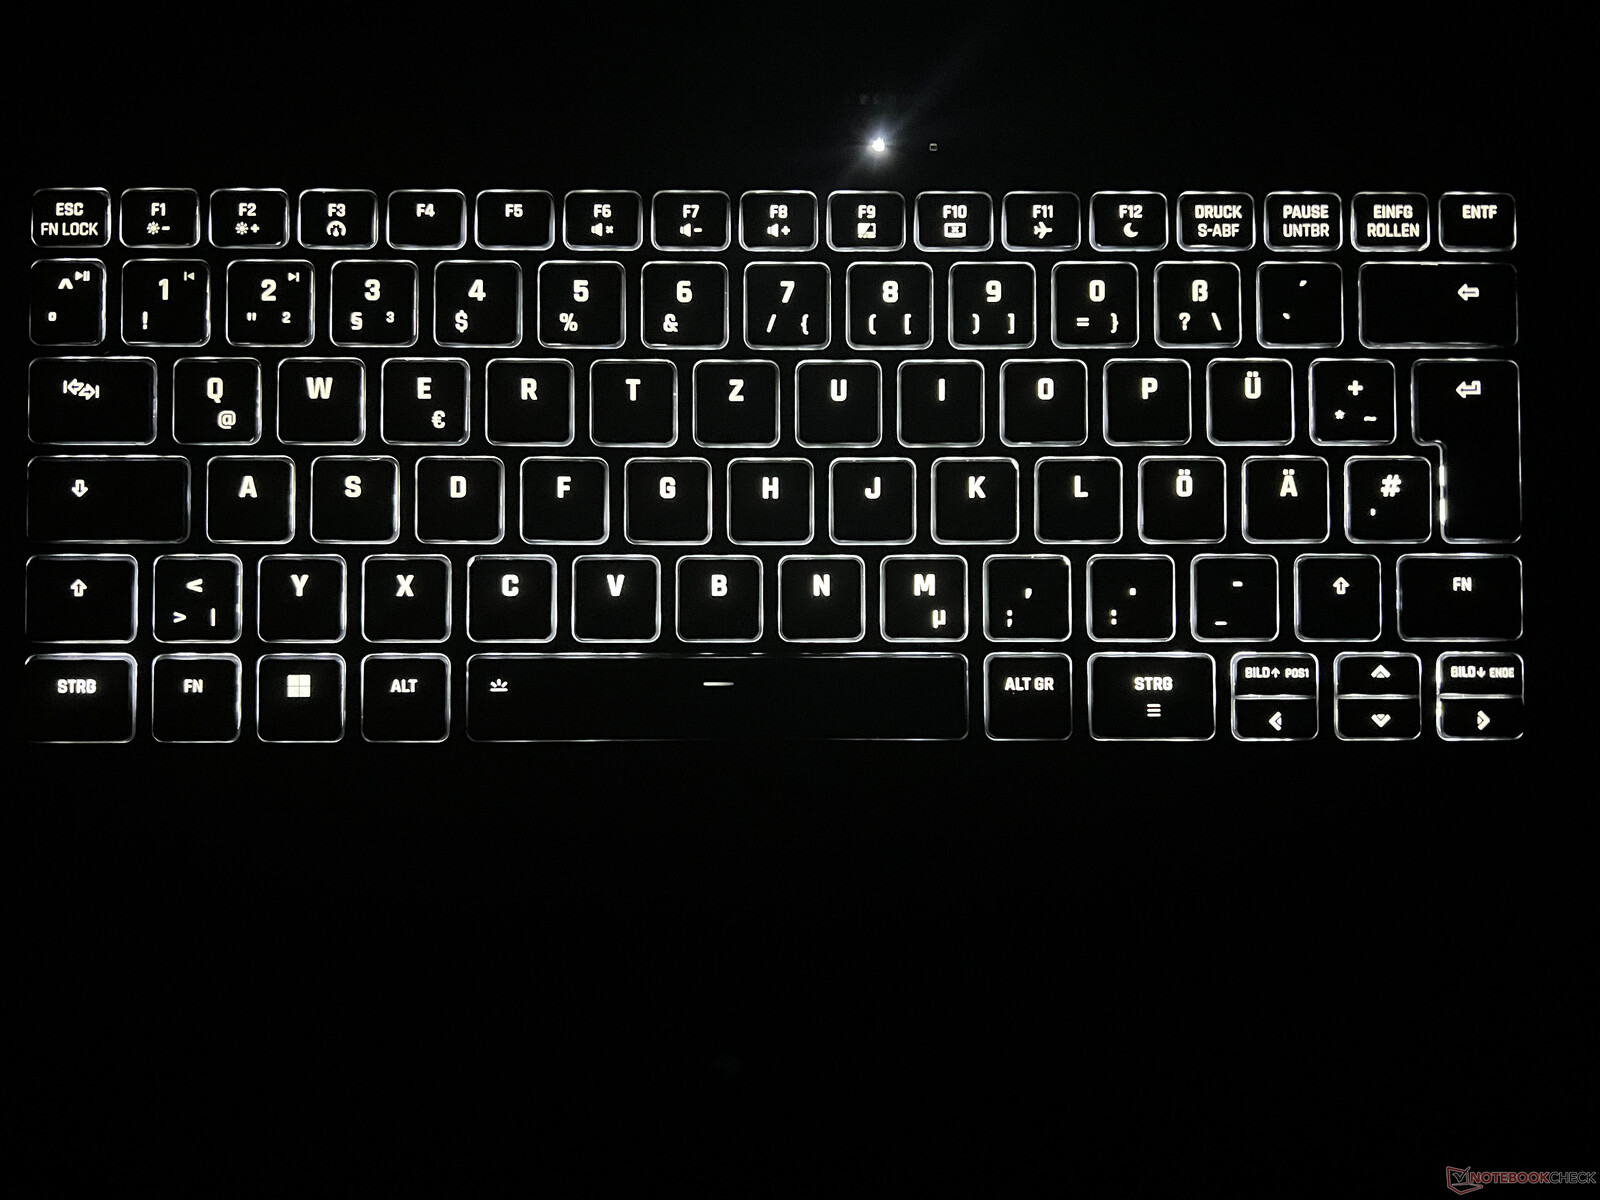
Dizüstü bilgisayarın siyah chiclet klavyesi arkadan aydınlatmalı ve yazması rahat, ancak tuşlar normalden biraz daha ince ve genel olarak oldukça küçük. Ok tuşları aslında daha da küçük ama en azından özel resim yukarı / resim aşağı tuşları var. Microsoft Precision dokunmatik yüzey rahatça kullanılabilecek kadar büyük (12,1 x 7,3 cm) ve sol üst köşede bir parmak izi tarayıcısı bulunuyor. Öte yandan, tamamen pürüzsüz değil ve kullanım sırasında biraz direnç fark edeceksiniz. Ayrıca, tıklama sesleri çok yüksek ve ucuz geliyor, yani girişler için aşağı bastırmak yerine sadece pede dokunmanızı tavsiye ederiz.
Ekran - Mat IPS panel
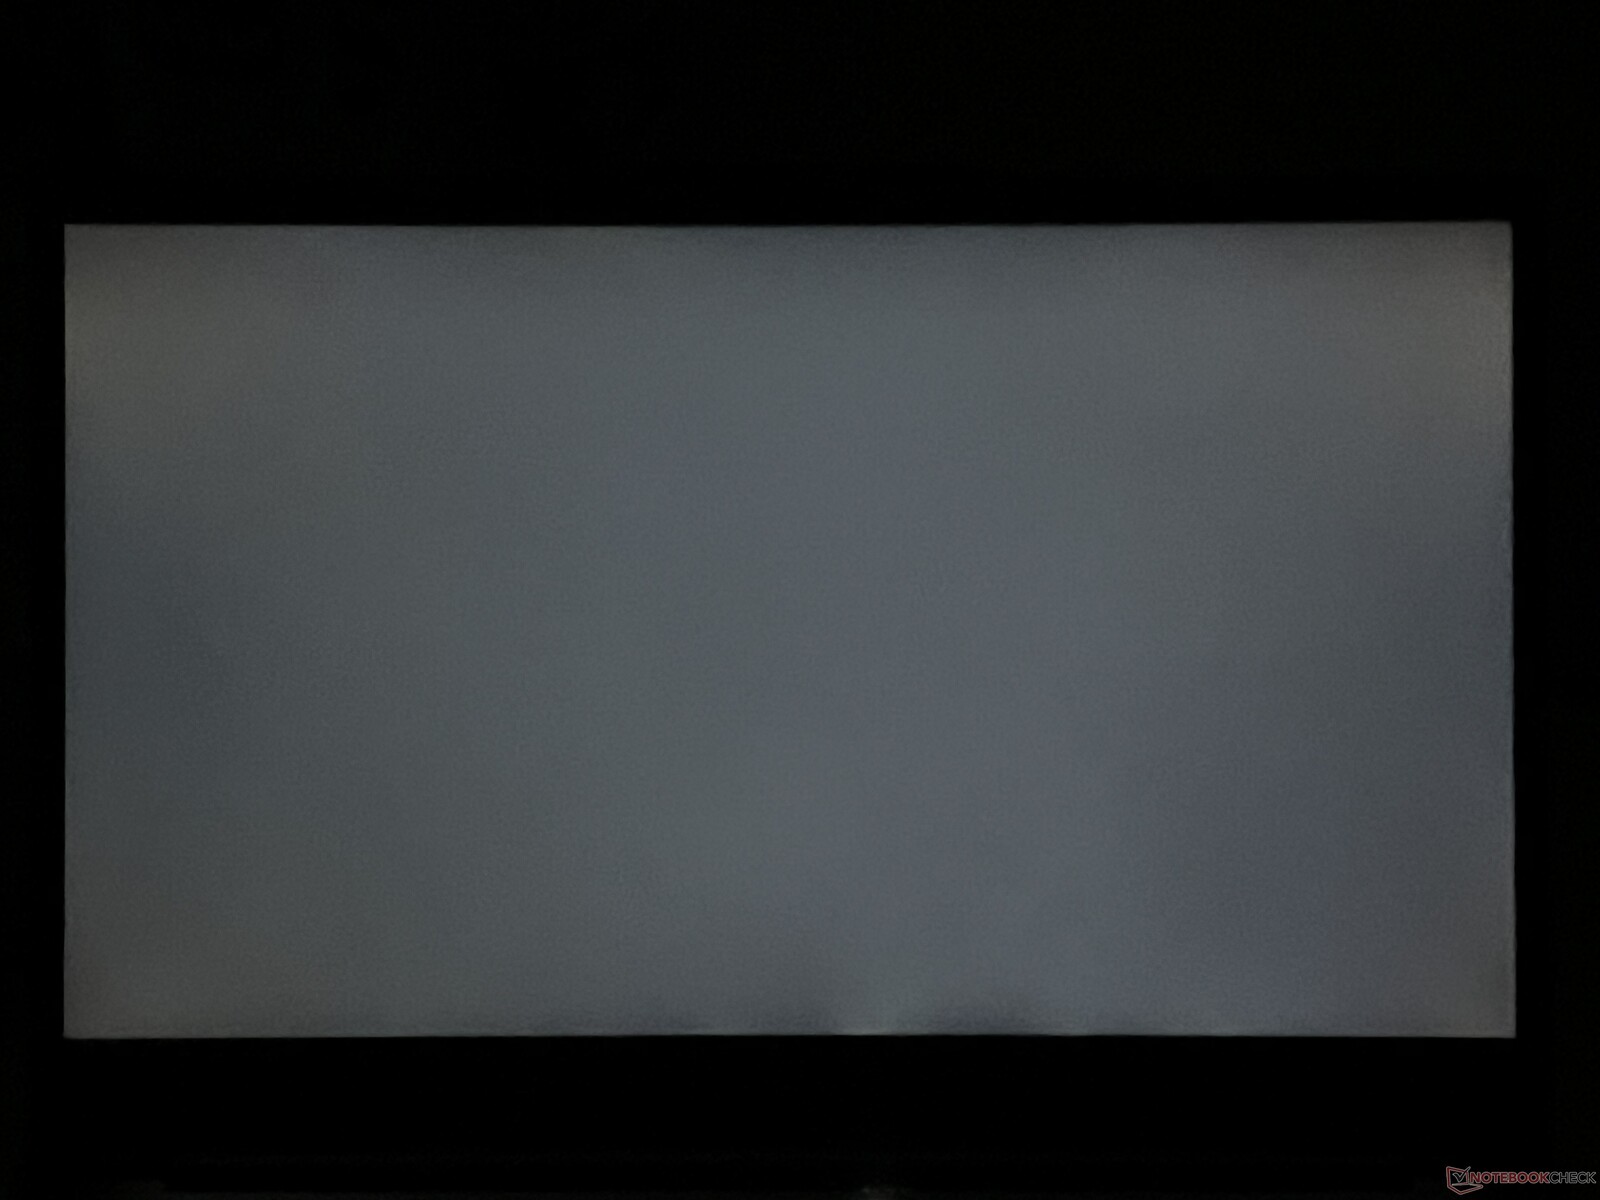
Work 14, AU Optronics'in 1.920 x 1.080 piksel çözünürlüğe sahip mat IPS paneliyle (60 Hz) donatılmıştır. Bu, hala 16:9 panel olduğu anlamına geliyor, ancak rakiplerinin çoğunun ekranları aynı en boy oranına sahip. Öznel olarak, grenli görünümünün bir sonucu olarak görüntü kalitesi biraz düşüyor, ancak içerik yeterince keskin ve ekran PWM kullanmıyor. Arka ışık akması bir sorun değil, ancak tepki süreleri çok yavaş ve önemli miktarda gölgelenme gözlemledik. Doğrudan karşılaştırıldığında Acer Swift Go, OLED paneliyle çok daha iyi bir öznel görüntü kalitesi sunuyor ancak buna karşılık kullanıcılar sürekli PWM titremesiyle uğraşmak zorunda kalıyor.
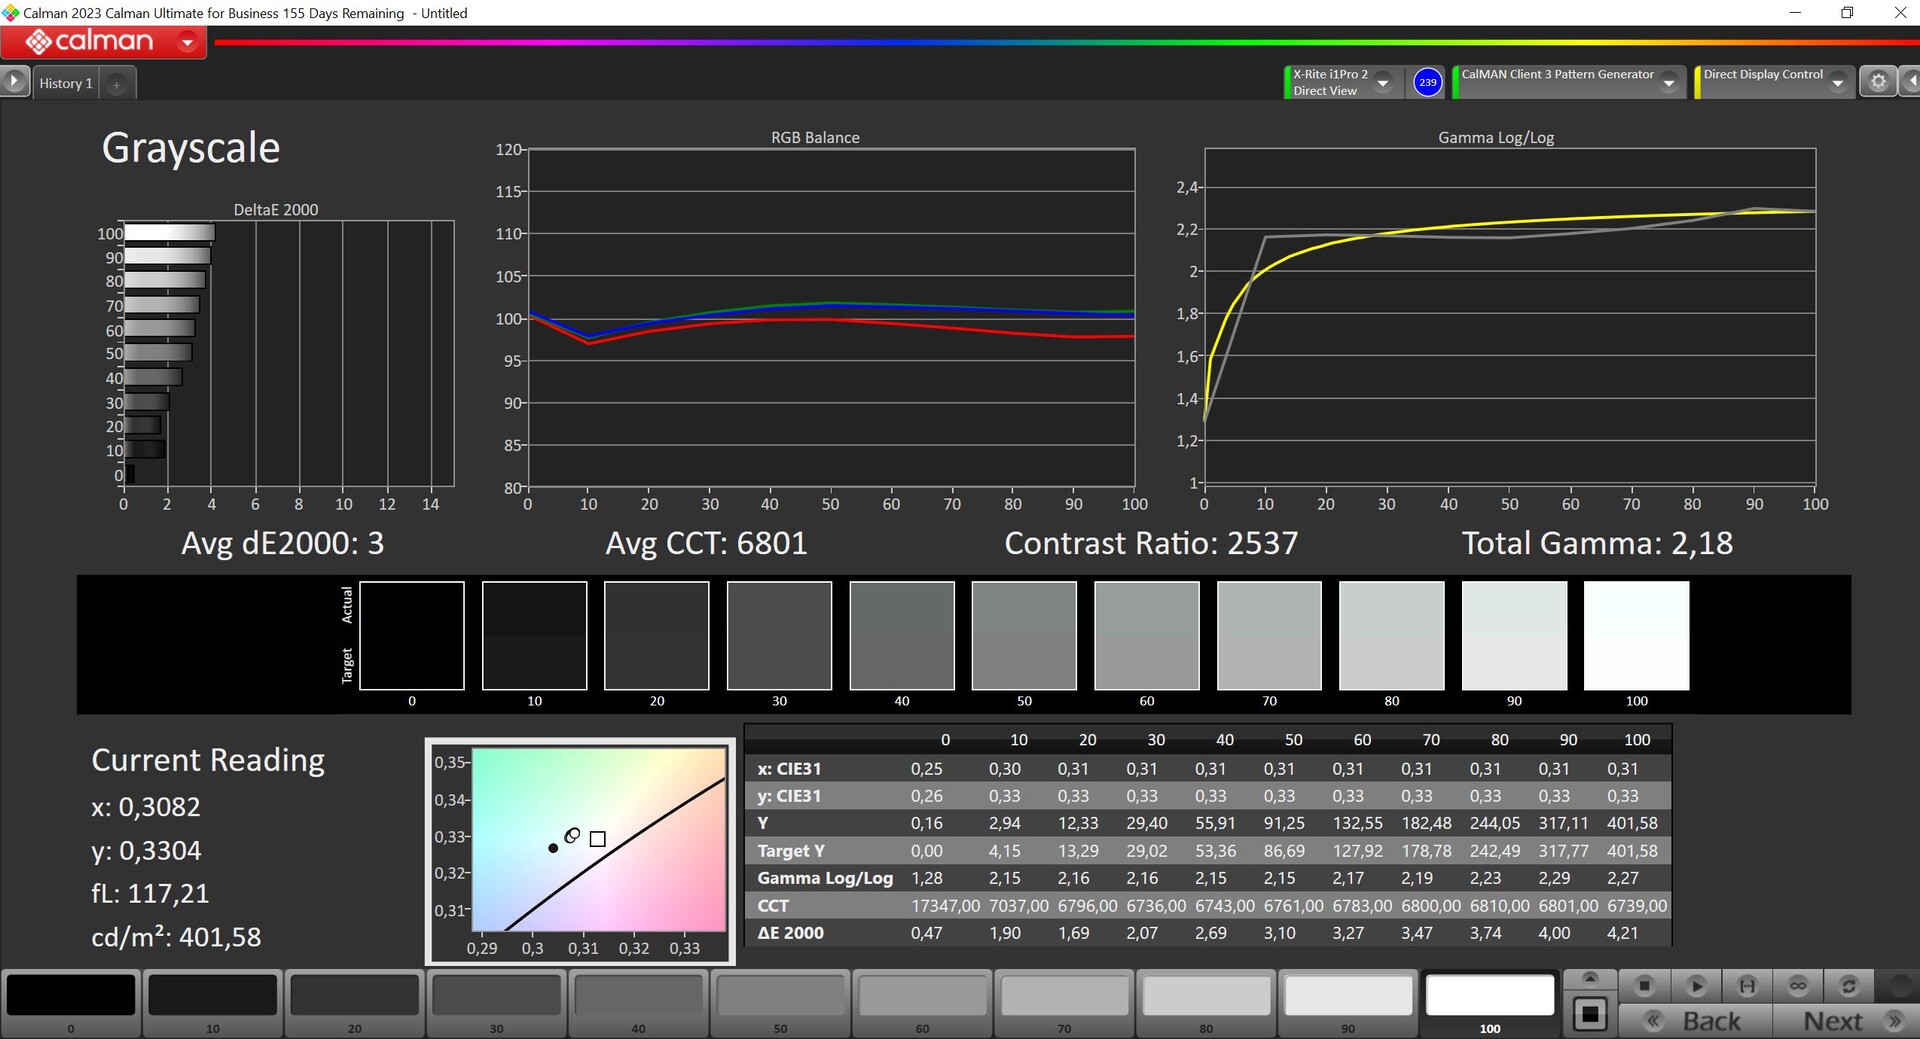
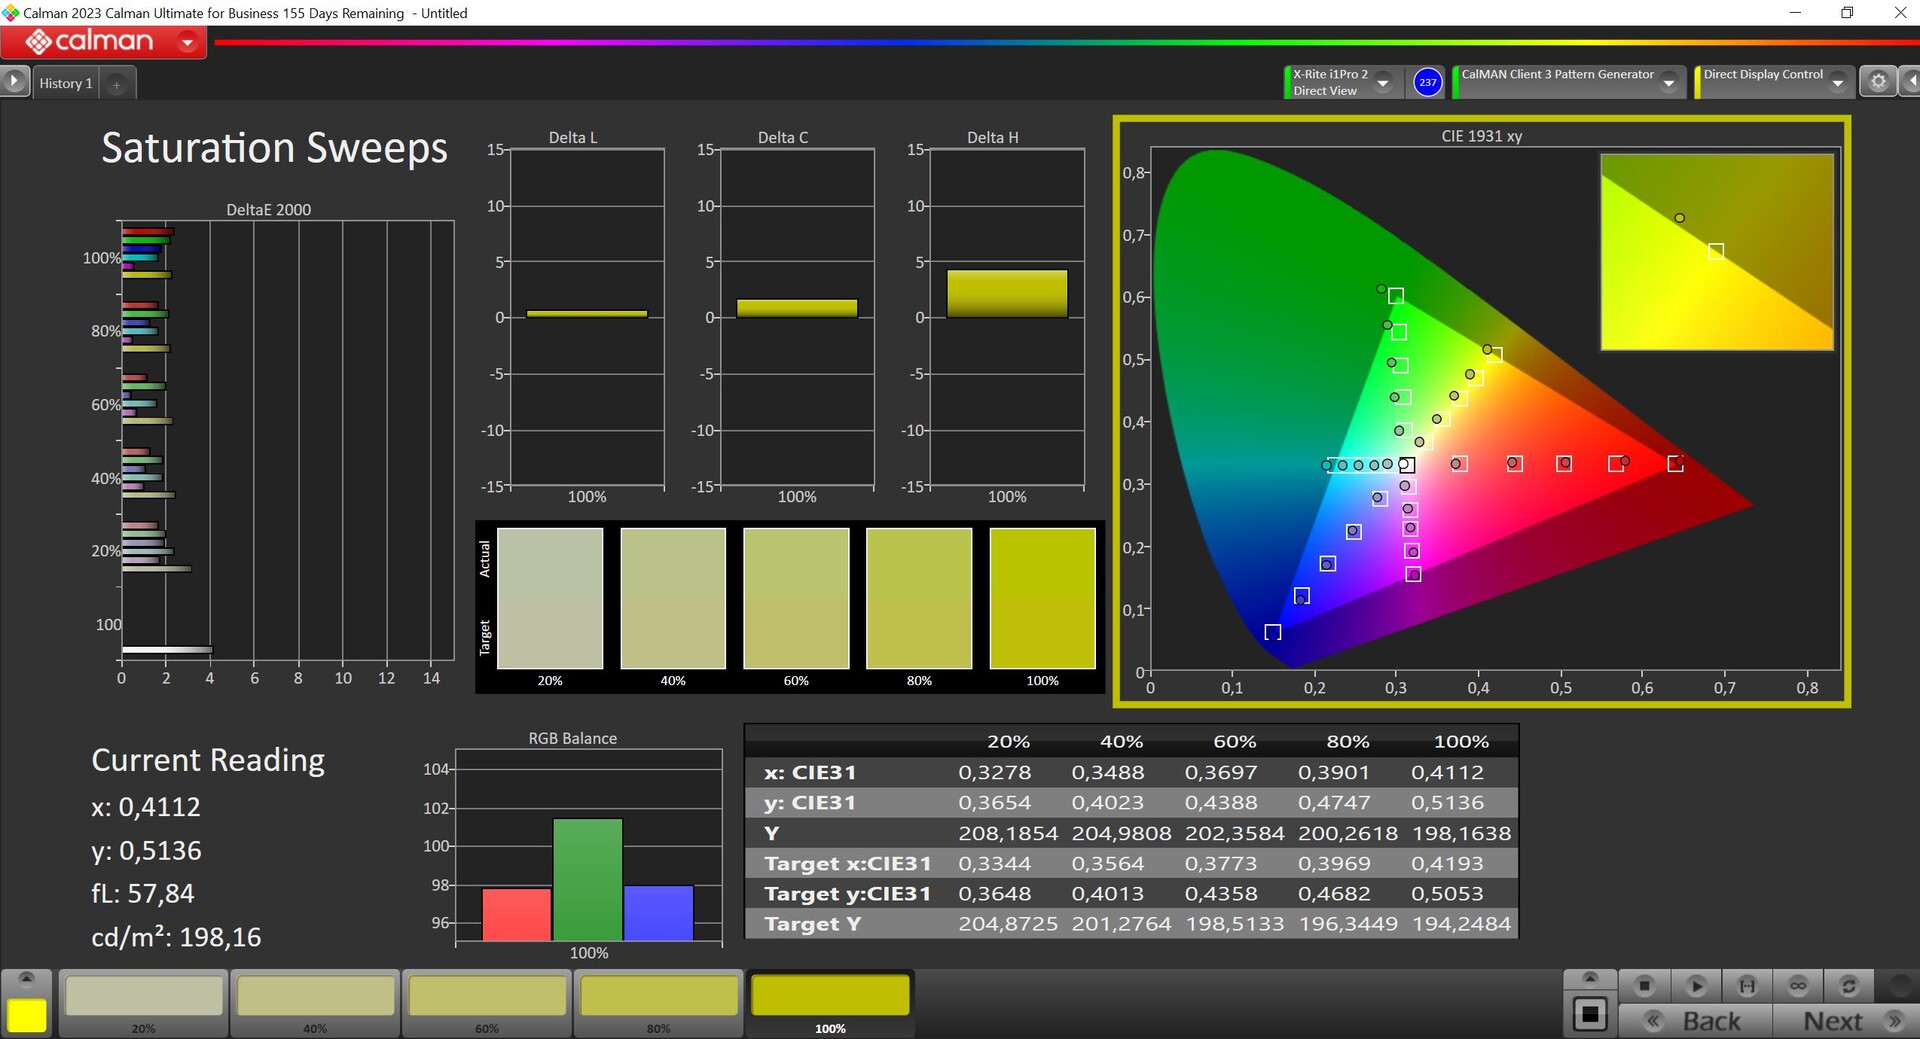
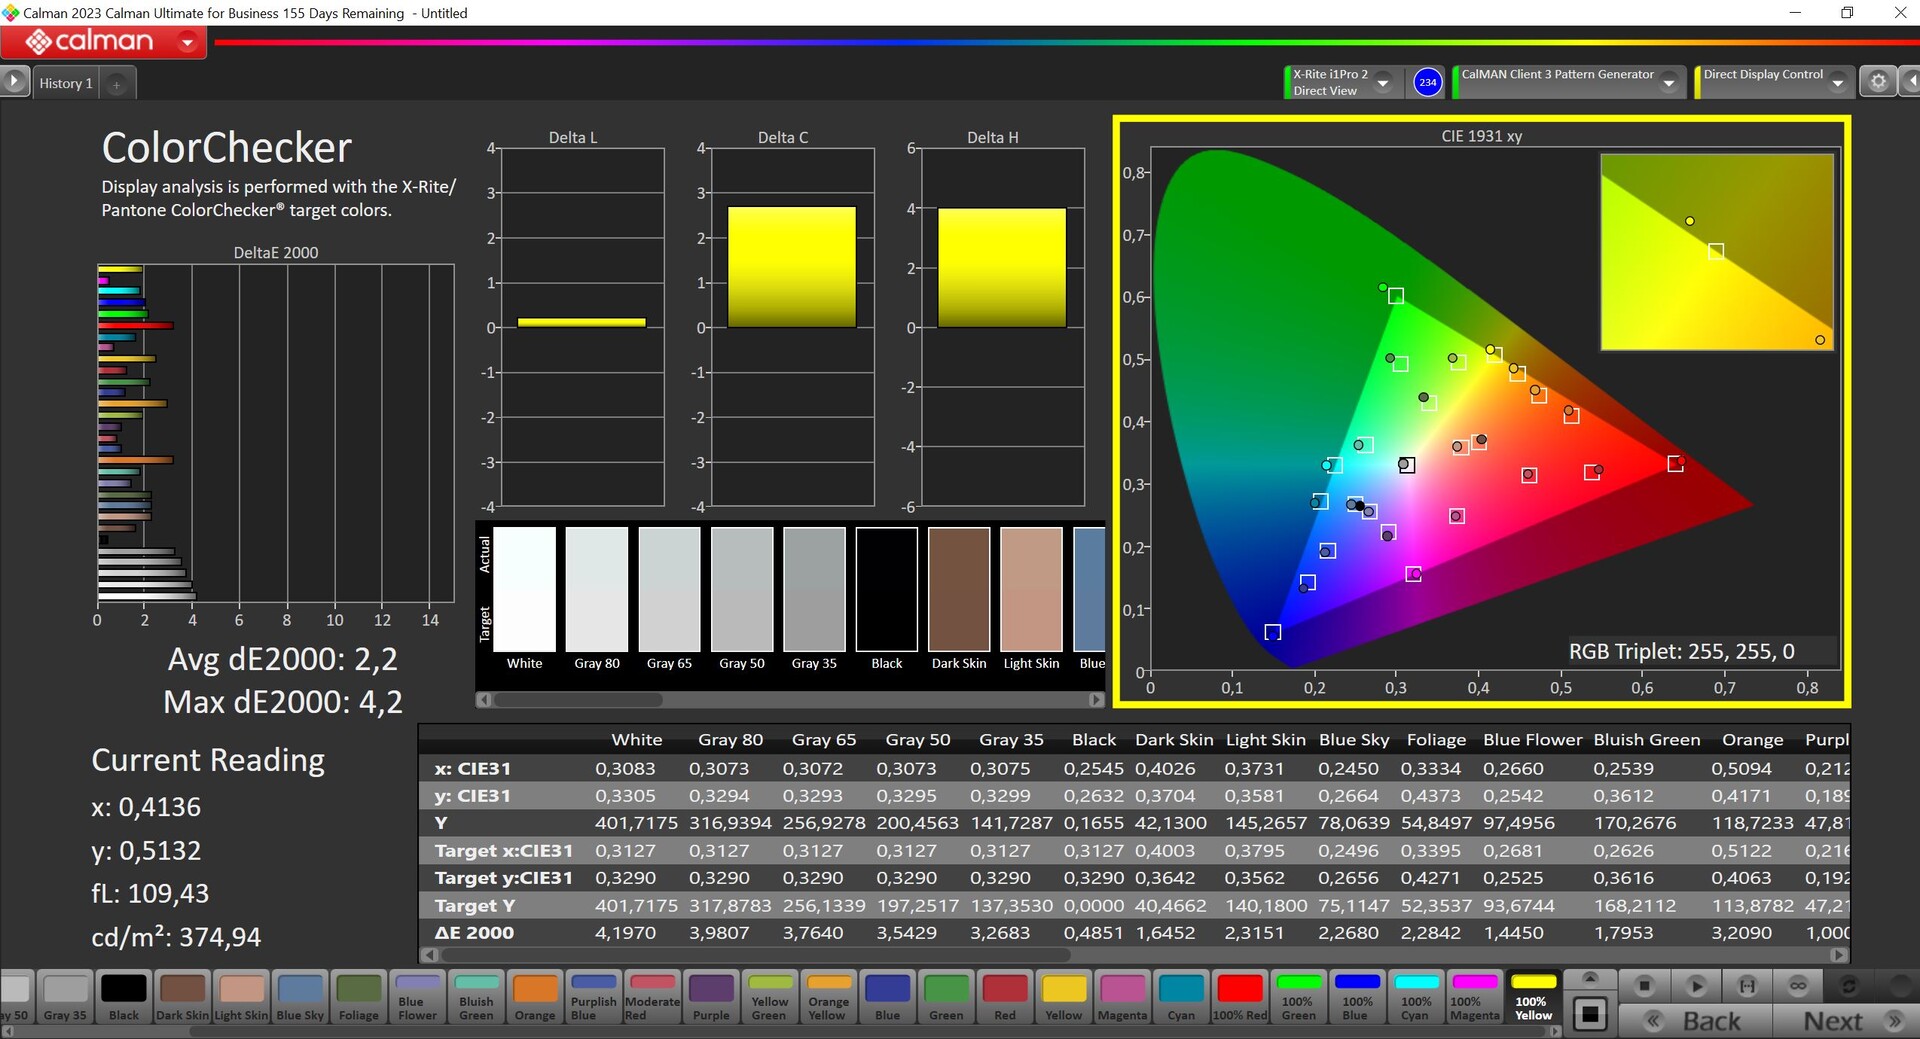
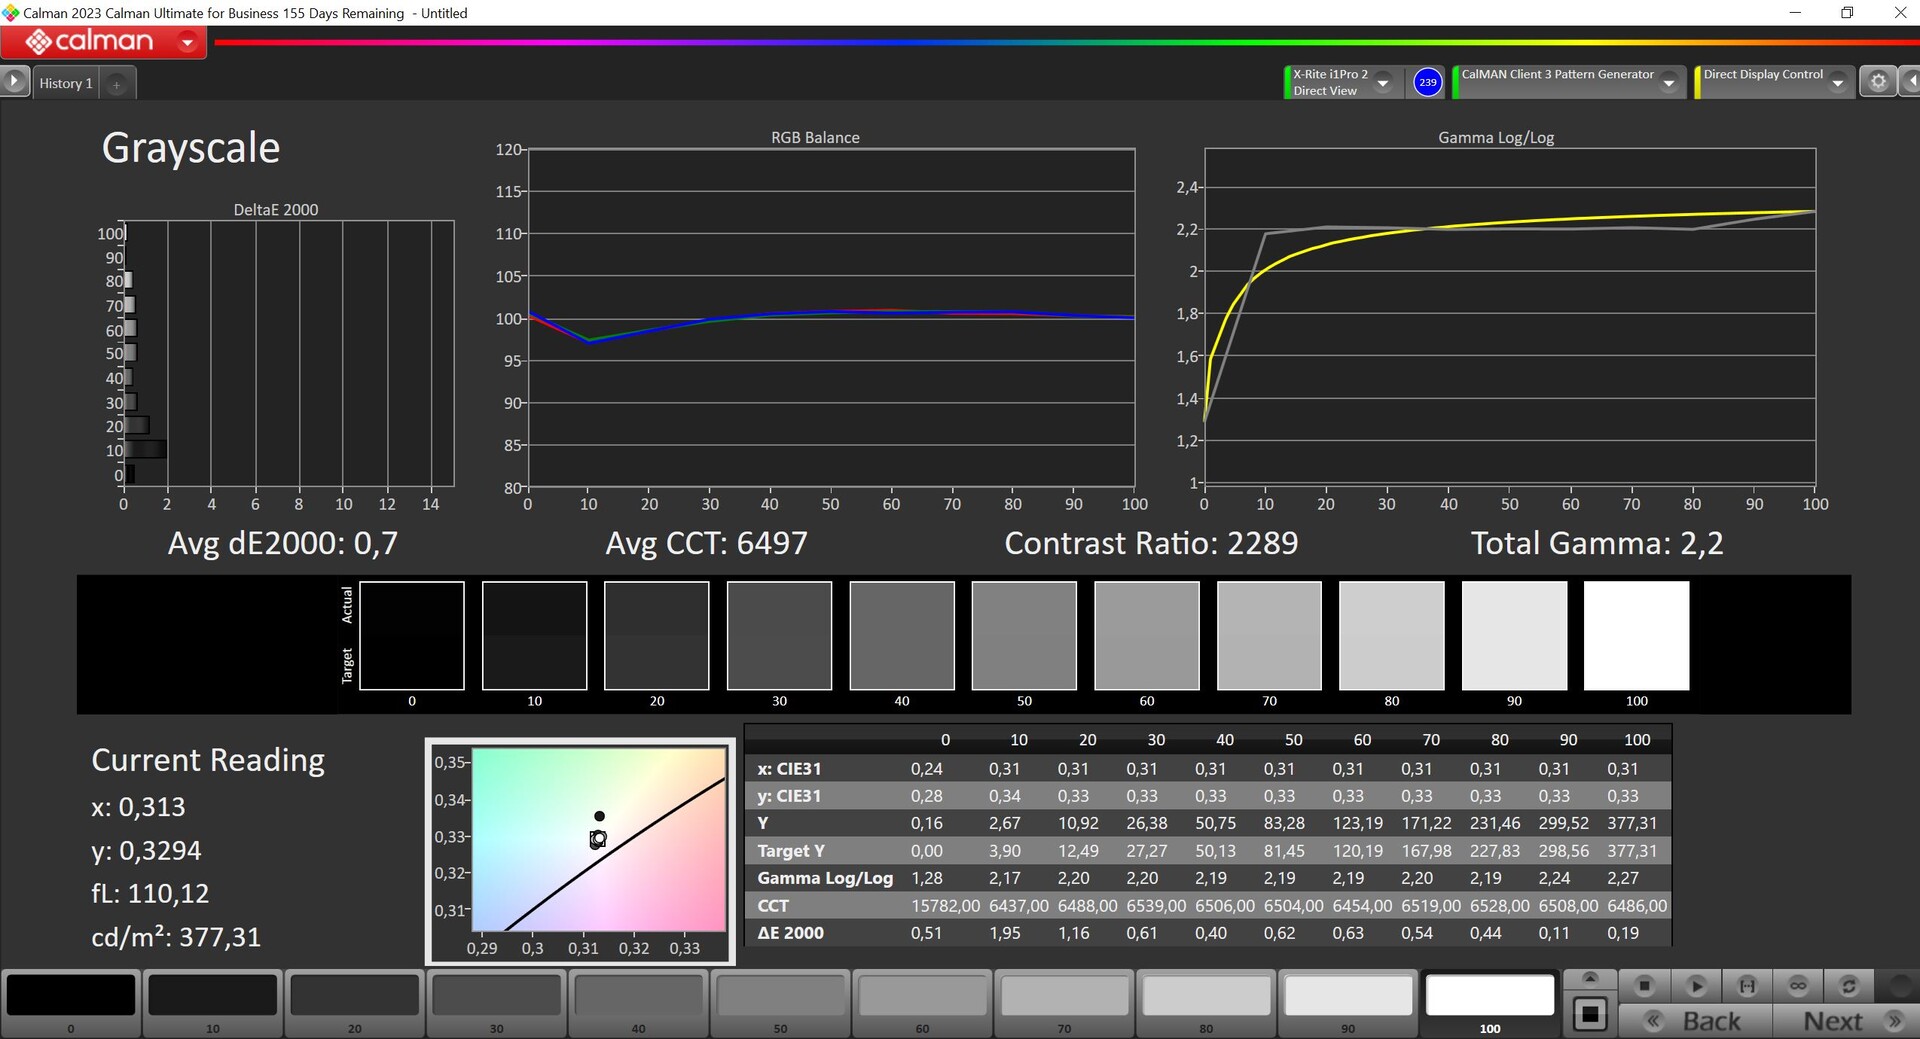
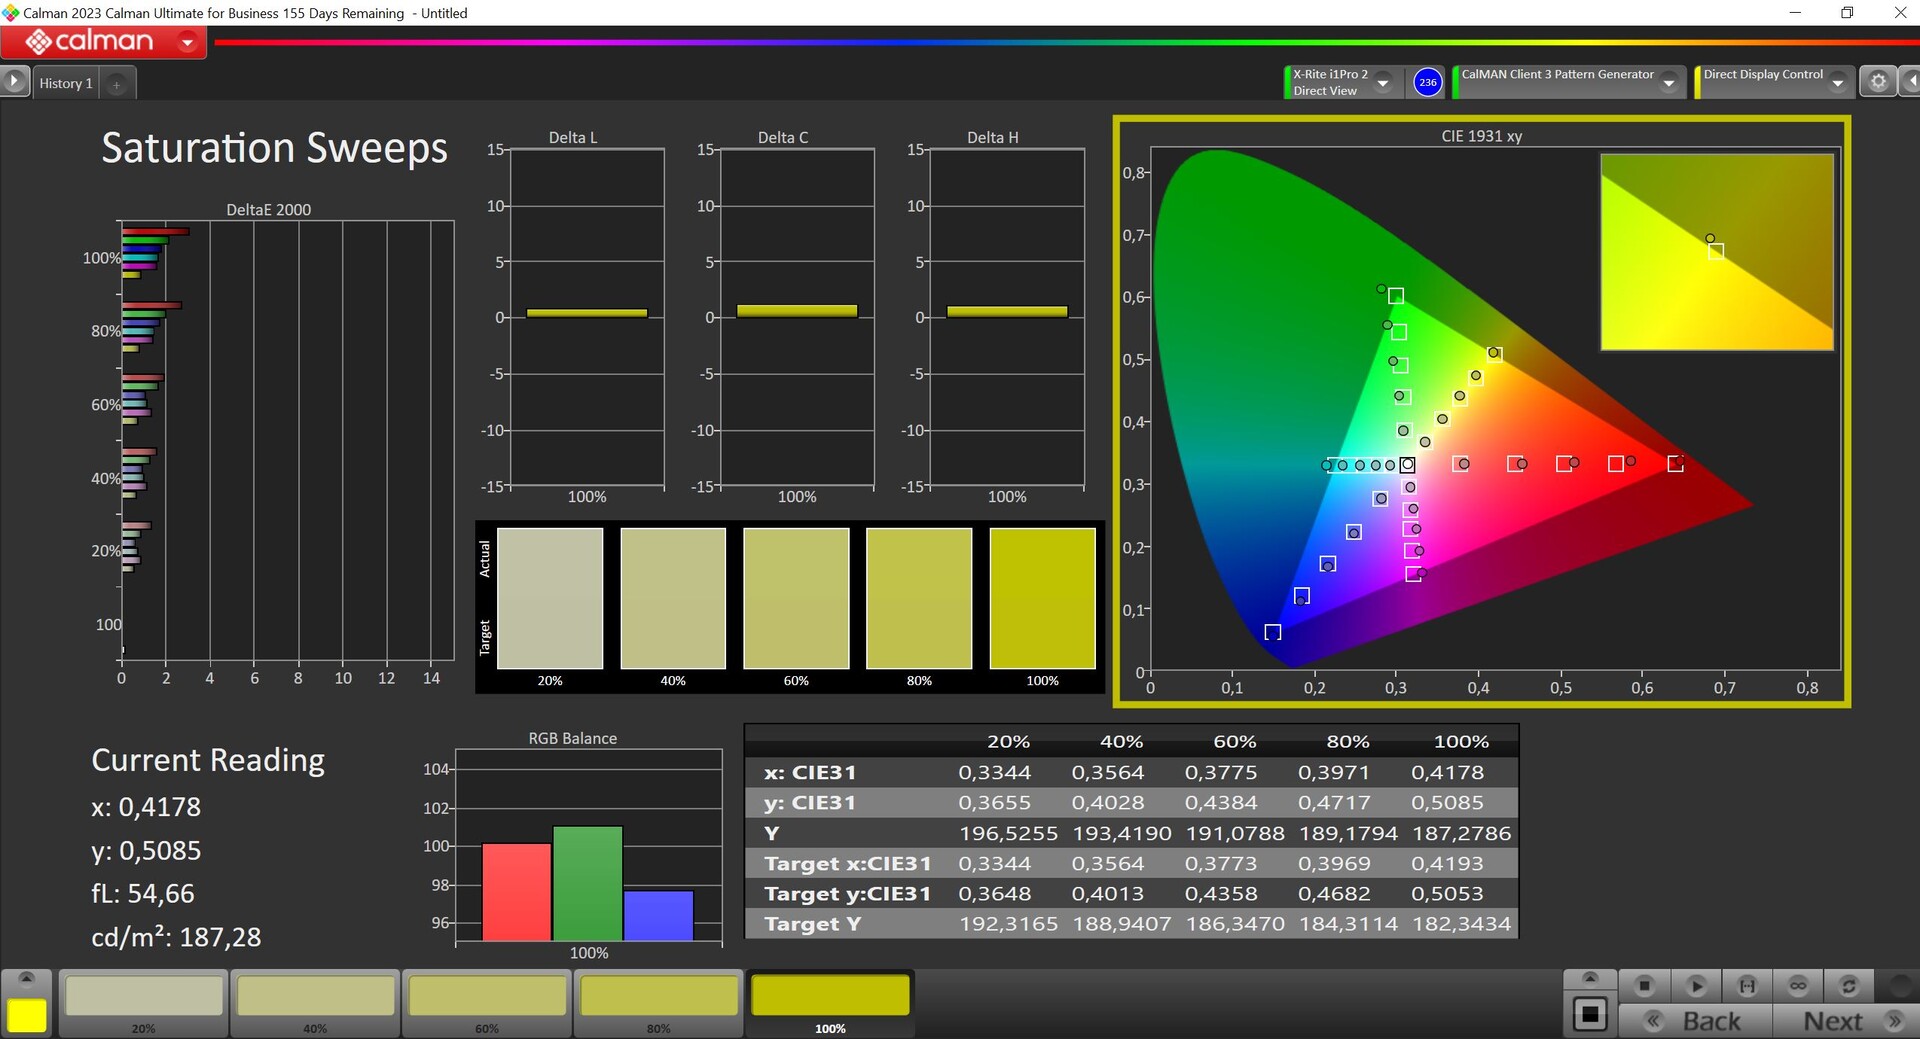
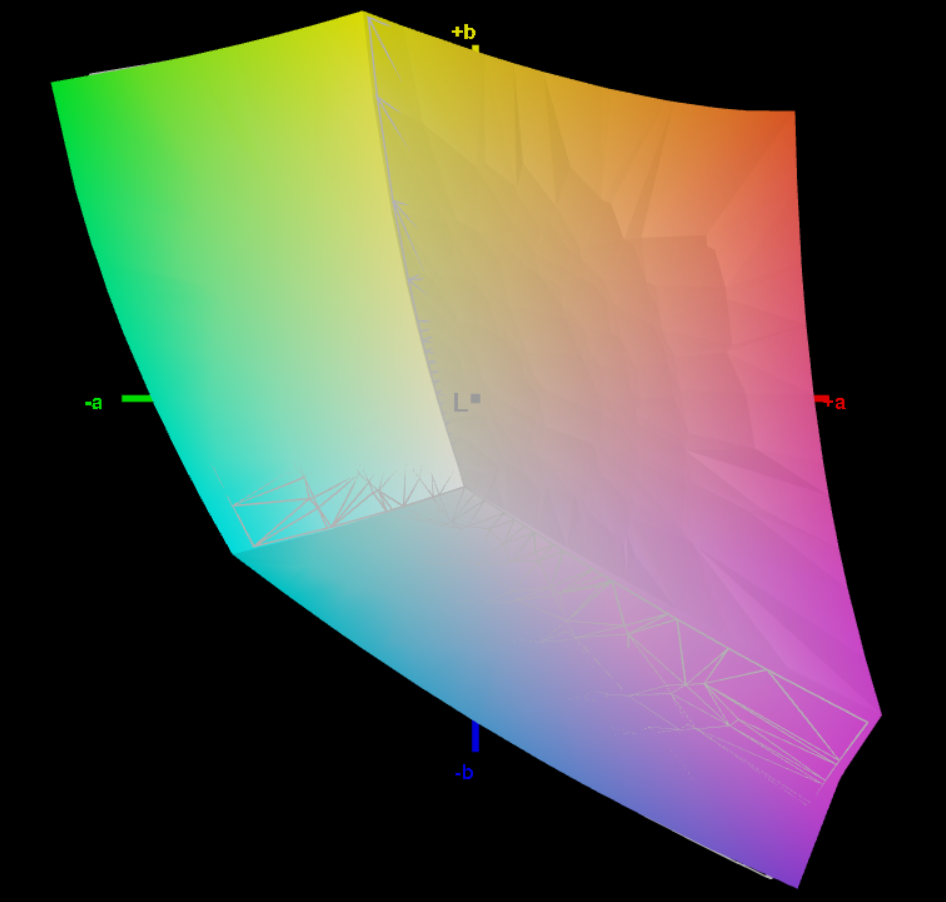
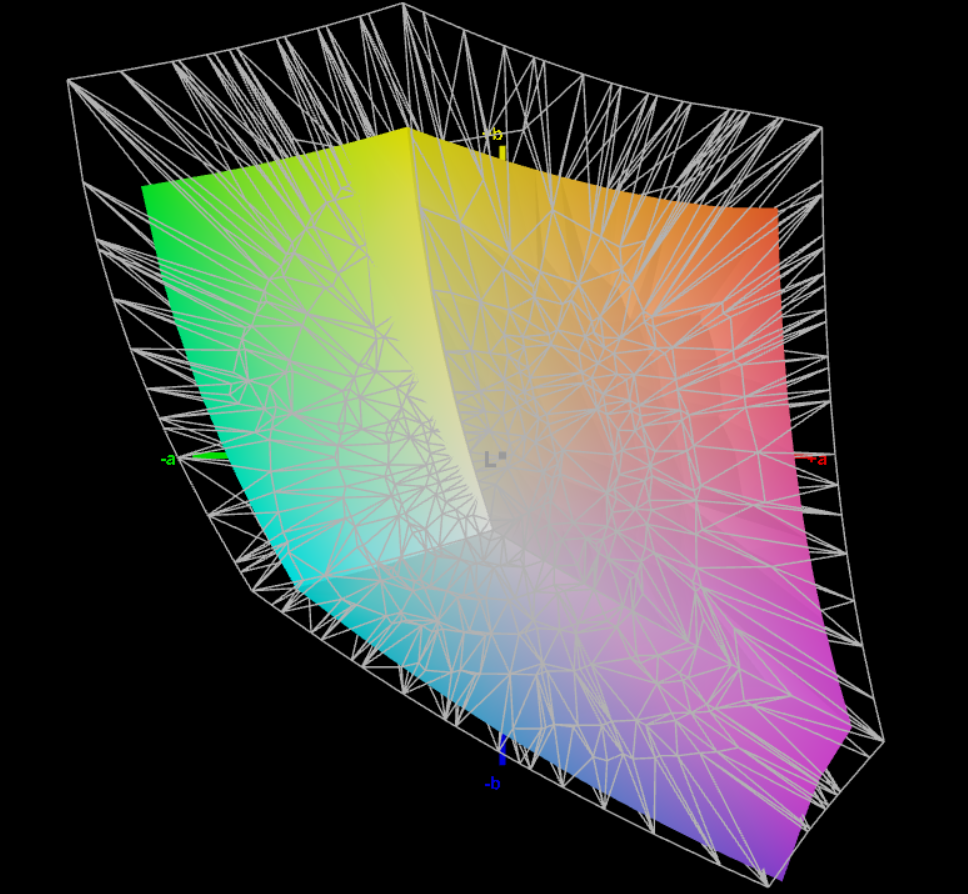
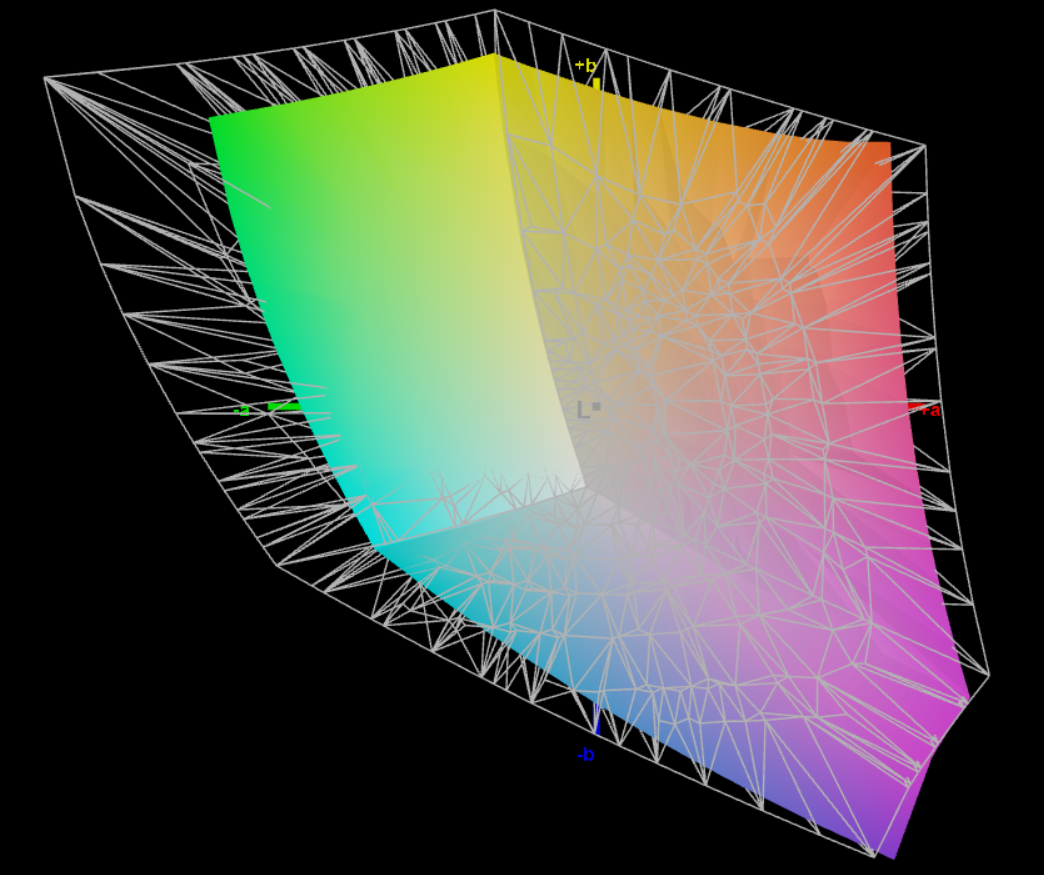
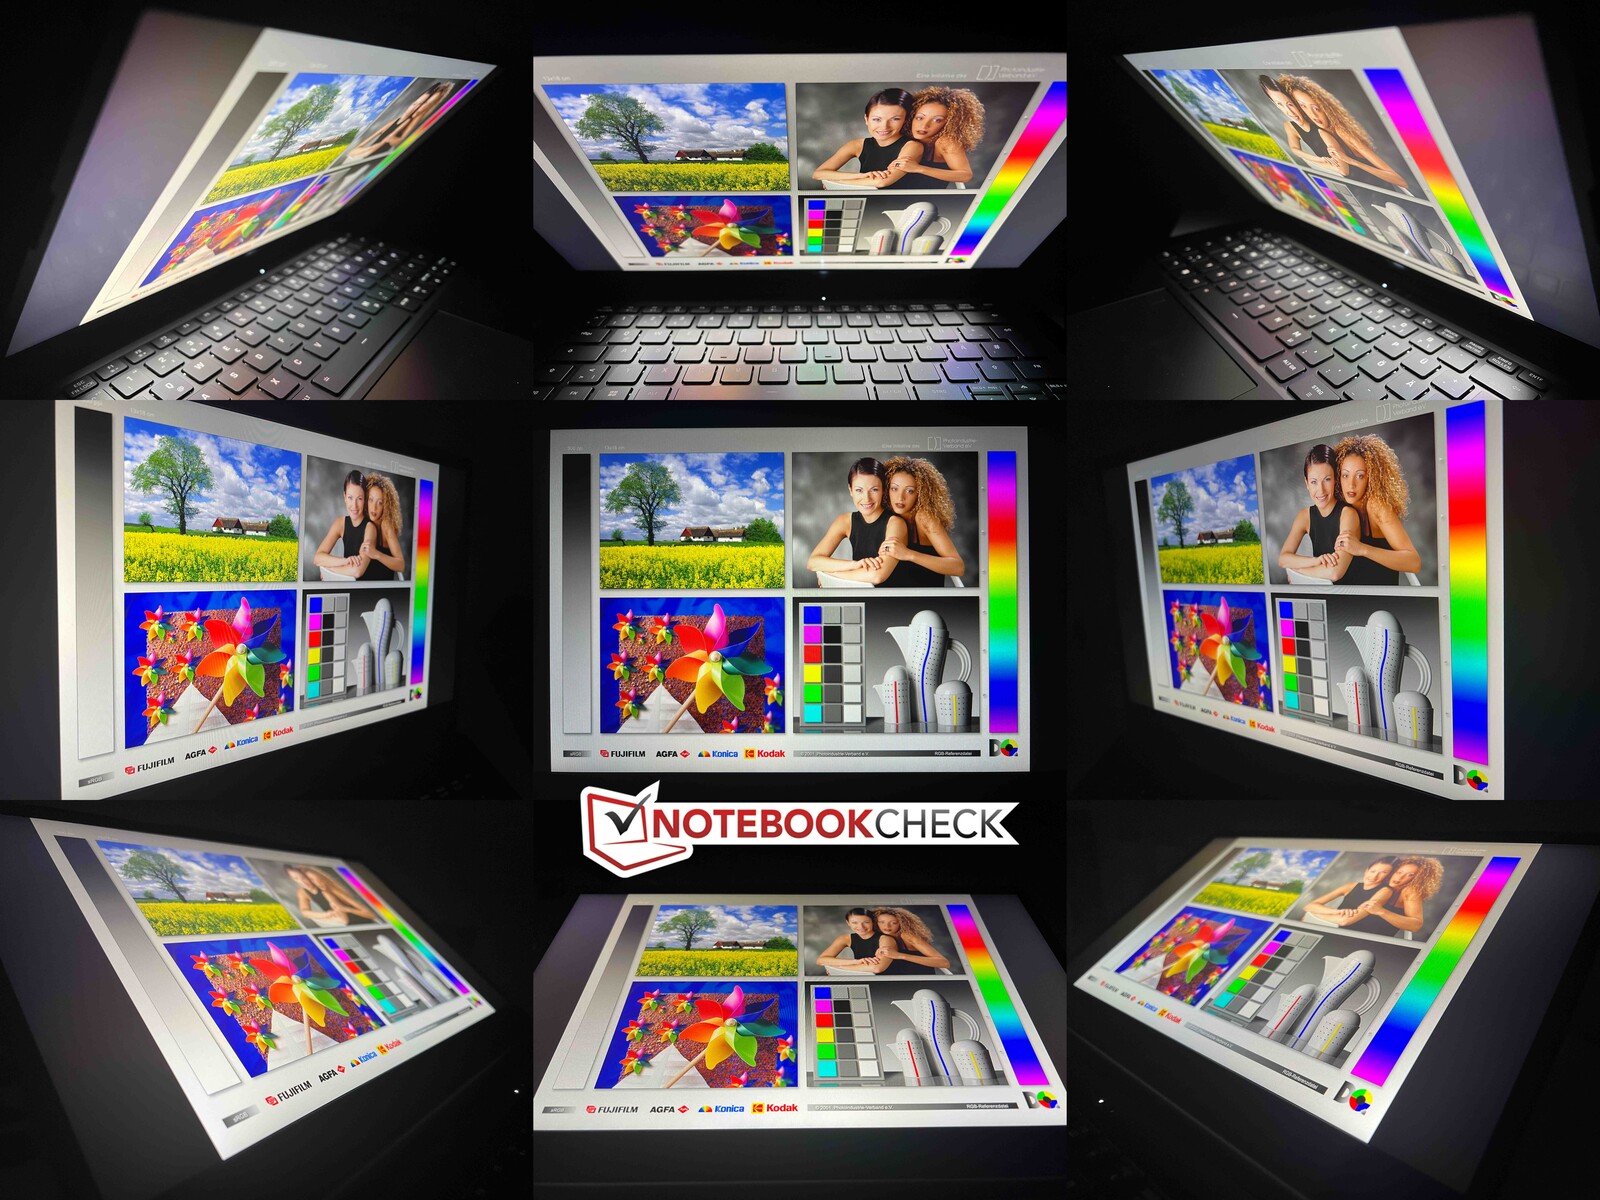
Üretici tipik parlaklığı 300 cd/m² olarak belirtiyor ve test cihazımız ortalama olarak 400 cd/m²'nin üzerinde çok daha iyi sonuçlar gösterdi. Dahası, siyah değeri 0,16 cd/m² ile çok düşüktür ve bu da yüksek bir maksimum kontrast oranına yol açar. Kalibrasyonu kutudan çıkar çıkmaz iyi ve bu günlük kullanımda herhangi bir soruna yol açmamalı. Ekranı kendiniz kalibre ederseniz, tasvirini biraz daha iyileştirebilirsiniz, ancak bu biraz parlaklık pahasına gelir. Daha küçük olan sRGB renk alanını neredeyse tamamen kapsıyor. Dışarıdan bakıldığında panel oldukça iyi bir izlenim bırakıyor ve görüş açısı stabilitesi gayet iyi.
| |||||||||||||||||||||||||
Aydınlatma: 89 %
Batarya modunda parlaklık: 402 cd/m²
Kontrast: 2513:1 (Siyah: 0.16 cd/m²)
ΔE ColorChecker Calman: 2.2 | ∀{0.5-29.43 Ø4.72}
calibrated: 1.3
ΔE Greyscale Calman: 3 | ∀{0.09-98 Ø4.97}
73.8% AdobeRGB 1998 (Argyll 3D)
99.8% sRGB (Argyll 3D)
72.4% Display P3 (Argyll 3D)
Gamma: 2.18
CCT: 6801 K
| Schenker Work 14 Base B140HAN06.8, IPS, 1920x1080, 14" | Acer Swift Go 14 SFG14-71 Samsung ATNA40YK11-0, OLED, 2880x1800, 14" | HP ProBook 445 G10 AUO2FA6, IPS, 1920x1080, 14" | Dell Latitude 3440 BOE NE140FH, IPS, 1920x1080, 14" | Lenovo ThinkPad L14 G4 21H6S00900 B140HAN06.9, IPS LED, 1920x1080, 14" | |
|---|---|---|---|---|---|
| Display | 22% | -5% | -42% | 0% | |
| Display P3 Coverage (%) | 72.4 | 99.9 38% | 68.4 -6% | 40.4 -44% | 73.2 1% |
| sRGB Coverage (%) | 99.8 | 100 0% | 95.2 -5% | 60.7 -39% | 98.9 -1% |
| AdobeRGB 1998 Coverage (%) | 73.8 | 95.4 29% | 70.6 -4% | 41.8 -43% | 73.9 0% |
| Response Times | 96% | 24% | 28% | 5% | |
| Response Time Grey 50% / Grey 80% * (ms) | 60 ? | 1.85 ? 97% | 53.4 ? 11% | 35.3 ? 41% | 58.1 ? 3% |
| Response Time Black / White * (ms) | 34.7 ? | 2 ? 94% | 21.8 ? 37% | 29.8 ? 14% | 32.7 ? 6% |
| PWM Frequency (Hz) | 357 ? | ||||
| Screen | -8% | -15% | -67% | -18% | |
| Brightness middle (cd/m²) | 402 | 278 -31% | 501 25% | 292.6 -27% | 430 7% |
| Brightness (cd/m²) | 404 | 279 -31% | 464 15% | 270 -33% | 409 1% |
| Brightness Distribution (%) | 89 | 96 8% | 87 -2% | 88 -1% | 88 -1% |
| Black Level * (cd/m²) | 0.16 | 0.04 75% | 0.26 -63% | 0.19 -19% | 0.31 -94% |
| Contrast (:1) | 2513 | 6950 177% | 1927 -23% | 1540 -39% | 1387 -45% |
| Colorchecker dE 2000 * | 2.2 | 3.01 -37% | 2.64 -20% | 4.63 -110% | 2.4 -9% |
| Colorchecker dE 2000 max. * | 4.2 | 4.43 -5% | 5.06 -20% | 17.1 -307% | 4.7 -12% |
| Colorchecker dE 2000 calibrated * | 1.3 | 4.14 -218% | 1.57 -21% | 2.13 -64% | 1.4 -8% |
| Greyscale dE 2000 * | 3 | 3.2 -7% | 3.8 -27% | 3.2 -7% | 3 -0% |
| Gamma | 2.18 101% | 2.194 100% | 2.103 105% | 2.34 94% | 2.3 96% |
| CCT | 6801 96% | 6126 106% | 6562 99% | 7184 90% | 6489 100% |
| Toplam Ortalama (Program / Ayarlar) | 37% /
14% | 1% /
-7% | -27% /
-48% | -4% /
-11% |
* ... daha küçük daha iyidir

Yanıt Sürelerini Görüntüle
| ↔ Tepki Süresi Siyahtan Beyaza | ||
|---|---|---|
| 34.7 ms ... yükseliş ↗ ve sonbahar↘ birleşimi | ↗ 17 ms yükseliş | 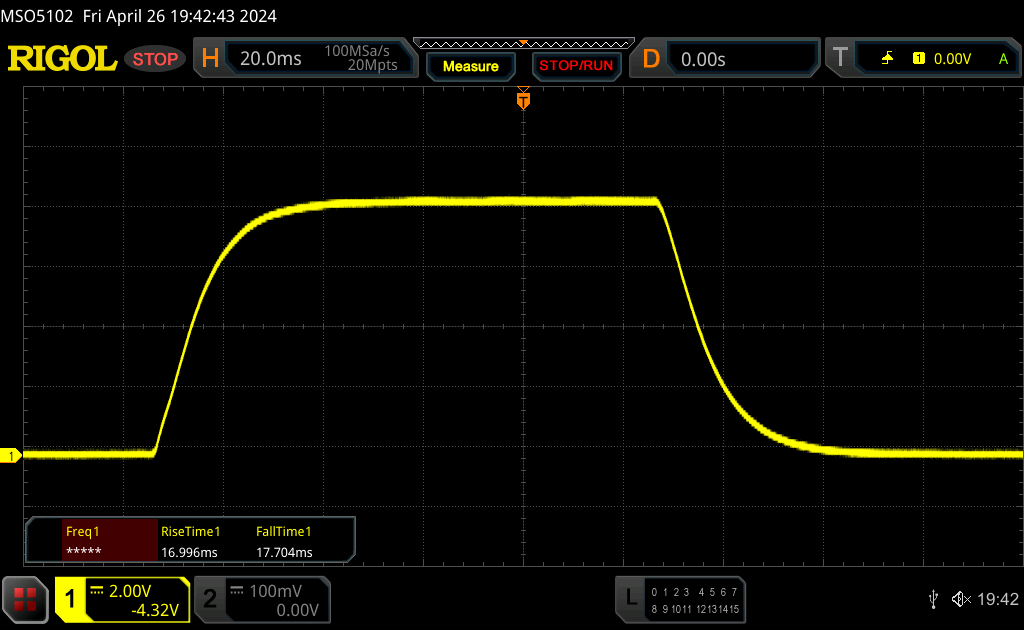 |
| ↘ 17.7 ms sonbahar | ||
| Ekran, testlerimizde yavaş yanıt oranları gösteriyor ve oyuncular için yetersiz olacaktır. Karşılaştırıldığında, test edilen tüm cihazlar 0.1 (minimum) ile 240 (maksimum) ms arasında değişir. » Tüm cihazların 92 %'si daha iyi. Bu, ölçülen yanıt süresinin test edilen tüm cihazların ortalamasından (19.8 ms) daha kötü olduğu anlamına gelir. | ||
| ↔ Tepki Süresi %50 Griden %80 Griye | ||
| 60 ms ... yükseliş ↗ ve sonbahar↘ birleşimi | ↗ 27.5 ms yükseliş | 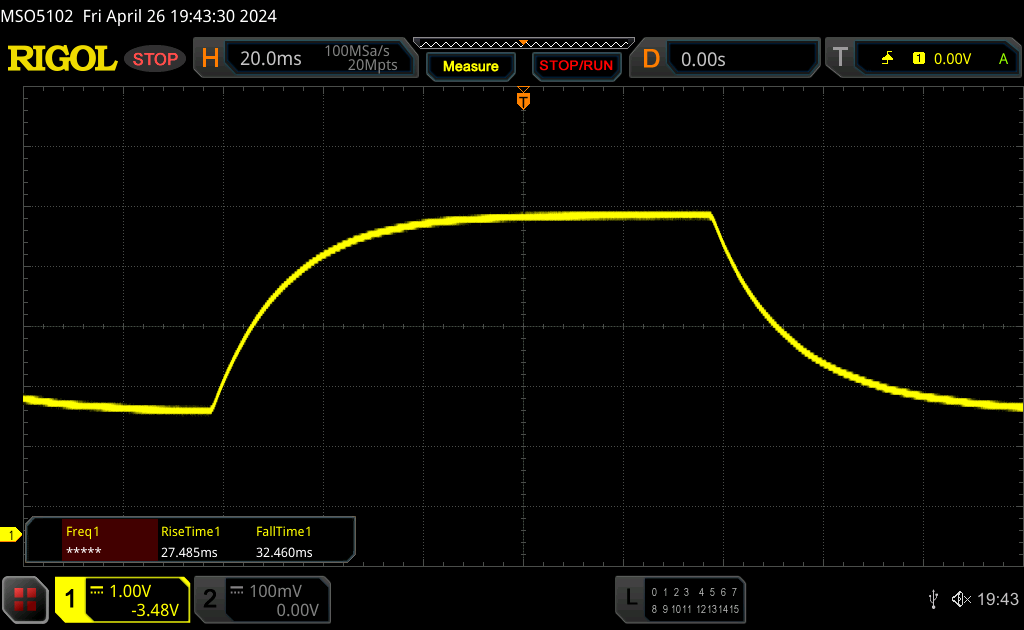 |
| ↘ 32.5 ms sonbahar | ||
| Ekran, testlerimizde yavaş yanıt oranları gösteriyor ve oyuncular için yetersiz olacaktır. Karşılaştırıldığında, test edilen tüm cihazlar 0.165 (minimum) ile 636 (maksimum) ms arasında değişir. » Tüm cihazların 96 %'si daha iyi. Bu, ölçülen yanıt süresinin test edilen tüm cihazların ortalamasından (31 ms) daha kötü olduğu anlamına gelir. | ||
Ekran Titremesi / PWM (Darbe Genişliği Modülasyonu)
| Ekran titriyor / PWM algılanmadı |  | ||
Karşılaştırıldığında: Test edilen tüm cihazların %52 %'si ekranı karartmak için PWM kullanmıyor. PWM tespit edilirse, ortalama 7775 (minimum: 5 - maksimum: 343500) Hz ölçüldü. | |||
Performans - Alder Lake ile Çalışma 14
Test koşulları
Schenker çeşitli performans profilleri sunar. Aşağıdaki kıyaslamaları ve ölçümleri varsayılan olarak etkin olan eğlence modunu kullanarak gerçekleştirdik.
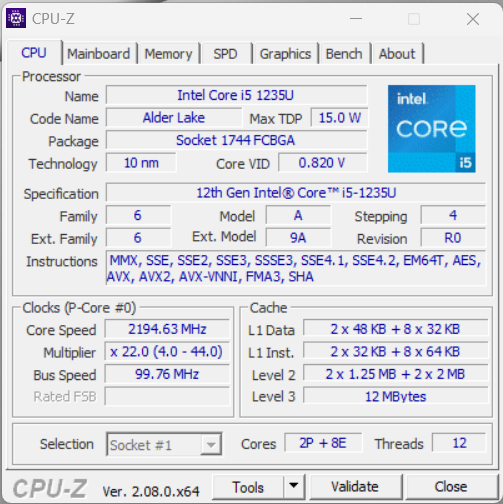
İşlemci - Core i5-1235U
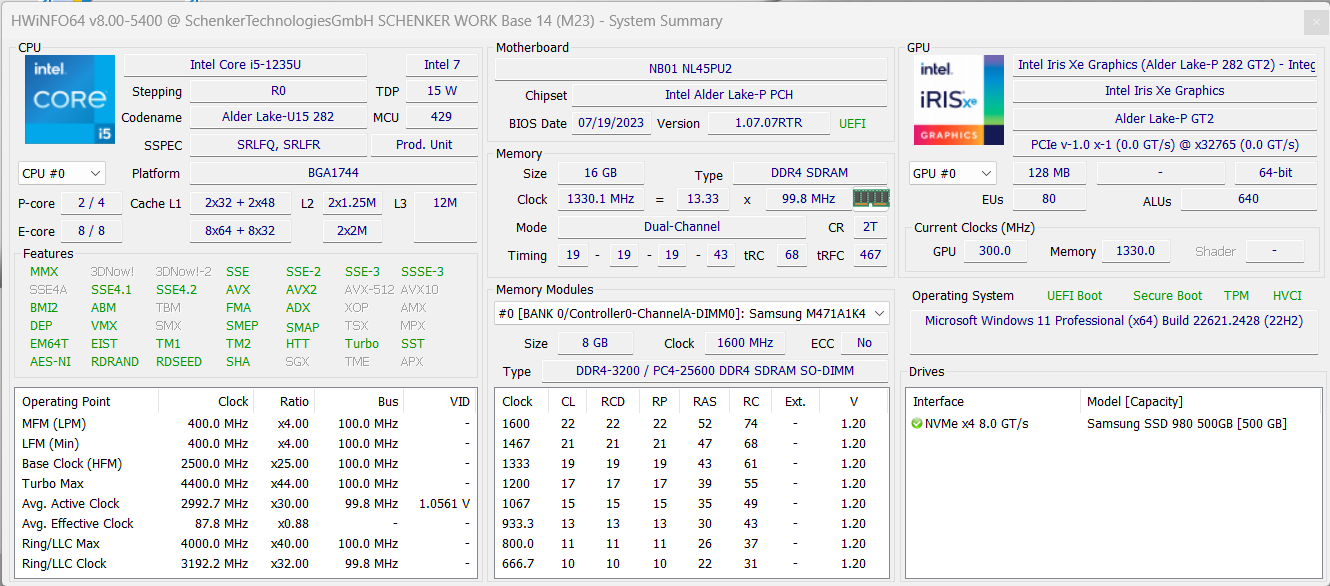
Bu Core i5-1235U intel'in Alder Lake neslindendir, 10 çekirdeğe sahiptir (2x performans, 8x verimlilik) ve Work 14'te 25/20 watt'ta çalıştırılır. Elbette, herhangi bir performans mucizesi beklememelisiniz, ancak genel performansı aşağıdakilerle karşılaştırılabilir Core i5-1345U içinde Dell Latitude 14. CPU performansı, evden veya ofisten çalışırken basit günlük görevler için kesinlikle yeterince iyi ve ayrıca dizüstü bilgisayar çok yavaş hissettirmiyor. Buna karşılık, AI uygulamaları için bir NPU olmadan idare etmeniz gerekecek. Pil kullanımında, işlemcinin maksimum 15 watt tüketmesine izin verilir, bu nedenle performansı %20 daha düşüktür. Daha fazla CPU kıyaslaması bulunabilir burada.
Cinebench R15 Multi continuous test
Cinebench R23: Multi Core | Single Core
Cinebench R20: CPU (Multi Core) | CPU (Single Core)
Cinebench R15: CPU Multi 64Bit | CPU Single 64Bit
Blender: v2.79 BMW27 CPU
7-Zip 18.03: 7z b 4 | 7z b 4 -mmt1
Geekbench 6.7: Multi-Core | Single-Core
Geekbench 5.5: Multi-Core | Single-Core
HWBOT x265 Benchmark v2.2: 4k Preset
LibreOffice : 20 Documents To PDF
R Benchmark 2.5: Overall mean
| CPU Performance rating | |
| Sınıf ortalaması Office | |
| Acer Swift Go 14 SFG14-71 | |
| Dell Latitude 3440 -2! | |
| Lenovo ThinkPad L14 G4 21H6S00900 -2! | |
| HP ProBook 445 G10 | |
| Schenker Work 14 Base | |
| Ortalama Intel Core i5-1235U | |
| Cinebench R23 / Multi Core | |
| Sınıf ortalaması Office (1673 - 22808, n=74, son 2 yıl) | |
| Lenovo ThinkPad L14 G4 21H6S00900 | |
| HP ProBook 445 G10 | |
| Acer Swift Go 14 SFG14-71 | |
| Dell Latitude 3440 | |
| Schenker Work 14 Base | |
| Ortalama Intel Core i5-1235U (2485 - 9208, n=8) | |
| Cinebench R23 / Single Core | |
| Dell Latitude 3440 | |
| Sınıf ortalaması Office (708 - 2130, n=74, son 2 yıl) | |
| Ortalama Intel Core i5-1235U (1444 - 1698, n=8) | |
| Schenker Work 14 Base | |
| Acer Swift Go 14 SFG14-71 | |
| HP ProBook 445 G10 | |
| Lenovo ThinkPad L14 G4 21H6S00900 | |
| Cinebench R20 / CPU (Multi Core) | |
| Sınıf ortalaması Office (648 - 8840, n=73, son 2 yıl) | |
| Lenovo ThinkPad L14 G4 21H6S00900 | |
| HP ProBook 445 G10 | |
| Acer Swift Go 14 SFG14-71 | |
| Dell Latitude 3440 | |
| Schenker Work 14 Base | |
| Ortalama Intel Core i5-1235U (1783 - 3537, n=8) | |
| Cinebench R20 / CPU (Single Core) | |
| Dell Latitude 3440 | |
| Sınıf ortalaması Office (345 - 816, n=73, son 2 yıl) | |
| Schenker Work 14 Base | |
| Ortalama Intel Core i5-1235U (566 - 651, n=8) | |
| Acer Swift Go 14 SFG14-71 | |
| HP ProBook 445 G10 | |
| Lenovo ThinkPad L14 G4 21H6S00900 | |
| Cinebench R15 / CPU Multi 64Bit | |
| Sınıf ortalaması Office (250 - 3380, n=75, son 2 yıl) | |
| Lenovo ThinkPad L14 G4 21H6S00900 | |
| Acer Swift Go 14 SFG14-71 | |
| HP ProBook 445 G10 | |
| Dell Latitude 3440 | |
| Ortalama Intel Core i5-1235U (785 - 1587, n=8) | |
| Schenker Work 14 Base | |
| Cinebench R15 / CPU Single 64Bit | |
| Sınıf ortalaması Office (99.5 - 312, n=75, son 2 yıl) | |
| Dell Latitude 3440 | |
| Acer Swift Go 14 SFG14-71 | |
| HP ProBook 445 G10 | |
| Lenovo ThinkPad L14 G4 21H6S00900 | |
| Schenker Work 14 Base | |
| Ortalama Intel Core i5-1235U (151.5 - 242, n=8) | |
| Blender / v2.79 BMW27 CPU | |
| Schenker Work 14 Base | |
| Ortalama Intel Core i5-1235U (366 - 662, n=8) | |
| Dell Latitude 3440 | |
| Acer Swift Go 14 SFG14-71 | |
| Lenovo ThinkPad L14 G4 21H6S00900 | |
| HP ProBook 445 G10 | |
| Sınıf ortalaması Office (158 - 1940, n=74, son 2 yıl) | |
| 7-Zip 18.03 / 7z b 4 | |
| Sınıf ortalaması Office (7098 - 76886, n=75, son 2 yıl) | |
| HP ProBook 445 G10 | |
| Lenovo ThinkPad L14 G4 21H6S00900 | |
| Dell Latitude 3440 | |
| Acer Swift Go 14 SFG14-71 | |
| Ortalama Intel Core i5-1235U (20166 - 38643, n=8) | |
| Schenker Work 14 Base | |
| 7-Zip 18.03 / 7z b 4 -mmt1 | |
| Dell Latitude 3440 | |
| HP ProBook 445 G10 | |
| Sınıf ortalaması Office (3387 - 6469, n=75, son 2 yıl) | |
| Lenovo ThinkPad L14 G4 21H6S00900 | |
| Schenker Work 14 Base | |
| Acer Swift Go 14 SFG14-71 | |
| Ortalama Intel Core i5-1235U (4371 - 5233, n=8) | |
| Geekbench 6.7 / Multi-Core | |
| Sınıf ortalaması Office (757 - 17846, n=82, son 2 yıl) | |
| Acer Swift Go 14 SFG14-71 | |
| Ortalama Intel Core i5-1235U (6703 - 7046, n=2) | |
| Schenker Work 14 Base | |
| HP ProBook 445 G10 | |
| Geekbench 6.7 / Single-Core | |
| Sınıf ortalaması Office (462 - 2894, n=83, son 2 yıl) | |
| Acer Swift Go 14 SFG14-71 | |
| Ortalama Intel Core i5-1235U (1981 - 2208, n=2) | |
| Schenker Work 14 Base | |
| HP ProBook 445 G10 | |
| Geekbench 5.5 / Multi-Core | |
| Sınıf ortalaması Office (1483 - 16999, n=71, son 2 yıl) | |
| Acer Swift Go 14 SFG14-71 | |
| Ortalama Intel Core i5-1235U (5528 - 8571, n=10) | |
| Dell Latitude 3440 | |
| Schenker Work 14 Base | |
| HP ProBook 445 G10 | |
| Lenovo ThinkPad L14 G4 21H6S00900 | |
| Geekbench 5.5 / Single-Core | |
| Sınıf ortalaması Office (811 - 2128, n=71, son 2 yıl) | |
| Dell Latitude 3440 | |
| Acer Swift Go 14 SFG14-71 | |
| Schenker Work 14 Base | |
| Ortalama Intel Core i5-1235U (1426 - 1643, n=10) | |
| HP ProBook 445 G10 | |
| Lenovo ThinkPad L14 G4 21H6S00900 | |
| HWBOT x265 Benchmark v2.2 / 4k Preset | |
| Sınıf ortalaması Office (2.21 - 26, n=74, son 2 yıl) | |
| Lenovo ThinkPad L14 G4 21H6S00900 | |
| HP ProBook 445 G10 | |
| Acer Swift Go 14 SFG14-71 | |
| Dell Latitude 3440 | |
| Schenker Work 14 Base | |
| Ortalama Intel Core i5-1235U (4.99 - 9.43, n=8) | |
| LibreOffice / 20 Documents To PDF | |
| Acer Swift Go 14 SFG14-71 | |
| Sınıf ortalaması Office (39.9 - 102.3, n=74, son 2 yıl) | |
| HP ProBook 445 G10 | |
| Ortalama Intel Core i5-1235U (42.4 - 65.5, n=8) | |
| Dell Latitude 3440 | |
| Schenker Work 14 Base | |
| Lenovo ThinkPad L14 G4 21H6S00900 | |
| R Benchmark 2.5 / Overall mean | |
| Lenovo ThinkPad L14 G4 21H6S00900 | |
| Sınıf ortalaması Office (0.4098 - 0.888, n=74, son 2 yıl) | |
| HP ProBook 445 G10 | |
| Ortalama Intel Core i5-1235U (0.4986 - 0.603, n=8) | |
| Acer Swift Go 14 SFG14-71 | |
| Schenker Work 14 Base | |
| Dell Latitude 3440 | |
* ... daha küçük daha iyidir
AIDA64: FP32 Ray-Trace | FPU Julia | CPU SHA3 | CPU Queen | FPU SinJulia | FPU Mandel | CPU AES | CPU ZLib | FP64 Ray-Trace | CPU PhotoWorxx
| Performance rating | |
| Sınıf ortalaması Office | |
| Lenovo ThinkPad L14 G4 21H6S00900 | |
| HP ProBook 445 G10 | |
| Dell Latitude 3440 | |
| Acer Swift Go 14 SFG14-71 | |
| Ortalama Intel Core i5-1235U | |
| Schenker Work 14 Base | |
| AIDA64 / FP32 Ray-Trace | |
| Sınıf ortalaması Office (2083 - 31245, n=80, son 2 yıl) | |
| HP ProBook 445 G10 | |
| Lenovo ThinkPad L14 G4 21H6S00900 | |
| Dell Latitude 3440 | |
| Acer Swift Go 14 SFG14-71 | |
| Schenker Work 14 Base | |
| Ortalama Intel Core i5-1235U (3078 - 7457, n=8) | |
| AIDA64 / FPU Julia | |
| Sınıf ortalaması Office (8191 - 125394, n=80, son 2 yıl) | |
| Lenovo ThinkPad L14 G4 21H6S00900 | |
| HP ProBook 445 G10 | |
| Dell Latitude 3440 | |
| Acer Swift Go 14 SFG14-71 | |
| Schenker Work 14 Base | |
| Ortalama Intel Core i5-1235U (15838 - 37760, n=8) | |
| AIDA64 / CPU SHA3 | |
| Sınıf ortalaması Office (433 - 5755, n=80, son 2 yıl) | |
| Lenovo ThinkPad L14 G4 21H6S00900 | |
| HP ProBook 445 G10 | |
| Dell Latitude 3440 | |
| Schenker Work 14 Base | |
| Acer Swift Go 14 SFG14-71 | |
| Ortalama Intel Core i5-1235U (978 - 2072, n=8) | |
| AIDA64 / CPU Queen | |
| Lenovo ThinkPad L14 G4 21H6S00900 | |
| HP ProBook 445 G10 | |
| Sınıf ortalaması Office (22784 - 115197, n=69, son 2 yıl) | |
| Dell Latitude 3440 | |
| Ortalama Intel Core i5-1235U (45680 - 62404, n=8) | |
| Acer Swift Go 14 SFG14-71 | |
| Schenker Work 14 Base | |
| AIDA64 / FPU SinJulia | |
| HP ProBook 445 G10 | |
| Lenovo ThinkPad L14 G4 21H6S00900 | |
| Sınıf ortalaması Office (1378 - 18321, n=80, son 2 yıl) | |
| Dell Latitude 3440 | |
| Ortalama Intel Core i5-1235U (3099 - 4644, n=8) | |
| Acer Swift Go 14 SFG14-71 | |
| Schenker Work 14 Base | |
| AIDA64 / FPU Mandel | |
| Lenovo ThinkPad L14 G4 21H6S00900 | |
| HP ProBook 445 G10 | |
| Sınıf ortalaması Office (4601 - 66922, n=80, son 2 yıl) | |
| Dell Latitude 3440 | |
| Acer Swift Go 14 SFG14-71 | |
| Schenker Work 14 Base | |
| Ortalama Intel Core i5-1235U (8046 - 18819, n=8) | |
| AIDA64 / CPU AES | |
| Lenovo ThinkPad L14 G4 21H6S00900 | |
| Sınıf ortalaması Office (4854 - 155900, n=80, son 2 yıl) | |
| Dell Latitude 3440 | |
| Ortalama Intel Core i5-1235U (23386 - 67140, n=8) | |
| Acer Swift Go 14 SFG14-71 | |
| HP ProBook 445 G10 | |
| Schenker Work 14 Base | |
| AIDA64 / CPU ZLib | |
| Sınıf ortalaması Office (114.6 - 1366, n=80, son 2 yıl) | |
| Dell Latitude 3440 | |
| HP ProBook 445 G10 | |
| Lenovo ThinkPad L14 G4 21H6S00900 | |
| Schenker Work 14 Base | |
| Ortalama Intel Core i5-1235U (329 - 633, n=8) | |
| Acer Swift Go 14 SFG14-71 | |
| AIDA64 / FP64 Ray-Trace | |
| Sınıf ortalaması Office (1109 - 17834, n=80, son 2 yıl) | |
| HP ProBook 445 G10 | |
| Lenovo ThinkPad L14 G4 21H6S00900 | |
| Dell Latitude 3440 | |
| Schenker Work 14 Base | |
| Acer Swift Go 14 SFG14-71 | |
| Ortalama Intel Core i5-1235U (1670 - 3928, n=8) | |
| AIDA64 / CPU PhotoWorxx | |
| Sınıf ortalaması Office (11090 - 65229, n=80, son 2 yıl) | |
| Acer Swift Go 14 SFG14-71 | |
| Ortalama Intel Core i5-1235U (15933 - 41909, n=8) | |
| Schenker Work 14 Base | |
| Dell Latitude 3440 | |
| HP ProBook 445 G10 | |
| Lenovo ThinkPad L14 G4 21H6S00900 | |
Sistem performansı
Günlük kullanımda dizüstü bilgisayarın performansı iyi, ancak PCIe SSD'si de bunda rol oynuyor. Testimiz sırasında sistem kararlılığıyla ilgili herhangi bir sorun yaşamadık ve gerekirse cihazın RAM'i 64 GB'a kadar genişletilebiliyor.
CrossMark: Overall | Productivity | Creativity | Responsiveness
WebXPRT 3: Overall
WebXPRT 4: Overall
Mozilla Kraken 1.1: Total
| PCMark 10 / Score | |
| Sınıf ortalaması Office (2601 - 9298, n=64, son 2 yıl) | |
| Lenovo ThinkPad L14 G4 21H6S00900 | |
| HP ProBook 445 G10 | |
| Acer Swift Go 14 SFG14-71 | |
| Dell Latitude 3440 | |
| Ortalama Intel Core i5-1235U, Intel Iris Xe Graphics G7 80EUs (4528 - 5543, n=8) | |
| Schenker Work 14 Base | |
| PCMark 10 / Essentials | |
| Lenovo ThinkPad L14 G4 21H6S00900 | |
| Dell Latitude 3440 | |
| HP ProBook 445 G10 | |
| Acer Swift Go 14 SFG14-71 | |
| Sınıf ortalaması Office (3245 - 11594, n=64, son 2 yıl) | |
| Ortalama Intel Core i5-1235U, Intel Iris Xe Graphics G7 80EUs (9143 - 11273, n=8) | |
| Schenker Work 14 Base | |
| PCMark 10 / Productivity | |
| HP ProBook 445 G10 | |
| Sınıf ortalaması Office (5336 - 17243, n=64, son 2 yıl) | |
| Lenovo ThinkPad L14 G4 21H6S00900 | |
| Acer Swift Go 14 SFG14-71 | |
| Dell Latitude 3440 | |
| Ortalama Intel Core i5-1235U, Intel Iris Xe Graphics G7 80EUs (6440 - 7354, n=8) | |
| Schenker Work 14 Base | |
| PCMark 10 / Digital Content Creation | |
| Sınıf ortalaması Office (2049 - 13541, n=64, son 2 yıl) | |
| Acer Swift Go 14 SFG14-71 | |
| Dell Latitude 3440 | |
| Schenker Work 14 Base | |
| Lenovo ThinkPad L14 G4 21H6S00900 | |
| Ortalama Intel Core i5-1235U, Intel Iris Xe Graphics G7 80EUs (4220 - 5839, n=8) | |
| HP ProBook 445 G10 | |
| CrossMark / Overall | |
| Sınıf ortalaması Office (381 - 2010, n=73, son 2 yıl) | |
| Acer Swift Go 14 SFG14-71 | |
| Dell Latitude 3440 | |
| Ortalama Intel Core i5-1235U, Intel Iris Xe Graphics G7 80EUs (983 - 1644, n=8) | |
| Schenker Work 14 Base | |
| Lenovo ThinkPad L14 G4 21H6S00900 | |
| CrossMark / Productivity | |
| Acer Swift Go 14 SFG14-71 | |
| Sınıf ortalaması Office (464 - 1880, n=73, son 2 yıl) | |
| Dell Latitude 3440 | |
| Ortalama Intel Core i5-1235U, Intel Iris Xe Graphics G7 80EUs (1026 - 1676, n=8) | |
| Schenker Work 14 Base | |
| Lenovo ThinkPad L14 G4 21H6S00900 | |
| CrossMark / Creativity | |
| Sınıf ortalaması Office (319 - 2361, n=73, son 2 yıl) | |
| Dell Latitude 3440 | |
| Acer Swift Go 14 SFG14-71 | |
| Ortalama Intel Core i5-1235U, Intel Iris Xe Graphics G7 80EUs (1032 - 1618, n=8) | |
| Schenker Work 14 Base | |
| Lenovo ThinkPad L14 G4 21H6S00900 | |
| CrossMark / Responsiveness | |
| Acer Swift Go 14 SFG14-71 | |
| Sınıf ortalaması Office (360 - 1690, n=73, son 2 yıl) | |
| Ortalama Intel Core i5-1235U, Intel Iris Xe Graphics G7 80EUs (746 - 1867, n=8) | |
| Dell Latitude 3440 | |
| Schenker Work 14 Base | |
| Lenovo ThinkPad L14 G4 21H6S00900 | |
| WebXPRT 3 / Overall | |
| Sınıf ortalaması Office (129.9 - 455, n=74, son 2 yıl) | |
| Dell Latitude 3440 | |
| Ortalama Intel Core i5-1235U, Intel Iris Xe Graphics G7 80EUs (233 - 305, n=11) | |
| Lenovo ThinkPad L14 G4 21H6S00900 | |
| Acer Swift Go 14 SFG14-71 | |
| Schenker Work 14 Base | |
| WebXPRT 4 / Overall | |
| Dell Latitude 3440 | |
| Sınıf ortalaması Office (104.2 - 313, n=75, son 2 yıl) | |
| Ortalama Intel Core i5-1235U, Intel Iris Xe Graphics G7 80EUs (206 - 236, n=10) | |
| Schenker Work 14 Base | |
| Lenovo ThinkPad L14 G4 21H6S00900 | |
| Mozilla Kraken 1.1 / Total | |
| Lenovo ThinkPad L14 G4 21H6S00900 | |
| Schenker Work 14 Base | |
| Ortalama Intel Core i5-1235U, Intel Iris Xe Graphics G7 80EUs (486 - 634, n=11) | |
| Sınıf ortalaması Office (391 - 1297, n=76, son 2 yıl) | |
| Acer Swift Go 14 SFG14-71 | |
| Acer Swift Go 14 SFG14-71 | |
| Dell Latitude 3440 | |
* ... daha küçük daha iyidir
| PCMark 10 Score | 4873 puan | |
Yardım | ||
| AIDA64 / Memory Copy | |
| Sınıf ortalaması Office (20075 - 110930, n=77, son 2 yıl) | |
| Acer Swift Go 14 SFG14-71 | |
| Ortalama Intel Core i5-1235U (24653 - 61921, n=8) | |
| Schenker Work 14 Base | |
| Dell Latitude 3440 | |
| HP ProBook 445 G10 | |
| Lenovo ThinkPad L14 G4 21H6S00900 | |
| AIDA64 / Memory Read | |
| Sınıf ortalaması Office (10084 - 128030, n=78, son 2 yıl) | |
| Ortalama Intel Core i5-1235U (24441 - 66108, n=8) | |
| Schenker Work 14 Base | |
| Acer Swift Go 14 SFG14-71 | |
| Dell Latitude 3440 | |
| HP ProBook 445 G10 | |
| Lenovo ThinkPad L14 G4 21H6S00900 | |
| AIDA64 / Memory Write | |
| Sınıf ortalaması Office (20073 - 119858, n=78, son 2 yıl) | |
| Acer Swift Go 14 SFG14-71 | |
| Ortalama Intel Core i5-1235U (25156 - 75808, n=8) | |
| Schenker Work 14 Base | |
| Dell Latitude 3440 | |
| HP ProBook 445 G10 | |
| Lenovo ThinkPad L14 G4 21H6S00900 | |
| AIDA64 / Memory Latency | |
| Acer Swift Go 14 SFG14-71 | |
| Sınıf ortalaması Office (7.6 - 162.9, n=73, son 2 yıl) | |
| Lenovo ThinkPad L14 G4 21H6S00900 | |
| HP ProBook 445 G10 | |
| Ortalama Intel Core i5-1235U (76.3 - 119, n=8) | |
| Schenker Work 14 Base | |
| Dell Latitude 3440 | |
* ... daha küçük daha iyidir
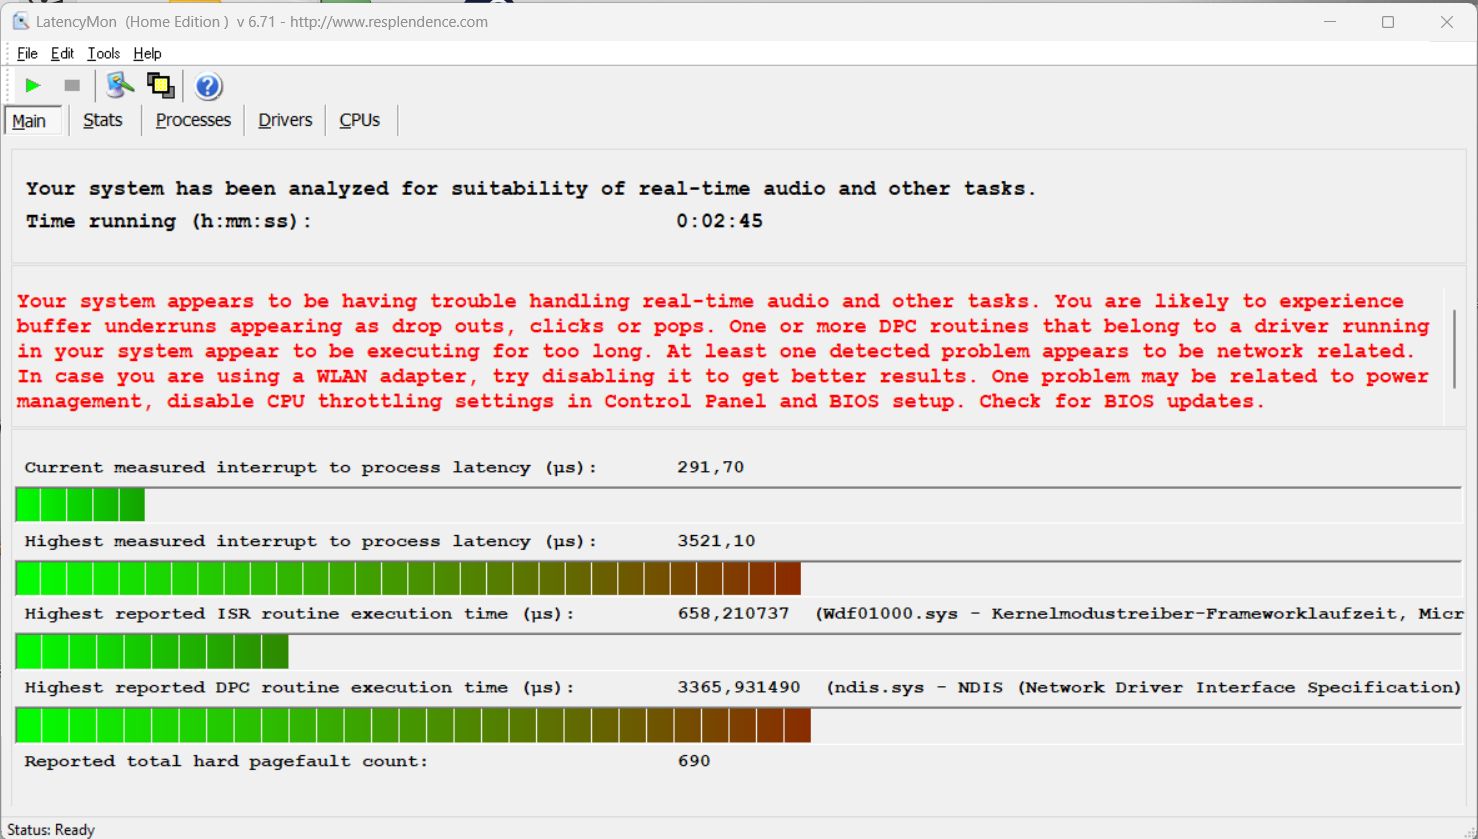
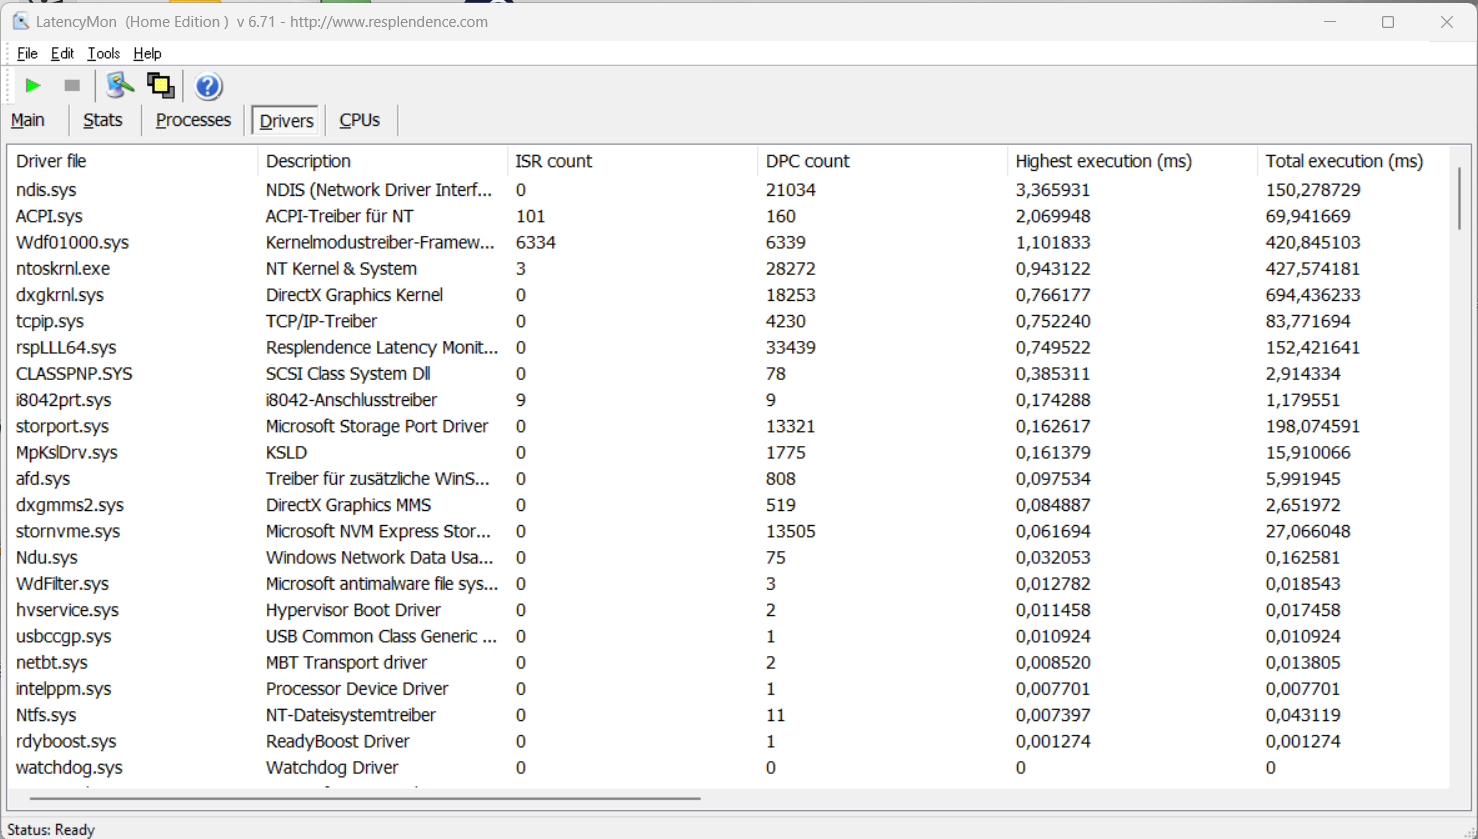
DPC gecikme süreleri
Standartlaştırılmış gecikme testimiz sırasında, mevcut BIOS sürümüne sahip test cihazı gerçek zamanlı ses uygulamalarını kullanırken sınırlamalar gösterdi.
| DPC Latencies / LatencyMon - interrupt to process latency (max), Web, Youtube, Prime95 | |
| Schenker Work 14 Base | |
| Dell Latitude 3440 | |
| Lenovo ThinkPad L14 G4 21H6S00900 | |
| HP ProBook 445 G10 | |
| Acer Swift Go 14 SFG14-71 | |
* ... daha küçük daha iyidir
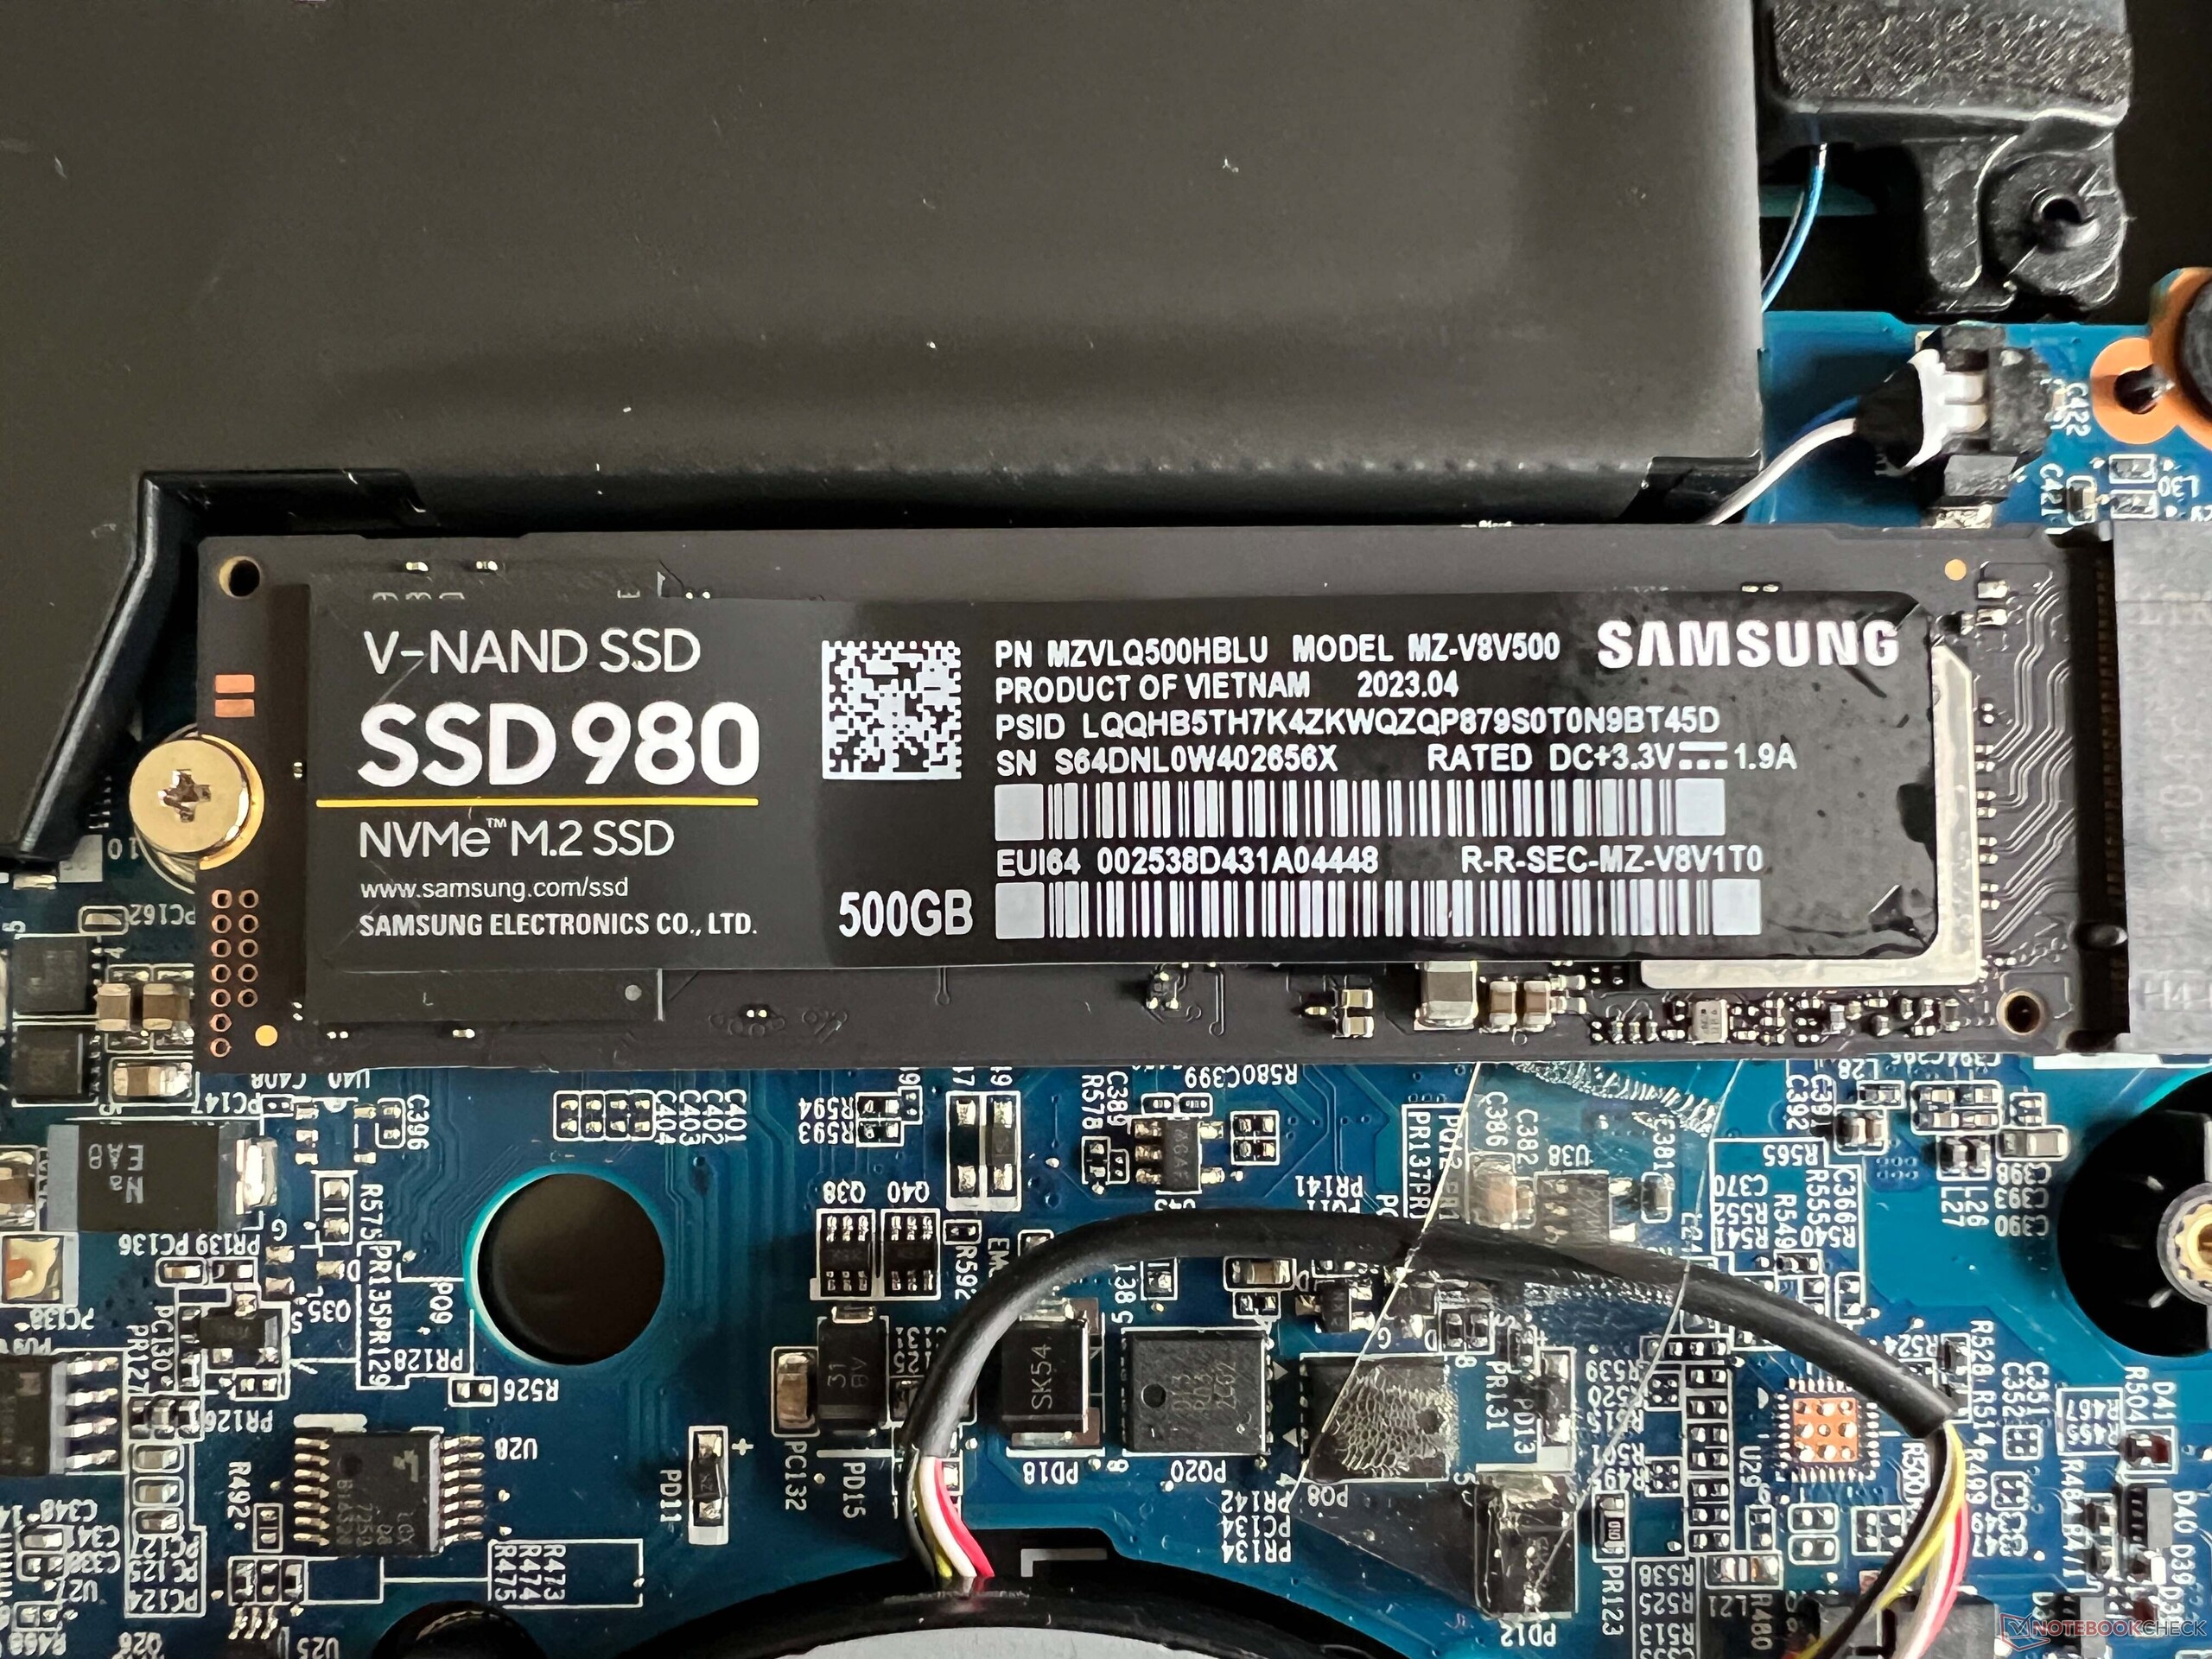
Depolama cihazı
Work 14, M.2-2280 SSD'ler için hızlı bir PCIe 4.0 yuvasına sahiptir. Test cihazımız, Samsung 980'in iyi ve istikrarlı aktarım hızları sunan 500 GB'lık versiyonu ile donatılmıştır. Dizüstü bilgisayar ilk kez açıldıktan sonra kullanıcıların kullanabileceği 422 GB bulunmaktadır. Diğer SSD kıyaslamalarını aşağıda bulabilirsiniz burada.

| Drive Performance rating - Percent | |
| Acer Swift Go 14 SFG14-71 | |
| Dell Latitude 3440 | |
| Sınıf ortalaması Office | |
| Ortalama Samsung SSD 980 500GB (MZ-V8V500BW) | |
| Schenker Work 14 Base | |
| Lenovo ThinkPad L14 G4 21H6S00900 | |
| HP ProBook 445 G10 | |
* ... daha küçük daha iyidir
Reading continuous performance: DiskSpd Read Loop, Queue Depth 8
Grafik kartı
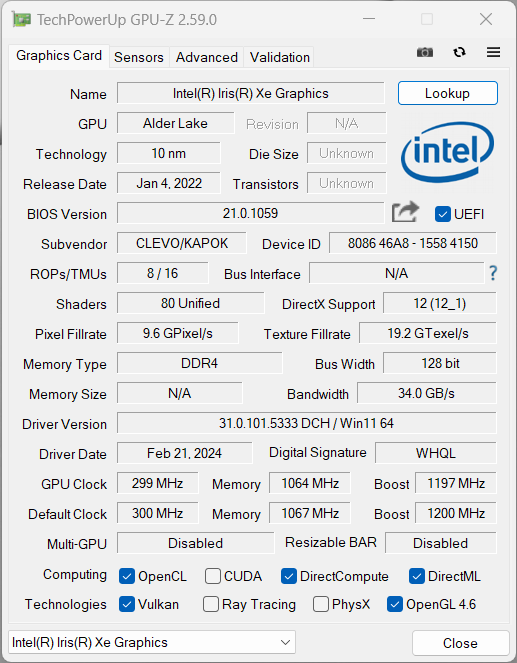
Grafik hesaplamaları entegre sistem tarafından gerçekleştirilir Iris Xe Graphics G7 (80 EUs). IGPU, yüksek çözünürlüklü videoları oynatmak da dahil olmak üzere günlük görevleri iyi bir şekilde yerine getirir, ancak ondan çok daha fazlasını beklememelisiniz. Bununla birlikte, aynı şey Iris GPU ile donatılmış rakipleri için de söylenebilir veya HP ProBook 445, modası geçmiş AMD RX Vega 7.
Oyun kıyaslamalarımız, Work 14 Base'in oyun oynamak için neredeyse hiç uygun olmadığını çok net bir şekilde gösterdi. Daha eski veya daha az zorlu oyunları çalıştırırken bile, genellikle düşük ayrıntı seviyeleriyle sınırlı kalırsınız.
Sürekli yük altında grafik performansı tamamen sabit kalmıyor ve yaklaşık %10 düşüyor. Pil kullanımı sırasında performansta daha fazla düşüş gözlemlemedik. Diğer GPU kıyaslamalarına buradan ulaşabilirsiniz.
| 3DMark Performance rating - Percent | |
| Sınıf ortalaması Office | |
| Acer Swift Go 14 SFG14-71 | |
| Ortalama Intel Iris Xe Graphics G7 80EUs | |
| Schenker Work 14 Base | |
| Dell Latitude 3440 | |
| HP ProBook 445 G10 -1! | |
| Lenovo ThinkPad L14 G4 21H6S00900 | |
| 3DMark 11 - 1280x720 Performance GPU | |
| Sınıf ortalaması Office (2551 - 18313, n=69, son 2 yıl) | |
| Acer Swift Go 14 SFG14-71 | |
| Dell Latitude 3440 | |
| Ortalama Intel Iris Xe Graphics G7 80EUs (2246 - 6579, n=112) | |
| Schenker Work 14 Base | |
| HP ProBook 445 G10 | |
| Lenovo ThinkPad L14 G4 21H6S00900 | |
| 3DMark | |
| 1920x1080 Fire Strike Graphics | |
| Sınıf ortalaması Office (736 - 21871, n=73, son 2 yıl) | |
| Acer Swift Go 14 SFG14-71 | |
| Schenker Work 14 Base | |
| Ortalama Intel Iris Xe Graphics G7 80EUs (1560 - 5398, n=114) | |
| Dell Latitude 3440 | |
| HP ProBook 445 G10 | |
| Lenovo ThinkPad L14 G4 21H6S00900 | |
| 2560x1440 Time Spy Graphics | |
| Sınıf ortalaması Office (493 - 6679, n=68, son 2 yıl) | |
| Acer Swift Go 14 SFG14-71 | |
| Schenker Work 14 Base | |
| Ortalama Intel Iris Xe Graphics G7 80EUs (561 - 1576, n=111) | |
| Dell Latitude 3440 | |
| Lenovo ThinkPad L14 G4 21H6S00900 | |
| Geekbench 5.5 - OpenCL Score | |
| Sınıf ortalaması Office (3474 - 95841, n=69, son 2 yıl) | |
| Acer Swift Go 14 SFG14-71 | |
| Ortalama Intel Iris Xe Graphics G7 80EUs (7294 - 17602, n=112) | |
| Dell Latitude 3440 | |
| Schenker Work 14 Base | |
| Lenovo ThinkPad L14 G4 21H6S00900 | |
| HP ProBook 445 G10 | |
| 3DMark 11 Performance | 5431 puan | |
| 3DMark Fire Strike Score | 3537 puan | |
| 3DMark Time Spy Score | 1331 puan | |
Yardım | ||
| Blender / v3.3 Classroom HIP/AMD | |
| Lenovo ThinkPad L14 G4 21H6S00900 | |
| HP ProBook 445 G10 | |
| Sınıf ortalaması Office (296 - 507, n=5, son 2 yıl) | |
| Blender / v3.3 Classroom CPU | |
| Schenker Work 14 Base | |
| Ortalama Intel Iris Xe Graphics G7 80EUs (463 - 3047, n=53) | |
| Dell Latitude 3440 | |
| Lenovo ThinkPad L14 G4 21H6S00900 | |
| Acer Swift Go 14 SFG14-71 | |
| HP ProBook 445 G10 | |
| Sınıf ortalaması Office (245 - 3219, n=72, son 2 yıl) | |
* ... daha küçük daha iyidir
| Performance rating - Percent | |
| Sınıf ortalaması Office | |
| Acer Swift Go 14 SFG14-71 | |
| Dell Latitude 3440 | |
| Schenker Work 14 Base | |
| HP ProBook 445 G10 | |
| Lenovo ThinkPad L14 G4 21H6S00900 | |
| The Witcher 3 - 1920x1080 Ultra Graphics & Postprocessing (HBAO+) | |
| Sınıf ortalaması Office (14.8 - 18.1, n=4, son 2 yıl) | |
| Acer Swift Go 14 SFG14-71 | |
| HP ProBook 445 G10 | |
| Dell Latitude 3440 | |
| Schenker Work 14 Base | |
| Lenovo ThinkPad L14 G4 21H6S00900 | |
| GTA V - 1920x1080 Highest AA:4xMSAA + FX AF:16x | |
| Sınıf ortalaması Office (5.77 - 45.3, n=67, son 2 yıl) | |
| Acer Swift Go 14 SFG14-71 | |
| Lenovo ThinkPad L14 G4 21H6S00900 | |
| Schenker Work 14 Base | |
| HP ProBook 445 G10 | |
| Dell Latitude 3440 | |
| Final Fantasy XV Benchmark - 1920x1080 High Quality | |
| Sınıf ortalaması Office (8.09 - 79.5, n=69, son 2 yıl) | |
| Acer Swift Go 14 SFG14-71 | |
| Dell Latitude 3440 | |
| Schenker Work 14 Base | |
| HP ProBook 445 G10 | |
| Lenovo ThinkPad L14 G4 21H6S00900 | |
| Strange Brigade - 1920x1080 ultra AA:ultra AF:16 | |
| Sınıf ortalaması Office (12.9 - 142.1, n=51, son 2 yıl) | |
| Acer Swift Go 14 SFG14-71 | |
| Dell Latitude 3440 | |
| Schenker Work 14 Base | |
| HP ProBook 445 G10 | |
| Lenovo ThinkPad L14 G4 21H6S00900 | |
| Dota 2 Reborn - 1920x1080 ultra (3/3) best looking | |
| Sınıf ortalaması Office (14.6 - 135, n=75, son 2 yıl) | |
| Acer Swift Go 14 SFG14-71 | |
| Dell Latitude 3440 | |
| Schenker Work 14 Base | |
| HP ProBook 445 G10 | |
| Lenovo ThinkPad L14 G4 21H6S00900 | |
| X-Plane 11.11 - 1920x1080 high (fps_test=3) | |
| Sınıf ortalaması Office (12 - 82.4, n=66, son 2 yıl) | |
| Dell Latitude 3440 | |
| HP ProBook 445 G10 | |
| Lenovo ThinkPad L14 G4 21H6S00900 | |
| Schenker Work 14 Base | |
| Acer Swift Go 14 SFG14-71 | |
Witcher 3 FPS diagram
| düşük | orta | yüksek | ultra | |
|---|---|---|---|---|
| GTA V (2015) | 76.2 | 66.4 | 15.8 | 6.87 |
| The Witcher 3 (2015) | 66 | 43 | 23 | 9.6 |
| Dota 2 Reborn (2015) | 82.5 | 60 | 46.6 | 41.9 |
| Final Fantasy XV Benchmark (2018) | 30.2 | 17.4 | 12.1 | |
| X-Plane 11.11 (2018) | 30.2 | 23.7 | 21.8 | |
| Far Cry 5 (2018) | 36 | 20 | 19 | 17 |
| Strange Brigade (2018) | 64.6 | 28.3 | 22.4 | 17.6 |
| F1 23 (2023) | 29.3 | 26.7 | 18.3 |
Emisyonlar ve güç
Gürültü emisyonları
Dizüstü bilgisayarı soğutmak için tek bir fan kullanılır. Rölantide ve düşük yük altında oldukça sessiz kalıyor ancak sisteme daha fazla yük bindiğinde fan oldukça yüksek ses çıkarıyor (35 dB(A)) ve buna ek olarak yüksek frekanslı bir gürültü yayıyor. Stres testi sırasında, özellikle dizüstü bilgisayarın düşük performansını göz önünde bulundurduğunuzda, 43 dB(A) çok yüksektir. Test cihazımızdan gelen herhangi bir ek elektronik ses fark etmedik.
Ses yüksekliği
| Boşta |
| 23.6 / 23.6 / 24.8 dB |
| Çalışırken |
| 34.2 / 42.9 dB |
 | ||
30 dB sessiz 40 dB(A) duyulabilirlik 50 dB(A) gürültülü |
||
min: | ||
| Schenker Work 14 Base Iris Xe G7 80EUs, i5-1235U, Samsung SSD 980 500GB (MZ-V8V500BW) | Acer Swift Go 14 SFG14-71 Iris Xe G7 80EUs, i5-1335U, WD PC SN740 SDDQNQD-512G-1014 | HP ProBook 445 G10 Vega 7, R5 7530U, Kioxia BG5 KBG50ZNS512G | Dell Latitude 3440 Iris Xe G7 80EUs, i5-1345U, Samsung PM9A1 MZVL2512HCJQ | Lenovo ThinkPad L14 G4 21H6S00900 Vega 7, R5 7530U, Kioxia BG5 KBG5AZNT512G | |
|---|---|---|---|---|---|
| Noise | -5% | -1% | -3% | -3% | |
| kapalı / ortam * (dB) | 23.6 | 24.9 -6% | 24 -2% | 23.9 -1% | 25.2 -7% |
| Idle Minimum * (dB) | 23.6 | 24.9 -6% | 24 -2% | 24.4 -3% | 25.2 -7% |
| Idle Average * (dB) | 23.6 | 24.9 -6% | 25 -6% | 24.4 -3% | 25.2 -7% |
| Idle Maximum * (dB) | 24.8 | 24.9 -0% | 28 -13% | 24.4 2% | 27.3 -10% |
| Load Average * (dB) | 34.2 | 31.9 7% | 33 4% | 37.1 -8% | 32.1 6% |
| Witcher 3 ultra * (dB) | 34.2 | 43.2 -26% | 36 -5% | 38.2 -12% | 35.7 -4% |
| Load Maximum * (dB) | 42.9 | 43.2 -1% | 36 16% | 40.2 6% | 38.3 11% |
* ... daha küçük daha iyidir
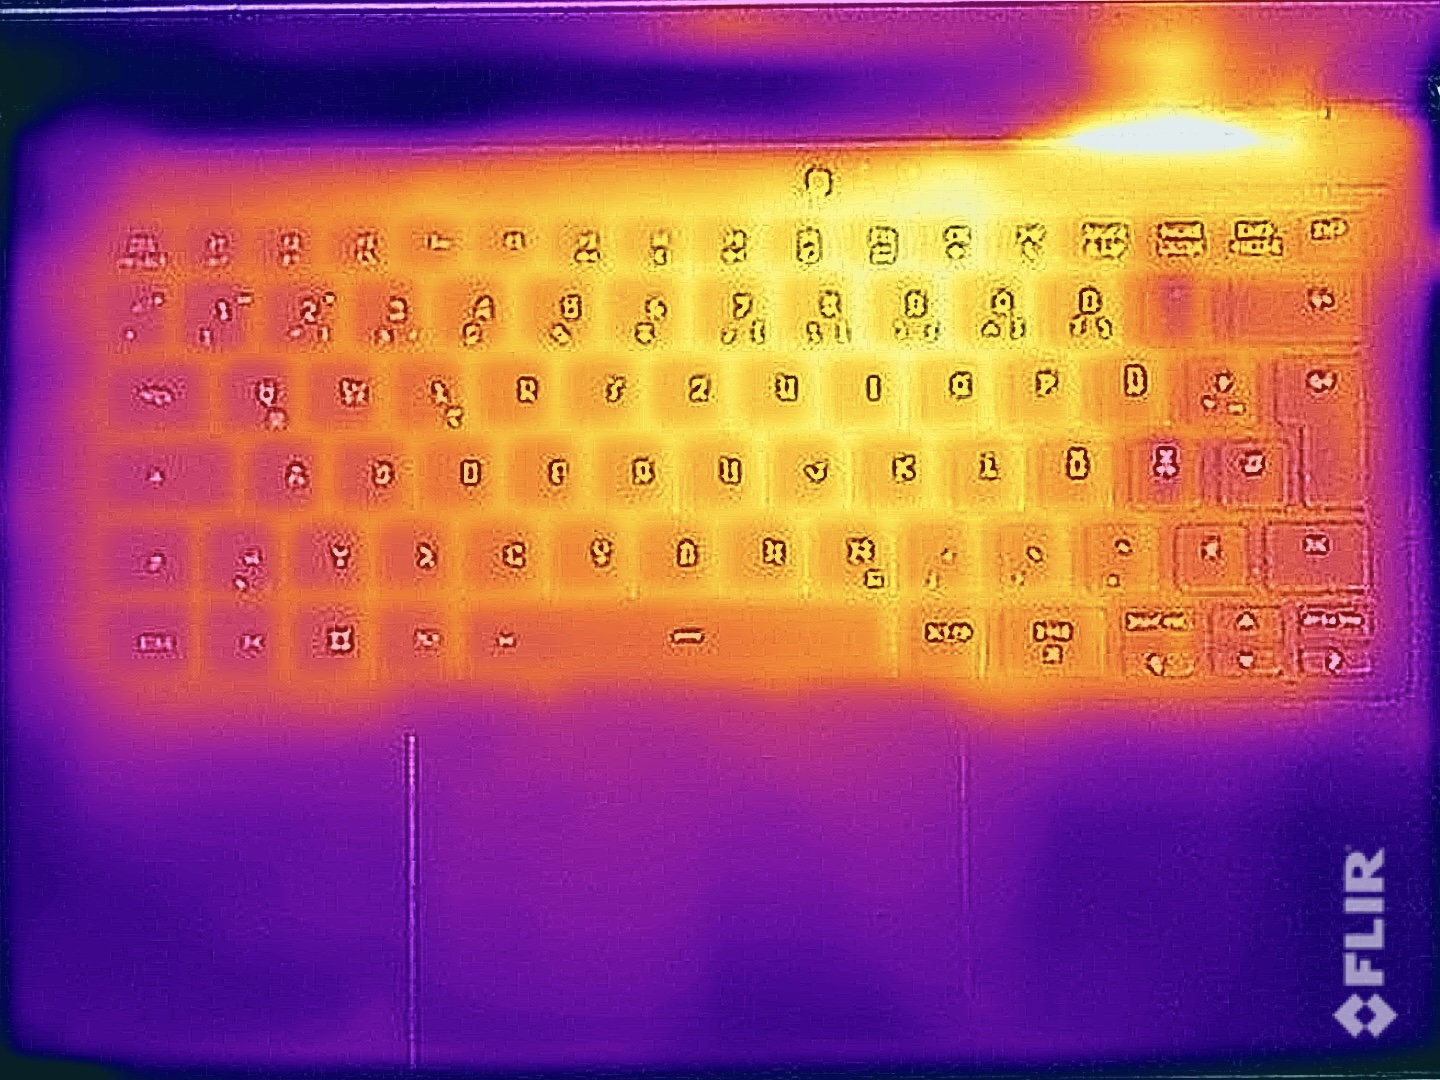
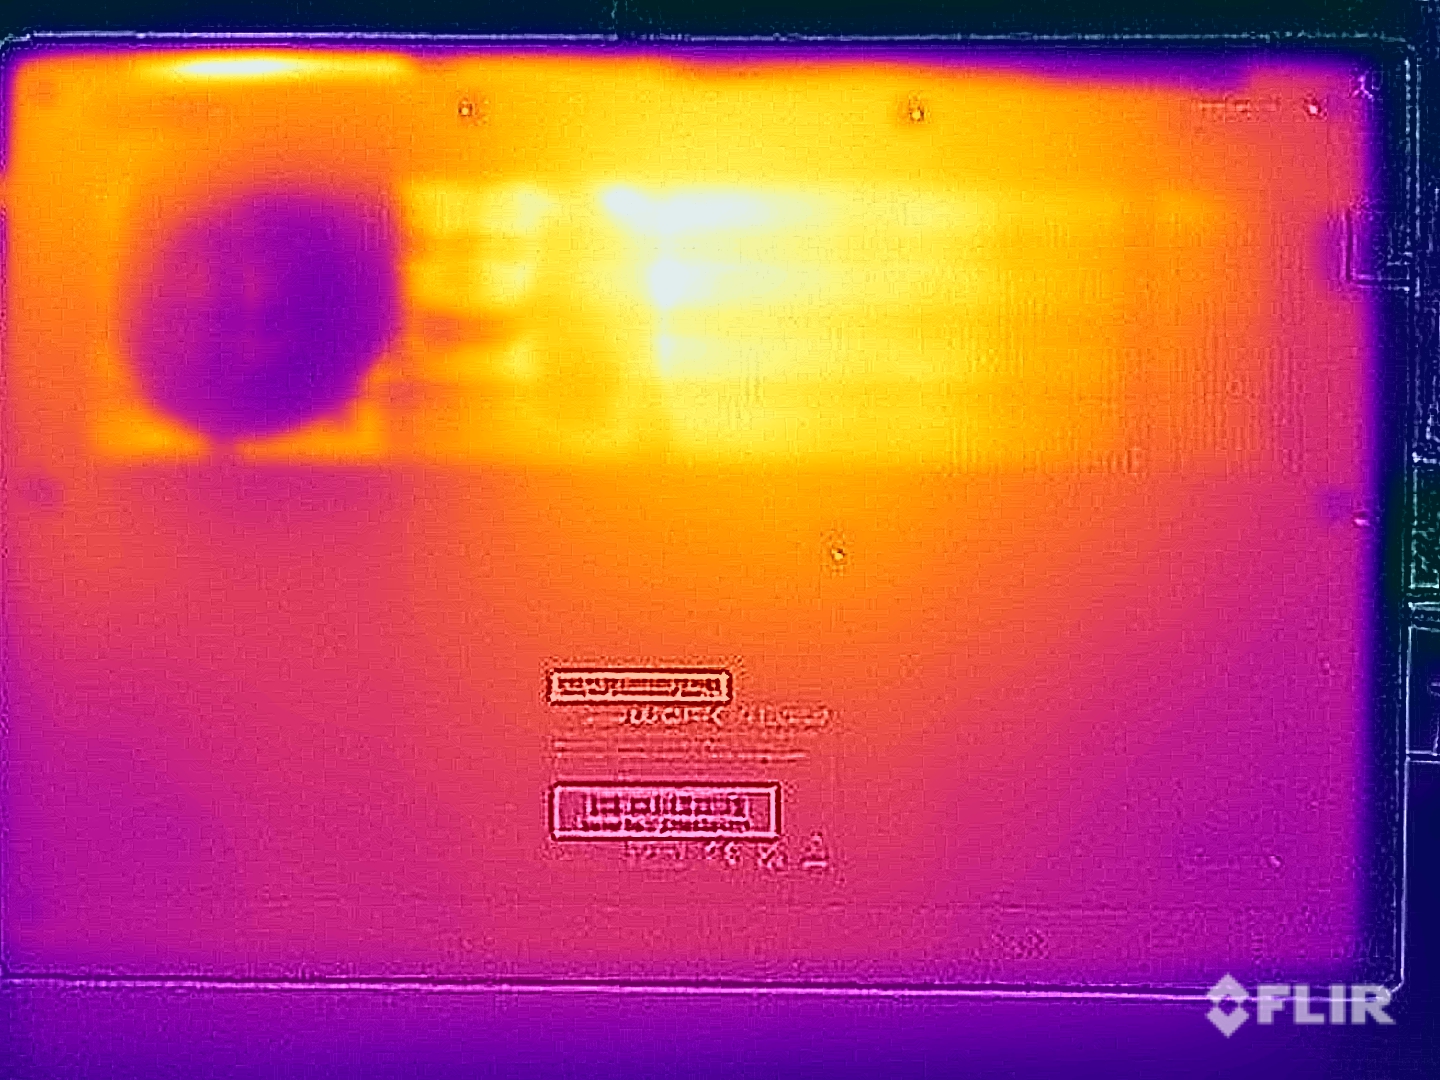
Sıcaklık
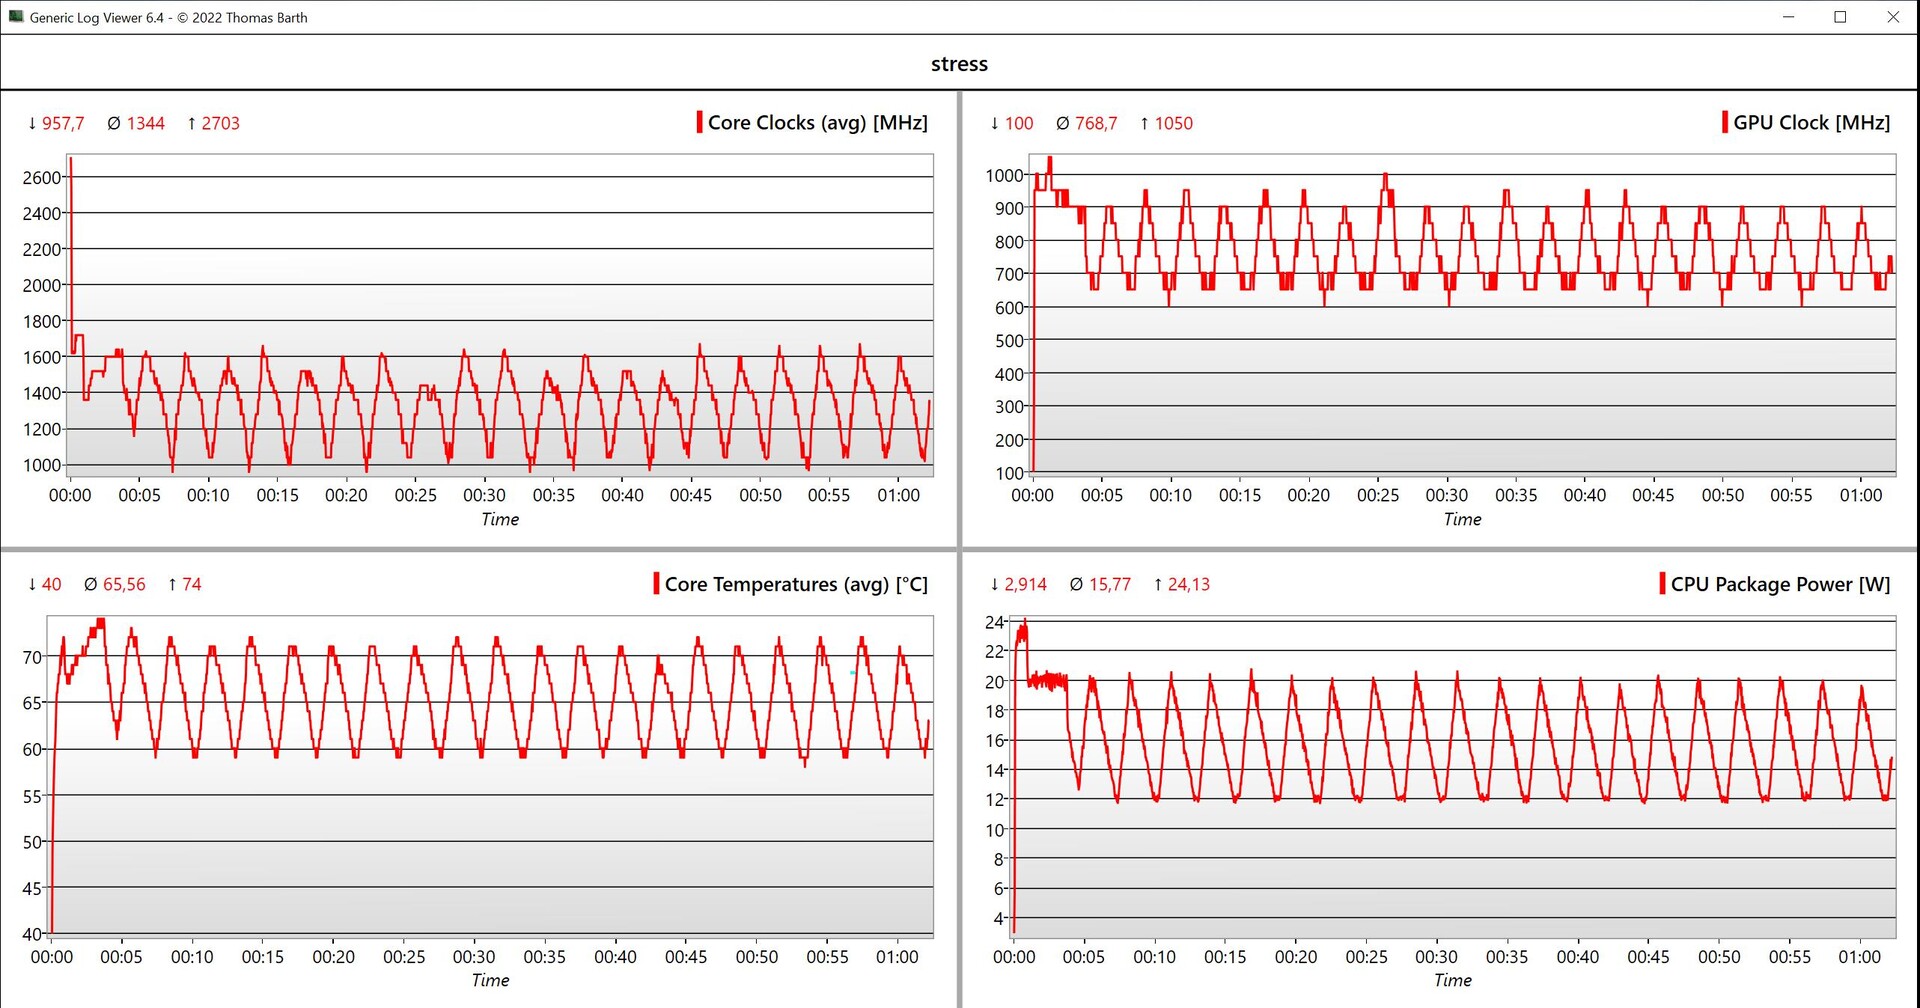
Yüzey sıcaklıkları kritik değildir ve tam yük altında bile Work 14'ü sorunsuz bir şekilde kalçalarınıza yerleştirebilirsiniz, ayrıca yazarken parmaklarınız ısınmaz. Stres testi sırasında, işlemci birkaç dakika boyunca 20 watt tüketti ve ilerleyen süreçte 12 ila 20 watt arasında dengelendi.
(+) Üst taraftaki maksimum sıcaklık, 34.3 °C / 94 F ortalamasına kıyasla 39.2 °C / 103 F'dir. , Office sınıfı için 21.2 ile 62.5 °C arasında değişir.
(±) Alt kısım, 36.8 °C / 98 F ortalamasına kıyasla maksimum 40.4 °C / 105 F'ye kadar ısınır
(+) Boşta kullanımda, üst tarafın ortalama sıcaklığı 24.4 °C / 76 F olup, cihazın 29.5 °C / 85 F.
(±) The Witcher 3 oynarken, üst tarafın ortalama sıcaklığı 33.3 °C / 92 F olup, cihazın 29.5 °C / 85 F.
(+) Avuç içi dayanakları ve dokunmatik yüzey, maksimum 27 °C / 80.6 F ile cilt sıcaklığından daha soğuktur ve bu nedenle dokunulduğunda soğuktur.
(±) Benzer cihazların avuç içi dayanağı alanının ortalama sıcaklığı 27.5 °C / 81.5 F (+0.5 °C / 0.9 F) idi.
| Schenker Work 14 Base Intel Core i5-1235U, Intel Iris Xe Graphics G7 80EUs | Acer Swift Go 14 SFG14-71 Intel Core i5-1335U, Intel Iris Xe Graphics G7 80EUs | HP ProBook 445 G10 AMD Ryzen 5 7530U, AMD Radeon RX Vega 7 | Dell Latitude 3440 Intel Core i5-1345U, Intel Iris Xe Graphics G7 80EUs | Lenovo ThinkPad L14 G4 21H6S00900 AMD Ryzen 5 7530U, AMD Radeon RX Vega 7 | |
|---|---|---|---|---|---|
| Heat | -12% | -15% | -8% | -16% | |
| Maximum Upper Side * (°C) | 39.2 | 44.8 -14% | 43 -10% | 35.2 10% | 39 1% |
| Maximum Bottom * (°C) | 40.4 | 34.8 14% | 51 -26% | 41 -1% | 46.3 -15% |
| Idle Upper Side * (°C) | 25.3 | 30.7 -21% | 27 -7% | 29.8 -18% | 26.3 -4% |
| Idle Bottom * (°C) | 25.8 | 32.5 -26% | 30 -16% | 32 -24% | 37.5 -45% |
* ... daha küçük daha iyidir
Konuşmacılar
Dizüstü bilgisayarın iki stereo hoparlörü yüksek bir maksimum ses seviyesine ulaşabilir, ancak genel kaliteleri son derece zayıftır ve Work 14'ün ana zayıflıklarından biridir. Ucuz ofis dizüstü bilgisayarları hiçbir zaman etkileyici sesleriyle ünlü olmasalar da, Dell'in Latitude 14 daha fazlasının yapılabileceğini göstermektedir. Rekabetin geri kalanı da bu açıdan avantajlıdır.
Schenker Work 14 Base ses analizi
(+) | hoparlörler nispeten yüksek sesle çalabilir (84.4 dB)
Bas 100 - 315Hz
(-) | neredeyse hiç bas yok - ortalama olarak medyandan 22.8% daha düşük
(±) | Bas doğrusallığı ortalamadır (8.6% delta - önceki frekans)
Ortalar 400 - 2000 Hz
(±) | daha yüksek ortalar - ortalama olarak medyandan 9.7% daha yüksek
(±) | Ortaların doğrusallığı ortalamadır (11.7% delta - önceki frekans)
Yüksekler 2 - 16 kHz
(+) | dengeli yüksekler - medyandan yalnızca 4.6% uzakta
(±) | Yükseklerin doğrusallığı ortalamadır (8.5% delta - önceki frekans)
Toplam 100 - 16.000 Hz
(±) | Genel sesin doğrusallığı ortalamadır (25.9% ortancaya göre fark)
Aynı sınıfla karşılaştırıldığında
» Bu sınıftaki tüm test edilen cihazların %79%'si daha iyi, 7% benzer, 14% daha kötüydü
» En iyisinin deltası 7% idi, ortalama 21% idi, en kötüsü 53% idi
Test edilen tüm cihazlarla karşılaştırıldığında
» Test edilen tüm cihazların %80'si daha iyi, 4 benzer, % 16 daha kötüydü
» En iyisinin deltası 4% idi, ortalama 24% idi, en kötüsü 134% idi
Dell Latitude 3440 ses analizi
(+) | hoparlörler nispeten yüksek sesle çalabilir (85.8 dB)
Bas 100 - 315Hz
(±) | azaltılmış bas - ortalama olarak medyandan 14.6% daha düşük
(±) | Bas doğrusallığı ortalamadır (9.8% delta - önceki frekans)
Ortalar 400 - 2000 Hz
(+) | dengeli ortalar - medyandan yalnızca 3% uzakta
(+) | orta frekanslar doğrusaldır (3.5% deltadan önceki frekansa)
Yüksekler 2 - 16 kHz
(+) | dengeli yüksekler - medyandan yalnızca 4.2% uzakta
(+) | yüksekler doğrusaldır (5.9% deltadan önceki frekansa)
Toplam 100 - 16.000 Hz
(+) | genel ses doğrusaldır (11.6% ortancaya göre fark)
Aynı sınıfla karşılaştırıldığında
» Bu sınıftaki tüm test edilen cihazların %3%'si daha iyi, 2% benzer, 95% daha kötüydü
» En iyisinin deltası 7% idi, ortalama 21% idi, en kötüsü 53% idi
Test edilen tüm cihazlarla karşılaştırıldığında
» Test edilen tüm cihazların %8'si daha iyi, 2 benzer, % 90 daha kötüydü
» En iyisinin deltası 4% idi, ortalama 24% idi, en kötüsü 134% idi
Güç tüketimi
Cihazın güç tüketimi değerlerinde herhangi bir sürprizle karşılaşmadık ve 45 watt'lık güç kaynağı yeterince güçlü.
| Kapalı / Bekleme modu | |
| Boşta | |
| Çalışırken |
|
Key:
min: | |
Power consumption Witcher 3 / stress test
Power consumption with external monitor
Çalışma Zamanları
Work 14, 49 Wh bataryaya sahiptir ve bu da 150 cd/m²'de (test cihazımızın maksimum parlaklığının %38'i) 7:38 saat ve WLAN testimiz sırasında maksimum parlaklıkta 5:33 saat pratik çalışma süreleri ile sonuçlanmıştır. Sonuç olarak, bu cihaz rakiplerinin çoğunun gerisinde kaldı ve Work 14 şarj cihazına ihtiyaç duymadan tam bir iş günü geçiremeyecek. Cihazı tamamen şarj etmek, açıkken yaklaşık 2,5 saat sürüyor.
| Battery Runtime | |
| WiFi Websurfing | |
| Lenovo ThinkPad L14 G4 21H6S00900 | |
| Sınıf ortalaması Office (3.83 - 31.5, n=75, son 2 yıl) | |
| HP ProBook 445 G10 | |
| Dell Latitude 3440 | |
| Schenker Work 14 Base | |
| Acer Swift Go 14 SFG14-71 | |
| WiFi Websurfing max. Brightness | |
| Lenovo ThinkPad L14 G4 21H6S00900 | |
| Sınıf ortalaması Office (5.7 - 14.9, n=27, son 2 yıl) | |
| Schenker Work 14 Base | |
Artılar
Eksiler
Karar - İyi bakım seçeneklerine sahip bir ofis dizüstü bilgisayarı
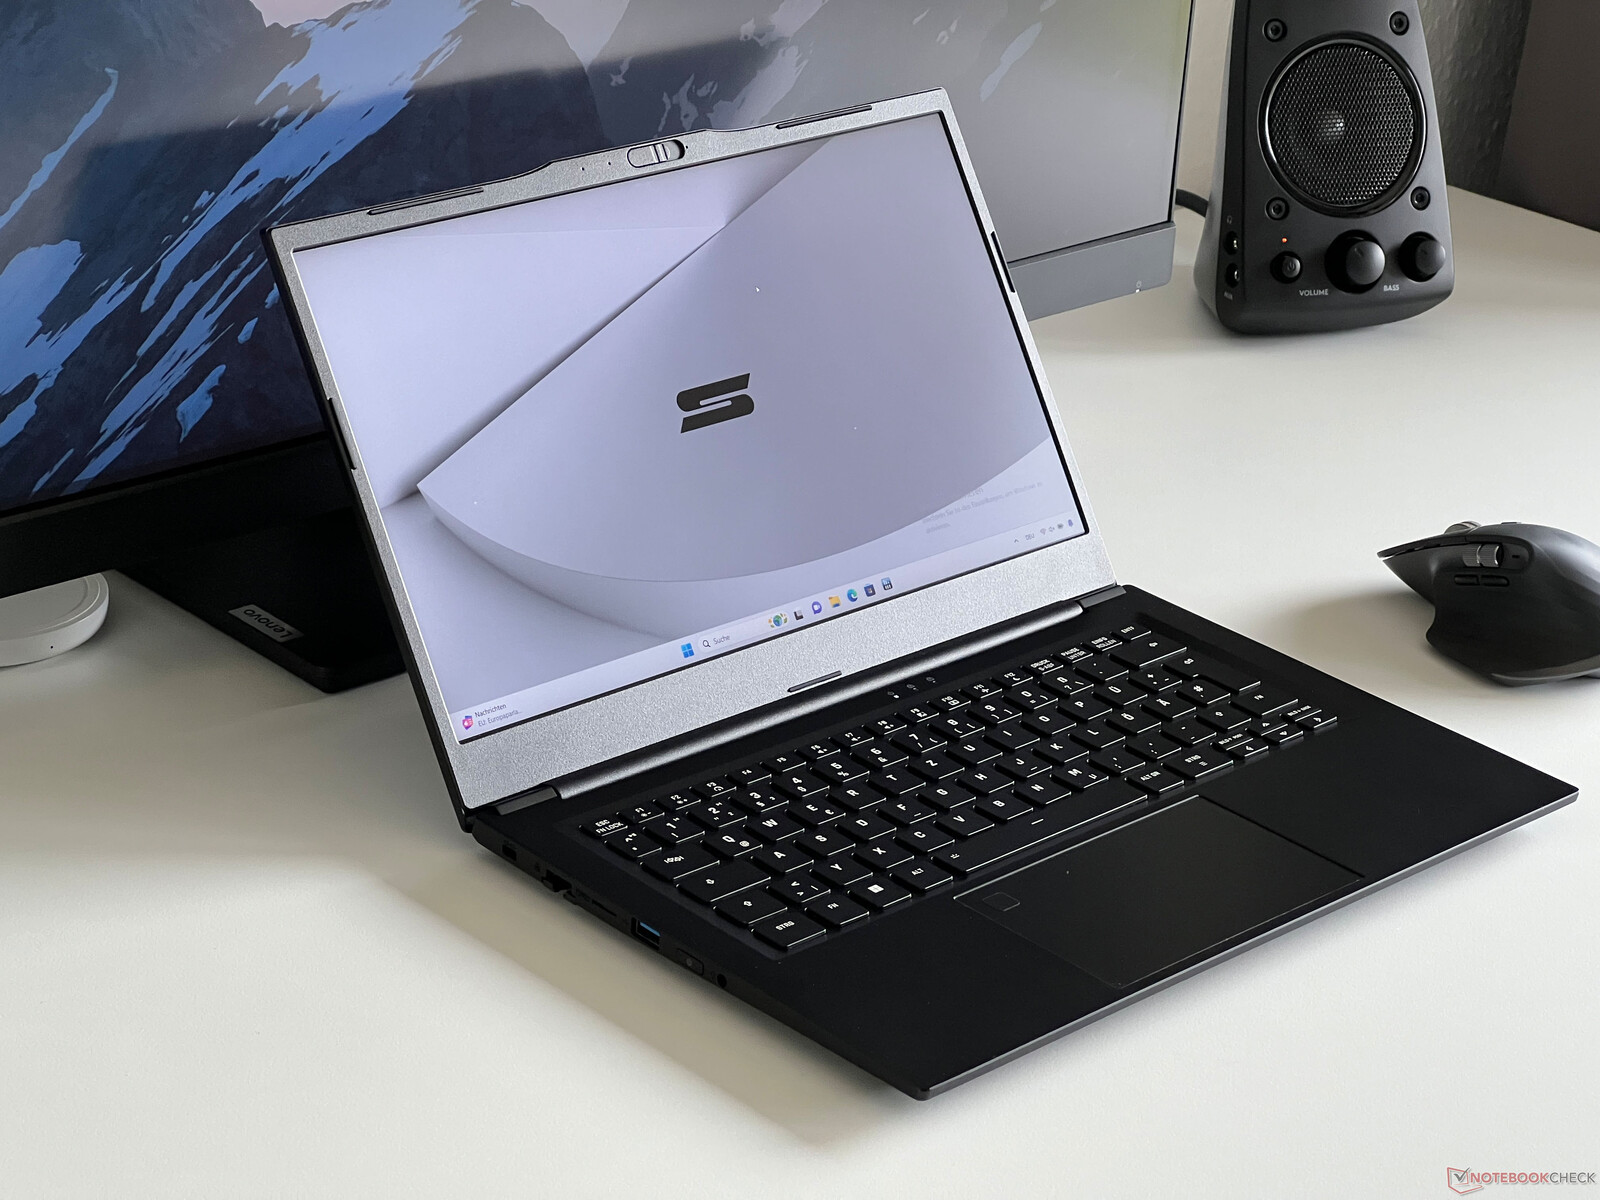
Schenker Work 14 Base, alüminyum kasasının yanı sıra çok iyi bakım seçeneklerine ve geniş bir bağlantı noktası yelpazesine sahip giriş seviyesi bir ofis dizüstü bilgisayarıdır. Ne yazık ki, USB4 ve Thunderbolt gibi modern standartlardan mahrum kalacaksınız ama buna karşılık, yeterli sayıda USB bağlantı noktası ve Gigabit Ethernet bağlantısı var - günümüzde ofis dizüstü bilgisayarlarında her zaman bulunmayan bir özellik. Alüminyum kasası rakiplerinin plastik kasalarından daha kaliteli görünüyor, ancak yüzeyleri çok fazla parmak izi çekiyor ve testimiz sırasında bazı hafif gıcırtı sesleri fark ettik.
Dizüstü bilgisayar, düşük güç sınırlarını kullanan eski bir Core i5-1235U ile donatılmıştır, bu nedenle performansı basit günlük işler için tamamen yeterlidir. Bu iyi öznel izlenimden kısmen PCIe SSD'si de sorumludur. Öte yandan, küçük fanı yük altında oldukça rahatsız edici oluyor çünkü tiz bir ses çıkarıyor ve genel olarak çok gürültülü oluyor. Dizüstü bilgisayarın Full HD çözünürlüklü mat IPS ekranı 400 cd/m² ile çok parlak.
Schenker Work 14 Base, alüminyum kasası, iyi bakım seçenekleri ve mat IPS ekranı ile basit bir ofis dizüstü bilgisayarıdır. Bununla birlikte, grenli bir görüntü ve genel olarak düşük bir performans standardıyla yaşamak zorunda kalacaksınız.
Work 14 Base'in, genellikle biraz daha iyi performans, daha uzun çalışma süresi ve daha iyi hoparlörler sunan rakipleriyle rekabet etmesi de kolay değil. bununla birlikte, 16:9 ekranlar bu fiyat sınıfında hala normdur ve genel olarak, performans söz konusu olduğunda bu segmentte bazı tavizler vermeniz gerekecektir.
Fiyat ve bulunabilirlik
Şu anda Schenker Work 14 Base yaklaşık 750 ABD Doları fiyatla satılıyor ancak Amerika Birleşik Devletleri'nde satın alınamıyor.
Schenker Work 14 Base
- 05/01/2024 v7 (old)
Andreas Osthoff
Şeffaflık
İncelenecek cihazların seçimi editör ekibimiz tarafından yapılır. Test örneği, bu incelemenin amacı doğrultusunda üretici veya perakendeci tarafından yazara ödünç olarak sağlanmıştır. Borç verenin bu inceleme üzerinde herhangi bir etkisi olmadığı gibi, üretici de yayınlanmadan önce bu incelemenin bir kopyasını almamıştır. Bu incelemeyi yayınlama zorunluluğu yoktu. Bağımsız bir medya şirketi olarak Notebookcheck, üreticilerin, perakendecilerin veya yayıncıların otoritesine tabi değildir.
Notebookcheck bu şekilde test yapıyor
Notebookcheck, tüm sonuçların karşılaştırılabilir olmasını sağlamak için her yıl yüzlerce dizüstü bilgisayarı ve akıllı telefonu standart prosedürler kullanarak bağımsız olarak inceliyor. Yaklaşık 20 yıldır test yöntemlerimizi sürekli olarak geliştirdik ve bu süreçte endüstri standartlarını belirledik. Test laboratuvarlarımızda deneyimli teknisyenler ve editörler tarafından yüksek kaliteli ölçüm ekipmanları kullanılmaktadır. Bu testler çok aşamalı bir doğrulama sürecini içerir. Karmaşık derecelendirme sistemimiz, nesnelliği koruyan yüzlerce sağlam temellere dayanan ölçüm ve kıyaslamaya dayanmaktadır.Price comparison

