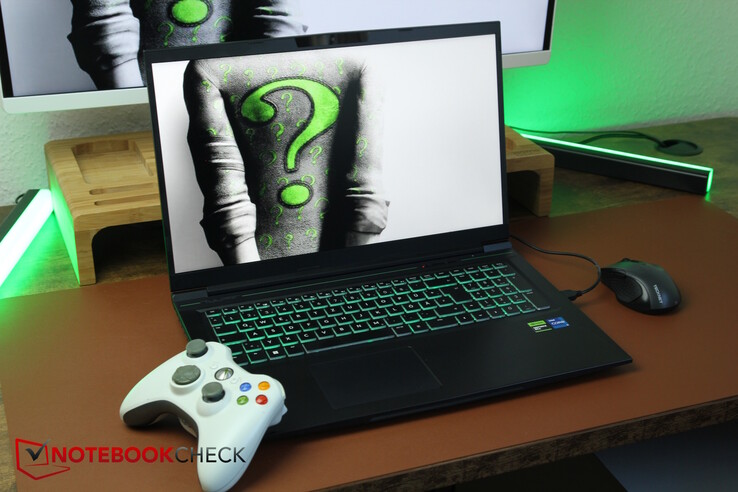
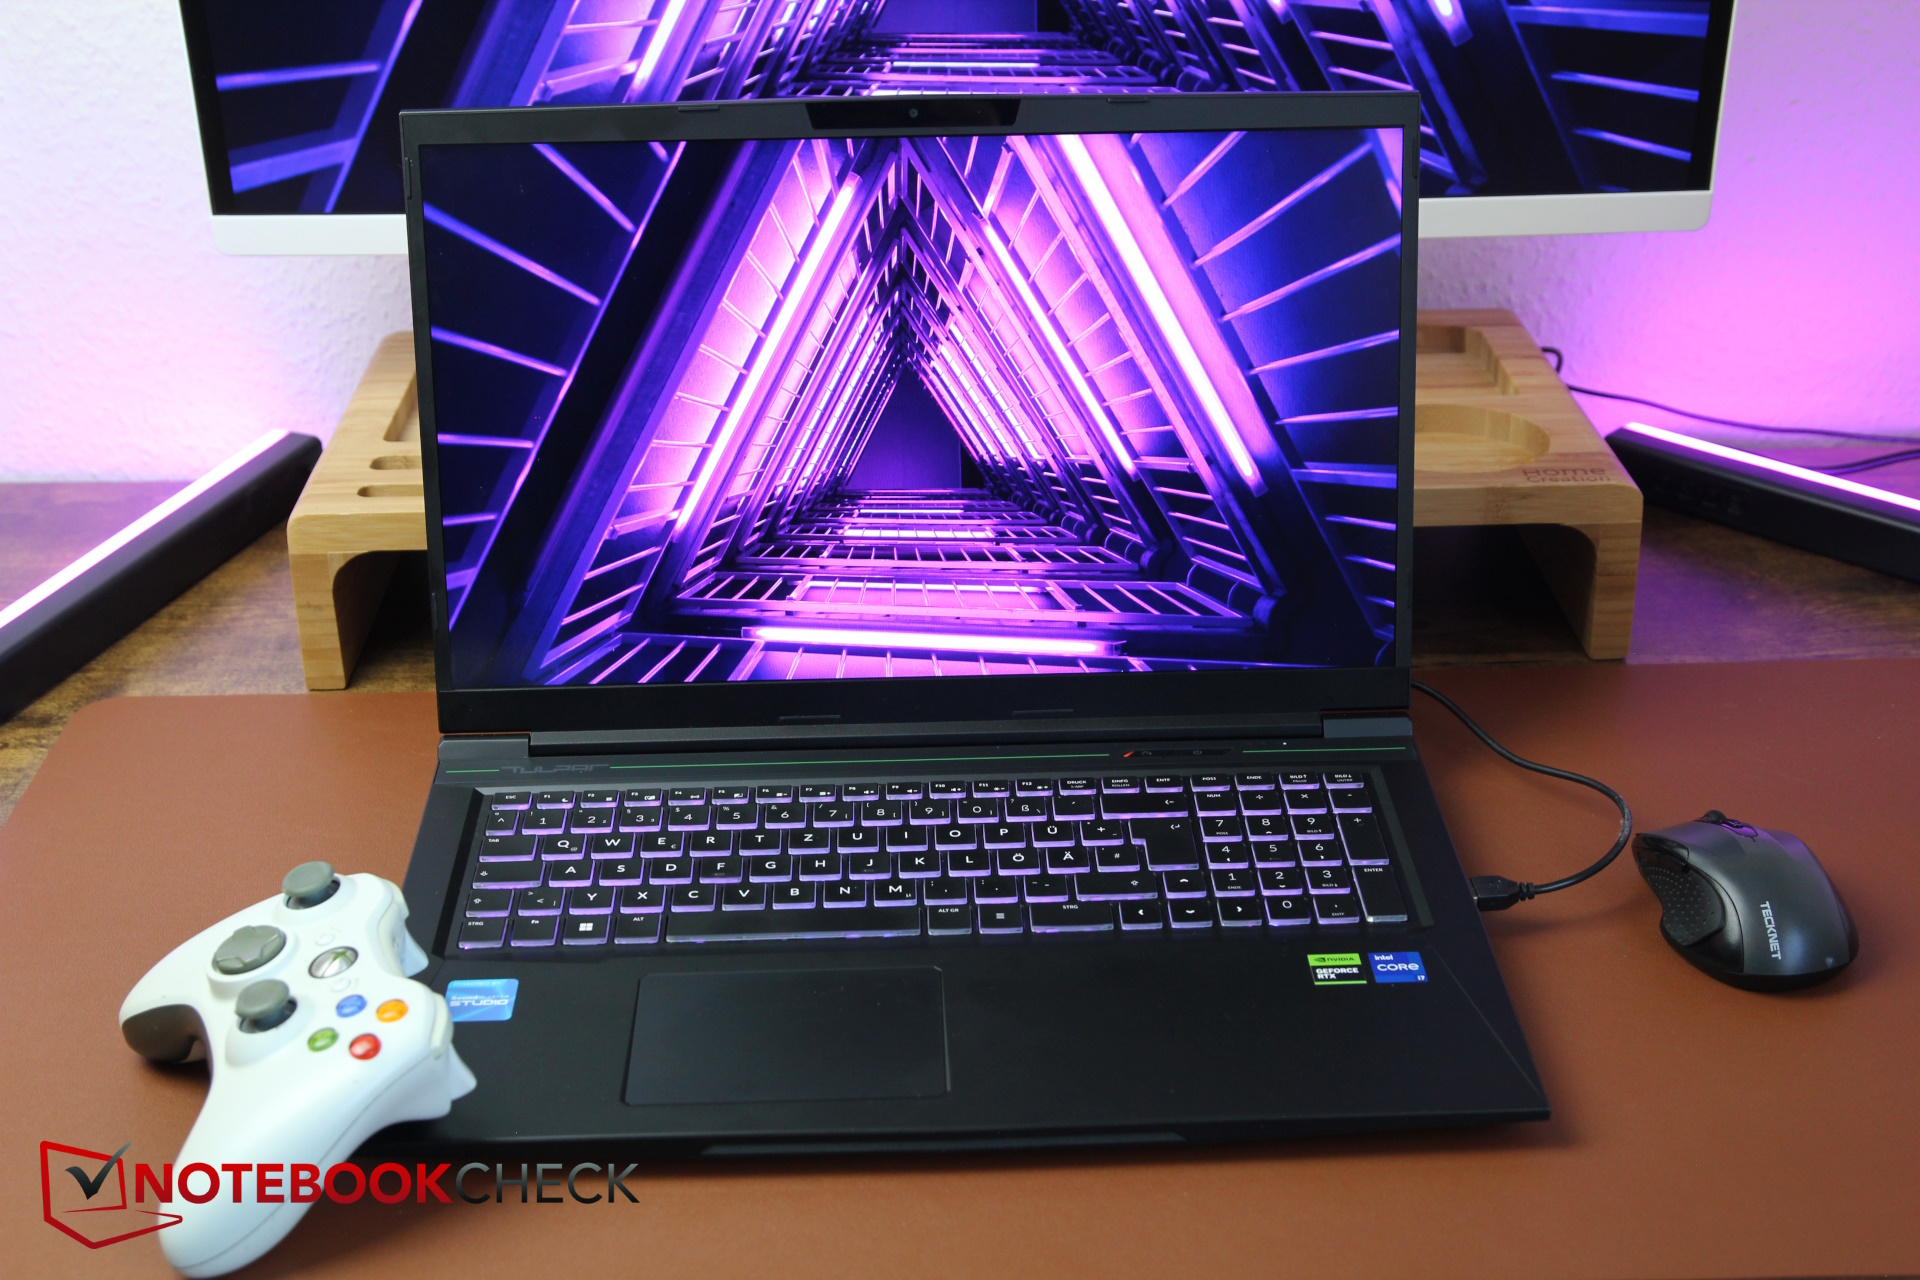
Tulpar T7 V20.6 (Tongfang GM7PG0R) dizüstü bilgisayar incelemesi: Şu anda en ucuz RTX 4060 oyuncularından biri
Aslen Türk olan ve teknik olarak Monster Notebook adıyla ticaret yapan şirket, 2022 yılında Avrupa pazarı için marka adını Tulpar Notebook olarak değiştirdi. Tulpar'ın DACH merkezi Berlin'in merkezinde, Alexanderplatz'da bulunuyor ve burada çeşitli ürünleri deneyebilir ve cihazınıza servis hizmeti alabilirsiniz.
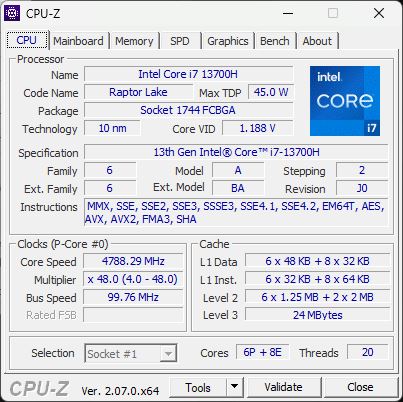
Tulpar'ın dizüstü bilgisayarları son zamanlarda artan bir ilgi görüyor, bu da nihayet ilk Tulpar dizüstü bilgisayarımızı test etme şansına sahip olduğumuz anlamına geliyor. "A serisi, ara sıra oyun oynayanlar için daha uygun fiyatlı temel modeller içeriyor. T serisi ise yüksek talepleri olan sık oyuncuları hedefliyor," diyor üreticinin web sitesi. Yüksek talepleri olan ağır oyuncular için bir model olan T7'yi test ediyoruz - ancak "A ve T dizüstü bilgisayar serileri en son teknolojik standartlara göre tasarlanmış" olmasına rağmen, şu anda Intel'in en son Gen14 CPU'suna sahip sadece iki T6 modeli var. T7 modelimiz hala bir i7-13700H son Intel neslinden. Buna ek olarak, bir RTX 4060 tonfang GM7PG0R kasasının içinde.
Tulpar dizüstü bilgisayarın şu anki cazibesi her şeyden önce düşük fiyatı. Düşük fiyat mı? Web sitesinde, 1 TB depolama alanına sahip modelin fiyatı yaklaşık 1.800 ABD Doları! Ancak aynı zamanda, T7 dizüstü bilgisayarı, bunun için çok daha az talep eden bazı çevrimiçi perakendecilerden de alabilirsiniz.
18 inçlik modellerin yükselişi nedeniyle bu yıl daha az sayıda 17 inçlik oyuncu bilgisayarı piyasaya sürülüyor. Sonuç olarak, T7'yi geçen yılın diğer bütçe ve orta sınıf oyuncularıyla karşılaştıracağız, örneğin XMG Apex 17, Acer Nitro 17, Medion Erazer Defender P40 ve MSI Katana 17. Buna ek olarak, 16 inçlik Lenovo Legion 5i 16 G9 en son teknolojinin ne kadar ileri gidebileceğini görmek için güncel bir CPU ile ringe çıkıyor.
Karşılaştırmalı olarak olası rakipler
Derecelendirme | Tarih | Modeli | Ağırlık | Yükseklik | Boyut | Çözünürlük | Fiyat |
|---|---|---|---|---|---|---|---|
| 86.3 % v7 (old) | 05/2024 | Tulpar T7 V20.6 i7-13700H, GeForce RTX 4060 Laptop GPU | 2.6 kg | 30.05 mm | 17.30" | 1920x1080 | |
| 87.1 % v7 (old) | 10/2023 | Schenker XMG Apex 17 (Late 23) R7 7840HS, GeForce RTX 4060 Laptop GPU | 2.5 kg | 24.9 mm | 17.30" | 2560x1440 | |
| 87.2 % v7 (old) | 12/2023 | Acer Nitro 17 AN17-51-71ER i7-13700H, GeForce RTX 4060 Laptop GPU | 3 kg | 30.3 mm | 17.30" | 2560x1440 | |
| 84.6 % v7 (old) | 08/2023 | Medion Erazer Defender P40 i7-13700HX, GeForce RTX 4060 Laptop GPU | 2.9 kg | 33 mm | 17.30" | 2560x1440 | |
| 82.1 % v7 (old) | 06/2023 | MSI Katana 17 B13VFK i7-13620H, GeForce RTX 4060 Laptop GPU | 2.8 kg | 25.2 mm | 17.30" | 1920x1080 | |
| 89.1 % v7 (old) | 02/2024 | Lenovo Legion 5 16IRX G9 i7-14650HX, GeForce RTX 4060 Laptop GPU | 2.4 kg | 25.2 mm | 16.00" | 2560x1600 |
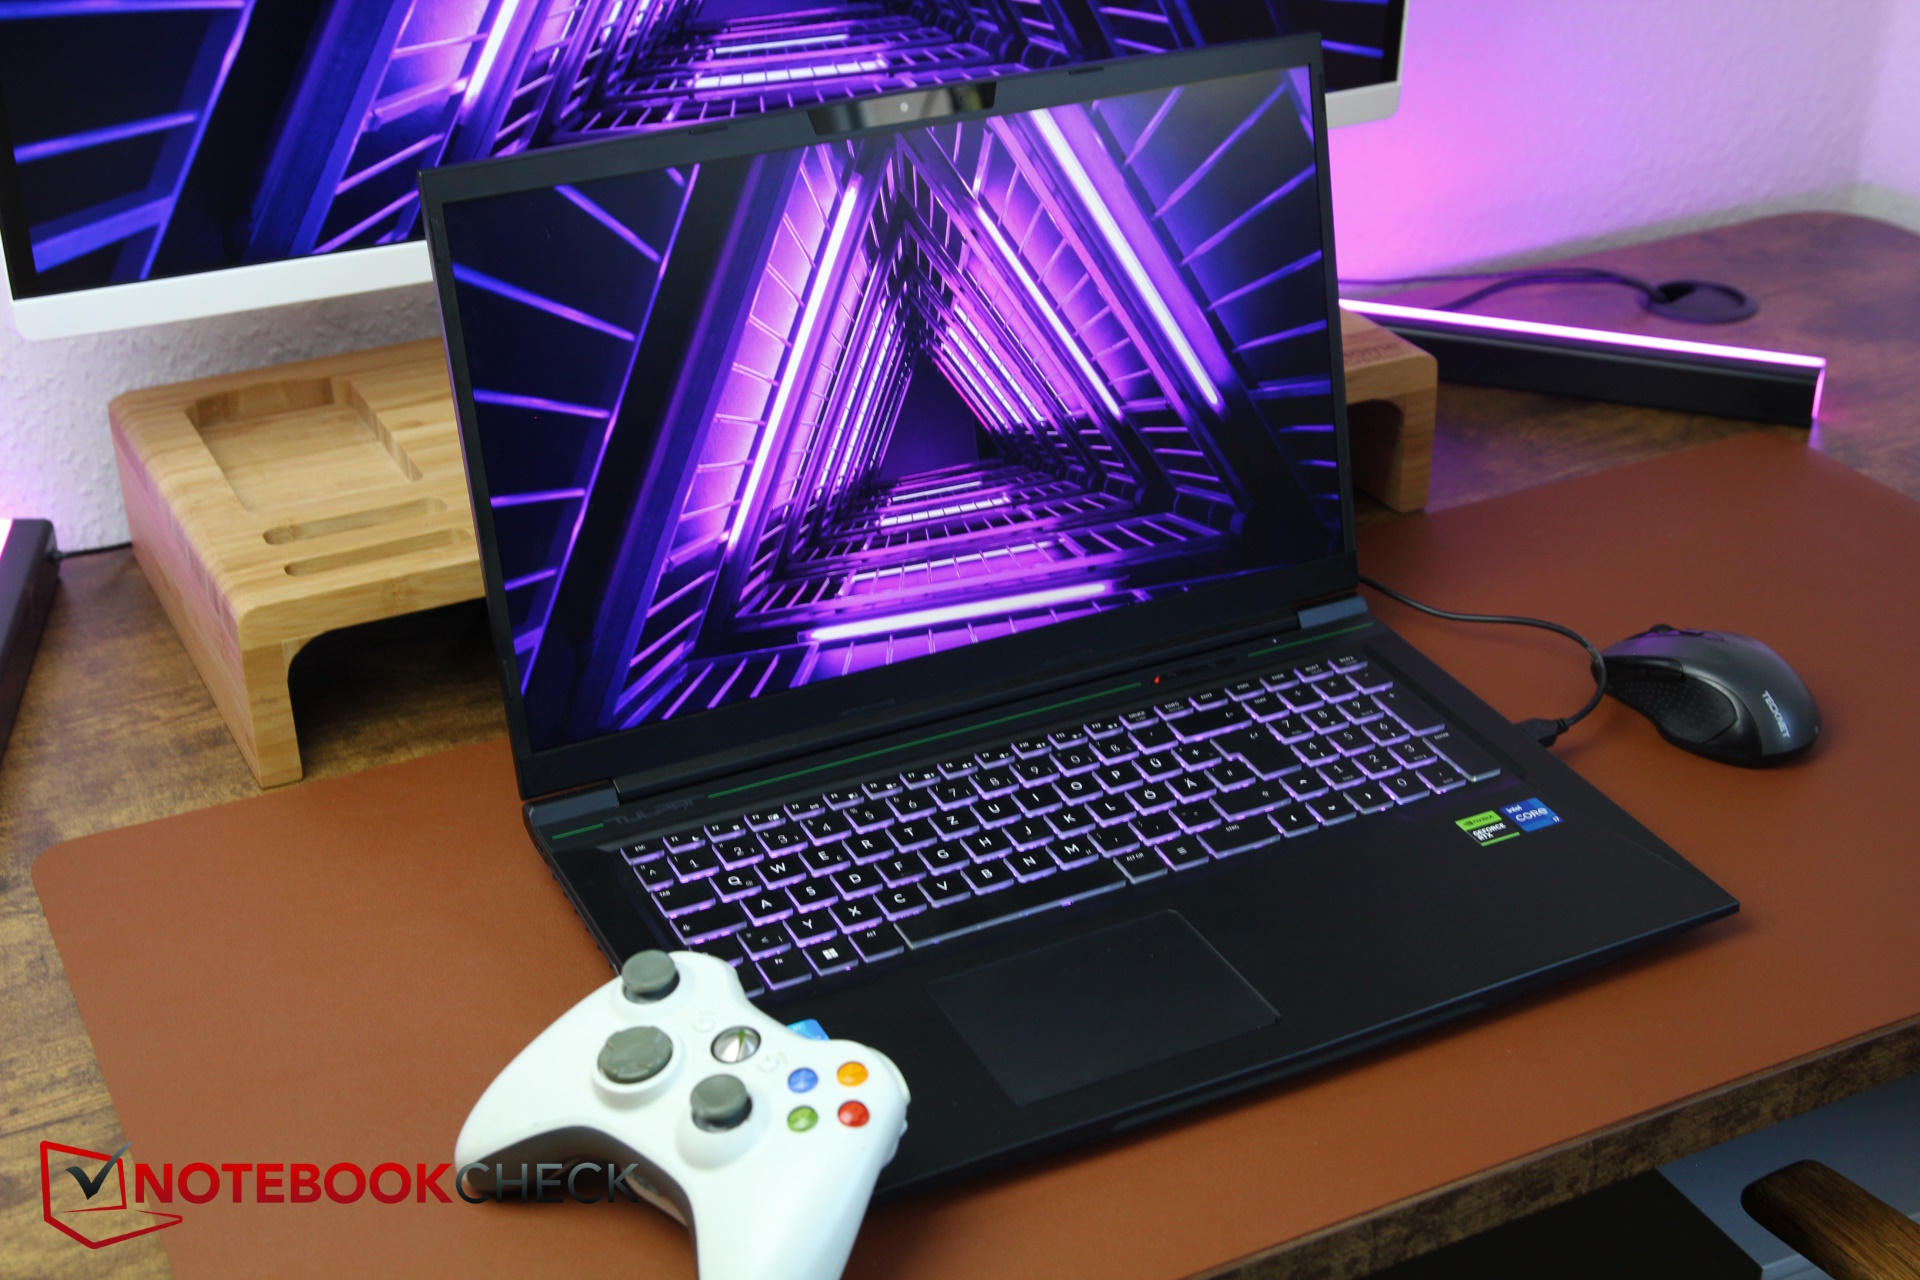
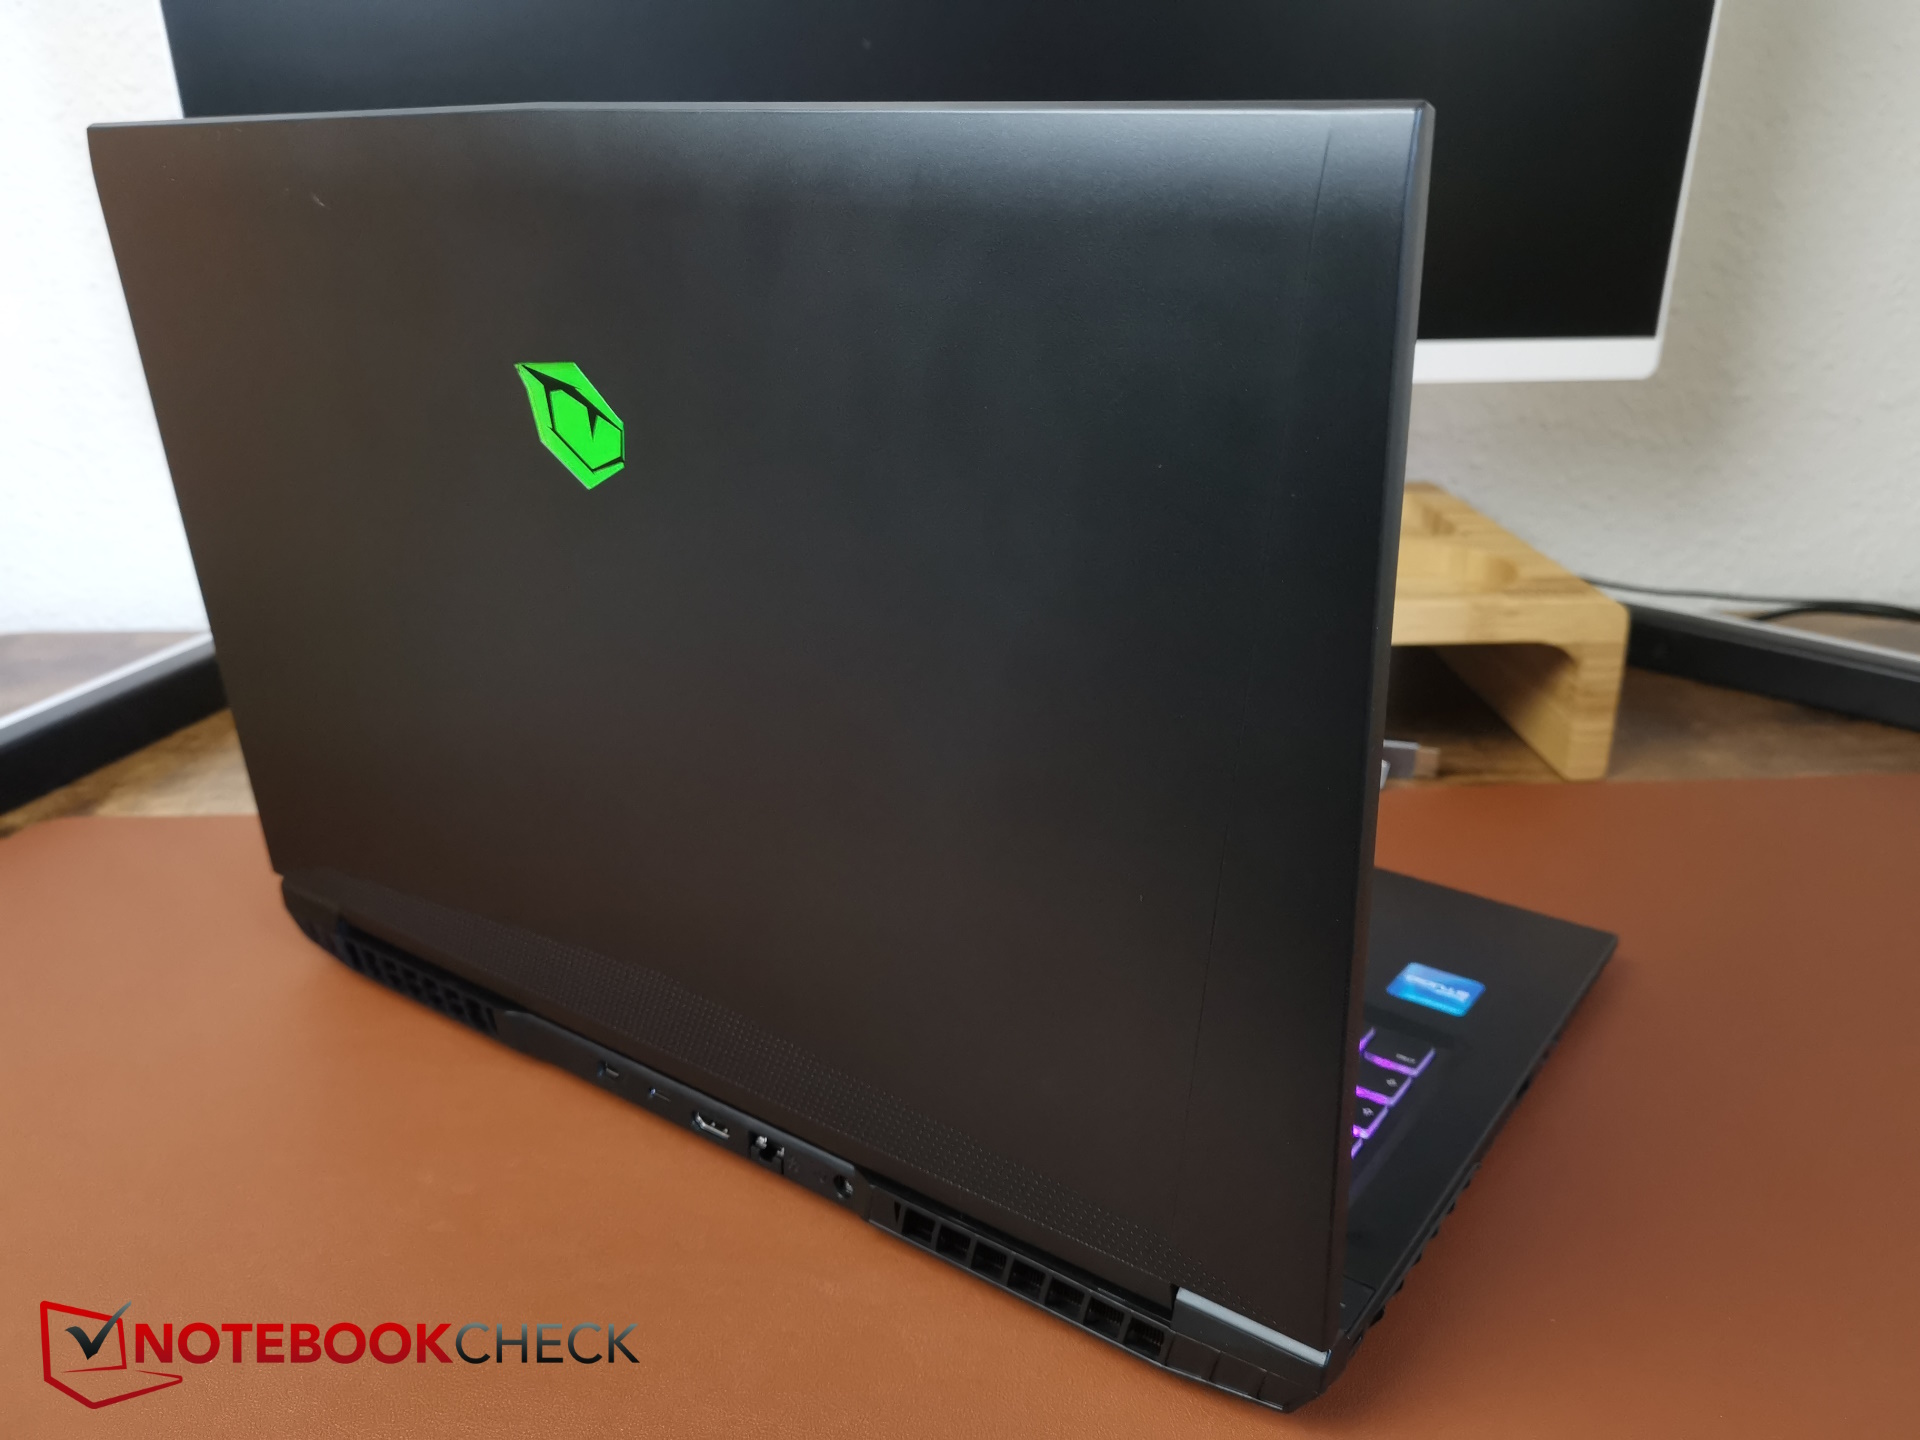
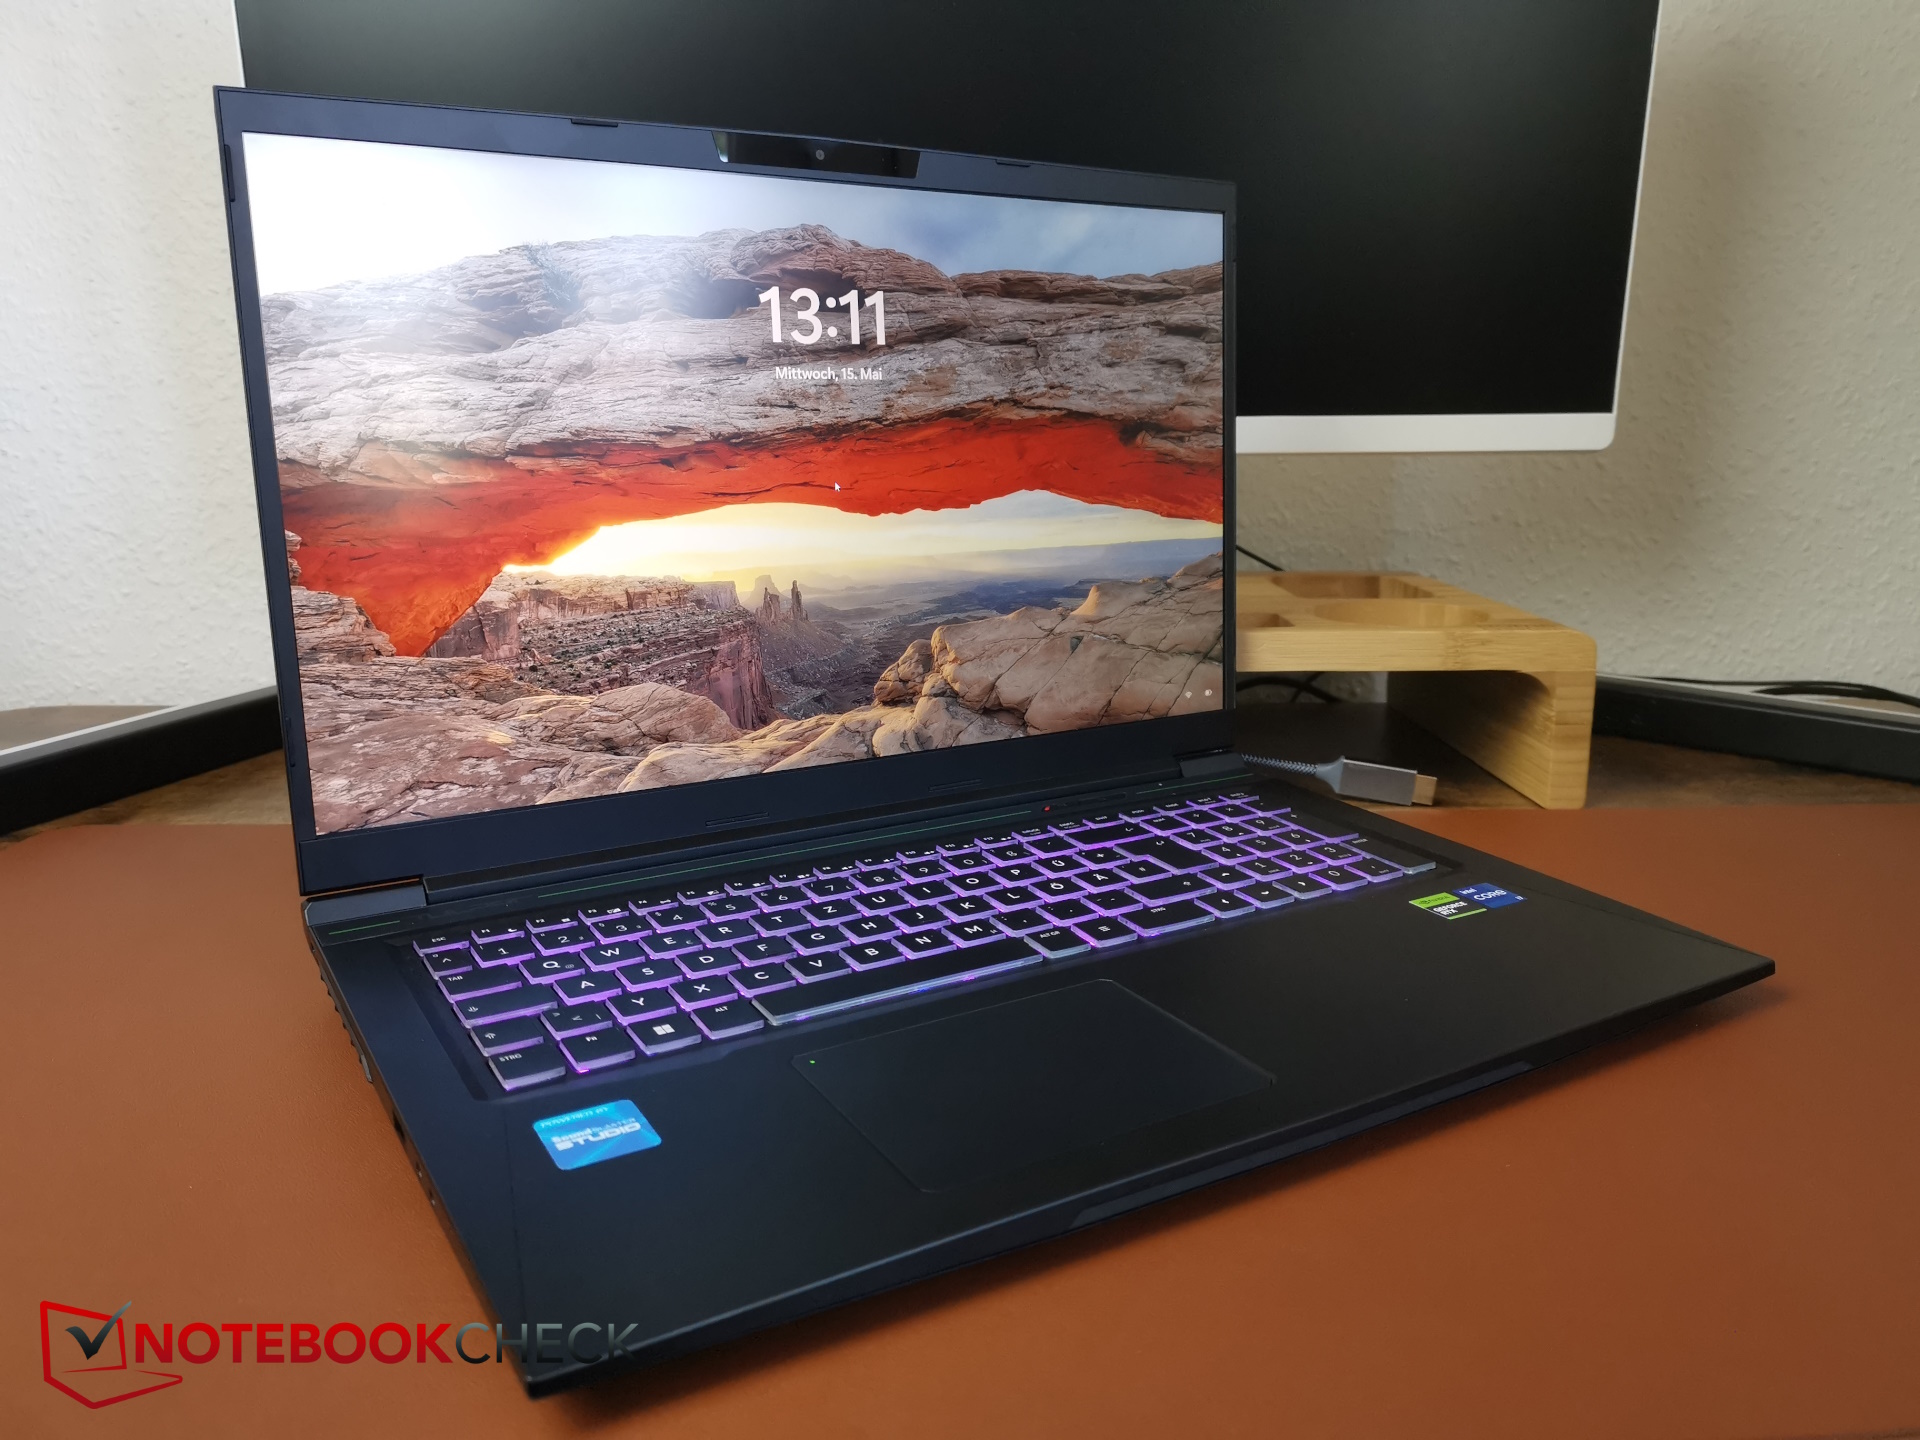
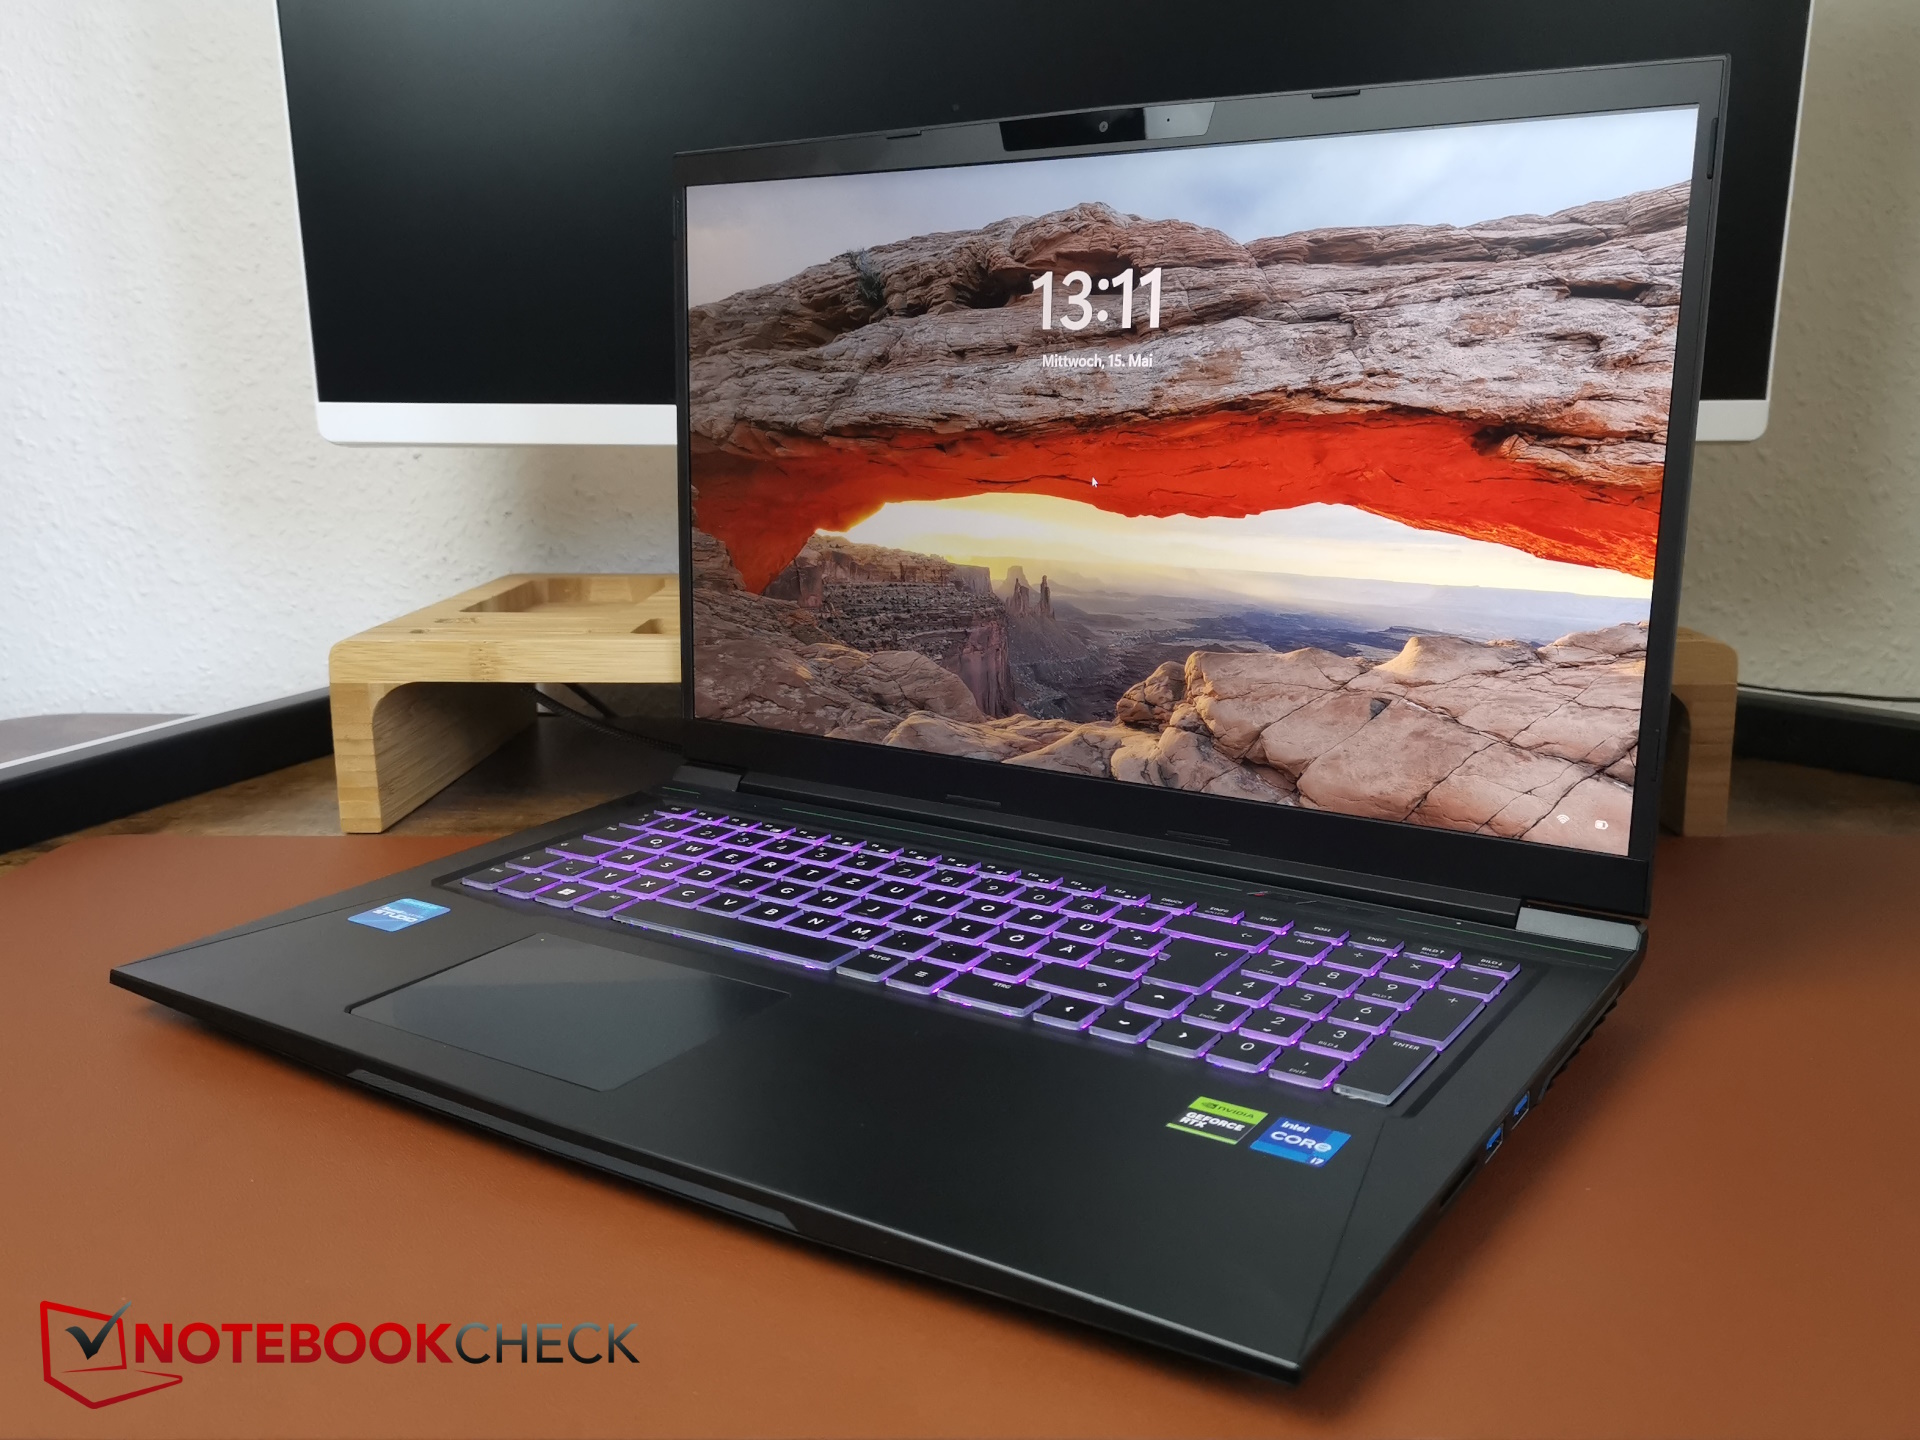
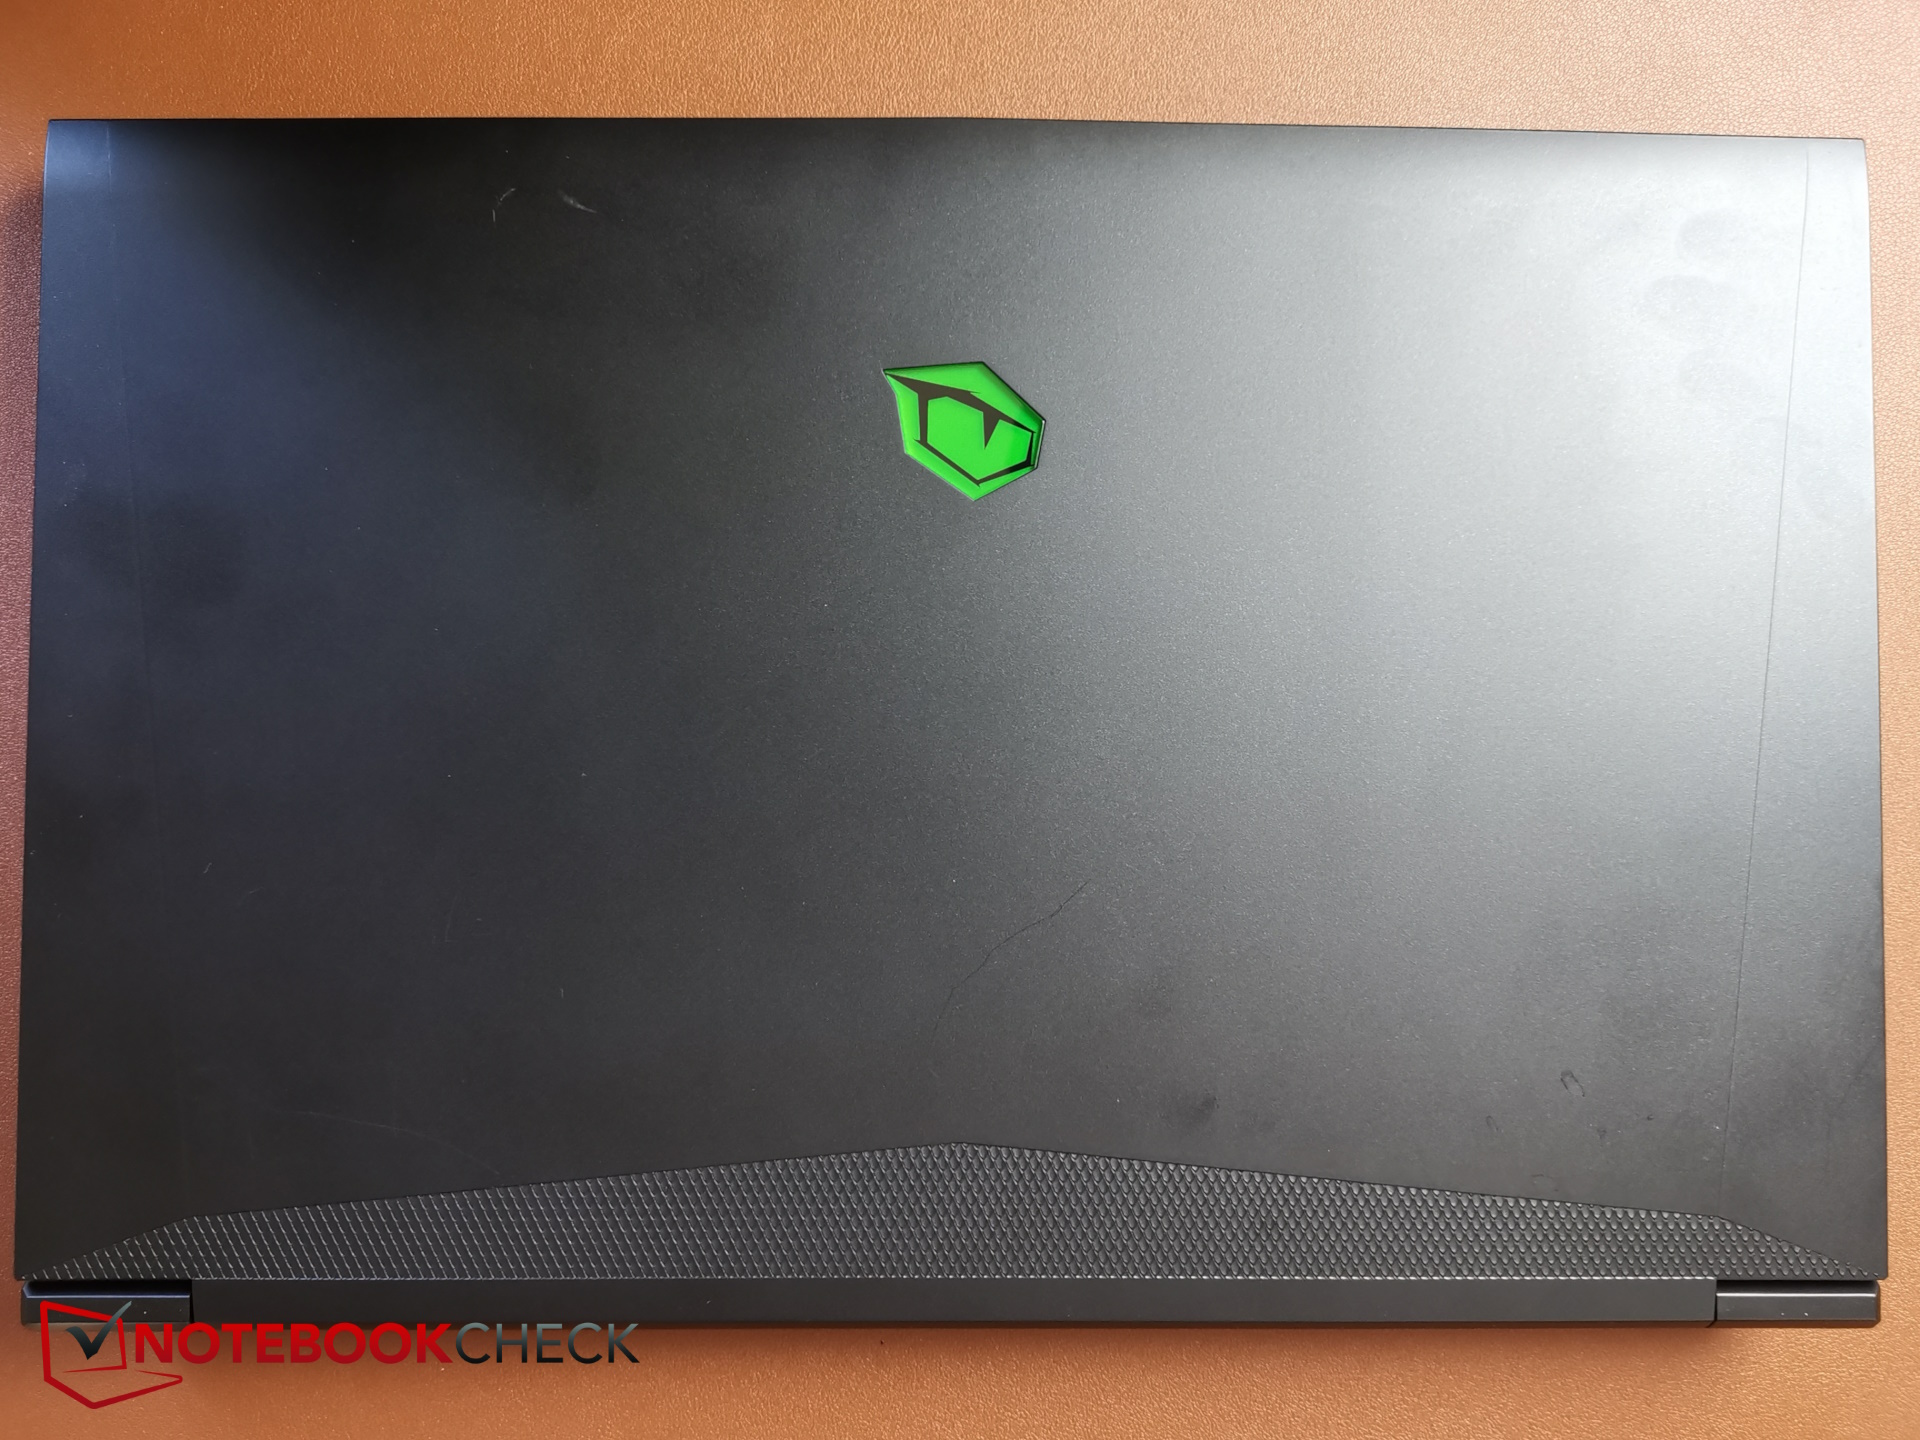
Vaka - Yeşil oyuncu gözlü bir Tongfang
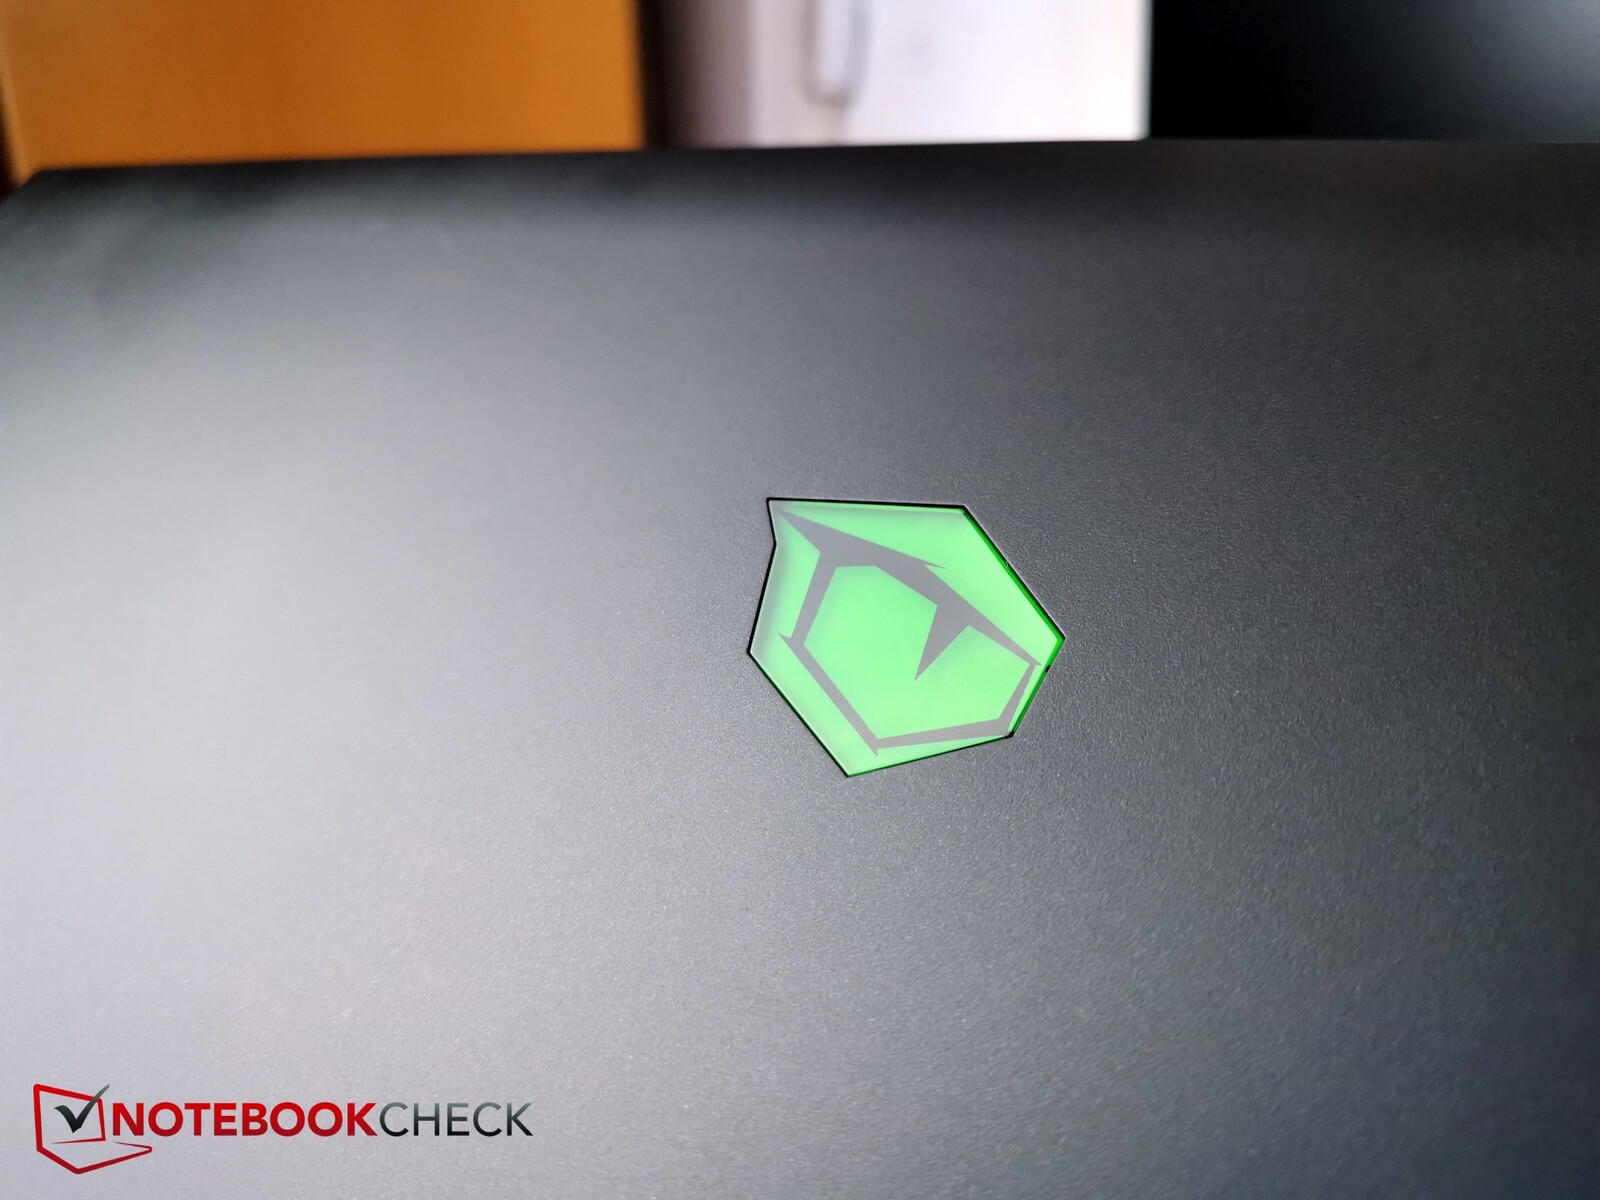
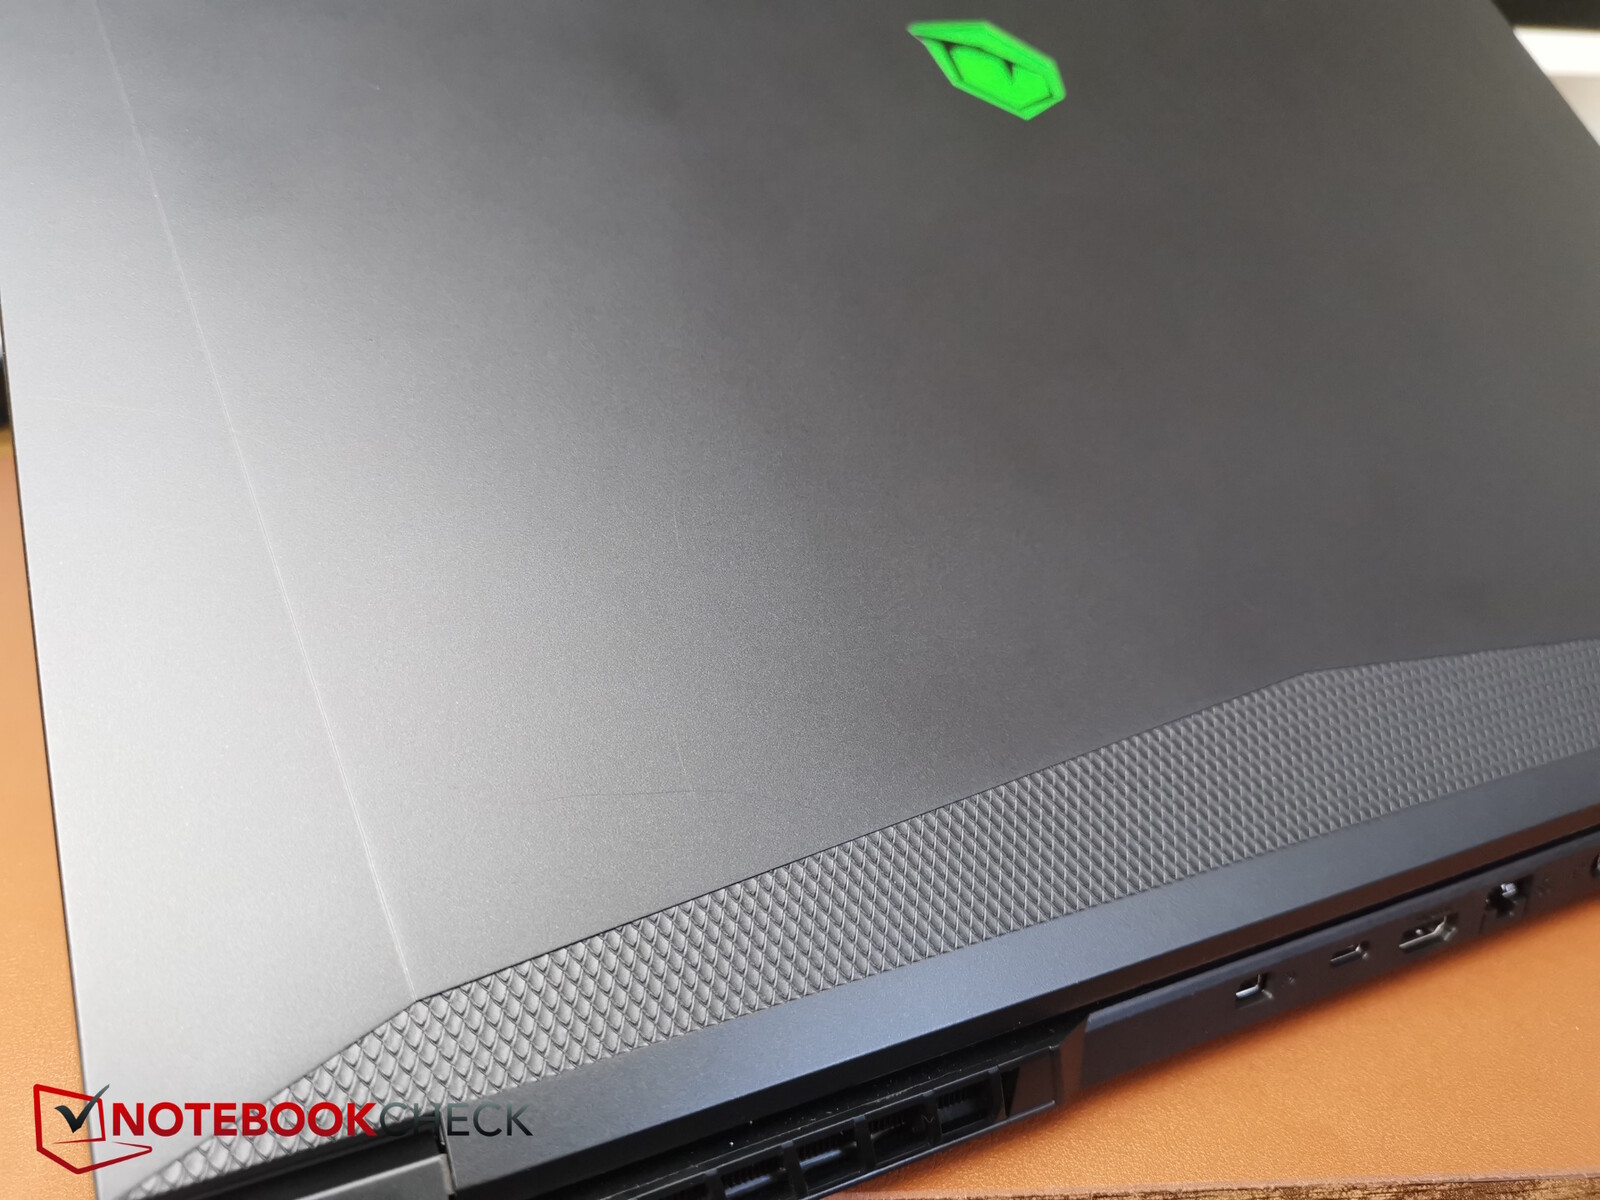
Tongfang kılıfı tamamen siyah plastikten yapılmıştır. Ön taraftaki yeşil logo, altındaki bal peteği desenli geniş şerit ve klavyenin üzerindeki tabanda yeşil şeritli Tulpar markası cihaza vurgu yapıyor. Hafif dokulu yüzey yağ ve parmak izi izlerini çekiyor.
Burulma testlerimizde taban oldukça kolay bükülebildi ve özellikle yan kenarlar daha güçlü çatlama sesleri çıkardı. Bunun dışında, taban yeterince sağlam ve aynı şey ekran için de söylenebilir. Menteşeler ekranı iyi bir şekilde yerinde tutuyor, ancak açılış açısını ayarlarken belirli bir miktar sallanmayı önleyemiyorlar. Sonuncusu yaklaşık 145 derece.
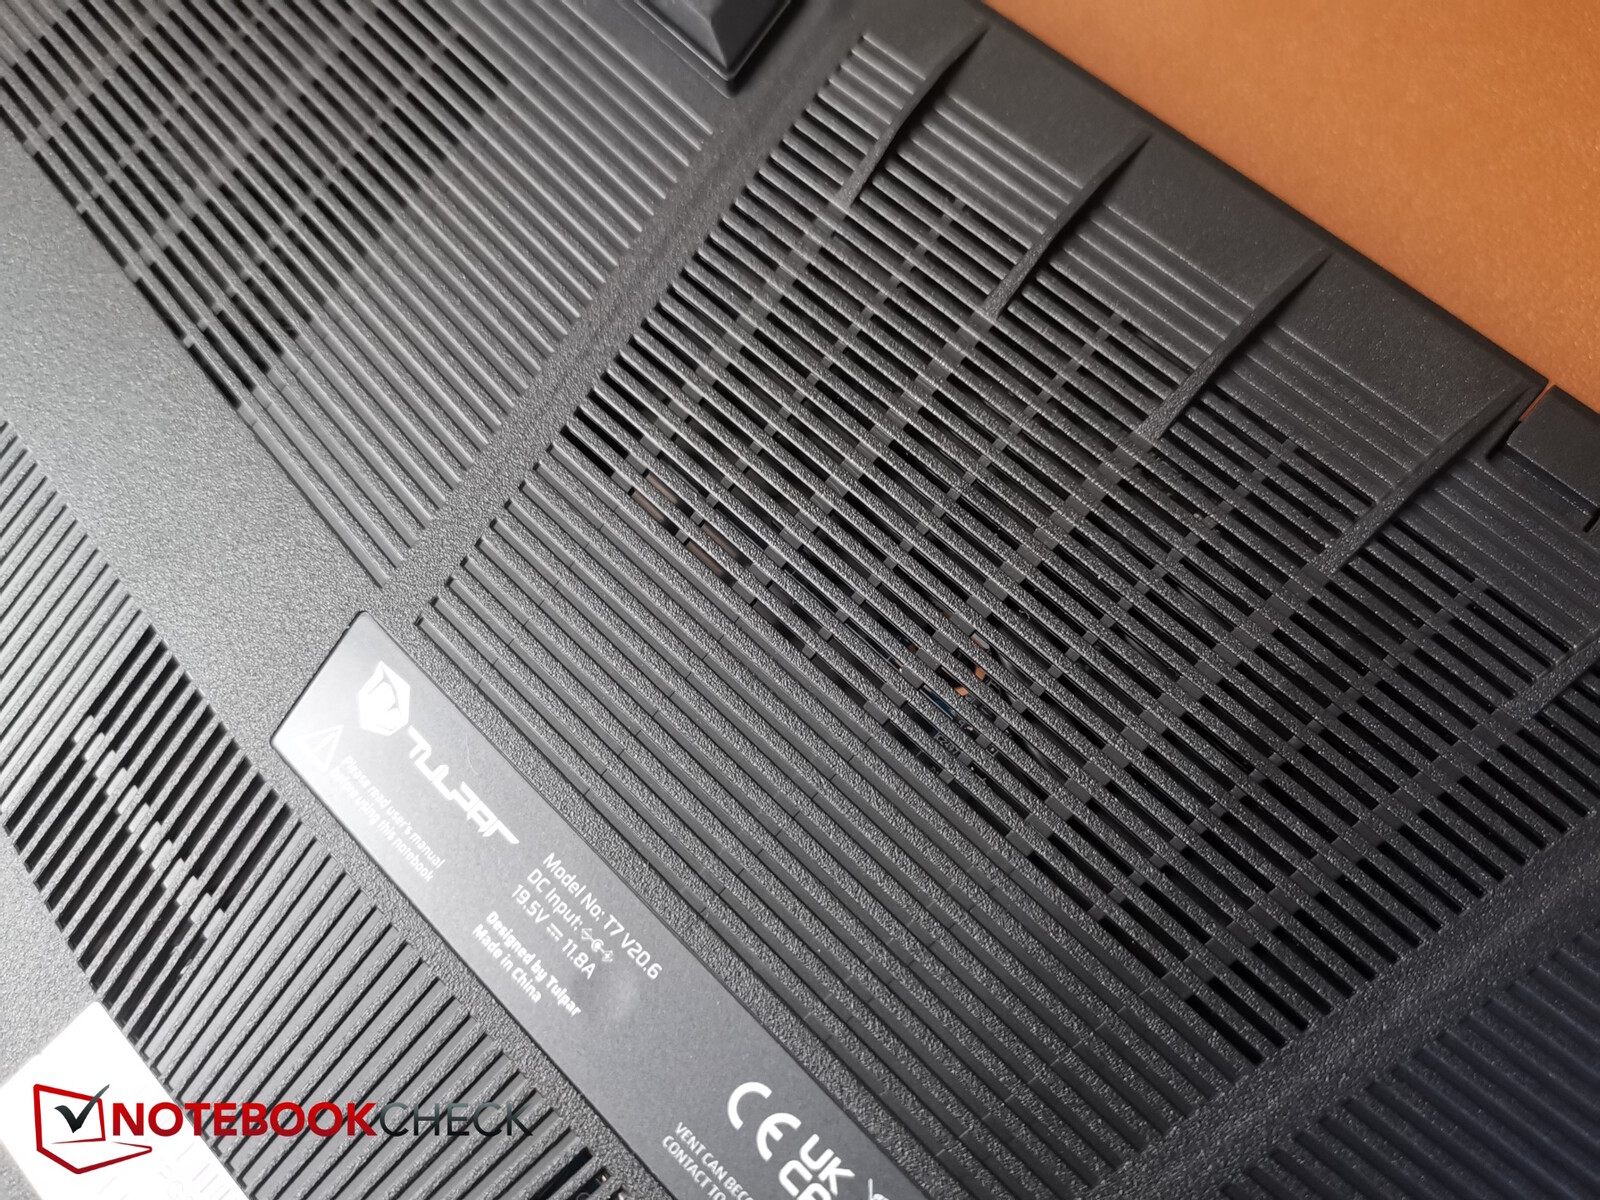
Sadece tabanın alt plaka ile buluştuğu ve alt plakanın hafif kavisli olduğu ön kenar boyunca bazı küçük boşluklar fark ettik. Alt kısım biraz daha yumuşak bir plastikten yapılmıştır ve plastik, özellikle yarıkları nedeniyle daha da yumuşak olan hava ızgaralarında dışarıdan dahili soğutma elemanlarına, özellikle de ısı borularına kolayca bastırılabilir. Ancak dört kauçuk ayak sayesinde bu durum normalde yaşanmaz.
Genel olarak, yapı kalitesi iyi, ancak piyasada kesinlikle daha sağlam ve daha kaliteli cihazlar var.
Karşılaştırma alanında, T7 ortalama bir boyut ve ağırlığa sahiptir. Medion veya XMG ile yaklaşık aynı boyutta iken Nitro ve Katana daha büyüktür. 2,6 kg ağırlığıyla Schenker'in altında kalırken, diğer karşılaştırma cihazları, özellikle de yaklaşık 3 kg ağırlığındaki Nitro daha ağırdır.
Maksimum kalınlığı 30 mm olan T7 çok ince görünmüyor, ancak Acer Nitro da aynı kalınlıkta ve Medion'un (soğutma) kaburgalarında 3 mm daha fazla var - özellikle de T7 çoğu yerde belirtilen maksimum değerinden daha ince olduğu için. Katana ve XMG daha ince.
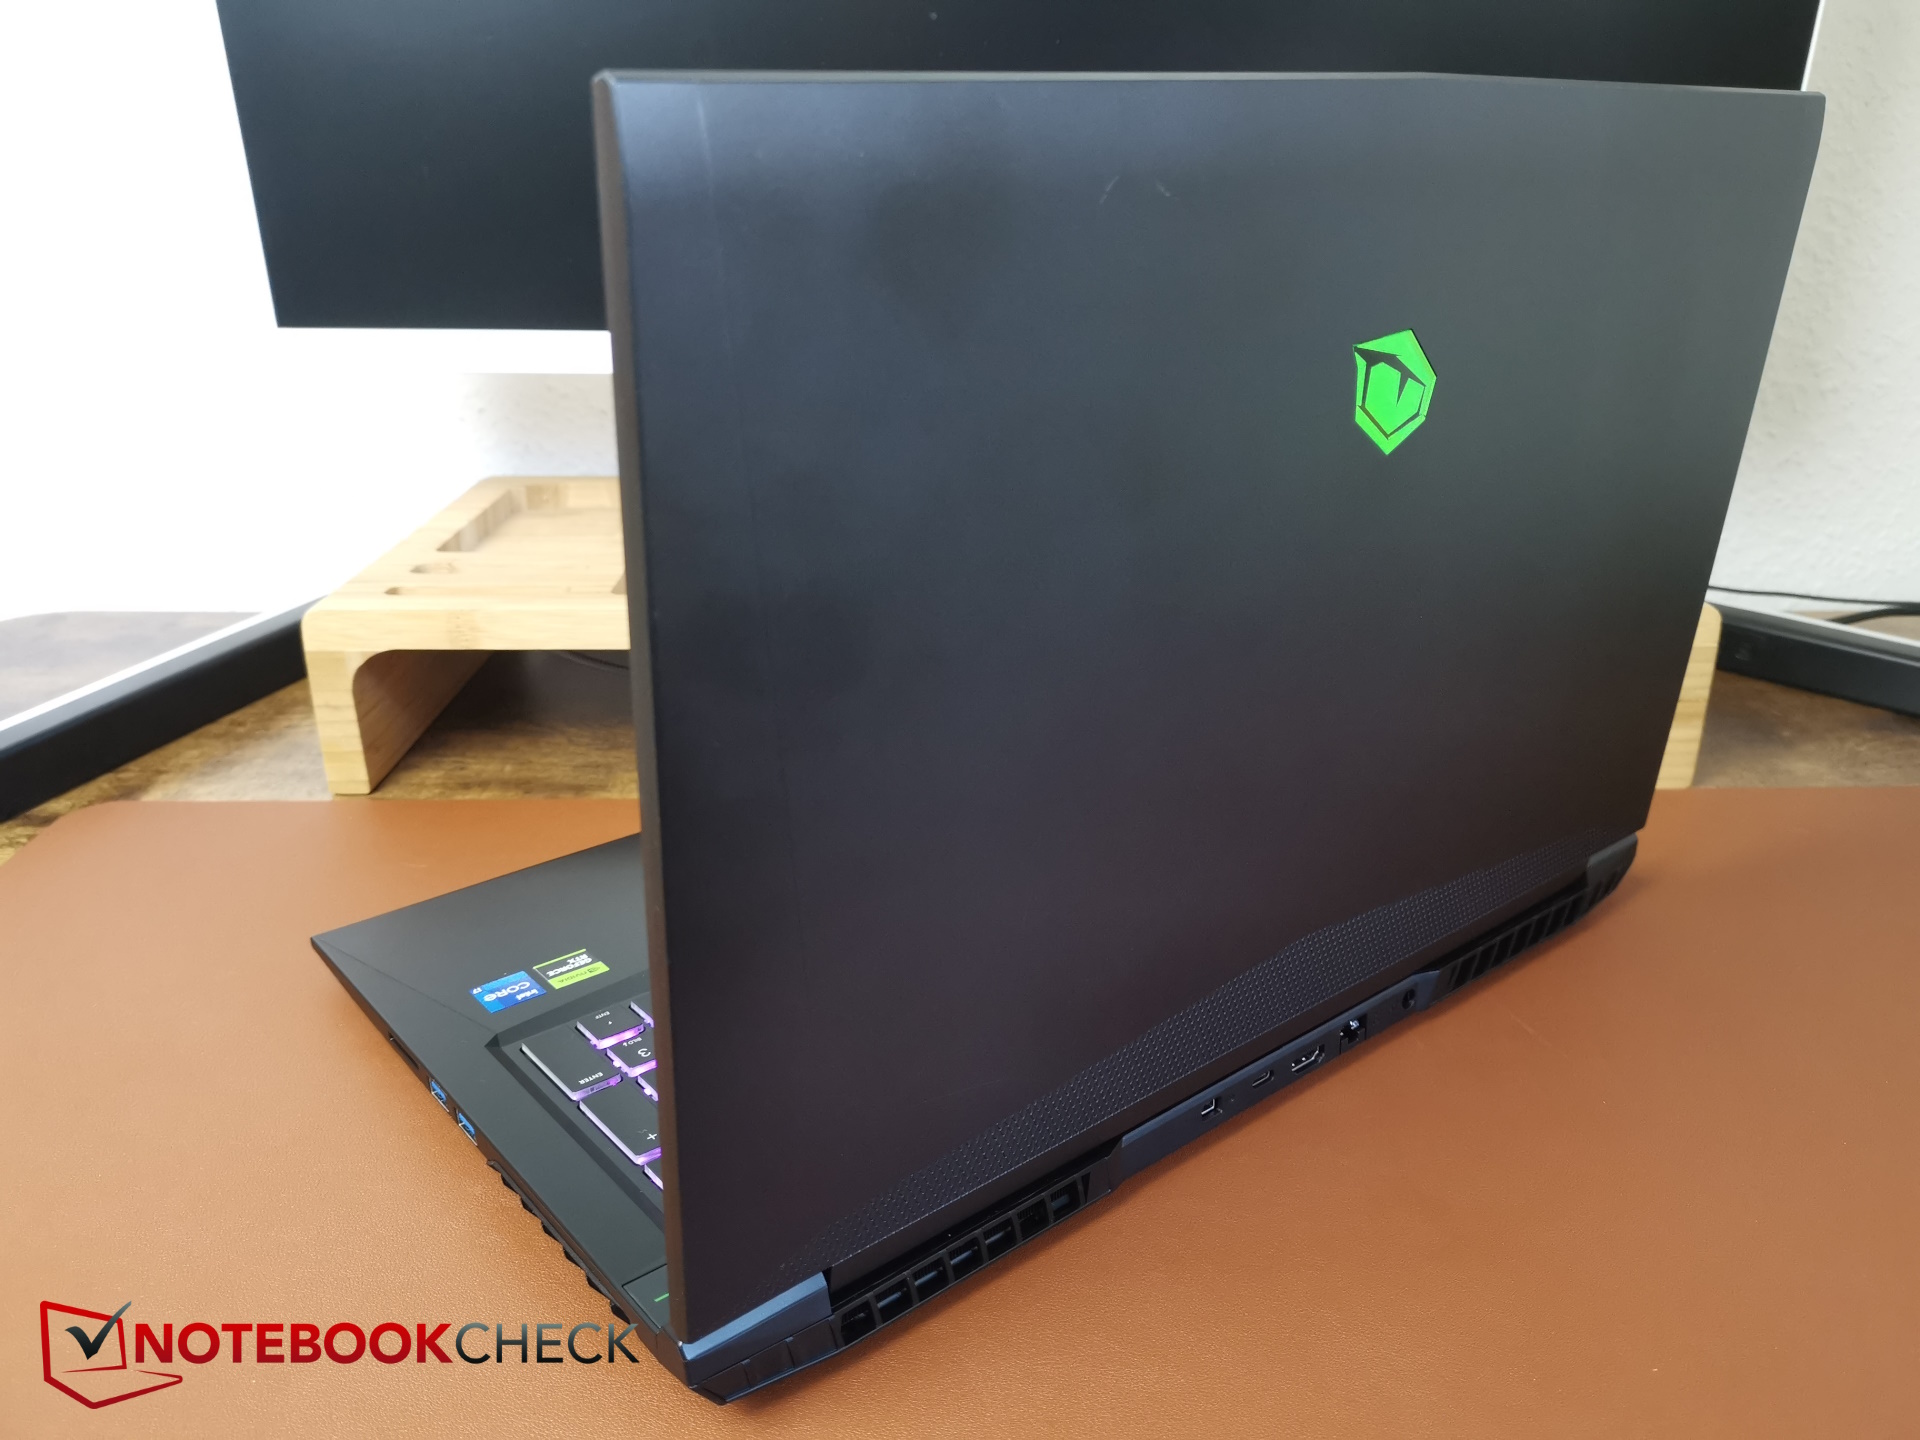
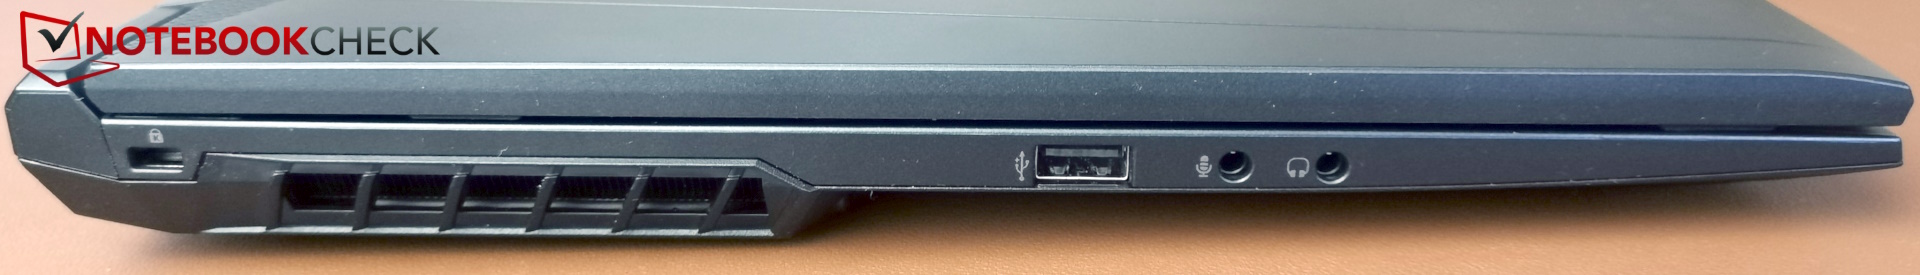
Bağlanabilirlik - Thunderbolt yok, ancak USB 2.0
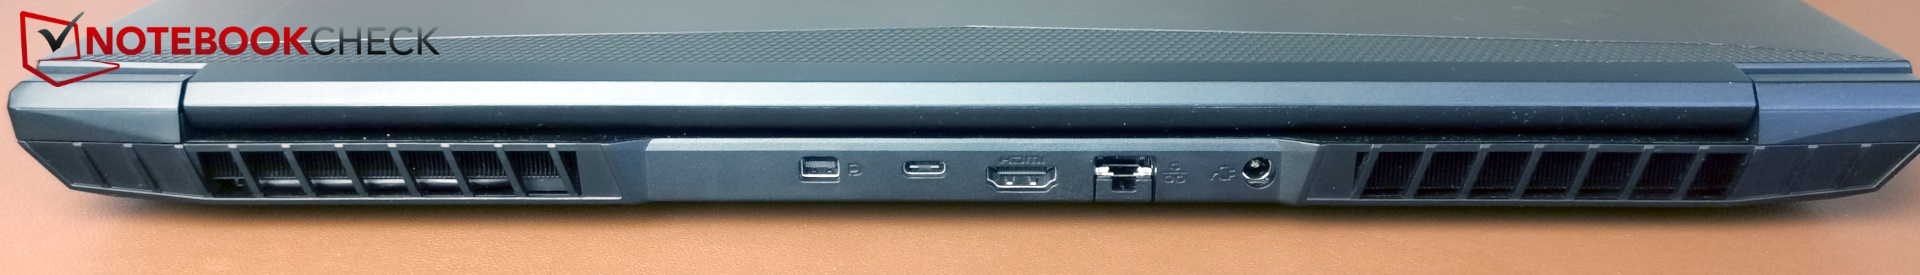
Tulpar gamer, en gerekli tüm bağlantı seçeneklerine sahiptir ve büyük bir olumlu yanı, özellikle VR kulaklıkları için önemli olabilecek arkadaki özel MiniDP bağlantı noktasıdır. Buna karşılık, USB-C portu maalesef Thunderbolt'u desteklemiyor ve üç USB-A portundan biri (solda) hala tip 2.0. Yine de en azından tam boyutlu bir SD kart okuyucusu ve iki ayrı ses portu var.
Düzeni gayet iyi, en azından bağlantılar her iki tarafa ve arkaya iyi dağıtılmış. Her şeyden önce, LAN, HDMI, MiniDP ve güç gibi potansiyel olarak sert ve kalın kablolar arkadan çıkıyor, bu nedenle yalnızca yanlardaki USB cihazlarıyla uğraşmanız gerekecek. Sağ taraftaki iki USB-A bağlantı noktası biraz daha uzakta olabilirdi ancak bunun dışında dizüstü bilgisayarın dağılımı iyi.
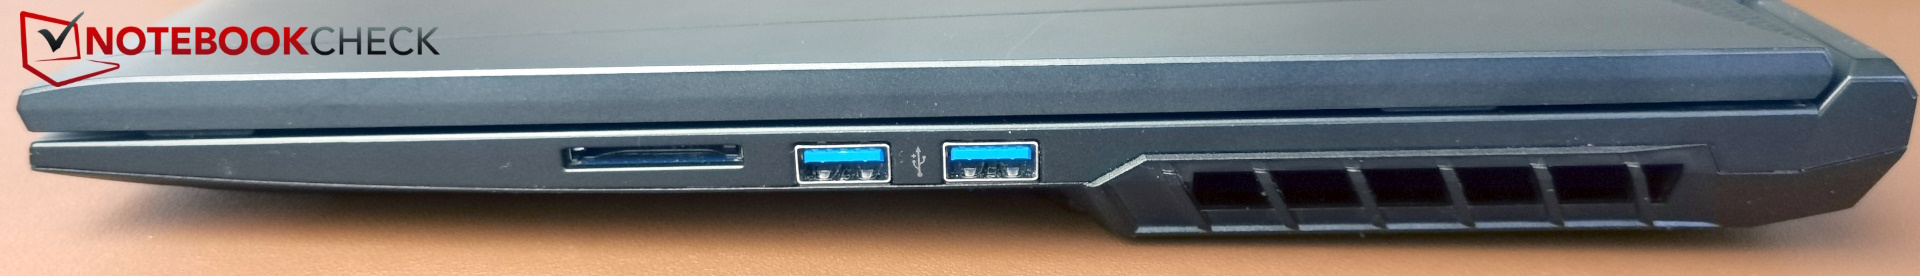
SD kart okuyucu
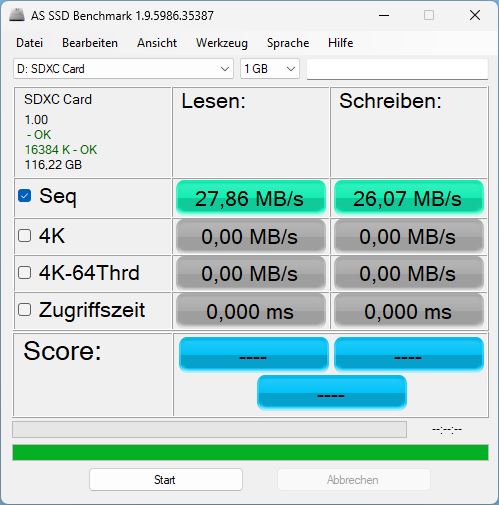
Dizüstü bilgisayarın tam boyutlu bir SD kart okuyucu ile donatılmış olmasını seviyoruz. Daha az etkileyici olan ise kart okuyucunun hızının ne kadar yavaş olduğu. Mandallama mekanizması yok ve kartlar yarıya kadar dışarı çıkıyor.
Sıralı okuma ve yazma hızlarını yalnızca 27 MB/s civarında ölçtük, bu da AV PRO MicroSD 128 GB V60 referans kartımızla aynı hızda olmaktan başka bir şey değil. Karttan masaüstüne 1 GB görüntü malzemesi kopyalamak tam 48 saniye sürüyor! Her ne kadar Legion 5 ve XMG belirleyici olmasa da rakipler çok daha hızlı.
| SD Card Reader | |
| average JPG Copy Test (av. of 3 runs) | |
| Sınıf ortalaması Gaming (20.9 - 210, n=54, son 2 yıl) | |
| Medion Erazer Defender P40 (AV PRO microSD 128 GB V60) | |
| Acer Nitro 17 AN17-51-71ER | |
| Schenker XMG Apex 17 (Late 23) (AV PRO microSD 128 GB V60) | |
| Lenovo Legion 5 16IRX G9 | |
| Tulpar T7 V20.6 | |
| maximum AS SSD Seq Read Test (1GB) | |
| Sınıf ortalaması Gaming (25.5 - 261, n=51, son 2 yıl) | |
| Medion Erazer Defender P40 (AV PRO microSD 128 GB V60) | |
| Acer Nitro 17 AN17-51-71ER | |
| Schenker XMG Apex 17 (Late 23) (AV PRO microSD 128 GB V60) | |
| Lenovo Legion 5 16IRX G9 | |
| Tulpar T7 V20.6 | |
İletişim
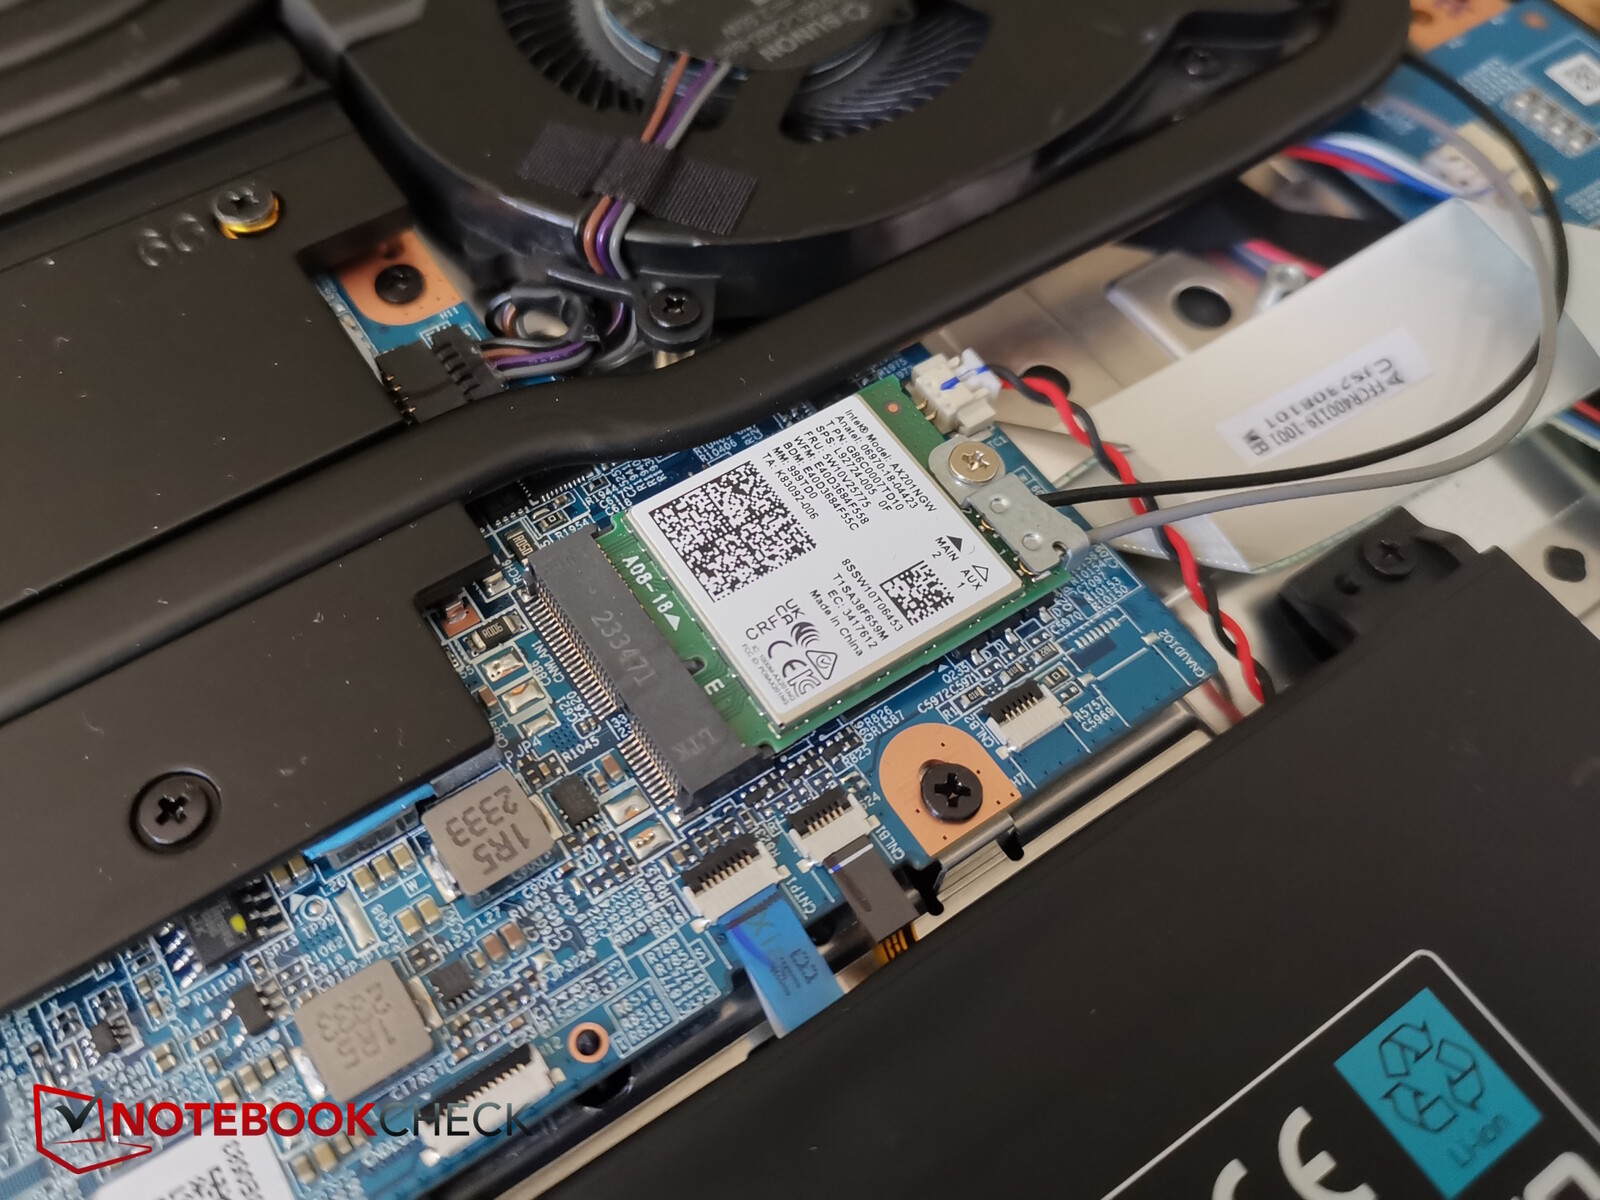
Cihaz RJ45 LAN bağlantısına sahiptir. WLAN için Tulpar, Wi-Fi 6'yı destekleyen ancak Wi-Fi 6E'yi desteklemeyen Intel Wi-Fi 6 AX201 modülünü kurmuştur.
Gönderme ve alma sırasında iletim hızları yüksek ve çok sabittir.
Web kamerası
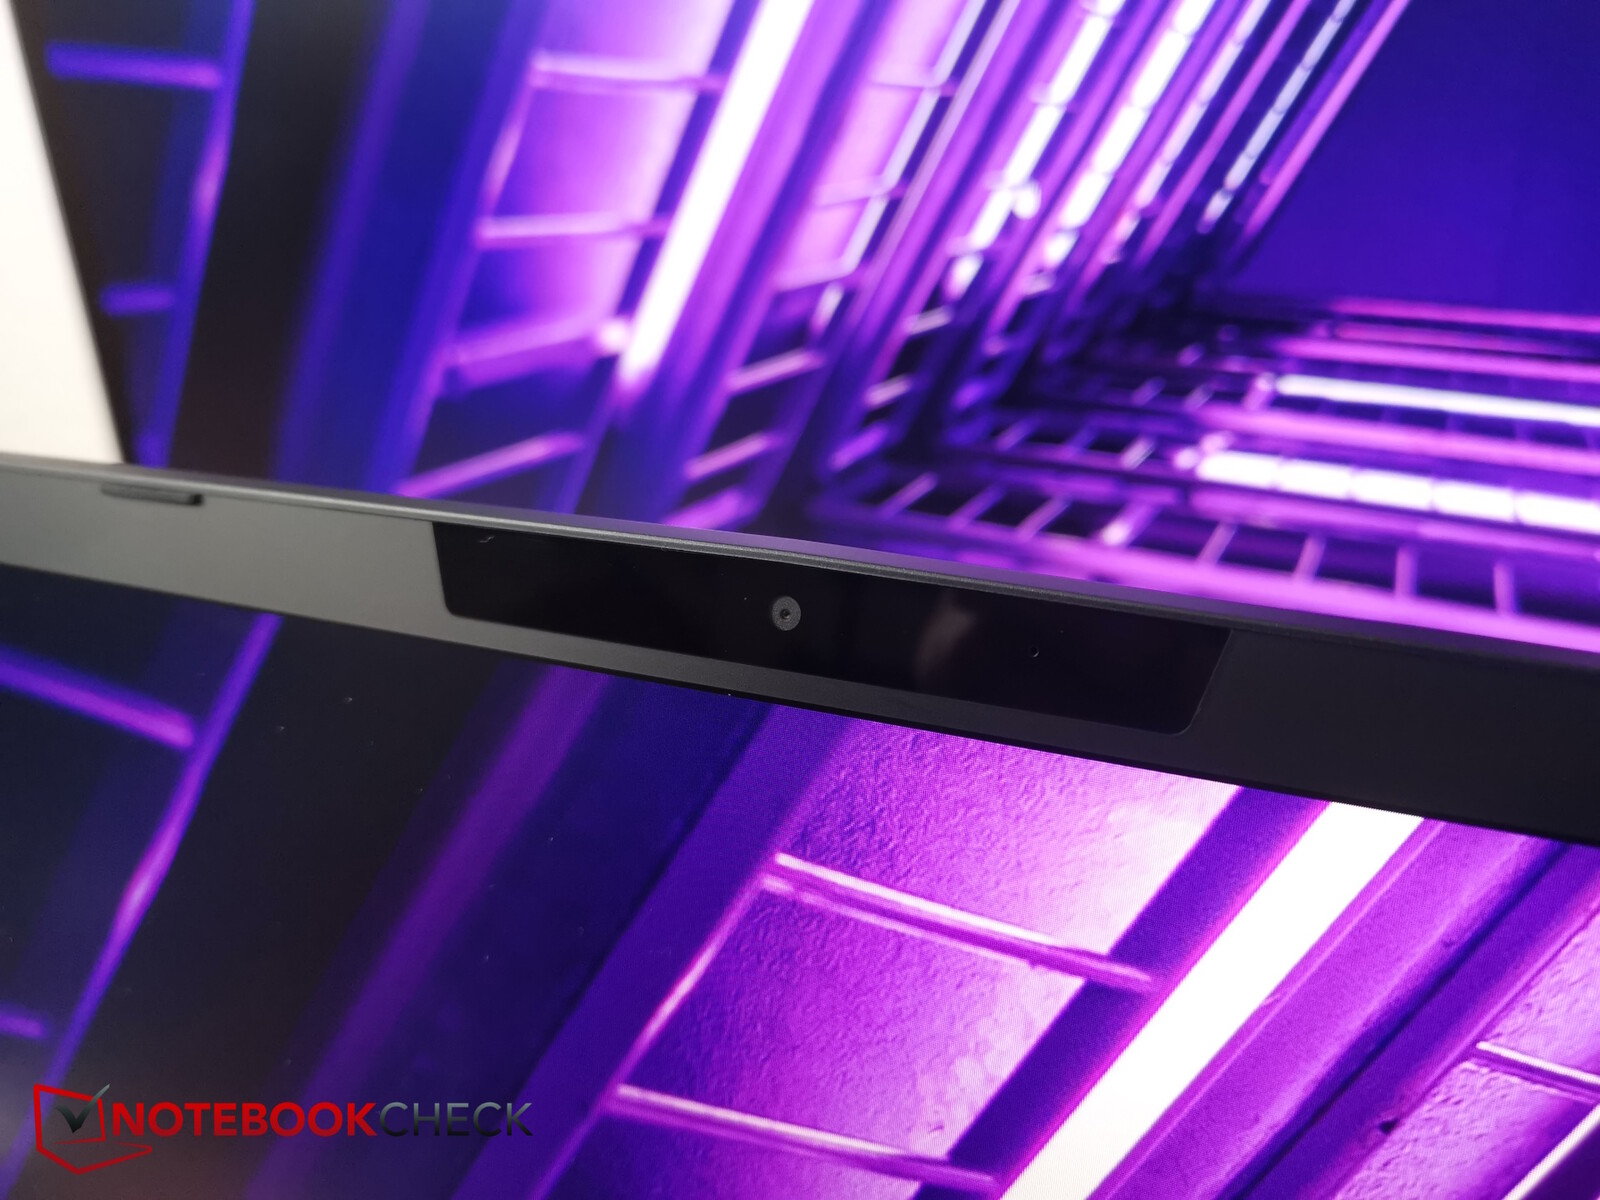
En azından XMG ve Legion 5 zaten Full HD web kameralarına güvenirken, Tulpar, diğer rakipler gibi hala 720p kameraya sahip.
Bu da oldukça yüksek renk sapmaları ve zayıf keskinlikle mücadele etmek zorunda, bu da kullanıcının çok güzel bir görüntüsünü iletmemesine neden oluyor.


Güvenlik
Bir Kensington yuvası mevcuttur ve TPM Intel CPU'ya entegre edilmiştir. En azından parmak izi sensörü veya web kamerası kapağı gibi ek güvenlik özellikleri yoktur.
Aksesuarlar ve garanti
Uygun fiyatlı Tulpar dizüstü bilgisayarla birlikte ekstra aksesuar gelmiyor. Bununla birlikte, 12 aylık yasal garantiye ek olarak ömür boyu, yıllık, ücretsiz bakım sözü vardır. Bu, fanların temizlenmesini, CPU ve GPU üzerindeki termal macunun değiştirilmesini ve kasadaki tozun temizlenmesini içerir. Ancak dikkatli olun: Müşteri kendi başına bir şey yaparsa (örneğin termal macunu değiştirirse), ücretsiz bakım sona erer, bu nedenle Tulpar'ın web sitesindeki hüküm ve koşulları tam olarak okumak en iyisidir.
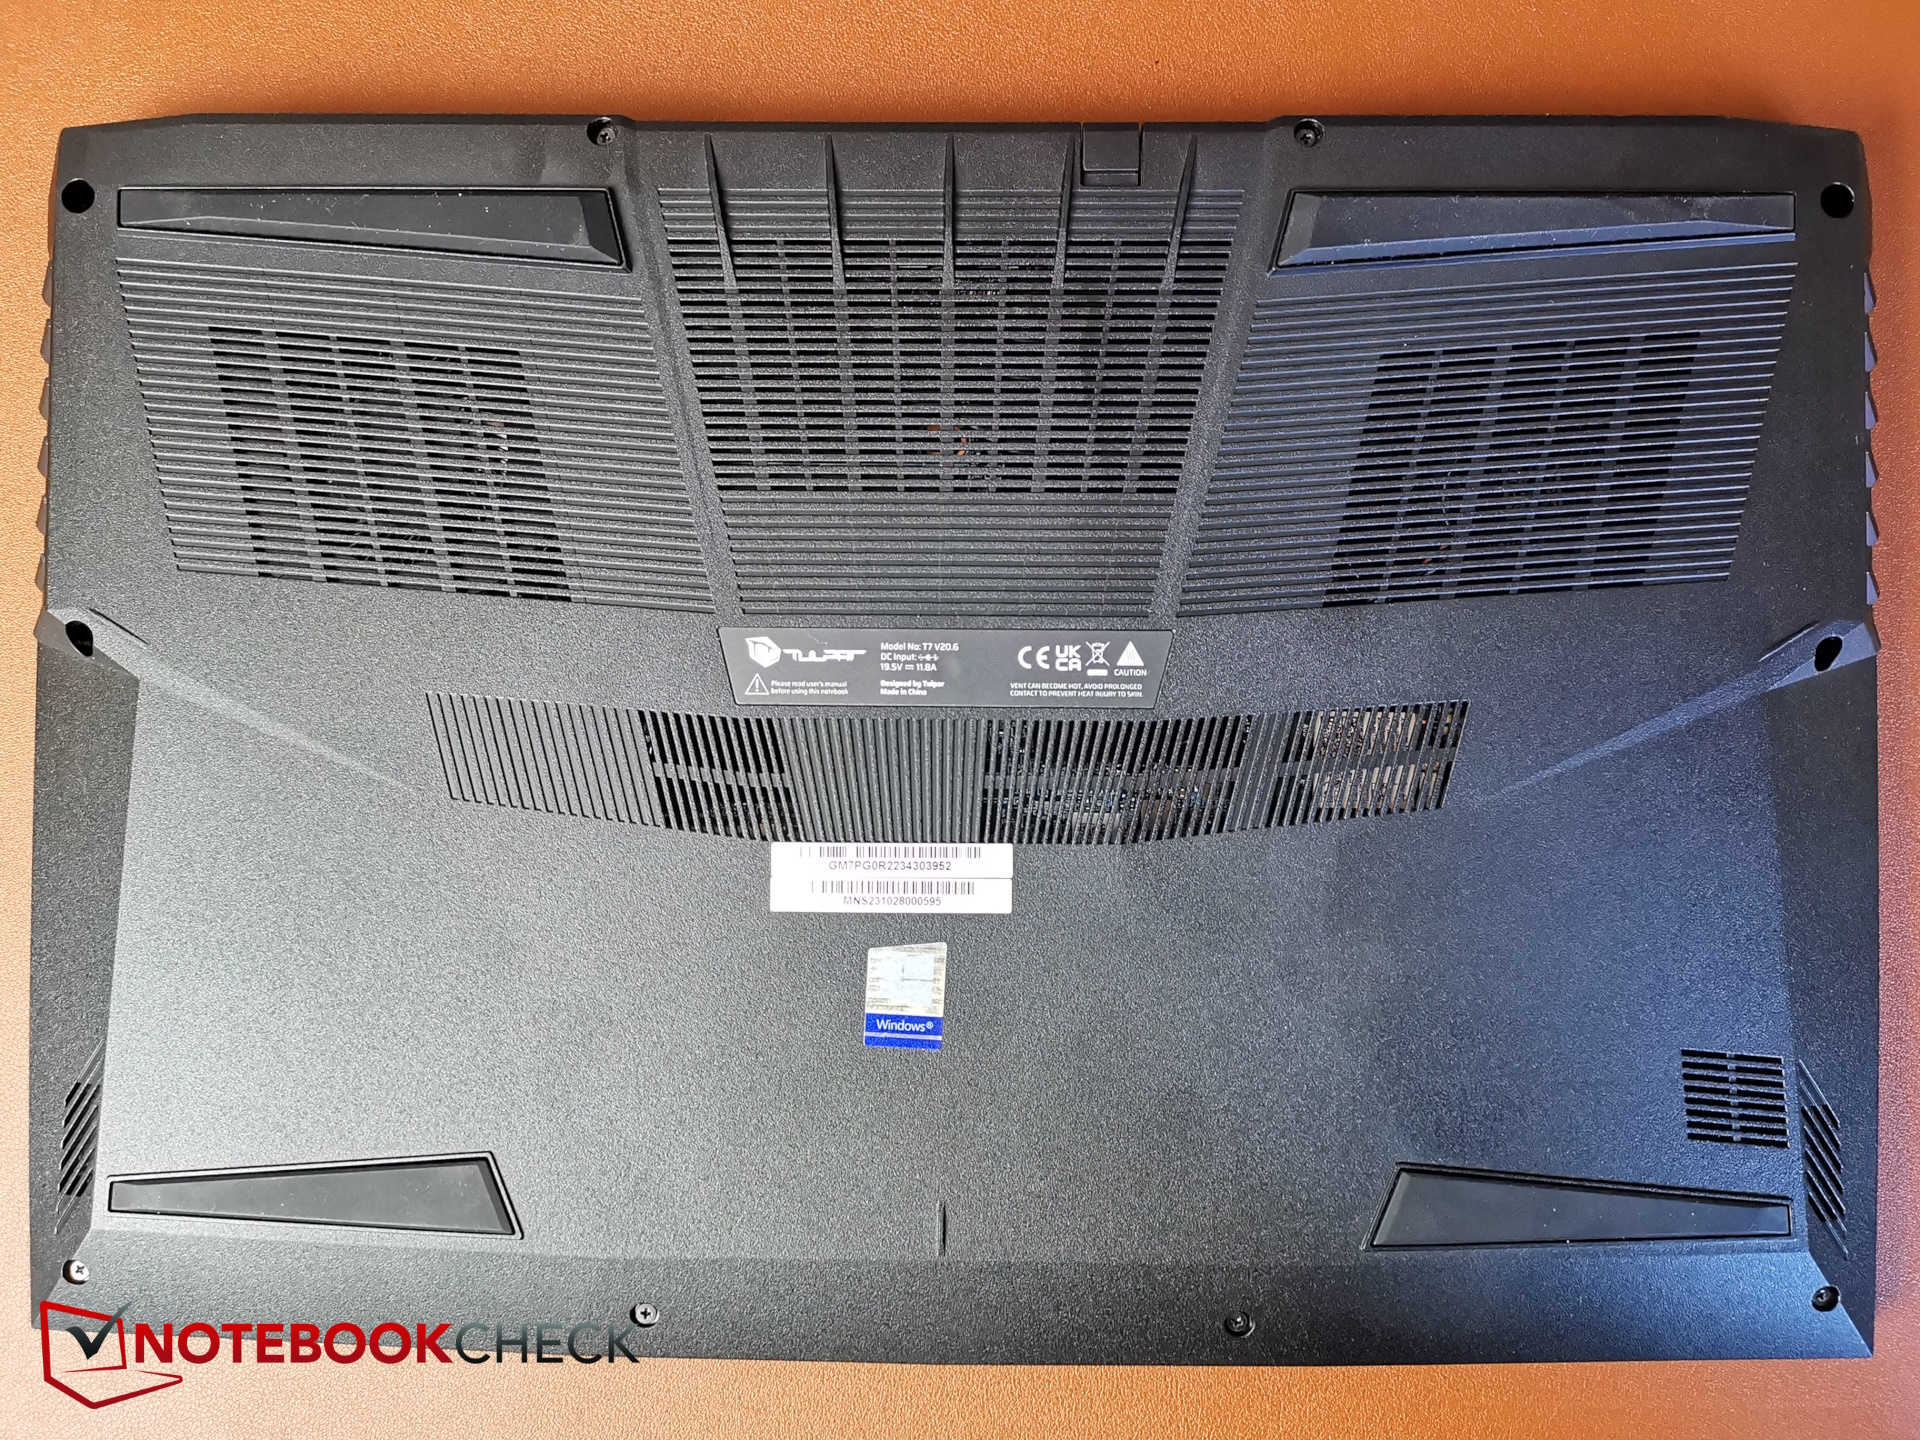
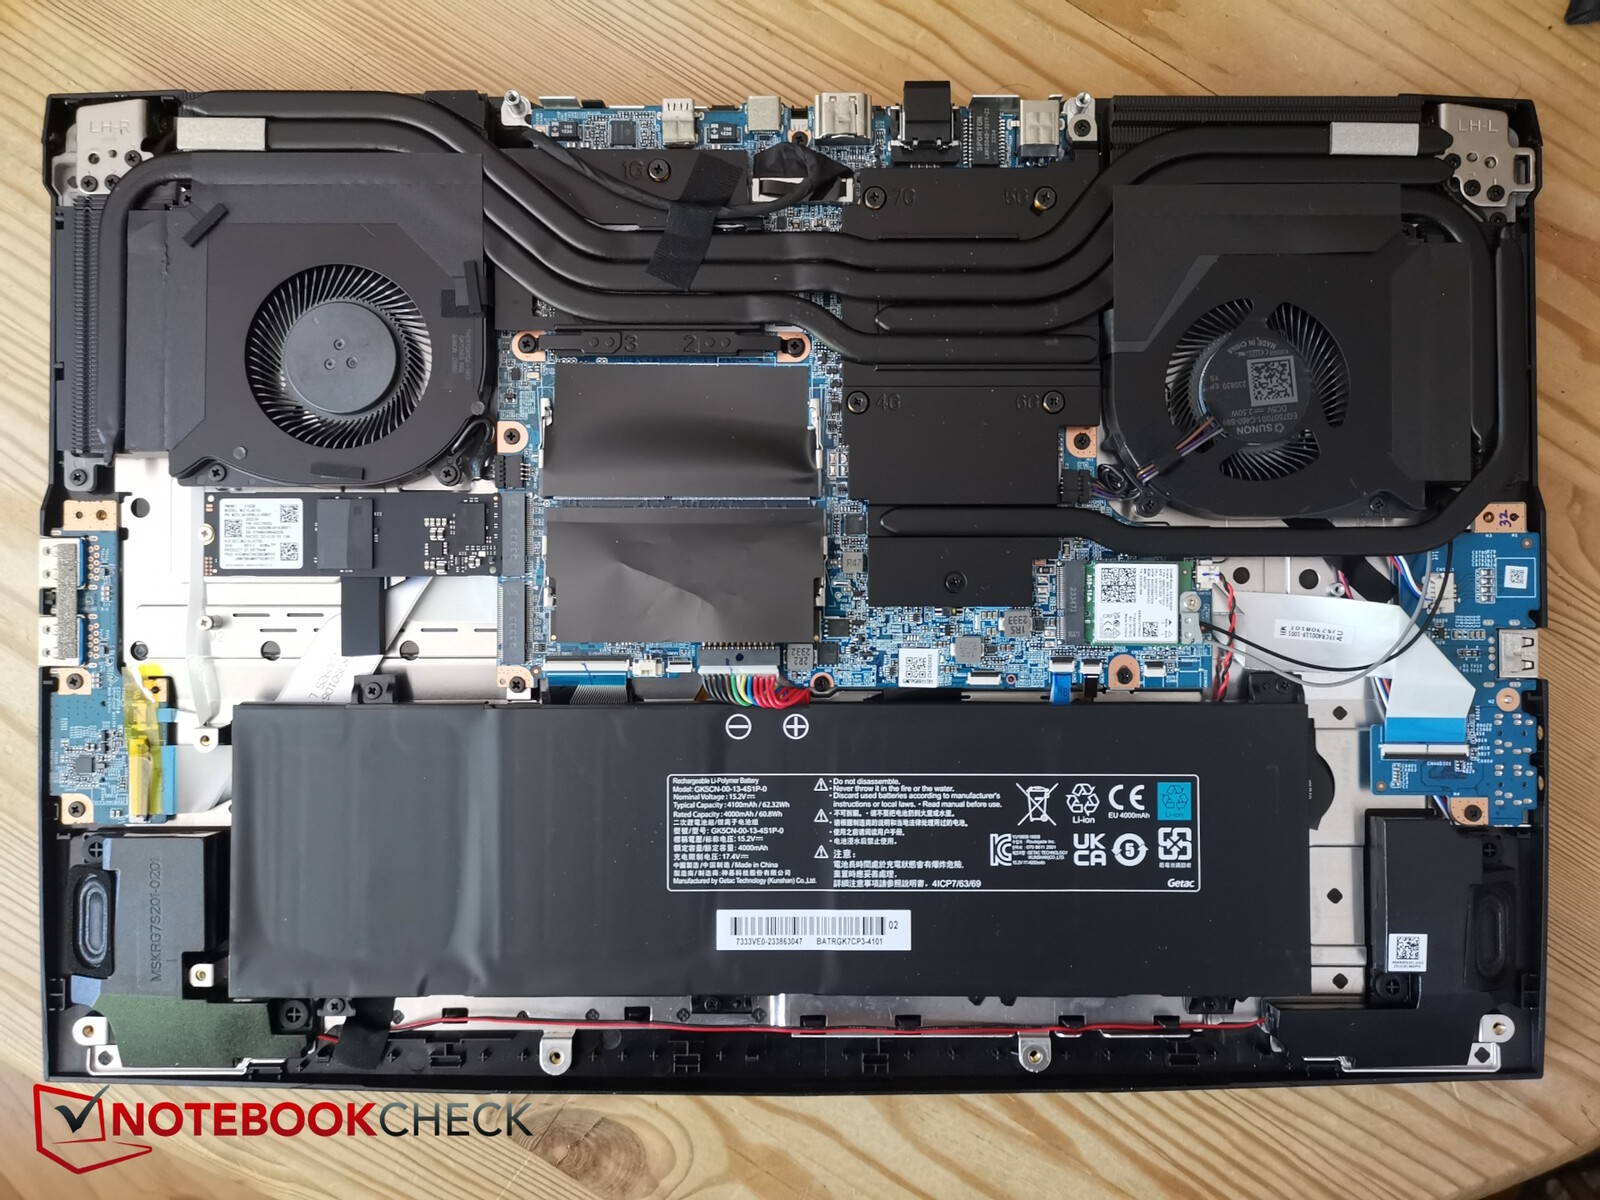
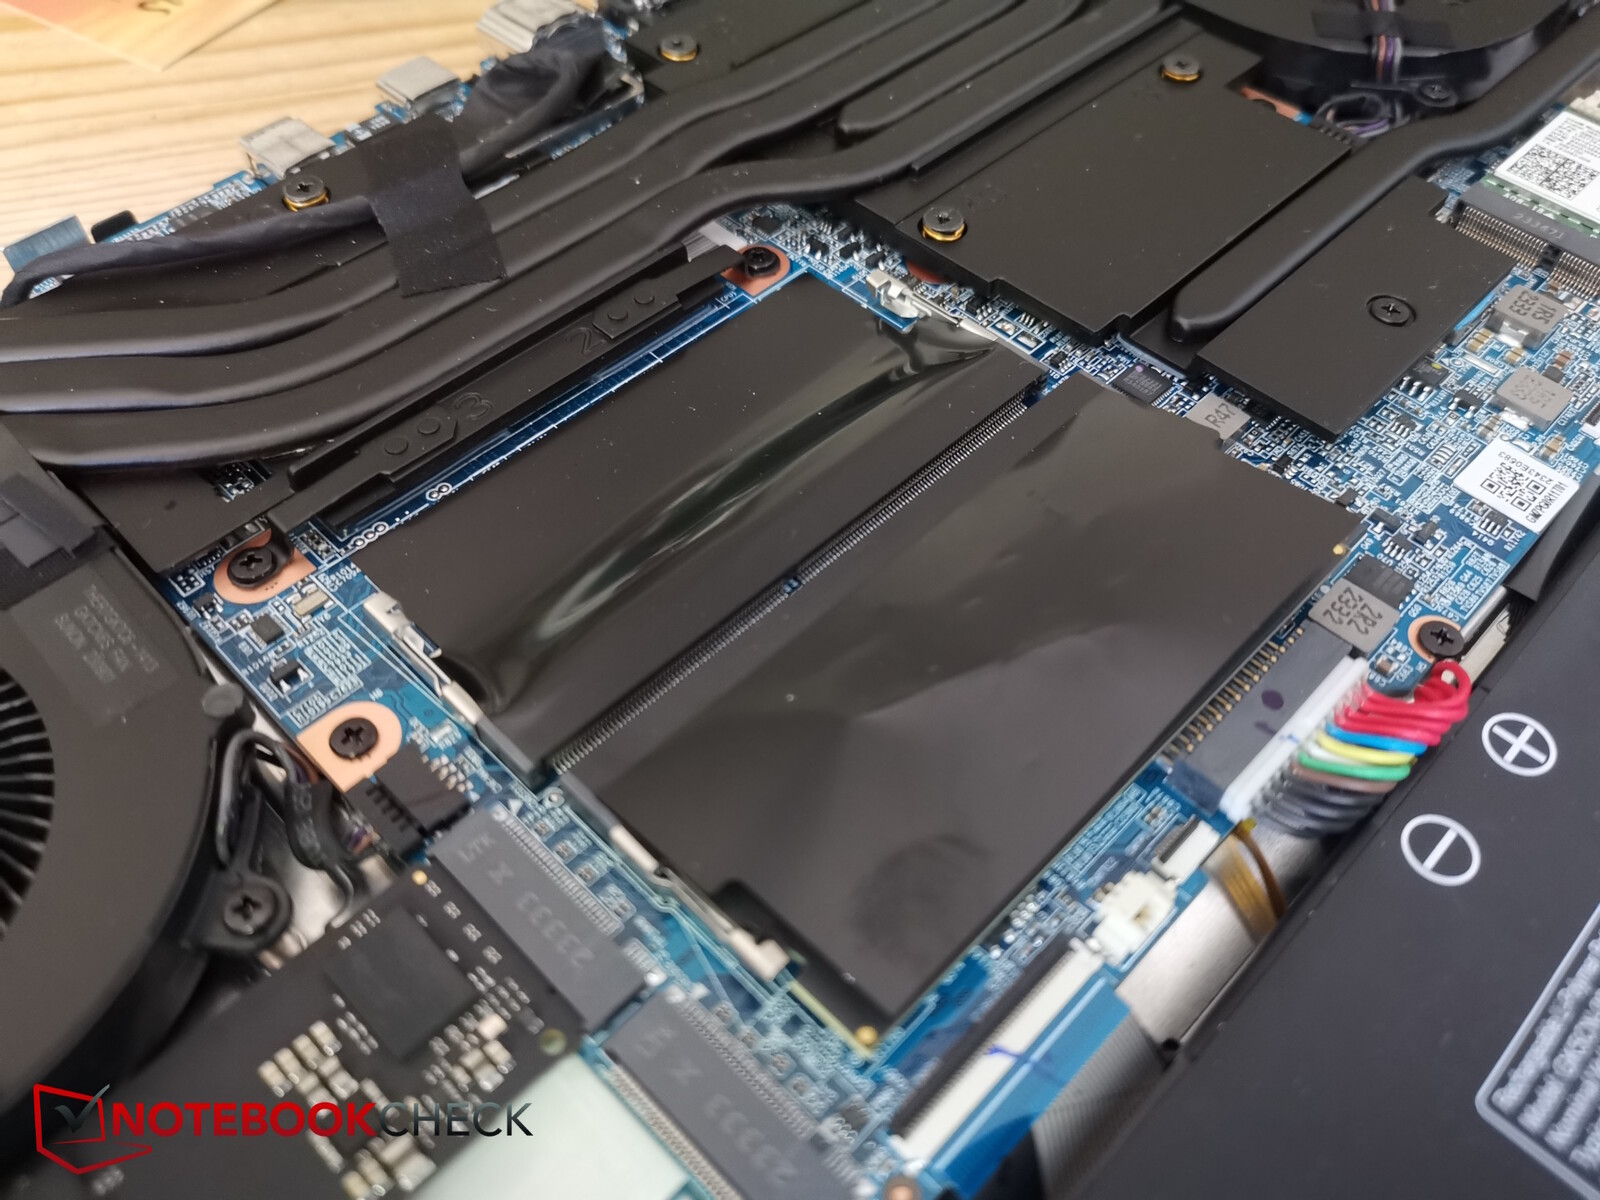
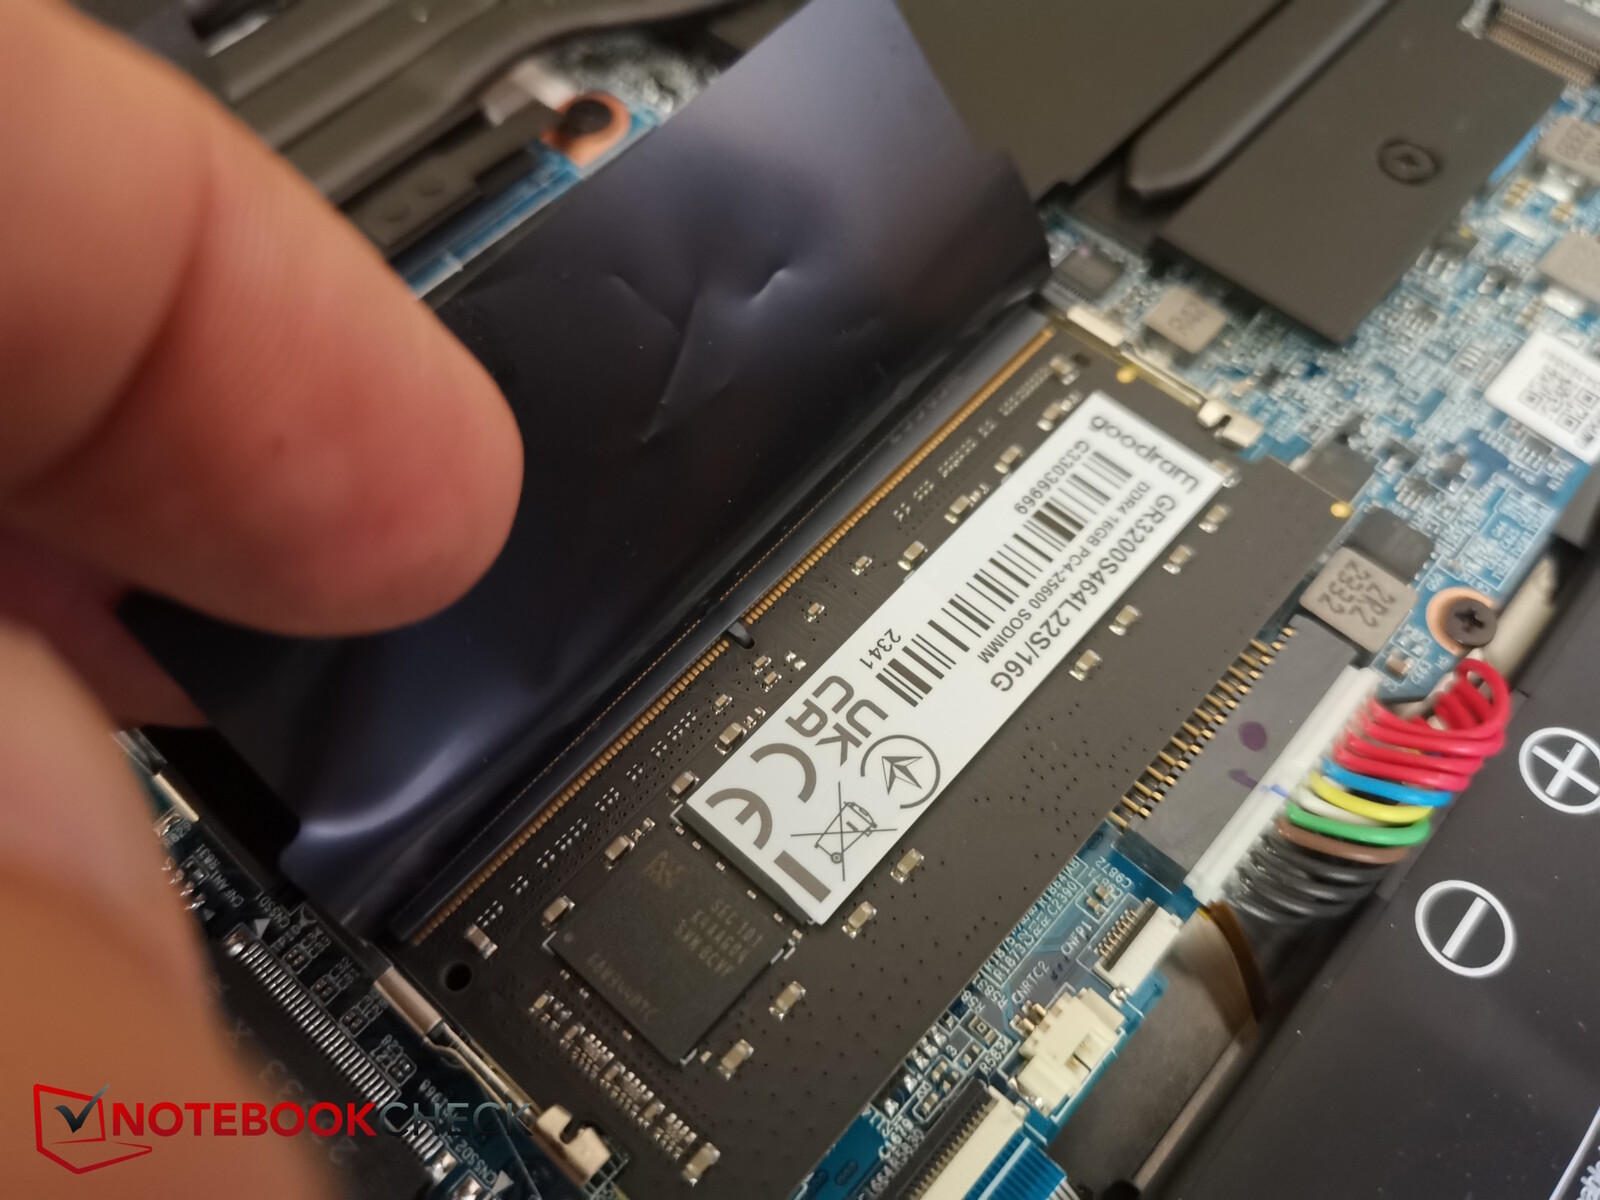
Bakım
Alt kasa kısmı aynı uzunlukta 10 adet yıldız vida ve çok sayıda plastik klipsle yerinde tutuluyor. Sonuç olarak, kaldırırken dikkatli olmalısınız, ancak genel olarak açması oldukça kolaydır. Gizli vida bulunmamaktadır.
İçeride soğutma sistemine, iki RAM yuvasına (yalnızca biri dolu), iki M.2 SSD yuvasına (biri boş), Wi-Fi modülüne ve bataryaya erişebilirsiniz.
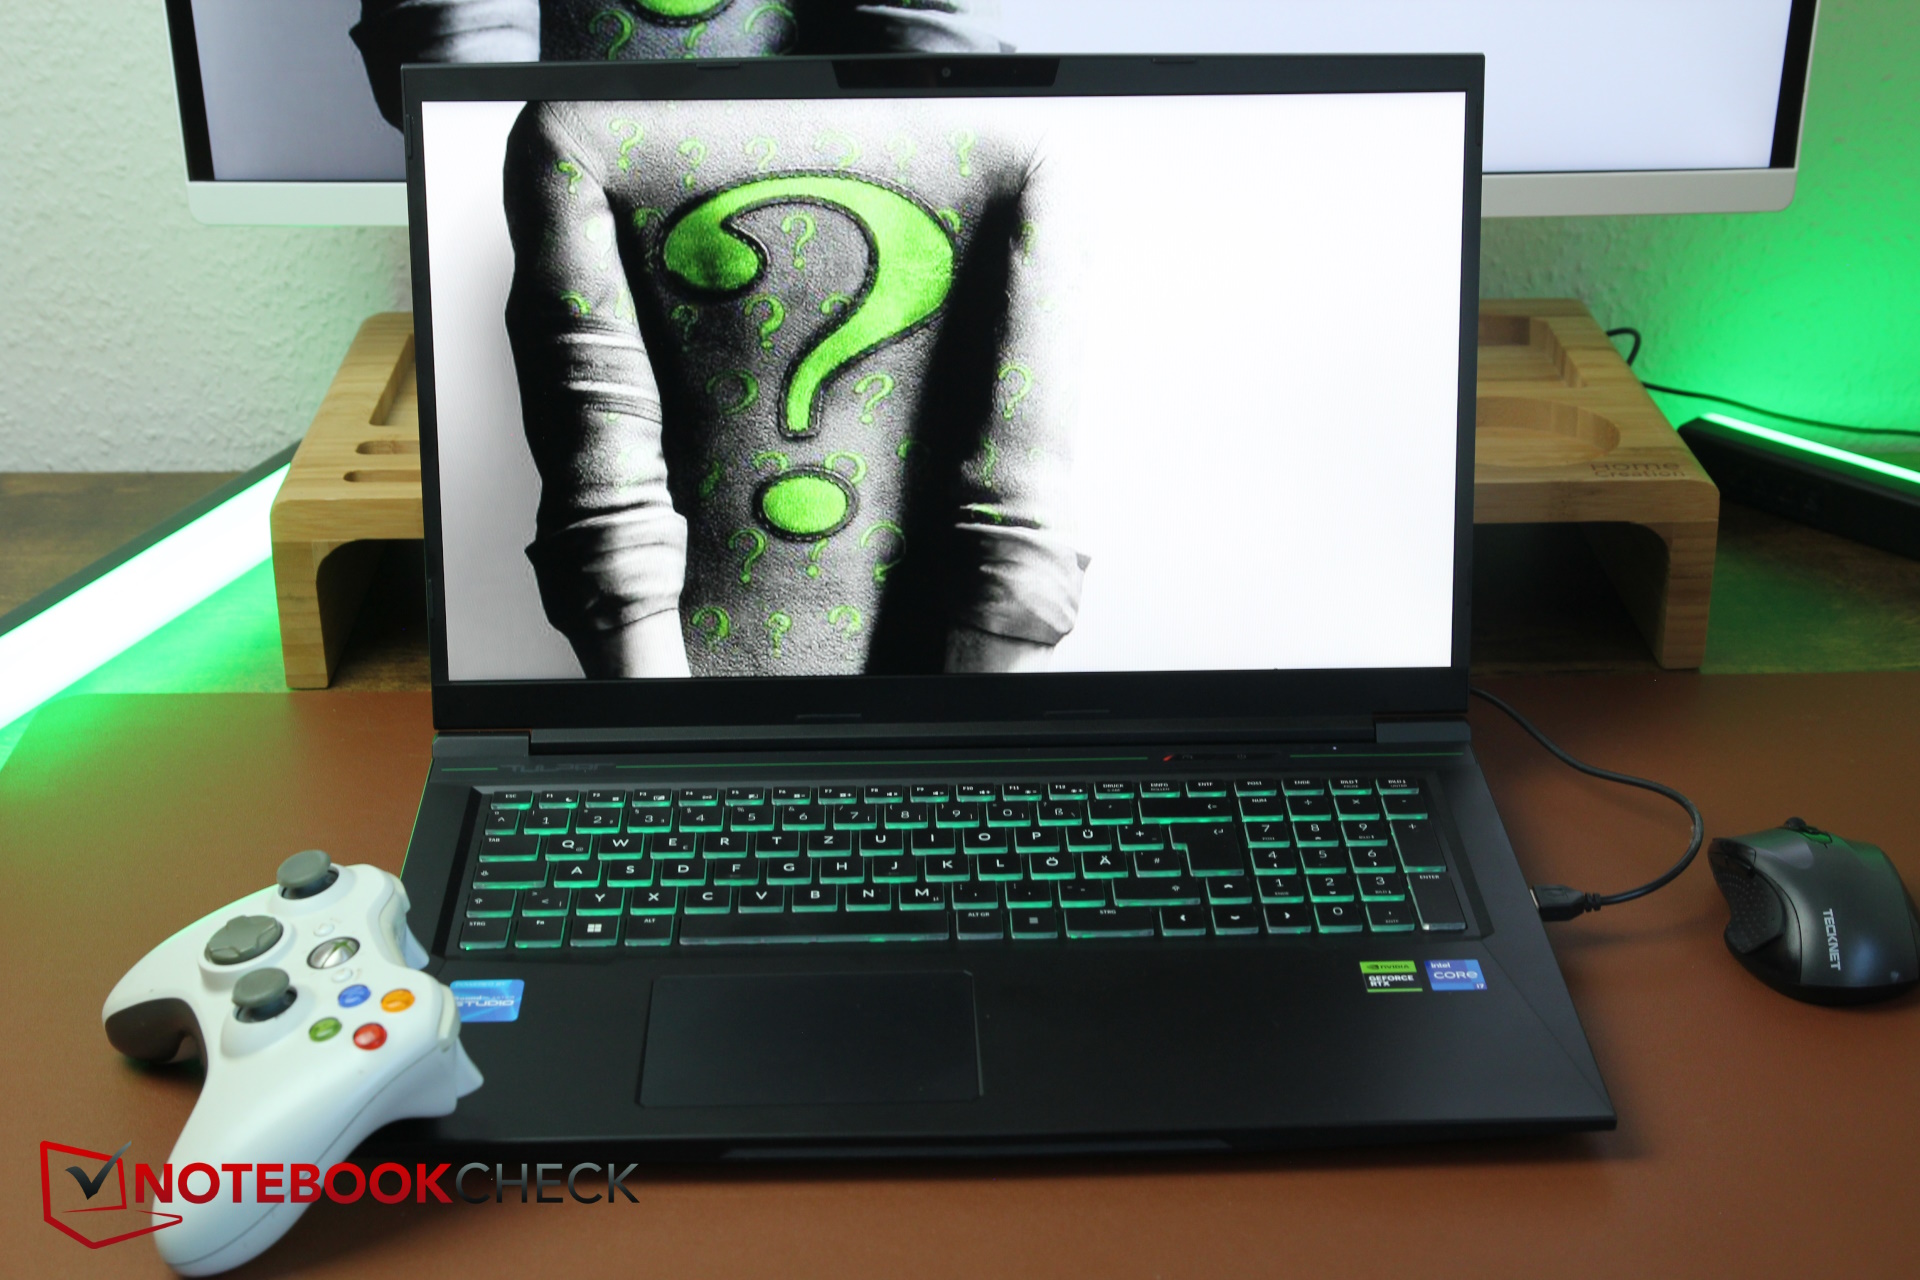
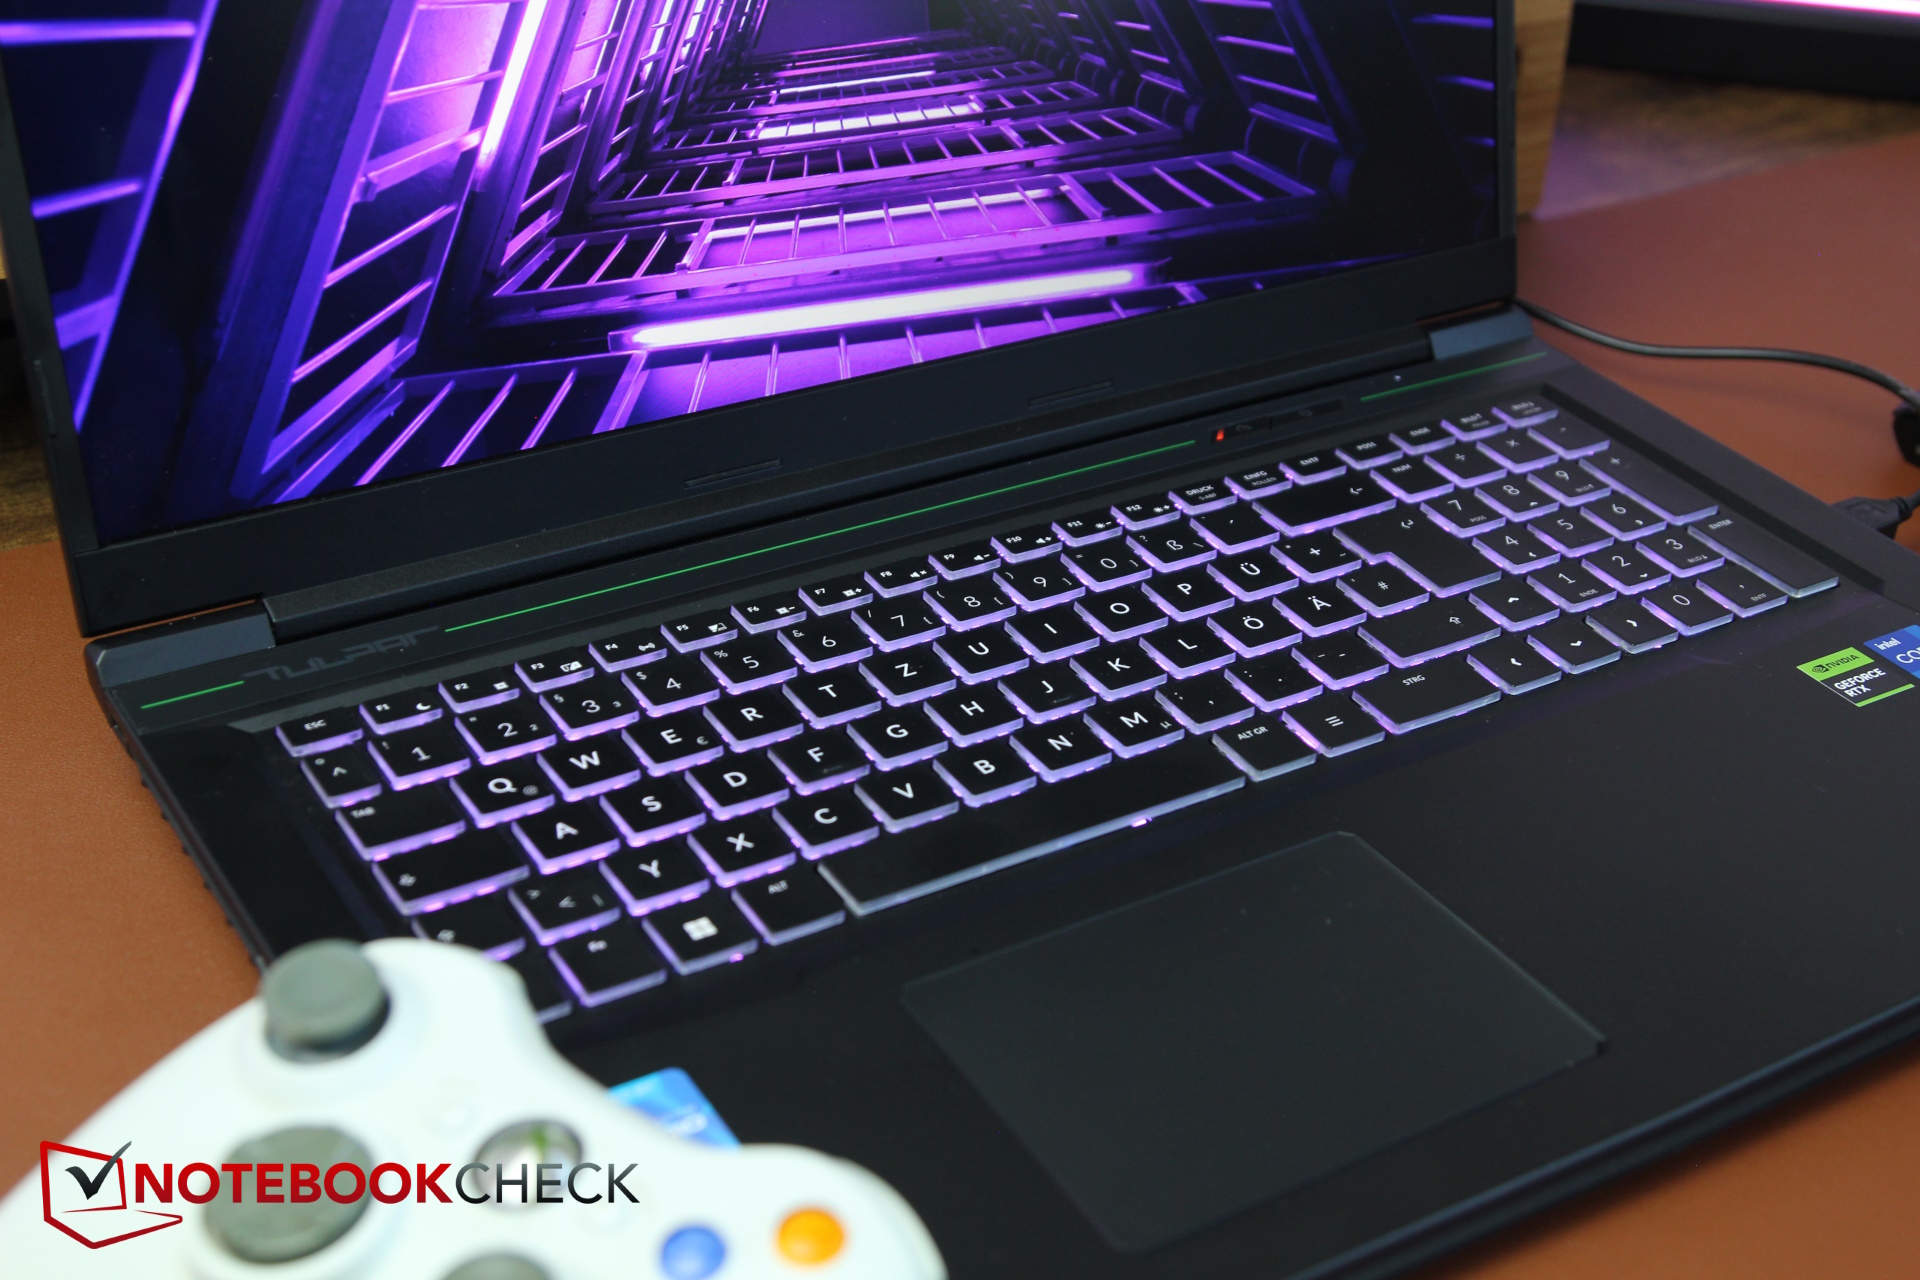
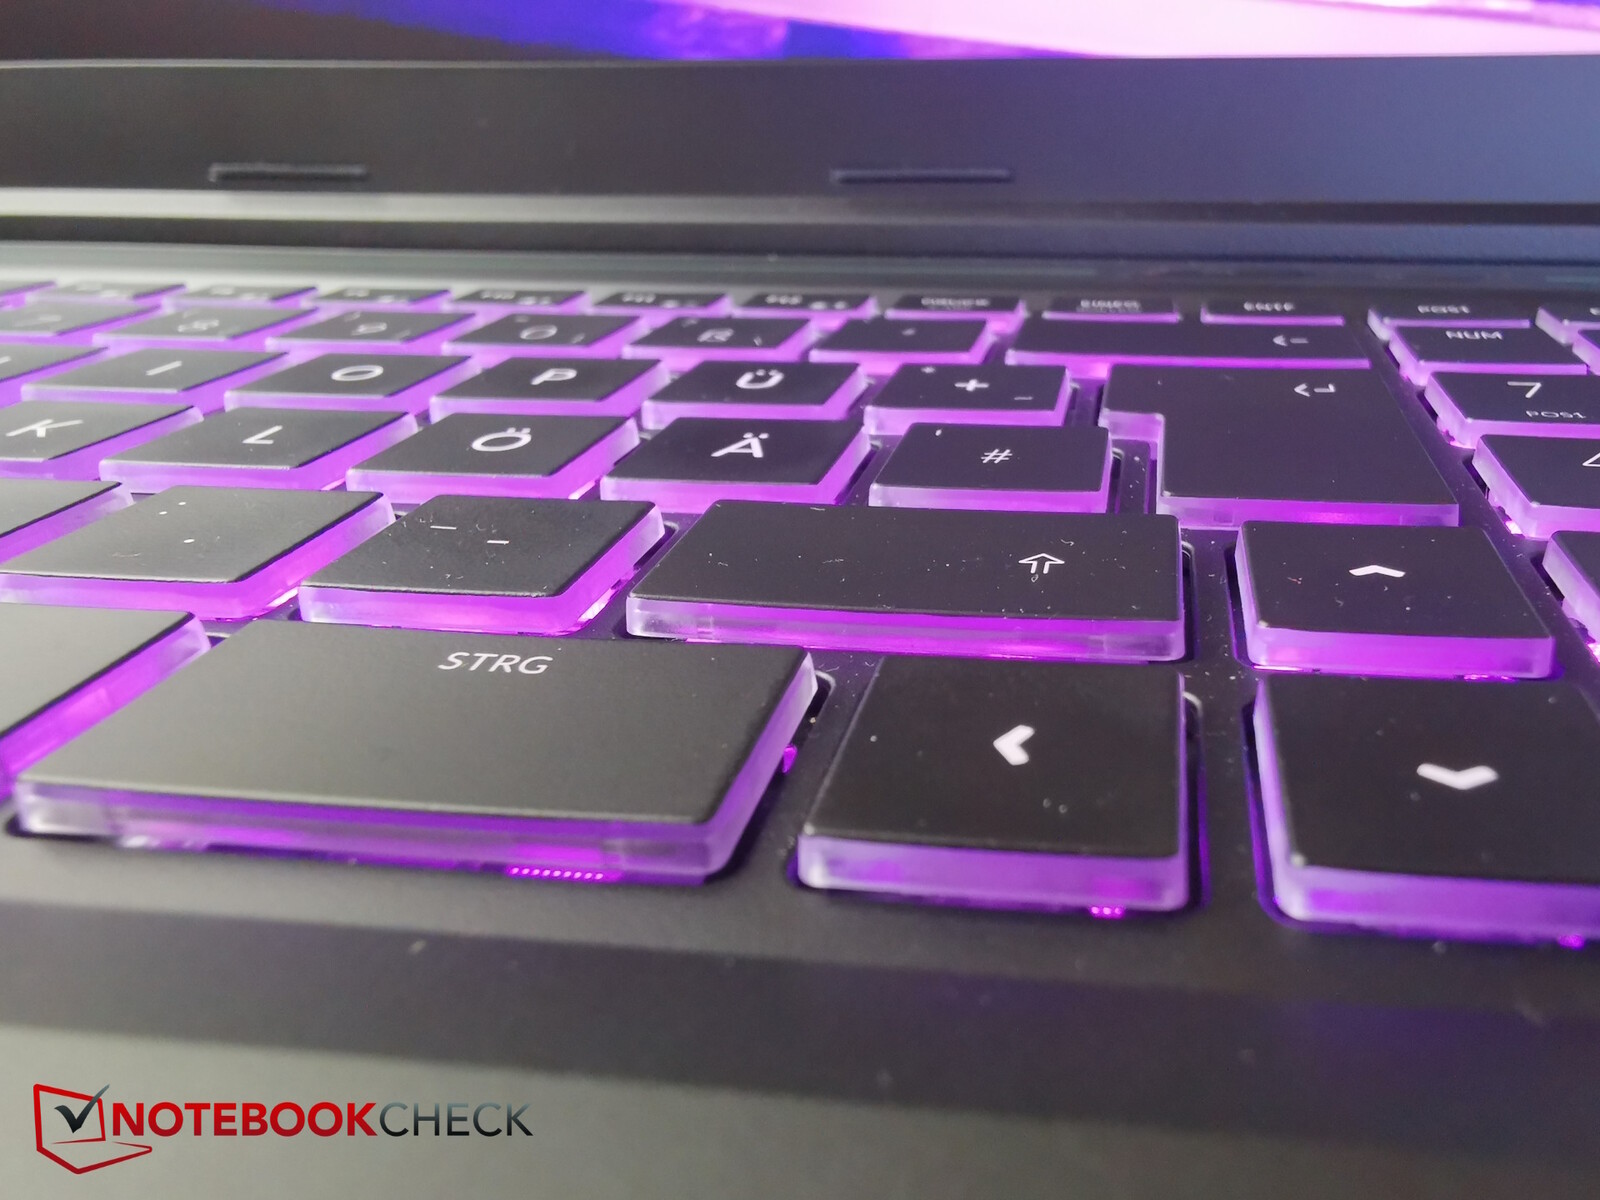
Giriş aygıtları - Klavye beklenenden daha iyi
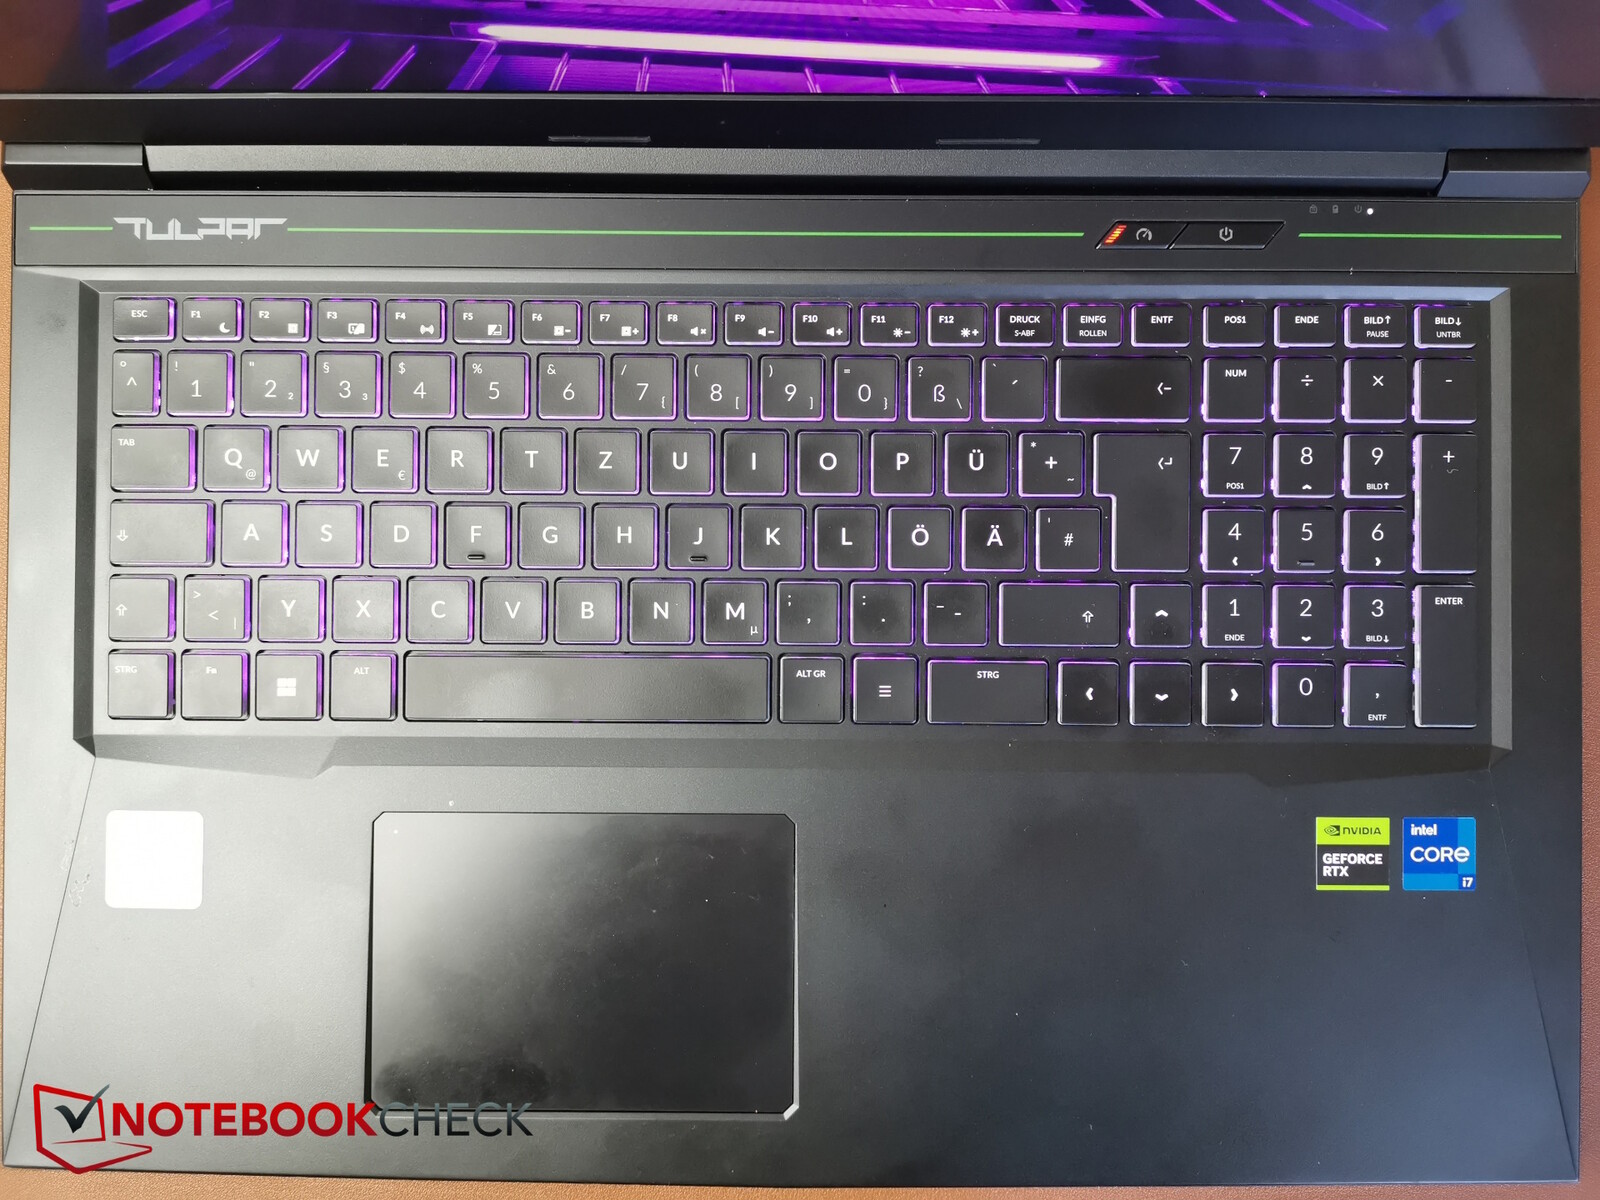
Klavye
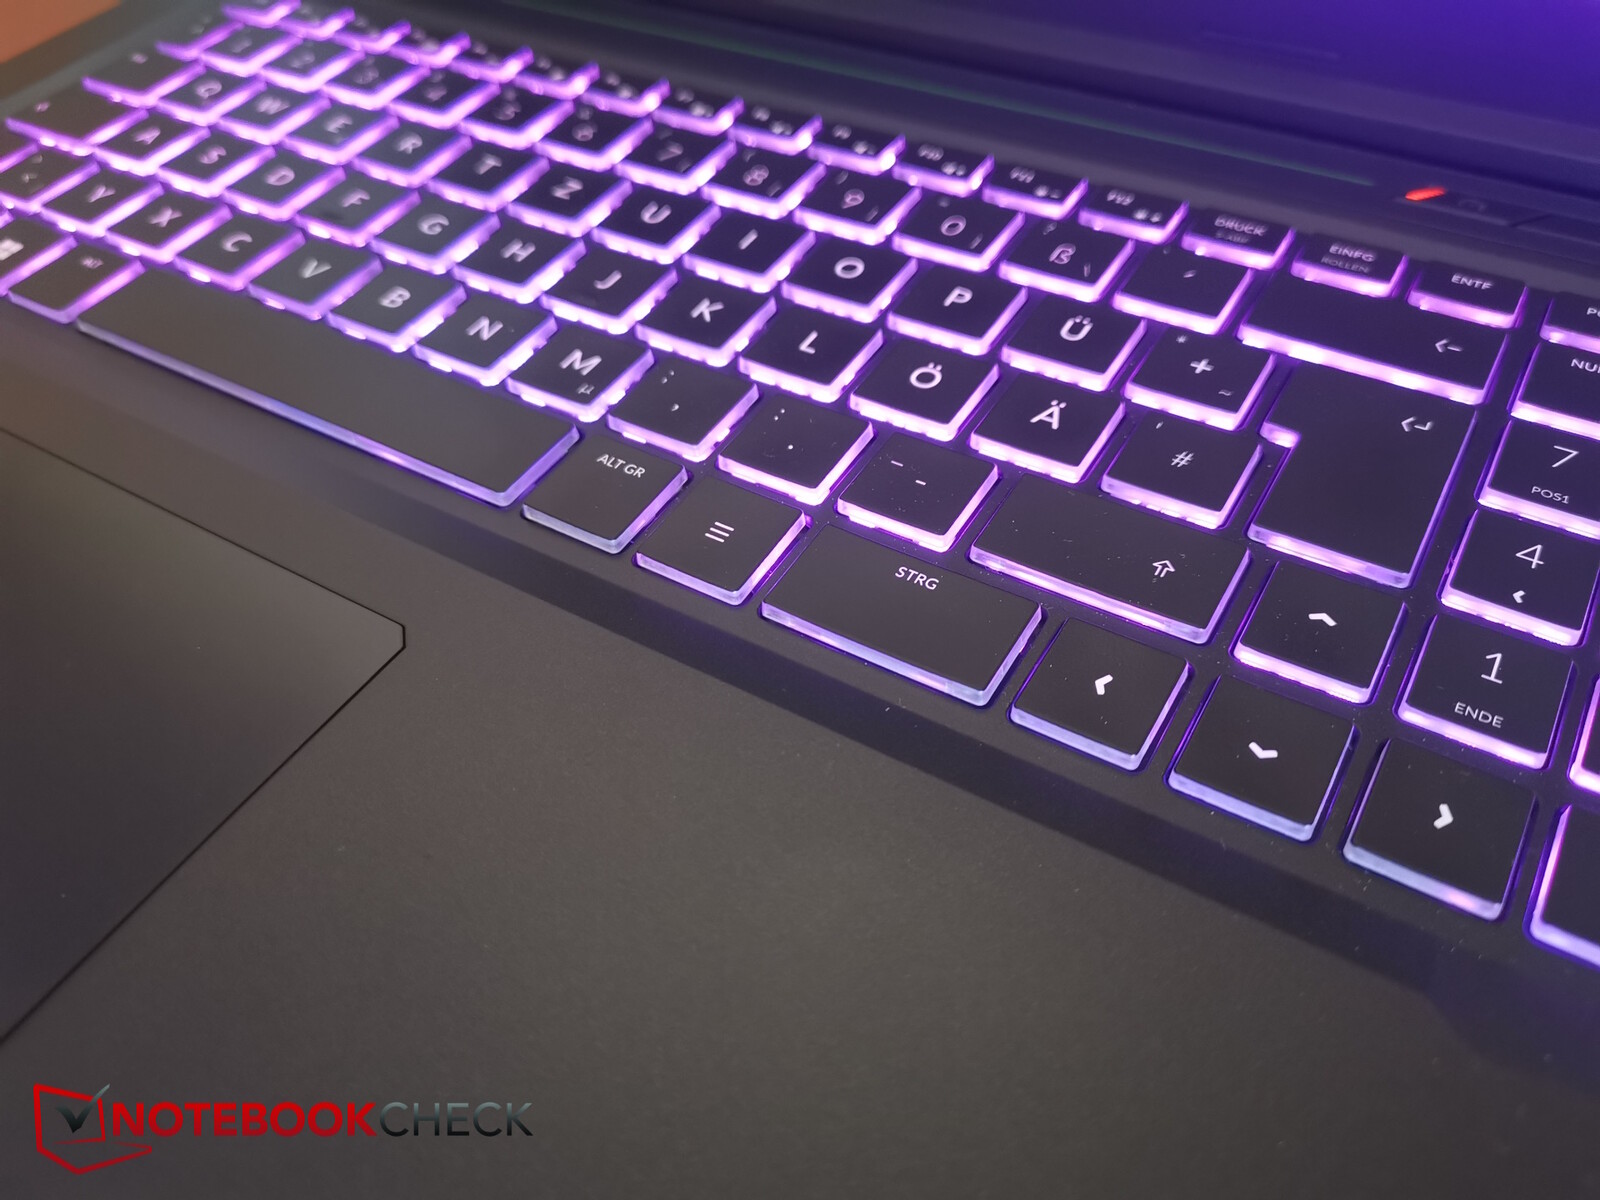
Klavye standart bir düzene sahiptir; her şey altı sıraya yayılmıştır ve hiçbir şey cihazın üst kısmından alt kısmına doğru sapmaz. Sağ tarafta bir sayı tuşu bulunmaktadır. Üç seviyeli arkadan aydınlatmalı (1 bölgeli) klavyenin tabanı hafifçe girintilidir ve tuşlar 1,5 x 1,5 cm boyutlarındadır. Basınç yolları diğer birçok dizüstü bilgisayara göre biraz daha uzun ve yumuşaktır, ancak geri bildirimleri yeterince nettir. Sonuç olarak, klavye bazı rakiplerine göre daha az düz bir his veriyor ve üzerinde yazmak oldukça rahat ve hızlı. Yazma sesi orta ila orta yükseklikte ve tuş etiketlerinin okunması kolay.
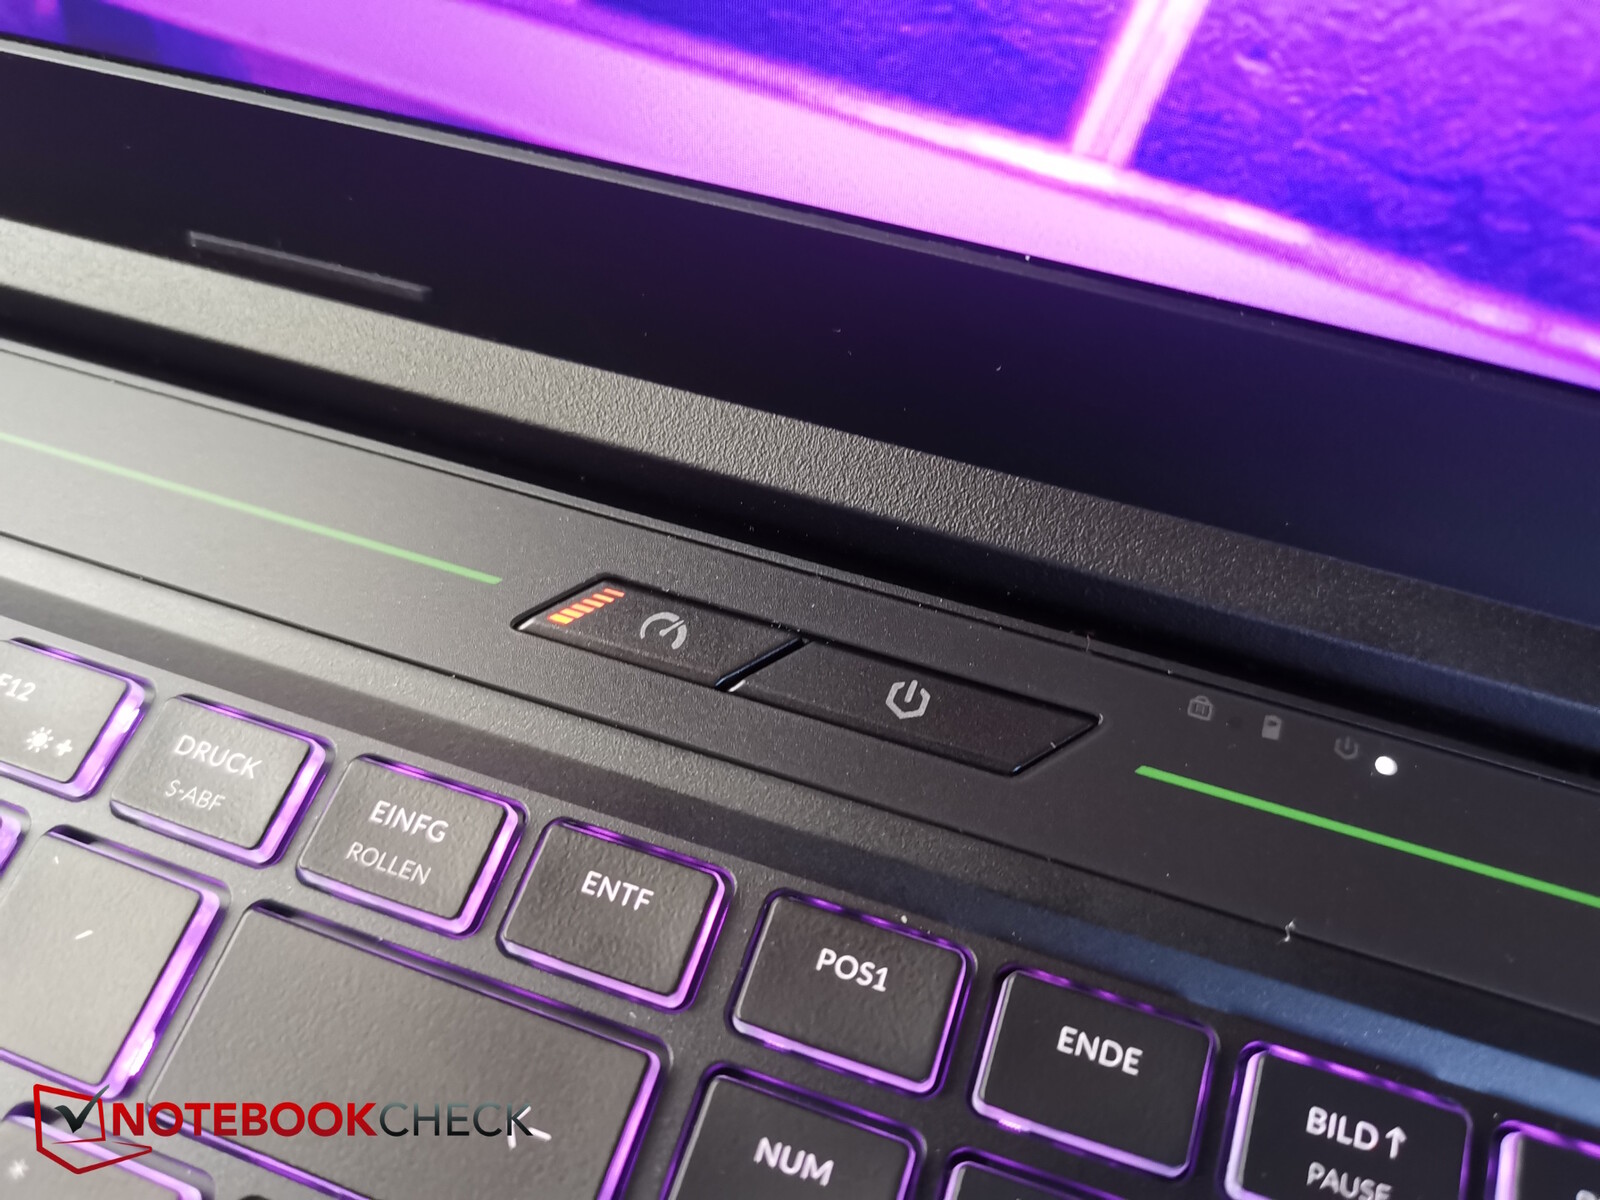
Klavyenin geri kalanının üzerinde ayrı bir güç düğmesi var ve yanında performans profilleri arasında geçiş yapmak için başka bir düğme bulunuyor. Ne yazık ki, Kontrol Merkezi'nde listelenenlere kıyasla farklı isimleri var, ancak tam olarak bunları kontrol ediyorlar. Ofis dengeli, oyun meraklısı ve turbo aslında overboost olarak adlandırılıyor. Düğme üzerindeki küçük bir LED hangi modun kullanımda olduğunu gösteriyor (kapalı = ofis, turuncu = oyun, daha açık turuncu = turbo).
Dokunmatik yüzey
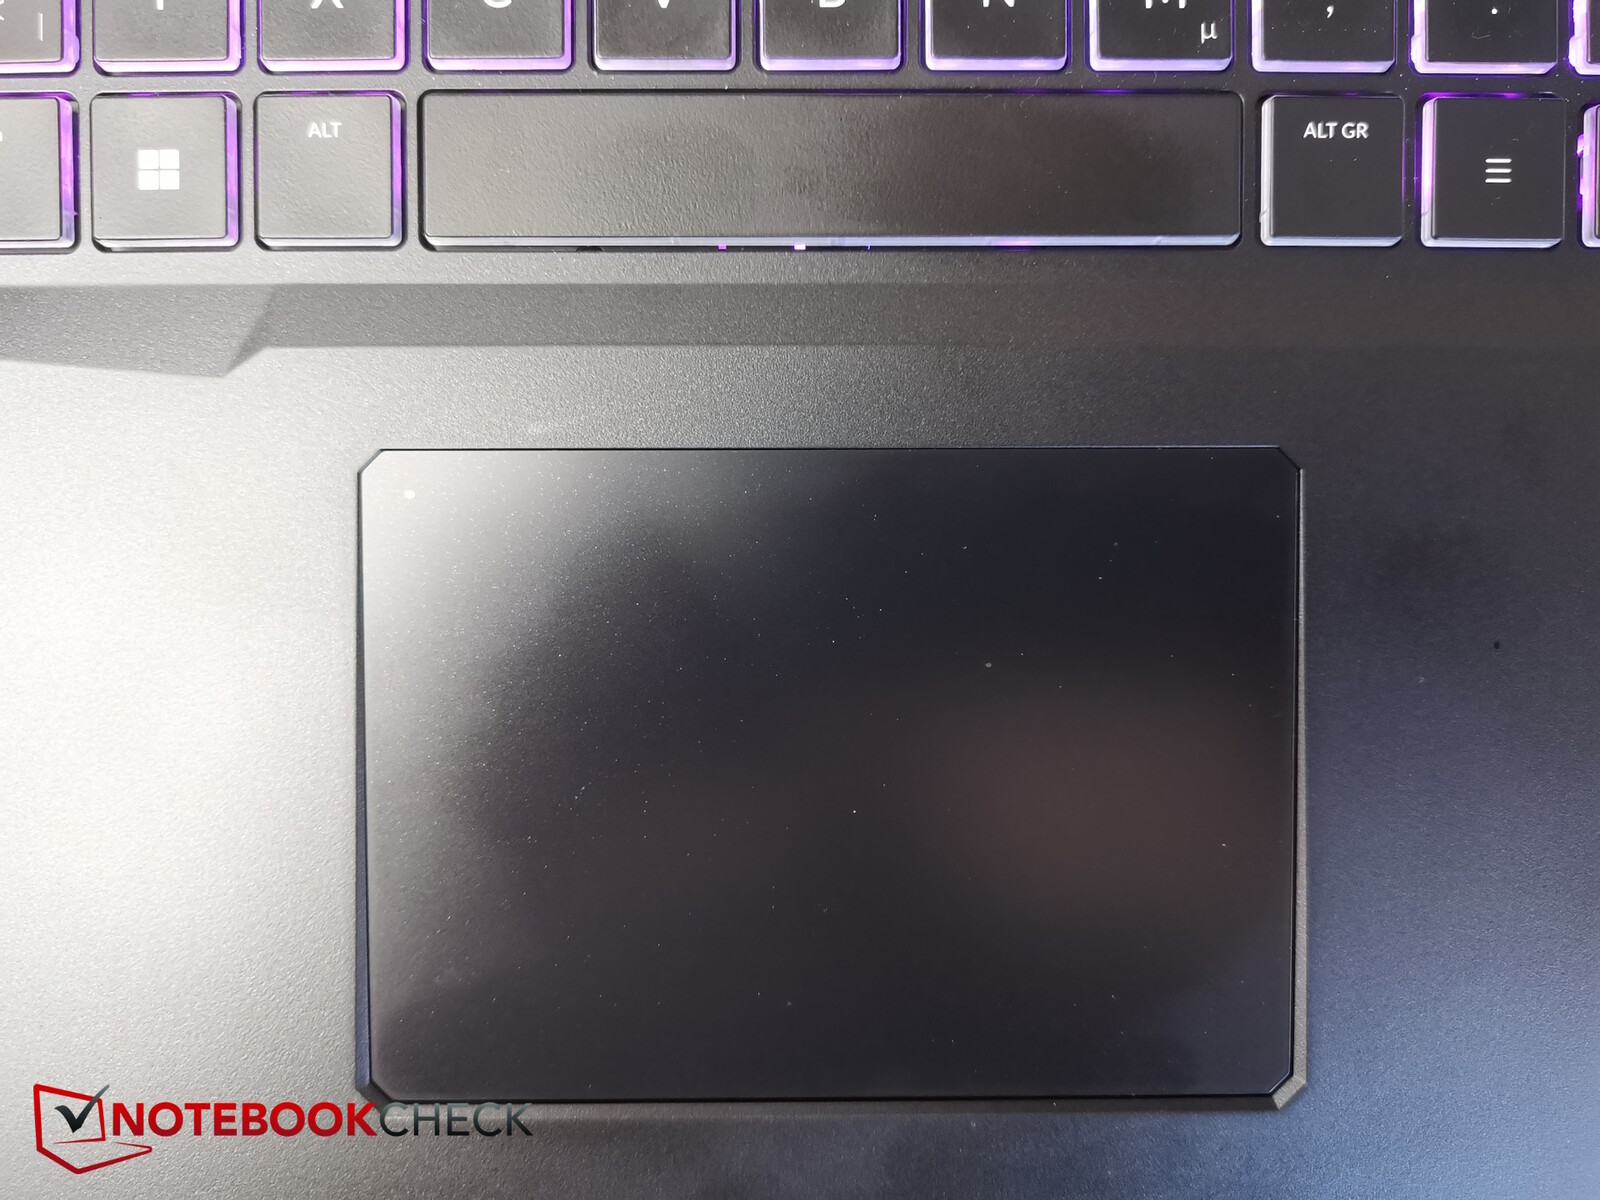
Tulpar açıkça oyunculara yönelik olarak pazarlanıyor ve dizüstü bilgisayar 17 inçlik bir model olmasına rağmen nispeten küçük dokunmatik yüzeyi (yaklaşık 10,6 x 7,35 cm) bunu açıkça ortaya koyuyor. Sayı tuşunun bir sonucu olarak, tamamen ortada değil, bunun yerine hafifçe sola doğru oturuyor, yani boşluk çubuğunun hemen altında.
Yüzeyi yalnızca optimum koşullar altında güzel ve pürüzsüzdür - başka bir deyişle, elleriniz biraz nemli olduğunda yüzeyine takılır. Sol üst kısma iki kez dokunarak dokunmatik yüzeyi (de)aktive edebilirsiniz ve küçük bir LED mevcut durumunu gösterir.
Tıklama sesleri biraz daha yüksek ve cihaza çok yüksek kaliteli bir his vermiyor ama idare eder. Genel olarak, dokunmatik yüzey çok iyi yanıt veriyor ve sağlam bir toplam performans sunuyor. Oyuncular yine de büyük olasılıkla bir fareye uzanacaktır.
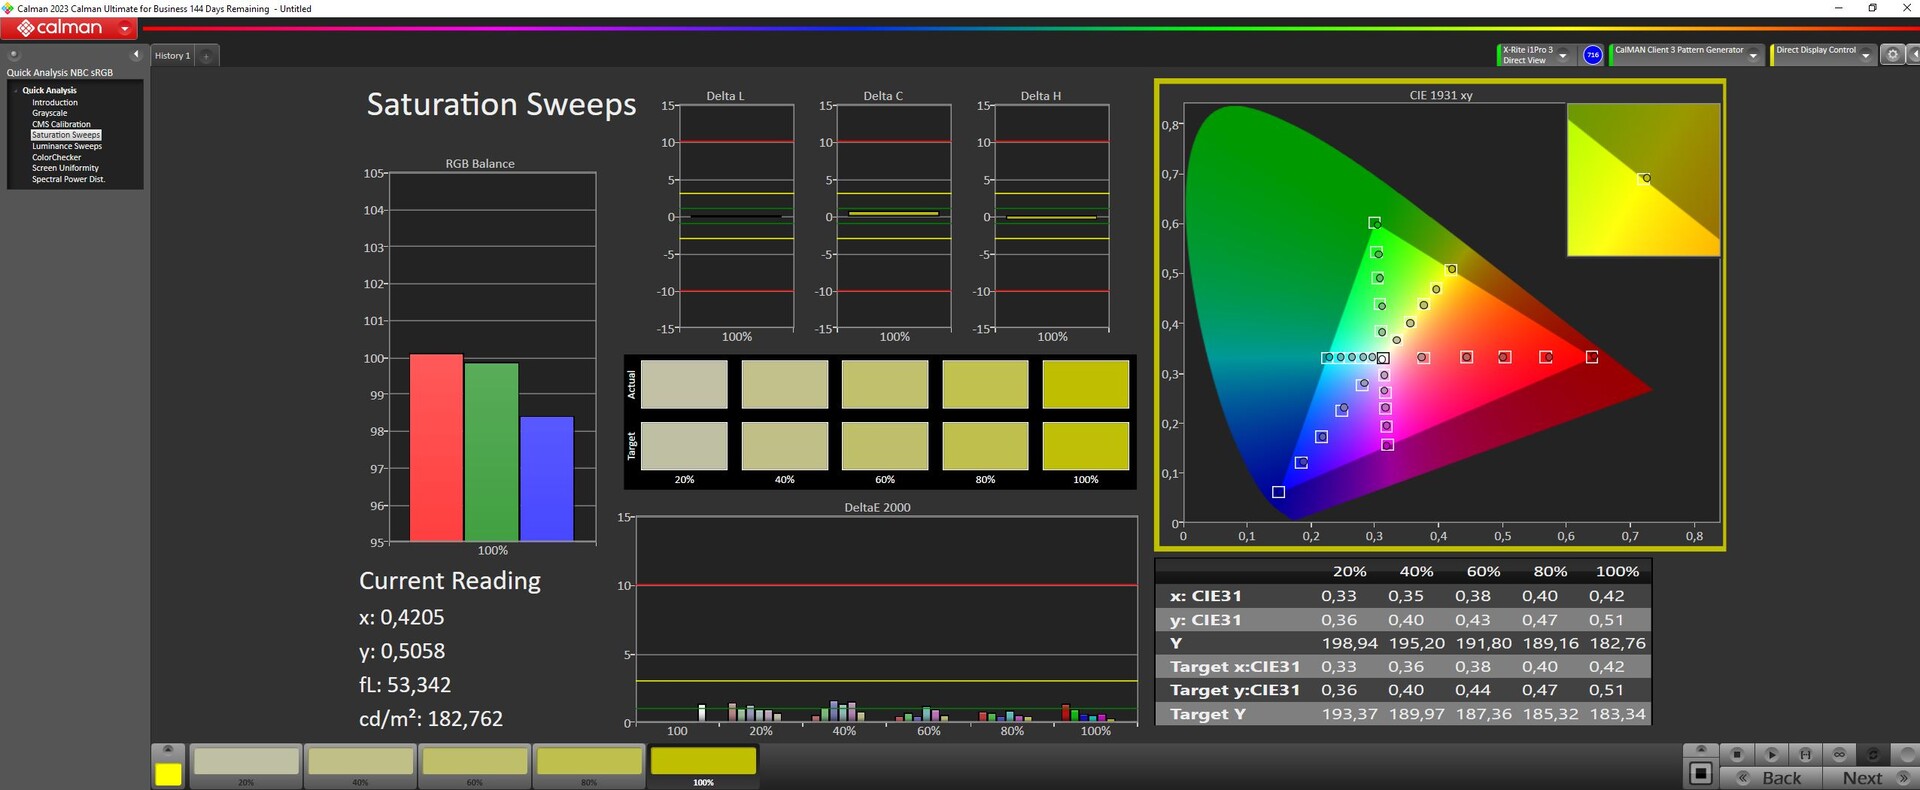
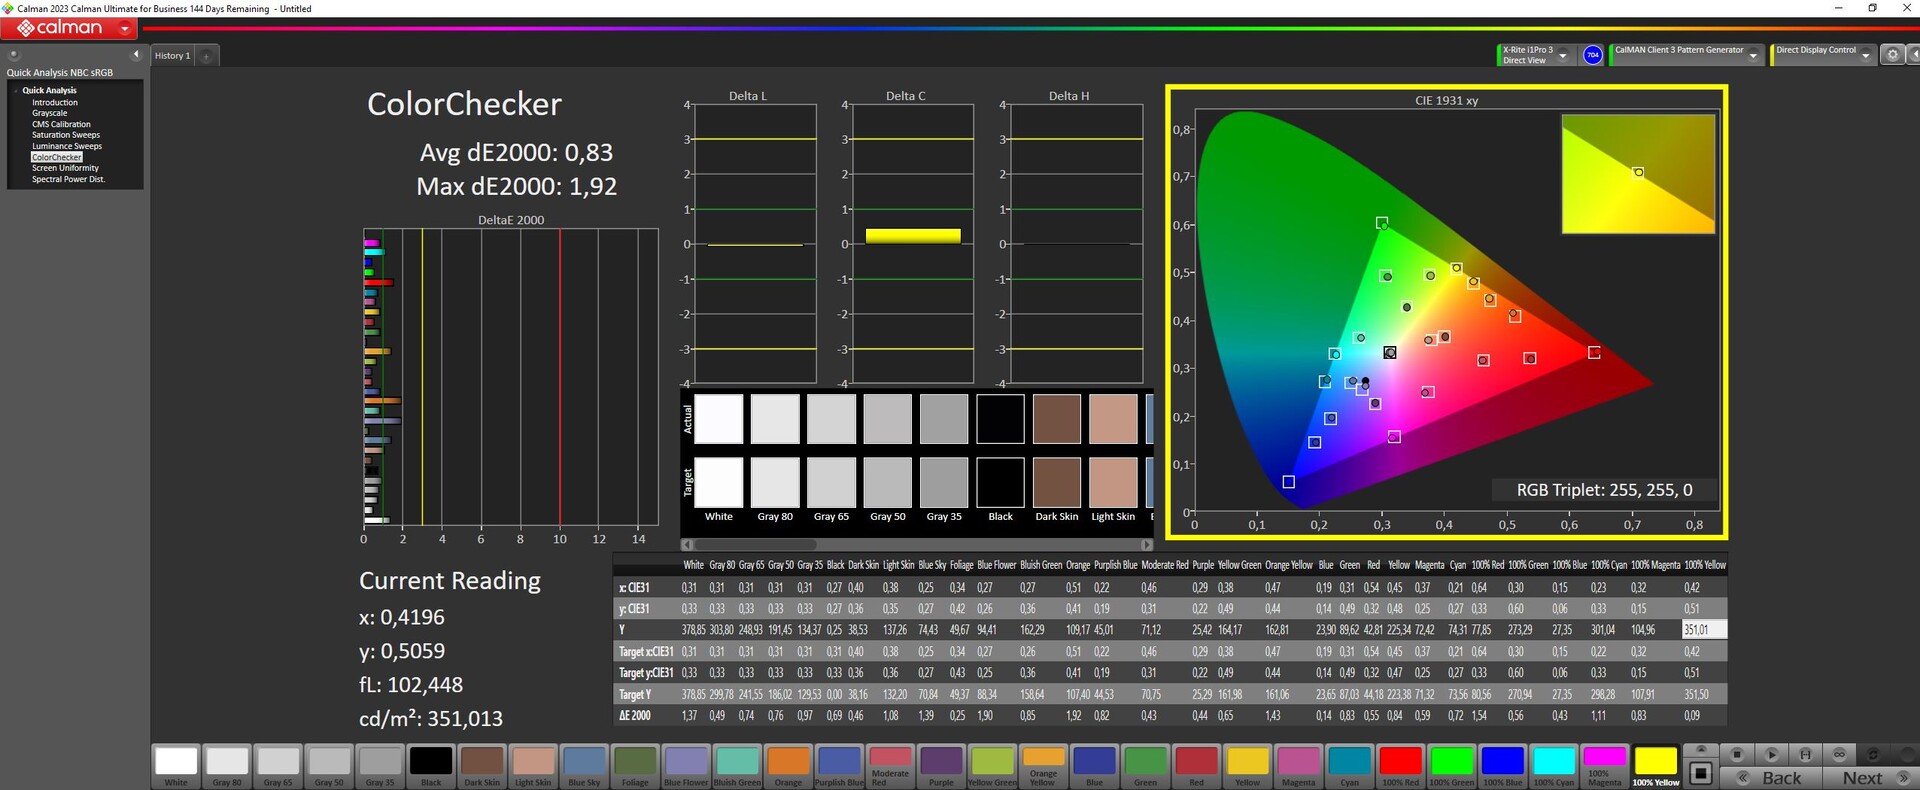
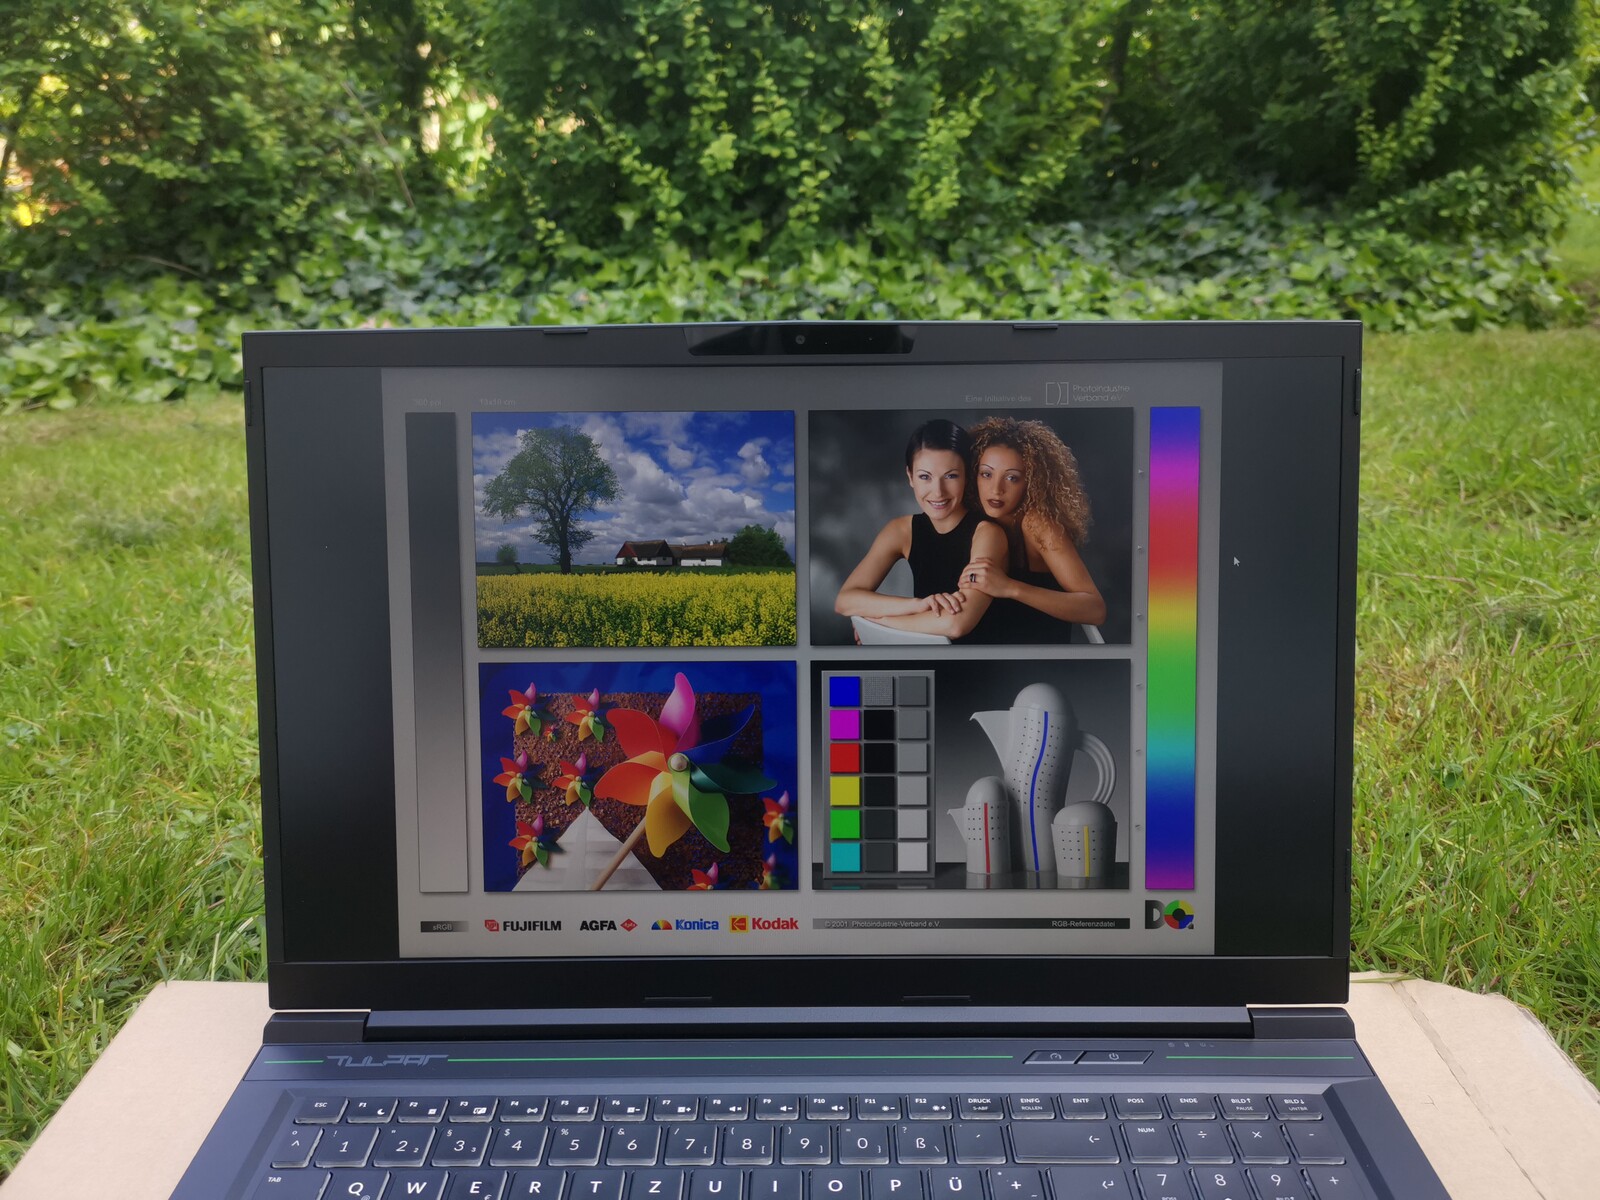
Ekran - 2019'dan itibaren iyi Full HD
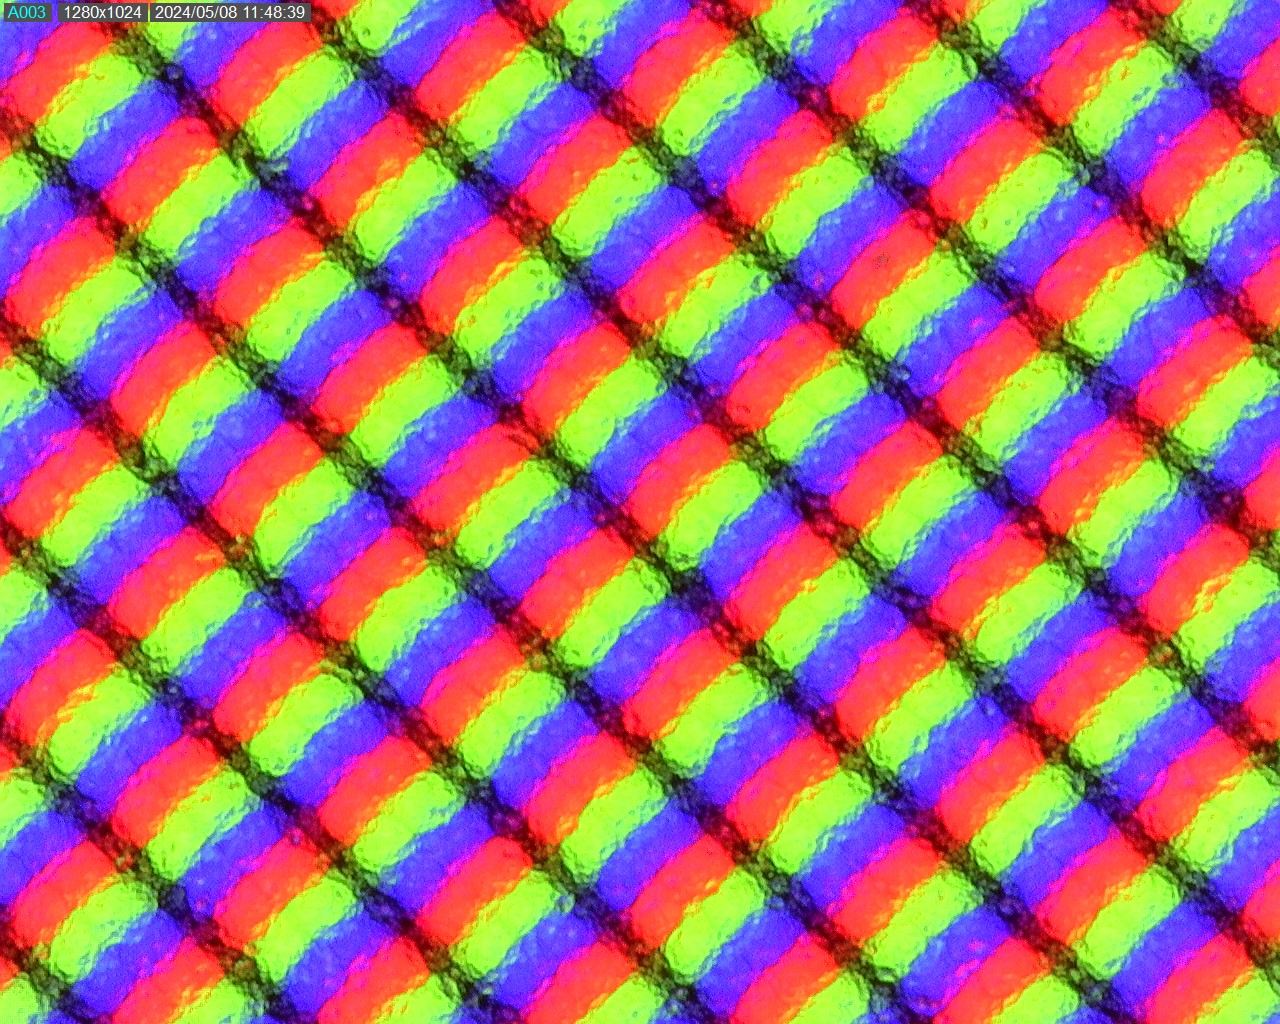
Chi Mei'nin mat Full HD IPS ekranı eski bir tanıdık, aynı zamanda daha ucuz MSI G serisi dizüstü bilgisayarlarda da kendine yer buluyor MSI GP75 Leopard 9SD (2019)'un yanı sıra daha önce test ettiğimiz MSI GT76 9SG (2019) ve MSI GE75 9SG. Tabii ki, bu durumda yaş gerçekten bir kalite işareti değildir. Katana hariç, rakiplerin hiçbiri 17 inçte Full HD'ye güvenmiyor, bunun yerine 2.560 x 1.440 piksel ile daha yüksek çözünürlüklü ekranlara güveniyor.
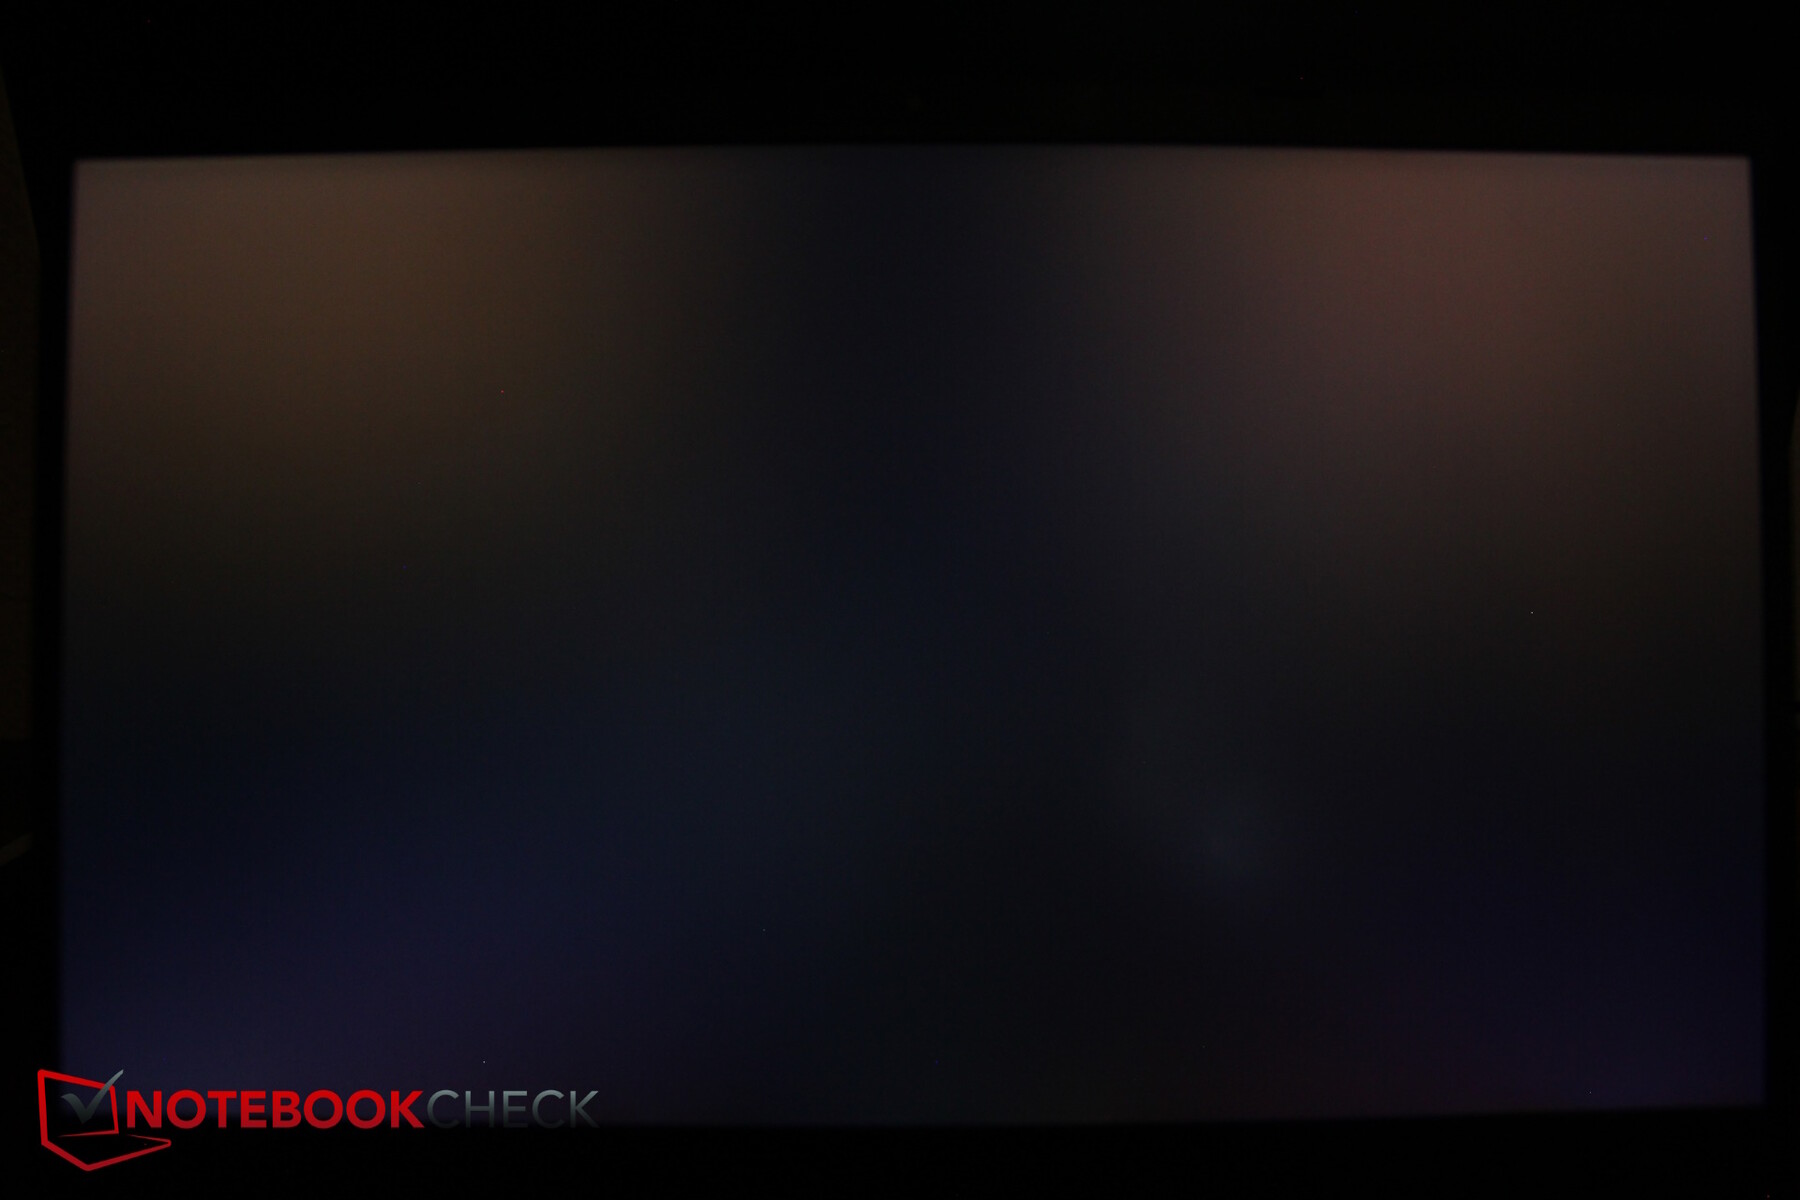
Yine de panelin kötü olduğu söylenemez. Yaklaşık 350 nit ortalama parlaklığı iyi, ancak aydınlatması daha eşit olabilirdi. Buna karşılık, bir bütçe cihazı için iyi olan siyah değeri sayesinde kontrastı karşılaştırma cihazlarından daha yüksektir. Arka ışık akması neredeyse hiç fark edilmiyor ve kesinlikle yolunuza çıkmamalı.
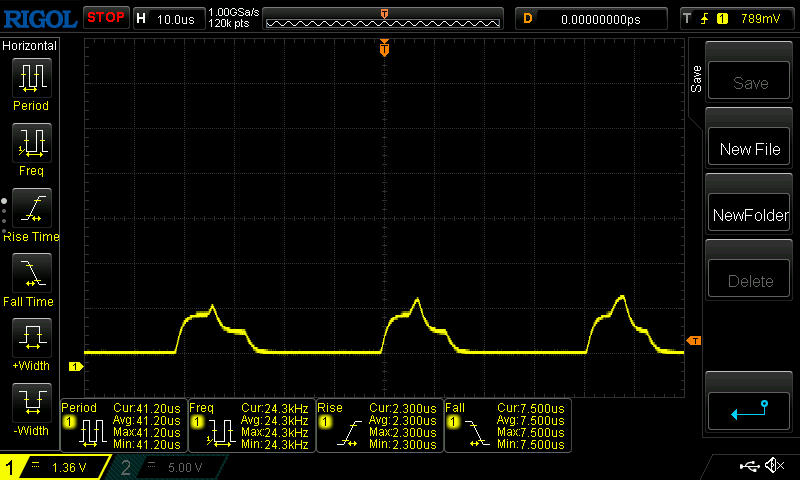
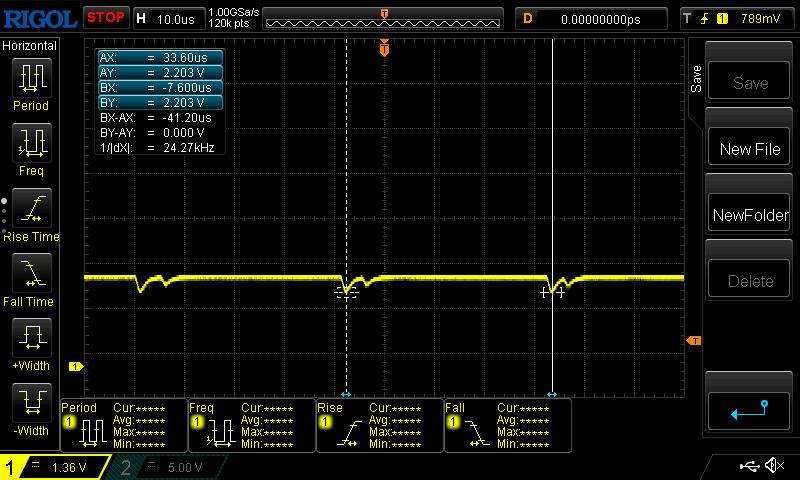
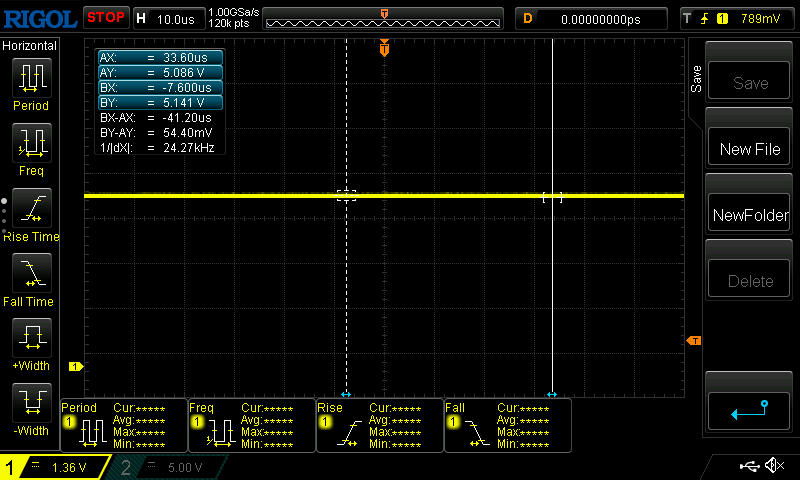
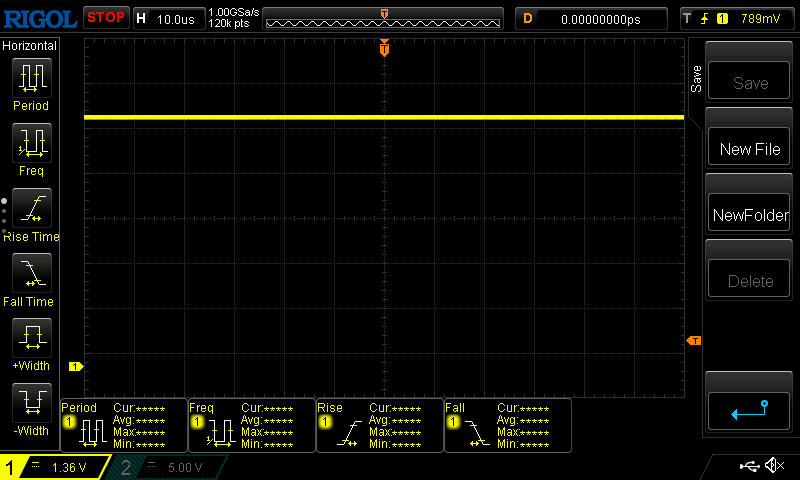
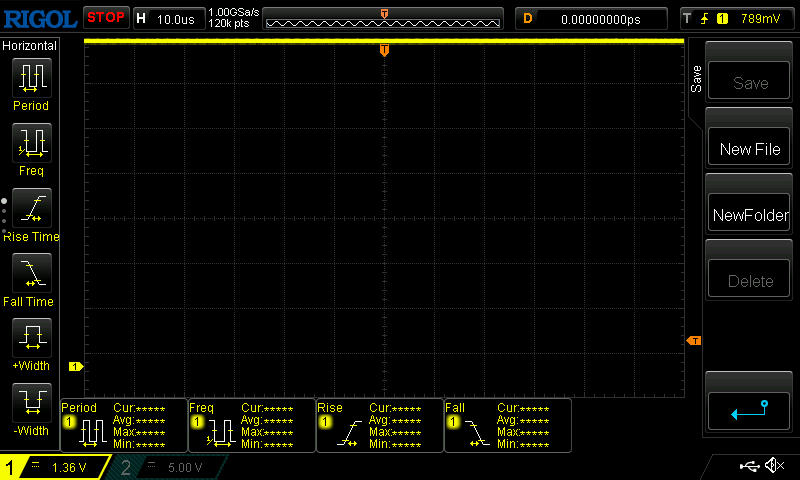
Ancak ekran yüzde 25'in altındaki parlaklık seviyelerinde 25 kHz ila 42 kHz gibi yüksek bir frekansta titriyor, bu da hassas kullanıcıların bile neredeyse hiç sorun yaşamayacağı anlamına geliyor. Tepki süreleri yaklaşık 11 (siyahtan beyaza) ila 15 ms (griden griye) arasındadır.
| |||||||||||||||||||||||||
Aydınlatma: 83 %
Batarya modunda parlaklık: 373 cd/m²
Kontrast: 1639:1 (Siyah: 0.23 cd/m²)
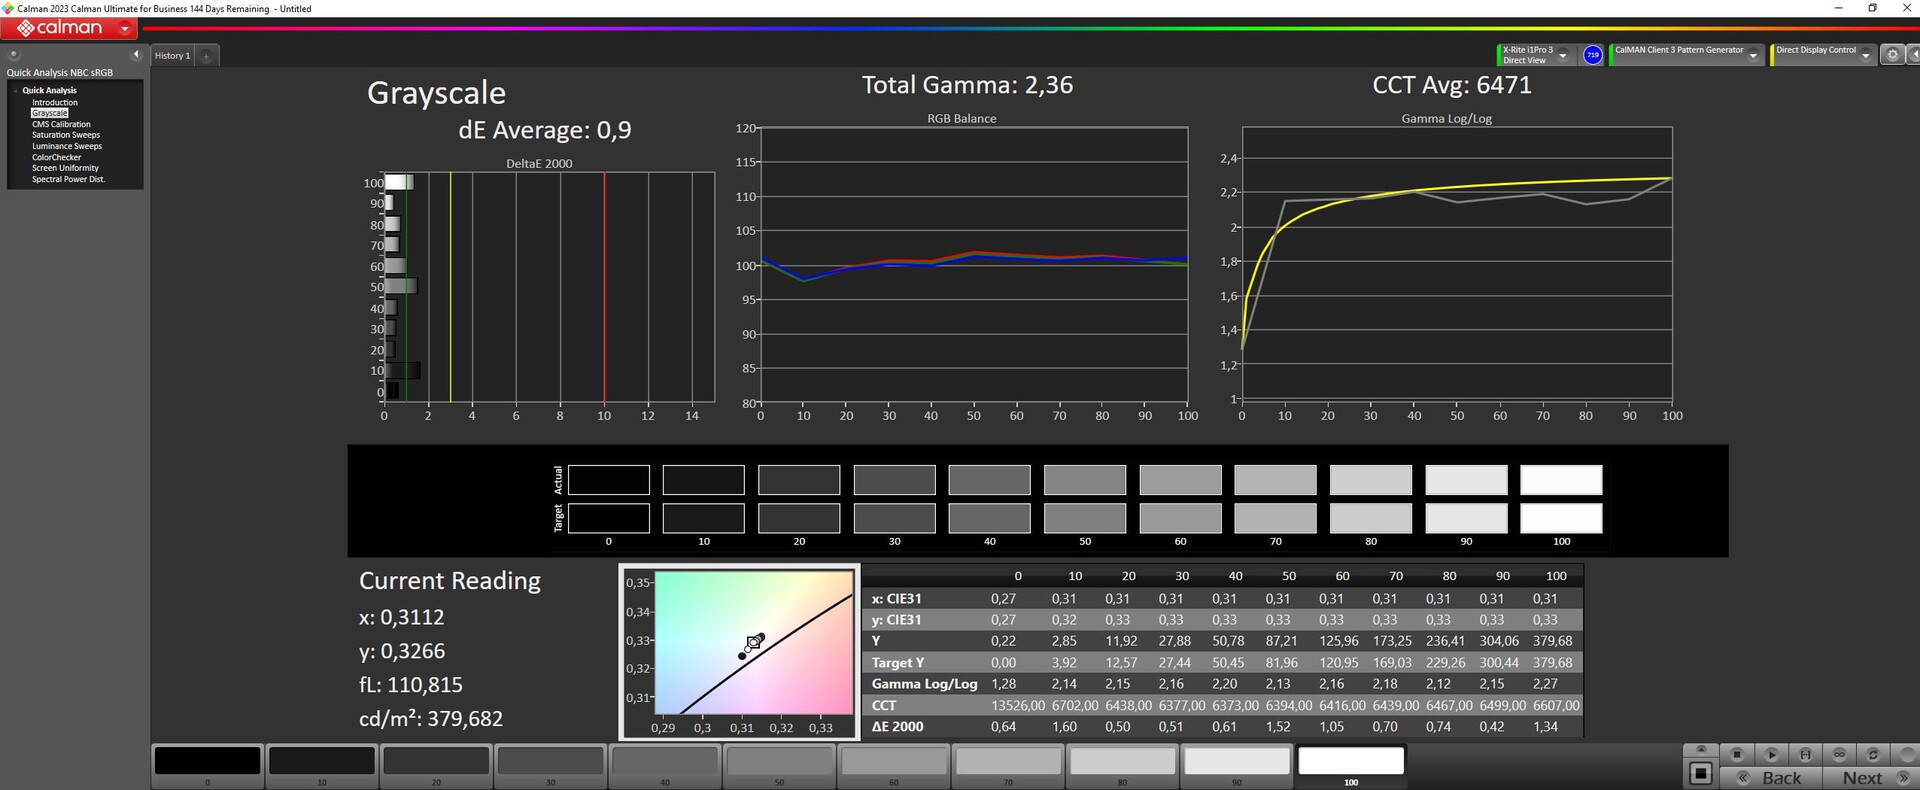
ΔE ColorChecker Calman: 0.83 | ∀{0.5-29.43 Ø4.73}
calibrated: 0.83
ΔE Greyscale Calman: 0.9 | ∀{0.09-98 Ø4.97}
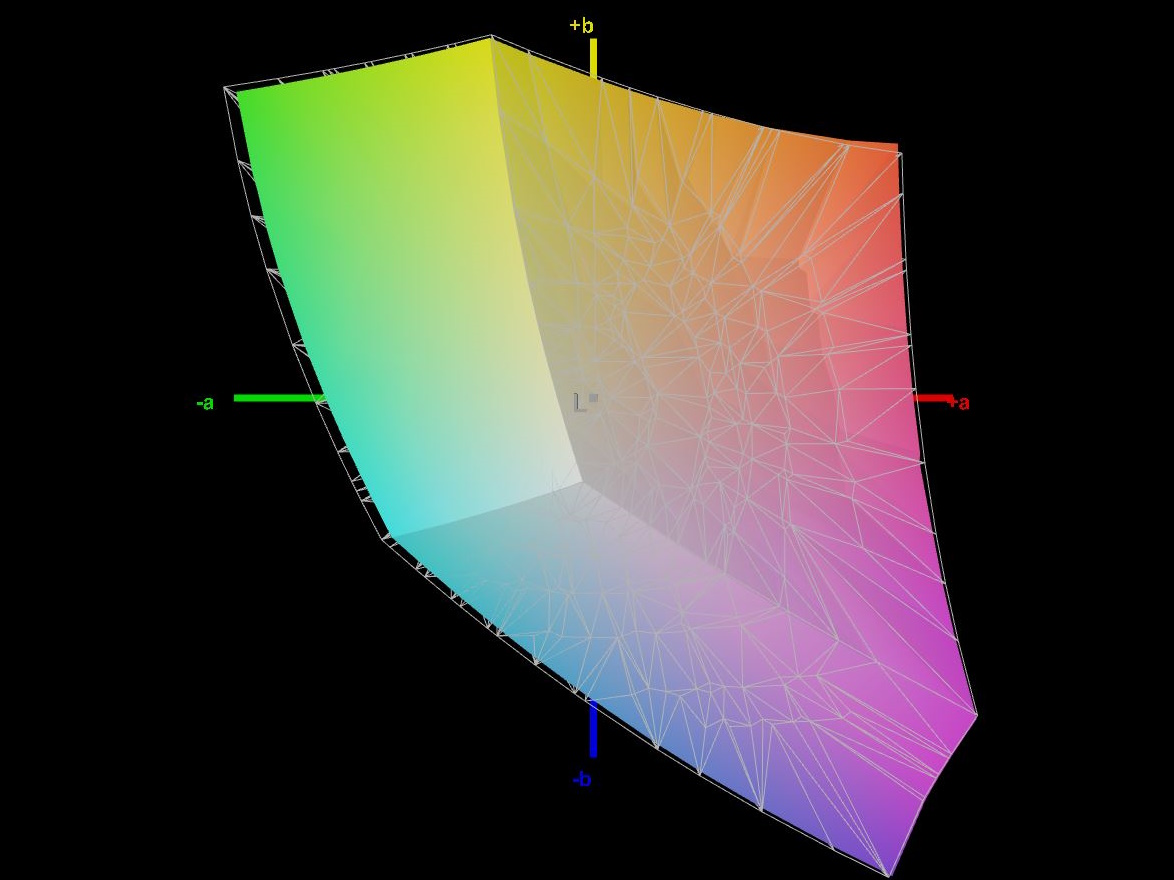
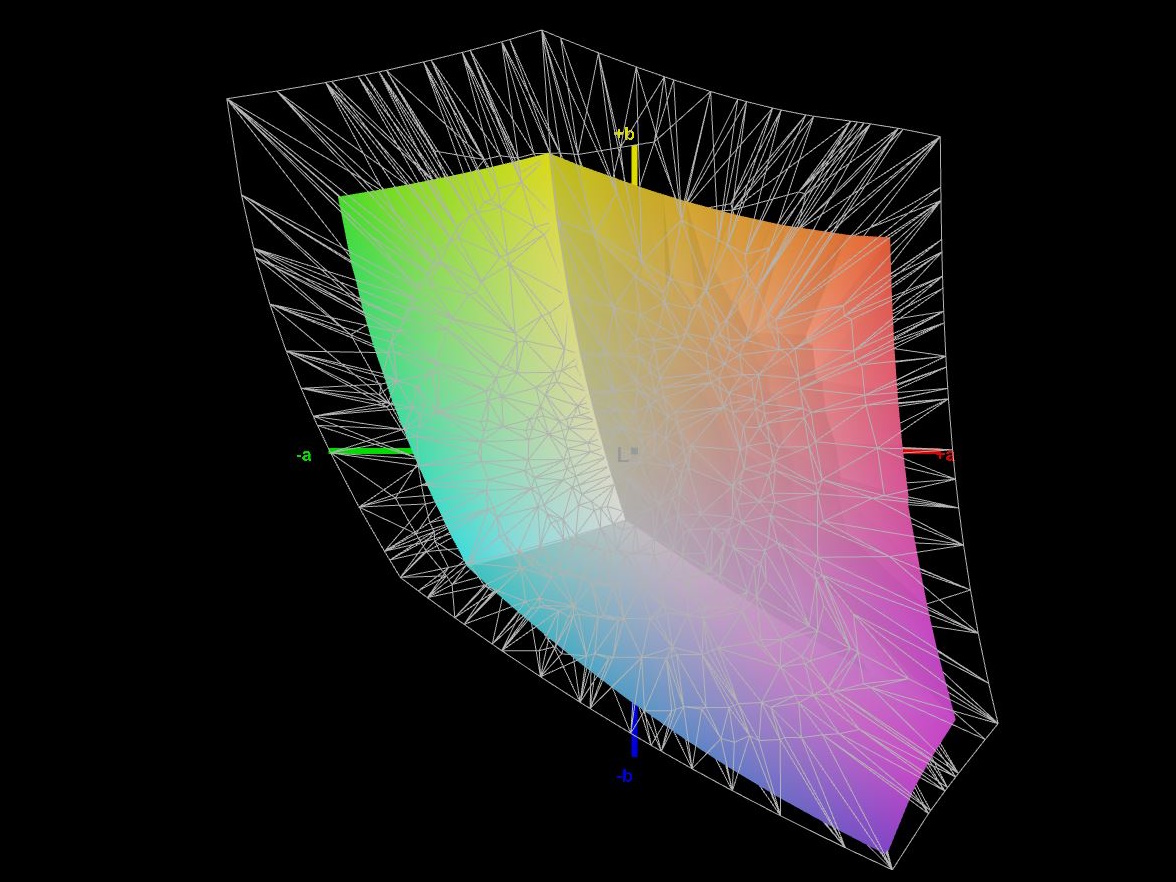
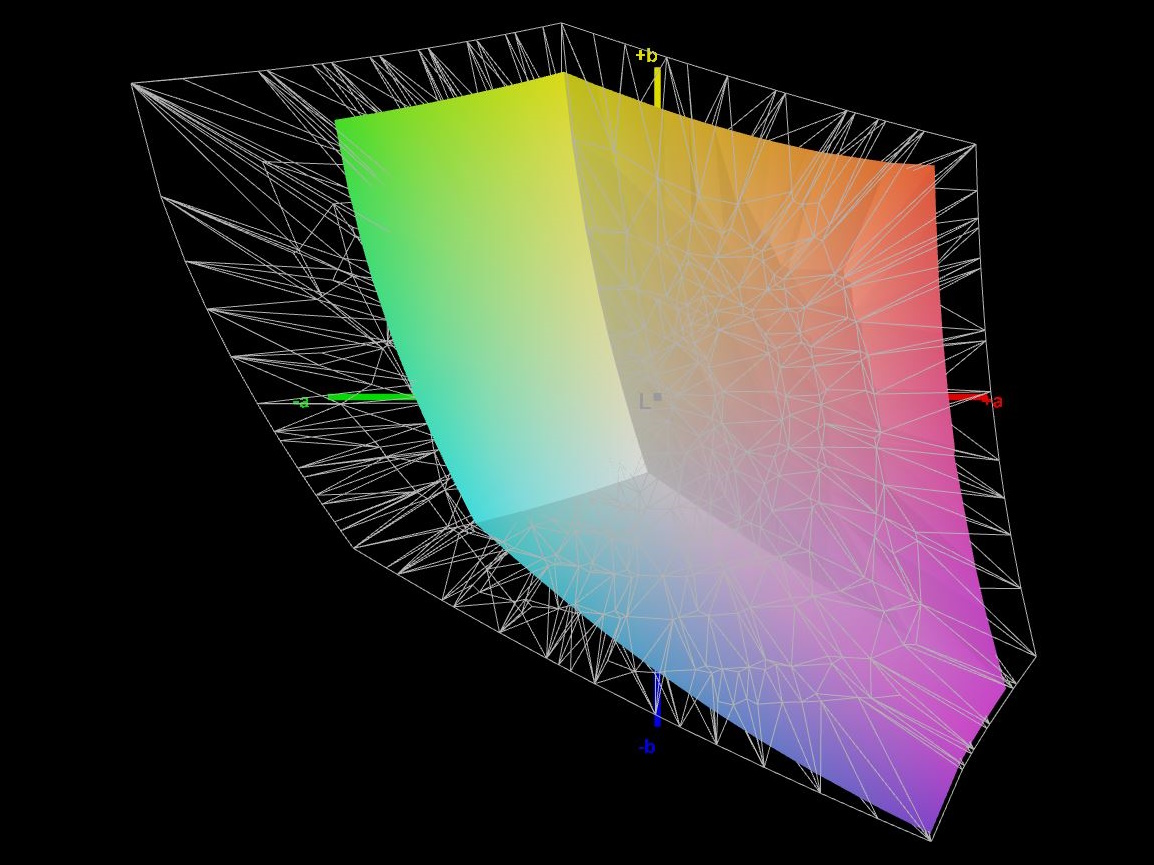
66.1% AdobeRGB 1998 (Argyll 3D)
96.2% sRGB (Argyll 3D)
64.2% Display P3 (Argyll 3D)
Gamma: 2.36
CCT: 6471 K
| Tulpar T7 V20.6 Chi Mei CMN175C (CMN N173HCE-G33), IPS, 1920x1080, 17.3" | Schenker XMG Apex 17 (Late 23) BOE CQ NE173QHM-NZ3, IPS, 2560x1440, 17.3" | Acer Nitro 17 AN17-51-71ER BOE0B7C NE173QHM-NY6, , 2560x1440, 17.3" | Medion Erazer Defender P40 BOE CQ NE173QHM-NZ3, IPS, 2560x1440, 17.3" | MSI Katana 17 B13VFK B173HAN04.9, IPS LED, 1920x1080, 17.3" | Lenovo Legion 5 16IRX G9 NE160QDM-NZ3, IPS, 2560x1600, 16" | |
|---|---|---|---|---|---|---|
| Display | 4% | 29% | 5% | -36% | 10% | |
| Display P3 Coverage (%) | 64.2 | 68.1 6% | 98.3 53% | 68.3 6% | 40.8 -36% | 72.4 13% |
| sRGB Coverage (%) | 96.2 | 97.7 2% | 100 4% | 98.1 2% | 61 -37% | 100 4% |
| AdobeRGB 1998 Coverage (%) | 66.1 | 69.5 5% | 85.7 30% | 69.8 6% | 42.2 -36% | 74.1 12% |
| Response Times | 19% | 14% | 12% | -129% | 19% | |
| Response Time Grey 50% / Grey 80% * (ms) | 14.7 ? | 13.5 ? 8% | 14.8 ? -1% | 14.6 ? 1% | 33 ? -124% | 12.5 ? 15% |
| Response Time Black / White * (ms) | 11.1 ? | 7.9 ? 29% | 8 ? 28% | 8.7 ? 22% | 26 ? -134% | 8.7 ? 22% |
| PWM Frequency (Hz) | 25000 | |||||
| PWM Amplitude * (%) | 27 | |||||
| Screen | -55% | -153% | -32% | -222% | -9% | |
| Brightness middle (cd/m²) | 377 | 403 7% | 361 -4% | 364 -3% | 267 -29% | 526 40% |
| Brightness (cd/m²) | 353 | 381 8% | 326 -8% | 343 -3% | 256 -27% | 500 42% |
| Brightness Distribution (%) | 83 | 90 8% | 87 5% | 86 4% | 93 12% | 87 5% |
| Black Level * (cd/m²) | 0.23 | 0.37 -61% | 0.6 -161% | 0.28 -22% | 0.21 9% | 0.33 -43% |
| Contrast (:1) | 1639 | 1089 -34% | 602 -63% | 1300 -21% | 1271 -22% | 1594 -3% |
| Colorchecker dE 2000 * | 0.83 | 2.22 -167% | 3.83 -361% | 1.67 -101% | 4.7 -466% | 1.2 -45% |
| Colorchecker dE 2000 max. * | 1.92 | 3.76 -96% | 5.71 -197% | 2.78 -45% | 20.4 -963% | 2.1 -9% |
| Colorchecker dE 2000 calibrated * | 0.83 | 1.22 -47% | 3.48 -319% | 1.14 -37% | 4.5 -442% | 1 -20% |
| Greyscale dE 2000 * | 0.9 | 1.9 -111% | 3.29 -266% | 1.4 -56% | 1.5 -67% | 1.3 -44% |
| Gamma | 2.36 93% | 2.046 108% | 2.29 96% | 2.091 105% | 2.12 104% | 2.23 99% |
| CCT | 6471 100% | 6656 98% | 6679 97% | 6568 99% | 6552 99% | 6391 102% |
| Toplam Ortalama (Program / Ayarlar) | -11% /
-32% | -37% /
-90% | -5% /
-18% | -129% /
-169% | 7% /
-1% |
* ... daha küçük daha iyidir
Biraz eski olan panel, renk alanı kapsamı söz konusu olduğunda mevcut ekranlara ayak uyduramıyor. Eğer sRGB'den daha fazla renk alanı kapsamı arıyorsanız, başka bir yere bakmalısınız.
Panel, özellikle bu fiyat sınıfında, kutudan çıkar çıkmaz şaşırtıcı derecede iyi kalibre edilmiştir. Ortalama gri tonlama ve ColorChecker DeltaE değerleri yalnızca 0,9 ve 0,83'tür (sRGB'ye göre ölçülmüştür), bu nedenle kullanıcıların ekranı daha fazla kalibre etmesi gerekmeyecektir.
Yanıt Sürelerini Görüntüle
| ↔ Tepki Süresi Siyahtan Beyaza | ||
|---|---|---|
| 11.1 ms ... yükseliş ↗ ve sonbahar↘ birleşimi | ↗ 5.7 ms yükseliş | |
| ↘ 5.4 ms sonbahar | ||
| Ekran, testlerimizde iyi yanıt oranları gösteriyor ancak rekabetçi oyuncular için çok yavaş olabilir. Karşılaştırıldığında, test edilen tüm cihazlar 0.1 (minimum) ile 240 (maksimum) ms arasında değişir. » Tüm cihazların 30 %'si daha iyi. Bu, ölçülen yanıt süresinin test edilen tüm cihazların ortalamasından (19.9 ms) daha iyi olduğu anlamına gelir. | ||
| ↔ Tepki Süresi %50 Griden %80 Griye | ||
| 14.7 ms ... yükseliş ↗ ve sonbahar↘ birleşimi | ↗ 6.8 ms yükseliş | |
| ↘ 7.9 ms sonbahar | ||
| Ekran, testlerimizde iyi yanıt oranları gösteriyor ancak rekabetçi oyuncular için çok yavaş olabilir. Karşılaştırıldığında, test edilen tüm cihazlar 0.165 (minimum) ile 636 (maksimum) ms arasında değişir. » Tüm cihazların 29 %'si daha iyi. Bu, ölçülen yanıt süresinin test edilen tüm cihazların ortalamasından (31.1 ms) daha iyi olduğu anlamına gelir. | ||
Ekran Titremesi / PWM (Darbe Genişliği Modülasyonu)
| Ekran titriyor / PWM algılandı | 25000 Hz Amplitude: 27 % | 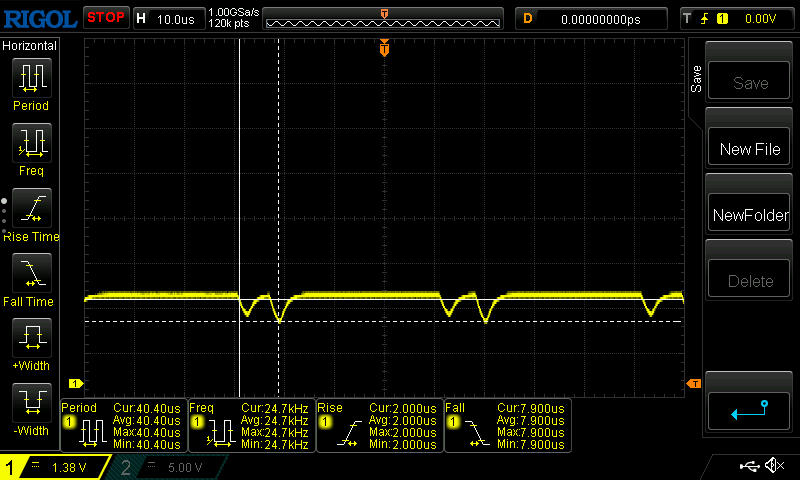 | |
Ekran arka ışığı 25000 Hz'de titriyor (en kötü durum, örneğin PWM kullanılması) . 25000 Hz frekansı oldukça yüksektir, bu nedenle PWM'ye duyarlı çoğu kullanıcı herhangi bir titremeyi fark etmemelidir. Karşılaştırıldığında: Test edilen tüm cihazların %52 %'si ekranı karartmak için PWM kullanmıyor. PWM tespit edilirse, ortalama 7791 (minimum: 5 - maksimum: 343500) Hz ölçüldü. | |||
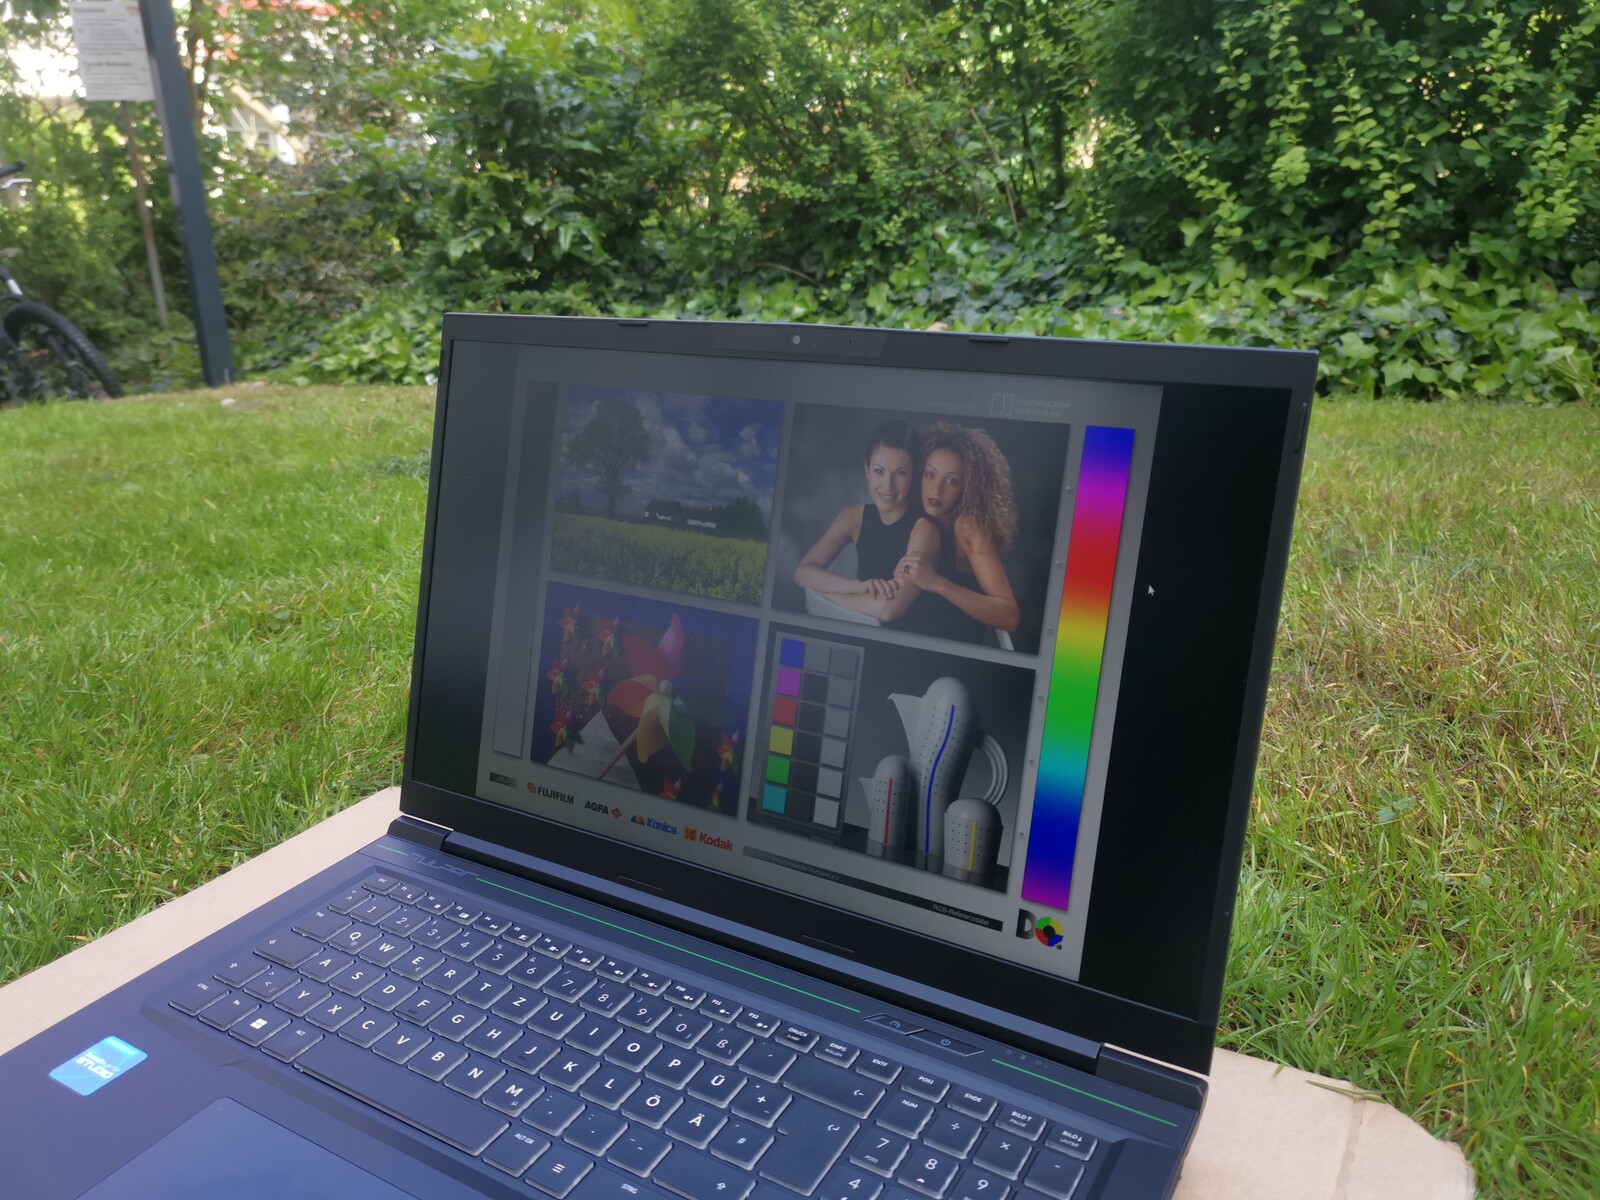
Dışarıda, ekranın mat yüzeyi çoğu yansımayı önler. Gölgede, doğrudan T7'ye bakarken iyi çalışabilirsiniz - 350 nit parlaklığı bunu yapabilmek için yeterlidir. Sadece doğrudan güneş ışığından ve eğimli görüş açılarından kaçınmalısınız.

Performans - Intel Gen13 eski bir haber değil
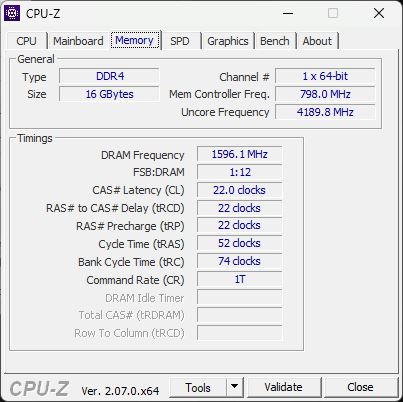
Tulpar T7'nin hepsi aşağıdaki özelliklere sahip çeşitli konfigürasyonları mevcuttur RTX 4060. T7 20.6 ürünümüz Raptor Lake CPU ile donatılmıştır i7-13700Hoysa T7 20.7 civarındaki modeller, adındaki sözde daha yüksek "sayıya" rağmen hala 12. nesil Alder Lake CPU kullanmaktadır. Ayrıca, genellikle bir sayı ile takip edilen farklı RAM ve SSD yapılandırmaları da vardır; örneğin T7 20.6.1 (1 TB SSD) ile T7 20.2 (500 GB SSD) - her iki model de 32 GB RAM'e sahiptir. Test cihazımızın bellek ve depolama yapılandırması (16 GB RAM ve 500 GB SSD) Tulpar'ın web sitesinde veya karşılaştırma portallarında bulunamıyor.
Tulpar T7 açıkça daha dar bütçeli oyuncuları hedefliyor. Intel Gen13 CPU ve RTX 4060, düşük fiyata iyi bir oyun performansı vaat ediyor. Öte yandan, içerik oluşturucular, bariz oyuncu tasarımı, kalın kasası, küçük dokunmatik yüzeyi ve düzenleme için en uygun olmayan iyi ekranı ile doğrudan hitap edilmiyor.
Test koşulları
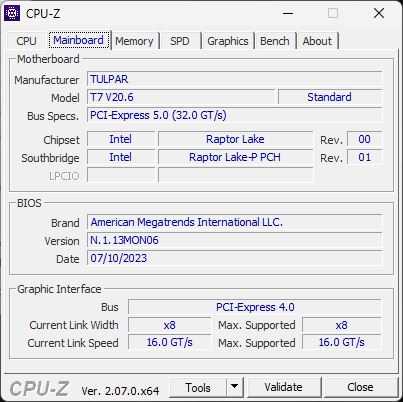
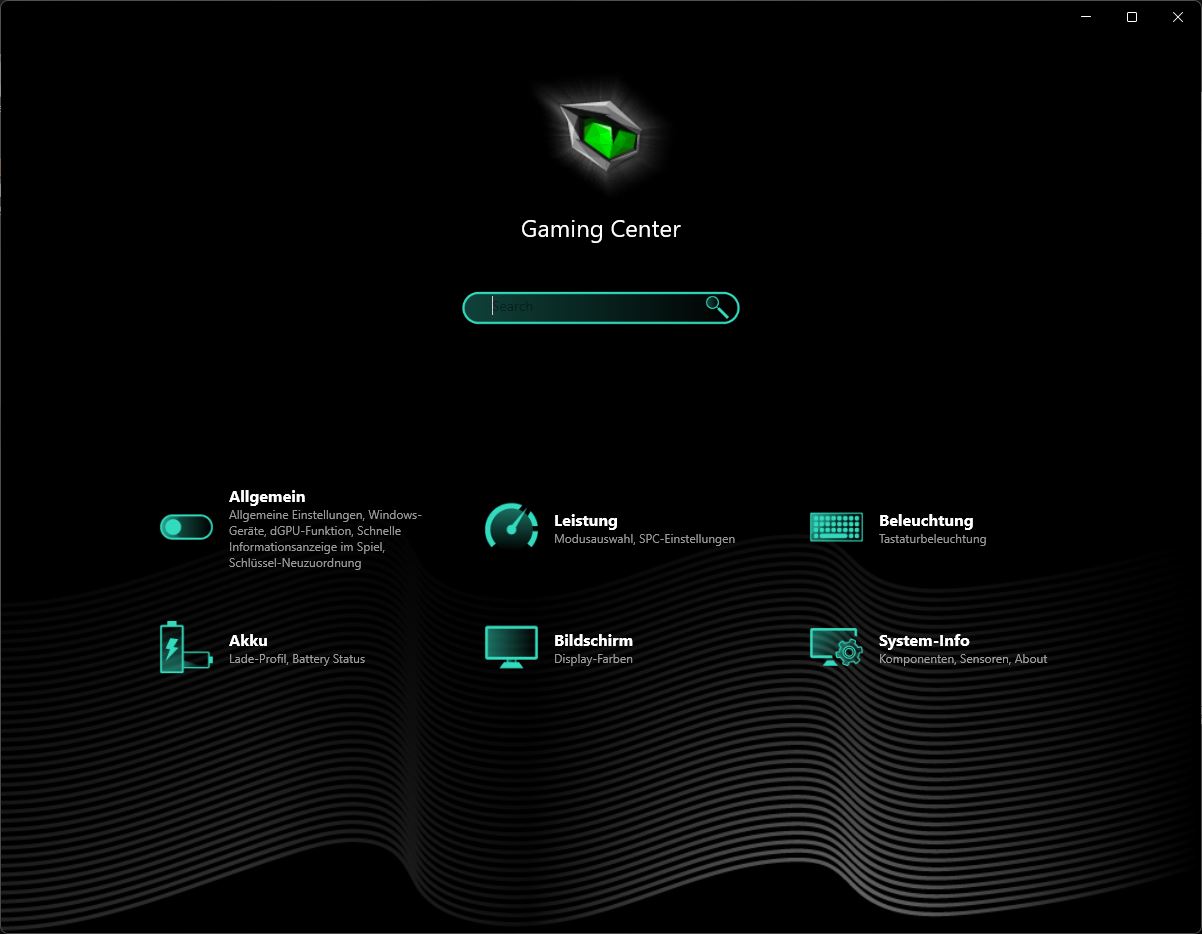
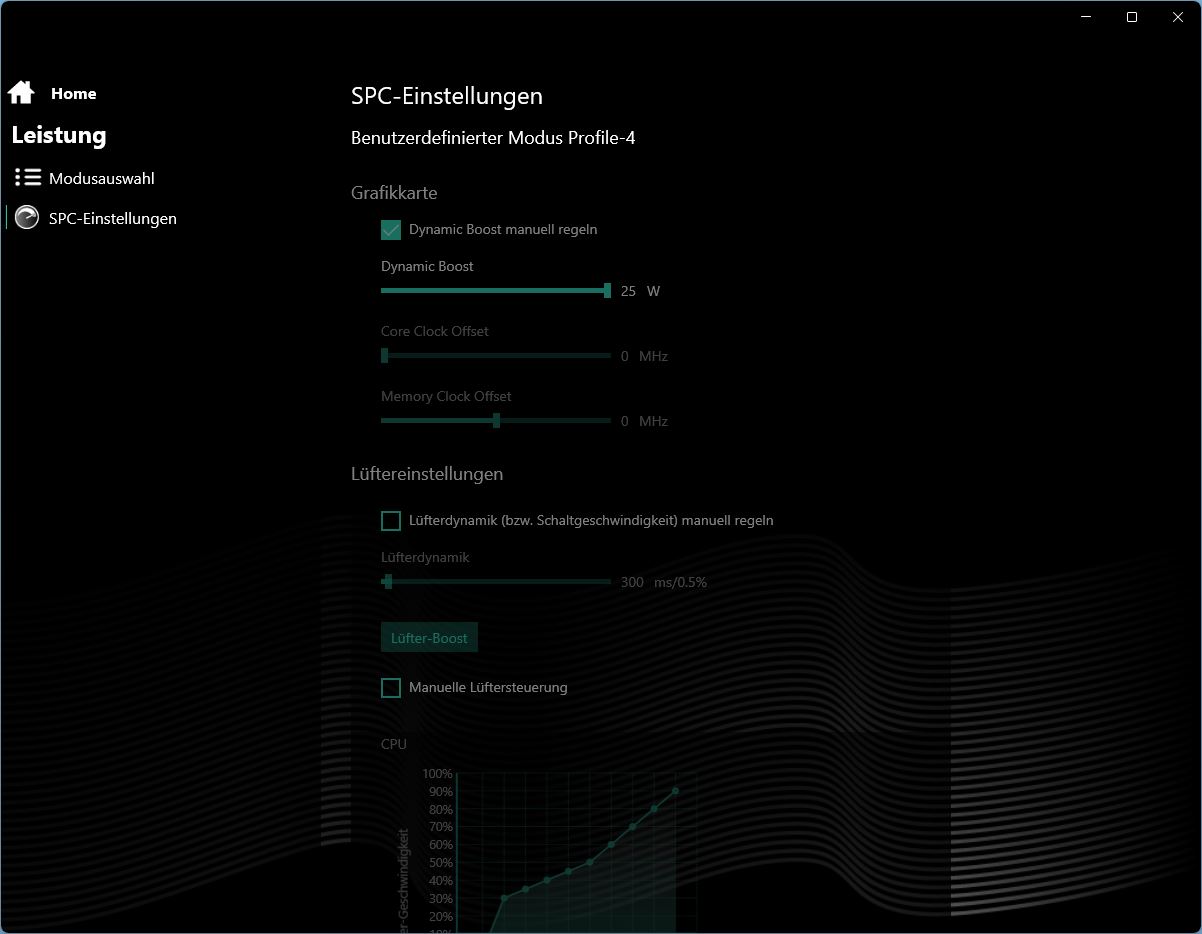
Tulpar, tasarımı Schenker ve bazı diğerlerinin XMG modellerinde kullanılanla tamamen aynı olan genel, hafifçe uyarlanmış bir Kontrol Merkezine dayanır. Basit ama anlaşılır ve çeşitli ayar seçenekleri sunuyor.
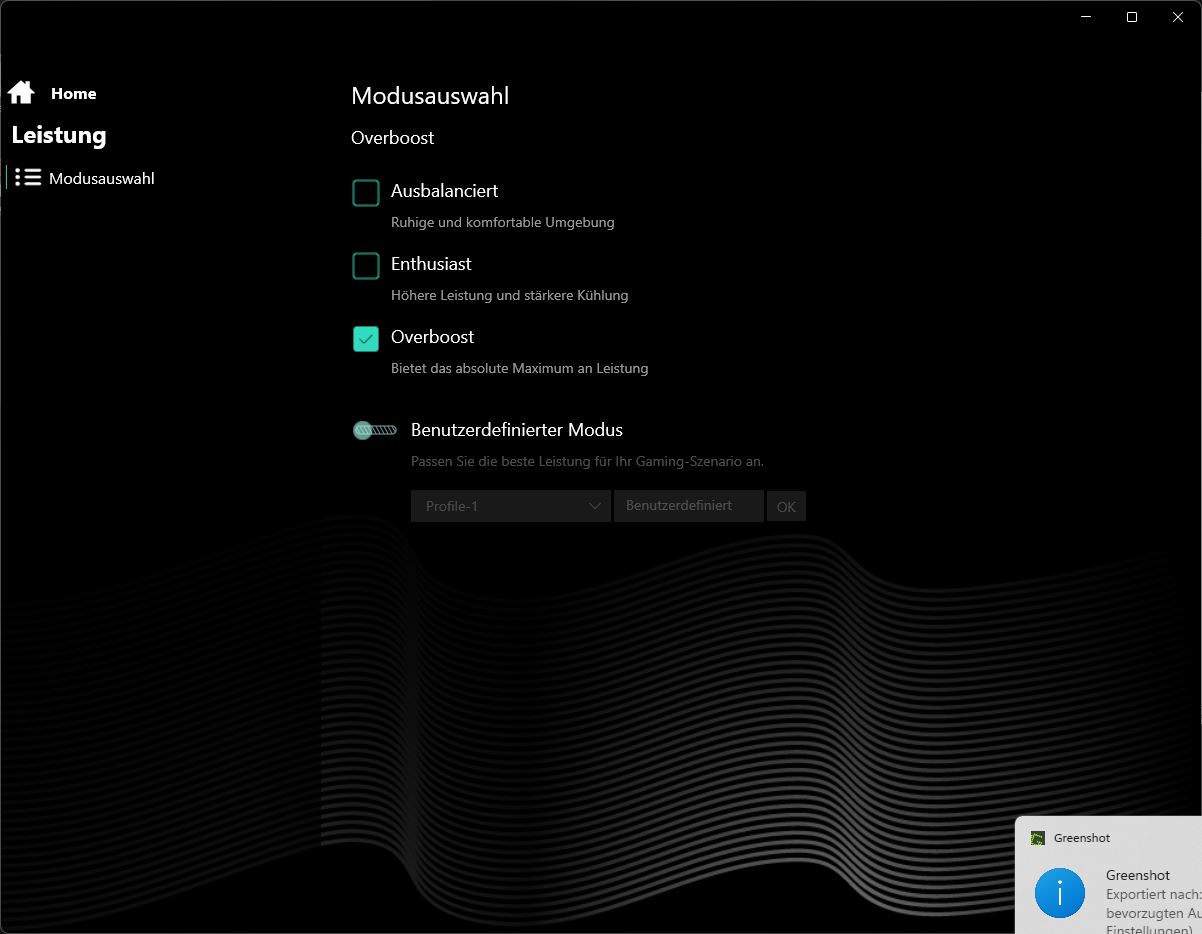
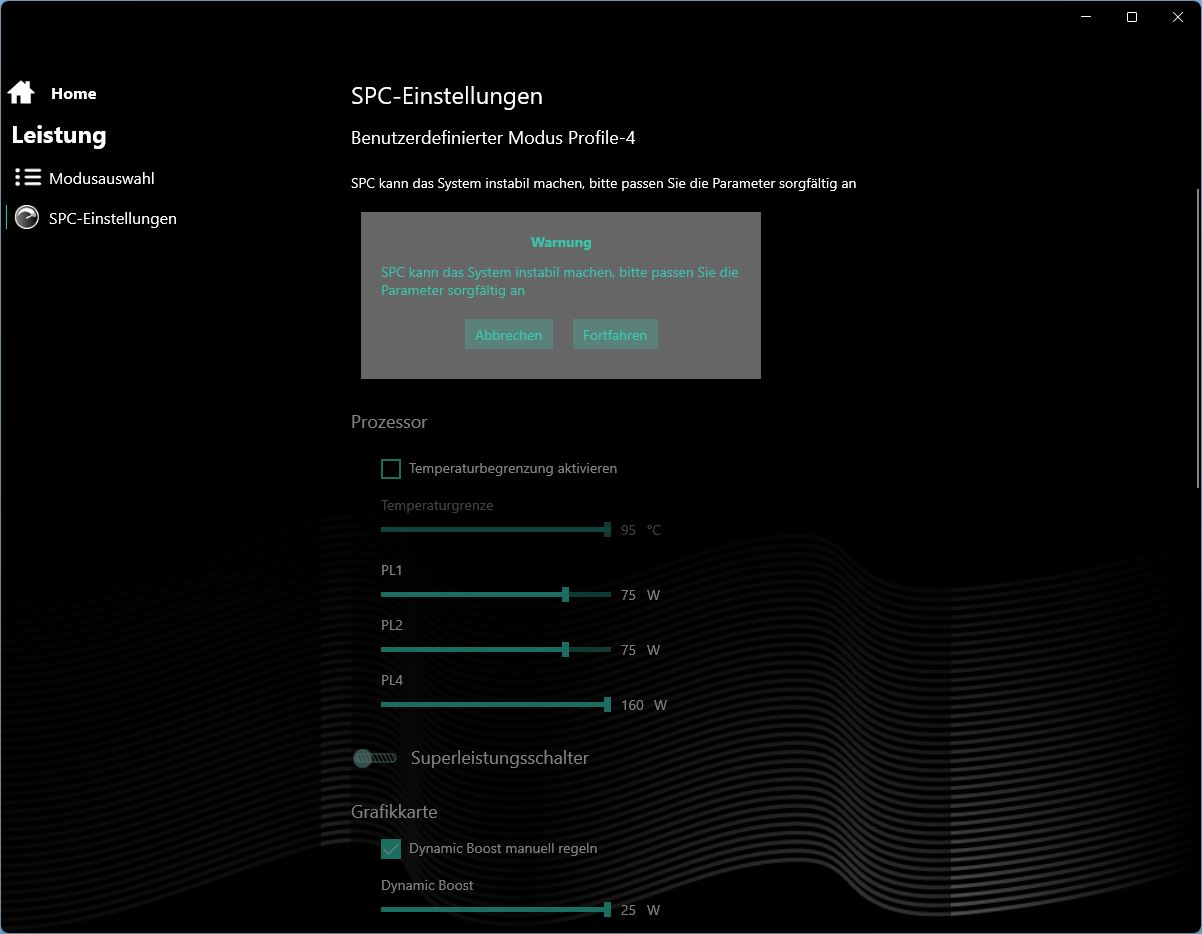
Performans sekmesi üç varsayılan profilin(dengeli, meraklı, overboost) yanı sıra her türlü özelleştirme seçeneğine sahip bir manuel mod sunuyor. Aksi belirtilmedikçe performans kıyaslamalarımızı overboost modunu kullanarak gerçekleştirdik.
Performans profillerine ek olarak bir MUX anahtarı, genel ayarlar, ekran seçenekleri, klavye aydınlatma ayarları ve pil ayarları da bulunmaktadır.
Pil modu hakkında bir kelime: Dizüstü bilgisayarın performansı elbette büyük ölçüde azalsa da, ayarlanan güç modu görsel olarak değişmez, bu nedenle daha önce overboost modunu etkinleştirdiyseniz ve elektrik fişini çektiyseniz, Kontrol Merkezinde hala aktiftir. Bu, bir prizden uzaktayken de çeşitli güç modları arasında seçim yapabileceğinizi göstermektedir. Ancak, seçilen güç modundan bağımsız olarak pil modu sonuçlarımız her zaman aynı olduğu için (tolerans dahilinde) durum büyük olasılıkla böyle değildir.
İşlemci
Intel Gen13 Core i7-13700H Geçen yıl büyük üreticilerin birçok oyun bilgisayarında bulunan CPU, bu oyun dizüstü bilgisayarında kullanılıyor. En yeni Gen14 şu anda sadece Tulpar'ın T6 serisinde mevcut. Ancak, Gen14 neredeyse hiç hız avantajı sunmadığından, yeni dizüstü bilgisayarların liderliği en iyi ihtimalle küçük olacaktır.
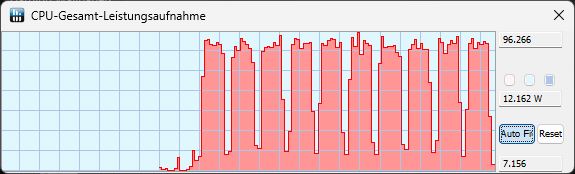
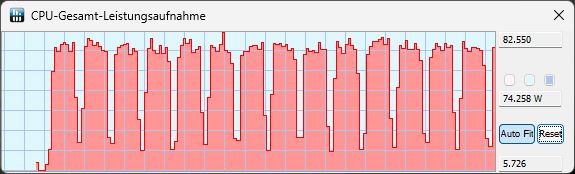
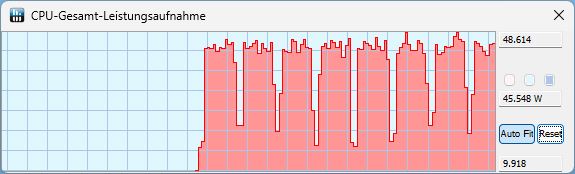
Tulpar'ımız Cinebench R15 döngüsü sırasında iyi performans gösterdi, ilk birkaç çalıştırmadan sonra herhangi bir düşüş olmadan yüksek ve her şeyden önce çok sabit bir performans sundu. Overboost modunda 95 ila 96 watt arasında oldukça sabit bir TDP değerine ulaşırken, meraklı modunda hala 82 watt ve dengeli modda sadece 48 watt olduğunu gördük. Pil modunda, otomatik olarak dengeli olarak ayarlanır. Burada CPU'nun performansı yaklaşık yüzde 27 oranında düşüyor.
Genel olarak ve tüm kıyaslamalarda T7, veri tabanımızdaki aynı CPU'ya sahip ortalama bir dizüstü bilgisayarla hemen hemen aynı performans seviyesindeydi. Hatta birçok testte daha hızlıydı, ancak alışılmadık derecede düşük Geekbench çoklu iş parçacığı puanları genel puanını biraz bozuyor. Cinebench testleri sırasında ortalama i7-13700H'den yaklaşık yüzde 11 daha hızlıydı.
Bu da onu performans açısından karşılaştırma cihazlarının tam ortasına yerleştiriyor - sadece Legion 5 fark edilir derecede daha hızlıydı ve diğer tüm rakipler test cihazımızın birkaç yüzde puanı içindeydi.
Geekbench testlerindeki alışılmadık derecede düşük çoklu çekirdek skorları oldukça ilginçtir. Çeşitli tekrarlardan sonra bile skorları çok düşük kalmıştır(overboost, dGPU ve hibrit mod test edilmiştir). Cinebench testlerinde ise çoklu iş parçacığı skorları normalden iyiye doğru seyretti.
| Performans profili/ölçüm değeri | CB15 çoklu skor | TDP (watt cinsinden) |
|---|---|---|
| Turbo | 2,763 | 95 |
| Meraklısı | 2,538 | 82 |
| Dengeli | 1.990 | 48 |
| Akü | 1,760 | 35 |
Cinebench R15 Multi continuous test
Cinebench R23: Multi Core | Single Core
Cinebench R20: CPU (Multi Core) | CPU (Single Core)
Cinebench R15: CPU Multi 64Bit | CPU Single 64Bit
Blender: v2.79 BMW27 CPU
7-Zip 18.03: 7z b 4 | 7z b 4 -mmt1
Geekbench 6.7: Multi-Core | Single-Core
Geekbench 5.5: Multi-Core | Single-Core
HWBOT x265 Benchmark v2.2: 4k Preset
LibreOffice : 20 Documents To PDF
R Benchmark 2.5: Overall mean
| CPU Performance rating | |
| Sınıf ortalaması Gaming | |
| Lenovo Legion 5 16IRX G9 | |
| Schenker XMG Apex 17 (Late 23) | |
| Medion Erazer Defender P40 -2! | |
| Tulpar T7 V20.6 | |
| Ortalama Intel Core i7-13700H | |
| Acer Nitro 17 AN17-51-71ER -2! | |
| MSI Katana 17 B13VFK -2! | |
| Cinebench R23 / Multi Core | |
| Sınıf ortalaması Gaming (10488 - 40970, n=110, son 2 yıl) | |
| Lenovo Legion 5 16IRX G9 | |
| Medion Erazer Defender P40 | |
| Acer Nitro 17 AN17-51-71ER | |
| Tulpar T7 V20.6 | |
| Schenker XMG Apex 17 (Late 23) | |
| MSI Katana 17 B13VFK | |
| Ortalama Intel Core i7-13700H (5890 - 20034, n=29) | |
| Cinebench R23 / Single Core | |
| Sınıf ortalaması Gaming (1166 - 2356, n=110, son 2 yıl) | |
| Lenovo Legion 5 16IRX G9 | |
| Tulpar T7 V20.6 | |
| MSI Katana 17 B13VFK | |
| Ortalama Intel Core i7-13700H (1323 - 1914, n=29) | |
| Schenker XMG Apex 17 (Late 23) | |
| Medion Erazer Defender P40 | |
| Acer Nitro 17 AN17-51-71ER | |
| Cinebench R20 / CPU (Multi Core) | |
| Sınıf ortalaması Gaming (4029 - 16108, n=109, son 2 yıl) | |
| Lenovo Legion 5 16IRX G9 | |
| Medion Erazer Defender P40 | |
| Acer Nitro 17 AN17-51-71ER | |
| Tulpar T7 V20.6 | |
| Schenker XMG Apex 17 (Late 23) | |
| MSI Katana 17 B13VFK | |
| Ortalama Intel Core i7-13700H (2322 - 7674, n=29) | |
| Cinebench R20 / CPU (Single Core) | |
| Sınıf ortalaması Gaming (442 - 895, n=109, son 2 yıl) | |
| Lenovo Legion 5 16IRX G9 | |
| Tulpar T7 V20.6 | |
| Ortalama Intel Core i7-13700H (508 - 741, n=29) | |
| MSI Katana 17 B13VFK | |
| Schenker XMG Apex 17 (Late 23) | |
| Medion Erazer Defender P40 | |
| Acer Nitro 17 AN17-51-71ER | |
| Cinebench R15 / CPU Multi 64Bit | |
| Sınıf ortalaması Gaming (1578 - 6271, n=109, son 2 yıl) | |
| Lenovo Legion 5 16IRX G9 | |
| Medion Erazer Defender P40 | |
| Acer Nitro 17 AN17-51-71ER | |
| Tulpar T7 V20.6 | |
| Schenker XMG Apex 17 (Late 23) | |
| Ortalama Intel Core i7-13700H (905 - 2982, n=29) | |
| MSI Katana 17 B13VFK | |
| Cinebench R15 / CPU Single 64Bit | |
| Sınıf ortalaması Gaming (188.8 - 343, n=109, son 2 yıl) | |
| Lenovo Legion 5 16IRX G9 | |
| Tulpar T7 V20.6 | |
| Schenker XMG Apex 17 (Late 23) | |
| Ortalama Intel Core i7-13700H (213 - 278, n=29) | |
| MSI Katana 17 B13VFK | |
| Medion Erazer Defender P40 | |
| Acer Nitro 17 AN17-51-71ER | |
| Blender / v2.79 BMW27 CPU | |
| Ortalama Intel Core i7-13700H (169 - 555, n=29) | |
| MSI Katana 17 B13VFK | |
| Schenker XMG Apex 17 (Late 23) | |
| Medion Erazer Defender P40 | |
| Acer Nitro 17 AN17-51-71ER | |
| Tulpar T7 V20.6 | |
| Sınıf ortalaması Gaming (80 - 330, n=107, son 2 yıl) | |
| Lenovo Legion 5 16IRX G9 | |
| 7-Zip 18.03 / 7z b 4 | |
| Lenovo Legion 5 16IRX G9 | |
| Sınıf ortalaması Gaming (33491 - 148086, n=108, son 2 yıl) | |
| Medion Erazer Defender P40 | |
| Acer Nitro 17 AN17-51-71ER | |
| Schenker XMG Apex 17 (Late 23) | |
| MSI Katana 17 B13VFK | |
| Ortalama Intel Core i7-13700H (27322 - 76344, n=29) | |
| Tulpar T7 V20.6 | |
| 7-Zip 18.03 / 7z b 4 -mmt1 | |
| Schenker XMG Apex 17 (Late 23) | |
| Lenovo Legion 5 16IRX G9 | |
| Sınıf ortalaması Gaming (4199 - 7436, n=108, son 2 yıl) | |
| Tulpar T7 V20.6 | |
| Ortalama Intel Core i7-13700H (4825 - 6238, n=29) | |
| MSI Katana 17 B13VFK | |
| Medion Erazer Defender P40 | |
| Acer Nitro 17 AN17-51-71ER | |
| Geekbench 6.7 / Multi-Core | |
| Lenovo Legion 5 16IRX G9 | |
| Sınıf ortalaması Gaming (6625 - 22104, n=109, son 2 yıl) | |
| Schenker XMG Apex 17 (Late 23) | |
| Ortalama Intel Core i7-13700H (8415 - 13832, n=13) | |
| Tulpar T7 V20.6 | |
| Geekbench 6.7 / Single-Core | |
| Sınıf ortalaması Gaming (1490 - 3259, n=109, son 2 yıl) | |
| Lenovo Legion 5 16IRX G9 | |
| Schenker XMG Apex 17 (Late 23) | |
| Tulpar T7 V20.6 | |
| Ortalama Intel Core i7-13700H (2316 - 2639, n=13) | |
| Geekbench 5.5 / Multi-Core | |
| Sınıf ortalaması Gaming (6460 - 27010, n=108, son 2 yıl) | |
| Lenovo Legion 5 16IRX G9 | |
| Medion Erazer Defender P40 | |
| Acer Nitro 17 AN17-51-71ER | |
| Schenker XMG Apex 17 (Late 23) | |
| Ortalama Intel Core i7-13700H (6165 - 14215, n=29) | |
| MSI Katana 17 B13VFK | |
| Tulpar T7 V20.6 | |
| Geekbench 5.5 / Single-Core | |
| Sınıf ortalaması Gaming (986 - 2474, n=108, son 2 yıl) | |
| Schenker XMG Apex 17 (Late 23) | |
| Lenovo Legion 5 16IRX G9 | |
| Ortalama Intel Core i7-13700H (1362 - 1919, n=29) | |
| MSI Katana 17 B13VFK | |
| Tulpar T7 V20.6 | |
| Medion Erazer Defender P40 | |
| Acer Nitro 17 AN17-51-71ER | |
| HWBOT x265 Benchmark v2.2 / 4k Preset | |
| Sınıf ortalaması Gaming (11.5 - 44.3, n=108, son 2 yıl) | |
| Lenovo Legion 5 16IRX G9 | |
| Medion Erazer Defender P40 | |
| Schenker XMG Apex 17 (Late 23) | |
| Acer Nitro 17 AN17-51-71ER | |
| Tulpar T7 V20.6 | |
| MSI Katana 17 B13VFK | |
| Ortalama Intel Core i7-13700H (6.72 - 21.2, n=29) | |
| LibreOffice / 20 Documents To PDF | |
| MSI Katana 17 B13VFK | |
| Acer Nitro 17 AN17-51-71ER | |
| Tulpar T7 V20.6 | |
| Medion Erazer Defender P40 | |
| Sınıf ortalaması Gaming (19 - 88.8, n=108, son 2 yıl) | |
| Ortalama Intel Core i7-13700H (31.3 - 62.4, n=29) | |
| Schenker XMG Apex 17 (Late 23) | |
| Lenovo Legion 5 16IRX G9 | |
| R Benchmark 2.5 / Overall mean | |
| Acer Nitro 17 AN17-51-71ER | |
| Medion Erazer Defender P40 | |
| Ortalama Intel Core i7-13700H (0.4308 - 0.607, n=29) | |
| Tulpar T7 V20.6 | |
| MSI Katana 17 B13VFK | |
| Sınıf ortalaması Gaming (0.3439 - 0.759, n=109, son 2 yıl) | |
| Schenker XMG Apex 17 (Late 23) | |
| Lenovo Legion 5 16IRX G9 | |
* ... daha küçük daha iyidir
AIDA64: FP32 Ray-Trace | FPU Julia | CPU SHA3 | CPU Queen | FPU SinJulia | FPU Mandel | CPU AES | CPU ZLib | FP64 Ray-Trace | CPU PhotoWorxx
| Performance rating | |
| Sınıf ortalaması Gaming | |
| Schenker XMG Apex 17 (Late 23) | |
| Acer Nitro 17 AN17-51-71ER | |
| Lenovo Legion 5 16IRX G9 | |
| Medion Erazer Defender P40 | |
| Tulpar T7 V20.6 | |
| Ortalama Intel Core i7-13700H | |
| MSI Katana 17 B13VFK | |
| AIDA64 / FP32 Ray-Trace | |
| Sınıf ortalaması Gaming (10227 - 85542, n=107, son 2 yıl) | |
| Schenker XMG Apex 17 (Late 23) | |
| Lenovo Legion 5 16IRX G9 | |
| Acer Nitro 17 AN17-51-71ER | |
| Tulpar T7 V20.6 | |
| Medion Erazer Defender P40 | |
| Ortalama Intel Core i7-13700H (4986 - 18908, n=29) | |
| MSI Katana 17 B13VFK | |
| AIDA64 / FPU Julia | |
| Sınıf ortalaması Gaming (51376 - 238426, n=107, son 2 yıl) | |
| Schenker XMG Apex 17 (Late 23) | |
| Lenovo Legion 5 16IRX G9 | |
| Tulpar T7 V20.6 | |
| Acer Nitro 17 AN17-51-71ER | |
| Medion Erazer Defender P40 | |
| Ortalama Intel Core i7-13700H (25360 - 92359, n=29) | |
| MSI Katana 17 B13VFK | |
| AIDA64 / CPU SHA3 | |
| Sınıf ortalaması Gaming (2180 - 9817, n=107, son 2 yıl) | |
| Schenker XMG Apex 17 (Late 23) | |
| Acer Nitro 17 AN17-51-71ER | |
| Lenovo Legion 5 16IRX G9 | |
| Tulpar T7 V20.6 | |
| Medion Erazer Defender P40 | |
| Ortalama Intel Core i7-13700H (1339 - 4224, n=29) | |
| MSI Katana 17 B13VFK | |
| AIDA64 / CPU Queen | |
| Sınıf ortalaması Gaming (49785 - 173351, n=98, son 2 yıl) | |
| Schenker XMG Apex 17 (Late 23) | |
| Medion Erazer Defender P40 | |
| Tulpar T7 V20.6 | |
| Lenovo Legion 5 16IRX G9 | |
| Acer Nitro 17 AN17-51-71ER | |
| Ortalama Intel Core i7-13700H (59324 - 107159, n=29) | |
| MSI Katana 17 B13VFK | |
| AIDA64 / FPU SinJulia | |
| Schenker XMG Apex 17 (Late 23) | |
| Sınıf ortalaması Gaming (4424 - 33636, n=107, son 2 yıl) | |
| Lenovo Legion 5 16IRX G9 | |
| Tulpar T7 V20.6 | |
| Acer Nitro 17 AN17-51-71ER | |
| Medion Erazer Defender P40 | |
| Ortalama Intel Core i7-13700H (4800 - 11050, n=29) | |
| MSI Katana 17 B13VFK | |
| AIDA64 / FPU Mandel | |
| Sınıf ortalaması Gaming (25115 - 128721, n=107, son 2 yıl) | |
| Schenker XMG Apex 17 (Late 23) | |
| Lenovo Legion 5 16IRX G9 | |
| Acer Nitro 17 AN17-51-71ER | |
| Tulpar T7 V20.6 | |
| Medion Erazer Defender P40 | |
| Ortalama Intel Core i7-13700H (12321 - 45118, n=29) | |
| MSI Katana 17 B13VFK | |
| AIDA64 / CPU AES | |
| Schenker XMG Apex 17 (Late 23) | |
| Acer Nitro 17 AN17-51-71ER | |
| Sınıf ortalaması Gaming (39258 - 247074, n=107, son 2 yıl) | |
| Lenovo Legion 5 16IRX G9 | |
| Tulpar T7 V20.6 | |
| Ortalama Intel Core i7-13700H (28769 - 151254, n=29) | |
| Medion Erazer Defender P40 | |
| MSI Katana 17 B13VFK | |
| AIDA64 / CPU ZLib | |
| Sınıf ortalaması Gaming (574 - 2531, n=107, son 2 yıl) | |
| Lenovo Legion 5 16IRX G9 | |
| Acer Nitro 17 AN17-51-71ER | |
| Tulpar T7 V20.6 | |
| Schenker XMG Apex 17 (Late 23) | |
| Medion Erazer Defender P40 | |
| Ortalama Intel Core i7-13700H (389 - 1215, n=29) | |
| MSI Katana 17 B13VFK | |
| AIDA64 / FP64 Ray-Trace | |
| Sınıf ortalaması Gaming (5509 - 45446, n=107, son 2 yıl) | |
| Schenker XMG Apex 17 (Late 23) | |
| Lenovo Legion 5 16IRX G9 | |
| Acer Nitro 17 AN17-51-71ER | |
| Tulpar T7 V20.6 | |
| Medion Erazer Defender P40 | |
| Ortalama Intel Core i7-13700H (2540 - 10135, n=29) | |
| MSI Katana 17 B13VFK | |
| AIDA64 / CPU PhotoWorxx | |
| Sınıf ortalaması Gaming (12271 - 89891, n=107, son 2 yıl) | |
| Ortalama Intel Core i7-13700H (12872 - 52727, n=29) | |
| Acer Nitro 17 AN17-51-71ER | |
| Schenker XMG Apex 17 (Late 23) | |
| Medion Erazer Defender P40 | |
| MSI Katana 17 B13VFK | |
| Lenovo Legion 5 16IRX G9 | |
| Tulpar T7 V20.6 | |
Sistem performansı
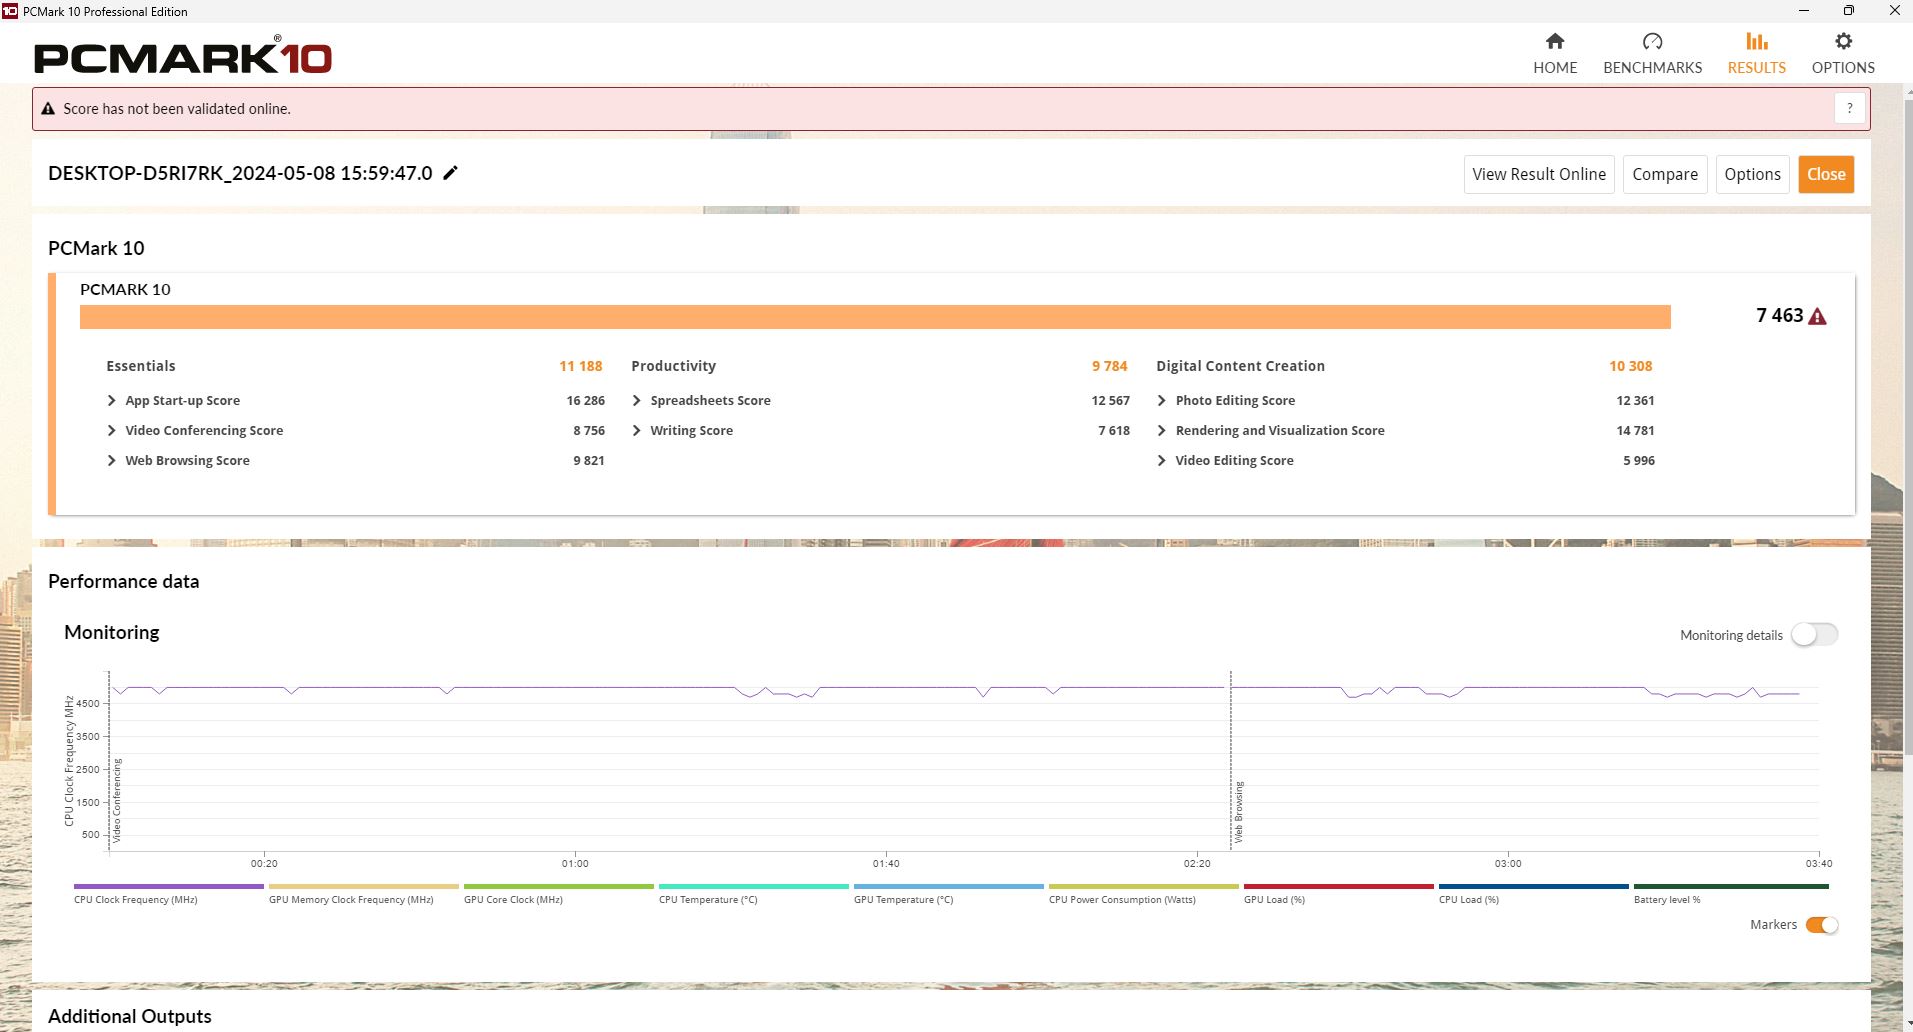
Sistem performansı söz konusu olduğunda, T7 üst orta sıralarda yer alıyor. PCMark 10 sırasında, bu donanım kombinasyonu için tam ortalama seviyeye ulaştı. CrossMark sonuçları biraz düşük seviyede.
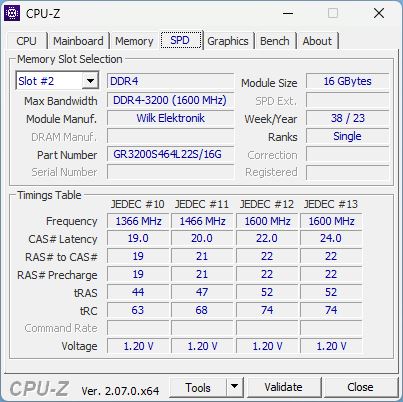
Sadece bir RAM yuvasının dolu olması en iyisi değil - en azından bizim T7 yapılandırmamızda. Aşağıdaki AIDA bellek testi, tek kanallı RAM'in dezavantajını gösteriyor. Çift kanal için, bir yuva hala boş olduğundan başka bir çubuk takmanız gerekir.
CrossMark: Overall | Productivity | Creativity | Responsiveness
WebXPRT 3: Overall
WebXPRT 4: Overall
Mozilla Kraken 1.1: Total
| PCMark 10 / Score | |
| Sınıf ortalaması Gaming (5828 - 11574, n=94, son 2 yıl) | |
| Schenker XMG Apex 17 (Late 23) | |
| Lenovo Legion 5 16IRX G9 | |
| Tulpar T7 V20.6 | |
| Ortalama Intel Core i7-13700H, NVIDIA GeForce RTX 4060 Laptop GPU (7157 - 7661, n=5) | |
| MSI Katana 17 B13VFK | |
| Acer Nitro 17 AN17-51-71ER | |
| Medion Erazer Defender P40 | |
| PCMark 10 / Essentials | |
| Tulpar T7 V20.6 | |
| MSI Katana 17 B13VFK | |
| Lenovo Legion 5 16IRX G9 | |
| Ortalama Intel Core i7-13700H, NVIDIA GeForce RTX 4060 Laptop GPU (10179 - 11200, n=5) | |
| Schenker XMG Apex 17 (Late 23) | |
| Sınıf ortalaması Gaming (8810 - 12600, n=98, son 2 yıl) | |
| Acer Nitro 17 AN17-51-71ER | |
| Medion Erazer Defender P40 | |
| PCMark 10 / Productivity | |
| Sınıf ortalaması Gaming (6845 - 18766, n=96, son 2 yıl) | |
| Schenker XMG Apex 17 (Late 23) | |
| Tulpar T7 V20.6 | |
| Medion Erazer Defender P40 | |
| Ortalama Intel Core i7-13700H, NVIDIA GeForce RTX 4060 Laptop GPU (8238 - 10249, n=5) | |
| MSI Katana 17 B13VFK | |
| Lenovo Legion 5 16IRX G9 | |
| Acer Nitro 17 AN17-51-71ER | |
| PCMark 10 / Digital Content Creation | |
| Sınıf ortalaması Gaming (7602 - 19657, n=96, son 2 yıl) | |
| Schenker XMG Apex 17 (Late 23) | |
| Lenovo Legion 5 16IRX G9 | |
| Acer Nitro 17 AN17-51-71ER | |
| Ortalama Intel Core i7-13700H, NVIDIA GeForce RTX 4060 Laptop GPU (10308 - 11862, n=5) | |
| Tulpar T7 V20.6 | |
| MSI Katana 17 B13VFK | |
| Medion Erazer Defender P40 | |
| CrossMark / Overall | |
| Lenovo Legion 5 16IRX G9 | |
| Sınıf ortalaması Gaming (1366 - 2409, n=96, son 2 yıl) | |
| MSI Katana 17 B13VFK | |
| Schenker XMG Apex 17 (Late 23) | |
| Medion Erazer Defender P40 | |
| Tulpar T7 V20.6 | |
| Ortalama Intel Core i7-13700H, NVIDIA GeForce RTX 4060 Laptop GPU (1629 - 1849, n=5) | |
| Acer Nitro 17 AN17-51-71ER | |
| CrossMark / Productivity | |
| Lenovo Legion 5 16IRX G9 | |
| Sınıf ortalaması Gaming (1386 - 2254, n=96, son 2 yıl) | |
| MSI Katana 17 B13VFK | |
| Schenker XMG Apex 17 (Late 23) | |
| Tulpar T7 V20.6 | |
| Medion Erazer Defender P40 | |
| Ortalama Intel Core i7-13700H, NVIDIA GeForce RTX 4060 Laptop GPU (1561 - 1743, n=5) | |
| Acer Nitro 17 AN17-51-71ER | |
| CrossMark / Creativity | |
| Lenovo Legion 5 16IRX G9 | |
| Sınıf ortalaması Gaming (1343 - 2729, n=96, son 2 yıl) | |
| MSI Katana 17 B13VFK | |
| Medion Erazer Defender P40 | |
| Schenker XMG Apex 17 (Late 23) | |
| Ortalama Intel Core i7-13700H, NVIDIA GeForce RTX 4060 Laptop GPU (1691 - 2064, n=5) | |
| Tulpar T7 V20.6 | |
| Acer Nitro 17 AN17-51-71ER | |
| CrossMark / Responsiveness | |
| Lenovo Legion 5 16IRX G9 | |
| MSI Katana 17 B13VFK | |
| Sınıf ortalaması Gaming (1226 - 2334, n=96, son 2 yıl) | |
| Schenker XMG Apex 17 (Late 23) | |
| Acer Nitro 17 AN17-51-71ER | |
| Medion Erazer Defender P40 | |
| Ortalama Intel Core i7-13700H, NVIDIA GeForce RTX 4060 Laptop GPU (1381 - 1656, n=5) | |
| Tulpar T7 V20.6 | |
| WebXPRT 3 / Overall | |
| Sınıf ortalaması Gaming (242 - 532, n=99, son 2 yıl) | |
| Lenovo Legion 5 16IRX G9 | |
| Schenker XMG Apex 17 (Late 23) | |
| Tulpar T7 V20.6 | |
| MSI Katana 17 B13VFK | |
| Medion Erazer Defender P40 | |
| Ortalama Intel Core i7-13700H, NVIDIA GeForce RTX 4060 Laptop GPU (215 - 314, n=4) | |
| Acer Nitro 17 AN17-51-71ER | |
| WebXPRT 4 / Overall | |
| Sınıf ortalaması Gaming (176.4 - 354, n=99, son 2 yıl) | |
| Lenovo Legion 5 16IRX G9 | |
| Tulpar T7 V20.6 | |
| MSI Katana 17 B13VFK | |
| Ortalama Intel Core i7-13700H, NVIDIA GeForce RTX 4060 Laptop GPU (228 - 274, n=4) | |
| Medion Erazer Defender P40 | |
| Schenker XMG Apex 17 (Late 23) | |
| Acer Nitro 17 AN17-51-71ER | |
| Mozilla Kraken 1.1 / Total | |
| Acer Nitro 17 AN17-51-71ER | |
| Medion Erazer Defender P40 | |
| MSI Katana 17 B13VFK | |
| Schenker XMG Apex 17 (Late 23) | |
| Ortalama Intel Core i7-13700H, NVIDIA GeForce RTX 4060 Laptop GPU (495 - 570, n=4) | |
| Tulpar T7 V20.6 | |
| Lenovo Legion 5 16IRX G9 | |
| Sınıf ortalaması Gaming (391 - 590, n=104, son 2 yıl) | |
* ... daha küçük daha iyidir
| PCMark 10 Score | 7463 puan | |
Yardım | ||
| AIDA64 / Memory Copy | |
| Sınıf ortalaması Gaming (21750 - 129946, n=107, son 2 yıl) | |
| Schenker XMG Apex 17 (Late 23) | |
| Ortalama Intel Core i7-13700H (24334 - 78081, n=29) | |
| Lenovo Legion 5 16IRX G9 | |
| Acer Nitro 17 AN17-51-71ER | |
| Medion Erazer Defender P40 | |
| MSI Katana 17 B13VFK | |
| Tulpar T7 V20.6 | |
| AIDA64 / Memory Read | |
| Sınıf ortalaması Gaming (22956 - 118858, n=107, son 2 yıl) | |
| Lenovo Legion 5 16IRX G9 | |
| Medion Erazer Defender P40 | |
| Acer Nitro 17 AN17-51-71ER | |
| Ortalama Intel Core i7-13700H (23681 - 79656, n=29) | |
| Schenker XMG Apex 17 (Late 23) | |
| MSI Katana 17 B13VFK | |
| Tulpar T7 V20.6 | |
| AIDA64 / Memory Write | |
| Schenker XMG Apex 17 (Late 23) | |
| Sınıf ortalaması Gaming (22297 - 135096, n=107, son 2 yıl) | |
| Ortalama Intel Core i7-13700H (22986 - 99898, n=29) | |
| Acer Nitro 17 AN17-51-71ER | |
| Medion Erazer Defender P40 | |
| Lenovo Legion 5 16IRX G9 | |
| MSI Katana 17 B13VFK | |
| Tulpar T7 V20.6 | |
| AIDA64 / Memory Latency | |
| Acer Nitro 17 AN17-51-71ER | |
| Sınıf ortalaması Gaming (75.3 - 259, n=107, son 2 yıl) | |
| MSI Katana 17 B13VFK | |
| Ortalama Intel Core i7-13700H (82.4 - 136.8, n=29) | |
| Medion Erazer Defender P40 | |
| Lenovo Legion 5 16IRX G9 | |
| Tulpar T7 V20.6 | |
| Schenker XMG Apex 17 (Late 23) | |
* ... daha küçük daha iyidir
DPC gecikme süreleri
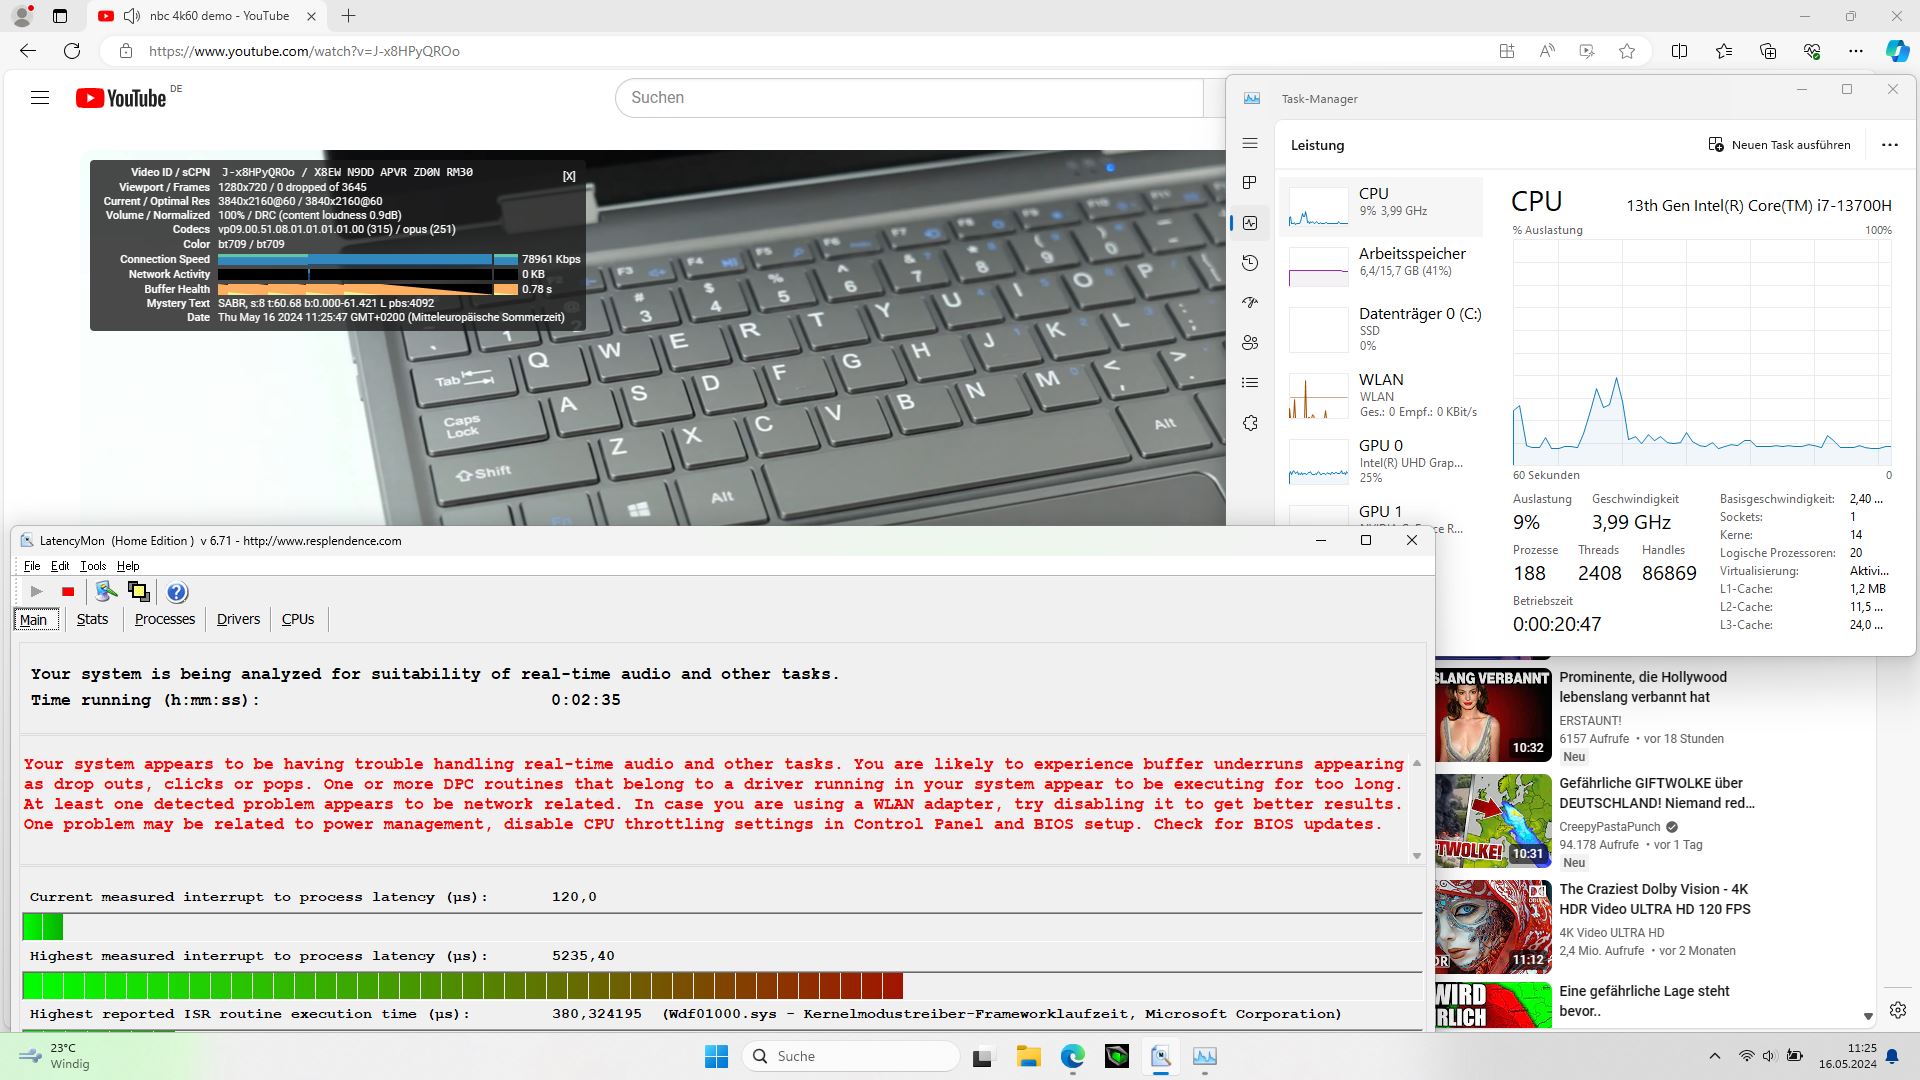
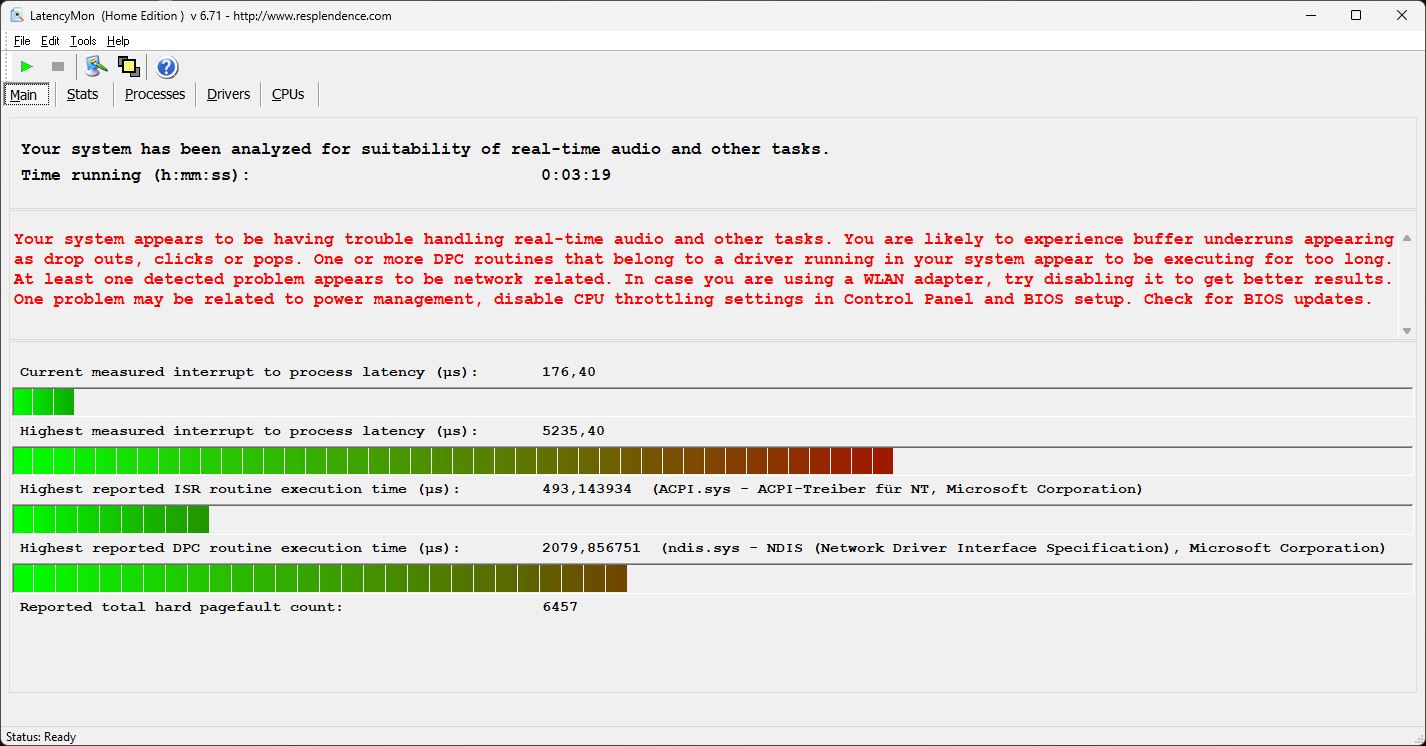
Ne yazık ki, LatencyMon yazılımının penceresini hareket ettirirken ilk gecikme sorunlarını zaten fark etmiştik. Tarayıcıyı açmak gecikme değerini daha da arttırdı, ancak daha sonra birkaç sekme açmak bunu yapmadı. Bu noktaya kadar, ölçtüğümüz yaklaşık 500 μs değeri hala tolere edilebilir bir aralıkta.
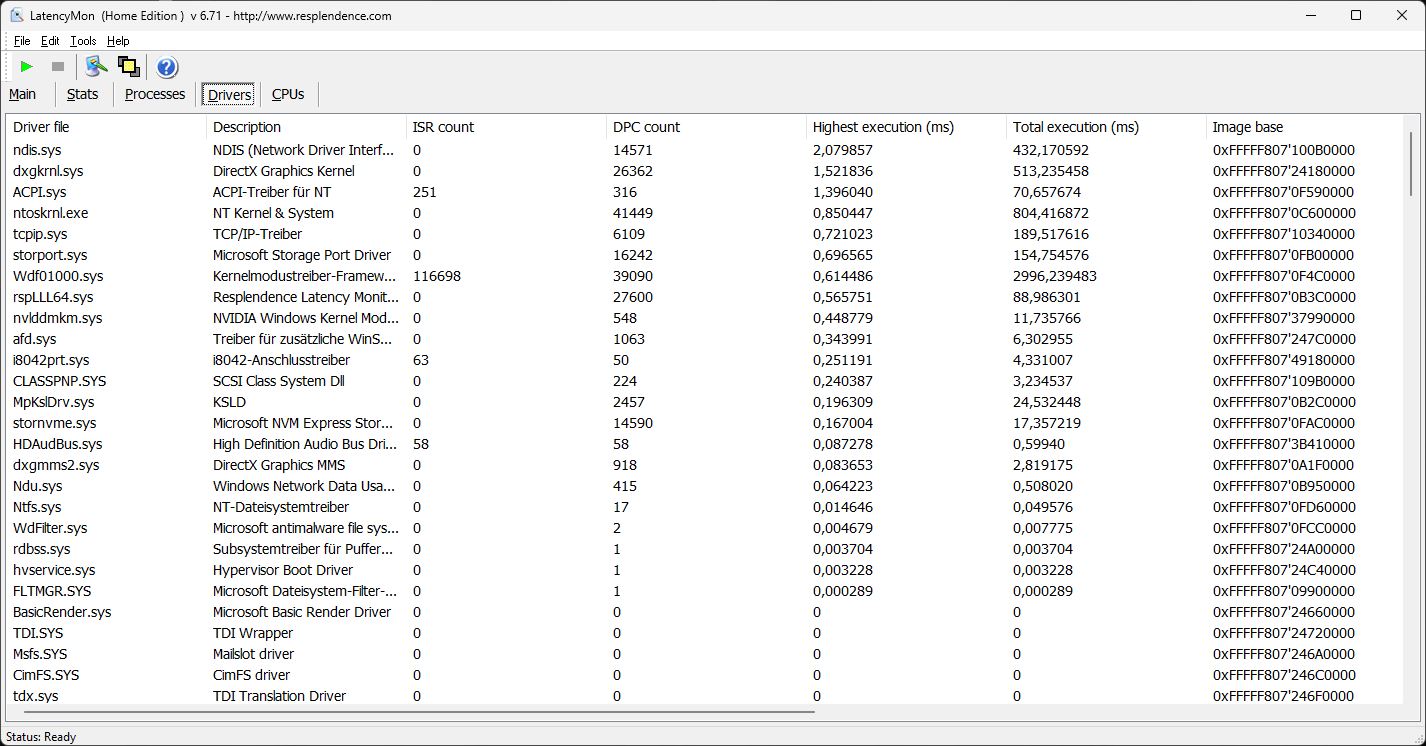
Ancak 4K/60fps YouTube videomuzu oynatırken gecikme değeri 5.000 μs'nin üzerine çıktı! Yine de hiçbir kare düşmesi yaşanmadı. Bununla birlikte, değer hala açıkça çok yüksek.
| DPC Latencies / LatencyMon - interrupt to process latency (max), Web, Youtube, Prime95 | |
| Tulpar T7 V20.6 | |
| Medion Erazer Defender P40 | |
| MSI Katana 17 B13VFK | |
| Lenovo Legion 5 16IRX G9 | |
| Acer Nitro 17 AN17-51-71ER | |
| Schenker XMG Apex 17 (Late 23) | |
* ... daha küçük daha iyidir
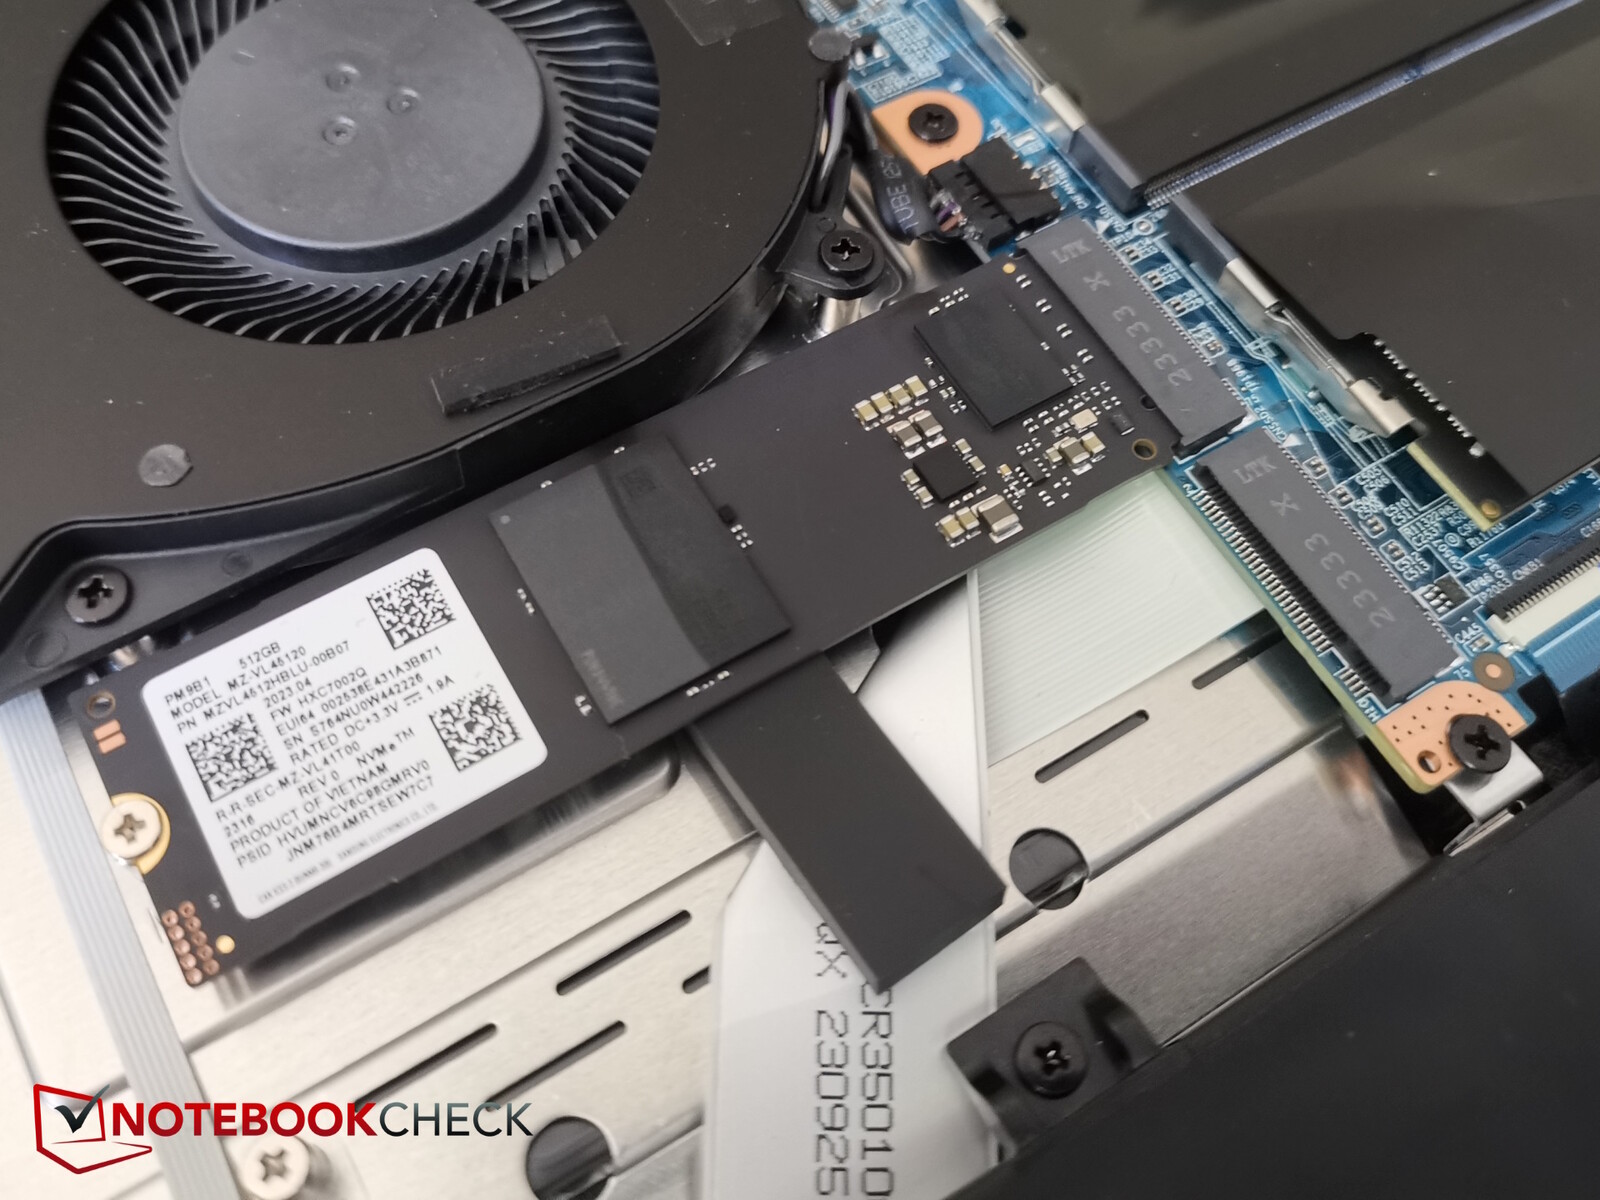
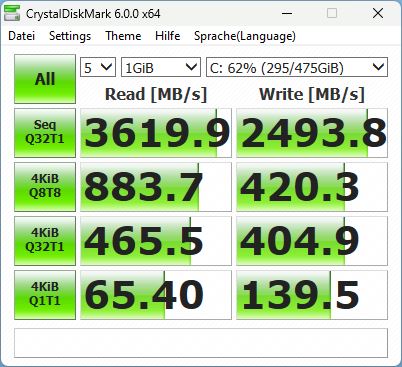
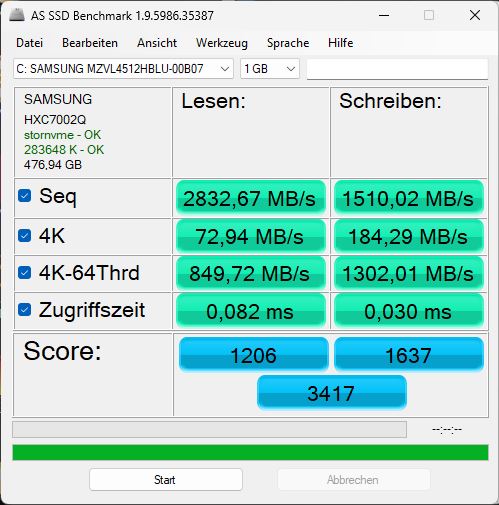
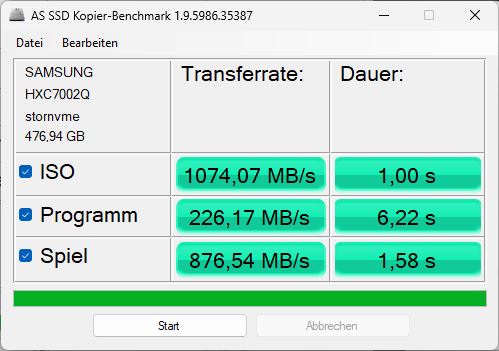
Depolama cihazları
Sadece 500 GB depolama alanına sahip kurulu Samsung NVMe SSD biraz daha eskidir ve sonuç olarak özellikle hızlı değildir, ayrıca T7'nin içinde biraz daha düşük performans gösterir. Rakipler bu açıdan açıkça daha hızlıdır. Kesinlikle 1 TB depolama alanına sahip bir T7 yapılandırmasını tercih etmelisiniz. Bununla birlikte, hızı günlük işler ve oyunlar için yeterli olacağından ve Crystaldiskmark testinde de biraz daha iyi performans gösterdiğinden endişelenmenize gerek yok. Sonuçta, performansı daha uzun bir süre boyunca sabit kaldı.

* ... daha küçük daha iyidir
Reading continuous performance: DiskSpd Read Loop, Queue Depth 8
Grafik kartı
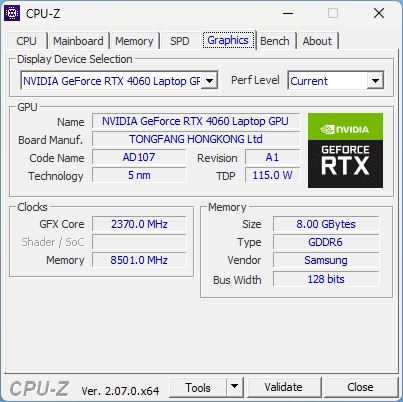
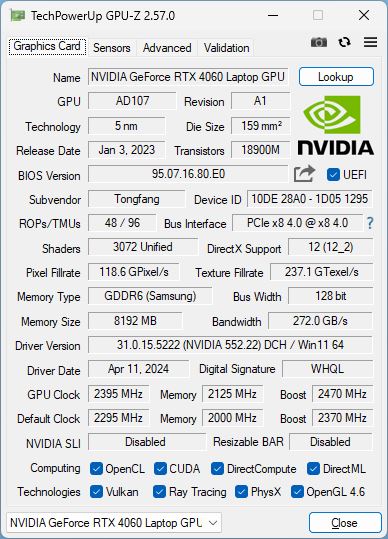
Tüm T7 modellerinde bir Nvidia Geforce RTX 4060. Tulpar, performansı hakkında herhangi bir bilgi vermedi, ancak Nvidia kontrol paneli 140 watt olduğunu belirtiyor. RTX 4060, neredeyse tüm güncel oyunları Full HD'de orta ila yüksek ayrıntılarla çalıştırabilmelidir, bu da takılı ekranla uyumludur.
Sentetik 3DMark testlerinde, 3D performansı çok iyiydi ve aynı GPU'ya sahip ortalama bir dizüstü bilgisayardan yaklaşık yüzde 10 daha iyiydi.
Pil modunda tekrarlanan bir Fire Strike çalışması, yaklaşık yüzde 85'lik bir 3D performans kaybına neden oldu, bu da büyük bir düşüş! Görünüşe göre, burada sadece entegre GPU iş başında. Optimus devre dışı bırakılırsa (yalnızca dGPU etkin), skoru önemli ölçüde artar ve performans kaybı yaklaşık yüzde 56'ya düşer.
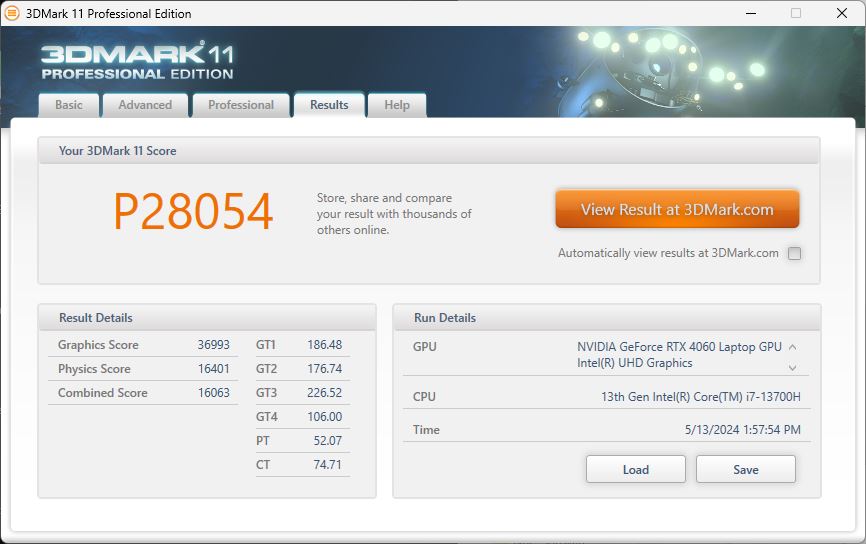
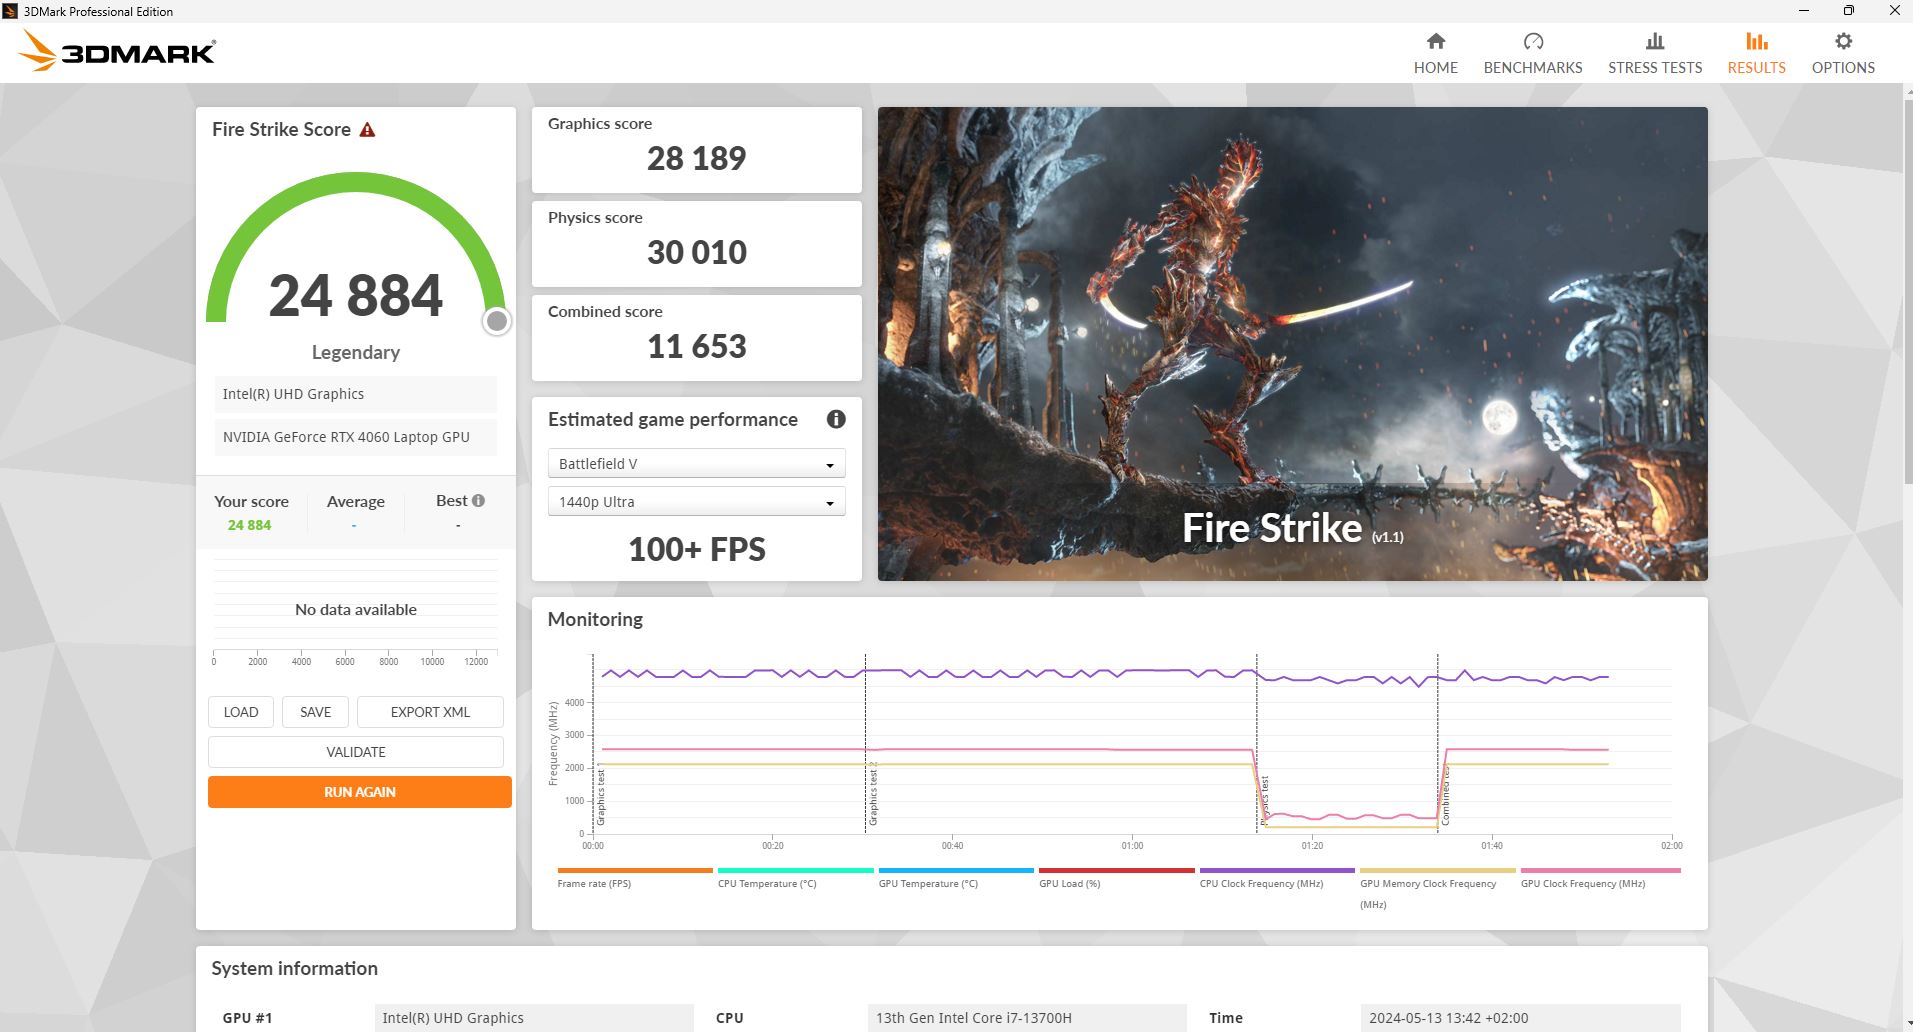
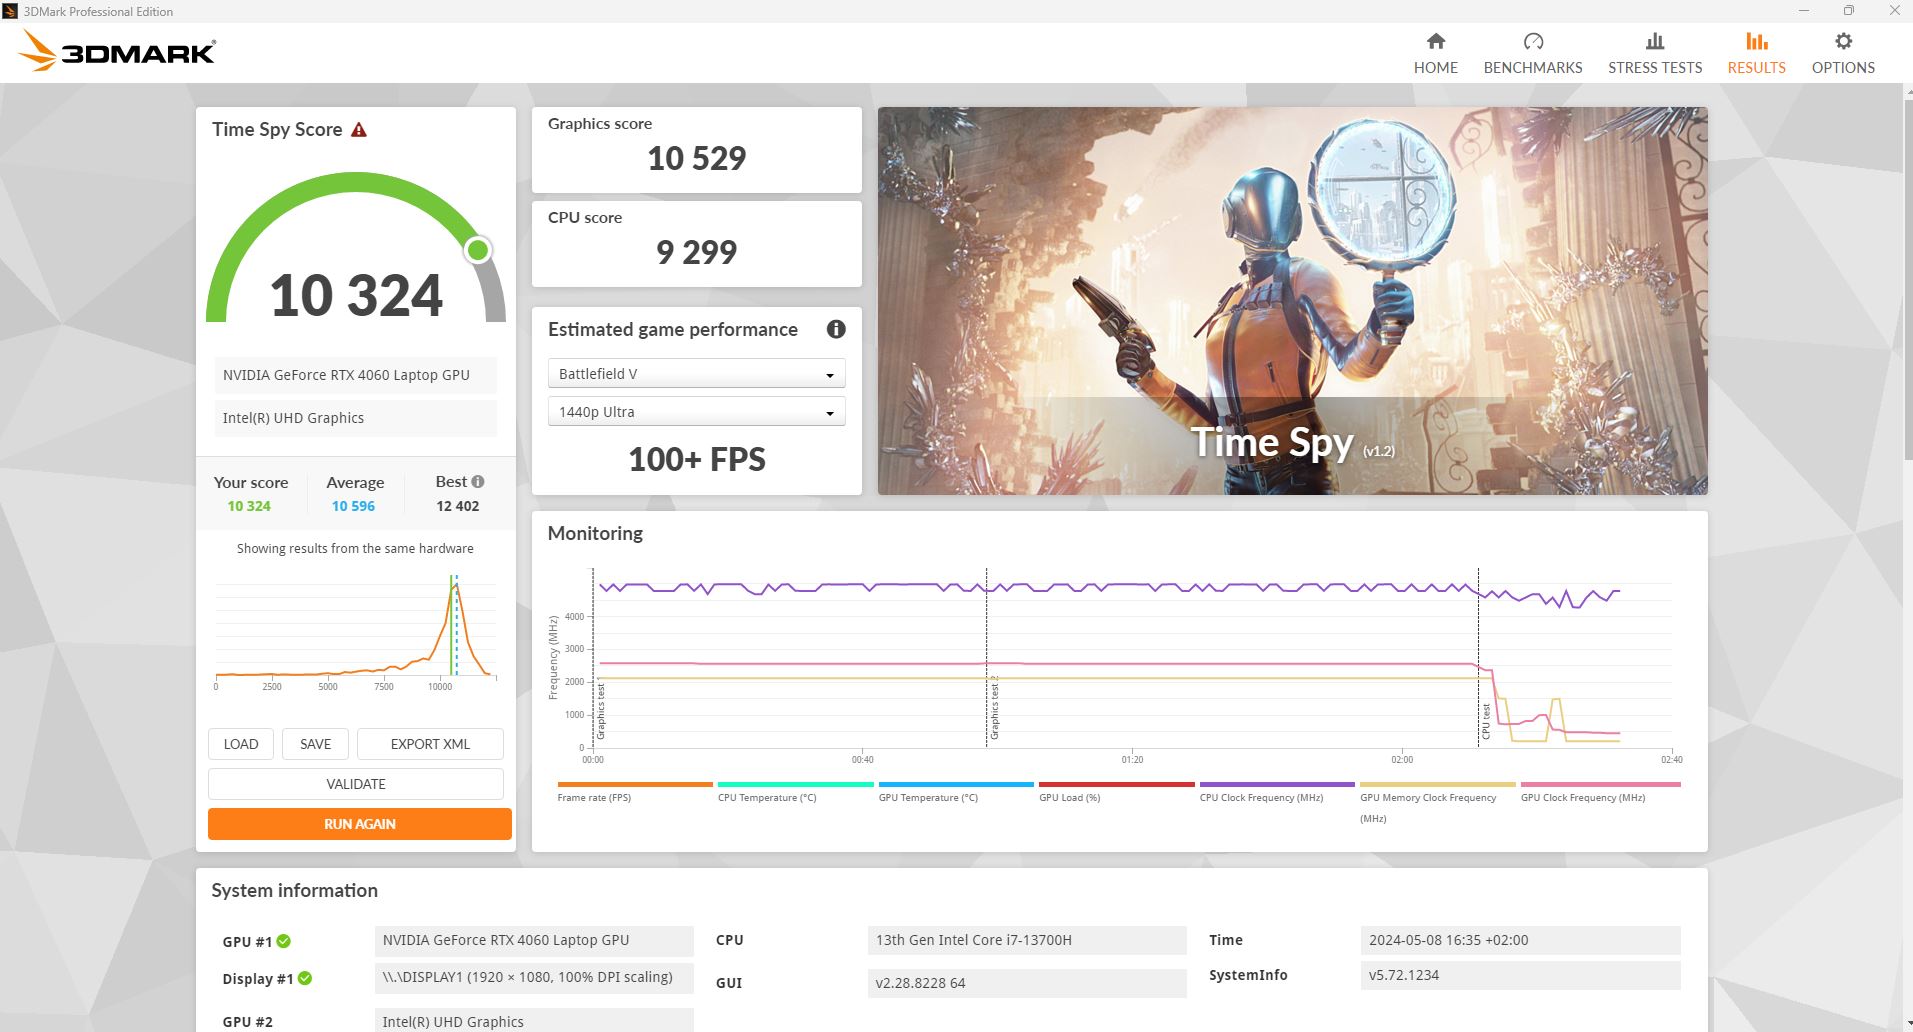
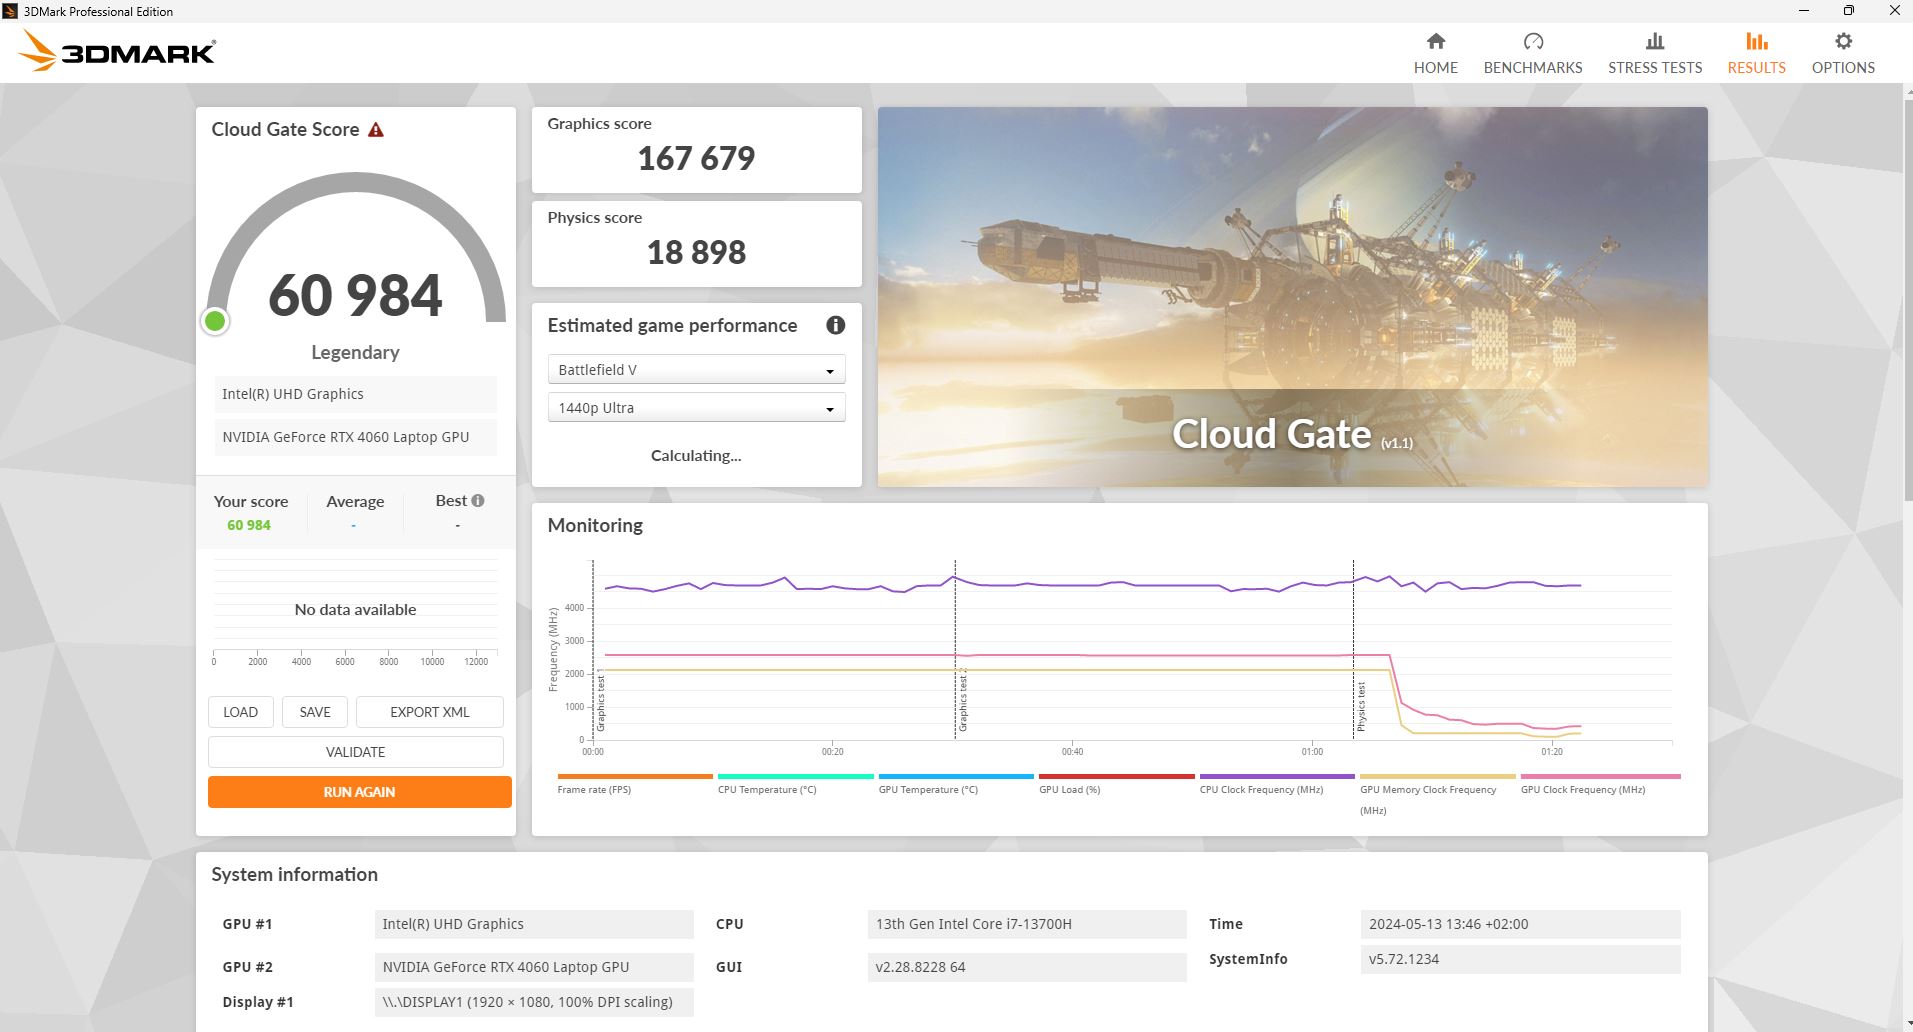
| 3DMark 11 Performance | 28054 puan | |
| 3DMark Cloud Gate Standard Score | 60984 puan | |
| 3DMark Fire Strike Score | 24884 puan | |
| 3DMark Time Spy Score | 10324 puan | |
Yardım | ||
* ... daha küçük daha iyidir
Oyun performansı
Ne yazık ki Tulpar dizüstü bilgisayar, oyun karşılaştırmasında iyi 3DMark sonuçlarını tam olarak koruyamadı, çünkü sık sık rakiplerine yenildi ve sıralamanın en altında yer aldı. XMG benzer bir seviyedeydi, ancak rakiplerinin çoğu yüzde 10 daha hızlıydı.
Güncel oyun Skull & Bones'u çalıştırırken T7, Full HD'de ve ultra ayrıntılarla ortalama 65 fps'ye ulaşıyor.
| Performance rating - Percent | |
| Sınıf ortalaması Gaming | |
| Lenovo Legion 5 16IRX G9 | |
| MSI Katana 17 B13VFK | |
| Acer Nitro 17 AN17-51-71ER | |
| Medion Erazer Defender P40 | |
| Schenker XMG Apex 17 (Late 23) -1! | |
| Tulpar T7 V20.6 | |
| The Witcher 3 - 1920x1080 Ultra Graphics & Postprocessing (HBAO+) | |
| Sınıf ortalaması Gaming (95 - 240, n=8, son 2 yıl) | |
| Acer Nitro 17 AN17-51-71ER | |
| MSI Katana 17 B13VFK | |
| Schenker XMG Apex 17 (Late 23) | |
| Medion Erazer Defender P40 | |
| Tulpar T7 V20.6 | |
| Lenovo Legion 5 16IRX G9 | |
| GTA V - 1920x1080 Highest AA:4xMSAA + FX AF:16x | |
| Sınıf ortalaması Gaming (48.3 - 186.9, n=100, son 2 yıl) | |
| Lenovo Legion 5 16IRX G9 | |
| Acer Nitro 17 AN17-51-71ER | |
| Medion Erazer Defender P40 | |
| MSI Katana 17 B13VFK | |
| Tulpar T7 V20.6 | |
| Final Fantasy XV Benchmark - 1920x1080 High Quality | |
| Sınıf ortalaması Gaming (41 - 215, n=101, son 2 yıl) | |
| Lenovo Legion 5 16IRX G9 | |
| Schenker XMG Apex 17 (Late 23) | |
| Acer Nitro 17 AN17-51-71ER | |
| Medion Erazer Defender P40 | |
| MSI Katana 17 B13VFK | |
| Tulpar T7 V20.6 | |
| Strange Brigade - 1920x1080 ultra AA:ultra AF:16 | |
| Sınıf ortalaması Gaming (76.3 - 456, n=91, son 2 yıl) | |
| Lenovo Legion 5 16IRX G9 | |
| Tulpar T7 V20.6 | |
| Acer Nitro 17 AN17-51-71ER | |
| Schenker XMG Apex 17 (Late 23) | |
| Medion Erazer Defender P40 | |
| MSI Katana 17 B13VFK | |
| Dota 2 Reborn - 1920x1080 ultra (3/3) best looking | |
| Lenovo Legion 5 16IRX G9 | |
| MSI Katana 17 B13VFK | |
| Sınıf ortalaması Gaming (84.8 - 248, n=110, son 2 yıl) | |
| Medion Erazer Defender P40 | |
| Schenker XMG Apex 17 (Late 23) | |
| Acer Nitro 17 AN17-51-71ER | |
| Tulpar T7 V20.6 | |
Bu Witcher 3 grafik olağan gece/gündüz eğrisini takip ediyor ve bunun dışında performansı çok tutarlı. T7 bazı rakipleri kadar hızlı değil, ancak aradaki fark çok büyük değil.
GPU saat hızı yaklaşık 2,6 GHz'de sabitken, bellek saati 2,1 GHz'dir. GPU 72 °C'ye ve maksimum 75,5 °C'ye kadar ısınır. Grafik kartının tüketimi yaklaşık 97 watt'tır, bu da 140 olası watt'ın hala biraz uzağındadır.
Meraklı modunda, saat hızı 100 ila 150 MHz düşer, ancak sıcaklık gelişimi benzerdir. Güç tüketimi 94 watt civarındadır.
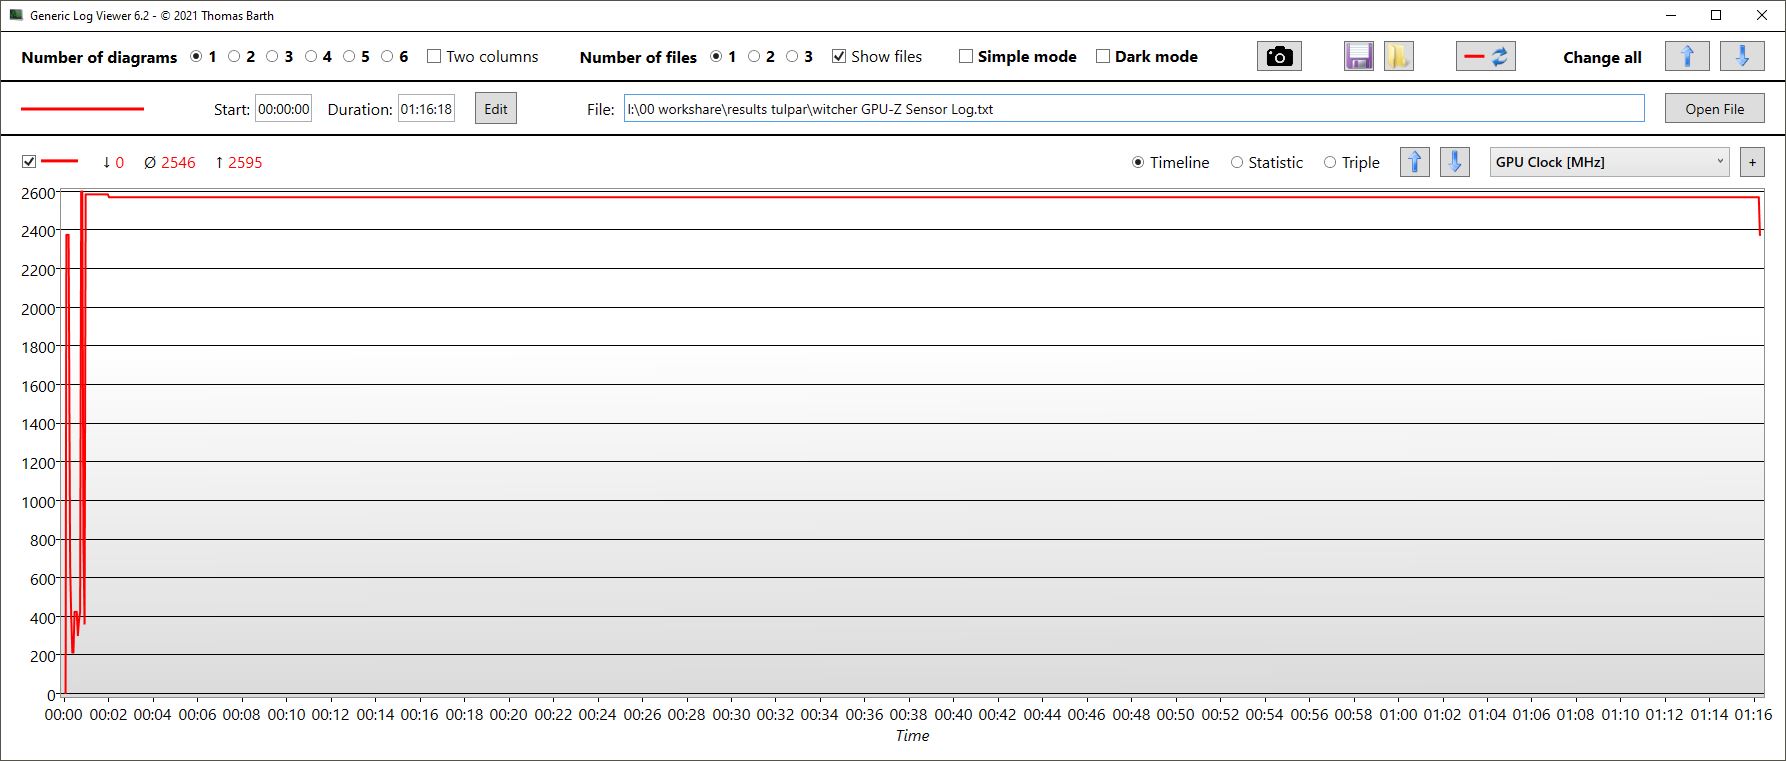
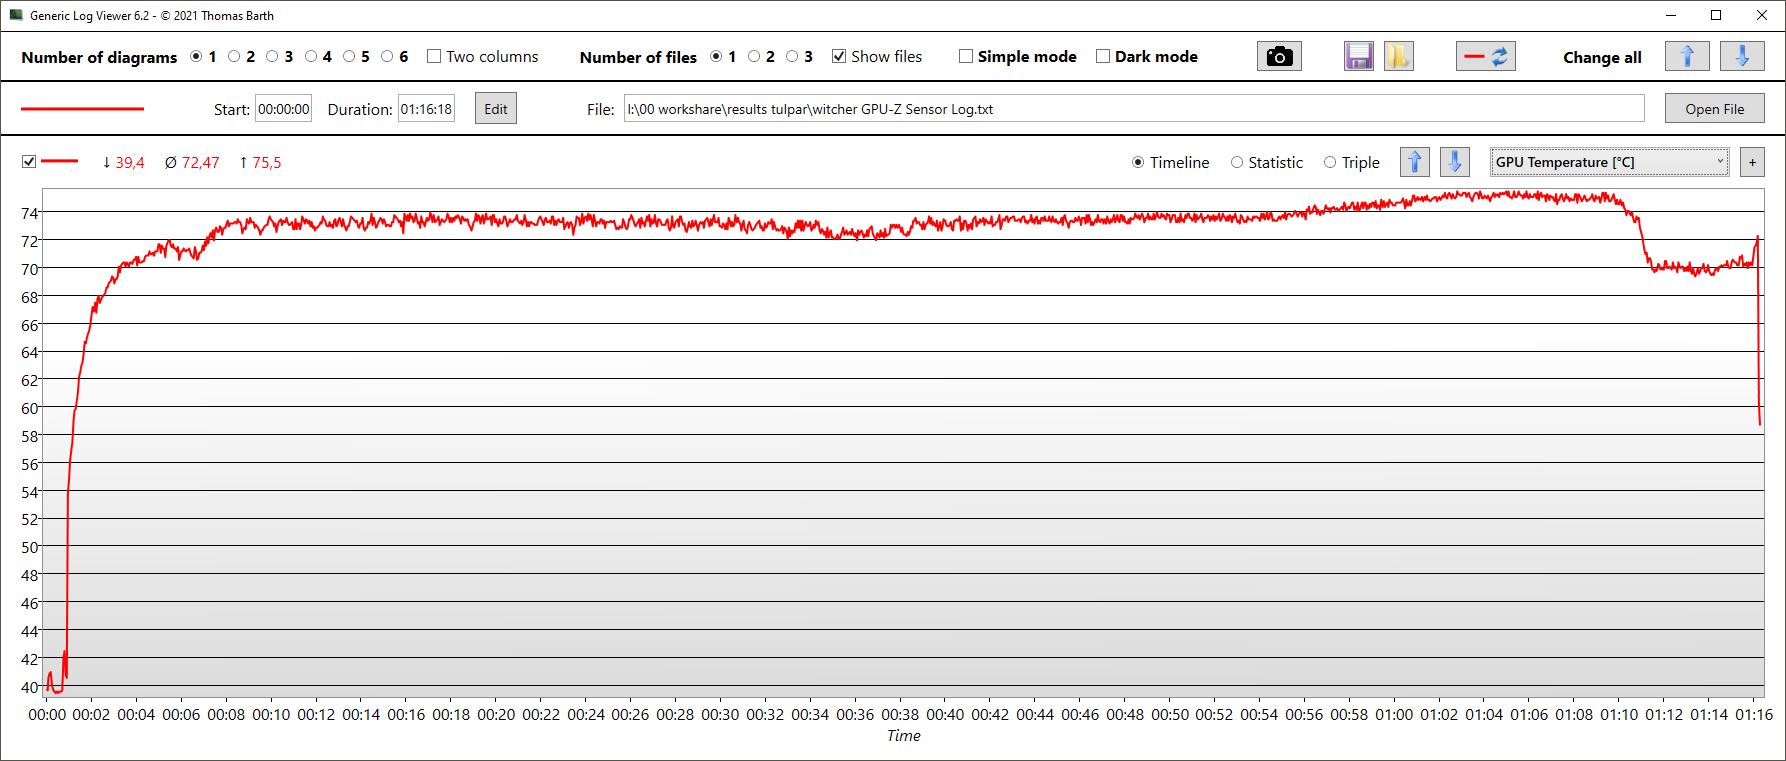
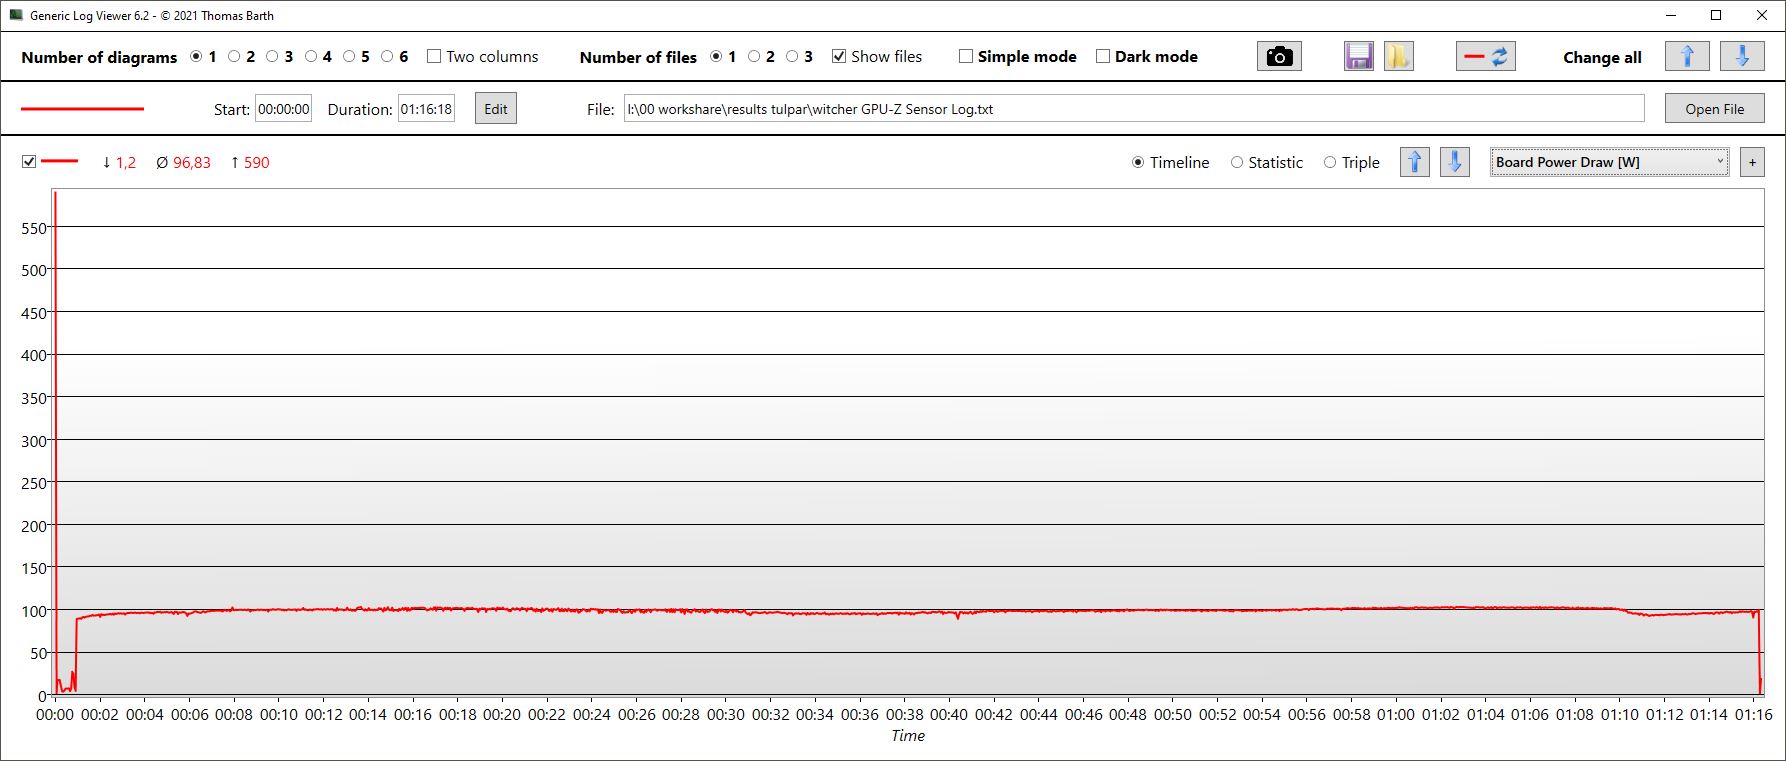
| Performans modu/ölçüm değeri | Witcher 3 fps | GPU saati (GHz cinsinden) | GPU sıcaklığı (°C cinsinden) | GPU güç tüketimi (watt cinsinden) |
|---|---|---|---|---|
| Overboost | 97 | 2.6 | 73 | 97 |
| Meraklı | 90 | 2,45 | 72 | 94 |
| Dengeli | 64 | 1,7 | 57 | 49 |
Witcher 3 FPS diagram
| düşük | orta | yüksek | ultra | |
|---|---|---|---|---|
| GTA V (2015) | 178.3 | 172.1 | 163 | 97.8 |
| The Witcher 3 (2015) | 339 | 287 | 198 | 99.6 |
| Dota 2 Reborn (2015) | 148 | 130 | 124 | 115 |
| Final Fantasy XV Benchmark (2018) | 149.5 | 125.8 | 93.3 | |
| X-Plane 11.11 (2018) | 141.69 | 126.82 | 99.32 | |
| Far Cry 5 (2018) | 135 | 113 | 109 | 103 |
| Strange Brigade (2018) | 432 | 291 | 230 | 198.7 |
| Skull & Bones (2024) | 82 | 82 | 78 | 65 |
Emisyonlar - Ilımlı değerler
Gürültü emisyonları
Masaüstünde rölantide çalışırken, dizüstü bilgisayarın fanları genellikle kapalıdır. Bu durum overdrive modu için de geçerlidir ancak bu modda fanlar bazen kısa süreliğine 40 dB'ye kadar hızlanabilir. İkinci durum, rölanti modundan uzakta daha az zorlu görevler üstlenildiğinde de elde edilebilir.
3DMark06 testinde fanların gürültüsü yavaşça 40 dB'ye kadar yükseldi. Bununla birlikte, çalışma sırasında tekrar sessizleştiler ve sonunda fanlar oldukça sabit 38 dB'de vızıldadılar. Bu nedenle ölçtüğümüz 40 dB, fanların ortalama yük altındaki maksimum değeri olarak anlaşılmalıdır.
The Witcher 3 sırasında fanlar sürekli olarak yaklaşık 47,5 dB ile 50 dB'nin hemen altı arasında değişti. Bunlar bir oyuncu için tipik değerlerdir, ancak bu testte temsil edilen rakipler oyun oynarken daha da yüksek seslidir. Genel olarak, T7 gürültü açısından oldukça iyi bir performans sergiliyor, ancak diğer karşılaştırma cihazlarının performansına tam olarak ulaşamıyor.
Ses yüksekliği
| Boşta |
| 23 / 23 / 30.84 dB |
| Çalışırken |
| 40.14 / 50.69 dB |
 | ||
30 dB sessiz 40 dB(A) duyulabilirlik 50 dB(A) gürültülü |
||
min: | ||
| Tulpar T7 V20.6 GeForce RTX 4060 Laptop GPU, i7-13700H, Samsung PM9B1 512GB MZVL4512HBLU | Schenker XMG Apex 17 (Late 23) GeForce RTX 4060 Laptop GPU, R7 7840HS, Samsung 990 Pro 1 TB | Acer Nitro 17 AN17-51-71ER GeForce RTX 4060 Laptop GPU, i7-13700H, Samsung PM9A1 MZVL21T0HCLR | Medion Erazer Defender P40 GeForce RTX 4060 Laptop GPU, i7-13700HX, Phison PS5021-E21 1TB | MSI Katana 17 B13VFK GeForce RTX 4060 Laptop GPU, i7-13620H, Micron 2400 MTFDKBA1T0QFM | Lenovo Legion 5 16IRX G9 GeForce RTX 4060 Laptop GPU, i7-14650HX, Samsung PM9A1 MZVL21T0HCLR | |
|---|---|---|---|---|---|---|
| Noise | -6% | -3% | -16% | -14% | -9% | |
| kapalı / ortam * (dB) | 23 | 24 -4% | 24 -4% | 25 -9% | 24.5 -7% | 24 -4% |
| Idle Minimum * (dB) | 23 | 25 -9% | 24 -4% | 26 -13% | 24.5 -7% | 24 -4% |
| Idle Average * (dB) | 23 | 29 -26% | 24 -4% | 27 -17% | 24.5 -7% | 28.8 -25% |
| Idle Maximum * (dB) | 30.84 | 33 -7% | 32.32 -5% | 32 -4% | 40 -30% | 32 -4% |
| Load Average * (dB) | 40.14 | 37 8% | 35.18 12% | 53 -32% | 48.3 -20% | 45.5 -13% |
| Witcher 3 ultra * (dB) | 50.69 | 50 1% | 54.78 -8% | 56 -10% | 56 -10% | 53.1 -5% |
| Load Maximum * (dB) | 50.69 | 54 -7% | 54.78 -8% | 64 -26% | 59.1 -17% | 55.7 -10% |
* ... daha küçük daha iyidir
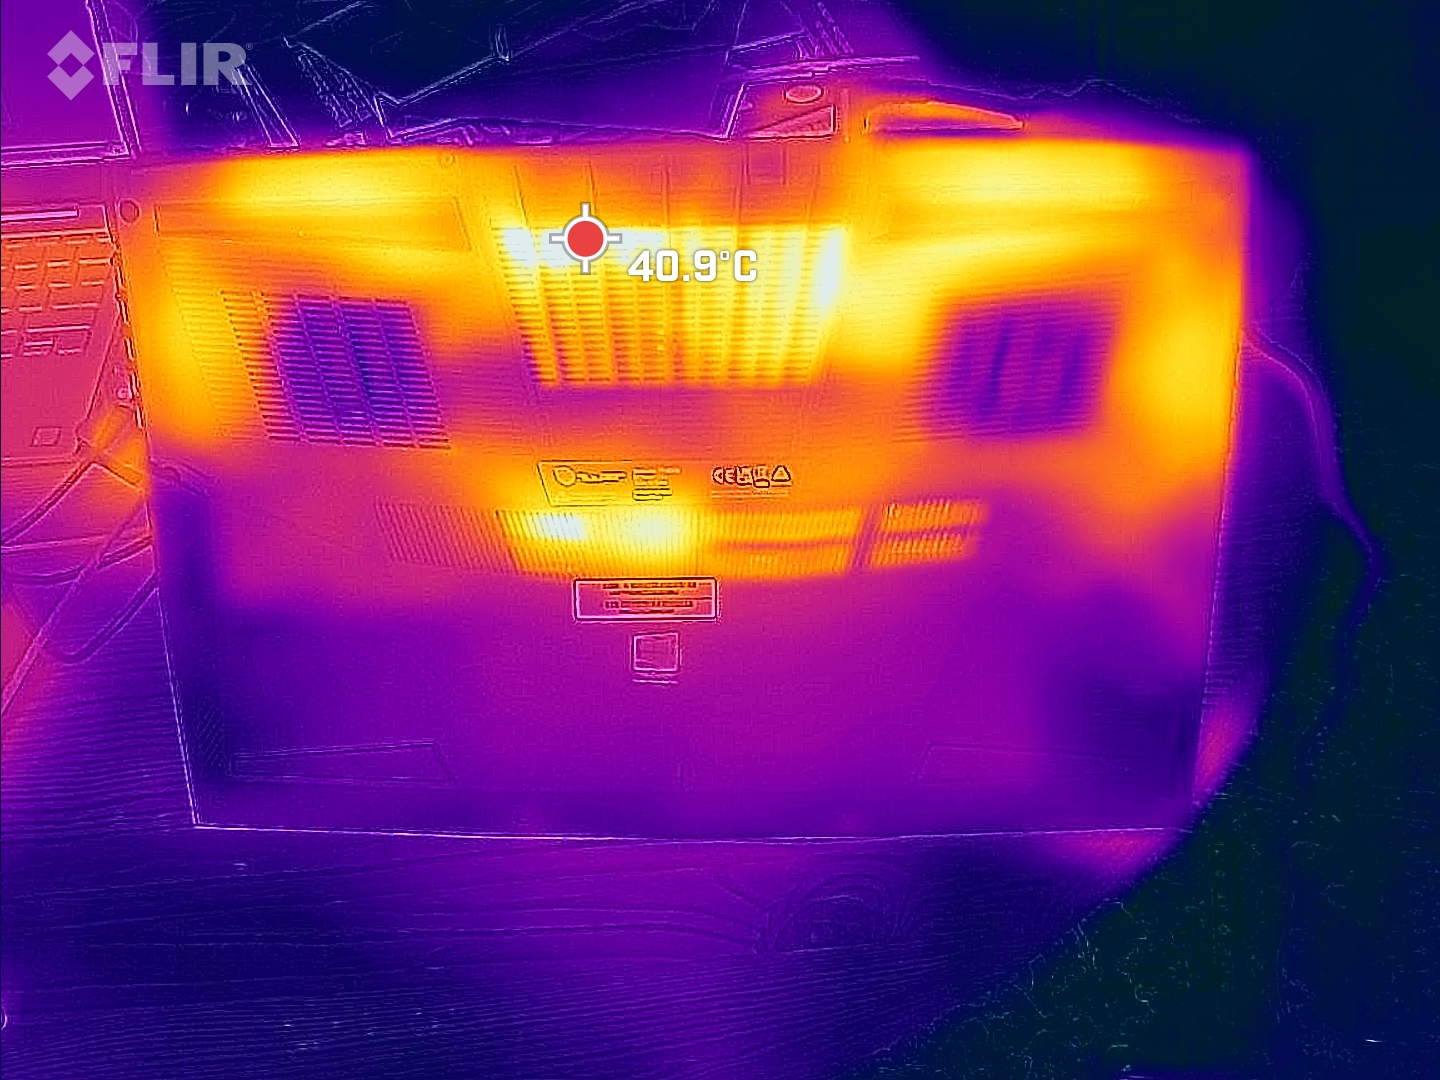
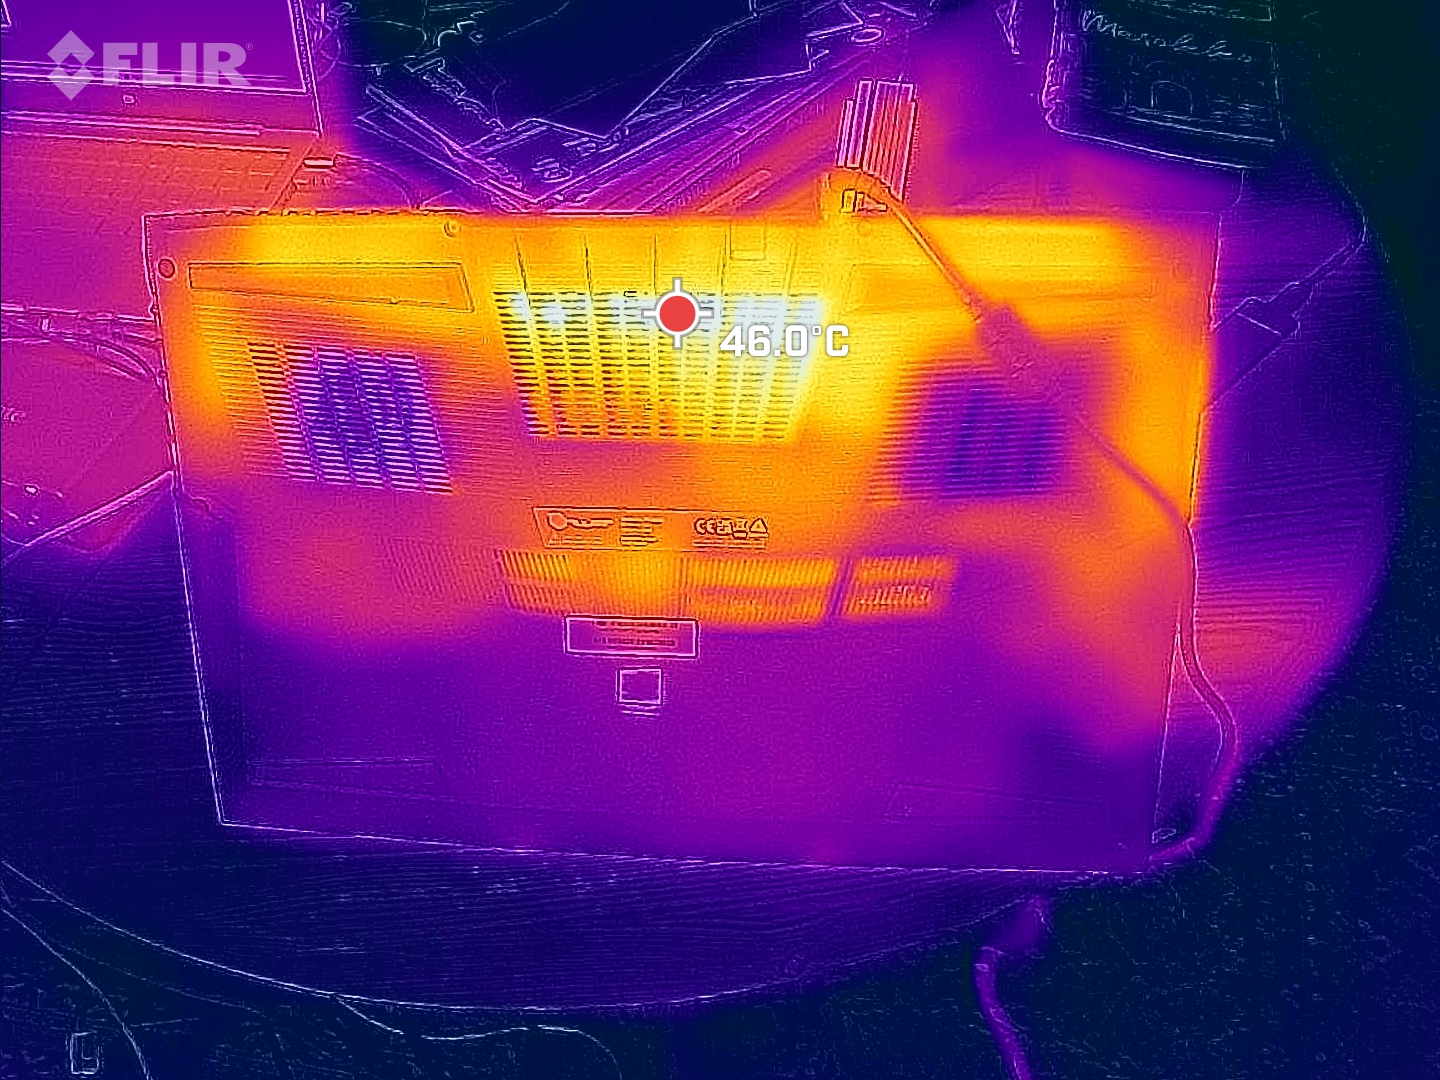
Sıcaklık
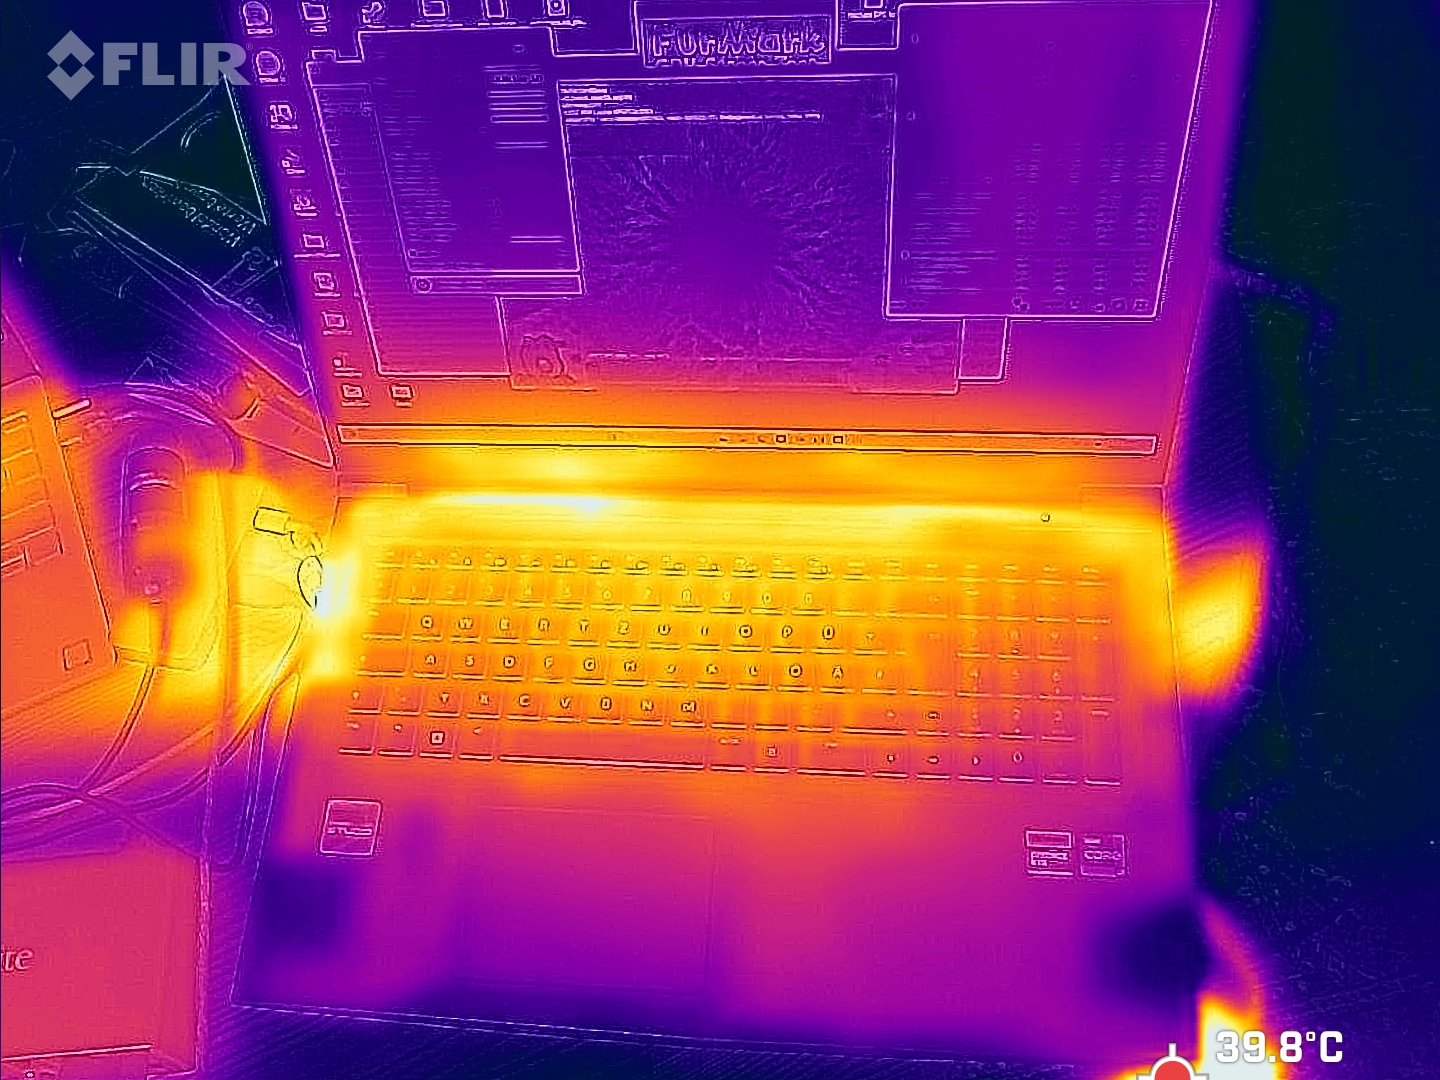
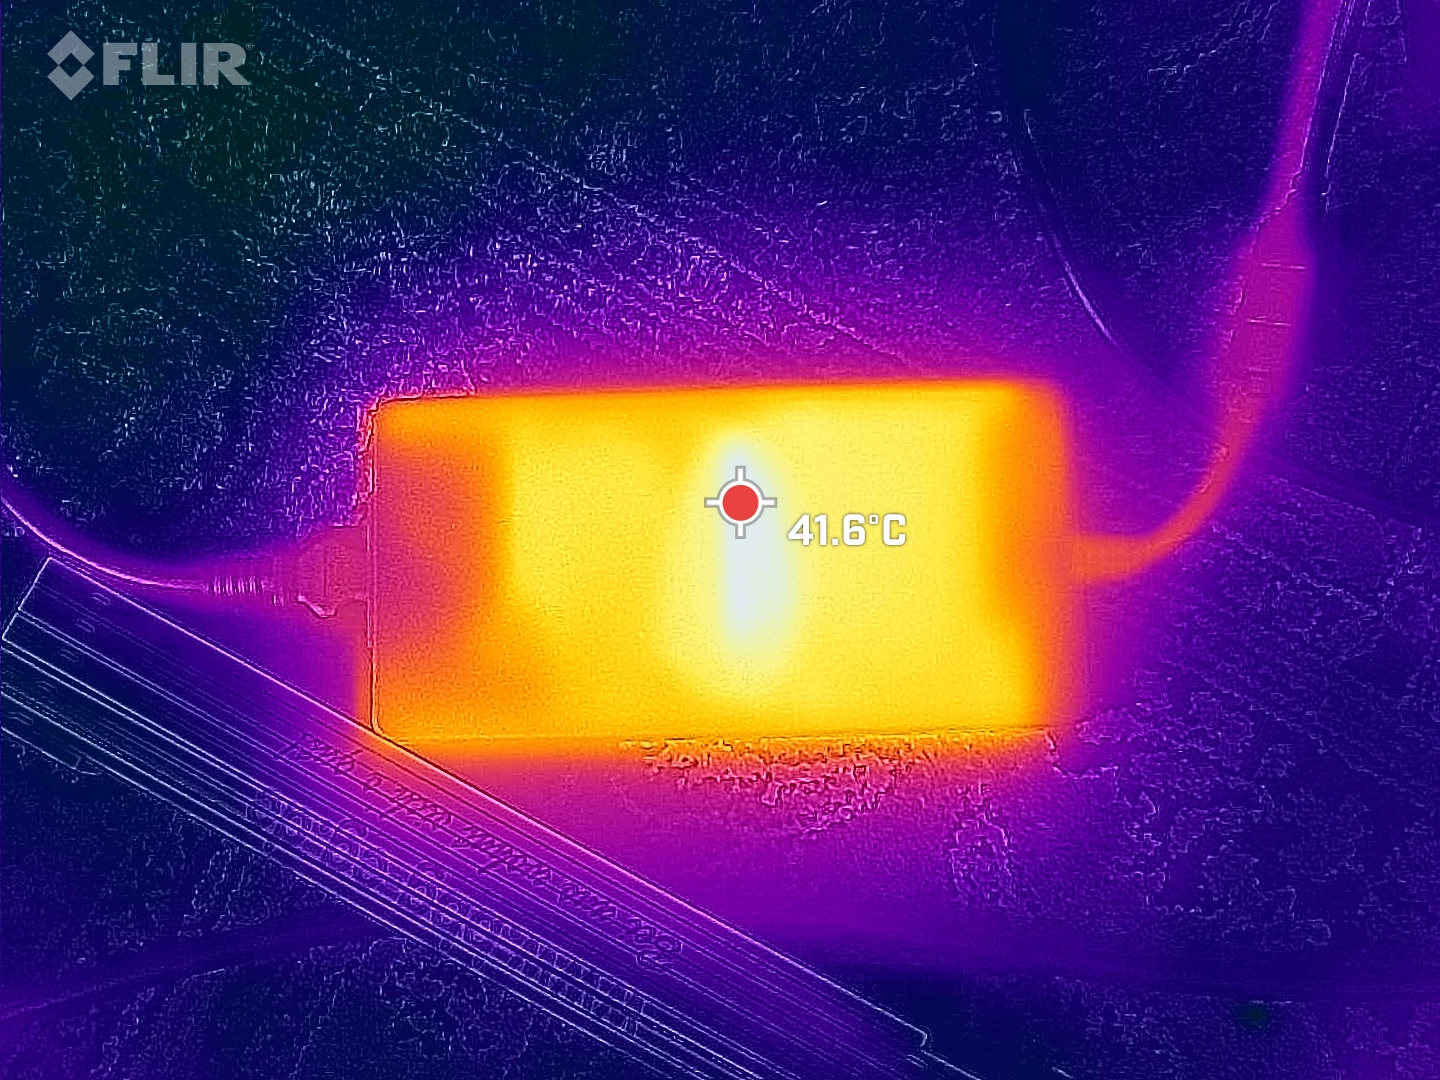
T7'nin yüzey sıcaklıkları da ılımlı kaldı ve sıcak noktaları stres testi sırasında yalnızca 44 °C'ye kadar ısındı.
Aynı stres testini dengeli modda gerçekleştirdiğimizde, ortalama yüzey sıcaklıklarını yalnızca üstte 32 °C ve altta 33 °C olarak ölçtük.
(+) Üst taraftaki maksimum sıcaklık, 40.4 °C / 105 F ortalamasına kıyasla 38 °C / 100 F'dir. , Gaming sınıfı için 21.2 ile 68.8 °C arasında değişir.
(±) Alt kısım, 43.2 °C / 110 F ortalamasına kıyasla maksimum 44 °C / 111 F'ye kadar ısınır
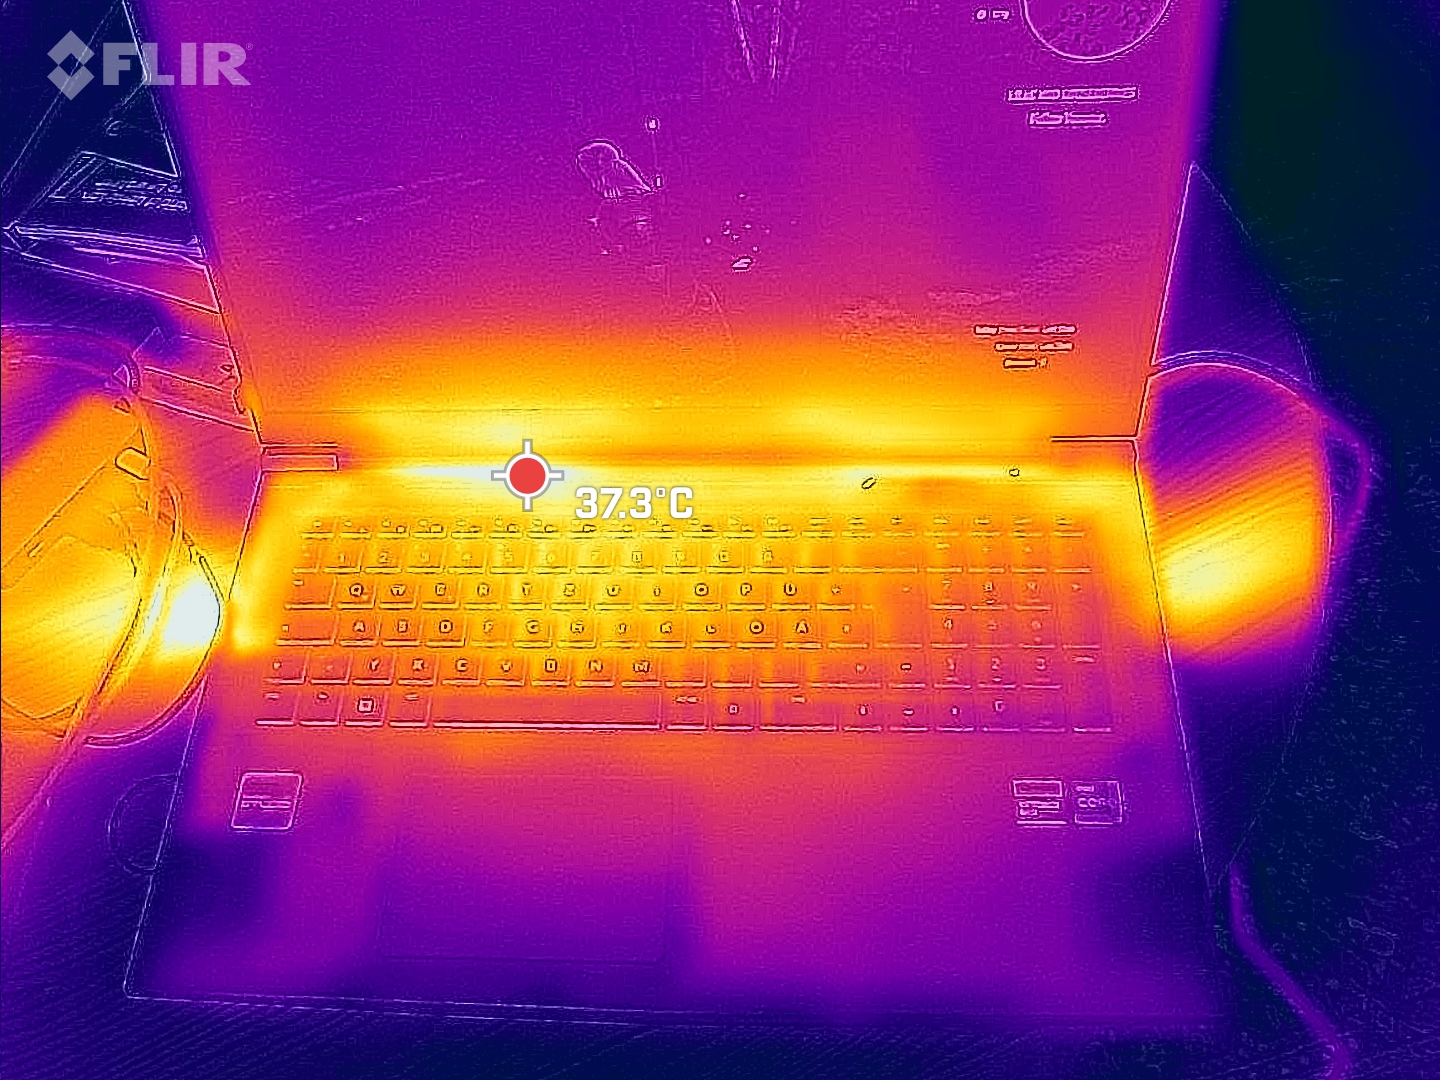
(+) Boşta kullanımda, üst tarafın ortalama sıcaklığı 30 °C / 86 F olup, cihazın 33.9 °C / 93 F.
(±) The Witcher 3 oynarken, üst tarafın ortalama sıcaklığı 34.3 °C / 94 F olup, cihazın 33.9 °C / 93 F.
(+) Avuç içi dayanakları ve dokunmatik yüzey maksimum (35 °C / 95 F) cilt sıcaklığına ulaşıyor ve bu nedenle sıcak değil.
(-) Benzer cihazların avuç içi dayanağı alanının ortalama sıcaklığı 28.8 °C / 83.8 F (-6.2 °C / -11.2 F) idi.
| Tulpar T7 V20.6 Intel Core i7-13700H, NVIDIA GeForce RTX 4060 Laptop GPU | Schenker XMG Apex 17 (Late 23) AMD Ryzen 7 7840HS, NVIDIA GeForce RTX 4060 Laptop GPU | Acer Nitro 17 AN17-51-71ER Intel Core i7-13700H, NVIDIA GeForce RTX 4060 Laptop GPU | Medion Erazer Defender P40 Intel Core i7-13700HX, NVIDIA GeForce RTX 4060 Laptop GPU | MSI Katana 17 B13VFK Intel Core i7-13620H, NVIDIA GeForce RTX 4060 Laptop GPU | Lenovo Legion 5 16IRX G9 Intel Core i7-14650HX, NVIDIA GeForce RTX 4060 Laptop GPU | |
|---|---|---|---|---|---|---|
| Heat | -16% | -11% | 2% | -4% | -2% | |
| Maximum Upper Side * (°C) | 38 | 51 -34% | 46 -21% | 42 -11% | 41.6 -9% | 40.4 -6% |
| Maximum Bottom * (°C) | 44 | 54 -23% | 51 -16% | 45 -2% | 43.1 2% | 43.8 -0% |
| Idle Upper Side * (°C) | 32 | 33 -3% | 34 -6% | 28 12% | 32 -0% | 30.3 5% |
| Idle Bottom * (°C) | 33 | 34 -3% | 33 -0% | 30 9% | 35.8 -8% | 35.3 -7% |
* ... daha küçük daha iyidir
Stres testi
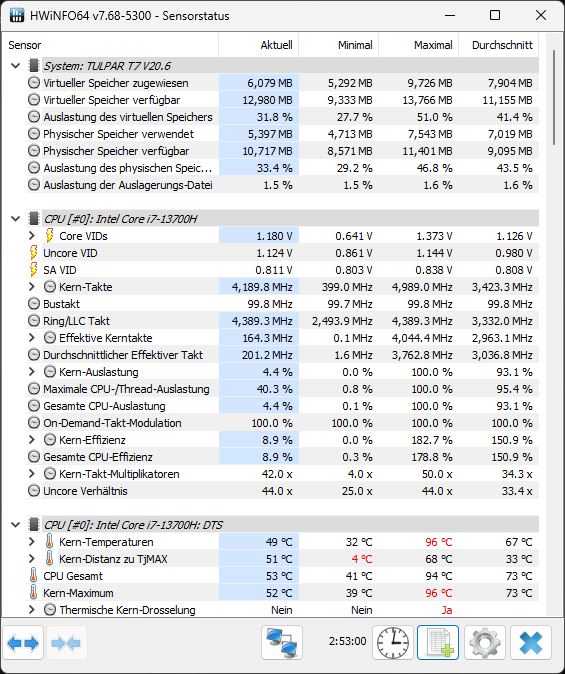
Stres testinde, çekirdekler başlangıçta yaklaşık 3,5 - 3,7 GHz'e kadar çıktı ve bir saatlik testin sonuna kadar bu aralıkta kaldı. Çekirdek sıcaklıkları ortalama 78 °C'dir ve 85 °C'den daha fazla ısınmamıştır. CPU'nun güç tüketimi 60 ila 80 watt arasında dalgalandı ve ortalama 67 watt oldu.
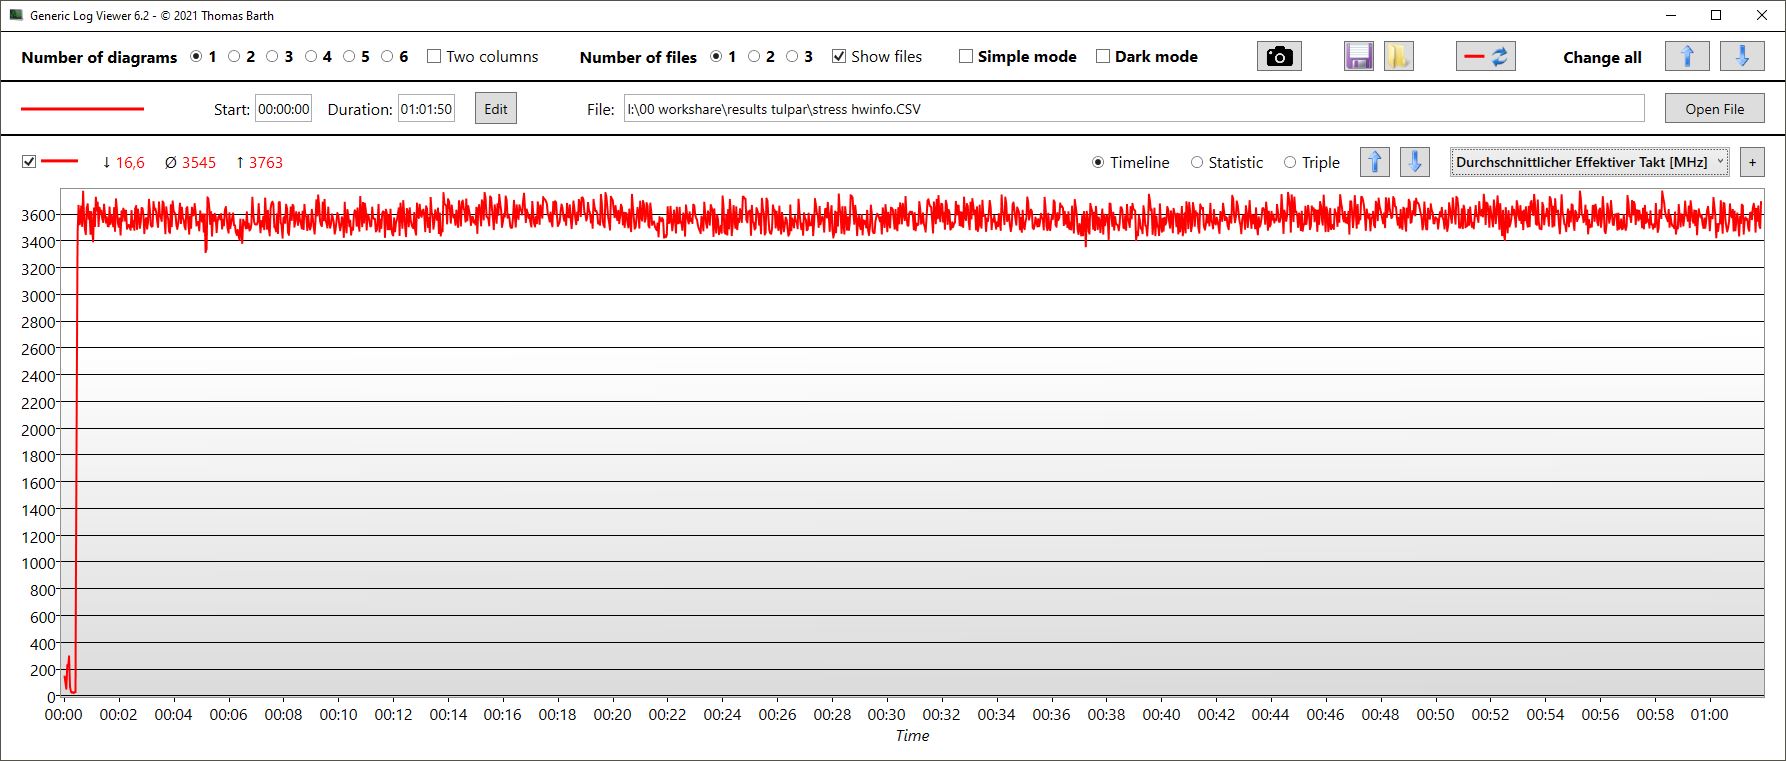
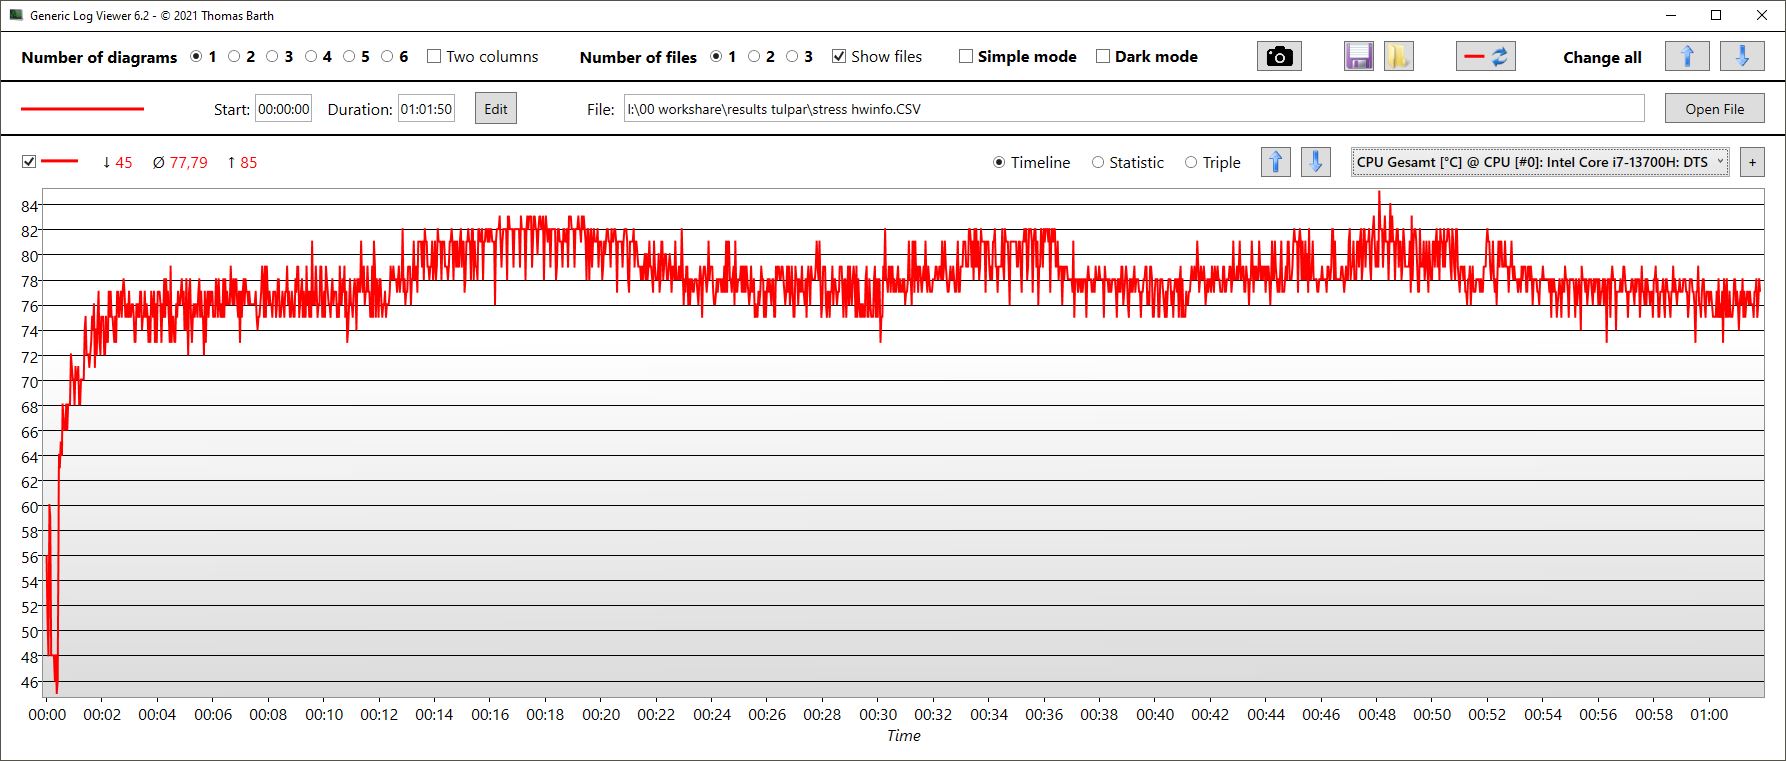
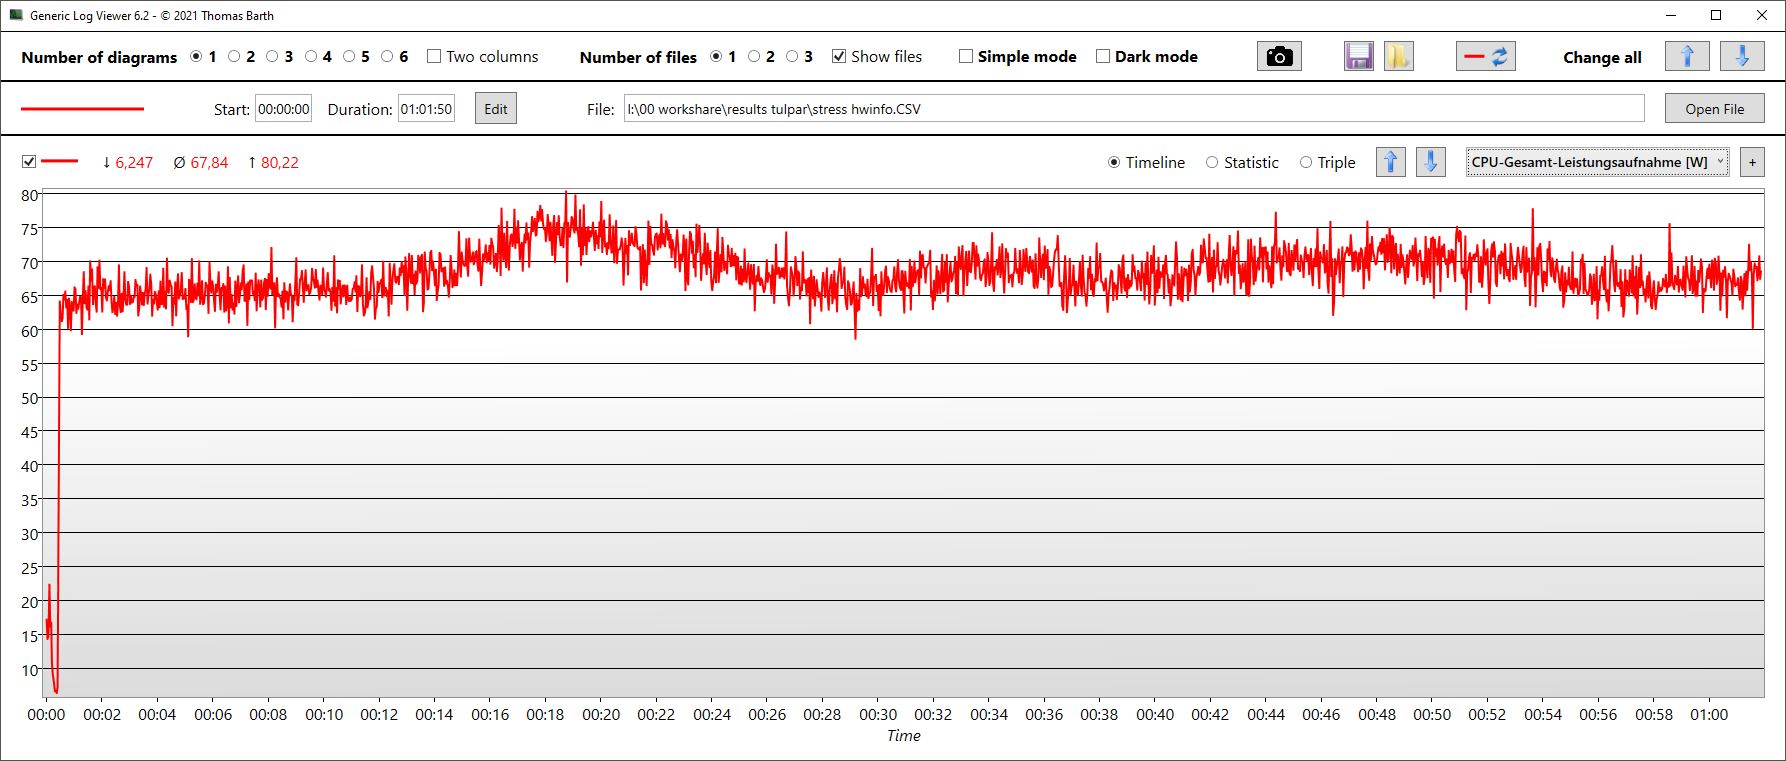
| CPU saati (GHz) | GPU saati (MHz) | Ortalama CPU sıcaklığı (°C) | Ortalama GPU sıcaklığı (°C) | |
| Sistem boşta | 4.2 | / | 41 | / |
| Prime95 + FurMark stres | 3,5 | 1.264 | 80 | 54 |
| Witcher 3 stres | 0,64 | 2.600 | 77 | 71 |
Konuşmacılar
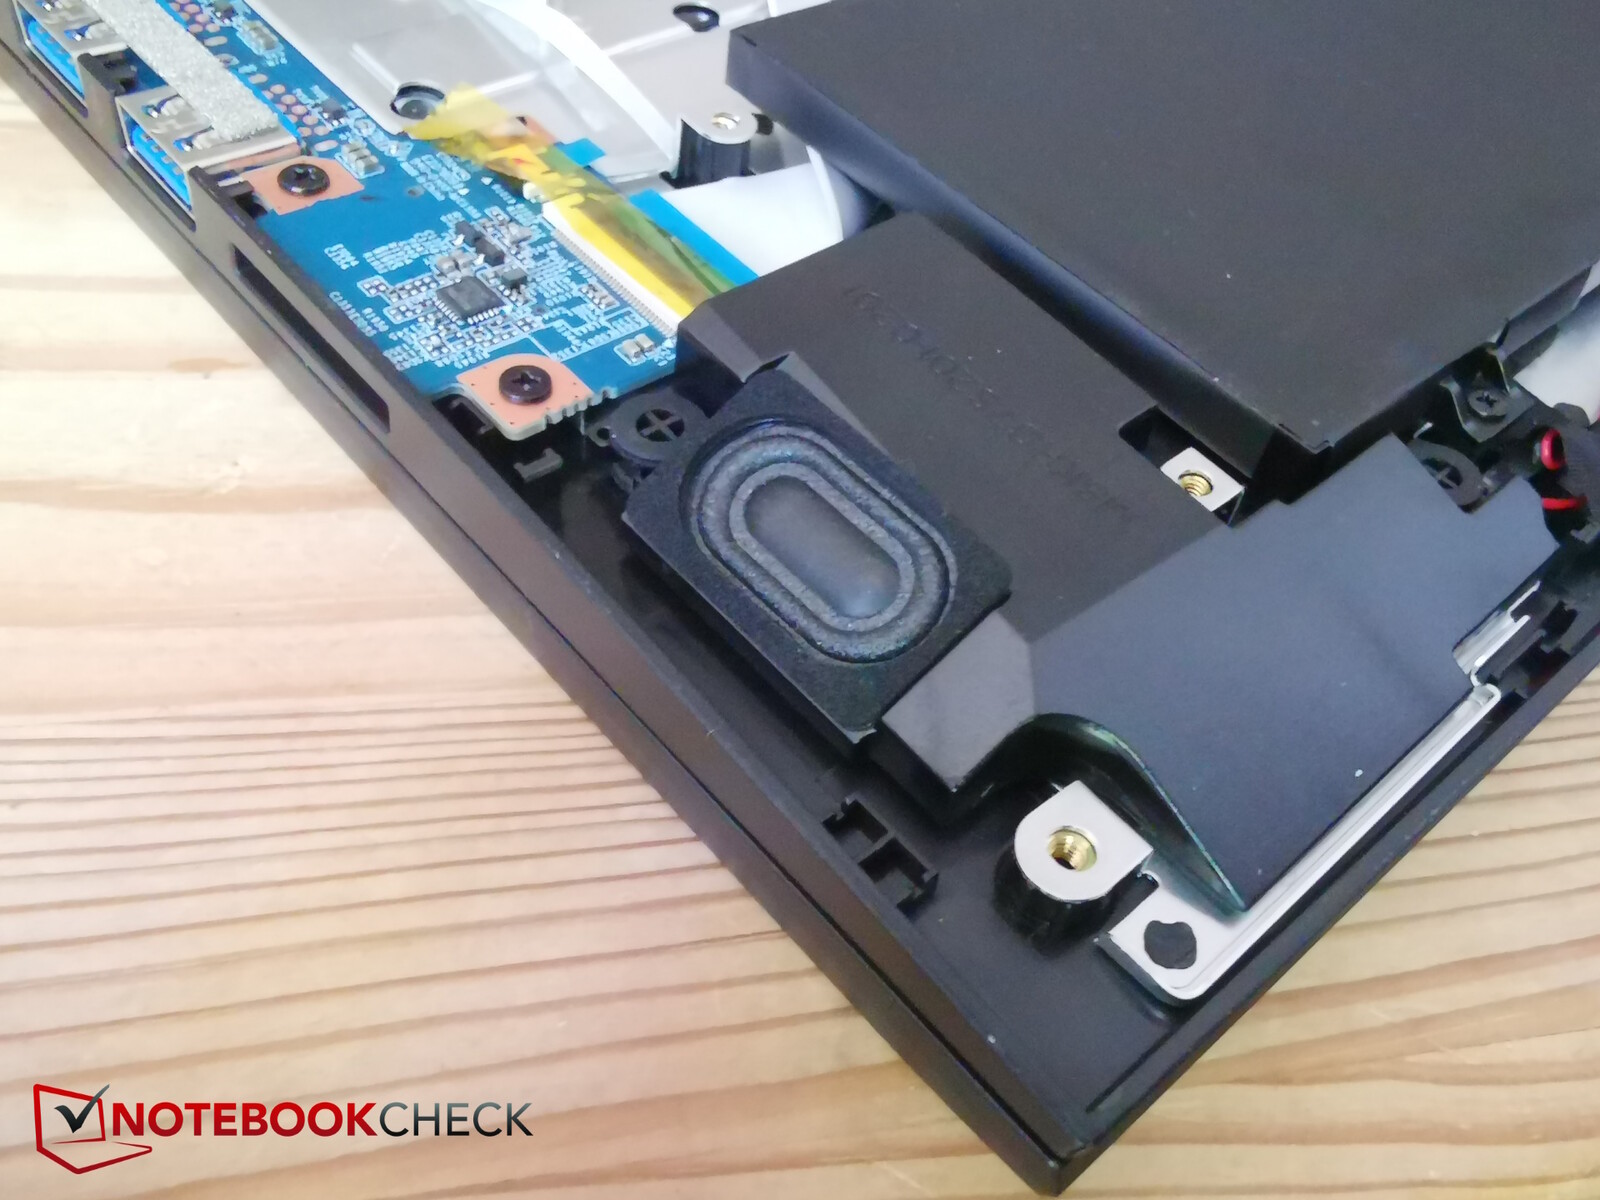
Stereo hoparlörler dizüstü bilgisayarın ön köşelerine yerleştirilmiş; oldukça küçükler ve aşağıya doğru yayılıyorlar. Buna göre, daha yüksek olabilirlerdi ve bas sesleri eksik. En azından orta ve tizler dengeli.
Analog ses cihazlarını bağlamak için bir mikrofon girişi ve bir kulaklık çıkışı (her ikisi de 3,5 mm) mevcut.
Tulpar T7 V20.6 ses analizi
(±) | hoparlör ses yüksekliği ortalama ama iyi (78.88 dB)
Bas 100 - 315Hz
(-) | neredeyse hiç bas yok - ortalama olarak medyandan 20.7% daha düşük
(±) | Bas doğrusallığı ortalamadır (12% delta - önceki frekans)
Ortalar 400 - 2000 Hz
(+) | dengeli ortalar - medyandan yalnızca 4.8% uzakta
(+) | orta frekanslar doğrusaldır (6.5% deltadan önceki frekansa)
Yüksekler 2 - 16 kHz
(+) | dengeli yüksekler - medyandan yalnızca 2.7% uzakta
(+) | yüksekler doğrusaldır (5.7% deltadan önceki frekansa)
Toplam 100 - 16.000 Hz
(±) | Genel sesin doğrusallığı ortalamadır (17% ortancaya göre fark)
Aynı sınıfla karşılaştırıldığında
» Bu sınıftaki tüm test edilen cihazların %45%'si daha iyi, 12% benzer, 43% daha kötüydü
» En iyisinin deltası 6% idi, ortalama 18% idi, en kötüsü 132% idi
Test edilen tüm cihazlarla karşılaştırıldığında
» Test edilen tüm cihazların %30'si daha iyi, 8 benzer, % 62 daha kötüydü
» En iyisinin deltası 4% idi, ortalama 24% idi, en kötüsü 134% idi
Lenovo Legion 5 16IRX G9 ses analizi
(+) | hoparlörler nispeten yüksek sesle çalabilir (84.4 dB)
Bas 100 - 315Hz
(-) | neredeyse hiç bas yok - ortalama olarak medyandan 25.7% daha düşük
(±) | Bas doğrusallığı ortalamadır (8.3% delta - önceki frekans)
Ortalar 400 - 2000 Hz
(+) | dengeli ortalar - medyandan yalnızca 4.3% uzakta
(+) | orta frekanslar doğrusaldır (5.2% deltadan önceki frekansa)
Yüksekler 2 - 16 kHz
(+) | dengeli yüksekler - medyandan yalnızca 1.9% uzakta
(+) | yüksekler doğrusaldır (2.1% deltadan önceki frekansa)
Toplam 100 - 16.000 Hz
(±) | Genel sesin doğrusallığı ortalamadır (16.1% ortancaya göre fark)
Aynı sınıfla karşılaştırıldığında
» Bu sınıftaki tüm test edilen cihazların %39%'si daha iyi, 6% benzer, 54% daha kötüydü
» En iyisinin deltası 6% idi, ortalama 18% idi, en kötüsü 132% idi
Test edilen tüm cihazlarla karşılaştırıldığında
» Test edilen tüm cihazların %26'si daha iyi, 5 benzer, % 69 daha kötüydü
» En iyisinin deltası 4% idi, ortalama 24% idi, en kötüsü 134% idi
Güç yönetimi - Geçen yılın verimliliği
Güç tüketimi
T7 özellikle tutumlu değil. Aradaki fark çok büyük olmasa da dizüstü bilgisayar boştayken daha tutumlu rakipler var. The Witcher 3 çalıştırıldığında, özellikle biraz düşük performansını düşündüğünüzde tüketimi çok yüksektir. Medion ve Lenovo biraz daha fazla tüketmesine rağmen, XMG ve Acer biraz daha iyi performans sunarken biraz daha tutumludur.
HDMI üzerinden harici bir monitör bağlarsanız, dizüstü bilgisayarın dGPU'su aktif olur ve bu da boşta tüketiminin yaklaşık 5 watt artmasına neden olur (aşağıdaki grafiğe bakın).
| Kapalı / Bekleme modu | |
| Boşta | |
| Çalışırken |
|
Key:
min: | |
| Tulpar T7 V20.6 i7-13700H, GeForce RTX 4060 Laptop GPU, Samsung PM9B1 512GB MZVL4512HBLU, IPS, 1920x1080, 17.3" | Schenker XMG Apex 17 (Late 23) R7 7840HS, GeForce RTX 4060 Laptop GPU, Samsung 990 Pro 1 TB, IPS, 2560x1440, 17.3" | Acer Nitro 17 AN17-51-71ER i7-13700H, GeForce RTX 4060 Laptop GPU, Samsung PM9A1 MZVL21T0HCLR, , 2560x1440, 17.3" | Medion Erazer Defender P40 i7-13700HX, GeForce RTX 4060 Laptop GPU, Phison PS5021-E21 1TB, IPS, 2560x1440, 17.3" | MSI Katana 17 B13VFK i7-13620H, GeForce RTX 4060 Laptop GPU, Micron 2400 MTFDKBA1T0QFM, IPS LED, 1920x1080, 17.3" | Lenovo Legion 5 16IRX G9 i7-14650HX, GeForce RTX 4060 Laptop GPU, Samsung PM9A1 MZVL21T0HCLR, IPS, 2560x1600, 16" | Ortalama NVIDIA GeForce RTX 4060 Laptop GPU | Sınıf ortalaması Gaming | |
|---|---|---|---|---|---|---|---|---|
| Power Consumption | 16% | 9% | -2% | 3% | -21% | -5% | -24% | |
| Idle Minimum * (Watt) | 12 | 9 25% | 8.3 31% | 8 33% | 12.2 -2% | 15.4 -28% | 11.5 ? 4% | 13.2 ? -10% |
| Idle Average * (Watt) | 17 | 12 29% | 13.5 21% | 12 29% | 14.9 12% | 19.7 -16% | 16 ? 6% | 18.9 ? -11% |
| Idle Maximum * (Watt) | 17.5 | 14 20% | 14.8 15% | 18 -3% | 15.8 10% | 20.7 -18% | 20.3 ? -16% | 24.3 ? -39% |
| Load Average * (Watt) | 78.5 | 67 15% | 77 2% | 101 -29% | 85.22 -9% | 102.6 -31% | 92.9 ? -18% | 108.3 ? -38% |
| Witcher 3 ultra * (Watt) | 169 | 147.6 13% | 154 9% | 180.8 -7% | 151.1 11% | 191.3 -13% | ||
| Load Maximum * (Watt) | 209 | 223 -7% | 263 -26% | 284 -36% | 212.8 -2% | 246.6 -18% | 210 ? -0% | 254 ? -22% |
* ... daha küçük daha iyidir
Power consumption Witcher 3 / stress test
Power consumption with external monitor
Çalışma Zamanları
Tulpar, 17 inçlik kasanın içine 62 Wh'lik bir batarya yerleştirmiş. Dizüstü bilgisayarın boyutu göz önüne alındığında, bu bir oyuncu için çok fazla değil ve üreticinin biraz para tasarrufu yaptığını açıkça söyleyebilirsiniz - XMG Apex'in de aynı pil ile donatılmış olmasına ve MSI Katana'nın sadece 54 Wh ile yetinmek zorunda kalmasına rağmen. Diğer üç rakip 73 ila 90 Wh arasında değişen daha büyük pillerle donatılmıştır.
Sonuç olarak T7, WLAN testi ve 150 nit düşük parlaklıkta video testi sırasında yaklaşık 3,5 saatlik çalışma süreleri elde etti. Burada sadece Katana daha kötü performans gösterirken, karşılaştırılan diğer cihazlar, örneğin aynı boyutta pile sahip olmasına rağmen Apex çok daha uzun süre dayanabildi. Bu belki de daha iyi enerji tasarrufu önlemlerine sahip olmasından kaynaklanıyor.
| Tulpar T7 V20.6 i7-13700H, GeForce RTX 4060 Laptop GPU, 62.32 Wh | Schenker XMG Apex 17 (Late 23) R7 7840HS, GeForce RTX 4060 Laptop GPU, 62.32 Wh | Acer Nitro 17 AN17-51-71ER i7-13700H, GeForce RTX 4060 Laptop GPU, 90 Wh | Medion Erazer Defender P40 i7-13700HX, GeForce RTX 4060 Laptop GPU, 73 Wh | MSI Katana 17 B13VFK i7-13620H, GeForce RTX 4060 Laptop GPU, 53.5 Wh | Lenovo Legion 5 16IRX G9 i7-14650HX, GeForce RTX 4060 Laptop GPU, 80 Wh | Sınıf ortalaması Gaming | |
|---|---|---|---|---|---|---|---|
| Pil Çalışma Süresi | 46% | 110% | 39% | -25% | 74% | 74% | |
| H.264 (h) | 3.7 | 6.9 86% | 6.9 86% | 5.7 54% | 9.6 159% | 8.26 ? 123% | |
| WiFi v1.3 (h) | 3.5 | 5.1 46% | 8.2 134% | 6.2 77% | 2.9 -17% | 7.4 111% | 7.04 ? 101% |
| Load (h) | 1.5 | 1.6 7% | 1.3 -13% | 1 -33% | 0.8 -47% | 1.47 ? -2% | |
| Reader / Idle (h) | 7.8 | 8.8 | 8.71 ? | ||||
| Witcher 3 ultra (h) | 2.5 |
Artılar
Eksiler
Karar - Uygun fiyatlı, sağlam, ancak temel yeterlilik!

Şu andaki cazip fiyatının yanı sıra, Tulpar T7'nin klavyesini, hızlı WLAN'ını ve elbette ömür boyu, yıllık ve ücretsiz servisini özellikle seviyoruz. Dahası, T7 stres altında oldukça serin kalıyor.
Bununla birlikte, uygun fiyatlı oyuncu ne yazık ki oyun oynarken gücünden tam olarak yararlanamadığı için ikincisinin bir bedeli var. Elbette, ucuz bir oyun dizüstü bilgisayarını zayıf bir web kamerası veya Thunderbolt'u desteklemediği için affedebilirsiniz. Ancak buna karşılık, temel disiplini olan oyun oynama konusunda başarılı olması gerekir. Ve Tulpar dizüstü bilgisayar bunu yapmıyor. Üreticinin bize 16 GB tek kanallı RAM'e sahip bir konfigürasyon göndermesi, 32 GB'lık (umarım çift kanallı?) çeşitli SKU'lar olmasına rağmen, maalesef kıyaslama sonuçlarımız üzerinde olumsuz bir etkiye sahip oldu. Sonuç olarak, T7 oyun oynama konusunda rakiplerinin gerisinde kalıyor - kesinlikle öyle olmaması gerektiği halde. Pil ömrü de bazı kullanıcıları hayal kırıklığına uğratabilir, ancak 17 inçlik bir oyuncu için çok önemli olmayabilir.
Tulpar T7, ömür boyu, yıllık, ücretsiz servis gibi cömert bir vaatte bulunan uygun fiyatlı bir dizüstü oyun bilgisayarıdır. Çift kanallı RAM'e sahip bir yapılandırma seçtiğinizden emin olmalısınız çünkü aksi takdirde performansı rekabete ayak uyduramaz.
Sadece MRSP'sini dikkate alırsanız, çok sayıda alternatif var. Ancak, RTX 4060'lı T7 şu anda bazı durumlarda 1.000 ABD dolarının altında gibi oldukça düşük bir fiyata satılmaktadır. Daha fazla harcamaya hazırsanız, o zaman Lenovo Legion 5 pek çok alanda daha iyi bir alternatif olabilir.
Fiyat ve bulunabilirlik
Tulpar T7 şu anda ABD'de henüz mevcut değil. Görünüşe göre üretici, ürünlerini bu yılın sonlarına doğru ABD'de piyasaya sürecek.
Tulpar T7 V20.6
- 05/24/2024 v7 (old)
Christian Hintze
Şeffaflık
İncelenecek cihazların seçimi editör ekibimiz tarafından yapılır. Test örneği, bu incelemenin amacı doğrultusunda üretici veya perakendeci tarafından yazara ödünç olarak sağlanmıştır. Borç verenin bu inceleme üzerinde herhangi bir etkisi olmadığı gibi, üretici de yayınlanmadan önce bu incelemenin bir kopyasını almamıştır. Bu incelemeyi yayınlama zorunluluğu yoktu. Bağımsız bir medya şirketi olarak Notebookcheck, üreticilerin, perakendecilerin veya yayıncıların otoritesine tabi değildir.
Notebookcheck bu şekilde test yapıyor
Notebookcheck, tüm sonuçların karşılaştırılabilir olmasını sağlamak için her yıl yüzlerce dizüstü bilgisayarı ve akıllı telefonu standart prosedürler kullanarak bağımsız olarak inceliyor. Yaklaşık 20 yıldır test yöntemlerimizi sürekli olarak geliştirdik ve bu süreçte endüstri standartlarını belirledik. Test laboratuvarlarımızda deneyimli teknisyenler ve editörler tarafından yüksek kaliteli ölçüm ekipmanları kullanılmaktadır. Bu testler çok aşamalı bir doğrulama sürecini içerir. Karmaşık derecelendirme sistemimiz, nesnelliği koruyan yüzlerce sağlam temellere dayanan ölçüm ve kıyaslamaya dayanmaktadır.Price comparison

